the Creative Commons Attribution 4.0 License.
the Creative Commons Attribution 4.0 License.
 | 25 Jun 2026
A global view of the stratospheric background, volcanic and wildfire aerosol in the CALIOP era (2006–2023)
Bengt G. Martinsson
Johan Friberg
Moa K. Sporre
This study deals with the stratospheric aerosol during the 17 years of lidar measurements with CALIOP aboard the CALIPSO satellite. To obtain extinction from the backscattering measurements, we estimated the lidar ratios of the main aerosol injections into the stratosphere. The stratospheric background is estimated by making a subdivision of the stratosphere into nine parts, spanned by three latitude and altitude intervals, reaching background conditions individually at different times. The extracted background estimate shows excellent agreement with SAGE II solar occultation measurements in the volcanically quiescent period 1998–2000. Our results show that 70 % of the background aerosol in the deep Brewer-Dobson (dBD) branch is formed above 19 km altitude, indicating strong influence of carbonyl sulfide on the stratospheric background aerosol. The stratosphere was clearly affected by 15 volcanic eruptions and 5 wildfires. Their combined aerosol load affected the Southern extratropics, tropics and Northern extratropics almost equally, and the altitude distribution shows that the shallow Brewer-Dobson branch was most affected (43 %) followed by the dBD (31 %) and lowermost stratosphere (26 %). The most important events in order of maximum AOD were the Hunga Ha'apai eruption (2022), Australian wildfires (2019–20) and the eruptions of Raikoke (2019), Sarychev (2009) and Nabro (2011). These events induced strong variability in the yearly average global stratospheric aerosol optical depth (AOD), which ranged from 0.0057 (background) to 0.016. CALIOP provided invaluable data for stratospheric aerosol climatologies during its 17 years of operation.
- Article
(11579 KB) - Full-text XML
-
Supplement
(4206 KB) - BibTeX
- EndNote


Tropospheric air, containing aerosol particles and the sulfurous aerosol precursor gases carbonyl sulfide (OCS) and sulfur dioxide (SO2), enter the stratosphere across the tropical tropopause. These constituents form the stratospheric background aerosol (Kremser et al., 2016), an aerosol layer that is located above 20 km altitude in the tropics, and lower in the extratropics, containing water-soluble sulfur-rich particles (Junge et al., 1961). Additional aerosol, that can be classified as background due to its diffuse nature, originates from the Asian Tropopause Aerosol Layer (ATAL), an aerosol layer between 13–18 km altitude over Asia (Vernier et al., 2015). The stratospheric background aerosol contains sulfate, water, organics, and minor traces of tropospheric aerosol and extraterrestrial material (Martinsson et al., 2005; Murphy et al., 2007; Kremser et al., 2016; Martinsson et al., 2019).
The stratospheric aerosol load is highly variable due to special aerosol events connected to volcanism (Bauman et al., 2003; Vernier et al., 2009; Solomon et al., 2011; Andersson et al., 2015) and wildfires (Fromm et al., 2010; Baars et al., 2019; Ohneiser et al., 2020; Peterson et al., 2021; Martinsson et al., 2022; Solomon et al., 2022; Friberg et al., 2023; Peterson et al., 2025), which inject copious amounts of aerosol and precursor gases affecting the stratospheric aerosol for months up to several years (Friberg et al., 2018). These aerosol events induce a variability that needs to be accounted for in climate models. From 1979, the satellite measurement era, the most important volcanic eruptions, El Chichon in 1982 and Mt. Pinatubo (1991), caused a maximum global 3 month average effective radiative forcing of −2 and −3 W m−2, respectively (Schmidt et al., 2018). After a period of low volcanic influence on the stratosphere around the turn of the millennium, many volcanic eruptions and wildfires have affected the aerosol in the stratosphere. The most important are the 2019–20 Australian wildfires and the eruptions of Sarychev (2009), Raikoke (2019) and Hunga Ha'apai (2022).
Fresh wildfire aerosol particles contain black carbon and a dominating fraction of organics (Garofalo et al., 2019), where the latter is rapidly lost (half-life 10 d) in the stratosphere due to photolysis (Martinsson et al., 2022). The composition of volcanic stratospheric aerosol particles varies. SO2-rich volcanic emissions, like the 2008 eruption of Kasatochi, are dominated by sulfate, some organics and a minor fraction of ash (Martinsson et al., 2009; Andersson et al., 2013; Friberg et al., 2014). On the other hand, SO2-poor eruptions, like that of Puyehue-Cordón Caulle in 2011, are dominated by ash (Clarisse et al., 2013). Steam-boosted eruptions of submarine volcanoes (Mastin et al., 2024), like the 2022 eruption of Hunga Ha'apai, can result in a stratospheric aerosol with a strong contribution from sea salt (Martinsson et al., 2025).
From the beginning of extensive satellite data in the late 1970s the stratospheric aerosol load has usually been measured using solar occultation (Sato et al., 1993). GloSSAC (Global Space-based Stratospheric Aerosol Climatology), a later construction of a continuous record of optical properties of stratospheric aerosol spanning 1979 to present, has a core of solar occultation measurement with the notable 22 year era of SAGE II continuing a few years of solar occultation measurement by SAM II and SAGE I (Thomason et al., 2018). Solar occultation became unavailable during 2005–2017. To continue the GloSSAC record, other satellite-based measurements were deployed. The limb scatter instrument OSIRIS (Rieger et al., 2015) and the lidar CALIOP (Cloud-Aerosol LIdar with Orthogonal Polarization) (Winker et al., 2010) were, after substantial recalibration (Thomason et al., 2018; Kovilakam et al., 2020; Kovilakam et al., 2023), used to bridge the gap to obtain continuous time series of stratospheric aerosol properties. Mixing data from many sources that are relying on different measurement principles is however complex, as pointed out by Thomason et al. (2018). We will return to this matter in the discussion section.
This work deals with the stratospheric aerosol in the CALIOP era, spanning the 17 year period 12 June 2006 to 30 June 2023. CALIOP data (level 1B, version 4–51) is corrected for attenuation, and the lidar ratio is estimated for the stratospheric aerosol resulting from 12 volcanic eruptions and wildfires. The stratosphere from the tropopause to 35 km altitude is divided into three altitude and three latitude parts, in total nine parts, where the backscattering of the background stratospheric aerosol is identified and its sources discussed. By subtraction of the signal from the background aerosol, the backscattering from major stratospheric aerosol events is obtained. This is converted to AOD using the estimated lidar ratios. We find that global average aerosol backscattering intensity exceeded the background by 55 % in the 17 years studied. The strongest influence from volcanism and wildfires was in 2022 and 2023 due to the submarine Hunga Ha'apai eruption. The second strongest occurred in 2020 due to the Australian wildfires, followed by 2009 (Sarychev eruption) and 2019 (mainly the Raikoke eruption). 2013 was a year when the entire stratosphere was close to background conditions. Finally, we discuss the validity of lidar data in comparison with the more established data based on solar occultation.
This paper is based on measurements with the CALIOP lidar instrument aboard the CALIPSO (Cloud-Aerosol Lidar and Infrared Pathfinder Satellite Observation) satellite that completed approximately 15 orbits between latitudes −82 and 82° each day.
2.1 CALIOP properties and methods applied
CALIOP with a laser of 532 nm wavelength produced vertical profiles of backscattering intensity from air molecules, aerosol particles and cloud drops from the ground up to 35 km altitude with high vertical resolution depending on altitude. In the altitude ranges <8.2, 8.2 −20.2, 20.2–30.1 and >30.1 km the vertical resolution is 30, 60, 180 and 300 m, respectively (Winker et al., 2007, 2010). Here we use data only from the stratosphere, where the tropopause altitude according to MERRA-2 reanalysis (Modern-Era Retrospective analysis for Research and Applications) (Gelaro et al., 2017) was used to discriminate data from the troposphere. Only data recorded during nighttime were used in the general evaluation concerning all the CALIOP data available (Friberg et al., 2018; Martinsson et al., 2022), implying that data will be missing at high latitudes for part of the year with the strongest influence at the summer solstice. Data are also missing at high latitudes mainly in the southern hemisphere due to influence from polar stratospheric clouds. The data were extrapolated linearly to cover all the way to 80° latitude in both hemispheres. In the global perspective used here the fraction of the earth's surface area affected by the extrapolation is 8.7 % at the summer solstice and 3.5 % two months before/after that time. In most cases the quantitative impact on the global AOD is small, but in special cases, like the eruption of the Icelandic volcano Grimsvötn (64° N) on 21 May 2011, the inability to measure at high latitudes causes larger quantitative errors (Andersson et al., 2015).
The evaluation is based on version 4–51 of CALIOP level 1B data (NASA/LARC/SD/ASDC, 2024). Clouds within 3 km above the tropopause were discriminated based on depolarization of the signal obtained from the CALIOP instrument, polar stratospheric clouds were discriminated based on temperature and data taken in the South Atlantic Anomaly are filtered out as explained in Friberg et al. (2018) and Martinsson et al. (2022). The backscatter data were corrected for attenuation by methodology described in Martinsson et al. (2022) and were first converted to extinction by the standard effective lidar ratio S=50 sr used for CALIOP (Kar et al., 2019). Volcanic eruptions and wildfires with lidar ratio deviating from 50 sr by more than 5 % were corrected, see Sects. 2.3 and 3.4.
The stratospheric CALIOP level 3 product (Kar et al., 2019) and the data presented here are both based on the CALIOP level 1B data set but differ with respect to latitude-, longitude- and time-resolution, where CALIOP level 3 is based on monthly averages and we normally use a time-resolution of 1–8 d depending on issue investigated. These data sets also differ with respect to lidar ratios: CALIOP level 3 extinction is obtained based on a fixed lidar ratio of 50 sr, whereas we, when possible, estimate effective lidar ratios for aerosol from individual volcanic eruptions and wildfires as described in Sects. 2.3, 3.1 and 3.4. The notion “effective” relates to that CALIOP is affected by multiple scattering, implying that use of lidar ratios for measurements unaffected by multiple scattering, i.e., the true physical relation between extinction and backscattering of the aerosol studied, will result in overestimation the extinction (Prata et al., 2017; Martinsson et al., 2022). Another difference between CALIOP level 3 and our method is that we correct data for attenuation of the detected scattered light (Martinsson et al., 2022), which is important for identification and quantification of aerosol processes in wildfire aerosol (Martinsson et al., 2022; Friberg et al., 2023) and volcanic aerosol (Martinsson et al., 2025) and to obtain the AOD without influence from attenuation.
2.2 Estimation of the stratospheric background
The stratospheric aerosol background can rarely be observed in the entire stratosphere. The last time the stratosphere was practically unaffected by injections from volcanic eruptions and wildfires for several years was a few years around the turn of the millennium (Solomon et al., 2011). Still, we need to find means to estimate the stratospheric background because we can estimate the lidar ratio of stratospheric injections from volcanic eruptions and wildfires (presented in next Sect.) but not for the background aerosol. Injections from aerosol events seldom affect the entire stratosphere. Therefore, parts of the stratosphere can be in background conditions when other parts are affected by aerosol injections.
To study the background conditions, the stratosphere was subdivided into nine parts spanned by three altitude layers: the lowermost stratosphere (LMS, from the tropopause to the 380 K isentrope, where the latter was obtained from MERRA-2 pressures and temperatures), the shallow Brewer-Dobson branch (sBD, between isentropes 380 and 470 K) and the deep Brewer-Dobson branch (dBD, from the 470 K isentrope to 35 km altitude), and three latitude regions: the Southern extratropics (latitudes −80 to −20°), the tropics (latitudes −20 to 20°) and the Northern extratropics (latitudes 20 to 80°). Data were averaged over 8 d resulting in 46 observations per year in each of the nine stratospheric parts. To estimate the background conditions in this 17 year study, the averages of the three years with the lowest average backscattering of each 8 d period were formed. For two of the nine stratospheric parts, the tropical sBD and dBD, background conditions were rare, wherefore only the two lowest years were used in these two stratospheric parts. The method applied results in the minimum aerosol load observed during the 17 year period. This means that in addition to the tropospheric aerosol and precursor gases entering the stratosphere across the tropical tropopause in the large-scale stratospheric circulation, phenomena such as the ATAL (Vernier et al., 2015) and other exchanges across the extratropical tropopause are included in the background.
The extracted lowest 8 d values formed a seasonal pattern that was fitted by the sum of a constant and a sinusoidal function. These fits were used to express the average backscattering of the background aerosol in each of the nine stratospheric parts over the 17 years spanned by CALIOP measurements. The average backscattering converts to AOD when multiplied with the lidar ratio. The fitted background was subtracted from the measured total backscattering to form the backscattering from volcanic eruptions and wildfires. These background-subtracted average backscattering data were converted to AOD via the lidar ratios obtained from individual aerosol events, as described in the next section.
2.3 Lidar ratio
The lidar ratio of the aerosol from the strongest volcanic eruptions and wildfires in the period studied was estimated based on methodology described in Martinsson et al. (2022), where individual dense aerosol layers are investigated. In that method a target value in scattering ratio (R) obtained horizontally beside the studied aerosol layer (RT) is reached below the layer in an iterative procedure that results in an estimate of the effective lidar ratio, while correcting for attenuation of the backscattered signal. The effective lidar ratio obtained describes the average conditions of the entire layer where the optical properties in principle can vary. However, the lidar ratio estimates are obtained in dense aerosol layers, where the influence from background aerosol is small.
The uncertainty in the estimated lidar ratio depends on the AOD of the layer. A small change in the lidar ratio (S) results in a substantial change in the scattering ratio (R) below a dense layer, i.e., is small for dense aerosol layers. is obtained by shifting R slightly around RT. There is also an uncertainty in how well RT represents the aerosol beneath the layer. We estimate that uncertainty by the standard deviation of the scattering ratio (σ(RT)) obtained horizontally beside all the aerosol layers studied for each volcanic eruption or wildfire. This is thus based on the assumption that the aerosol horizontally beside and below the aerosol layer have the same standard deviation in R, but the actual scattering ratios horizontally beside and below an individual layer are uncorrelated. The estimated uncertainty becomes . Figure 1 shows all related to the AOD of all the estimations of the lidar ratio. The uncertainty in the lidar ratio estimate increases as the layer AOD decreases, hence a limit was set to <10 sr to pass as a lidar ratio estimate. As a result, most estimates for three volcanic eruptions, 2011 Nabro (Na11), 2014 Kelut (Ke14), and 2021 Soufriere (So21), among the 12 eruptions and wildfires analyzed were lost, as illustrated in Fig. 1.
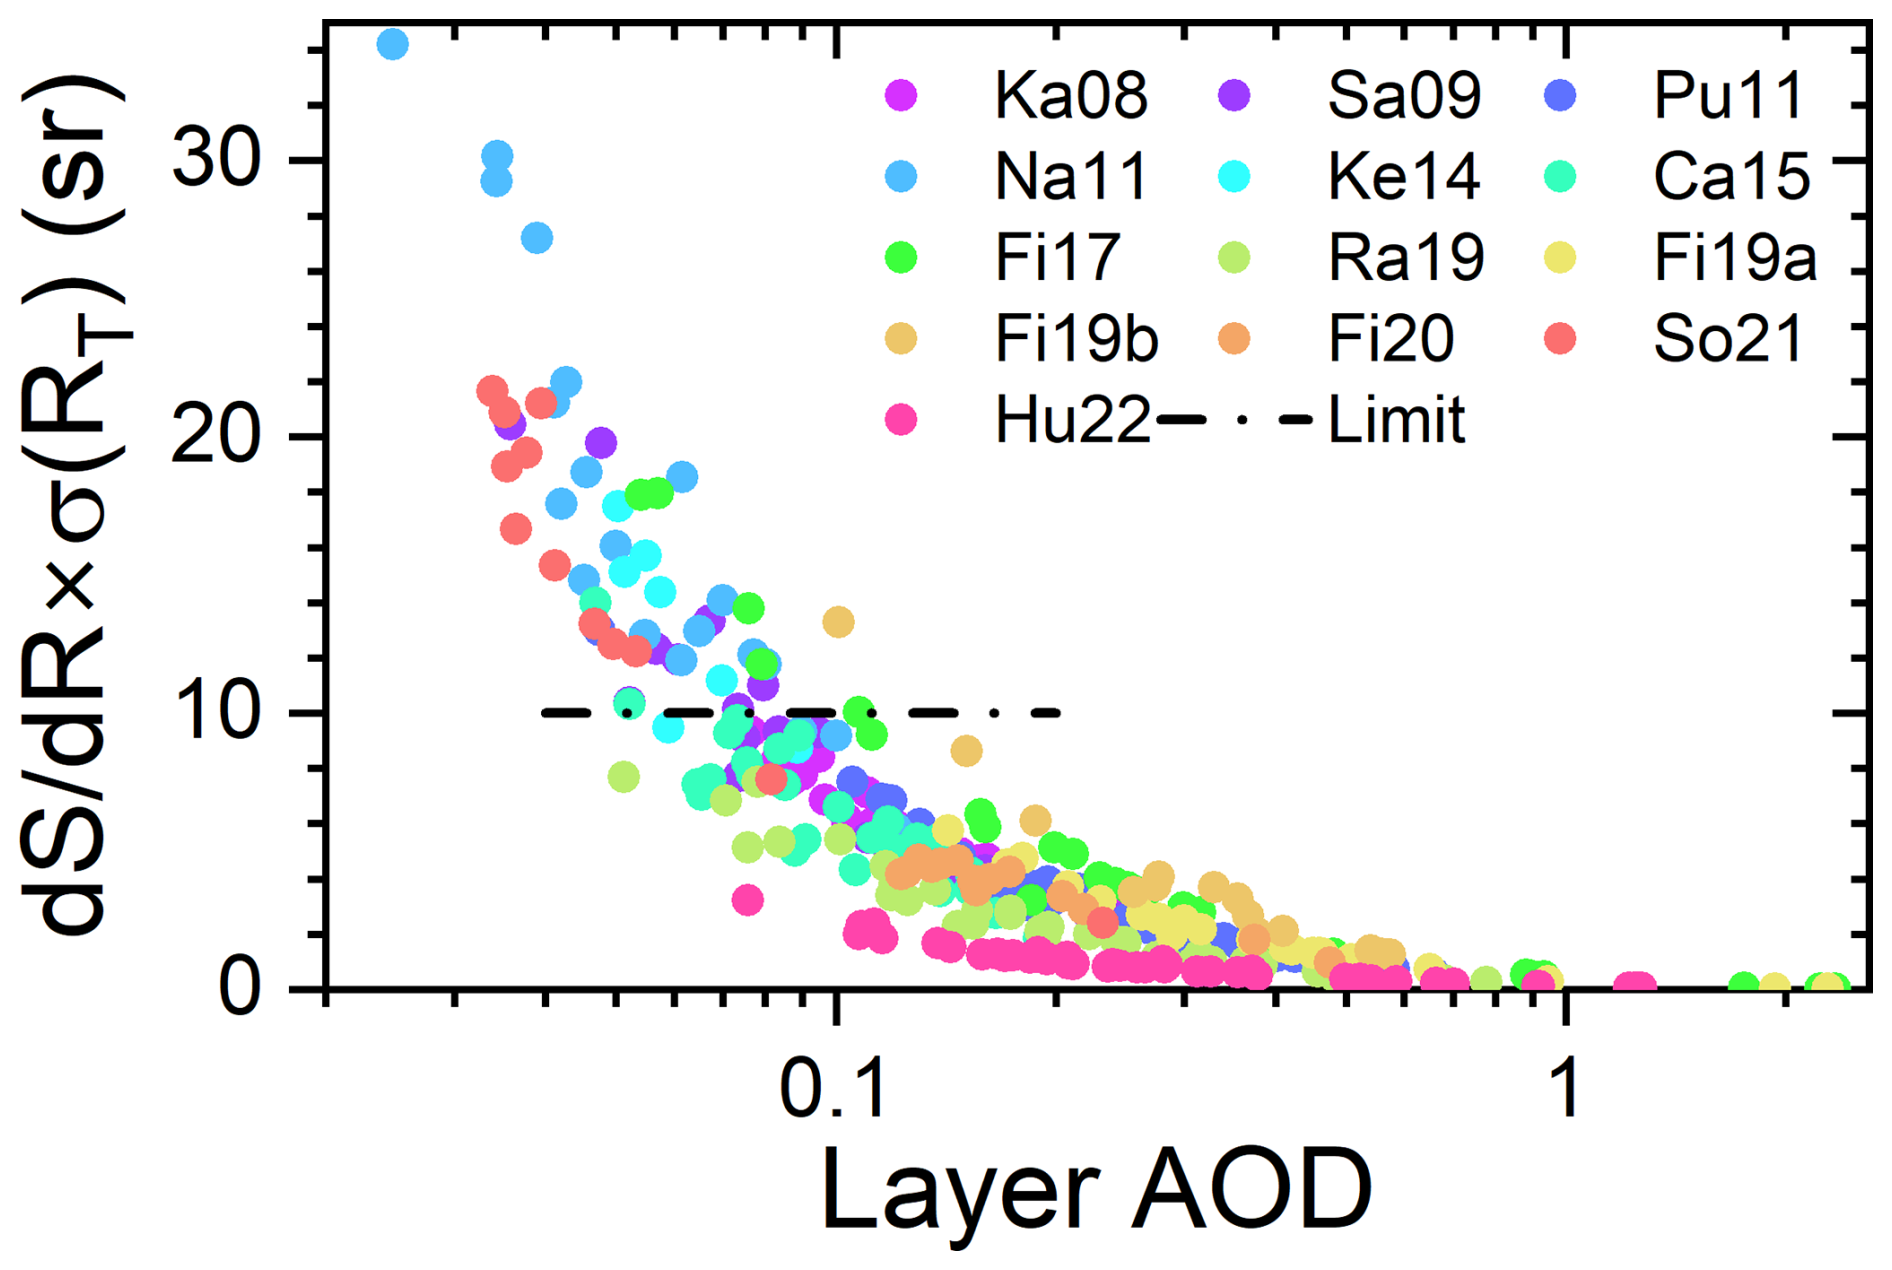
Figure 1Relation between the layer AOD and the measure on the uncertainty of the lidar ratio estimation. is the sensitivity of the lidar ratio (S) to small shifts of the target scattering ratio (R) and σ(RT) is the standard deviation of the target R of each eruption or wildfire obtained horizontally beside each aerosol layer investigated. Layers with uncertainty exceeding 10 sr (“limit”) are discarded in the following analysis.
For simplicity all the CALIOP data were evaluated using the standard lidar ratio of S0=50 sr in the general evaluation. In the study of individual aerosol layers (Fig. 1) both the AOD based on the estimated lidar ratio and that based on S0 were computed, where the latter (AOD50) was used to obtain the deviation caused by using S0. This deviation depends on the ratio and AOD50, where the effect of is the dominant one except for very dense aerosol layers. The result from the general evaluation is corrected afterwards based on the ratio of S0 and the estimated S, see Sect. 3.4.
Here we will present the stratospheric aerosol from the tropopause to 35 km altitude and the latitude range −80 to 80° in the era of lidar measurements by the CALIOP instrument aboard the CALIPSO satellite. CALIOP measured the backscattered intensity from a 532 nm laser beam, which can be converted to extinction by multiplying with the ratio of extinction to backscatter, i.e. the lidar ratio. Knowing the lidar ratio thus is central for quantification by obtaining AOD from CALIOP measurements. We developed methodology to estimate the effective lidar ratio from CALIOP measurements, a methodology that also corrects for attenuation of the laser signal (Martinsson et al., 2022). Here we start by presenting the lidar ratio of the main aerosol events of the CALIOP era before giving an overview of the AOD in the period studied. Then we investigate separation of aerosol signals of aerosol events due to volcanic eruptions and wildfires from signals due to stratospheric background aerosol. This is followed by sections on corrections of AOD due to lidar ratio deviations from the commonly assumed 50 sr, an overview of the AOD and a simplified estimate of the stratospheric aerosol's radiative impact.
3.1 Lidar ratio
The main aerosol events affecting the stratosphere in the CALIOP era are presented in Table 1. The methodology we use to estimate lidar ratios requires sufficiently dense aerosol layers as described in Sect. 2, implying that some of the events mentioned in Table 1 are not suitable for the methodology. The lidar ratio was investigated for stratospheric aerosol from nine volcanic eruptions and three wildfire events (Fig. 2). For some of these aerosol events the screening related to the uncertainty in the estimated lidar ratio (Fig. 1) resulted in few observations, namely for the 2011 Nabro, 2014 Kelut and the 2021 Soufriere eruptions. Most of the eruptions and wildfires display a stable lidar ratio during the first month, whereas two of the events show an initial decrease of the lidar ratio, the 2017 North American wildfire (Fig. 2g) and the 2022 Hunga Ha'apai eruption (Fig. 2l), towards a stable value.
Table 1Major volcanic eruptions and wildfires affecting the stratospheric aerosol in the CALIOP era.
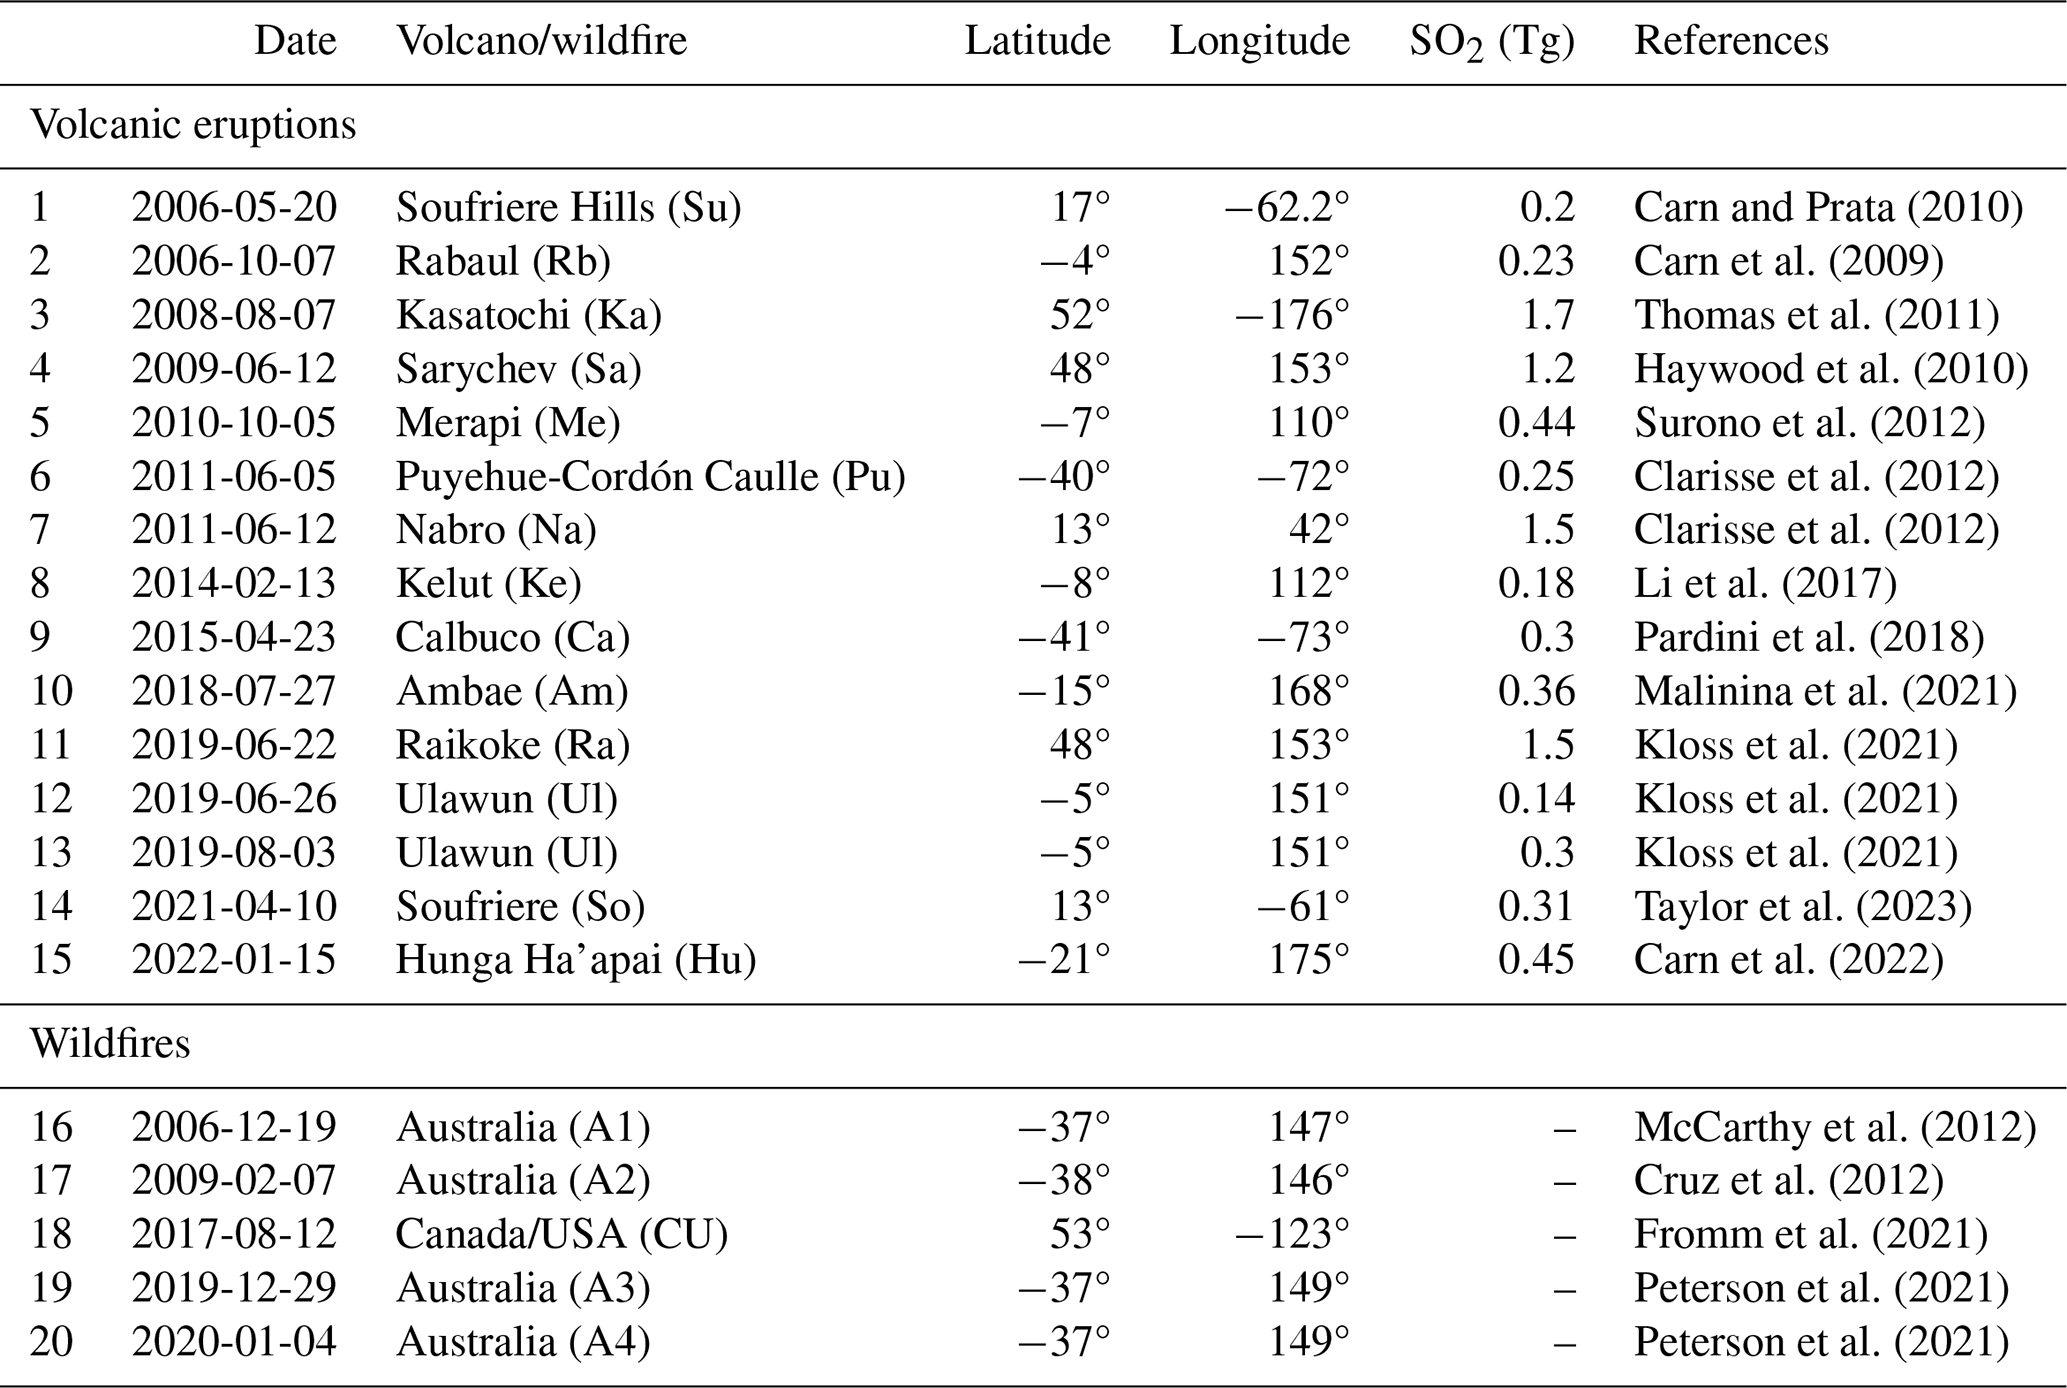
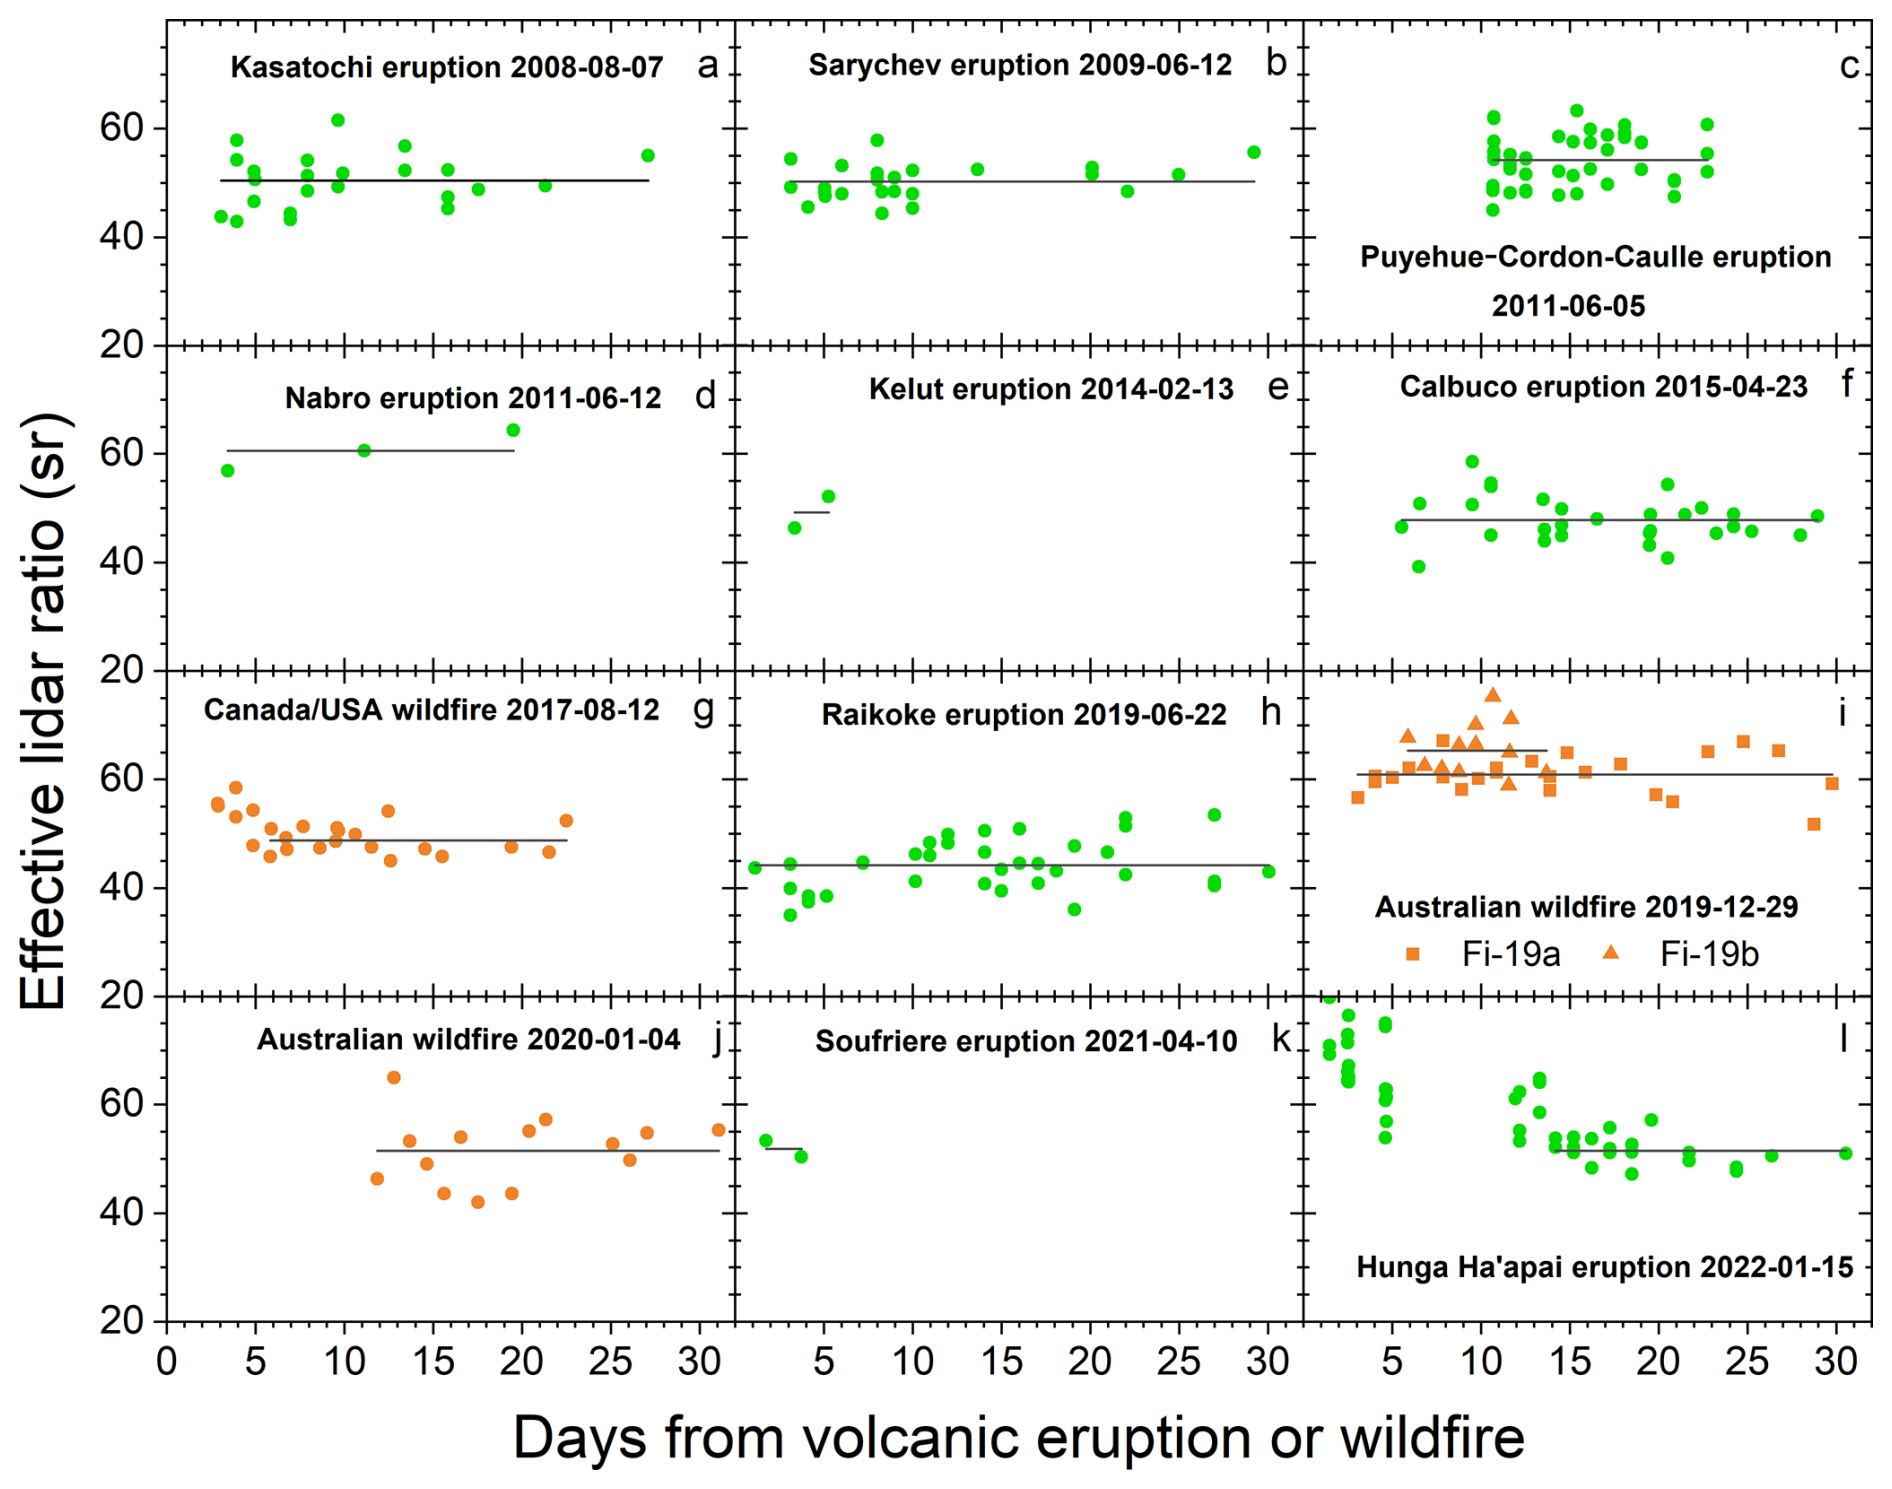
Figure 2Effective particle lidar ratios the first 30 d after a volcanic eruption or wildfire with a line displaying the average of each event. All measurements concurring with the condition are displayed for volcanic eruptions and wildfires in (a) to (l). The averages include all data points except for the Canada/USA wildfire (g) and the Hunga Ha'apai eruption (l) where the initial decline in the lidar ratio is not part of the average represented by horizontal lines.
Effective lidar ratios are presented here which are best suited for application to measurements that, like CALIOP, are affected by multiple scattering (Martinsson et al., 2022). Compared with previous estimates, the results presented here are approximately 20 % lower than those of Prata et al. (2017) for the Kasatochi, Sarychev and Puyehue-Cordon Caulle eruptions, who estimated lidar ratio for measurements that are not affected by multiple scattering. Ohneiser et al. (2020) present Raman lidar measurements of the 2019 Australian wildfire (Table 1) that are not affected by multiple scattering. On 9 January 2020 around 04:00 UTC (longitude −70.9, latitude −53.2) S=76 sr was obtained. The closest CALIOP measurement in space and time that we evaluated was taken on the same day at 04:05 UTC, position (−43.4, −53.1) with S=75 sr. The day before, at position (−57.2, −50.0) S=70 sr and the day after at position (−55.0, −57.1) S=71 sr. All these three measurements belong to the fires taking place last days of 2019, category B (outside the vortex) and are the three highest effective lidar ratios obtained in this category.
Stratospheric aerosol resulting from most volcanic eruptions and wildfires have a lidar ratio close to 50 sr, which is the commonly used lidar ratio for CALIOP data (Kar et al., 2019). Notable exceptions with lidar ratio deviating by more than 5 % from 50 sr are the ash-dominated 2011 eruption of Puyehue-Cordón Caulle (Fig. 2c), the 2019 Raikoke eruption (Fig. 2h) and the Australian wildfire in the last days of 2019 (Fig. 2i). Also, the 2011 Nabro eruption (Fig. 2d) tends to deviate from the commonly adopted lidar ratio of 50 sr of stratospheric aerosol, however the observations are too few for a firm conclusion. In the forthcoming presentation the lidar ratio of 50 sr will be used before the influence from deviations is addressed in Sect. 3.4 and 3.5.
3.2 Stratospheric aerosol events overview
At least 15 volcanic eruptions and 5 wildfires clearly affected the stratospheric aerosol in the CALIOP era (Table 1). The latitude distribution of the stratospheric aerosol from the tropopause to 35 km altitude is shown in Fig. 3, and subdivided into three layers, dBD, sBD, and LMS, in Fig. 4 with full size versions in Supplement Figs. S1–S3. Additionally, the altitude distribution is shown in three latitude ranges (−80 to −20°, −20 to 20° and 20 to 80°) in Fig. 5 (Supplement Figs. S4–S6).
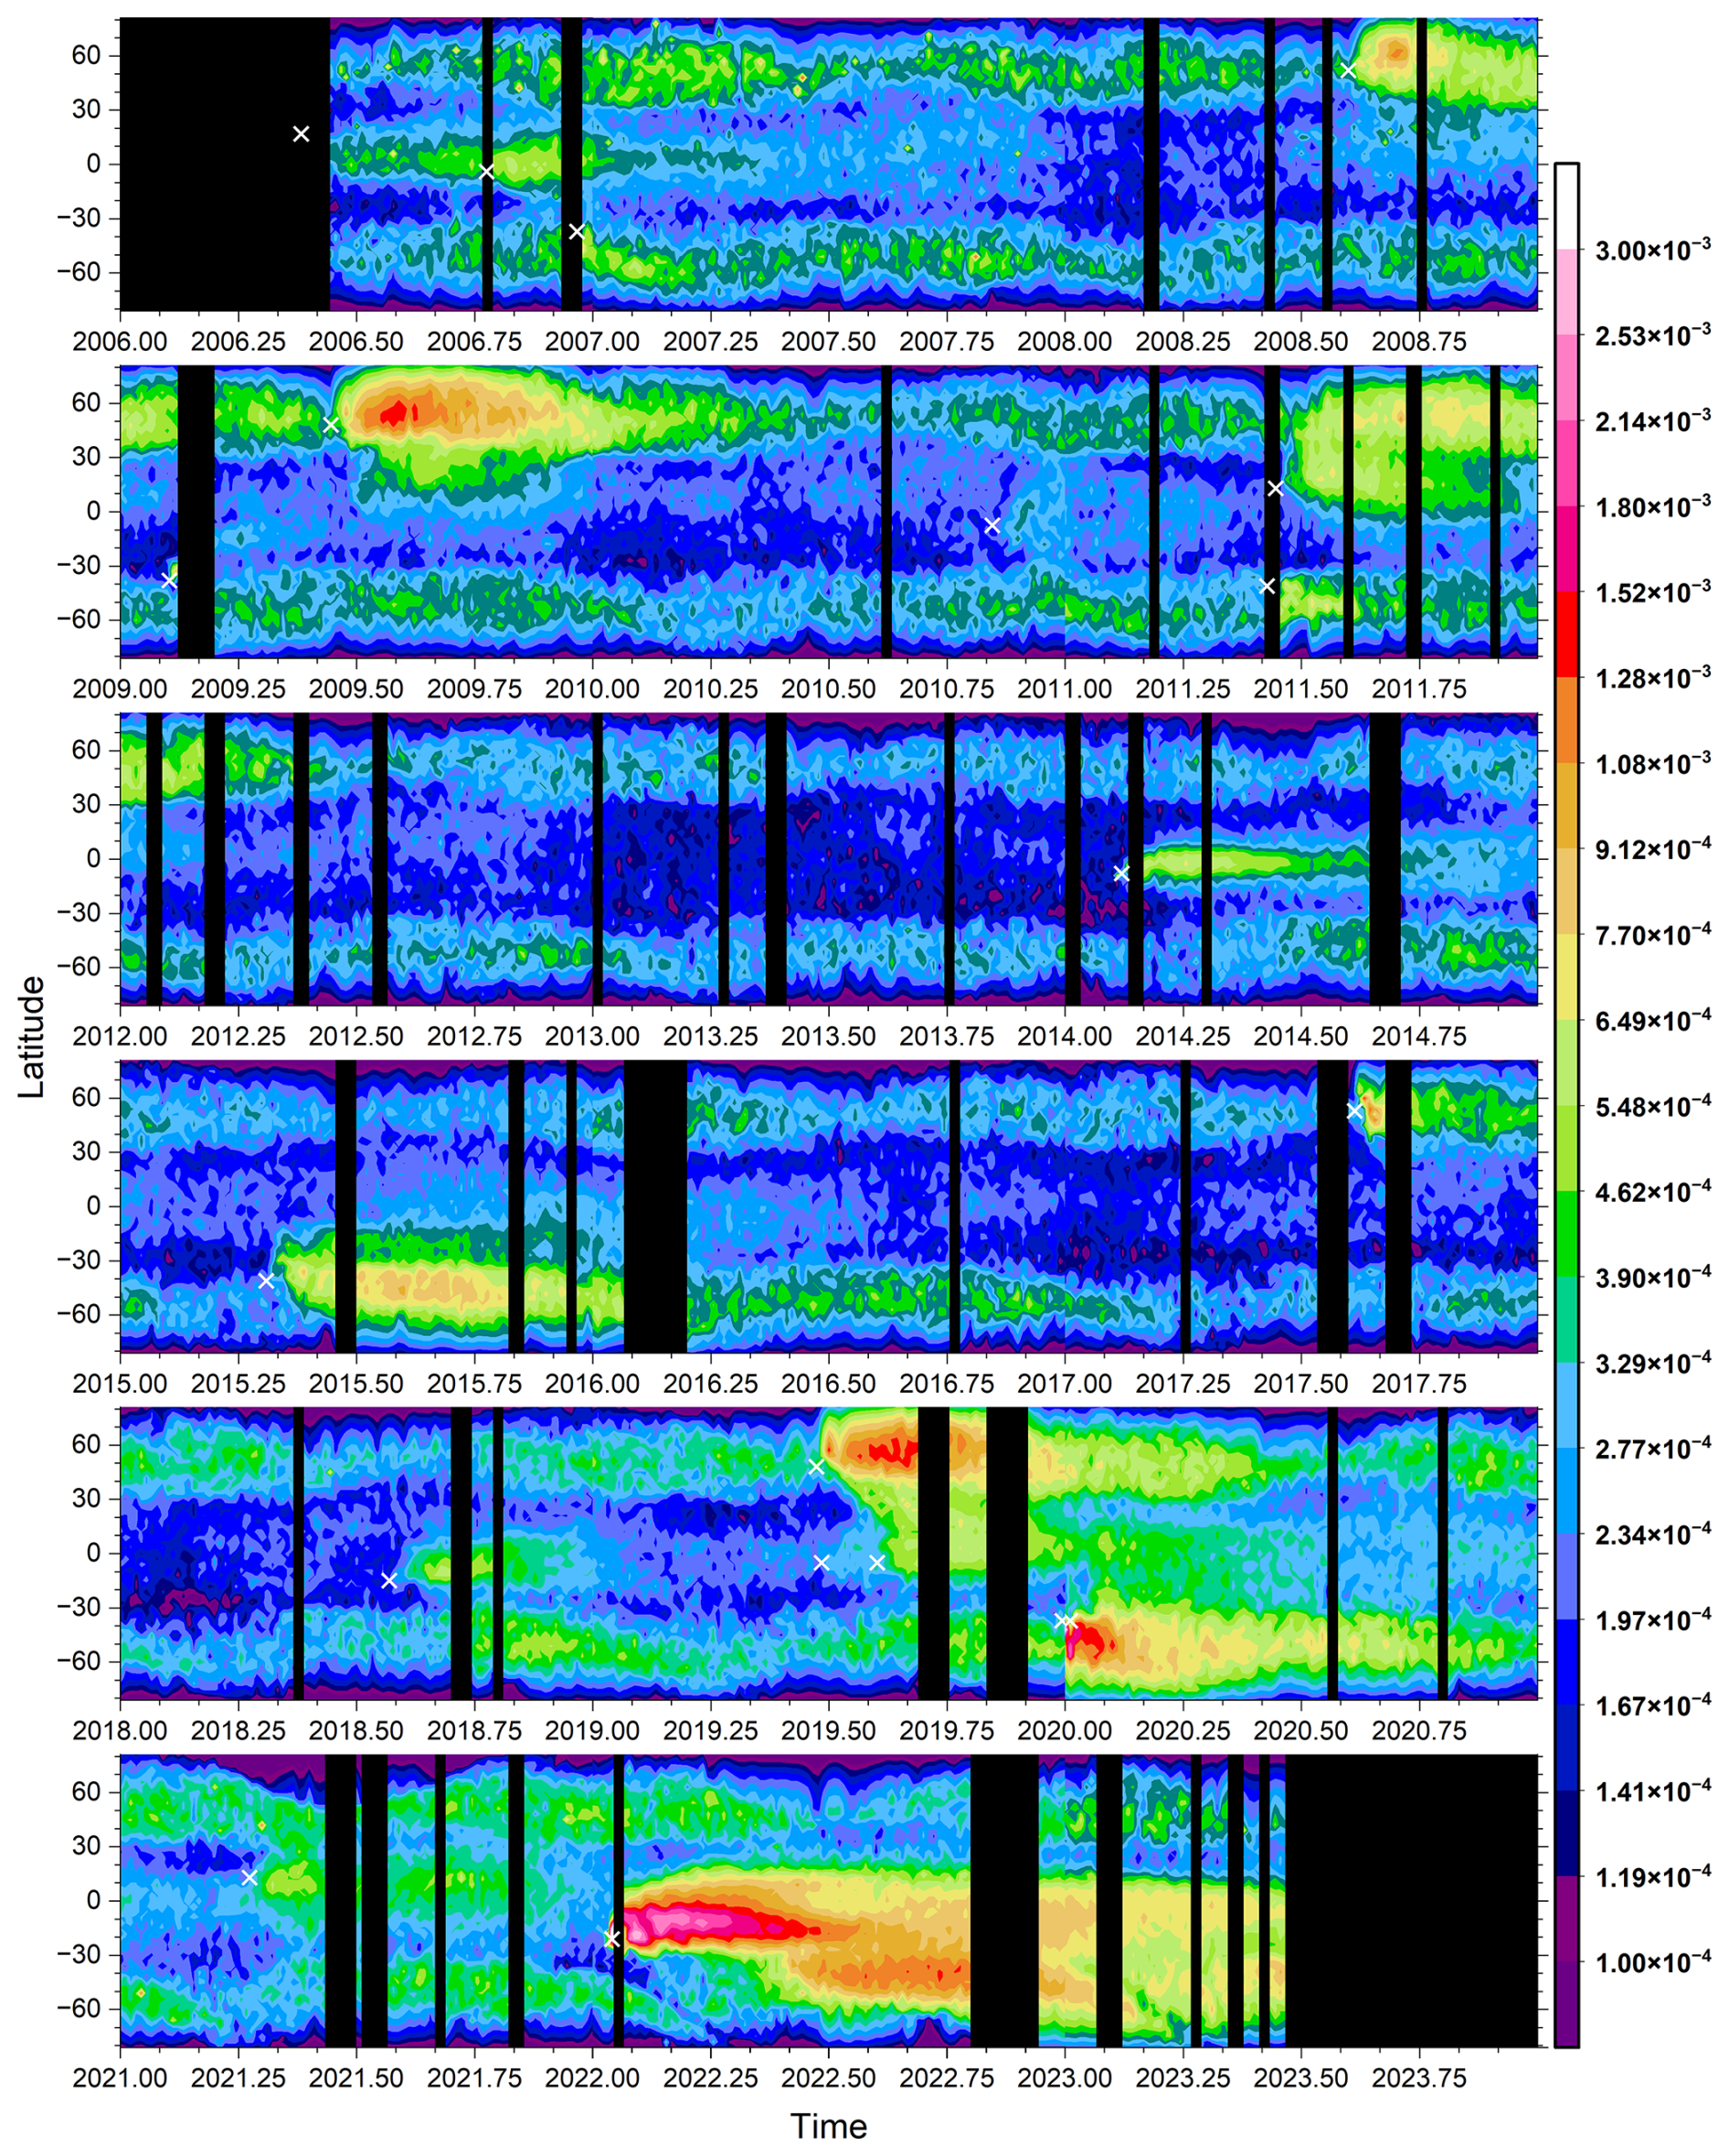
Figure 3AOD integrated from the tropopause to 35 km altitude averaged over 4 d and 3° in latitude. The lidar ratio is set to 50 sr. Color scale: The data is latitude weighted in the way that the global AOD contribution per degree of latitude is shown, i.e. the sum over latitude is the total AOD at any given time. The data has been extrapolated at high latitudes as described in Sect. 2.1, Fig. S7 shows the data without extrapolation. White crosses indicate time and latitude of aerosol events mentioned in Table 1.
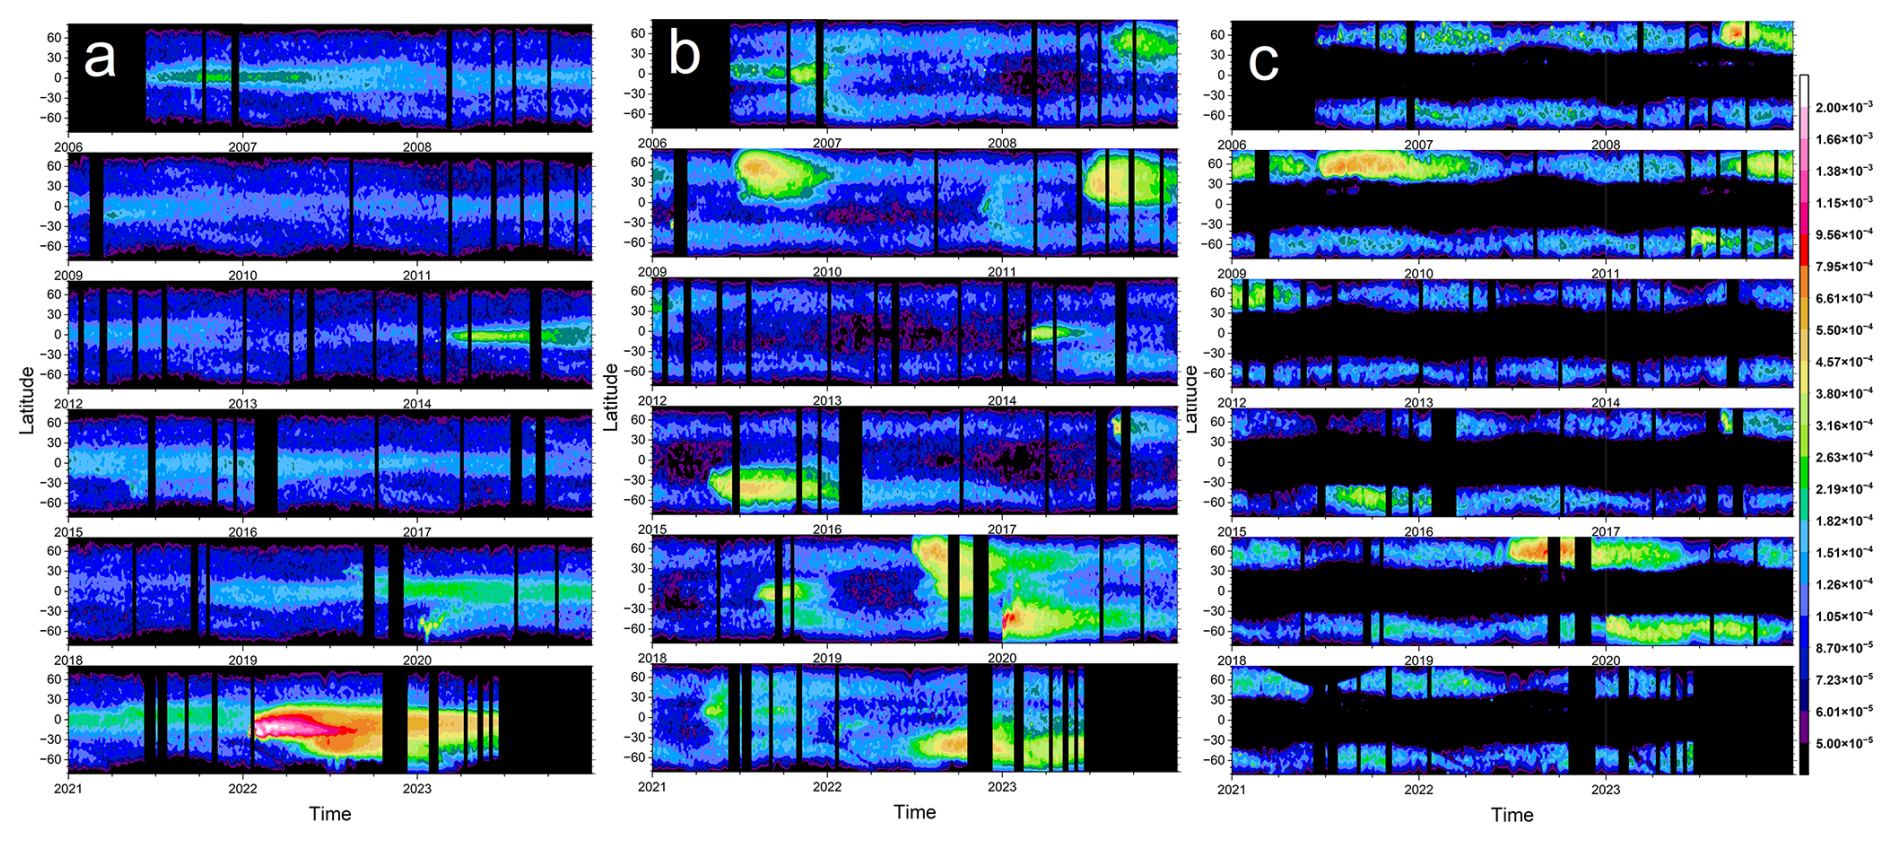
Figure 4AOD integrated in three layers: (a) dBD, (b) sBD and (c) LMS. The color scale is latitude weighted as explained in the caption of Fig. 3. Full size images are displayed in the Supplement, Figs. S1–S3.
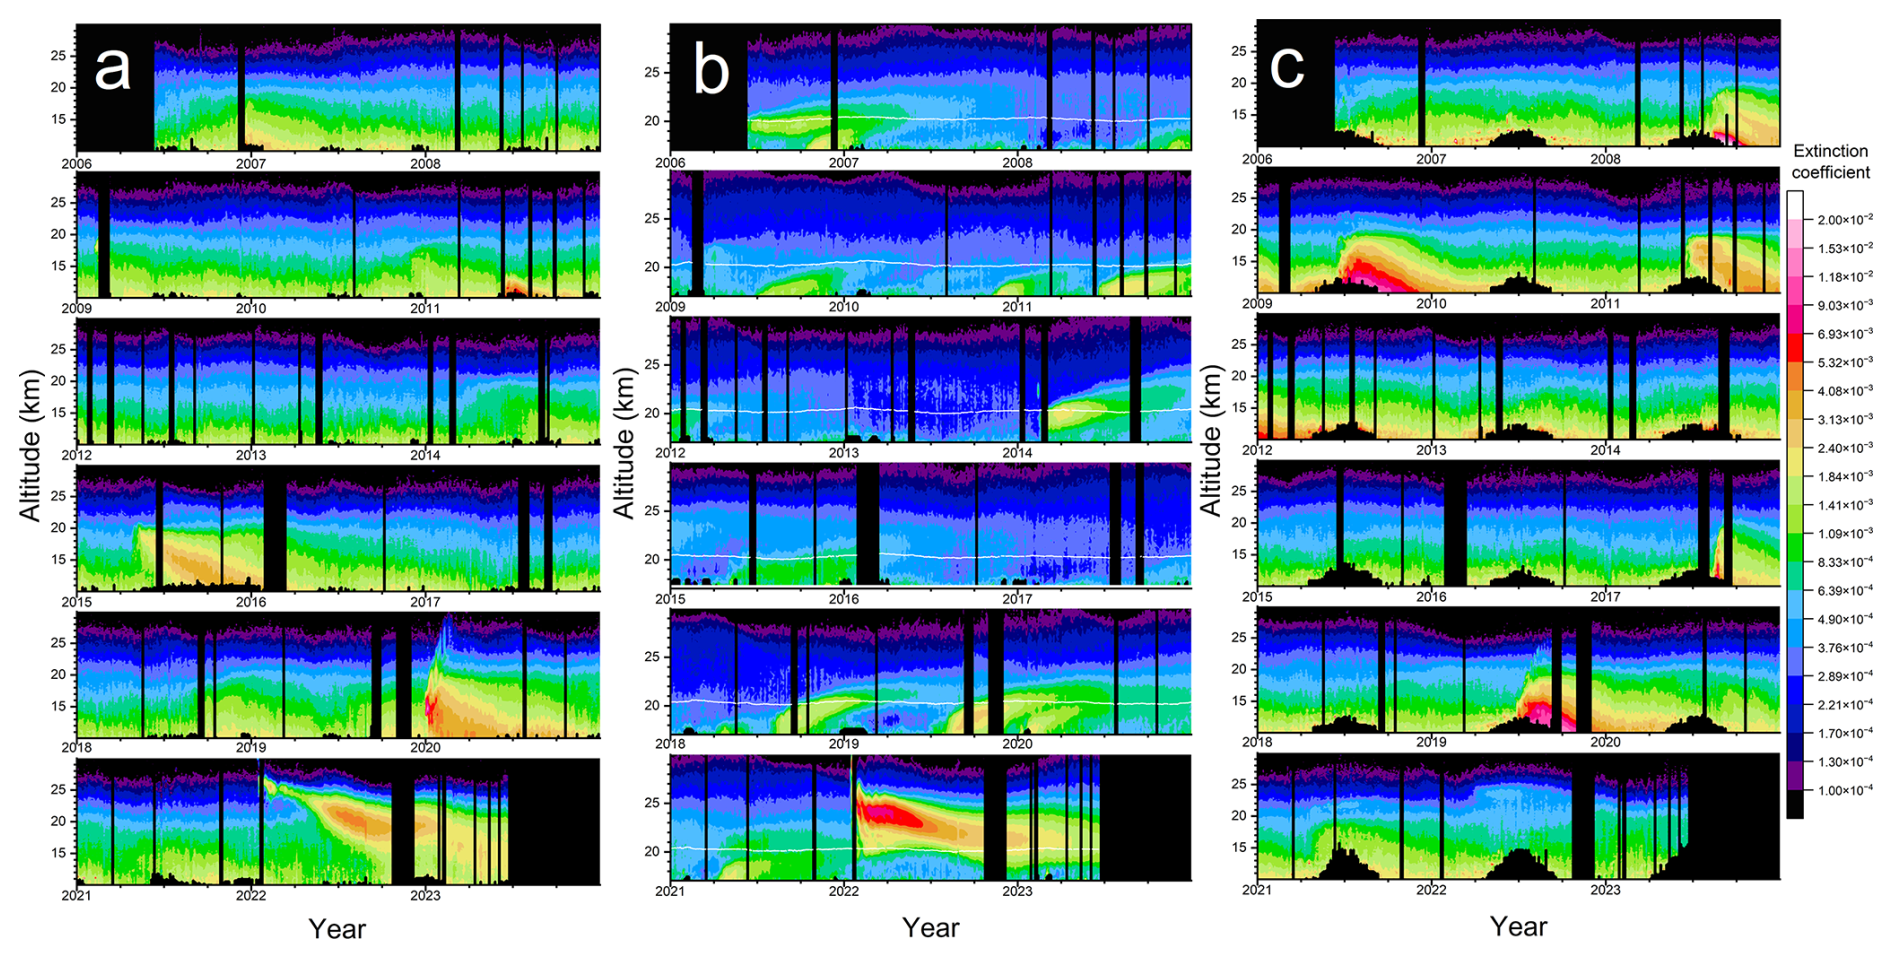
Figure 5Extinction coefficients (km−1) averaged in three latitude bands: (a) southern extratropics (−80 to −20°), (b) tropics (−20 to 20°) and (c) northern extratropics (20 to 80°). Full size images are displayed in the Supplement, Figs. S4–S6.
The influence from injections of aerosol from volcanic eruptions and wildfires has durations of a few months to several years (Friberg et al., 2018). The latter category is the aerosol events that enter the dBD branch in the tropics. The outstanding event fulfilling this requirement in the period studied is the submarine eruption of Hunga Ha'apai in 2022 (Figs. 4a and 5a, b) where intense volcanism – sea interaction (Seabrook et al., 2023; Mastin et al., 2024) formed large quantities of stratospheric aerosol, whereas aerosol formation from SO2 could explain only ∼30 % of the AOD (Martinsson et al., 2025). The remaining aerosol events in the dBD have much lower AODs. The Kelut eruption in 2014 affected the dBD for approximately 4 years. The combined effect of the 2006 eruptions of Soufriere Hills and Rabaul (Fig. 5b) show similar long-term effects on the dBD in the tropics (Fig. 4a). The combined effects of 4 volcanic eruptions, the 2018 Ambae, the two 2019 Ulawun and the 2021 Soufriere eruptions, gradually increased the dBD aerosol load in the tropics. In addition to these tropical eruptions, some extratropical aerosol events affected the dBD: the 2015 Calbuco eruption and some plumes injected above the main aerosol layer of the 2019 Raikoke eruption. Three wildfires also contributed aerosol to the extratropical dBD, the 2009 Australian, the 2017 Canada/USA and the 2019 Australian wildfires. The aerosol from the latter fire formed a vortex where the aerosol rose above 31 km altitude (Kablick et al., 2020). The extratropical aerosol events leave the dBD faster than the tropical ones because of the extratropical downward motion of the BD circulation.
The shallow Brewer-Dobson (sBD) branch (Fig. 4b) displays no such strong aerosol event as the effect of the 2022 Hunga Ha'apai eruption on the dBD (Fig. 4a). On the other hand, many events had intermediate or small impacts. The Australian wildfires at the end of 2019 and the beginning of 2020 made an initial strong impact that was rapidly reduced by loss of 90 % of the aerosol with a half-life of 10 d, likely due to photolysis of organic aerosol (Friberg et al., 2023), as did the 2017 North American wildfire but with a lower aerosol load (Martinsson et al. 2022) and, to a still lower extent, the 2009 Australian wildfire. The main volcanic eruptions affecting the sBD branch were the 2008 Kasatochi, 2009 Sarychev, 2011 Nabro, 2015 Calbuco, 2019 Raikoke and, after a delay due to transport from the dBD branch, the 2022 Hunga Ha'apai eruptions (Fig. 4a, b). Other volcanos with smaller impact on the sBD branch were the 2006 Soufriere Hills and Rabaul, the 2010 Merapi, 2014 Kelut, 2018 Ambae, 2019 Ulawun (2 eruptions) and 2021 Soufriere eruptions.
The LMS (Fig. 4c), the last stratospheric part passed by the air and its trace substances in the large-scale stratospheric circulation before exiting to the troposphere, is affected by all stratospheric aerosol events. In addition, some extratropical aerosol events do not reach beyond the LMS. The Kasatochi eruption resulted in two distinct aerosol layers, a thin layer in the sBD whereas the main part of its effluents was injected both sides of and close to the tropopause (Andersson et al., 2015). Other exclusive LMS events in the period studied here are the 2011 Puyehue-Cordón Caulle eruption and the 2006 Australia wildfire.
Most volcanic eruptions show a gradual increase in AOD over few months before reaching its maximum because of the time required for aerosol dynamical processing and to transform sulfur dioxide into sulfate, which usually is the main component of the aerosol from volcanic eruptions. Notable exceptions are the 2022 Hunga Ha'apai and the 2011 Puyehue-Cordón Caulle eruptions (Fig. 3). The aerosol of the latter eruption mainly consisted of volcanic ash (Vernier et al., 2013) and the former by aerosol containing sulfate and sea-salt from volcanism – sea interaction (Martinsson et al., 2025). These eruptions are thus less influenced by delay in aerosol formation from chemical transformation. The wildfires in the years 2009, 2017, 2019 and 2020 also rapidly reach the maximum AOD before a decline due to photolysis of organic compounds reduces the AOD by 90\%̇ (Martinsson et al., 2022; Friberg et al., 2023).
3.3 Stratospheric background
The stratospheric background aerosol is not a well-defined concept. One way is to include all but major aerosol events in the background to obtain a persistently variable background (Solomon et al., 2011). An alternative background is based on SAGE II measurements in the volcanically quiescent period in the late 1990s to early 2000s (Kremser et al., 2016). CALIOP measurements were not available in those years. A volcanic eruption or wildfire rarely affects the entire stratosphere. Therefore, we divided the stratosphere into nine sections by altitude and latitude thereby increasing the probability of finding conditions close to background separately in each of the layers using the average of the three lowest average backscattering values (in two cases the two lowest) of each layer over the year (Fig. 6), as described in the methods section.
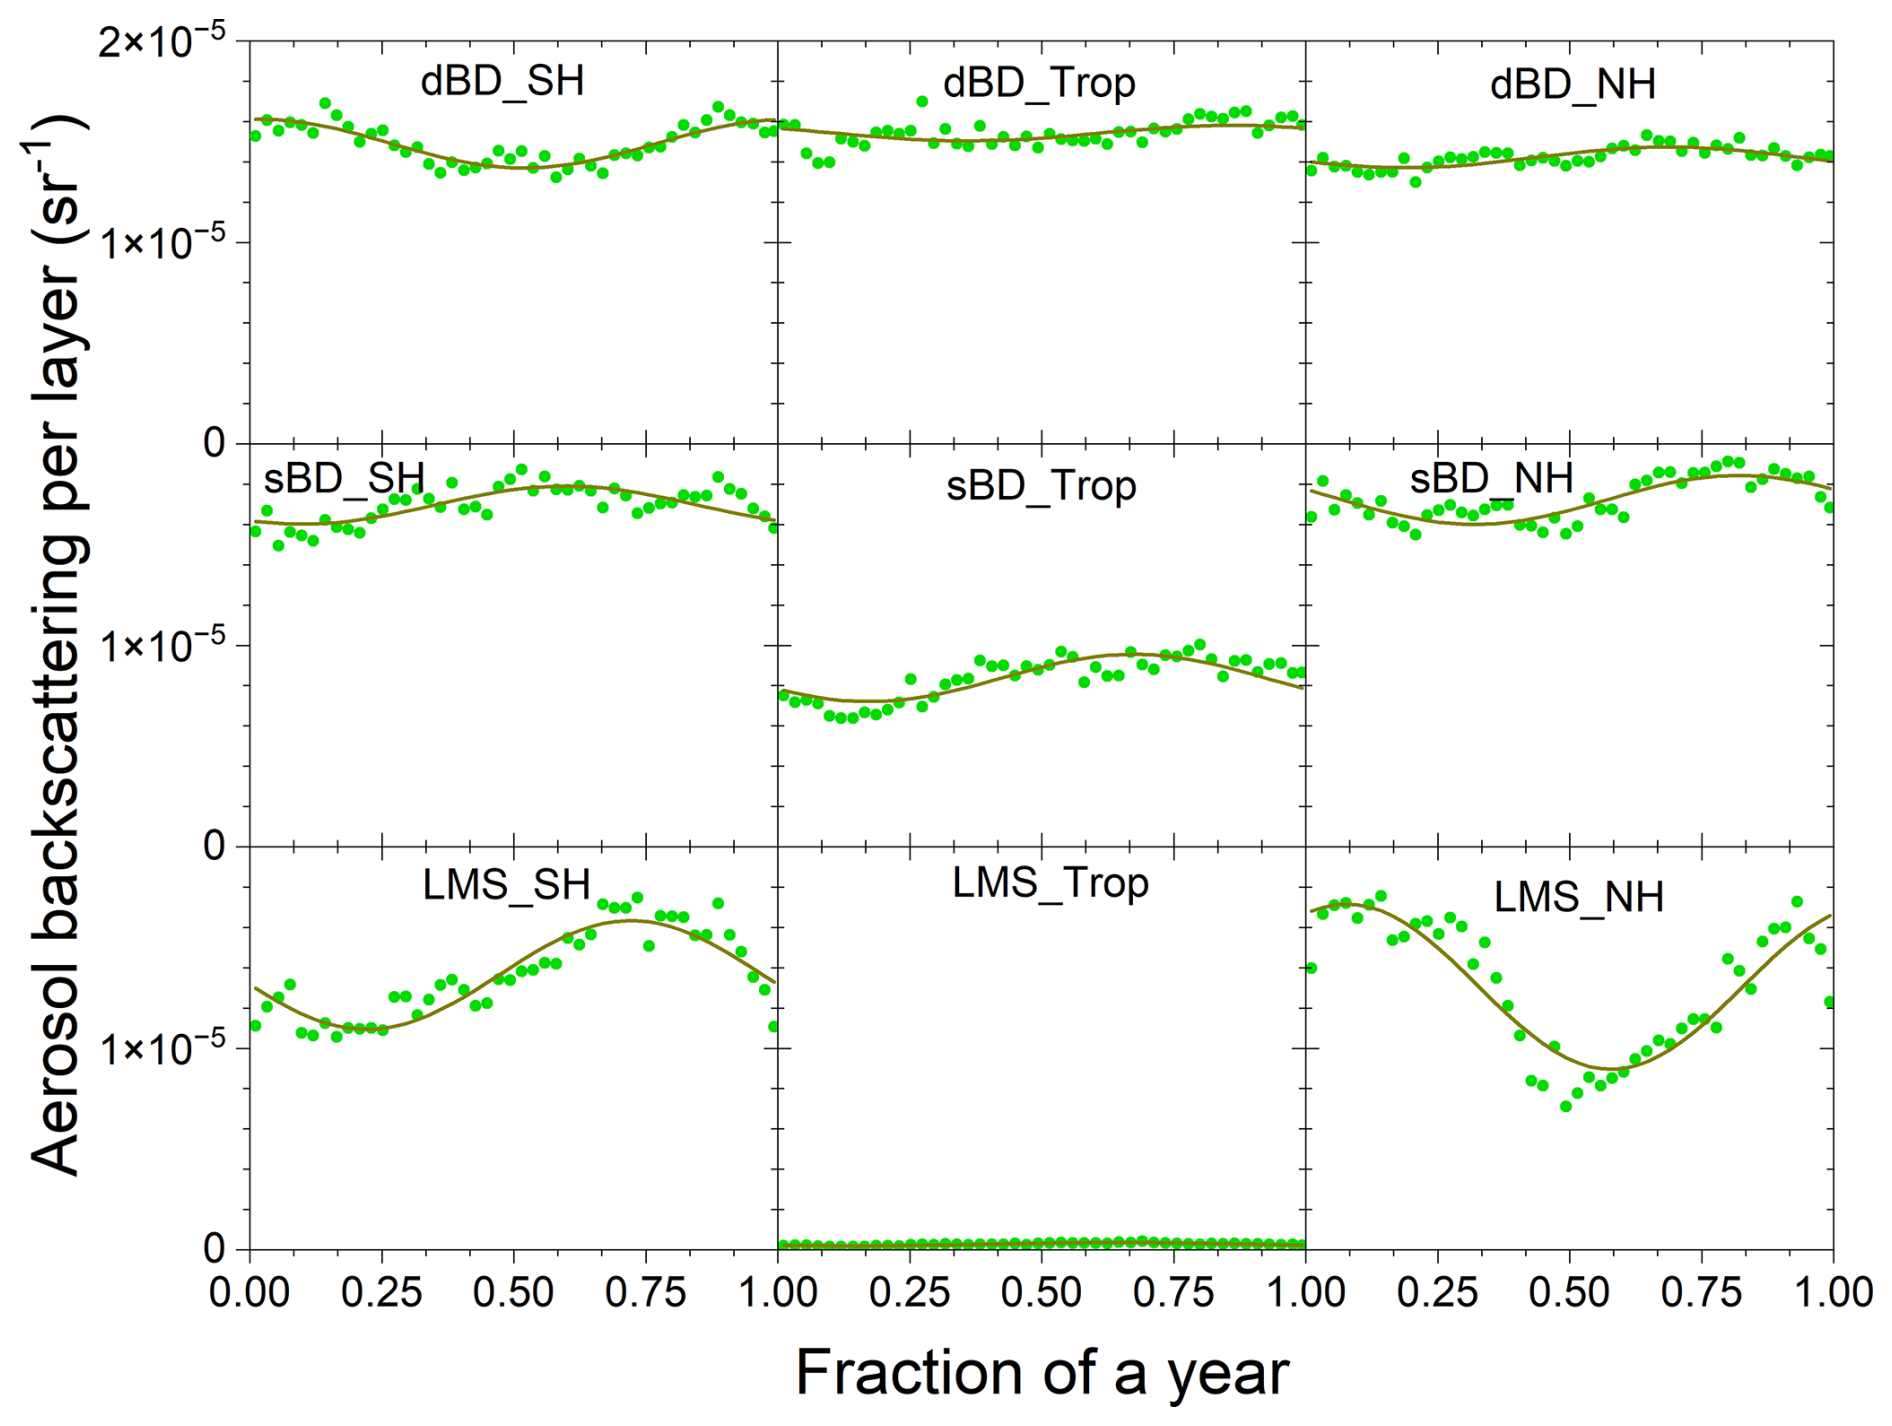
Figure 6Average backscattering, which when multiplied with the lidar ratio becomes the AOD of the layer, of the background aerosol extracted based on the three lowest average values of each 8 d period over the year in the CALIOP era (2006–2023). The extracted data were fitted to a constant and a sinusoidal function. (Exceptions: the two lowest 8 d averages were used for “dBD_Trop” and “sBD_Trop” due to infrequent background values.) The extraction was undertaken in nine regions spanned by latitudes: −80 to −20° (SH), −20 to 20° (Tropics), 20 to 80° (NH) and altitude ranges: the tropopause to 380 K isentrope (LMS), 380 to 470 K isentrope (sBD), 470 K to 35 km altitude (dBD). The data were latitude weighted in the way that the sum of the nine layers is the global aerosol backscattering.
The distribution of aerosol over the nine layers used to extract the background aerosol is shown in Table 2. Seven of the nine layers each contain 11 %–15 % of the background aerosol in the stratosphere from the tropopause to 35 km altitude during conditions that are close to background. The smallest contribution comes from the tropical LMS, which is to be expected given the small air volume of that layer. The tropical sBD also has a small contribution, but that cannot be explained by the air volume. This layer where tropospheric air enters the stratosphere extends to approximately 20 km altitude, where UV radiation intensity is too weak to efficiently oxidize carbonyl sulfide (Weisenstein et al., 1997), which is an important precursor gas of the stratospheric background aerosol (Crutzen, 1976; Kremser et al., 2016), a topic we return to below. Seasonal changes in aerosol background average backscattering are most pronounced in the extratropical LMS, especially in the NH. The volume of LMS varies over the year. That variation (Appenzeller et al., 1996) approximately coincides with the variation in Fig. 6 both in terms of seasonality and the stronger amplitude in the LMS of the NH. The seasonal variation of background backscattering in the LMS therefore likely reflects both the seasonal variation of LMS volume and true variability in aerosol loading. Poleward transport in the BD circulation maximizes in the winter resulting in increased extratropical downward motion of the stratospheric aerosol layer in the spring resulting in low aerosol load in the summer LMS when the mass transport across its upper boundary is at its minimum. The latter also coincides with the weakening of the subtropical Jetstream which increases the tropospheric influence on the LMS. In the summer/early fall there is also influence from ATAL (Vernier et al., 2015) and small wildfires briefly affecting the stratosphere (Peterson et al., 2025). The chemical composition of the LMS aerosol of the Northern hemisphere in that period differs from winter/spring/early summer by having a larger carbon than sulfur content (Martinsson et al., 2019). The change in composition can be caused by the ATAL and/or small wildfires which thus contribute to the effect of the large-scale stratospheric circulation in the build-up of the NH LMS aerosol load during late summer and fall.
Table 2Average backscattering of background aerosol and AOD of aerosol events in 2006–2023 and the distribution over nine stratospheric layers.
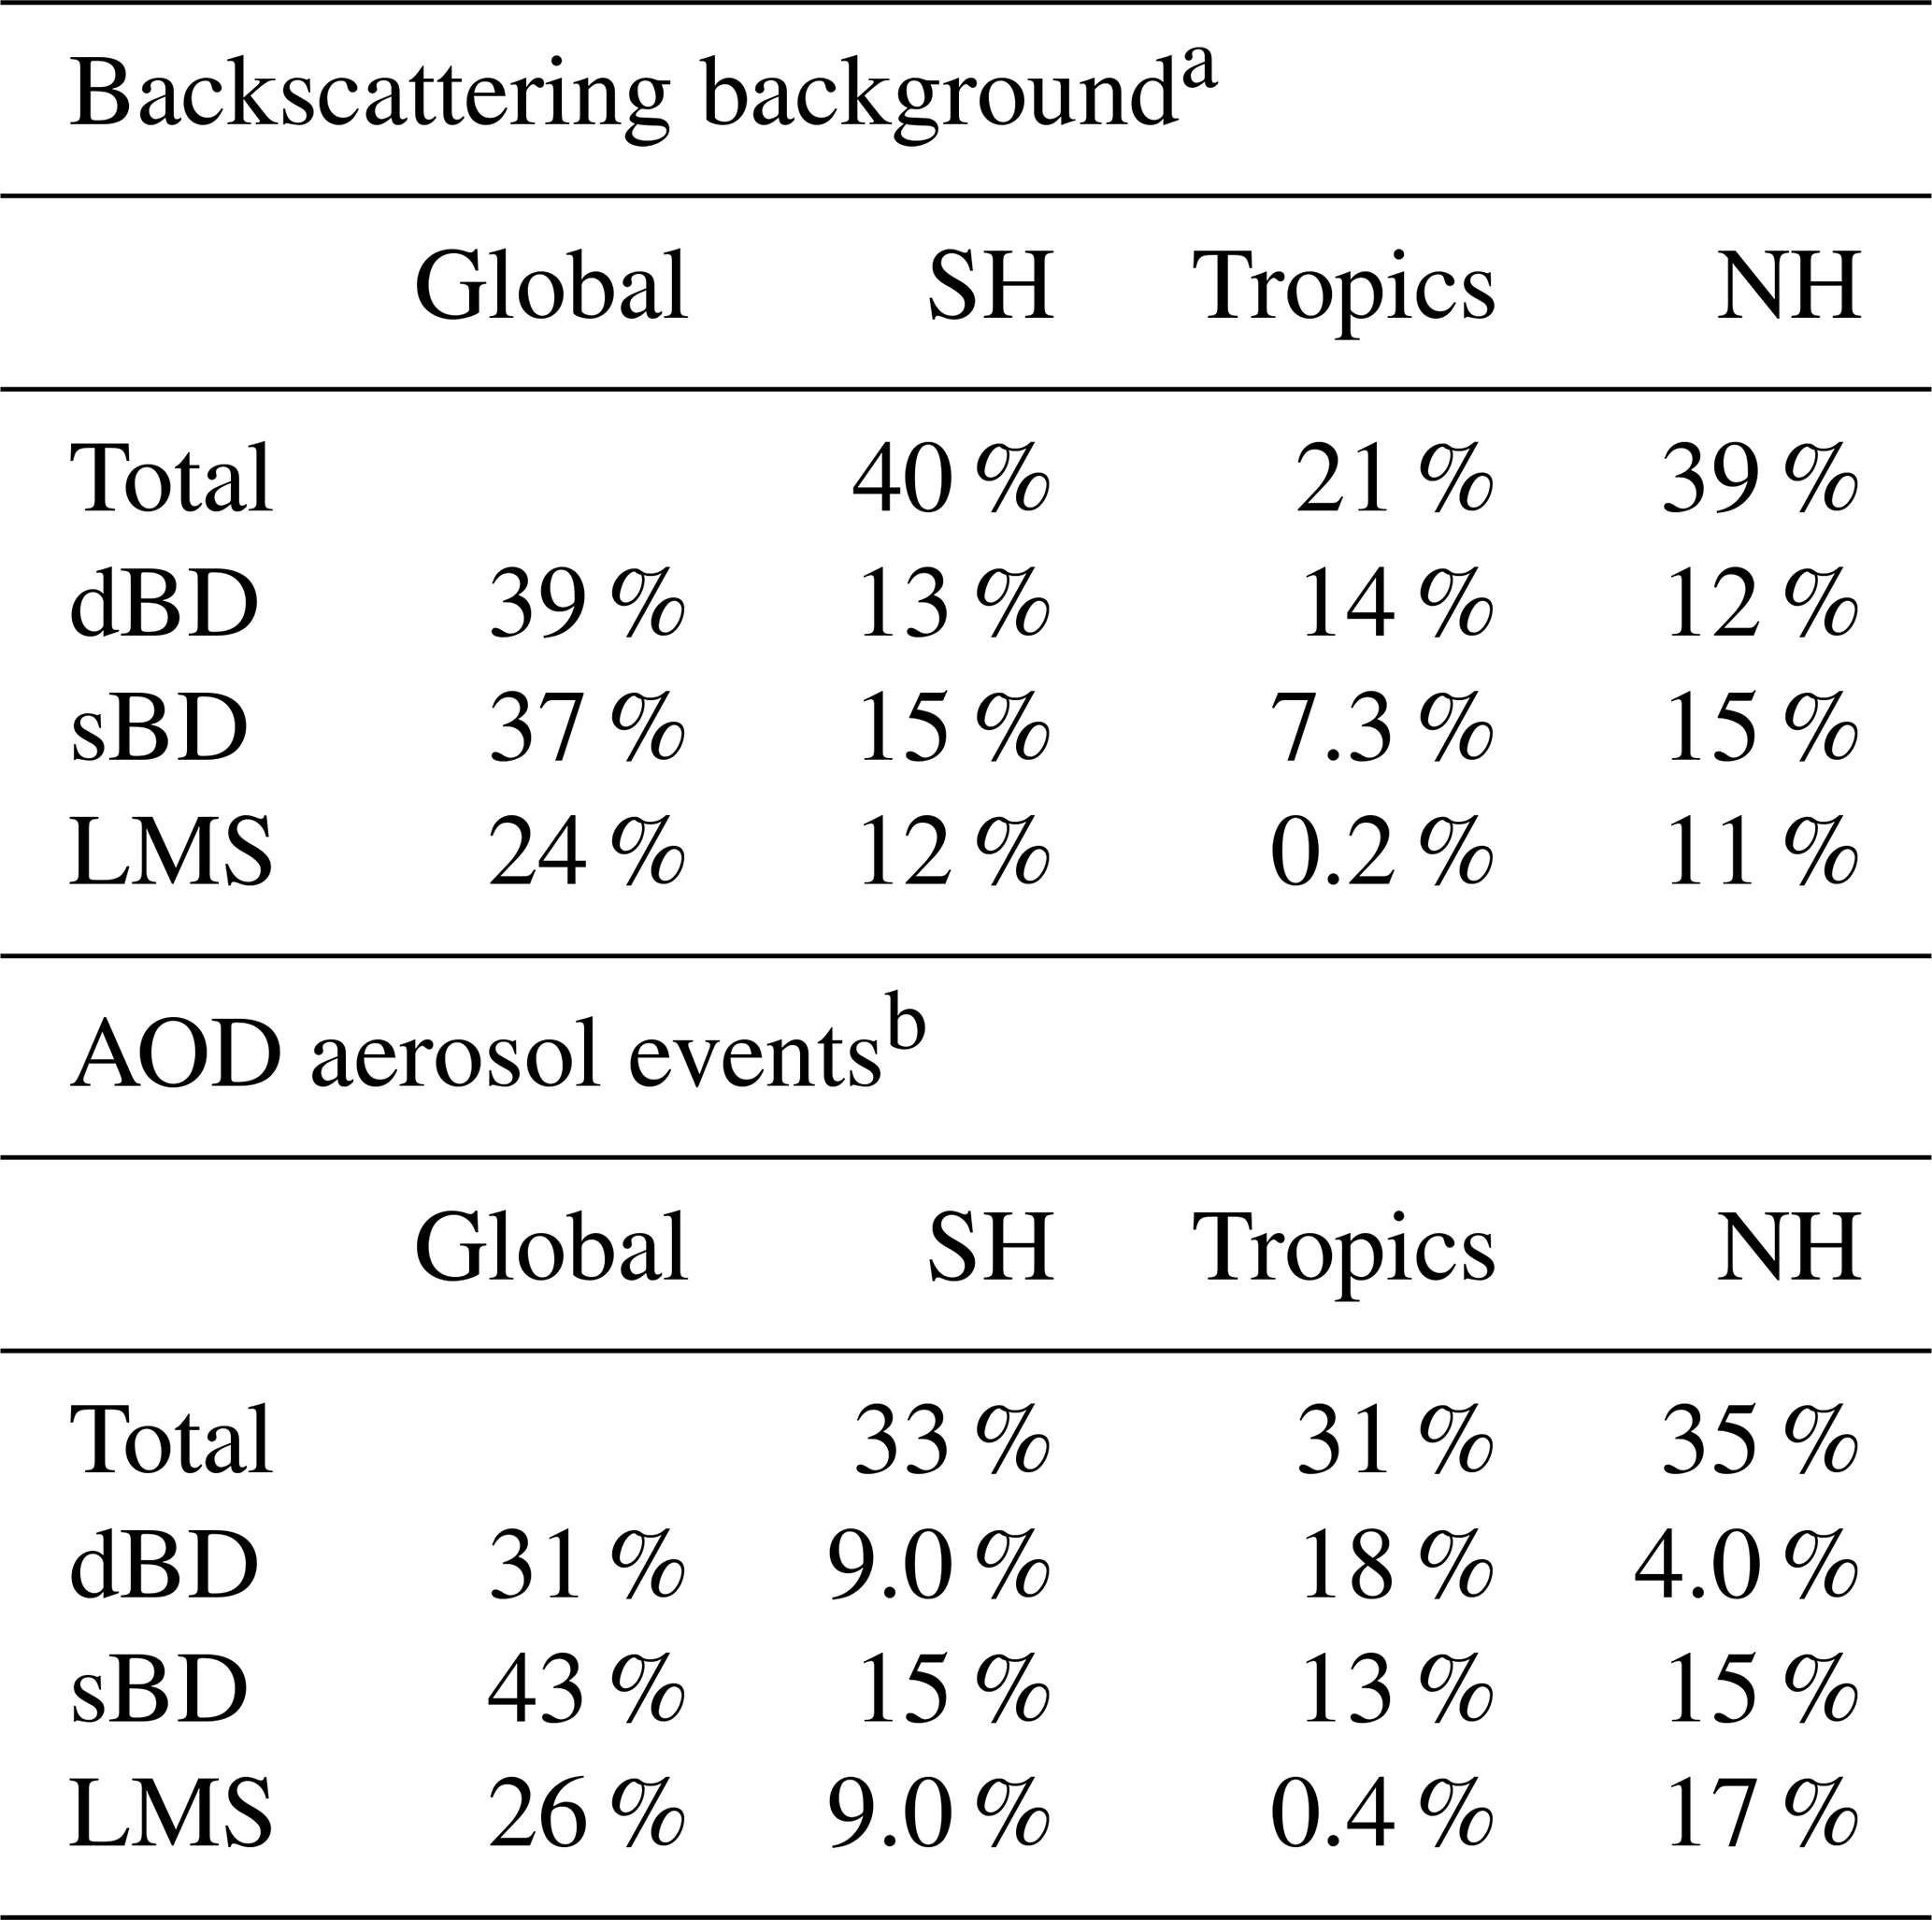
a Average backscattering of background =0.00011 sr−1, b Average AOD from aerosol events (2006–2023) =0.0031.
The average backscattering of the stratospheric aerosol and the estimated background (Fig. 6) in nine altitude and latitude layers is shown in Fig. 7. By comparing these two quantities, we verify the underlying assumption in the method used to obtain the background that the stratospheric aerosol background has no long-term trend, which agrees with previous observations (Kremser et al., 2016). Subtracting the background, we obtain the average backscattering from volcanic eruptions and wildfires. The net average backscattering of the layers was converted to AOD of the layers by multiplication with the lidar ratio of 50 sr in Fig. S8 with contributions from volcanic eruptions and wildfires as described in Sect. 3.2.
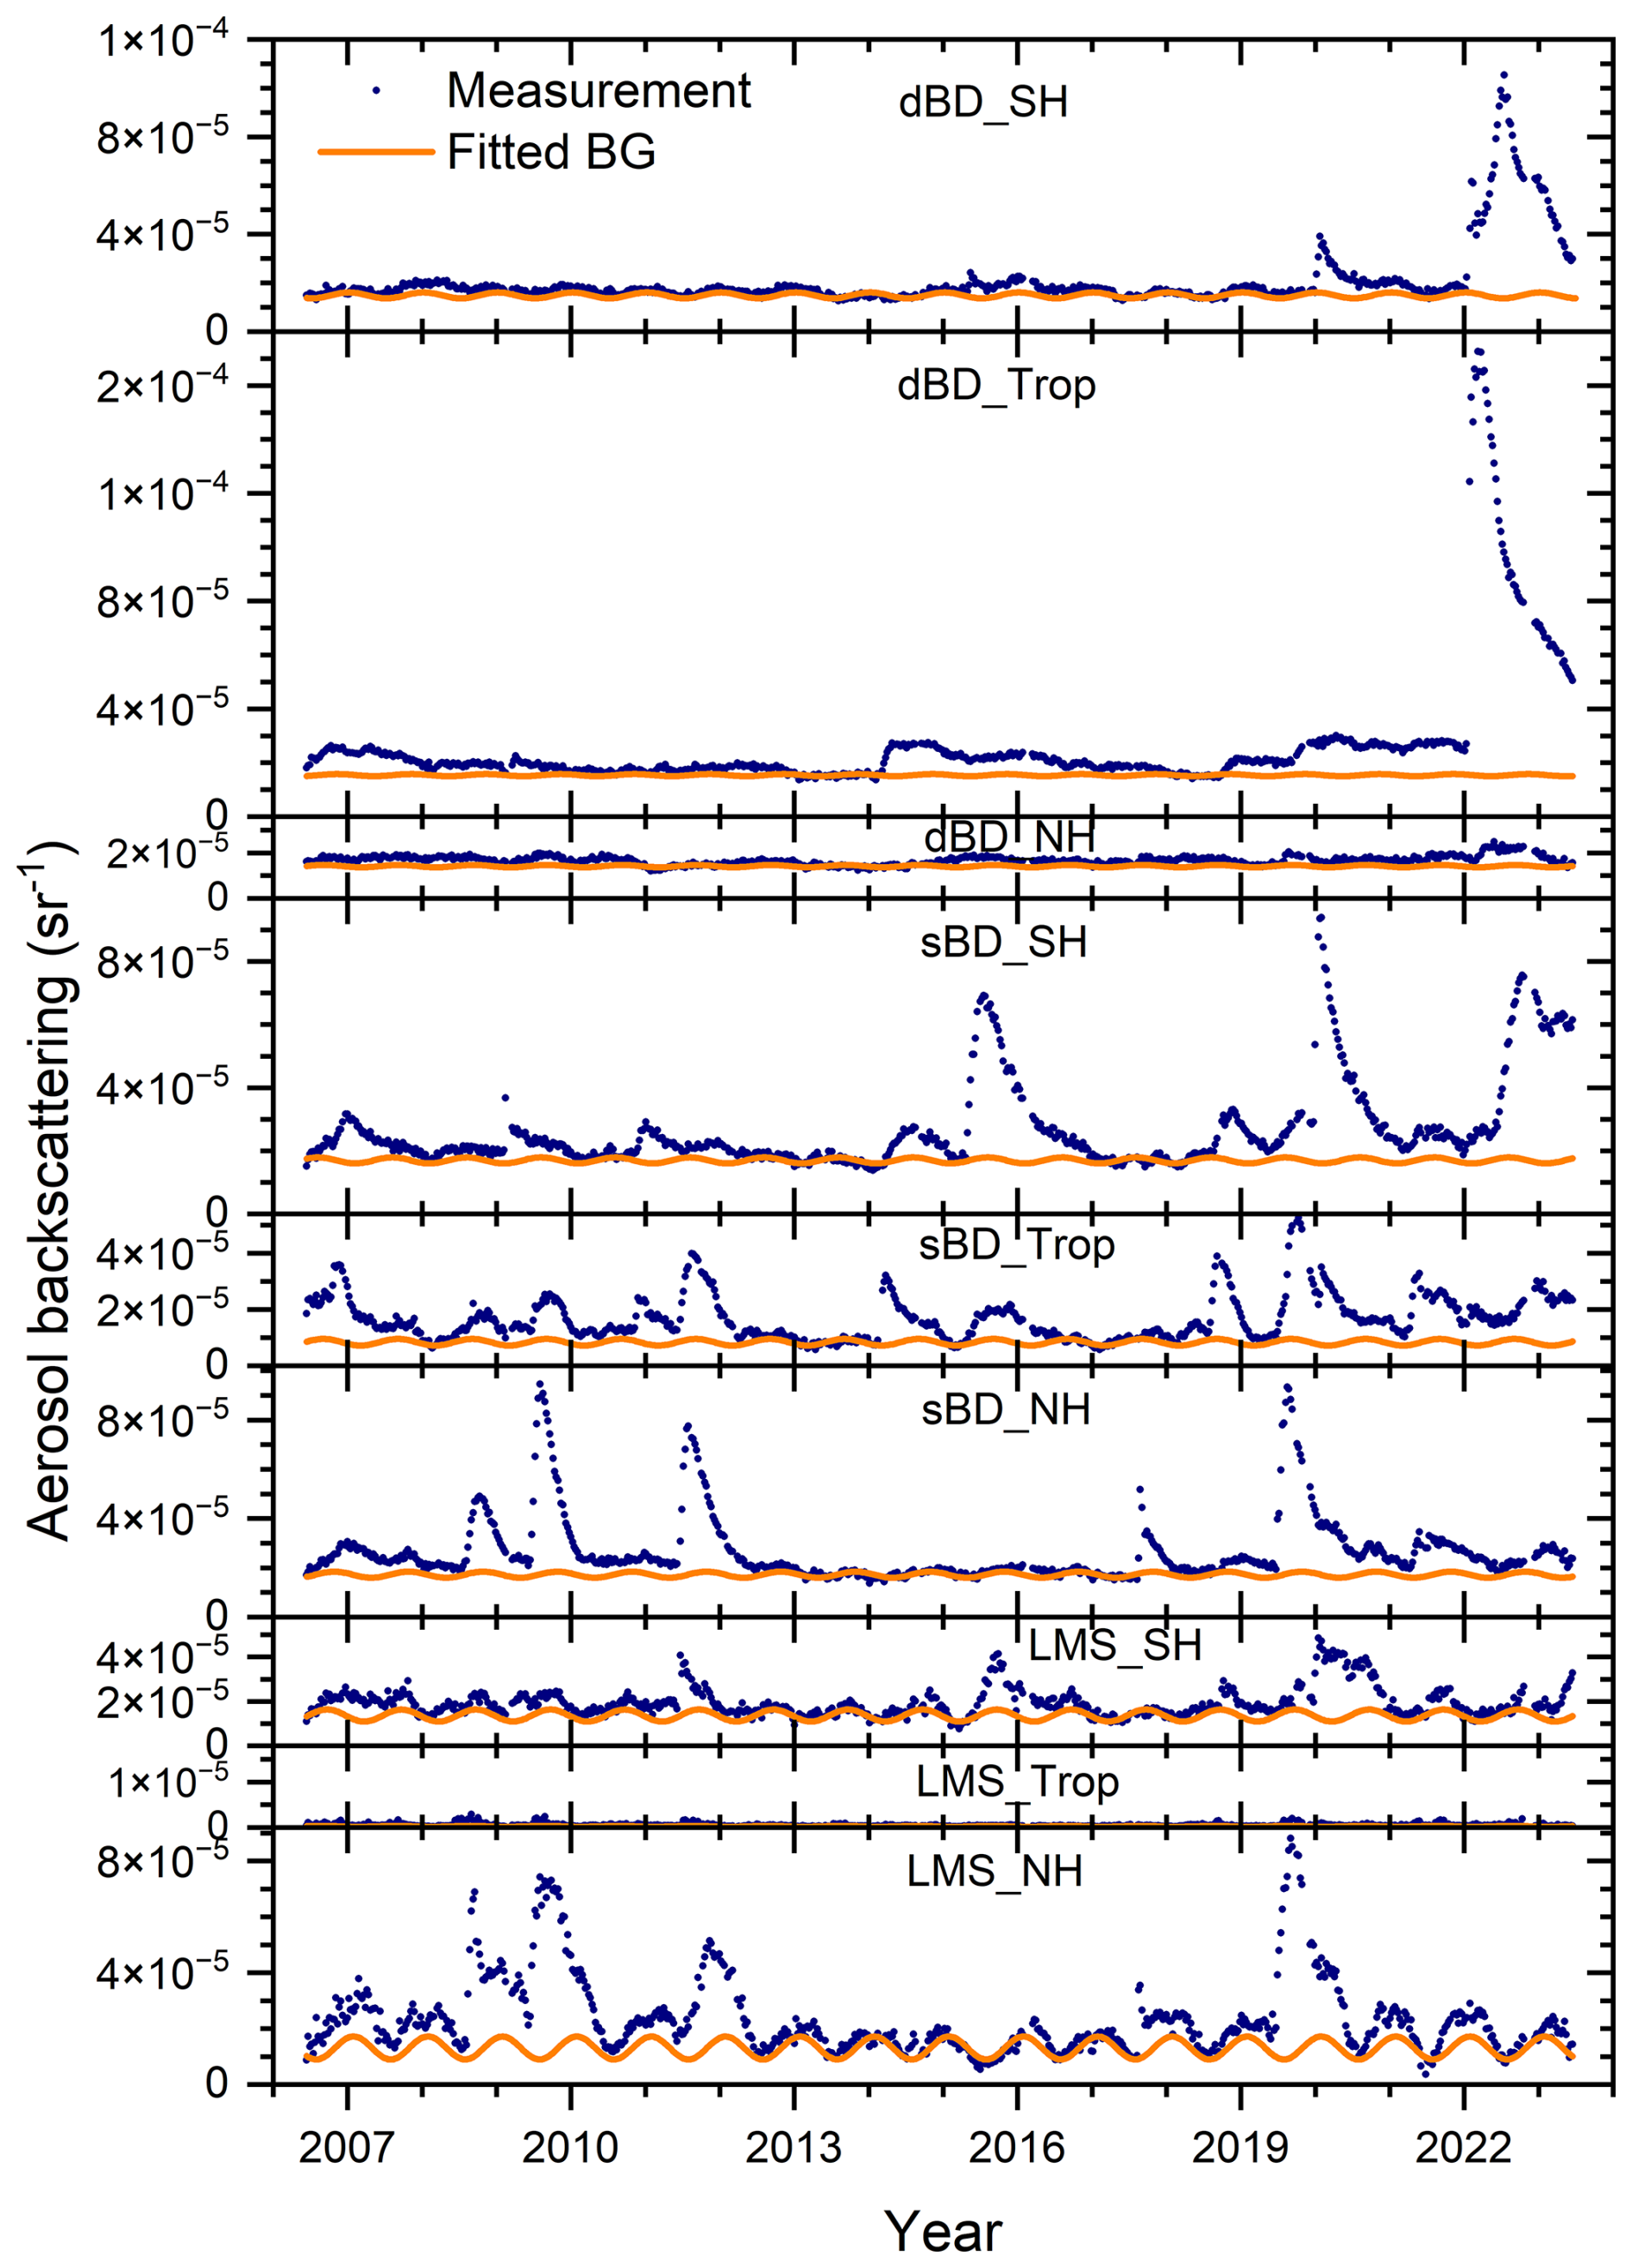
Figure 7Stratospheric aerosol average backscattering, which when multiplied with the lidar ratio becomes the AOD, and fitted background in nine latitude and altitude regions: the deep BD branch (470 K isentrope to 35 km altitude), the shallow BD branch (between isentropes 380 and 470 K) and the LMS (from the tropopause to the 380 K isentrope) and three latitude regions the southern hemisphere extratropics (−80 to −20°), the tropics (−20 to 20°) and the northern hemisphere extratropics (20 to 80°) to find time-sections not or weakly affected by stratospheric aerosol events (see Fig. 6 and text for details).
Except for a tiny peak in the LMS in the Northern extratropics, 2013 is close to background conditions (Fig. 7). The stratospheric background aerosol is often thought of as a layer located above 20 km altitude in the tropics and lower in the extratropics. This is approximately true in terms of scattering ratio (R), the optical equivalent of mixing ratio (Fig. 8a). More than half of the air entering the tropical stratosphere is transported polewards in the sBD (Lin and Fu, 2013), where the scattering ratio remains low in a band closest to the tropopause (Fig. 8a). This band contains young stratospheric air compared to air at the same altitude but at higher latitude (Austin and Li, 2006; Butchart, 2014; Ploeger et al., 2021). In the air rising further in the tropical stratosphere a dramatic increase of the aerosol mixing ratio can be seen above 20 km altitude. The aerosol signal increases by a factor of 2.5 (Fig. 8b) from 19 to 25 km altitude in the latitude range −10 to 10°, i.e., 70 % of the aerosol at 25 km is formed above 19 km altitude. The dBD air is transported polewards and descends at higher latitudes than the sBD air (Fig. 8a). With a typical vertical velocity of 20 m d−1 (Mote et al., 1998) the transport from the tropical tropopause (at 17 km) to 19 km altitude requires approximately 100 d, providing ample time for conversion of SO2 before reaching the latter altitude (Nicknish et al., 2025). Hence, little SO2 enters the dBD, implying particle formation from another source. Intensifying UV radiation with altitude causes oxidation of the most abundant sulfur compound in the atmosphere, i.e., carbonyl sulfide (OCS) (Crutzen, 1976; Kremser et al., 2016), whereas this compound remains intact in the sBD. The requirement of intense UV radiation for oxidation makes OCS an important aerosol formation pathway mainly in the dBD. The formed aerosol is transported polewards where downward transport brings the aerosol to the sBD and LMS layers before the transport out of the stratosphere (Fig. 8a). The formation pathways of the stratospheric background aerosol are still debated. The estimated contribution of OCS to the stratospheric background aerosol ranges from 20 %–50 % (Sheng et al., 2015; Chin and Davies, 1995) to 70 % or more (Crutzen, 1976; Brühl et al., 2012). High-resolution lidar data, like that of CALIOP, can be used to constrain modeling efforts to quantify sulfurous aerosol sources by reconstructing the CALIOP observations in Fig. 8 to understand the sources of the background aerosol.
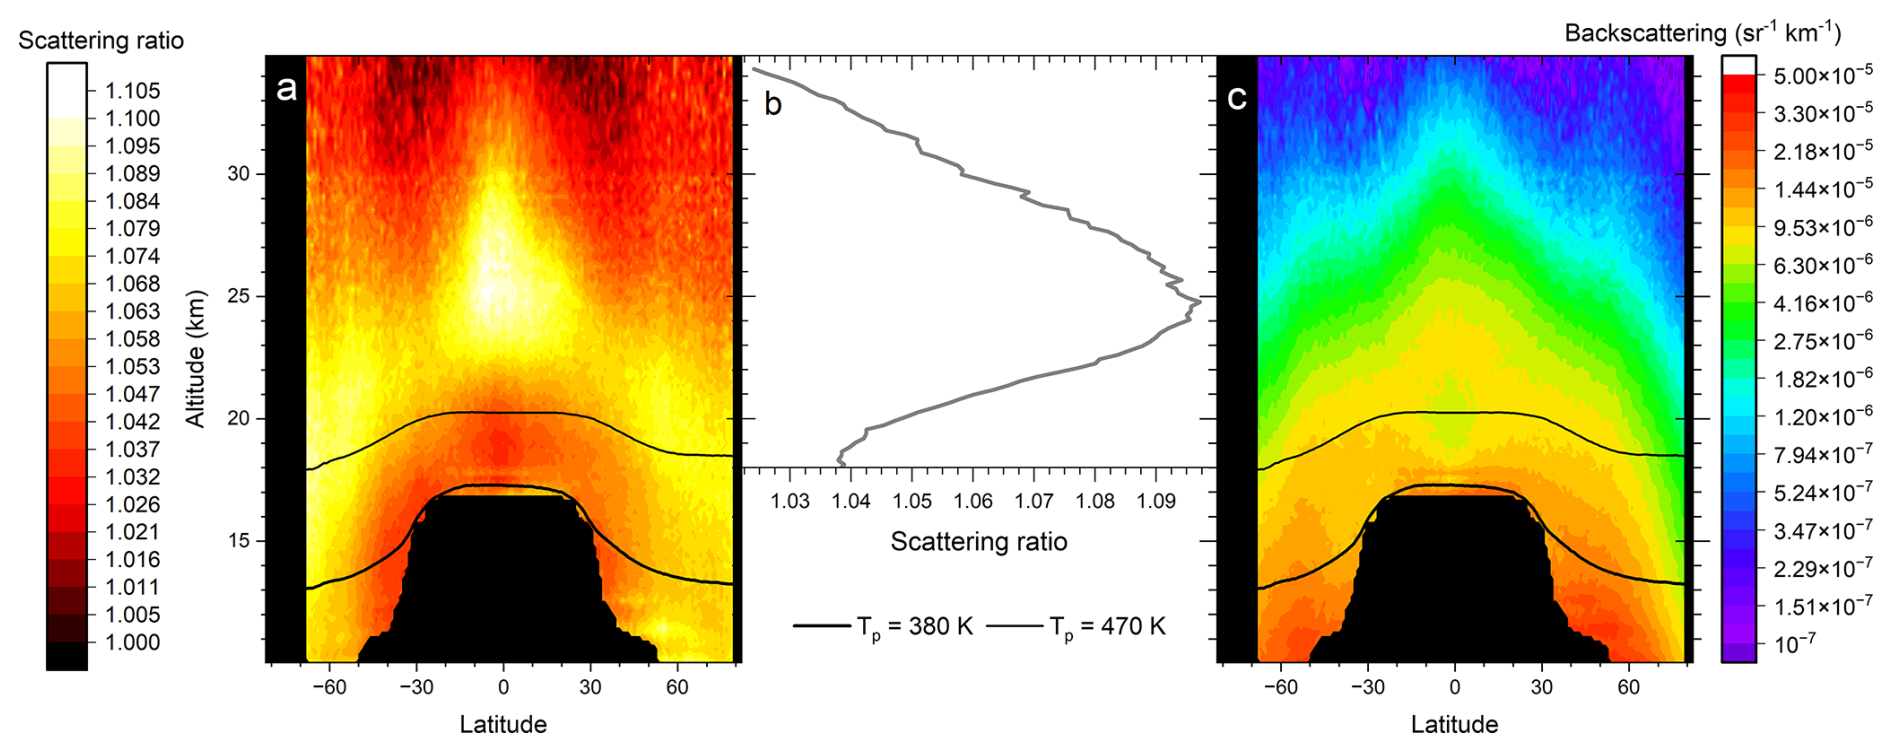
Figure 8The stratospheric aerosol averaged over year 2013, which was close to background conditions. (a) The scattering ratio, i.e., the ratio between the total to the modeled backscattering of air molecules. This intensive parameter is not latitude weighted. (b) Average scattering ratio in the central tropics (latitudes −10 to 10°) dependence on altitude. (c) Average aerosol backscattering, this extensive quantity is latitude weighted. Black lines in a and c are the yearly average positions of the potential temperatures (Tp) 380 and 470 K.
When we instead consider the absolute background aerosol load (Fig. 8c) we find the highest aerosol load at low stratospheric altitudes. The air in the Brewer-Dobson circulation becomes compressed during the downwelling in the extratropics in accordance with the altitude-dependence of the atmospheric pressure. Mixing across the extratropical tropopause culminating in the late summer with the ATAL affects the aerosol load in the LMS but does not affect the mixing ratios appreciably (Fig. 8a). However, somewhat higher scattering ratios are found in the ATAL region (15–45° N and 13–18 km altitude (Vernier et al., 2015)) compared with the same region of the southern hemisphere. In monthly resolution, rather than the yearly resolution of Fig. 8, enhanced aerosol load in the ATAL area is clearly visible in July–September 2013 (Martinsson et al., 2017). During background conditions approximately 60 % of the aerosol backscattering signal (AOD divided by the lidar ratio) is found in the two lower layers, sBD and LMS (Table 2), containing aerosol transported from both the sBD and dBD of the tropics.
3.4 Correction of lidar ratio
Thus far we have presented AODs with the lidar ratio set to 50 sr. The lidar ratios of the individual measurements are shown in Fig. 2. In Fig. 9a we show the averages with statistical uncertainty (standard error and double-sided 95 % confidence interval). As already pointed out, three of the eruptions (Nabro 2011, Kelut 2014 and Soufriere 2021) cannot be evaluated statistically due to few available measurements. Most of the aerosol events show effective lidar ratios of approximately 50 sr, whereas the aerosol from Puyehue-Cordón Caulle (2011), Raikoke (2019) and the Australian wildfires in the end of 2019 deviates from 50 sr by more than 5 %.
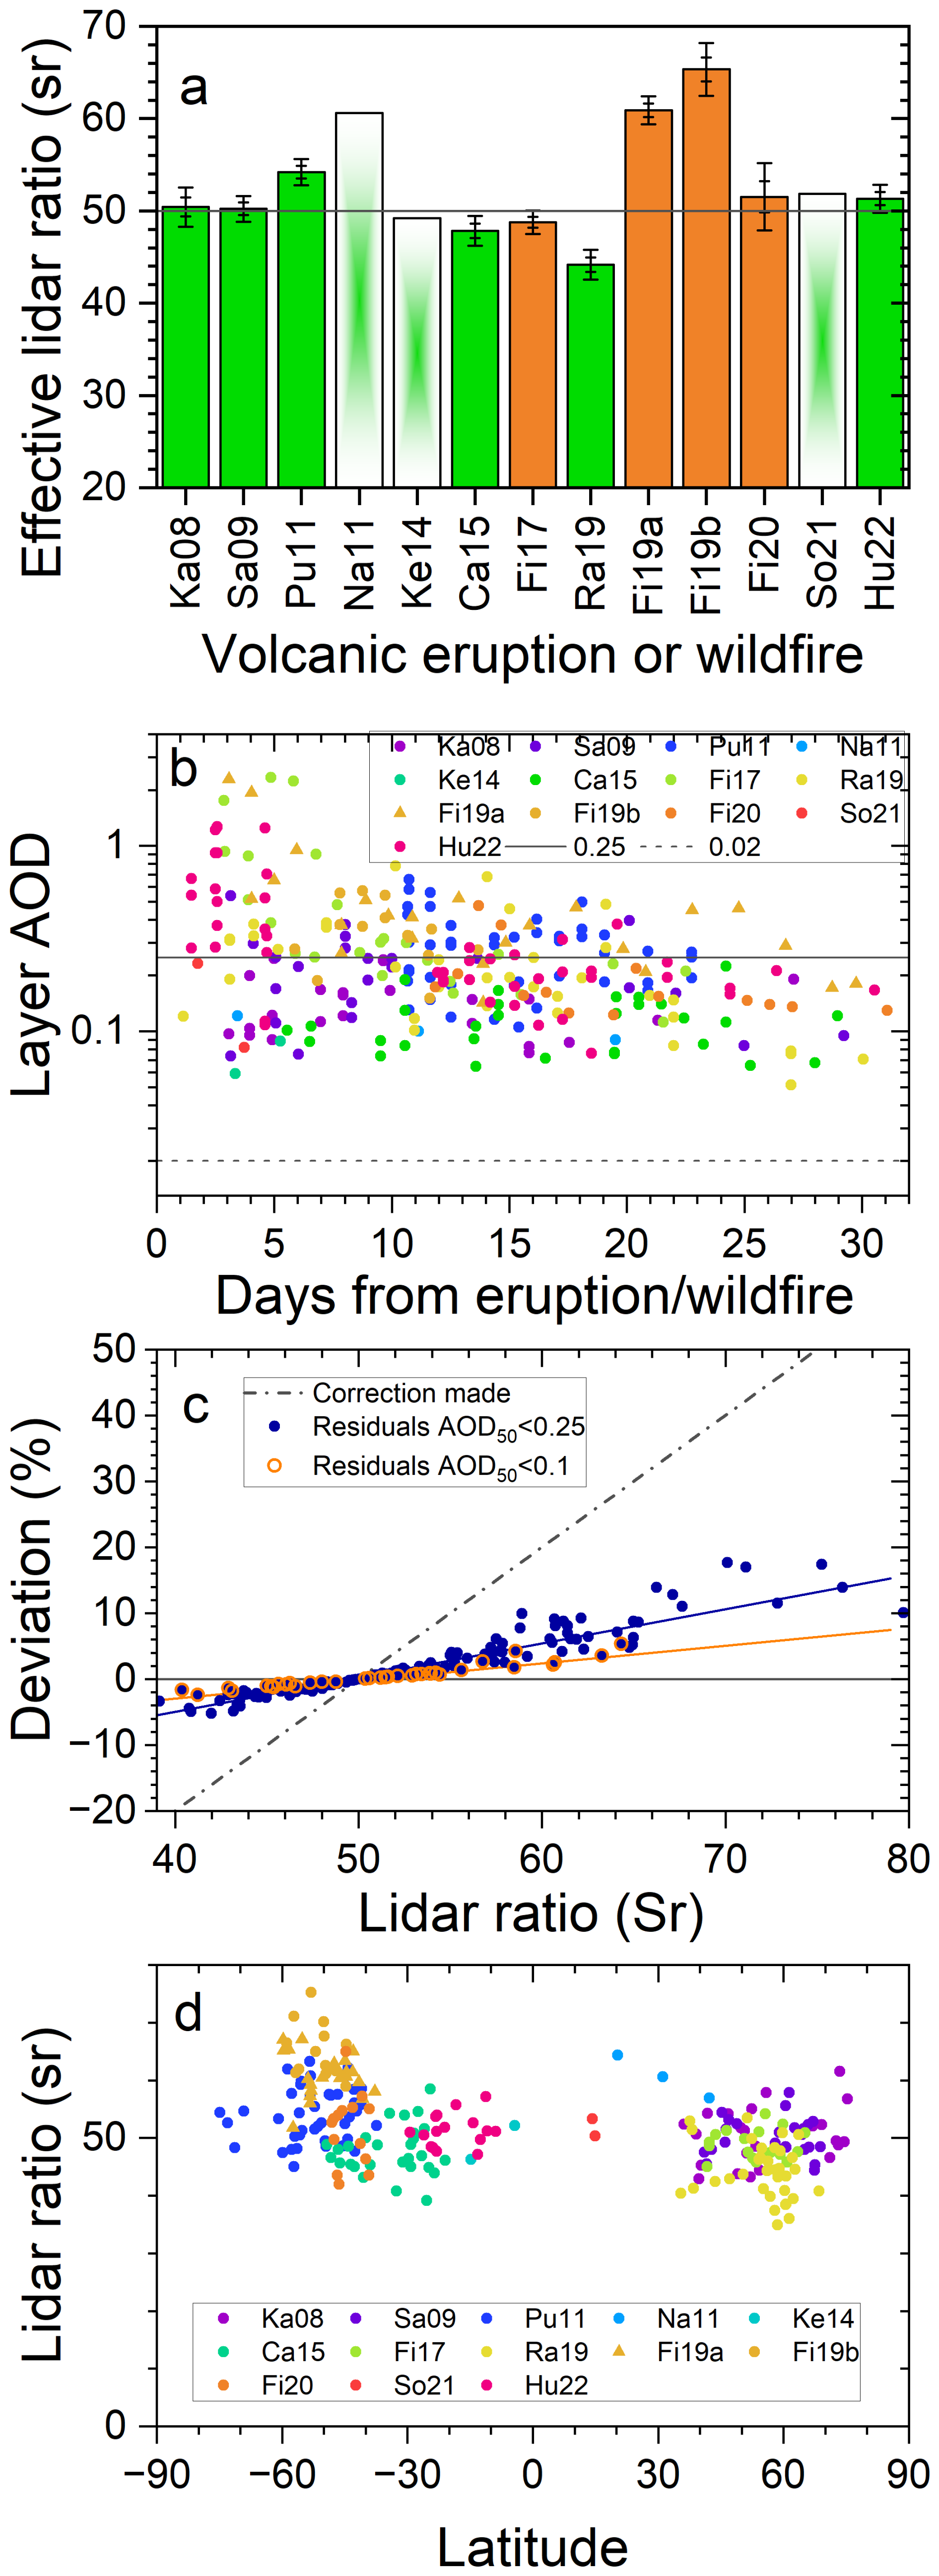
Figure 9(a) Average lidar ratios according to Fig. 2 with standard errors and 95 % ranges of volcanic eruptions and wildfires. Too few observations for error estimations were obtained for the eruptions of Nabro (Na11), Kelut (Ke14) and Soufriere (So21). (b) AODs of aerosol layers with sr vs. time from the eruption or wildfire. The full line illustrates approximate maximum layer AOD after 1 month, and the broken line indicates the approximate maximum layer AOD observable by limb-viewing techniques (note: logarithmic y-scale). (c) Correction of AOD obtained by setting the lidar ratio to 50 sr (AOD50), based on a linear dependence of the AOD on the lidar ratio. The residual deviation after the correction of two categories is also shown: aerosol layers with AOD50<0.1 and <0.25. (d) Estimated lidar ratios in Fig. 2 vs. latitude.
To convert the AOD obtained using S0=50 sr to the estimated lidar ratio (S) we need to consider the linear dependence of the AOD on the lidar ratio. A secondary effect relates to the level of AOD. For the latter, we need to evaluate the occurrence of dense aerosol layers. All the measurements fulfilling the criteria on uncertainty of the lidar ratio estimate (Fig. 1) are displayed in Fig. 9b. Initially layer AODs sometimes exceed 1. After 20 d the AOD of the individual aerosol layers is mostly 0.25 and lower, except for the 2019 Australian wildfire that remain somewhat higher probably due to less air mixing in the vortex formed (Kablick et al., 2020). We corrected the AODs by for volcanic eruptions and wildfires that formed an aerosol with effective lidar ratio deviating more than 5 % from S0=50 sr, whereas the residual correction connected with the AOD of an aerosol layer was not accounted for (see the methods section for further detail) because the effect is small (Fig. 9c). In the general evaluation we did not separate the aerosol backscattering from the 2019 and 2020 Australian wildfires that were only a few days apart. The 2020 fire was dominant in terms of AOD with 80 %–90 % of the total AOD from the two fires (Friberg et al., 2023). Here, we weigh the lidar ratios of the two fires accordingly to obtain S=53.3 representing both fires.
The blue dots in Fig. 10a over the stratospheric AOD were corrected for deviant lidar ratios in 2011 (Puyehue-Cordón Caulle eruption by +8 %) and 2019–2020 (Raikoke eruption by −12 % and Australian wildfires by +7 %). The corresponding AOD using S0=50 sr is represented by a thin gray line showing that the AOD was practically not affected by the correction in 2011 because that year was dominated by aerosol from another eruption (Nabro, Fig. 3). The AOD from the Raikoke (2019) eruption shifted down slightly by the correction, and that of the 2019–2020 Australian wildfires shifted upwards.
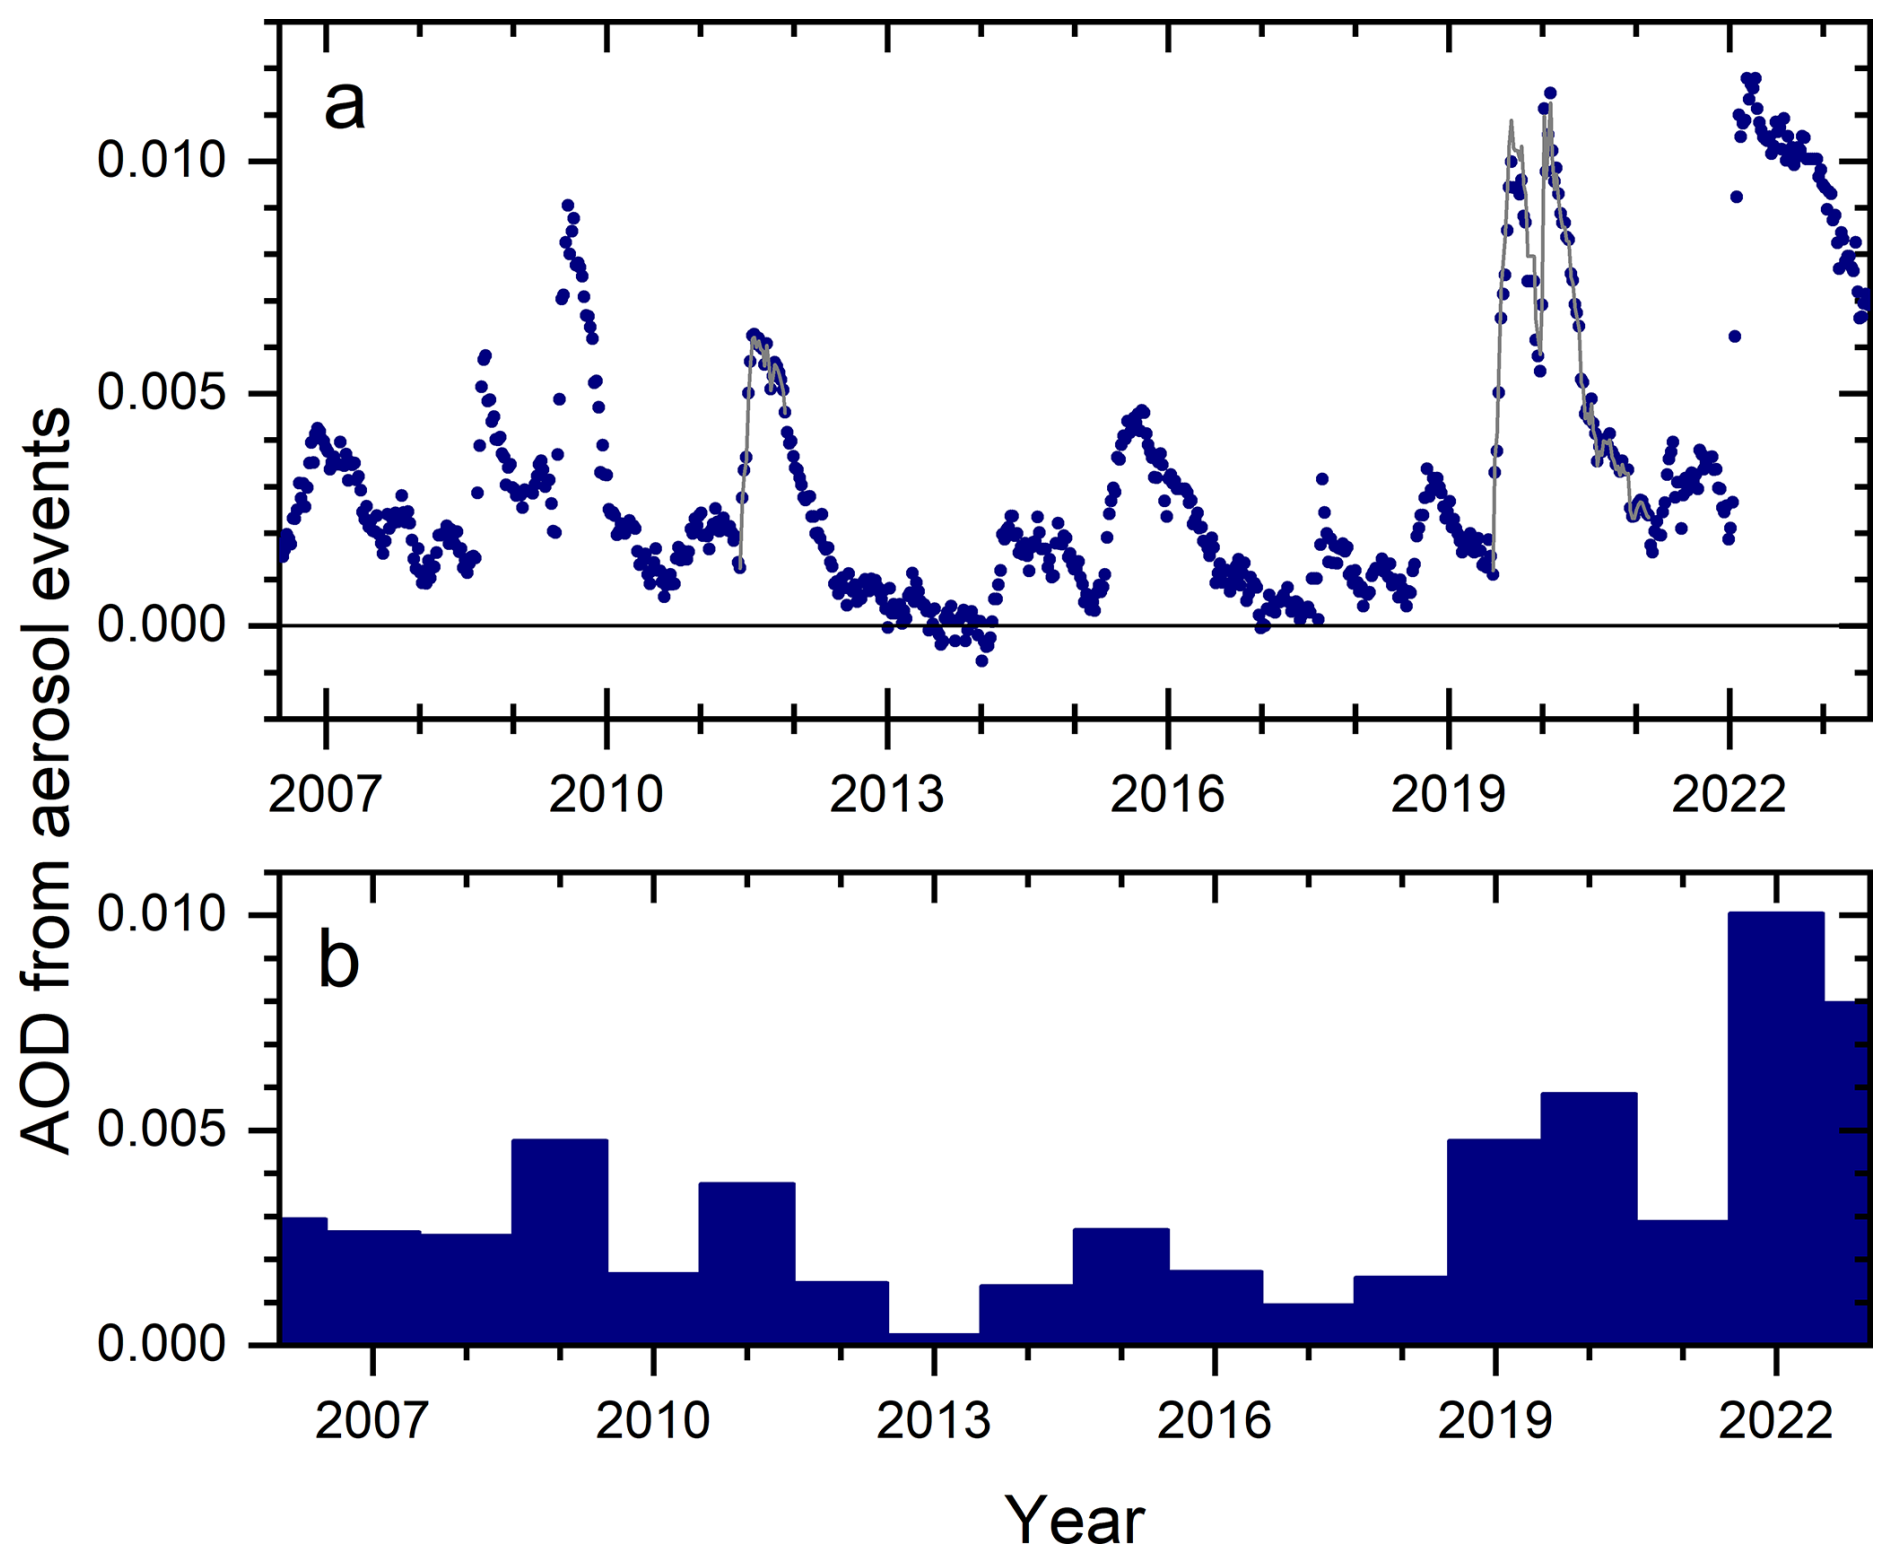
Figure 10Background-subtracted AOD of the stratosphere from the tropopause to 35 km altitude and averaged from −80 to 80° in latitude. (a) AOD from main stratospheric aerosol events caused by volcanic eruptions and wildfires. AOD50 is shown (full grey line) where correction due to lidar ratio deviating from 50 sr is undertaken (Pu11, Ra19 and Fi19 and 20). (b) Yearly averages of data in (a). Note that the horizontal tick marks indicate start of a year in (a) and the middle of a year in (b). Also note that the averages of years 2006 and 2023 span only half years due to the mid-year start (2006) and finish (2023) of the CALIOP measurements.
Altogether the changes in AOD from the corrections due to deviant lidar ratio were found to be minor, the largest correction (−12 %) was applied to the AOD of the Raikoke eruption. However, we could not statistically quantify all major aerosol events, most notably the Nabro eruption in 2011 (Fig. 2). Our results show that assumption of an effective lidar ratio of 50 sr works satisfactory in most cases in the 17 year period studied when the stratospheric aerosol is influenced by volcanism or wildfires. The applied method to obtain the effective lidar ratio cannot be used for optically thin layers like the background aerosol.
3.5 AOD of stratospheric aerosol events
The AOD from aerosol events were approximately evenly distributed over the three latitude regions (−80 to −20°, −20 to 20° and 20 to 80°) studied (Table 2). The altitude distribution showed most influence from volcanic eruptions and wildfires in the sBD (43 %), followed by the dBD (31 %), and the often overlooked LMS (Andersson et al., 2015) held 26 % of the AOD from aerosol events in the period 2006–2023.
The average stratospheric AOD, with the contribution from background aerosol subtracted, from the tropopause to 35 km altitude in the latitude range −80 to 80° is shown in Fig. 10a. The intense volcanism – sea interaction of the Hunga Ha'apai eruption in the beginning of 2022 (Martinsson et al., 2025) resulted in the highest and broadest AOD peak (Fig. 10a). Other prominent events were the Australian wildfires at the end of 2019 and the beginning of 2020, the eruptions of Raikoke (2019), Sarychev (2009), Nabro (2011), Calbuco (2015) and Kasatochi (2008) affecting the stratospheric AOD together with several eruptions and wildfires having smaller contributions (Table 1).
The average influence of volcanic eruptions and wildfires each year is shown in Fig. 10b. The most affected year was 2022 with an average AOD of 0.01 from aerosol events. That year is likely followed by 2023, for which we have no data from the second half of the year. Both these years were mainly affected by the 2022 Hunga Ha'apai eruption. Then follows 2020 (mainly the 2019–20 Australian wildfires with some contribution from the Raikoke eruption) with background-subtracted AOD of 0.006, 2009 (Sarychev) and 2019 (Raikoke) both years with AOD of 0.005, whereas 2011 (mainly Nabro) reach AOD from aerosol events of almost 0.004. The average background-subtracted AOD from volcanic eruptions and wildfires from 2006 to 2023 is 0.0031. The background aerosol produces global average backscattering of 0.00011 sr−1, which, with the commonly used assumption of a lidar ratio of 50 sr, corresponds to a stratospheric background AOD of 0.0057.
The yearly average AOD from aerosol events ranges from 0.0002 (in 2013) to 0.010 (2022) and the average over the 17 years studied is 0.0031. Making use of previous estimates of the relation between radiative forcing (F) and stratospheric AOD ( AOD in W m−2) (Schmidt et al., 2018), we can obtain a first, simplified estimate of the radiative effect of the stratospheric aerosol events. This relation is based on volcanic sulfate aerosol, which is the dominant type of stratospheric aerosol event in the 17 year period studied. The relation is not designed to deal with absorbing wildfire aerosol, which cause uncertainty in the average radiative forcing of the period estimated here. This simplified, order-of-magnitude estimate of the global stratospheric yearly average total effective radiative forcing due to volcanic eruptions and wildfires varies between −0.006 and −0.24 W m−2, with the average −0.074 W m−2 in the period 2006 to 2023. Assuming a lidar ratio of 50 sr, the stratospheric background aerosol effective radiative forcing becomes −0.14 W m−2.
Stratospheric aerosol optical properties are often described using solar occultation data, especially from the 22 years of SAGE II measurements (Bauman et al., 2003; Thomason et al., 2018). Prior comparisons of CALIOP lidar-based results with solar occultation (SAGE III/ISS) show agreement within approximately 10 % in the latitude range −30 to 30° and increasing discrepancy at midlatitudes reaching above 50 % at high latitudes for background aerosol in the altitude range 20–30 km (Kar et al., 2019), and discrepancies exceeding 50 % is reported at altitudes below 17 km (Kovilakam et al., 2023). The main reason for these differences was attributed to the unknown lidar ratio of CALIOP (Kar et al., 2019; Kovilakam et al., 2023). Here we have estimated the CALIOP effective lidar ratio of the aerosol from several volcanic eruptions and wildfires (Fig. 2), and in Fig. 9d the latitude distribution of the estimates is shown. Using the standard lidar ratio of 50 sr cannot explain the latitude- and altitude-dependence in the lidar – solar occultation comparison obtained in Kar et al. (2019) and Kovilakam et al. (2023) for aerosol from volcanic eruptions and wildfires in the CALIOP era.
The latitude-dependent discrepancy at 532 nm wavelength between SAGE III/ISS and CALIOP at high altitudes in the period June 2017 to August 2018 above 20 km (i.e., essentially in the dBD) reported by Kar et al. (2019) concerns a period when the dBD was close to background (Fig. 7). The method used here for estimating the lidar ratio does not work for background conditions (Fig. 1). Using the standard CALIOP lidar ratio for the background aerosol (50 sr) results in the global average background AOD of 0.0057. SAGE II measurements during the volcanically quiescent period 1998–2000 resulted in AOD of 0.0040 (estimated from Solomon et al. (2011), their Fig. 2), who integrated the stratospheric AOD from 15 km altitude. When removing the stratospheric aerosol data below 15 km from the CALIOP measurements, the stratospheric background AOD is reduced by 31 % to 0.0039 using lidar ratio 50 sr. This is almost identical to the background AOD reported in Solomon et al. (2011), thus indicating that the stratospheric background aerosol on average has a lidar ratio close to 50 sr. Kar et al. (2019) found that aerosol backscattering during background conditions at altitudes above 20 km in the extratropics should be converted to AOD by a variable lidar ratio. Mid- and high-latitude air in this altitude range has a high stratospheric age (∼5 years) (Ploeger et al., 2021), implying that particle gravitational settling has long time to affect the particle size distribution, and hence the optical properties of the aerosol. In Fig. 8c we find most of the aerosol above 20 km altitude to be located in the tropics, implying that the deviations at high latitudes that Kar et al. (2019) reported have little impact on global AOD, and thus little impact on our comparison with Solomon et al. (2011) that deals with the entire stratosphere above 15 km altitude.
In a comparison by Kovilakam et al. (2023) between CALIOP and SAGE III/ISS during November 2017, 2–3 months after the Canada/USA fire (Table 1) large deviations were found at high latitudes and altitudes as in Kar et al. (2019), as described above. Kovilakam et al. (2023) also found large differences in the densest part of the stratosphere, i.e., at altitudes below 17 km. In GloSSAC the more than 50 % lower values of limb-viewing techniques (SAGE and OSIRIS) than CALIOP were adopted, justified by citing uncertainties in the lidar ratio to discard CALIOP results at low altitudes (Kovilakam et al., 2023).
The main advantages of solar occultation measurements are that extinction is measured and that several wavelengths are available. Lidar measurements also have some distinct advantages. Lidars with nadir view have several hundred kilometers shorter measurement path enabling measurements in dense aerosol layers (Martinsson et al., 2022, their Fig. 7) producing viable, quantitative results when limb views fail, provided that the lidar ratio is known. The lidar vertical resolution is superior and is not relying on assumptions on homogeneity of the aerosol layer measured, like solar occultation measurements do (Damadeo et al., 2013). Accurate altitude descriptions with high vertical resolution of stratospheric injections (Sandvik et al., 2021) are vital for the outcome of stratospheric aerosol modeling (Axebrink et al., 2025). Relying on these points we argue that the role of lidar measurements should be re-evaluated. Existing methods differ in their sensitivity to aerosol properties and in their temporal coverage. We need to take advantage of the best qualities of all available methods, both in terms of physical properties and time coverage. Re-evaluation of CALIOP data could improve stratospheric aerosol climatologies, like GloSSAC (Thomason et al., 2018; Kovilakam et al., 2020; Kovilakam et al., 2023), that are designed for the modeling community, ultimately leading to a better representation of the stratospheric aerosol in climate modeling.
Hopefully the lidar ratio of stratospheric aerosol can be further clarified when the aerosol load is close to background conditions by lidar systems measuring both backscattering and extinction. The ATLID aboard the EarthCARE satellite (Illingworth et al., 2015) that started to produce data in July 2024 and the NASA and Italian Space Agency collaboration on the 3 wavelength lidar CALIGOLA planned for launch in the early 2030s (Behrenfeld et al., 2023) are future means to further clarify extinction obtained from lidars, and to optimally combine solar occultation and lidar measurements for future long-term records on the optical properties of the stratospheric aerosol with high and unambiguous vertical resolution.
The entire backscattering record at 532 nm wavelength of the satellite-based lidar system CALIOP spanning years 2006 to 2023 was investigated in this study. During this period injections of aerosol and precursor gases into the stratosphere of 15 volcanic eruptions and 5 wildfires were identified. The effective lidar ratios of 12 volcanic eruptions and wildfires were investigated to convert the measured backscattering to extinction. The measurements were evaluated and corrected for attenuation using the lidar ratio S0=50 sr. The aerosol events having a lidar ratio deviating by more than 5 % from S0 were corrected after the general evaluation.
Background aerosol conditions are more likely to occur in sublayers than throughout the entire stratosphere. The stratosphere was therefore subdivided into 9 layers spanned by altitude (lowermost stratosphere (LMS), shallow Brewer-Dobson branch (sBD), deep Brewer-Dobson branch (dBD)) and latitude intervals (tropics and Southern and Northen extratropics). The estimated backgrounds of layers were combined to obtain the background aerosol of the entire stratosphere. The backscattering of background aerosol was converted to aerosol optical depth (AOD) using a lidar ratio of 50 sr. That AOD agrees well with measurements with solar occultation (SAGE II) during 1998–2000 in the volcanically quiescent period. The average backscattering of seven of the nine layers each contains 11 %–15 % of the entire background aerosol. The tropical LMS has a small contribution due to very small volume compared to the other layers. The tropical sBD was also clearly lower (7 %) because oxidation of carbonyl sulfide (OCS) occurs at higher altitudes in the upwards moving air in the tropical stratosphere. We find that 70 % of the aerosol in the tropical dBD is formed above 19 km altitude during background conditions, due to formation from OCS. A several kilometers thick band of low aerosol load directly above the tropopause was identified which we attribute to young stratospheric air transported in the sBD. Above that layer a broad band with high aerosol load was found which we identify as the tropical dBD air that is transported polewards and downwards resulting in high aerosol load in the sBD and LMS at mid and high latitudes. Considering the ongoing debate on the sources of stratospheric background aerosol, these highly resolved CALIOP data could be useful to constrain modeling efforts on the sources of the stratospheric sulfurous aerosol.
The background aerosol AOD (0.0057) was subtracted from the measurements to obtain the influence from aerosol and trace gas injections into the stratosphere. The most important aerosol events in the 17 year period are the 2022 Hunga Ha'apai eruption and the Australian wildfires (2019–20) followed by the volcanic eruptions Raikoke (2019), Sarychev (2009) and Nabro (2011). The global yearly average AOD increase from volcanic and wildfire injections spans 0 to 0.010.
Limb-viewing solar occultation measurements have some distinctive advantages in that much of the early measurements in the satellite era were undertaken with that method. They also deliver direct measurements of extinction, and at several wavelengths. Here, we have estimated the effective lidar ratio of the CALIOP measurements to obtain extinction from backscattering measurements. Lidars operating in nadir view, like CALIOP, have several hundred kilometers (or a factor of more than 100) shorter measurement path than limb-viewers, allowing measurements in dense aerosol layers where limb-viewers fail. Lidars have unambiguous and superior vertical resolution over other satellite instruments providing models with important input on aerosol and trace gas injections into the stratosphere. Newer lidars that measure extinction are launched, under construction and planned. Future work should better reconcile lidar and solar occultation records and exploit their complementary strengths. With known effective lidar ratios the relation between CALIOP and solar occultation measurements needs to be re-evaluated, especially in the dense stratospheric air located below 17 km altitude in long-term records over the optical properties of the stratospheric aerosol.
The data used are publicly available: CALIOP V4.51 lidar data (https://search.earthdata.nasa.gov/search?fp=CALIPSO, last access: 30 October 2025).
The supplement related to this article is available online at https://doi.org/10.5194/acp-26-8999-2026-supplement.
BGM planned the study, undertook most of the data analysis and wrote the paper. JF participated in the planning of the study, undertook part of the data analysis and MKS contributed. JF and MKS undertook data extraction and handling for the data analysis. All authors participated in discussions and commented on the manuscript.
The contact author has declared that none of the authors has any competing interests.
Publisher's note: Copernicus Publications remains neutral with regard to jurisdictional claims made in the text, published maps, institutional affiliations, or any other geographical representation in this paper. The authors bear the ultimate responsibility for providing appropriate place names. Views expressed in the text are those of the authors and do not necessarily reflect the views of the publisher.
Aerosol products from the CALIOP sensor were produced by NASA Langley Research Center.
The Swedish National Space Agency, contracts 2025-00200 and 2022-00157, Johan Friberg. The Crafoord Foundation, contract 20240901, Johan Friberg. Formas, contract 2025-01869, Johan Friberg. Formas, contract 2020-00997, Moa Sporre. The Swedish Research Council 2022-02836, Moa Sporre.
This paper was edited by Matthias Tesche and reviewed by three anonymous referees.
Andersson, S. M., Martinsson, B. G., Friberg, J., Brenninkmeijer, C. A. M., Rauthe-Schöch, A., Hermann, M., van Velthoven, P. F. J., and Zahn, A.: Composition and evolution of volcanic aerosol from eruptions of Kasatochi, Sarychev and Eyjafjallajökull in 2008–2010 based on CARIBIC observations, Atmos. Chem. Phys., 13, 1781–1796, https://doi.org/10.5194/acp-13-1781-2013, 2013.
Andersson, S. M., Martinsson, B. G., Vernier, J.-P., Friberg, J., Brenninkmeijer, C. A. M., Hermann, M., van Velthoven, P. F. J., and Zahn, A.: Significant radiative impact of volcanic aerosol in the lowermost stratosphere, Nat. Commun., 6, 1–8, https://doi.org/10.1038/ncomms8692, 2015.
Appenzeller, C., Holton, J. R., and Rosenlov, K. H.: Seasonal variation of mass transport across the tropopause, J. Geophys. Res., 101, 15071–15078, 1996.
Austin, J. and Li, F.: On the relationship between the strength of the Brewer-Dobson circulation and the age of stratospheric air, Geophys. Res. Lett., 33, L17807, https://doi.org/10.1029/2006GL026867, 2006.
Axebrink, E., Sporre, M. K., and Friberg, J.: Impact of SO2 injection profiles on simulated volcanic forcing for the 2009 Sarychev eruptions – investigating the importance of using high-vertical-resolution methods when compiling SO2 data, Atmos. Chem. Phys., 25, 2047–2059, https://doi.org/10.5194/acp-25-2047-2025, 2025.
Baars, H., Ansmann, A., Ohneiser, K., Haarig, M., Engelmann, R., Althausen, D., Hanssen, I., Gausa, M., Pietruczuk, A., Szkop, A., Stachlewska, I. S., Wang, D., Reichardt, J., Skupin, A., Mattis, I., Trickl, T., Vogelmann, H., Navas-Guzmán, F., Haefele, A., Acheson, K., Ruth, A. A., Tatarov, B., Müller, D., Hu, Q., Podvin, T., Goloub, P., Veselovskii, I., Pietras, C., Haeffelin, M., Fréville, P., Sicard, M., Comerón, A., Fernández García, A. J., Molero Menéndez, F., Córdoba-Jabonero, C., Guerrero-Rascado, J. L., Alados-Arboledas, L., Bortoli, D., Costa, M. J., Dionisi, D., Liberti, G. L., Wang, X., Sannino, A., Papagiannopoulos, N., Boselli, A., Mona, L., D'Amico, G., Romano, S., Perrone, M. R., Belegante, L., Nicolae, D., Grigorov, I., Gialitaki, A., Amiridis, V., Soupiona, O., Papayannis, A., Mamouri, R.-E., Nisantzi, A., Heese, B., Hofer, J., Schechner, Y. Y., Wandinger, U., and Pappalardo, G.: The unprecedented 2017–2018 stratospheric smoke event: decay phase and aerosol properties observed with the EARLINET, Atmos. Chem. Phys., 19, 15183–15198, https://doi.org/10.5194/acp-19-15183-2019, 2019.
Bauman, J. J., Russell, P. B., Geller, M. A., and Hamill, P.: A stratospheric aerosol climatology from SAGE II and CLAES measurements, 2. Results and comparisons, 1984–1999, J. Geophys. Res., 108, 4383, https://doi.org/10.1029/2002JD002993, 2003.
Behrenfeld, M. J., Lorenzoni, L., Hu, Y., Bissom, K. M., Hostetler, C. A., Di Girolamo, P., Dionisi, D., Longo, F., and Zoffoli, S.: Satellite Lidar Measurements as a Critical New Global Ocean Climate Record, Remote Sens., 15, 5567, https://doi.org/10.3390/rs15235567, 2023.
Brühl, C., Lelieveld, J., Crutzen, P. J., and Tost, H.: The role of carbonyl sulphide as a source of stratospheric sulphate aerosol and its impact on climate, Atmos. Chem. Phys., 12, 1239–1253, https://doi.org/10.5194/acp-12-1239-2012, 2012.
Butchart, N.: The Brewer-Dobson circulation, Rev. Geophys., 52, 157–184, https://doi.org/10.1002/2013RG000448, 2014.
Carn, S. A., Krueger, A. J., Krotkov, N. A., Yang, K., and Evans, K.: Tracking volcanic sulfur dioxide clouds for aviation hazard mitigation, Nat. Hazards, 51, 325–343, https://doi.org/10.1007/s11069-008-9228-4, 2009.
Carn, S. A. and Prata, F. J.: Satellite-based constraints on explosive SO2 release from Soufrière Hills Volcano, Montserrat, Geophys. Res. Lett., 37, 1–5, https://doi.org/10.1029/2010GL044971, 2010.
Carn, S. A., Krotkov, N. A., Fisher, B. L., and Li, C.: Out of the blue, Volcanic SO2 emissions during the 2021–2022 eruptions of Hunga Tonga– Hunga Ha'apai (Tonga), Front. Earth Sci., 10, 976962, https://doi.org/10.3389/feart.2022.976962, 2022.
Chin, M. and Davies, D. D.: A reanalysis of carbonyl sulfide as a source of stratospheric background sulfur aerosol, J. Geophys. Res., 100, 8993–9005, 1995.
Clarisse, L., Hurtmans, D., Clerbaux, C., Hadji-Lazaro, J., Ngadi, Y., and Coheur, P.-F.: Retrieval of sulphur dioxide from the infrared atmospheric sounding interferometer (IASI), Atmos. Meas. Tech., 5, 581–594, https://doi.org/10.5194/amt-5-581-2012, 2012.
Clarisse, L., Coheur, P.-F., Prata, F., Hadji-Lazaro, J., Hurtmans, D., and Clerbaux, C.: A unified approach to infrared aerosol remote sensing and type specification, Atmos. Chem. Phys., 13, 2195–2221, https://doi.org/10.5194/acp-13-2195-2013, 2013.
Crutzen, P. J.: The possible importance of CSO for the sulfate layer of the stratosphere, Geophys. Res. Lett., 3, 73–76, 1976.
Cruz, M. G., Sullivan, A. L., Gould, J. S., Sims, N. C., Bannister, A. J., Hollis, J. J., and Hurley, R. J.: Anatomy of a catastrophic wildfire: The Black Saturday Kilmore East fire in Victoria, Australia, Forest Ecol. Manag. 284, 269–295, 2012.
Damadeo, R. P., Zawodny, J. M., Thomason, L. W., and Iyer, N.: SAGE version 7.0 algorithm: application to SAGE II, Atmos. Meas. Tech., 6, 3539–3561, https://doi.org/10.5194/amt-6-3539-2013, 2013.
Friberg, J., Martinsson, B. G., Andersson, S. M., Brenninkmei jer, C. A. M., Hermann, M., Van Velthoven, P. F. J., and Zahn, A.: Sources of increase in lowermost stratospheric sulphurous and carbonaceous aerosol background concentrations during 1999–2008 derived from CARIBIC flights, Tellus B, 66, 23428, https://doi.org/10.3402/tellusb.v66.23428, 2014.
Friberg, J., Martinsson, B. G., Andersson, S. M., and Sandvik, O. S.: Volcanic impact on the climate – the stratospheric aerosol load in the period 2006–2015, Atmos. Chem. Phys., 18, 11149–11169, https://doi.org/10.5194/acp-18-11149-2018, 2018.
Friberg, J., Martinsson, B. G., and Sporre, M. K.: Short- and long-term stratospheric impact of smoke from the 2019–2020 Australian wildfires, Atmos. Chem. Phys., 23, 12557–12570, https://doi.org/10.5194/acp-23-12557-2023, 2023.
Fromm, M., Lindsey, D. T., Servranckx, R., Yue, G., Trickl, T., Sica, R., Doucet, P., and Godin-Beekmann, S.: The untold story of pyrocumulonimbus, B. Am. Meteorol. Soc., 91, 1193–1209, 2010.
Fromm, M., Kablick III, G. P., Peterson, D. A., Kahn, R. A., Flower, V. J. B., and Seftor, C. J.: Quantifying the source term and uniqueness of the August 12, 2017 Pacific Northwest pyroCb event, J. Geophys. Res., 126, https://doi.org/10.1029/2021JD034928, 2021.
Garofalo, L. A., Levin, E. J. T., Campos, T., Kreidenweis, S. N., and Farmer, D. K.: Emission and evolution of submicron organic aerosol in smoke from wild fires in the western United States, ACS Space Chem., 3, 1237–1247, 2019.
Gelaro, R., McCarty, W., Suarez, M. J., Todling, R., Moloud, A., Takacs, L., Randles, C. A., Darmenov, A., Bosilovich, M. G., Reichle, R., Wargan, K., Coy, L., Cullather, R., Draper, C., Akella, S., Buchard, V., Conaty, A., da Silva, A. M., Gu, W., Kim, G.-K., Koster, R., Lucchesi, R., Merkova, D., Nielsen, J. E., Partyka, G., Pawson, S., Putman, W., Rienecker, M., Schubert, S. D., Seinkiewicz, M., and Zhao, B.: The Modern-Era Retrospective Analysis for Research and Applications, Version 2 (MERRA-2), J. Clim. 30, 5419–5454, 2017.
Haywood, J. M., Jones, A., Clarisse, L., Bourassa, A., Barnes, J., Telford, P., Bellouin, N., Boucher, O., Agnew, P., Clerbaux, C., Coheur, P., Degenstein, D., and Braesicke, P.: Observations of the eruption of the Sarychev volcano and simulations using the HadGEM2 climate model, J. Geophys. Res., 115, https://doi.org/10.1029/2010JD014447, 2010.
Illingworth, A. J., Barker, H. W., Beljaars, A., Ceccaldi, M., Chepfer, H., Clerbaux, N., Cole, J., Delanoë, J., Domenech, C., Donovan, D. P., Fukuda, S., Hirakata, M., Hogan, R. J., Huenerbein, A., Kollias, P., Kubota, T., Nakajima, T., Naka jima, T. Y., Nishizawa, T., Ohno, Y., Okamoto, H., Oki, R., Sato, K., Satoh, M., Shephard, M. W., Velázquez-Blázquez, A., Wandinger, U., Wehr, T., and van Zadelhoff, G.-J.: The Earth CARE Satellite, The Next Step Forward in Global Measurements of Clouds, Aerosols, Precipitation, and Radiation, B. Am. Meteorol. Soc., 96, 1311–1332, https://doi.org/10.1175/BAMS-D-12-00227.1, 2015.
Junge, C. E., Chagnon, C. W., and Manson, J. E.: A World-wide Stratospheric Aerosol Layer, Science, 133, 1478–1479, 1961.
Kablick, G. P., Allen, D. R., Fromm, M. D., and Nedoluha, G. E.: Australian PyroCb Smoke Generates Synoptic-Scale Strato spheric Anticyclones, Geophys. Res. Lett., 47, https://doi.org/10.1029/2020GL088101, 2020.
Kar, J., Lee, K.-P., Vaughan, M. A., Tackett, J. L., Trepte, C. R., Winker, D. M., Lucker, P. L., and Getzewich, B. J.: CALIPSO level 3 stratospheric aerosol profile product: version 1.00 algorithm description and initial assessment, Atmos. Meas. Tech., 12, 6173–6191, https://doi.org/10.5194/amt-12-6173-2019, 2019.
Kloss, C., Berthet, G., Sellitto, P., Ploeger, F., Taha, G., Tidiga, M., Eremenko, M., Bossolasco, A., Jégou, F., Renard, J.-B., and Legras, B.: Stratospheric aerosol layer perturbation caused by the 2019 Raikoke and Ulawun eruptions and their radiative forcing, Atmos. Chem. Phys., 21, 535–560, https://doi.org/10.5194/acp-21-535-2021, 2021.
Kovilakam, M., Thomason, L. W., Ernest, N., Rieger, L., Bourassa, A., and Millán, L.: The Global Space-based Stratospheric Aerosol Climatology (version 2.0): 1979–2018, Earth Syst. Sci. Data, 12, 2607–2634, https://doi.org/10.5194/essd-12-2607-2020, 2020.
Kovilakam, M., Thomason, L., and Knepp, T.: SAGE III/ISS aerosol/cloud categorization and its impact on GloSSAC, Atmos. Meas. Tech., 16, 2709–2731, https://doi.org/10.5194/amt-16-2709-2023, 2023.
Kremser, S., Thomason, L. W., von Hobe, M., Hermann, M., Desh ler, T., Timmreck, C., Toohey, M., Stenke, A., Schwarz, J. P., Weigel, R., Fueglistaler, S., Prata, F. J., Vernier, J. P., Schlager, H., Barnes, J. E., Antuña-Marrero, J. C., Fairlie, D., Palm, M., Mahieu, E., Notholt, J., Rex, M., Bingen, C., Vanhellemont, F., Bourassa, A., Plane, J. M. C., Klocke, D., Carn, S. A., Clarisse, L., Trickl, T., Neely, R., James, A. D., Rieger, L., Wilson, J. C., and Meland, B.: Stratospheric aerosol– Observations, processes, and impact on climate, Rev. Geophys., 54, 278–335, https://doi.org/10.1002/2015RG000511, 2016.
Li, C., Krotkov, N. A., Carn, S., Zhang, Y., Spurr, R. J. D., and Joiner, J.: New-generation NASA Aura Ozone Monitoring Instrument (OMI) volcanic SO2 dataset: algorithm description, initial results, and continuation with the Suomi-NPP Ozone Mapping and Profiler Suite (OMPS), Atmos. Meas. Tech., 10, 445–458, https://doi.org/10.5194/amt-10-445-2017, 2017.
Lin, P. and Fu, Q., Changes in various branches of the Brewer – Dobson circulation from an ensemble of chemistry climate models, J. Geophys. Res., 118, 73–84, https://doi.org/10.1029/2012JD018813, 2013.
Malinina, E., Rozanov, A., Niemeier, U., Wallis, S., Arosio, C., Wrana, F., Timmreck, C., von Savigny, C., and Burrows, J. P.: Changes in stratospheric aerosol extinction coefficient after the 2018 Ambae eruption as seen by OMPS-LP and MAECHAM5-HAM, Atmos. Chem. Phys., 21, 14871–14891, https://doi.org/10.5194/acp-21-14871-2021, 2021.
Martinsson, B. G., Nguyen, H. N., Brenninkmeijer, C. A. M., Zahn, A., Heintzenberg, J., Hermann, M., and van Velthoven, P. F. J.: Characteristics and origin of lowermost stratospheric aerosol at northern midlatitudes under volcanically quiescent conditions based on CARIBIC observations, J. Geophys. Res., 110, https://doi.org/10.1029/2004JD005644, 2005.
Martinsson, B. G., Brenninkmeijer, C. A. M., Cam, S. A., Hermann, M., Heue, K. P., van Velthoven, P. F. J., and Zahn, A.: Influence of the 2008 Kasatochi volcanic eruption on sulfurous and carbonaceous aerosol constituents in the lower stratosphere, Geophys. Res. Lett., 36, 1–5, https://doi.org/10.1029/2009GL038735, 2009.
Martinsson, B. G., Friberg, J., Sandvik, O. S., Hermann, M., van Velthoven, P. F. J., and Zahn, A.: Particulate sulfur in the upper troposphere and lowermost stratosphere – sources and climate forcing, Atmos. Chem. Phys., 17, 10937–10953, https://doi.org/10.5194/acp-17-10937-2017, 2017.
Martinsson, B. G., Friberg, J., Sandvik, O. S., Hermann, M., van Velthoven, P. F. J., and Zahn, A.: Formation and composition of the UTLS aerosol, npj Climate and Atmospheric Science, 2, 1–6, https://doi.org/10.1038/s41612-019-0097-1, 2019.
Martinsson, B. G., Friberg, J., Sandvik, O. S., and Sporre, M. K.: Five-satellite-sensor study of the rapid decline of wildfire smoke in the stratosphere, Atmos. Chem. Phys., 22, 3967–3984, https://doi.org/10.5194/acp-22-3967-2022, 2022.
Martinsson, B. G., Friberg, J., and Sporre, M. K.: Stratospheric aerosol formed by intense volcanism–sea interaction during the 2022 Hunga Ha'apai eruption, Atmos. Chem. Phys., 25, 10677–10690, https://doi.org/10.5194/acp-25-10677-2025, 2025.
Mastin, L. G., Van Eaton, A. R., and Cronin, S. J.: Did steam boost the height and growth rate of the giant Hunga eruption plume?, B. Volcanol., 86, 64, https://doi.org/10.1007/s00445-024-01749-1, 2024.
McCarthy, G. J., Plucinski, M. P., and Gould, J. S.: Analysis of the resourcing and containment of multiple remote fires: The Great Divide Complex of fires, Victoria, December 2006, Aust. Forestry, 75, 54–63, https://doi.org/10.1080/00049158.2012.10676385, 2012.
Mote, P. W., Dunkerton, T. J., McIntyre, M. E., Ray, E. A., Haynes, P. H., and Russell III, J. M.: Vertical velocity, vertical diffusion, and dilution by midlatitude air in the tropical lower stratosphere, J. Geophys. Res. 103, 8651–8666, 1998.
Murphy, D. M., Cziczo, D. J., Hudson, P. K., and Thomson, D. S.: Carbonaceous material in aerosol particles in the lower stratosphere and tropopause region, J. Geophys. Res., 112, https://doi.org/10.1029/2006JD007297, 2007.
NASA/LARC/SD/ASDC: Science CALIPSO Lidar Level 1B profile data, V4-51, NASA Langley Atmospheric Data Center DAAC [data set], https://doi.org/10.5067/CALIOP/CALIPSO/CAL_LID_L1-Standard-V4-51, 2024.
Nicknish, P. A., Stone, K., Solomon, S., and Carn, S. A.: Quantifying the decay timescale of volcanic sulfur dioxide in the stratosphere, Atmos. Chem. Phys., 25, 11535–11555, https://doi.org/10.5194/acp-25-11535-2025, 2025.
Ohneiser, K., Ansmann, A., Baars, H., Seifert, P., Barja, B., Jimenez, C., Radenz, M., Teisseire, A., Floutsi, A., Haarig, M., Foth, A., Chudnovsky, A., Engelmann, R., Zamorano, F., Bühl, J., and Wandinger, U.: Smoke of extreme Australian bushfires observed in the stratosphere over Punta Arenas, Chile, in January 2020: optical thickness, lidar ratios, and depolarization ratios at 355 and 532 nm, Atmos. Chem. Phys., 20, 8003–8015, https://doi.org/10.5194/acp-20-8003-2020, 2020.
Pardini, F., Burton, M., Arzilli, F., La Spina, G., and Polacci, M.: SO2 emissions, plume heights and magmatic processes inferred from satellite data: The 2015 Calbuco eruptions, J. Volcanol. Geotherm. Res., 361, 12–24, 2018.
Peterson, D. A., Fromm, M. D., McRae, R. H. D., Campbell, J. R., Hyer, E. J., Taha, G., Camacho, C. P., Kablick, G. P., Schmidt, C. C., and DeLand, M. T.: Australia's Black Summer pyrocumulonimbus super outbreak reveals potential for increasingly extreme stratospheric smoke events, Npj Clim. Atmos. Sci., 4, 38 https://doi.org/10.1038/s41612-021-00192-9, 2021.
Peterson, D. A., Berman, M. T., Fromm, M. D., Servranckx, R., Julstrom, W. J., Hyer, E. J., Campbell, J. R., McHardy, T. M., and Lambert, A.: Worldwide inventory reveals the frequency and variability of pyrocumulonimbus and stratospheric smoke plumes during 2013–2023, Npj Clim. Atmos. Sci., 8, 325, https://doi.org/10.1038/s41612-025-01188-5, 2025.
Ploeger, F., Diallo, M., Charlesworth, E., Konopka, P., Legras, B., Laube, J. C., Grooß, J.-U., Günther, G., Engel, A., and Riese, M.: The stratospheric Brewer–Dobson circulation inferred from age of air in the ERA5 reanalysis, Atmos. Chem. Phys., 21, 8393–8412, https://doi.org/10.5194/acp-21-8393-2021, 2021.
Prata, A. T., Young, S. A., Siems, S. T., and Manton, M. J.: Lidar ratios of stratospheric volcanic ash and sulfate aerosols retrieved from CALIOP measurements, Atmos. Chem. Phys., 17, 8599–8618, https://doi.org/10.5194/acp-17-8599-2017, 2017.
Rieger, L. A., Bourassa, A. E., and Degenstein, D. A.: Merging the OSIRIS and SAGE II stratospheric aerosol records, J. Geophys. Res.-Atmos., 120, 8890–8904, https://doi.org/10.1002/2015JD023133, 2015.
Sandvik, O. S., Friberg, J., Sporre, M. K., and Martinsson, B. G.: Methodology to obtain highly resolved SO2 vertical profiles for representation of volcanic emissions in climate models, Atmos. Meas. Tech., 14, 7153–7165, https://doi.org/10.5194/amt-14-7153-2021, 2021.
Sato, M., Hansen, J. E., McCormick, M. P., and Pollack J. B.: Stratospheric aerosol optical depths, 1850–1990, J. Geophys. Res., 98, 22987–22994, 1993.
Schmidt, A., Mills, M. J., Ghan, S., Gregory, J. M., Allan, R. P., Andrews, T., Bardeen, C. G., Conley, A., Forster, P. M., Gettelman, A., Portmann, R. W., Solomon, S., and Toon, O. B.: Volcanic radiative forcing from 1979 to 2015, J. Geophys. Res.-Atmos., 123, 12491–12508, https://doi.org/10.1029/2018JD028776, 2018.
Seabrook, S., Mackay, K., Watson, S. J., Clare, M. A., Hunt, J. E., Yeo, I. A., Lane, E. M., Clark, M. R., Wysoczanski, R., Rowden, A. A., Kula, T., Hoffmann, L. J., Armstrong, E., and Williams, M. J. M.: Volcaniclastic density currents explain widespread and di verse seafloor impacts of the 2022 Hunga Volcano eruption, Nat. Commun., 14, 7881, https://doi.org/10.1038/s41467-023-43607 2, 2023.
Sheng, J.-X., Weisenstein, D. K., Luo, B.-P., Rozanov, E., Stenke, A., Anet, J., Bingemer, H., and Peter, T.: Global atmospheric sulfur budget under volcanically quiescent conditions: Aerosol-chemistry-climate model predictions and validation, J. Geophys. Res.-Atmos., 120, 256–276, https://doi.org/10.1002/2014JD021985, 2015.
Solomon, S., Daniel, J. S., Neely, R. R., Vernier, J.-P., Dutton, E. G., and Thomason, L. W.: The persistently variable “background” stratospheric aerosol layer and global climate change, Science, 333, 866–870, 2011.
Solomon, S., Dube, K., Stone, K., Yu, P., Kinnison, D., Toon, O. B., Strahan, S. E., Rosenlov, K. H., Portmann, R., Davis, S., Randel, W., Bernath, P., Boone, C., Bardeen, C. G., Bourassa, A., Zawada, D., and Degenstein, D.: On the stratospheric chemistry of midlatitude wildfire smoke, Proc. Natl. Acad. Sci. USA, 119, https://doi.org/10.1073/pnas.2117325119, 2022.
Surono, Jousset, P., Pallister, J., Boichu, M., Boungiorno, M. F., Budisantoso, A., Costa, F., Andreastuti, S., Prata, F., Schneider, D., Clarisse, L., Humaida, H., Sumarti, S., Bignami, C., Griswold, J., Carn, S., Oppenheimer C., and Lavigne F.: The 2010 explosive eruption of Java's Merapi volcano – A “100-year” event, J. Volcanol. Geotherm. Res. 241–242, 121–135, 2012.
Taylor, I. A., Grainger, R. G., Prata, A. T., Proud, S. R., Mather, T. A., and Pyle, D. M.: A satellite chronology of plumes from the April 2021 eruption of La Soufrière, St Vincent, Atmos. Chem. Phys., 23, 15209–15234, https://doi.org/10.5194/acp-23-15209-2023, 2023.
Thomas, H. E., Watson, I. M., Carn, S. A., Prata, A. J., and Realmuta, V. J.: A comparison of AIRS, MODIS and OMI sulphur dioxide retrievals in volcanic clouds, Geomatics, Natural Hazards and Risk, 2, 217–232, 2011.
Thomason, L. W., Ernest, N., Millán, L., Rieger, L., Bourassa, A., Vernier, J.-P., Manney, G., Luo, B., Arfeuille, F., and Peter, T.: A global space-based stratospheric aerosol climatology: 1979–2016, Earth Syst. Sci. Data, 10, 469–492, https://doi.org/10.5194/essd-10-469-2018, 2018.
Vernier, J.-P., Pommereau, J. P., Garnier, A., Pelon, J., Larsen, N., Nielsen, J., Christiansen, T., Cairo, F., Thomason, L. W., Leblanc, T., and McDermid, I. S.: Tropical stratospheric aerosol layer from CALIPSO lidar observations, J. Geophys. Res., 114, https://doi.org/10.1029/2009JD011946, 2009.
Vernier, J.-P., Farlie, T. D., Murray, J. J., Tupper, A., Trepte, C., Winker, D., Pelon, J., Garnier, A., Jumelet, J., Pavolonis, M., Omar, A. H., and Powell, K. A.: An Advanced System to Monitor the 3D Structure of Diffuse Volcanic Ash Clouds, J. Appl. Meteorol. Clim., 10, 2125–2138, 2013.
Vernier, J.-P., Farlie, T. D., Natarajan, M., Wiengold, F. G., Bian, J., Martinsson, B. G., Crumeyrolle, S., Thomason, L. W., and Bedka, K. M.: Increase in upper tropospheric and lower stratospheric aerosol levels and its potential connection with Asian pollution, J. Geophys. Res., 120, https://doi.org/10.1002/ 2014JD022372, 2015.
Weisenstein, D. K., Yue, G. K., Ko, M. K. W., Sze, N.-D., Rodriguez, J. M., and Scott, C. J.: A two-dimensional model of sulfur species and aerosol, J. Geophys. Res., 102, 13019–13035, 1997.
Winker, D. M., Hunt, W. H., and McGill, M. J.: Initial performance assessment of CALIOP, Geophys. Res. Lett., 34, 1–5, https://doi.org/10.1029/2007GL030135, 2007.
Winker, D. M., Pelon, J., Coakley, J. A., Ackerman, S. A., Charl son, R. J., Colarco, P. R., Flamant, P., Fu, Q., Hoff, R. M., Kittaka, C., Kubar, T. L., Le Treut, H., McCormick, M. P., Mégie, G., Poole, L., Powell, K., Trepte, K., Vaughan, M. A., and Wielicki, B. A.: The CALIPSO mission – A global 3D view of aerosols and clouds, B. Am. Meteorol. Soc., 91, 1211–1229, https://doi.org/10.1175/2010BAMS3009.1, 2010.