the Creative Commons Attribution 4.0 License.
the Creative Commons Attribution 4.0 License.
 | 25 Jun 2026
Cross-hemispheric transport of the Hunga aerosol plume: in situ evidence and radiative effects from the northern hemisphere
Gwenaël Berthet
Pasquale Sellitto
Irene Bartolome Garcia
Emmanuel Briaud
Rubel Chandra Das
Stéphane Chevrier
Nicolas Dumelié
Lilian Joly
Thomas Lecas
Pauline Marbach
Felix Ploeger
Jean-Baptiste Renard
Jean-Paul Vernier
Frank G. Wienhold
Michaela I. Hegglin
The Hunga eruption (20° S) in January 2022 injected a substantial amount of water vapor and aerosols into the stratosphere, primarily impacting the Southern Hemisphere and tropics. Using a combination of satellite observations and in situ measurements with optical particle counters, we show that a significant portion of the aerosol plume was transported into the Northern Hemisphere (NH) mid-latitudes. This cross-hemispheric transport occurred within the tropically controlled transition zone, within the shallow branch of the Brewer–Dobson circulation. By October 2022, enhanced aerosol concentrations were observed up to 50° N, at altitudes between 17–23 km with some dense plumes at around 21–22 km. In situ observations reveal an effective radius of around 330 nm, comparable to what was observed in the Southern Hemisphere (SH). Aerosol extinction coefficients in the mid-latitudes (30–50° N) were approximately doubled over background levels, corresponding to an aerosol optical depth (AOD) increase of (1–2) × 10−3 across the SAGE III/ISS wavelengths. These enhancements led to a modest, but not negligible, shortwave top-of-atmosphere (TOA) radiative forcing of W m−2 between November 2022 and February 2023. Our results show that the moderate aerosol impact of the Hunga eruption in the SH produced non-negligible radiative impacts in the NH, emphasizing the importance of considering both hemispheres when analysing the total impact.
- Article
(4950 KB) - Full-text XML
- BibTeX
- EndNote


The Hunga volcano (Kingdom of Tonga, 20° S, 175° W) eruptions on 15 January 2022, resulted in the most significant stratospheric aerosol perturbation observed since the eruption of Mt. Pinatubo in 1991 (Sellitto et al., 2022). The eruption injected relatively small amounts of sulfur dioxide (SO2) (e.g., Carn et al., 2022; Sellitto et al., 2024) and an unprecedented amount of water vapor into the upper stratosphere (Millán et al., 2022; Khaykin et al., 2022), reaching altitudes of up to 58 km (Taha et al., 2022; Proud et al., 2022; Carr et al., 2022). The SO2 mass injection was initially estimated at a moderate 0.6–0.7 Tg (Carn et al., 2022) to over 1.0 Tg (Sellitto et al., 2024), which is at least 15–20 times smaller than that of the Pinatubo eruption (Guo et al., 2004) and no larger than more recent moderate stratospheric eruptions (e.g., Andersson et al., 2015). Nevertheless, the aerosol load, in terms of stratospheric aerosol optical depth (sAOD), was recorded as the largest since Pinatubo (Taha et al., 2022; Sellitto et al., 2022), but peak values are not significantly larger than what was observed following Raikoke (Vernier et al., 2025). The rapid oxidation of SO2 to sulfate aerosols was accelerated by the elevated levels of water vapor, leading to an unusually fast formation of stratospheric aerosols, with e-folding times between 2 and 4 weeks (e.g., Zhu et al., 2022; Sellitto et al., 2024; Asher et al., 2023; Legras et al., 2022).
Satellite and in situ observations have provided valuable insights into the evolution and transport of the Hunga aerosol plume. After a transient phase of a few days after the eruption, the plume consisted mainly of water vapour, SO2, and submicron sulfate particles, with no significant amounts of ash. SO2 levels returned to background concentrations by the end of January 2022 (Shikwambana et al., 2023; Legras et al., 2022; Sellitto et al., 2024). For the first three months, the sulfate aerosol plume was primarily confined between 20° N and 35° S due to the zonal symmetry of the summer stratospheric circulation (Legras et al., 2022). Marked anomalies in the sAODs were observed at southern hemispheric mid- and high-latitudes starting from April 2022 (Sellitto et al., 2024). In addition, small filamentary portions of the plume had already reached the northern and southern hemispheric poles by April 2022 (Taha et al., 2022) and were observed above China (at 27° N) with in situ aerosol instruments (POPS and COBALD, Bian et al., 2023). This timing is also consistent with independent ground-based lidar observations over central China (Wuhan; 30.5° N, 114.4° E) at 23–25 km during 10–12 April 2022 (He, 2025). One year later, aerosols from the eruption have been measured in the Antarctic (Deshler et al., 2024). Those in situ observations revealed significant increases in aerosol mass, surface area, and extinction, particularly for particles larger than 0.5 µm (Deshler et al., 2024). During the first 13 months, the descent rate of the aerosol layer was estimated at −0.008 km d−1, suggesting that volcanic aerosols could remain in the stratosphere until at least the first half of 2025 (Sicard et al., 2025).
Recent analyses of the Hunga aerosol plume have also examined the evolution of the particle size distribution over time. Using data from the Stratospheric Aerosol and Gas Experiment III on the International Space Station (SAGE III/ISS), Duchamp et al. (2023) and Knepp et al. (2024) found that the particle size distribution (effective radius at 400 nm and mode width at 1.25) remained relatively stable over 15 months (March 2022 to June 2023).
Radiative transfer simulations and observational studies have demonstrated the significant impact of the Hunga eruption on the Earth's radiation budget. During the first two weeks, radiative forcing was initially dominated by aerosol-induced cooling, but as the vertical distribution of the plume evolved, water vapor's positive effect began to influence the top-of-the-atmosphere radiative forcing, leading to a net warming effect for the Hunga plume, about 1 month after the eruption (Sellitto et al., 2022). Over the 13 months following the eruption, after horizontal dispersion and vertical separation of the aerosol and water vapor plumes, the overall radiative forcing of the Hunga plume was found to be negative, with a stratospheric tropical temperature decrease of around 4 K from February to April 2022 and still a very small cooling effect through 2022 and 2023 (Schoeberl et al., 2022, 2024).
While the transport, evolution, radiative impact, and chemical processes of the Hunga plume in the SH have been extensively studied, its impact on the Northern Hemisphere (NH) has not yet been studied in detail and quantified. In this study, we analyze the transport of the Hunga aerosol plumes to the NH and their radiative forcing using a combination of satellite and in situ observations alongside radiative transfer simulations.
2.1 The Lightweight Optical Aerosol Counter, LOAC
LOAC was deployed to measure aerosol properties in the atmosphere (Renard et al., 2016). We use version 1.5, which includes improvements over Renard et al. (2016), featuring increased laser source power at a wavelength of 650 nm and reduced stray light through the design of a new optical chamber. This compact instrument, including batteries (flight configuration), weighs 1 kg. It provides measurements of aerosol size distributions in diameter from 200 nm to 50 µm and aerosol concentrations corresponding to the measured size range, as well as a coarse classification of aerosol types. The measurement uncertainties depend on the aerosol concentration, flow rate, and sampling frequency, with an estimated 20 % uncertainty for concentrations greater than 1 cm−3, increasing to 60 % uncertainty for lower concentrations due to Poisson statistical limitations.
The LOAC samples every 10 s (0.1 Hz). For the final profiles, individual measurements are averaged over time intervals of 1 to 10 min, depending on particle concentrations and balloon ascent speed. This averaging corresponds to a vertical resolution of 500 m–1.5 km in the upper troposphere and lower stratosphere (UTLS). These parameters ensure that LOAC provides detailed yet stable aerosol profiles under varying atmospheric conditions.
Aerosol counting observations have been converted to extinction coefficients at 756 nm using a Mie scattering model assuming sulphuric acid droplets. Here, we use LOAC measurement profiles from Reims, France (49.3° N, 4.0° E), obtained on 19 October 2022, from Orleans, France (47.8° N, 1.9° E) on 6 December 2022 and 2 June 2023, and from MeteoModem, France (48.3, 2.6° E) on 14 November 2022, 20 January 2023 and 21 February 2023.
2.2 Portable Optical Particle Spectrometer, POPS
POPS observations were part of the same payload as the LOAC flight (see above). POPS measures aerosol properties in the atmosphere at a wavelength of 405 nm and weighs around 1 kg, including batteries (Todt et al., 2023). The instrument provides data on aerosol size distributions from 140 nm to about 2.5 µm in diameter and the differential aerosol concentration, corresponding to the respective size range. Measurement uncertainties from Poisson statistics result in uncertainties of approximately 7 % for concentrations exceeding 1 cm−3, increasing up to 73 % for concentrations below 10−2 cm−3. These uncertainties are influenced by predefined instrument parameters and ambient conditions.
The temporal sampling for POPS is 1 s. In the UTLS, POPS can achieve a vertical resolution of ∼ 50 m. This combination allows for high-resolution temporal and spatial profiling of aerosols in varying atmospheric conditions. POPS size distributions have also been converted to extinction at 756 nm. For the measurement flights considered in this study, data obtained above approximately 25 km altitude were excluded due to a collapse of the volumetric flow rate at those altitudes.
In this study, we use POPS profiles measured from Reims, France (49.3° N, 4.0° E), obtained on 12 October 2022, and 19 October 2022, and from Orleans, France (47.8° N, 1.9° E), on 6 December 2022.
2.3 Ozone Mapping Profiler Suite Limb Profiler, OMPS-LP
OMPS-LP, onboard the Suomi National Polar-orbiting Partnership (Suomi NPP) satellite, measures limb-scattered radiance and solar irradiance across the 290–1000 nm wavelength range, covering altitudes from 0 to 80 km with a vertical sampling of 1 km and an instantaneous resolution of 1.5 km (Jaross et al., 2014). The instrument provides near-global coverage within 3–4 d using three horizontally separated vertical slits. Aerosol extinction profiles are provided at wavelengths of 510, 600, 675, 745, 869, and 997 nm. Here, we use the 675 nm channel.
With its high sampling rate, meaning near-global coverage every few days, we use OMPS observations here to study transport features of the respective volcanic plume. This study utilizes version 2.0 aerosol extinction data (Taha et al., 2021) for the years 2022 and 2023, mainly focusing on the northern hemispheric stratosphere.
2.4 Compact Optical Back- scatter Aerosol Detector, COBALD
COBALD is a lightweight (540 g) instrument that consists of two high-power light-emitting diodes (LEDs) that emit about 500 mW of optical power, at wavelengths of 455 and 940 nm, respectively. The backscattered light from the molecules, aerosols, or ice particles is recorded by a silicon photodiode using phase-sensitive detection. The precision along the backscatter ratio profile is better than 1 % in the UTLS region (Brabec et al., 2012; Vernier et al., 2015). COBALD measurements within this work were obtained during the REAS/MAGIC campaign 2022 (Dumelié et al., 2024).
2.5 Stratospheric Aerosol and Gas Experiment III, SAGE III/ISS
SAGE III/ISS, launched in February 2017 and operational on the International Space Station (ISS) since June 2017, measures profiles of trace gases and aerosol extinction coefficients using solar and lunar occultation. The instrument operates across nine wavelengths ranging from 384 to 1544 nm, acquiring approximately 30 profiles daily within latitude bands of 60° N–60° S, with optimal spatial coverage in mid-latitudes (30–60° N/S).
Aerosol extinction coefficient profiles extend vertically from ∼ 40 km down to the Earth's surface, or to the limit of the detector's dynamic range, which is typically constrained by optically thick water clouds. The vertical resolution is ∼ 1 km, with data reported at 0.5 km intervals between 0.5 and 40 km. The instrument has a horizontal resolution of ∼ 200 km along the line of sight and an additional 200 km along the ISS's motion. Tropopause height and meteorological parameters are obtained from the Modern-Era Retrospective analysis for Research and Applications version 2 (MERRA-2) reanalysis data to support aerosol extinction retrievals.
This study utilizes version 6 of the solar occultation aerosol extinction coefficient profiles at multiple wavelengths (384, 449, 521, 602, 676, 756, and 869 nm). These data are primarily used to calculate the radiative impact of the northern hemispheric aerosol enhancement following the Hunga eruption. Additionally, SAGE III/ISS observations at 756 nm are employed to confirm aerosol plume signatures detected by optical particle counters (OPCs), ensuring consistency across measurement techniques.
2.6 CALIPSO Backscatter Initialized LaTM Trajectory Analysis
To study the transport of the Hunga plume, the Langley Trajectory Model (LaTM) (Fairlie et al., 2014) is initialized using backscatter data from the CALIOP/CALIPSO satellite in conjunction with MERRA-2 meteorological data. We used CALIPSO level 1 V4-51 to initialize the LaTM after averaging the data over approximately 1° latitude along the orbit track and removing clouds using a depolarization threshold of 5 % (Vernier et al., 2009). The analysis focuses on the air parcels that traveled over France, as illustrated in Fig. A1.
2.7 Chemical Lagrangian Model of the Stratosphere
To compute backward trajectories we used the trajectory module of CLaMS (Chemical Lagrangian Model of the Stratosphere, (McKenna et al., 2002a, b; Pommrich et al., 2014) and references therein). CLaMS is a modular chemistry transport model developed to study transport and chemistry processes in the atmosphere. The backward trajectories were run during seven days and driven by ERA5 reanalysis data truncated to 1° × 1°. latitude/longitude resolution and sampled every 6 h (00:00, 06:00, 12:00, 18:00 UTC). For more details about the used ERA5 version, the reader is referred to Ploeger et al. (2021) and Hersbach et al. (2020). The calculation of trajectories was initiated on 19 October 2022 in a box targeting the area of the in situ observation (48–51° N, 3.5–6.5° E, 20–20.6 km), 1° apart from each other in the horizontal and 100 m apart in the vertical. In total, 63 backward trajectories were calculated with outputs of potential temperature, pressure, longitude and latitude every 15 min.
2.8 UVSPEC Radiative Transfer Model
The UVSPEC radiative transfer model, part of the LibRadtran package (Mayer and Kylling, 2005), is used to estimate shortwave radiative forcing of the stratospheric aerosol perturbation in the NH due to the Hunga plume transport. The UVSPEC solves the radiative transfer equation using the SDISORT method, which employs the pseudo-spherical approximation of the discrete ordinate method (DISORT) (Dahlback and Stamnes, 1991). The molecular absorption was parameterized with the LOWTRAN band model (Pierluissi and Peng, 1985), as adopted from the SBDART code (Ricchiazzi et al., 1998).
With UVSPEC, we computed the top-of-atmosphere (TOA) direct and diffuse shortwave spectra in the spectral range covered by the SAGE III/ISS observations (385–1550 nm), with a spectral resolution of 0.1 nm. Input solar flux spectra are taken from Kurucz (1994), and atmospheric conditions are based on the AFGL climatological standard winter midlatitude atmosphere (Anderson et al., 1986). We estimated the northern-hemispheric perturbation of the Hunga eruption by comparing the Hunga-perturbed period with a background period for the stratospheric aerosol. For more details, see Sect. 3.5.
3.1 Stratospheric aerosol overview in the Northern Mid-Latitudes 2021–2024
The general stratospheric aerosol situation in the northern mid-latitudes, for the period 2021–2024, is visualized in Fig. 1. The presented time frame starts just before the La Soufrière eruption in April 2021 at 13° N and 61° W, with background aerosol extinction values of around 0.3 × 10⁻³ km−1 at 19 km altitude. Following the La Soufrière eruption, the stratospheric northern mid-latitudes were significantly affected by an increased aerosol load (e.g., Li et al., 2023; Bruckert et al., 2023; Taylor et al., 2023), with aerosol extinction values up to around 0.5 × 10⁻³ km−1 at 19 km altitude, an increase by a factor of around 1.7. From Fig. 1, the increase is evident up to around 22 km altitude until early 2022. The exact phase-out time of aerosols from La Soufrière cannot clearly be identified, because the Hunga eruption (at 20° S, 175° W) in January 2022 produced a slight influence on the northern-hemispheric stratosphere as early as March 2022, as shown in Taha et al. (2022). Therefore, because of already enhanced background conditions in the stratospheric northern mid-latitudes, the actual beginning of the general influence of the Hunga eruption on the NH in terms of increased aerosol values cannot clearly be identified. However, a significant increase in aerosol extinction from October 2022 to May 2023 was observed between 16 and 23 km altitude, about 4 km above the respective tropopause, and can clearly be associated with enhancements from the Hunga eruption. Peak enhancements were observed around December 2022 and January 2023, with aerosol extinction values of around 0.6 × 10⁻³ km−1 at 19 km altitude.
Even though the eruption at La Soufrière occurred in the NH with direct stratospheric injections of sulfur-containing gaseous and aerosol species, its impact, as seen in Fig. 1, in terms of aerosol extinction, is by a factor of around 1.2 smaller than that of the Hunga eruption.
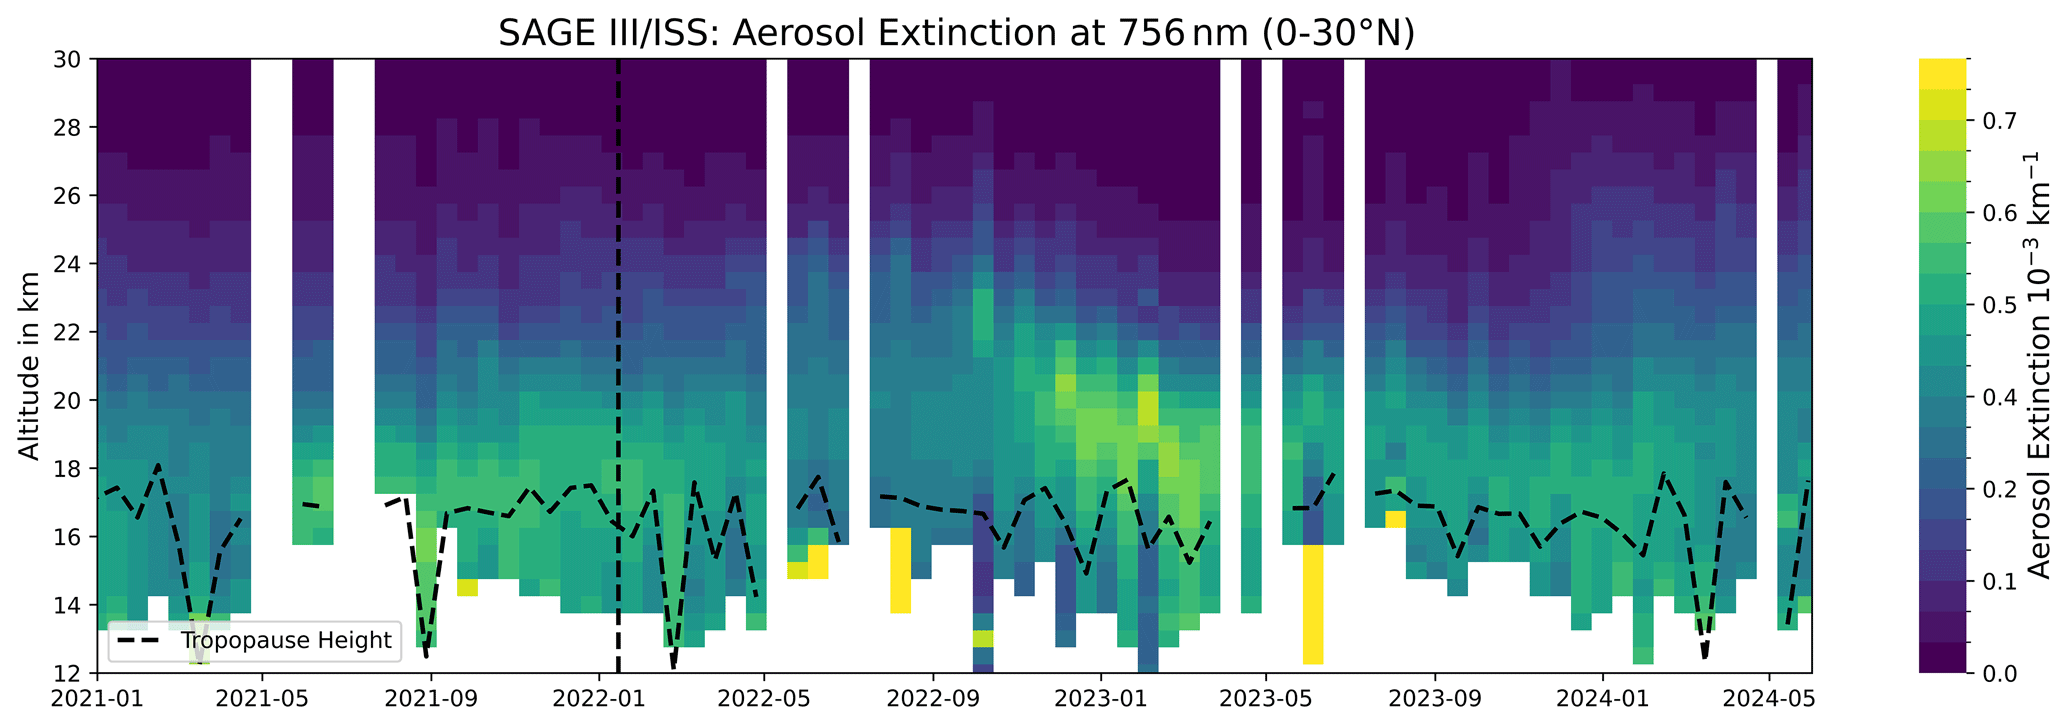
Figure 1SAGE III/ISS aerosol extinction observations at 756 nm for the northern mid-latitudes (30–50° N), averaged over 15 d intervals. Vertical dashed line represent the timing of the main eruptions. The horizontal dashed line shows the maximum MERRA-2 tropopause height for the respectively averaged SAGE III/ISS extinction profiles.
3.2 In Situ Observations of the Hunga Plume in the Northern Mid-Latitudes
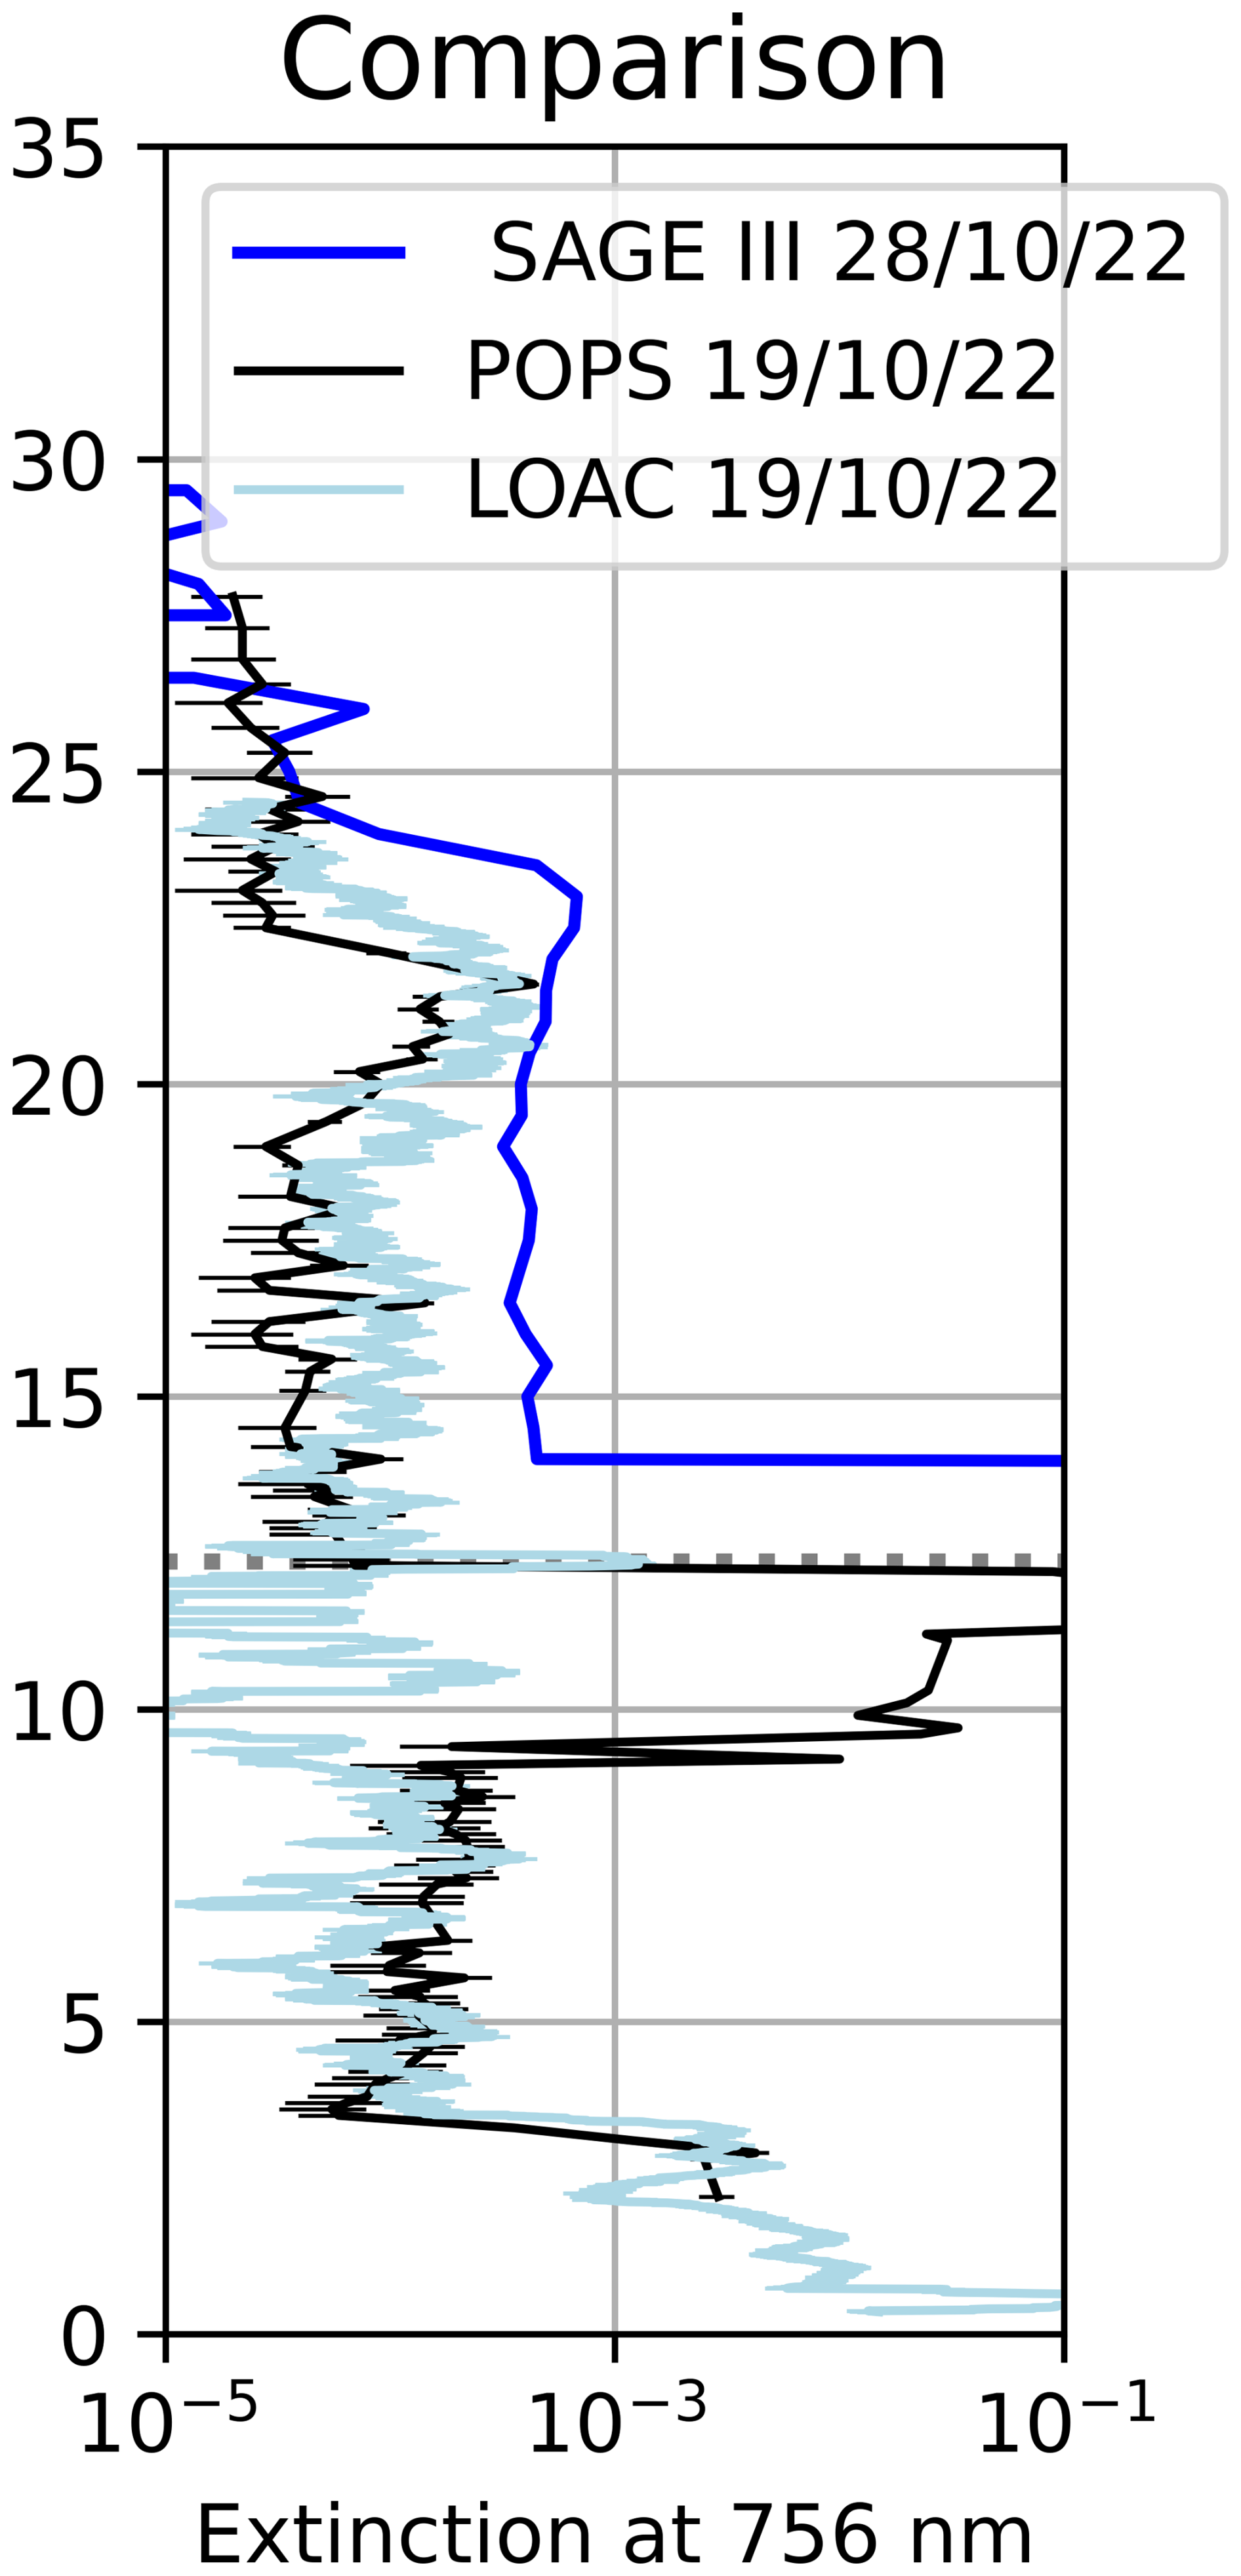
In situ observations with Optical Particle Counters (LOAC and POPS) confirm an enhanced aerosol layer in the northern-hemispheric mid-latitudes, which can be associated with the transport of the Hunga plume. We highlight two in situ measurement profiles from a weather balloon flight in Reims, France, on 19 October 2022, which are analyzed in more detail throughout this manuscript and reveal a peak aerosol plume layer between 20 and 23 km altitude (see Fig. 2a and b, black profiles). While Fig. 1 shows that the overall aerosol impact in the NH extends to lower altitudes down to 16 km, the POPS and LOAC measurement profiles from 19 October 2022 indicate the influence of a concentrated, dense plume patch at 20–23 km altitude. Reference measurement flights on 12 October 2022, 6 December 2022 and 2 June 2023 in France (Fig. 2a and b), do not show such a clear increase of a localized transport feature in aerosol extinction at those altitudes (20–23 km). The SAGE III/ISS aerosol extinction measurements, taken closest in time and space to the in situ measurement flight shown in Fig. 2a and b, confirm the observed enhancement above 20 km altitude (Fig. 2d, black profile). Extinction profiles from POPS, LOAC on 19 October 2022 and the closest SAGE III/ISS profile are shown within one Figure respectively in Fig. A2. The measurements show good comparability, with the presence of an enhancement above 20 km. SAGE III/ISS observations tend to show higher values considering that the extinctions from the OPCs were calculated from the limited size range of the instrument. The comparison is also limited by measurement uncertainties, place and time deviations. A smaller but still increased aerosol signal above 20 km is observed in France on 14 November 2022, one month after POPS and LOAC measurements have identified a dense plume (black profile, Fig. 2c). Other observations by LOAC in France in 2022 and 2023 in Fig. 2c show aerosol enhancements between 15 and 20 km altitude, consistent with what is seen in Fig. 1.
The general aerosol enhancement above the tropopause up to 20 km altitude is clear when comparing SAGE III/ISS observations in fall 2022 with those in October 2018 under mostly unperturbed stratospheric conditions and still visible one year later in 2023 (Fig. 2d and e). Respective COBALD observations are shown in Fig. 2f. The first flight took place on 17 January 2022 just after the Hunga eruption but before the plume could be transported in the NH. The transport of the Hunga is evident on 8 December and 13 December where scattering ratios are observed between 20 and 23 km with values reaching 1.15 in contrast with earlier measurements in October when the plume had not yet been transported over France. COBALD measurements in Fig. 2f confirm that no significant aerosol plume signal was observed on 10 October 2022, one week before POPS and LOAC show the plume signal in Fig. 1a and b. COBALD observations on 8 and 13 December show an enhanced aerosol signal compared to January and October 2022.
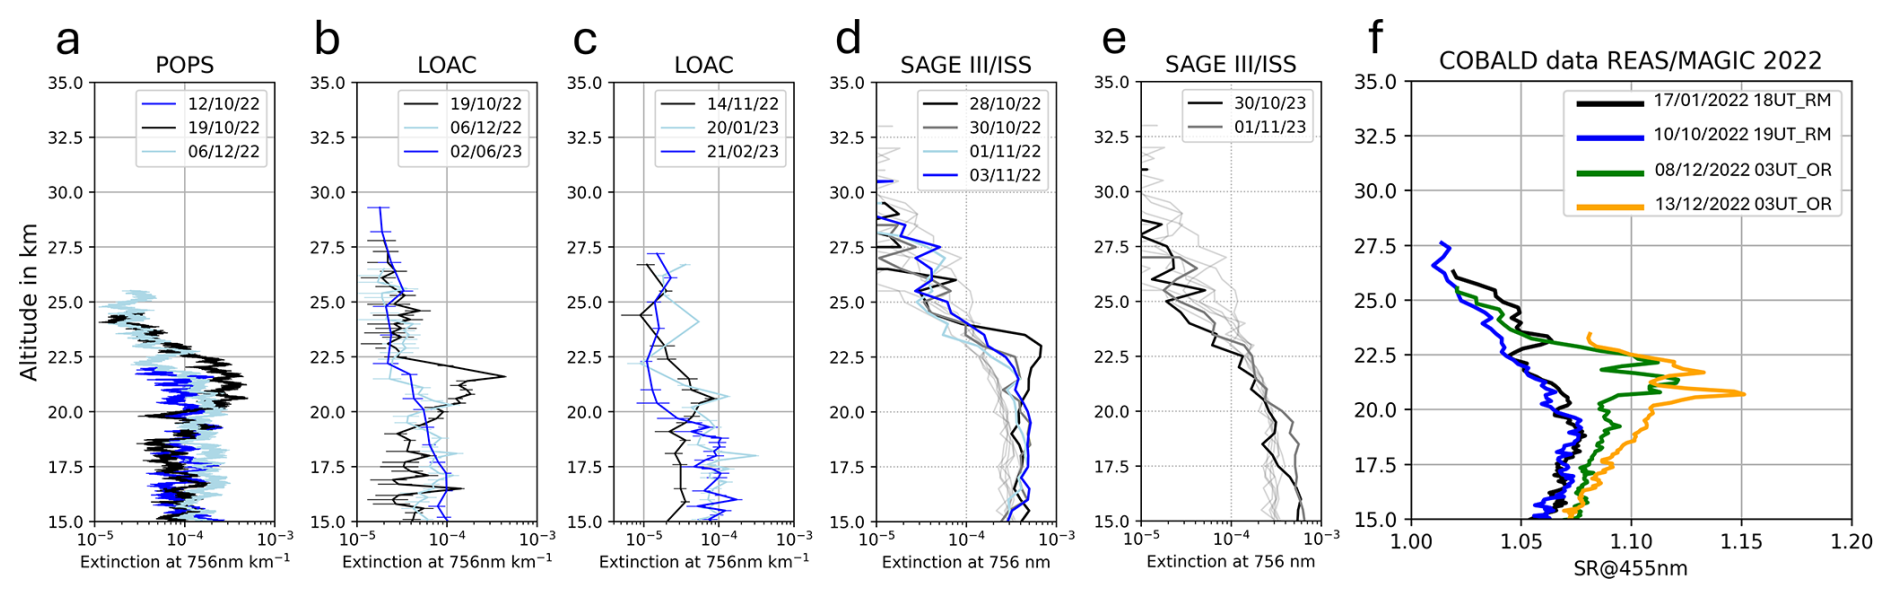
Figure 2(a) POPS in situ aerosol extinction observations for the plume signal from Reims, France 19 October 2022 at 49° N and 4° E and comparison flights for background measurements on 6 December 2022 (Orleans, France, 47.8° N, 1.9° E) and 12 October 2022 (Reims); (b) Respective LOAC v1.5 observations, including background measurements on 2 June 2023 (Orleans, France, 47.8° N, 1.9° E); (c) LOAC observations of aerosol plumes of volcanic origin from MeteoModem, France 48.3° N, 2.6° E; (d) and (e) SAGE III/ISS aerosol extinction profiles (756 nm) within around 250 km of the in situ measurement locations. Panel (d) shows profiles from the same year as the in situ observations, while panel (e) presents profiles from one year later. Light grey lines in (d) and (e) indicate background profiles observed in October 2018 above central Europe. (f) COBALD scatterin ratio observations at 455 nm from Reims (RM) and Orleans (OR), France in October and December 2022.
To trace back in space and time the aerosol plumes observed in the POPS and LOAC measurements discussed above, we performed back-trajectory calculations (initialized from a 2° by 2° grid around Reims, France at 20.6 km altitude) using the Chemical Lagrangian Model of the Stratosphere (CLaMS) and analyzed satellite-based aerosol extinction observations from OMPS; this is shown in Figs. 3, 4 and the respective video in the supplementary material. The back trajectories indicate a clear transport pathway along isentropes from the tropics and mid-latitudes on 12 October 2022, around 25° N and between 0 and 30° W at approximately 21.2 km altitude, to the location of the POPS and LOAC in situ observations in Reims on 19 October 2022 at 49° N and 4° E at around 20.6 km altitude. The respective trajectories starting below the observed plume altitude, between 16 and 18 km, follow a distinctly different path and remain within the Northern Hemisphere, originating from the west, between 90 and 40° W, not shown here. Figure 4 presents spaceborne aerosol extinction observations from OMPS, illustrating how a portion of the aerosol plume originating from the tropical stratosphere due to the Hunga eruption detached and formed a compact plume transported toward the northern mid-latitudes. Because the longitude ranges in Fig. 4a–d were selected based on the CLaMS back trajectories shown in Fig. 3, the OMPS aerosol extinction plume transport observations clearly confirm the pathways indicated by the trajectories.
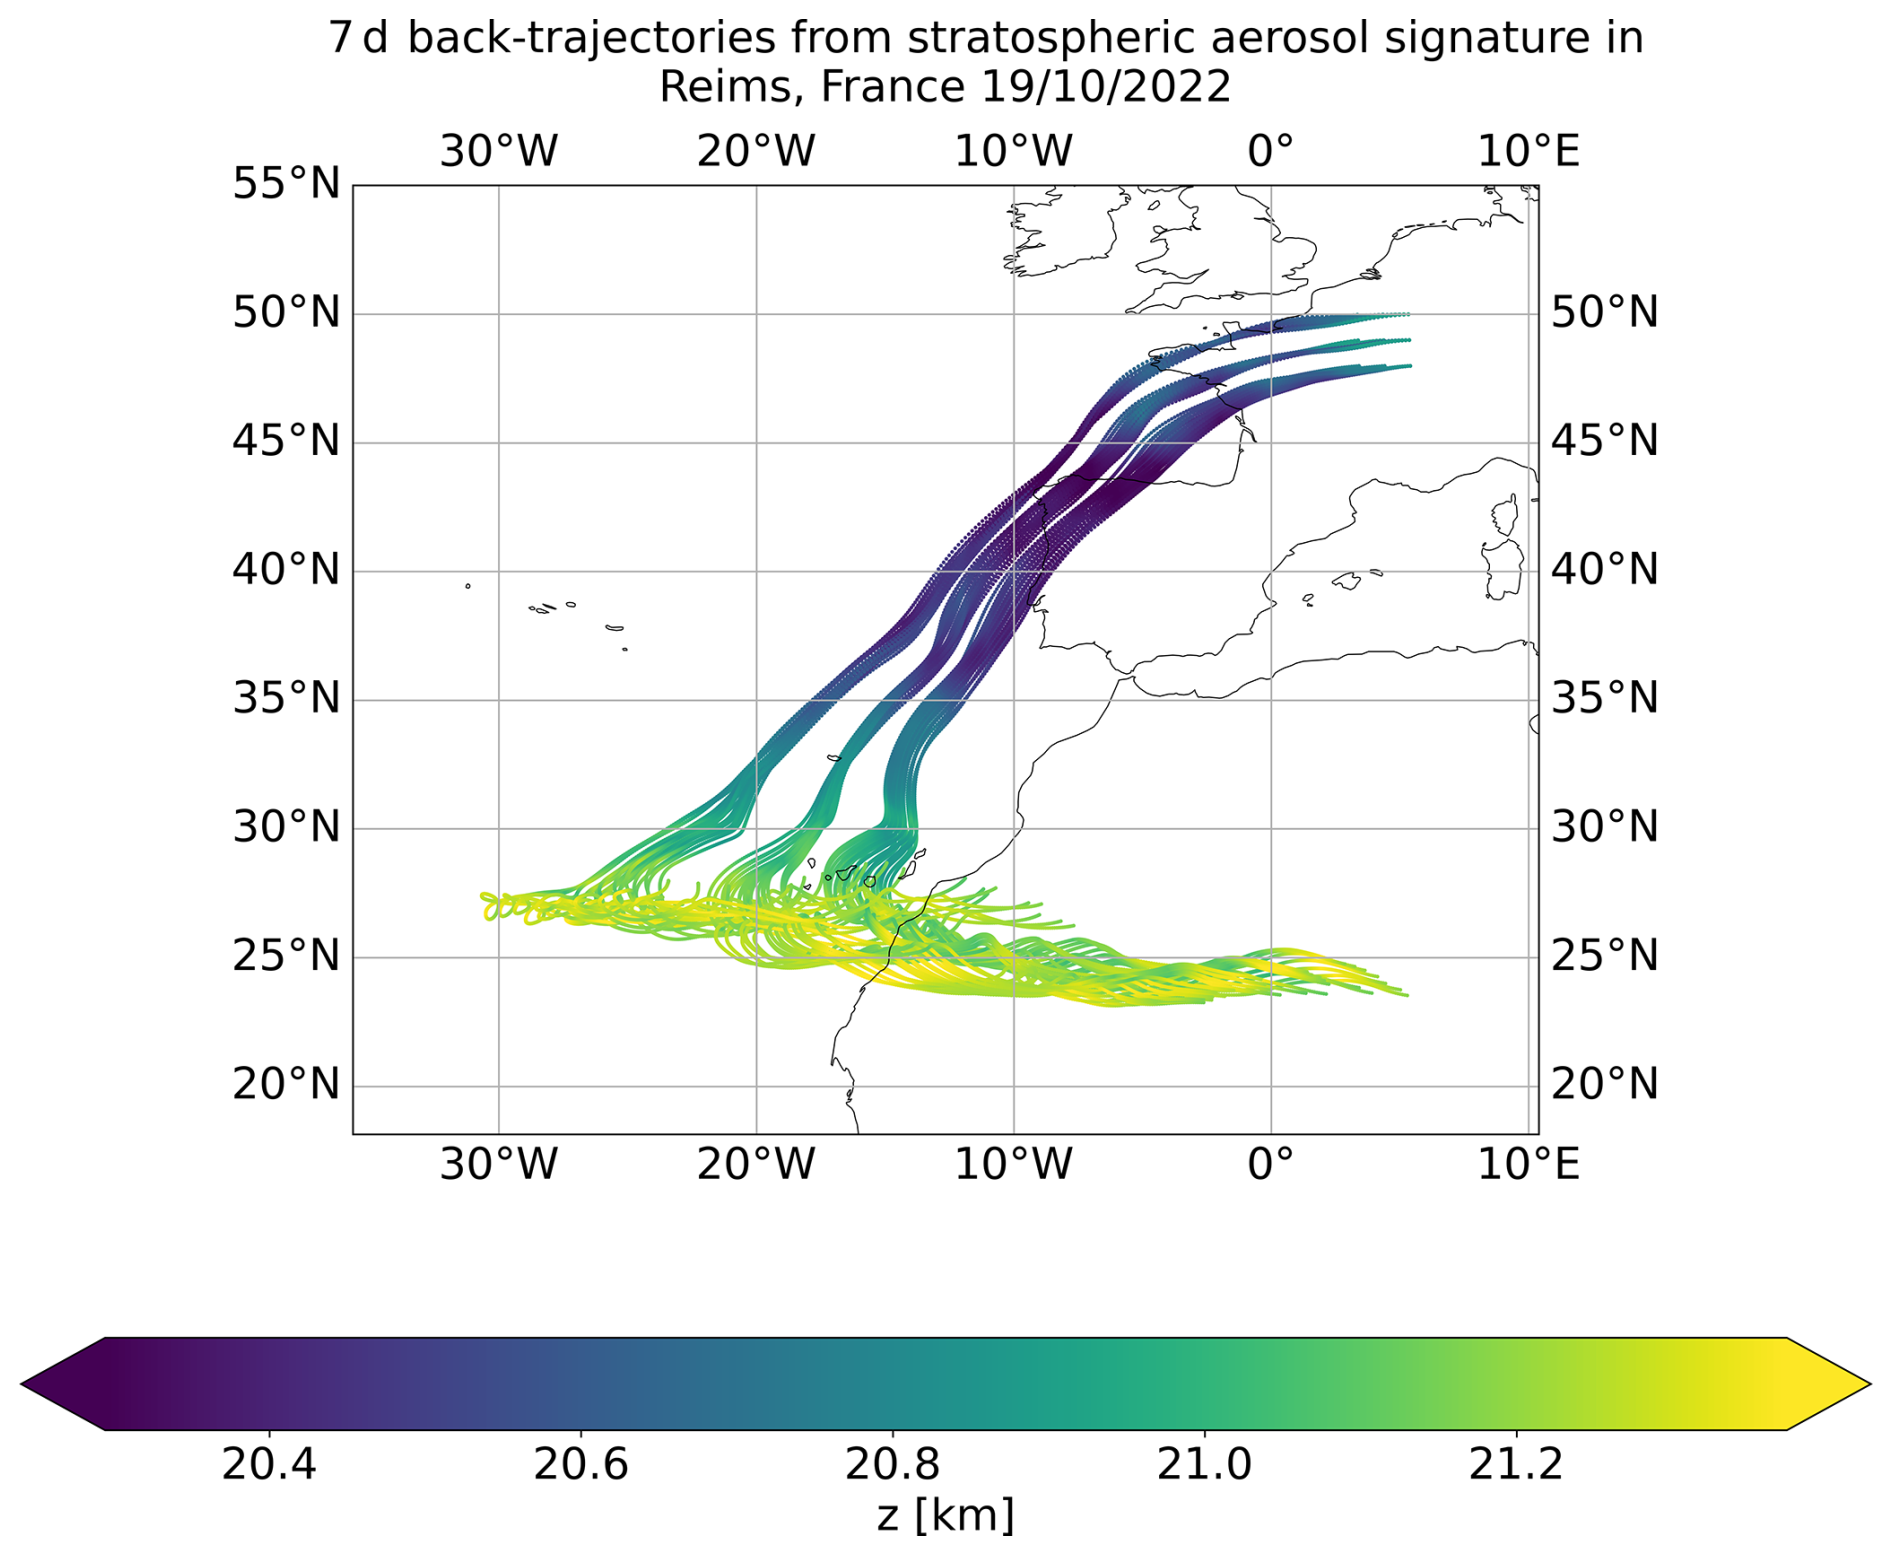
Figure 3Simulation depicting the backward trajectories of 63 air parcels over 7 days with hourly outputs using CLamS. The backward trajectories are initialized from a box spanning 48°–50° N and 3°–5° E at 20.6 km altitude. Colors represent the corresponding altitude levels.
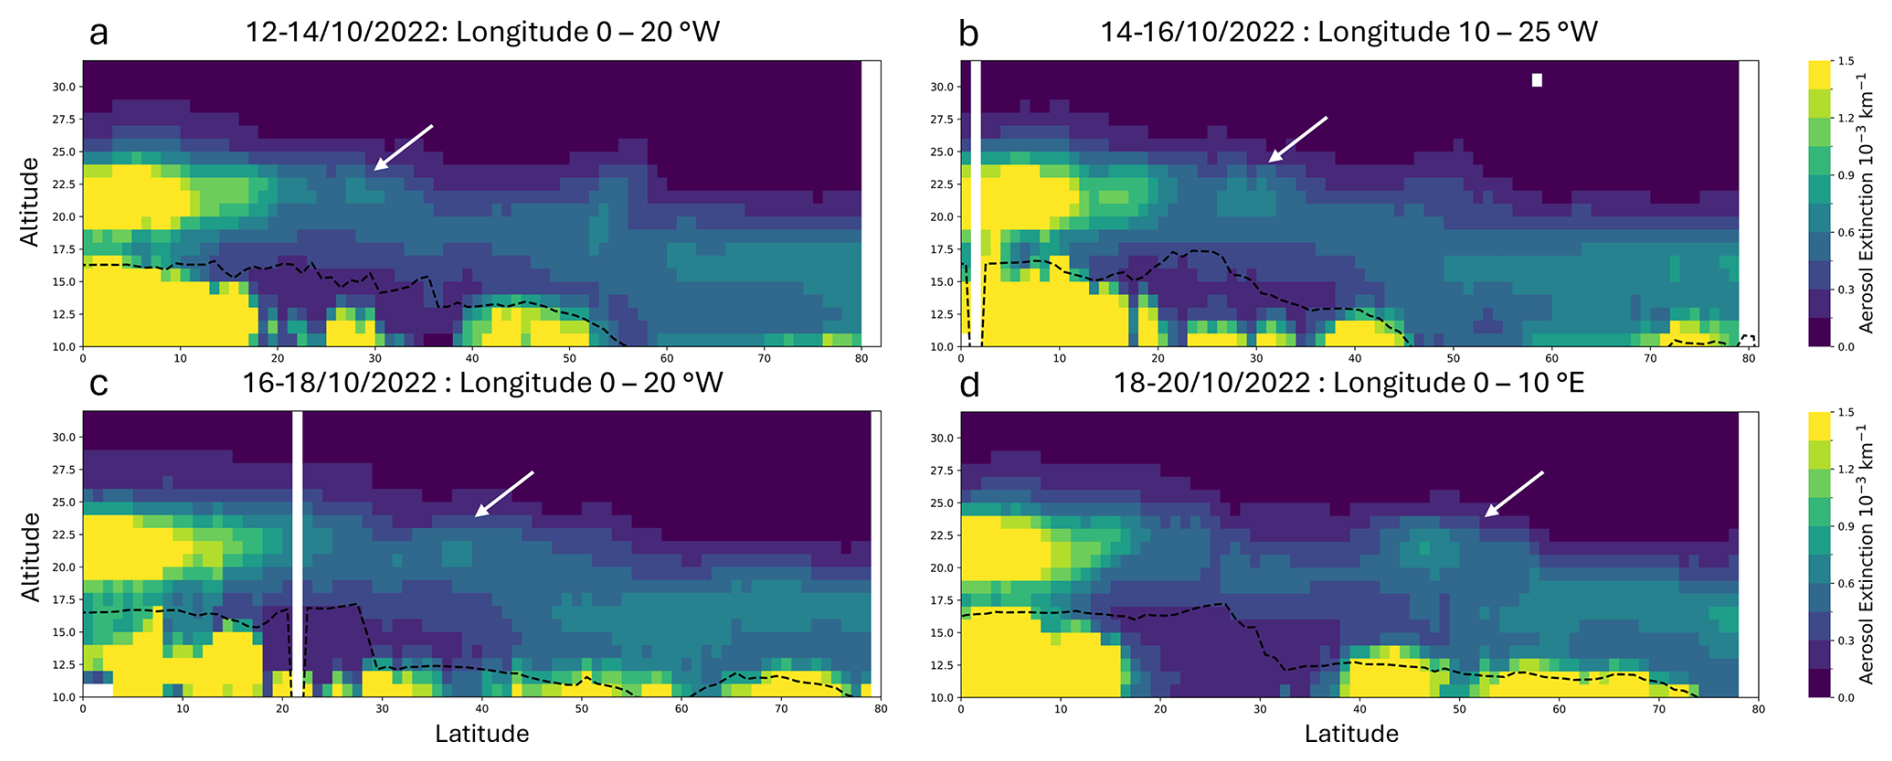
Figure 4Cross-sections of OMPS LP aerosol extinction at 675 nm as a function of latitude and altitude. Each panel shows a two-day average, with data gridded on a 1 km vertical and 1° latitude grid. Between around 30 and 130 profiles are averaged within each bin. The dashed line indicates the mean tropopause altitude. Whenever no tropopause value is available, the dashed line decreases to 0. Arrows highlight aerosol features discussed in this study and corresponding to the trajectories presented in Fig. 3.
Figure 5 presents a complementary method for verifying the source of the observed enhanced aerosol values above France, as shown in Fig. 2. This analysis employs the CALIPSO Backscatter Initialized LaTM Trajectory Analysis data to provide higher vertical resolution backscatter information regarding the transport of the aerosol plume from the Hunga eruption. The time series analysis of backscatter ratios over France was derived from the trajectory analysis using this methodology. The data reveal a distinct signature of elevated backscatter (ratios greater than 1.1) in regions at altitudes of approximately 20 to 22 km in mid-October 2022. This coincides with the timeline of balloon measurements recorded on 19 October 2022, at 06:30 UTC (as seen in Fig. 2). These observations with respective analysis give an independent confirmation, with an alternative data set, that the Hunga plume has reached the NH mid-latitudes during that time.
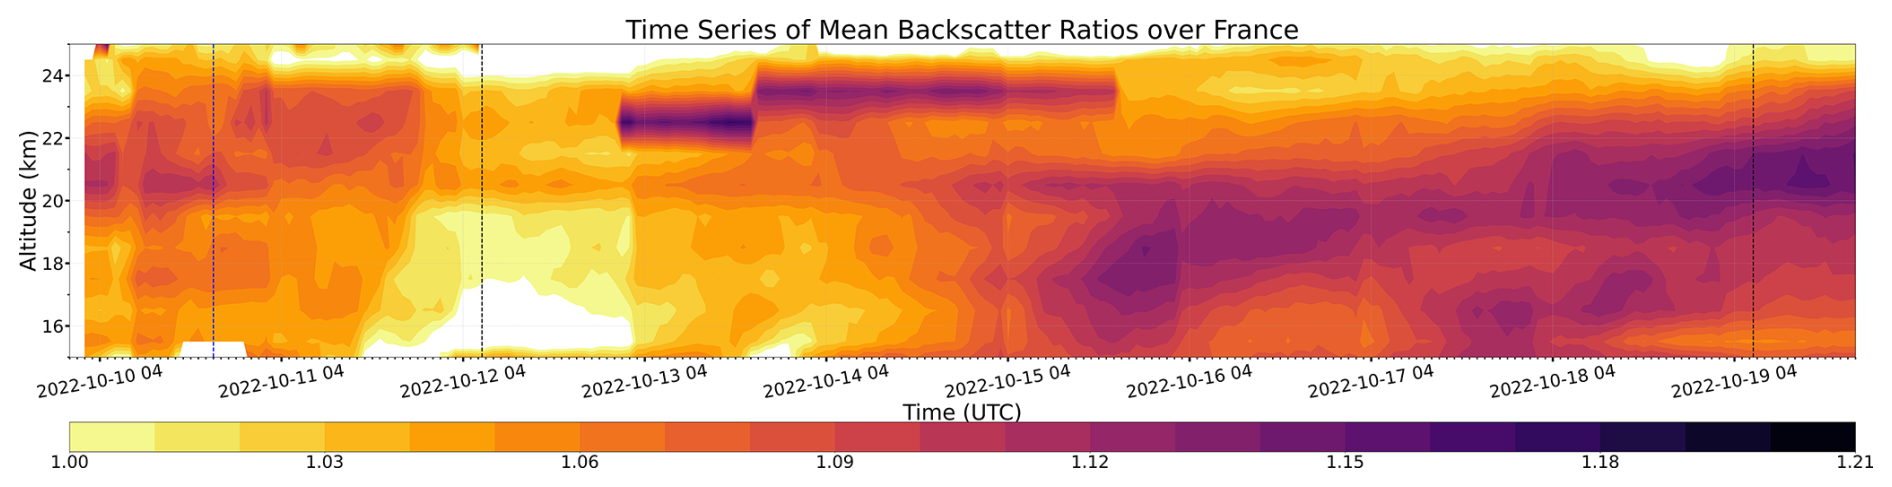
Figure 5Time series of mean backscatter ratios over France as observed by CALIOP/CALIPSO. The mean profile is calculated hourly within a 1 km altitude bin, using data from a 1000 km radius around Reims (49.26° N, 4.03° E). The black dashed lines indicate the timing of the balloon measurements.
3.3 Transport and Distribution in the Northern Hemisphere
Figure 6 presents a still representation of the supplementary video, illustrating the evolution of the aerosol plume following the Hunga eruption. While the impact on the stratospheric Northern Hemisphere extends over altitudes from 17 to 23 km, distinct filaments are found mainly around 20 km. Therefore, Fig. 6 focuses on the representation of denser aerosol plumes and filaments transported to the Northern Hemisphere mid-latitudes at 21–22 km altitude. From late January to March 2022, the tropical stratosphere up to 10° N becomes increasingly filled with aerosol particles originating from the Hunga eruption. In March, occasional light aerosol plumes with extinction values at around 0.4 × 10⁻³ km−1, compared to surrounding conditions at around 0.2 × 10⁻³ km−1, are observed. By the end of March 2022, most of the tropical to subtropical regions up to 20° N are filled with aerosols. Distinct filaments continue to move northward, reaching approximately 40° N. From October 2022 until January 2023, denser and more extensive plumes in both latitude and longitude are transported to higher latitudes, with aerosol extinction values increasing from background levels of about 0.4 × 10⁻³ to around 0.8 × 10⁻³ km−1. During this period, the filaments gradually mix with the surrounding background air.
The distributions in Fig. 6 further reveal that northward transport of the aerosol plume is related to streamers extending from the subtropics to middle latitudes which are likely caused by Rossby wave breaking. At levels around 500 K (20–21 km), such poleward transport related to breaking Rossby waves has been shown to maximize during boreal winter (Homeyer and Bowman, 2013), consistent with increased northward transport of Hunga aerosol from end of October onwards.
The most significant impact of the Hunga aerosol plume to the NH mid-latitudes is therefore observed in the NH fall/winter (Figs. 6 and 1). The impact of the Hunga aerosols to the NH mid-latitude stratosphere remains evident until around April 2023. Dense signals such as those observed in February 2023, at around 60° N, show rather the influence of polar stratospheric clouds and are therefore not related to the Hunga aerosol signature. The aerosol enhancements observed with POPS and LOAC (Fig. 2a and b) are consistent with filament observations shown in the supplementary video, particularly in mid-October at around 50° N and 150° E. The tropical stratosphere shows an enhanced aerosol signal until September 2023, while aerosol filaments transported to the northern mid-latitudes decrease in intensity. By the end of 2023, the aerosol signal in the tropical stratosphere decreases and with that the extent of the transported filaments towards the north.
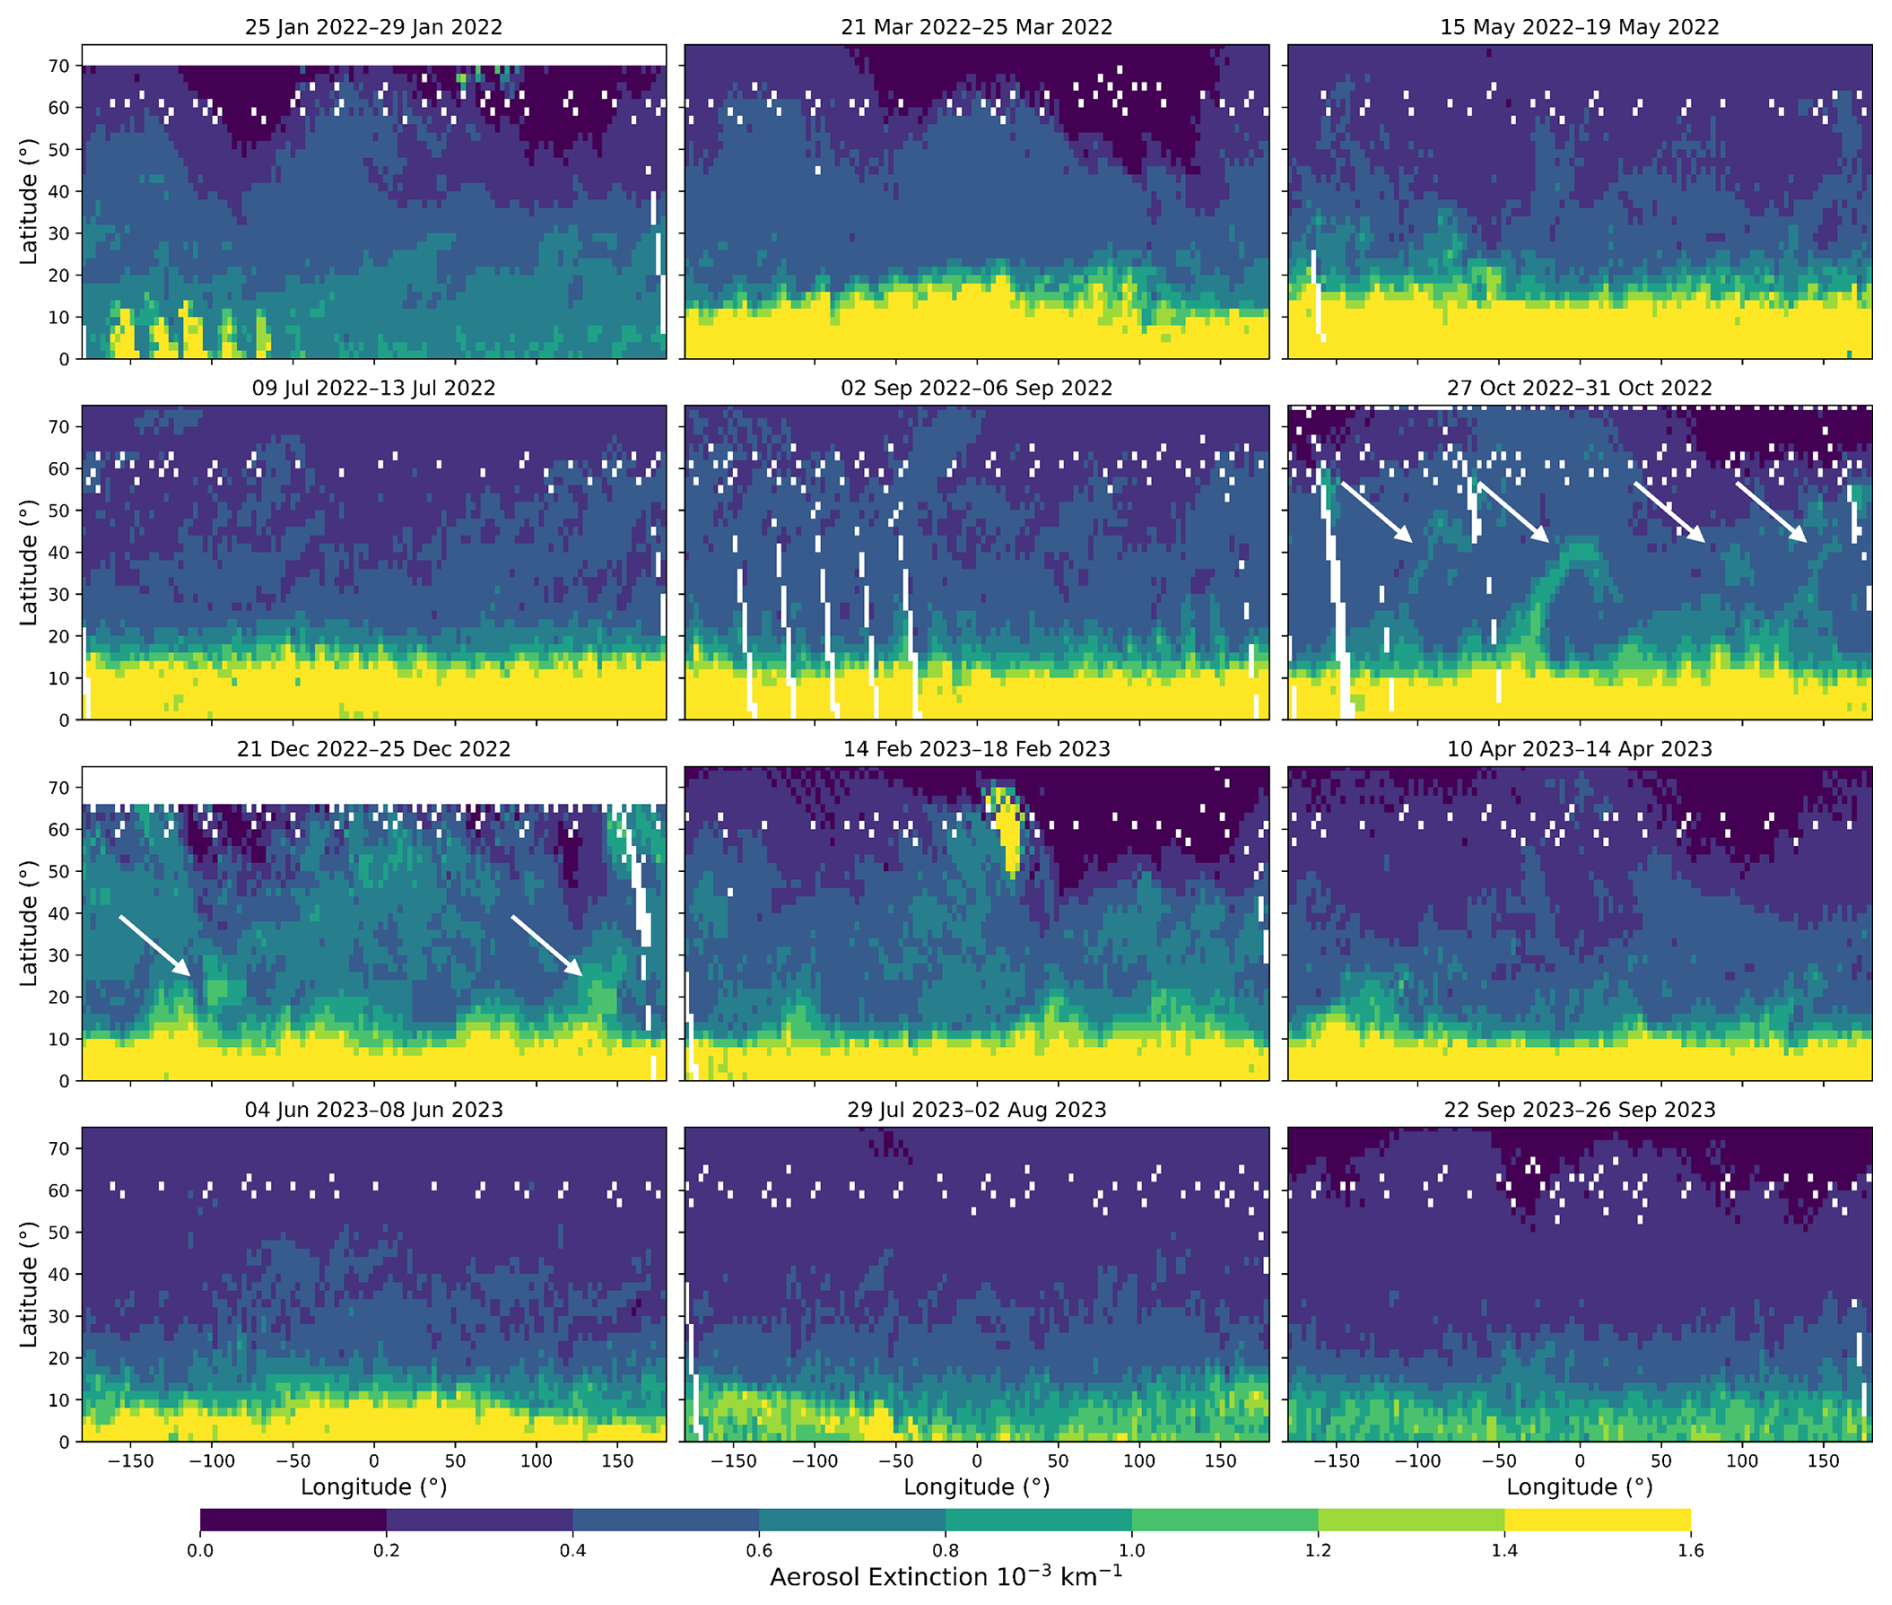
Figure 6Five-day mean aerosol extinction at 675 nm from OMPS at 21–22 km altitude, binned to 2° (latitude) × 3° (longitude) from January 2022 to September 2023. Each panel shows the period indicated in the title. The arrows point to clearly identifiable plume patches. The respective detailed transport is shown in the supplementary material video https://doi.org/10.5281/zenodo.15343728, (Kloss, 2025).
These transport patterns are consistent with those found in earlier studies revealing a direct transport pathway between the tropics and midlatitudes within the first few kilometers above the tropical tropopause (around 100–50 hPa or 16–21 km), before the air enters the tropical pipe within which mixing with midlatitude air is inhibited through very strong potential vorticity gradients (Plumb, 2002). Our results thereby strongly resemble the transport feature seen in Fig. 1 of Grant et al. (1994), in which aerosol observations following the 1991 Pinatubo eruption clearly reveal poleward transport out of the tropical region in this altitude range.
This region roughly corresponds to the tropically controlled transition layer, a term coined by Rosenlof et al. (1997), within which air, after passing through the tropical cold point tropopause and being dehydrated, is mixed horizontally into the midlatitudes. Hegglin and Shepherd (2007) further revealed a strong seasonality in the strength and depth of the mixing within this layer based on O3–N2O correlations. Ultimately, the meridional mixing stems from the breaking of synoptic-scale Rossby waves above the subtropical jet (Trepte and Hitchman, 1992; Haynes and Shuckburgh, 2000; Shepherd, 2000).
3.4 Aerosol Size Distribution and Microphysical Properties
Figure 7 presents the aerosol size distribution within the aerosol plume layer (20–22.5 km), based on profiles from Fig. 2a (POPS) and b (LOAC), observed in Reims, France, on 19 October 2022. No significant variation is observed between the lower and upper plume layers (i.e. 20–21 and 21.5–22.5 km), suggesting a homogeneous size distribution across this altitude range – i.e., no notable sedimentation within the layer.
Statistical tests confirm that the POPS data are significantly better fit by a bimodal than a unimodal distribution. A bimodal lognormal distribution was fitted to the POPS data using the method described by Brock et al. (2021) and Deng et al. (2022). The combined lognormal fits yield the total bimodal distribution. Parameters derived from the fit are listed in Table 1.
For OPC measurements six months later, Deshler et al. (2024) also report a bimodal pattern in the Southern Hemisphere (Antarctica), even though the observed particle radius of the second mode in Deshler et al. (2024) is larger (∼ 900 nm compared to 330 nm with POPS). The overall effective radius derived from POPS is 327 nm (weighted from the two modes, Table 1). This agrees well with in situ measurements over Antarctica (200–300 nm, Deshler et al., 2024) and is lower than remote sensing retrievals from January–June 2023, which suggest values between 400–500 nm (Duchamp et al., 2023; Boichu et al., 2023; Knepp et al., 2024; Khaykin et al., 2022).
Overall, LOAC observations (Fig. 7) agree with POPS, with both instruments detecting exclusively particle radii <1 µm and a peak concentration below 100 nm. Particles <1 µm have also already been observed for the fresh plume within one week of the eruption by LOAC (Kloss et al., 2022). POPS shows systematically higher concentrations – by ∼ 20 % to 90 % – except in the 200–250 nm radius range. These differences fall mainly within the respective measurement uncertainties (c.f. Sect. 2.1 and 2.2).
Based on a lognormal fit, LOAC data yield an effective radius of 304 nm, consistent with POPS. A second mode seems possible in LOAC observations but shifted towards smaller particle sizes. However, unlike POPS, the bimodal distribution does not significantly improve the fit compared to a unimodal one. Because LOAC observations are limited to particles larger than the observed peak concentration (at around 100 nm) within the Hunga plume, lognormal fit analysis cannot work as reliably as for POPS. Therefore, parameters such as the effective radius (304 nm) and mode radius (41.7 nm), calculated with LOAC observations here, should be interpreted with caution.
Table 1Fitted parameters for the bimodal lognormal distribution derived from POPS measurements, as shown in Fig. 7. The table lists the peak concentration, mode radius, effective radius, and geometric standard deviation (σ) for each mode.
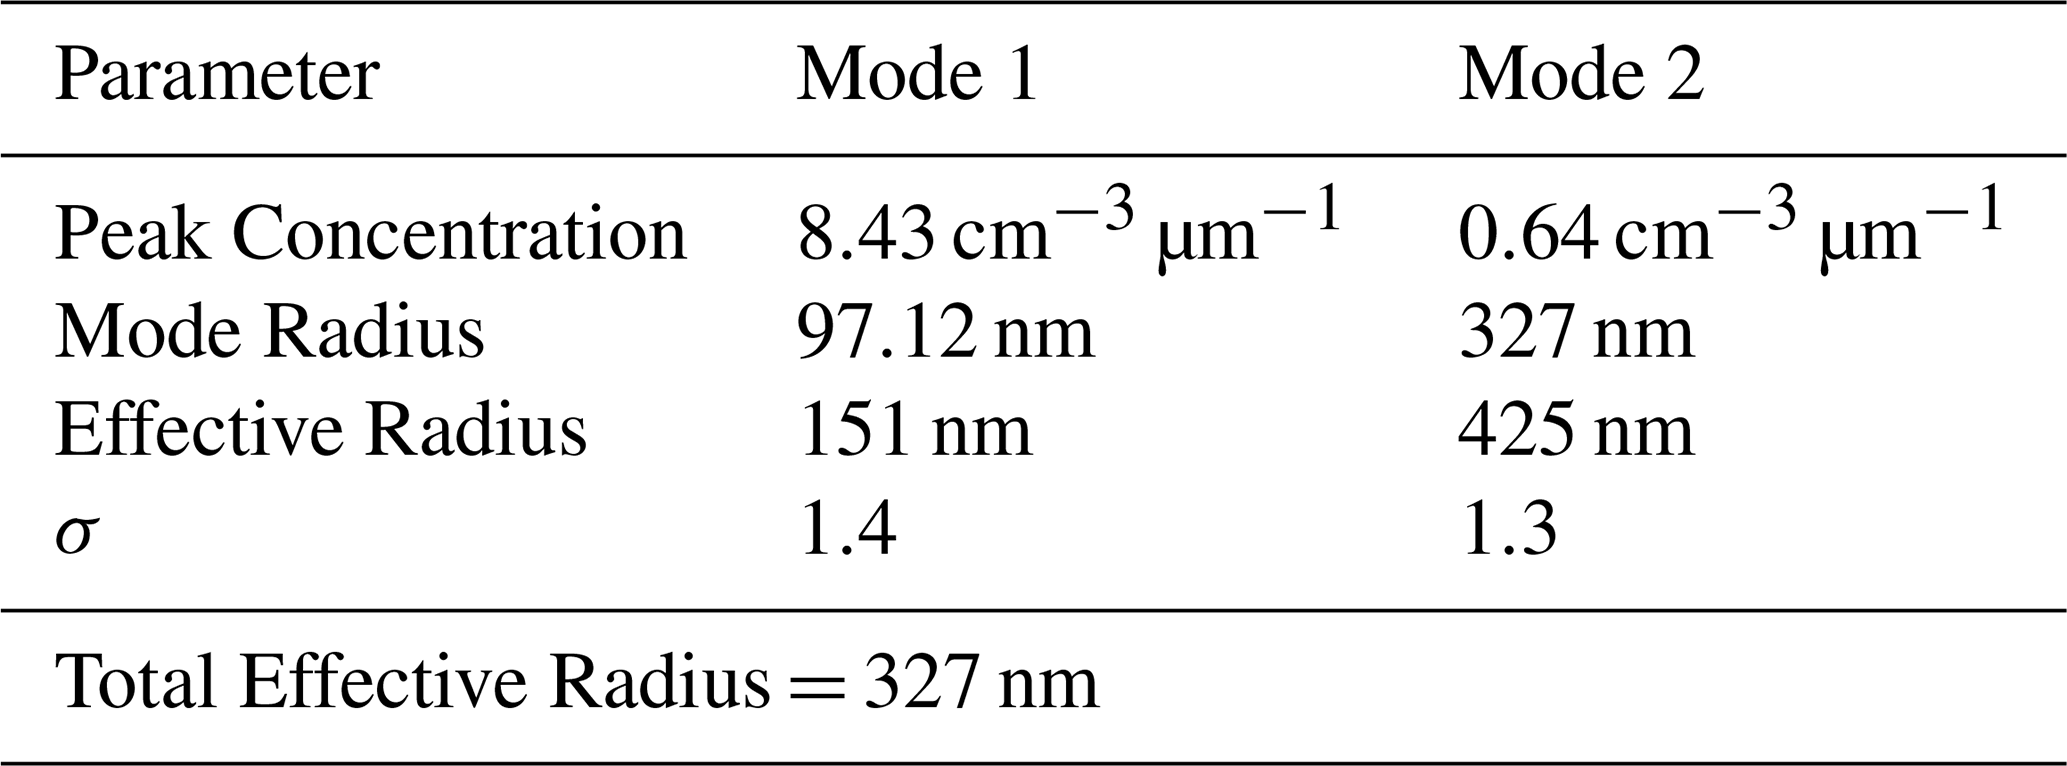
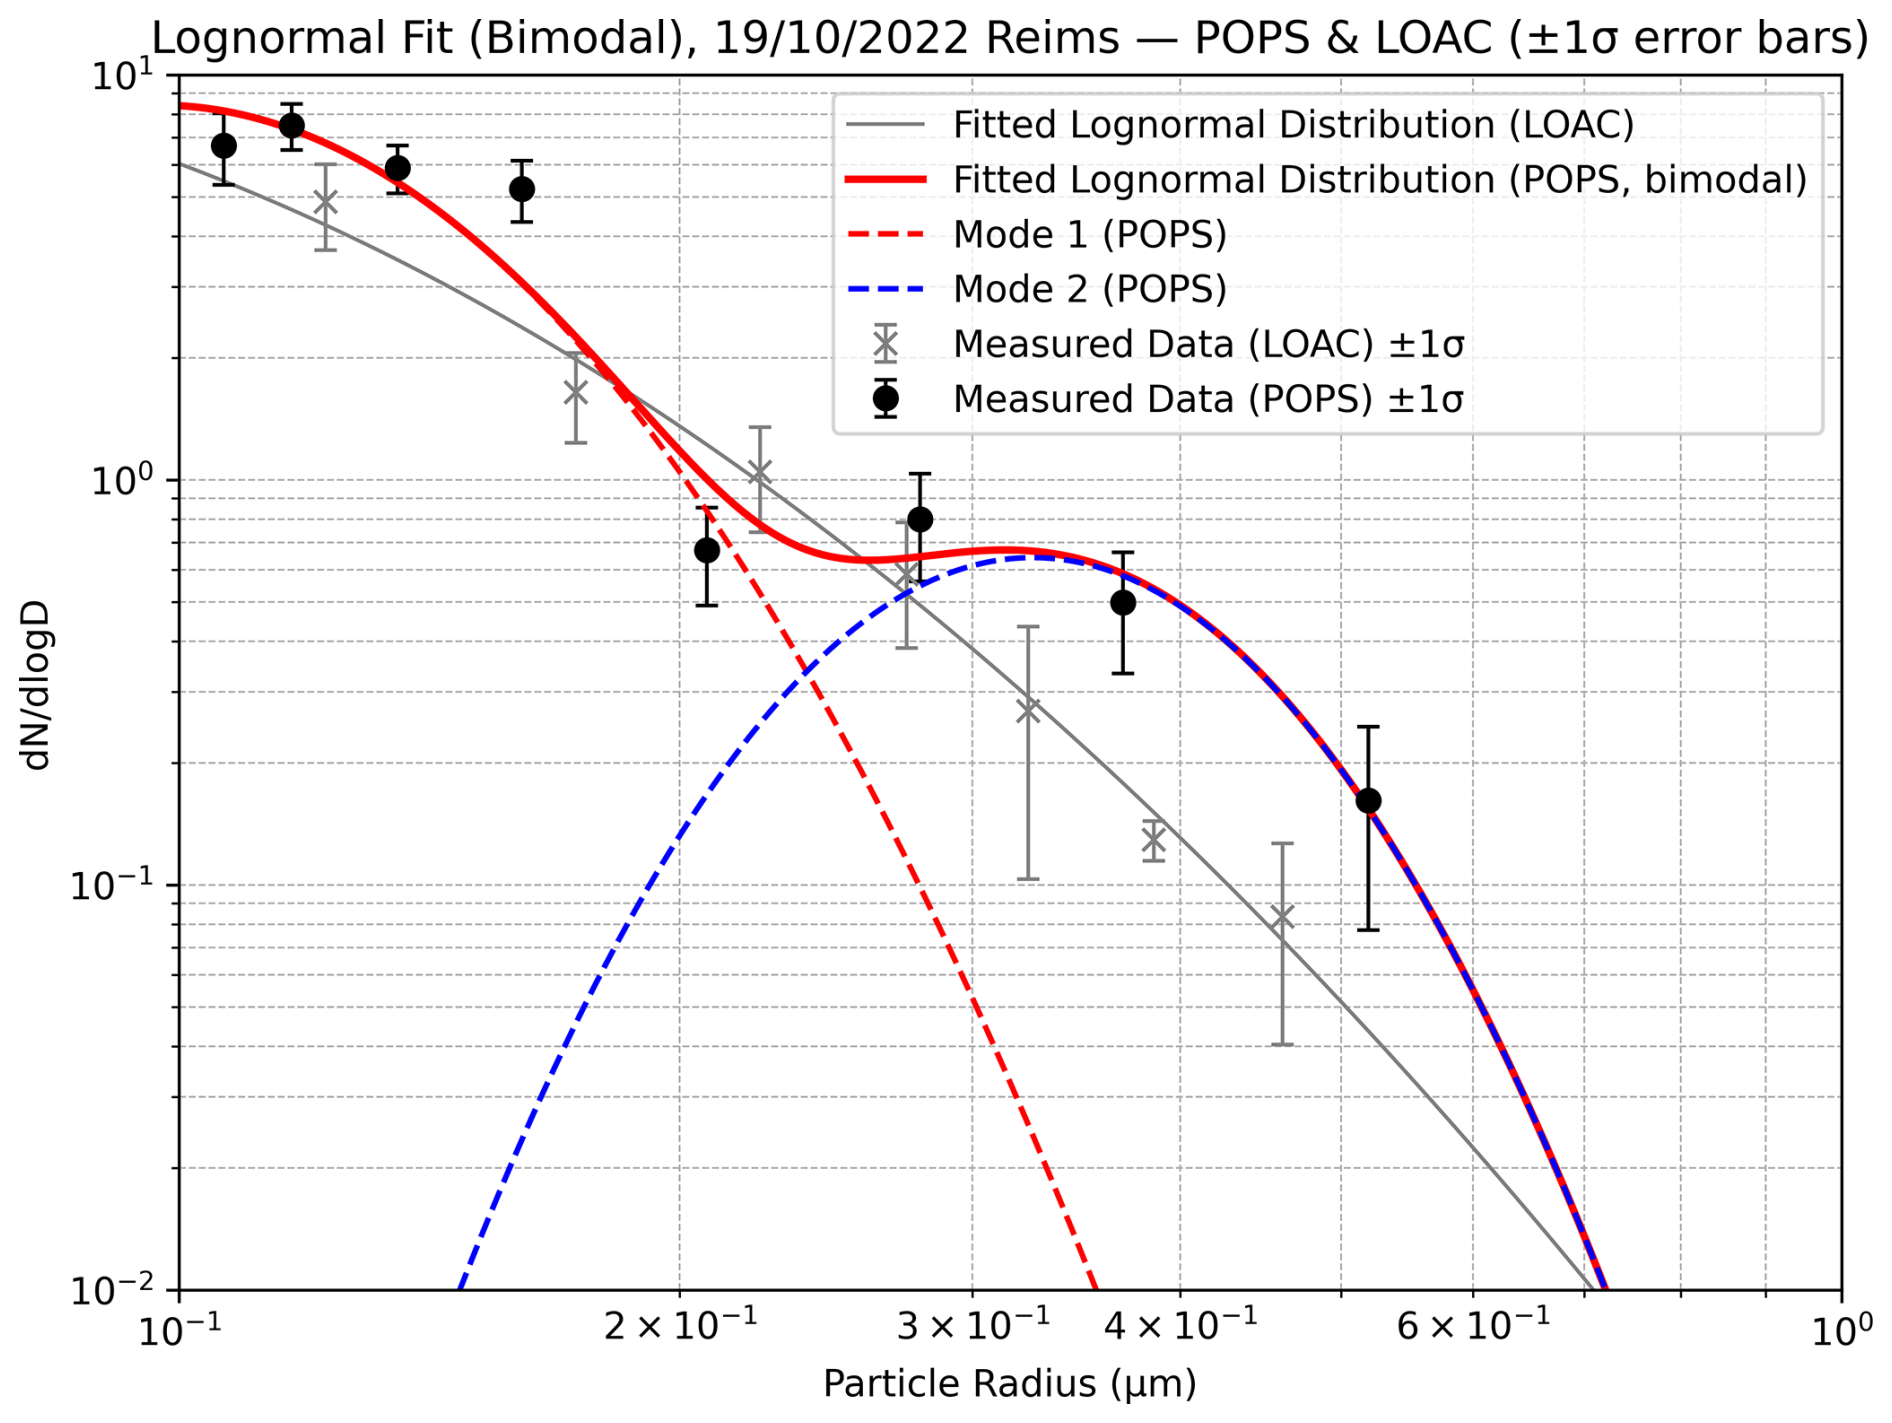
Figure 7POPS and LOAC observations on 19 October 2022 in Reims, France, as also shown in Fig. 2, for the 20–22.5 km altitude range. Black dots indicate POPS measurements, while grey crosses represent the corresponding LOAC measurements. Error bars denote the standard deviation of the averaged profiles. The red solid line represents the bimodal lognormal fit to the POPS observations, and the dashed lines show the individual modes of the fit.
3.5 The radiative impact of the Hunga eruption on the Northern Hemisphere
The observed perturbations to the northern-hemispheric stratospheric aerosol layer due to the transport of the Hunga plume have been used to quantify the inherent TOA radiative forcing, using the UVSPEC radiative transfer model. The strongest cumulative impact of the transported compact plume patches discussed above is observed from satellite between November 2022 and February 2023 at altitudes of 16–24 km (see Fig. 1). Thus, we calculated the TOA radiative forcing using, as aerosol input, satellite aerosol extinction profiles observed during this period, with respect to a background for November 2017–February 2018 (the latest available period without major stratospheric perturbations, for this latitude region), latitudinally averaged between 30 and 50° N. As satellite inputs, we use those from SAGE III/ISS, which have a better signal-to-noise ratio than OMPS-LP and more reliable spectral information. Stratospheric aerosol extinction coefficient profiles for these two periods, from SAGE III/ISS observations, are shown in Fig. 8.
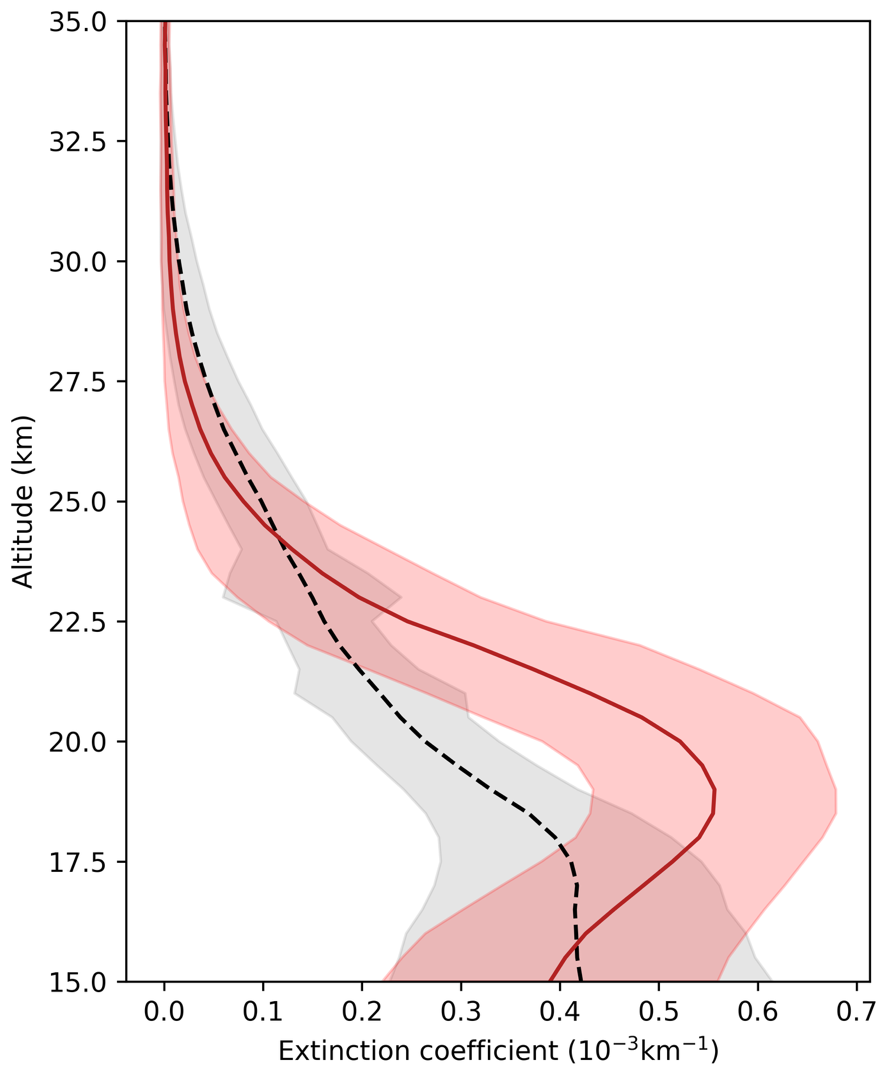
Figure 8Average SAGE III/ISS stratospheric aerosol extinction coefficient profiles and respective standard deviation, between 30 and 50° N, for a Hunga-perturbed period (November 2022–February 2023, solid red curve) and for a corresponding background period (November 2017–February 2018, dashed black curve), at 756 nm.
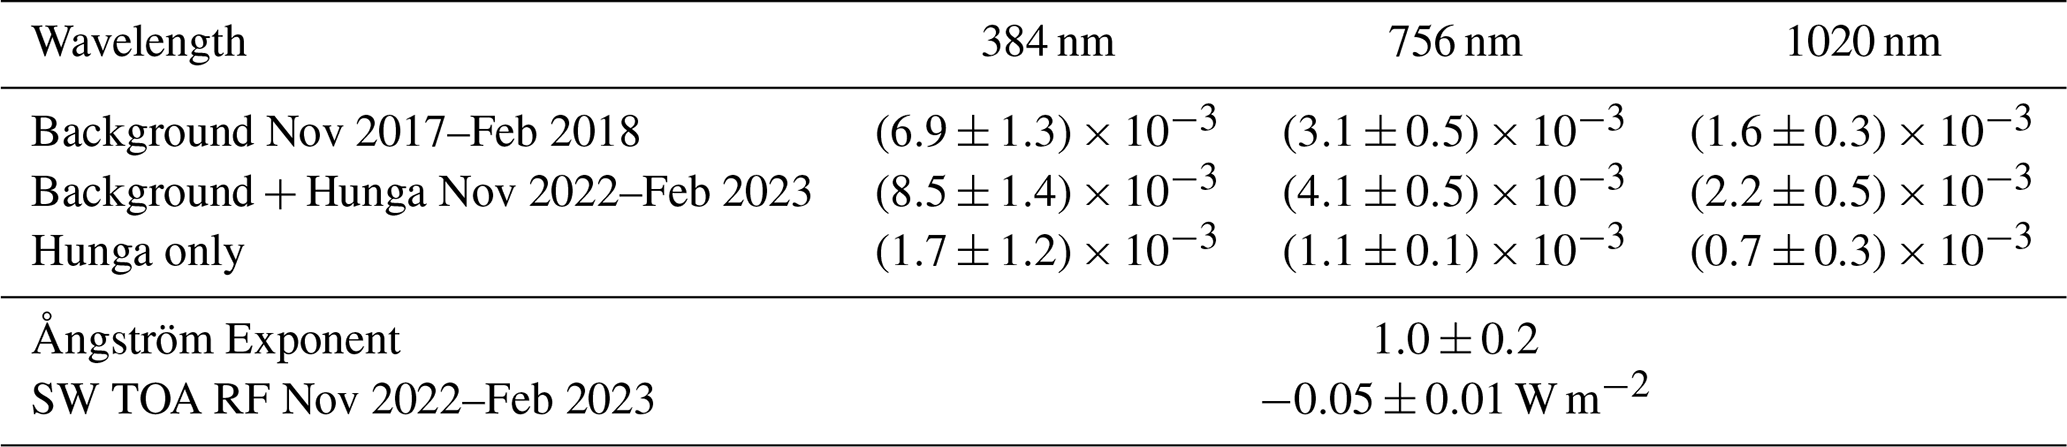
Table 2Different optical and radiative properties of the Hunga plume transported to the NH are summarized as follows: spectral aerosol optical depth values at 384, 756, and 1020 nm are reported for the background stratosphere (November 2017–February 2018), the Hunga-perturbed stratosphere (November 2022–February 2023), and the isolated Hunga impact, calculated between 30° and 50° N. These values are derived from SAGE III/ISS extinction coefficients integrated between 15 km and the TOA. The Ångström exponent is obtained by fitting the spectral SAGE III/ISS observations using the Ångström power-law relation. The shortwave TOA radiative forcing is computed using the UVSPEC radiative transfer model.
The Hunga plume transported to the NH produced up to a doubling of the aerosol extinction coefficient, with respect to background conditions, on average, between about 16 and 24 km altitude. The visible-range AOD of the Hunga plume is found to be between about and , depending on the wavelength of the SAGE III/ISS observations, e.g., at 756 nm (Table 2). This produced an increase in the Hunga-perturbed sAOD (to about to , depending on the wavelength, with at 756 nm) with respect to the background stratosphere (at about to , depending on the wavelength, with at 756 nm).
Using the different spectral AOD values obtained with SAGE III/ISS for the isolated Hunga plume in the NH, an Ångström exponent of (1.0±0.2) is found (Table 2), which is very similar to both experimental values (Sellitto et al., 2024) and theoretical values (Sellitto et al., 2025) obtained for the main plume in the SH. Based on southern hemispheric aerosol optical properties of the Hunga plume (single scattering albedo and phase function), estimated by Sellitto et al. (2025) with a Mie code, the assumption of pure sulphate aerosol particles, and size distributions obtained with satellite observations of SAGE III/ISS (Duchamp et al., 2023), a TOA radiative forcing of W m−2 is calculated with the UVSPEC RTM (Table 2). This value, though small, is not negligible and is comparable to remote transport of other stratospheric aerosol plume patches (Kloss et al., 2019).
Please note that these shortwave estimations were obtained in the spectral interval covered by SAGE III/ISS (384 to 1550 nm), while the usual shortwave spectral range of integration should cover a larger range (e.g., 300–3000 nm, see Sellitto et al., 2022); thus, the obtained values of the radiative forcing might be slightly underestimated.
While the Hunga eruption occurred in the SH, with its stratospheric and radiative impacts primarily confined to the SH and tropical regions, our findings show that parts of the aerosol plume were also transported into the NH stratosphere consistent with a direct transport pathway between the tropics and midlatitudes in the first few kilometers above the tropical tropopause, in which two-way mixing leads to tracer transport between the midlatitudes and the tropics. Dense plume segments were transported poleward, toward the northern mid-latitudes within this lower branch of the Brewer-Dobson Circulation.
Horizontal distribution analyses using OMPS-LP data reveal that aerosol transport into the NH began by February 2022 and persisted through mid-2023. By October, substantial aerosol enhancements extended up to 50° N, consistent with in situ measurements. Aerosol transport occurred predominantly at altitudes of 17–23 km, with dense plumes observed at 21–22 km. During this period, the stratospheric aerosol extinction coefficient is approximately doubled at 16–24 km altitude, compared to background conditions within the 30–50° N latitude band at 16–24 km altitude. This corresponds to an increase in AOD of approximately , depending on wavelength.
These aerosol enhancements resulted in a shortwave TOA radiative forcing of W m−2, averaged over 30–50° N from November 2022 to February 2023. While small, this forcing is not negligible and is comparable to radiative impacts observed from long-range transport of other stratospheric aerosol events.
These results underscore that even a volcanic eruption with moderate aerosol output can have measurable effects in the opposite hemisphere, with potentially significant consequences for regional radiative balance. Furthermore, the elevated aerosol load of the Hunga plume in the NH may enhance heterogeneous chemical reactions, with possible implications for ozone depletion and polar stratospheric cloud formation. These effects should be taken into account in both global and regional chemistry-climate simulations.
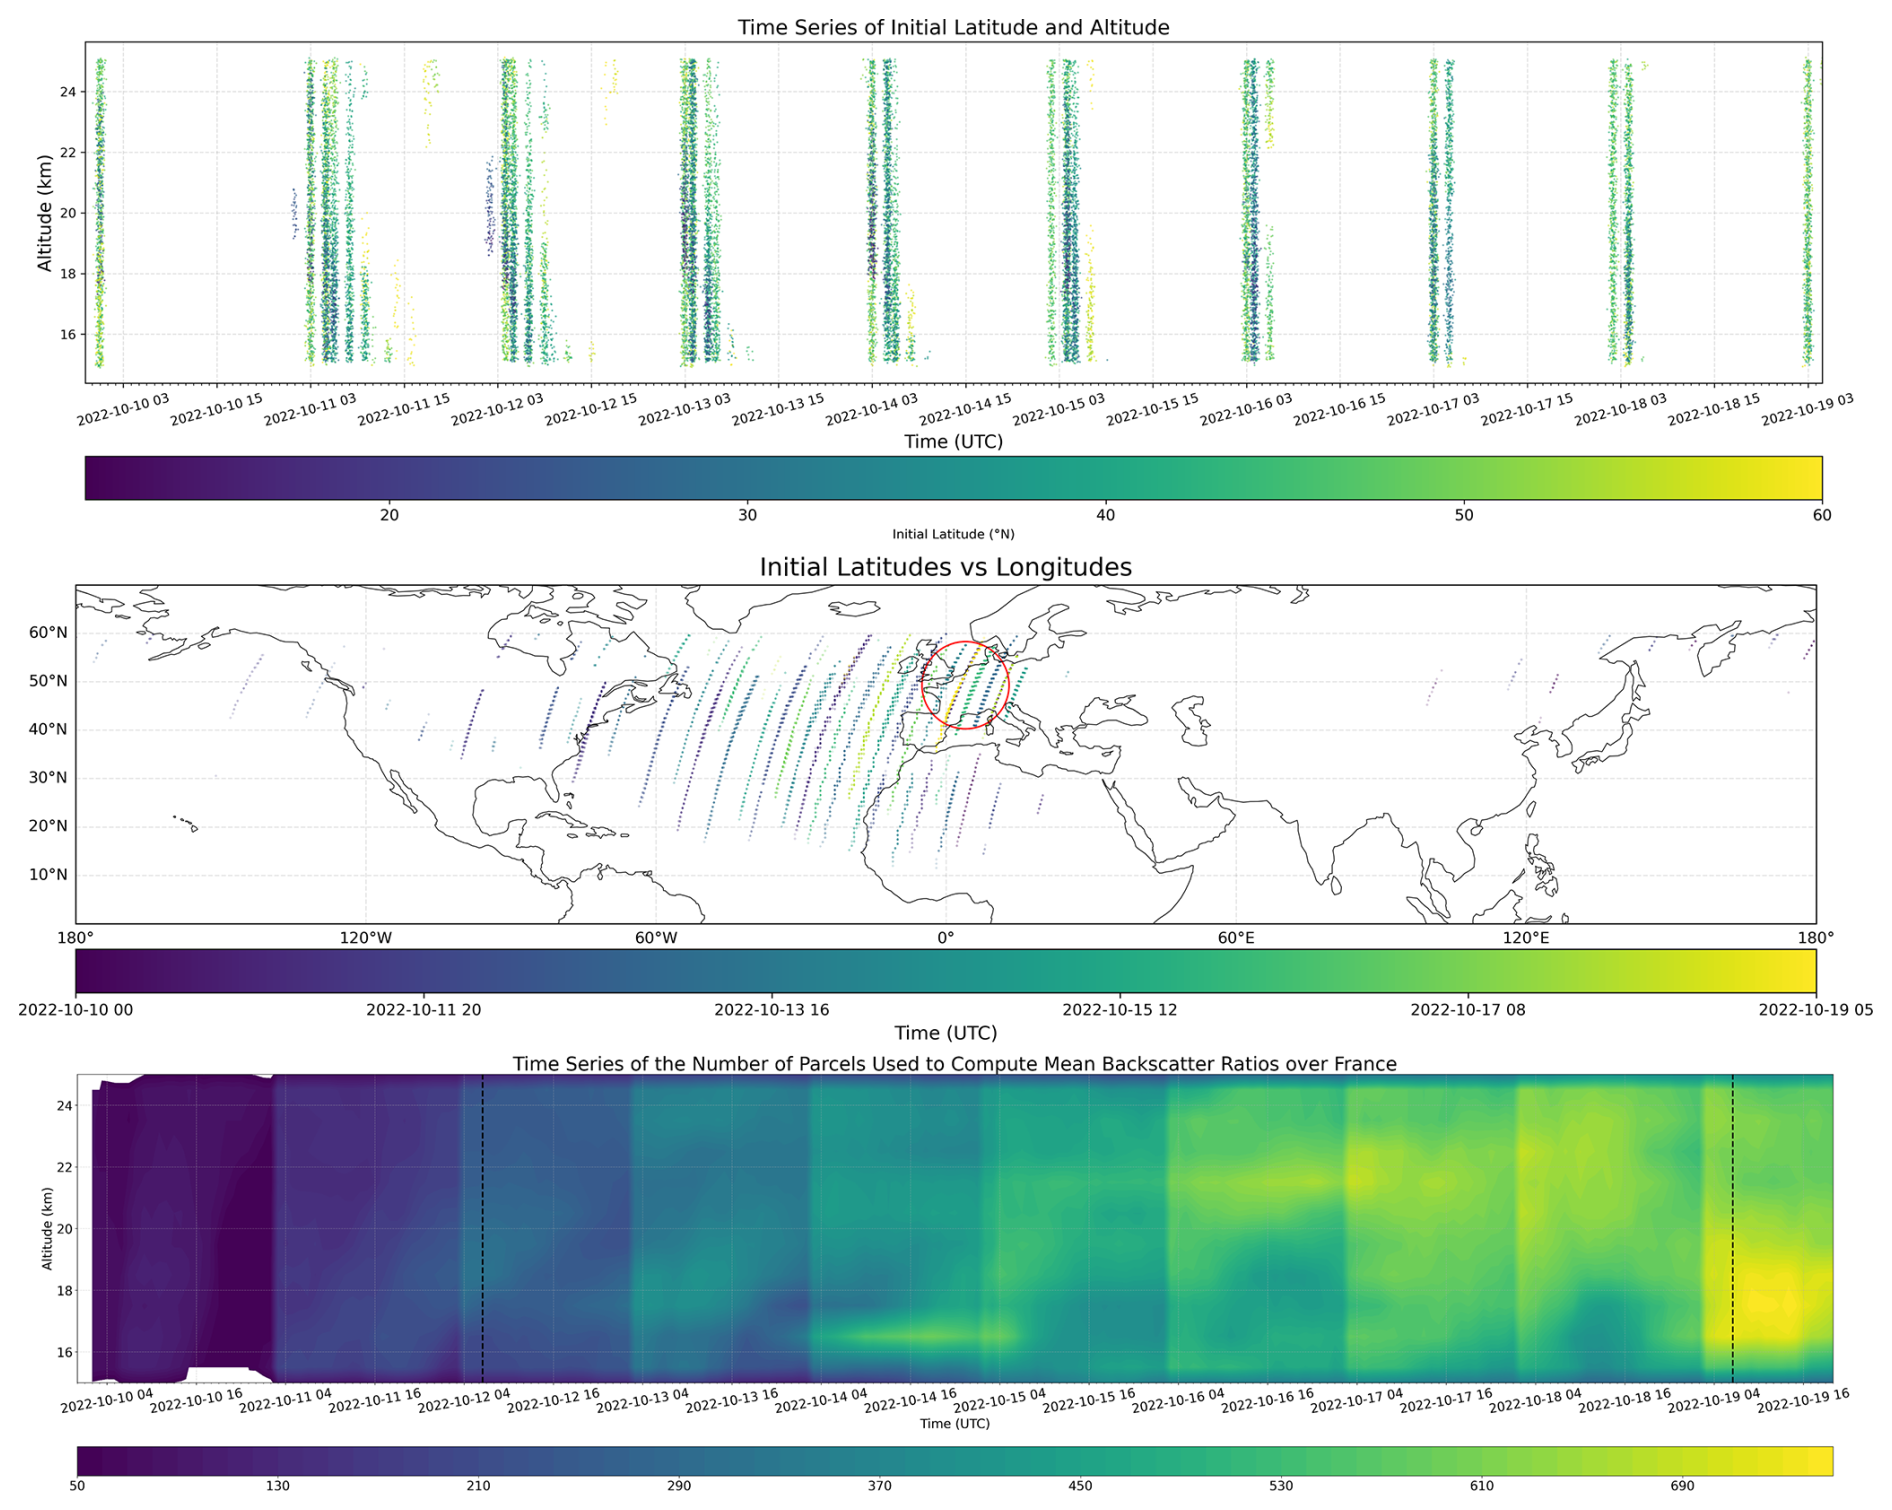
Figure A1Time series of initial latitude and altitude (top), initial latitudes versus longitudes with the date of initializations depicted as a color bar (middle), and time series showing the number of parcels used to compute mean backscatter ratios over France (bottom).
For the access of the OMPS v 2.0 data, they are available at https://doi.org/10.5067/CX2B9NW6FI27 (Taha, 2020) (NASA EarthData registration required). The SAGE III/ISS Aerosol Product can be accessed under https://doi.org/10.5067/ISS/SAGEIII/SOLAR_NetCDF4_L2-V6.0 (SAGE SCIENCE TEAM, 2026). LOAC and POPS observations can be accessed via https://doi.org/10.5281/zenodo.15296481 (Berthet, 2025). POPC and COBALD data can be downloaded via figshare at https://doi.org/10.6084/m9.figshare.28887050.v1 (Vernier, 2025). Data for CALIPSO can be found at https://asdc.larc.nasa.gov/project/CALIPSO/CAL_LID_L1-Standard-V4-51_V4-51 (last access: 18 June 2026). The code for the CLaMS trajectory module is available on a GitLab server at https://jugit.fz-juelich.de/clams/CLaMS (Müller and the CLaMS team, 2024).
Complementary to Fig. 6 and Sect. 3.3, the supplementary Video shows OMPS aerosol extinction observations at 21 to 22 km in the NH, from the beginning of 2021 to mid-2023 in 3 d-steps. The year 2021 is represented to represent aerosol extinction conditions before the Hunga eruption in January 2022, including the influence of the Soufrière eruption in 2021 (https://doi.org/10.5281/zenodo.15343728, Kloss, 2025).
CK coordinated and designed the research. GB performed and coordinated in situ measurement campaigns and the respective funding. PS performed radiative offline simulations, respective analysis. RCD and JPV contributed CALIPSO Backscatter Initialized LaTM Trajectory Analysis. JPV and FGW contributed COBALD data and analysis. PM performed statistical fit analysis to in situ observations. JBR was responsible for LOAC data retrievals. IBG performed CLaMS trajectory simulations. GB, JBR, JPV, ND, LJ, SC, TL and EB assisted in performing in situ observations. MIH, FP helped with transport analysis. All the authors contributed to the writing and revision of the paper.
The contact author has declared that none of the authors has any competing interests.
Publisher's note: Copernicus Publications remains neutral with regard to jurisdictional claims made in the text, published maps, institutional affiliations, or any other geographical representation in this paper. The authors bear the ultimate responsibility for providing appropriate place names. Views expressed in the text are those of the authors and do not necessarily reflect the views of the publisher.
The authors are grateful to the National Aeronautics and Space Administration (NASA), SAGE III/ISS and OMPS teams. AI tools have been used to improve parts of the phrasing of the manuscript. We would like to thank Gilles Chalumeau and Thierry Vincent for intensive technical work and help with the instrument and measurements. LPC2E gratefully acknowledges funding from the Labex Voltaire (ANR-10-LABX-100-01), the ASTuS ANR project (21-CE01-0007-01), the French-Indian CEFIPRA and LE STUDIUM région Centre-Val de Loire for supporting JP Vernier's visit to LPC2E. This research has been partially supported by the Centre National d'Etudes Spatiales (grant no. EXTRA-SAT). We thank Gilles Chalumeau and Thierry Vincent for balloon flight preparation and operations in Orléans and the administrative team from National Institute of Aerospace, Amit Pandit and Johnny Mau for preparing payloads for the balloon flights conducted in Reims, France. We thank the European Centre for Medium-Range Weather Forecasts (ECMWF) for providing the ERA5 reanalyses. The authors gratefully acknowledge the Gauss Centre for Supercomputing e.V. (https://www.gauss-centre.eu, last access: 28 May 2026) for funding this project by providing computing time through the John von Neumann Institute for Computing (NIC) on the GCS Supercomputer JUWELS (Jülich Supercomputing Centre, 2021) at Jülich Supercomputing Centre (JSC). We thank the NASA Roses Upper Atmospheric Composition Observation (UACO) and Atmospheric Composition and Modelling Analysis (ACMAP) programs and the SAGEIII/ISS science team for supporting the NIA/NASA teams. We thank the reviewers for their valuable comments and constructive suggestions, which helped improve the quality of this study.
LPC2E gratefully acknowledges funding from the Labex Voltaire (ANR-10-LABX-100-01), the ASTuS ANR project (21-CE01-0007-01), the French-Indian CEFIPRA and LE STUDIUM région Centre-Val de Loire for supporting JP Vernier's visit to LPC2E. This research has been partially supported by the Centre National d'Etudes Spatiales (grant no. EXTRA-SAT).
The article processing charges for this open-access publication were covered by the Forschungszentrum Jülich.
This paper was edited by Zhanqing Li and reviewed by four anonymous referees.
Anderson, G., Clough, S., Kneizys, F., and Shettle, E.: AFGL Atmospheric Constituent Profiles (0.120 km), AFGL Environmental Research Papers, 1–46, https://apps.dtic.mil/dtic/tr/fulltext/u2/a175173.pdf (last access: 28 May 2026), 1986. a
Andersson, S. M., Martinsson, B. G., Vernier, J.-P., Friberg, J., Brenninkmeijer, C. A. M., Hermann, M., van Velthoven, P. F. J., and Zahn, A.: Significant radiative impact of volcanic aerosol in the lowermost stratosphere, Nat. Commun., 6, 7692, https://doi.org/10.1038/ncomms8692, 2015. a
Asher, E., Todt, M., Rosenlof, K., Thornberry, T., Gao, R.-S., Taha, G., Walter, P., Alvarez, S., Flynn, J., Davis, S. M., Evan, S., Brioude, J., Metzger, J.-M., Hurst, D. F., Hall, E., and Xiong, K.: Unexpectedly rapid aerosol formation in the Hunga Tonga plume, P. Natl. Acad. Sci. USA, 120, e2219547120, https://doi.org/10.1073/pnas.2219547120, 2023. a
Berthet, G.: POPS and LOAC v1.5 profiles for concentration and extinction – Hunga Tonga volcanic plume in the midlatitude Northern Hemisphere, Zenodo [data set], https://doi.org/10.5281/zenodo.15296481, 2025. a
Bian, J., Li, D., Bai, Z., Xu, J., Li, Q., Wang, H., Vömel, H., Wienhold, F. G., and Peter, T.: First detection of aerosols of the Hunga Tonga eruption in the Northern Hemisphere stratospheric westerlies, Sci. Bull., 68, 574–577, https://doi.org/10.1016/j.scib.2023.03.002, 2023. a
Boichu, M., Grandin, R., Blarel, L., Torres, B., Derimian, Y., Goloub, P., Brogniez, C., Chiapello, I., Dubovik, O., Mathurin, T., Pascal, N., Patou, M., and Riedi, J.: Growth and Global Persistence of Stratospheric Sulfate Aerosols From the 2022 Hunga Tonga–Hunga Ha'apai Volcanic Eruption, Journal Geophys. Res.-Atmos., 128, e2023JD039010, https://doi.org/10.1029/2023JD039010, 2023. a
Brabec, M., Wienhold, F. G., Luo, B. P., Vömel, H., Immler, F., Steiner, P., Hausammann, E., Weers, U., and Peter, T.: Particle backscatter and relative humidity measured across cirrus clouds and comparison with microphysical cirrus modelling, Atmos. Chem. Phys., 12, 9135–9148, https://doi.org/10.5194/acp-12-9135-2012, 2012. a
Brock, C. A., Froyd, K. D., Dollner, M., Williamson, C. J., Schill, G., Murphy, D. M., Wagner, N. J., Kupc, A., Jimenez, J. L., Campuzano-Jost, P., Nault, B. A., Schroder, J. C., Day, D. A., Price, D. J., Weinzierl, B., Schwarz, J. P., Katich, J. M., Wang, S., Zeng, L., Weber, R., Dibb, J., Scheuer, E., Diskin, G. S., DiGangi, J. P., Bui, T., Dean-Day, J. M., Thompson, C. R., Peischl, J., Ryerson, T. B., Bourgeois, I., Daube, B. C., Commane, R., and Wofsy, S. C.: Ambient aerosol properties in the remote atmosphere from global-scale in situ measurements, Atmos. Chem. Phys., 21, 15023–15063, https://doi.org/10.5194/acp-21-15023-2021, 2021. a
Bruckert, J., Hirsch, L., Horváth, Á., Kahn, R. A., Kölling, T., Muser, L. O., Timmreck, C., Vogel, H., Wallis, S., and Hoshyaripour, G. A.: Dispersion and Aging of Volcanic Aerosols After the La Soufrière Eruption in April 2021, J. Geophys. Res.-Atmos., 128, e2022JD037694, https://doi.org/10.1029/2022JD037694, 2023. a
Carn, S. A., Krotkov, N. A., Fisher, B. L., and Li, C.: Out of the blue: Volcanic SO2 emissions during the 2021–2022 eruptions of Hunga Tonga–Hunga Ha'apai (Tonga), Frontiers in Earth Science, 10, https://doi.org/10.3389/feart.2022.976962, 2022. a, b
Carr, J. L., Horváth, Á., Wu, D. L., and Friberg, M. D.: Stereo Plume Height and Motion Retrievals for the Record-Setting Hunga Tonga-Hunga Ha'apai Eruption of 15 January 2022, Geophys. Res. Lett., 49, e2022GL098131, https://doi.org/10.1029/2022GL098131, 2022. a
Dahlback, A. and Stamnes, K.: A new spherical model for computing the radiation field available for photolysis and heating at twilight, Planetary and Space Science, 39, 671–683, https://doi.org/10.1016/0032-0633(91)90061-E, 1991. a
Deng, C., Li, Y., Yan, C., Wu, J., Cai, R., Wang, D., Liu, Y., Kangasluoma, J., Kerminen, V.-M., Kulmala, M., and Jiang, J.: Measurement report: Size distributions of urban aerosols down to 1 nm from long-term measurements, Atmos. Chem. Phys., 22, 13569–13580, https://doi.org/10.5194/acp-22-13569-2022, 2022. a
Deshler, T., Kalnajs, L. E., Norgren, M., Zhu, Y., and Zhang, J.: In Situ Aerosol Size Spectra Measurements in the Austral Polar Vortex Before and After the Hunga Tonga-Hunga Ha'apai Volcanic Eruption, Geophys. Res. Lett., 51, e2024GL111388, https://doi.org/10.1029/2024GL111388, 2024. a, b, c, d, e
Duchamp, C., Wrana, F., Legras, B., Sellitto, P., Belhadji, R., and von Savigny, C.: Observation of the Aerosol Plume From the 2022 Hunga Tonga–Hunga Ha'apai Eruption With SAGE III/ISS, Geophys. Res. Lett., 50, e2023GL105076, https://doi.org/10.1029/2023GL105076, 2023. a, b, c
Dumelié, N., Vernier, J.-P., Berthet, G., Vernier, H., Renard, J.-B., Rastogi, N., Wienhold, F., Combaz, D., Angot, M., Burgalat, J., Parent, F., Chauvin, N., Albora, G., Dagaut, P., Benoit, R., Kovilakam, M., Crevoisier, C., and Joly, L.: Toward Rapid Balloon Experiments for Sudden Aerosol Injection in the Stratosphere (REAS) by Volcanic Eruptions and Wildfires, B. Am. Meteorol. Soc., 105, E105–E120, https://doi.org/10.1175/BAMS-D-22-0086.1, 2024. a
Fairlie, T. D., Vernier, J.-P., Natarajan, M., and Bedka, K. M.: Dispersion of the Nabro volcanic plume and its relation to the Asian summer monsoon, Atmos. Chem. Phys., 14, 7045–7057, https://doi.org/10.5194/acp-14-7045-2014, 2014. a
Grant, W. B., Browell, E. V., Fishman, J., Brackett, V. G., Veiga, R. E., Nganga, D., Minga, A., Cros, B., Butler, C. F., Fenn, M. A., Long, C. S., and Stowe, L. L.: Aerosol-associated changes in tropical stratospheric ozone following the eruption of Mount Pinatubo, J. Geophys. Res.-Atmos., 99, 8197–8211, https://doi.org/10.1029/93JD03314, 1994. a
Guo, S., Bluth, G. J. S., Rose, W. I., Watson, I. M., and Prata, A. J.: Re-evaluation of SO2 release of the 15 June 1991 Pinatubo eruption using ultraviolet and infrared satellite sensors, Geochem. Geophy. Geosy., 5, https://doi.org/10.1029/2003GC000654, 2004. a
Haynes, P. and Shuckburgh, E.: Effective diffusivity as a diagnostic of atmospheric transport: 1. Stratosphere, J. Geophys. Res.-Atmos., 105, 22777–22794, https://doi.org/10.1029/2000JD900093, 2000. a
He, Y.: Comment on “Cross-Hemispheric Transport of the Hunga Aerosol Plume: In Situ Evidence and Radiative Effects from the Northern Hemisphere” by Kloss et al., EGUsphere [preprint], 2025, https://doi.org/10.5194/egusphere-2025-2091-CC1, 2025. a
Hegglin, M. I. and Shepherd, T. G.: O3-N2O correlations from the Atmospheric Chemistry Experiment: Revisiting a diagnostic of transport and chemistry in the stratosphere, J. Geophys. Res.-Atmos., 112, https://doi.org/10.1029/2006JD008281, 2007. a
Hersbach, H., Bell, B., Berrisford, P., Hirahara, S., Horányi, A., Muñoz-Sabater, J., Nicolas, J., Peubey, C., Radu, R., Schepers, D., Simmons, A., Soci, C., Abdalla, S., Abellan, X., Balsamo, G., Bechtold, P., Biavati, G., Bidlot, J., Bonavita, M., De Chiara, G., Dahlgren, P., Dee, D., Diamantakis, M., Dragani, R., Flemming, J., Forbes, R., Fuentes, M., Geer, A., Haimberger, L., Healy, S., Hogan, R. J., Hólm, E., Janisková, M., Keeley, S., Laloyaux, P., Lopez, P., Lupu, C., Radnoti, G., de Rosnay, P., Rozum, I., Vamborg, F., Villaume, S., and Thépaut, J.-N.: The ERA5 global reanalysis, Q. J. Roy. Meteor. Soc., 146, 1999–2049, https://doi.org/10.1002/qj.3803, 2020. a
Homeyer, C. R. and Bowman, K. P.: Rossby Wave Breaking and Transport between the Tropics and Extratropics above the Subtropical Jet, J. Atmos. Sci., 70, 607–626, https://doi.org/10.1175/JAS-D-12-0198.1, 2013. a
Jaross, G., Bhartia, P. K., Chen, G., Kowitt, M., Haken, M., Chen, Z., Xu, P., Warner, J., and Kelly, T.: OMPS Limb Profiler instrument performance assessment, J. Geophys. Res.-Atmos., 119, 4399–4412, https://doi.org/10.1002/2013JD020482, 2014. a
Jülich Supercomputing Centre: JUWELS Cluster and Booster: Exascale Pathfinder with Modular Supercomputing Architecture at Juelich Supercomputing Centre, Journal of Large-Scale Research Facilities, 7, A183, https://doi.org/10.17815/jlsrf-7-183, 2021. a
Khaykin, K., Podglajen, A., Ploeger, F., Grooß, J.-U., Tence, F., Bekki, S., Khlopenkov, K., Bedka, K., Rieger, L., Baron, A., Godin-Beekmann, S., Legras, B., Sellitto, P., Sakai, T., Barnes, J., Uchino, O., Morino, I., Nagai, T., Wing, R., Baumgarten, G., Gerding, M., Duflot, V., Payen, G., Jumelet, J., and Ravetta, F.: Global perturbation of stratospheric water and aerosol burden by Hunga eruption, Communications Earth & Environment, 3, 316, https://doi.org/10.1038/s43247-022-00652-x, 2022. a, b
Kloss, C.: Time series of OMPS aerosol extinction at 21–22 km, Zenodo [video], https://doi.org/10.5281/zenodo.15343728, 2025. a, b
Kloss, C., Berthet, G., Sellitto, P., Ploeger, F., Bucci, S., Khaykin, S., Jégou, F., Taha, G., Thomason, L. W., Barret, B., Le Flochmoen, E., von Hobe, M., Bossolasco, A., Bègue, N., and Legras, B.: Transport of the 2017 Canadian wildfire plume to the tropics via the Asian monsoon circulation, Atmos. Chem. Phys., 19, 13547–13567, https://doi.org/10.5194/acp-19-13547-2019, 2019. a
Kloss, C., Sellitto, P., Renard, J.-B., Baron, A., Bègue, N., Legras, B., Berthet, G., Briaud, E., Carboni, E., Duchamp, C., Duflot, V., Jacquet, P., Marquestaut, N., Metzger, J.-M., Payen, G., Ranaivombola, M., Roberts, T., Siddans, R., and Jégou, F.: Aerosol Characterization of the Stratospheric Plume From the Volcanic Eruption at Hunga Tonga 15 January 2022, Geophys. Res. Lett., 49, e2022GL099394, https://doi.org/10.1029/2022GL099394, 2022. a
Knepp, T. N., Kovilakam, M., Thomason, L., and Miller, S. J.: Characterization of stratospheric particle size distribution uncertainties using SAGE II and SAGE III/ISS extinction spectra, Atmos. Meas. Tech., 17, 2025–2054, https://doi.org/10.5194/amt-17-2025-2024, 2024. a, b
Kurucz, R. L.: Synthetic Infrared Spectra, Infrared Solar Phys., 154, 523–531, https://doi.org/10.1007/978-94-011-1926-9_62, 1994. a
Legras, B., Duchamp, C., Sellitto, P., Podglajen, A., Carboni, E., Siddans, R., Grooß, J.-U., Khaykin, S., and Ploeger, F.: The evolution and dynamics of the Hunga Tonga–Hunga Ha'apai sulfate aerosol plume in the stratosphere, Atmos. Chem. Phys., 22, 14957–14970, https://doi.org/10.5194/acp-22-14957-2022, 2022. a, b, c
Li, Y., Pedersen, C., Dykema, J., Vernier, J.-P., Vattioni, S., Pandit, A. K., Stenke, A., Asher, E., Thornberry, T., Todt, M. A., Bui, T. P., Dean-Day, J., and Keutsch, F. N.: In situ measurements of perturbations to stratospheric aerosol and modeled ozone and radiative impacts following the 2021 La Soufrière eruption, Atmos. Chem. Phys., 23, 15351–15364, https://doi.org/10.5194/acp-23-15351-2023, 2023. a
Mayer, B. and Kylling, A.: Technical note: The libRadtran software package for radiative transfer calculations - description and examples of use, Atmos. Chem. Phys., 5, 1855–1877, https://doi.org/10.5194/acp-5-1855-2005, 2005. a
McKenna, D. S., Grooß, J.-U., Günther, G., Konopka, P., Müller, R., Carver, G., and Sasano, Y.: A new Chemical Lagrangian Model of the Stratosphere (CLaMS) 2. Formulation of chemistry scheme and initialization, J. Geophys. Res.-Atmos., 107, ACH 4-1–ACH 4-14, https://doi.org/10.1029/2000JD000113, 2002a. a
McKenna, D. S., Konopka, P., Grooß, J.-U., Günther, G., Müller, R., Spang, R., Offermann, D., and Orsolini, Y.: A new Chemical Lagrangian Model of the Stratosphere (CLaMS) 1. Formulation of advection and mixing, J. Geophys. Res.-Atmos., 107, ACH 15-1–ACH 15-15, https://doi.org/10.1029/2000JD000114, 2002b. a
Millán, L., Santee, M. L., Lambert, A., Livesey, N. J., Werner, F., Schwartz, M. J., Pumphrey, H. C., Manney, G. L., Wang, Y., Su, H., Wu, L., Read, W. G., and Froidevaux, L.: The Hunga Tonga-Hunga Ha'apai Hydration of the Stratosphere, Geophys. Res. Lett., 49, e2022GL099381, https://doi.org/10.1029/2022GL099381, 2022. a
Müller, R. and the CLaMS team: Chemical Lagrangian Model of the Stratosphere (CLaMS) code repository, FZ Jülich [code], https://jugit.fz-juelich.de/clams/CLaMS, last access: 4 January 2024. a
Pierluissi, J. H. and Peng, G. S.: New molecular transmission band models for LOWTRAN, Optical Engineering, 24, https://doi.org/10.1117/12.7973523, 1985. a
Ploeger, F., Diallo, M., Charlesworth, E., Konopka, P., Legras, B., Laube, J. C., Grooß, J.-U., Günther, G., Engel, A., and Riese, M.: The stratospheric Brewer–Dobson circulation inferred from age of air in the ERA5 reanalysis, Atmos. Chem. Phys., 21, 8393–8412, https://doi.org/10.5194/acp-21-8393-2021, 2021. a
Plumb, R. A.: Stratospheric Transport, J. Meteorol. Soc. Jpn. Ser. II, 80, 793–809, https://doi.org/10.2151/jmsj.80.793, 2002. a
Pommrich, R., Müller, R., Grooß, J.-U., Konopka, P., Ploeger, F., Vogel, B., Tao, M., Hoppe, C. M., Günther, G., Spelten, N., Hoffmann, L., Pumphrey, H.-C., Viciani, S., D'Amato, F., Volk, C. M., Hoor, P., Schlager, H., and Riese, M.: Tropical troposphere to stratosphere transport of carbon monoxide and long-lived trace species in the Chemical Lagrangian Model of the Stratosphere (CLaMS), Geosci. Model Dev., 7, 2895–2916, https://doi.org/10.5194/gmd-7-2895-2014, 2014. a
Proud, S. R., Prata, A. T., and Schmauß, S.: The January 2022 eruption of Hunga Tonga-Hunga Ha'apai volcano reached the mesosphere, Science, 378, 554–557, https://doi.org/10.1126/science.abo4076, 2022. a
Renard, J.-B., Dulac, F., Berthet, G., Lurton, T., Vignelles, D., Jégou, F., Tonnelier, T., Jeannot, M., Couté, B., Akiki, R., Verdier, N., Mallet, M., Gensdarmes, F., Charpentier, P., Mesmin, S., Duverger, V., Dupont, J.-C., Elias, T., Crenn, V., Sciare, J., Zieger, P., Salter, M., Roberts, T., Giacomoni, J., Gobbi, M., Hamonou, E., Olafsson, H., Dagsson-Waldhauserova, P., Camy-Peyret, C., Mazel, C., Décamps, T., Piringer, M., Surcin, J., and Daugeron, D.: LOAC: a small aerosol optical counter/sizer for ground-based and balloon measurements of the size distribution and nature of atmospheric particles – Part 1: Principle of measurements and instrument evaluation, Atmos. Meas. Tech., 9, 1721–1742, https://doi.org/10.5194/amt-9-1721-2016, 2016. a, b
Ricchiazzi, P., Yang, S., Gautier, C., and Sowle, D.: SBDART: A Research and Teaching Software Tool for Plane-Parallel Radiative Transfer in the Earth's Atmosphere, B. Am. Meteorol. Soc., 79, 2101–2114, https://doi.org/10.1175/1520-0477(1998)079<2101:SARATS>2.0.CO;2, 1998. a
Rosenlof, K. H., Tuck, A. F., Kelly, K. K., Russell III, J. M., and McCormick, M. P.: Hemispheric asymmetries in water vapor and inferences about transport in the lower stratosphere, J. Geophys. Res.-Atmos., 102, 13213–13234, https://doi.org/10.1029/97JD00873, 1997. a
SAGE SCIENCE TEAM: SAGE III/ISS L2 Monthly Solar Event Species Profiles (NetCDF) V006, NASA Langley Atmospheric Science Data Center Distributed Active Archive Center [data set], https://doi.org/10.5067/ISS/SAGEIII/SOLAR_NETCDF4_L2-V6.0, 2026. a
Schoeberl, M. R., Wang, Y., Ueyama, R., Taha, G., Jensen, E., and Yu, W.: Analysis and Impact of the Hunga Tonga-Hunga Ha'apai Stratospheric Water Vapor Plume, Geophys. Res. Lett., 49, e2022GL100248, https://doi.org/10.1029/2022GL100248, 2022. a
Schoeberl, M. R., Wang, Y., Taha, G., Zawada, D. J., Ueyama, R., and Dessler, A.: Evolution of the Climate Forcing During the Two Years After the Hunga Tonga-Hunga Ha'apai Eruption, J. Geophys. Res.-Atmos., 129, e2024JD041296, https://doi.org/10.1029/2024JD041296, 2024. a
Sellitto, P., Podglajen, A., Belhadji, R., Boichu, M., Carboni, E., Cuesta, J., Duchamp, C., Kloss, C., Siddans, R., Bègue, N., Blarel, L., Jégou, F., Khaykin, S., Renard, J.-B., and Legras, B.: Significant radiative impact of volcanic aerosol in the lowermost stratosphere, Communications Earth & Environment, 3, 288, https://doi.org/10.1038/s43247-022-00618-z, 2022. a, b, c, d
Sellitto, P., Siddans, R., Belhadji, R., Carboni, E., Legras, B., Podglajen, A., Duchamp, C., and Kerridge, B.: Observing the SO2 and Sulfate Aerosol Plumes From the 2022 Hunga Eruption With the Infrared Atmospheric Sounding Interferometer (IASI), Geophys. Res. Lett., 51, e2023GL105565, https://doi.org/10.1029/2023GL105565, 2024. a, b, c, d, e, f
Sellitto, P., Belhadji, R., Legras, B., Podglajen, A., and Duchamp, C.: The optical properties of the stratospheric aerosol layer perturbation of the Hunga Tonga–Hunga Ha'apai volcano eruption of 15 January 2022, Atmos. Chem. Phys., 25, 6353–6364, https://doi.org/10.5194/acp-25-6353-2025, 2025. a, b
Shepherd, T. G.: The middle atmosphere, J. Atmos. Sol.-Terr. Phy., 62, 1587–1601, https://doi.org/10.1016/S1364-6826(00)00114-0, 2000. a
Shikwambana, L., Sivakumar, V., and Xongo, K.: Tracking the Transport of SO2 and Sulphate Aerosols from the Tonga Volcanic Eruption to South Africa, Atmosphere, 14, https://doi.org/10.3390/atmos14101556, 2023. a
Sicard, M., Baron, A., Ranaivombola, M., Gantois, D., Millet, T., Sellitto, P., Bègue, N., Bencherif, H., Payen, G., Marquestaut, N., and Duflot, V.: Radiative impact of the Hunga stratospheric volcanic plume: role of aerosols and water vapor over Réunion Island (21° S, 55° E), Atmos. Chem. Phys., 25, 367–381, https://doi.org/10.5194/acp-25-367-2025, 2025. a
Taha, G.: OMPS-NPP L2 LP Aerosol Extinction Vertical Profile swath daily 3slit V2, Goddard Earth Sciences Data and Information Services Center (GES DISC) [data set], https://doi.org/10.5067/CX2B9NW6FI27, 2020. a
Taha, G., Loughman, R., Zhu, T., Thomason, L., Kar, J., Rieger, L., and Bourassa, A.: OMPS LP Version 2.0 multi-wavelength aerosol extinction coefficient retrieval algorithm, Atmos. Meas. Tech., 14, 1015–1036, https://doi.org/10.5194/amt-14-1015-2021, 2021. a
Taha, G., Loughman, R., Colarco, P. R., Zhu, T., Thomason, L. W., and Jaross, G.: Tracking the 2022 Hunga Tonga-Hunga Ha'apai Aerosol Cloud in the Upper and Middle Stratosphere Using Space-Based Observations, Geophys. Res. Lett., 49, e2022GL100091, https://doi.org/10.1029/2022GL100091, 2022. a, b, c, d
Taylor, I. A., Grainger, R. G., Prata, A. T., Proud, S. R., Mather, T. A., and Pyle, D. M.: A satellite chronology of plumes from the April 2021 eruption of La Soufrière, St Vincent, Atmos. Chem. Phys., 23, 15209–15234, https://doi.org/10.5194/acp-23-15209-2023, 2023. a
Todt, M. A., Asher, E., Hall, E., Cullis, P., Jordan, A., Xiong, K., Hurst, D. F., and Thornberry, T.: Baseline Balloon Stratospheric Aerosol Profiles (B2SAP) – Systematic Measurements of Aerosol Number Density and Size, J. Geophys. Res.-Atmos., 128, e2022JD038041, https://doi.org/10.1029/2022JD038041, 2023. a
Trepte, C. R. and Hitchman, M. H.: Tropical stratospheric circulation deduced from satellite aerosol data, Nature, 355, 626–628, https://doi.org/10.1038/355626a0, 1992. a
Vernier, H., Quintão, D., Biazon, B., Landulfo, E., Souza, G., Santos, V. A., Lopes, J. S. F., Mendes, C. P. A., Matta, A. S. J. D., Damaris, K. P., Grosslin, B., Jorge, P. M. P. M., Andrade, M. D. F., Rastogi, N., Raj, A., Liu, H., Kovilakam, M., Fadnavis, S., Wienhold, F. G., Colombier, M., Boone, D. C., Berthet, G., Dumelie, N., Joly, L., and Vernier, J.-P.: Balloon Observations Suggesting Sea Salt Injection into the Stratosphere from Hunga Tonga-Hunga Ha'apai, EGUsphere [preprint], https://doi.org/10.5194/egusphere-2025-924, 2025. a
Vernier, J.-P.: COBALD/POPC DATA FRANCE 2022, Figshare [data set], https://doi.org/10.6084/m9.figshare.28887050.v1, 2025. a
Vernier, J. P., Pommereau, J. P., Garnier, A., Pelon, J., Larsen, N., Nielsen, J., Christensen, T., Cairo, F., Thomason, L. W., Leblanc, T., and McDermid, I. S.: Tropical stratospheric aerosol layer from CALIPSO lidar observations, J. Geophys. Res.-Atmos., 114, https://doi.org/10.1029/2009JD011946, 2009. a
Vernier, J.-P., Fairlie, T. D., Natarajan, M., Wienhold, F. G., Bian, J., Martinsson, B. G., Crumeyrolle, S., Thomason, L. W., and Bedka, K. M.: Increase in upper tropospheric and lower stratospheric aerosol levels and its potential connection with Asian pollution, J. Geophys. Res.-Atmos., 120, 1608–1619, https://doi.org/10.1002/2014JD022372, 2015. a
Zhu, Y., Bardeen, C. G., Tilmes, S., Mills, M. J., Wang, X., Harvey, V. L., Taha, G., Kinnison, D., Portmann, R. W., Yu, P., Rosenlof, K. H., Avery, M., Kloss, C., Li, C., Glanville, A. S., Millán, L., Deshler, T., Krotkov, N., and Toon, O. B.: Perturbations in stratospheric aerosol evolution due to the water-rich plume of the 2022 Hunga-Tonga eruption, Communications Earth & Environment, 3, 248, https://doi.org/10.1038/s43247-022-00580-w, 2022. a