the Creative Commons Attribution 4.0 License.
the Creative Commons Attribution 4.0 License.
 | 22 Jun 2026
Critical role of dust induced electrostatic coagulation in the evolution of aerosol size distributions in the atmosphere
Luoqiu Quan
Ruoyu Zhang
Gui Dai
Xinghua Jiang
Xiangyang Wang
Xiewen Ma
Xinyu Liu
Qianqian Gao
Xiaohui Lu
Xiaofei Wang
Coagulation modifies the particle size distributions (PSD) of atmospheric aerosols, affecting their optical properties, cloud droplet activation, and gravitational deposition. While Coulomb forces may impact coagulation processes between charged aerosols, such as dust, most coagulation models neglect the effects of aerosol charge. Here, we address the lack of measurements of charge numbers carried by individual dust aerosol particles by developing a method to retrieve their joint size-charge distributions. By incorporating aerosol charge into the coagulation kernel, simulations in a dust-only scenario at typical environmental concentrations show that, on hourly timescales, electrostatic force leads to a reduction of up to ∼ 64 % in number concentration relative to Brownian coagulation. Moreover, electrostatic coagulation between dust and ambient sub-500 nm aerosols modifies the latter's PSD by ∼ 10 % compared with Brownian coagulation. These results strongly suggest that electrostatic coagulation should be considered in air quality models.
- Article
(7508 KB) - Full-text XML
-
Supplement
(1990 KB) - BibTeX
- EndNote


Changes in the aerosol particle size distribution (PSD) alter aerosol optical properties and deposition behavior. These changes affect atmospheric radiation, cloud droplet activation, and aerosol removal processes (Tegen and Lacis, 1996; Pöschl, 2005). One important driver of PSD evolution is coagulation. Coagulation shifts aerosols toward larger sizes and reduces the total number concentration. Quantifying PSD evolution due to coagulation is essential for assessing atmospheric effects. Aerosol coagulation can be driven by Brownian motion, van der Waals and Coulomb interactions, and hydrodynamic (shear/turbulence-induced) processes. Different mechanisms lead to different coagulation kernels and thus distinct PSD evolution (Seinfeld and Pandis, 2016).
Most widely used coagulation models use Brownian coagulation as the fundamental mechanism and include no explicit charge terms in the coagulation kernel (Lee et al., 2009; Ramnarine et al., 2019; Grell et al., 2005). When aerosols carry charge, Coulomb forces alter aerosol collision and coalescence processes. Oppositely charged aerosols experience Coulomb attraction and collide more frequently, whereas like-charged aerosols experience Coulomb repulsion and collide less often (Harrison and Carslaw, 2003). Experimental and numerical studies show that when aerosols carry large opposite charges or the charge distribution is highly asymmetric, the electrostatic coagulation rate is significantly higher than the Brownian coagulation rate (Adachi et al., 1981). Therefore, using such Brownian models to assess the coagulation of highly charged atmospheric aerosols may introduce bias for charged aerosols. Explicit consideration of Coulomb interactions in the coagulation process is necessary to improve the accuracy of modeled PSD evolution.
Highly charged aerosols are common in the atmosphere, typically including dust aerosols, volcanic ash, sea spray, and urban coarse aerosols (Harrison and Carslaw, 2003; Cimarelli and Genareau, 2022). Dust aerosols with geometric diameters up to 20 µm have an emission of approximately 5000 Tg yr−1 and possess long-range transport capability (Kok et al., 2021). These features produce significant environmental effects by influencing atmospheric radiative forcing and cloud condensation nuclei (CCN) number concentration. Meanwhile, the PSD of dust aerosols strongly influences their radiative properties, CCN concentration, and deposition rate (Tegen and Lacis, 1996; Lee et al., 2009). Thus, dust aerosols are a highly representative system for investigating coagulation processes in highly charged aerosol populations. Quantifying the evolution of the PSD of dust aerosols during coagulation is essential for improving such assessments. Based on physics-based numerical calculations, Mallios et al. (2022) predicted mean net dust aerosol charges of approximately 0.5–2000 e, exceeding those expected under Boltzmann equilibrium. The existence of such charge states suggests that electrostatic interactions may become non-negligible, highlighting the potential importance of electrostatic coagulation in dust aerosol systems (Adachi et al., 1981). The specific differences between electrostatic and Brownian coagulation of dust aerosols in driving the PSD evolution of ambient aerosols in dust-laden environments are not yet well understood.
Techniques for measuring the number of charges carried by individual dust aerosol particles are required to quantify PSD evolution driven by electrostatic coagulation. Such techniques must provide polarity discrimination and size-resolved precision. Existing approaches can be broadly classified into three categories: bulk net-charge measurements (e.g., Faraday-cup or induction electrometry), single-particle trajectory or deflection measurements, and high-precision single-particle instruments based on levitation or trapping (e.g., electrodynamic balance; Zhang and Zhou, 2020; Li et al., 2022). These methods usually deliver only some of the above capabilities – rarely all at once, especially in high-throughput, in situ settings. Obtaining measurements of the number of charges carried by individual dust aerosol particles that are directly applicable to electrostatic coagulation modeling remains a major technical challenge.
The core objective of this study is to quantify the differences between electrostatic and Brownian coagulation of dust aerosols in driving the PSD evolution of ambient aerosols during dust events. To address this objective, we develop a new method to obtain the number of charges carried by individual dust aerosol particles through laboratory measurements and computational inversion, providing inputs that can be directly used for electrostatic coagulation modeling. The measured charges serve as initial conditions for subsequent coagulation simulations, and the method provides a reusable workflow for related research. Based on the comparative simulation results, the role of explicit charge inclusion in coagulation modeling is evaluated.
This section describes the measurements, data processing, and coagulation model. The PSDs and electrical mobility diameter distributions of laboratory-generated dust aerosols were obtained from measurements, while distributions of the number of charges carried by individual dust aerosol particles were derived from measurements and computational inversion. The PSDs of ambient sub-500 nm aerosols were obtained from field measurements, and their charge distributions were obtained through computation. The number concentrations of dust aerosols, with or without ambient sub-500 nm aerosols, were mapped onto a common size-charge matrix and used as model initial conditions. The model simulated Brownian and electrostatic coagulation and updated the aerosol number concentration matrix over time.
2.1 Laboratory dust aerosol generation
2.1.1 Soil samples
This study used eight soil samples to produce laboratory-generated dust aerosols. Two were collected from the Dunhuang dust source area, Gansu Province, China (S1, S2). Three were collected from the Inner Mongolia dust source area (Ulanqab and Hohhot), China (S3–S5). Three were collected from non-dust-source areas in Qingxi Country Park, Shanghai (S6), Fudan University's Jiangwan Campus, Shanghai (S7), and Baoshi Town in Anju District, Suining, Sichuan Province (S8). All samples were passed through a 100 mesh nylon sieve to remove coarse particles and organic debris. Site coordinates and soil texture are listed in Table S1 in the Supplement.
2.1.2 Dust aerosol generator
A dust aerosol generator (SyGAVib) was used to produce laboratory-generated dust aerosols (Qu et al., 2020). The device consists of a cylindrical acrylic chamber, a loudspeaker, and an aluminum cup with an open top. Operating parameters were set following Qu et al. (2020) to generate a stable dust plume. Each experiment used 0.3 g of soil placed in the aluminum cup, with the cup fixed to the loudspeaker diaphragm. The loudspeaker was driven at 100 Hz with medium output power to loosen particles via collisions. Three bottom inlet ports supplied dried and filtered air at a total flow rate of 8 L min−1. The two lower side ports each supplied 3.5 L min−1 of sheath air to provide upward momentum, and the port above the cup delivered air of 1 L min−1 into the cup to simulate turbulence and loft the dust aerosols. To avoid the effect of humidity on Coulomb forces between aerosols (Ma et al., 2023), the plume relative humidity was maintained at 25 %–35 %. A temperature-humidity probe was placed at the top of the chamber. The setup is shown in Fig. S1 in the Supplement. It should be noted that these aerosols are more representative of freshly generated dust aerosols under near-source conditions than of aged atmospheric dust after long-range transport.
2.2 Dust aerosol measurements
2.2.1 Size and electrical mobility distributions
Size distributions of dust aerosols were measured with an Aerodynamic Particle Sizer (APS, TSI Inc. Inlet flow rate: 1 L min−1) over 0.5–20 µm, whereas aerosols <0.5 µm were measured with a Scanning Mobility Particle Sizer (SMPS, TSI Inc. Sampling flow rate: 0.3 L min−1). For consistency, all aerosol sizes were converted to electrical mobility diameter, which more accurately approximates the geometric diameter of non-spherical aerosols. The detailed conversion formula is provided in Eq. (3). Electrical mobility distributions were measured with an SMPS without a neutralizer, covering 1.56 × 10⁻⁹–1.07 × 10⁻⁶ m2 V−1 s−1. The schematic is in Fig. S1.
2.2.2 Measurement of the number of charges carried by individual dust aerosol particles
The experimental setup is shown in Fig. 1. The laboratory-generated dust aerosols were then directed into the Differential Mobility Analyzer (DMA, Models 3080 and 3082, TSI Inc., inlet flow rate: 1 L min−1, sheath flow rate: 10 L min−1) at prescribed electrical mobilities Zp (Table S2), and the aerodynamic diameter of the classified aerosols was measured with an APS. The distribution of the number of charges carried by individual dust aerosol particles was retrieved through joint analysis of the prescribed electrical mobility and the electrical mobility diameter (Dp).
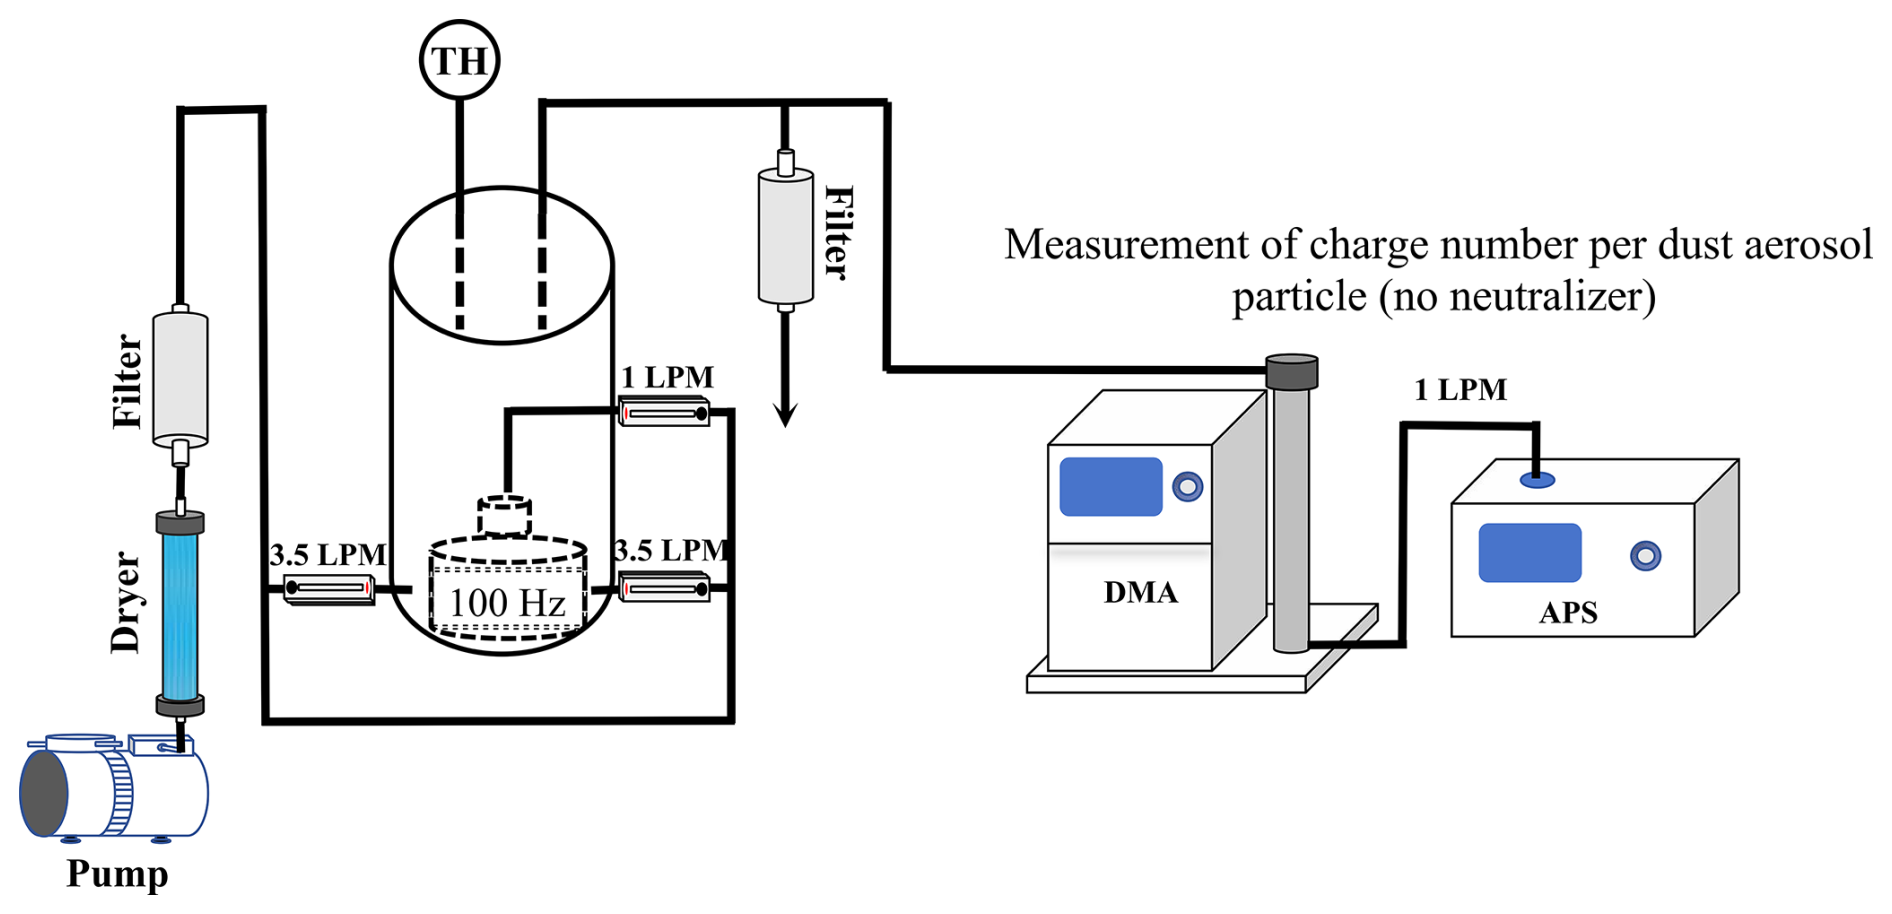
Figure 1Schematic of the experimental workflow for measuring the number of charges carried by individual dust aerosol particles.
Electrical mobility equation:
Zp is the electrical mobility (m2 V−1 s−1), n is the number of charges carried by a particle, e is the elementary charge (1.6 × 10⁻¹⁹ C), π is the circular constant, and μ is the dynamic viscosity of air (1.85 × 10⁻⁵ Pa s at 25 °C), Dp is the electrical mobility diameter (m).
Here, C is the Cunningham slip correction factor and is calculated as (Seinfeld and Pandis, 2016):
D is the aerosol diameter (m), λ is the molecular mean free path ( m).
The aerodynamic diameter was converted to the electrical mobility diameter using the size conversion relationship (Seinfeld and Pandis, 2016):
is derived from the following two equations:
χ is the dynamic shape factor under the experimental conditions (set to 1.0 assuming spherical dust aerosols), Da is the aerodynamic diameter (m), Dve is the volume equivalent diameter (m), ρ0 is the reference density (1 g cm−3), and ρp is the density of dust aerosol particles, taken as 2.65 g cm−3 (Haywood et al., 2003). Missing charge bin concentrations were obtained by linear interpolation along the charge axis.
Under each prescribed electrical mobility condition Zp, the APS provided the PSD () of the DMA-classified dust aerosols for different aerodynamic diameter bins. The aerodynamic diameter Da measured by the APS was converted to the electrical mobility diameter Dp using Eq. (3). For each logarithmic particle-diameter bin (log Dpbin), the corresponding number of charges per particle n was then calculated from Eq. (1) using the prescribed Zp and the converted Dp. Therefore, each prescribed electrical mobility condition produced one aerosol number concentration line in the two-dimensional size-charge space.
For simplicity, the concentration was not jointly normalized over the particle-size and charge dimensions. It was expressed as , rather than as a combined two-dimensional concentration form such as or . Each value was assigned to the corresponding calculated charge number n. The full two-dimensional size-charge distribution was reconstructed from multiple measured lines obtained under different prescribed electrical mobility conditions, and the bins not directly covered by these measured lines were filled by linear interpolation between adjacent lines.
The interpolation uncertainty is mainly associated with the high-charge tail, where aerosol number concentrations are inherently low and therefore more sensitive to data-processing methods. However, the prescribed electrical mobility range in this study is relatively broad and still includes measured points in the high-charge tail. Therefore, the uncertainty associated with the high-charge tail is expected to have a limited influence on the reconstructed size–charge distribution.
It should also be noted that a dynamic shape factor of χ=1 was assumed in the conversion from aerodynamic diameter to electrical mobility diameter as a simplifying assumption. Since irregular mineral dust aerosols typically have χ>1, this assumption may shift the particle size range associated with highly charged aerosols, while this assumption affects the converted particle size, but does not change the measured charge characteristics. This uncertainty does not affect the qualitative comparison between the two cases, because both cases start from the same initial PSD and therefore share the same underlying Brownian coagulation pathway, with the only difference being whether electrostatic interactions are included.
In addition, the finite DMA mobility selection range may introduce a small bias toward higher inferred charge states for large aerosols. This is because aerosols with large diameters and only a few charges may fall below the lower DMA mobility selection limit and therefore cannot be fully selected. According to the electrical mobility definition equation, the lower DMA mobility selection limit used in this study, m2 V−1 s−1, corresponds to a minimum required charge of only ∼ 5 e for aerosols with diameters of ∼ 1 µm, ∼ 10 e for ∼ 2 µm, and ∼ 35 e even near the upper end of the measured size range (∼ 7 µm). Importantly, ∼ 59 % of the total dust aerosol number concentration is distributed within the 1–2 µm size range, where the lower DMA mobility boundary corresponds to only ∼ 5–10 e. However, the mean charge level of dust aerosols in this dominant 1–2 µm size range is still on the order of 102 e, much higher than the lower-boundary charge values.
The number fraction of dust aerosols outside the lower DMA mobility limit was estimated on a particle size bin basis. For each particle size bin, the charge value corresponding to the lower DMA mobility boundary was first calculated based on the electrical mobility definition equation. The number concentration below this boundary was then estimated from the fitted charge distribution for that particle size bin. Specifically, the charge distribution in each particle size bin was empirically fitted using a Gaussian-shaped function in ln (n) space:
where n is the number of charges per particle, Dp is the particle diameter of a given size bin, is the number concentration at charge state n for particles with diameter Dp, and , , and are empirical fitting parameters obtained separately for each particle size bin. Based on this particle size bin based estimation, only ∼ 0.6 % of the dust aerosols in this study are estimated to fall below the lower DMA mobility limit. Therefore, under the present operating conditions, the dust aerosols considered in this study would generally remain above the lower DMA mobility selection limit.
A custom charged particle remover (CPR) operated at 3.5 kV was used to determine the neutral fraction of dust aerosols (Zhang et al., 2023). The CPR consists of two coaxially aligned stainless-steel tubes that create a radial electric field, which removes charged aerosols and allows only neutral aerosols to pass through unaffected (design and operation details in Fig. S2).
2.3 Ambient sub-500 nm aerosol size distribution measurement and charge calculation
The PSD of representative ambient sub-500 nm aerosols was determined from measurements collected during periods without dust events at the seventh floor of the Environmental Science Building, Jiangwan Campus of Fudan University, Shanghai, China, on 30 September 2024. The detailed geographic coordinates of the measurement site are provided in Table S3. Given that ultrafine aerosols (<100 nm) in urban environments typically contribute the majority of the total number concentration (>80 %) (Kumar et al., 2014; Morawska et al., 2008), and that the WMO Global Atmosphere Watch (GAW) multi-site analysis also used the 10–500 nm size range to represent total number concentration (Rose et al., 2021), the electrical mobility diameter distribution of ambient sub-500 nm aerosols was measured with an SMPS over 14–500 nm. The measurement setup is shown in Fig. S4. Assuming a natural bipolar ion background (Tigges et al., 2015), aerosol charge states were assumed near Boltzmann equilibrium. The charge distribution for each size bin was computed from the measured size distribution using the Boltzmann formulation (Liu and Pui, 1974; Table S4).
2.4 Coagulation modeling
2.4.1 Input matrix construction
In the coagulation model, aerosol number concentrations are represented on a unified matrix in size and charge. Dust aerosol model inputs were derived from three Inner Mongolia soil samples. Given that Mongolia accounted for more than 42 % of dust concentrations in northern China during March–April 2023 (Chen et al., 2023) and shares a dust source belt and similar emission and transport pathways with Inner Mongolia (Mu and Fiedler, 2025), dust aerosols generated from Inner Mongolia soils are representative. The dataset was discretized on a two-dimensional size-charge matrix, defined by electrical mobility diameter Dp (Table S5) and charge number , where z represents the number of elementary charges carried by a particle. The size matrix comprised 131 logarithmically spaced bins from 14.1 nm to 7 µm. This yielded three number concentration matrices Nk (Dp,z) for k=1, 2, 3. Each Nk was normalized to a joint probability density matrix:
and the representative joint probability density function was obtained by taking the element-wise arithmetic mean:
Following Chen et al. (2023), the dust aerosol number concentration of ∼ 300 # cm−3 (∼ 3 mg m−3) observed in Beijing during transport from Mongolia was mapped onto the matrix according to the above representative joint probability density matrix, yielding a representative number concentration matrix of dust aerosols. This matrix was combined with the ambient sub-500 nm aerosol matrix, or used alone, to form the initial mixed field that served as the model input. For sensitivity analysis under dust-only conditions, additional simulations were performed with initial dust aerosol number concentrations of 50, 100, 200, 300, 500, and 1000 # cm−3 (Fig. 5). This range of concentrations was used to evaluate model stability under varying initial conditions and to examine the concentration dependence of electrostatic coagulation.
2.4.2 Brownian coagulation
Under Brownian coagulation, the generation and loss terms are computed on the size matrix for each size bin, following Zebel (1958) and Oron and Seinfeld (1989):
N is the aerosol number concentration in a size bin (# cm−3), and are the aerosol diameters (m), denotes the representative size of aerosols colliding with Dp (m), and βB is the Brownian coagulation kernel (m3 s−1), calculated using the Fuchs (1964) formulation at 25 °C.
The Brownian coagulation kernel is given by:
where:
Dpi is the aerosol diameter (m), k is the Boltzmann constant (1.380649 × 10⁻²³ J K−1), T is the temperature (298.15 K), and mi is the aerosol mass (kg).
Coagulation satisfies volume conservation:
At each time step a pairwise collision rate matrix is formed. Columns correspond to the size bins being depleted and rows correspond to the pairing size bins that collide with them. The total coagulation rate for a given size bin is obtained by summing all elements in its column. The remaining number concentration in the size bin Dp after one time step is:
The time step Δt was 1 s for 0–100 s, 10 s for 100–1000 s, and 100 s for 1000–10 000 s.
For the formation term, the upper-triangular part of the rate matrix was used to avoid double counting. For each pair in the upper triangle of the pairwise collision rate matrix, the equivalent product size was computed from volume conservation and mapped to the nearest discrete size bin. The number of newly formed aerosols was then added to the corresponding product bin. After traversing the upper triangle, the formation term for each size bin was obtained. The field N(Dp) was updated by adding the formation matrix to the remaining concentration matrix.
2.4.3 Electrostatic coagulation
Electrostatic coagulation was modeled using the Brownian framework with a Coulomb correction applied to the coagulation kernel:
βE is the electrostatic coagulation kernel (m3 s−1), derived from the Brownian kernel with a Coulomb interaction correction. In this study, all parameters were set to 25 °C. z′ denotes particles with charge number smaller than z, and z* denotes the representative charge of aerosols colliding with z.
The electrostatic coagulation kernel is given by (Brownian kernel with Coulomb correction):
zi is the aerosol charge number, e is the elementary charge (1.60217662 × 10⁻¹⁹ C), ε0ε is the dielectric permittivity of air (8.854737 × 10⁻¹² F m−1), and Rpi is the aerosol effective radius (m).
Simulating electrostatic coagulation requires accounting for atmospheric ions. Dust aerosols are typically transported at altitudes of ∼ 2–5 km, where they are influenced by cosmic-ray ionization (Kok et al., 2021; Xie et al., 2022). The initial ion number concentration is 440 # cm−3 and the ion production rate is 2 # cm−3 s−1 (Tammet et al., 2006; Israel, 1970, 1973; Hoppel et al., 1986a). At each time step, the ion balance and aerosol charging are updated first and coagulation is then applied.
The pairwise collision rate matrix in electrostatic coagulation is indexed by paired size and charge (Dp,z). As in Brownian coagulation, the loss for any source cell is obtained by summing the column of the pairwise collision rate matrix corresponding to that cell. The formation term differs in that the product is indexed by both size and charge. The size of newly formed aerosols is computed from volume conservation and mapped to the nearest discrete size bin. The charge of newly formed aerosols is computed from charge conservation and assigned to the corresponding integer charge bin. The resulting size and charge indices are then used to add the newly formed aerosols to the corresponding matrix cell.
It should be noted that certain features of the coagulation model may introduce slight biases. The calculation of the size of the product aerosol follows volume conservation and the computed size may deviate from the true volume-equivalent diameter because aerosols are not ideal spheres. Moreover, although a relatively fine size discretization is adopted, binning still introduces errors, which are more apparent when the size difference between dust aerosols and ambient sub-500 nm aerosols is large. Coagulation products are often binned near the size of the larger precursor aerosol. This underestimates the contribution of small aerosols, causes a numerical loss of total aerosol volume, and subtly shifts the PSD toward smaller sizes.
3.1 Size and charge characteristics of laboratory-generated dust aerosols
This study used a DMA–APS measurement system combined with inversion of the electrical mobility equation to obtain size-resolved distributions of the number of charges carried by individual dust aerosol particles. The experimental setup is shown in Fig. 1. These measurements provide the basis for subsequent size–charge coupled analyses and coagulation simulations, and enable a standardized workflow for in situ measurement of charged dust aerosols.
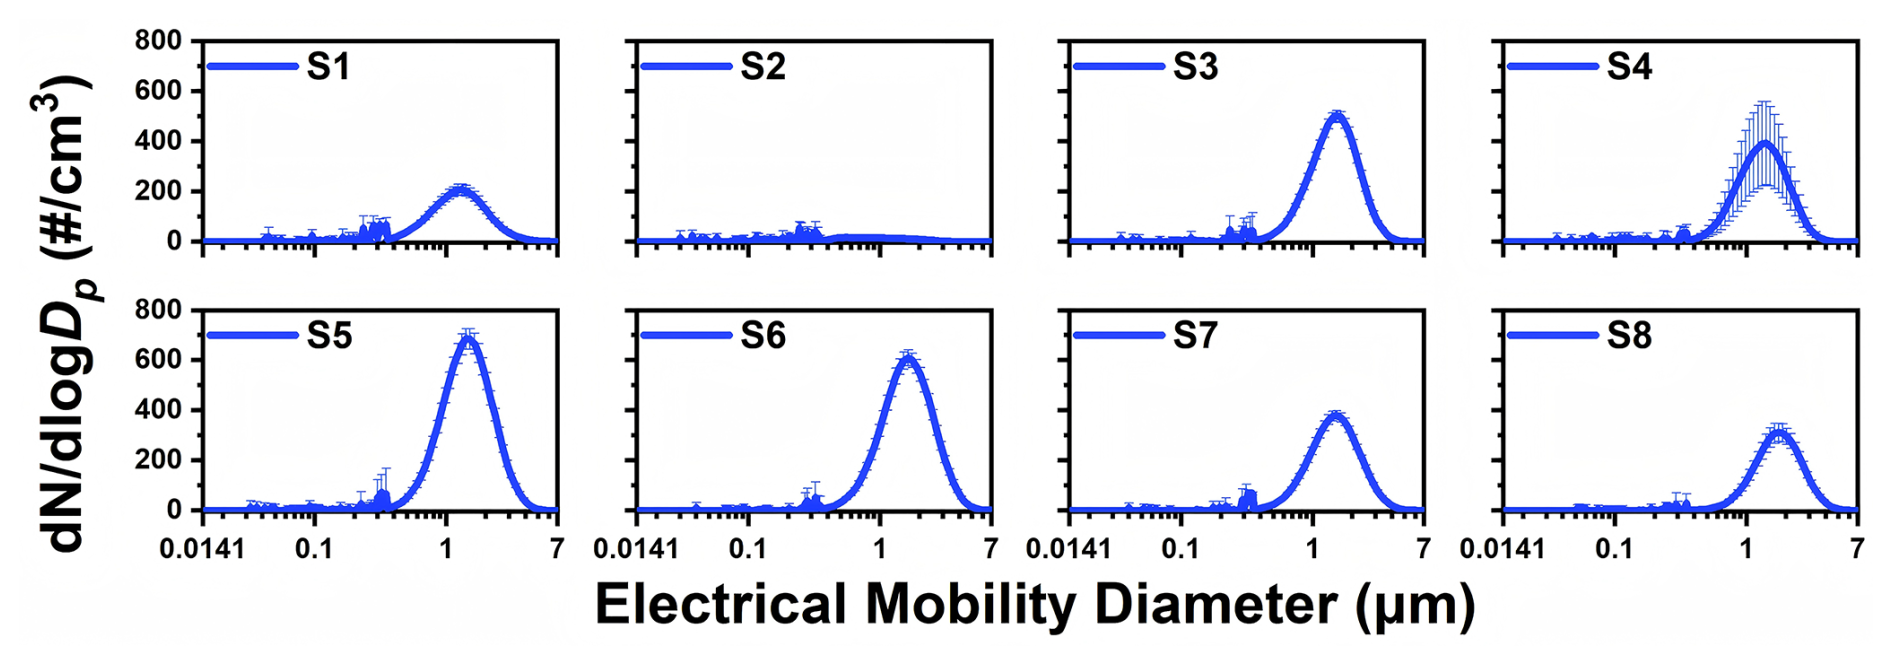
The laboratory-generated dust aerosols are shown to be representative of real atmospheric dust (Shao and Mao, 2016). Figure 2 shows that the peak diameters of the eight dust aerosol samples fall within 1–3 µm, consistent with long-range transported atmospheric dust aerosols (Maring et al., 2003). This size distribution also agrees well with field APS measurements of transported dust in Yinchuan, China, further supporting the atmospheric representativeness of the laboratory-generated aerosols (Shao and Mao, 2016). Investigating coagulation within this size range therefore provides greater atmospheric relevance.
The data in Fig. 3 indicate that the charge distribution of the laboratory-generated dust aerosols spans a range of ∼ 10–1000 e, with a peak at ∼100 e. These values are much higher than those at the bipolar Boltzmann equilibrium. The distributions are nearly symmetric between positive and negative charges, indicating no pronounced polarity preference. This near-symmetric bipolar character is further supported by the nearly identical positive and negative electrical mobility distributions in Fig. S5. These measurements directly resolve the size-dependent charge distribution of individual dust aerosols, providing observational constraints that are typically unavailable in coagulation studies. This nonequilibrium bipolar charge distribution enhances Coulomb interactions and consequently leads to a higher coagulation rate (Adachi et al., 1981).
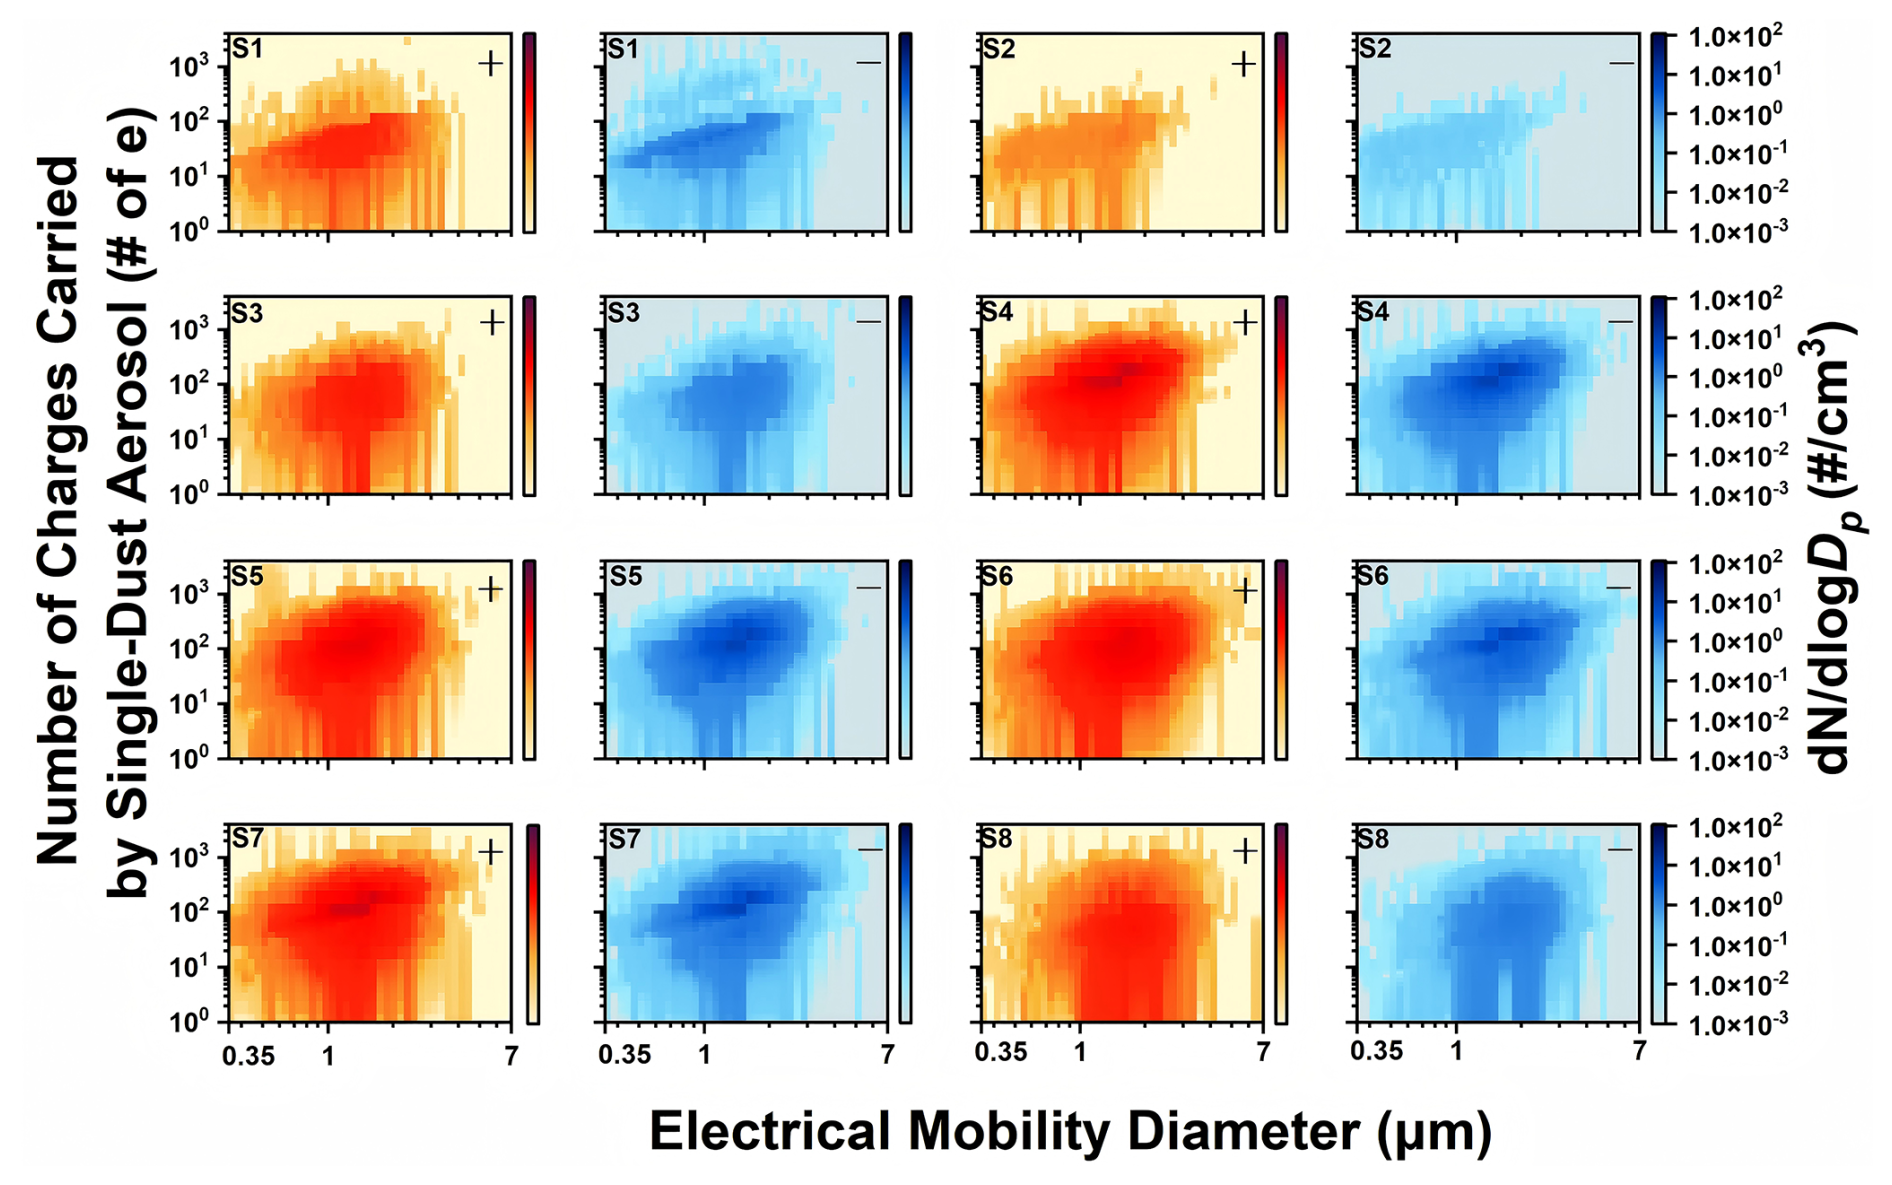
Figure 3Maps of the joint distribution of number of charges carried by single-dust aerosol and electrical mobility diameter for dust aerosol samples S1–S8. The x axis is electrical mobility diameter on a logarithmic scale from 0.35–7 µm. The y axis is the number of elementary charges per aerosol on a logarithmic scale from 1–4000 e. Color encodes number concentration on a logarithmic scale from 10−3–102 # cm−3. Red indicates positively charged aerosols and blue indicates negatively charged aerosols.
3.2 PSD evolution of dust aerosols in dust-only scenario under Brownian and electrostatic coagulation
The PSD evolution under electrostatic coagulation of dust aerosols differs significantly from that under Brownian coagulation. The size-charge number concentration matrix of dust aerosols was used as the model input, with an initial total number concentration of 300 # cm−3. This value was chosen to represent a characteristic peak in dust number concentrations commonly observed under non-extreme dust conditions in northern China, based on long-term measurements in Beijing and nearby regions (Chen et al., 2023). The choice of dust aerosol number concentration is described in Methods Sect. 2.4.1.
The PSD evolution under Brownian and electrostatic coagulation from 0 to 10 000 s was then simulated, as shown in Fig. 4. From 0 to 10 000 s, the PSD is essentially unchanged under Brownian coagulation (Fig. 4a), whereas under electrostatic coagulation the peak diameter shifts from ∼ 0.9 to 1.5 µm and the peak number concentration falls from ∼ 700 to 250 # cm−3 (Fig. 4b). These results show that dust aerosols change the PSD on hourly timescales through electrostatic coagulation. Therefore, calculations of coagulation processes involving highly charged aerosols should explicitly account for the influence of Coulomb forces.
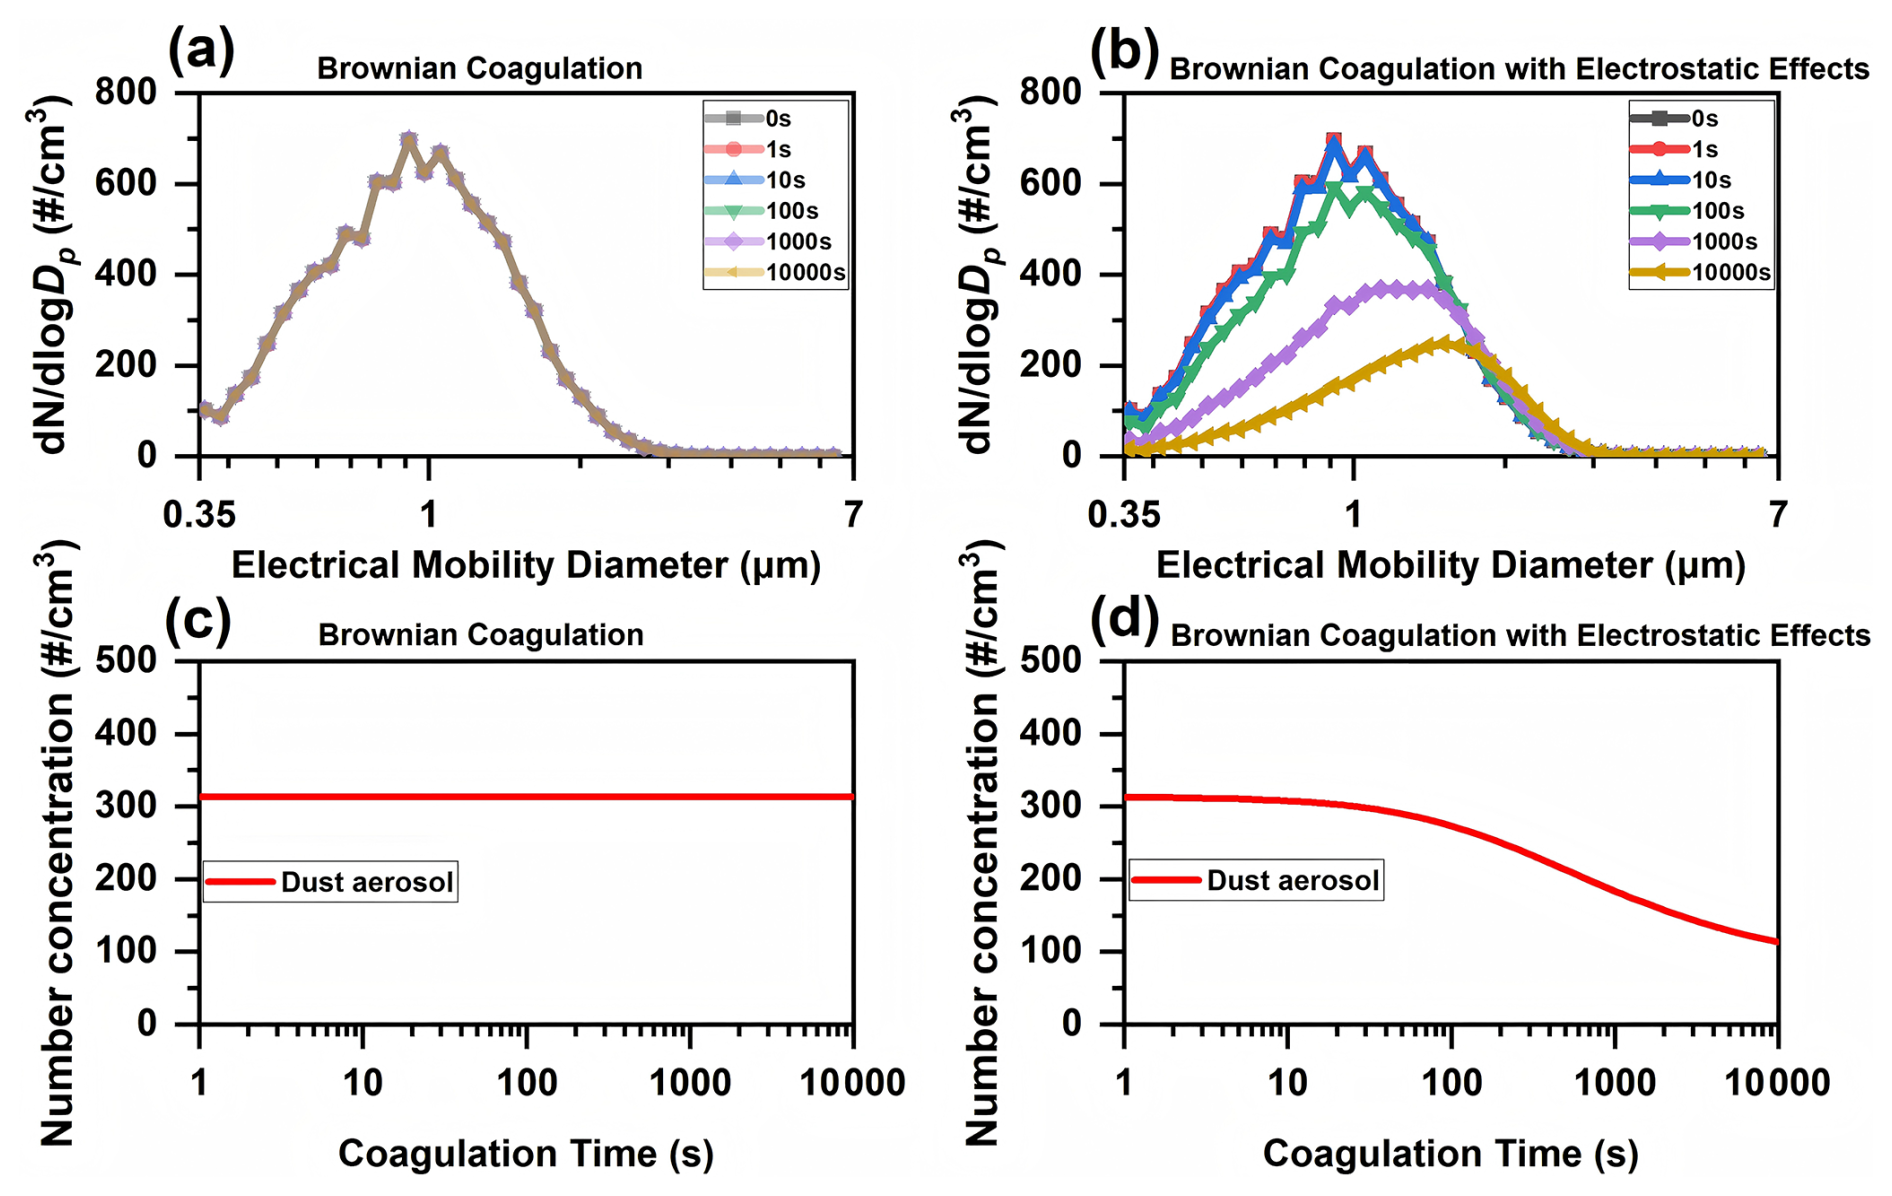
Figure 4Temporal evolution of the PSD and total number concentration for dust aerosols (dust-only with an initial concentration at 300 # cm−3), simulated at 25 °C. (a) Dust aerosols' PSD under Brownian coagulation, remaining essentially unchanged. (b) Dust aerosols' PSD under electrostatic coagulation. (c) Total aerosol number concentration under Brownian coagulation. (d) Same as (c), but for electrostatic coagulation.
In addition, sensitivity tests of dust-only electrostatic coagulation with initial dust aerosol number concentrations from 50 to 1000 # cm−3 (Fig. 5) show that the qualitative features of PSD evolution remain consistent across this concentration range. The simulations further show that higher initial dust aerosol number concentrations experience a stronger decrease in the PSD peak over 0–10 000 s. This behavior is consistent with coagulation kinetics, where the collision frequency scales with the square of the number concentration (; Seinfeld and Pandis, 2016). This effect is likely to occur in dense dust plumes or severe dust-storm events in the real atmosphere.
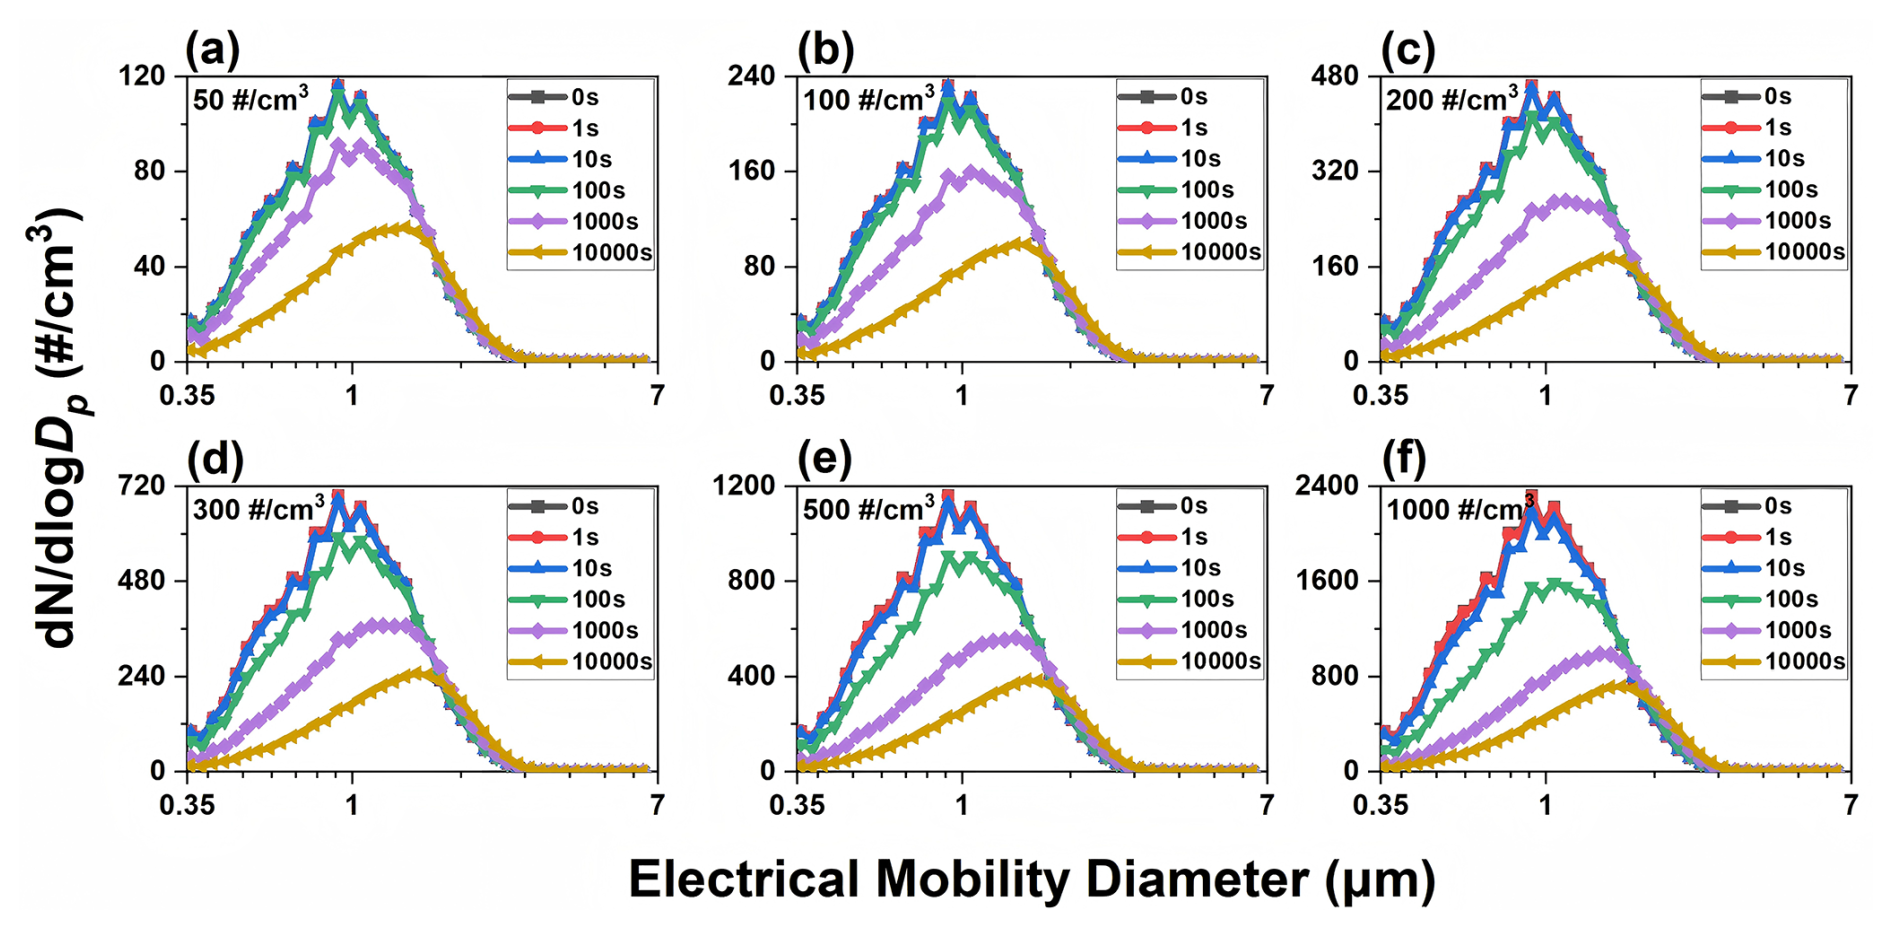
Figure 5Temporal evolution of the PSD due to electrostatic coagulation under dust-only conditions at different initial number concentrations at 25 °C. (a) 50 # cm−3; (b) 100 # cm−3; (c) 200 # cm−3; (d) 300 # cm−3; (e) 500 # cm−3; (f) 1000 # cm−3. The corresponding temporal evolution of aerosol charge distributions is shown in Figs. S6–S11.
The dust aerosols used in this study are more representative of freshly generated dust aerosols. As coagulation and related processes proceed during atmospheric transport, the charge states of dust aerosols are generally expected to decrease. Therefore, the PSD evolution trend shown here is more representative of dust source regions and near-source conditions. However, in real atmospheric transport, dust plumes may continuously mix with newly emitted or entrained aerosols that retain relatively high initial charges. Such continuous input could delay charge decay and sustain stronger electrostatic coagulation over a longer timescale, thereby affecting PSD evolution during transport. The above discussion suggests that the transition from freshly generated, highly charged dust to more aged and weakly charged dust during atmospheric transport deserves more explicit consideration in future modeling studies.
3.3 PSD evolution of ambient aerosols containing a dust fraction of 300 particles cm−3 under Brownian and electrostatic coagulation
This section examines the PSD evolution of ambient aerosols containing a dust fraction of 300 # cm−3 under Brownian and electrostatic coagulation using a mixed aerosol system. The model input consisted of the PSD and charge information for (1) ambient sub-500 nm aerosols assuming a Boltzmann-equilibrium charge distribution, and (2) dust aerosols with a total number concentration of 300 # cm−3. These inputs were used to simulate PSD evolution under Brownian and electrostatic coagulation from 0 to 10 000 s. Comparison with a dust-only scenario indicates that dust PSD evolution remains essentially unchanged under both Brownian and electrostatic coagulation over 0–10 000 s in the mixed system (Figs. 4 and 6).
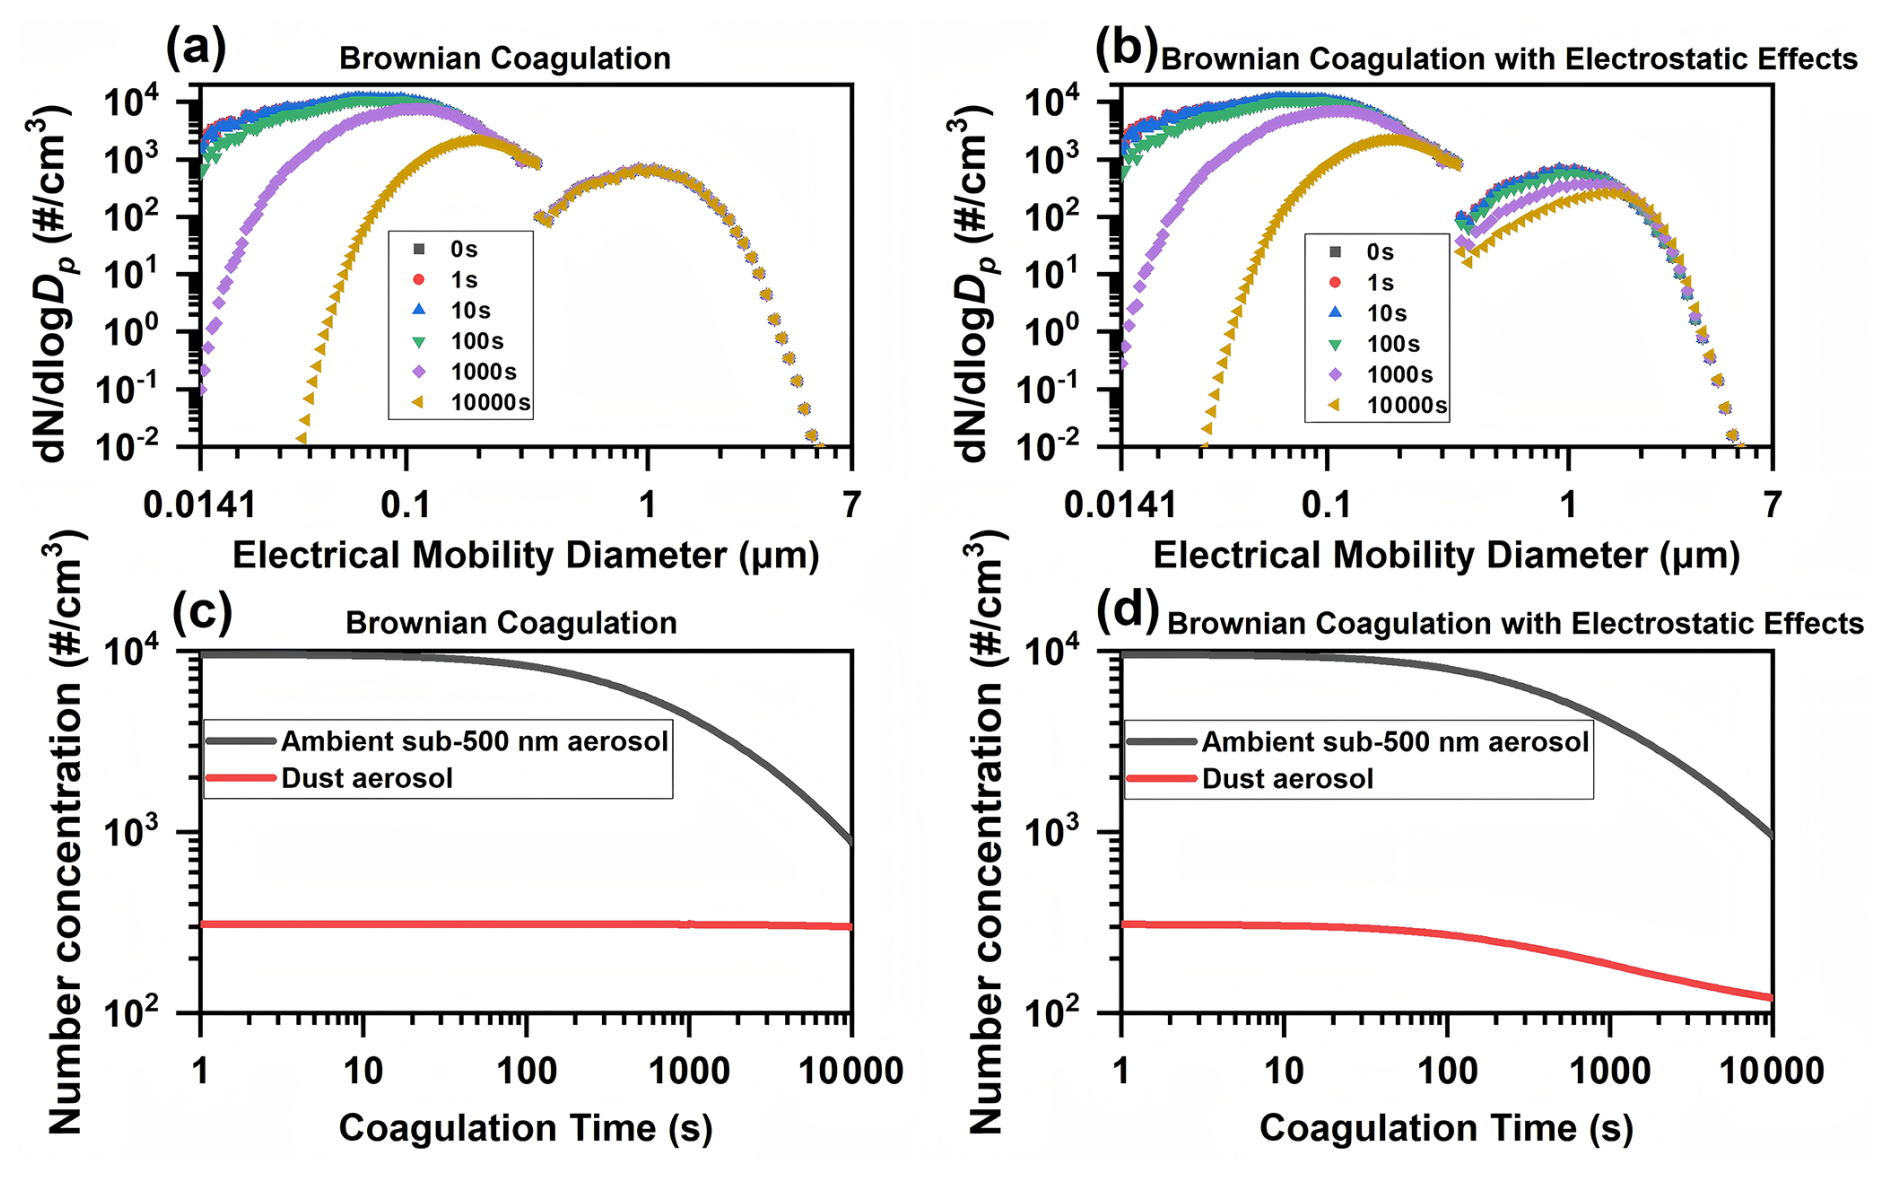
Figure 6Temporal evolution of the PSD and total number concentration of ambient aerosols, containing a dust aerosol fraction of 300 # cm−3, simulated at 25 °C. (a) PSD of ambient aerosols under Brownian coagulation, with the dust fraction primarily concentrated in the size range greater than 0.5 µm. Curves correspond to the times indicated in the legend. (b) PSD of ambient aerosols under electrostatic coagulation. (c) Temporal evolution of total number concentrations of ambient sub-500 nm aerosols and dust aerosols under Brownian coagulation. (d) Same as (c), but for electrostatic coagulation.
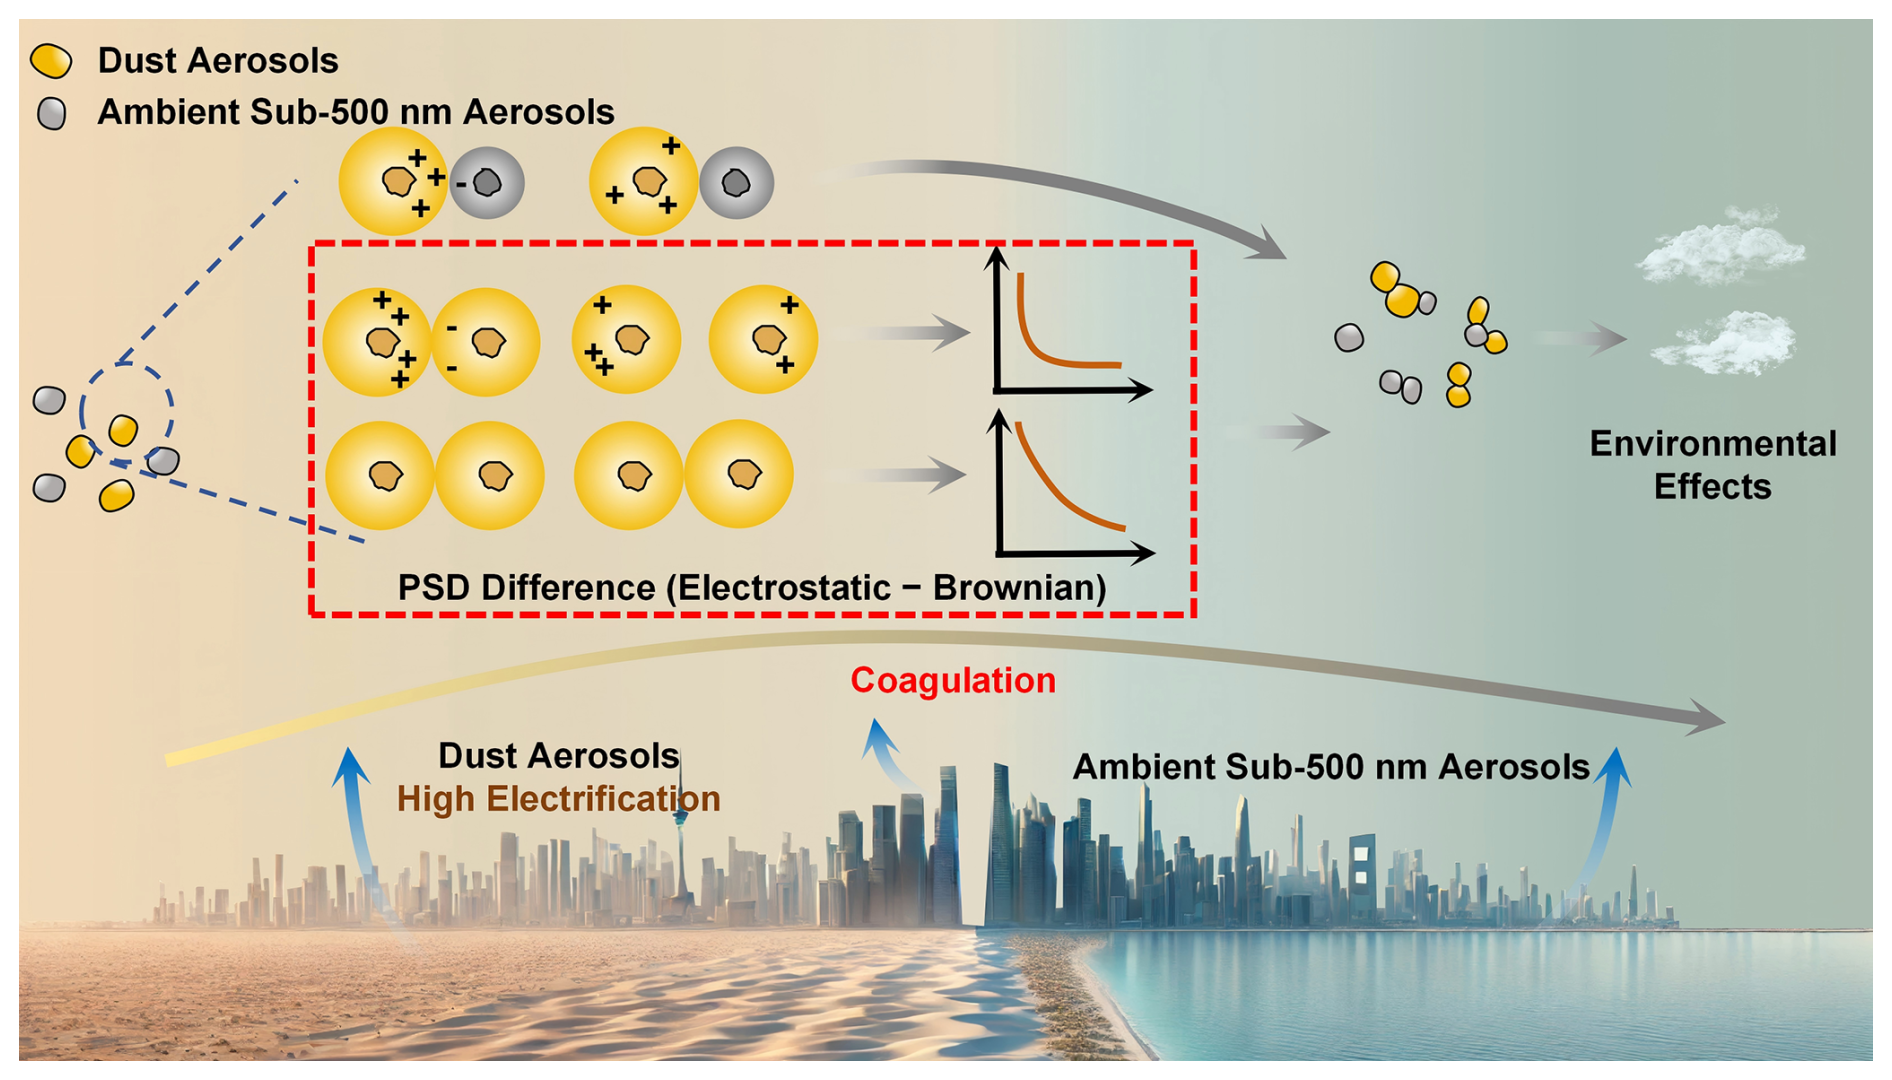
Figure 7Conceptual schematic illustrating the contrasting PSD evolution under electrostatic and Brownian coagulation. The nonequilibrium bipolar high-charge state of dust aerosols enhances the effective coagulation rate via Coulomb interactions, accelerating PSD evolution and number concentration decay. Highly charged dust aerosols also modestly accelerate coagulation among ambient sub-500 nm aerosols.
The difference between the PSD evolution of ambient sub-500 nm aerosols under electrostatic and Brownian coagulation in a mixed system containing a dust fraction of 300 # cm−3 is modest but noticeable. As shown in Fig. 6, under Brownian coagulation the peak number concentrations at 100 and 1000 s are ∼ 11 000 and 7700 # cm−3, corresponding to diameters of 71 and 113 nm, whereas under the electrostatic coagulation at the same times the peak number concentrations are ∼ 10 700 and 7100 # cm−3, with the peak diameter unchanged. These changes in peak number concentration show a maximum difference of ∼ 10 %, indicating that dust aerosols exert only a modest but noticeable influence on the PSD of ambient sub-500 nm aerosols. Although the magnitude of this difference is modest compared with the much larger PSD changes of highly charged dust aerosols, the ∼ 10 % difference indicates that electrostatic interactions affect the evolution of ambient sub-500 nm aerosols. This effect is environmentally relevant because these aerosols are closely related to aerosol radiative effects and CCN number concentrations. At the same time, it should still be regarded as a secondary effect, as it is much smaller than the PSD changes observed for highly charged dust aerosols themselves.
The rate of electrostatic coagulation between dust aerosols and ambient sub-500 nm aerosols first increases and then decreases on hourly timescales. Specifically, during the early stage of electrostatic coagulation, the number concentration of ambient sub-500 nm aerosols declines markedly faster than under Brownian coagulation. However, by 10 000 s, the peak number concentration under electrostatic coagulation is even slightly higher than under Brownian coagulation (Fig. 6a, b). Mechanistically, high initial dust aerosol concentration increases collision frequency, and high charge enhances Coulomb interactions, which together accelerate coagulation within dust and with ambient sub-500 nm aerosols. As time progresses, dust aerosol concentration and charge decrease (Fig. S9), thus reducing electrostatic coagulation with ambient sub-500 nm aerosols. This indicates that the electrostatic enhancement of coagulation between dust aerosols and ambient sub-500 nm aerosols is strongly time-dependent and gradually diminishes during long-range transport.
It should be noted that, in the mixed aerosol system, the numerical mass loss is more pronounced for coagulation between dust aerosols and ambient sub-500 nm aerosols because of their large size difference. This mass loss mainly arises from the representation of a physically continuous increase in aerosol volume, and thus equivalent diameter, using discrete size bins in the sectional coagulation model. When a dust aerosol coagulates with a much smaller ambient sub-500 nm aerosol, the equivalent-volume diameter of the coagulation product may increase only slightly and may still remain within the original dust aerosol size bin rather than entering the next larger bin. For example, when a 1.085 µm dust aerosol coagulates with a 21.7 nm ambient sub-500 nm aerosol, the equivalent-volume diameter of the coagulation product is only approximately 1.085003 µm, which is still below the next larger size bin of 1.166 µm. Therefore, the coagulation product remains assigned to the original 1.085 µm dust aerosol size bin, and the small increase in aerosol volume is not fully reflected as a rightward shift of the dust aerosol PSD. Assuming constant aerosol density and the cubic relationship between aerosol mass and aerosol diameter, a ∼ 10 %–20 % mass loss corresponds to only a ∼ 3 %–7 % equivalent-diameter difference because aerosol mass scales with the cube of aerosol diameter. Thus, this numerical uncertainty mainly affects the quantitative magnitude of the dust aerosol PSD shift, but is unlikely to alter the qualitative differences in PSD evolution between Brownian coagulation and electrostatic coagulation in the mixed aerosol system.
To summarize these processes, Fig. 7 provides a conceptual comparison of the two coagulation mechanisms. Enhanced Coulomb interactions among highly charged dust aerosols promote faster coagulation and accelerate number concentration decay, while interactions with ambient sub-500 nm aerosols produce smaller but still observable PSD changes. These results indicate that electrostatic effects may play an important role in shaping aerosol size distributions and their atmospheric impacts.
Air quality models usually omit the charge term in the coagulation kernel, thereby neglecting Coulomb interactions during collisions of charged aerosols. In this study, a dedicated DMA–APS configuration is used to retrieve size-resolved distributions of the number of charges carried by individual dust aerosol particles, providing key inputs resolved by particle size and charge number to the coagulation model. For a dust-only scenario at typical environmental concentrations (300 # cm−3), over 0–10 000 s the PSD remains essentially unchanged under Brownian coagulation, whereas under electrostatic coagulation the peak diameter shifts from ∼ 0.9 to 1.5 µm and the peak number concentration decreases by ∼ 64 %, demonstrating that the PSD evolution of dust aerosols on hourly timescales clearly differs between Brownian and electrostatic coagulation. These results demonstrate that Coulomb interactions can substantially influence the coagulation of highly charged aerosols and must therefore be included explicitly in the coagulation kernel.
Given that dust aerosols in the atmosphere mix with abundant ambient sub-500 nm aerosols, it is necessary to quantify how highly charged dust aerosols modify the PSD evolution of ambient aerosols under Brownian versus electrostatic coagulation. When ambient sub-500 nm aerosols are introduced, dust PSD evolution shows no detectable change relative to the dust-only scenario under both Brownian and electrostatic coagulation. Electrostatic coagulation by dust aerosols exerts modest but measurable effects on ambient sub-500 nm aerosols, leading to ∼ 10 % differences in peak number concentration relative to Brownian coagulation.
Overall, PSD evolution under electrostatic coagulation differs from Brownian coagulation and exhibits pronounced temporal and spatial dependence in systems containing highly charged aerosols. These results indicate that assessments of radiative effects, cloud droplet formation and aerosol deposition should explicitly account for aerosol charge, particularly for highly charged aerosol populations.
All data supporting the findings are archived at Mendeley Data (https://doi.org/10.17632/n8ys5rzcty.1, Quan, 2026). The MATLAB analysis and simulation code and configuration files are included in the same Mendeley Data record. Any additional information is provided in the Supplement.
The supplement related to this article is available online at https://doi.org/10.5194/acp-26-8753-2026-supplement.
XW conceptualized the study, supervised the project, provided scientific guidance, and led the writing and revision of the manuscript. XL revised and edited the manuscript. LQ conducted the experiments, processed the data, developed the numerical model, and wrote the manuscript. RZ contributed to the construction of the experimental setup, data processing, and the preliminary development of the model framework. All other co-authors participated in the experiments and contributed to the discussion and revision of the manuscript.
The contact author has declared that none of the authors has any competing interests.
Publisher's note: Copernicus Publications remains neutral with regard to jurisdictional claims made in the text, published maps, institutional affiliations, or any other geographical representation in this paper. The authors bear the ultimate responsibility for providing appropriate place names. Views expressed in the text are those of the authors and do not necessarily reflect the views of the publisher.
We thank R. Losno for sharing the SyGAVib design details.
This work was supported by the National Natural Science Foundation of China (grant no. 42377090) and the Shanghai Natural Science Foundation (grant no. 23ZR1479700).
This paper was edited by Mingyi Wang and reviewed by two anonymous referees.
Adachi, M., Okuyama, K., and Kousaka, Y.: Electrostatic coagulation of bipolarly charged aerosol particles, J. Chem. Eng. Jpn., 14, 467–473, https://doi.org/10.1252/JCEJ.14.467, 1981.
Chen, S., Zhao, D., Huang, J., He, J., Chen, Y., Chen, J., Bi, H., Lou, G., Du, S., Zhang, Y., and Yang, F.: Mongolia contributed more than 42 % of the dust concentrations in northern China in March and April 2023, Adv. Atmos. Sci., 40, 1549–1557, https://doi.org/10.1007/s00376-023-3062-1, 2023.
Cimarelli, C. and Genareau, K.: A review of volcanic electrification of the atmosphere and volcanic lightning, J. Volcanol. Geoth. Res., 422, 107449, https://doi.org/10.1016/j.jvolgeores.2021.107449, 2022.
Fuchs, N. A.: The Mechanics of Aerosols, Pergamon Press, Oxford, 1964.
Grell, G. A., Peckham, S. E., Schmitz, R., McKeen, S. A., Frost, G., Skamarock, W. C., and Eder, B.: Fully coupled “online” chemistry within the WRF model, Atmos. Environ., 39, 6957–6975, https://doi.org/10.1016/j.atmosenv.2005.04.027, 2005.
Harrison, R. G. and Carslaw, K. S.: Ion–aerosol–cloud processes in the lower atmosphere, Rev. Geophys., 41, 1012, https://doi.org/10.1029/2002RG000114, 2003.
Haywood, J. M., Francis, P. N., Osborne, S. R., Glew, M. D., Loeb, N., Highwood, E. J., Tanré, D., Myhre, G., Formenti, P., and Hirst, E.: Radiative properties and direct radiative effect of Saharan dust measured by the C-130 aircraft during SHADE: 1. Solar spectrum, J. Geophys. Res.-Atmos., 108, 8577, https://doi.org/10.1029/2002JD002687, 2003.
Hoppel, W. A., Anderson, R. V., and Willett, J. C.: Atmospheric electricity in the planetary boundary layer, in: The Earth's Electrical Environment, 149–165, National Academy Press, Washington, D.C., https://doi.org/10.17226/898, 1986a.
Israel, H.: Atmospheric Electricity, Vol. 1, Israel Program for Scientific Translations, Jerusalem, distributed by the National Science Foundation, Washington, D.C., ISBN 978-0-7065-0517-7, 1970.
Israel, H.: Atmospheric Electricity, Vol. 2, Israel Program for Scientific Translations, Jerusalem, National Science Foundation, Washington, D.C., ISBN 978-0-7065-1129-1, 1973.
Kok, J. F., Adebiyi, A. A., Albani, S., Balkanski, Y., Checa-Garcia, R., Chin, M., Colarco, P. R., Hamilton, D. S., Huang, Y., Ito, A., Klose, M., Leung, D. M., Li, L., Mahowald, N. M., Miller, R. L., Obiso, V., Pérez García-Pando, C., Rocha-Lima, A., Wan, J. S., and Whicker, C. A.: Improved representation of the global dust cycle using observational constraints on dust properties and abundance, Atmos. Chem. Phys., 21, 8127–8167, https://doi.org/10.5194/acp-21-8127-2021, 2021.
Kumar, P., Morawska, L., Birmili, W., Paasonen, P., Hu, M., Kulmala, M., Harrison, R. M., Norford, L., and Britter, R.: Ultrafine particles in cities, Environ. Int., 66, 1–10, https://doi.org/10.1016/j.envint.2014.01.013, 2014.
Lee, Y. H., Chen, K., and Adams, P. J.: Development of a global model of mineral dust aerosol microphysics, Atmos. Chem. Phys., 9, 2441–2458, https://doi.org/10.5194/acp-9-2441-2009, 2009.
Li, Y., Chen, X., and Jiang, J.: Measuring size distributions of atmospheric aerosols using natural air ions, Aerosol Sci. Tech., 56, 655–664, https://doi.org/10.1080/02786826.2022.2060795, 2022.
Liu, B. Y. H. and Pui, D. Y. H.: Equilibrium bipolar charge distribution of aerosols, J. Colloid Interf. Sci., 49, 305–312, https://doi.org/10.1016/0021-9797(74)90366-X, 1974.
Ma, X., Gao, Q., Jiang, X., Chen, S., Gan, Y., Zhang, T., Lu, X., and Wang, X.: Direct effects of air humidity on dust aerosol production: Evidence for the surprising role of electrostatic forces, Geophys. Res. Lett., 50, e2023GL103639, https://doi.org/10.1029/2023GL103639, 2023.
Mallios, S. A., Daskalopoulou, V., and Amiridis, V.: Modeling of the electrical interaction between desert dust particles and the Earth's atmosphere, J. Aerosol Sci., 165, 106044, https://doi.org/10.1016/j.jaerosci.2022.106044, 2022.
Maring, H., Savoie, D. L., Izaguirre, M. A., Custals, L., and Reid, J. S.: Mineral dust aerosol size distribution change during atmospheric transport, J. Geophys. Res.-Atmos., 108, 8592, https://doi.org/10.1029/2002JD002536, 2003.
Morawska, L., Ristovski, Z., Jayaratne, E. R., Keogh, D. U., and Ling, X.: Ambient nano and ultrafine particles from motor vehicle emissions: Characteristics, ambient processing and implications on human exposure, Atmos. Environ., 42, 8113–8138, https://doi.org/10.1016/j.atmosenv.2008.07.050, 2008.
Mu, F. and Fiedler, S.: How much do atmospheric depressions and Mongolian cyclones contribute to spring dust activities in East Asia?, npj Clim. Atmos. Sci., 8, 51, https://doi.org/10.1038/s41612-025-00929-w, 2025.
Oron, A. and Seinfeld, J. H.: The dynamic behavior of charged aerosols: II. Numerical solution by the sectional method, J. Colloid Interf. Sci., 133, 66–79, https://doi.org/10.1016/0021-9797(89)90282-8, 1989.
Pöschl, U.: Atmospheric aerosols: Composition, transformation, climate and health effects, Angew. Chem. Int. Edit., 44, 7520–7540, https://doi.org/10.1002/anie.200501122, 2005.
Qu, Z., Trabelsi, Z. A., Losno, R., Monna, F., Nowak, S., Masmoudi, M., and Quisefit, J.-P.: A laboratory dust generator applying vibration to soil sample: Mineralogical study and compositional analyses, J. Geophys. Res.-Atmos., 125, e2019JD032224, https://doi.org/10.1029/2019JD032224, 2020.
Quan, L.: Critical Role of Dust Induced Electrostatic Coagulation in the Evolution of Aerosol Size Distributions in the Atmosphere, Mendeley Data [code, data set], https://doi.org/10.17632/n8ys5rzcty.1, 2026.
Ramnarine, E., Kodros, J. K., Hodshire, A. L., Lonsdale, C. R., Alvarado, M. J., and Pierce, J. R.: Effects of near-source coagulation of biomass burning aerosols on global predictions of aerosol size distributions and implications for aerosol radiative effects, Atmos. Chem. Phys., 19, 6561–6577, https://doi.org/10.5194/acp-19-6561-2019, 2019.
Rose, C., Collaud Coen, M., Andrews, E., Lin, Y., Bossert, I., Lund Myhre, C., Tuch, T., Wiedensohler, A., Fiebig, M., Aalto, P., Alastuey, A., Alonso-Blanco, E., Andrade, M., Artíñano, B., Arsov, T., Baltensperger, U., Bastian, S., Bath, O., Beukes, J. P., Brem, B. T., Bukowiecki, N., Casquero-Vera, J. A., Conil, S., Eleftheriadis, K., Favez, O., Flentje, H., Gini, M. I., Gómez-Moreno, F. J., Gysel-Beer, M., Hallar, A. G., Kalapov, I., Kalivitis, N., Kasper-Giebl, A., Keywood, M., Kim, J. E., Kim, S.-W., Kristensson, A., Kulmala, M., Lihavainen, H., Lin, N.-H., Lyamani, H., Marinoni, A., Martins Dos Santos, S., Mayol-Bracero, O. L., Meinhardt, F., Merkel, M., Metzger, J.-M., Mihalopoulos, N., Ondracek, J., Pandolfi, M., Pérez, N., Petäjä, T., Petit, J.-E., Picard, D., Pichon, J.-M., Pont, V., Putaud, J.-P., Reisen, F., Sellegri, K., Sharma, S., Schauer, G., Sheridan, P., Sherman, J. P., Schwerin, A., Sohmer, R., Sorribas, M., Sun, J., Tulet, P., Vakkari, V., van Zyl, P. G., Velarde, F., Villani, P., Vratolis, S., Wagner, Z., Wang, S.-H., Weinhold, K., Weller, R., Yela, M., Zdimal, V., and Laj, P.: Seasonality of the particle number concentration and size distribution: a global analysis retrieved from the network of Global Atmosphere Watch (GAW) near-surface observatories, Atmos. Chem. Phys., 21, 17185–17223, https://doi.org/10.5194/acp-21-17185-2021, 2021.
Seinfeld, J. H. and Pandis, S. N.: Atmospheric Chemistry and Physics: From Air Pollution to Climate Change, 3rd edn., John Wiley & Sons, Hoboken, NJ, ISBN 978-1-118-94740-1, 2016.
Shao, J. and Mao, J.: Dust particle size distributions during spring in Yinchuan, China, Adv. Meteorol., 2016, 4050240, https://doi.org/10.1155/2016/6940502, 2016.
Tammet, H., Hõrrak, U., Laakso, L., and Kulmala, M.: Factors of air ion balance in a coniferous forest according to measurements in Hyytiälä, Finland, Atmos. Chem. Phys., 6, 3377–3390, https://doi.org/10.5194/acp-6-3377-2006, 2006.
Tegen, I. and Lacis, A. A.: Modeling of particle size distribution and its influence on the radiative properties of mineral dust aerosol, J. Geophys. Res.-Atmos., 101, 19237–19244, https://doi.org/10.1029/95JD03610, 1996.
Tigges, L., Wiedensohler, A., Weinhold, K., Gandhi, J., and Schmid, H.-J.: Bipolar charge distribution of a soft X-ray diffusion charger, J. Aerosol Sci., 90, 77–86, https://doi.org/10.1016/j.jaerosci.2015.07.002, 2015.
Xie, H., Wang, Z., Luo, T., Yang, K., Zhang, D., Zhou, T., Yang, X., Liu, X., and Fu, Q.: Seasonal variation of dust aerosol vertical distribution in Arctic based on polarized micropulse lidar measurement, Remote Sensing, 14, 5581, https://doi.org/10.3390/rs14215581, 2022.
Zebel, G.: Zur Theorie des Verhaltens elektrisch geladener Aerosole, Kolloid Z., 157, 37–50, 1958.
Zhang, H. and Zhou, Y.-H.: Reconstructing the electrical structure of dust storms from locally observed electric field data, Nat. Commun., 11, 5072, https://doi.org/10.1038/s41467-020-18759-0, 2020.
Zhang, R., Lu, X., Wang, L., Chen, J., Chen, D.-R., and Wang, X.: Extremely inexpensive and simple method to remove indoor respiratory aerosols, Environ. Sci. Technol. Let., 10, 786–791, https://doi.org/10.1021/acs.estlett.3c00541, 2023.