the Creative Commons Attribution 4.0 License.
the Creative Commons Attribution 4.0 License.
 | 22 Jun 2026
Measurement report: Spatial variability of VOCs, ozone, and carbonaceous aerosols during the 2022 European summer heatwave
Thérèse Salameh
Robert Wegener
Heidi Hellén
Jean-Luc Jaffrezo
Pontus Roldin
Elisabeth Alonso-Blanco
Andres Alastuey
Crist Amelynck
Jgor Arduini
Benjamin Bergmans
Marie Bertrand
Agnes Borbon
Efstratios Bourtsoukidis
Laetitia Bouvier
David Butterfield
Iris Buxbaum
Darius Ceburnis
Anja Claude
Augustin Colette
Aurélie Colomb
Sophie Darfeuil
James Dernie
Maximilien Desservettaz
Elías Díaz-Ramiro
Marvin Dufresne
René Dubus
Mario Duval
Marie Dury
Anna Font
Kirsten N. Fossum
Evelyn Freney
Gotzon Gangoiti
Maria Carmen Gomez
Francisco J. Gómez-Moreno
Marie Gohy
Valérie Gros
Paul Hamer
Bryan Hellack
Hartmut Herrmann
Robert Holla
Adéla Holubová
Niels R. Jensen
Tuija Jokinen
Matthew Jones
Uwe Käfer
Lukas Kesper
Dieter Klemp
Dagmar Kubistin
Angela Marinoni
Martina Mazzini
Vy Ngoc Thuy Dinh
Jurgita Ovadnevaite
Tuukka Petäjä
Miguel Portillo-Estrada
Jitka Přívozníková
Jean-Philippe Putaud
Stefan Reimann
Laura Renzi
Veronique Riffault
Stuart Ritchie
Chris Robins
Begoña Artíñano Rodríguez de Torres
Laurent Poulain
Julian Rüdiger
Agnieszka Sanocka
Estibaliz Saez de Camara Oleaga
Niels Schoon
Roger Seco
Ivan Simmons
Leïla Simon
David Simpson
Sverre Solberg
Emmanuel Tison
August Thomasson
Svetlana Tsyro
Marsailidh Twigg
Toni Tykkä
Bert Verreyken
Ågot Watne
Katie Williams
Ana Maria Yáñez-Serrano
Karen Yeung
Ilona Ylivinkka
Karl Espen Yttri
This study presents results from an Intensive Measurement Period (IMP2022) conducted during the European heatwave of July 2022, focusing on ozone, volatile organic compounds (VOCs), and carbonaceous aerosols at 31 sites across Europe. The episode featured persistent high-pressure systems, record-breaking temperatures, widespread ozone exceedances and concurrent atmospheric new particle formation and growth events. Coordinated measurements and chemistry transport modelling were used to examine the spatial variability of ozone, VOC composition, and secondary organic aerosol (SOA) formation under extreme meteorological conditions. Oxygenated VOCs (O-VOCs) constituted the largest fraction of total measured VOC mixing ratios, followed by non-methane hydrocarbons (NMHCs) and aromatics, with contributions from both anthropogenic and biogenic sources. Sensitivity simulations indicate that ozone formation was predominantly NOx-limited across most regions during IMP2022. However, the highest ozone peaks occurred under conditions of elevated NOx in combination with enhanced BVOC emissions. In contrast, SOA formation was slightly enhanced under low-NOx conditions and reduced in elevated NOx. Isoprene, aliphatic NMHCs, and O-VOCs dominated the ozone formation potential, while aromatics and monoterpenes were major contributors to SOA potential. Model simulations indicated that higher NOx concentrations can reduce SOA formation by about 10 %. The campaign also highlighted observational gaps underscoring the need for broader and higher-resolution VOC monitoring across Europe. Overall, further reductions in NOx emissions, alongside targeted control of key anthropogenic VOCs, would benefit air quality under future climate extremes.
- Article
(7945 KB) - Full-text XML
-
Supplement
(8753 KB) - BibTeX
- EndNote


Air pollution continues to pose major risks to human health and ecosystems despite decades of emission reductions. A significant proportion of the European population is still exposed to harmful levels of air pollutants (EEA, 2025). This problem becomes particularly critical during extreme heat events, when pollution levels often escalate. Elevated concentrations of ozone and particulate matter (PM) intensify stress on human health, and when combined with the direct harmful effects of high temperatures, contributes significantly to increased mortality rates (Anenberg et al., 2020).
Volatile organic compounds (VOCs) play an important role in atmospheric chemistry, serving as key precursors for the formation of both tropospheric ozone and secondary organic aerosol (SOA). In the presence of sunlight and nitrogen oxides (NOx), VOCs undergo photochemical reactions that produce ozone. Simultaneously, VOC oxidation can form SOA, a major component of fine particulate matter (PM2.5) (Monks et al., 2009; Seinfeld and Pandis, 1998). The atmosphere contains a diverse variety of VOC species from both anthropogenic and biogenic sources. In Europe, biogenic VOC (BVOC) emissions are dominated by oxygenated VOCs (O-VOCs), monoterpenes, and isoprene, with O-VOCs constituting the largest share (Oderbolz et al., 2013). The relative contributions vary regionally due to differences in vegetation composition and land cover. However, significant uncertainties remain in the parameterisation of BVOC emissions, particularly regarding their sensitivity to temperature, radiation, and drought stress under extreme conditions (Bourtsoukidis et al., 2024, 2025; Guion et al., 2023; Seco et al., 2007). High temperatures increase the BVOC emissions from vegetation and can significantly increase the production of biogenic SOA (BSOA) and ozone (Guion et al., 2023; Hallquist et al., 2009; Hamer et al., 2026; Li et al., 2025; Vazquez Santiago et al., 2024). The hot and stagnant atmospheric conditions during heatwaves promote the formation and accumulation of reactive chemical species such as ozone. In addition, lower stomatal uptake under heat and drought stress decreases dry deposition and thus limits ozone removal (Emberson et al., 2001; Lin et al., 2020). Additionally, the lack of precipitation reduces the wet deposition of precursors, thus enhancing concentrations even further.
The reactivity of VOCs in the atmosphere varies widely, influencing their potential to contribute to ozone and SOA formation (Seinfeld and Pandis, 1998), and their impact on the hydroxyl radical (OH) concentrations and methane lifetime (Boy et al., 2022). This variability stems from differences in their molecular structure and the environmental conditions. The capacity of a VOC species to form ozone depends largely on the OH concentration and reaction rate, and the availability of NOx. Under high-NOx conditions, unsaturated hydrocarbons such as isoprene and aromatics like trimethylbenzenes are significant contributors to ozone production as they undergo rapid photochemical reactions (Derwent et al., 1998; Holland et al., 2023; Jenkin et al., 2017). The ability of a VOC species to contribute to SOA formation is influenced by the volatility of its oxidation products. Extremely low and low-volatility organic compounds (ELVOC and LVOC, respectively) are more efficient in growing ultrafine particles, especially newly formed sub-10 nm particles, compared to semi-volatile organic compounds (SVOC) (Tröstl et al., 2016; Yan et al., 2020).
BVOCs, including isoprene, monoterpenes, and sesquiterpenes emitted primarily by vegetation, are major precursors to BSOA (Gu et al., 2021; Hallquist et al., 2009). More recently also diterpenes have received attention as an important BVOC (Yáñez-Serrano et al., 2025). BVOCs have been shown to play a key role in the early growth of newly formed nanoparticles (Mohr et al., 2019; Tröstl et al., 2016). Among anthropogenic VOCs, aromatics like toluene and xylenes are particularly important SOA precursors (Hallquist et al., 2009; Henze et al., 2008). Environmental factors, such as temperature and the presence of other pollutants, influence VOC reactivity. For example, NOx concentration strongly affects the pathways and efficiency of ozone and SOA formation.
The influence of NOx on the VOC oxidation pathways is not straightforward, as it depends on VOC structure and environmental conditions such as temperature, humidity and solar radiation. Ozone production generally increases with NOx under VOC-rich conditions, but the response is non-linear and depends on the VOC NOx ratio (Seinfeld and Pandis, 1998). Similarly, SOA formation exhibits a non-linear dependence on NOx. At low-NOx conditions, moderate increase in NOx can enhanceSOA formation whereas at higher-NOx levels, further increases tend to suppress SOA yields (Nie et al., 2023; Sarrafzadeh et al., 2016; Yan et al., 2020).
Efforts to improve air quality in Europe have been guided by legally binding emission reduction commitments under the Gothenburg Protocol of the United Nations Economic Commission for Europe (UNECE) Convention on Long-range Transboundary Air Pollution (CLRTAP) and the EU National Emission reduction Commitments (NEC) Directive (EU, 2016; UNECE, 2012). These measures have resulted in substantial declines in the emissions of ozone and SOA precursors. From 2000 to 2022, anthropogenic emissions of NOx and non-methane volatile organic compounds (NMVOC) decreased by 24 % and 16 %, respectively, across the European Monitoring and Evaluation Programme (EMEP) area (EMEP, 2023). Within the EU27+UK+EFTA (European Free Trade Association regrouping Iceland, Liechtenstein, Norway, and Switzerland) region, reductions were even more pronounced, with 45 % for NOx and 55 % for NMVOC (EMEP, 2023). Observations of ambient NO2 concentrations reduced by 32 ± 7 % from 2000 to 2019, suggesting a smaller decline compared to the reported emissions (Aas et al., 2024). Although there are few consistent long-term VOC measurements, observations at Hohenpeissenberg (DE0043G) in southern Germany showed a 10 %–30 % decline in the least reactive species and 45 %–55 % in the most reactive ones from 2003 to 2022 (Solberg et al., 2024). The reductions in NOx have contributed to decreased summer peak ozone concentrations (Aas et al., 2024), yet exceedances of regulatory limit values (e.g., 120 µg m3 for the maximum daily 8 h mean) are still commonly observed in Europe (EEA, 2025). Despite the reduction in peak levels of European background ozone concentrations, some urban areas experience increased ozone concentrations, due to climate-warming-driven BVOC emissions or the weakening of the NO titration effect (Querol et al., 2016; Vazquez Santiago et al., 2024; Wang et al., 2024). Further temperature increases may also enhance the temperature-dependent emissions of anthropogenic non-combustion VOCs, such as from volatile chemical products (VCP), as well as increase the reaction rates towards OH radical (Cao et al., 2023; Qin et al., 2025). The heatwave in Europe in summer 2003 showed that various factors such as increased biogenic emissions, reduced dry deposition, and increased residence time in the boundary layer as well as the occurrence of wildfires contributed to elevated surface ozone concentrations (Solberg et al., 2008). With climate change expected to increase the frequency and severity of extreme weather events, including heatwaves(Ban et al., 2022; IPCC, 2023), the risk of exceeding health limits for ozone and PM may rise. This may require more stringent pollution control strategies (Sadiq, 2020; Sokhi et al., 2021). In 2024, the EU revised its Ambient Air Quality Directive (EU, 2024) with stricter pollution limits, aligning more closely with the air quality guidelines of the World Health Organization (WHO, 2021).
To assess the relative importance of the different precursors when setting emission targets and forecasting episodes, it is crucial to accurately measure their concentrations. The EMEP monitoring programme includes a range of VOCs to assess levels and trends in ozone and SOA precursors (UNECE, 2019), however, the programme does not specifically target ozone episodes, which poses challenges in assessing these events. VOC measurements are also part of the Aerosol, Clouds and Trace Gases Research Infrastructure (ACTRIS) (Laj et al., 2024) and the World Meteorological Organisation's (WMO) Global Atmosphere Watch (GAW) programmes. Most EMEP, ACTRIS and European GAW VOC sites are collocated and follow harmonised measurement and reporting guidelines.
There are two primary limitations in the current monitoring of VOCs: (1) Only a few sites measure a comprehensive suite of VOCs, with especially sparse spatial coverage for O-VOCs and terpenes, and there is a lack of NMHC measurement sites in the Mediterranean and Eastern Europe (Solberg et al., 2024); (2) the conventional manual sampling approach for O-VOCs collects only one or two samples per week (EMEP, 2014), offering insufficient temporal resolution for the study of ozone episodes. Finally, SOA tracers are not part of the regular EMEP monitoring programme, although they provide valuable insights into SOA sources by identifying compounds linked to biogenic or anthropogenic origins.
While previous studies have examined spatial variability of VOCs and their role in ozone and SOA formation, coordinated multi-site observations combining a broad suite of VOC species, aerosol chemical composition, and tracer analyses during a single, well-defined heatwave event remain limited.
To address these gaps, the EMEP Task Force on Measurement and Modelling (TFMM) conducted an Intensive Measurement Period (IMP) in the summer of 2022. The goal was to improve understanding of ozone and SOA formation under heatwave conditions. The IMP focused on intensified VOC measurements at selected sites, supported by analyses of carbonaceous aerosol and organic tracers in PM. Particle number size distribution (PNSD) measurements were included to investigate atmospheric new particle formation (NPF) and growth during the measurement period. The IMP was timed (12–19 July 2022) to coincide with a forecasted heatwave, which subsequently developed into a severe European event with record-breaking temperatures and widespread wildfires that contributed to the observed air pollution episode.
2.1 Setup of the campaign and methods used
The IMP 2022 summer campaign focused on one week of intensive VOC observations at selected sites from 12 to 19 July 2022. The campaign began when forecasts indicated the onset of a heatwave over Central Europe. Participating sites supplemented their regular EMEP/ACTRIS observations (if applicable) by expanding the range of measured VOCs and/or increasing their sampling frequency to daily or hourly intervals.
For clarity, VOCs were grouped into the following categories, which are used consistently throughout this manuscript:
-
Short-chain aliphatic hydrocarbons (C2–C6), excluding isoprene
-
Longer-chain aliphatic hydrocarbons (C7–C12)
-
Aromatics
-
Isoprene: formally an aliphatic hydrocarbon but treated separately due to its dominant biogenic origin
-
Oxygenated VOCs (O-VOCs) except methanol
-
Terpenes. Primarily divided into monoterpenes and sesquiterpenes
The specific compounds included in each category are listed in Table S2. Hereafter, the term “NMHCs” refers to aliphatic hydrocarbons excluding isoprene, unless otherwise specified.
Manual devices for VOC sampling were distributed at sites lacking regular monitoring or certain component groups, and subsequent analyses were conducted at centralized laboratories. Additionally, aliquots of filters for regular elemental- and organic carbon (EC-OC) measurement were collected to analyse specific BSOA tracers. The various devices and centralized analyses are summarized below:
NMHCs were sampled with Silcosteel canisters (SilcoCan). The canisters were equipped with a suitable flow reducer and an ozone scrubber (Na2S2O3). Each sample collected air for one hour between 12:00 and 16:00 UTC. Analysis was performed at Forschungszentrum Jülich (FZJV) GmbH using gas chromatography coupled to a mass spectrometer and flame ionization detector (GC-MS/FID, Agilent 6890N) (Hoerger et al., 2015; Klemp et al., 2021).
O-VOCs were collected using solid adsorbent cartridges (Waters Sep-Pak XPOsure Plus Short Cartridge) coated with 2,4-dinitrophenylhydrazine (DNPH) (EMEP, 2014). Two DNPH cartridges, connected back-to-back behind an ozone scrubber (a copper tube filled with a potassium iodide solution), were used for each sample Sampling occurred at a flow rate of ∼ 1.5 L min−1 between 12:00 and 16:00 UTC. The DNPH cartridges were eluted with 3 mL of acetonitrile to extract hydrazones. The derivatives were analyzed by high-performance liquid chromatography (HPLC, Thermo Fisher Ultimate 3000) with UV detection at 360 nm at the ACTRIS Centre of Reactive Trace Gases in-situ measurements (CiGas) at Institut Mines Télécom (IMT) Nord Europe, France.
Monoterpenes, sesquiterpenes, and larger hydrocarbons were collected using Tenax TA – Carbopack B tubes and analyzed by thermal desorption–gas chromatography–mass spectrometers (TD-GC-MS) at the Finnish Meteorological Institute (FMI), Finland (Hellén et al., 2024). An ozone trap (Na2S2O3 impregnated filter) was connected in front of the sampling tube. Samples were collected at a flow rate of ∼ 80 mL min−1 over a two-hour sampling period between 12:00 and 16:00 UTC.
SOA tracer analysis from quartz fibre filters was carried out for sites with regular EC-OC measurements from either PM10 or PM2.5 samplers. Most of the EC-OC analyses were performed by operators using the EUSAAR-2 protocol (Cavalli et al., 2016), while filter aliquots were cut from the filters and analysed for selected tracers at the Institut des Géosciences de l'Environnement (IGE), France. Filters were exposed for 24 h, except at Birkenes (one week). Sampling typically occurred from midnight to midnight, though some samples were collected from 09:00 UTC. Pure water extracts were analysed for light organic acids using ion chromatography - mass spectrometry (IC-MS, Thermo-Fisher Integrion + ISQ EC MS) with separation on an AS11HC column. Sugars, polyols, and monosaccharide anhydrides were quantified using HPLC with hydrophilic interaction (HILIC) columns and tandem mass spectrometry detection (Exion LC30 AD + AB Sciex 5500 QTRAP) (Bros et al., 2025).
Three sites (CZ0003R, DE0008R, DE0007R) used manual sampling of NMHCs with stainless steel canisters. However, their setup differed from the centralized analysis and fewer compounds were detected. In addition to manual sampling, several sites were equipped with automated monitors. Various GC-FID/MS instruments, commonly used for regular NMHC monitoring, were incorporated into the campaign. O-VOCs were measured using two GC–GC/FID systems in Switzerland, and some O-VOC compounds were detected using Proton Transfer Reaction–Mass Spectrometry (PTR-MS) instruments. PTR-MS was also used to measure the sum of monoterpenes.
VOC identification by PTR-MS relies on the molecular mass of the compounds, making this technique unable to distinguish between species with the same nominal mass when operated in the H3O? mode (Dusanter et al., 2025; Yuan et al., 2017). This limitation is particularly relevant for PTR-Quadrupole-Mass Spectrometry (PTR-QMS) instruments, which have unit mass resolution. The more recent PTR-Time-of-Flight-Mass Spectrometry (PTR-ToF-MS) instruments offer higher mass resolution and allow separation of isobaric compounds. For instance, isoprene and furan are both detected at integer 69 in PTR-QMS, but can be separated by PTR-ToF-MS. VOC quantification by PTR-MS can also be complicated by interferences from fragments of protonated VOCs at higher masses. For example, fragments of protonated nonanal and 2-methyl-3-buten-2-ol can appear at the same as protonated isoprene. The contribution from such interferences depends on the measurement environment and the energetic conditions in the drift tube reactor of the PTR-MS instrument. Moreover, isomeric compounds cannot be separated by PTR-MS using H3O? reactant ions; therefore, the sum of isomers is often quantified, as is the case for monoterpenes. Assignment of compounds to values in the PTR-MS instruments followed the GLOVOCs database (Yáñez-Serrano et al., 2021). Several of these VOC measurements are part of the EMEP monitoring programme described in the annual data report (Solberg et al., 2024).
All sites that measured VOCs also monitored ozone using standard UV instruments. Most sites were also equipped with a NOx chemiluminescence instrument, though different converters were used (Table 1). A molybdenum converter is biased compared to a photolytic converter due to interference from other nitrogen oxides (e.g. peroxyacetyl nitrate, HNO3). Most ozone and NO2 measurements at regional sites are reported to EMEP (Hjellbrekke, 2024; Hjellbrekke and Solberg, 2024). The PNSD measurements follow the ACTRIS guidelines as outlined by Wiedensohler et al. (2012)
Table 1Overview of the sites participating in the measurement campaign, variables measured, and methods used.
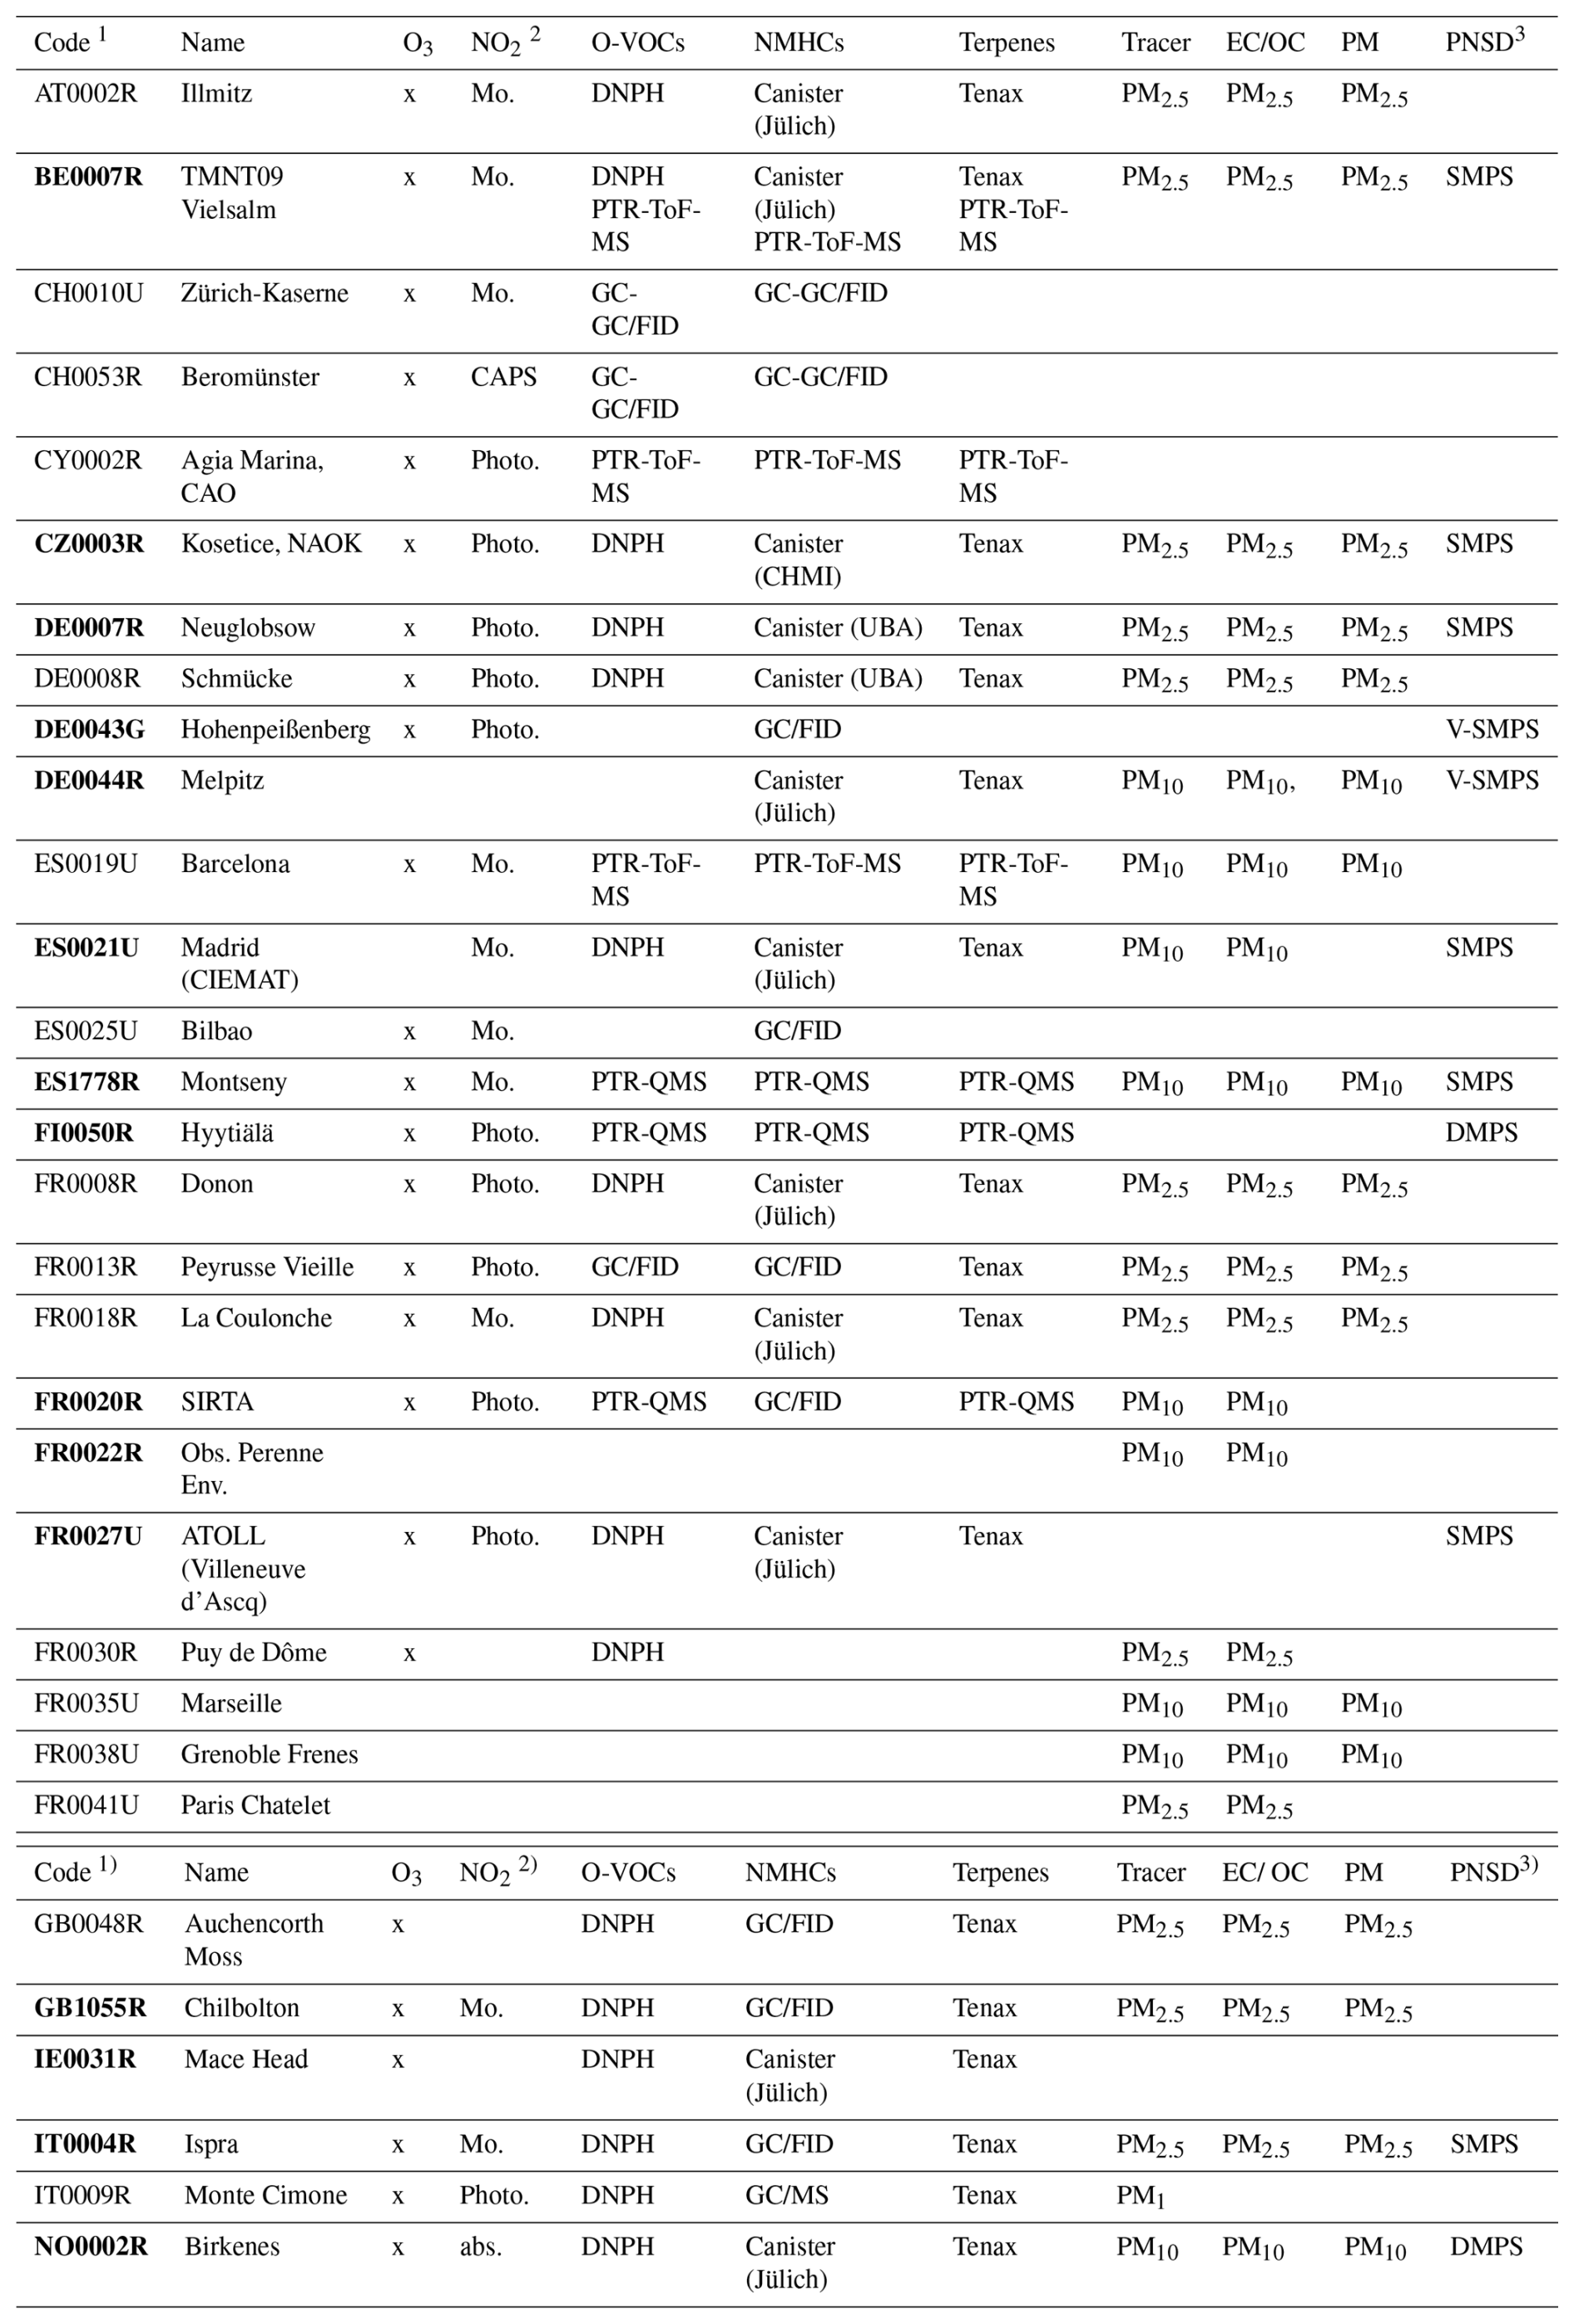
1 Sites marked in bold are compared to ADCHEM model calculations. 2 “Mo.” indicates a molybdenum converter while “Photo.” means photolytic and “abs.” corresponds to a manual method with NO2 absorbed on KI-impregnated glass sinters. CAPS is a Cavity Attenuated Phase Shift Spectroscopy instrument. 3 DMPS: Differential Mobility Particle Sizer; SMPS: Scanning Mobility Particle Sizer; V-SMPS: Volatility-SMPS. x for O3 indicate a UV fluorescence monitor.
A total of 31 sites participated in the campaign (Fig. 1). Table S1 lists site coordinates and land-use characteristics. Of these, 14 sites measured the main VOC species across all compound categories (NMHCs, isoprene, O-VOCs, aromatics, and monoterpenes), and 23 analysed organic tracers. Table 1 provides an overview of the analyses performed at the different sites, In total, more than 120 VOC species, as well as 47 tracers and other compounds in PM, were measured during the campaign. Some sites that did not include organic tracer analyses still performed EC/OC and PM measurements, although these were not included in the present analysis.
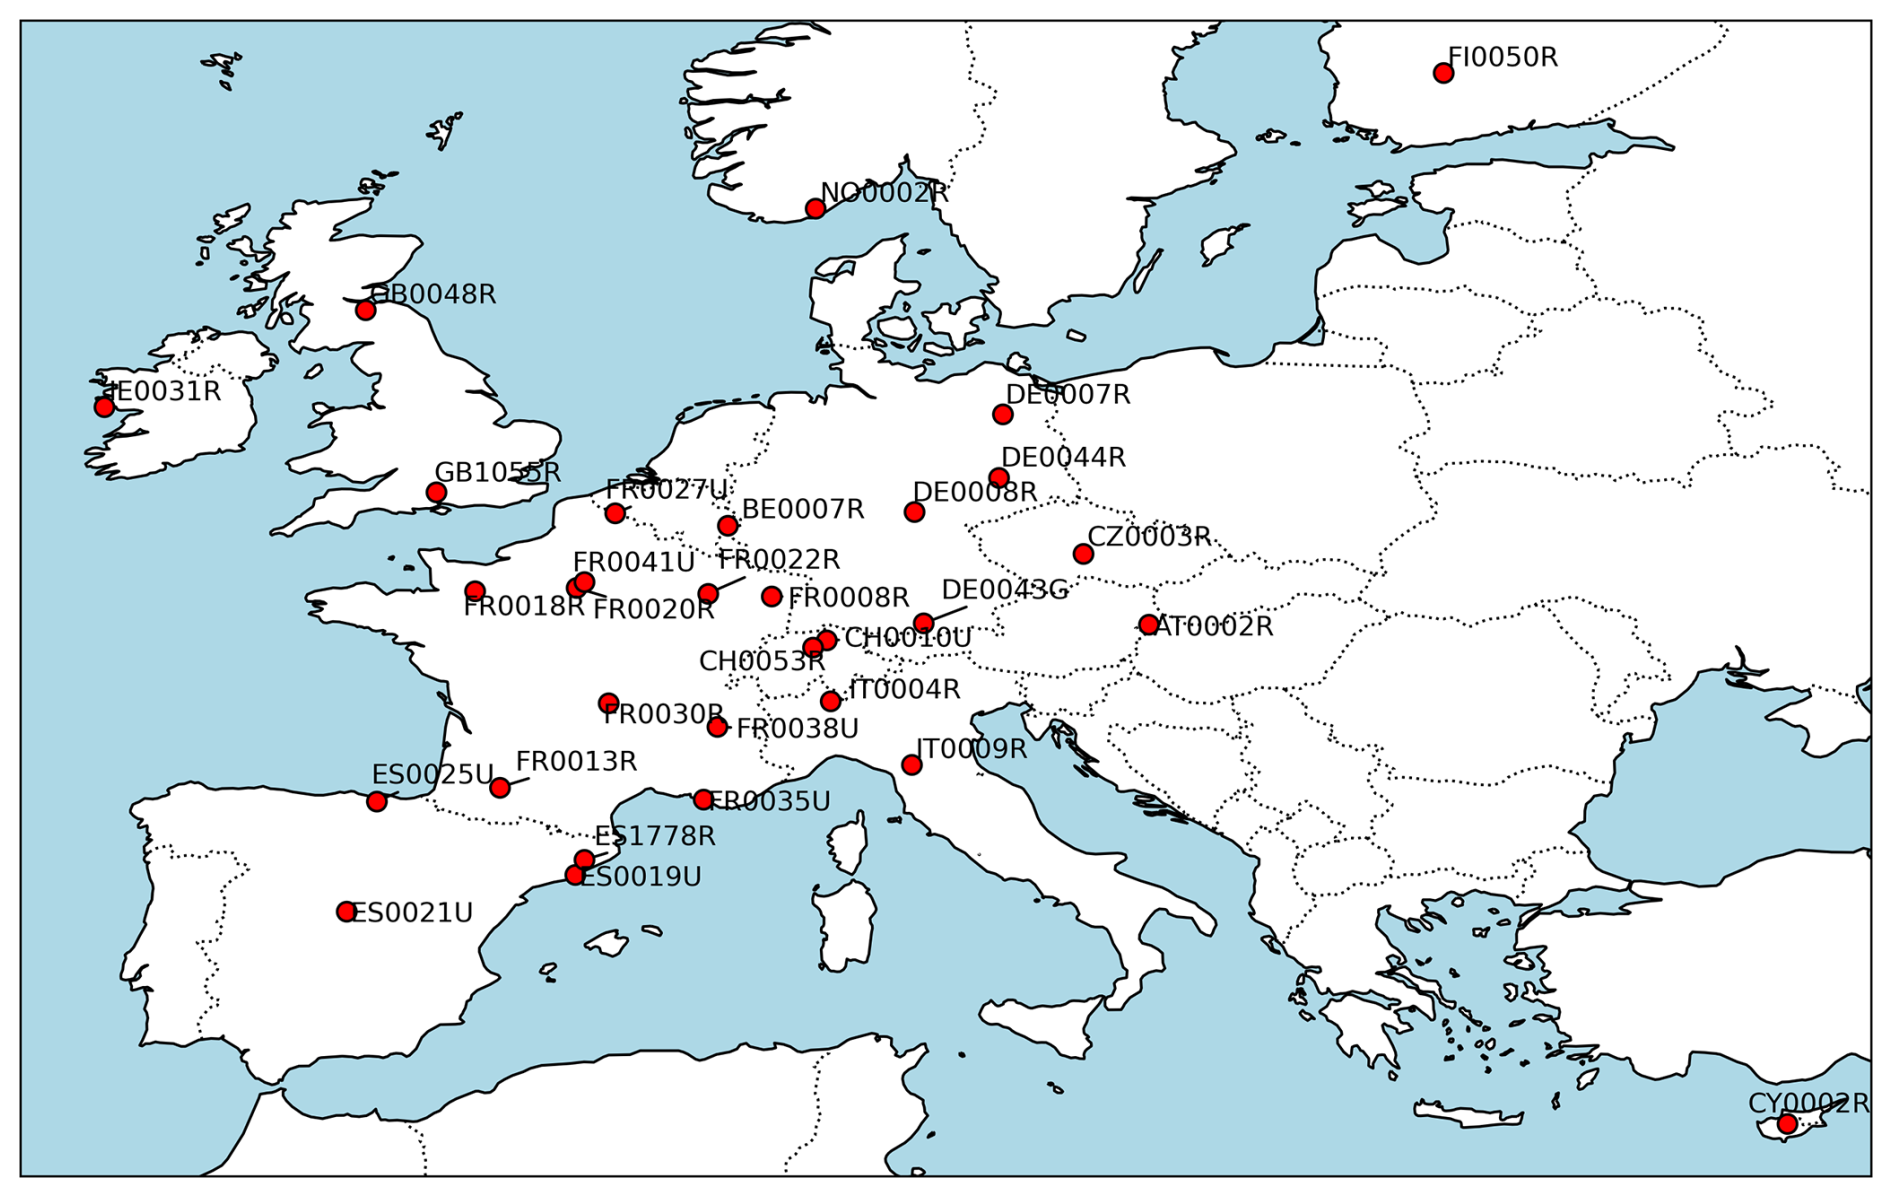
Figure 1Location and codes of the participating sites.
2.2 Screening and preparation of measurement data
To ensure comparability with manual measurements, all data were averaged to daytime means, between 12:00 and 16:00 UTC, during which manual samples were collected over varying durations (1–4 h) within this timeframe, except for ozone, where the 1 h daily maximum concentration was used. Manual measurements, originally recorded in mass units, were converted to mixing ratios (pptv), using standard temperature (273.15 K) and pressure (1013.25 hPa) to ensure consistency across all VOC data. VOCs are thus reported as mixing ratios; for simplicity, these are hereafter referred to as concentrations.
All measurements followed established SOPs within the EMEP and ACTRIS frameworks, and centralised analyses were applied for key compound classes to ensure comparability across sites (Sect. 2.1). While different analytical techniques were used for different VOC groups, these represent standard methods for the respective compounds. Additional site-based measurements (e.g., PTR-MS) may introduce some variability; where available, parallel measurements were used to assess consistency. When multiple measurements were available for the same compound group, data were prioritised based on methodological suitability, temporal resolution, and comparability across sites. The total dataset was screened and a prioritization of methods for different VOC component groups as follows:.
-
NMHCs: (1) C2–C6 data from canisters and GC/FID monitors were used, and monitor data were prioritized when both sources were available due to their higher temporal resolution; (2) for C7–C12 compounds, data from Tenax tubes and GC/FID monitors were used, and monitor data were prioritized when both sources were available;
-
Isoprene: Ssimilar to C2–C6 NMHCs, with the addition of PTR-MS data ( 69 for PTR-QMS and 69.070 for PTR-ToF-MS). FR0020R has both a PTR-QMS and GC/FID. Data from the GC/FID was used.
-
Aromatic hydrocarbon data were collected from canisters, Tenax tubes and monitors. Prioritization was as follows: (1) monitor data were prioritized over manual measurements when available; (2) benzene and toluene data from canisters were prioritized against that from Tenax tubes due to problems with high blank values, while data from Tenax tubes were prioritized for the other aromatic compounds; (3) for PTR-MS, xylenes + ethylbenzene were assigned to 107 for PTR-QMS and 107.086 for PTR-ToF-MS, while trimethylbenzenes were assigned to 121.101 and 121 respectively for the PTR-ToF-MS and PTR-MS instruments.
-
Terpenes: Monoterpenes were collected from Tenax tubes and measured online by PTR-MS (at 137 for PTR-QMS and 137.132 for PTR-ToF-MS). Tenax tube data were prioritized when both measurements were available. Sesquiterpene data were exclusively taken from Tenax tubes.
-
Oxygenated VOC data were collected from DNPH cartridges, GC/FID and PTR-MS. DNPH data were prioritized. For PTR-MS, acetone was assigned to 59 and 59.049 for PTR-QMS and PTR-ToF-MS, respectively. Propanal was also assigned to this mass, but not considered since acetone is the dominant component. 3-buten-2-one (MVK) + 2-methylpropenal (MACR) were assigned to 71 and 71.049 while butanal + 2-methylpropanal + butanone were assigned to 73 and 73.065, referred to as butanals + butanone. Methanol was collected with the canister sampler and PTR-MS, and PTR-MS data were prioritized.
-
Chemical speciation of aerosols and tracer analysis. Chemical analyses were performed by a single laboratory per compound family across all sampling sites. The PM mass and EC-OC were measured at several sites as part of the regular EMEP monitoring. These data were prioritized when both were available.
2.3 Setup for the EMEP and ADCHEM models
To map the ozone concentration field during this summertime campaign, we used the EMEP Meteorological Synthesizing Centre-West (MSC-W) chemical transport model (Simpson et al., 2012, 2025 and references therein).
We used the 1D-vertical column Lagrangian chemistry transport model ADCHEM (Roldin et al., 2011, 2019) to investigate the sources and sinks of tropospheric ozone, OA particles, and atmospheric NPF in air masses transported to 15 of the 31 sites listed in bold in Table 1. ADCHEM was run along air mass trajectories generated using the Lagrangian particle dispersion model FLEXPART v10.4 (Pisso et al., 2019). Air mass trajectories were computed 10 days back in time, with arrival at each modelled site every third hour (Fig. S30–39). FLEXPART is driven by meteorology from the ERA5 reanalysis product (Hersbach et al., 2023). The meteorology relevant for the ADCHEM simulations was also stored alongside the air mass trajectories. ADCHEM's vertical domain, 0 to 2100 m, was divided into 20 logarithmically spaced layers, ranging from 10 m at the surface to 200 m aloft. Emissions of trace gases and primary aerosol particles were taken from the CAMS (Copernicus Atmosphere Monitoring Service) global ocean, biogenic and anthropogenic emission inventories (Granier et al., 2019; Lana et al., 2011; Simpson et al., 2023; Sindelarova et al., 2014; Ziska et al., 2013) while ocean surface parameters such as ammonium, salinity, and pH from Copernicus Marine Service products were used to calculate the ocean-atmosphere ammonia exchange (Wollesen De Jonge et al., 2024; Xavier et al., 2024). The model also accounts for emissions of gases and particles from wildfire emissions using the satellite based GFED5 emission inventory (van der Werf et al., 2025) .
In previous publications it has been demonstrated that ADCHEM generally is able to reproduce observed trends in submicron particle number size distributions, organic aerosol mass concentrations and ozone concentrations at several rural continental stations in Europe and polar marine environments (Roldin et al., 2019; Olenius and Roldin, 2022; Xavier et al., 2024; Wollesen De Jonge et al., 2024; Zhang et al., 2024; Svenhag et al., 2025)
The ozone budget is governed by the odd oxygen family (Ox), which includes O3, NO2, and other rapidly interchanging species (Jacob, 2000; Wang et al., 1998). Ox is removed through dry and wet deposition and reactions with radicals such as OH, HO2, VOCs, and halogens. The rate-limiting steps in Ox production are the reactions of NO with HO2, CH3O2, and other organic peroxy radicals (RO2) radicals (Jacob, 1999). Ozone is primarily produced during daytime when peroxy radicals react with NO to form NO2 which photolyzes back into NO and atomic oxygen, which subsequently forms ozone.
ADCHEM keeps track of both the dry and wet deposition and gas-phase chemical production and losses of tropospheric ozone. The gas-phase chemistry includes in total 1461 other organic peroxy radicals and the total ozone production rate () from the reactions between HO2, CH3O2 and the other RO2 and NO in each model height layer was calculated using Eq. (1):
ki denote the individual reaction rates for the reactions between the different RO2 and NO. The ozone production was then integrated over all height layers from 0 to 2100 m a.g.l. and over the time spent along the air mass trajectories upwind the stations. Similarly the model calculates the Ox loses by reactions between O3 and in total 201 VOCs (O3+ VOC), O3 and OH (O3+ OH), O3 and HO2 (O3+ HO2), Ox lost by reactions with 9 different chlorine, bromine and iodine radicals (O3+ halognes), O(1D) reacting with water vapour (O(1D) + H2O) and NO2 reacting with OH (NO2+ OH).
NPF was modelled using the ClusterIn module (Olenius and Roldin, 2022), which simulates molecular cluster formation, coagulation, and evaporation that can grow into aerosol particles with an initial diameter of ∼ 1 nm. In the present work, we employed ion-mediated NPF involving ammonia and sulfuric acid, sulfuric acid and dimethylamine (DMA), and iodic acid (HIO3) and iodous acid (HIO2), as described by Xavier et al. (2024). Particle growth occurred via condensation of a suite of semi- and low-volatility organic compounds, inorganic and organic acids (H2SO4, HNO3, HIO3, MSA, MSIA), and bases (NH3, DMA). Production and chemical degradation of ozone and condensable organic and inorganic vapours are represented by detailed multiphase chemical mechanisms (6425 species and 17,970 reactions) which combine the Master Chemical Mechanism (MCM) v3.3.1 (Bloss et al., 2005; Jenkin et al., 1997, 2003, 2012, 2015; Saunders et al., 2003), the Peroxy Radical Autoxidation Mechanism (PRAM, (Roldin et al., 2019), the CAPRAM halogen module v3 (Hoffmann et al., 2019), an updated dimethylsulfide (DMS) oxidation chemistry scheme (Wollesen de Jonge et al., 2021), and a 3-carene mechanism (Luo et al., 2024). SOA formation was represented by the gas-particle partitioning of 1,223 semi- and low-volatility oxidized organic compounds, including highly oxygenated organic compounds (HOM) formed from monoterpenes, α-pinene, β-pinene, limonene, and 3-carene (Luo et al., 2024; Nie et al., 2023; Roldin et al., 2019), and aromatic compounds, benzene, toluene, p-xylene, o-xylene, and m-xylene (Iyer et al., 2023; Pichelstorfer et al., 2024).
To explore the influence of terrestrial BVOC and anthropogenic NOx emissions on ozone, OH, SOA, and particle number levels during the campaign, and to assess whether ozone formation was VOC- or NOx-limited, we performed simulations using five model setups:
-
Base case: Includes all known anthropogenic and biogenic emissions of trace gases and aerosol particles.
-
Without isoprene: Terrestrial biogenic isoprene emissions were removed.
-
Without BVOC: All terrestrial BVOC emissions (including isoprene) were removed.
-
2× NOx: Anthropogenic NOx emissions were doubled.
-
0.5× NOx: Anthropogenic NOx emissions were halved.
3.1 Characterizing the heatwave and ozone episode
The summer of 2022 was the warmest on record in Europe at the time. Combined with a lack of rain, this led to severe drought conditions, particularly in southern and central Europe (Copernicus, 2023; Martins et al., 2024). At the beginning of the measurement period (12–13 July), some parts of southwestern Europe were under the influence of a persistent high-pressure system, with daily 1 h maximum ozone concentrations exceeding 100 ppbv in Spain.In the following days, several sites in Italy also recorded high ozone levels (above 80 ppbv), while the BeNeLux region, the UK, and Scandinavia benefited from clean marine air masses. The Mediterranean was affected by a high-pressure system the whole week, while another high-pressure system was initially located west of Ireland and moved slowly eastward. At the start of the period, the central and northern parts of Europe experienced westerly winds on the northern side of the approaching high, bringing marine air masses to the region. From 14 to 16 July, the high pressures gradually entered northwestern parts of the continent, dominating the weather situation over large parts of central Europe by 17 July, with its center over Germany. The high-pressure system continued to move slowly eastward over the following days, and then gradually broke up. On 18–19 July, the high set up southerly winds over central Europe and the UK, bringing continental air masses to the region (Tsyro et al., 2022). This progression illustrates how the heatwave developed from southwestern Europe toward central and northern regions, leading to a gradual build-up of ozone across the continent (Fig. 2). The period was also affected by wildfire activity in parts of southern and western Europe, which likely contributed to elevated precursor levels and ozone formation.
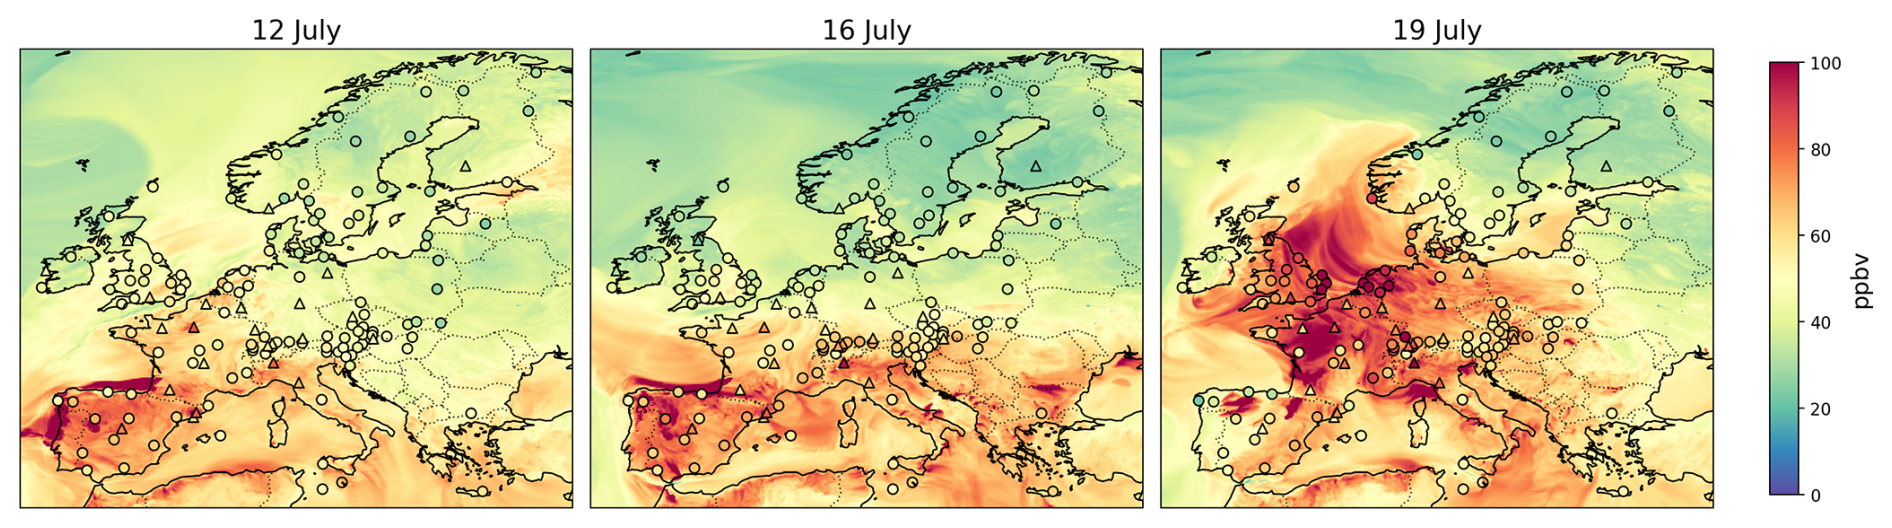
Figure 21-hour maximum ozone concentrations (ppbv) based on the EMEP model and observations superimposed for the 12, 16 and 19 July 2022. The sites participating in the campaign are marked as triangles and regular EMEP sites as circles.
On 19 July, monitoring sites in France, the UK, the Netherlands, Switzerland, and Germany observed hourly mean ozone concentrations exceeding 100 ppbv (Fig 2). The highest value (116 ppbv) was observed at the Sibton regional background site in East England. This coincided with record-breaking temperatures in the UK, which exceeded 40 °C for the first time (MET Office, 2022). Norway was also affected by the heatwave, particularly in the south, where an ozone peak of 89 ppbv was measured, the highest annual maximum since 2006. Figure S1 shows the temperature changes during the study period, and the observed peak ozone concentrations clearly correlated with the site temperatures. The spatial and temporal evolution of ozone closely followed the movement of the high-pressure systems and associated temperature increases, highlighting the strong coupling between meteorological conditions and ozone formation during the event.
The modelled ozone concentrations were comparable to observations, with an average positive bias of 8 % for ozone daily maxima during the IMP week. The model slightly overestimated (by 11 %) at sites with low concentrations (below 50 ppbv) and slightly underestimated (−3 %) at high-concentration sites (above 80 ppbv).
Figre S2 provides an overview of the development of ozone concentrations at the sites studied in this work, along with measurements of NO2, and sulfate, OC and EC in PM. For NO2, no clear spatial pattern was observed, although some sites exhibited high levels. In contrast, sulfate concentrations displayed a distinct south-to-north gradient, with the highest values in southern Europe and minimal variation throughout the week. However, OC concentrations increased in central and northern Europe by the end of the week.
The role of emissions and chemical processes underlying these patterns is further explored in the following sections.
3.2 Volatile organic compounds (VOCs)
3.2.1 Chemical speciation of the VOC component groups
The relative contributions of different VOC component groups, such as C2–C6 and C7–C12 NMHCs, O-VOCs, aromatics, isoprene, and monoterpenes, were analysed at fourteen sites that measured all major VOCs (Fig. 3). O-VOCs and C2-C6 NMHCs dominated the total VOC concentrations at most locations. On average O-VOCs contributed 56 ± 7 % to total VOCs, NMHCs 32 ± 8 %, and isoprene 7 ± 7 %.
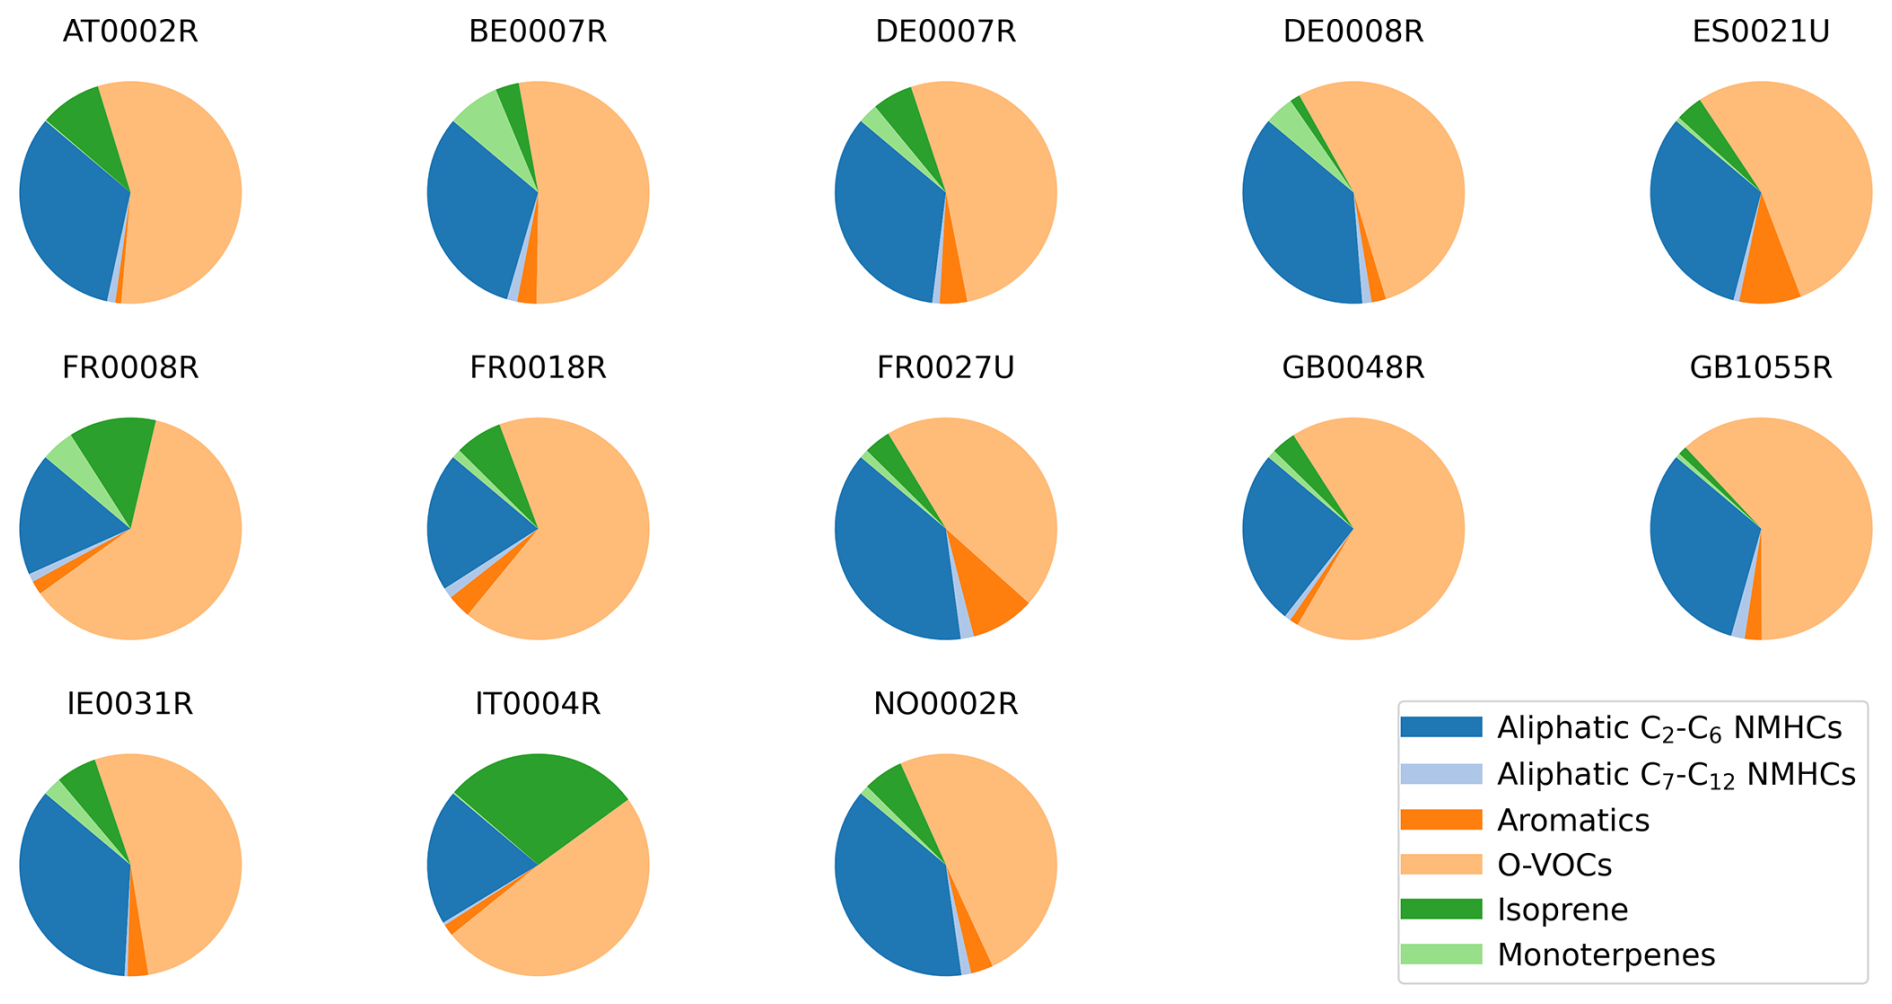
Figure 3Distribution of different VOC groups at sites where the most relevant component groups were measured. The figure is based on the relative contribution of the sum of the average concentrations (pptv), 12–19 July.
Methanol, one of the most abundant VOCs, is not included, but seven of the sites in Fig. 3 also measure methanol and, when included, methanol contributed 26 ± 8 % to the total, while the remaining O-VOCs contributed 41 ± 7 %, and NMHCs 23 ± 7 % (Fig. S3).
The chemical speciation of VOCs including sites lacking measurements for some component groups are shown in Fig. 4. The sites are sorted from north to south, with urban sites in a separate panel on the right. The data in Fig. 4 differ from those in Fig. 3 in that they omit C7–C12 NMHCs, while including sesquiterpenes. The relative contributions of the different VOCs are detailed in the Supplement, however only sites with data for all major species within each component group are included (Fig. S4). Figure 5 illustrates the spatial variation of the different VOC groups.
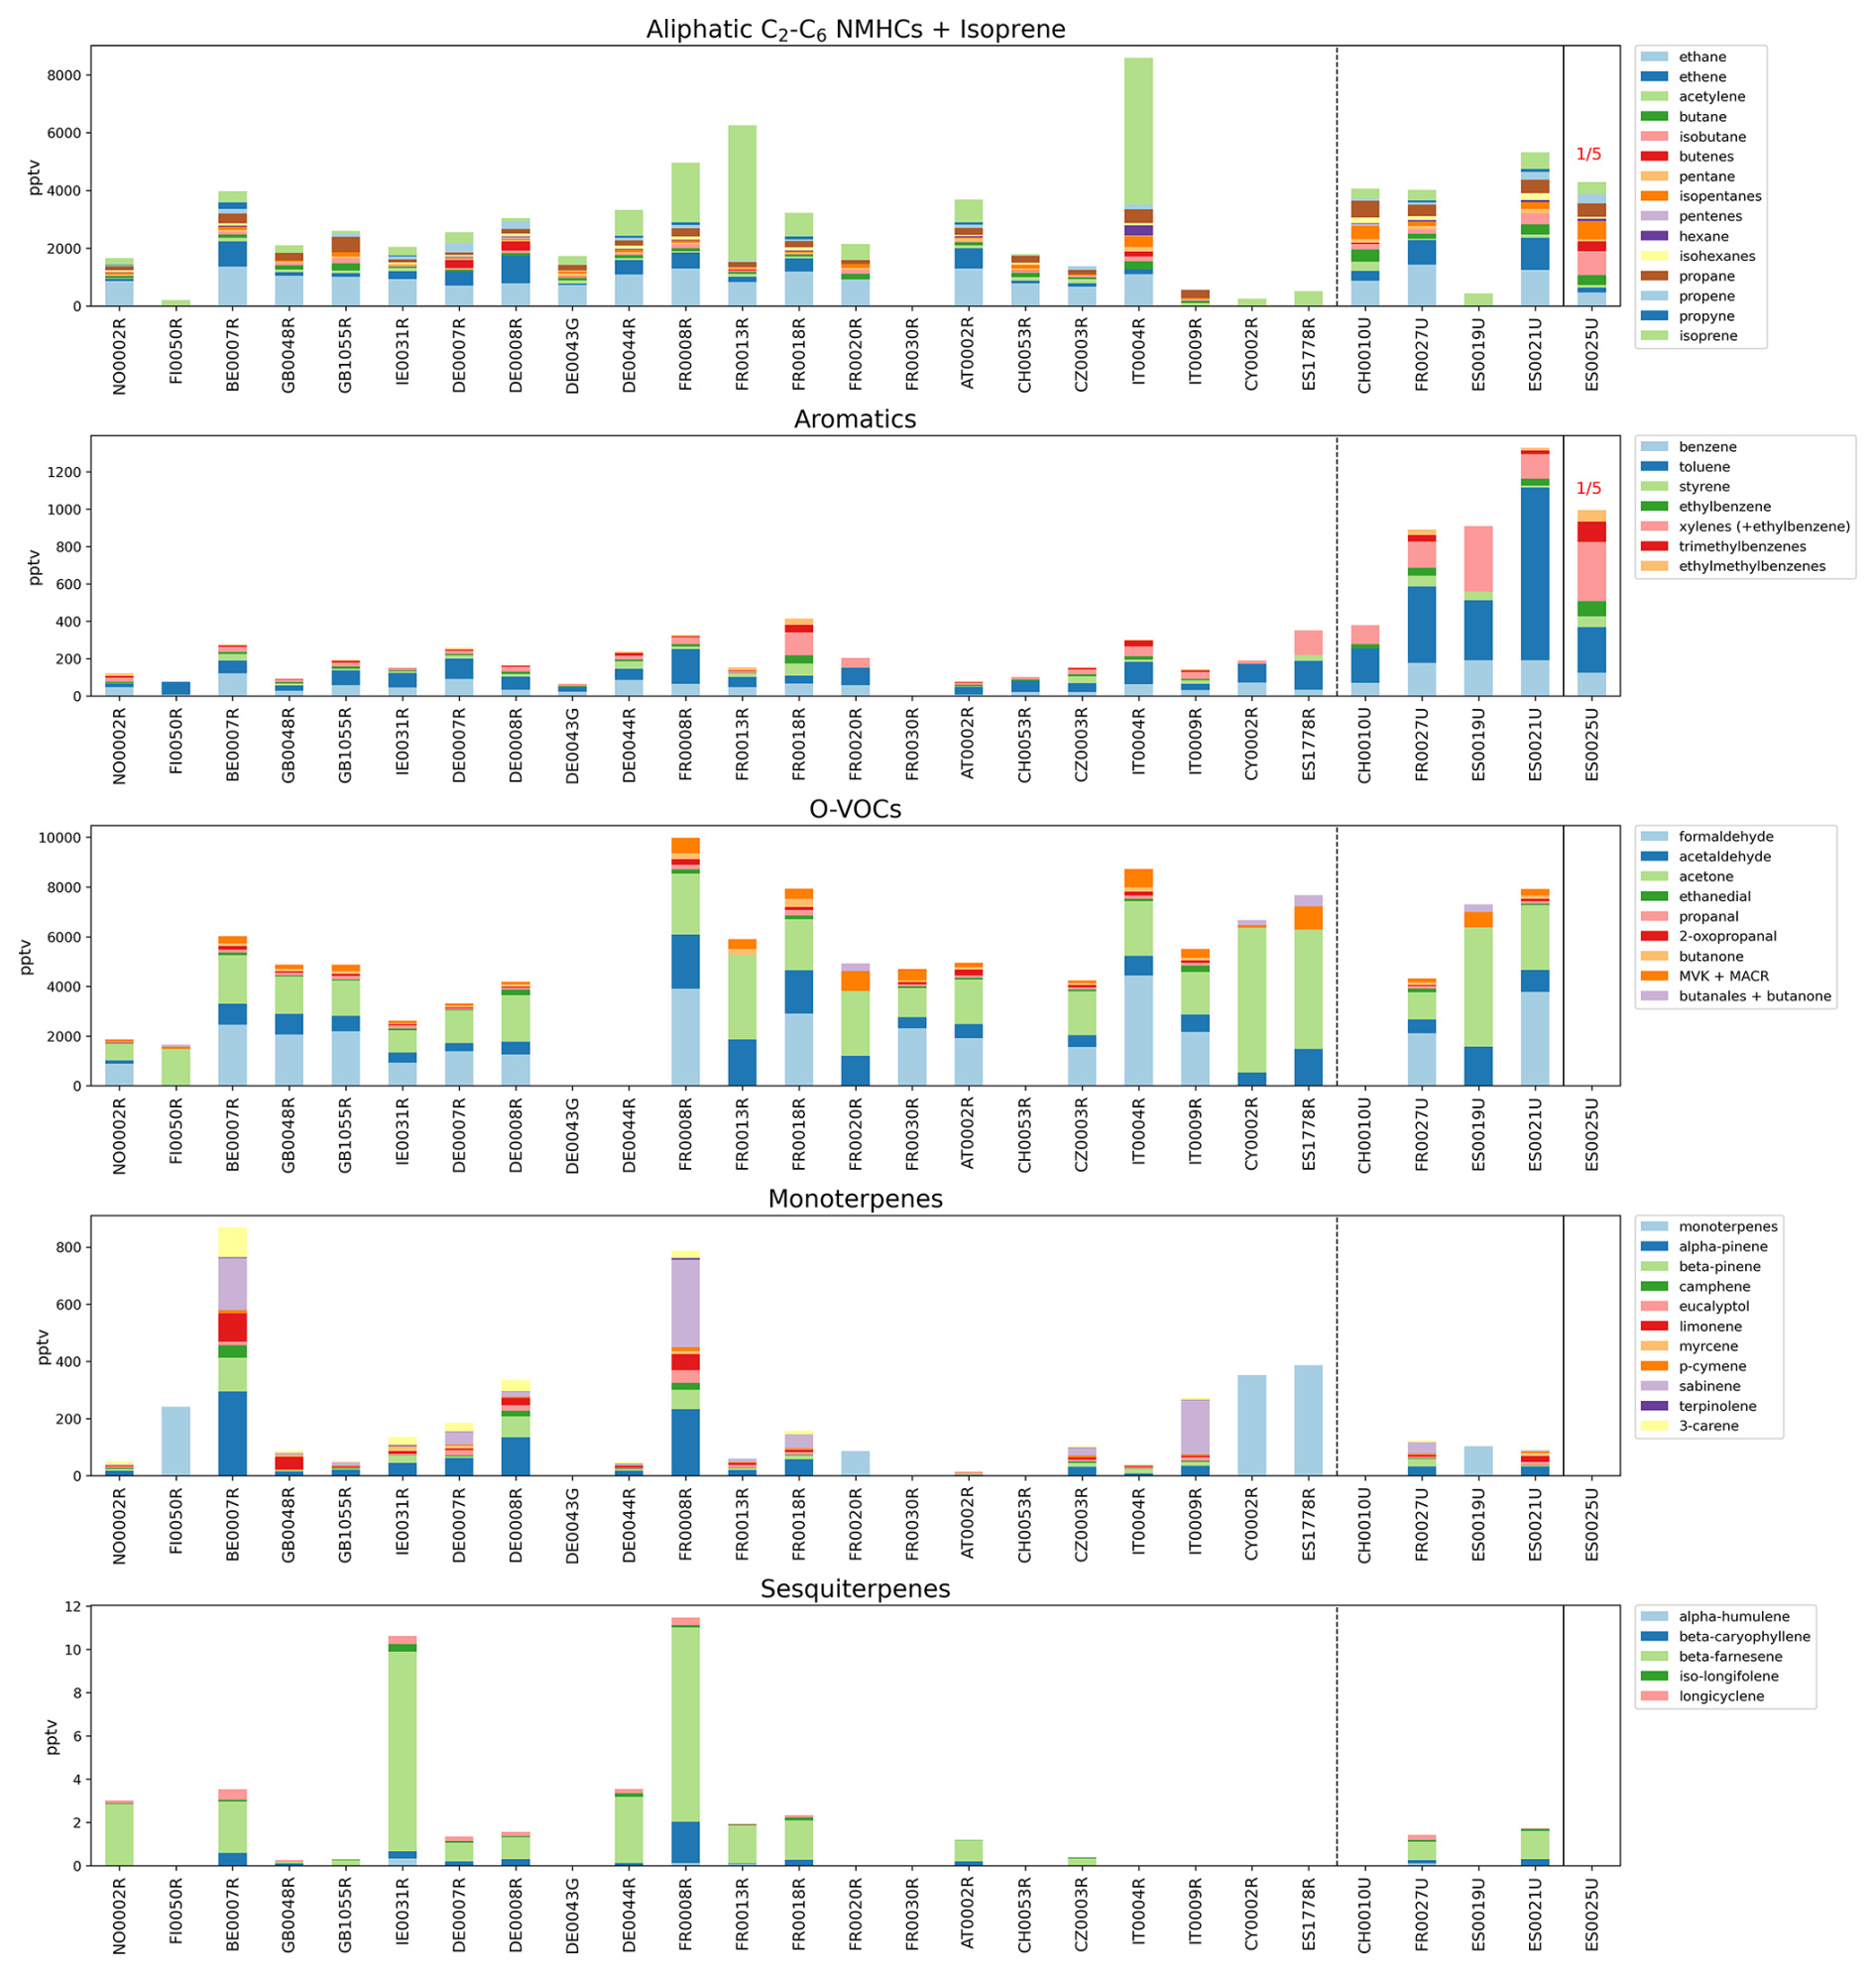
Figure 4Chemical composition of different VOC groups at all sites, averaged over the measurement period (12–19 July 2022). The sites are sorted from north to south, with the urban sites separated to the right. The NMHC and aromatic measurements at ES0025U were divided by five. MVK is 3-buten-2-one, MACR is 2-methylpropenal, and MEK is butanone. The different trimethylbenzenes and xylenes were summed. The xylenes for the PTR-MS sites also include ethylbenzene. Note that not all sites include all components, most notably isoprene was missing at some sites, while PTR-MS sites include isoprene only; besides, some O-VOCs sites missed formaldehyde data.
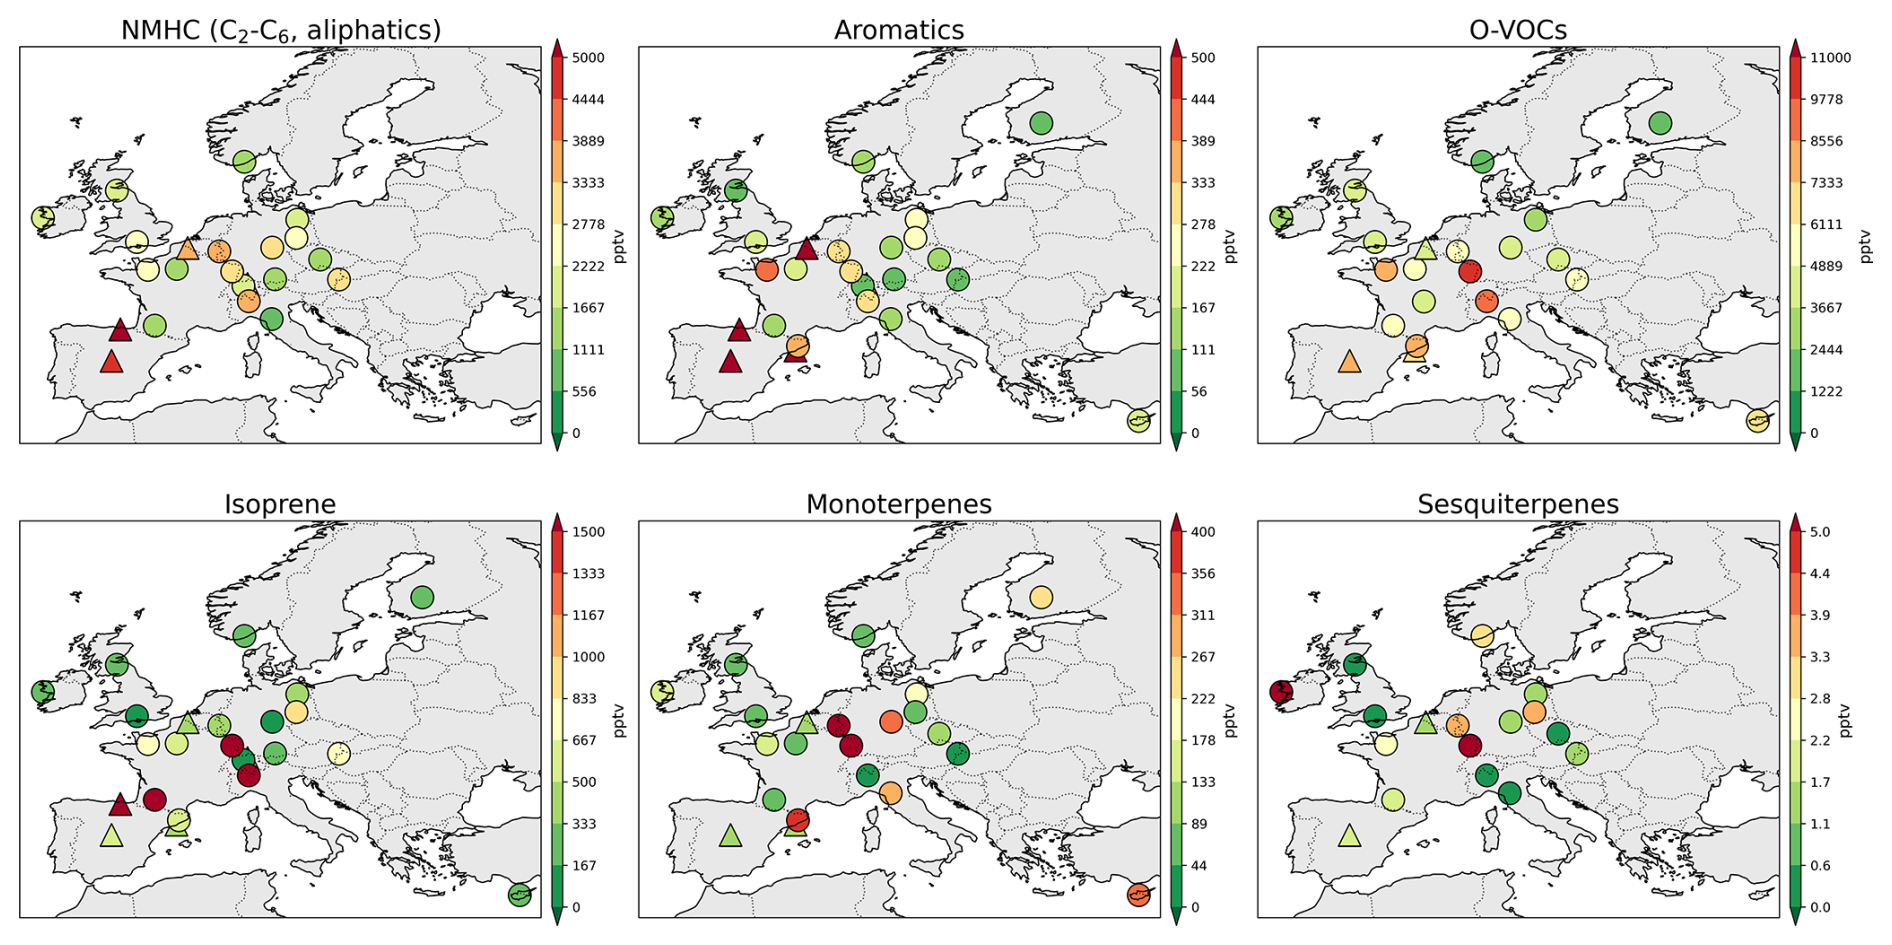
Figure 5Spatial variation of the average concentrations of the different VOCs from 12–19 July. The groups sum the average concentration for all the relevant components. The urban sites are marked as triangles.
The concentrations of C2–C6 NMHC ) and aromatic compounds were generally highest at urban sites (Fig. 4) as expected as these are mainly from anthropogenic sources. However, some regional sites exhibited relatively high levels of these compounds, likely due to their proximity to major cities or densely populated regions in Europe (Fig. 5), as indicated by elevated NO2 values at Ispra (IT0004R) and Chilbolton (GB1055R) (Fig. S2). Ispra (IT0004R) is influenced by emissions from the Po Valley, and Chilbolton (GB1055R) is influenced by populated areas throughout southern England as seen in regular measurements from these sites (Solberg et al., 2024). In contrast some sites show relatively high NMHC and/or aromatics concentrations (e.g. AT0002R, FR0008R, FR0018R) without correspondingly high NO2 levels, while others such as Kosetice (CZ0003R) exhibit elevated NO2 levels but only modest NMHC and aromatic concentrations. Urban sites showed markedly higher concentrations of benzene, toluene, ethylbenzene, and xylenes (BTEX), a subset of aromatic compounds, than regional sites, consistent with European observations by Liu et al. (2025). The relative contributions of aromatic hydrocarbons were highest for toluene (38 ± 15 %), benzene (25 ± 10 %), and the sum of xylenes (16 ± 8 %).
Ethane was the most dominant C2–C6 NMHC on average, comprising 41 ± 13 % of the summed C2–C6 NMHC mixing ratio, followed by ethene (15 ± 9%). On average, ethane concentrations were comparable to isoprene concentrations (1000 ± 260 pptv and 954 ± 1455 pptv, respectively), although site-to-site variability was substantial. Considering their respective lifetimes (2 months for ethane vs. 1 hour for isoprene), this comparable mixing ratios suggests large isoprene emission around some sites during the IMP.
The highest isoprene concentrations were observed at Peyrusse Vieille (FR0013R) and 5 Ispra (IT0004R). These elevated isoprene concentrations are consistent with dominant biogenic emissions, Peyrusse Vieille being located far from large anthropogenic sources, and the pronounced daytime maxima at Ispra are characteristic of temperature- and light-dependent biogenic emission patterns. Isoprene contributed only with 2 %–3 % at Schmücke (DE0008R), Beromünster (CH0053R), and Chilbolton (GB1055R). The latter two sites (GB1055R and CH0053R) are located in agricultural areas and were likely not strongly influenced by biogenic emissions. In contrast, Schmücke is located in the Thuringian forest, where a stronger biogenic influence would be expected. Nevertheless, monoterpene concentrations remained relatively high Schmücke, as expected for a forested site dominated by coniferous trees. Although monoterpenes are primarily of biogenic origin, some compounds such as α-pinene, β-pinene, and limonene may also have anthropogenic sources (e.g., volatile chemical products and cleaning agents), particularly at sites influenced by urban or regional emissions.
Both monoterpenes and sesquiterpenes showed spatial patterns distinct from the other VOC groups (Fig. 4). Spatial variations of the different terpenes are mapped in Fig. S5. The mean concentrations of these compounds varied widely across sites, reflecting the surrounding biogenic environment. Forested sites such as Vielsalm (BE0007R) and Donon (FR0008R) showed the highest concentrations of monoterpenes. At sites with potential anthropogenic influence, however, contributions from non-biogenic sources cannot be excluded. While sesquiterpenes were generally lower, elevated levels were observed at Mace Head (IE0031R). α-Pinene was the dominant monoterpene, contributing 24 ± 15 %, followed by sabinene (15 ± 17 %) and β-pinene (10 ± 10 %). The relative importance of individual monoterpenes varied by site, reflecting differences in vegetation as well as possible local emission influences. For example, limonene dominated at Auchencorth Moss (GB0048R), whereas it was 3-carene at Birkenes (NO0002R) and Mace Head. β-Farnesene dominated sesquiterpenes at all sites, with an average contribution of 75 ± 15 %. The high concentration of sesquiterpenes at Mace Head was surprising, given the relatively low levels of monoterpenes and isoprene at the site. Considering its proximity to the Atlantic Ocean, phytoplankton activity, which can emit sesquiterpenes (Park et al., 2023), might be a potential source. These emissions may also originate from flowering plants and diverse plant types, such as shrubs, grasses, and herbaceous species, which are known to produce sesquiterpenes (Duhl et al., 2008). Some broadleaf trees, such as downy birches, may emit more sesquiterpenes than monoterpenes (Hellén et al., 2021).
There is no distinct difference between urban and regional sites regarding O-VOC concentrations, although a clear gradient is observed, with the highest concentrations in central and southwestern Europe (Figs. 4 and 5). The relative distribution of the various O-VOC species was, however, remarkably similar across sites (Fig. S4). Given the geographical and environmental diversity of the stations, this suggests high background levels of O-VOC, which also contribute to a significant fraction of urban O-VOCs, as shown by Borbon et al. (2024). Formaldehyde and acetone were the dominant O-VOC components, contributing 42 ± 6 % and 32 ± 6 %, respectively, followed by acetaldehyde 13 ± 4 %. The widespread occurrence of these compounds across Europe likely reflects both their diverse sources and their secondary formation in the atmosphere. They are emitted directly from anthropogenic activities, such as traffic (Gentner et al., 2013), VCP use (Seltzer et al., 2021) and industrial combustion (Wang et al., 2023), and episodically from wildfires (Akagi et al., 2011; Gilman et al., 2015). In addition, substantial secondary production occurs through oxidation of hydrocarbons from both anthropogenic and biogenic precursors, including ethane, isoprene, and terpenes (Khan et al., 2015; Millet et al., 2010; Seinfeld and Pandis, 1998).
Within ACTRIS, an important part of the QA/QC procedure is to compare VOCs with similar sources or atmospheric lifetimes, to identify specific local influences (e.g., meteorological effects, nearby emissions) or potential technical issues (Laj et al., 2024; Reiman et al., 2018). Figure 6 presents a selection of relevant ratio plots, whereas Fig. S6 includes all ACTRIS-recommended ratios. Such ratios are useful for assessing source characteristics and atmospheric processing.
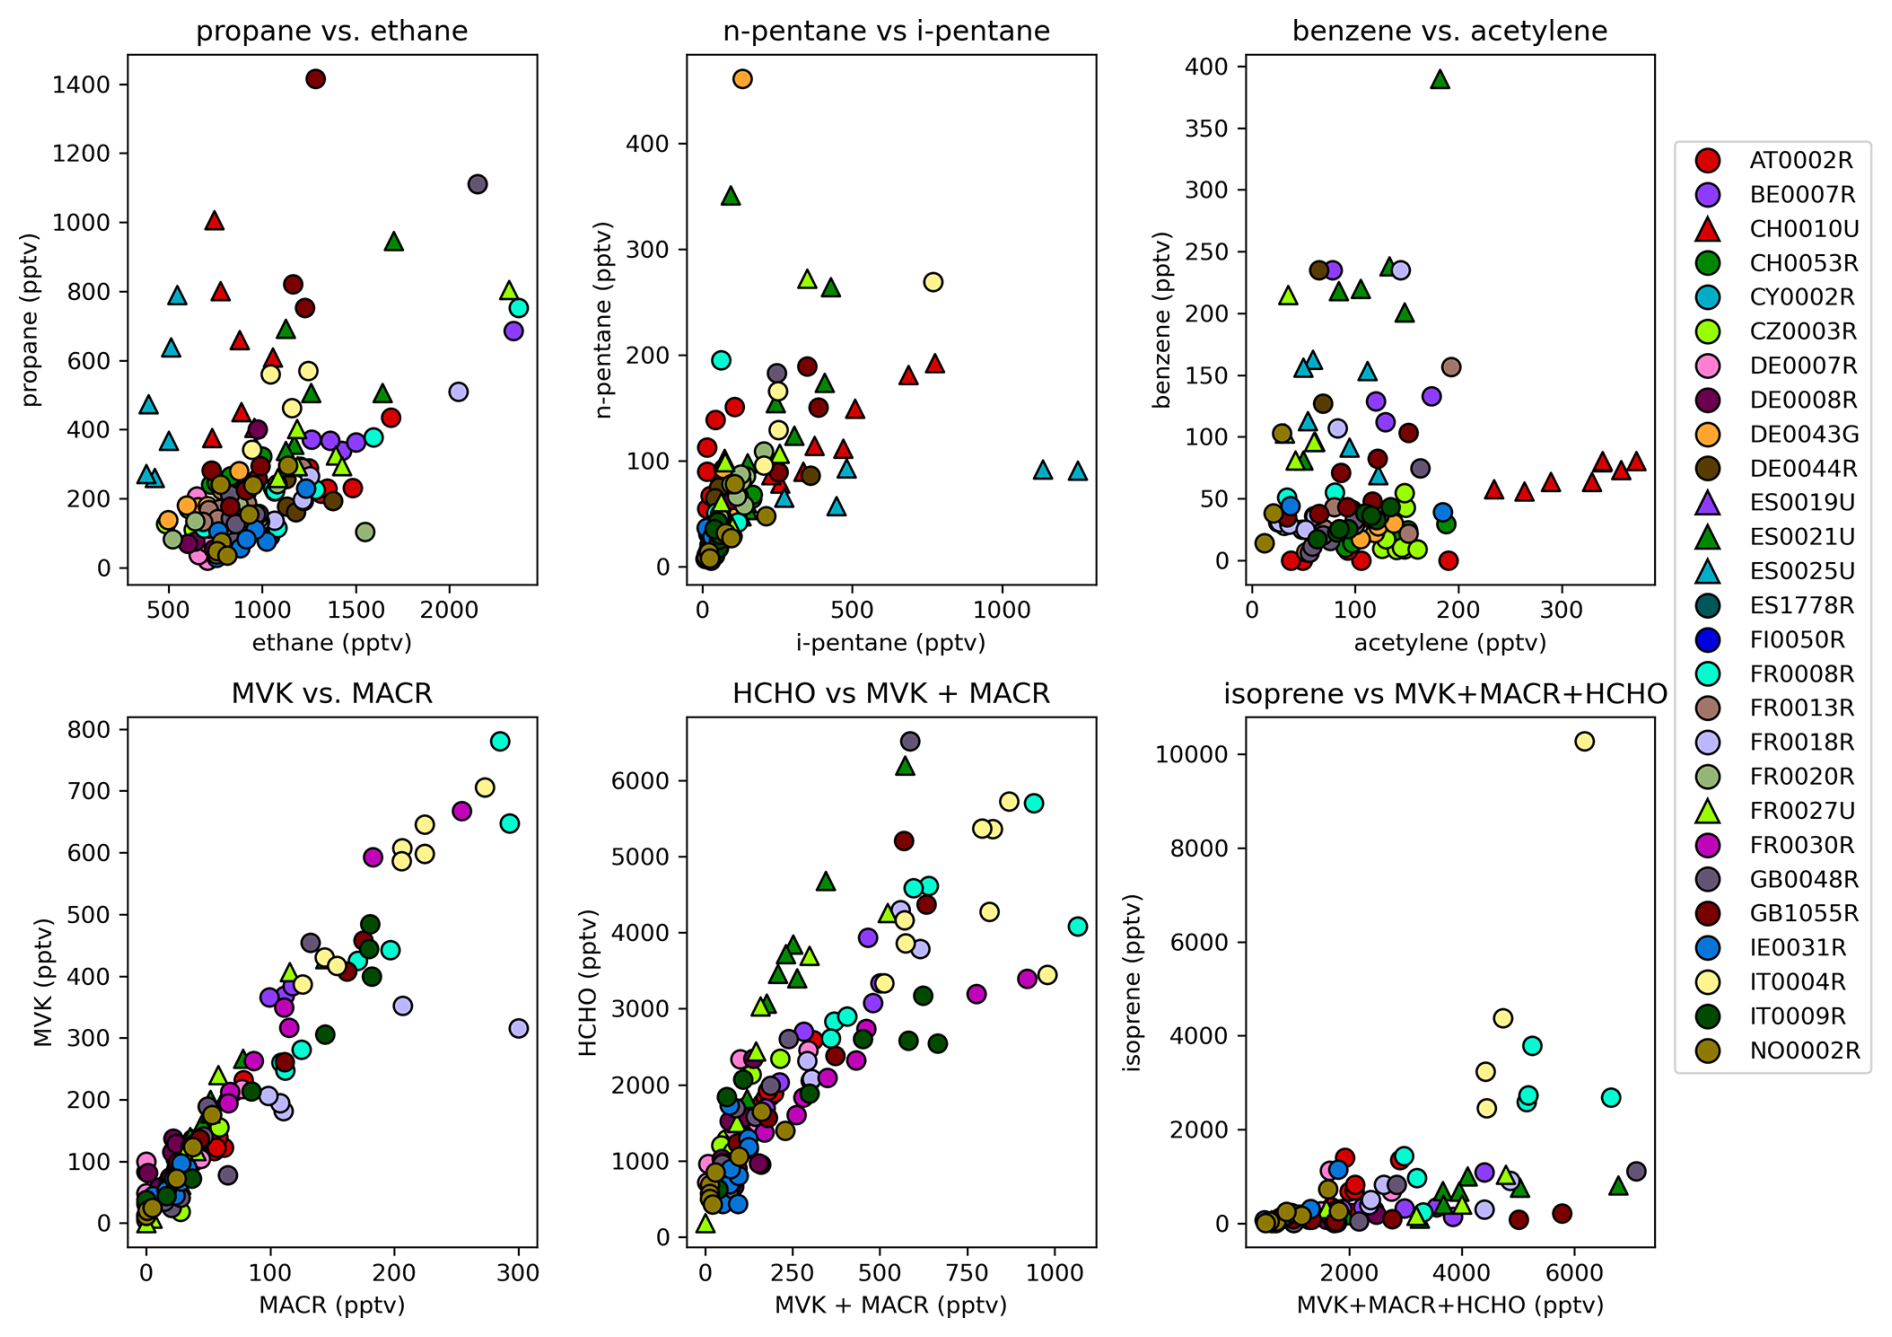
Figure 6Ratio of selected VOCs for daily-averaged concentrations. Urban sites are marked as triangles. Note that VOC concentrations at ES0025U are divided by five.
A correlation between ethane and propane was observed at most sites, consistent with both species being influenced by leakage from the production and use of oil and natural gas. However, because propane's atmospheric lifetime is approximately one-fourth that of ethane (Ge et al., 2024), higher propane/ethane ratios are indicative of proximity to local sources. This is clearly seen at urban sites such as Zürich (CH0010U), Madrid (ES0021U), and Bilbao (ES0025U), as well as at the regional background site Auchencorth Moss (GB0048R), as also documented in earlier studies (Derwent et al., 2007) .
The -pentane ratio further distinguishes between source types (Baker et al., 2008). Most regional and rural sites showed values between 1 and 2, consistent with mixed anthropogenic influences, while Zürich (CH0010U) exhibited a higher ratio (∼ 3.6) typical of urban or traffic emissions. In contrast, Bilbao (ES0025U) displayed an unusually high ratio (∼ 7.6), suggesting additional local influences such as liquefied petroleum gas (LPG) handling, petrochemical activity, or harbour emissions.
The benzene-to-acetylene ratio is often used within ACTRIS as a QA/QC indicator, since both compounds originate from incomplete combustion and have comparable atmospheric lifetimes. A ratio around 0.3 is typically expected for well-mixed combustion sources (Reiman et al., 2018), while significant deviations may reflect either measurement issues (e.g., acetylene breakthrough) or differences in emission source profiles. In our dataset, ratios varied widely (0.1–3.2) across Europe. Low ratios at Zürich (CH0010U) suggest strong local acetylene sources, plausibly linked to nearby human activities such as restaurants and outdoor smoking, while elevated ratios at Bilbao (ES0025U), ATOLL Villeneuve d'Ascq (FR0027U), and Melpitz (DE0044R) indicate benzene-rich emissions, likely related to industrial or solvent use rather than measurement artefacts.
Some of the first-generation photooxidation products of isoprene, methacrolein (MACR) and methyl vinyl ketone (MVK), are further oxidized to formaldehyde and other products (Wennberg et al., 2018; Wolfe et al., 2016). When isoprene is the dominant source, the MVK/MACR ratio is typically around two (Ling et al., 2019). A linear regression of MVK againstMACR for all sites shown in Fig. 6 (bottom left), yielded a slope of 2.32 ± 0.07, consistent with this expected relationship and confirming isoprene as their main precursor.
Examining the relationship between MVK + MACR and their oxidation product formaldehyde (HCHO) shows a fairly strong correlation across sites, with the HCHO (MVK + MACR) slope of 4.7 ± 0.3 (Fig. 6, bottom middle). Formaldehyde is produced secondarily from the oxidation of isoprene (both directly and through MVK and MACR), methanol, methane, and other hydrocarbons, but it can also have primary contributions from combustion and volatile chemical products (VCPs). Some sites, such as Madrid (ES0021U) and ATOLL Villeneuve d'Ascq (FR0027U), show somewhat elevated HCHO concentrations, likely due to influence from anthropogenic sources. At several locations, the correlation between MVK + MACR and HCHO weakens at high MVK + MACR levels. This may reflect nearby isoprene sources where photochemical processing has not yet produced large amounts of HCHO, and/or enhanced HCHO loss under hot, sunny conditions through photolysis and OH oxidation. Ispra (IT0004R) and Donon (FR0008R) stand out from the other sites when comparing the sum of MVK, MACR, and HCHO relative to isoprene (Fig. 6, bottom right), likely reflecting higher isoprene emissions and differences in photochemical age. While anthropogenic isoprene sources are generally minor, episodic petrochemical or solvent emissions could sporadically contribute at some sites.
3.2.2 Temporal variations of the VOCs
Long-term VOC observations are available at only a subset of the IMP sites, limiting the ability to contextualise 2022 levels against typical July conditions. Between one and seven of the IMP sites have reported VOC data to EMEP and/or ACTRIS for at least four years during the period 2015–2021 (Solberg et al., 2024), depending on the compound. At these sites, the midday (12:00–16:00 UTC) July averages indicate that NMHCs and aromatics during the IMP week were broadly comparable to long-term July levels. For O-VOCs, only Peyrusse Vieille (FR0013R) has a sufficiently long time series. At this site, acetone and acetaldehyde concentrations in 2022 were three and five times higher, respectively, than during July 2015–2021. For isoprene, long-term measurements are available at four sites. At Hohenpeissenberg (DE0043G) and Peyrusse Vieille (FR0013R), isoprene levels were approximately twofold and fourfold higher, respectively, during the IMP week compared with long-term July averages. In contrast, the Swiss site (CH0053R) and the Finnish site (FI0050R) showed concentrations consistent with typical July conditions.
The temporal evolution of the VOC groups across Europe during the heatwave is illustrated in Fig. S7. As the high-pressure system moved northward, elevated VOC levels developed in central and northwestern Europe (e.g., France, Germany, the UK) during 16–19 July (Fig. S7). This progression broadly followed the large-scale warming pattern, although the northward signal was less pronounced than for ozone (Fig. 1). Most VOC groups show somewhat elevated concentrations across northwestern Europe during the final days of the period, as exemplified in Fig. 7 by the sites in Norway (NO0002R), the UK (GB1055R), Belgium (BE0007R), and northern Germany (DE0007R), likely reflecting the transport of air masses influenced by southerly winds. Donon (FR0008R), which is also located in the northwest, does not show clear temporal variations, although levels are somewhat elevated at the end of the week. Interpretation of these changes is complicated by the differing atmospheric lifetimes of VOCs, making it difficult to distinguish between local and long-range influences.
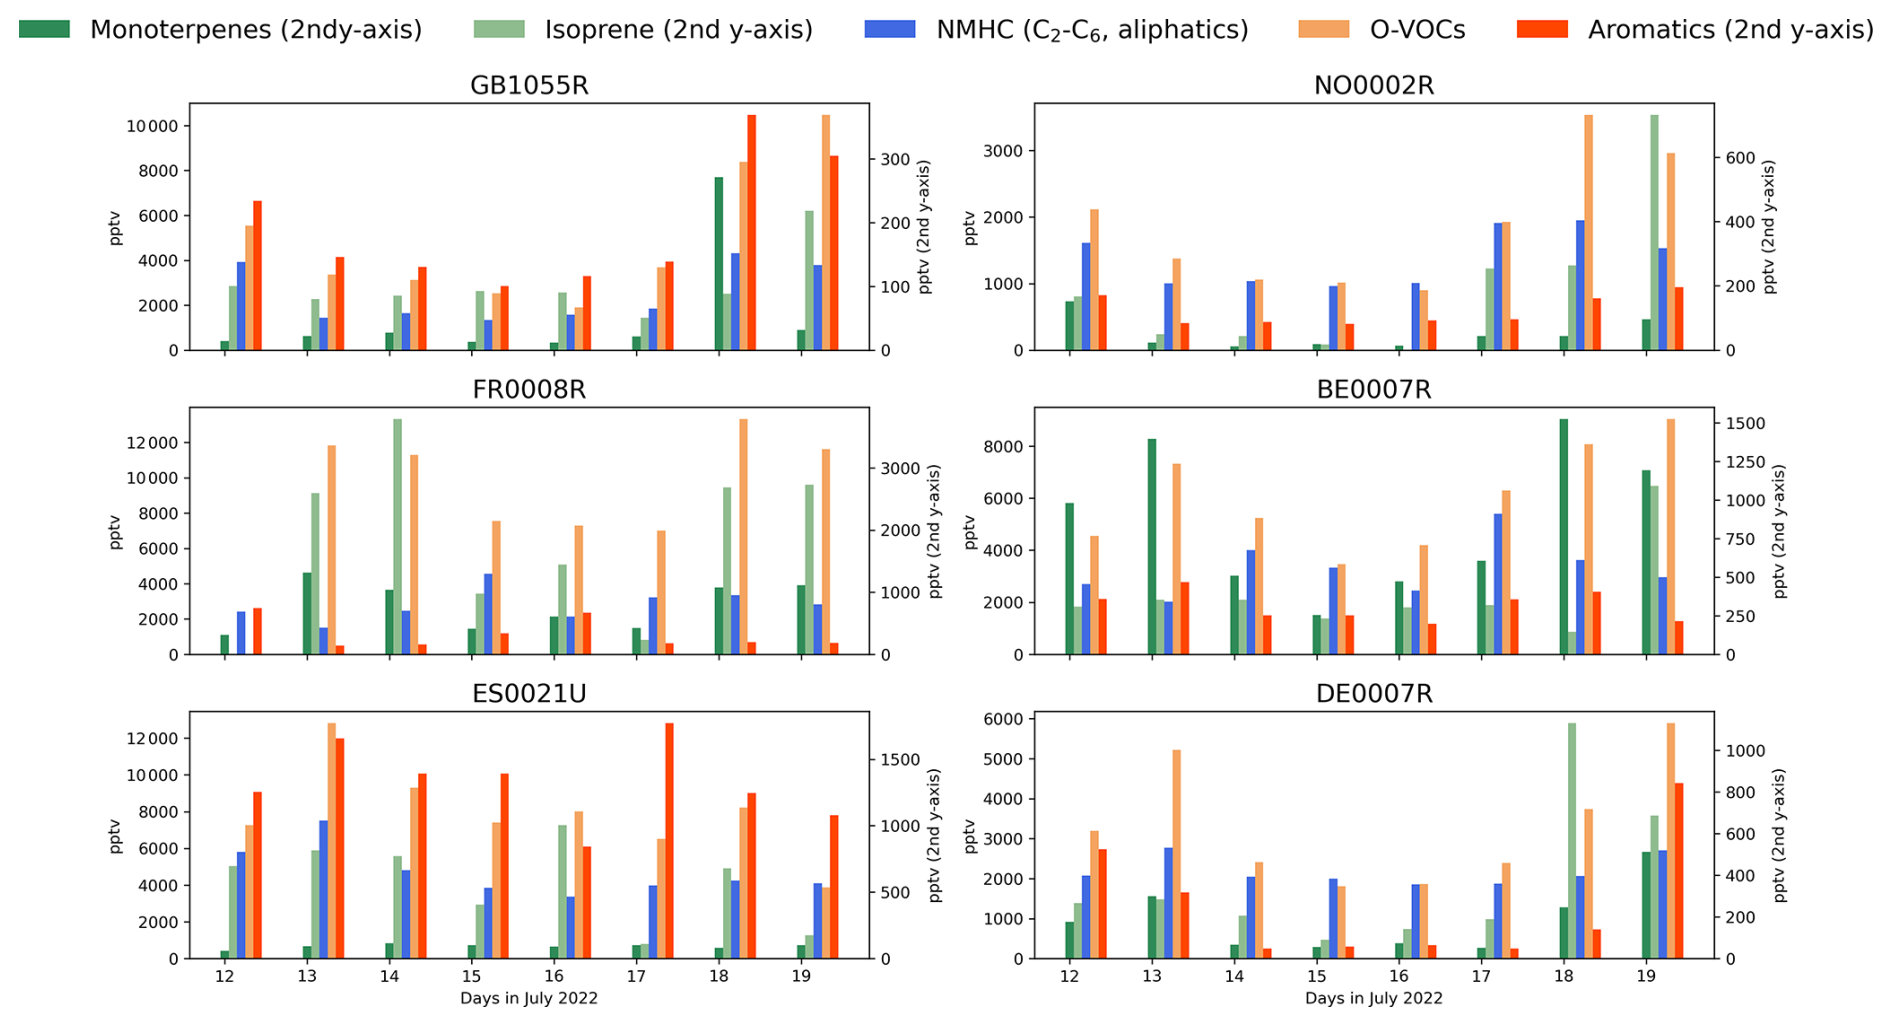
Figure 7Temporal variations of selected VOCs and VOC groups at 6 sites across Europe on 12–19 July.
The isoprene emissions recently published by Hamer et al. (2026) show a similar spatial development as temperature during the IMP week (12–19 July; Fig. S1), with the highest emissions over Portugal, northern Spain, and southern France at the start of the week, increasing across central Europe as the heatwave progressed northward (Fig. S8). Around half of the sites show a significant correlation between the in-situ observed isoprene concentrations and the modelled emissions (Fig. S9). The sites furthest from the continent (NO0002R, GB0048R, FI0050R) show the best correlations, suggesting that these were mainly influenced by the regional increase in biogenic isoprene emissions associated with rising temperatures. Bilbao (ES0025U) also shows a strong correlation, although most Spanish sites exhibit weaker relationships. It is difficult to establish a direct correspondence between emissions and observed concentrations within the same model grid cell, despite the relatively short atmospheric lifetime of isoprene. A forthcoming model intercomparison study within the EMEP TFMM framework will address these aspects in more detail.
The strongest temporal gradients are seen for O-VOCs, with distinctly higher concentrations in central and northwestern Europe toward the end of the week (Fig. S7). Monoterpenes exhibited a more scattered spatial pattern and weaker temporal variability. High monoterpenes levels at the start of the heatwave were found not only in southern Europe but also in central Europe and in Finland on 12–13 July.
While ozone concentrations during the heatwave were strongly linked to the movement of the high-pressure system and associated air-mass transport, VOCs displayed more diverse temporal patterns. This reflects the variety of VOC sources, formation mechanisms, and sinks, including anthropogenic emissions, biogenic processes, and secondary formation under different photochemical conditions.
3.3 Ozone production and losses
To explore effects of changes in VOC and NOx concentrations on the ozone production rate, we simulated the local ozone production at different VOC and NO2 reactivity levels using the MCM v3.3.1 boxmodel and compared it to the VOC and NO2 reactivities observed at the participating sites similar as outlined by Ehlers et al. (2016). Ozone production rates calculated for 21 sites are shown in Fig. S10. The highest ozone concentrations were typically located in regions with the highest ozone production rates. However, there were large variations between sites. For example, Monte Cimone (IT0009R) showed high ozone levels, but little ozone formation, probably due to ozone being transported to the site. In contrast, lower O3 daily maxima were observed at e.g. Illmitz (AT0002R) and La Coulonche (FR0018R) while higher O3 production rates were calculated at these sites.
Most sites in this study are background locations where reactive ozone-forming VOCs, particularly those of anthropogenic urban origin, may already have undergone atmospheric oxidation. This limits our ability to assess the role of specific emission sources in ozone formation. However, the measurements still provide useful information on the relative importance of the remaining VOCs present at the sites. We estimated the commonly used ozone formation potential (OFP) of the measured VOCs using literature-based Photochemical Ozone Creation Potential (POCP) values (Holland et al., 2023; Jenkin et al., 2017). Representing POCP as fixed values is a substantial simplification, as the actual ozone formation depends strongly on atmospheric conditions such as NOx concentrations, VOC NOx ratios, and relative humidity. Nevertheless, these estimates offer an approximation of the relative contribution of different VOC groups and components to ozone formation under typical conditions. Figure 8 shows that isoprene, NMHCs, and O-VOCs contribute most to the calculated OFP at the participating sites, with aromatics mainly important in the urban areas. Among individual compounds, isoprene was on average twice as influential as ethene and formaldehyde, followed by acetaldehyde, propene, and ethane. When categorising the NMHCs according to their dominant sources, combustion emerges as the most important. Overall, biogenic, combustion, and mixed sources (mainly O-VOCs) contribute roughly equally to the total OFP (Fig. 8). It should be noted that the source categorization is uncertain as many VOCs have multiple primary and secondary origins. The classification is therefore intended as an indicative grouping of dominant source types. The VOC source assignments are provided in Table S3.
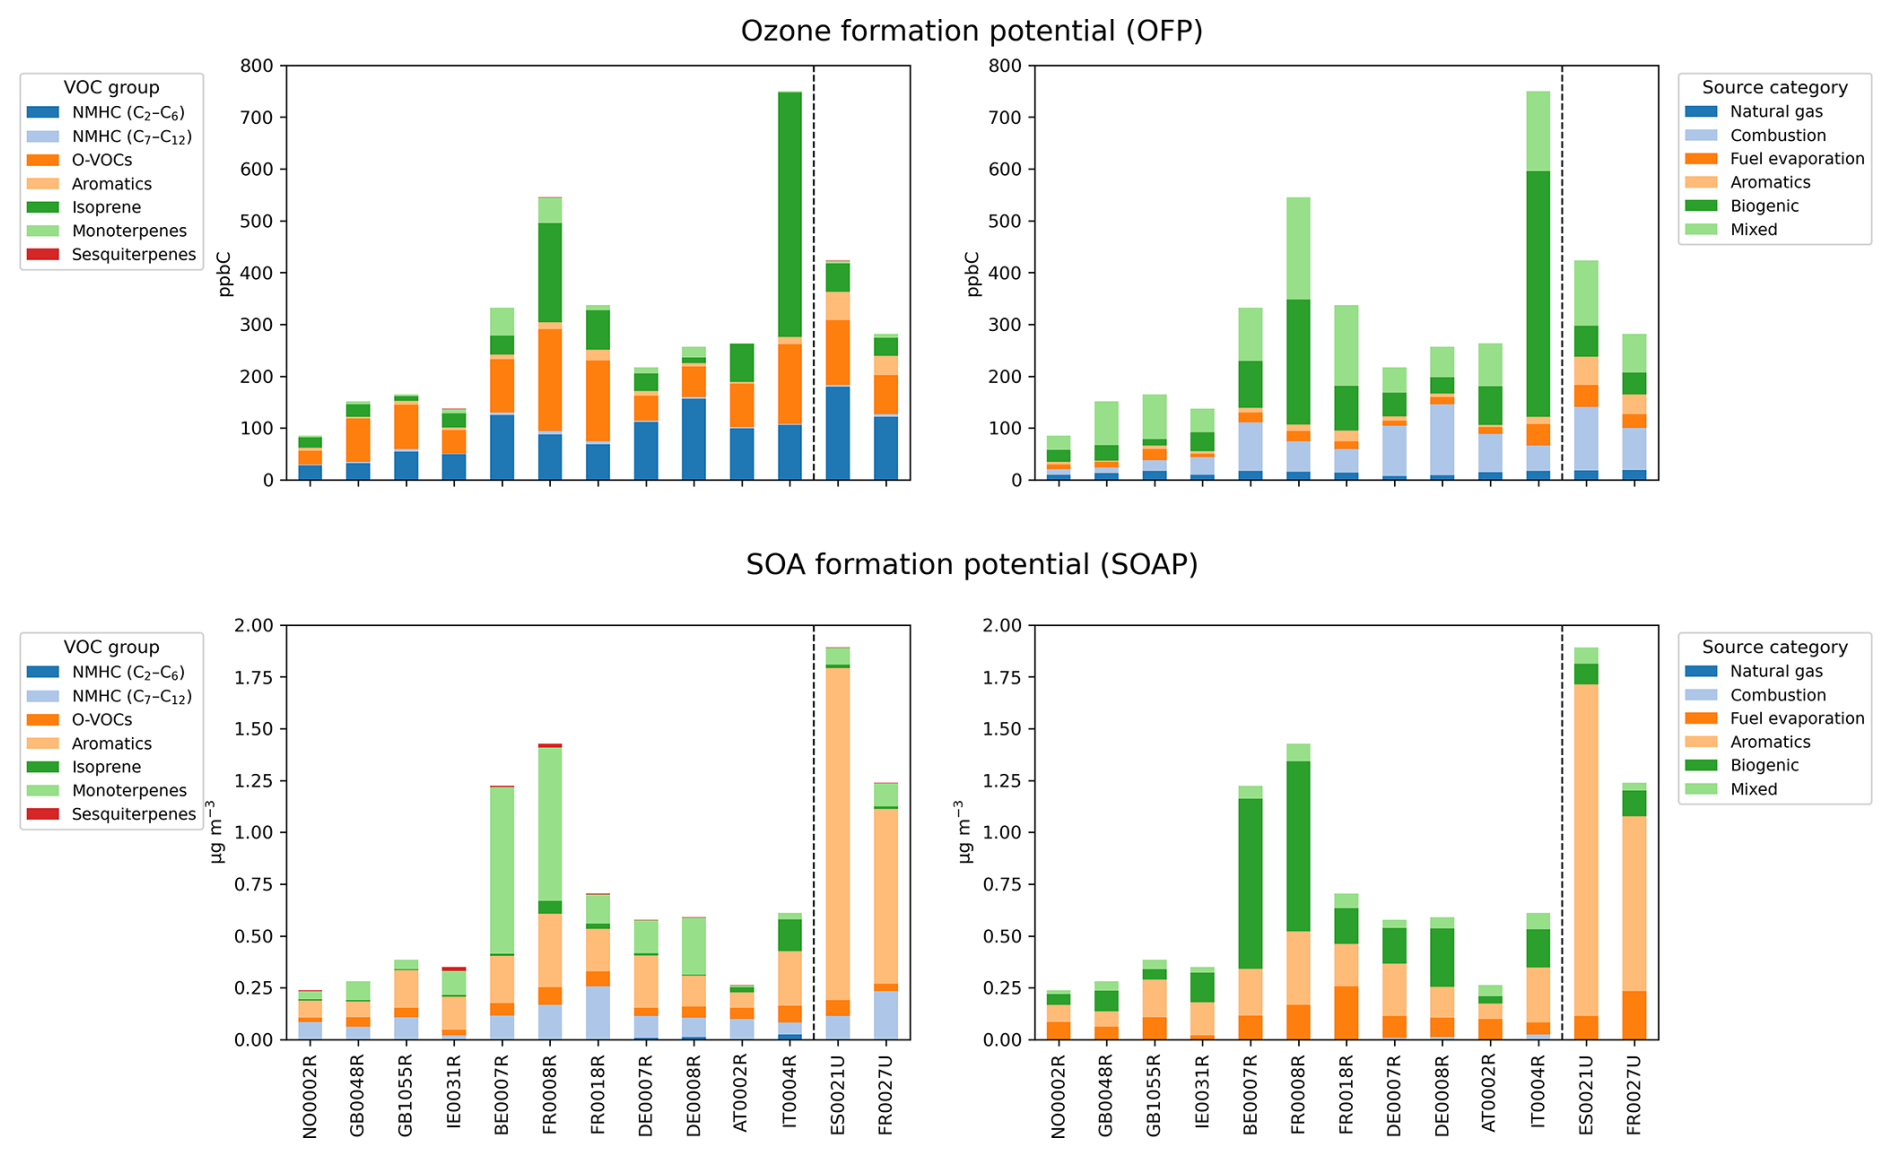
Figure 8The ozone and SOA formation potentials related to (1) the sum of VOCs in the different component groups (left figures), averaged over 12:00–16:00 UTC, 12–19 July 2022 and (2) to the main emission source categories, the VOCs. Natural gas includes propane and ethane. Fuel evaporation covers branched/normal alkanes in the gasoline/distillate range (C4–C12). Combustion includes unsaturated light hydrocarbons (butenes, pentenes, hexenes, 1,3-butadiene), acetylene, and propene. Aromatics are grouped together (toluene, xylenes, ethylbenzene, trimethylbenzenes, styrene, benzene) since they come from combustion, solvent use, and fuel evaporation. Biogenic includes isoprene mono- and sesquiterpenes Mixed is used for O-VOCs because they're largely secondary with multiple precursors/sources.
To better understand the processes that control observed ozone levels, we used the ADCHEM model (Chap. 2.3) to quantify ozone production and loss over the past three days upwind of the 15 measurement stations indicated in Table 1. Model performance compared to observations is summarized in Tables S4–S5. The model underestimates ozone near oceanic sites (e.g., Birkenes (NO002R), Mace Head (IE0031R)) with air masses from the open sea, and overestimates ozone at Ispra (IT0004R) in the Po Valley, mainly because of misrepresented nighttime conditions. At the mountain site of Hohenpeissenberg (DE0043G), the model likely underestimates nighttime ozone due to inadequate representation of the free troposphere influence. Modelled and measured VOC concentrations (data not shown) agree reasonably well in northern and central Europe, but NMHCs and aromatics are generally overestimated in southern regions, particularly at urban and suburban sites. This could indicate overestimated emissions and limited vertical mixing. Aromatic VOCs tend to be underestimated in northwestern Europe, while monoterpenes show large site-to-site differences, likely reflecting the influence of local sources and the coarse resolution of the emission inventory.
Figure 9 shows the modelled campaign-averaged ozone production expressed in Dobson Units (DU). Net ozone production (production minus losses) is shown for the basecase as well as for sensitivity simulations without isoprene, without BVOCs, and with half and twice the NOx emissions. At all stations except Hyytiälä (FI0050R) in the Finnish boreal forest, ozone production exceeds sinks, resulting in positive net ozone production. Across all sites, BVOC emissions generally enhanced ozone production and concentrations, as demonstrated by comparing the basecase to simulations without terrestrial BVOC emissions. This effect was particularly pronounced at the southern European stations Ispra (IT0004R), Montseny (ES1778R), and Madrid (ES0021U) (see Fig.S11 for details on the temporal variations at each site).
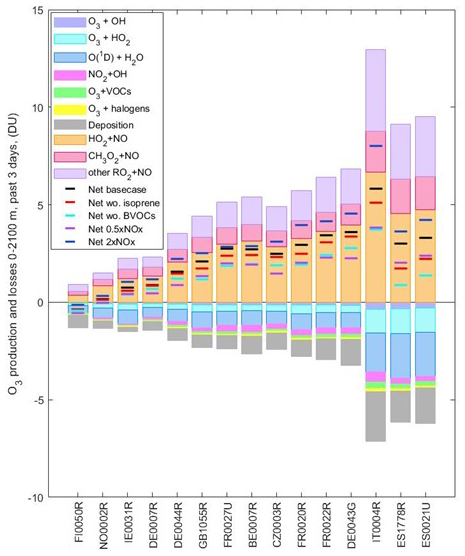
Figure 9Modelled (ADCHEM) 8 d averaged cumulative time-integrated O3 production and losses in the lowest 2100 m of the atmosphere for the past 3 d upwind of 15 targeted measurement stations. Ozone is lost by reactions with OH, HO2, unsaturated VOCs and various halogen (Br, I, Cl) radicals, when O(1D) reacts with H2O and when NO2 reacts with OH. Ozone is produced when HO2, CH3O2 and other RO2 radicals react with NO. Also shown by horizontal lines are the net ozone formation (production minus losses) from the basecase simulations (Net basecase), for simulations without terrestrial biogenic emissions of isoprene (Net wo. isoprene), without any terrestrial BVOC emissions (Net wo. BVOC) and with anthropogenic NOx emissions scaled with a factor of 0.5 or 2.0 (Net 0.5xNOx and Net 2× NOx, respectively).
At Hyytiälä (FI0050R), ozone production was relatively insensitive to BVOC emissions but highly sensitive to NOx. Doubling NOx emissions resulted in an average 20 % increase in ozone concentrations, while halving them led to a 15 % reduction (Fig. 10). This behaviour aligns with the study of Zhang et al. (2024), who showed that ozone production in air masses arriving at Hyytiälä during summer 2018 was generally NOx-limited. In most regions, doubling NOx emissions increased ozone production and surface ozone concentrations, while halving NOx emissions consistently lowered ozone production and concentrations at all stations. This indicates that ozone formation was generally NOx-limited during the campaign. The only exceptions were Vielsalm (BE0007R) and ATOLL Villeneuve d'Ascq (FR0027U), where average surface ozone concentrations decreased slightly in the 2× NOx scenario; at some stations including Chilbolton (GB1055R), such reductions were occasionally observed. However, during the episodes with the highest ozone concentrations, the 2× NOx simulations always resulted in substantially higher ozone concentrations (additional 10 to 36 ppbv), while simulations without BVOCs led to substantially lower ozone (reduction of 2 to 40 ppbv) compared to the basecase. This suggests that the exceptionally high ozone peaks, particularly toward the end of the campaign, were driven by a combination of high (B)VOC emissions and anthropogenic NOx. These findings indicate that further reductions in NOx emissions would be beneficial for lowering ozone levels at a large range of sites across Europe, especially during extreme pollution events. On average, the model overestimated NO2 concentrations by 21±27 % at rural sites (Table S5). One possible explanation of this discrepancy could be uncertainties in the quantification of NO2 at sites using molybdenum converters (Table 1), where concentrations may be overestimated due to conversion of other reactive nitrogen oxide compounds (Reiman et al., 2018). However, no systematic differences in model–measurement comparison were found between sites using molybdenum and photolytic converters.
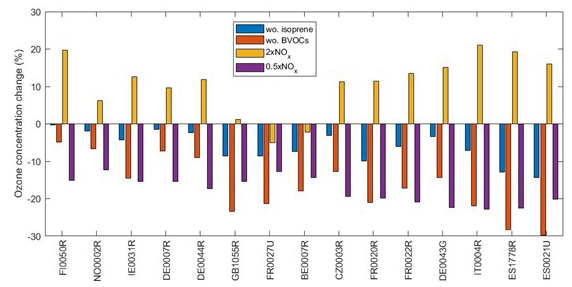
Figure 10Modelled 8-day averaged surface ozone concentration changes relative to the basecase simulations for 4 different model sensitivity tests: without biogenic terrestrial isoprene emissions (wo. isoprene), without terrestrial BVOC emissions (wo. BVOCs), with 2 times higher anthropogenic NOx emissions (2× NOx) and with 50 % lower anthropogenic NOx emissions (0.5× NOx).
3.4 Carbonaceous aerosols
To explore the spatial and temporal distribution of carbonaceous aerosols during the IMP2022, EC/OC was measured at all the sites with tracer analysis except at Mt Cimone (IT0009R), 22 in total (Table 1). Consistent with previous findings (Yttri et al., 2007), OC and EC concentrations decreased along the south-to-north transect, with levels at the three southernmost sites being 5 to 6 times higher than the northernmost sites. However, OC and EC concentrations increased at central and northern European sites during the IMP week, as was observed for ozone and some VOCs, in alignment with the heatwave plume (Fig. S2). The ratio remained relatively stable throughout the heatwave (Fig. S2), averaging 3 %–5 % at most French and German regional sites, and 10 %–15 % at urban sites and the Ispra (IT0004R) regional site. The generally low ratios suggest a minor influence of primary organic aerosol (POA) from combustion, a dominant contribution from SOA, and some influence from primary biological aerosol particles (PBAP).
During the summer of 2022, EC and OC levels were consistent with long-term July averages at sites with multi-year data (Table 2). However, Montseny (ES1778R) and Ispra (IT0004R) recorded particularly high OC levels, corresponding to the 95th and 83rd percentiles of their long-term means, respectively.
Table 2Mean concentrations of OC and EC (in µgC m−3) during IMP Summer 2022 and corresponding percentile of the long-term mean for July 2010–2020.
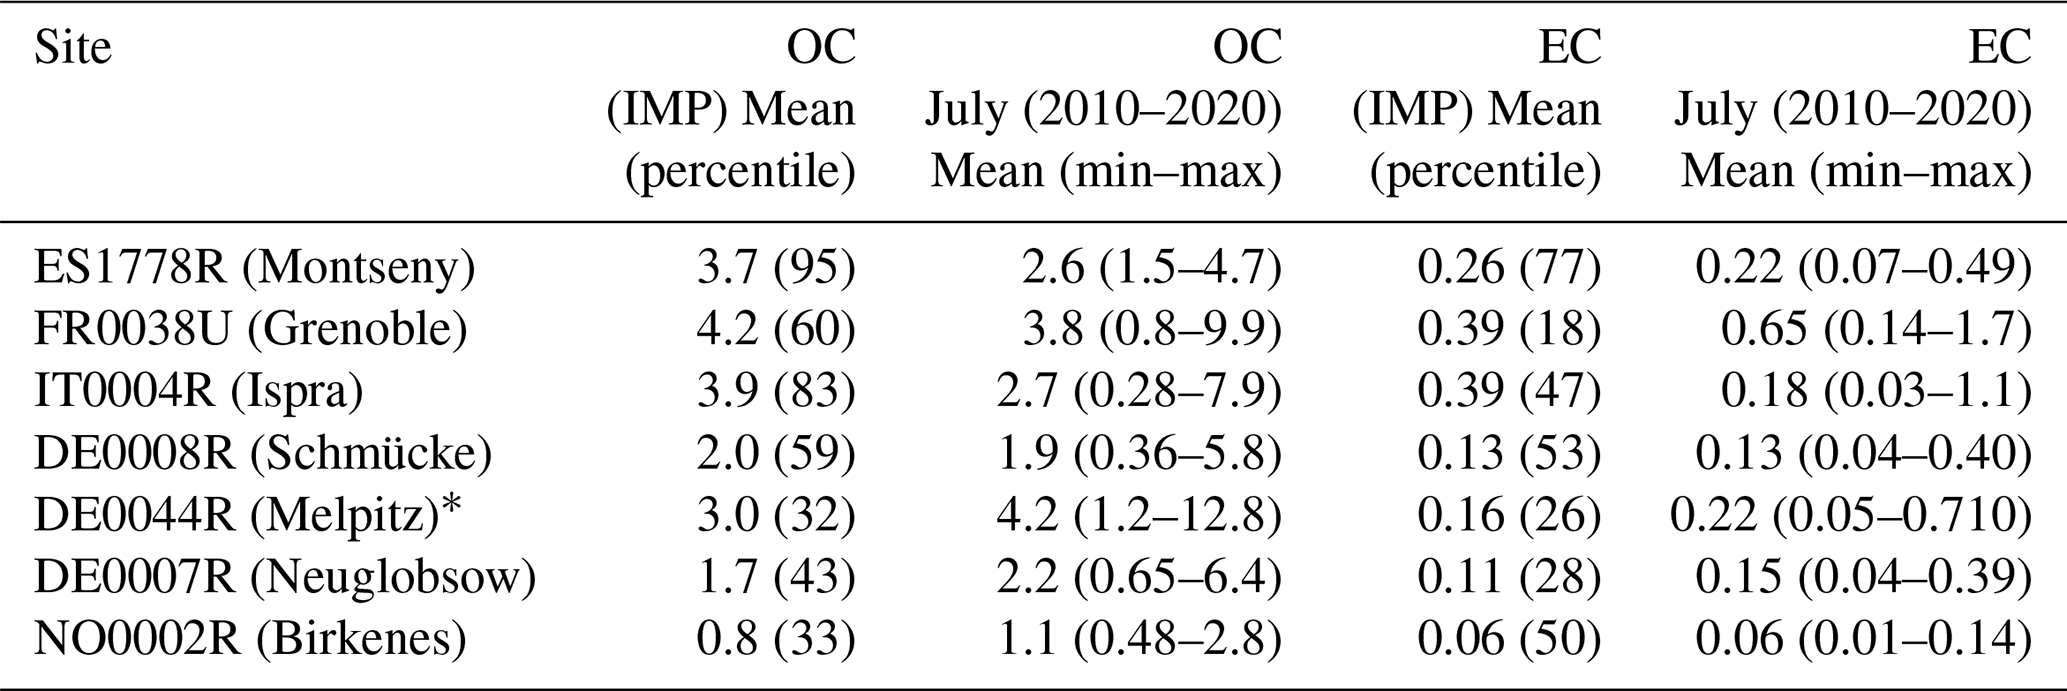
* Measurements from 2013–2020.
Carbonaceous aerosols constitute the major fraction of PM during the IMP, contributing approximately 34 ± 6 % in PM10 and 72 ± 27 % in PM2.5, based on a conversion factor of 1.8 from OC to OM (Fig. S12). Note that using one factor for all sites is likely introducing additional uncertainties since the chemical composition may vary between sites but was adopted for transparency. The undetermined mass in PM10 size was relatively high, averaging around 50 %, whereas in PM2.5 it was only about 3 %. It should be noted, however, that at some sites, the measured PM2.5 mass exceeded the sum of the component masses, indicating bias in some of the measurements. The substantial part of undetermined mass in PM10 can partly be attributed to mineral dust (MD). Only a few sites measured aluminium and/or iron, which are commonly used to estimate MD. In total, twelve EMEP sites reported iron in PM10 in July 2022, of which two were IMP sites with PM10 measurements. The average MD contribution across these twelve sites during the IMP period was 13 ± 6 % (data not shown), with the highest concentrations observed in southern Europe.
3.4.1 Organic tracers
Approximately 50 organic species were analysed to assess the contributions of various OA sources during the heatwave. These included source-specific tracers such as levoglucosan, indicative of biomass burning emissions (Simoneit et al., 1999); sugars and sugar alcohols, linked to PBAP (Primary Biological Aerosol Particles) (Elbert et al., 2007; Graham et al., 2003; Sánchez-Ochoa et al., 2007); and 2-methyltetrols (2-MT) and 3-methyl-1,2,3-butane-tricarboxylic acid (3-MBTCA), formed from the oxidation of isoprene and α-pinene, respectively (Paulot et al., 2009; Szmigielski et al., 2007). The spatial distribution of mean concentrations for selected tracers during the IMP is shown in Fig. 11. The upper panels display 3-MBTCA and 2-MT levels, and these BSOA tracers decreased along the south-to-north transect, reflecting the expected reduction in BVOC emissions poleward. At most sites (16 out of 23), the mean concentration of 2-MT was equal to or exceeded that of 3-MBTCA.
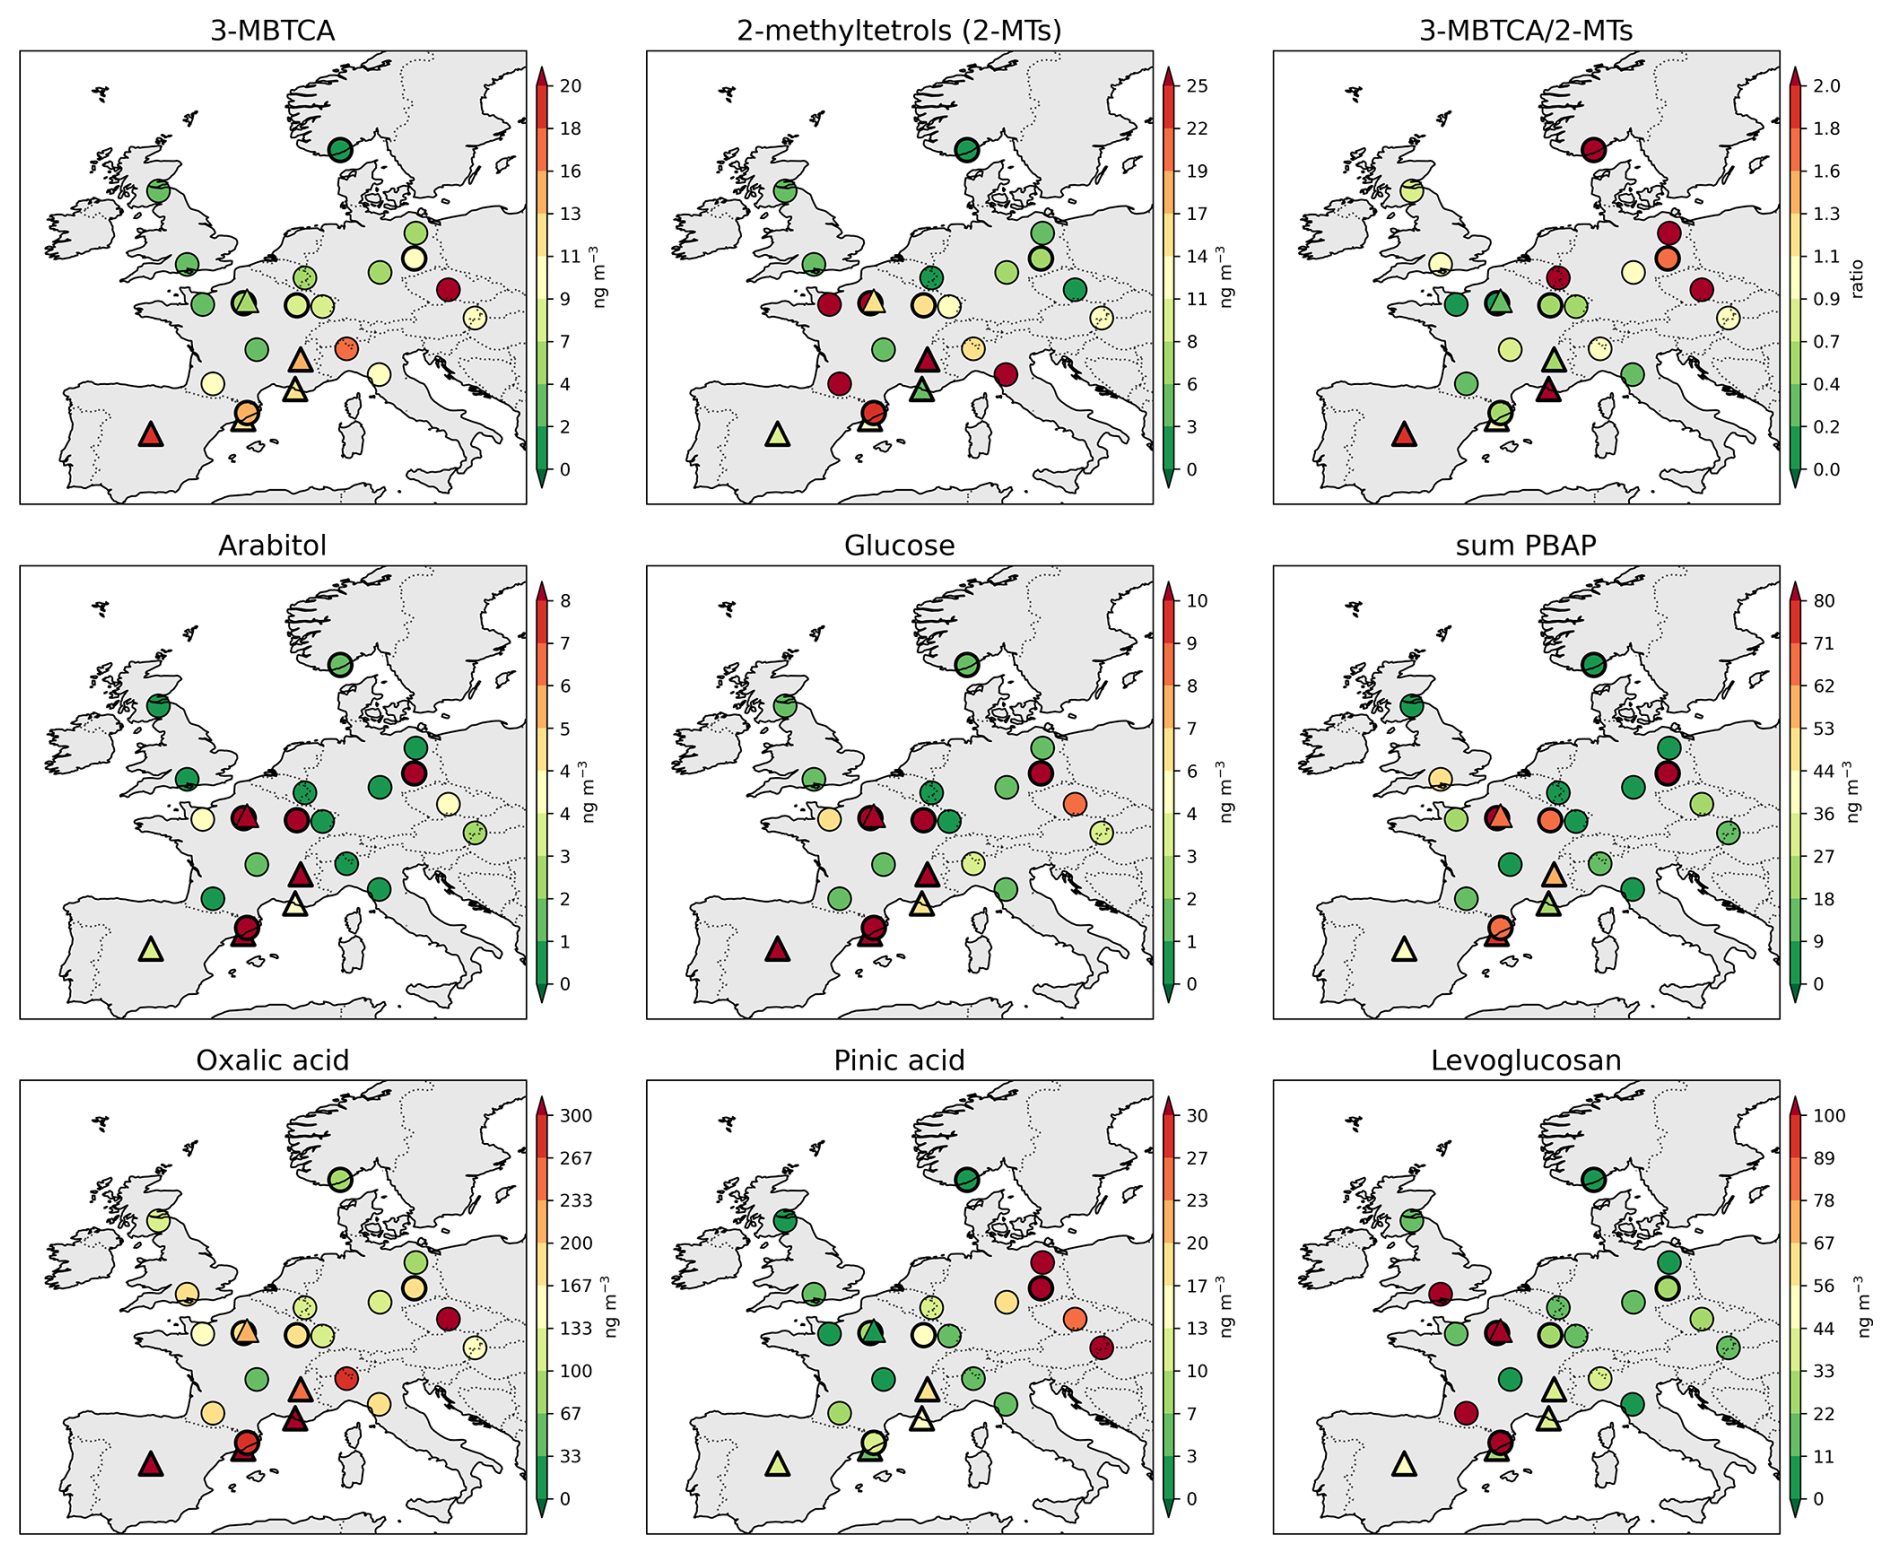
Figure 11Spatial distribution of the mean concentration of selected organic tracers, their respective ratio, and the sum of PBAPs. Urban sites are denoted with a triangle, and sites with a PM10 cut-off size are marked with a thicker border than PM2.5.
The middle panels in Fig. 11 show arabitol, glucose, and the sum of 13 sugars and sugar alcohols indicating the distribution of PBAP, while the bottom panels present oxalic acid, pinic acid, and levoglucosan. The temporal development of a selection of organic tracers are found in Fig. S13–14.
Although oxalic acid can originate from primary sources, its atmospheric presence is primarily driven by secondary formation. Like 3-MBTCA it shows a clear north-south gradient. In contrast, for pinic acid, a first-generation oxidation product of α-pinene (Vestenius et al., 2014 and references therein), concentrations were highest in central and eastern Europe. This spatial distribution aligns with the 3-MBTCA/2-MT ratio, which highlights the relative importance of BSOA from α-pinene in these regions. Interestingly, α-pinene does not show a spatial pattern similar to that of pinic acid or 3-MBTCA (Fig. S5). Furthermore, the relationships between the daily ratios of concentrations between pinic acid and α-pinene, and between 3-MBTCA and α-pinene, vary notably across sites (Fig. S15). Similar variability is observed for β-pinene versus cis-pinonic acid and for isoprene versus 2-MT (Fig. S15). This discrepancy arises from multiple factors, including BVOC emissions, photosynthetically active radiation, ambient temperature, mixing layer height, yields, formation pathways, gas-to-particle partitioning, and atmospheric lifetimes (El Haddad et al., 2011; Hellén et al., 2024). In particular, oxidation during atmospheric transport leads to reduced concentrations of the precursor and increased concentrations of oxidation products downwind of the emission source.
Mean levoglucosan concentrations exceeded 100 ng m−3 at five sites spanning northern Spain, France, and southern England, with 24 h levels surpassing 700 ng m−3. These elevated concentrations were likely driven by several wildfires in Europe in July 2022, particularly in Portugal, Spain, and southwestern France (San-Miguel-Ayanz et al., 2023). The evolution of the wildfire plume is supported by EMEP model simulations, which show good agreement with the observed levoglucosan enhancements in France and the UK toward the end of the IMP week (Fig. S16). In contrast, other sites recorded much lower mean levoglucosan levels (4 to 50 ng m−3), consistent with typical levels during summer periods in rural areas (Golly et al., 2019).
PBAP tracers such as arabitol and glucose show similar variability, with elevated levels at individual sites (DE0044R and FR0020R), but no clear spatial gradient despite the highest concentrations seen in central and southern Europe (Fig. 11). Summed PBAP concentrations (arabitol, mannitol, glucose, trehalose, fructose, mannose, sucrose, maltose, rhamnose, lactose, sorbitol, adonitol, inositol, and melezitose) support patterns observed for individual markers, highlighting the importance of local sources such as vegetation, soil, and microbial activity (Samaké et al., 2020).
Methane-sulfonic acid (MSA) primarily originates from the oxidation of dimethyl sulfide (DMS) emitted by marine phytoplankton. The spatial distribution shows the highest concentrations in coastal areas (Fig. S14); however, some continental sites also exhibit elevated levels, suggesting additional terrestrial biogenic sources, such as DMS emissions during warm periods from soil, leaf litter, or anoxic lakes, as indicated by Golly et al. (2019).
Long-term tracer measurements are not available at most sites, which limits our ability to quantitatively distinguish heatwave-driven anomalies from typical July conditions.
3.4.2 Source apportionment of organic aerosols
The sum of all the measured organic tracers for each sample correlates quite well with OC concentrations (r2 = 0.67) during the IMP (Fig. S17), indicating that these compounds explained a large OA fraction. However, due to mixed origins, chemical degradation, and uncertainties in their spatial and temporal representativeness, relatively few of the measured tracers can be used directly to quantify contributions from different sources. Nevertheless, we used several of the most well-established organic tracers to apportion some of the OA mass. These scaling factors may vary with source composition and environmental conditions. The resulting source contributions should therefore be interpreted as estimates rather than precise quantitative apportionment.
We apportioned carbonaceous aerosol into biomass burning (BB) and fossil fuel combustion (FF) contributions using levoglucosan as the biomass burning tracer and factors derived from European studies (Zotter et al., 2014 and references therein), as shown in Eqs. (2) and (3). Elemental carbon from fossil fuel (ECFF) was calculated as total EC minus [ECBB] (Eq. 4), and [OCFF] was derived from [ECFF] using a factor of 0.6 (Eq. 5) from Gilardoni et al. (2011) and Yttri et al. (2011):
OC associated with primary biological aerosol particles (OCPBAP) was estimated from the five PBAP tracers (arabitol, mannitol, fructose, glucose, and trehalose) using an OC-to-PBAPTracer ratio of 6.4 (Eq. 6). Since trehalose concentrations were not measured during this IMP, they were estimated from arabitol concentrations using an arabitol-to-trehalose ratio of 2, based on European data (Yttri, 2025a, b, c). It is important to note that there is not necessarily a linear relationship between these compounds, and the ratio is different in other parts of the world. For example, a study at three sites on the Qinghai–Tibetan Plateau found no correlation between arabitol and trehalose (Zhu et al., 2022).
SOA (OCSOA) was then derived by subtracting the sum of the primary OC fractions (BB, FF and PBAP) from the total OC, as shown in Eq. (7):
SOA includes both the biogenic (BSOA) and the anthropogenic (ASOA) fractions. BSOA from α-pinene oxidation (OCBSOA (α-pinene)) was estimated using 3-MBTCA concentrations and an OC-to-3-MBTCA conversion factor of 57 (Eq. 8), based on Positive Matrix Factorization (PMF) derived source apportionment (Borlaza et al., 2021). The remaining SOA (OCSOA rest) is primarily attributed to oxidation of isoprene, other terpenes beyond α-pinene, and anthropogenic precursors.
Figure 12 illustrates the average apportioned OA categories for all sites with both tracer and OC measurements (in PM10 or PM2.5). The sum of SOA is indicated with a red border. OCSOA constituted the major fraction of OC, with averages of 84 ± 11 % in PM2.5 and 75 ± 11 % PM10. Biomass burning contributed similarly to both size fractions (ca. 10 % on average), but with large site-to-site differences. For example, [OCBB] contributed nearly 25 % or more of OC at sites in Spain (ES1778R), France (FR0013R and FR0041U), and the UK (GB1055R) during the IMP week, consistent with occurrences of wildfires in western Europe during this period (San-Miguel-Ayanz et al., 2023 and Fig. S16).
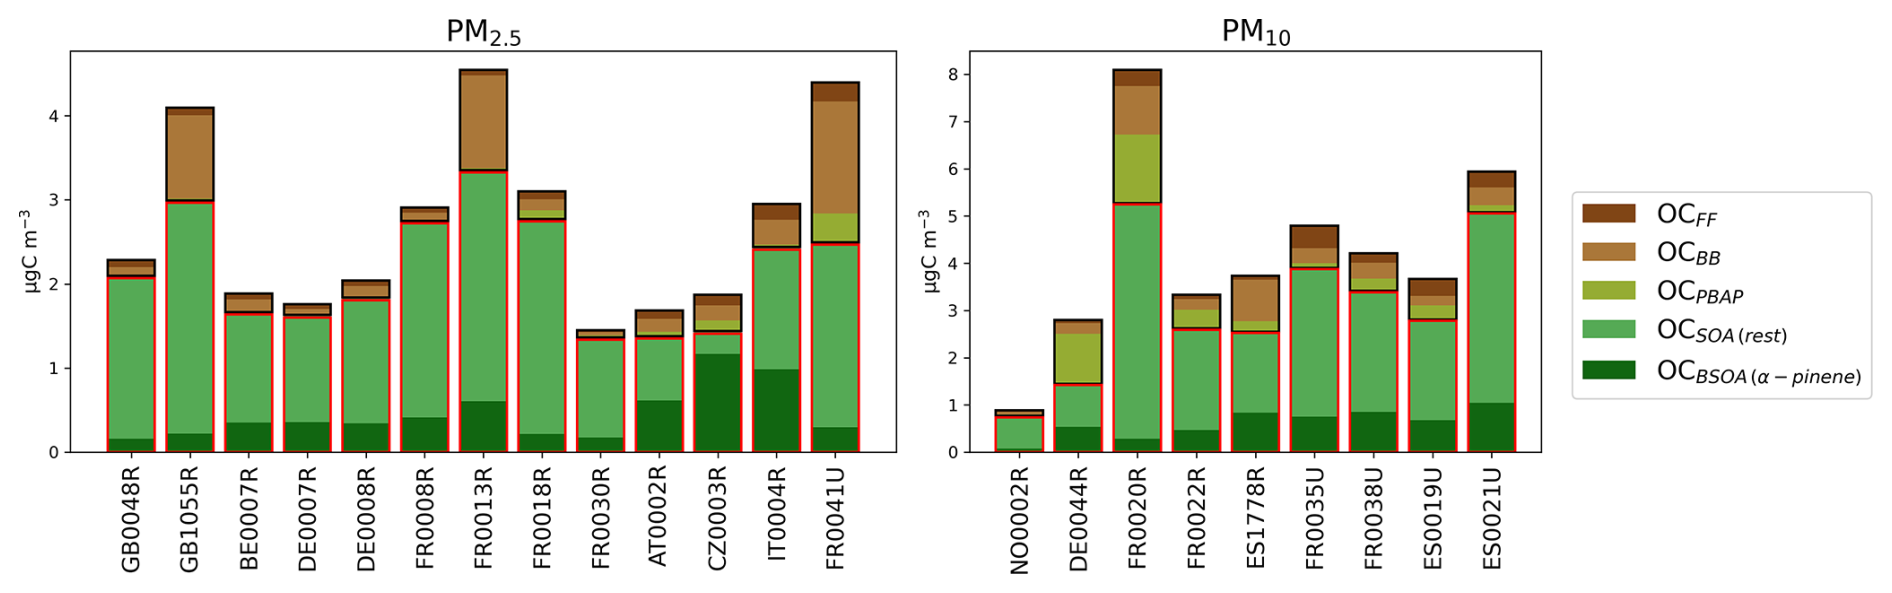
Figure 12OC apportioned into categories with PM2.5 (left) and PM10 (right) size fractions. Secondary OCs are indicated with a red border and primary OCs with a black border.
OC from fossil fuels differed little between PM2.5 and PM10 (averaging 4 %–5 %), with the largest contributions in urban areas, e.g., around 10 % in Marseille (FR0035U) and Barcelona (ES0019U). On the other hand, PBAP contributions differed significantly between size fractions: 2 ± 2 % in PM2.5 versus 10 ± 11 % in PM10. At Melpitz (DE0044R), as much as 37 % of OC in PM10 was from PBAP with 1.1 µgC m−3, whereas at SIRTA (FR0020R), PBAP contributed 1.4 µgC m−3, but the relative PBAP contribution was lower (18 %) due to a larger SOA fraction. Approximately one-third of OCSOA was attributed to α-pinene oxidation: 19 ± 13 % of total OC in PM2.5 and 16 ± 6 % in PM10.
At Ispra, SOA contributed 76 % of the total OC during the IMP week, which is in line with the radiocarbon-based source apportionment by Gilardoni et al. (2011), who found that SOA accounted for about 81 % of OC in summer 2007, with 53 % attributed to BSOA, as estimated from their data. At Peyrusse Vieille (FR0013R), SOA represented on average nearly 90 % of the organics in PM2.5 in July during 2012–2021, with biomass burning (BB) contributing 6 %, based on a similar tracer approach (Font et al., 2024). During the IMP period, SOA accounted for 78 % and BB for 24 %, the latter increase linked to the wildfires. At Birkenes (NO0002R), the long-term summer average shows that primary biological aerosol particles (PBAP) account for as much as 31 % of OC in PM10 (Yttri et al., 2021), substantially different from the IMP week, when SOA dominated with 87 % and PBAP contributed only 3 %.
3.4.3 OA formation and losses
ADCHEM was used to quantify OA production and losses at the sites (Fig. 13). OA production includes primary emissions and condensation (SOA formation), while losses occur through dry and wet deposition, as well as evaporation. Net OA production (production minus sinks) was assessed for the basecase and for some sensitivity runs: i.e., without isoprene, without BVOCs, and with anthropogenic NOx scaled by factors of 0.5 and 2. Changes in OC concentrations relative to the basecase are shown in Fig. 14. With the exception of the three northernmost stations (Hyytiälä (FI0050R), Birkenes (NO0002R), and Mace Head (IE0031R)), net OA productions were positive over the past three days of upwind transport at each site (Fig. 13). The northern and western sites were influenced by marine air masses with significant MSA (CH3SO3H) production, whereas the OA concentrations at more southern sites were dominated by ASOA, BSOA and primary OA from traffic. Simulations without terrestrial BVOC emissions showed reduced OA production and lower OC concentrations, with the strongest reduction observed at Hyytiälä (−55 %) (Fig. 13). The 0.5 × NOx scenario resulted in higher (3 ± 1 %) OA production and OC levels, while the 2 × NOx scenario led to substantially reduced (5±3 %) OC levels, despite higher OH and ozone levels (Fig. 14). This reflects higher SOA yields under low-NOx conditions, which more than compensate for slower VOC oxidation at lower NOx levels.
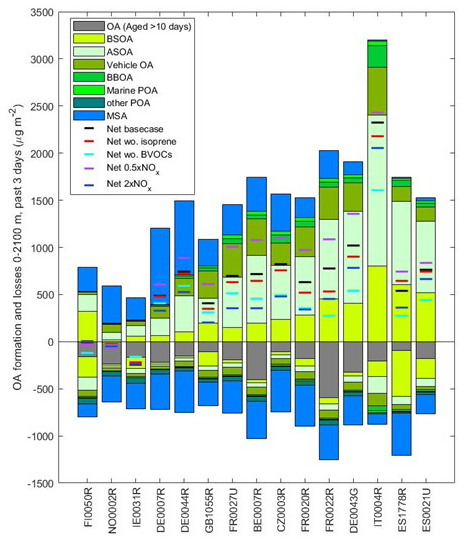
Figure 13Modelled (ADCHEM) 8 d averaged cumulative OA formation and losses during the past 3 d upwind of the measurement stations. OA formation includes primary emissions (POA) and secondary formation (SOA), while losses comprise dry/wet deposition and evaporation. OA is divided into source categories: aged background OA (> 10 d), BSOA, ASOA, vehicle OA, biomass burning OA (BBOA), marine POA, other POA, and methyl sulfonic acid (MSA). Net OA formation (production minus losses) is shown for the base case and sensitivity simulations without isoprene, without all BVOCs, and with anthropogenic NOx scaled by 0.5× and 2×.
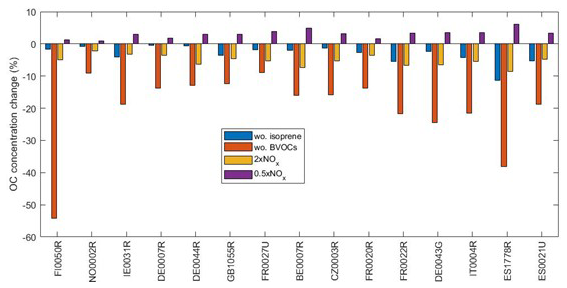
Figure 14Modelled 8 d averaged surface OC concentration changes relative to the basecase simulations for 4 different model sensitivity tests: without biogenic terrestrial isoprene emissions (wo. isoprene), without terrestrial BVOC emissions (wo. BVOCs), with twice the anthropogenic NOx emissions (2 × NOx) and half the anthropogenic NOx emissions (0.5 × NOx).
Aromatic compounds, such as benzene, toluene, xylenes, and phenols, are key ASOA precursors. Their oxidation is initiated by OH radicals and proceeds through multiple oxidation pathways, including autoxidation, and formation of HOM (Iyer et al., 2023; Pichelstorfer et al., 2024). In the model, the aromatics SOA mass yields (i.e. the ratio of formed SOA mass to the mass of reacted SOA precursors (VOC)) are markedly higher than those of monoterpenes and isoprene (Fig. S18). Consequently, aromatics account for over 50 % of the modelled SOA mass at several sites, despite the substantially higher emissions of monoterpenes and isoprene (Fig. 15).
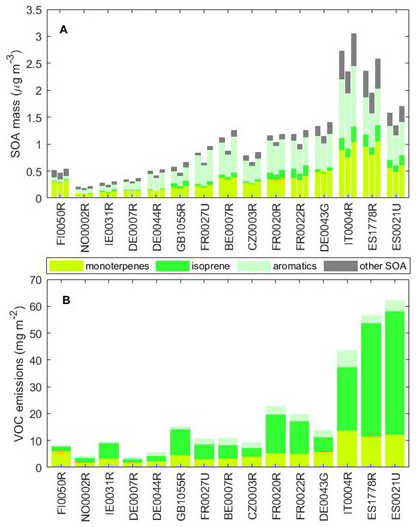
Figure 15Modelled averaged surface SOA mass concentrations (A) and 10 d cumulative SOA precursor emissions along the simulated air mass trajectories (B). In panel A, the three bars for each site represent the modelled average SOA mass for the basecase (left), 2 × NOx (middle) and 0.5 × NOx (right) simulations.
However, the model underestimates the total measured OC by about 50 % on average across the stations, while Ispra (IT0004R) showed a slight overestimation (Table S5), likely due to missing SOA precursors (e.g., large alkanes), missing oxidation pathways for the formation of low-volatility compounds (underestimated SOA yields), and underestimated POA emissions (Roldin et al., 2024; Simpson et al., 2020). Although ADCHEM incorporates state-of-the-art VOC oxidation mechanisms (Iyer et al., 2023; Luo et al., 2024; Pichelstorfer et al., 2024; Roldin et al., 2019), it only considers HOM formation from a limited range of VOCs (i.e. α-pinene, β-pinene, limonene, 3-carene, benzene, toluene, xylenes). Even for these, oxidation pathways and volatility distributions remain highly uncertain, especially under high-NOx conditions and at temperatures below 20 °C.
Another approach to evaluate the potential of VOCs to form aerosols is the SOA Potential (SOAP) concept as outlined by Derwent et al. (2010), which is commonly used to quantify the contribution of observed VOCs to SOA formation (Dufresne et al., 2025; Gu et al., 2021; In 'T Veld et al., 2024; Wu and Xie, 2018). In this study, we used literature-derived SOA yields to estimate SOAP at the participating sites (Fig. 8). Unlike ozone formation, where isoprene, ethene, and formaldehyde dominated, SOA formation was primarily driven by aromatics (46 ± 4 %), followed by monoterpenes (27 ± 4 %) and long-chain (C7-C12) NMHCs (16 ± 1 %). When categorising the NMHCs according to their dominant sources, fuel evaporation emerges as the most important (Fig. 8). As noted above, these source groupings (Table S3) represent indicative classifications and are subject to uncertainty. Toluene was the most important SOA precursor, followed by benzene, sabinene, and α-pinene. It should be noted that using fixed SOA yields is a simplification, as actual yields depend strongly on atmospheric conditions such as NOx concentrations, as shown above, and humidity. Moreover, the VOCs measured at these sites may not represent the SOA precursors from long-range transport. The SOAP analysis (Fig. 8) is broadly consistent with the ADCHEM model, which also identifies terpenes and aromatics as dominant SOA precursors during the IMP campaign. However, quantitatively, the model substantially underestimates SOA concentrations relative to the tracer-based estimates shown in Fig. 12, with deficits of up to a factor of ten at stations such as DE0007R, GB1055R, and FR0020R, and around a factor of two at Ispra (IT0004R) (Fig. S19). In contrast, the model tends to overestimate POA compared with the source-apportioned (OCFF+ OCBB) components (Fig. S19). These discrepancies may reflect missing or simplified SOA precursor emissions, incomplete oxidation pathways, or uncertainties associated with the empirical scaling-factors in the observation-based methods. . Only BSOA formed from α-pinene was available for model comparison, and the model underestimated this component by a factor of two to nine, despite considering monoterpenes beyond α-pinene. Notably, these discrepancies did not correspond directly to the differences between observed and modelled monoterpene concentrations (Fig. S20), indicating that local BVOC levels alone cannot explain BSOA levels at the site. This likely reflects short atmospheric lifetimes of BVOCs, which decouple local emissions from downwind oxidation, and subsequent BSOA formation. Overall, these results highlight the need for improved characterization of SOA sources and formation mechanisms across Europe.
3.5 Submicron particle number size distributions and atmospheric new particle formation events
Similar to tropospheric ozone formation, atmospheric NPF and growth is favoured by conditions with high photochemical activity which increases the production of strong inorganic acids such as H2SO4. H2SO4 form molecular clusters together with strong bases like ammonia and dimethyl amine which during favourable conditions can grow into new aerosol particles with an initial diameter of ∼ 1 nm (Olenius and Roldin, 2022; Wollesen De Jonge et al., 2024). High ozone, OH concentrations and high ambient temperatures will also increase the production of low volatility HOM that contribute to the growth of the newly formed aerosol particles (Roldin et al., 2019; Wollesen De Jonge et al., 2024). However, simultaneously high ambient temperatures result in increasing evaporation rates of both molecular clusters and newly formed aerosol particles which tend to suppress the NPF and growth. To investigate further the aerosol formation and growth during the heatwave, both modelled and observed PNSD were assessed at 11 of the 15 stations included in the ADCHEM trajectory simulations (Table 1). The campaign median submicron particle number concentrations (PNC) of particles larger than 10 nm in diameter were underestimated at all stations (Fig. S21), which indicate missing particle sources. This can likely be a result of underestimated nanoparticle growth rates (GR) as a result of the underestimated SOA formation.
ADCHEM simulates PNSD from 1 nm (dry diameter) to 10 µm, while DMPS or SMPS observations typically cover diameters from about 10 nm to 800–900 nm. Apparent NPF and subsequent growth were observed at all 11 stations on several days during the campaign. At several central European sites, Neuglobsow (DE0007R), Melpitz (DE0044R), ATOLL Villeneuve d'Ascq (FR0027U), and Vielsalm (BE0007R), NPF and growth occurred almost daily. Figure 16 compares modelled and measured submicron PNC at Vielsalm; additional comparisons for Melpitz and Kosetice (CZ0003R) are provided in the Supplement (Fig. S22–23) to illustrate typical NPF and growth patterns at representative continental sites as all three stations are influenced by relatively clean marine NW air masses but represent cases with different distance (time over the continent) before the air mass arrives at the stations.
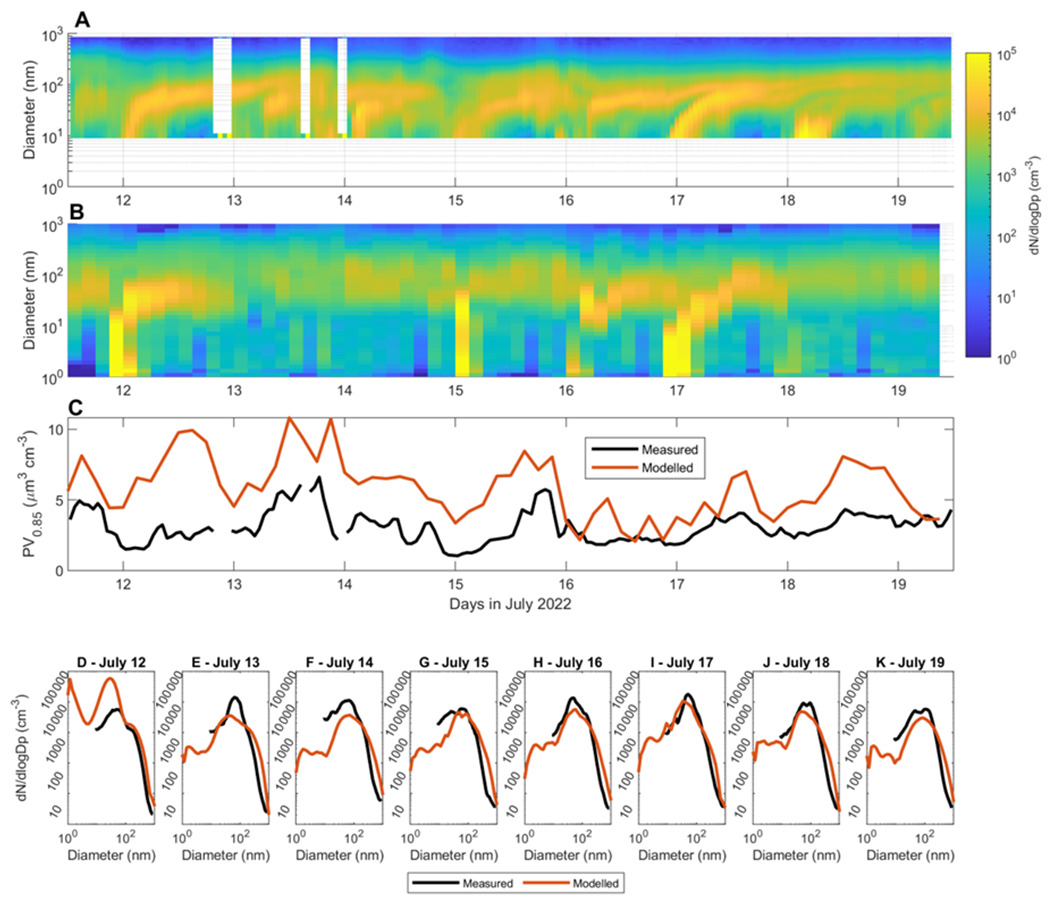
Figure 16Modelled and measured submicron particle concentrations at Vielsalm (BE0007R). Panels (A) and (B) show the measured and modelled PNSD at the station from 12 to 19 July, respectively. Panel (C) compares the measured and modelled particle volume concentrations for particles smaller than ∼ 0.85 µm in diameter. Panels (D) to (K) compare the measured and modelled median particle number size distributions for each campaign day.
According to ADCHEM, the strong NPF and growth events observed at sites in central and northern European sites (Germany, Belgium, northern France, and the Czech Republic) were primarily associated with relatively clean northwesterly air masses crossing the North Sea 1–2 d prior to arrival. The most pronounced event occurred on 17 July, with particle growth continuing into 18 July, followed by a second, weaker formation event. The model qualitatively reproduced the timing of the onset of this regional NPF and particle growth event across the stations. During transport, newly formed particles grew by condensation of inorganic species, primarily H2SO4 (from marine DMS and anthropogenic SO2), as well as organic vapours (Fig. S24–26). At Melpitz, weaker NPF events were first initiated several days upwind via ion-mediated NH3–H2SO4 nucleation near the Faroe and Shetland Islands, then intensified near the North German coast. At Vielsalm, NPF began near the northern coast of Scotland and the Orkney Islands and intensified as air masses passed near Amsterdam and approached the site. For Kosetice, air masses crossed the North Sea near Hamburg on 16 July, triggering strong NH3–H2SO4 nucleation over northern Germany (also observed at Neuglobsow and Melpitz), with continued growth over eastern Germany and the Czech Republic on 17 July. For Vielsalm the modelled nanoparticle growth during the NPF event on 17 July is well captured, while for Melpitz and Kosetice the nanoparticle growth is considerably underestimated (Fig. S27–29). The ultrafine particles (UFP, < 100 nm), that were likely formed by NPF in the morning and measured at all three sites in the midnight between 17 and 18 July had a geometric mean diameter (GMD) of approximately 60 nm, while the modelled GMD are around 25 nm at Melpitz, 35 nm at Kosetice and 70 nm at Vielsalm. This corresponds to average particle GR from 10:00 am to midnight of around 1.7, 2.5 and 5.0 nm h−1, respectively.
The notably higher modelled GR along the air mass trajectories arriving at Vielsalm compared with the other two stations is primarily a result of considerably more condensation of anthropogenic organic vapours (ASOA). This demonstrates that the SOA formation and observed NPF and growth events during the campaign are strongly interlinked, and the underestimated SOA formation in the model is likely one of the main reasons why the model underestimates the PNC at the stations. However, higher BVOC emissions do not necessarily result in increased PNC, since increasing VOC emissions also tends to reduce OH concentrations and thus lower sulfuric acid production, which can suppress NPF. Therefore, the ADCHEM model setup without BVOC emissions results in similar or lower PNC than the base case at all stations except at FI0050R (Fig. S22). The model simulations with modified anthropogenic NOx emissions (2 × NOx or 0.5 × NOx) demonstrate that NOx has a complex impact on NPF and growth. The model results show that increasing NOx tends to increase the atmospheric oxidation capacity (OH and O3 concentrations), thereby enhancing the oxidation of VOCs and SO2 and the production of O-VOCs and H2SO4, which may lead to more numerous particles and increased H2SO4 and O-VOCs driven condensation particle growth. At the same time the formed O-VOCs tend to be more volatile under high-NOx conditions, which can in contrast reduce nanoparticle GR (Roldin et al., 2019; Wollesen De Jonge et al., 2024). The net effect of increasing or decreasing NOx can therefore lead to either higher or lower PNCs (Figs. S21, S24–29).
The underestimation of particle number concentrations is consistent with the underestimation of SOA (Sect.`3.4), suggesting a link between SOA formation and particle growth, although a quantitative attribution is beyond the scope of this study.
The 2022 summer heatwave in Europe provided a unique opportunity to investigate the interactions between meteorology, emissions, and atmospheric chemistry during extreme climate events. The comprehensive observations and modelling in this study show that elevated ozone, OA, and ultrafine particle (UFP) levels were driven by a combination of persistent high-pressure systems, enhanced biogenic emissions due to high temperatures, and anthropogenic precursor emissions.
During the campaign, the highest ozone peaks were associated with a combination of elevated BVOC and NOx emissions, and sensitivity simulations indicate that ozone formation responded to both NOx and BVOC at most sites. These results suggest that further reductions in NOx emissions remain effective in lowering ozone levels during extreme pollution events. Isoprene (mainly biogenic), NMHCs (mostly from anthropogenic sources), and O-VOCs (from mixed sources) dominated the ozone formation potential, with aromatics playing a larger role in urban areas. O-VOCs represented the largest fraction of total VOCs, yet are currently measured at only a few sites in Europe; their importance for ozone production underlines the need for broader and more long-term monitoring of these compounds. Terpenes, which are important precursors for SOA formation, are also not regularly monitored.
The majority of OA was secondary in origin (approximately 80 %, depending on site and size fraction), with substantial contributions from both biogenic and anthropogenic precursors. Aromatic VOCs and monoterpenes contributed substantially to SOA formationADCHEM model results substantially underestimate SOA and UFP concentrations at several sites, suggesting remaining uncertainties related to missing or simplified precursor emissions and oxidation pathways in the model. The underestimation of particle growth during observed NPF events further indicates that SOA formation and nanoparticle growth were closely coupled during the campaign.
The IMP2022 campaign was relatively short and included few online VOC measurements, limiting the assessment of temporal variability, and the dataset was too limited to perform a detailed source apportionment analysis. To address these gaps, a follow-up campaign, led by EMEP/TFMM in collaboration with ACTRIS and RI-URBANS, was conducted in September 2024, focusing on high-resolution VOC measurements near key emission sources and coordinated observations at regional sites.
Overall, these findings underline the intertwined roles of anthropogenic and biogenic emissions in shaping air quality during heatwaves. A complete understanding of air quality therefore requires monitoring both biogenic and anthropogenic precursors, as well as tracers of the various classes of OA components, both primary and secondary. As climate change is expected to increase the frequency and intensity of such extreme events, air quality management must account for the additional risks these conditions pose.
An Excel file containing the data in harmonised units and selected aggregations is available through Zenodo (https://doi.org/10.5281/zenodo.20423958; Aas et al., 2026). The file includes links to the original datasets and their DOIs in the EBAS database hosted by NILU (https://ebas.nilu.no, last access: 14 November 2025).
The supplement related to this article is available online at https://doi.org/10.5194/acp-26-8717-2026-supplement.
WAa, AC, TS, RW, HH, KEY, JLJ, SS, ST were responsible for conceptualizing the study. WAa wrote the original draft of the paper with contributions from TS, RW, HH, JLJ, PR, AT, KEY, SS, ST, JPP, BB. TS, MDf performed the centralised O-VOC analysis, HH, TT conducted the terpene analysis, RW, RD, LK, DKl did the centralised NMHC analysis while JLJ, VNT, SD, MDu performed the centralised tracer analysis. PR, AT, ÅW provided the ADCHEM model results and DS, ST, YG contributed with EMEP model results. PH provided isoprene emission data. Site measurements were provided and quality-assured by the following contributors: IB (AT0002R); BB, MDy, MG, CA, BV, NS (BE0007R); SR (CH sites); TJ, EB (Cyprus); AH, JP (CZ0003R); JR, BH (DE0007R, DE0008R); LP, UK, HaH (DE0044R); DKu, ACl, RH (DE0043G); AMYS, MPE, RS, AA (ES0019U, ES1778R); BART, FJGM, EDR, EAB (ES0021U); MCG, GG, BART (ES0025U); IY, TP (FI0050R); AF, ET, TS (FR0008R, FR0013R, FR0018R); VR (FR0027U); AB, EF, ACo (FR0030R); VG, LS (FR0020R); TS (FR0022R); DB, IS, JD, KW, CR, MT, StR, MJ (UK sites); DC, KF, JG (IE0031R); JPP, NJ (IT0004R); JA, AM, MM, LR (IT0009R); WAa, SS, KEY (NO0002R).
At least one of the (co-)authors is a member of the editorial board of Atmospheric Chemistry and Physics. The peer-review process was guided by an independent editor, and the authors also have no other competing interests to declare.
Publisher's note: Copernicus Publications remains neutral with regard to jurisdictional claims made in the text, published maps, institutional affiliations, or any other geographical representation in this paper. The authors bear the ultimate responsibility for providing appropriate place names. Views expressed in the text are those of the authors and do not necessarily reflect the views of the publisher.
We gratefully acknowledge the European Solvents Industry Group (ESIG) for supporting this intensive measurement period, with special thanks to Cornelia Tietz and Norbert Hannig for their commitment. The ADCHEM modelling work was supported by the Swedish Strategic Research Area Modelling the Regional and Global Earth system (MERGE) and the Lund University Faculty of Engineering Profile Area AEROSOLS. This work also benefited from the collaborative efforts of numerous colleagues across participating countries, both during the planning phase and the operational work. Their cooperation and dedication are sincerely appreciated, particularly within the EMEP measurement community and the ACTRIS National Facilities responsible for daily operations. ACTRIS CiGas provided valuable guidance on VOC measurement protocols and quality assurance. ERA5 reanalysis data were provided by ECMWF. We used ChatGPT 5.1 to condense and improve the language of specific sections during the review process of this paper. We thank all three reviewers for their thorough and constructive evaluations, which significantly improved the manuscript.
Work by CCC (NILU) and MSC-W (MET Norway) is supported by the EMEP Trust Fund. The European Solvents Industry Group (ESIG) financed several VOC and OA analyses. The centralized analyses of OA tracers on AirOSol analytical plateau at IGE benefit from the work within the ANR-ABS program in France (grant no. ANR-21-CE01-0021-01). The ADCHEM modelling work is part of the PAREMPI Horizon Europe project (grant no. GA 101096133). The ADCHEM simulations were enabled by resources provided by LUNARC, The Centre for Scientific and Technical Computing at Lund University and by the National Academic Infrastructure for Supercomputing in Sweden (NAISS), partially funded by the Swedish Research Council through grant no. 2022-06725. ACTRIS received support from the European Commission through several projects from FP6 to H2020, including ACTRIS-PPP (grant no. GA 739530) and ACTRIS-IMP (grant no. GA 871115).
Routine measurements at the participating sites are supported by national environmental agencies and research funding bodies, which provide the essential basis for this work. In Germany, ACTRIS implementation and operation are supported by the Federal Ministry of Research, Technology and Space (BMFTR) and the Federal Ministry for the Environment, Climate Action, Nature Conservation and Nuclear Safety (BMUKN). ATOLL measurements have been supported by the Labex CaPPA project (grant no. ANR-11-LABX-0005-01; funded by the French National Research Agency (ANR) through the PIA (Programme d'Investissement d'Avenir)), the CDP AREA project (grant no. R-CDP-24-003-AREA; funded by the French State under the France-2030 programme and the Initiative of Excellence of the University of Lille), the CLIMIBIO and ECRIN projects, all financed by the Regional Council “Hauts-de-France” and the European Regional Development Fund (ERDF) Measurements at Birkenes was supported by the Norwegian Environmental Agency. Measurements taken at the Madrid urban site were supported by the OASIS (grant no. PID2021-127885OB-I00) and HYNU-CLIM (grant no. PID2024-161276OA-I00) projects, which are funded by the MCIN/AEI/10.13039/501100011033 and by the “ERDF A way of making Europe”. This research also received support from the Agencia Estatal de Investigación (project AIRPHONEMA (grant no. PID2022-142160OB-I00 MCIN/AEI/10.13039/501100011033/FEDER EU), and by Generalitat de Catalunya (D. G. Canvi Climatic I Qualitat Ambiental and AGAUR, grant no. 2021 SGR47). UK datasets were funded by UK Environment Agency air quality networks. Auchencorth Moss is partially supported by the UK Natural Environment Research Council (NERC), through the UK Centre for Ecology and Hydrology (UKCEH) National Capability for UK Challenges Programme (grant no. NE/Y006208/1). Swiss measurements at Zürich Kaserne and at Beromünster are funded by the Swiss Federal Office for the Environment (FOEN) through the NABEL air pollution measurement network. In addition, funding from ACTRIS-CH is acknowledged. Measurements at SMEAR II in Hyytiälä, Finland were supported by Research Council Finland (grant no. 358647). Measurements at Vielsalm were supported by the Belgian Federal Science Policy Office through the ACTRIS-BE (grant no. FSIRI/00/AC1) and ACTRIS-2BE (grant no. EF/241/ACTRIS2BE) projects and the BERTRAC research profile (grant no. Prf-2021034_BERTRAC#2).
This paper was edited by Eleanor Browne and reviewed by three anonymous referees.
Aas, W., Fagerli, H., Alastuey, A., Cavalli, F., Degorska, A., Feigenspan, S., Brenna, H., Gliß, J., Heinesen, D., Hueglin, C., Holubová, A., Jaffrezo, J.-L., Mortier, A., Murovec, M., Putaud, J.-P., Rüdiger, J., Simpson, D., Solberg, S., Tsyro, S., Tørseth, K., and Yttri, K. E.: Trends in Air Pollution in Europe, 2000–2019, Aerosol Air Qual. Res., 24, 230237, https://doi.org/10.4209/aaqr.230237, 2024.
Aas, W., Salameh, T., Wegener, R., Hellén, H., Jaffrezo, J.-L., Alonso-Blanco, E., Alastuey, A., Amelynck, C., Arduini, J., Bergmans, B., Bertrand, M., Borbon, A., Bourtsoukidis, E., Bouvier, L., Butterfield, D., Buxbaum, I., Ceburnis, D., Claude, A., Colomb, A., Darfeuil, S., Dernie, J., Desservettaz, M., Díaz-Ramiro, E., Dufresne, M., Dubus, R., Duval, M., Dury, M., Font, A., Fossum, K., Freney, E., Gangoiti, G., Gomez, M. C., Gómez-Moreno, F. J., Gohy, M., Gros, V., Hellack, B., Herrmann, H., Holla, R., Holubová, A., Jensen, N., Jokinen, T., Jones, M., Käfer, U., Kesper, L., Klemp, D., Kubistin, D., Marinoni, A., Mazzini, M., Ngoc Thuy Dinh, V., Ovadnevaite, J., Portillo-Estrada, M., Přívozníková, J., Putaud, J.-P., Reimann, S., Renzi, L., Riffault, V., Ritchie, S., Robins, C., Rodríguez de Torres, B. A., Poulain, L., Rüdiger, J., Sanocka, A., Saez de Camara Oleaga, E., Schoon, N., Seco, R., Simmons, I., Simon, L., Tison, E., Twigg, M., Tykkä, T., Verreyken, B., Yáñez-Serrano, A. M., Yeung, K., Ylivinkka, I., Yttri, K. E., and Williams, K.: Spatial variability of VOCs, ozone, and carbonaceous aerosols during the 2022 European summer heatwave, Zenodo [data set], https://doi.org/10.5281/ZENODO.20423958, 2026.
Akagi, S. K., Yokelson, R. J., Wiedinmyer, C., Alvarado, M. J., Reid, J. S., Karl, T., Crounse, J. D., and Wennberg, P. O.: Emission factors for open and domestic biomass burning for use in atmospheric models, Atmos. Chem. Phys., 11, 4039–4072, https://doi.org/10.5194/acp-11-4039-2011, 2011.
Anenberg, S. C., Haines, S., Wang, E., Nassikas, N., and Kinney, P. L.: Synergistic health effects of air pollution, temperature, and pollen exposure: a systematic review of epidemiological evidence, Environ. Health, 19, 130, https://doi.org/10.1186/s12940-020-00681-z, 2020.
Baker, A. K., Beyersdorf, A. J., Doezema, L. A., Katzenstein, A., Meinardi, S., Simpson, I. J., Blake, D. R., and Sherwood Rowland, F.: Measurements of nonmethane hydrocarbons in 28 United States cities, Atmos. Environ., 42, 170–182, https://doi.org/10.1016/j.atmosenv.2007.09.007, 2008.
Ban, J., Lu, K., Wang, Q., and Li, T.: Climate change will amplify the inequitable exposure to compound heatwave and ozone pollution, One Earth, 5, 677–686, https://doi.org/10.1016/j.oneear.2022.05.007, 2022.
Bloss, C., Wagner, V., Jenkin, M. E., Volkamer, R., Bloss, W. J., Lee, J. D., Heard, D. E., Wirtz, K., Martin-Reviejo, M., Rea, G., Wenger, J. C., and Pilling, M. J.: Development of a detailed chemical mechanism (MCMv3.1) for the atmospheric oxidation of aromatic hydrocarbons, Atmos. Chem. Phys., 5, 641–664, https://doi.org/10.5194/acp-5-641-2005, 2005.
Borbon, A., Salameh, T., Sauvage, S., and Afif, C.: Light oxygenated volatile organic compound concentrations in an Eastern Mediterranean urban atmosphere rivalling those in megacities, Environ. Pollut., 350, 123797, https://doi.org/10.1016/j.envpol.2024.123797, 2024.
Borlaza, L. J. S., Weber, S., Uzu, G., Jacob, V., Cañete, T., Micallef, S., Trébuchon, C., Slama, R., Favez, O., and Jaffrezo, J.-L.: Disparities in particulate matter (PM10) origins and oxidative potential at a city scale (Grenoble, France) – Part 1: Source apportionment at three neighbouring sites, Atmos. Chem. Phys., 21, 5415–5437, https://doi.org/10.5194/acp-21-5415-2021, 2021.
Bourtsoukidis, E., Pozzer, A., Williams, J., Makowski, D., Peñuelas, J., Matthaios, V. N., Lazoglou, G., Yañez-Serrano, A. M., Lelieveld, J., Ciais, P., Vrekoussis, M., Daskalakis, N., and Sciare, J.: High temperature sensitivity of monoterpene emissions from global vegetation, Commun. Earth Environ., 5, 23, https://doi.org/10.1038/s43247-023-01175-9, 2024.
Bourtsoukidis, E., Guenther, A., Wang, H., Economou, T., Lazoglou, G., Christodoulou, A., Christoudias, T., Nölscher, A., Yañez-Serrano, A. M., and Peñuelas, J.: Environmental Change Is Reshaping the Temperature Sensitivity of Sesquiterpene Emissions and Their Atmospheric Impacts, Glob. Change Biol., 31, e70258, https://doi.org/10.1111/gcb.70258, 2025.
Boy, M., Zhou, P., Kurtén, T., Chen, D., Xavier, C., Clusius, P., Roldin, P., Baykara, M., Pichelstorfer, L., Foreback, B., Bäck, J., Petäjä, T., Makkonen, R., Kerminen, V.-M., Pihlatie, M., Aalto, J., and Kulmala, M.: Positive feedback mechanism between biogenic volatile organic compounds and the methane lifetime in future climates, Npj Clim. Atmospheric Sci., 5, 72, https://doi.org/10.1038/s41612-022-00292-0, 2022.
Bros, P., Darfeuil, S., Jacob, V., Elazzouzi, R., Tusha, D., Rousseau, T., Weng, J., Winiger, P., El Haddad, I., Hueglin, C., Uzu, G., and Jaffrezo, J.-L.: Quantification of 21 sugars in tropospheric particulate matter by ultra-high-performance liquid chromatography tandem mass spectrometry, Atmos. Meas. Tech., 18, 6315–6327, https://doi.org/10.5194/amt-18-6315-2025, 2025.
Cao, C., Gentner, D. R., Commane, R., Toledo-Crow, R., Schiferl, L. D., and Mak, J. E.: Policy-Related Gains in Urban Air Quality May Be Offset by Increased Emissions in a Warming Climate, Environ. Sci. Technol., 57, 9683–9692, https://doi.org/10.1021/acs.est.2c05904, 2023.
Cavalli, F., Alastuey, A., Areskoug, H., Ceburnis, D., Cech, J., Genberg, J., Harrison, R. M., Jaffrezo, J. L., Kiss, G., Laj, P., Mihalopoulos, N., Perez, N., Quincey, P., Schwarz, J., Sellegri, K., Spindler, G., Swietlicki, E., Theodosi, C., Yttri, K. E., Aas, W., and Putaud, J. P.: A European aerosol phenomenology-4: Harmonized concentrations of carbonaceous aerosol at 10 regional background sites across Europe, Atmos. Environ., 144, 133–145, https://doi.org/10.1016/j.atmosenv.2012.07.050, 2016.
Copernicus: Global Climate Highlights 2022. 2022 saw record temperatures in Europe and across the world, https://climate.copernicus.eu/2022-saw-record-temperatures-europe-and-across-world (last access: 29 November 2024), 2023.
Derwent, R. G., Jenkin, M. E., Saunders, S. M., and Pilling, M. J.: Photochemical ozone creation potentials for organic compounds in northwest Europe calculated with a master chemical mechanism, Atmos. Environ., 32, 2429–2441, https://doi.org/10.1016/S1352-2310(98)00053-3, 1998.
Derwent, R. G., Jenkin, M. E., Passant, N. R., and Pilling, M. J.: Reactivity-based strategies for photochemical ozone control in Europe, Environ. Sci. Policy, 10, 445–453, https://doi.org/10.1016/j.envsci.2007.01.005, 2007.
Derwent, R. G., Jenkin, M. E., Utembe, S. R., Shallcross, D. E., Murrells, T. P., and Passant, N. R.: Secondary organic aerosol formation from a large number of reactive man-made organic compounds, Sci. Total Environ., 408, 3374–3381, https://doi.org/10.1016/j.scitotenv.2010.04.013, 2010.
Dufresne, M., Salameh, T., Leonardis, T., Gille, G., Armengaud, A., and Sauvage, S.: Volatile organic compound sources and impacts in an urban Mediterranean area (Marseille, France), Atmos. Chem. Phys., 25, 5977–5999, https://doi.org/10.5194/acp-25-5977-2025, 2025.
Duhl, T. R., Helmig, D., and Guenther, A.: Sesquiterpene emissions from vegetation: a review, Biogeosciences, 5, 761–777, https://doi.org/10.5194/bg-5-761-2008, 2008.
Dusanter, S., Holzinger, R., Klein, F., Salameh, T., and Jamar, 30 M., Measurement Guidelines for VOC Analysis by PTR-MS, https://www.actris.eu/sites/default/files/inline-files/PTRMS SOP %28April2025%29.pdf, last access: 10 November 2025.
EEA: Europe's air quality status 2025, Web report Published 09 Apr 2025, https://www.eea.europa.eu/en/analysis/publications/air-quality-status-report-2025 (last access: 10 December 2025), 2025.
Ehlers, C., Klemp, D., Rohrer, F., Mihelcic, D., Wegener, R., Kiendler-Scharr, A., and Wahner, A.: Twenty years of ambient observations of nitrogen oxides and specified hydrocarbons in air masses dominated by traffic emissions in Germany, Faraday Discuss., 189, 407–437, https://doi.org/10.1039/C5FD00180C, 2016.
El Haddad, I., Marchand, N., Temime-Roussel, B., Wortham, H., Piot, C., Besombes, J.-L., Baduel, C., Voisin, D., Armengaud, A., and Jaffrezo, J.-L.: Insights into the secondary fraction of the organic aerosol in a Mediterranean urban area: Marseille, Atmos. Chem. Phys., 11, 2059–2079, https://doi.org/10.5194/acp-11-2059-2011, 2011.
Elbert, W., Taylor, P. E., Andreae, M. O., and Pöschl, U.: Contribution of fungi to primary biogenic aerosols in the atmosphere: wet and dry discharged spores, carbohydrates, and inorganic ions, Atmos. Chem. Phys., 7, 4569–4588, https://doi.org/10.5194/acp-7-4569-2007, 2007.
Emberson, L. D., Ashmore, M. R., Simpson, D., Tuovinen, J.-P., and Cambridge, H. M.: Modelling and Mapping Ozone Deposition in Europe, Water. Air. Soil Pollut., 130, 577–582, https://doi.org/10.1023/A:1013851116524, 2001.
EMEP: EMEP Manual for Sampling and Chemical Analysis, EMEP/CCC Report 1/2014, NILU, Kjeller, Norway, https://emep-ccc.nilu.no/reports (last access: 10 November 2025), 2014.
EMEP: Transboundary particulate matter, photo-oxidants, acidification and eutrophication components, Joint MSC-W & CCC & CEIP & CIAM Report, EMEP status report 1/2023, Norwegian Meteorological Institute, Oslo, https://emep.int/publ/reports/2023/EMEP_Status_Report_1_2023.pdf (last access: 10 November 2025), 2023.
EU: Directive (EU) 2016/2284 of the European Parliament and of the Council of 14 December 2016 on the reduction of national emissions of certain atmospheric pollutants, amending Directive 2003/35/EC and repealing Directive 2001/81/EC, 2016, Official Journal of the European Union, https://eur-lex.europa.eu/eli/dir/2016/2284/2024-02-06 (last access: 11 November 2025), 2016.
EU: Directive (EU) 2024/2881 of the European Parliament and of the Council of 23 October 2024 on ambient air quality and cleaner air for Europe, (recast), Official Journal of the European Union, https://eur-lex.europa.eu/eli/dir/2024/2881/oj (last access: 11 November 2025), 2024.
Font, A., De Brito, J. F., Riffault, V., Conil, S., Jaffrezo, J.-L., and Bourin, A.: Long-term measurements of aerosol composition at rural background sites in France: Sources, seasonality and mass closure of PM2.5, Atmos. Environ., 334, 120724, https://doi.org/10.1016/j.atmosenv.2024.120724, 2024.
Ge, Y., Solberg, S., Heal, M. R., Reimann, S., van Caspel, W., Hellack, B., Salameh, T., and Simpson, D.: Evaluation of modelled versus observed non-methane volatile organic compounds at European Monitoring and Evaluation Programme sites in Europe, Atmos. Chem. Phys., 24, 7699–7729, https://doi.org/10.5194/acp-24-7699-2024, 2024.
Gentner, D. R., Worton, D. R., Isaacman, G., Davis, L. C., Dallmann, T. R., Wood, E. C., Herndon, S. C., Goldstein, A. H., and Harley, R. A.: Chemical Composition of Gas-Phase Organic Carbon Emissions from Motor Vehicles and Implications for Ozone Production, Environ. Sci. Technol., 47, 11837–11848, https://doi.org/10.1021/es401470e, 2013.
Gilardoni, S., Vignati, E., Cavalli, F., Putaud, J. P., Larsen, B. R., Karl, M., Stenström, K., Genberg, J., Henne, S., and Dentener, F.: Better constraints on sources of carbonaceous aerosols using a combined 14C – macro tracer analysis in a European rural background site, Atmos. Chem. Phys., 11, 5685–5700, https://doi.org/10.5194/acp-11-5685-2011, 2011.
Gilman, J. B., Lerner, B. M., Kuster, W. C., Goldan, P. D., Warneke, C., Veres, P. R., Roberts, J. M., de Gouw, J. A., Burling, I. R., and Yokelson, R. J.: Biomass burning emissions and potential air quality impacts of volatile organic compounds and other trace gases from fuels common in the US, Atmos. Chem. Phys., 15, 13915–13938, https://doi.org/10.5194/acp-15-13915-2015, 2015.
Golly, B., Waked, A., Weber, S., Samake, A., Jacob, V., Conil, S., Rangognio, J., Chrétien, E., Vagnot, M.-P., Robic, P.-Y., Besombes, J.-L., and Jaffrezo, J.-L.: Organic markers and OC source apportionment for seasonal variations of PM2.5 at 5 rural sites in France, Atmos. Environ., 198, 142–157, https://doi.org/10.1016/j.atmosenv.2018.10.027, 2019.
Graham, B., Guyon, P., Taylor, P. E., Artaxo, P., Maenhaut, W., Glovsky, M. M., Flagan, R. C., and Andreae, M. O.: Organic compounds present in the natural Amazonian aerosol: Characterization by gas chromatography–mass spectrometry, J. Geophys. Res.-Atmos., 108, 2003JD003990, https://doi.org/10.1029/2003JD003990, 2003.
Granier, C., Darras, S., Denier van der Gon, H., Doubalova, J., Elguindi, N., Galle, B., Gauss, M., Guevara, M., Jalkanen, J.-P., Kuenen, J., Liousse, C., Quack, B., Simpson, D., and Sindelarova, K.: The Copernicus Atmosphere Monitoring Service global and regional emissions (April 2019 version), ECMWF Copernicus report, https://doi.org/10.24380/D0BN-KX16, 2019.
Gu, S., Guenther, A., and Faiola, C.: Effects of Anthropogenic and Biogenic Volatile Organic Compounds on Los Angeles Air Quality, Environ. Sci. Technol., 55, 12191–12201, https://doi.org/10.1021/acs.est.1c01481, 2021.
Guion, A., Turquety, S., Cholakian, A., Polcher, J., Ehret, A., and Lathière, J.: Biogenic isoprene emissions, dry deposition velocity, and surface ozone concentration during summer droughts, heatwaves, and normal conditions in southwestern Europe, Atmos. Chem. Phys., 23, 1043–1071, https://doi.org/10.5194/acp-23-1043-2023, 2023.
Hallquist, M., Wenger, J. C., Baltensperger, U., Rudich, Y., Simpson, D., Claeys, M., Dommen, J., Donahue, N. M., George, C., Goldstein, A. H., Hamilton, J. F., Herrmann, H., Hoffmann, T., Iinuma, Y., Jang, M., Jenkin, M. E., Jimenez, J. L., Kiendler-Scharr, A., Maenhaut, W., McFiggans, G., Mentel, Th. F., Monod, A., Prévôt, A. S. H., Seinfeld, J. H., Surratt, J. D., Szmigielski, R., and Wildt, J.: The formation, properties and impact of secondary organic aerosol: current and emerging issues, Atmos. Chem. Phys., 9, 5155–5236, https://doi.org/10.5194/acp-9-5155-2009, 2009.
Hamer, P. D., Markelj, M., Rojas-Munoz, O., Bonan, B., Calvet, J.-C., Marécal, V., Guenther, A., Trimmel, H., Vallejo, I., Eckhardt, S., Sousa Santos, G., Sindelarova, K., Simpson, D., Schmidbauer, N., Hellén, H., Rubli, P., Reimann, S., Claude, A., Kubistin, D., Cozic, J., Dernie, J., and Tarrasón, L.: Two biogenic volatile organic compound emission datasets over Europe based on land surface modelling and satellite data assimilation, Earth Syst. Sci. Data, 18, 3635–3669, https://doi.org/10.5194/essd-18-3635-2026, 2026.
Hellén, H., Praplan, A. P., Tykkä, T., Helin, A., Schallhart, S., Schiestl-Aalto, P. P., Bäck, J., and Hakola, H.: Sesquiterpenes and oxygenated sesquiterpenes dominate the VOC (C5–C20) emissions of downy birches, Atmos. Chem. Phys., 21, 8045–8066, https://doi.org/10.5194/acp-21-8045-2021, 2021.
Hellén, H., Tykkä, T., Schallhart, S., Stratigou, E., Salameh, T., and Iturrate-Garcia, M.: Measurements of atmospheric C10–C15 biogenic volatile organic compounds (BVOCs) with sorbent tubes, Atmos. Meas. Tech., 17, 315–333, https://doi.org/10.5194/amt-17-315-2024, 2024.
Henze, D. K., Seinfeld, J. H., Ng, N. L., Kroll, J. H., Fu, T.-M., Jacob, D. J., and Heald, C. L.: Global modeling of secondary organic aerosol formation from aromatic hydrocarbons: high- vs. low-yield pathways, Atmos. Chem. Phys., 8, 2405–2420, https://doi.org/10.5194/acp-8-2405-2008, 2008.
Hersbach, H., Bell, B., Berrisford, P., Biavati, G., Horányi, A., Muñoz Sabater, J., Nicolas, J., Peubey, C., Radu, R., Rozum, I., Schepers, D., Simmons, A., Soci, C., Dee, D., and Thépaut, J.-N.: ERA5 hourly data on single levels from 1940 to present, Copernicus Climate Change Service (C3S) Climate Data Store (CDS) [data set], https://doi.org/10.24381/cds.adbb2d47 (last access: 19 April 2025), 2023.
Hjellbrekke, A.-G.: Data Report 2022. Particulate matter, carbonaceous and inorganic compounds, EMEP/CCC-Report 1/2024, NILU, Kjeller, Norway, https://emep-ccc.nilu.no/reports (last access: 10 November 2025), 2024.
Hjellbrekke, A.-G. and Solberg, S.: Ozone measurements 2022, EMEP/CCC-Report 2/2024, NILU, Kjeller, Norway, https://emep-ccc.nilu.no/reports (last access: 10 November 2025), 2024.
Hoerger, C. C., Claude, A., Plass-Duelmer, C., Reimann, S., Eckart, E., Steinbrecher, R., Aalto, J., Arduini, J., Bonnaire, N., Cape, J. N., Colomb, A., Connolly, R., Diskova, J., Dumitrean, P., Ehlers, C., Gros, V., Hakola, H., Hill, M., Hopkins, J. R., Jäger, J., Junek, R., Kajos, M. K., Klemp, D., Leuchner, M., Lewis, A. C., Locoge, N., Maione, M., Martin, D., Michl, K., Nemitz, E., O'Doherty, S., Pérez Ballesta, P., Ruuskanen, T. M., Sauvage, S., Schmidbauer, N., Spain, T. G., Straube, E., Vana, M., Vollmer, M. K., Wegener, R., and Wenger, A.: ACTRIS non-methane hydrocarbon intercomparison experiment in Europe to support WMO GAW and EMEP observation networks, Atmos. Meas. Tech., 8, 2715–2736, https://doi.org/10.5194/amt-8-2715-2015, 2015.
Hoffmann, E. H., Tilgner, A., Vogelsberg, U., Wolke, R., and Herrmann, H.: Near-Explicit Multiphase Modeling of Halogen Chemistry in a Mixed Urban and Maritime Coastal Area, ACS Earth Space Chem., 3, 2452–2471, https://doi.org/10.1021/acsearthspacechem.9b00184, 2019.
Holland, R., Khan, A. H., Derwent, R. G., Lynch, J., Ahmed, F., Grace, S., Bacak, A., and Shallcross, D. E.: Gas-phase kinetics, POCPs, and an investigation of the contributions of VOCs to urban ozone production in the UK, Int. J. Chem. Kinet., 55, 350–364, https://doi.org/10.1002/kin.21640, 2023.
In 'T Veld, M., Seco, R., Reche, C., Pérez, N., Alastuey, A., Portillo-Estrada, M., Janssens, I. A., Peñuelas, J., Fernandez-Martinez, M., Marchand, N., Temime-Roussel, B., Querol, X., and Yáñez-Serrano, A. M.: Identification of volatile organic compounds and their sources driving ozone and secondary organic aerosol formation in NE Spain, Sci. Total Environ., 906, 167159, https://doi.org/10.1016/j.scitotenv.2023.167159, 2024.
IPCC: Climate Change 2021 – The Physical Science Basis: Working Group I Contribution to the Sixth Assessment Report of the Intergovernmental Panel on Climate Change, 1st Edn., Cambridge University Press, https://doi.org/10.1017/9781009157896, 2023.
Iyer, S., Kumar, A., Savolainen, A., Barua, S., Daub, C., Pichelstorfer, L., Roldin, P., Garmash, O., Seal, P., Kurtén, T., and Rissanen, M.: Molecular rearrangement of bicyclic peroxy radicals is a key route to aerosol from aromatics, Nat. Commun., 14, 4984, https://doi.org/10.1038/s41467-023-40675-2, 2023.
Jacob, D.: Heterogeneous chemistry and tropospheric ozone, Atmos. Environ., 34, 2131–2159, https://doi.org/10.1016/S1352-2310(99)00462-8, 2000.
Jacob, D. J.: Introduction to atmospheric chemistry, Online-Ausg., Princeton University Press, Princeton, N.J., 266 pp., ISBN 978-1-4008-4154-7, 1999.
Jenkin, M. E., Saunders, S. M., and Pilling, M. J.: The tropospheric degradation of volatile organic compounds: a protocol for mechanism development, Atmos. Environ., 31, 81–104, https://doi.org/10.1016/S1352-2310(96)00105-7, 1997.
Jenkin, M. E., Saunders, S. M., Wagner, V., and Pilling, M. J.: Protocol for the development of the Master Chemical Mechanism, MCM v3 (Part B): tropospheric degradation of aromatic volatile organic compounds, Atmos. Chem. Phys., 3, 181–193, https://doi.org/10.5194/acp-3-181-2003, 2003.
Jenkin, M. E., Wyche, K. P., Evans, C. J., Carr, T., Monks, P. S., Alfarra, M. R., Barley, M. H., McFiggans, G. B., Young, J. C., and Rickard, A. R.: Development and chamber evaluation of the MCM v3.2 degradation scheme for β-caryophyllene, Atmos. Chem. Phys., 12, 5275–5308, https://doi.org/10.5194/acp-12-5275-2012, 2012.
Jenkin, M. E., Young, J. C., and Rickard, A. R.: The MCM v3.3.1 degradation scheme for isoprene, Atmos. Chem. Phys., 15, 11433–11459, https://doi.org/10.5194/acp-15-11433-2015, 2015.
Jenkin, M. E., Derwent, R. G., and Wallington, T. J.: Photochemical ozone creation potentials for volatile organic compounds: Rationalization and estimation, Atmos. Environ., 163, 128–137, https://doi.org/10.1016/j.atmosenv.2017.05.024, 2017.
Khan, M. A. H., Cooke, M. C., Utembe, S. R., Archibald, A. T., Maxwell, P., Morris, W. C., Xiao, P., Derwent, R. G., Jenkin, M. E., Percival, C. J., Walsh, R. C., Young, T. D. S., Simmonds, P. G., Nickless, G., O'Doherty, S., and Shallcross, D. E.: A study of global atmospheric budget and distribution of acetone using global atmospheric model STOCHEM-CRI, Atmos. Environ., 112, 269–277, https://doi.org/10.1016/j.atmosenv.2015.04.056, 2015.
Klemp, D., Wegener, R., Dubus, R., Karadurmus, L., Kille, N., and Tan, Z.: Distribution of trace gases with adverse effects on fuel cells, Schriften des Forschungszentrums Jülich Reihe Energie & Umwelt/Energy & Environment, FZJ-2021-03034, Forschungszentrum Jülich GmbH Zentralbibliothek, Verlag, Jülich, ISBN 978-3-95806-551-2, 2021.
Laj, P., Lund Myhre, C., Riffault, V., Amiridis, V., Fuchs, H., Eleftheriadis, K., Petäjä, T., Salameh, T., Kivekäs, N., Juurola, E., Saponaro, G., Philippin, S., Cornacchia, C., Alados Arboledas, L., Baars, H., Claude, A., De Mazière, M., Dils, B., Dufresne, M., Evangeliou, N., Favez, O., Fiebig, M., Haeffelin, M., Herrmann, H., Höhler, K., Illmann, N., Kreuter, A., Ludewig, E., Marinou, E., Möhler, O., Mona, L., Eder Murberg, L., Nicolae, D., Novelli, A., O'Connor, E., Ohneiser, K., Petracca Altieri, R. M., Picquet-Varrault, B., Van Pinxteren, D., Pospichal, B., Putaud, J.-P., Reimann, S., Siomos, N., Stachlewska, I., Tillmann, R., Voudouri, K. A., Wandinger, U., Wiedensohler, A., Apituley, A., Comerón, A., Gysel-Beer, M., Mihalopoulos, N., Nikolova, N., Pietruczuk, A., Sauvage, S., Sciare, J., Skov, H., Svendby, T., Swietlicki, E., Tonev, D., Vaughan, G., Zdimal, V., Baltensperger, U., Doussin, J.-F., Kulmala, M., Pappalardo, G., Sorvari Sundet, S., and Vana, M.: Aerosol, Clouds and Trace Gases Research Infrastructure (ACTRIS): The European Research Infrastructure Supporting Atmospheric Science, Bull. Am. Meteorol. Soc., 105, E1098–E1136, https://doi.org/10.1175/BAMS-D-23-0064.1, 2024.
Lana, A., Bell, T. G., Simó, R., Vallina, S. M., Ballabrera-Poy, J., Kettle, A. J., Dachs, J., Bopp, L., Saltzman, E. S., Stefels, J., Johnson, J. E., and Liss, P. S.: An updated climatology of surface dimethlysulfide concentrations and emission fluxes in the global ocean: Updated Dms Climatology, Glob. Biogeochem. Cycles, 25, https://doi.org/10.1029/2010GB003850, 2011.
Li, S., Yuan, X., Li, S., Zhou, Y., Wang, S., Zhang, K., Agathokleous, E., Blande, J. D., and Feng, Z.: Extreme Heat Event Alters BVOC Responses to Elevated Ozone: From Physiology to Emission Patterns, Environ. Sci. Technol., 59, 12132–12144, https://doi.org/10.1021/acs.est.5c01132, 2025.
Lin, M., Horowitz, L. W., Xie, Y., Paulot, F., Malyshev, S., Shevliakova, E., Finco, A., Gerosa, G., Kubistin, D., and Pilegaard, K.: Vegetation feedbacks during drought exacerbate ozone air pollution extremes in Europe, Nat. Clim. Change, 10, 444–451, https://doi.org/10.1038/s41558-020-0743-y, 2020.
Ling, Z., He, Z., Wang, Z., Shao, M., and Wang, X.: Sources of methacrolein and methyl vinyl ketone and their contributions to methylglyoxal and formaldehyde at a receptor site in Pearl River Delta, J. Environ. Sci., 79, 1–10, https://doi.org/10.1016/j.jes.2018.12.001, 2019.
Liu, X., Zhang, X., Dufresne, M., Wang, T., Wu, L., Lara, R., Seco, R., Monge, M., Yáñez-Serrano, A. M., Gohy, M., Petit, P., Chevalier, A., Vagnot, M.-P., Fortier, Y., Baudic, A., Ghersi, V., Gille, G., Lanzi, L., Gros, V., Simon, L., Héllen, H., Reimann, S., Le Bras, Z., Müller, M. J., Beddows, D., Hou, S., Shi, Z., Harrison, R. M., Bloss, W., Dernie, J., Sauvage, S., Hopke, P. K., Duan, X., An, T., Lewis, A. C., Hopkins, J. R., Liakakou, E., Mihalopoulos, N., Zhang, X., Alastuey, A., Querol, X., and Salameh, T.: Measurement report: Exploring the variations in ambient BTEX in urban Europe and their environmental health implications, Atmos. Chem. Phys., 25, 625–638, https://doi.org/10.5194/acp-25-625-2025, 2025.
Luo, Y., Thomsen, D., Iversen, E. M., Roldin, P., Skønager, J. T., Li, L., Priestley, M., Pedersen, H. B., Hallquist, M., Bilde, M., Glasius, M., and Ehn, M.: Formation and temperature dependence of highly oxygenated organic molecules (HOMs) from Δ3-carene ozonolysis, Atmos. Chem. Phys., 24, 9459–9473, https://doi.org/10.5194/acp-24-9459-2024, 2024.
Martins, J. P. A., Caetano, S., Pereira, C., Dutra, E., and Cardoso, R. M.: A satellite view of the exceptionally warm summer of 2022 over Europe, Nat. Hazards Earth Syst. Sci., 24, 1501–1520, https://doi.org/10.5194/nhess-24-1501-2024, 2024.
MET Office: Record high temperatures verified, Press Office on Jul 2022, https://www.metoffice.gov.uk/about-us/news-and-media/media-centre/weather-and-climate-news/2022/record-high-temperatures-verified (last access: 10 November 2025), 2022.
Millet, D. B., Guenther, A., Siegel, D. A., Nelson, N. B., Singh, H. B., de Gouw, J. A., Warneke, C., Williams, J., Eerdekens, G., Sinha, V., Karl, T., Flocke, F., Apel, E., Riemer, D. D., Palmer, P. I., and Barkley, M.: Global atmospheric budget of acetaldehyde: 3-D model analysis and constraints from in-situ and satellite observations, Atmos. Chem. Phys., 10, 3405–3425, https://doi.org/10.5194/acp-10-3405-2010, 2010.
Mohr, C., Thornton, J. A., Heitto, A., Lopez-Hilfiker, F. D., Lutz, A., Riipinen, I., Hong, J., Donahue, N. M., Hallquist, M., Petäjä, T., Kulmala, M., and Yli-Juuti, T.: Molecular identification of organic vapors driving atmospheric nanoparticle growth, Nat. Commun., 10, 4442, https://doi.org/10.1038/s41467-019-12473-2, 2019.
Monks, P. S., Granier, C., Fuzzi, S., Stohl, A., Williams, M. L., Akimoto, H., Amann, M., Baklanov, A., Baltensperger, U., Bey, I., Blake, N., Blake, R. S., Carslaw, K., Cooper, O. R., Dentener, F., Fowler, D., Fragkou, E., Frost, G. J., Generoso, S., Ginoux, P., Grewe, V., Guenther, A., Hansson, H. C., Henne, S., Hjorth, J., Hofzumahaus, A., Huntrieser, H., Isaksen, I. S. A., Jenkin, M. E., Kaiser, J., Kanakidou, M., Klimont, Z., Kulmala, M., Laj, P., Lawrence, M. G., Lee, J. D., Liousse, C., Maione, M., McFiggans, G., Metzger, A., Mieville, A., Moussiopoulos, N., Orlando, J. J., O'Dowd, C. D., Palmer, P. I., Parrish, D. D., Petzold, A., Platt, U., Poschl, U., Prevot, A. S. H., Reeves, C. E., Reimann, S., Rudich, Y., Sellegri, K., Steinbrecher, R., Simpson, D., ten Brink, H., Theloke, J., van der Werf, G. R., Vautard, R., Vestreng, V., Vlachokostas, C., and von Glasow, R.: Atmospheric composition change – global and regional air quality, Atmos. Environ., 43, 5268–5350, https://doi.org/10.1016/j.atmosenv.2009.08.021, 2009.
Nie, W., Yan, C., Yang, L., Roldin, P., Liu, Y., Vogel, A. L., Molteni, U., Stolzenburg, D., Finkenzeller, H., Amorim, A., Bianchi, F., Curtius, J., Dada, L., Draper, D. C., Duplissy, J., Hansel, A., He, X.-C., Hofbauer, V., Jokinen, T., Kim, C., Lehtipalo, K., Nichman, L., Mauldin, R. L., Makhmutov, V., Mentler, B., Mizelli-Ojdanic, A., Petäjä, T., Quéléver, L. L. J., Schallhart, S., Simon, M., Tauber, C., Tomé, A., Volkamer, R., Wagner, A. C., Wagner, R., Wang, M., Ye, P., Li, H., Huang, W., Qi, X., Lou, S., Liu, T., Chi, X., Dommen, J., Baltensperger, U., El Haddad, I., Kirkby, J., Worsnop, D., Kulmala, M., Donahue, N. M., Ehn, M., and Ding, A.: NO at low concentration can enhance the formation of highly oxygenated biogenic molecules in the atmosphere, Nat. Commun., 14, 3347, https://doi.org/10.1038/s41467-023-39066-4, 2023.
Oderbolz, D. C., Aksoyoglu, S., Keller, J., Barmpadimos, I., Steinbrecher, R., Skjøth, C. A., Plaß-Dülmer, C., and Prévôt, A. S. H.: A comprehensive emission inventory of biogenic volatile organic compounds in Europe: improved seasonality and land-cover, Atmos. Chem. Phys., 13, 1689–1712, https://doi.org/10.5194/acp-13-1689-2013, 2013.
Olenius, T. and Roldin, P.: Role of gas–molecular cluster–aerosol dynamics in atmospheric new-particle formation, Sci. Rep., 12, 10135, https://doi.org/10.1038/s41598-022-14525-y, 2022.
Park, K., Rodriguez, B., Thomas, J., Gu, D., Zhang, M., Sarkar, C., Guenther, A., and Kim, S.: Potential Implications of the Sesquiterpene Presence over the Remote Marine Boundary Layer in the Arctic Region, Atmosphere, 14, 823, https://doi.org/10.3390/atmos14050823, 2023.
Paulot, F., Crounse, J. D., Kjaergaard, H. G., Kürten, A., St. Clair, J. M., Seinfeld, J. H., and Wennberg, P. O.: Unexpected Epoxide Formation in the Gas-Phase Photooxidation of Isoprene, Science, 325, 730–733, https://doi.org/10.1126/science.1172910, 2009.
Pichelstorfer, L., Roldin, P., Rissanen, M., Hyttinen, N., Garmash, O., Xavier, C., Zhou, P., Clusius, P., Foreback, B., Golin Almeida, T., Deng, C., Baykara, M., Kurten, T., and Boy, M.: Towards automated inclusion of autoxidation chemistry in models: from precursors to atmospheric implications, Environ. Sci. Atmos., 4, 879–896, https://doi.org/10.1039/D4EA00054D, 2024.
Pisso, I., Sollum, E., Grythe, H., Kristiansen, N. I., Cassiani, M., Eckhardt, S., Arnold, D., Morton, D., Thompson, R. L., Groot Zwaaftink, C. D., Evangeliou, N., Sodemann, H., Haimberger, L., Henne, S., Brunner, D., Burkhart, J. F., Fouilloux, A., Brioude, J., Philipp, A., Seibert, P., and Stohl, A.: The Lagrangian particle dispersion model FLEXPART version 10.4, Geosci. Model Dev., 12, 4955–4997, https://doi.org/10.5194/gmd-12-4955-2019, 2019.
Qin, M., She, Y., Wang, M., Wang, H., Chang, Y., Tan, Z., An, J., Huang, J., Yuan, Z., Lu, J., Wang, Q., Liu, C., Liu, Z., Xie, X., Li, J., Liao, H., Pye, H. O. T., Huang, C., Guo, S., Hu, M., Zhang, Y., Jacob, D. J., and Hu, J.: Increased urban ozone in heatwaves due to temperature-induced emissions of anthropogenic volatile organic compounds, Nat. Geosci., https://doi.org/10.1038/s41561-024-01608-w, 2025.
Querol, X., Alastuey, A., Reche, C., Orio, A., Pallares, M., Reina, F., Dieguez, J. J., Mantilla, E., Escudero, M., Alonso, L., Gangoiti, G., and Millán, M.: On the origin of the highest ozone episodes in Spain, Sci. Total Environ., 572, 379–389, https://doi.org/10.1016/j.scitotenv.2016.07.193, 2016.
Reiman, S., Wegener, R., Claude, A., and Sauvage, S.: Deliverable 3.17. Updated Measurement Guideline for NOx and VOCs, ACTRIS, https://www.actris.eu/sites/default/files/Documents/ACTRIS-2/Deliverables/WP3_D3.17_M42.pdf (last access: 17 November 2025), 2018.
Roldin, P., Swietlicki, E., Schurgers, G., Arneth, A., Lehtinen, K. E. J., Boy, M., and Kulmala, M.: Development and evaluation of the aerosol dynamics and gas phase chemistry model ADCHEM, Atmos. Chem. Phys., 11, 5867–5896, https://doi.org/10.5194/acp-11-5867-2011, 2011.
Roldin, P., Ehn, M., Kurtén, T., Olenius, T., Rissanen, M. P., Sarnela, N., Elm, J., Rantala, P., Hao, L., Hyttinen, N., Heikkinen, L., Worsnop, D. R., Pichelstorfer, L., Xavier, C., Clusius, P., Öström, E., Petäjä, T., Kulmala, M., Vehkamäki, H., Virtanen, A., Riipinen, I., and Boy, M.: The role of highly oxygenated organic molecules in the Boreal aerosol-cloud-climate system, Nat. Commun., 10, 4370, https://doi.org/10.1038/s41467-019-12338-8, 2019.
Roldin, P., Pagels, J., Rönkkö, T., and Karjalainen, P.: Horizon Europe project PAREMPI, Deliverable D3.1 Aerosol dynamics during exhaust dilution and cooling, PAREMPI, https://parempi.eu/wp-content/uploads/2024/11/PAREMPI_D3.1_20240630_fnl.pdf (last access: 7 November 2025), 2024.
Sadiq, M.: The climate penalty of plants, Nat. Clim. Change, 10, 387–388, https://doi.org/10.1038/s41558-020-0765-5, 2020.
Samaké, A., Bonin, A., Jaffrezo, J.-L., Taberlet, P., Weber, S., Uzu, G., Jacob, V., Conil, S., and Martins, J. M. F.: High levels of primary biogenic organic aerosols are driven by only a few plant-associated microbial taxa, Atmos. Chem. Phys., 20, 5609–5628, https://doi.org/10.5194/acp-20-5609-2020, 2020.
Sánchez-Ochoa, A., Kasper-Giebl, A., Puxbaum, H., Gelencser, A., Legrand, M., and Pio, C.: Concentration of atmospheric cellulose: A proxy for plant debris across a west-east transect over Europe, J. Geophys. Res.-Atmos., 112, 2006JD008180, https://doi.org/10.1029/2006JD008180, 2007.
San-Miguel-Ayanz, J., Durrant, T., Boca, R., Maianti, P., Liberta, G., Oom, D., Branco, A., De Rigo, D., Ferrari, D., Roglia, E., and Scionti, N.: Advance report on forest fires in Europe, Middle East and North Africa 2022, Publications Office of the European Union, https://doi.org/10.2760/091540, 2023.
Sarrafzadeh, M., Wildt, J., Pullinen, I., Springer, M., Kleist, E., Tillmann, R., Schmitt, S. H., Wu, C., Mentel, T. F., Zhao, D., Hastie, D. R., and Kiendler-Scharr, A.: Impact of NOx and OH on secondary organic aerosol formation from β-pinene photooxidation, Atmos. Chem. Phys., 16, 11237–11248, https://doi.org/10.5194/acp-16-11237-2016, 2016.
Saunders, S. M., Jenkin, M. E., Derwent, R. G., and Pilling, M. J.: Protocol for the development of the Master Chemical Mechanism, MCM v3 (Part A): tropospheric degradation of non-aromatic volatile organic compounds, Atmos. Chem. Phys., 3, 161–180, https://doi.org/10.5194/acp-3-161-2003, 2003.
Seco, R., Peñuelas, J., and Filella, I.: Short-chain oxygenated VOCs: Emission and uptake by plants and atmospheric sources, sinks, and concentrations, Atmos. Environ., 41, 2477–2499, https://doi.org/10.1016/j.atmosenv.2006.11.029, 2007.
Seinfeld, J. H. and Pandis, S. N.: Atmospheric chemistry and physics. From air pollution to climate change, John Wiley and Sons, Inc., New York, ISBN 978-1-118-94740-1, 1998.
Seltzer, K. M., Pennington, E., Rao, V., Murphy, B. N., Strum, M., Isaacs, K. K., and Pye, H. O. T.: Reactive organic carbon emissions from volatile chemical products, Atmos. Chem. Phys., 21, 5079–5100, https://doi.org/10.5194/acp-21-5079-2021, 2021.
Simoneit, B. R. T., Schauer, J. J., Nolte, C. G., Oros, D. R., Elias, V. O., Fraser, M. P., Rogge, W. F., and Cass, G. R.: Levoglucosan, a tracer for cellulose in biomass burning and atmospheric particles, Atmos. Environ., 33, 173–182, https://doi.org/10.1016/S1352-2310(98)00145-9, 1999.
Simpson, D., Benedictow, A., Berge, H., Bergström, R., Emberson, L. D., Fagerli, H., Flechard, C. R., Hayman, G. D., Gauss, M., Jonson, J. E., Jenkin, M. E., Nyíri, A., Richter, C., Semeena, V. S., Tsyro, S., Tuovinen, J.-P., Valdebenito, Á., and Wind, P.: The EMEP MSC-W chemical transport model – technical description, Atmos. Chem. Phys., 12, 7825–7865, https://doi.org/10.5194/acp-12-7825-2012, 2012.
Simpson, D., Fagerli, H., Colette, A., Denier van der Gon, H., Dore, C., Hallquist, M., Hansson, H.-C., Maas, R., Rouil, L., Allemand, N., Bergström, R., Bessagnet, B., Couvidat, F., El Haddad, I., Genberg Safont, J., Goile, F., Grieshop, A., Fraboulet, I., Hallquist, Å., Hamilton, J., Juhrich, K., Klimont, Z., Kregar, Z., Mawdsely, I., Megaritis, A., Ntziachristos, L., Pandis, S., Prevot, A. S. H., Schindlbacher, S., Seljeskog, M., Sirina-Leboine, N., Sommers, J., and Åström, S.: How should condensables be included in PMemission inventories reported to EMEP/CLRTAP? Report of the expert workshop on condensable organics organised by MSC-W, Gothenburg, 17–19 March 2020, EMEP Technical Report MSC-W, 4/2020, Norwegian Meteorological Institute, Oslo, Norway, https://emep.int/publ/reports/2020/emep_mscw_technical_report_4_2020.pdf (last access: 12 December 2025), 2020.
Simpson, D., Benedictow, A., and Darras, S.: In CAMS2_61 – Global and European Emission Inventories. Documentation of CAMS Emission Inventory Products, Copernicus Atmosphere Monitoring Service, 59–68, Ref: CAMS261_2021SC1_D6.1.2-2022_202306_Docu_v1.docx, https://doi.org/10.24380/Q2SI-TI6I, 2023.
Simpson, D., Hood, C., Van Caspel, W., Vieno, M., and Wind, P.: Updates to the EMEP/MSC-W model, 2024–2025, in: Transboundary particulate matter, photo-oxidants, acidifying and eutrophying components, EMEP Status Report 1/2023, The Norwegian Meteorological Institute, Oslo, Norway, 195–203, https://emep.int/publ/reports/2023/EMEP_Status_Report_1_2023.pdf (last access: 10 November 2025), 2025.
Sindelarova, K., Granier, C., Bouarar, I., Guenther, A., Tilmes, S., Stavrakou, T., Müller, J.-F., Kuhn, U., Stefani, P., and Knorr, W.: Global data set of biogenic VOC emissions calculated by the MEGAN model over the last 30 years, Atmos. Chem. Phys., 14, 9317–9341, https://doi.org/10.5194/acp-14-9317-2014, 2014.
Sokhi, R. S., Singh, V., Querol, X., Finardi, S., Targino, A. C., Andrade, M. D. F., Pavlovic, R., Garland, R. M., Massagué, J., Kong, S., Baklanov, A., Ren, L., Tarasova, O., Carmichael, G., Peuch, V.-H., Anand, V., Arbilla, G., Badali, K., Beig, G., Belalcazar, L. C., Bolignano, A., Brimblecombe, P., Camacho, P., Casallas, A., Charland, J.-P., Choi, J., Chourdakis, E., Coll, I., Collins, M., Cyrys, J., Da Silva, C. M., Di Giosa, A. D., Di Leo, A., Ferro, C., Gavidia-Calderon, M., Gayen, A., Ginzburg, A., Godefroy, F., Gonzalez, Y. A., Guevara-Luna, M., Haque, Sk. M., Havenga, H., Herod, D., Hõrrak, U., Hussein, T., Ibarra, S., Jaimes, M., Kaasik, M., Khaiwal, R., Kim, J., Kousa, A., Kukkonen, J., Kulmala, M., Kuula, J., La Violette, N., Lanzani, G., Liu, X., MacDougall, S., Manseau, P. M., Marchegiani, G., McDonald, B., Mishra, S. V., Molina, L. T., Mooibroek, D., Mor, S., Moussiopoulos, N., Murena, F., Niemi, J. V., Noe, S., Nogueira, T., Norman, M., Pérez-Camaño, J. L., Petäjä, T., Piketh, S., Rathod, A., Reid, K., Retama, A., Rivera, O., Rojas, N. Y., Rojas-Quincho, J. P., San José, R., Sánchez, O., Seguel, R. J., Sillanpää, S., Su, Y., Tapper, N., Terrazas, A., Timonen, H., Toscano, D., Tsegas, G., Velders, G. J. M., Vlachokostas, C., Von Schneidemesser, E., Vpm, R., Yadav, R., Zalakeviciute, R., and Zavala, M.: A global observational analysis to understand changes in air quality during exceptionally low anthropogenic emission conditions, Environ. Int., 157, 106818, https://doi.org/10.1016/j.envint.2021.106818, 2021.
Solberg, S., Hov, Ø., Søvde, A., Isaksen, I. S. A., Coddeville, P., De Backer, H., Forster, C., Orsolini, Y., and Uhse, K.: European surface ozone in the extreme summer 2003, J. Geophys. Res.-Atmos., 113, 2007JD009098, https://doi.org/10.1029/2007JD009098, 2008.
Solberg, S., Claude, A., and Reiman, S.: VOC measurements 2022, EMEP/CCC-Report 4/2024, NILU, Kjeller Norway, https://emep-ccc.nilu.no/reports (last access: 10 November 2025), 2024.
Svenhag, C., Roldin, P., Olenius, T., Wollesen de Jonge, R., Blichner, S. M., Yazgi, D., and Sporre, M. K.: Seasonal differences in observed versus modelled new particle formation at two European boreal stations, Atmos. Chem. Phys., 25, 11483–11504, https://doi.org/10.5194/acp-25-11483-2025, 2025.
Szmigielski, R., Surratt, J. D., Gómez-González, Y., Van Der Veken, P., Kourtchev, I., Vermeylen, R., Blockhuys, F., Jaoui, M., Kleindienst, T. E., Lewandowski, M., Offenberg, J. H., Edney, E. O., Seinfeld, J. H., Maenhaut, W., and Claeys, M.: 3-methyl-1,2,3-butanetricarboxylic acid: An atmospheric tracer for terpene secondary organic aerosol, Geophys. Res. Lett., 34, 2007GL031338, https://doi.org/10.1029/2007GL031338, 2007.
Tröstl, J., Chuang, W. K., Gordon, H., Heinritzi, M., Yan, C., Molteni, U., Ahlm, L., Frege, C., Bianchi, F., Wagner, R., Simon, M., Lehtipalo, K., Williamson, C., Craven, J. S., Duplissy, J., Adamov, A., Almeida, J., Bernhammer, A.-K., Breitenlechner, M., Brilke, S., Dias, A., Ehrhart, S., Flagan, R. C., Franchin, A., Fuchs, C., Guida, R., Gysel, M., Hansel, A., Hoyle, C. R., Jokinen, T., Junninen, H., Kangasluoma, J., Keskinen, H., Kim, J., Krapf, M., Kürten, A., Laaksonen, A., Lawler, M., Leiminger, M., Mathot, S., Möhler, O., Nieminen, T., Onnela, A., Petäjä, T., Piel, F. M., Miettinen, P., Rissanen, M. P., Rondo, L., Sarnela, N., Schobesberger, S., Sengupta, K., Sipilä, M., Smith, J. N., Steiner, G., Tomè, A., Virtanen, A., Wagner, A. C., Weingartner, E., Wimmer, D., Winkler, P. M., Ye, P., Carslaw, K. S., Curtius, J., Dommen, J., Kirkby, J., Kulmala, M., Riipinen, I., Worsnop, D. R., Donahue, N. M., and Baltensperger, U.: The role of low-volatility organic compounds in initial particle growth in the atmosphere, Nature, 533, 527–531, https://doi.org/10.1038/nature18271, 2016.
Tsyro, S., Schultz, M., Mortier, A., Valdebenito, A., Benedictow, A., Timmerman, A., Kranenburg, R., and Collete, A.: Ozone pollution episode of 12 – 20 July 2022, CAMS2_71 episode analysis report, N° 03 in 2022, CAMS, https://policy.atmosphere.copernicus.eu/reports/CAMS2-71_Ozone_episode_12-20July2022.pdf (last access: 12 December 2024), 2022.
UNECE: 1999 Protocol to Abate Acidification, Eutrophication and Ground-level Ozone to the Convention on Long-range Transboundary Air Pollution, as amended on 4 May 2012, ECE/EB.AIR/114, https://unece.org/sites/default/files/2021-10/ECE.EB_.AIR_.114_ENG.pdf (last access: 19 February 2024), 2012.
UNECE: Monitoring strategy for the Cooperative Programme for Monitoring and Evaluation of the Long-range Transmission of Air Pollutants in Europe for the period 2020–2029, ECE/EB.AIR/144/Add.1, http://www.unece.org/env/documents/2009/EB/ge1/ece.eb.air.ge.1.2009.15.e.pdf (last access: 31 March 2024), 2019.
van der Werf, G. R., Randerson, J. T., van Wees, D., Chen, Y., Giglio, L., Hall, J., Vernooij, R., Mu, M., Shahid, S. B., Barsanti, K. C., Yokelson, R., and Morton D. C.: Landscape fire emissions from the 5th version of the Global Fire Emissions Database (GFED5), Scientific Data, 12, 1870, https://doi.org/10.1038/s41597-025-06127-w, 2025.
Vazquez Santiago, J., Hata, H., Martinez-Noriega, E. J., and Inoue, K.: Ozone trends and their sensitivity in global megacities under the warming climate, Nat. Commun., 15, 10236, https://doi.org/10.1038/s41467-024-54490-w, 2024.
Vestenius, M., Hellén, H., Levula, J., Kuronen, P., Helminen, K. J., Nieminen, T., Kulmala, M., and Hakola, H.: Acidic reaction products of monoterpenes and sesquiterpenes in atmospheric fine particles in a boreal forest, Atmos. Chem. Phys., 14, 7883–7893, https://doi.org/10.5194/acp-14-7883-2014, 2014.
Wang, W., Yan, Y., Fang, H., Li, J., Zha, S., and Wu, T.: Volatile organic compound emissions from typical industries: Implications for the importance of oxygenated volatile organic compounds, Atmospheric Pollut. Res., 14, 101640, https://doi.org/10.1016/j.apr.2022.101640, 2023.
Wang, W., Yuan, B., Su, H., Cheng, Y., Qi, J., Wang, S., Song, W., Wang, X., Xue, C., Ma, C., Bao, F., Wang, H., Lou, S., and Shao, M.: A large role of missing volatile organic compound reactivity from anthropogenic emissions in ozone pollution regulation, Atmos. Chem. Phys., 24, 4017–4027, https://doi.org/10.5194/acp-24-4017-2024, 2024.
Wang, Y., Jacob, D. J., and Logan, J. A.: Global simulation of tropospheric O3-NOx-hydrocarbon chemistry: 1. Model formulation, J. Geophys. Res.-Atmos., 103, 10713–10725, https://doi.org/10.1029/98JD00158, 1998.
Wennberg, P. O., Bates, K. H., Crounse, J. D., Dodson, L. G., McVay, R. C., Mertens, L. A., Nguyen, T. B., Praske, E., Schwantes, R. H., Smarte, M. D., St Clair, J. M., Teng, A. P., Zhang, X., and Seinfeld, J. H.: Gas-Phase Reactions of Isoprene and Its Major Oxidation Products, Chem. Rev., 118, 3337–3390, https://doi.org/10.1021/acs.chemrev.7b00439, 2018.
WHO: WHO global air quality guidelines. Particulate matter (PM2.5 and PM10), ozone, nitrogen dioxide, sulfur dioxide and carbon monoxide. Executive summary, World Health Organization, Geneva, https://www.who.int/europe/publications/i/item/9789240034433 (last access: 19 May 2024), 2021.
Wiedensohler, A., Birmili, W., Nowak, A., Sonntag, A., Weinhold, K., Merkel, M., Wehner, B., Tuch, T., Pfeifer, S., Fiebig, M., Fjäraa, A. M., Asmi, E., Sellegri, K., Depuy, R., Venzac, H., Villani, P., Laj, P., Aalto, P., Ogren, J. A., Swietlicki, E., Williams, P., Roldin, P., Quincey, P., Hüglin, C., Fierz-Schmidhauser, R., Gysel, M., Weingartner, E., Riccobono, F., Santos, S., Grüning, C., Faloon, K., Beddows, D., Harrison, R., Monahan, C., Jennings, S. G., O'Dowd, C. D., Marinoni, A., Horn, H.-G., Keck, L., Jiang, J., Scheckman, J., McMurry, P. H., Deng, Z., Zhao, C. S., Moerman, M., Henzing, B., de Leeuw, G., Löschau, G., and Bastian, S.: Mobility particle size spectrometers: harmonization of technical standards and data structure to facilitate high quality long-term observations of atmospheric particle number size distributions, Atmos. Meas. Tech., 5, 657–685, https://doi.org/10.5194/amt-5-657-2012, 2012.
Wolfe, G. M., Kaiser, J., Hanisco, T. F., Keutsch, F. N., de Gouw, J. A., Gilman, J. B., Graus, M., Hatch, C. D., Holloway, J., Horowitz, L. W., Lee, B. H., Lerner, B. M., Lopez-Hilifiker, F., Mao, J., Marvin, M. R., Peischl, J., Pollack, I. B., Roberts, J. M., Ryerson, T. B., Thornton, J. A., Veres, P. R., and Warneke, C.: Formaldehyde production from isoprene oxidation across NOx regimes, Atmos. Chem. Phys., 16, 2597–2610, https://doi.org/10.5194/acp-16-2597-2016, 2016.
Wollesen de Jonge, R., Elm, J., Rosati, B., Christiansen, S., Hyttinen, N., Lüdemann, D., Bilde, M., and Roldin, P.: Secondary aerosol formation from dimethyl sulfide – improved mechanistic understanding based on smog chamber experiments and modelling, Atmos. Chem. Phys., 21, 9955–9976, https://doi.org/10.5194/acp-21-9955-2021, 2021.
Wollesen De Jonge, R., Xavier, C., Olenius, T., Elm, J., Svenhag, C., Hyttinen, N., Nieradzik, L., Sarnela, N., Kristensson, A., Petäjä, T., Ehn, M., and Roldin, P.: Natural Marine Precursors Boost Continental New Particle Formation and Production of Cloud Condensation Nuclei, Environ. Sci. Technol., 58, 10956–10968, https://doi.org/10.1021/acs.est.4c01891, 2024.
Wu, R. and Xie, S.: Spatial Distribution of Secondary Organic Aerosol Formation Potential in China Derived from Speciated Anthropogenic Volatile Organic Compound Emissions, Environ. Sci. Technol., 52, 8146–8156, https://doi.org/10.1021/acs.est.8b01269, 2018.
Xavier, C., Wollesen De Jonge, R., Jokinen, T., Beck, L., Sipilä, M., Olenius, T., and Roldin, P.: Role of Iodine-Assisted Aerosol Particle Formation in Antarctica, Environ. Sci. Technol., 58, 7314–7324, https://doi.org/10.1021/acs.est.3c09103, 2024.
Yan, C., Nie, W., Vogel, A. L., Dada, L., Lehtipalo, K., Stolzenburg, D., Wagner, R., Rissanen, M. P., Xiao, M., Ahonen, L., Fischer, L., Rose, C., Bianchi, F., Gordon, H., Simon, M., Heinritzi, M., Garmash, O., Roldin, P., Dias, A., Ye, P., Hofbauer, V., Amorim, A., Bauer, P. S., Bergen, A., Bernhammer, A.-K., Breitenlechner, M., Brilke, S., Buchholz, A., Mazon, S. B., Canagaratna, M. R., Chen, X., Ding, A., Dommen, J., Draper, D. C., Duplissy, J., Frege, C., Heyn, C., Guida, R., Hakala, J., Heikkinen, L., Hoyle, C. R., Jokinen, T., Kangasluoma, J., Kirkby, J., Kontkanen, J., Kürten, A., Lawler, M. J., Mai, H., Mathot, S., Mauldin, R. L., Molteni, U., Nichman, L., Nieminen, T., Nowak, J., Ojdanic, A., Onnela, A., Pajunoja, A., Petäjä, T., Piel, F., Quéléver, L. L. J., Sarnela, N., Schallhart, S., Sengupta, K., Sipilä, M., Tomé, A., Tröstl, J., Väisänen, O., Wagner, A. C., Ylisirniö, A., Zha, Q., Baltensperger, U., Carslaw, K. S., Curtius, J., Flagan, R. C., Hansel, A., Riipinen, I., Smith, J. N., Virtanen, A., Winkler, P. M., Donahue, N. M., Kerminen, V.-M., Kulmala, M., Ehn, M., and Worsnop, D. R.: Size-dependent influence of NOx on the growth rates of organic aerosol particles, Sci. Adv., 6, eaay4945, https://doi.org/10.1126/sciadv.aay4945, 2020.
Yáñez-Serrano, A. M., Filella, I., LLusià, J., Gargallo-Garriga, A., Granda, V., Bourtsoukidis, E., Williams, J., Seco, R., Cappellin, L., Werner, C., De Gouw, J., and Peñuelas, J.: GLOVOCS – Master compound assignment guide for proton transfer reaction mass spectrometry users, Atmos. Environ., 244, 117929, https://doi.org/10.1016/j.atmosenv.2020.117929, 2021.
Yáñez-Serrano, A. M., Peñuelas, J., Jorba, O., Graeffe, F., Meder, M., Garmash, O., Zhang, Y., Li, H., Luo, Y., Praplan, A., Hellén, H., Schobesberger, S., Vettikkat, L., Thomas, S., Kurtén, T., Taipale, D., Bourtsoukidis, E., Guenther, A., and Ehn, M.: Unaccounted impacts of diterpene emissions on atmospheric aerosol loadings, Commun. Earth Environ., 6, 636, https://doi.org/10.1038/s43247-025-02613-6, 2025.
Yttri, K. E.: Measurement of Organic tracers at Beograd Ada Marina, EBAS [data set], https://doi.org/10.48597/FZTX-QNX9, 2025a.
Yttri, K. E.: Measurement of Organic tracers at Birkenes II, EBAS [data set], https://doi.org/10.48597/FWQC-V9QW, 2025b.
Yttri, K. E.: Measurement of Organic tracers at Bor Gradski park, EBAS [data set], https://doi.org/10.48597/GK3W-YRUN, 2025c.
Yttri, K. E., Aas, W., Bjerke, A., Cape, J. N., Cavalli, F., Ceburnis, D., Dye, C., Emblico, L., Facchini, M. C., Forster, C., Hanssen, J. E., Hansson, H. C., Jennings, S. G., Maenhaut, W., Putaud, J. P., and Tørseth, K.: Elemental and organic carbon in PM10: a one year measurement campaign within the European Monitoring and Evaluation Programme EMEP, Atmos. Chem. Phys., 7, 5711–5725, https://doi.org/10.5194/acp-7-5711-2007, 2007.
Yttri, K. E., Simpson, D., Nøjgaard, J. K., Kristensen, K., Genberg, J., Stenström, K., Swietlicki, E., Hillamo, R., Aurela, M., Bauer, H., Offenberg, J. H., Jaoui, M., Dye, C., Eckhardt, S., Burkhart, J. F., Stohl, A., and Glasius, M.: Source apportionment of the summer time carbonaceous aerosol at Nordic rural background sites, Atmos. Chem. Phys., 11, 13339–13357, https://doi.org/10.5194/acp-11-13339-2011, 2011.
Yttri, K. E., Canonaco, F., Eckhardt, S., Evangeliou, N., Fiebig, M., Gundersen, H., Hjellbrekke, A.-G., Lund Myhre, C., Platt, S. M., Prévôt, A. S. H., Simpson, D., Solberg, S., Surratt, J., Tørseth, K., Uggerud, H., Vadset, M., Wan, X., and Aas, W.: Trends, composition, and sources of carbonaceous aerosol at the Birkenes Observatory, northern Europe, 2001–2018, Atmos. Chem. Phys., 21, 7149–7170, https://doi.org/10.5194/acp-21-7149-2021, 2021.
Yuan, B., Koss, A. R., Warneke, C., Coggon, M., Sekimoto, K., and De Gouw, J. A.: Proton-Transfer-Reaction Mass Spectrometry: Applications in Atmospheric Sciences, Chem. Rev., 117, 13187–13229, https://doi.org/10.1021/acs.chemrev.7b00325, 2017.
Zhang, J., Zhao, J., Wollesen de Jonge, R., Sarnela, N., Roldin, P., and Ehn, M.: Evaluating the Applicability of a Real-Time Highly Oxygenated Organic Molecule (HOM)-Based Indicator for Ozone Formation Sensitivity at a Boreal Forest Station, Environ. Sci. Technol. Lett., 11, 1227–1232, https://doi.org/10.1021/acs.estlett.4c00733, 2024.
Zhu, C.-S., Qu, Y., Dai, W.-T., Zhang, N.-N., Zhang, Z.-S., and Cao, J.-J.: Nonnegligible biogenic organic aerosol and the correlations with light absorption at three high altitude locations in the Qinghai–Tibetan Plateau, Atmos. Environ., 291, 119394, https://doi.org/10.1016/j.atmosenv.2022.119394, 2022.
Ziska, F., Quack, B., Abrahamsson, K., Archer, S. D., Atlas, E., Bell, T., Butler, J. H., Carpenter, L. J., Jones, C. E., Harris, N. R. P., Hepach, H., Heumann, K. G., Hughes, C., Kuss, J., Krüger, K., Liss, P., Moore, R. M., Orlikowska, A., Raimund, S., Reeves, C. E., Reifenhäuser, W., Robinson, A. D., Schall, C., Tanhua, T., Tegtmeier, S., Turner, S., Wang, L., Wallace, D., Williams, J., Yamamoto, H., Yvon-Lewis, S., and Yokouchi, Y.: Global sea-to-air flux climatology for bromoform, dibromomethane and methyl iodide, Atmos. Chem. Phys., 13, 8915–8934, https://doi.org/10.5194/acp-13-8915-2013, 2013.
Zotter, P., Ciobanu, V. G., Zhang, Y. L., El-Haddad, I., Macchia, M., Daellenbach, K. R., Salazar, G. A., Huang, R.-J., Wacker, L., Hueglin, C., Piazzalunga, A., Fermo, P., Schwikowski, M., Baltensperger, U., Szidat, S., and Prévôt, A. S. H.: Radiocarbon analysis of elemental and organic carbon in Switzerland during winter-smog episodes from 2008 to 2012 – Part 1: Source apportionment and spatial variability, Atmos. Chem. Phys., 14, 13551–13570, https://doi.org/10.5194/acp-14-13551-2014, 2014.