the Creative Commons Attribution 4.0 License.
the Creative Commons Attribution 4.0 License.
 | 20 Jan 2026
Measurement report: 30 years of BTEX monitoring at a suburban site in Switzerland supported by additional urban VOC observations
Zoé Le Bras
Pascal Rubli
Christoph Hueglin
Since 1994, benzene, toluene, ethylbenzene and xylene isomers (BTEX) are monitored in the ambient air at Dübendorf (DUE) in the suburban area of Zurich city in Switzerland. Overall, BTEX concentrations decreased up to 89 % in ambient air in DUE notably due to the introduction of regulations concerning the air quality such as limiting benzene concentrations in car fuel or the introduction of the incentive tax on volatile organic compounds (VOC) in 2000 in Switzerland. While BTEX was one of the major VOCs compound classes in 1994 (33 % of the total non-methane hydrocarbons (NMHC)), BTEX contribution to total NMHC significantly decreased to 6.3 % in 2024. Before 2000, traffic exhaust emissions were the dominant source of BTEX to the ambient air with a toluene-to-benzene (T : B) ratio of 2.4 ± 0.1. Since 2000, the contribution of vehicle emissions to toluene concentrations in ambient air in DUE during summer has decreased from 82 % to 65 %, with the remaining proportion emitted from solvent emissions. As BTEX are important ozone and secondary organic aerosol (SOA) precursors, the long-term measurements in Dübendorf was complemented with VOC data from the urban background station at Kaserne Zurich to assess the contribution of BTEX to ambient VOC composition. While the BTEX contribution to ozone formation potential (OFP) has decreased from 25 % in 2005 to 8 % in 2024, their relative contribution to SOA formation potential remains high, contributing to 80 % of the SOA formation potential of the total VOCs measured in Zurich in 2024.
- Article
(1768 KB) - Full-text XML
-
Supplement
(5442 KB) - BibTeX
- EndNote


Benzene, toluene, ethylbenzene and xylene isomers, referred to as BTEX compounds, are volatile aromatic hydrocarbons found in ambient air which are predominately of anthropogenic origin and are precursors of tropospheric ozone and secondary organic aerosols (SOA) (Atkinson, 2000). Benzene, one of the most abundant BTEX in urban areas, is classified as known carcinogen to humans (Group 1) (Althouse et al., 1980). Long-term or high-level exposure to BTEX showed adverse effects on human health (Demirel et al., 2014). Since inhalation is the primary route of BTEX entry into human body, monitoring these volatile organic compounds (VOC) in ambient air remains crucial for assessing associated health risks. These aromatic hydrocarbons can represent an important fraction (up to 40 %) of NMHC emitted in (sub)urban areas (Derwent et al., 2000; Borbon et al., 2002). Car exhaust and industrial activities represent the main emissions of BTEX in ambient urban air (Caselli et al., 2010). Combustion of benzene-containing petrol and coal, as well as the evaporation from gasoline service stations represent the main sources of benzene (Schnatter, 2000; Ballesta et al., 2006). Toluene, commonly used as a solvent, can also be emitted from fuel combustion and biomass burning (Kavouras and Zielinska, 2012). Ethylbenzene and xylene isomers have similar sources, mostly originating from petrol industries and solvents (Monod et al., 2001). Once released into the atmosphere, these compounds undergo oxidation by hydroxyl radicals with lifetimes between 2 weeks (benzene), two days (toluene, ethylbenzene) and some hours (xylene) (Monod et al., 2001). They can form highly oxygenated compounds that contribute to higher levels of tropospheric ozone and to the formation of secondary organic aerosols (SOA) (Molteni et al., 2018; Calvert et al., 2002). Higher tropospheric ozone events, driven by abundant ozone precursors under stagnant meteorological conditions and sufficient solar radiation, can cause severe damages to human health and vegetation (Lippmann, 1991; Edwards et al., 2014). Consequently, reducing BTEX emissions and subsequently the production of tropospheric ozone are critical for effective air pollution management and to reduce human risks in (sub)urban areas.
Various regulations on the emissions of VOCs have been implemented in Switzerland and Europe to mitigate their potential harmful effects to human health. Since 1987, gasoline engines are equipped with 3-way catalysts reducing the emissions of aromatic hydrocarbons and other VOCs from car exhausts in Europe (Heeb et al., 2000). In 2000, the ordinance on the incentive tax on VOCs has been introduced in Switzerland, regulating the use of solvents, such as toluene and xylene (Swiss Confederation, 1997). In addition, from 2000 onwards, the benzene content in gasoline engines in Switzerland has been restricted stepwise from 5 % vol to less than 1 % vol of benzene according to the Ordinance on Air Pollution Control (Swiss Confederation, 1986). In 2005, toluene and benzene were added to the list of substances with restricted use under the Swiss Chemical Risk Reduction Ordinance (ORRChem; Swiss Confederation, 2005). For example, preparations containing of benzene levels of 0.1 wt % or more is prohibited on the market and adhesives and spray paints destined for the general public should contain less than 0.1 wt % of toluene.
Thus, long-term monitoring of BTEX in the ambient atmosphere is essential for identifying trends in their concentrations and establishing their urban background concentrations, providing valuable data on the impact of ongoing and future air quality policy management. The longest continuous BTEX monitoring time series in Europe began at the suburban London Eltham station in late 1993 within the UK Automatic Hydrocarbon Monitoring Network, followed shortly thereafter by Dübendorf in Switzerland in early 1994. In this study, we present the BTEX data collected over 30 years in Dübendorf from the ground-based monitoring station in the suburban area of Zurich. BTEX measurements from traffic, urban, and rural sites across Switzerland are compared with those from Dübendorf. Furthermore, this study integrates VOC measurements collected in parallel with BTEX monitoring at the urban background station in Zurich to relate BTEX concentrations to the overall composition of ambient VOCs. This unique dataset allows us to (i) evaluate the effects of successive VOC regulatory measures on ambient BTEX concentrations in Switzerland and (ii) investigate how the contribution of BTEX to tropospheric ozone and secondary aerosol formation has evolved over time.
2.1 Sampling areas
Dübendorf station, later referred as DUE, is located in the suburban area of Zurich city (47.405° N; 8.609° E; 435 m above sea level – m a.s.l.) in Switzerland and is considered as a suburban monitoring station. Benzene and toluene are monitored continuously since 1994 in the ambient air at DUE while the monitoring of xylene and ethylbenzene was only performed from 1994 until 2010, due to their decreasing concentrations in ambient air making it very laborious to measure these compounds with the required precision. As a consequence, BTEX are monitored since 2011 at the road side station in Bern (BER; 46.570° N, 7.263° E; 536 m a.s.l.), which exhibits higher traffic influence and higher BTEX concentrations. At both stations, BTEX are measured with a gas chromatograph equipped with a photoionization detector (GC-PID, GC955 BTEX Analyzer, Synspec, the Netherlands).
In addition, sampling of BTEX has been conducted in Zurich city at Kaserne Zurich, considered as an urban background site (ZUE, 47.378° N, 8.530° E; 409 m a.s.l.) from 1993 to 1994, from 2001 to 2017 and since 2022 with a GC-flame ionization detector (GC-FID) with 1 h resolution. Online measurements of BTEX using GC-FID are conducted since 2018 at the rural Beromünster station (BRM; 47.190° N, 8.175° E; 797 m a.s.l.). All monitoring sites are part of the Swiss National Air Pollution Monitoring Network (NABEL).
2.2 BTEX measurement and ancillary data
Air samples for BTEX analysis are taken from the main inlet of the monitoring station in DUE and BER every 20 min and every hour at ZUE and BRM from a sampling line continuously flushed with air and analyzed by GC-PID or GC-FIDs respectively. BTEX concentrations are aggregated to 1 h resolution. Calibration and QA/QC assessments are monthly conducted. GC-PID instruments are calibrated with real-air standards filled with urban ambient air and are calibrated against a 4 ppbv 30-compound standard in nitrogen from the National Physical Laboratory (NPL) while GC-FIDs instrument are monthly calibrated using the 4 ppbv 30-compound NPL standard. Detection limits for all BTEX are 10 ppt.
Ancillary data, including ambient temperature, total NMHC, nitrogen oxides (NOx) and carbon monoxide (CO) concentrations are available from NABEL. Data from NABEL can be made available on request. Total NMHC concentration (ppm C) refers to the difference between total volatile hydrocarbons and methane concentrations measured simultaneously at the station with dedicated FID instruments (APHA-360 and APHA-370; HORIBA, Ltd.). As the carbon contribution of the oxygenated volatile compounds to total NMHC is lower than 1 : 1 due to the presence of oxygen, the same effective carbon number as the FID's response of the GC-FID analysis is used to calculate their contribution to total NMHC concentration. NOx and CO measurements are performed using type-approved instruments in accordance with European Standards EN 14211 and EN 14626, respectively. CO observations at DUE are missing for the years 2000–2009.
2.3 VOC measurements with GC-FID in ZUE
In addition to the BTEX measurement conducted in ZUE, VOC sampling with 1 h resolution was conducted using a GC-FID. Prior to 2023, oxygenated VOC (OVOC) monitoring in ZUE was not routinely performed. Consequently, a complete dataset of all VOCs quantified with our analytical system is only available for April–December 2005 and the complete years 2015, 2023 and 2024. Data related to VOCs are available in the EBAS Database at https://ebas-data.nilu.no/ (last access: 23 December 2025). An overview list with the VOCs measured in Zurich and their corresponding class is available in Table S1 in the Supplement. The sampling and analytical procedures used for the 2005 dataset are described in Lanz et al. (2008). The procedure for the subsequent years closely follows that applied in 2005, as detailed in the following description. The GC is equipped with two capillary columns connected via a Deans Switch (Restrictor DB-1, 2.48 m × 0.25 mm) and two FID detectors, enabling the simultaneous detection of alkane, alkene, alkyne, BTEX, terpene and OVOC. 300 mL of ambient air from the main inlet passes through a glass trap maintained at −43 °C to remove residual water and is subsequently trapped onto a multi-sorbent trap (U-T17O3P-2S, Markes International Ltd). The trap is then heated to 250 °C for 5 min and the desorbed VOCs are transferred to the GC (7890B, Agilent Technologies). Alkane, alkene and alkyne are separated on a PLOT column (Al2O3, Na2SO4; 50 m × 0.53 mm × 10 µm) while BTEX, terpenes and OVOCs are separated on an OxyPLOT column (30 m × 0.53 mm × 10 µm). Calibration and QA/QC procedures follow the same protocol as described in Sect. 2.2. If no standard is available for a given compound, its concentration is calculated according to the response factor of benzene in the calibration tank and to its effective carbon number (ECN) given in Sternberg et al. (1962).
3.1 Decrease in BTEX concentrations from 1994
At the suburban Dübendorf station, BTEX monitoring began in 1994. The longest continuous time series is available for benzene and toluene, while monitoring of ethylbenzene and xylene was discontinued in 2011 due to their low concentrations. An overview of the monthly data coverage based on benzene and toluene observations is given in Fig. S1 in the Supplement. Since no measurements of ethylbenzene and xylene are available after 2011, their concentrations from 2011 onwards were estimated based on their average relative contributions to total BTEX concentrations derived from the measurement period 1994–2010 (Fig. S2). For this estimation, the yearly sum of benzene and toluene was used together with the known average relative fractions of ethylbenzene and xylene determined for 1994–2010. The estimated and measured concentrations of both compounds showed good agreement (R2=0.94 and R2=0.97 for ethylbenzene and xylene, respectively; Fig. S3). Overall, BTEX concentrations declined between 1994 and 2024 with reduction of up to 89 % depending on the aromatic compound considered (Fig. 1A). Additionally, CO concentration decreased by 47 % (from 536 to 283 ppb), NOx by 67 % (from 33 to 11 ppb) and total NMHC by 58 % (from 146 to 62 ppb C) between 1994 and 2022 in DUE (Figs. 1B and S4).
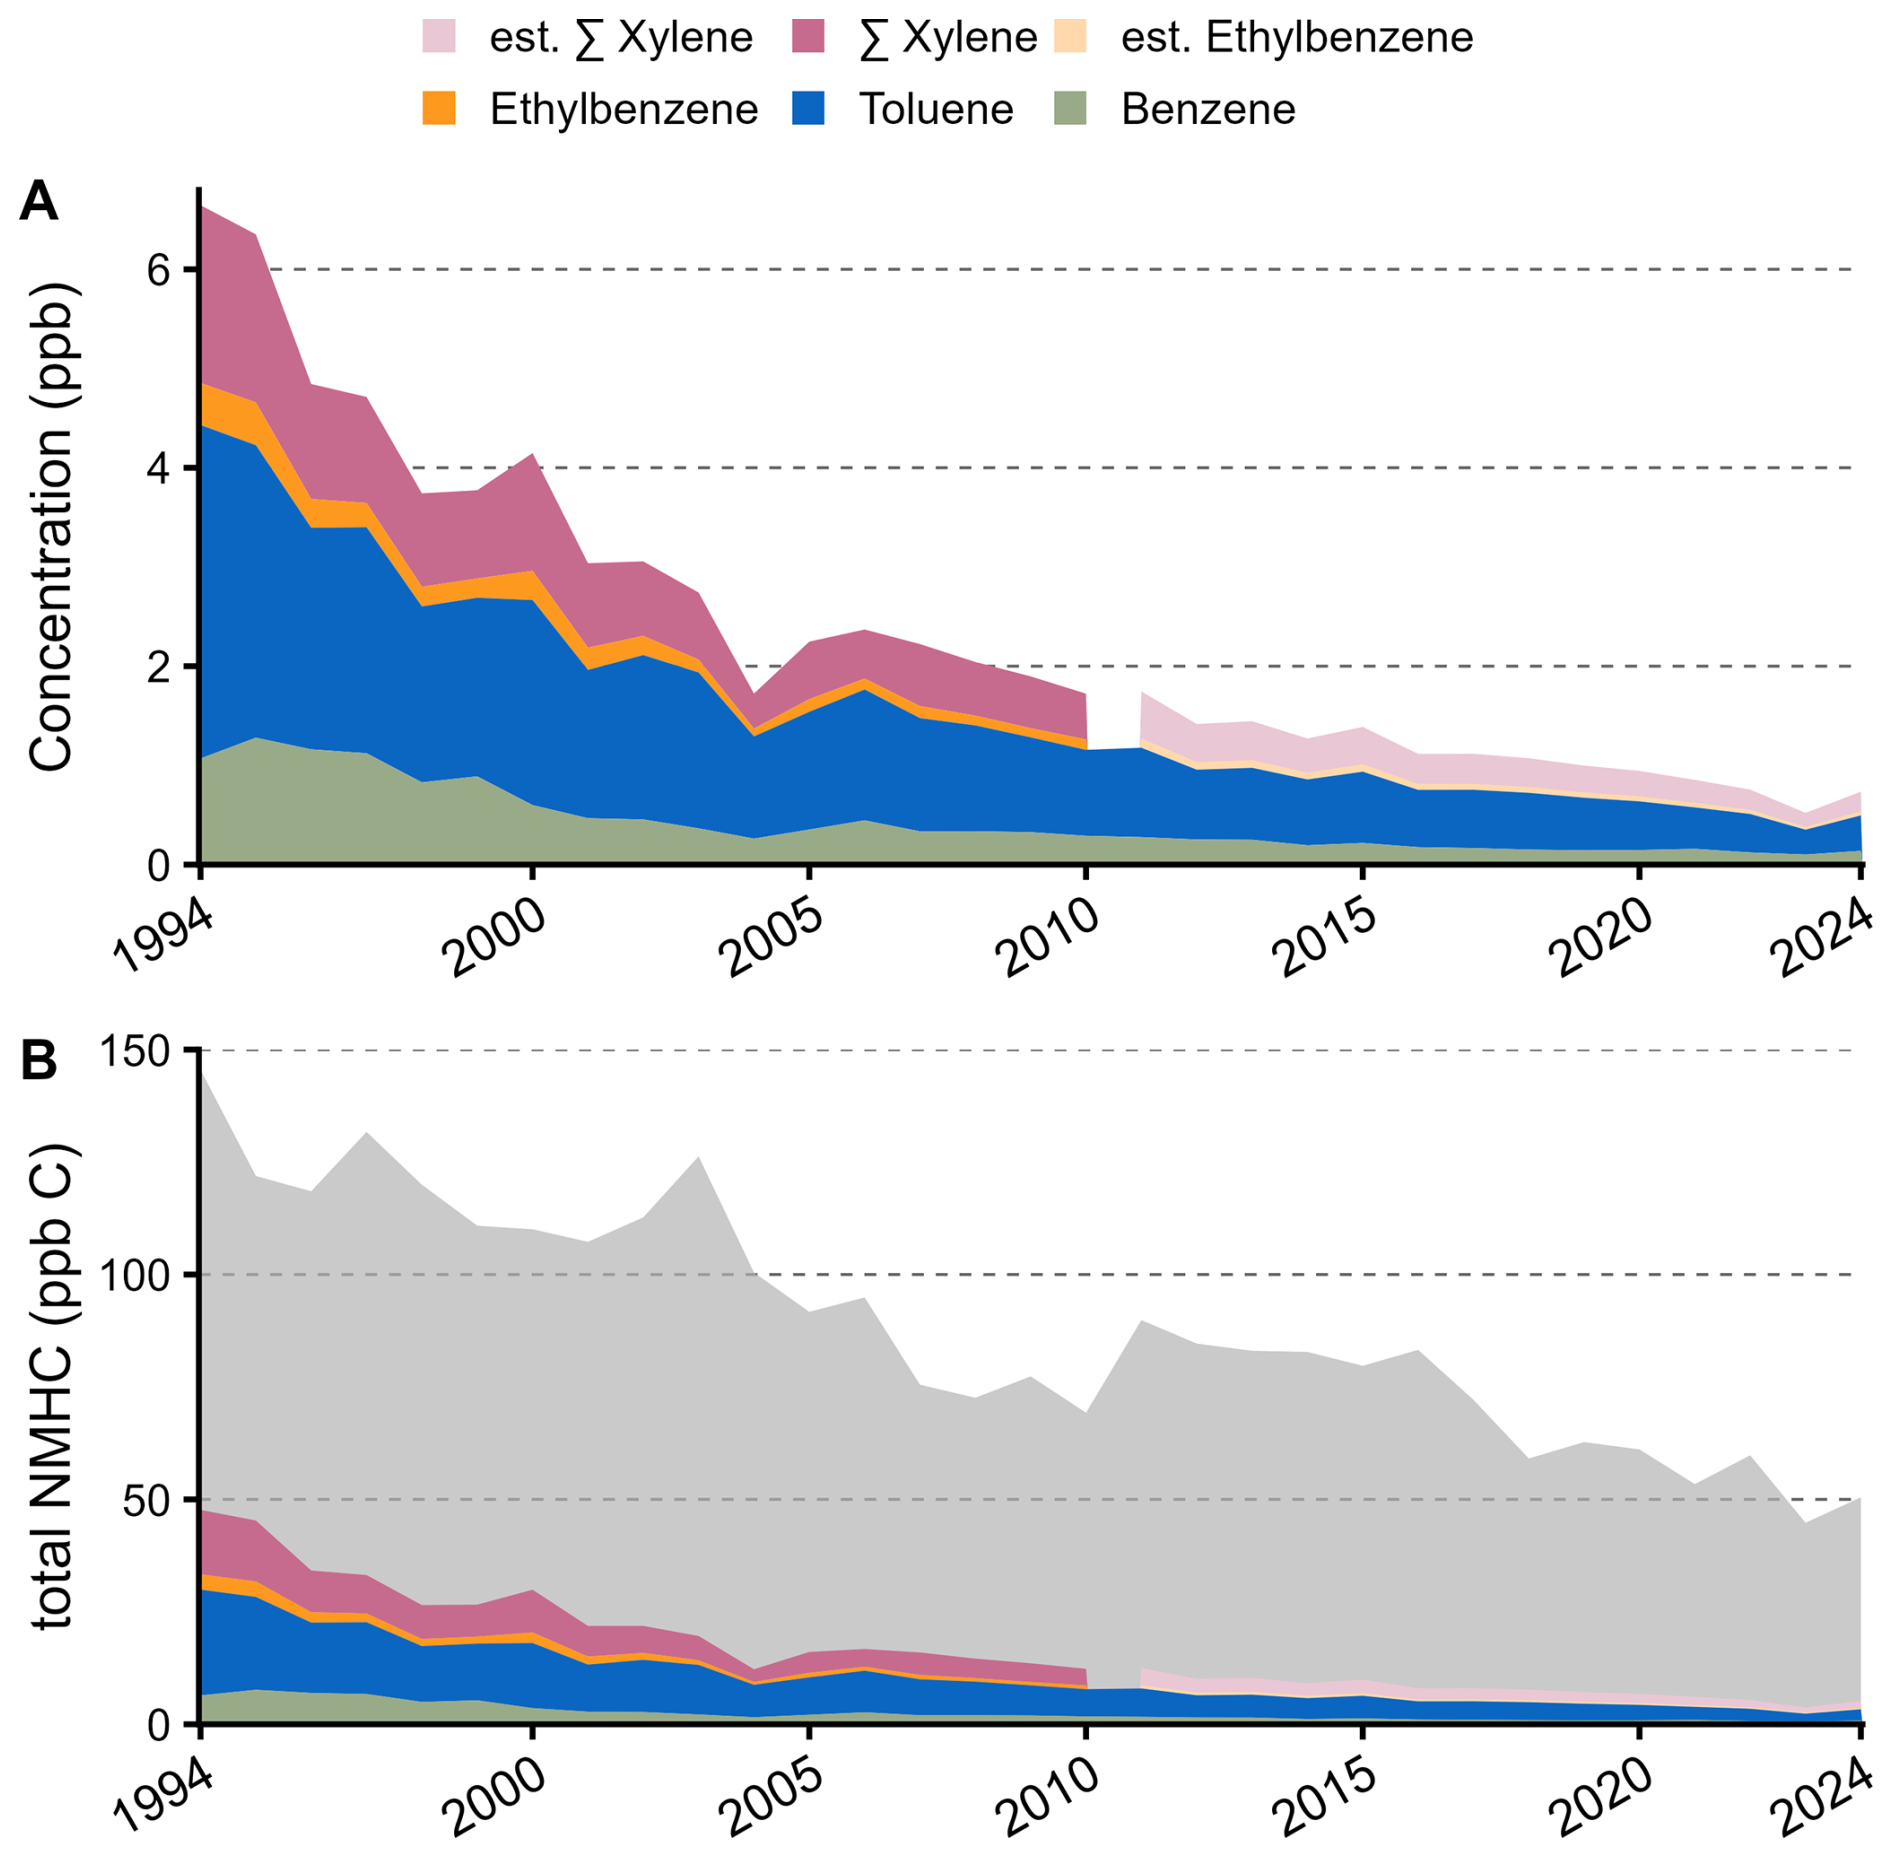
Figure 1Yearly averages of benzene, toluene, ethylbenzene, xylene (sum of m-, o- and p-xylene) concentrations (A), their corresponding concentrations in ppb C and total NMHC concentration (gray, B) from 1994 to 2024 at the suburban station DUE. After 2011, xylene and ethylbenzene concentrations were estimated based on their relative contribution to BTEX before 2011, further details given in Figs. S2–S3. BTEX concentrations in ppb C in (B) have been calculated according to the effective carbon number of each single compound.
In 1994, BTEX compounds constituted 33 % of the total NMHC concentrations in DUE and 6.3 % in 2024 corresponding to a decrease by 81 % (Fig. 1B). Toluene is the most abundant BTEX compound in DUE with its yearly average concentration decreasing by 89 % between 1994 and 2024 (from 3.3 to 0.36 ppb). For the same time period considered, benzene concentrations decreased by 87 % (from 1.1 to 0.14 ppb). The most pronounced year-to-year reduction in benzene concentrations occurred between 1999 and 2000 with concentrations decreasing by 33 % from 0.89 to 0.60 ppb attributed to the reduction of benzene content in gasoline. Ethylbenzene and xylene decreased by 75 % (from 0.42 to 0.10 ppb and from 1.7 to 0.46 ppb, respectively) between 1994 and 2010. For toluene, ethylbenzene and xylene, the most significant decrease in concentrations occurred between 2003 and 2004 with an average reduction of 40 %. Nevertheless, no regulations on VOC emissions were implemented in Switzerland during this period, nor any exceptional meteorological conditions were observed that could explain these low concentrations. A comparison with the time series from ZUE showed significant lower concentrations in DUE in 2004, whereas in other years both sites have comparable seasonal patterns with similar concentration ranges (Figs. S5–S7). Besides from the discrepancies observed in 2004, a significant decrease in concentrations of these compounds was observed in 2001 with an average decrease of 28 % after the introduction of the VOC incentive tax. Since 2016, benzene and toluene concentrations have decreased by an average of 5 % yr−1 with concentrations below 0.20 and 0.60 ppb, respectively.
At all the Swiss monitoring stations, a decrease in BTEX concentrations is observed (Fig. S8). Toluene remains the most abundant BTEX compounds. In ZUE, very similar BTEX concentration ranges and reduction as in DUE were observed between 1994 and 2024 with toluene concentration decreasing by 86 % (from 2.5 to 0.36 ppb) and benzene concentration by 81 % (from 0.91 to 0.17 ppb). Between 2001 and 2024, ethylbenzene decreased by 82 % (from 0.30 to 0.05 ppb) and xylene by 78 % (from 1.1 to 0.26 ppb) in ZUE. BTEX concentrations in BER were overall higher due to the station's proximity to a busy road. In 2023, yearly average concentrations at BER reached 0.16 ppb for benzene, 0.35 ppb for toluene, 0.04 ppb for ethylbenzene, and 0.20 ppb for xylene. Average BTEX concentrations at BER decreased by 71 % between 2011 and 2023. Over the same period, benzene and toluene concentrations at DUE declined by 50 % and 60 %, respectively. In contrast, the rural BRM site showed much lower concentrations in 2024, with yearly average of 0.09 ppb for benzene, 0.17 ppb for toluene, 0.01 ppb for ethylbenzene and 0.04 ppb for xylene.
The reduction in BTEX concentrations at DUE was also observed at other European monitoring sites for the same period. Long-term monitoring of BTEX at the Augsburg Königsplatz traffic station in Germany has been conducted since 1995 (Bayerisches Landesamt für Umwelt, 2025). Between 1995 and 2023, the decrease in benzene and toluene concentrations was comparable to that observed at DUE, decreasing by 96 % from 3.6 to 0.11 ppb and from 7.4 to 0.27 ppb, respectively. A similar trend was observed at the London Eltham suburban station, where BTEX concentrations decreased on average by 90 % between 1995 and 2022, with benzene decreasing from 1.2 to 0.12 ppb, toluene from 2.5 to 0.20 ppb, ethylbenzene from 0.45 to 0.043 ppb and xylene from 0.83 to 0.086 ppb (Defra, 2025).
To visualize the evolution of BTEX concentrations in DUE over three decades, we grouped the data into four representative periods: the late 1990s (1994–2000) before the restriction of benzene content in gasoline and the introduction of the VOC incentive tax (Swiss Confederation, 1997), the early 2000s (2001–2010), the 2010s (2011–2020) and the most recent year available (2024) as shown in Fig. 2. Overall, a clear decrease in BTEX concentrations is observed since 1994 with the most significant reduction in concentrations occurring between the 1994–2000 and 2001–2010 periods, notably due to the regulations on VOC emissions implemented since 2000. Seasonal patterns remain consistent across all the periods as shown in Fig. S9 with the normalized BTEX concentrations with the typical winter peak and relatively low concentrations in summer.
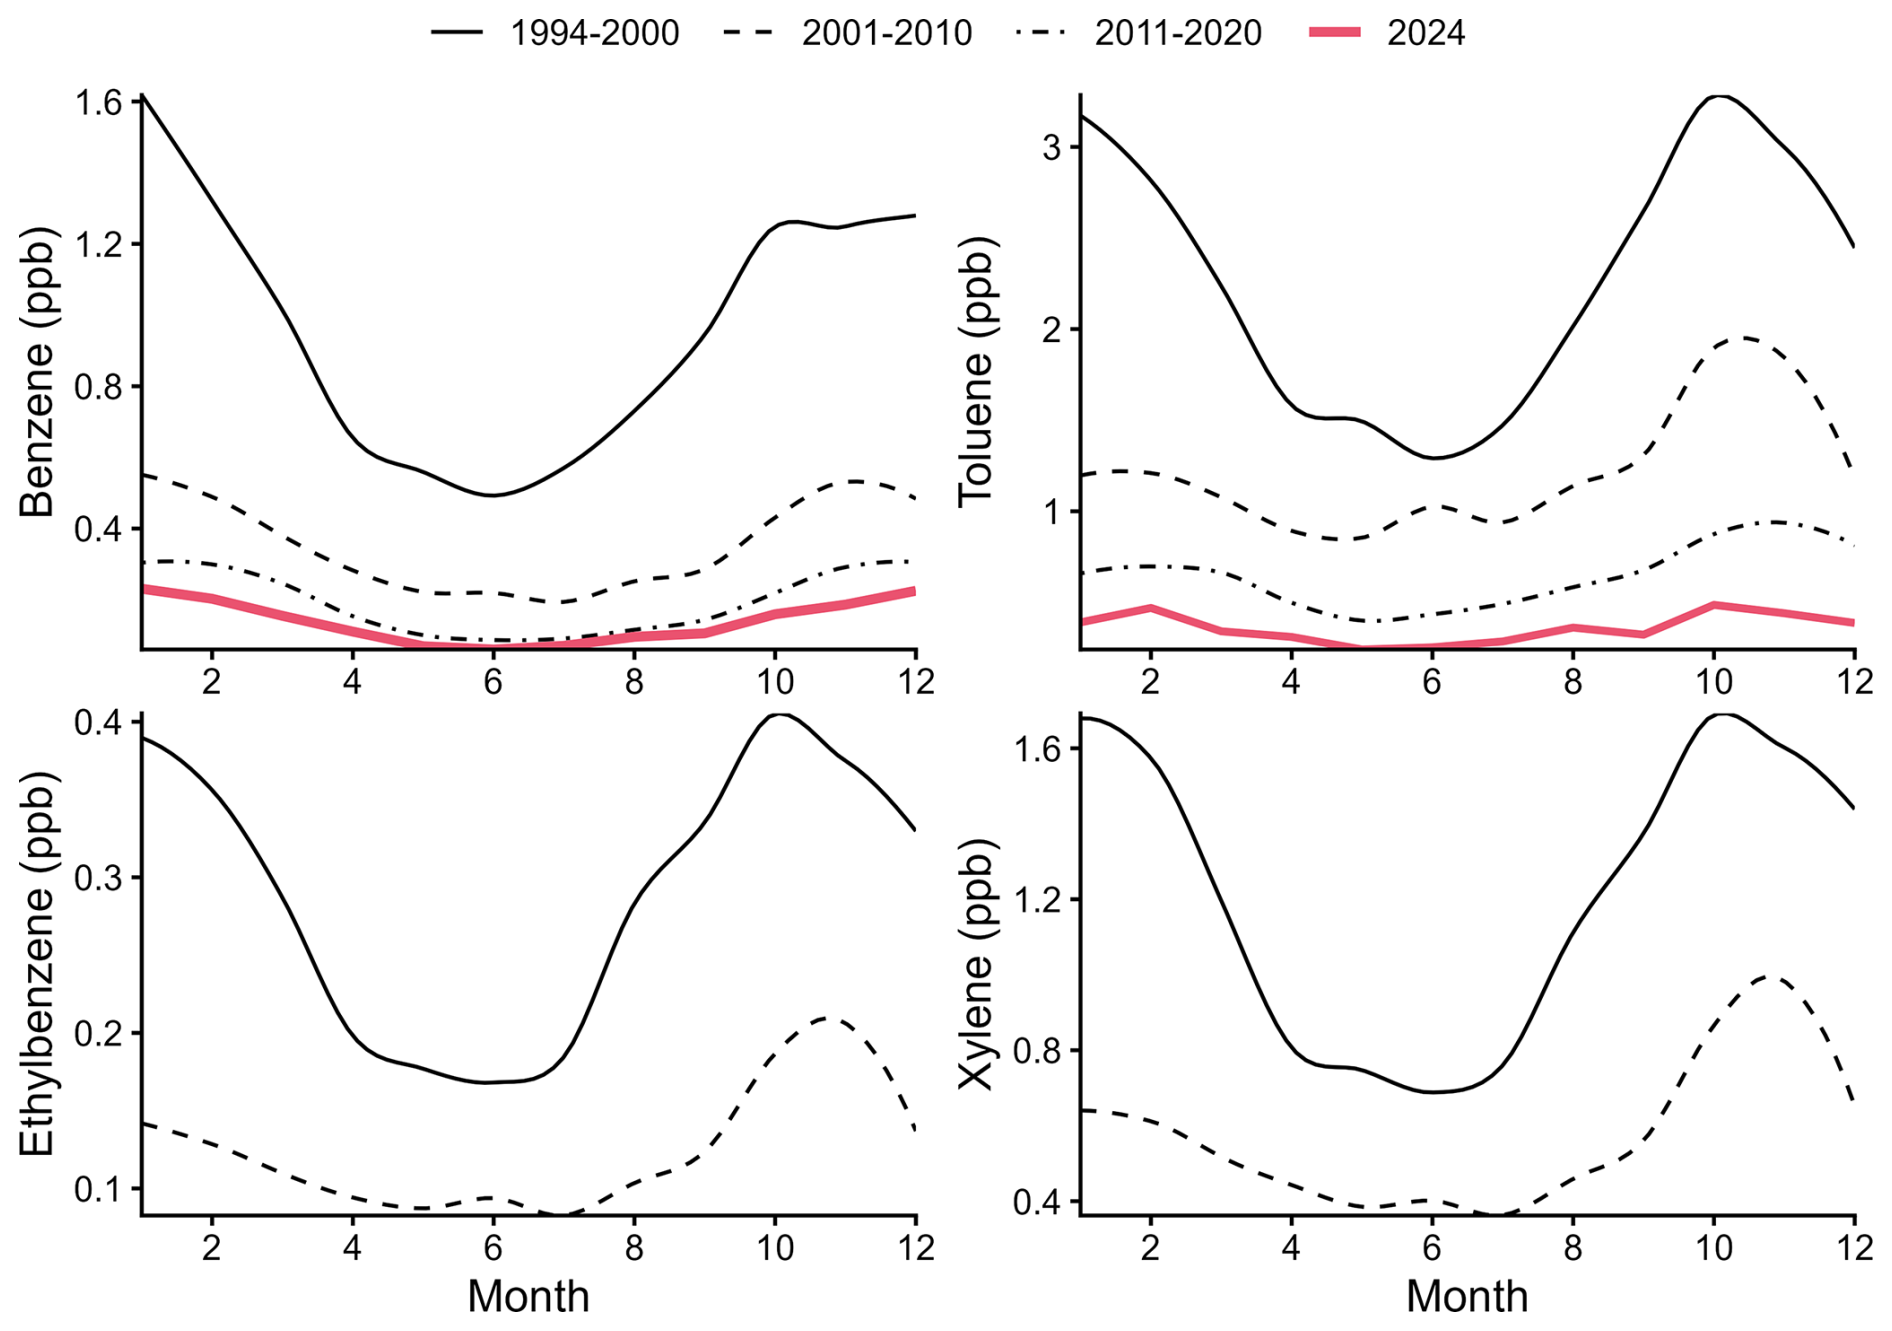
Figure 2Monthly average of benzene, toluene, ethylbenzene, xylene (sum of m-, o- and p-xylene) concentrations from 1994 to 2024 at the suburban station DUE. Monthly normalized BTEX concentration are shown in Fig. S9.
3.2 Comparison with Swiss emission inventories
Total NMHC emissions from the Swiss emission inventory, considering all emissions emitted within Switzerland from industry, households, transport and agriculture/forestry sectors, decreased by 75 % between 1994 and 2022, from 220 232 to 72 515 t yr−1 (FOEN, 2024). Over this period, the contributions from industry and transport declined from 56 % to 47 % and from 25 % to 11 %, respectively. NMHC compounds subject to the Swiss incentive tax, including BTEX, and representing on average 46 ± 2 % of the total NMHC emissions during the same period, are dominated by the industry sector which contributed 87 % in 1994 and remained stable after 2003 at 77 ± 1 %. Benzene emissions reported in the Swiss emission inventory declined by 85 % between 1994 and 2022, from 3656 to 564 t yr−1 (Fig. 3A; FOEN, 2024). Benzene emissions are dominated by the transport sector, accounting for 70 % in 1994 and 65 % in 2022. Although emissions from the industry and household sectors have remained relatively stable since 2014 at 86 ± 5 and 136 ± 11 t yr−1, respectively, the decrease in transport emissions has consequently increased the relative contribution of the household sector (including wood combustion) from 11 % in 1994 to 20 % in 2022 (FOEN, 2024).
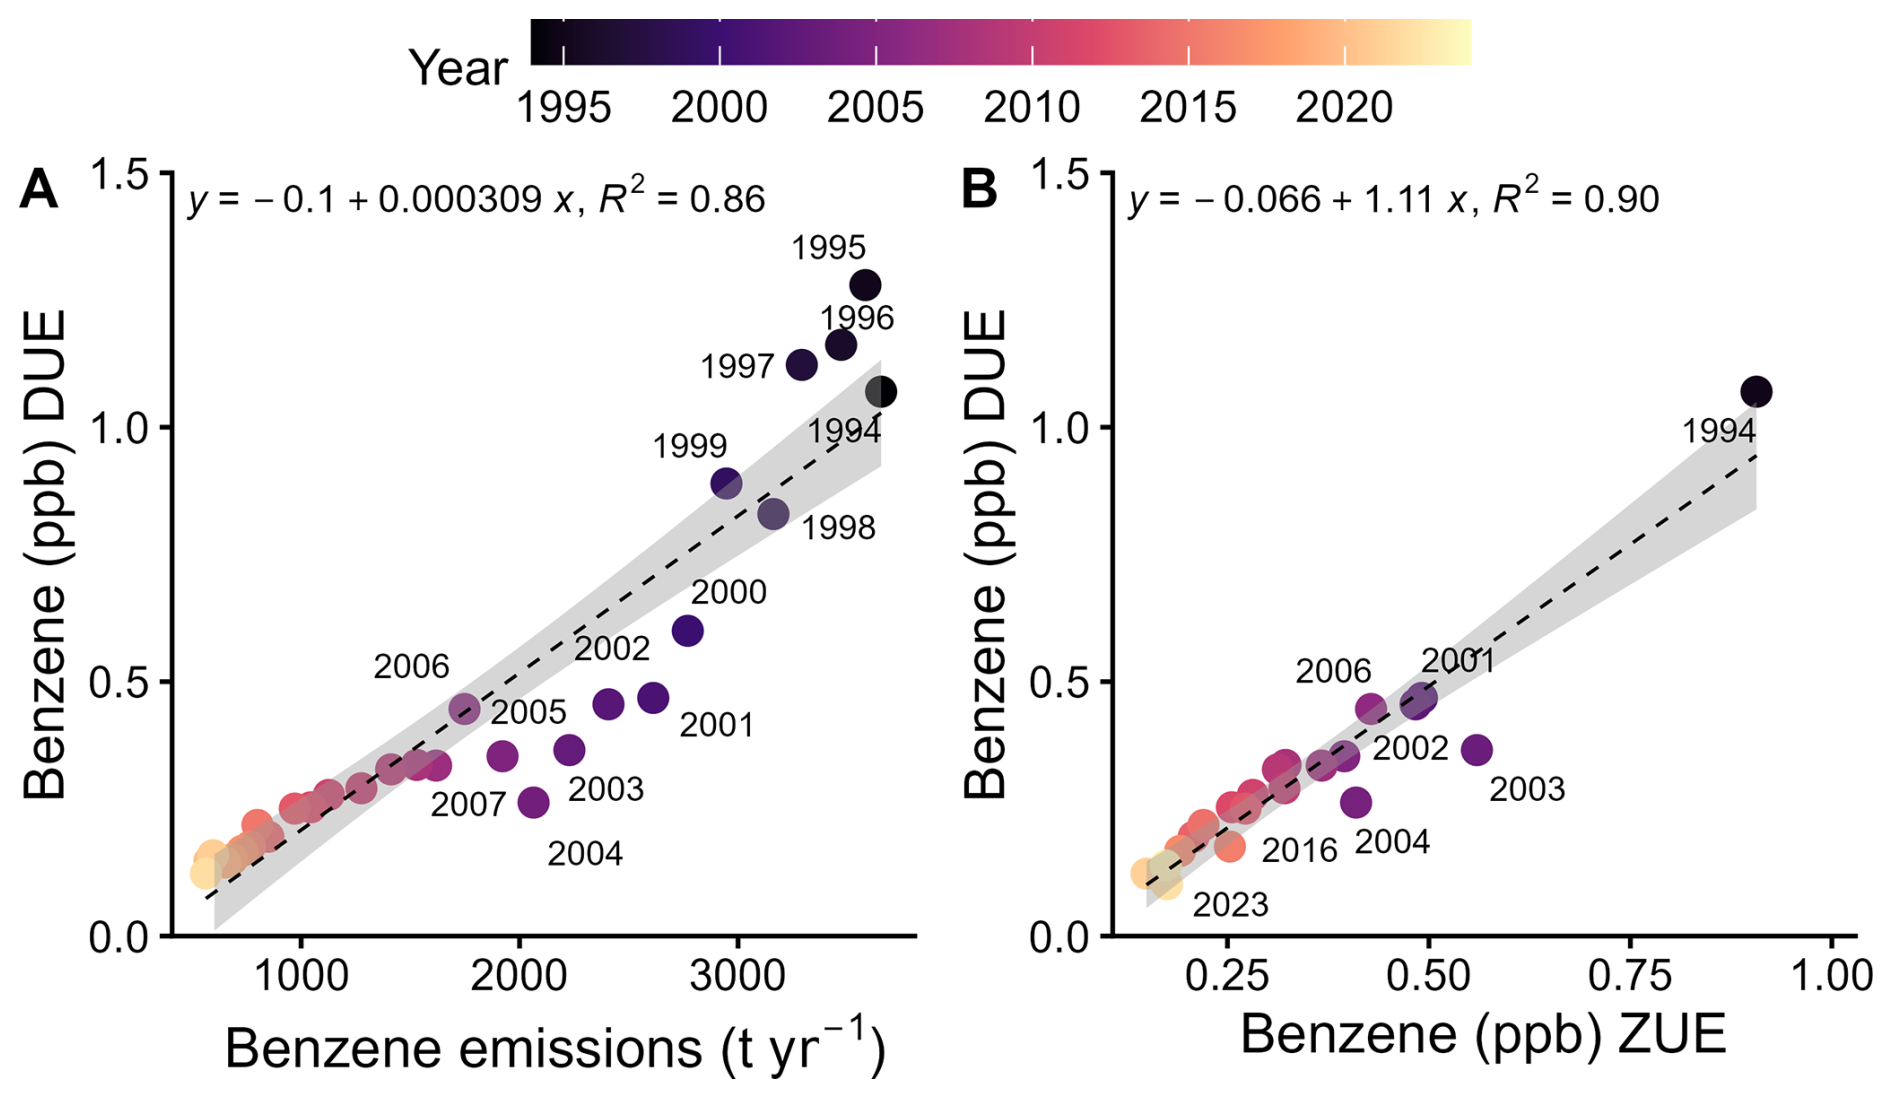
The benzene emissions reported agree well with the benzene measurement from DUE, showing a strong positive linear relationship (R2=0.86; Fig. 3A). Discrepancies are observed between the modeled benzene emissions and measured benzene in Dübendorf between 2000 and 2005. Based on the long-term correlation between Zurich and Dübendorf since 1994 (Fig. 3B), higher benzene concentrations would have been expected during the summer period in 2003 and 2004 in Dübendorf, as shown in Fig. S10. Additionally, in 2005 the emission factors used for the Swiss emissions inventory were reviewed and updated. However, these data are based on complex modeling, estimates and international databases and are therefore subject to large uncertainties, ranging from a few percent to more than 50 % (FOEN, 2024), which may explain the discrepancies observed between modeled and measured benzene concentrations between 2000 and 2005.
3.3 T : B ratio changes over the years
The toluene-to-benzene (T : B) ratio can be used as an indicator to assess the contribution of various sources of atmospheric pollutants, coming from traffic, solvent use or biomass burning/wood combustion. Areas impacted preliminary by car exhaust emissions have been estimated to have a T : B ratio ranged between 1.3 and 3.4 based on the European fleet composition (Ait-Helal et al., 2015; Liu et al., 2025 and references therein). For wood combustion, a T : B ratio below 1.3 has been determined from measurements conducted in an Swiss Alpine valley using wood as main heating source (Gaeggeler et al., 2008). Higher T : B ratio than 3.4 are linked to industrial activities, solvent and fuel evaporations (Liu et al., 2025).
Similar to Fig. 2, monthly T : B ratios were grouped into four representative periods (Fig. 4). During the period 1994–2000, T : B ratios showed little variation throughout the day and the year, remaining at 2.4 ± 0.1, indicating that vehicle emissions were the dominant source of toluene and benzene in ambient air. After 2000, a clear diurnal cycle is observed in the T : B ratios with the highest T : B ratio measured at night time (3.6 ± 0.1), due to nocturnal stagnation of benzene and toluene in the atmosphere and during the rush hour time between 08:00 and 09:00 a.m. UTC+1 (3.7 ± 0.01) followed by a decrease during the day due to their degradation (2.9 ± 0.06). T : B ratio showed as well a more pronounced seasonal variability, with the lowest values occurring in winter and the highest in summer. In 2001–2010, the winter T : B ratio was 1.2 : 0.52 (2.3) and 1.1 : 0.23 (4.8) ppb ppb−1 in the summer. For 2011–2020, T : B ratio was 0.71 : 0.29 (2.4) ppb ppb−1 in winter and 0.50 : 0.091 (5.5) ppb ppb−1 in summer. After 2020, T : B ratio in winter was 0.43 : 0.16 (2.7) ppb ppb−1, while summer T : B ratio was 0.23 : 0.076 (3.1) ppb ppb−1. The higher values in T : B ratio during the summer peak suggest a shift in source dominance, highlighting the relative higher contribution of solvent and fuel evaporation to toluene concentrations in comparison to vehicle emissions as well as the temperature dependence for toluene emissions (Fig. 4). This seasonal shift is further supported by the relationship between T : B ratio and CO concentrations shown in Fig. S11, with elevated T : B ratios that diverge from CO concentrations in summer after 2000.
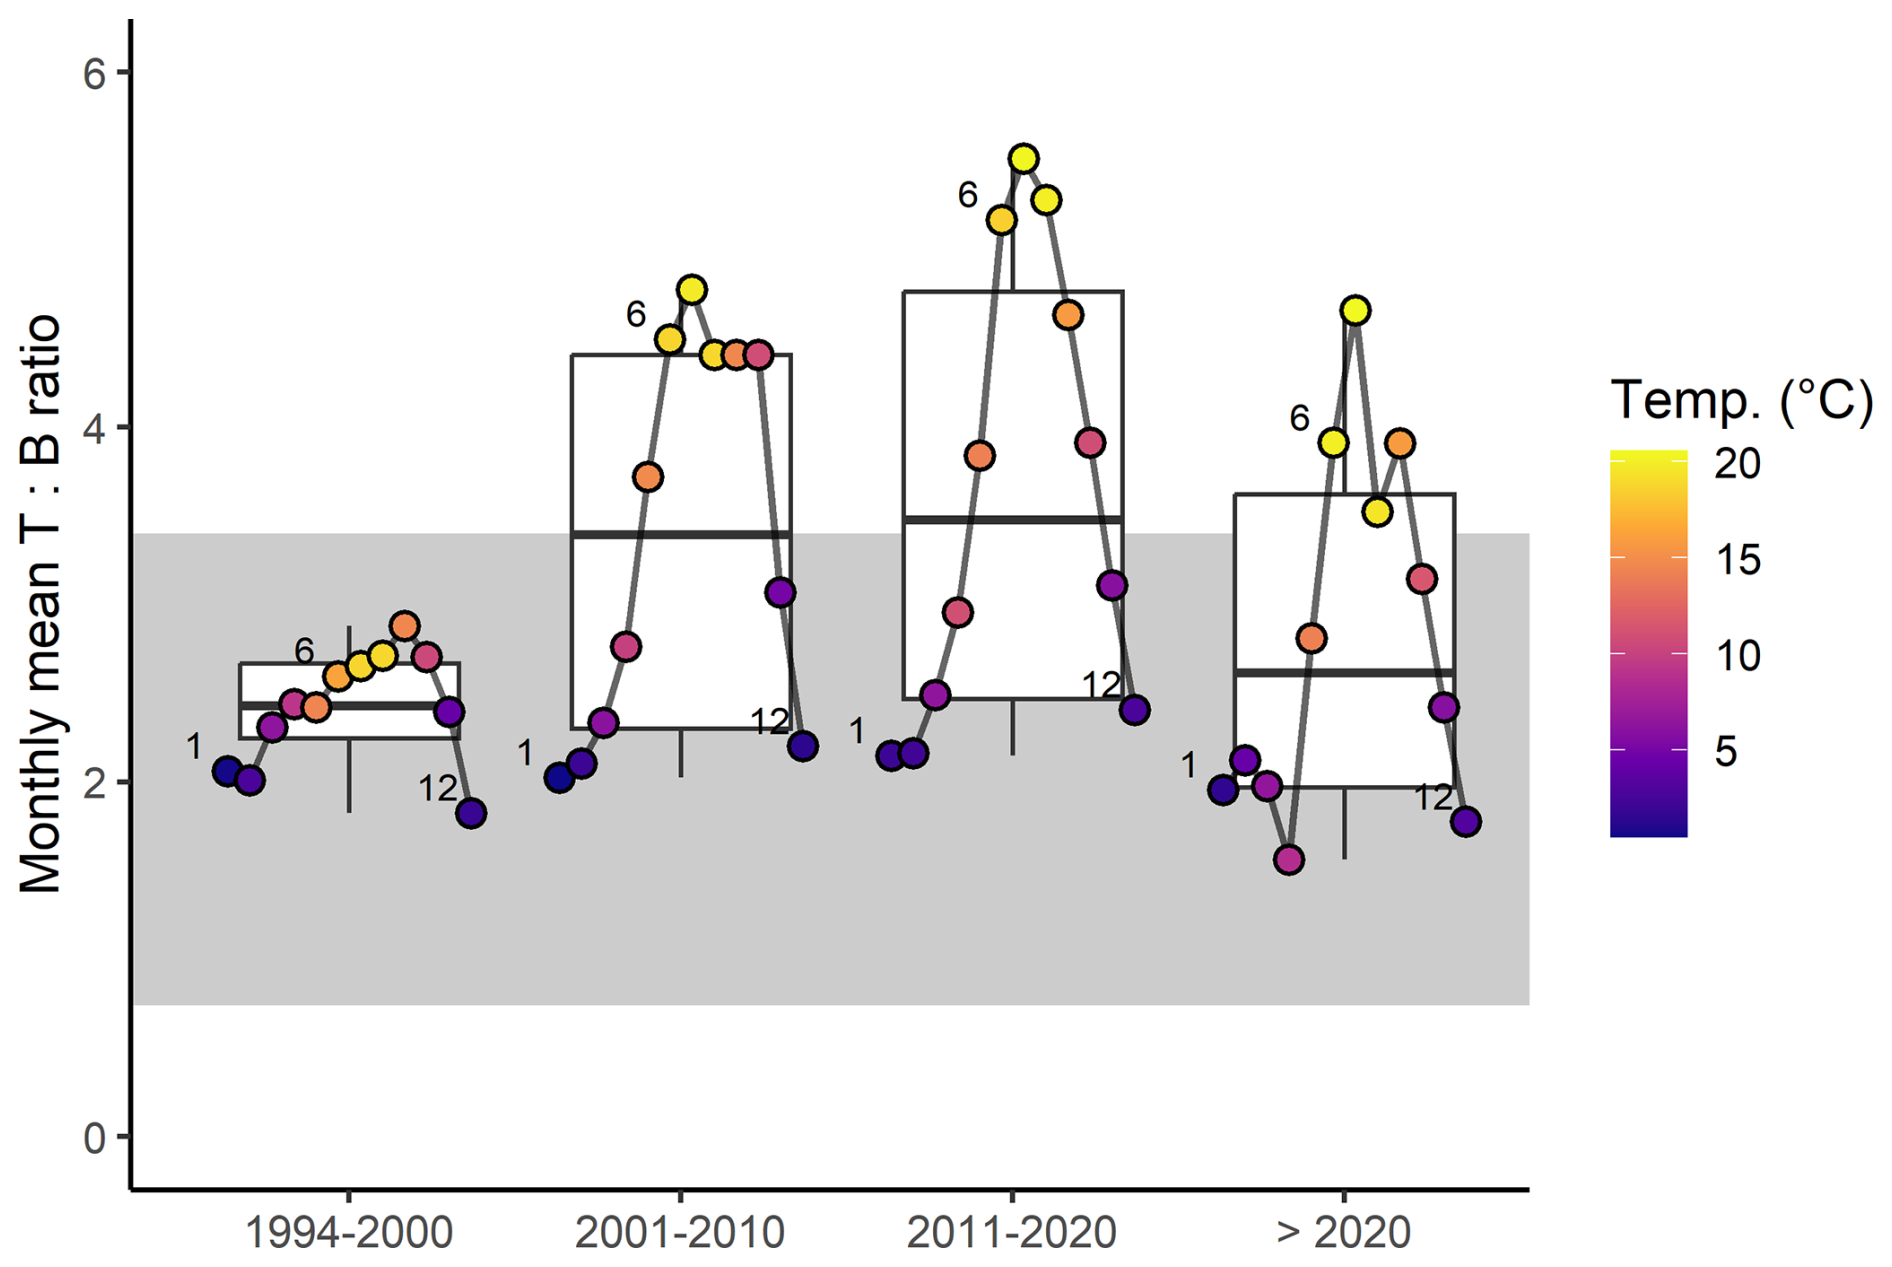
Figure 4Monthly averages for T : B ratio from 1994 to > 2020 grouped by time periods (1994–2000, 2001–2010, 2011–2020, and > 2020). Each dot represents the average T : B ratio for a given month, color-coded by the corresponding mean temperature (°C). The gray area marks the T : B range for typical vehicle emissions (1.3–3.4). Labels for January (1), June (6), and December (12) are indicated.
The ratio (m,p-xylene + o-xylene)-to-ethylbenzene (X : E) can further indicate the age of the air masses, with low ratio indicating aged air masses and a X : E ratio between 3.8 and 4.4 suggesting fresh emissions from gasoline (Keymeulen, 2001). In DUE, X : E ratios are available only for 1994–2000 and 2001–2010, with average ratios of 4.2 ± 0.13 and 4.6 ± 0.06, respectively (Fig. S12A). In ZUE, the average X : E ratio after 2000 was 4.8 ± 0.32 (Fig. S12B). Although the differences in X : E ratios between the two periods are significant but small in DUE, they may indicate a shift after 2000 from predominantly fresh gasoline emissions towards the influence of more fresh local sources. In the study of Lanz et al. (2008), a source apportionment analysis of VOCs was conducted in ZUE using data collected between 2005 and 2006 and the results were compared with source apportionment findings from 1993–1994. The increase in the T : B ratio has been notably attributed to the restriction of benzene content in gasoline between 1993 and 2006. Furthermore, toluene was mostly explained by the solvent use factor. Between 1993–1994 and 2005–2006, the relative contribution of the road traffic factor to total sources declined from 40 % (9.9 ppb) to 26 % (3.5 ppb), while the relative contribution from solvent use increased slightly from 18 % (4.5 ppb) to 20 % (2.7 ppb), highlighting the significant reduction in traffic-related emissions in ZUE over this period (Lanz et al., 2008).
To further investigate the seasonal change in the T : B ratio during summer at DUE, the solvent-related contribution to ambient toluene concentration was estimated by calculating a theoretical summer concentration of toluene (tolueneth,summer), assuming traffic emissions as the sole source (Eq. 1). Thus, the winter T : B ratio (toluenewinter : benzenewinter) was determined for each year during the morning rush hour in winter (08:00–09:00 a.m.), when road traffic peaks and the morning CO concentrations are the highest. This time window provides a T : B ratio representative of traffic emissions with minimal influence from photochemical degradation. The contribution of biomass burning to T : B ratio at DUE is in general negligible, given the station's proximity to the road and that biomass burning emissions occur predominantly in the evening (Qi et al., 2019).
Here, benzenesummer corresponds to the hourly benzene concentration in summer and was used to estimate tolueneth,summer from the winter T : B ratio. The solvent contribution to toluene was then derived using Eq. (2) with the measured hourly summer toluene concentrations (toluenesummer).
To investigate if tolueneth,summer represents well toluene emitted from traffic emissions, the summer and winter T : CO ratios were investigated as shown in Fig. S13. Winter and summer T : CO ratios are significantly different with 2.5–3.5 × 10⁻³ and 4.5–6.9 × 10⁻³, respectively. The tolueneth,summer : COsummer ratio, which should be largely related to traffic emissions, shows significant differences across the periods: 4.9 ± 0.28 × 10⁻³, 2.2 ± 0.15 × 10⁻³ and 3.1 ± 0.17 × 10⁻³ for 1994–2000, 2011–2020, > 2020. The difference in tolueneth,summer : COsummer ratios between 1994–2000 and the later periods is consistent with the implementation of VOC emission regulations for vehicles, as a larger decrease was observed for toluene and benzene relative to CO concentrations (Sect. 3.1). Additionally, tolueneth,summer : COsummer ratio is similar to the winter CO : T ratio, indicating that tolueneth,summer concentrations represent well the toluene emissions from car exhaust.
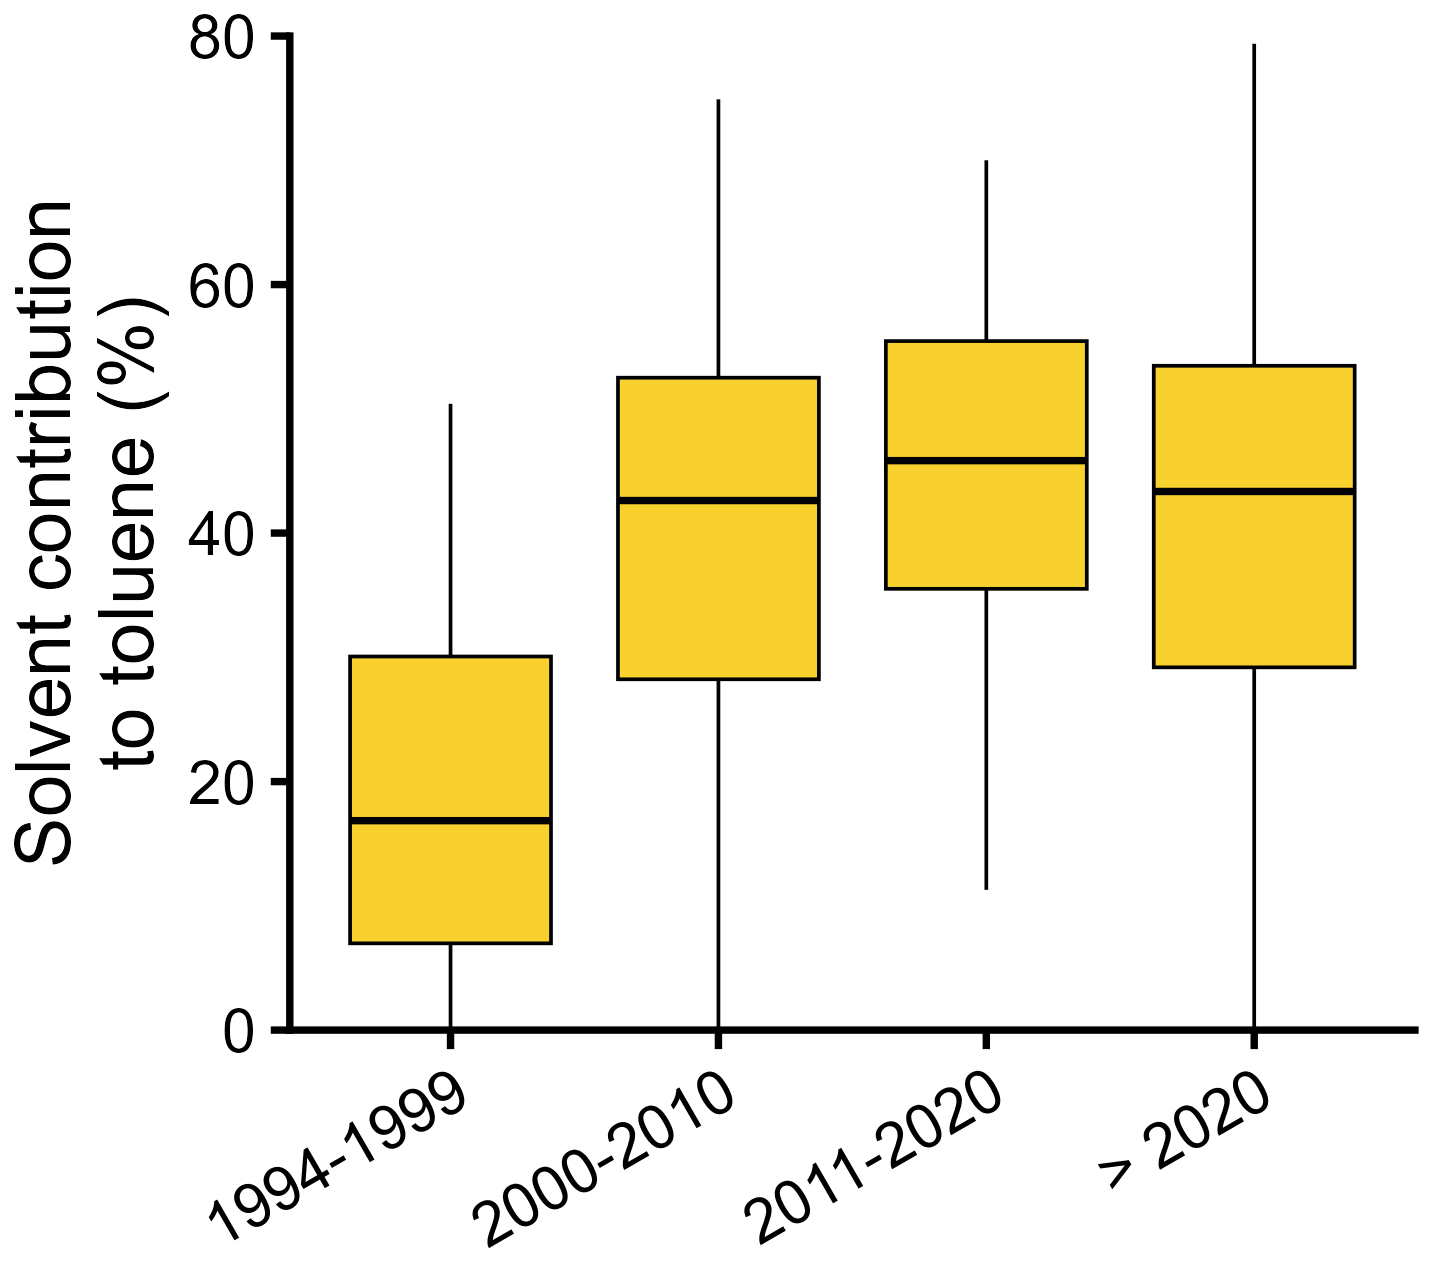
Figure 5Solvent contribution to toluene concentration in the summer calculated according to Eqs. (1) and (2) between 1994 and > 2020 grouped by time periods (1994–2000, 2001–2010, 2011–2020, and > 2020). Only June, July and August were considered for the summer months and November–February were considered for the winter period.
For the period 1994–2000, the solvent contribution to toluene concentrations was estimated at 18 ± 14 % and approximately doubled afterwards to 44 ± 17 % for the period 2011–2020 as shown in Fig. 5. Since 2021, a lower solvent contribution has been observed (39 ± 19 %), although this reduction is not statistically significant relative to 2011–2020. Future observations are required to confirm the decrease in solvent contribution after 2020 and may reflect either more controlled solvent-related toluene emissions or a shift in the dominant summertime sources of toluene at DUE.
3.4 Role of BTEX in tropospheric ozone and secondary aerosol formation potential
The role of BTEX in ozone formation can be estimated using their contribution in ozone formation potential (OFP) based on the maximum incremental reactivity (MIR) coefficient calculated by Carter (1990) for various individual VOCs. The MIR coefficient corresponds to the amount of ozone formed per amount of VOC added to an initial VOC-NOx mixture under relatively high NOx conditions, which are characteristic of (sub)urban environments. The OFPi for a given VOC compound i is calculated according to Eq. (3) with MIRi coefficient values updated from Carter (2009).
At the monitoring station in ZUE, a wider range of NMHC, from C2 to C8, are quantified by GC-FID including these VOC classes: alkane, alkene, alkyne, terpene, BTEX and OVOC. Given the proximity of the DUE and ZUE stations, along with the similar BTEX trends observed at both sites, observations from ZUE can be extrapolated to DUE in terms of their potential to form tropospheric ozone and secondary aerosols. The yearly average NMHC concentrations measured in ambient air by the GC-FIDs in ZUE increased by 53 % from 20.1 ppb in 2005 to 30.7 ppb in 2024 (Fig. 6A). In 2005, alkane was the dominant NMHC class (45 %) followed by OVOC (20 %) and BTEX (15 %). OVOC became the most dominant class in 2015 with 54 % and further increased to 70 % in 2024, whereas BTEX decreased from 6 % in 2015 to 3 % in 2024. The overall increase in total NMHC in ZUE was attributed to the increase in OVOC concentrations, particularly for ethanol and methanol (Fig. S14A). Recent studies have reported that OVOCs are becoming the predominant VOC class in urban ambient air (Ma et al., 2025; Borbon et al., 2024). Although various OVOCs are formed secondarily through photochemical reactions, direct emissions have been observed in urban areas from traffic emissions (e.g., methanol, ethanol, propanol, methyl-tert-butyl-ether), from biogenic emissions (e..g, methanol, propanone, ethanol) and from solvent-use emissions (e.g., ethanol, propanone) (Legreid et al., 2007; Baudic et al., 2016; Borbon et al., 2024). However, large uncertainties remain in anthropogenic OVOC emission inventories (Karl et al., 2018). In Zurich, a shift in the dominant VOC sources has been observed after 2000 with vehicle emissions decreasing and emissions from solvent and product use, dominated by OVOCs, becoming more predominant (FOEN, 2024; Lanz et al., 2008; Legreid et al., 2007).
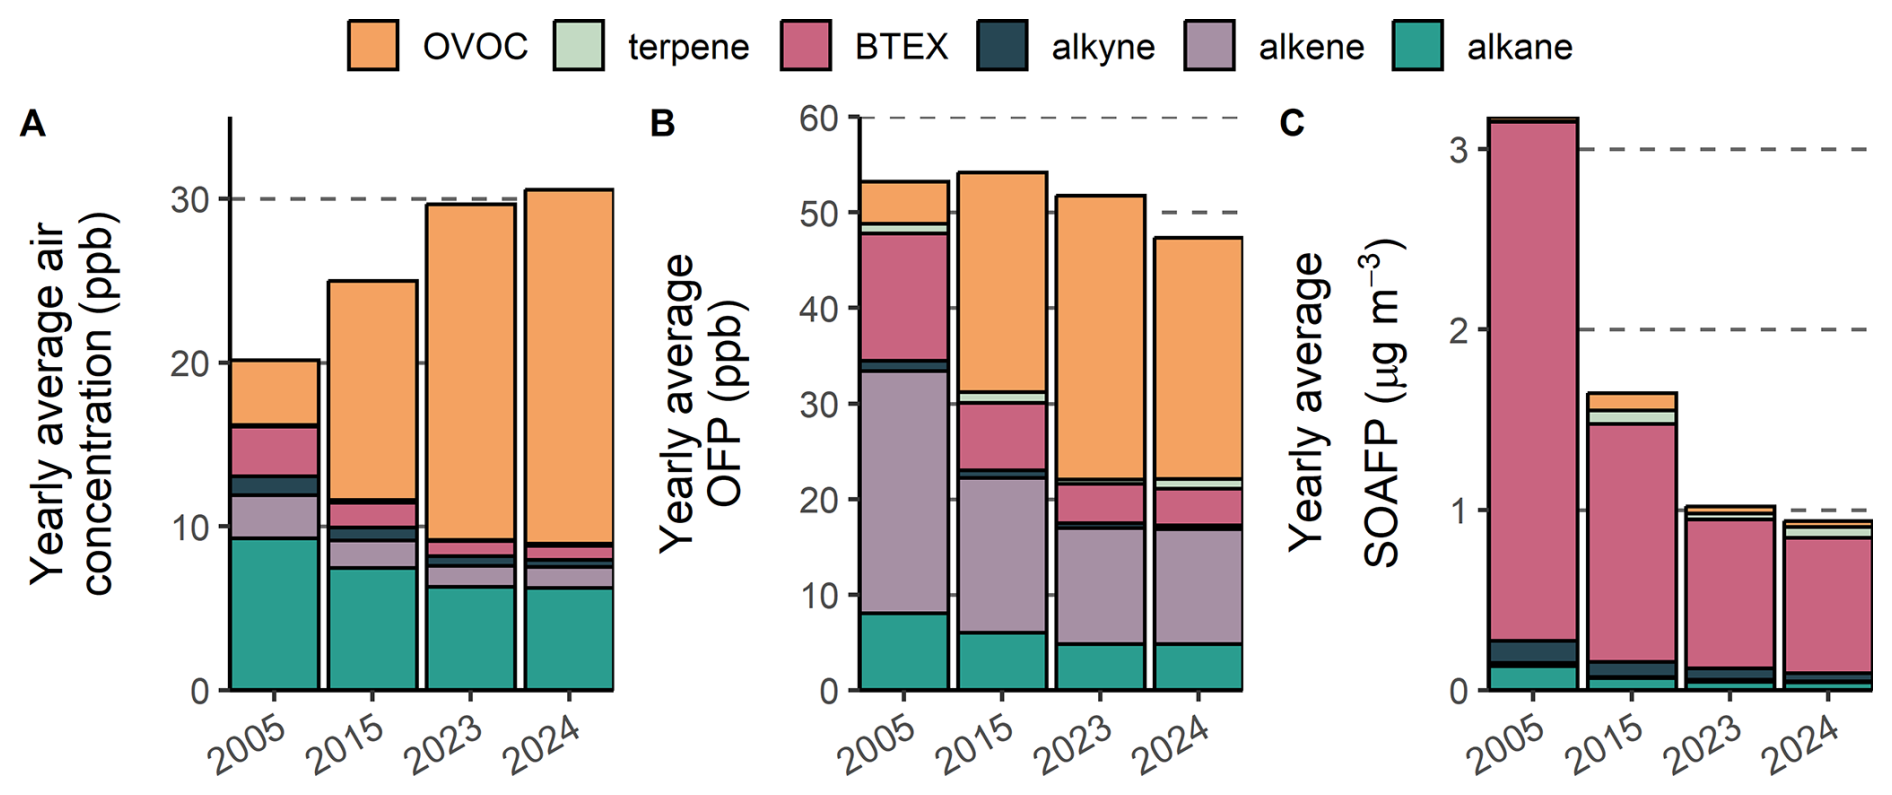
Figure 6Yearly average ambient air concentrations (A), ozone formation potential (OFP; B) and secondary organic aerosol formation potential (SOAFP; C) of the NMHC classes measured at the Zurich station between 2005 and 2024.
Considering the VOC classes in ZUE and the MIR values of each single VOC used to estimate OFP, the highest MIR values are observed for the alkene, terpene and BTEX classes (Fig. 6B). Due to the overall low concentrations of terpenes, i.e., isoprene, limonene and α-pinene measured at ZUE, their contributions to OFP contributed to less than 2 % in 2024 to total OFP and thus remain negligible. Alkene contribution to total OFP decreased from 48 % in 2005 to 25 % in 2024. Although OVOC compounds have low MIR values in comparison to the other VOCs measured in ZUE, their contribution to total OFP increased from 8 % in 2005 to 53 % in 2024 due to their increasing concentration, with ethanol the main OVOC, and the decreasing abundance of other VOCs (Fig. S14A). The individual contribution of each OVOC to OFP is given in Fig. S14B. In contrast, BTEX contribution to total OFP significantly decreased from 25 % in 2005 to less than 8 % in 2024. These results show a significant shift in the VOC-induced ozone formation in Zurich over the past two decades towards a marked transition from the predominance of alkenes and BTEX in OFP to the more abundant OVOCs since 2015.
Secondary organic aerosol formation potential (SOAFP) can be calculated in a similar way as OFP with the SOAP yield, instead of the MIR value, determined for each single VOC in Derwent et al. (2000) and Gu et al. (2021). Li et al. (2023) showed that aromatic compounds and alkanes contribute most to the formation of condensable organic vapors necessary for the growth of new particles, with aromatic compounds accounting for 59 ± 20 % of low-volatility organic compounds. In Zurich, although BTEX remain the dominant contributors to SOA formation potential (90 % in 2005; 80 % in 2024), their concentration significantly decreased by 74 %, from 2.9 µg m−3 in 2005 to 0.75 µg m−3 in 2024 (Fig. 6C). These results still show the dominant role of BTEX compounds within the different measured VOC classes in SOA formation despite their decreasing concentration in ambient air.
This study focuses on BTEX concentrations in ambient air in Switzerland since 1994. Continuous online BTEX measurements at a suburban site over three decades demonstrate the effect of the implementations of various regulations on VOC emissions and air quality, resulting in a significant net decrease in BTEX concentrations. As a consequence, monitoring of ethylbenzene and xylene at Dübendorf was discontinued in 2011 due to their low concentrations. The yearly average concentrations of toluene and benzene declined from 4.4 ppb in 1994 to 0.5 ppb in 2024 in Dübendorf. Changes in the T : B ratio, particularly in the summer following the restriction on benzene content in gasoline in 2000, indicate an increasing relative contribution from solvent use to toluene. Although BTEX compounds now contribute less to the overall ozone formation potential, they still accounted for up to 80 % of the SOAFP at the Zurich station in 2024. Given their role as key precursors for both ozone and secondary organic aerosol formation, continuous monitoring of BTEX concentrations in (sub)urban environments remains essential for the development and implementation of effective air quality management strategies. In addition, OVOCs are becoming predominant in ambient air. Despite their relatively low MIR values, the cumulative contribution of individual OVOCs can significantly enhance ozone formation potential. Including OVOCs in addition to BTEX in air quality monitoring programs is therefore essential for a representative composition of (sub)urban VOC mixtures in ambient air.
Data for this publication, including BTEX concentrations in DUE, BER, BRM and ZUE as well as VOC concentrations in ZUE for 2005, 2015, 2023 and 2024 are available at Zenodo https://doi.org/10.5281/zenodo.17062800 (Le Bras and Reimann, 2025).
The supplement related to this article is available online at https://doi.org/10.5194/acp-26-869-2026-supplement.
Z.L.B. wrote the manuscript with the input from all authors. S.R. was in charge of and supervised the continuous monitoring of BTEX and VOCs in Switzerland at DUE, ZUE, BER and BRM stations. P.R. helped in processing the collected BTEX and VOC data at the monitoring stations. C.H. supervised the data collected within the NABEL framework.
The contact author has declared that none of the authors has any competing interests.
Publisher's note: Copernicus Publications remains neutral with regard to jurisdictional claims made in the text, published maps, institutional affiliations, or any other geographical representation in this paper. The authors bear the ultimate responsibility for providing appropriate place names. Views expressed in the text are those of the authors and do not necessarily reflect the views of the publisher.
We acknowledge the technical staff involved in the BTEX and VOC data collection since 1994 at the different Swiss monitoring stations of the NABEL network and the Federal Office for the Environment (FOEN) for its conceptual support.
This research has been supported by the Federal Office for the Environment (FOEN).
This paper was edited by Thomas Karl and reviewed by two anonymous referees.
Ait-Helal, W., Beeldens, A., Boonen, E., Borbon, A., Boréave, A., Cazaunau, M., Chen, H., Daële, V., Dupart, Y., Gaimoz, C., Gallus, M., George, C., Grand, N., Grosselin, B., Herrmann, H., Ifang, S., Kurtenbach, R., Maille, M., Marjanovic, I., Mellouki, A., Miet, K., Mothes, F., Poulain, L., Rabe, R., Zapf, P., Kleffmann, J., and Doussin, J.-F.: On-road measurements of NMVOCs and NOx : Determination of light-duty vehicles emission factors from tunnel studies in Brussels city center, Atmospheric Environment, 122, 799–807, https://doi.org/10.1016/j.atmosenv.2015.09.066, 2015. a
Althouse, R., Huff, J., Tomatis, L., and Wilbourn, J.: An evaluation of chemicals and industrial processes associated with cancer in humans based on human and animal data: IARC Monographs Volumes 1 to 20, Cancer Research, 40, 1–12, 1980. a
Atkinson, R.: Atmospheric chemistry of VOCs and NOx, Atmospheric Environment, 34, 2063–2101, https://doi.org/10.1016/s1352-2310(99)00460-4, 2000. a
Ballesta, P. P., Field, R. A., Connolly, R., Cao, N., Baeza Caracena, A., and De Saeger, E.: Population exposure to benzene: One day cross-sections in six European cities, Atmospheric Environment, 40, 3355–3366, https://doi.org/10.1016/j.atmosenv.2006.01.053, 2006. a
Baudic, A., Gros, V., Sauvage, S., Locoge, N., Sanchez, O., Sarda-Estève, R., Kalogridis, C., Petit, J.-E., Bonnaire, N., Baisnée, D., Favez, O., Albinet, A., Sciare, J., and Bonsang, B.: Seasonal variability and source apportionment of volatile organic compounds (VOCs) in the Paris megacity (France), Atmospheric Chemistry and Physics, 16, 11961–11989, https://doi.org/10.5194/acp-16-11961-2016, 2016. a
Bayerisches Landesamt für Umwelt: Messwertarchiv Luft – Immissionsmessungen, licensed under Creative Commons Attribution 4.0 International (CC BY 4.0), https://www.lfu.bayern.de/luft/immissionsmessungen/messwertarchiv/index.htm (last access: 24 November 2025), 2025. a
Borbon, A., Locoge, N., Veillerot, M., J, G., and Guillermo, R.: Characterisation of NMHCs in a French urban atmosphere: Overview of the main sources, The Science of The Total Environment, 292, 177–191, https://doi.org/10.1016/s0048-9697(01)01106-8, 2002. a
Borbon, A., Salameh, T., Sauvage, S., and Afif, C.: Light oxygenated volatile organic compound concentrations in an Eastern Mediterranean urban atmosphere rivalling those in megacities, Environmental Pollution, 350, 123797, https://doi.org/10.1016/j.envpol.2024.123797, 2024. a, b
Calvert, J. G., Atkinson, R., Becker, K. H., Kamens, R. M., Seinfeld, J. H., Wallington, T. H., and Yarwood, G.: The mechanisms of atmospheric oxidation of the aromatic hydrocarbons, Oxford University Press, https://doi.org/10.1093/oso/9780195146288.001.0001, 2002. a
Carter, W. P.: Updated maximum incremental reactivity scale and hydrocarbon bin reactivities for regulatory applications, California Air Resources Board Contract, 339, https://ww2.arb.ca.gov/sites/default/files/barcu/regact/2009/mir2009/mir10.pdf (last access: 16 January 2026), 2009. a
Carter, W. P. L.: A Detailed Mechanism for the Gas-Phase Atmospheric Reactions of Organic Compounds, Atmospheric Environment, 24A, 481–518, 1990. a
Caselli, M., de Gennaro, G., Marzocca, A., Trizio, L., and Tutino, M.: Assessment of the impact of the vehicular traffic on BTEX concentration in ring roads in urban areas of Bari (Italy), Chemosphere, 81, 306–311, https://doi.org/10.1016/j.chemosphere.2010.07.033, 2010. a
Defra: UK Air Quality Archive, © Crown 2025 copyright Defra, Licensed under the Open Government Licence (OGL), https://uk-air.defra.gov.uk/ (last access: December 2025), 2025. a
Demirel, G., Özden, O., Dóğeroğlu, T., and Gaga, E.: Personal exposure of primary school children to BTEX, NO2 and ozone in Eskişehir, Turkey: Relationship with indoor/outdoor concentrations and risk assessment, Science of The Total Environment, 473–474, 537–548, https://doi.org/10.1016/j.scitotenv.2013.12.034, 2014. a
Derwent, R., Davies, T., Delaney, M., Dollard, G., Field, R., Dumitrean, P., Nason, P., Jones, B., and Pepler, S.: Analysis and interpretation of the continuous hourly monitoring data for 26 C2–C8 hydrocarbons at 12 United Kingdom sites during 1996, Atmospheric Environment, 34, 297–312, https://doi.org/10.1016/s1352-2310(99)00203-4, 2000. a, b
Edwards, P. M., Brown, S. S., Roberts, J. M., Ahmadov, R., Banta, R. M., deGouw, J. A., Dubé, W. P., Field, R. A., Flynn, J. H., Gilman, J. B., Graus, M., Helmig, D., Koss, A., Langford, A. O., Lefer, B. L., Lerner, B. M., Li, R., Li, S.-M., McKeen, S. A., Murphy, S. M., Parrish, D. D., Senff, C. J., Soltis, J., Stutz, J., Sweeney, C., Thompson, C. R., Trainer, M. K., Tsai, C., Veres, P. R., Washenfelder, R. A., Warneke, C., Wild, R. J., Young, C. J., Yuan, B., and Zamora, R.: High winter ozone pollution from carbonyl photolysis in an oil and gas basin, Nature, 514, 351–354, https://doi.org/10.1038/nature13767, 2014. a
FOEN: Luftschadstoffemissionen der Schweiz 1980–2022 nach dem territorial-Prinzip, Federal Office for the Environment (FOEN), https://www.bafu.admin.ch/bafu/de/home/themen/luft/gesamtemissionen-von-luftschadstoffen-in-der-schweiz.html (last access: March 2024), 2024. a, b, c, d, e, f
Gaeggeler, K., Prevot, A. S., Dommen, J., Legreid, G., Reimann, S., and Baltensperger, U.: Residential wood burning in an Alpine valley as a source for oxygenated volatile organic compounds, hydrocarbons and organic acids, Atmospheric Environment, 42, 8278–8287, https://doi.org/10.1016/j.atmosenv.2008.07.038, 2008. a
Gu, S., Guenther, A., and Faiola, C.: Effects of Anthropogenic and Biogenic Volatile Organic Compounds on Los Angeles Air Quality, Environmental Science & Technology, 55, 12191–12201, https://doi.org/10.1021/acs.est.1c01481, 2021. a
Heeb, N. V., Forss, A.-M., Bach, C., Reimann, S., Herzog, A., and Jäckle, H. W.: A comparison of benzene, toluene and C2-benzenes mixing ratios in automotive exhaust and in the suburban atmosphere during the introduction of catalytic converter technology to the Swiss Car Fleet, Atmospheric Environment, 34, 3103–3116, https://doi.org/10.1016/s1352-2310(99)00446-x, 2000. a
Karl, T., Striednig, M., Graus, M., Hammerle, A., and Wohlfahrt, G.: Urban flux measurements reveal a large pool of oxygenated volatile organic compound emissions, Proceedings of the National Academy of Sciences, 115, 1186–1191, https://doi.org/10.1073/pnas.1714715115, 2018. a
Kavouras, I. G. and Zielinska, B.: The Effects of Fuel Evaporation and Biomass Burning on Toluene Concentrations in an Urban Area, Water, Air, & Soil Pollution, 223, 5931–5940, https://doi.org/10.1007/s11270-012-1329-8, 2012. a
Keymeulen, R.: Benzene, toluene, ethyl benzene and xylenes in ambient air and Pinus sylvestris L. needles: a comparative study between Belgium, Hungary and Latvia, Atmospheric Environment, 35, 6327–6335, https://doi.org/10.1016/s1352-2310(01)00424-1, 2001. a
Lanz, V. A., Hueglin, C., Buchmann, B., Hill, M., Locher, R., Staehelin, J., and Reimann, S.: Receptor modeling of C2–C7 hydrocarbon sources at an urban background site in Zurich, Switzerland: changes between 1993–1994 and 2005–2006, Atmospheric Chemistry and Physics, 8, 2313–2332, https://doi.org/10.5194/acp-8-2313-2008, 2008. a, b, c, d
Le Bras, Z. and Reimann, S.: Measurement report: 30 years of monitoring aromatic hydrocarbons (BTEX) at a suburban site in Europe, Zenodo [data set], https://doi.org/10.5281/zenodo.17062801, 2025. a
Legreid, G., Lööv, J. B., Staehelin, J., Hueglin, C., Hill, M., Buchmann, B., Prevot, A. S., and Reimann, S.: Oxygenated volatile organic compounds (OVOCs) at an urban background site in Zürich (Europe): Seasonal variation and source allocation, Atmospheric Environment, 41, 8409–8423, https://doi.org/10.1016/j.atmosenv.2007.07.026, 2007. a, b
Li, Z., Zhao, B., Yin, D., Wang, S., Qiao, X., Jiang, J., Li, Y., Shen, J., He, Y., Chang, X., Li, X., Liu, Y., Li, Y., Liu, C., Qi, X., Chen, L., Chi, X., Jiang, Y., Li, Y., Wu, J., Nie, W., and Ding, A.: Modeling the Formation of Organic Compounds across Full Volatility Ranges and Their Contribution to Nanoparticle Growth in a Polluted Atmosphere, Environmental Science & Technology, 58, 1223–1235, https://doi.org/10.1021/acs.est.3c06708, 2023. a
Lippmann, M.: Health effects of tropospheric ozone, Environmental Science & Technology, 25, 1954–1962, 1991. a
Liu, X., Zhang, X., Dufresne, M., Wang, T., Wu, L., Lara, R., Seco, R., Monge, M., Yáñez-Serrano, A. M., Gohy, M., Petit, P., Chevalier, A., Vagnot, M.-P., Fortier, Y., Baudic, A., Ghersi, V., Gille, G., Lanzi, L., Gros, V., Simon, L., Héllen, H., Reimann, S., Le Bras, Z., Müller, M. J., Beddows, D., Hou, S., Shi, Z., Harrison, R. M., Bloss, W., Dernie, J., Sauvage, S., Hopke, P. K., Duan, X., An, T., Lewis, A. C., Hopkins, J. R., Liakakou, E., Mihalopoulos, N., Zhang, X., Alastuey, A., Querol, X., and Salameh, T.: Measurement report: Exploring the variations in ambient BTEX in urban Europe and their environmental health implications, Atmospheric Chemistry and Physics, 25, 625–638, https://doi.org/10.5194/acp-25-625-2025, 2025. a, b
Ma, X., Liu, G., and Chen, J.: PTR-QMS observation of OVOCs in an urban suburb of Guangzhou: Seasonal characterization, source apportionment and regional transport, Atmospheric Environment, 362, 121589, https://doi.org/10.1016/j.atmosenv.2025.121589, 2025. a
Molteni, U., Bianchi, F., Klein, F., El Haddad, I., Frege, C., Rossi, M. J., Dommen, J., and Baltensperger, U.: Formation of highly oxygenated organic molecules from aromatic compounds, Atmospheric Chemistry and Physics, 18, 1909–1921, https://doi.org/10.5194/acp-18-1909-2018, 2018. a
Monod, A., Sive, B. C., Avino, P., Chen, T., Blake, D. R., and Sherwood Rowland, F.: Monoaromatic compounds in ambient air of various cities: a focus on correlations between the xylenes and ethylbenzene, Atmospheric Environment, 35, 135–149, https://doi.org/10.1016/s1352-2310(00)00274-0, 2001. a, b
Qi, L., Chen, M., Stefenelli, G., Pospisilova, V., Tong, Y., Bertrand, A., Hueglin, C., Ge, X., Baltensperger, U., Prévôt, A. S. H., and Slowik, J. G.: Organic aerosol source apportionment in Zurich using an extractive electrospray ionization time-of-flight mass spectrometer (EESI-TOF-MS) – Part 2: Biomass burning influences in winter, Atmospheric Chemistry and Physics, 19, 8037–8062, https://doi.org/10.5194/acp-19-8037-2019, 2019. a
Schnatter, R.: Petroleum worker studies and benzene risk assessment, Journal of Toxicology and Environmental Health, Part A, 61, 433–437, https://doi.org/10.1080/00984100050166451, 2000. a
Sternberg, J. C., Gallaway, W. S., and Jones, D. T. L.: Chapter XVIII: The Mechanism of Response of Flame Ionization Detectors, in: Gas Chromatography: Third International Symposium Held Under the Auspices of the Analysis Instrumentation Division of the Instrument Society of America, edited by: Brenner, N., Callen, J. E., and Weiss, M. D., 231–267, Academic Press, New York and London, ISBN 9780121316501, 1962. a
Swiss Confederation: Luftreinhalte-Verordnung (Ordinance on Air Pollution Control (OAPC; SR 814.318.142.1), https://www.fedlex.admin.ch/eli/cc/1986/208_208_208/en (last access: October 2023), 1986. a
Swiss Confederation: Ordinance on the Incentive Tax on Volatile Organic Compounds; SR 814.018), https://www.fedlex.admin.ch/eli/cc/1997/2972_2972_2972/en (last access: October 2023), 1997. a, b
Swiss Confederation: Ordinance on the Reduction of Risks Associated with Particularly Dangerous Substances; SR 814.81, https://www.fedlex.admin.ch/eli/cc/2005/478/en (last access: October 2023), 2005. a