the Creative Commons Attribution 4.0 License.
the Creative Commons Attribution 4.0 License.
 | 22 Jun 2026
Latent heat feedbacks and the self-lofting of seeded ice plumes: insights from bin microphysics simulations
Chia Rui Ong
Anurag Dipankar
Ulrike Lohmann
Jan Henneberger
The interaction between environmental dynamics and microphysical processes governs the efficacy of glaciogenic cloud seeding, yet the extent to which initial vertical wind conditions dictate the evolution of seeded ice plumes remains poorly constrained. We investigate the dynamical and microphysical life cycle of ice plumes in supercooled stratiform clouds using idealized Large-Eddy Simulations (LES) coupled with the bin microphysics scheme SCALE-AMPS. Simulations of a targeted CLOUDLAB seeding experiment are constrained and validated by in situ observations. An ensemble of 20 simulations initialized with varying vertical wind velocities reveals a fundamental transition: while the initial trajectory is kinematically governed by the environmental vertical wind at cloud seeding, the long-term evolution is dominated by internal thermodynamic feedbacks. We identify a “self-lofting” mechanism wherein buoyancy generated by latent heat release from rapid ice growth overcomes initial subsidence, causing even downdraft-seeded plumes to eventually ascend. This thermodynamic response creates a structural trade-off: plumes initiated in updrafts are terminated by the cloud-top inversion, whereas those in downdrafts experience delayed ascent, resulting in a lager vertical dispersion. This expanded vertical extent compensates for the lower mean altitude of downdraft plumes, ensuring their geometrical detectability by downstream sampling in in observations. Microphysically, downdraft plumes undergo transient sublimation near cloud base but recover following buoyancy-driven re-ascent. These findings demonstrate that glaciogenic seeding is dynamically robust in low stratus clouds, as the seeded ice plume acts as an active thermodynamic agent capable of sustaining its residence time in the mixed-phase layer independent of the initial vertical wind state.
- Article
(5219 KB) - Full-text XML
- BibTeX
- EndNote


Ice microphysical processes govern the phase partitioning, persistence, and radiative properties of mixed-phase clouds, thereby exerting a critical influence on Earth’s hydrological cycle (Pruppacher et al., 1998; Korolev et al., 2017). These processes are intrinsically coupled to atmospheric dynamics: the interplay between vertical air motion, turbulence, and local supersaturation dictates ice crystal growth modes and cloud longevity (Korolev et al., 2003; Shupe et al., 2008). Vertical air motions are widely recognized as a primary driver of this evolution (Bühl et al., 2019; Shupe et al., 2008). Updrafts promote condensation and maintain liquid water by counteracting the Wegener–Bergeron–Findeisen (WBF) process – a mechanism wherein ice crystals grow at the expense of evaporating supercooled liquid droplets. In contrast, downdrafts and subsidence favor glaciation and liquid water depletion (Rauber and Tokay, 1991; Korolev and Field, 2008; Bühl et al., 2019).
While vertical velocity fluctuations modulate ice nucleation efficiency and particle trajectories (Pinsky and Khain, 2002; Grabowski and Abade, 2017; Abade and Albuquerque, 2024), subsequent ice growth is accompanied by latent heat release. This thermodynamic response alters buoyancy and feeds back onto vertical motions, thereby further coupling microphysical and dynamical evolution (Morrison et al., 2012). Following the initial ice initiation – the so-called “latent heat kick” from droplet freezing – the ice phase undergoes rapid diffusional growth. During this stage, the latent heating produced by depositional growth significantly outweighs the additional weight of the ice phase (condensate loading), effectively invigorating the cloud plume. While some studies have explored the resilience of cloud microphysics to environmental changes (Grabowski and Morrison, 2021), the specific roles of the initial freezing “kick” versus the subsequent feedbacks driven by the WBF mechanism and adiabatic cooling in governing plume dynamics remain under-examined. A fundamental question, therefore, arises: to what extent is the evolution of an ice plume determined by the initial vertical wind conditions at the time of nucleation, as opposed to being sustained and amplified by the seeding-induced microphysical – thermodynamic feedbacks – including both the initial latent heat “kick” from droplet freezing and the subsequent latent heat release associated with the transition from liquid and vapor to the ice phase?
Shallow mixed-phase clouds, such as stratocumulus and altocumulus, serve as an ideal natural laboratory for investigating these interactions. Compared to deep convection, these clouds are dynamically simpler, yet they exist in a thermodynamically metastable state where microphysical evolution is highly sensitive to the partitioning between liquid and ice phases (Ansmann et al., 2009; Westbrook and Illingworth, 2013). Glaciogenic cloud seeding offers a powerful framework for interrogating these systems by introducing a controlled source of ice crystals into supercooled clouds at a known time and location. Historically, glaciogenic seeding has been extensively studied to assess its potential for precipitation enhancement, with major field campaigns such as SNOWIE providing comprehensive evidence of cloud-seeding-induced snowfall over mountainous terrain (Tessendorf et al., 2019; Friedrich et al., 2021). While these meso-scale experiments have successfully demonstrated the macroscopic impact of seeding, the fundamental microphysical-dynamical interactions at the plume scale remain challenging to isolate. The CLOUDLAB (Henneberger et al., 2023) campaign employing uncrewed aerial vehicles (UAVs) and in situ instrumentation has enabled detailed characterization of seeded ice plumes, revealing rapid ice growth, efficient liquid water depletion, and enhanced aggregation (Miller et al., 2024, 2025; Ramelli et al., 2024; Fuchs et al., 2025; Zhang et al., 2026).
Nevertheless, such measurements are inherently Eulerian, providing snapshots of plume properties at fixed locations rather than a continuous record of their evolution. As a result, distinguishing whether the vertical transport of an ice plume is driven by the ambient vertical velocity into which it was born or by the buoyancy generated by its own growth remains difficult to establish from observations alone. Large-eddy simulations (LES) coupled with detailed bin microphysics schemes provide the necessary complementary tool to bridge this gap. Models such as the Scalable Computing for Advanced Library and Environment–Advanced Microphysics Prediction System (SCALE-AMPS; Ong et al., 2022) explicitly represent the size-, shape-, and habit-dependent evolution of ice particles while capturing the feedback between phase changes and air motion (Hashino and Tripoli, 2007).
In this study, we use the SCALE–AMPS model to simulate a targeted seeding event from the CLOUDLAB campaign, utilizing in situ observations to constrain the initial conditions and validate the microphysical evolution. The paper is organized as follows. We first describe the experimental setup and the in situ dataset (Sect. 2), followed by the numerical configuration of the SCALE–AMPS model (Sect. 3). The model performance is then evaluated against observations by comparing key parameters such as Ice Crystal Number Concentration (ICNC), Liquid Water Content (LWC), and particle size distributions (Sect. 4.1). Subsequently, we present the core sensitivity analysis, isolating the impact of initial vertical wind conditions on plume evolution and quantifying the role of latent heat feedbacks (Sect. 4.2 and 4.4). Finally, the main findings and their implications for future mixed-phase cloud studies are summarized (Sect. 5).
This study focuses on a single glaciogenic seeding experiment from the CLOUDLAB campaign in persistent wintertime supercooled stratus over the Swiss Plateau near Eriswil, Switzerland (47°04′14′′ N, 7°52′22′′ E; 920 m a.s.l.) (Scherrer and Appenzeller, 2014; Henneberger et al., 2023; Miller et al., 2024, 2025; Ramelli et al., 2024; Fuchs et al., 2025). The experiment was conducted on 24 January 2023 at 18:08:57 UTC in liquid-dominated, quasi-stationary cloud conditions with temperatures close to −5 °C at seeding height. Glaciogenic seeding was performed at an altitude of 1348 m, 2068 m upwind of the measurement site, under mean wind directions between 75 and 77°. As the seeded ice plume advected over a fixed ground-based site, its microphysical changes were continuously sampled by an in situ platform, providing time-resolved observations used both to constrain the model setup and to evaluate the simulated ice growth and interaction processes. The sampling altitude during plume observation was generally consistent with the seeding height, with vertical fluctuations of up to about ± 30 m.
In situ measurements were obtained using a tethered balloon system carrying the HOLographic Imager for Microscopic Observations (HOLIMO; Ramelli et al., 2020), a digital in-line holography instrument with effective spatial resolutions of 6 µm for cloud droplets and 25 µm for ice crystals. Holograms were reconstructed, and detected particles were initially classified using a convolutional neural network (Touloupas et al., 2020). Ice crystals classified by this procedure were subsequently analyzed using IceDetectNet-CLOUDLAB (Zhang et al., 2026), a CLOUDLAB-specific fine-tuning of IceDetectNet (Zhang et al., 2024). The uncertainty in cloud droplet number concentration is approximately 5 %, while uncertainties in ice crystal number concentration range from 5 %–10 % for larger crystals and increase to about 15 % for smaller particles.
The numerical simulation is configured to reproduce this experiment using observationally constrained initial and environmental conditions as follows: The model is initialized with a liquid water path of 107.5 g m−2 measured from HATPRO Microwave Radiometer. Thermodynamic profiles for the model setup are derived from radiosonde launches at 15:44, 20:31, and 20:48 UTC on 24 January 2023, which span the seeding and plume observation period. Model performance is evaluated against the observed ice size distribution, aspect ratio, ICNC, CDNC, LWC, and the ice–ice collision rate inferred from observed ice microphysical properties and deep learning techniques (see Zhang et al., 2026 for detailed methodology), using consistent definitions and averaging procedures for model output and observations.
3.1 Model
The SCALE-AMPS model (Nishizawa et al., 2015; Sato et al., 2015; Ong et al., 2022) is used in this study. SCALE is a large-eddy simulation (LES) atmospheric model that solves the primitive equations using the finite-volume formulation on a structured Arakawa C-staggered grid. Prognostic variables are advanced in time using the fourth-order Runge–Kutta integration scheme. Subgrid-scale turbulence is represented using a Smagorinsky–Lilly–type scheme (Smagorinsky, 1963; Lilly, 1962), and radiative transfer is computed with the MSTRNX radiation code (Sekiguchi and Nakajima, 2008). The current subgrid-scale scheme does not account for local supersaturation fluctuations (e.g., Grabowski and Abade, 2017). This idealization implies that microphysical processes, such as ice nucleation and droplet activation, are computed based on grid-mean thermodynamic states, a common simplification in current LES frameworks.
AMPS is a habit-preserving bin microphysics scheme. Detailed descriptions of AMPS are provided in Hashino and Tripoli (2007, 2008, 2011), and its implementation within the SCALE framework is described by Ong et al. (2022). Here, only a brief overview is given. Both liquid and ice particle size spectra are discretized into 40 bins. For each liquid bin, tracer variables include the liquid water mixing ratio (Qliq), Cloud Droplet Number Concentration (CDNC), aerosol mixing ratio (Qae), and the mean ratio of soluble mass to total aerosol mass (Qsolv). For each ice bin, the corresponding variables are the ice mixing ratio (Qice), ICNC, Qae, and Qsolv.
To keep track of the evolution of the shape of ice particles, three additional tracer variables corresponding to the a-axis and c-axis lengths are stored in each ice bin. These variables allow the model to keep track of the time evolution of habit changes, as ice particles grow into different shapes (e.g., planar or columnar) depending on ambient temperature. Aggregation (Qagg) and riming (Qrim) mixing ratios are also predicted, because collisions with ice particles and liquid droplets alter particle mass compositions and shapes. AMPS assumes that aggregation and riming processes cause ice particles to asymptotically approach an elliptical shape. A third mass-component prognostic variable, the crystal mass mixing ratio (Qcry), is included to track the history of vapor deposition growth. Vapor deposition growth increases only Qcry, while Qagg and Qrim remain unchanged. For pristine ice particles that grow exclusively by vapor deposition, Qcry=Qice within a bin.
A cubic polynomial is used to represent the subgrid-scale distribution of number density in both the liquid and ice spectra. During diffusional or collisional growth, particle mass changes cause the lower and upper boundaries of a bin to shift. The subgrid distribution in each shifted bin is recalculated, and the prognostic variables in the original bins are updated by integrating the corresponding quantities over the overlapping regions between the shifted and original bins. The ratios Qcry Qice, Qagg Qice and Qrim Qice are assumed to remain constant within the subgrid distribution. This is a strategy called implicit mass sorting assumption (Hashino and Tripoli, 2007). When two ice particles collide, the post-collision axis lengths are computed using the volumetric means.
The relative growth rates of the a- and c-axis lengths are determined by an inherent growth-rate function that depends solely on ambient temperature (Chen and Lamb, 1994). AMPS uses a single spectrum for all types of ice particles. Ice particle types can be diagnosed within each bin based on the crystal, aggregation and riming mass fractions (Qcry Qice, Qagg Qice, and Qrim Qice). In AMPS, ice particles are classified as one of the following types: pristine crystals, rimed crystals, graupel, aggregates, or rimed aggregates (Hashino and Tripoli, 2007). For example, ice particles are diagnosed as aggregates when the aggregation mass fraction exceeds 10 % and the riming mass fraction is less than 10 %.
Cloud condensation nuclei (CCN) are treated as a spatially uniform background variable throughout this study and are assumed to follow a lognormal size distribution. The distribution is characterized by a total number concentration of 317 cm−3 (corresponding to the observed mean cloud droplet number concentration), a geometric mean radius of 0.052 µm, and a geometric standard deviation of 0.71. The CCN are assumed to consist entirely of ammonium bisulfate (NH4HSO4). The distribution is discretized into 10 bins in the computation of CCN activation. CCN in bins with critical supersaturations lower than the ambient supersaturation are activated and transferred to the liquid water bins, with the resulting droplet size and bin assignment determined by the microphysics time step and the initial droplet growth rate. Activated CCN are immediately replenished to maintain the prescribed background distribution.
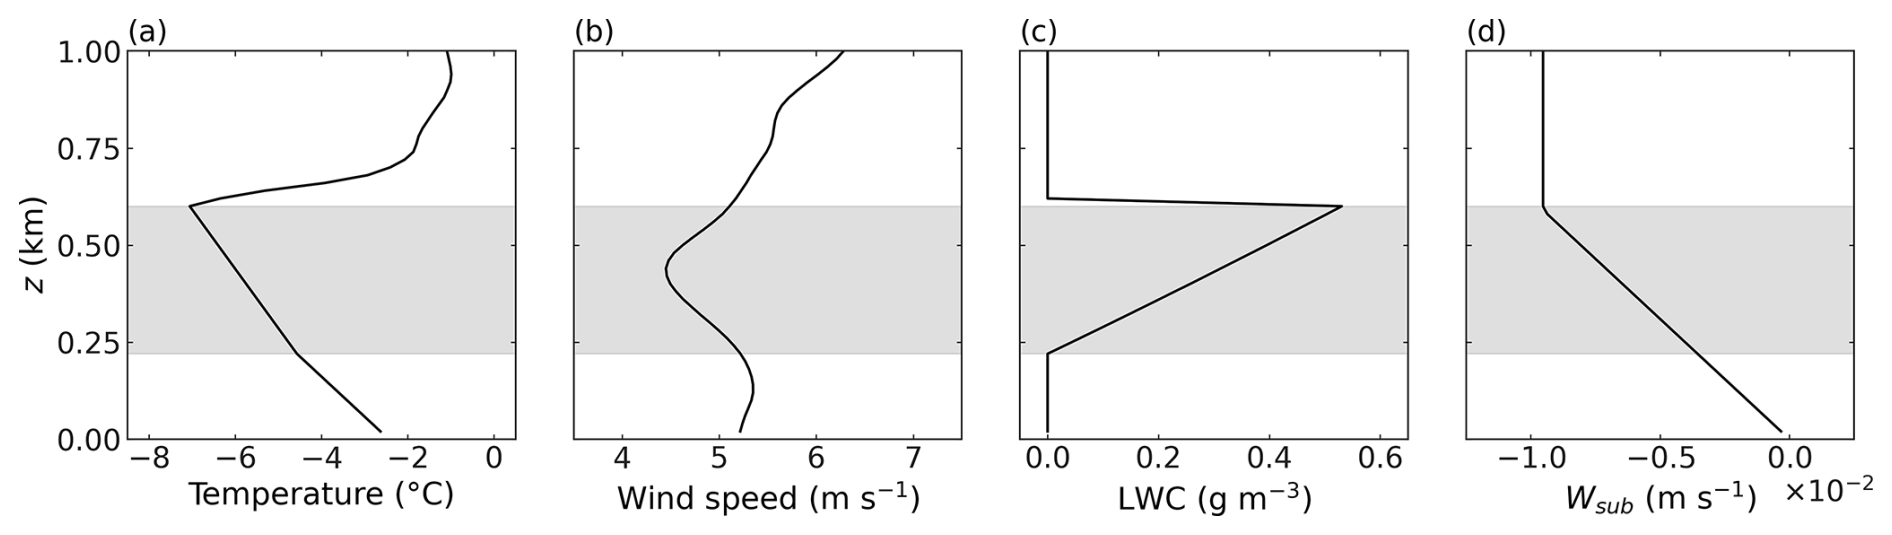
Figure 1Vertical profiles of (a) temperature, (b) wind speed, and (c) liquid water content (LWC) used as the initial conditions for the simulations. The mean wind is directed in the positive y direction. Panel (d) shows the imposed large-scale subsidence Wsub. The gray shaded region denotes the cloud layer.
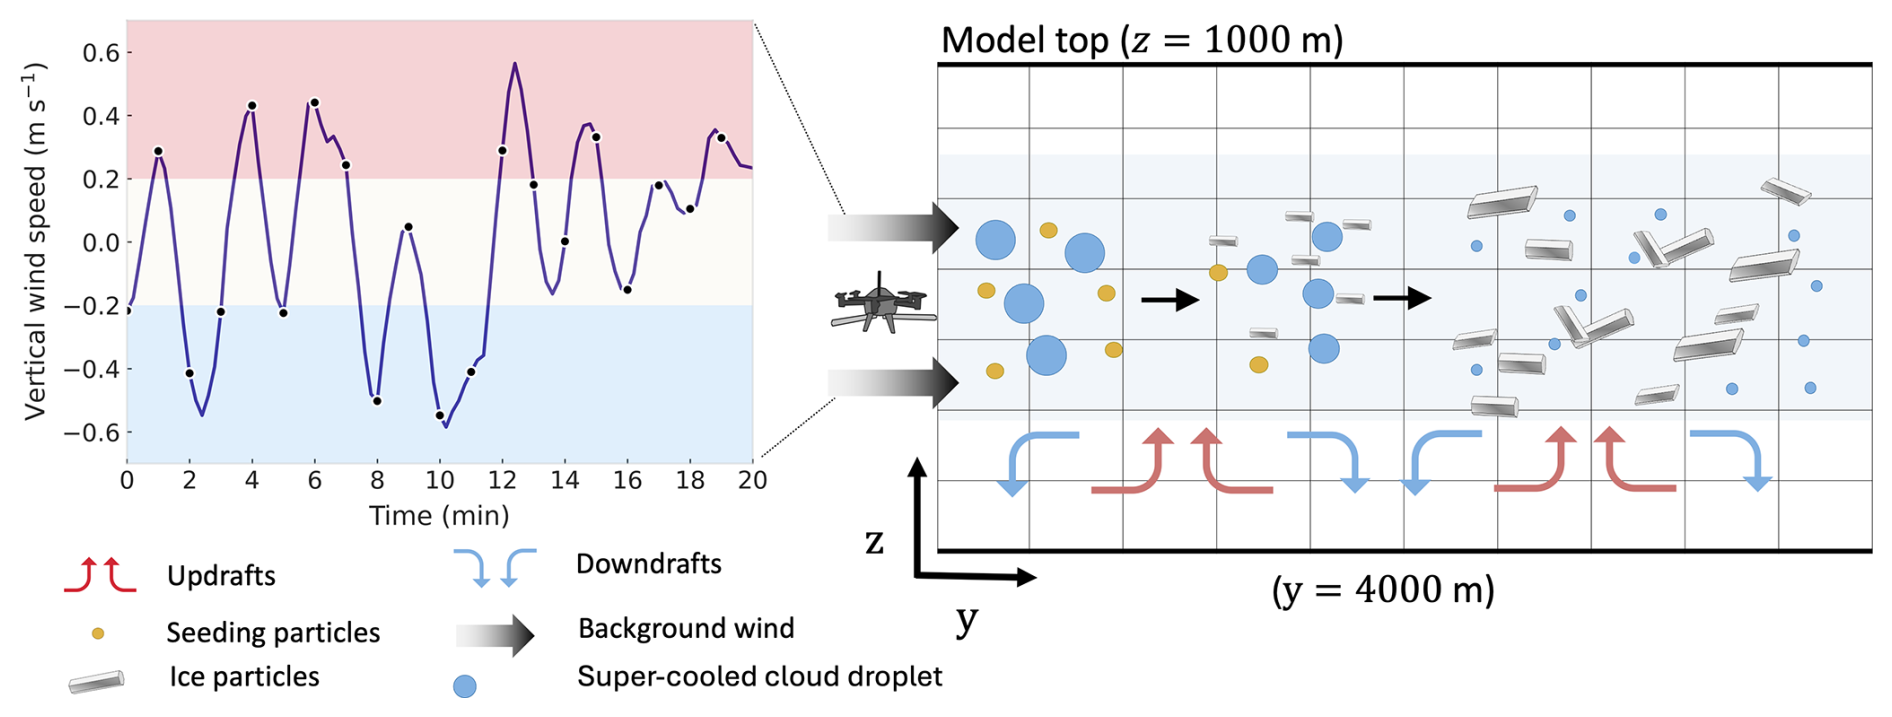
Figure 21 min running average of the vertical wind speed in the grid cells where ice-nucleating particles (INPs) are released. The dots indicate the specific vertical wind speeds at the 20 distinct initiation times for the ensemble members. (b) schematic illustration of the computational domain after the spin-up period. Cloud seeding is performed between the coordinates (950, 10, 310) and (1050, 10, 310) m.
3.2 Numerical setup
The computational domain spans 2 and 4 km in the x and y directions, respectively, with the model top at 1 km. The grid spacing is uniformly 20 m in the x, y, and z directions. Periodic boundary conditions are applied in the horizontal directions, and Rayleigh damping is imposed above 800 m. Complex orography over the Swiss Plateau at the field campaign site is not represented; consequently, the domain is flat. This idealization may lead to an underestimation of turbulent mixing associated with real terrain. The cloud layer extends from approximately 220 to 600 m in altitude. Accordingly, the relative humidity is prescribed as 100 % within this layer and varies linearly below and above the cloud, with boundary conditions derived from radiosonde observations. The initial vertical profiles of temperature and liquid water content (LWC; Fig. 1) are derived from the linearized relative humidity profile, observed pressure, and the assumption of a vertically uniform liquid potential temperature below cloud top. The initial wind profile is obtained by smoothing the radiosonde observations, with the mean flow oriented in the y direction. In all simulations, the wind speed is nudged toward the initial profile with a relaxation time scale of 1 h. Model output is saved at 12 s intervals.
A constant large-scale subsidence of 0.00952 m s−1 (Fig. 1d) is imposed above the inversion layer at 600 m above ground to maintain a steady boundary layer depth and inversion strength throughout the simulations, as the simulations are idealized and do not include realistic boundary conditions. The subsidence is assumed to be zero at the surface and is linearly interpolated at altitudes between the inversion layer and the surface. Its effect on temperature and water vapor mixing ratio is represented by adding a source term in the energy and moisture equations, where w is the subsidence and ϕ denotes temperature or water vapor mixing ratio, to their respective prognostic tendencies.
Observational constraints on the physical and chemical properties of background CCN are unavailable. We therefore assume that the CCN consist entirely of ammonium bisulfate, with a mean particle radius of 0.052 µm and standard deviation of the CCN size distribution of 0.071. The observed mean cloud droplet number concentration is 317 cm−3; accordingly, the background CCN number concentration is prescribed as 317 cm−3.
The first hour of integration is treated as a spin-up period to allow the model to adjust dynamically and thermodynamically to the imposed initial and boundary conditions. A spin-up time of 1 h is sufficient for turbulent flows in the boundary layer to fully develop and for the mean liquid water path and CDNC to approach quasi-steady values (not shown). After the spin-up period, a series of updrafts and downdrafts emerges within the boundary layer (see the schematic illustration of the idealized simulation setup in Fig. 2). These motions are generated by thermal convection in the presence of wind shear and surface friction. They propagate downstream and evolve with time, with existing updrafts and downdrafts dissipating and new ones forming. Their vertical extent can reach the cloud top.
Ice-nucleating particles (INPs) are released within grid cells spanning the coordinates (950, 10, 310) to (1050, 10, 310) m, where the three indices denote the x, y, and z coordinates, respectively. Because the INP release rate is not constrained by observations, we prescribe an injection duration of 1 min and a spatially uniform release rate of 10 cm−3 s−1, such that the simulated ice crystal number concentration (ICNC) matches the observed ICNC in the reference simulation described later. The injection altitude is chosen to match the actual seeding altitude, at which the ambient air temperature upon seeding is −5 °C. Ice particles form from the injected INPs and are subsequently advected downstream by the mean wind.
The freezing efficiency of INPs is parameterized following Omanovic et al. (2024), with the frozen fraction defined as
where Fice is the frozen fraction, T is temperature (K), b=0.97, k=0.88, and T0=263.95 K. New ice particles form when FiceNINP, where NINP is the total INP number concentration in a grid cell, exceeds the existing ICNC. All INPs are assumed to have a uniform diameter of 1.0 µm and are treated as passive tracers. Consequently, they do not interact dynamically with the flow, and their chemical composition and mass are not explicitly represented.
After the spin-up period, the 1 min running mean vertical wind speed within the seeding grid cells fluctuates between −0.6 and 0.6 m s−1 (left panel of Fig. 2). To investigate the sensitivity of the ice plume evolution to vertical wind speed, we perform 20 seeding simulations, with the initiation time of INP release staggered at 1 min intervals. The simulation in which INPs are released 9 min after the spin-up period is selected as the reference case, and its results are compared with observational data to evaluate the validity of the model and the numerical setup. The 20 simulations are categorized into three groups: (1) updraft, (2) no-wind, and (3) downdraft, based on the mean vertical wind speed at the seeding location greater than 0.2 m s−1, between −0.2 and 0.2 m s−1, and less than −0.2 m s−1, respectively. This classification yields 7 updraft, 6 no-wind, and 7 downdraft simulations. For the sensitivity analysis, the ice plume is defined as the set of grid cells in which the ICNC exceeds the 70th percentile, corresponding to ICNC values of approximately >100 L−1). This definition is adopted to more effectively track the core of the ice plume as it disperses over a larger region during the later stages of plume evolution, although it differs from the observational definition, in which the plume is identified using an ICNC threshold exceeding 10 L−1. The conclusions drawn from the analysis are not sensitive to this difference, except that the simulated vertical plume spread and standard deviations become larger.
To further isolate the physical mechanisms driving the plume evolution and to address the relative importance of the initial latent heat “kick” versus the subsequent WBF-driven feedbacks, two additional sets of 20-member ensemble simulations were conducted. These 40 simulations use the same initiation times as the original seeding ensemble to ensure a direct comparison under identical dynamical backgrounds: (1) WBF-off seeding case (Ls=Lc): In these simulations, the latent heat of sublimation (Ls) is set equal to the latent heat of condensation (Lc) in the model's thermodynamic equations. This modification effectively eliminates the net latent heat gain () otherwise produced when ice crystals grow at the expense of cloud droplets (the WBF process). Furthermore, it ensures that any depositional growth driven by adiabatic cooling during the plume's ascent only releases heat equivalent to Lc, thereby removing the extra energetic contribution of freezing (Lf). This setup allows the initial latent heat release from the freezing of cloud droplets (the “initial kick”) to occur normally while suppressing the enhanced thermodynamic feedback during subsequent ice growth; (2) No-ice seeding case: In this baseline ensemble, INPs are released into the domain as passive tracers, but the ice nucleation process is disabled. This case serves as a reference to represent the plume's evolution governed solely by the background turbulent flow, in the absence of any microphysical–thermodynamic feedbacks. By comparing these two sensitivity ensembles with the original seeding simulations, we can quantitatively decompose the total buoyancy gain into contributions from the initial freezing event and the subsequent growth-driven intensification supported by both WBF and adiabatic cooling.
The mean wind speed in the y direction exhibits weaker variability than the initial profile by the end of the spin-up period, as the boundary layer becomes well mixed by convection and turbulence. The wind speed decreases only slightly from approximately 5.1 m s−1 near the surface to 4.8 m s−1 near the cloud top. Consequently, the ice plume in all simulations advects downstream at an approximately constant speed in the y direction (Fig. 3). In the reference simulation, the ice plume travels 2 km in 444 s. The time required for the ice plume to travel 4 km varies between 804 and 852 s among the simulations.
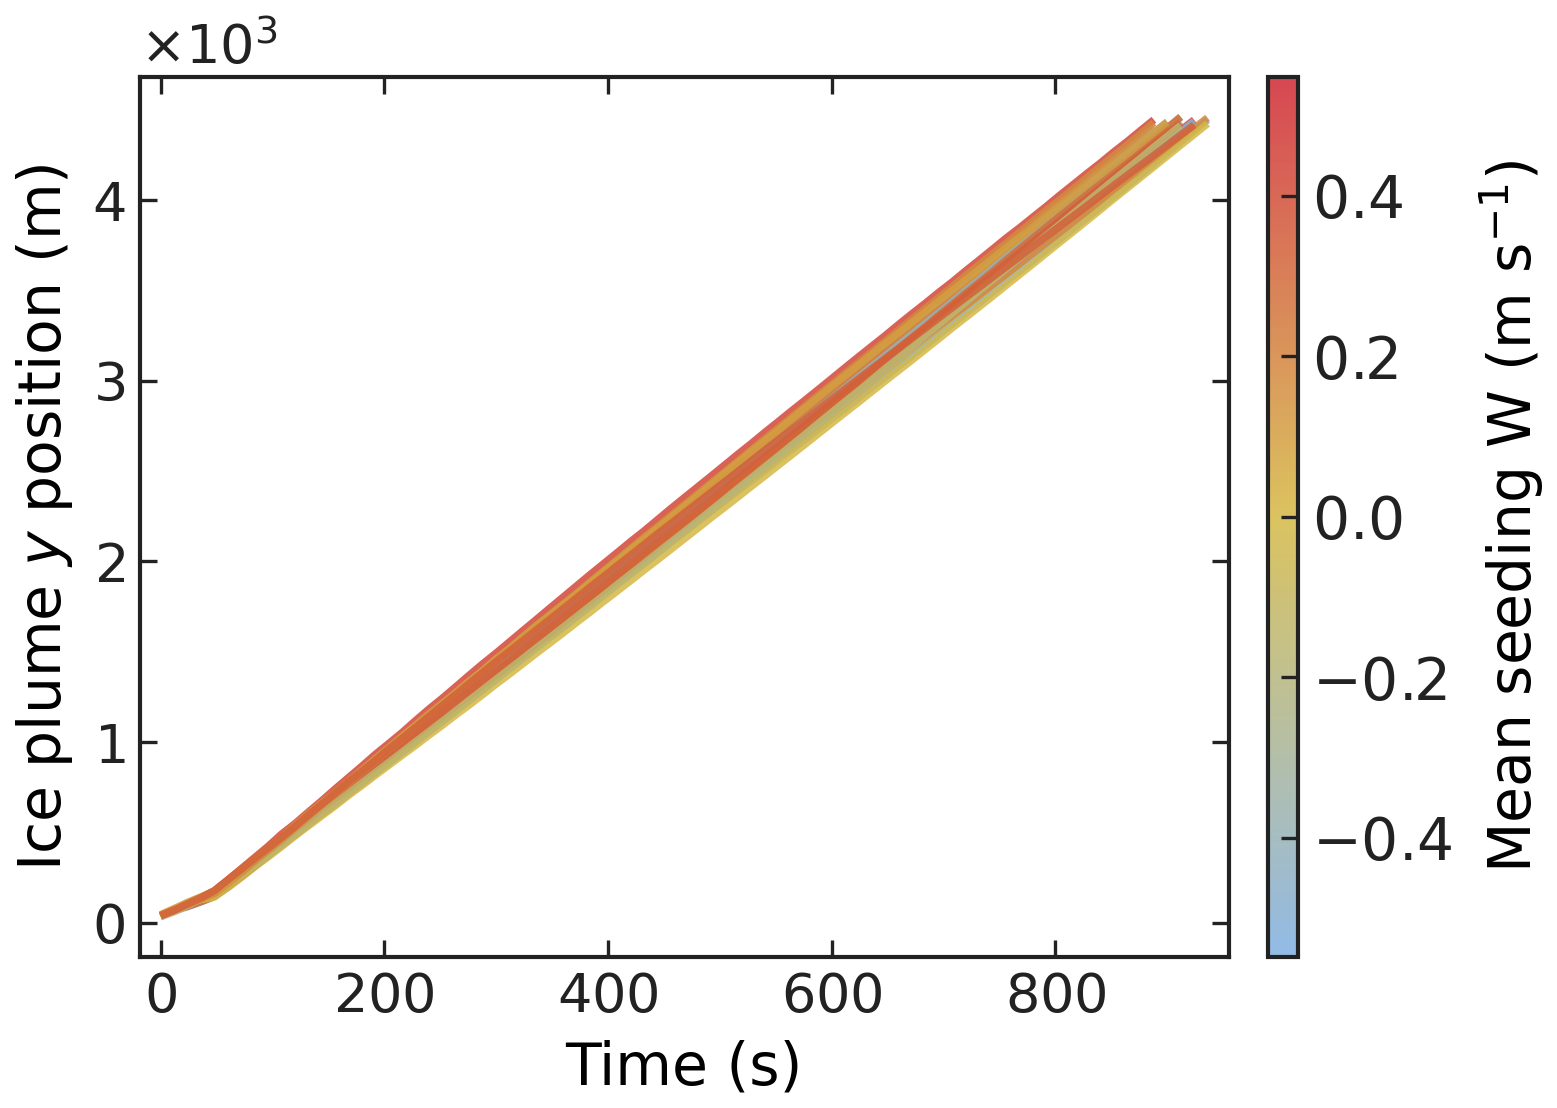
Figure 3Time series of the downstream distance (y position) advected by the ice plume for all simulations.
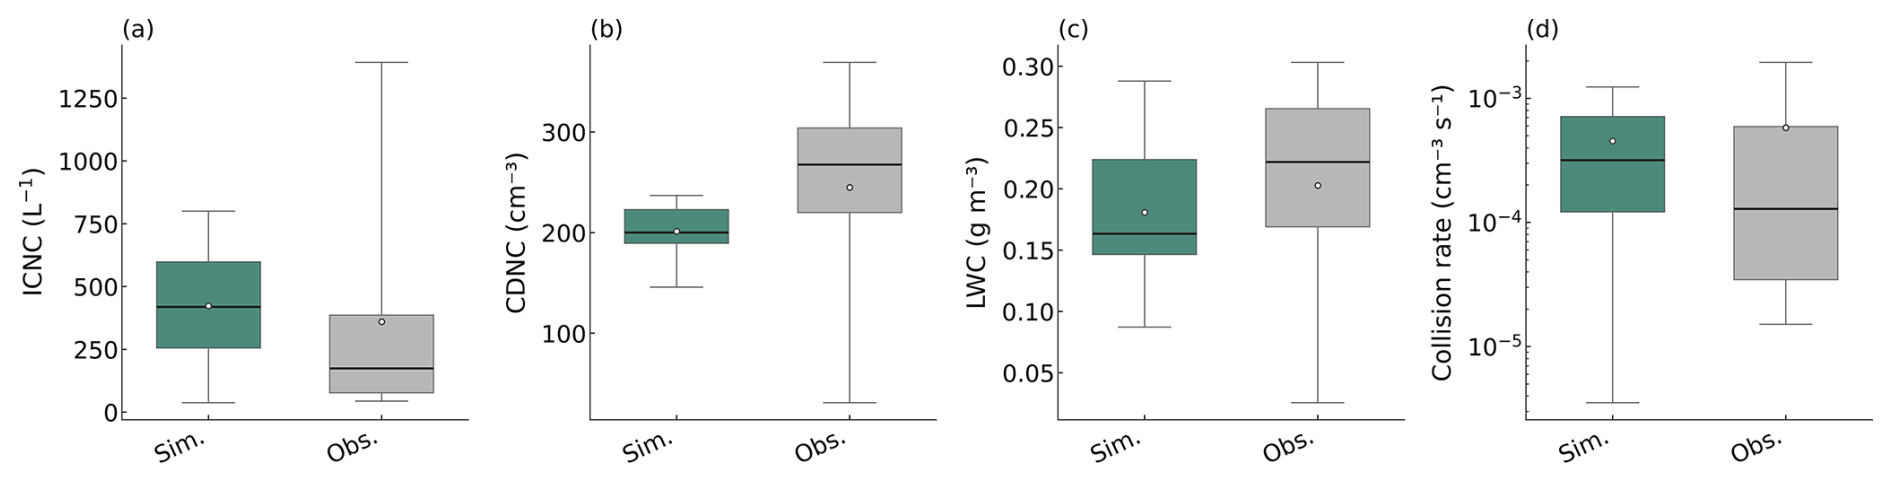
Figure 4Simulated and observed (a) ICNC, (b) CDNC, (c) LWC, and (d) collision rate at 2 km downstream of the seeding location. The simulation results are sampled at the height between 400 and 450 m above ground, while the observational data are taken at 400 m above ground.
4.1 Model validation
In this section, the validity of the numerical setup is assessed by comparing results from the reference simulation with in situ observations obtained on 24 January 2023. Specifically, comparisons are made for ICNC, CDNC, LWC, ice crystal aspect ratio, and size distribution. The observational data used for comparison were collected using the HOLIMO instrument at an altitude of approximately 400 m above ground level (a.g.l.) and approximately 2 km downstream of the seeding drone (the balloon carrying the instrument was advected by the wind). The data were collected starting at 18:16:25 UTC, when the instrument first detected ice crystals. Each data point represents a time snapshot with an ice crystal present. The means, medians, and standard deviations are computed from this time series.
In the simulation, these quantities are sampled from grid cells located 2 km downstream of the seeding region and between 400 and 450 m a.g.l., when the ice crystal plume passes through these grid cells and the ICNC exceeds 10 L−1. This sampling strategy is designed to match the location and conditions of the observational measurements. The means, medians, and standard deviations are computed in the same manner as for the observational data.
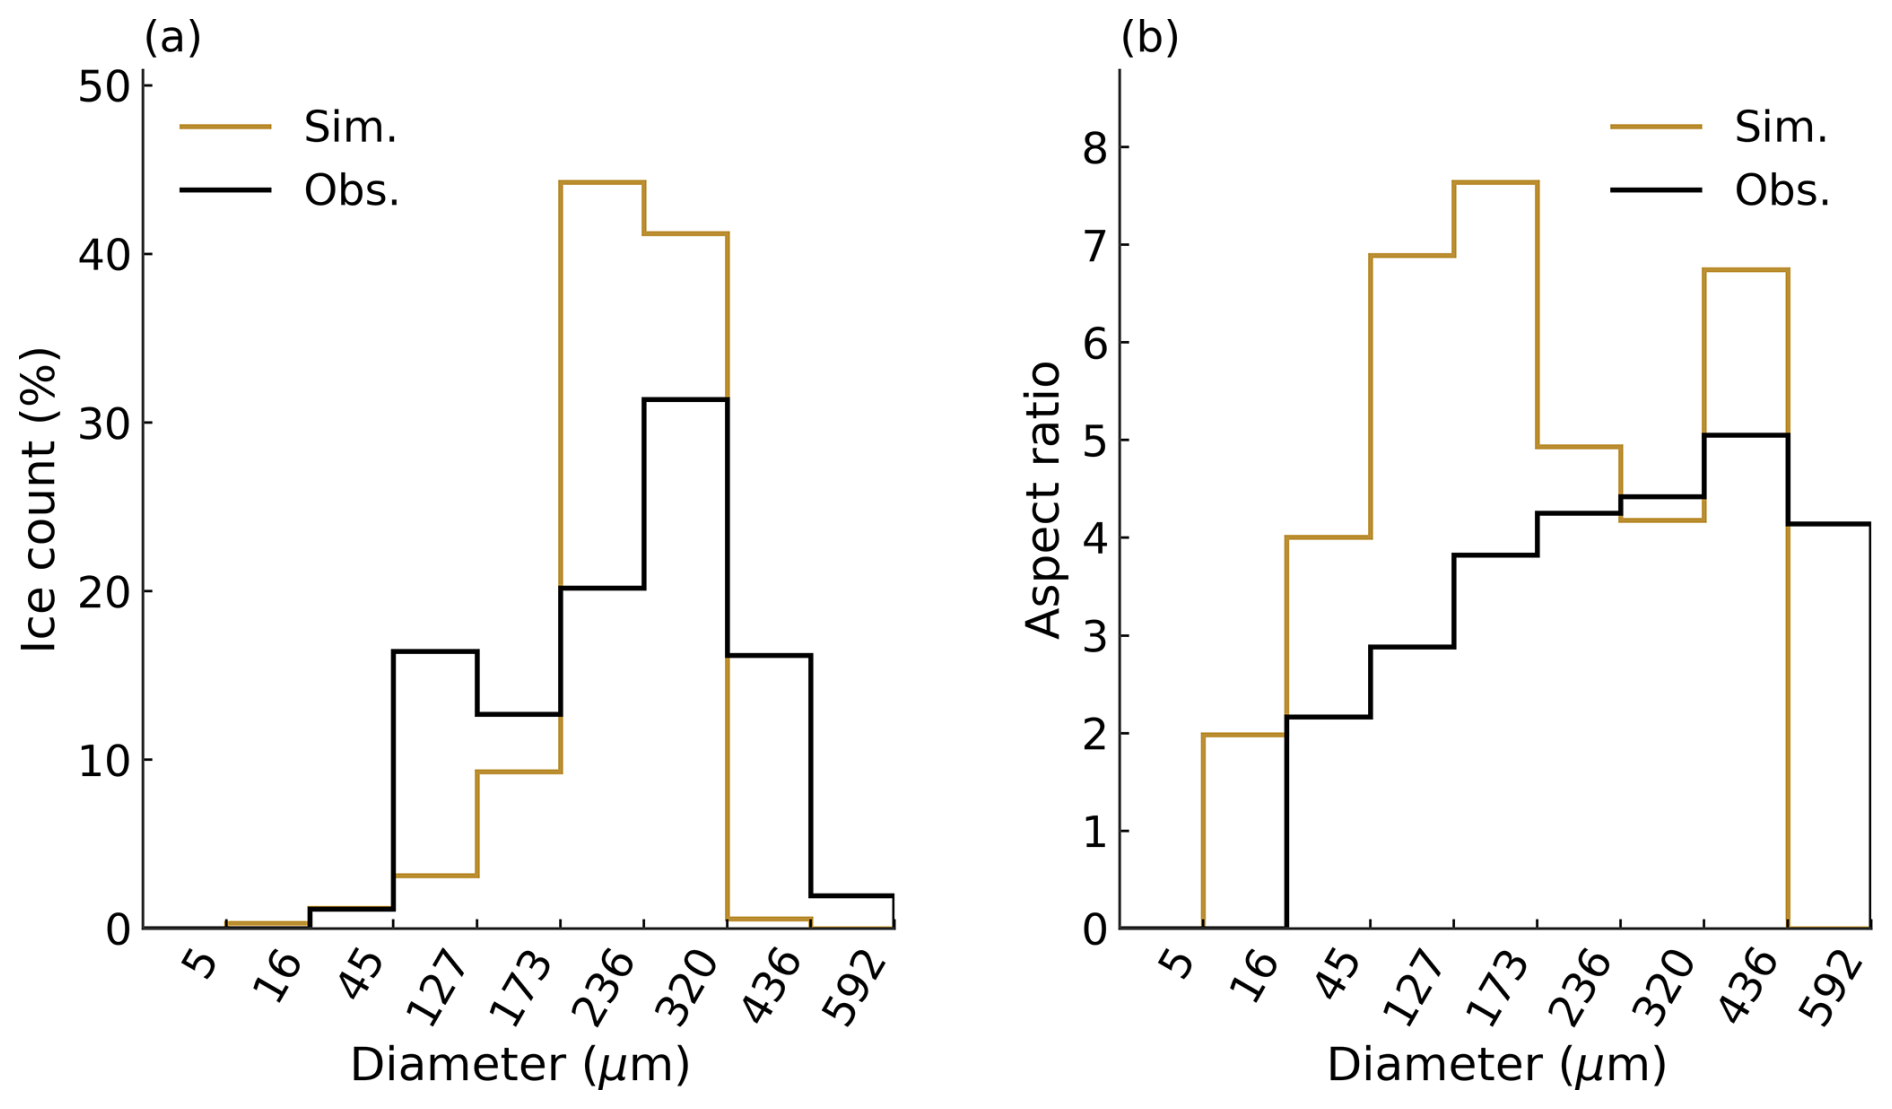
Figure 5Simulated and observed (a) ice count and (b) aspect-ratio distributions at 2 km downstream of the seeding location.
The bin resolution in AMPS differs from that of the instrument. In AMPS, the size distribution is defined as a function of ice crystal mass and follows a logarithmic mass grid (Hashino and Tripoli, 2007). To enable direct comparison of the mean ice crystal aspect ratio and number concentration in each bin, the bin boundaries are converted from mass to equivalent spherical diameter using the volume relation of a sphere, assuming an ice crystal density of 0.916 g cm−3. The observed aspect ratio and size distribution data are then re-binned accordingly.
The simulated mean values of ICNC, CDNC, LWC, and collision rate agree reasonably well with the observed means (Fig. 4), considering that the setup is idealized. Although the simulated median CDNC and LWC are approximately 70 cm−3 and 0.05 g m−3 lower than the observed medians, owing to a higher simulated median ICNC, the interquartile range (25th–75th percentiles) of the simulated LWC lies within the range of the observed LWC. The observational data exhibit greater variability than the simulation. This discrepancy may be attributed to three factors: (1) small-scale inhomogeneity that is not fully resolved by the grid spacing used in the simulation; (2) the idealized setup, which employs smoothed initial conditions and neglects the complex terrain; and (3) the use of a deterministic ice nucleation scheme, which may underestimate the natural stochastic variability of ice initiation.
In the simulation, ice crystals grow predominantly by vapor deposition. Consequently, the simulated size distribution is narrower than that observed (Fig. 5). Most simulated ice crystals have sizes between 173 and 320 µm, whereas the observed size distribution peaks between 236 and 320 µm. This difference is also likely due to the absence of turbulent effects that would otherwise broaden the ice crystal size distribution (Grabowski and Abade, 2017), as well as insufficient spatial inhomogeneity.
For ice crystals with sizes between 173 and 320 µm, the simulated mean aspect ratio ranges from 4 to 5, in good agreement with observed values (Fig. 5). However, the simulated mean aspect ratio of ice crystals smaller than 173 µm reaches approximately 7. This bias arises because some ice crystals form at colder temperatures after the ice plume ascends to higher altitudes. Over this temperature range in the boundary layer, the aspect ratio (c-axis a-axis) increases more rapidly at colder temperatures (Chen and Lamb, 1994), leading to larger aspect ratios for ice crystals formed later in the plume evolution.
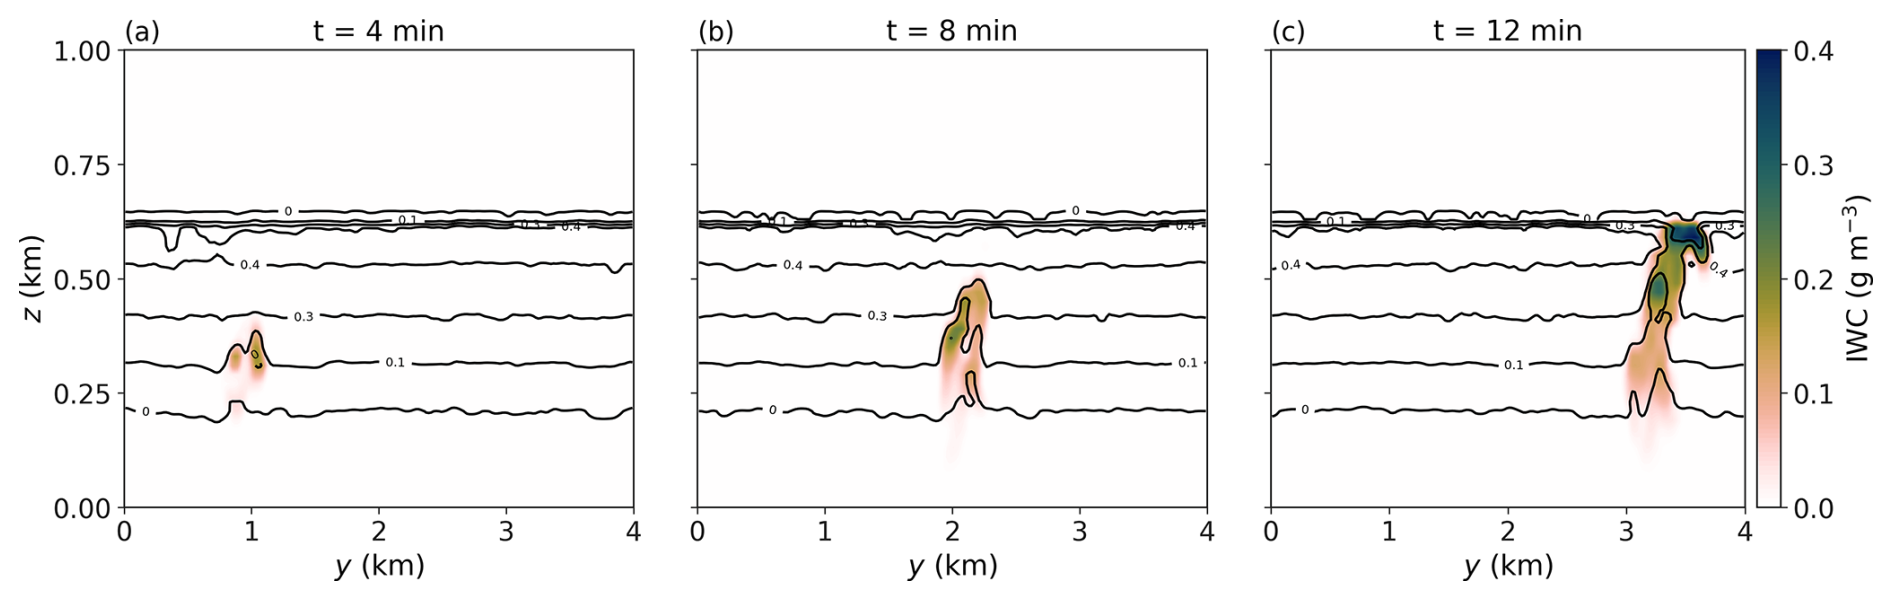
The ice plume initially appears as a localized feature, with a horizontal extent of approximately 300 m and a top height near 400 m 4 min after INPs are released into the computational domain (Fig. 6; see also Appendix A for 3D visualizations of the ice plume from the model simulations). After traveling 2 km downstream, the plume top reaches a height of about 500 m above ground, while its horizontal extent remains nearly unchanged. The vertical extent of the ice plume continues to increase with time, and it eventually spans the entire cloud depth at 3 km downstream.
Overall, although the simulated ice plume exhibits greater spatial homogeneity and potentially weaker turbulent effects than observed, the model is able to reproduce the key mean characteristics of the ice plume. Good agreement is achieved between the reference simulation and observations in terms of mean ICNC, CDNC, LWC, collision rate, ice crystal size, and aspect ratio. This numerical configuration therefore provides a foundation for the subsequent sensitivity experiments investigating the influence of vertical velocity at the seeding location.
4.2 Latent heat feedbacks and vertical plume dispersion
The vertical trajectory of the seeded ice plume is initially kinematically governed by the environmental vertical wind field at the point of injection. As illustrated in Fig. 7a, plumes injected into updraft regions undergo rapid ascent, reaching the cloud-top height (z≈600 m above ground) within 6 to 10 min. Conversely, plumes seeded into subsiding air parcels (winit<0) experience an initial loss of altitude, descending by up to 150 m within the first 300 s. However, a fundamental dynamic transition is observed as the plume evolves: the trajectory decouples from the initial environmental forcing, and all plumes eventually establish a coherent net ascent. Even simulations initialized in strong downdrafts reverse their vertical motion, initiating a secondary ascent phase after approximately 300 to 500 s.
We hypothesize that this unconditional lofting is driven by internal microphysical-thermodynamic feedbacks, specifically the buoyancy generated by the latent heat of phase changes. The rapid growth of seeded ice crystals-primarily through vapor deposition in the supersaturated mixed-phase environment-releases a significant amount of latent heat. This exothermic process induces a localized positive temperature perturbation within the plume relative to the environment, thereby generating buoyancy that opposes and eventually overcomes the initial downdraft momentum.
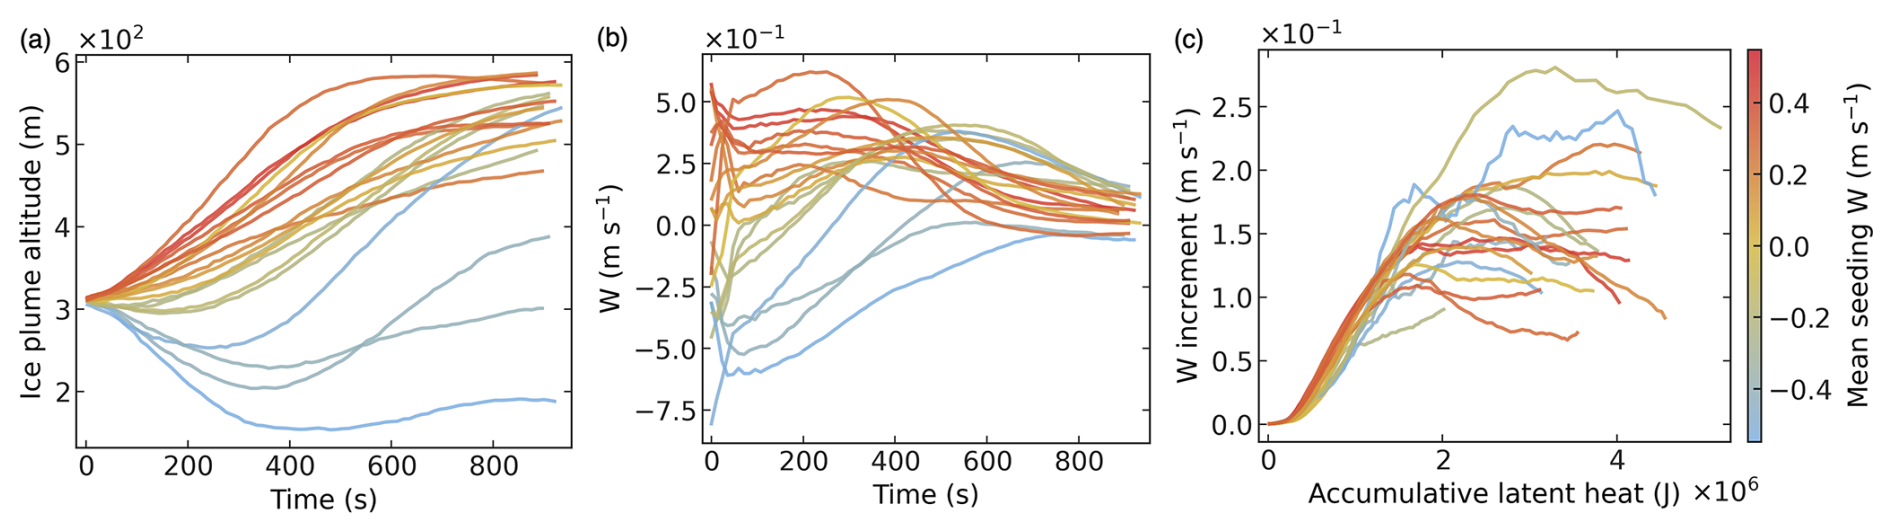
Figure 7Temporal evolution of ice plume dynamics and thermodynamic feedbacks. (a) Mean altitude of the ice plume center of mass. The observational sampling time corresponds to t≈464 s. (b) Evolution of the mean vertical wind speed (W) within the ice plume. (c) The relationship between the seeding-induced vertical velocity perturbation (ΔW) and the accumulative latent heat release. The strong positive correlation confirms that latent heating drives the secondary ascent.
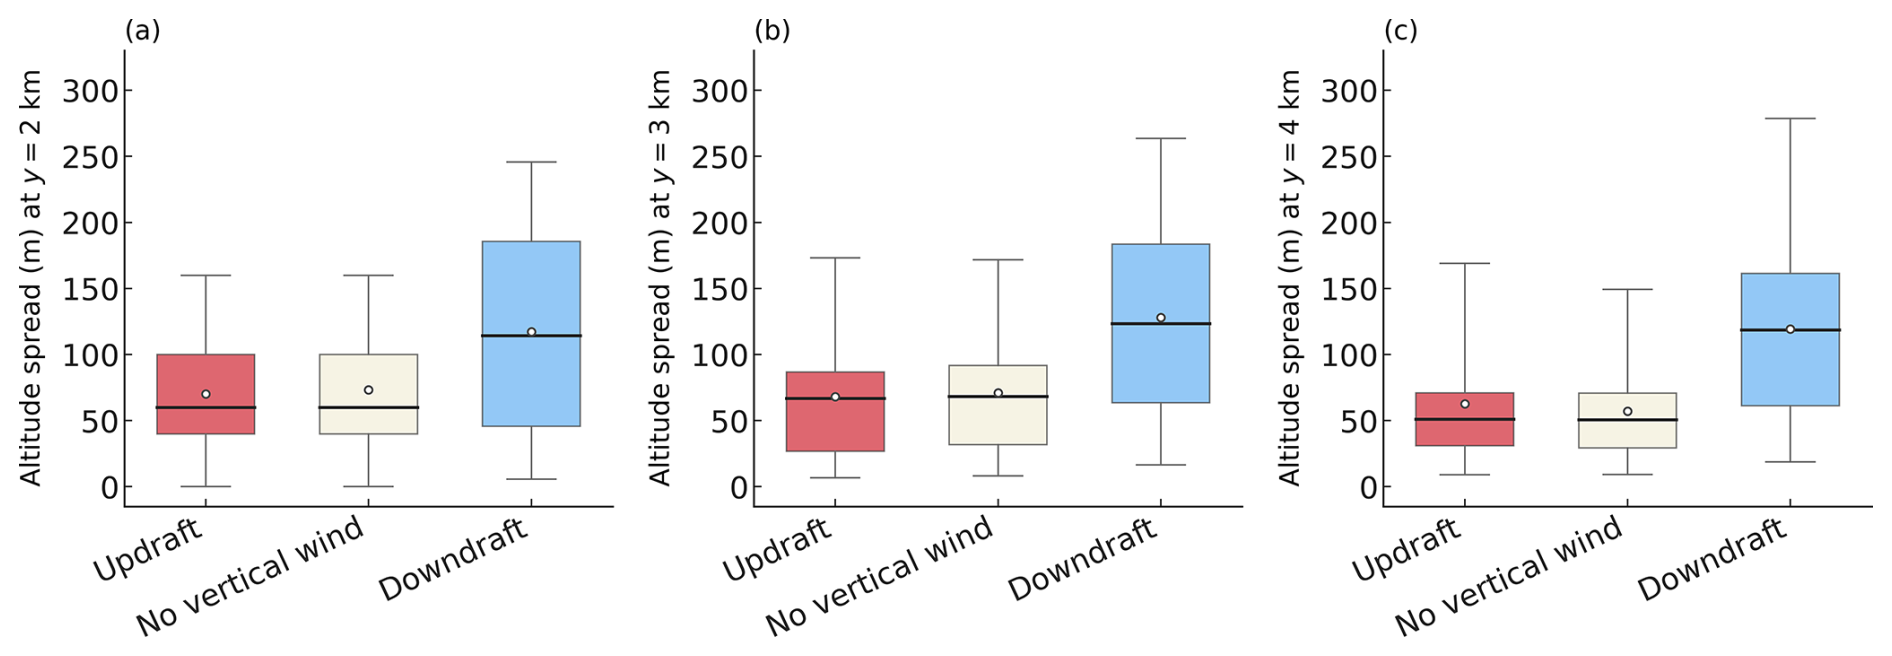
Figure 8Boxplots of the vertical extent (altitude spread) of the ice plumes sampled at downstream distances of (a) y=2, (b) y=3, and (c) y=4 km. In each boxplot, the central horizontal line and the white circle represent the median and the mean values, respectively. The top and bottom edges of the box indicate the 75th and 25th percentiles, while the whiskers extend to the 5th and 95th percentiles. Simulations are categorized by the vertical wind conditions at the injection time: Updraft (winit>0.2 m s−1), No vertical wind ( m s−1), and Downdraft ( m s−1).
This mechanism is quantitatively substantiated by two lines of evidence. First, the mean vertical velocity (W) within the plume converges towards positive values across the entire ensemble, independent of the initial kinematic state (Fig. 7b). Second, and more critically, there is a robust functional relationship between the seeding-induced vertical velocity perturbation (ΔW) and the cumulative latent heat release (Q−Qno ice), as shown in Fig. 7c. The cumulative latent heat is calculated as the time-integral of the net phase-change energy within the plume cells (defined as grid cells where ICNC exceeds the 70th percentile, corresponding to ICNC values of approximately 100 L−1 or greater). This term specifically represents the excess heating relative to the non-seeded baseline (Q−Qno ice), thereby isolating the latent heat of freezing and the net heating from the WBF process while excluding the background latent heat of condensation associated with the ambient cloud. The increase of ΔW with accumulated heat confirms that the secondary updraft is not a stochastic feature of the turbulence but a deterministic response to the latent heat released upon phase changes.
The interaction between this buoyancy-driven ascent and the thermodynamic stability at the cloud top (the capping inversion) fundamentally alters the vertical morphology of the plume. Plumes in updrafts possess high vertical momentum and reach the inversion layer rapidly (short residence time in the boundary layer). Upon impact, their ascent is stopped, causing the plume to spread horizontally (see Appendix A). In contrast, plumes in downdrafts exhibit a delayed ascent and longer residence time within the mixed-phase layer. This extended transit allows for greater vertical dispersion before reaching the ceiling. Consequently, as evidenced in Fig. 8, downdraft-seeded cases cause a significantly larger vertical spread (up to ∼250 m) at downstream distances compared to the vertically constrained updraft cases.
These dynamical differences have critical implications for the observational verification of the seeding signal. The in-situ measurement sampling was conducted at a downstream distance corresponding to an advection time of t≈464 s, at an altitude proximate to the seeding level. At this temporal snapshot (Fig. 8a), a significant vertical bifurcation is evident: while the centroids of the updraft-seeded plumes have ascended well above the sampling height (exceeding 500 m above ground), the downdraft-seeded plumes remain low, with centroids as low as ∼150 m. However, the enhanced vertical dispersion in the downdraft regime plays a critical compensatory role. These plumes occupy a much deeper vertical column, with a vertical extent reaching up to ∼250 m (Fig. 8a). This expanded vertical geometry ensures that even when the plume center of mass is below the flight level, the upper parts of the plume likely intersect the sampling height. Furthermore, this structural characteristic persists further downstream, as evidenced by the consistent spread statistics at y=3 and y=4 km (Fig. 8b, c). Consequently, despite the substantial variability in initial vertical trajectories, the seeding signature remains robustly detectable, as the thermodynamic feedbacks effectively broaden the spatial probability of interception.
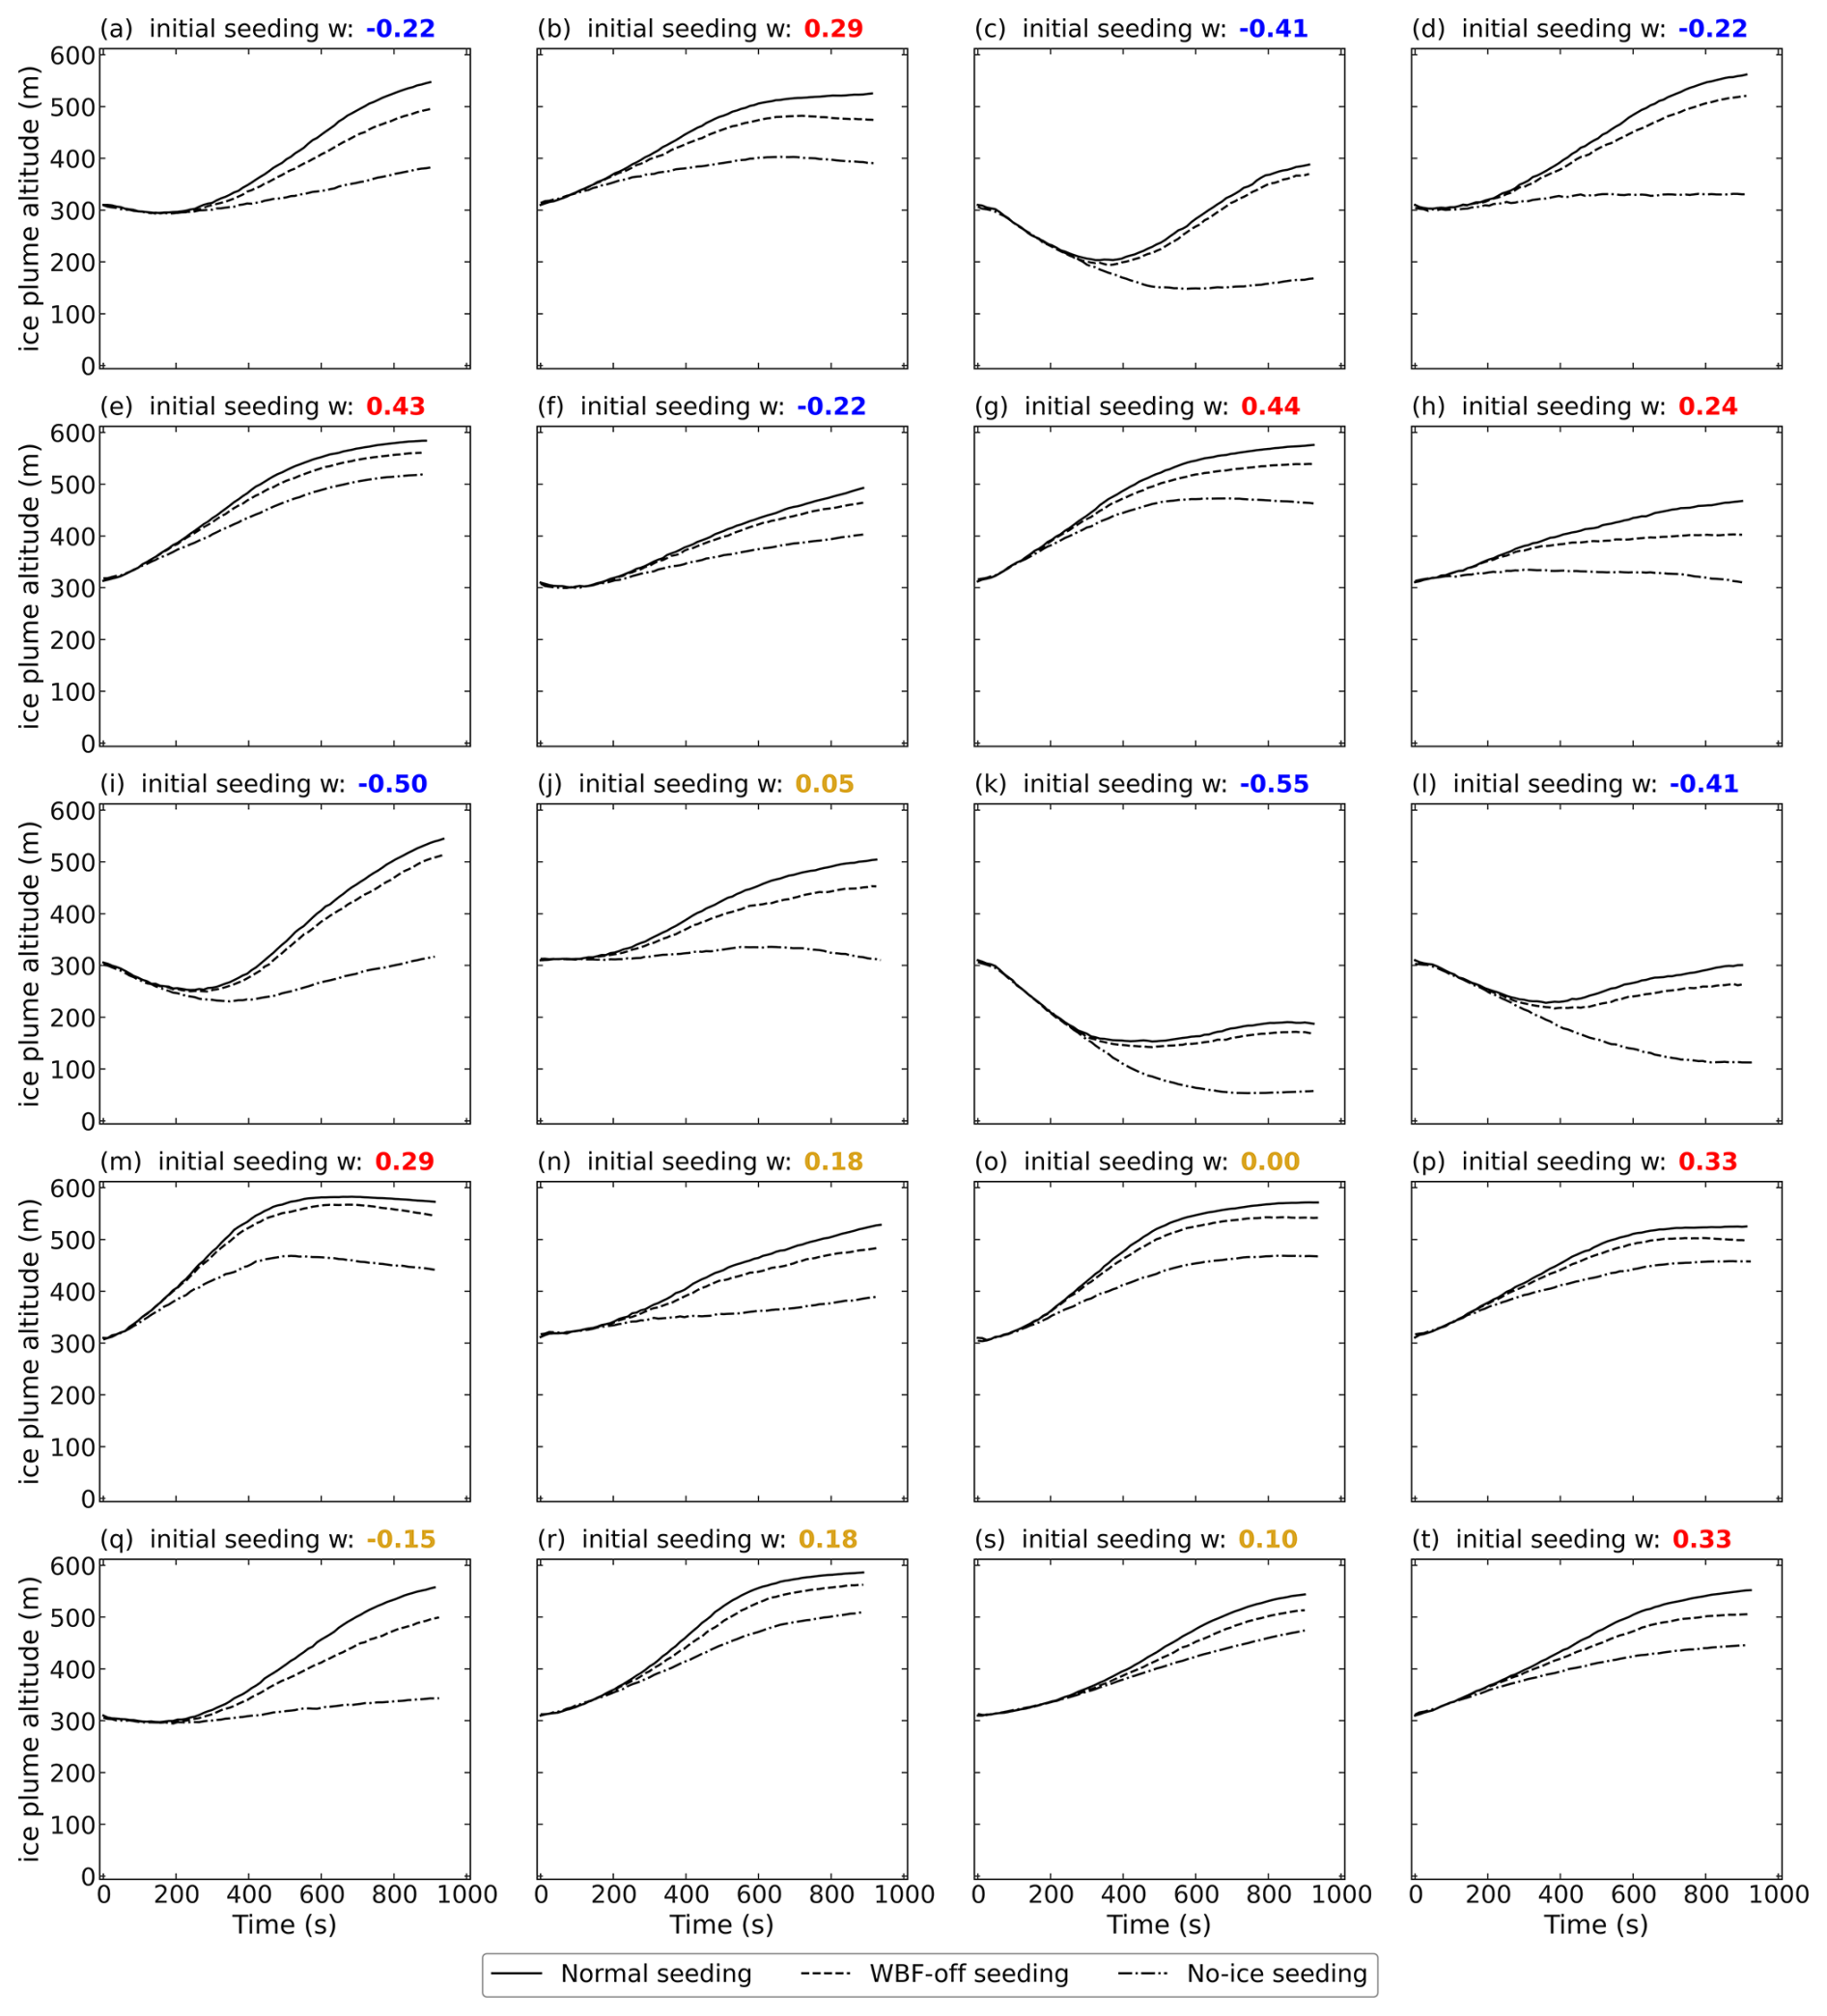
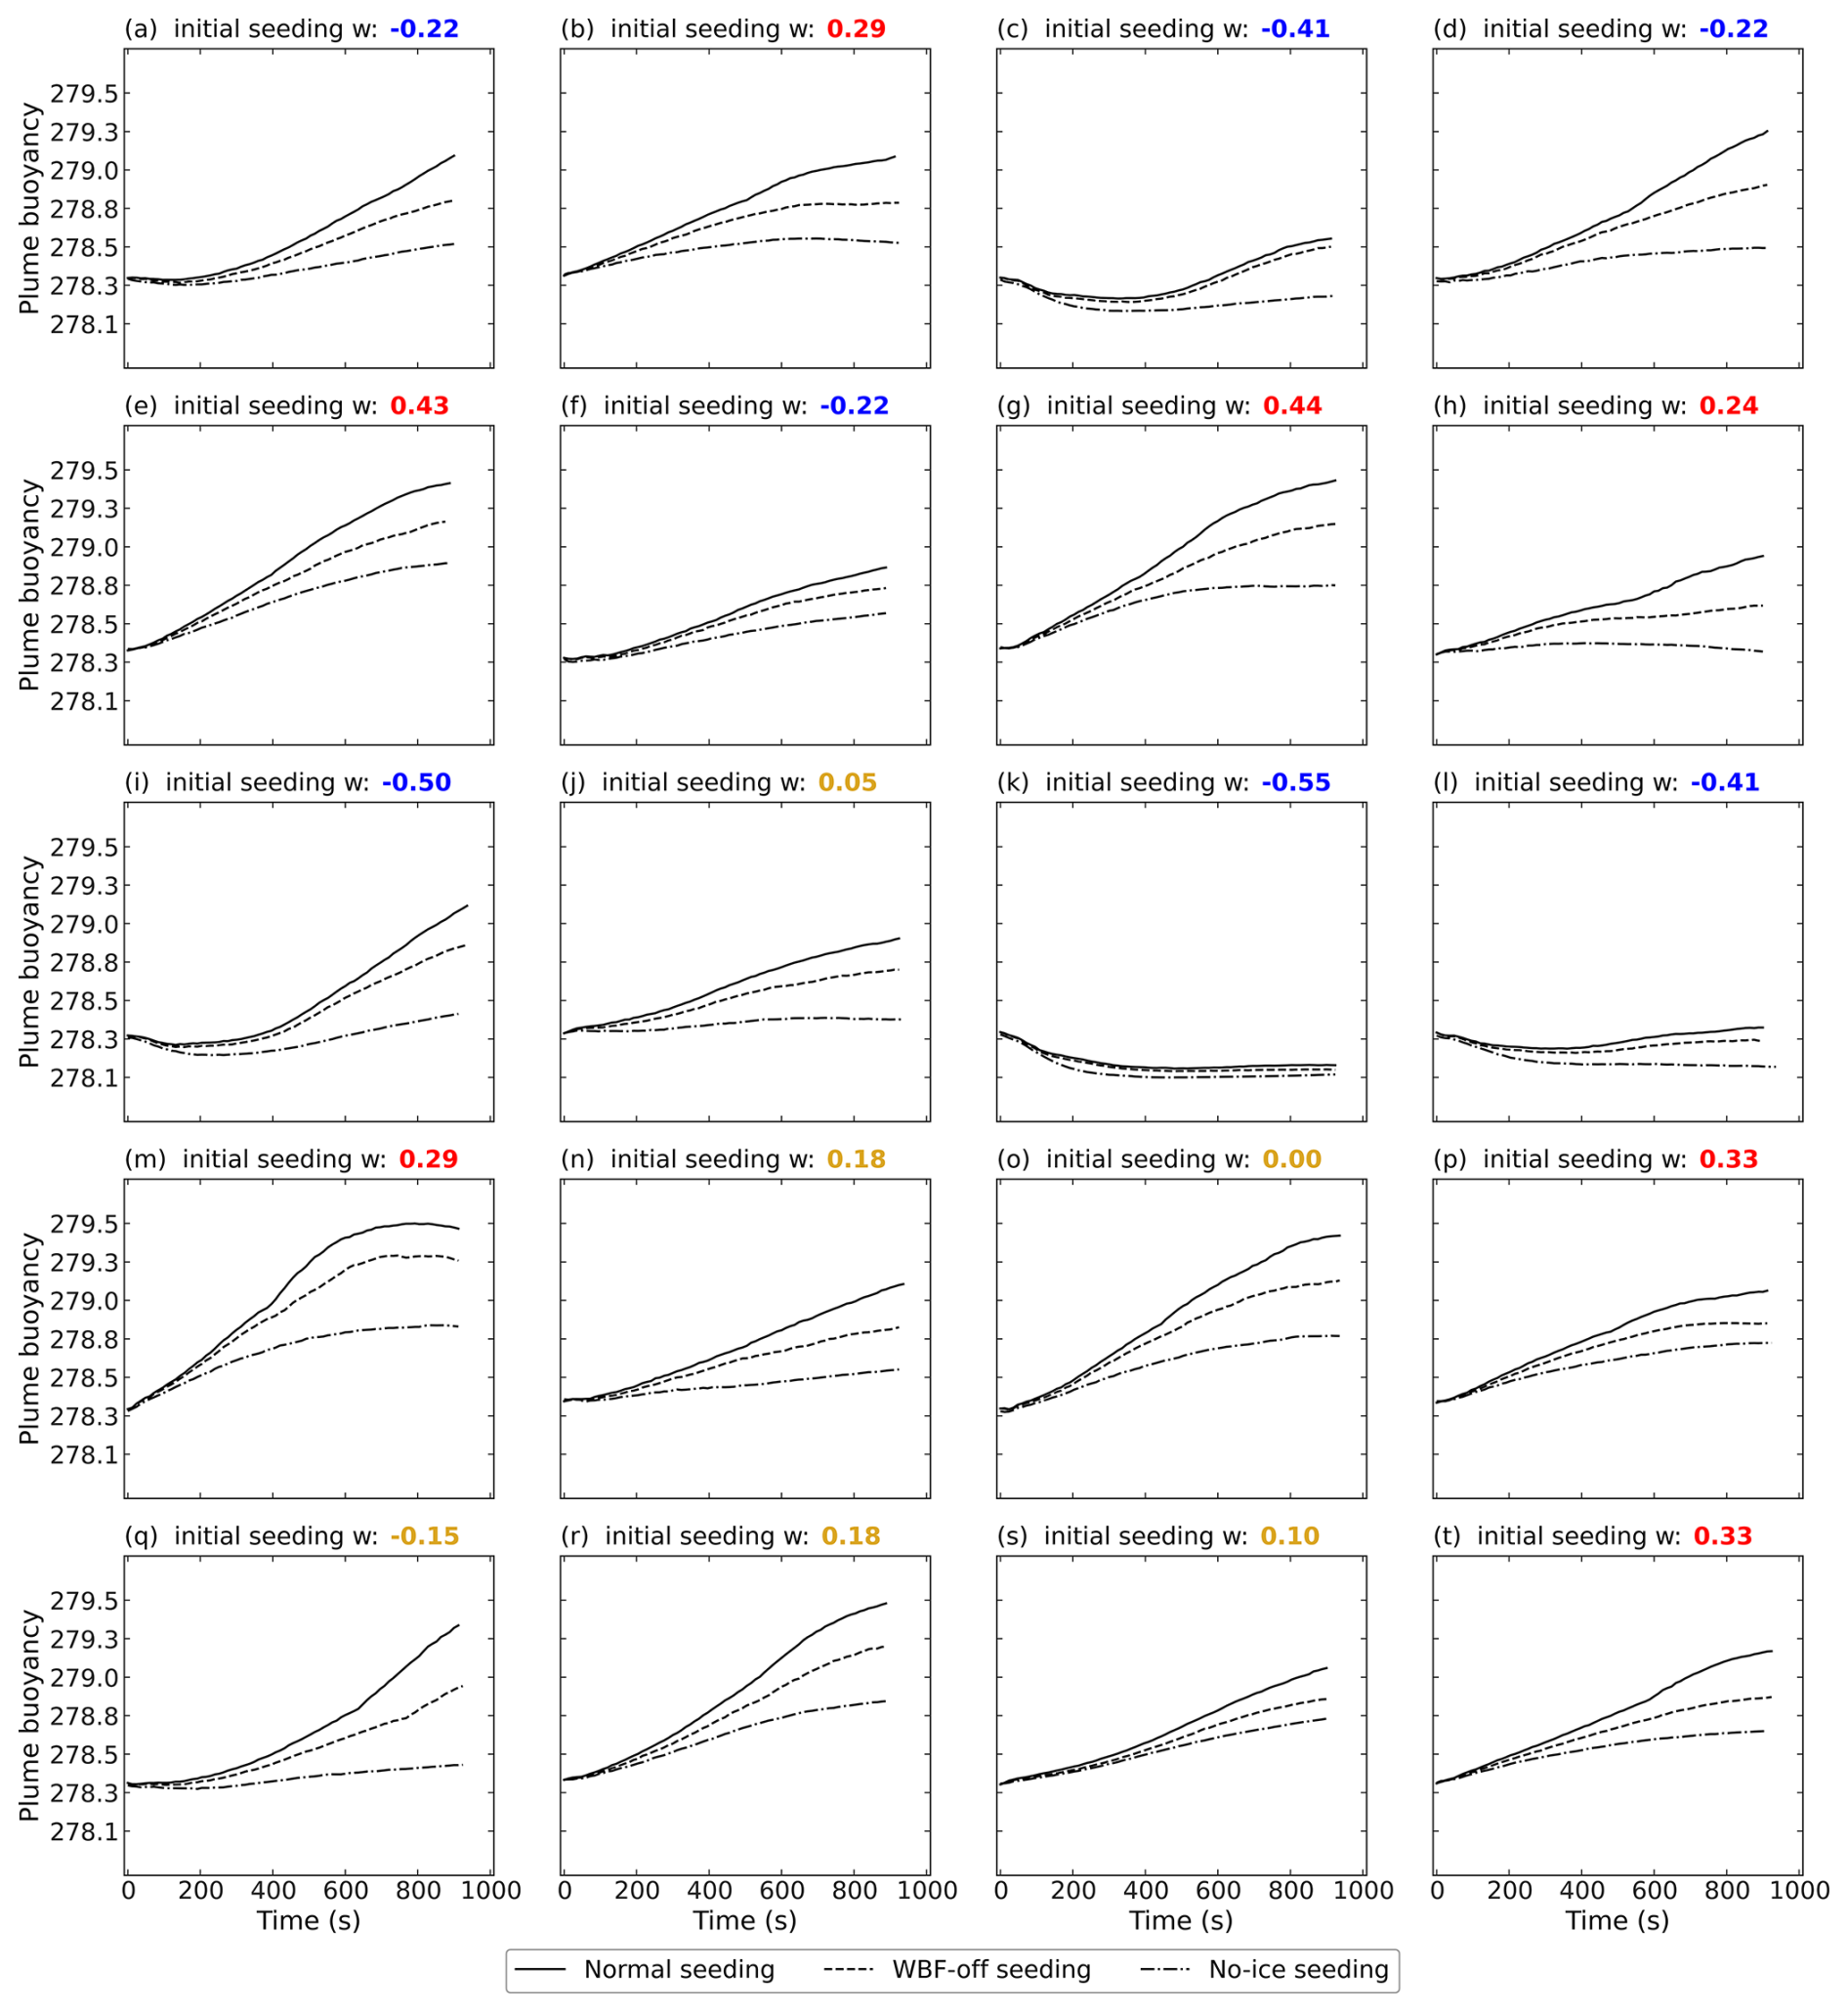
Figure 9Time evolution of the mean altitude of the ice plume in all simulations, with INP injection initiated at 1 min intervals from 0 to 1140 s (19 min). Solid curves represent the Normal configuration; dashed curves show results from simulations in which latent heating associated with the WBF process is disabled by setting the latent heat of sublimation equal to that of evaporation; dash-dotted curves indicate the mean altitude of INPs in simulations without ice nucleation.
4.3 Decomposing thermodynamic drivers: delayed feedback and the role of WBF
To disentangle the distinct thermodynamic drivers of the plume evolution, we compare the ice plume trajectories and their corresponding mean buoyancy across three sensitivity configurations: the Normal, WBF-off, and no-ice seeding cases (Figs. 9 and 12). To provide a more quantitative assessment of the time evolution, we analyze the accumulated altitude differences between these configurations in 100 s intervals (Fig. 11). During the initial stage of evolution (t<300 s), the trajectories remain nearly identical, which is physically explained by the evolution of plume buoyancy shown in Fig. 12. In the first 200 s, the buoyancy across all three ensembles shows minimal deviation, and the accumulated height differences remain close to zero (Fig. 11). This indicates that neither the initial latent heat of freezing nor the WBF growth exerts a significant immediate influence on the plume's altitude. During this period, vertical motion is almost entirely governed by the pre-existing environmental vertical velocity.
A distinct thermodynamic response emerges as the plumes evolve. Between t=200 and t=500 s, the buoyancy of both the Normal and WBF-off cases begins to increase significantly relative to the no-ice-nucleation baseline. As shown in Fig. 11, the height difference between the WBF-off and No-ice cases (green line) rises more rapidly than the difference between the Normal and WBF-off cases (blue line) during this interval. This suggests that the initial buoyancy gain is primarily attributed to the latent heat released during the freezing of cloud droplets and the onset of depositional growth at the condensation rate (Lc). This pulse of energy provides the impulse for the “secondary ascent” observed after 300 s.
The mature stage (t>600 s) is characterized by a secondary divergence in buoyancy, where the Normal plumes (solid lines in Fig. 12) exhibit a consistently higher rate of buoyancy increase compared to the WBF-off (Ls=Lc) plumes (dashed lines). Also, the accumulated height difference between the Normal and WBF-off cases (blue line in Fig. 11) shows a steady, non-linear increase over time. These two divergences represent the combined thermodynamic contribution of the WBF process and the enhanced depositional growth driven by adiabatic cooling. By extracting the latent heat of freezing (Lf) during the transition from both liquid and vapor phases to ice, these processes act as a persistent “internal engine” that sustains the plume's upward momentum.
This late-stage effect is quantified in Fig. 10 by calculating the ratio RWBF:
The results show that the excess latent heat accounts for approximately 25 % to 30 % of the total seeding-induced altitude gain. This stabilization in the averaged ratio is kinematically constrained by the shallow cloud layer in our numerical setup, as many plumes reach the cloud top after t>600 s. In individual cases where the plume remains within the cloud, the relative importance of the WBF process continues to increase over time. This ∼ 30 % contribution stems from two sources: (1) The complete elimination of the net latent heat gain from the WBF process (where droplet evaporation and ice growth now yield zero net energy change); (2) The reduction in latent heat released during depositional growth, as the vapor-to-ice transition is restricted to the lower condensation rate (Lc) instead of the sublimation rate (Ls).
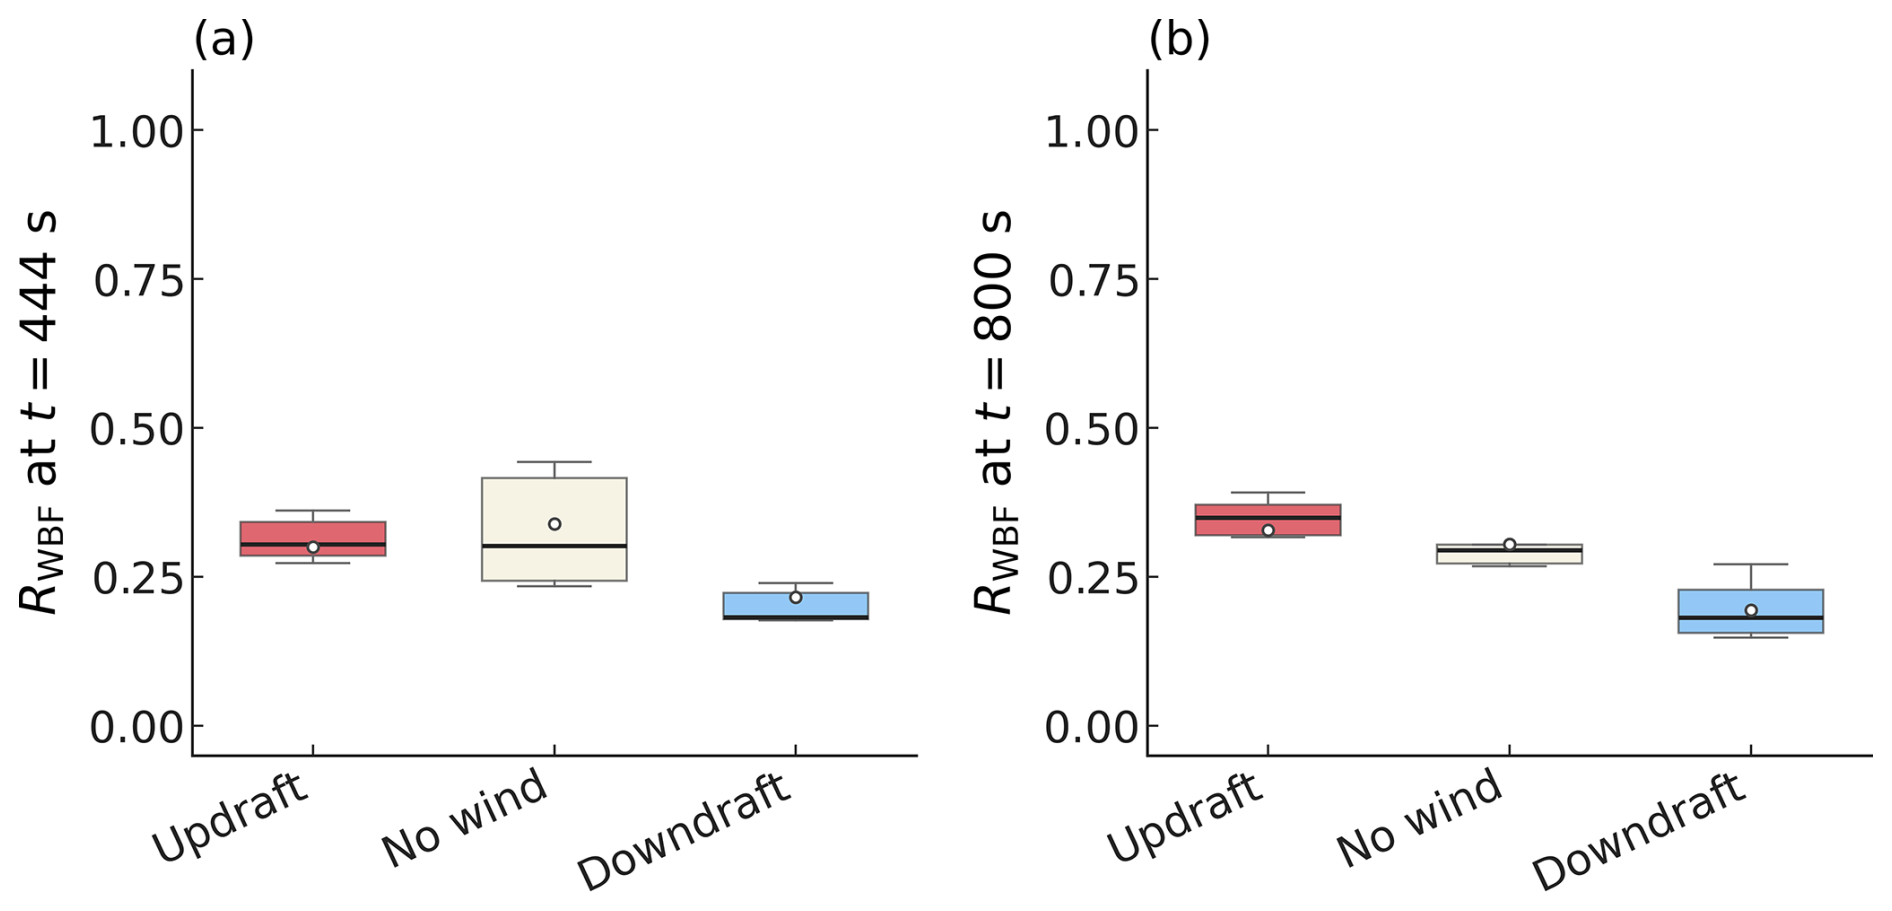
Figure 10The ratio of the mean-altitude difference between the Normal and WBF-off simulations to that between the Normal and No-ice seeding simulations at (a) 444 and (b) 800 s. Here, RWBF is define in Eq. (2).
While the majority of the altitude gain (∼ 70 %) is driven by the initial freezing and the “baseline” latent heat of deposition (calculated at Lc), the divergence between the Normal and WBF-off plumes after t>600 s (Fig. 9) widens over time. This trend suggests a potential hierarchical partitioning in the thermodynamic drivers. We hypothesize that in the early stages of ice crystal growth, the buoyancy is primarily sustained by the rapid relaxation of ambient water vapor toward ice saturation – a process that occurs even in the reduced-heating case (Ls=Lc), despite lower energy efficiency. As the ice crystals grow larger and their total surface area increases, the relative importance of the WBF process (which relies on the liquid water reservoir) intensifies, acting as a secondary sustaining engine. Thus, while the ice-specific feedbacks appear secondary in the timeframe analyzed here, they may play a progressively dominant role in the long-term vertical transport and persistence of the seeded ice plume.
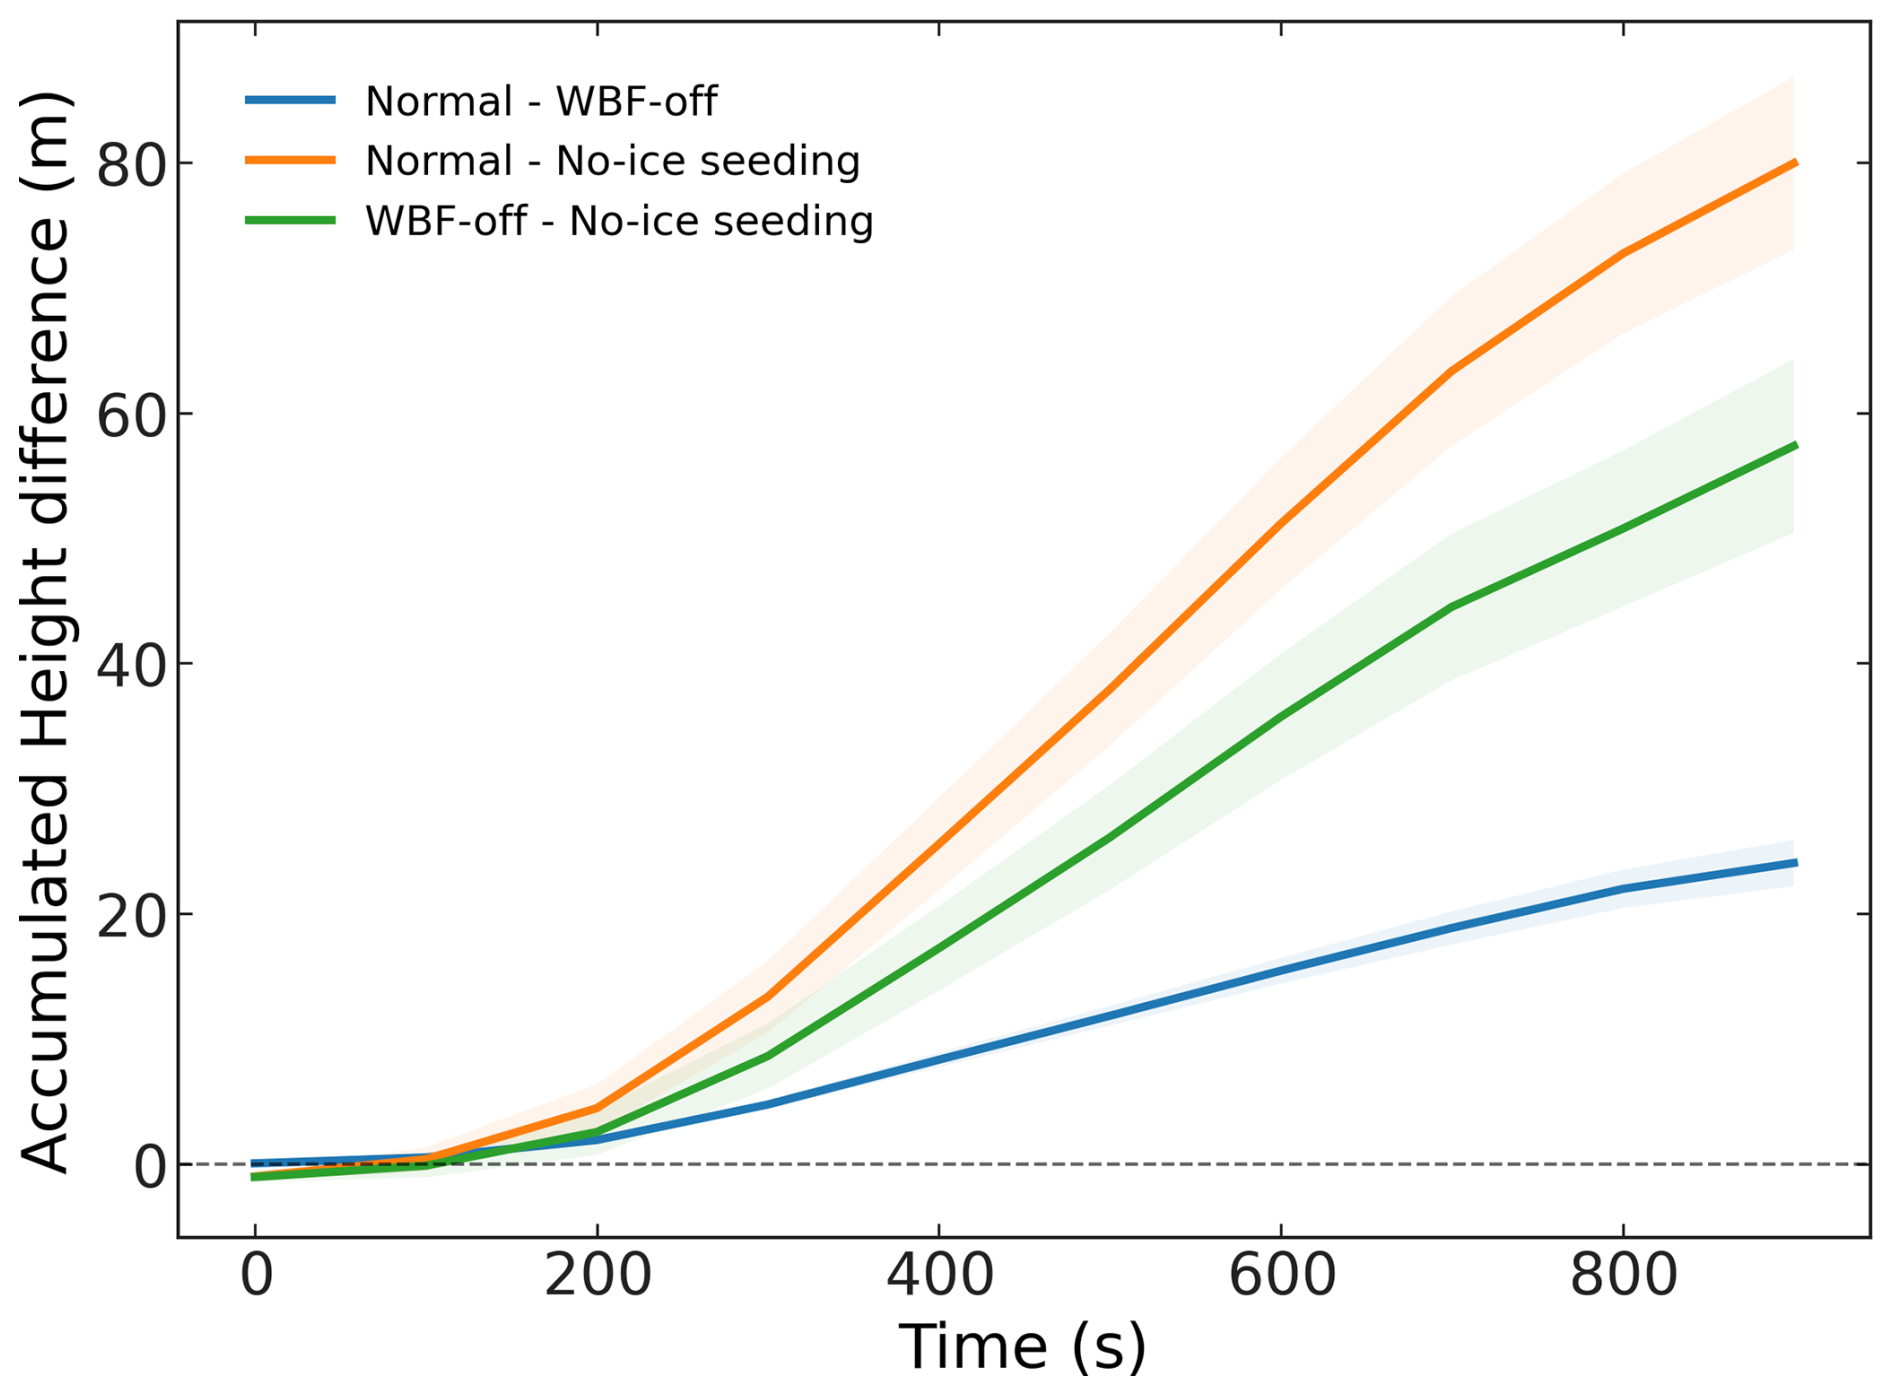
Figure 11Time evolution of the accumulated plume-height differences between the three model configurations: Normal, WBF-off, and No-ice seeding. The height difference is calculated as the difference in mean plume altitude between two configurations within 100 s time intervals and averaged over all trajectories. Positive values indicate that the first configuration exhibits a higher plume altitude than the second configuration. Shaded regions represent the standard error of the mean across trajectories.
4.4 Microphysical evolution of the ice plume
The properties of the trajectories discussed in Sect. 4.2 influence the microphysical evolution of the seeded plume. Figure 13 presents the temporal evolution of the bulk ice properties. ICNC exhibits a rapid, monotonic decay across all simulations (Fig. 13a), driven primarily by turbulent dispersion and dilution rather than aggregation or sedimentation loss. While the decay rates are generally comparable, the downdraft-seeded plumes (blue lines) display a slightly more pronounced reduction in ICNC between t=100 and 400 s compared to updraft and no-wind cases. This aligns with the findings in Fig. 8, where downdraft plumes undergo greater vertical expansion, leading to stronger volumetric dilution. However, by t=800 s, ICNC values across all regimes converge, suggesting that dispersion eventually homogenizes the number density regardless of the initial perturbation.
In contrast to the convergence of number concentration, the evolution of ice particle size and mass shows significant divergence based on the vertical wind regime. The mean ice diameter (Dice, Fig. 13b) increases continuously due to vapor deposition. Plumes in updrafts develop the largest crystals, followed by no-wind and downdraft cases. This stratification is even more distinct in the Ice Water Content (IWC, Fig. 13c). The updraft plumes, which are lofted rapidly into the supersaturated upper cloud regions, experience optimal growth conditions, resulting in the highest IWC. Conversely, downdraft plumes, which initially subside towards the cloud base or into sub-saturated air, experience suppressed growth rates, yielding significantly lower ice mass despite having similar number concentrations.
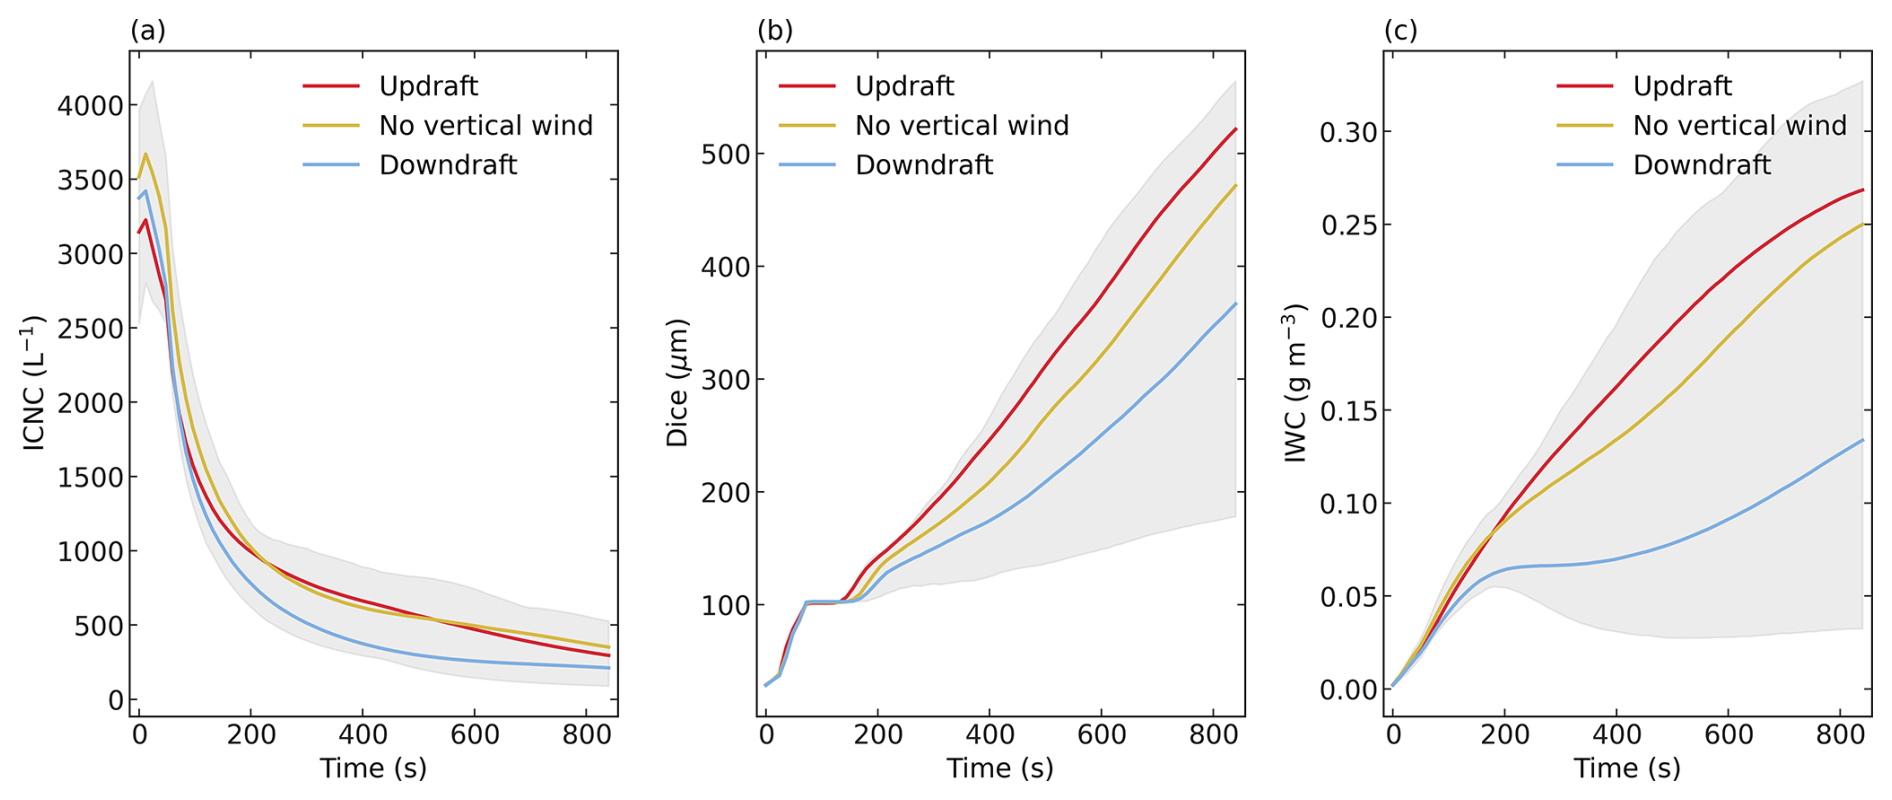
Figure 13Temporal evolution of mean ice microphysical properties averaged within the plume. (a) Ice Crystal Number Concentration (ICNC), showing dilution due to dispersion. (b) Mean ice diameter (Dice). (c) Ice Water Content (IWC). Shaded areas represent the standard deviation for all wind regimes.
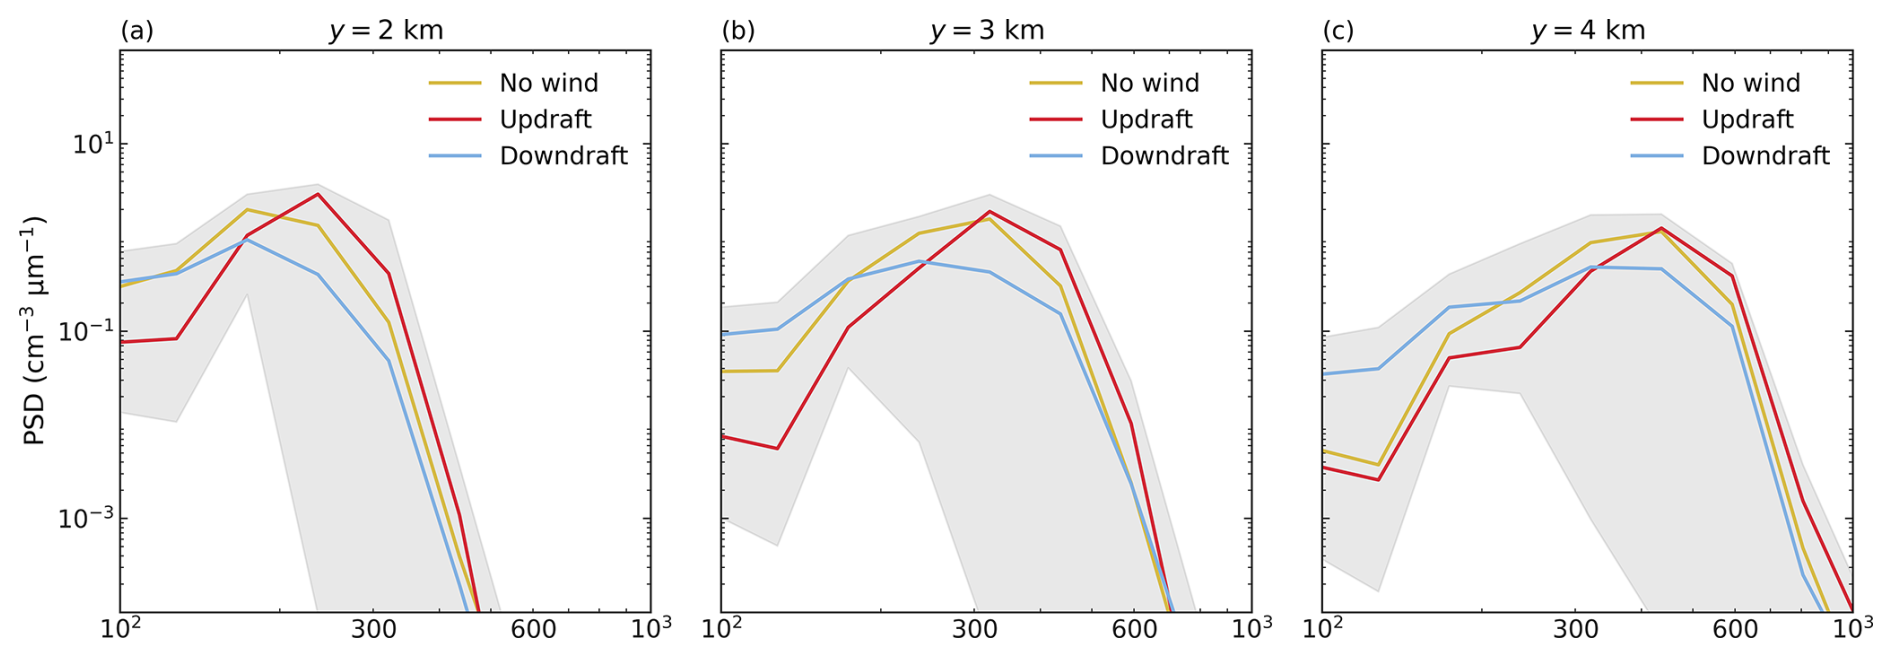
Figure 14Evolution of Ice Particle Size Distributions (PSD) sampled at downstream distances of (a) y=2, (b) y=3, and (c) y=4 km. Shaded areas are as in Fig. 13.
The evolution of the size distribution of the ice crystals confirms that while the growth rate varies, the growth mode remains consistent. Figure 14 displays the PSD at downstream distances of and 4 km. Across all wind conditions, the PSDs exhibit a coherent rightward shift (towards larger diameters) over time. The PSD in the downdraft regime exhibits a broader (i.e., flatter) shape than in the other two regimes. This can be attributed to the larger vertical extent of the ice plume, which exposes ice particles to varying temperatures and, consequently, different diffusional growth rates at different altitudes. In addition, the initial downward trajectory exposes the ice particles to an environment with lower ice supersaturation, and part of the ice plume even descends below the cloud layer (see Appendix A). As a result, the number concentration of small particles (diameter <200 µm) remains relatively high, even after the ice plume has traveled 4 km.
The structural similarity of the PSDs in the no-wind and updraft regimes suggests that the seeding mechanism primarily determines the initial spectral characteristics, whereas the environmental updraft velocity mainly modulates the rate of spectral shift rather than altering the fundamental shape of the distribution. This is likely because, in both regimes, the ice plume follows a similar trajectory toward the cloud top, with the key difference being that the onset of upward motion occurs earlier in the updraft regime.
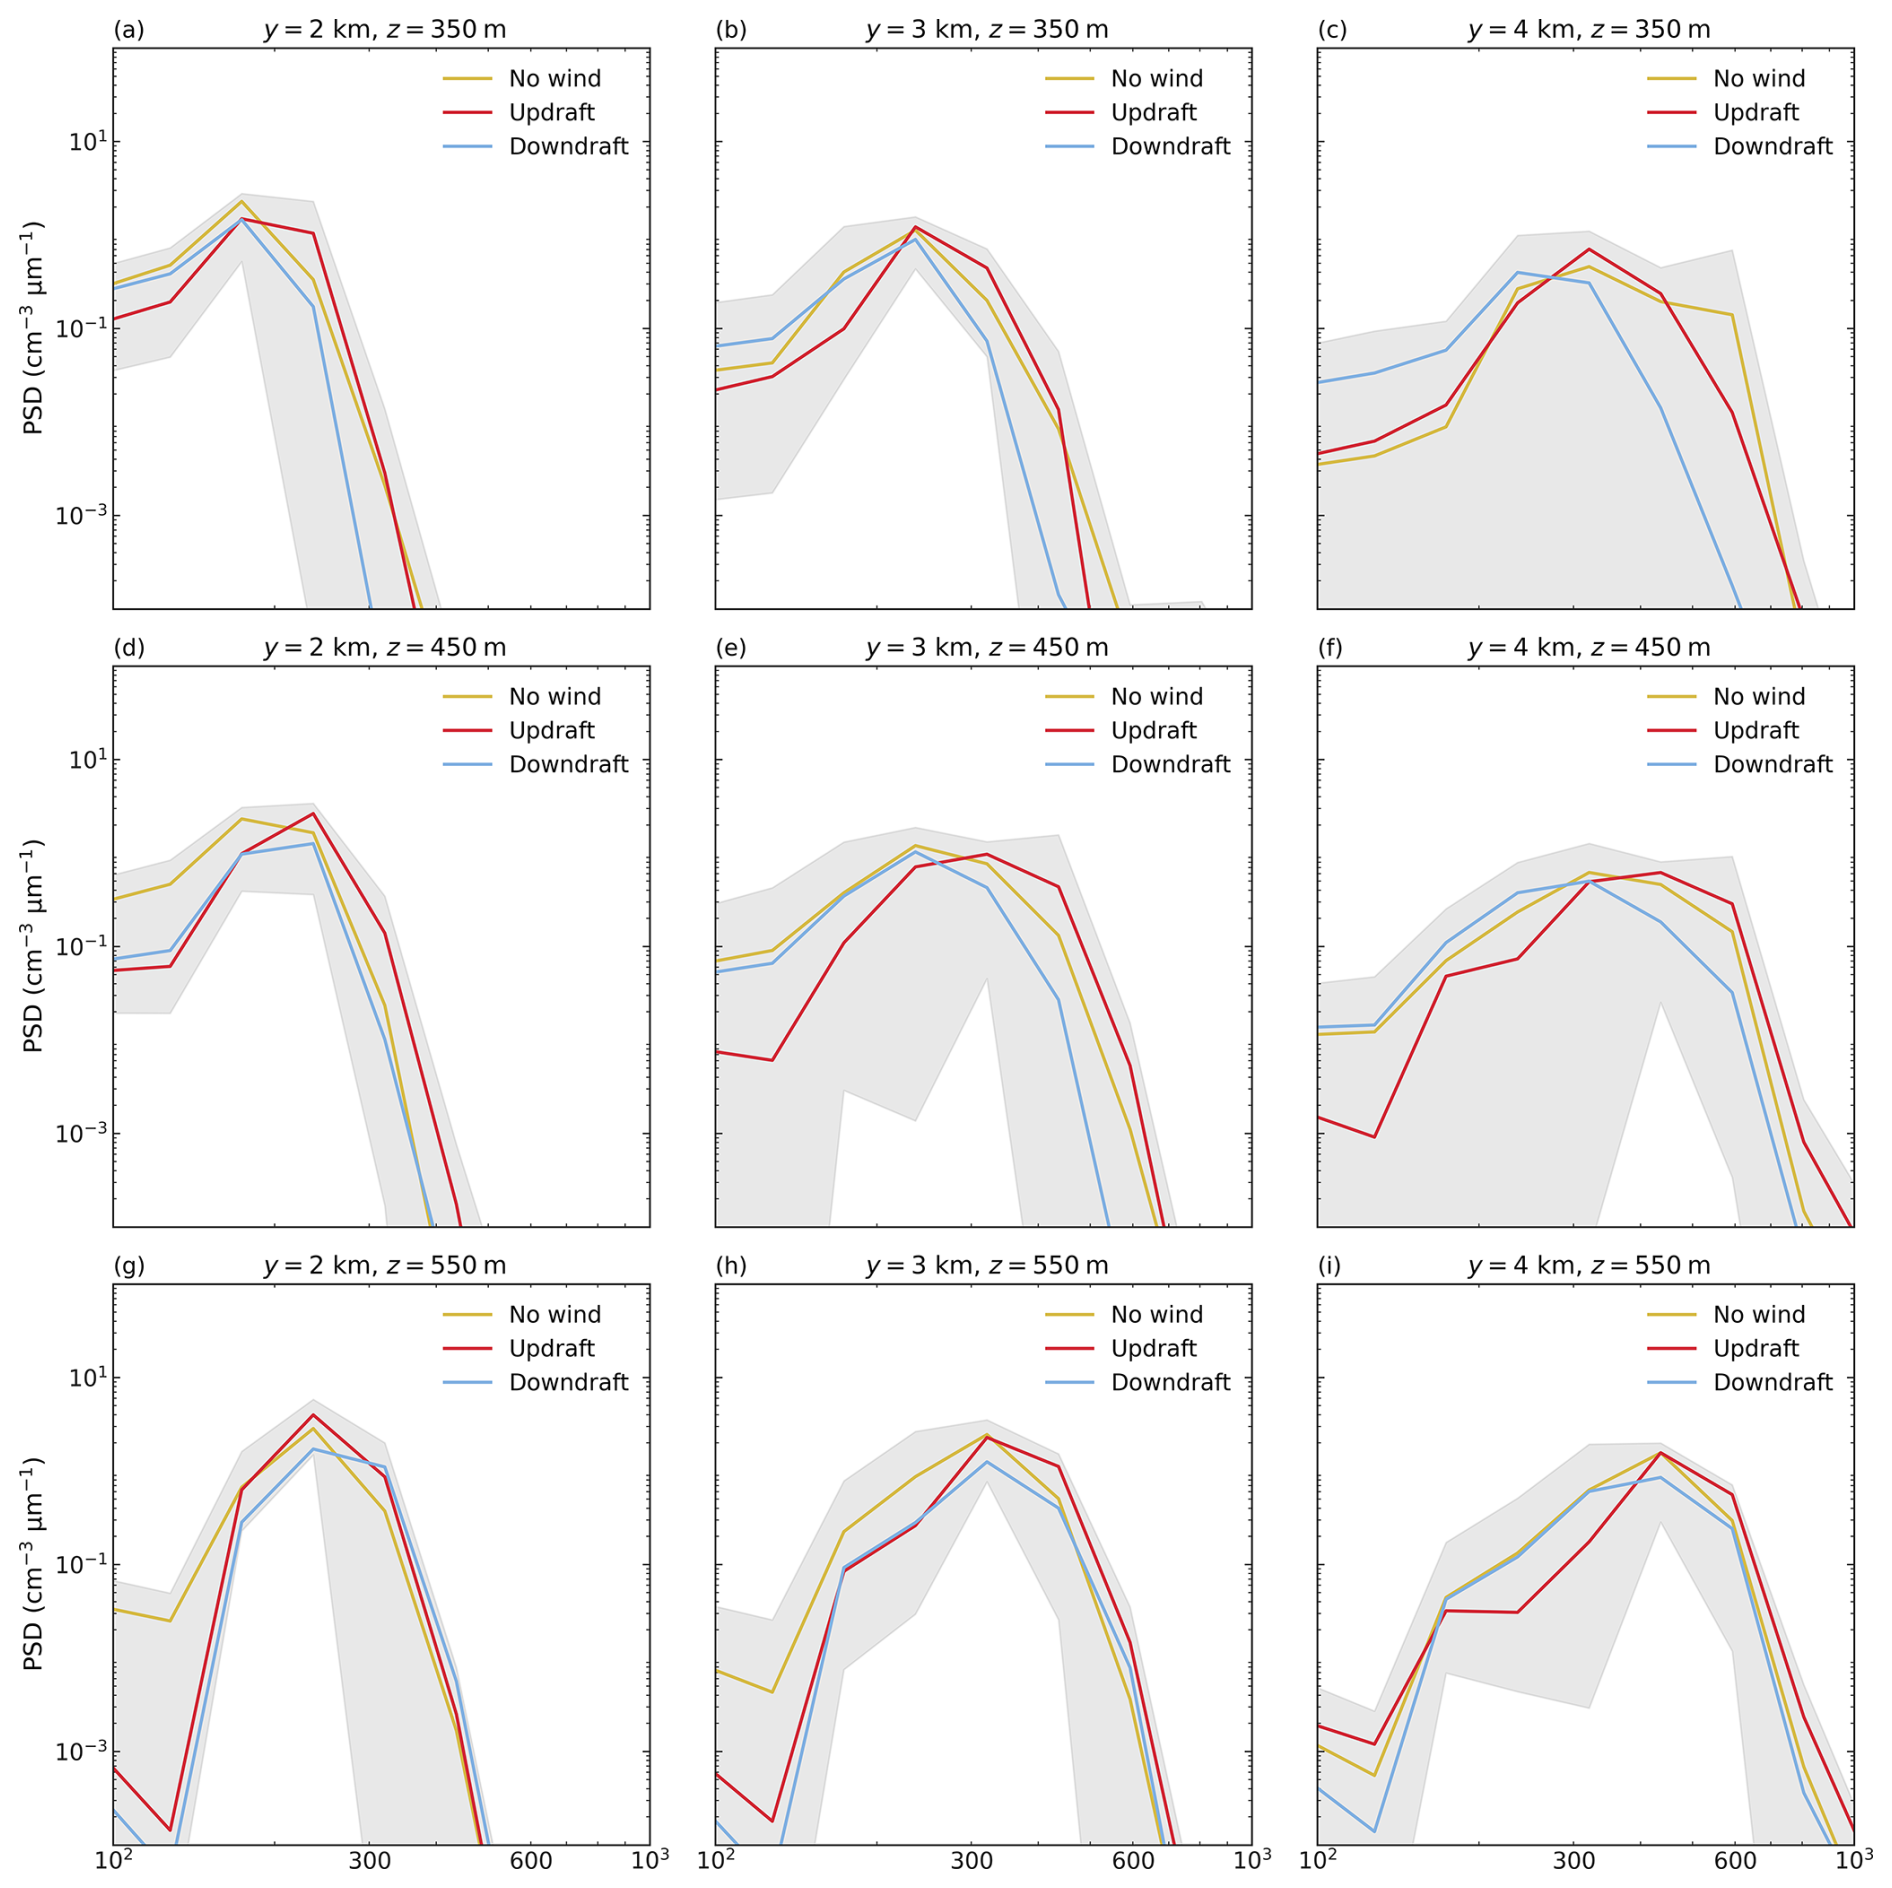
Figure 15Same as Fig. 14, except that the PSD is shown at fixed altitudes of 350 (a–c), 450 (d–f), and 550 m (g–i).
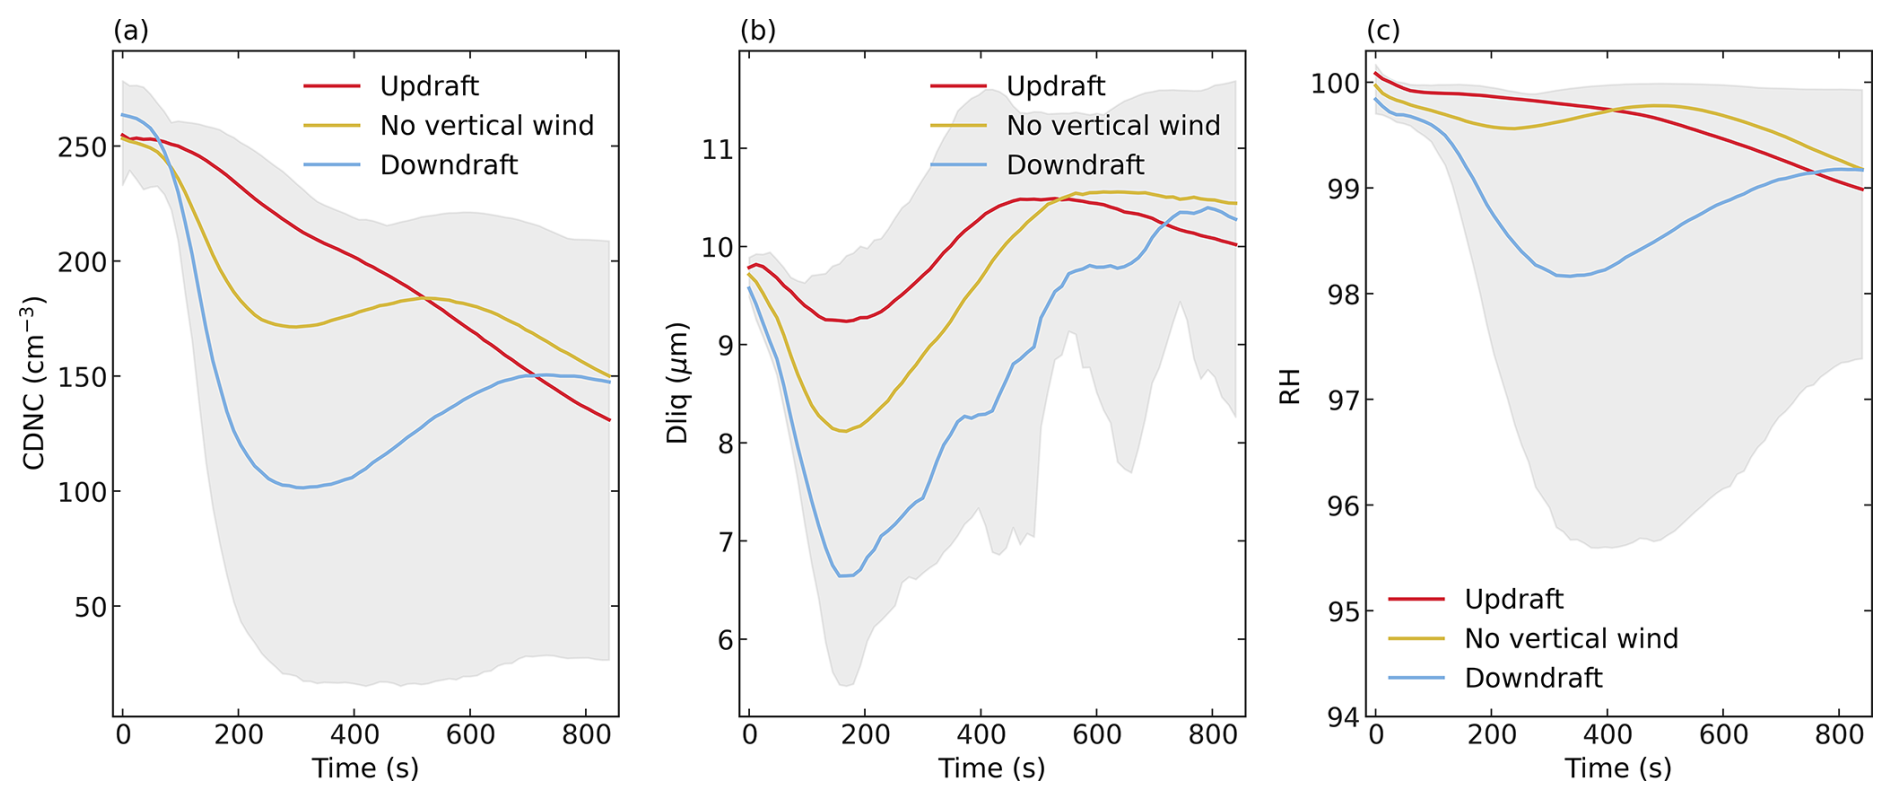
Figure 16Temporal response of the liquid phase within the ice plume. (a) Cloud Droplet Number Concentration (CDNC). (b) Mean liquid droplet diameter (Dliq). (c) Relative Humidity (RH) with respect to water. Shaded areas are as in Fig. 13.
The PSDs across the three regimes become increasingly similar at the same altitude in the simulations as the altitude increases (Fig. 15). This relative resilience of the PSD shape likely stems from the horizontally homogeneous quasi-uniform supersaturation environment within the liquid-dominated cloud layer, where ice crystals grow under similar vapor pressure deficits relative to water saturation regardless of their vertical trajectory. Furthermore, sedimentation does not yet play a significant role.
The growth of ice occurs at the expense of the liquid phase via the WBF process. This interaction is evident in Fig. 16, where CDNC decreases as the plume evolves. An anomaly is observed in the downdraft and no-wind simulations around t≈200 s: both CDNC (Fig. 16a) and mean liquid diameter (Dliq, Fig. 16b) exhibit a sharp minimum, coinciding with a drop in Relative Humidity (RH) (Fig. 16c). This “dip” corresponds to the period when subsiding plumes approach or penetrate cloud base, encountering drier air and causing partial evaporation or rapid glaciation. As the secondary lofting mechanism (driven by latent heat) takes over after t>300 s, the plumes re-ascend into the mixed-phase layer, allowing RH and liquid properties to stabilize. This highlights that seeding into downdrafts carries a risk of transient sublimation, although the plume ultimately recovers.
In this study, we investigated the dynamical and microphysical life cycle of glaciogenic ice plumes in supercooled stratiform clouds using the detailed bin microphysics model SCALE-AMPS. By constraining the simulations with in situ observations from the CLOUDLAB campaign, we successfully reproduced key plume characteristics – including ice number concentration, liquid water depletion, and particle size distributions – thereby establishing a robust framework for isolating the impact of environmental vertical wind conditions on seeding efficacy.
Our sensitivity analysis reveals that the evolution of a seeded ice plume is not merely a passive response to the initial advective field but is fundamentally shaped by latent heat release. The key findings are summarized as follows:
-
Thermodynamic decoupling and self-lofting: While the initial trajectory of the ice plume is kinematically governed by the vertical velocity at the injection moment, a decisive transition occurs after approximately 300–500 s. Regardless of whether the plume is seeded into an updraft or a downdraft, it eventually exhibits a mostly coherent net ascent. We attribute this universal lofting to the buoyancy generated by latent heat release from vapor deposition, which overcomes initial subsidence.
-
Evolution of the WBF Contribution: The relative importance of the WBF process – characterized by the net latent heat gain from the liquid-to-ice transition – increases over time. While the ensemble-averaged additional latent heat release specifically attributed to the WBF mechanism (Ls−Lc) stabilizes at approximately 25 %–30 % of the altitude gain after the first 15 min, this stabilization is primarily a consequence of the limited vertical extent of the simulated cloud layer, which kinematically constrains further plume ascent. In specific cases where the plume has not yet reached the cloud upper boundary, the relative contribution of the WBF mechanism continues to increase after t>600 s. We hypothesize a hierarchical growth preference: ice crystals first rapidly deplete the ambient vapor supersaturation (the primary early-stage driver) until the environment approaches ice saturation (ei≈1), followed by a sustained growth phase increasingly supported by the evaporation of liquid droplets (the WBF process). This suggests that the WBF mechanism may become more important in the later stages of the plume's evolution as the available vapor reservoir is exhausted.
-
Vertical dispersion and detectability trade-off: The interaction between this induced ascent and the cloud-top inversion creates a trade-off. Plumes in updrafts ascend rapidly but are terminated by the inversion layer (“ceiling effect”). Conversely, plumes in downdrafts traverse the boundary layer more slowly, resulting in a larger vertical dispersion (up to ∼250 m spread). Crucially, this enhanced vertical dispersion compensates for the lower mean altitude of downdraft plumes, ensuring that the seeding signature remains geometrically detectable by downstream in situ sampling.
-
Microphysical resilience and transient desiccation: The size of the ice crystals increases consistently, and the size distribution is similar across all regimes. However, the persistence of the liquid phase is sensitive to the trajectory. Downdraft-seeded plumes exhibit a transient “dip” in liquid water content and relative humidity around t≈200 s as they approach the drier air below cloud base. Despite this temporary desiccation, the subsequent latent-heat-driven re-ascent allows the plume to recover and remain within the mixed-phase regime.
These findings have significant implications for both observational strategies and numerical modeling of precipitation enhancement. First, the identification of the “self-lofting” mechanism suggests that glaciogenic seeding is more dynamically robust than previously assumed; the success of seeding is not strictly contingent on targeting pre-existing updrafts, as the plume is capable of generating its own buoyancy to sustain its advection time in the mixed-phase layer. Second, the structural analysis confirms that Eulerian observations (e.g., fixed ground sites) are likely to capture the seeding signal, even in downdraft conditions, due to the compensatory effect of enhanced vertical dispersion.
Future work should expand this analysis to include a wider range of environmental conditions. Specifically, it would be interesting to vary the vertical wind shear profiles, as the strength of the shear directly modulates the boundary layer mixing processes and the lateral spreading of the ice plume. Additionally, sensitivity studies regarding thermodynamic profiles, such as temperature and latent water content (LWC), are warranted. These variables directly govern ice crystal habit regimes and riming efficiency, thereby influencing the magnitude of latent heat release.
Furthermore, the updrafts and downdrafts in this idealized framework are generated internally by boundary-layer mixing and therefore have characteristic horizontal scales of approximately 𝒪(100) m. In realistic atmospheric conditions, however, vertical motions in stratiform clouds also include larger-scale components, such as those associated with orographically forced gravity waves and mesoscale circulations. Incorporating vertical motions across a wider range of spatial scales would allow for a more comprehensive assessment of their interactions with smaller-scale motions and the associated microphysical – thermodynamic feedbacks.
Finally, since this study relied on a specific bin microphysics scheme, inter-comparison with bulk microphysics schemes would be valuable to determine whether standard parameterizations can adequately resolve the latent heat feedbacks that drive the secondary plume ascent. Ultimately, recognizing the active thermodynamic role of seeded ice plumes is essential for refining the representation of aerosol-cloud interactions for weather modification simulations.
The data (https://doi.org/10.5281/zenodo.20744736, Ong and Zhang, 2026), code and models (https://github.com/OngChia/scale_amps/tree/cloudlab, last access: 19 June 2026), are available via the links provided in the references.
Three-dimensional animations of the simulated ice and liquid mixing ratios, corresponding to INP injection initiated at 6 min (strongest updraft), 9 min (reference case), and 10 min (strongest downdraft), are available at https://doi.org/10.5281/zenodo.19731239 (Ong, 2026).
U.L. and J.H. conceived the CLOUDLAB project and secured funding. C.O. performed the model simulations, while H.Z. analyzed the observational data from the seeding experiments. H.Z. and C.O. conducted the scientific analysis together. Regarding visualization, C.O. provided the initial data processing code, and H.Z. performed the post-processing and prepared the figures. H.Z. and C.O. wrote the original draft; specifically, C.O. drafted the sections on numerical setup and model validation, while H.Z. wrote the rest of the manuscript. U.L., J.H., and A.D. supervised the study and provided scientific guidance. All authors contributed to the review and editing of the manuscript and approved the final version.
The contact author has declared that none of the authors has any competing interests.
Publisher's note: Copernicus Publications remains neutral with regard to jurisdictional claims made in the text, published maps, institutional affiliations, or any other geographical representation in this paper. The authors bear the ultimate responsibility for providing appropriate place names. Views expressed in the text are those of the authors and do not necessarily reflect the views of the publisher.
We acknowledge financial support from the European Research Council (ERC) under the European Union's Horizon 2020 research and innovation program (grant no. 101021272), as well as from the EXCLAIM project funded by ETH Zurich. We extend our sincere gratitude to our colleagues at ETH Zurich: Nadja Omanovic for developing the frozen fraction function, and Christopher Fuchs, Fabiola Ramelli, Anna J. Miller, Nadja Omanovic, and Robert Spirig for their assistance with the seeding experiments and in situ measurements. From TROPOS, we thank Patric Seifert for providing the vertically pointing and scanning Doppler cloud radars and Kevin Ohneiser for maintaining the instrumentation. We are grateful to the two reviewers for their constructive comments, which have helped improve the quality of our work, particularly through their valuable insights into the role of latent heat feedback in the ice plume. Numerical simulations were performed on the Euler cluster operated by the High Performance Computing group at ETH Zurich. Data analysis and storage resources were provided by the Swiss National Supercomputing Centre (CSCS) in Lugano under project cwd01 (AD).
This research has been supported by the HORIZON EUROPE European Research Council (grant no. 101021272).
This paper was edited by Yuan Wang and reviewed by Wojciech W. Grabowski and one anonymous referee.
Abade, G. C. and Albuquerque, D. G.: Persistent mixed-phase states in adiabatic cloud parcels under idealised conditions, Q. J. Roy. Meteor. Soc., 150, 3450–3474, https://doi.org/10.1002/qj.4775, 2024. a
Ansmann, A., Tesche, M., Seifert, P., Althausen, D., Engelmann, R., Fruntke, J., Wandinger, U., Mattis, I., and Müller, D.: Evolution of the ice phase in tropical altocumulus: SAMUM lidar observations over Cape Verde, J. Geophys. Res.-Atmos., 114, https://doi.org/10.1029/2008JD011659, 2009. a
Bühl, J., Seifert, P., Engelmann, R., and Ansmann, A.: Impact of vertical air motions on ice formation rate in mixed-phase cloud layers, npj Climate and Atmospheric Science, 2, https://doi.org/10.1038/s41612-019-0092-6, 2019. a, b
Chen, J.-P. and Lamb, D.: The Theoretical Basis for the Parameterization of Ice Crystal Habits: Growth by Vapor Deposition, J. Atmos. Sci., 51, 1206–1222, https://doi.org/10.1175/1520-0469(1994)051<1206:TTBFTP>2.0.CO;2, 1994. a, b
Friedrich, K., French, J. R., Tessendorf, S. A., Hatt, M., Weeks, C., Rauber, R. M., Geerts, B., Xue, L., Rasmussen, R. M., Blestrud, D. R., et al.: Microphysical characteristics and evolution of seeded orographic clouds, J. Appl. Meteorol. Clim., 60, 909–934, https://doi.org/10.1175/JAMC-D-20-0206.1, 2021. a
Fuchs, C., Ramelli, F., Miller, A. J., Omanovic, N., Spirig, R., Zhang, H., Seifert, P., Ohneiser, K., Lohmann, U., and Henneberger, J.: Quantifying ice crystal growth rates in natural clouds from glaciogenic cloud seeding experiments, Atmos. Chem. Phys., 25, 12177–12196, https://doi.org/10.5194/acp-25-12177-2025, 2025. a, b
Grabowski, W. W. and Abade, G. C.: Broadening of cloud droplet spectra through eddy hopping: Turbulent adiabatic parcel simulations, J. Atmos. Sci., 74, 1485–1493, https://doi.org/10.1175/JAS-D-17-0043.1, 2017. a, b, c
Grabowski, W. W. and Morrison, H.: Reply to “Comments on 'Do ultrafine cloud condensation nuclei invigorate deep convection?”', J. Atmos. Sci., 78, 341–350, https://doi.org/10.1175/JAS-D-20-0218.1, 2021. a
Hashino, T. and Tripoli, G. J.: The Spectral Ice Habit Prediction System (SHIPS). Part I: Model Description and Simulation of the Vapor Deposition Process, J. Atmos. Sci., 64, 2210–2237, https://doi.org/10.1175/JAS3963.1, 2007. a, b, c, d, e
Hashino, T. and Tripoli, G. J.: The Spectral Ice Habit Prediction System (SHIPS). Part II: Simulation of Nucleation and Depositional Growth of Polycrystals, J. Atmos. Sci., 65, 3071–3094, https://doi.org/10.1175/2008JAS2615.1, 2008. a
Hashino, T. and Tripoli, G. J.: The Spectral Ice Habit Prediction System (SHIPS). Part III: Description of the Ice Particle Model and the Habit-Dependent Aggregation Model, J. Atmos. Sci., 68, 1125–1141, https://doi.org/10.1175/2011JAS3666.1, 2011. a
Henneberger, J., Ramelli, F., Spirig, R., Omanovic, N., Miller, A. J., Fuchs, C., Zhang, H., Bühl, J., Hervo, M., Kanji, Z. A., Ohneiser, K., Radenz, M., Rösch, M., Seifert, P., and Lohmann, U.: Seeding of supercooled low stratus clouds with a UAV to study microphysical ice processes: an introduction to the CLOUDLAB project, B. Am. Meteor. Soc., 104, E1962–E1979, https://doi.org/10.1175/BAMS-D-22-0178.1, 2023. a, b
Korolev, A. and Field, P. R.: The effect of dynamics on mixed-phase clouds: Theoretical considerations, J. Atmos. Sci., 65, 66–86, https://doi.org/10.1175/2007JAS2355.1, 2008. a
Korolev, A., McFarquhar, G., Field, P. R., Franklin, C., Lawson, P., Wang, Z., Williams, E., Abel, S. J., Axisa, D., Borrmann, S., Crosier, J., Fugal, J., Krämer, M., Lohmann, U., Schlenczek, O., Schnaiter, M., and Wendisch, M.: Mixed-phase clouds: Progress and challenges, Meteorol. Monogr., 58, 5–1, https://doi.org/10.1175/AMSMONOGRAPHS-D-17-0001.1, 2017. a
Korolev, A. V., Isaac, G. A., Cober, S. G., Strapp, J. W., and Hallett, J.: Microphysical characterization of mixed-phase clouds, Q. J. Roy. Meteor. Soc., 129, 39–65, https://doi.org/10.1256/qj.01.204, 2003. a
Lilly, D. K.: On the numerical simulation of buoyant convection, Tellus, 14, 148–172, https://doi.org/10.1111/j.2153-3490.1962.tb00128.x, 1962. a
Miller, A. J., Ramelli, F., Fuchs, C., Omanovic, N., Spirig, R., Zhang, H., Lohmann, U., Kanji, Z. A., and Henneberger, J.: Two new multirotor uncrewed aerial vehicles (UAVs) for glaciogenic cloud seeding and aerosol measurements within the CLOUDLAB project, Atmos. Meas. Tech., 17, 601–625, https://doi.org/10.5194/amt-17-601-2024, 2024. a, b
Miller, A. J., Fuchs, C., Ramelli, F., Zhang, H., Omanovic, N., Spirig, R., Marcolli, C., Kanji, Z. A., Lohmann, U., and Henneberger, J.: Quantified ice-nucleating ability of AgI-containing seeding particles in natural clouds, Atmos. Chem. Phys., 25, 5387–5407, https://doi.org/10.5194/acp-25-5387-2025, 2025. a, b
Morrison, H., De Boer, G., Feingold, G., Harrington, J., Shupe, M., and Sulia, K.: Resilience of persistent Arctic mixed-phase clouds, Nat. Geosci., 5, 11–17, https://doi.org/10.1038/ngeo1332, 2012. a
Nishizawa, S., Yashiro, H., Sato, Y., Miyamoto, Y., and Tomita, H.: Influence of grid aspect ratio on planetary boundary layer turbulence in large-eddy simulations, Geosci. Model Dev., 8, 3393–3419, https://doi.org/10.5194/gmd-8-3393-2015, 2015. a
Omanovic, N., Ferrachat, S., Fuchs, C., Henneberger, J., Miller, A. J., Ohneiser, K., Ramelli, F., Seifert, P., Spirig, R., Zhang, H., and Lohmann, U.: Evaluating the Wegener–Bergeron–Findeisen process in ICON in large-eddy mode with in situ observations from the CLOUDLAB project, Atmos. Chem. Phys., 24, 6825–6844, https://doi.org/10.5194/acp-24-6825-2024, 2024. a
Ong, C. R.: INP seeding simulations by SCALE-AMPS, Zenodo [video], https://doi.org/10.5281/zenodo.19731239, 2026. a
Ong, C. R. and Zhang, H.: Dataset of INP seeding simulations by SCALE-AMPS, Zenodo [data set], https://doi.org/10.5281/zenodo.20744736, 2026. a
Ong, C. R., Koike, M., Hashino, T., and Miura, H.: Modeling Performance of SCALE-AMPS: Simulations of Arctic Mixed-Phase Clouds Observed During SHEBA, J. Adv. Model. Earth Sy., 14, e2021MS002887, https://doi.org/10.1029/2021MS002887, 2022. a, b, c
Pinsky, M. and Khain, A.: Effects of in-cloud nucleation and turbulence on droplet spectrum formation in cumulus clouds, Q. J. Roy. Meteor. Soc., 128, 501–533, https://doi.org/10.1256/003590002321042072, 2002. a
Pruppacher, H. R., Klett, J. D., and Wang, P. K.: Microphysics of clouds and precipitation, Aerosol Sci. Technol., 28, 381–382, https://doi.org/10.1080/02786829808965531, 1998. a
Ramelli, F., Beck, A., Henneberger, J., and Lohmann, U.: Using a holographic imager on a tethered balloon system for microphysical observations of boundary layer clouds, Atmos. Meas. Tech., 13, 925–939, https://doi.org/10.5194/amt-13-925-2020, 2020. a
Ramelli, F., Henneberger, J., Fuchs, C., Miller, A. J., Omanovic, N., Spirig, R., Zhang, H., David, R. O., Ohneiser, K., Seifert, P., and Lohmann, U.: Repurposing weather modification for cloud research showcased by ice crystal growth, P. Natl. Acad. Sci. USA, 3, pgae402, https://doi.org/10.1093/pnasnexus/pgae402, 2024. a, b
Rauber, R. M. and Tokay, A.: An explanation for the existence of supercooled water at the top of cold clouds, J. Atmos. Sci., 48, 1005–1023, https://doi.org/10.1175/1520-0469(1991)048<1005:AEFTEO>2.0.CO;2, 1991. a
Sato, Y., Nishizawa, S., Yashiro, H., Miyamoto, Y., Kajikawa, Y., and Tomita, H.: Impacts of cloud microphysics on trade wind cumulus: which cloud microphysics processes contribute to the diversity in a large eddy simulation?, Prog. Earth Planet. Sci., 2, https://doi.org/10.1186/s40645-015-0053-6, 2015. a
Scherrer, S. C. and Appenzeller, C.: Fog and low stratus over the Swiss Plateau-a climatological study, Int. J. Climatol., 34, 678–686, https://doi.org/10.1002/joc.3714, 2014. a
Sekiguchi, M. and Nakajima, T.: A k-distribution-based radiation code and its computational optimization for an atmospheric general circulation model, J. Quant. Spectrosc. Ra., 109, 2779–2793, https://doi.org/10.1016/j.jqsrt.2008.07.013, 2008. a
Shupe, M. D., Kollias, P., Persson, P. O. G., and McFarquhar, G. M.: Vertical motions in Arctic mixed-phase stratiform clouds, J. Atmos. Sci., 65, 1304–1322, https://doi.org/10.1175/2007JAS2479.1, 2008. a, b
Smagorinsky, J.: General circulation experiments with the primitive equations: I. the basic experiment, Mon. Weather Rev., 91, 99–164, https://doi.org/10.1175/1520-0493(1963)091<0099:GCEWTP>2.3.CO;2, 1963. a
Tessendorf, S. A., French, J. R., Friedrich, K., Geerts, B., Rauber, R. M., Rasmussen, R. M., Xue, L., Ikeda, K., Blestrud, D. R., Kunkel, M. L., Parkinson, S., Snider, J. R., Aikins, J., Faber, S., Majewski, A., Grasmick, C., Bergmaier, P. T., Janiszeski, A., Springer, A., Weeks, C., Serke, D. J., and Bruintjes, R.: A transformational approach to winter orographic weather modification research: The SNOWIE project, B. Am. Meteor. Soc., 100, 71–92, https://doi.org/10.1175/BAMS-D-17-0152.1, 2019. a
Touloupas, G., Lauber, A., Henneberger, J., Beck, A., and Lucchi, A.: A convolutional neural network for classifying cloud particles recorded by imaging probes, Atmos. Meas. Tech., 13, 2219–2239, https://doi.org/10.5194/amt-13-2219-2020, 2020. a
Westbrook, C. and Illingworth, A.: The formation of ice in a long-lived supercooled layer cloud, Q. J. Roy. Meteor. Soc., 139, 2209–2221, https://doi.org/10.1002/qj.2096, 2013. a
Zhang, H., Li, X., Ramelli, F., David, R. O., Pasquier, J., and Henneberger, J.: IceDetectNet: a rotated object detection algorithm for classifying components of aggregated ice crystals with a multi-label classification scheme, Atmos. Meas. Tech., 17, 7109–7128, https://doi.org/10.5194/amt-17-7109-2024, 2024. a
Zhang, H., Ramelli, F., Fuchs, C., Omanovic, N., Miller, A. J., Spirig, R., Wu, Z., Chu, Y., Li, X., Lohmann, U., and Henneberger, J.: Inferring the controlling factors of ice aggregation from targeted cloud seeding experiments, Atmos. Chem. Phys., 26, 1459–1481, https://doi.org/10.5194/acp-26-1459-2026, 2026. a, b, c