the Creative Commons Attribution 4.0 License.
the Creative Commons Attribution 4.0 License.
 | 16 Jun 2026
Measurement report: Validation of multi-satellite remote sensing products and potential source apportionment of BrO and IO in the Arctic using ship-based DOAS
Qijin Zhang
Yikai Li
Haochen Peng
Haoran Liu
Wei Tan
Chao Liu
Zhiguo Zhang
Wanchao Ma
Tianyu Tang
Arctic reactive halogen species are pivotal in mediating polar air-sea interactions and global biogeochemical cycling. Based on ship-based Multi-Axis Differential Optical Absorption Spectroscopy (MAX-DOAS) observations from the 12th Chinese National Arctic Research Expedition (July to September 2021), this study provides a systematic performance assessment of Tropospheric Monitoring Instrument (TROPOMI), Geostationary Environmental Monitoring Spectrometer (GEMS), and Global Ozone Monitoring Experiment-2 (GOME-2) satellite products in the Arctic (R>0.6). Our findings indicate that tropospheric BrO variability is predominantly governed by sea-ice contact (SIC) duration, accounting for 48.63 % of the variance in a generalized additive model (GAM). Potential BrO source regions are identified in western Greenland, the high-latitude Canadian Arctic, and the marginal ice zone (MIZ). Implementing a dynamic boundary layer height (BLH) constraint enhanced the correlation from 0.73 to 0.77. Meteorological conditions exert significant modulation on activation efficiency. For instance, correlations reached 0.84 under southwesterly flow, whereas snowfall reduced the correlation from 0.87 during snow-free periods to 0.61 during snowfall events. Conversely, IO spatial variability is primarily driven by marine biogenic emissions, exhibiting a positive correlation with chlorophyll a concentrations (R = 0.64) and clustering in phytoplankton-rich regions such as the Bering Strait. In the MIZ, the moderate correlation between BrO and IO (R = 0.5) suggests their co-evolution at the shared ice-ocean-atmosphere interface. These high-resolution datasets provide critical a priori constraints for chemistry models. They optimize polar emission parameterizations and halogen budgets, improving Weather Research and Forecasting with Chemistry (WRF-Chem) predictions for polar processes and global climate assessment robustness.
- Article
(16353 KB) - Full-text XML
-
Supplement
(4232 KB) - BibTeX
- EndNote


The unique geographic and climatic conditions of the polar regions make them sensitive indicators and amplifiers for global climate change and atmospheric chemistry. They play an irreplaceable role in regulating global ozone balance, aerosol cycles, and air-sea interactions (Polvani et al., 2020). Nitrogen oxides (NOx), formaldehyde (HCHO), and reactive halogen species (RHS), including X, HOX, XY, OXO, XNO2, X2, XO, and XONO2, where Y and X represent halogen atoms such as I and Br, are core components of polar atmospheric chemistry (Hara et al., 2020; Saiz-Lopez et al., 2008). Halogen radicals (e.g., Br, I, Cl) drive polar ozone depletion catalytically (Hara et al., 2020; Polvani et al., 2020), while RHS also modulate the HOX and NOx ratios (Bloss et al., 2005; Khosravi et al., 2020; Ranjithkumar et al., 2023). XO radicals oxidize NO to NO2, thus increasing the NOx ratio; in contrast, they react with HO2 to form HOX, which subsequently undergoes photolysis (a process particularly efficient for HOI) to generate OH, thereby decreasing the HOX ratio (Saiz-Lopez et al., 2007; Welsh et al., 2023). The bromine explosion process on saline surfaces covered by sea ice or snow converts bromide ions (Br−) into gaseous reactive bromine species, serving as the primary source of bromine in the polar boundary layer (Hara et al., 2020; Saiz-Lopez et al., 2007). In contrast, iodine oxides (IO) originate mainly from marine phytoplankton, with their concentrations tightly linked to polar ecosystem dynamics (Cuevas et al., 2018). Figure S1 in the Supplement illustrates the key chemical cycles of iodine and bromine in the polar troposphere.
Currently, polar atmospheric composition observations primarily rely on satellite remote sensing (Begoin et al., 2010; Blechschmidt et al., 2016; Bougoudis et al., 2020; Dameris et al., 2021; de Laat et al., 2024; Hindley et al., 2019; Mahajan et al., 2021; Roy et al., 2024; Seo et al., 2020; Yang et al., 2021) and ground-based station measurements (Crutzen, 1970; Frieß et al., 2010, 2011, 2016; Gong et al., 2025; Hao et al., 2025; Luo et al., 2018; Mahajan et al., 2021, 2024; Prados-Roman et al., 2018), yet both suffer from notable limitations. While satellite remote sensing enables large-scale coverage, the unique high-albedo snow and ice surfaces, extremely low temperatures, and high cloud cover in polar regions limit its retrieval accuracy for trace gases, particularly low-concentration BrO and IO. Furthermore, the spatiotemporal resolution of satellites is insufficient to capture the rapid dynamics of polar photochemical reactions (e.g., reactive bromine radicals have lifetimes as short as minutes), precluding real-time tracking of short-term trace gas variations (Wagner et al., 2007). Ground-based stations deliver high-resolution data but are predominantly located in terrestrial or island regions of Antarctica and the Arctic (Frieß et al., 2011; Luo et al., 2018; Prados-Roman et al., 2018; Simpson et al., 2017; Yang et al., 2020). Since approximately 70 % of polar regions consist of oceans, data on NO2, HCHO, and RHS in the marine boundary layer are scarce. This scarcity means satellite retrieval results over oceanic regions lack effective validation.
Additionally, regional studies of reactive halogen species exhibit distinct gaps: most research on BrO and IO focuses on local regions like the Antarctic Peninsula and Arctic Svalbard (Adachi et al., 2022; Čížková et al., 2023; Luo et al., 2018; Mahajan et al., 2024; Park et al., 2023; Spagnesi et al., 2025), with ship-based DOAS data missing for extensive oceanic areas such as the Arctic Chukchi and Beaufort Seas. Extensive literature over the past few decades has established the foundation for research on polar halogen activation (Brockway et al., 2024; Luo et al., 2018; Peterson et al., 2017; Pratt et al., 2013; Swanson et al., 2020; Wagner et al., 2007), particularly regarding the distribution and underlying mechanisms of reactive halogens during the polar spring. Specifically, Pratt et al. (2013) confirmed the photochemical production of Br2 from sunlit snowpack, while Swanson et al. (2020) identified distinct environmental patterns of reactive bromine events through long-term ground-based observations. However, existing datasets primarily analyze springtime data and are concentrated at stationary sites such as Alert, Utqiaġvik, and Ny-Ålesund. Observational evidence for the summer melt season remains scarce, leaving the evolution mechanisms of the halogen cycle under continuous high-radiation conditions unclear. Thus, there is an urgent need for mobile, high spatiotemporal resolution detection techniques to resolve polar boundary layer chemical processes and accurately identify the sources and transformations of halogen species. Ship-based MAX-DOAS is well suited to address this gap: by collecting scattered sunlight from multiple directions, it retrieves IO, BrO, HCHO, and other trace gases from the ultraviolet-visible spectrum. Moreover, it enables point-to-line integrated mobile observations aboard research vessels, serving as a robust tool for studying atmospheric composition in polar oceanic regions (Nasse et al., 2015a, b; Wagner et al., 2007).
In recent years, Arctic sea-ice extent has exhibited a significant declining trend, which directly impacts key processes in polar atmospheric chemistry (e.g., the extent and intensity of bromine explosions). Significant reductions in Arctic sea-ice extent and concentration were observed in August 2021, particularly in the Beaufort Sea and Bering Strait (Fig. S2). These changes alter the saline water-sea surface-atmosphere exchange interface and influence marine phytoplankton distribution, which may further modulate the release and formation of reactive halogen species.
Leveraging the ship-based MAX-DOAS measurements aboard the Xuelong-2 during China's 12th Arctic Scientific Expedition (2021), this study pursued the following objectives consistent with the nature of a measurement report: (1) Evaluate the polar applicability of NO2, HCHO, and BrO satellite products by providing a high-precision ship-based benchmark for validating retrieval uncertainties in polar oceanic regions. (2) Validate the sea-ice-driven mechanism governing tropospheric BrO, refine the quantification of sea-ice contact (SIC) duration by incorporating boundary layer height constraints, and employ GAMs to elucidate the synergistic influences of meteorological parameters and sea-ice surface characteristics on the BrO-SIC relationship. (3) Verify the biogenic driving mechanism of IO concentrations by quantifying its correlation with MODIS-derived chlorophyll a and revealing the spatial differentiation between sea-ice-derived BrO and biogenic IO. By filling critical observational gaps in the Arctic marine boundary layer, this report provides essential empirical constraints for upgrading the parameterizations of halogen chemical cycles in atmospheric chemistry models (e.g., GEOS-Chem and WRF-Chem), thereby enhancing the accuracy of polar air-sea interaction simulations and global climate assessments.
2.1 Experimental Setup
The instrument was installed on the research vessel Xuelong-2 on 10 July 2021, and performed continuous automated measurements throughout the cruise. The vessel departed Shanghai Port (31.35° N, 121.69° E) on 12 July 2021, sailing via the Korea Strait, Soya Strait, Bering Strait, Beaufort Sea, and Siberian Seas (see Fig. 1 for the detailed trajectory). The time of the first contact with sea ice was 24 July (72.20° N, 169.18° W); subsequently, the vessel sailed toward the Arctic region and began its return voyage on 28 August 2021. The instrument was fixed on the vessel's side deck, mounted away from the ship's exhaust vents with an unobstructed surrounding field of view (Tan et al., 2018). During ship-based mobile measurements, the observation azimuth was directed toward the stern (see Fig. S3 for the vessel's top view). The ship-based MAX-DOAS system comprises a motor-driven observation unit, a spectrometer operating in the 300–460 nm range (spectral resolution: 0.6 nm), a temperature control system, and a computer control unit. For measurements, right-angle prisms reflect scattered sunlight at various elevation angles; this light is transmitted to the spectrometer via optical fibers for spectral acquisition, and the computer control unit performs spectral analysis. The temperature control system ensured stable instrument operation under the Arctic's extreme cold conditions. Ship sway caused the telescope's elevation angle relative to the vessel to deviate from the actual observation direction. To mitigate this effect, the spectral exposure time was set to 100 ms, which is short enough that ship movement during spectral recording is negligible. Additionally, the observation elevation angle sequence was set to 10, 20, and 90° (zenith) to reduce the impact of ship roll on the observed spectra. The system was also equipped with a high-precision global positioning system to log the vessel's real-time cruise coordinates and trajectory.
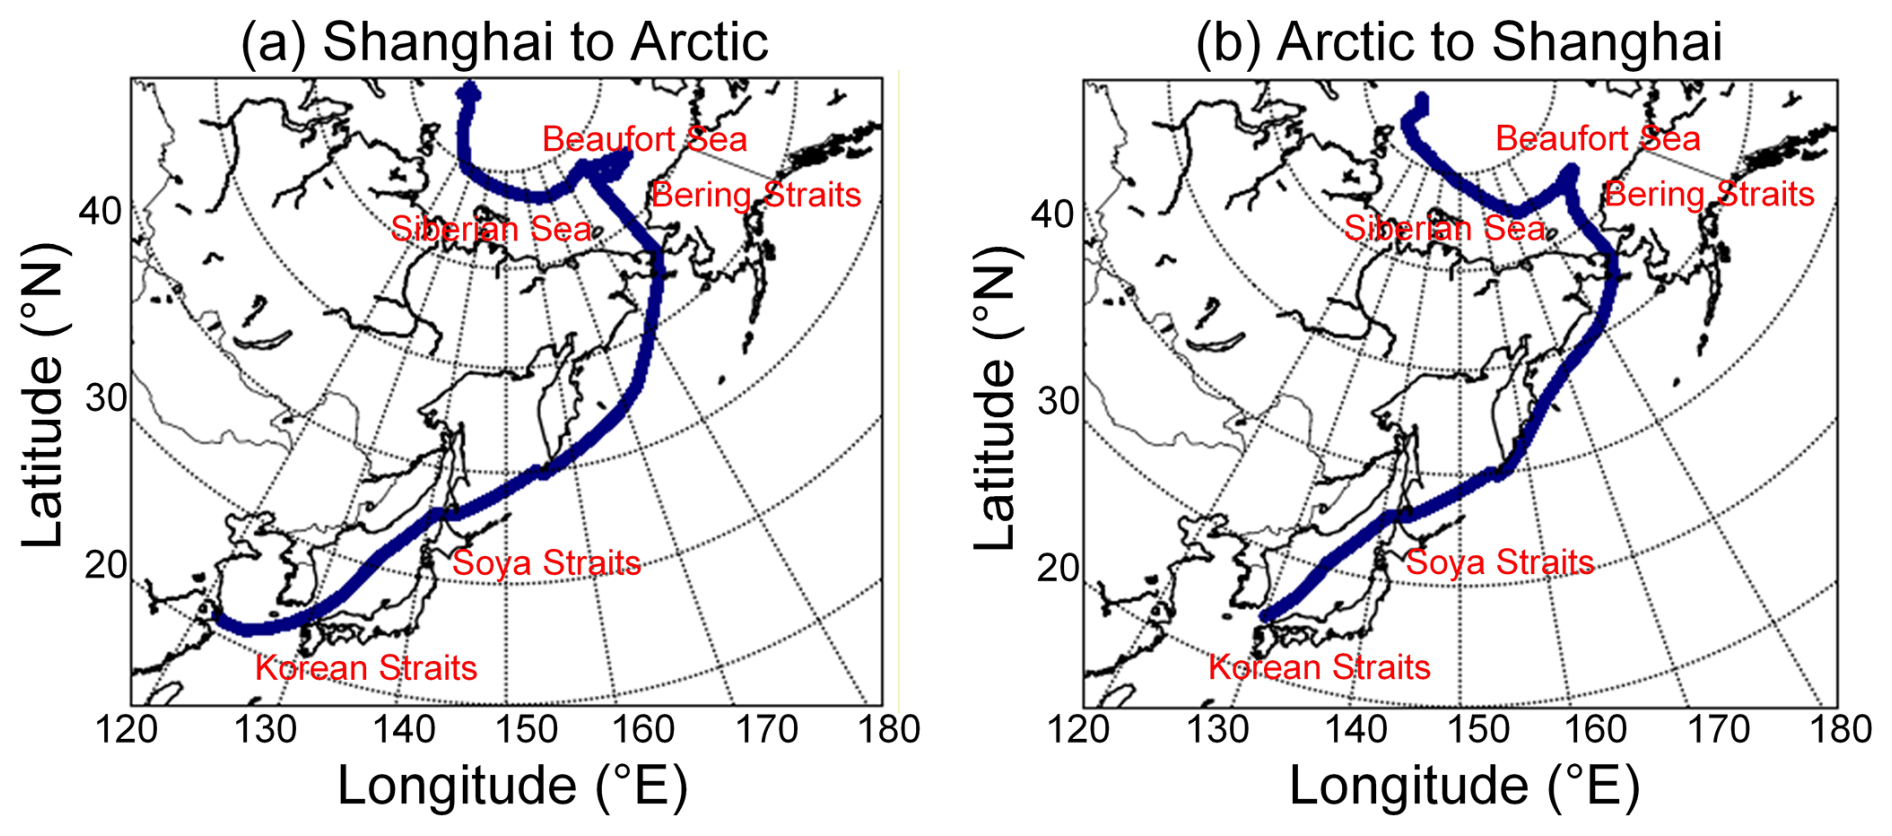
Figure 1Trajectories of the research vessel for the 12th Arctic Scientific Expedition: (a) Outbound from Shanghai to the Arctic; (b) Return from the Arctic.
2.2 Data Analysis
2.2.1 Data Processing and Filtering
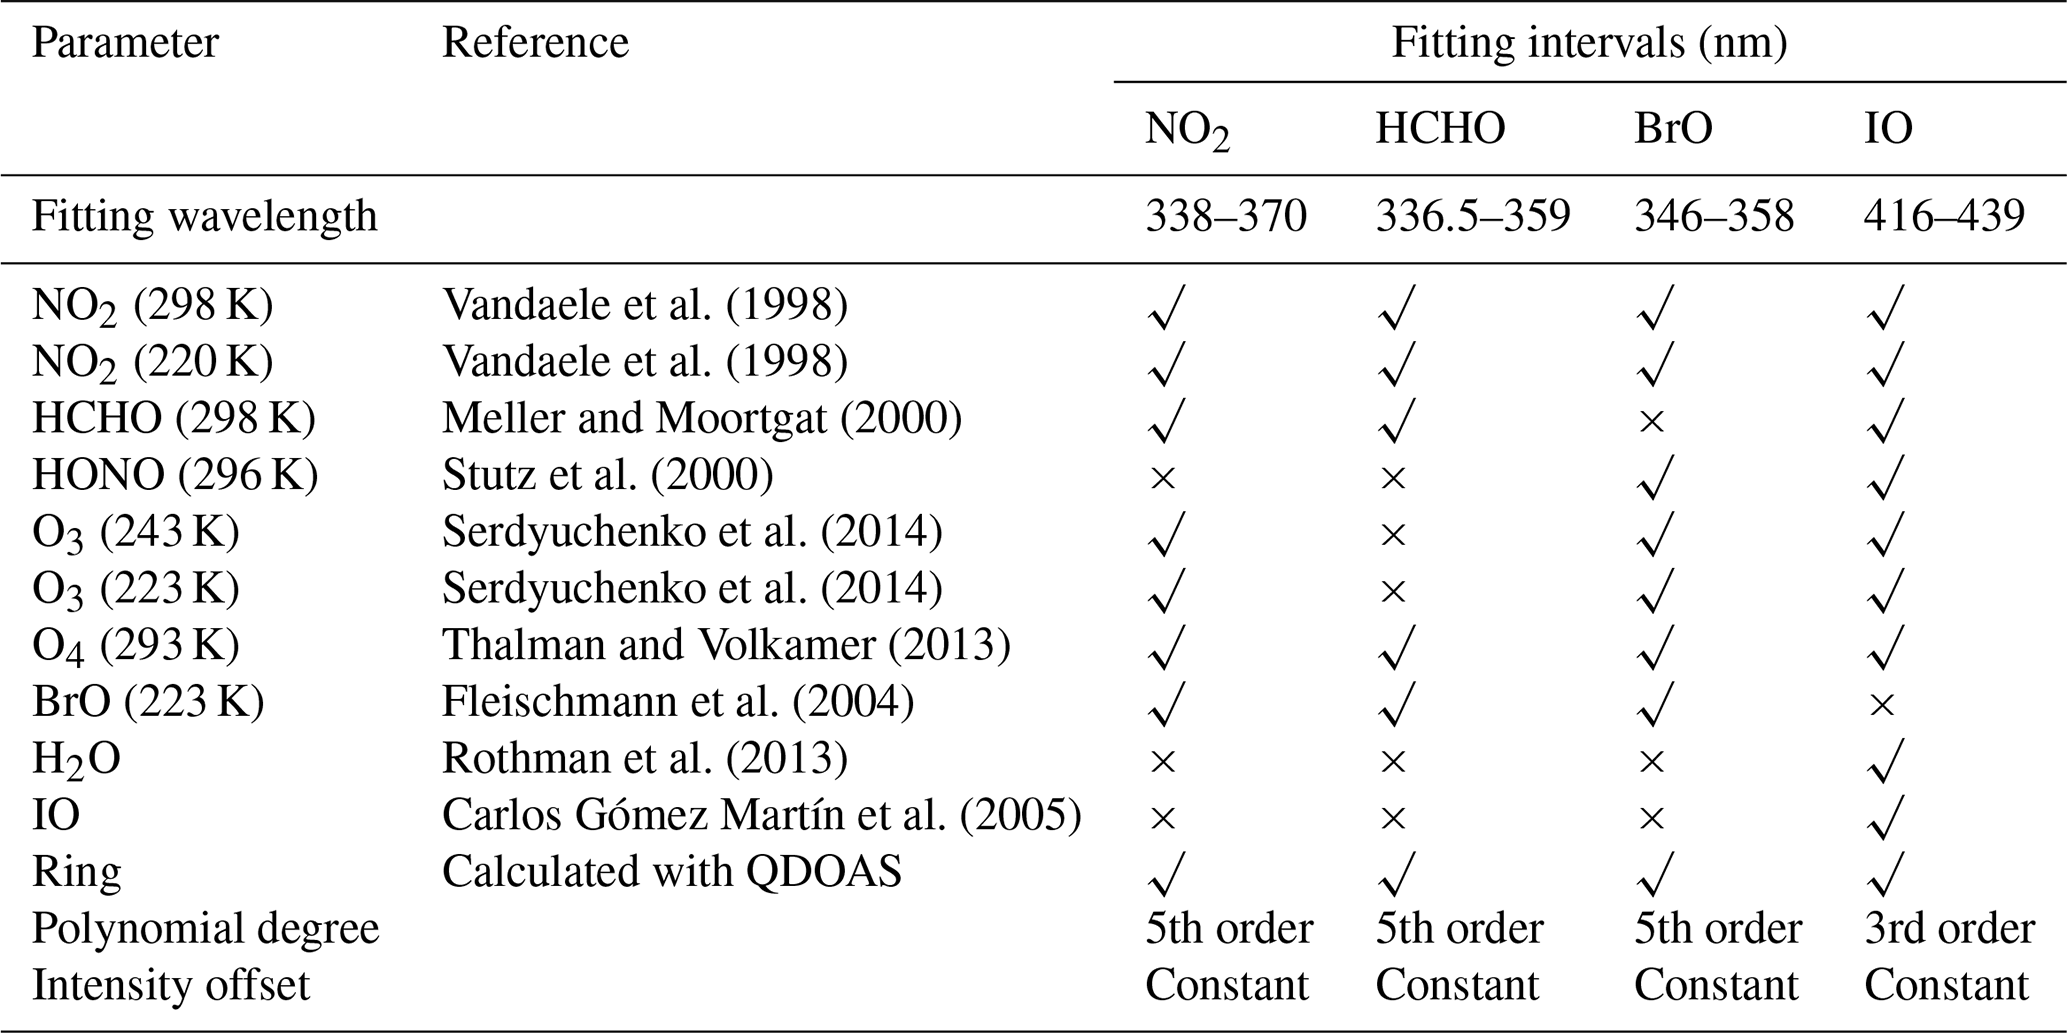
Data retrieval was conducted using the QDOAS software (BIRA-IASB; http://uv-vis.aeronomie.be/software/QDOAS, last access: 20 March 2026) based on the DOAS principle. For ship-based spectral processing, offset and dark current corrections were first applied to the data. During retrieval, zenith spectra for each elevation angle sequence were used as reference spectra. Detailed retrieval parameters are provided in Table 1, with retrieval configurations following previous studies (Frieß et al., 2023; Hong et al., 2018; Mahajan et al., 2021; Saiz-Lopez et al., 2008). A 5th-order polynomial was used to remove broadband structures induced by Mie and Rayleigh scattering, while a nonlinear intensity offset was incorporated into the fitting process to mitigate the impact of instrument stray light.
Ship-based MAX-DOAS retrieves differential slant column densities (DSCDs) using sequential zenith reference spectra, which effectively eliminates the stratospheric background and enables the detection of tropospheric trace gases. To compensate for minor changes in spectrometer wavelength calibration, spectral shift and stretch were incorporated during the fitting process. Figure 2 presents a typical spectral fitting result for a spectrum measured at 10° elevation at 01:02 UTC on 15 August 2021. Only retrieval values with a root mean square (RMS) < and solar zenith angle (SZA) < 75° were retained in this study. During mobile measurements, the ship's exhaust plume could interfere with trace gas measurements under unfavorable wind conditions. To eliminate ship exhaust interference in the measured spectra, spectral data measured at ship speeds below 5 km h−1 were filtered out, and spectra acquired under unfavorable wind conditions (0–90 and 315–360°) were excluded. A schematic representation of these filtering criteria is provided in Fig. S3. The filtered dataset remained adequate for robust analysis (Behrens et al., 2019).
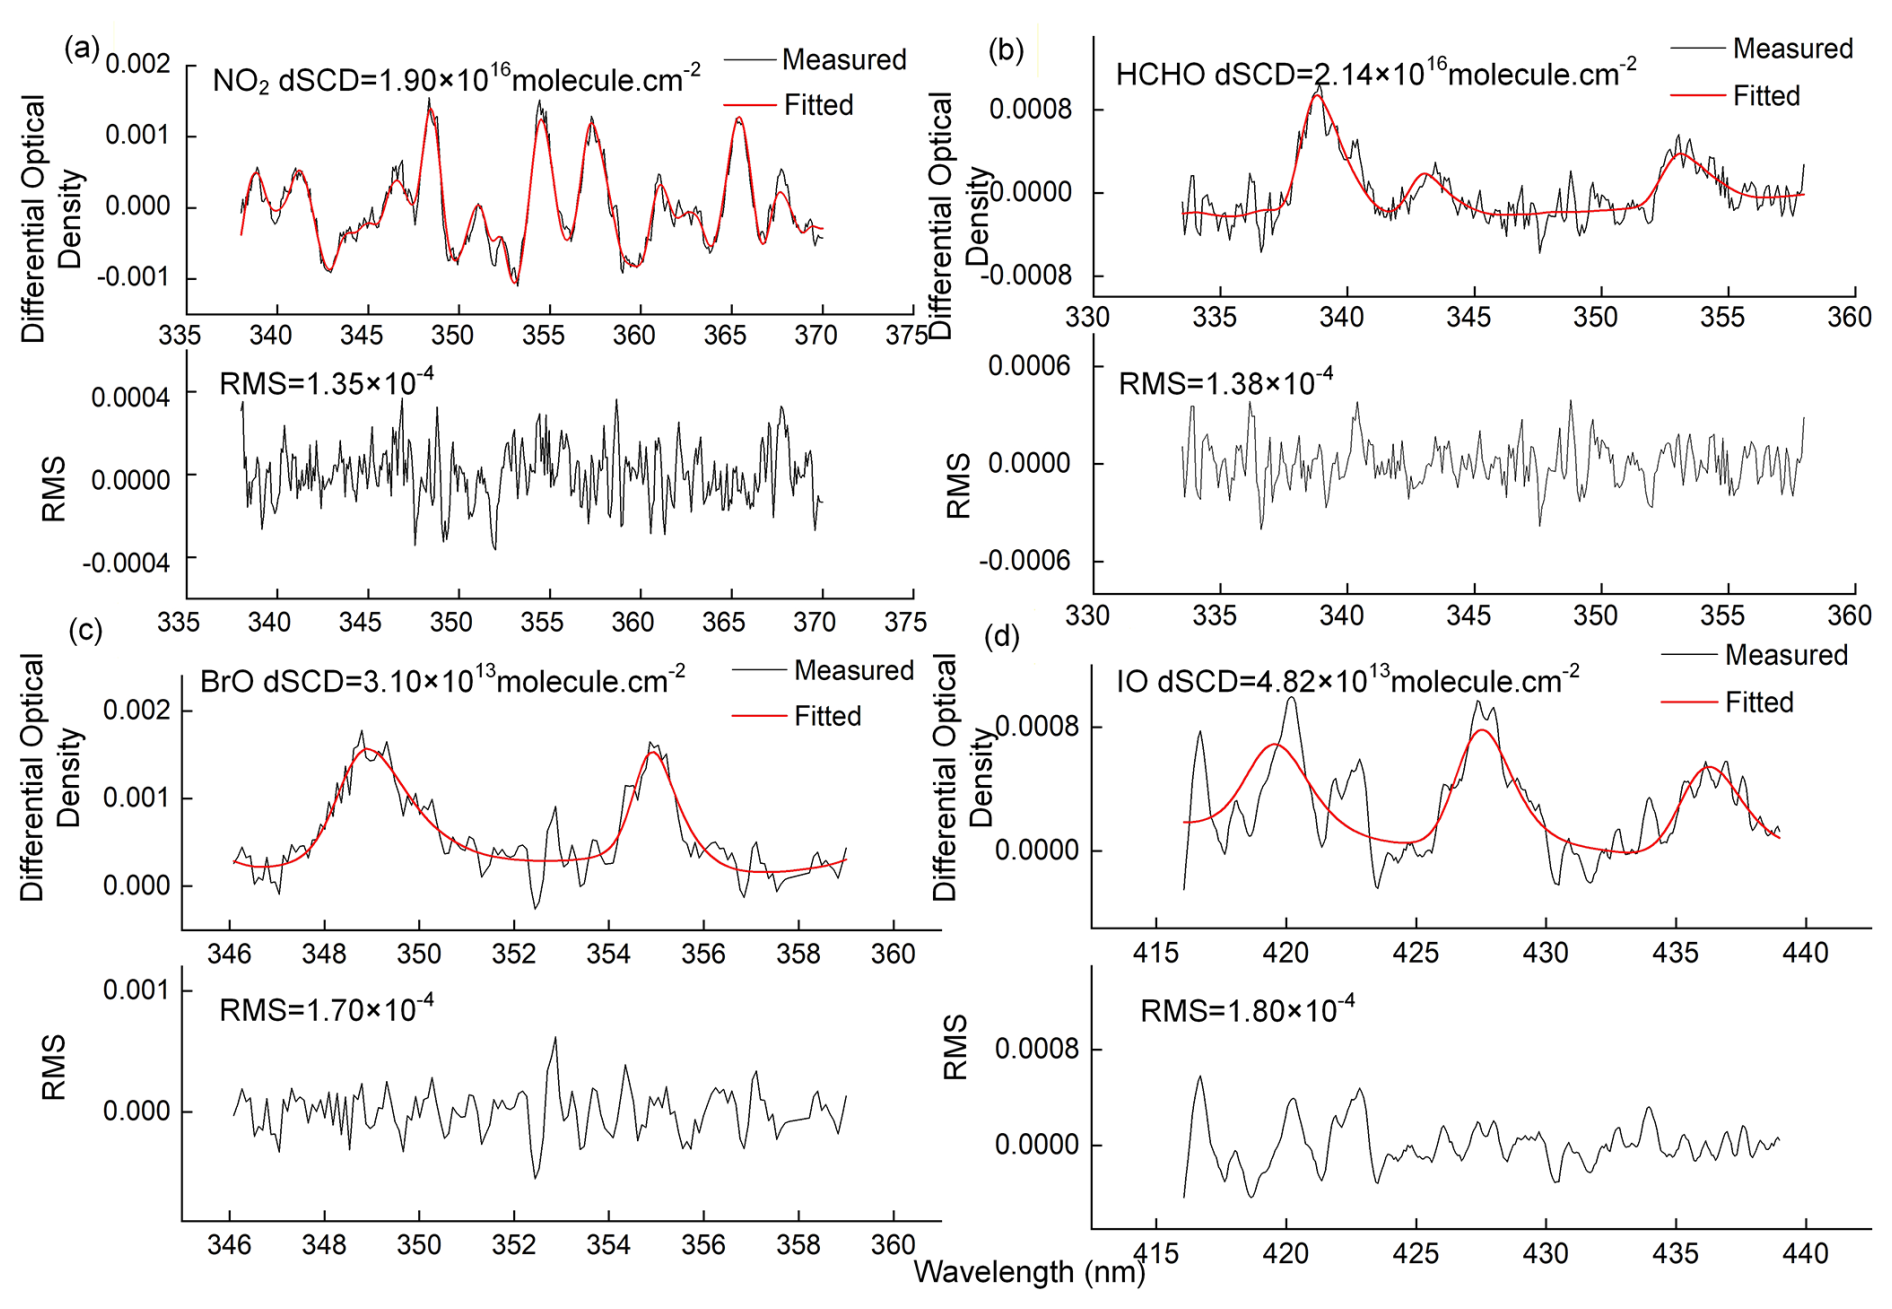
Figure 2An example of ship MAX-DOAS spectral fittings for (a) NO2, (b) HCHO, (c) BrO, and (d) IO. The spectrum was recorded at 01:02 UTC on 15 August 2021, with an elevation of 10°.
2.2.2 Uncertainties in Stratospheric-Tropospheric Separation
The separation of tropospheric and stratospheric contributions using DSCDs involves several layers of uncertainty. Following established error assessment methodologies (Hendrick et al., 2007; Tack et al., 2015; Wittrock et al., 2004), the total uncertainty in our retrieved tropospheric vertical columns is attributed to two primary factors. First, spectral noise and statistical fitting uncertainties account for approximately 5 %–10 % of the total DSCD uncertainty under clear-sky conditions. Second, uncertainties arise from atmospheric spatial inhomogeneity and stratospheric photochemical gradients. These gradients are particularly pronounced for reactive species such as NO2 and BrO. To mitigate this, we restricted our analysis to observations with SZA < 75°, ensuring that the stratosphere remained in a photochemical quasi-steady state. Additionally, the implementation of sequential zenith reference spectra (ZRS) within short intervals (a few minutes) effectively minimizes the influence of stratospheric temporal and spatial variability. In the Arctic environment, the residual uncertainty stemming from stratospheric gradients following the sequential ZRS subtraction is estimated to be less than 10 %.
Based on these components, the combined uncertainty of the tropospheric-stratospheric separation during this campaign ranges from 11.2 %–14.1 %. We note that the relative uncertainty may increase in the pristine Arctic atmosphere when tropospheric concentrations are near the detection limits.
2.2.3 Retrieval of Trace Gas Vertical Column Densities
Because DOAS analysis yielded DSCDs in this study, conversion to vertical column densities (VCDs) required the application of differential air mass factors, and the specific formula is given below:
In the above equation, α denotes the telescope elevation angle, and DAMFtrop(α) is expressed as AMFtrop(α)−AMFtrop(90°). Owing to rapidly changing radiative conditions and heterogeneous air masses encountered during ship-based MAX-DOAS campaigns, an alternative retrieval method has been developed for mobile platforms. This method, which has been successfully applied in previous mobile MAX-DOAS studies (Hong et al., 2018; Wagner et al., 2010), demonstrates superior performance over the standard approach. Therefore, this study adopts this method to retrieve tropospheric VCDs, with the specific formula provided below:
In the above equation, SZA denotes the solar zenith angle. The difference between the two unknown terms SCDref and SCDstrat(SZA) is defined as DSCDoffset. Combining Eqs. (1) and (2) yields the specific expression for DSCDoffset.
Here, DSCDoffset is a time-smooth function, fitted to the DSCDoffset(ti) time series using a second-order polynomial, where ti denotes the time interval between two consecutive spectra at the same elevation angle. The calculated DSCDoffset(ti) time series is expressed as:
The fitted polynomial approximates DSCDoffset(ti); substituting it into Eq. (2) gives the tropospheric VCD time series. Details of this method are provided in Wagner et al. (2010). Radiative transfer calculations in this study were performed using the atmospheric radiative transfer model SCIATRAN 2.2 (Rozanov et al., 2005).
2.3 Performance of the MAX-DOAS Retrieval
2.3.1 Uncertainty Analysis
Following established methodologies (Hendrick et al., 2007; Song et al., 2023; Tack et al., 2015; Wagner et al., 2007; Wittrock et al., 2004), the uncertainty of MAX-DOAS retrievals is categorized into four primary sources. First, smoothing and noise uncertainties originate from statistical uncertainties in the DOAS fitting. Under clear-sky conditions, the fitting uncertainties for NO2, HCHO, BrO, and IO remain within 5 %–10 %. Second, reference spectrum uncertainty arises because tropospheric DSCDs are determined by subtracting a sequential ZRS from off-axis measurements. While this approach assumes stratospheric absorption cancels out, uncertainties in the residual trace gas column amounts within the ZRS (stemming from stratospheric background or tropospheric pollution) can introduce systematic biases of approximately 10 %–15 %. Third, algorithmic uncertainties primarily stem from uncertainties in aerosol vertical distribution, multiple scattering simulations, and profile assumptions within the radiative transfer model. For the Arctic sea-ice environment, sensitivity tests demonstrate that surface albedo has a negligible impact on boundary layer observations at low elevation angles, with the total AMF uncertainty estimated at 10 %–20 %. Fourth, residual uncertainties from stratospheric gradients and atmospheric inhomogeneity are also considered. By employing the sequential ZRS method and filtering for SZA < 75°, uncertainties from steep stratospheric photochemical gradients are effectively suppressed to within 10 %.
Consequently, the total uncertainty of the retrieved VCDs during this ship-based campaign is estimated to be approximately 18.1 %–28.7 %. Furthermore, due to the pristine background of the Arctic region, the relative uncertainty may increase when tropospheric concentrations are extremely low. Detailed information is provided in the Supplement (Table S1).
2.3.2 Detection Limits
To evaluate the sensitivity of MAX-DOAS in the Arctic environment, different methods were adopted to calculate detection limits based on the atmospheric distribution and signal-to-noise ratio characteristics of various trace gases. First, for NO2, HCHO, and IO, we used the standard method in DOAS applications to determine the detection limit (Chance and Spurr, 1997; Stutz and Platt, 1996; Wagner et al., 2007). The detection limit of the DSCD (LODdSCD) is defined as twice the statistical fitting error from the DOAS retrieval (2σfit). Second, for BrO, since tropospheric BrO concentrations in the Arctic are relatively low and influenced by the stratospheric BrO background, the conventional 2σfit noise method often overestimates the tropospheric detection limit because of the high weighting of stratospheric absorption. Therefore, we adopted the equivalent RMS noise factor method, which calculates the minimum identifiable slant column density at a given signal-to-noise ratio by analyzing the RMS noise of the residual spectrum (Coburn et al., 2011). During the observation period, the estimated detection limits for NO2, HCHO, BrO, and IO were 2.0 × 10¹⁵, 5.0 × 10¹⁵, 3.0 × 10¹³, 1.3 × 10¹³ molec. cm−2, respectively.
2.4 Satellite Observations
This study compares ship-based MAX-DOAS measurements with tropospheric VCD products from multiple satellite instruments, including the Tropospheric Monitoring Instrument (TROPOMI), Geostationary Environmental Monitoring Spectrometer (GEMS), and Global Ozone Monitoring Experiment-2 (GOME-2).
TROPOMI is onboard the Sentinel-5P satellite, operating in a near-Earth sun-synchronous orbit with an equator crossing time of 13:30 local time. It features 4 independent spectrometers covering the mid-ultraviolet (UV), long-wave UV-visible (UV-VIS), short-wave infrared (SWIR), and near-infrared (NIR) bands, with a total wavelength range of 270–2385 nm (non-overlapping and discontinuous). Among comparable atmospheric remote sensing instruments, TROPOMI has the best spatial resolution (5.5 km × 3.5 km), enabling precise capture of spatial distributions of trace gases in small-scale regions, making it a key data source for high-resolution atmospheric composition monitoring in polar oceans.
GEMS is a hyperspectral UV-VIS imaging spectrometer onboard the Cheollima-2 satellite, operating in a geostationary orbit and focusing on atmospheric trace gas observations over the Asia-Pacific. With a spatial resolution of 3.5 km × 8 km, it effectively monitors trace gases like HCHO and NO2; additionally, its high temporal resolution (one regional scan per hour) captures short-term dynamic changes in atmospheric composition, offering temporal insights into rapid polar photochemical processes.
The GOME-2 series (GOME-2A, GOME-2B) are onboard the sun-synchronous MetOp satellite, with an equator crossing time of 09:30 local time. They measure by receiving sunlight reflected from the Earth's atmosphere or surface, covering 240–790 nm. Despite a relatively low spatial resolution (40 km × 40 km), they retrieve auxiliary parameters such as cloud top pressure and effective cloud fraction via the Fast Retrieval Scheme for Clouds from the Oxygen A band (FRESCO+), supporting quality control for atmospheric composition retrieval in cloudy regions. In this study, tropospheric BrO VCD analysis uses GOME-2B products to investigate large-scale polar BrO distribution.
Scanning Imaging Absorption Spectrometer for Atmospheric Chartography (SCIAMACHY) was one of the core payloads aboard the European Space Agency (ESA)'s Envisat satellite, with its operation directly tied to the satellite platform. On 8 April 2012, Envisat suffered an unexpected loss of contact; subsequently, on 9 May 2012, ESA officially declared the mission terminated, and SCIAMACHY ceased operations alongside the platform. Owing to this constraint, satellite validation of atmospheric IO observations was not performed in this study.
2.5 Potential Source Contribution Function
The PSCF is a Lagrangian receptor-oriented model employed to pinpoint potential emission source areas. For a specific grid cell (i,j), the PSCF value is defined as the ratio of the number of “polluted” trajectory endpoints (mi,j), associated with concentrations exceeding a predefined threshold to the total number of endpoints (ni,j) residing in that cell.
To reduce uncertainty caused by small grid counts, this study refers to Pernov et al. (2021), Polissar et al. (2001), Yin et al. (2018) by introducing a weight function to obtain the weighted PSCF (WPSCF). The formula is as follows:
where navg represents the average number of endpoints across all grid cells.
2.6 Auxiliary Data
To estimate BrO distribution, this study obtained Northern Hemisphere BrO data from GOME-2 products via http://www.iup.uni-bremen.de/doas/scia_data_browser.html (last access: 12 August 2025). Sea ice concentration and age data were sourced from the National Snow and Ice Data Center (NSIDC; https://nsidc.org/home, last access: 27 November 2025). Chlorophyll a concentrations were derived from Moderate Resolution Imaging Spectroradiometer (MODIS; https://aqua.nasa.gov/modis, last access: 16 December 2025). Backward trajectory analysis was conducted using the Hybrid Single-Particle Lagrangian Integrated Trajectory model via the NOAA ARL website to identify air mass sources. Finally, boundary layer height, wind direction, snow density, and snowfall data were obtained from the European Centre for Medium-Range Weather Forecasts (ECMWF).
3.1 Spatial Distributions of NO2, HCHO, BrO, and IO
Figure 3 presents the spatial distributions of VCDs of four trace gases during the cruise (round-trip cruise from Shanghai to the Arctic). Notably, partial data gaps exist in the cruise dataset, attributed to four main interfering factors: insufficient light during nighttime navigation, spectral detection interference from severe weather (e.g., thunderstorms), temporary instrument or power system malfunctions, and near-field data contamination by the shipboard emission plumes.
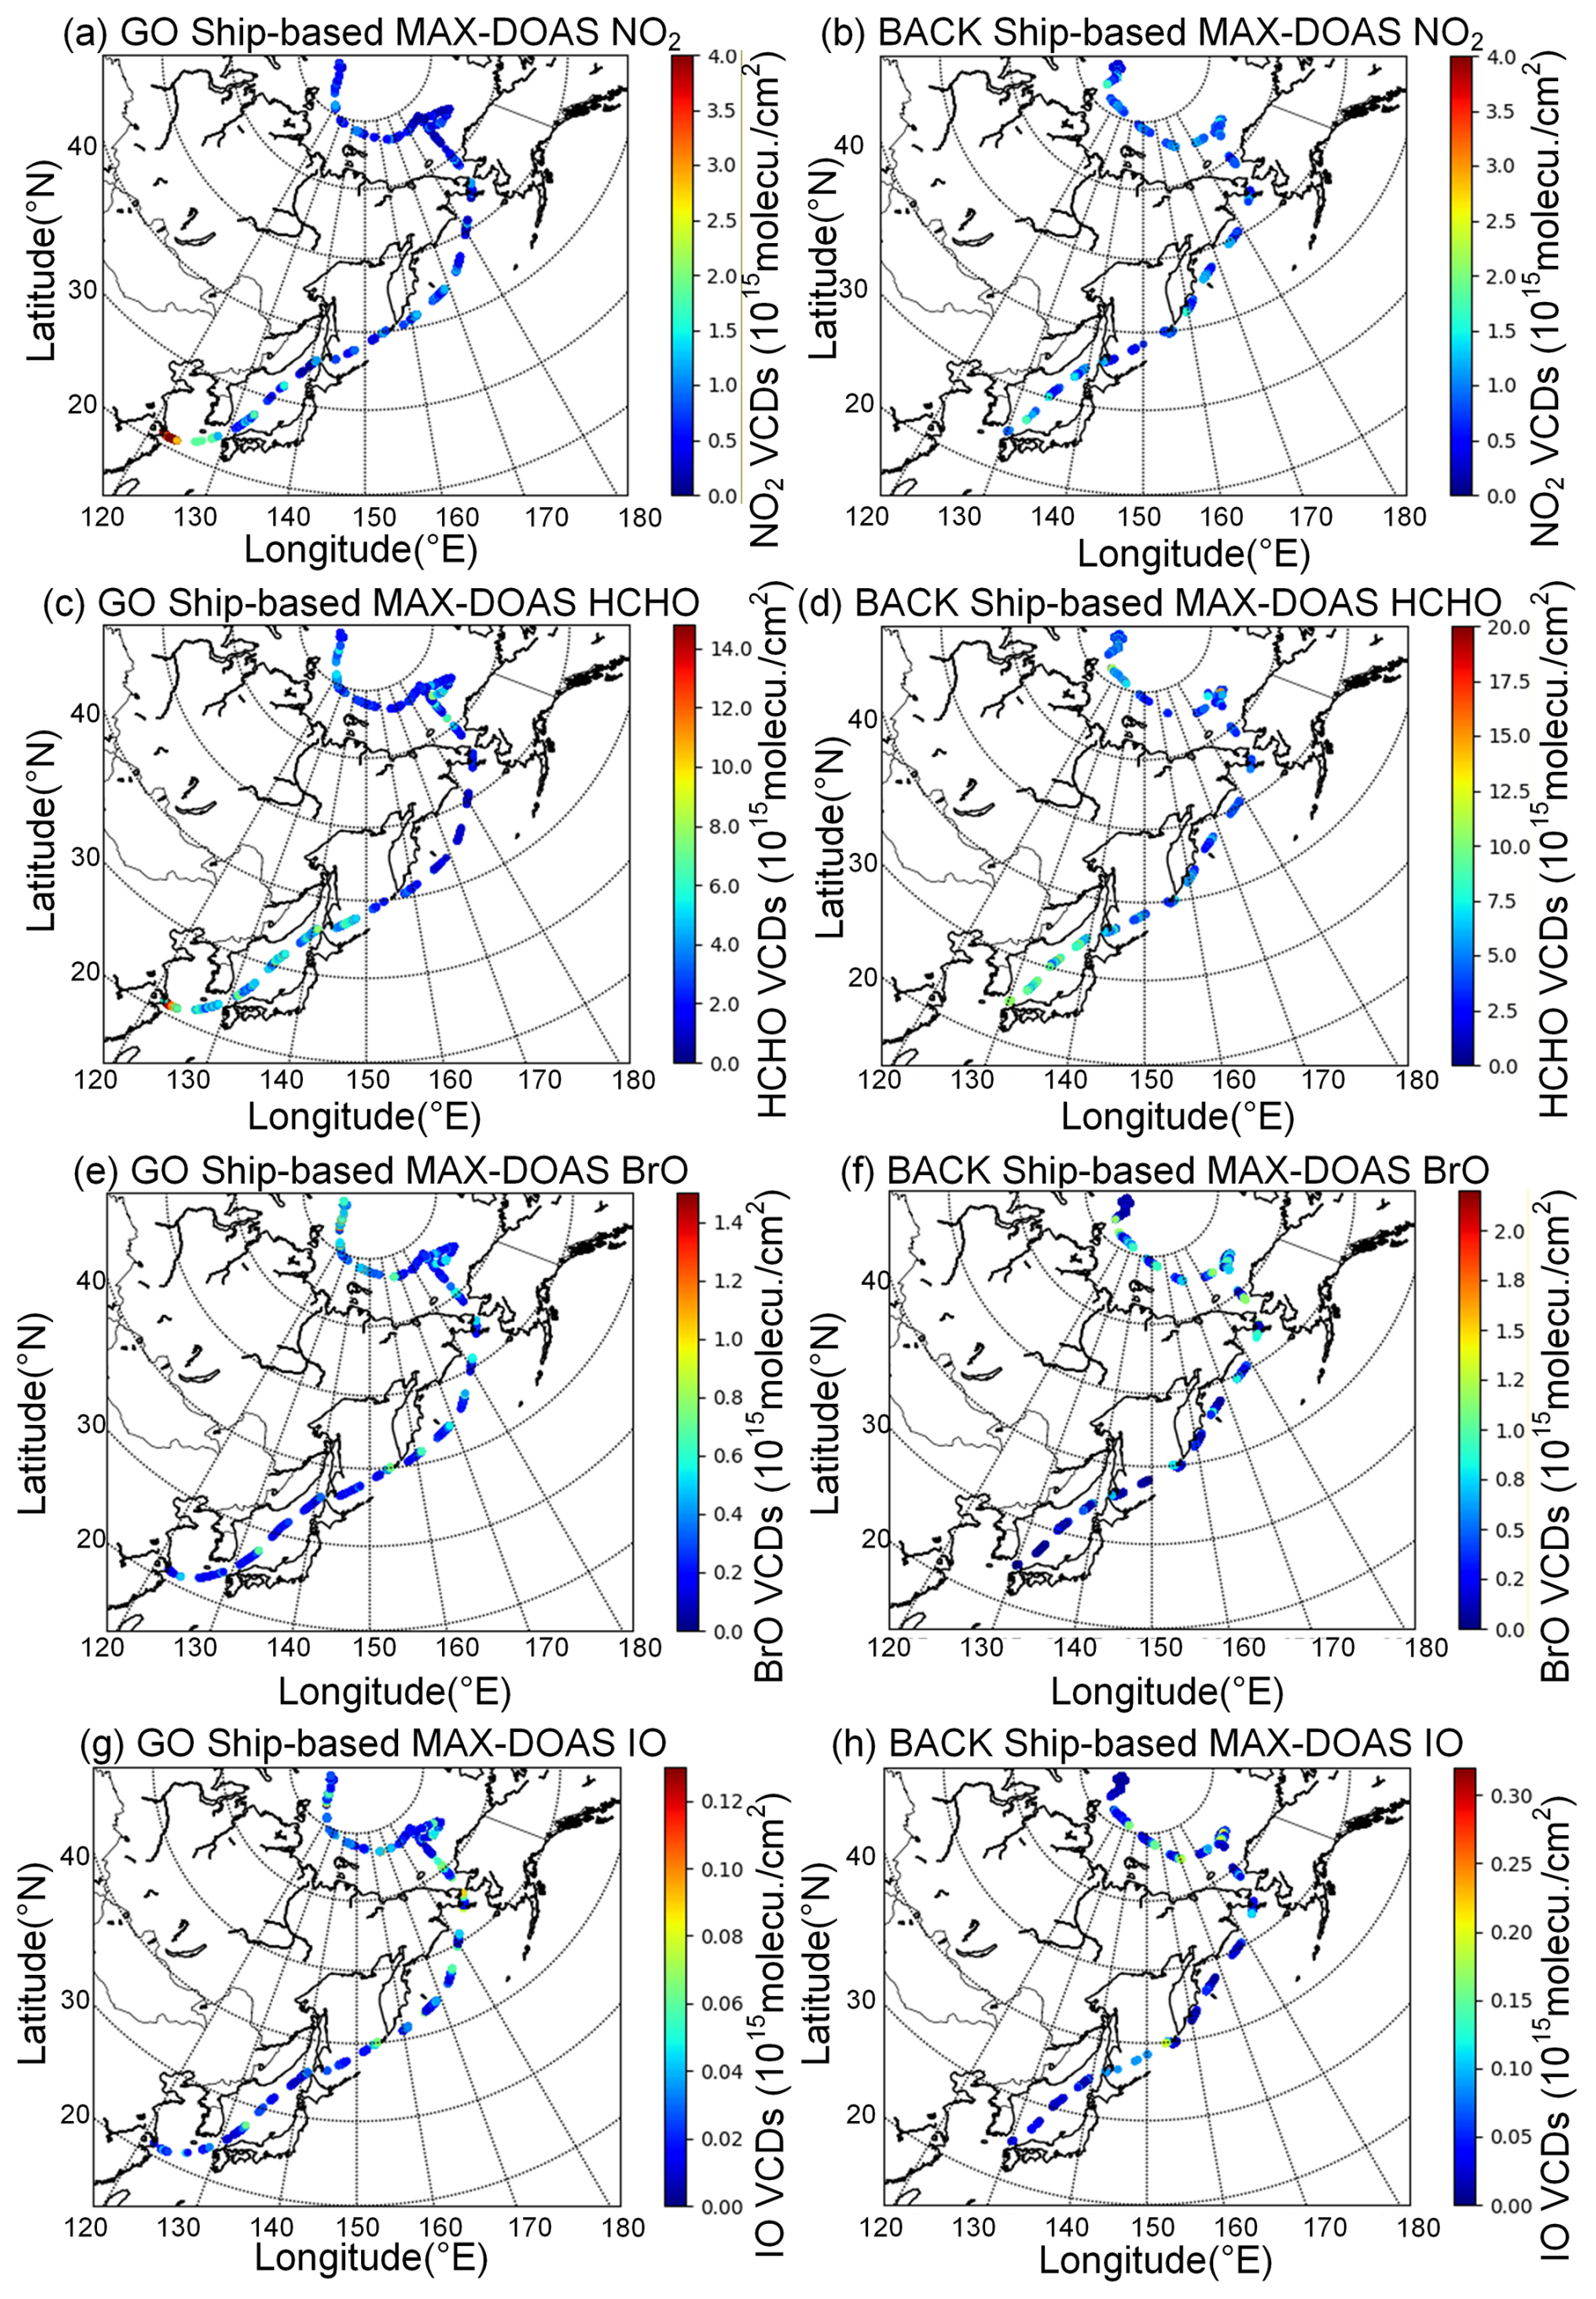
Figure 3Spatial distributions of trace gas VCDs (NO2, HCHO, BrO, and IO). Panels (a), (c), (e), and (g) present NO2, HCHO, BrO, and IO distributions along the outbound route from Shanghai to the Arctic, while panels (b), (d), (f), (h) show their distributions along the return route from the Arctic to Shanghai.
The high-value regions of different trace gases exhibit distinct regional variations: NO2 and HCHO VCD maxima are concentrated in low-latitude areas with intensive anthropogenic activities, with the highest concentrations observed in the Shanghai Port region. Additionally, relatively high NO2 and HCHO concentrations are found in ports near the Korea Strait, a key shipping lane connecting the Pacific Ocean and the Sea of Japan, frequented by international merchant vessels. The elevated pollutant levels in these regions are likely directly linked to ship emissions from port operations and shipping lanes, a mechanism supported by numerous previous studies (Hwang and Kang, 2023; Wang et al., 2019). In contrast, high VCDs of the reactive halogen species IO and BrO are concentrated in the Arctic Ocean. The maximum BrO VCD is observed near the Beaufort Sea, while the maximum IO VCD occurs near the Bering Strait.
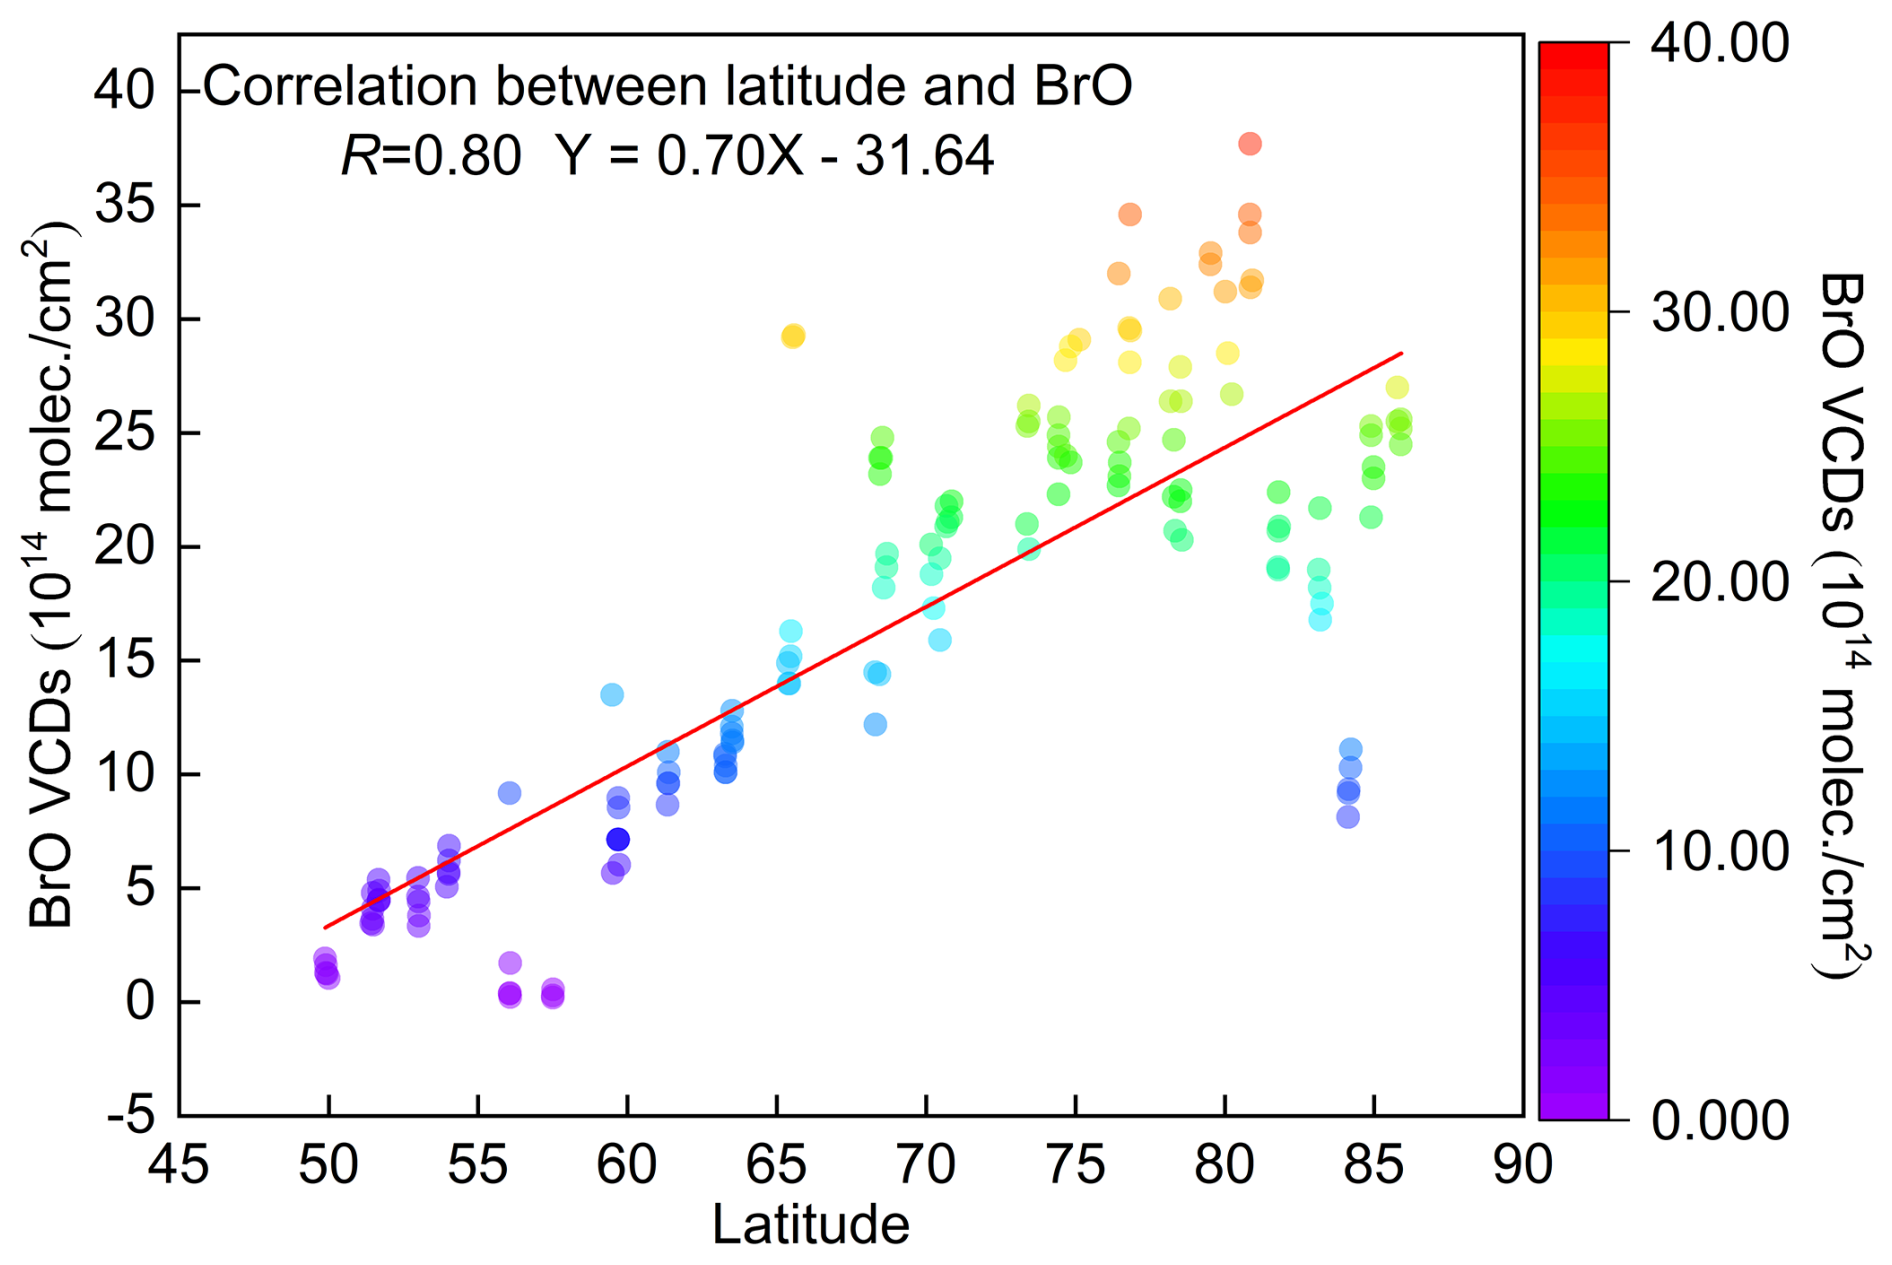
Figure 3 shows that BrO VCDs generally increase with latitude. Previous studies (Simpson et al., 2017; Zhao et al., 2016) have identified high-latitude Northern Hemisphere regions as cores of abnormally elevated tropospheric BrO, with these high values typically linked to key physicochemical mechanisms: sea-ice photochemical processes (e.g., bromine explosion) and low-temperature catalysis. Thus, this study focuses on data at and north of 50° N. Data were analyzed at 1° latitude intervals, selecting the top 5 BrO concentrations and their corresponding latitude information per interval. As shown in Fig. 4, BrO concentrations exhibit a positive correlation with latitude, with a correlation coefficient of 0.80. In contrast, IO spatial distribution shows no distinct latitudinal gradient, suggesting its concentrations are more strongly associated with the spatial heterogeneity of marine biological activities (e.g., phytoplankton emissions). The relationship between IO and chlorophyll a concentrations will be analyzed in depth in subsequent sections, incorporating synchronously observed marine ecological data (see Sect. 3.3.2 for details).
3.2 Satellite Comparison
Ship-based MAX-DOAS measured NO2, HCHO, and BrO VCDs were compared with atmospheric products from GEMS, TROPOMI, and GOME-2 satellites to validate the applicability of satellite data in the Arctic and adjacent seas. Results are presented in Fig. 5 (NO2), Fig. 6 (HCHO), and Fig. 7 (BrO).
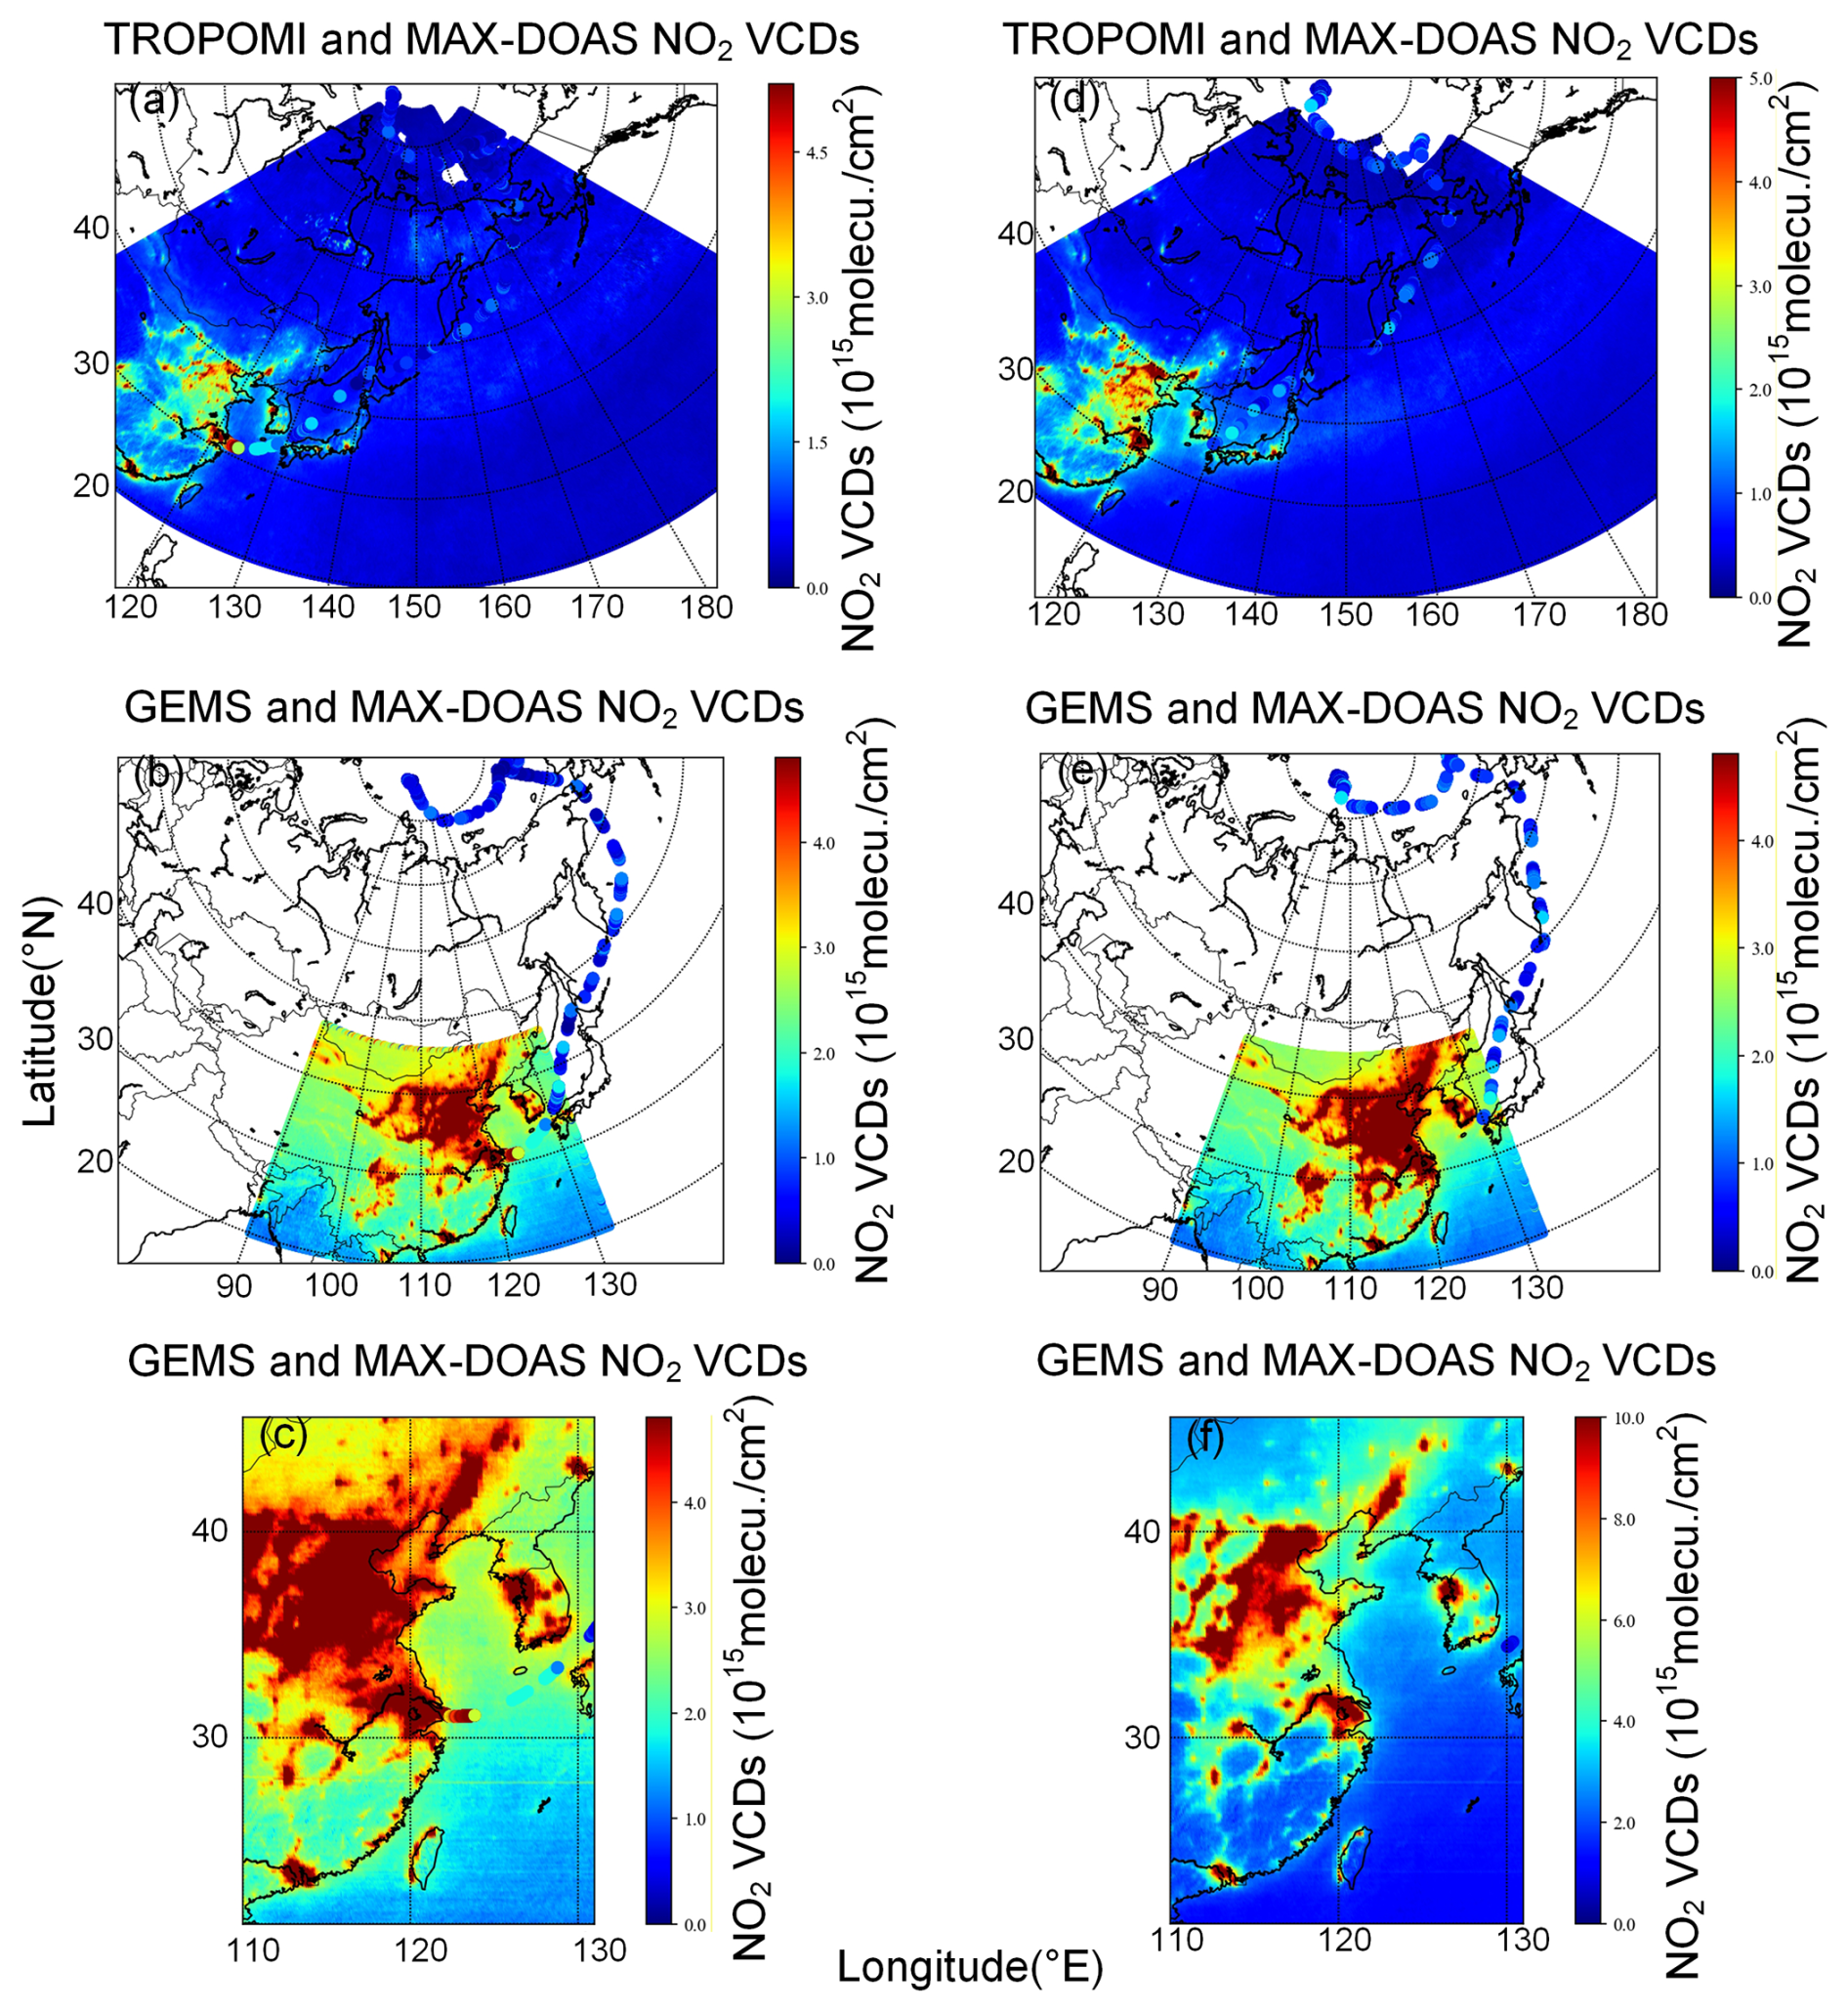
Figure 5Comparison of ship-based MAX-DOAS measured NO2 VCDs with satellite observations: (a–c) Shanghai to Arctic and (d–f) Arctic to Shanghai.
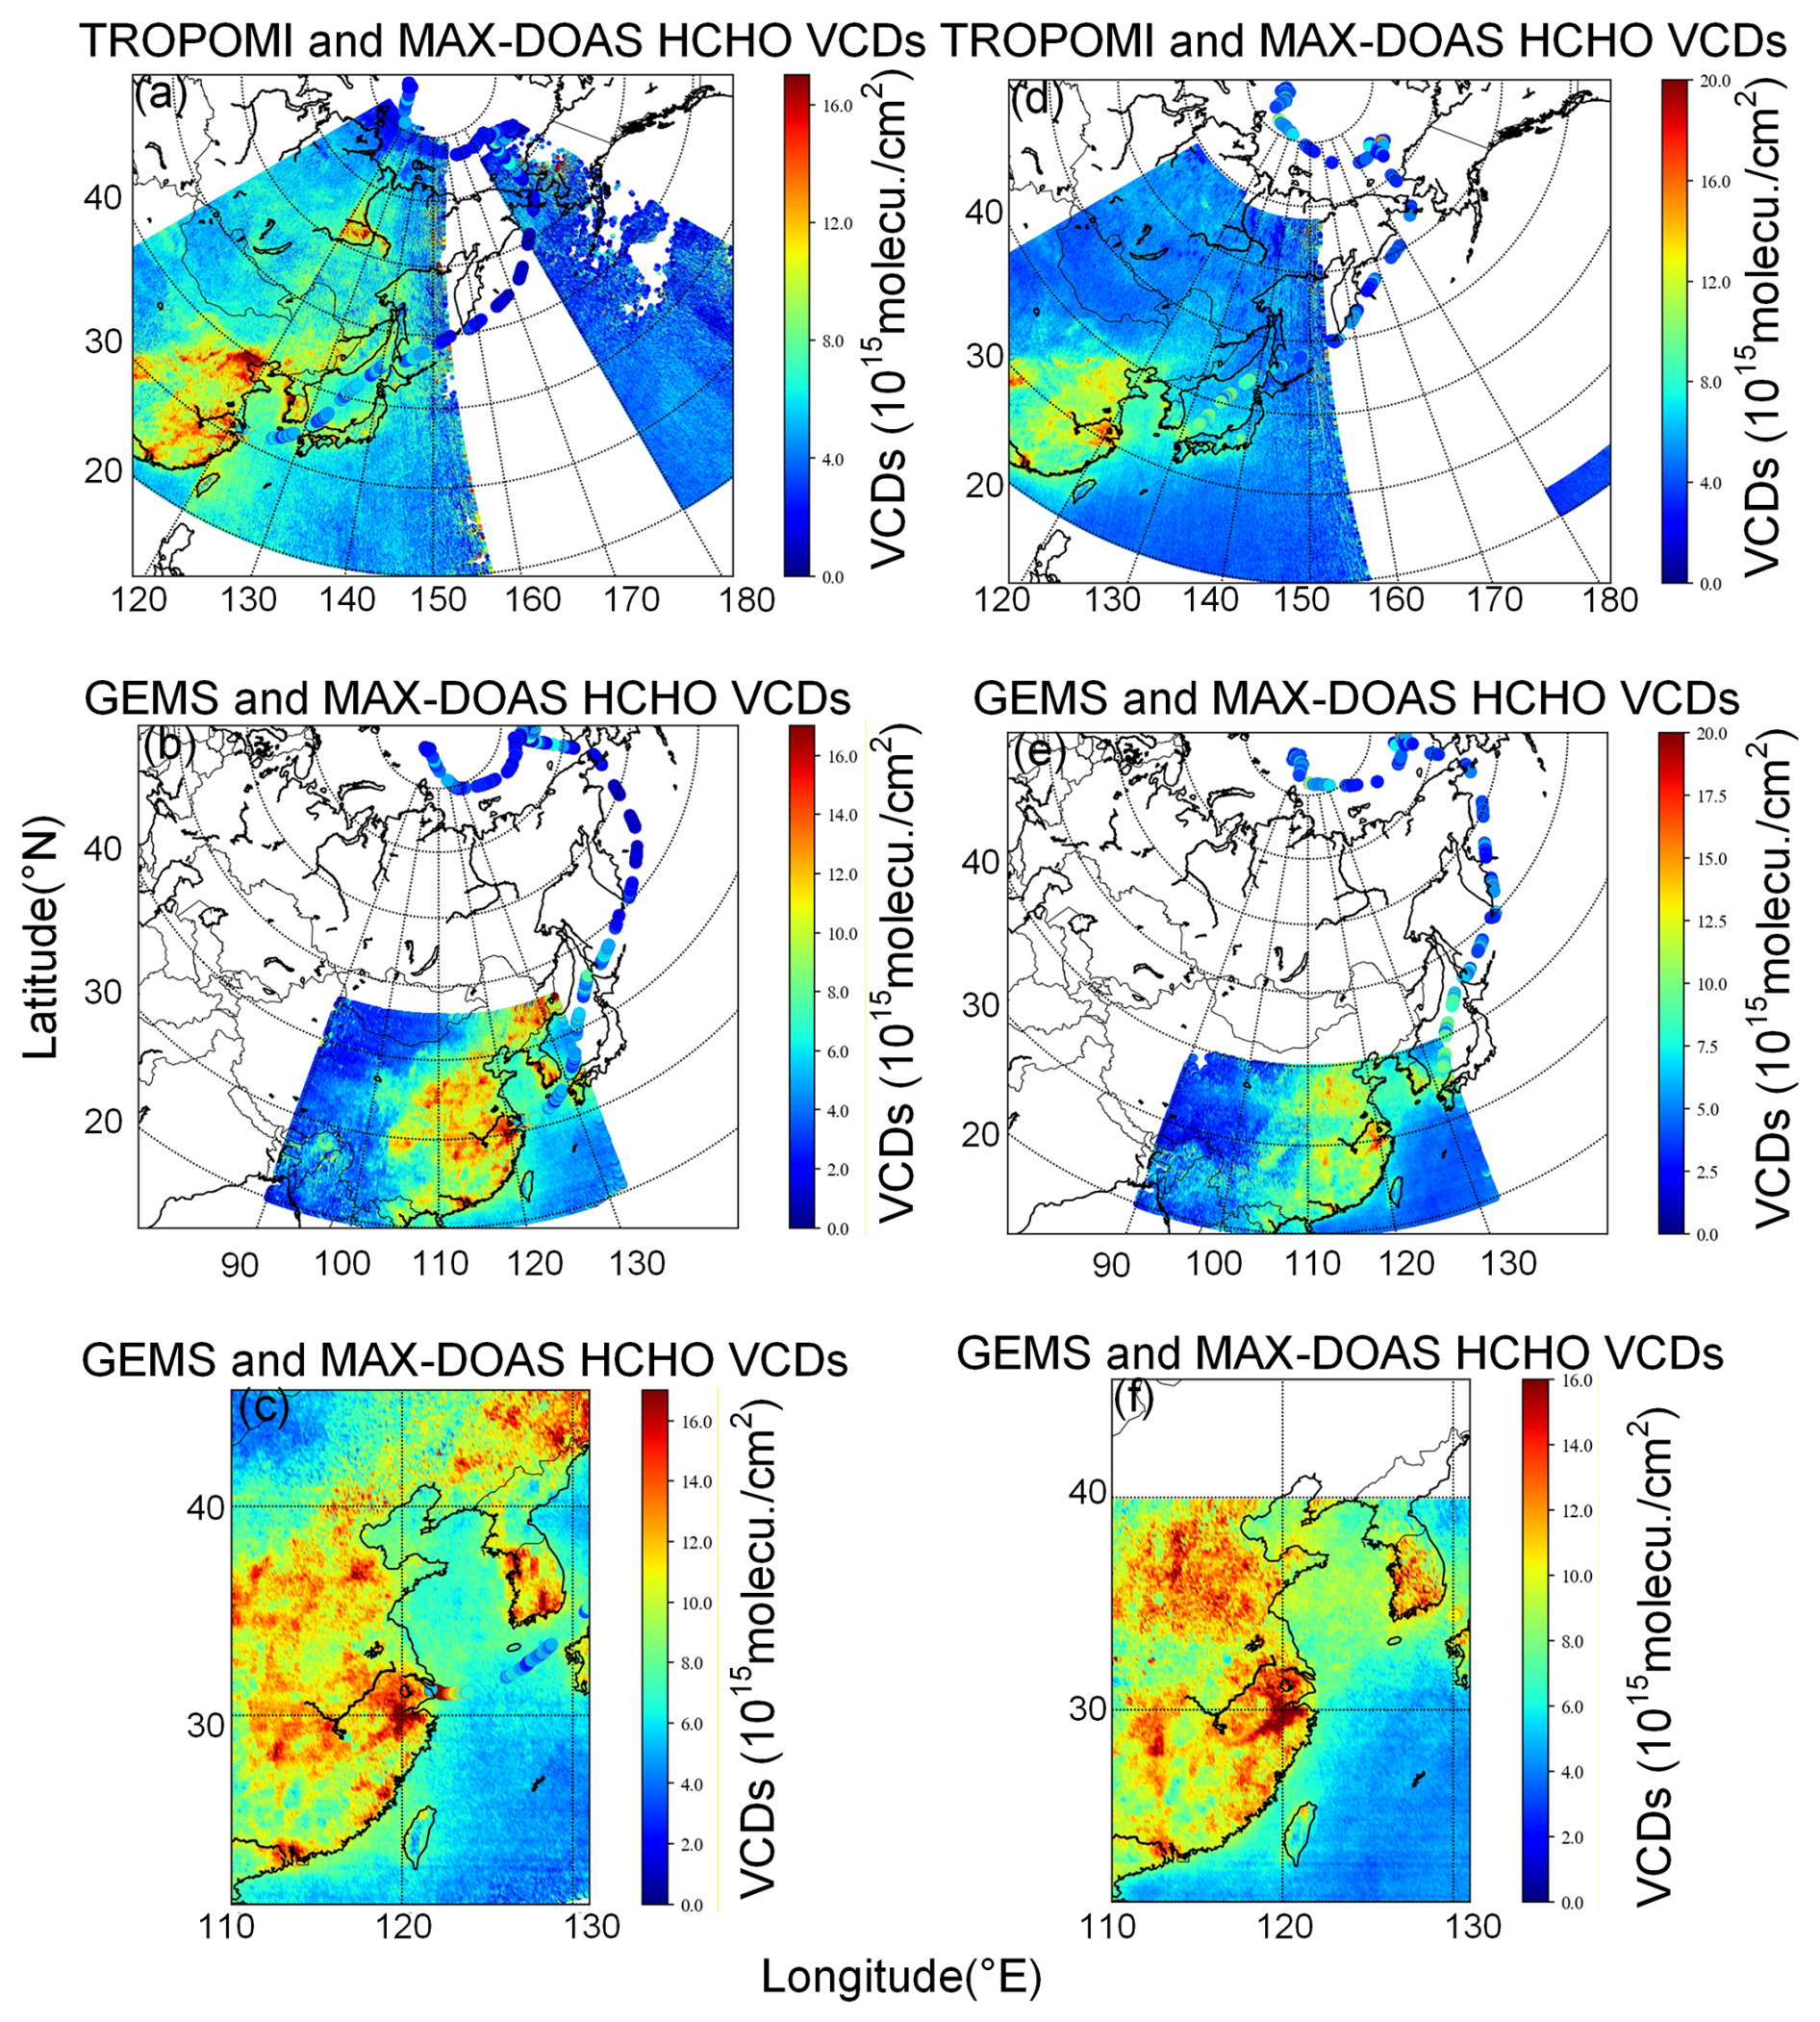
Figure 6Comparison of ship-based MAX-DOAS measured HCHO VCDs with satellite observations: (a–c) Shanghai to Arctic and (d–f) Arctic to Shanghai.
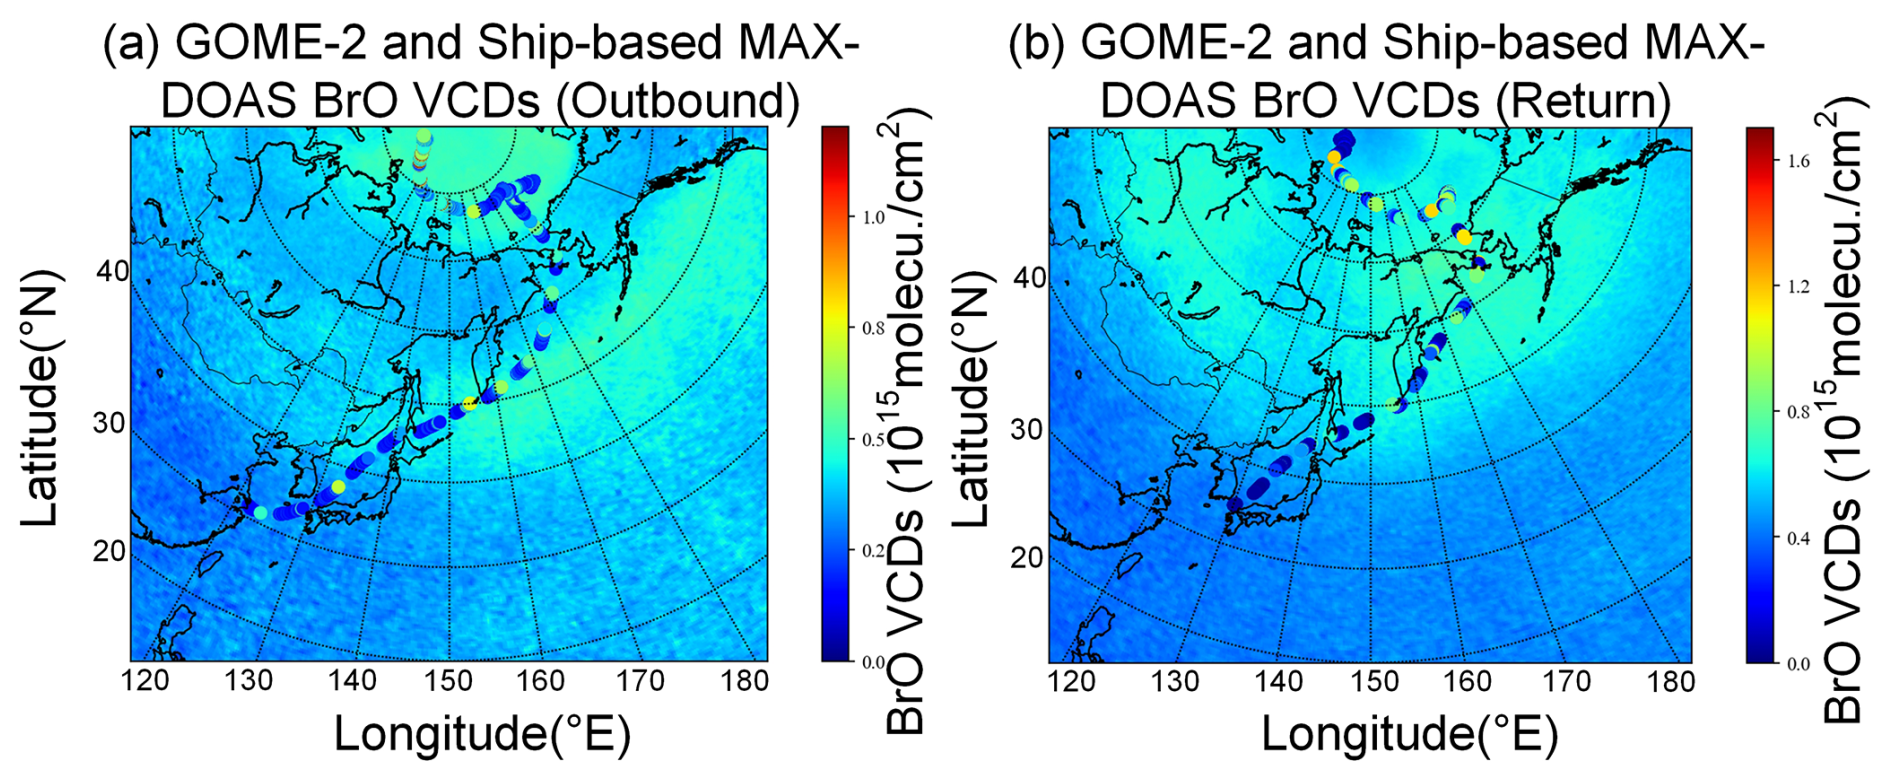
Figure 7Comparison of ship-based MAX-DOAS measured BrO VCDs with GOME-2 observations: (a) Shanghai to Arctic and (b) Arctic to Shanghai.
To ensure data reliability, satellite products with high cloud contamination (effective cloud fraction > 0.4) and poor retrieval quality (relative error > 100 %) were excluded. This filtering is necessary because cloud particles significantly interfere with ultraviolet-visible radiation transmission, altering the optical path length and leading to biases in trace gas retrieval. Qualified satellite data were temporally averaged (matching the temporal resolution of ship-based observations) and interpolated to 0.1° × 0.1° gridded data using a parabolic spline interpolation algorithm (Chan et al., 2015, 2018; Kuhlmann et al., 2014). This gridding process not only preserves the true spatial distribution of trace gases but also retains details of pollution hotspots (e.g., ports, shipping lanes), avoiding comparison biases from spatial scale mismatch (Hong et al., 2018). Since GEMS is focused on the Asia-Pacific region and its effective coverage boundary does not cover high-latitude Arctic areas, it was only used for comparison within 110–130° E, 20–45° N to ensure spatial coverage consistency with ship-based observations.
Direct comparisons in Figs. 5–7 reveal good overall consistency between ship-based MAX-DOAS and satellite observations (TROPOMI, GEMS, GOME-2). Notably, in mid-to-low-latitude marine regions (e.g., Shanghai Port, Korea Strait), the spatial localization of HCHO and NO2 high-value areas is consistent. In Arctic regions (e.g., Beaufort Sea, Bering Strait), BrO concentration trends also exhibit clear coherence. To further quantify this consistency, satellite data were gridded and averaged over daily mobile measurement areas. Correlation analysis was performed between daily mean satellite values and daily mean mobile MAX-DOAS values throughout the cruise, with results shown in Fig. 8a–c.
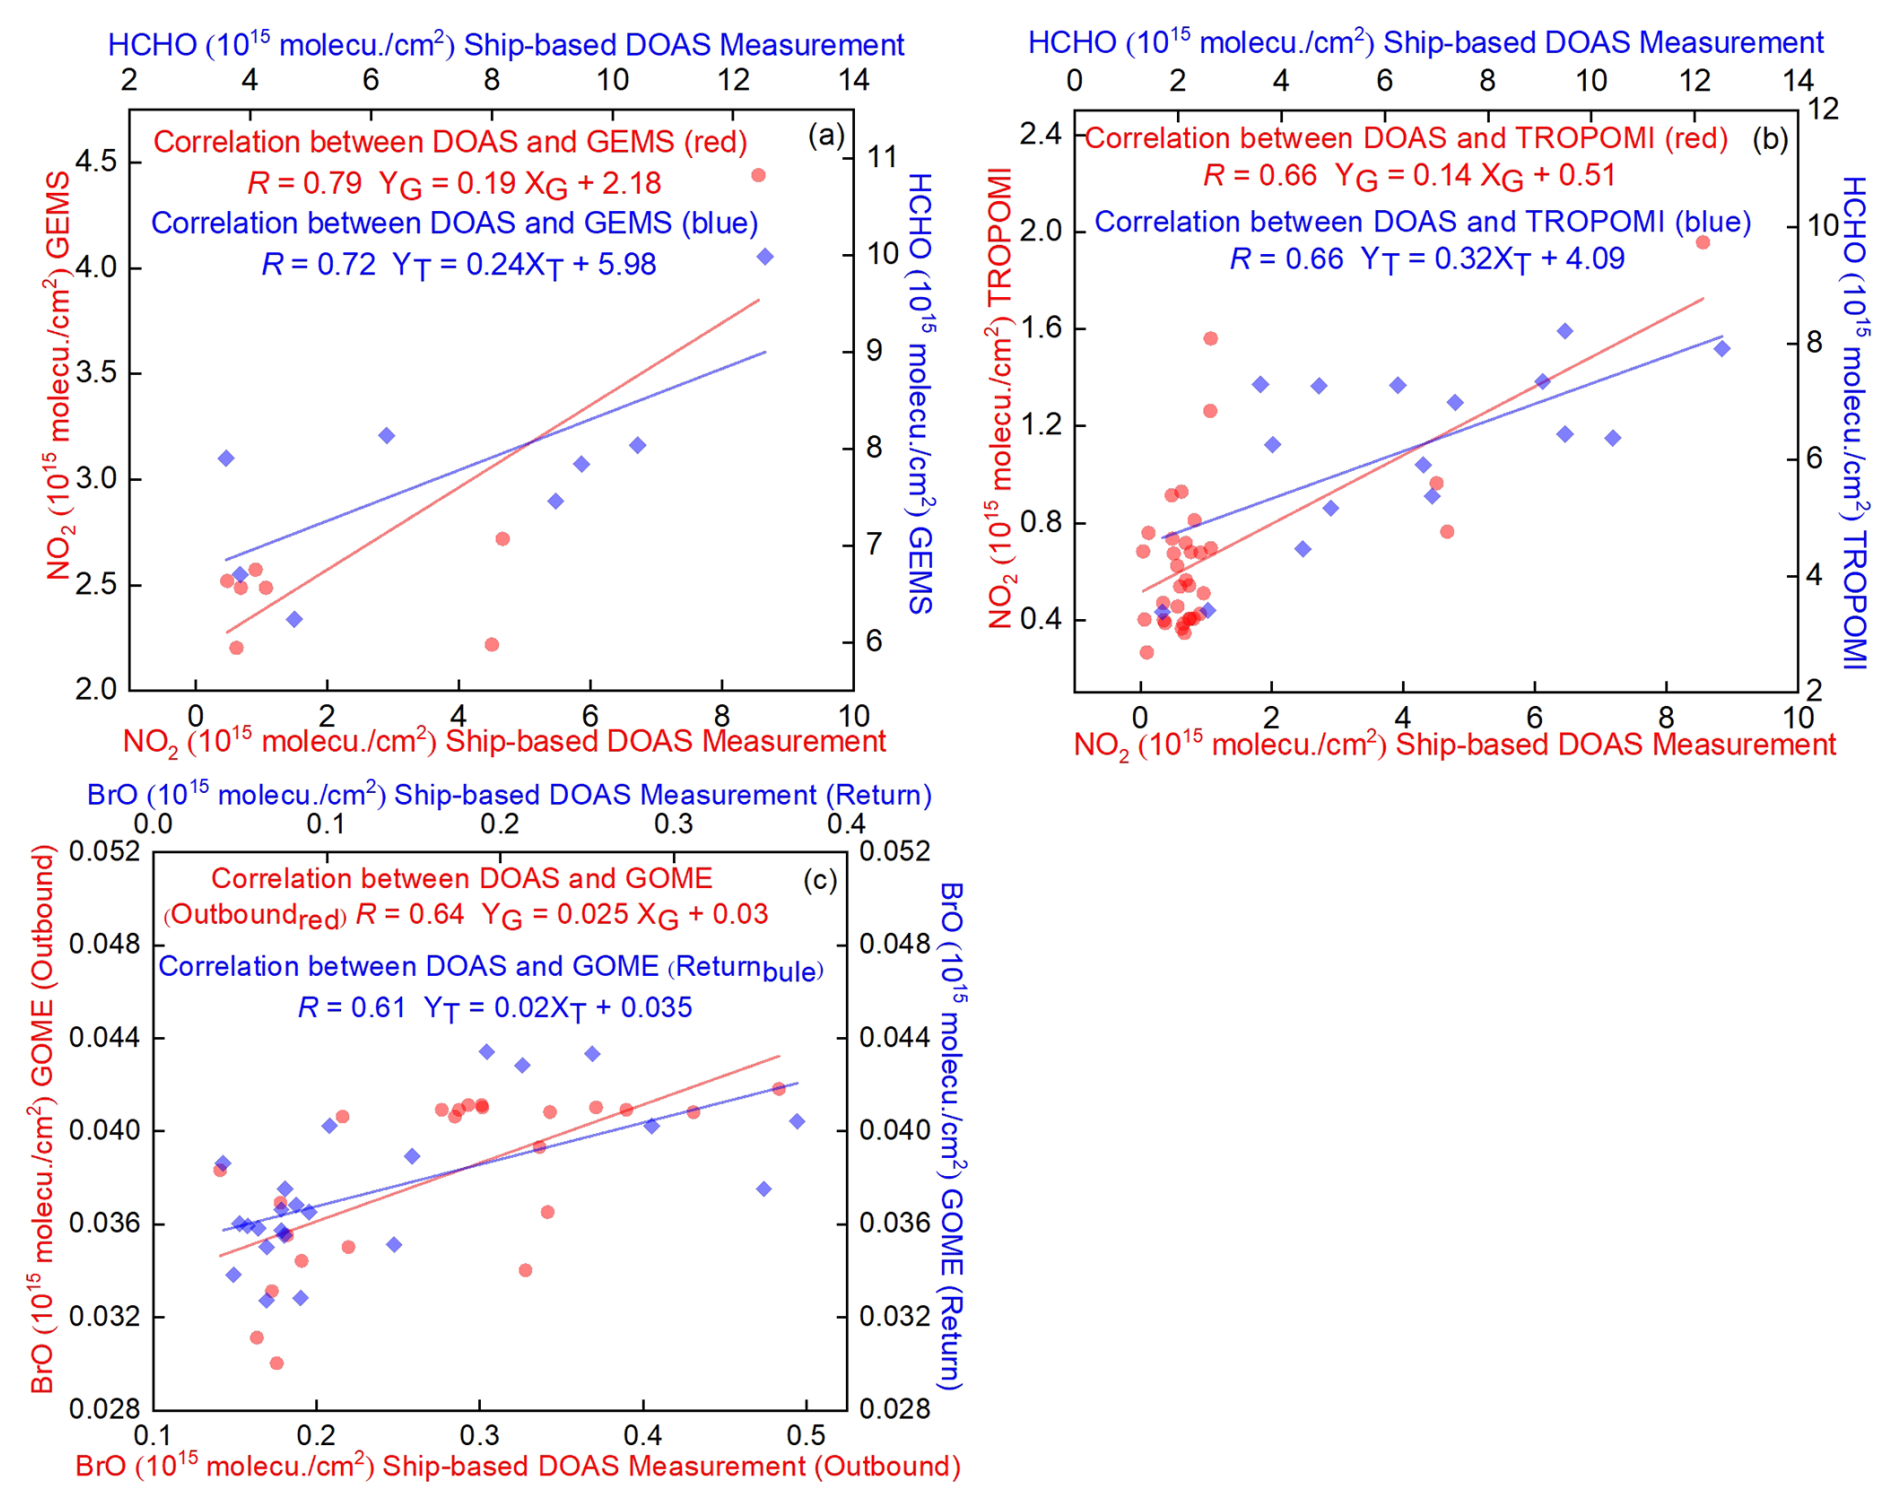
Figure 8Correlation analysis between daily measurements and satellite observations during the ship-based campaign. Panels (a) GEMS, (b) TROPOMI, (c) GOME-2.
Ship-based MAX-DOAS measured NO2 and HCHO VCDs exhibit correlation coefficients of 0.79 and 0.72 with GEMS satellite observations, respectively, and 0.66 for both species with TROPOMI observations. For BrO VCDs from round-trip ship-based measurements, correlations with GOME-2 are 0.64 (outbound) and 0.61 (return). Notably, the GEMS correlation analysis uses a relatively small sample size (constrained by its observation coverage). To rule out the confounding effect of high correlation due to small sample size, TROPOMI data of the same sample size as GEMS were selected within 110–130° E, 20–45° N for recalculation (see Fig. S4). The correlation coefficient between ship-based NO2 VCDs and TROPOMI rose to 0.73, whereas that for HCHO VCDs dropped to 0.20. This result further verifies that the strong correlation between GEMS and ship-based observations does not stem from data volume deviation, but is most likely closely linked to GEMS' higher temporal resolution (1 observation per hour). In contrast to TROPOMI's daily overpass frequency, GEMS more accurately matches the temporal dynamics of ship-based MAX-DOAS measurements, mitigating concentration biases induced by time period discrepancies.
Discrepancies between ship-based MAX-DOAS and satellite observations arise primarily from three factors: (1) Satellites have substantially lower spatial resolution than ship-based MAX-DOAS point-scale measurements and are less sensitive to local trace gas sources (e.g., transient ship emissions). In contrast, ship-based MAX-DOAS exhibits higher sensitivity to the lower atmosphere, enabling precise capture of short-term emission signals from near sea surface pollutants (Wu et al., 2018). This leads to slightly higher ship-based observations compared to satellite retrievals in trace-gas-intensive regions (e.g., ports, shipping lanes). (2) Satellite retrievals are vulnerable to aerosols and clouds in the Arctic and adjacent seas. Even with cloud fraction screening, cloud particles can modify radiative transfer paths, resulting in underestimated trace gas absorption signals. Ship-based MAX-DOAS, however, partially mitigates aerosol scattering interference through multi-azimuth observations, delivering more stable measurements. (3) VCDs from both platforms require conversion using the AMF. AMF calculations integrate multiple variables: trace gas profiles, aerosol profiles, and surface albedo. Variations in calculation assumptions thus induce VCD discrepancies.
3.3 Sources of Reactive Halogen Species in the Arctic
BrO and IO are core trace gases in polar atmospheric chemistry, but their emission pathways and driving mechanisms show significant differences. BrO concentrations are typically influenced by the coupling of physicochemical and meteorological factors, specifically the “bromine explosion cycle”, which involves complex heterogeneous reactions on various saline interfaces. In contrast, IO in the Arctic boundary layer is mainly related to direct emissions from marine biogenic sources. Therefore, this section adopts a multi-factor synergistic analysis to resolve the drivers of BrO. The analysis for IO focuses on its biogenic driving attributes, emphasizing the influence of biological activity, represented by chlorophyll a, on boundary layer IO concentrations.
3.3.1 Drivers and Modulating Factors of Arctic BrO
To clarify the primary sources of BrO and their coupling with sea-ice, this study integrated satellite remote sensing data and NSIDC sea ice concentration to analyze the spatiotemporal distribution of Arctic sea-ice from July to September 2021 (see Fig. S5). The results showed that sea-ice was in the summer ablation phase in August: dense ice was concentrated in the central Arctic Ocean and its periphery, with significant retreat of the sea ice edge zone. This spatiotemporal sea ice pattern provides a basis for subsequent analyses of air mass-sea ice contact duration and the characteristics of the sea ice edge zone in BrO source regions. Subsequently, backward trajectory analysis was performed using the HYSPLIT model to focus on the regulatory effects of air mass transport paths and sea-ice contact duration on reactive halogen concentrations, and to quantify the impact of transport processes on source contributions. Observational data from the Xuelong-2 research vessel in the high-latitude dense Arctic ice zone (6–30 August 2021) were used, with the frequently monitored representative site (86.40° N, 86.0° E) as the target location. Backward trajectories were calculated every 6 h (ending time: 19:00 UTC on 30 August), and air mass movements were simulated at three altitudes (0, 500, 1000 m) to characterize transport properties at different boundary layer heights. Backward trajectory results during the ship-based MAX-DOAS campaign are presented in Fig. S6. Sea-ice contact duration T (t, h) is defined as the cumulative time that an air mass arriving at the target location at time t and height h remains over sea ice and below the threshold height z0. Following previous studies (Frieß et al., 2001, 2004), z0 was set to 200 m within the boundary layer's near-surface mixing layer, where air undergoes sufficient exchange with the sea ice surface. This facilitates BrO formation via release of reactive bromine or sea salt aerosols (Choi et al., 2018; Jozef et al., 2024; McPhee, 2017).
Figure S7 presents backward trajectories from the Xuelong-2 research cruise on NSIDC sea ice concentration data (August 2021), with different colored curves representing air mass trajectories at 0, 500, and 1000 m altitudes. Sea-ice contact durations of the polluted air masses were calculated using the predefined threshold height, yielding durations of 30, 42, 25 and 18 h for the dates shown in the figure. With this methodological framework established, GOME-2 satellite retrievals were used to derive the average BrO VCD distribution in the Arctic and adjacent seas (July–September 2021; Fig. 9a). BrO concentrations exhibit a zonal gradient centered on the polar region: high values are concentrated in the sea ice edge zone north of 50° N and the central Arctic Ocean, while concentrations are significantly lower in mid-to-low-latitude regions south of 50° N. This distribution aligns with the classic mechanism: brine layers on sea ice surfaces and beneath snow cover provide critical reaction interfaces for the photochemical activation of halides, facilitating the multi-step conversion of bromide ions (Br−) to gaseous BrO (Begoin et al., 2010; Saiz-Lopez et al., 2008). To validate the link between source regions and latitude, the latitudinal variation of BrO concentrations (July–September) was plotted (see Fig. S8). BrO concentrations generally increase with latitude but slightly decrease in the near-polar central region (above 85° N). This phenomenon is consistent with the conclusion of Begoin et al. (2010) that Arctic BrO high values are concentrated in the sea ice edge zone. This is presumably due to lower halide activation efficiency in the fully ice-covered central Arctic compared to the sea ice edge zone, coupled with enhanced photochemical consumption of BrO, resulting in lower concentrations (Chen et al., 2023).
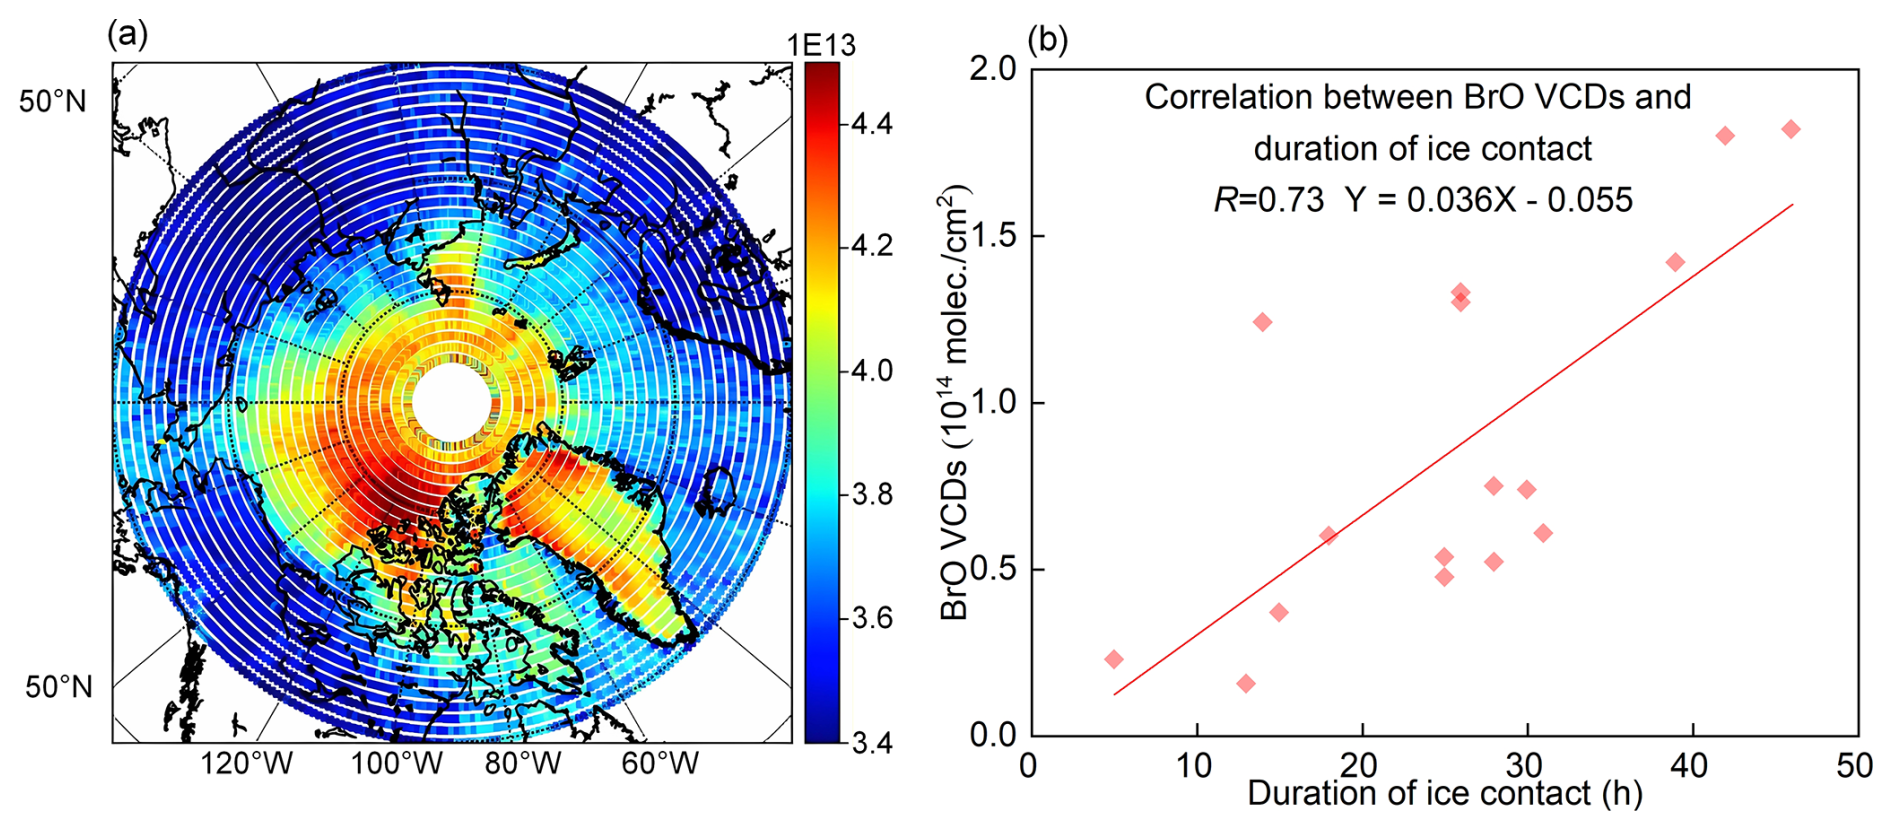
Figure 9Source region characteristics of Arctic BrO. (a) GOME-2 derived spatial distribution of BrO VCDs. (b) Correlation between air mass sea-ice contact duration and ship-based BrO VCDs.
To further validate source region characteristics, this study integrated satellite-observed BrO spatial distributions with ship-based MAX-DOAS observations. Maximum daily BrO VCDs from ship-based measurements were paired with their corresponding air mass-sea ice contact durations, and correlation analysis was performed (Fig. 9b). The two variables exhibit a positive correlation (R = 0.73), consistent with the findings of Wagner et al. (2007). This indicates that the longer air masses reside over sea ice, the higher the likelihood of absorbing halides from sea ice and participating in bromine explosion events, ultimately increasing BrO concentrations at the observation site (Wagner et al., 2007). This finding also explains the satellite-observed pattern: BrO maxima are concentrated in the sea ice edge zone rather than the fully ice-covered central Arctic. This is attributed to intense dynamic changes in the sea ice edge zone, which enhance halide activation efficiency, and air mass transport paths in these regions are more likely to satisfy the condition of prolonged sea ice contact (Cao et al., 2024).
To elucidate the synergistic impacts of environmental parameters and quantify their respective contributions to bromine activation, we employed a GAM to investigate BrO variability (see Supplement Fig. S9). The model achieved an overall correlation of R = 0.80. Our quantitative assessment identifies sea-ice contact duration as the primary driver of BrO enhancements, accounting for an independent contribution of 48.63 %. This finding statistically verifies that surface contact time is the fundamental requirement for bromine activation and subsequent accumulation. Snowfall contributes 8.81 % to the variance, where its negative correlation reflects the physical masking of saline source regions (e.g., frost flowers or salty snowpacks) by fresh snow, thereby inhibiting heterogeneous chemical reactions. While the direct contributions from wind direction (3.77 %) and boundary layer height (3.42 %) are modest, comparative subgroup analysis (e.g., R = 0.87 for snow-free periods versus R = 0.61 during snowfall) indicates that meteorological forcing primarily governs the intensity and efficiency of “bromine explosions” by modulating boundary layer stability and air mass trajectories (Bognar et al., 2020). The remaining unexplained variance (35.37 %) is likely associated with environmental drivers not captured in the current model. Comprehensive details concerning how environmental parameters modulate the relationship between BrO VCDs and sea-ice contact duration are available in Figs. S10–S17.
Using backward trajectory data, this study performed PSCF analysis to identify BrO's potential source regions and quantify their contributions to BrO concentrations at the observation site (Fig. 10). To pinpoint core potential source regions, high BrO concentrations (threshold: 6.0 × 10¹³ molec. cm−2) from ship-based MAX-DOAS observations were used as the benchmark. PSCF results indicate that high-probability potential BrO sources are concentrated in western Greenland, the seas north of North America, and the Arctic sea-ice edge zone. The sea ice dynamic processes in these regions, including halide release from sea ice melting and sea salt aerosol formation and transport, enhance bromine activation efficiency, making them the primary contributors to BrO at the observation site (Cao et al., 2024; Jozef et al., 2024). This aligns with the satellite-observed source region characteristics in Sect. 3.3.1, further confirming that sea ice is BrO's core source.
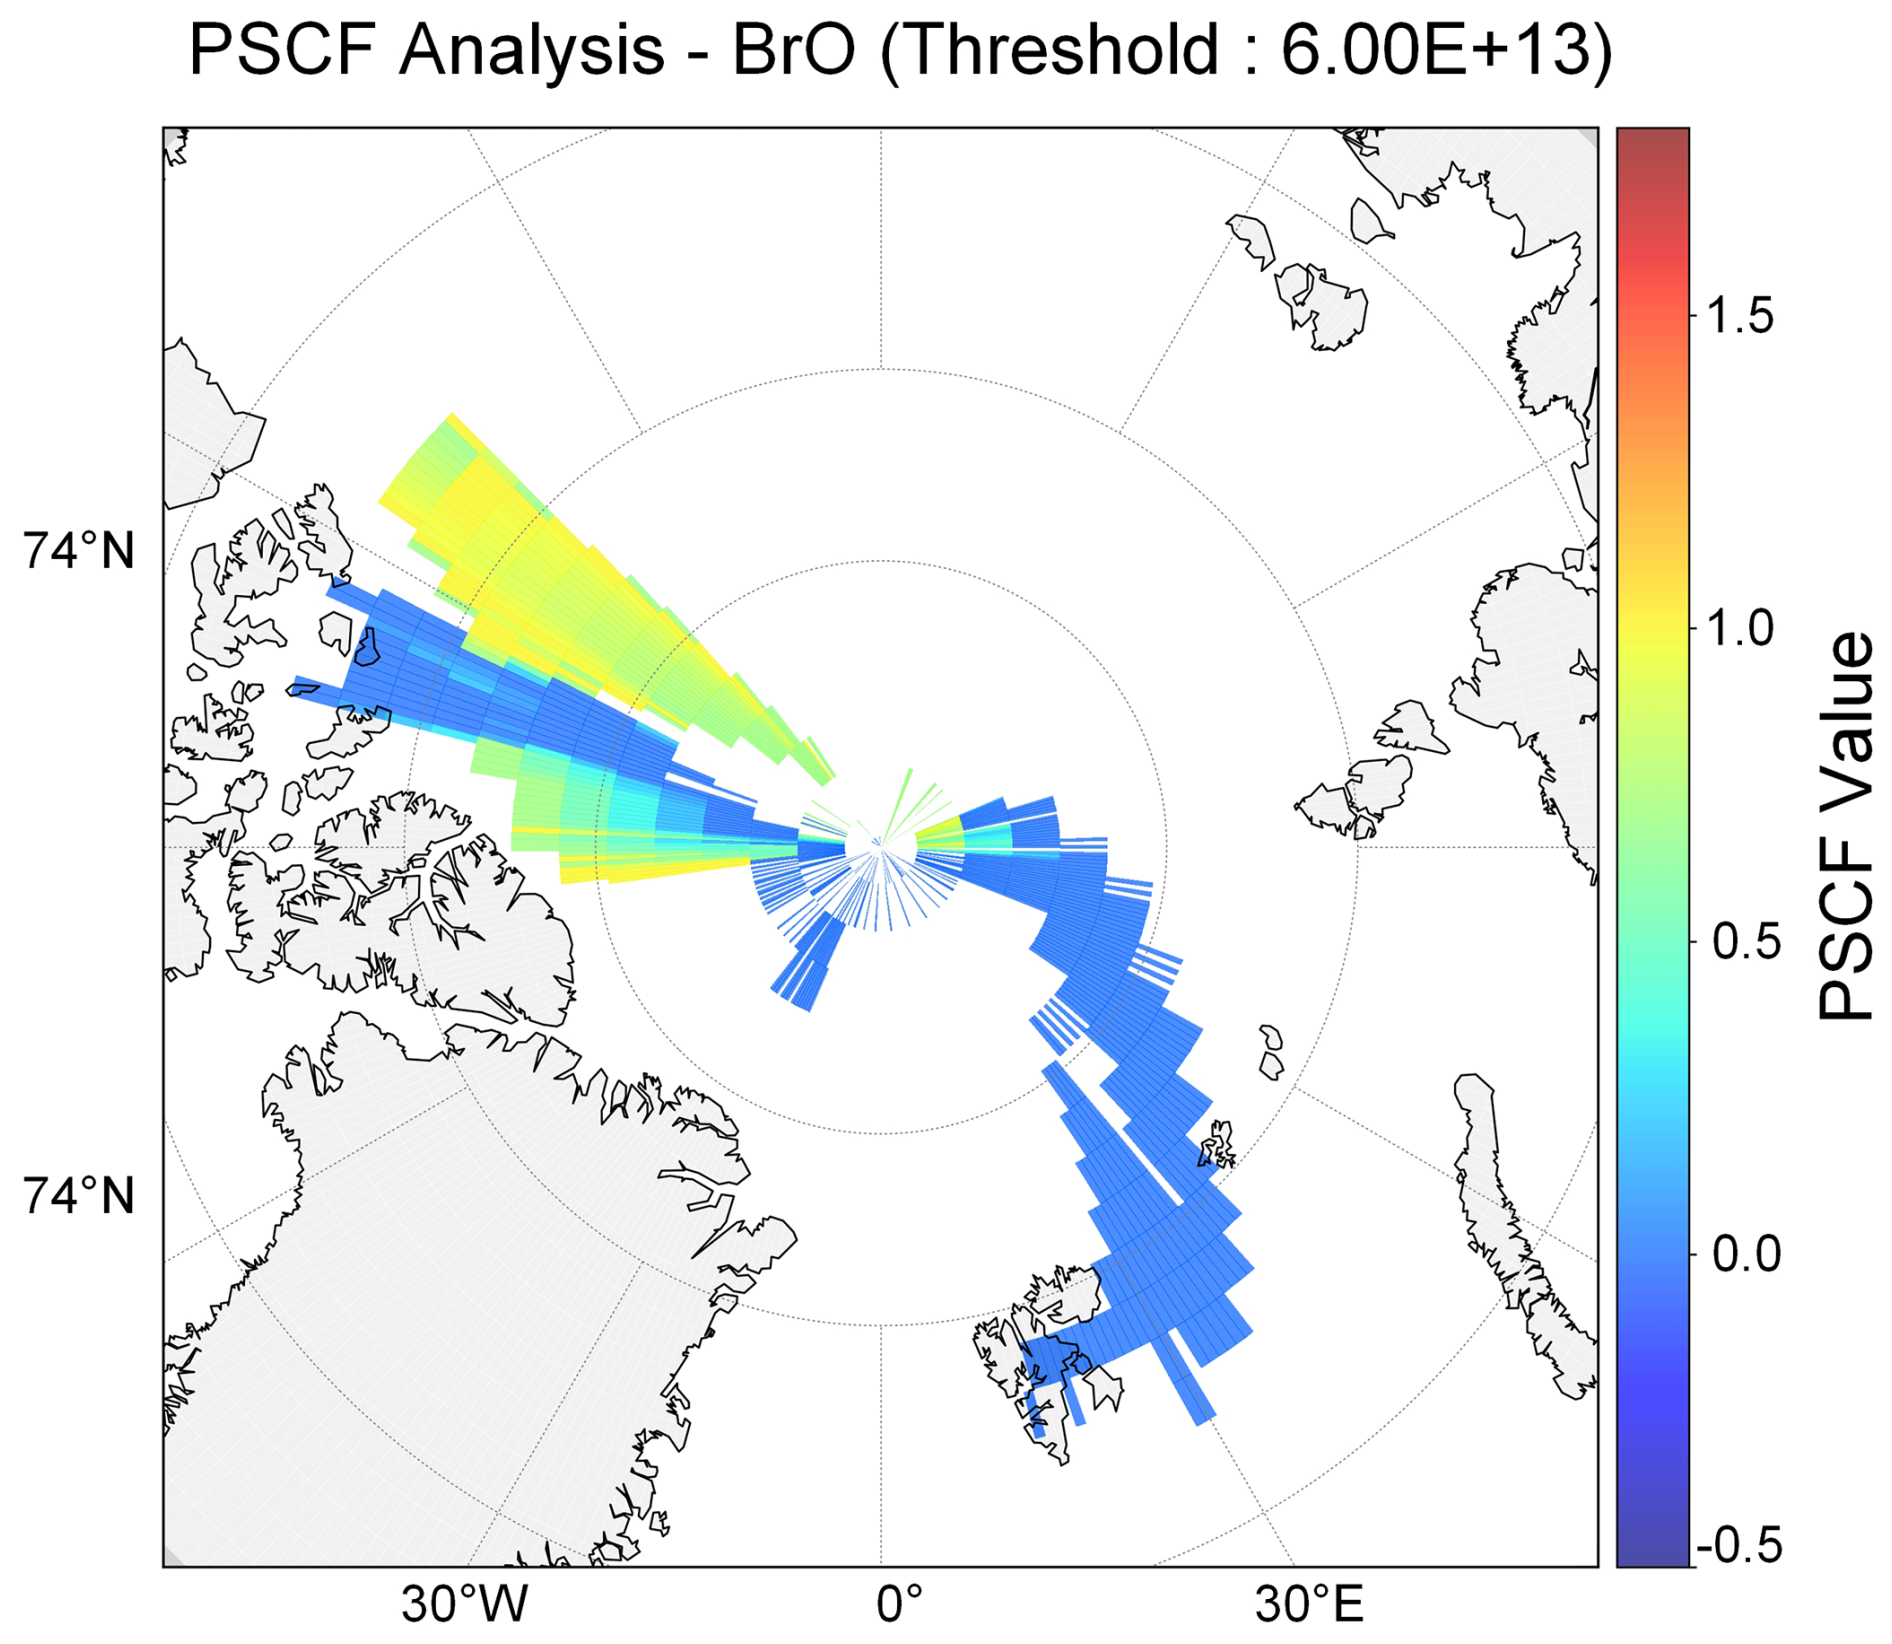
Figure 10PSCF analysis for BrO in the Arctic.
3.3.2 Biogenic Sources of IO: Coupling with Chlorophyll a Concentration
To address IO's sources, this study focused on its link to marine biological processes. Using chlorophyll a, which is a key indicator of phytoplankton biomass, as a proxy, we integrated MODIS satellite data, ship-based observations, and backward trajectory data to assess IO's biogenic source contributions from two dimensions: spatial distribution coupling and quantitative concentration correlation. First, chlorophyll a concentration spatial distribution (July–September 2021) was retrieved from MODIS satellite data (see Fig. S18). The results show that high chlorophyll a concentrations are concentrated in coastal regions, with particularly prominent signals in the Bering Strait and its vicinity. This reflects significant phytoplankton biomass accumulation in the area during late summer and early autumn (Grebmeier et al., 2006), providing a potential site for biogenic iodine enrichment.
To further verify the spatial association between high IO air masses and phytoplankton-enriched regions, backward trajectories of air masses during high IO concentration periods (Xuelong-2 cruise) were overlaid on MODIS chlorophyll a concentration data (August 2021; see Fig. S19). The results indicate that trajectories of high-probability IO sources extensively cover chlorophyll a hotspots, including the Bering Strait, southern Greenland, and coastal North Atlantic waters. This directly confirms the spatial coupling between phytoplankton biological processes and IO formation in these regions. Building on this spatial correlation and previous research, we note that phytoplankton enrich iodine in seawater via biological processes (e.g., cellular metabolism, death and decomposition) and release iodine species across the sea-water-atmosphere interface (or sea-ice brine channels). These iodine species then participate in the photochemical production of IO (Saiz-Lopez et al., 2015).
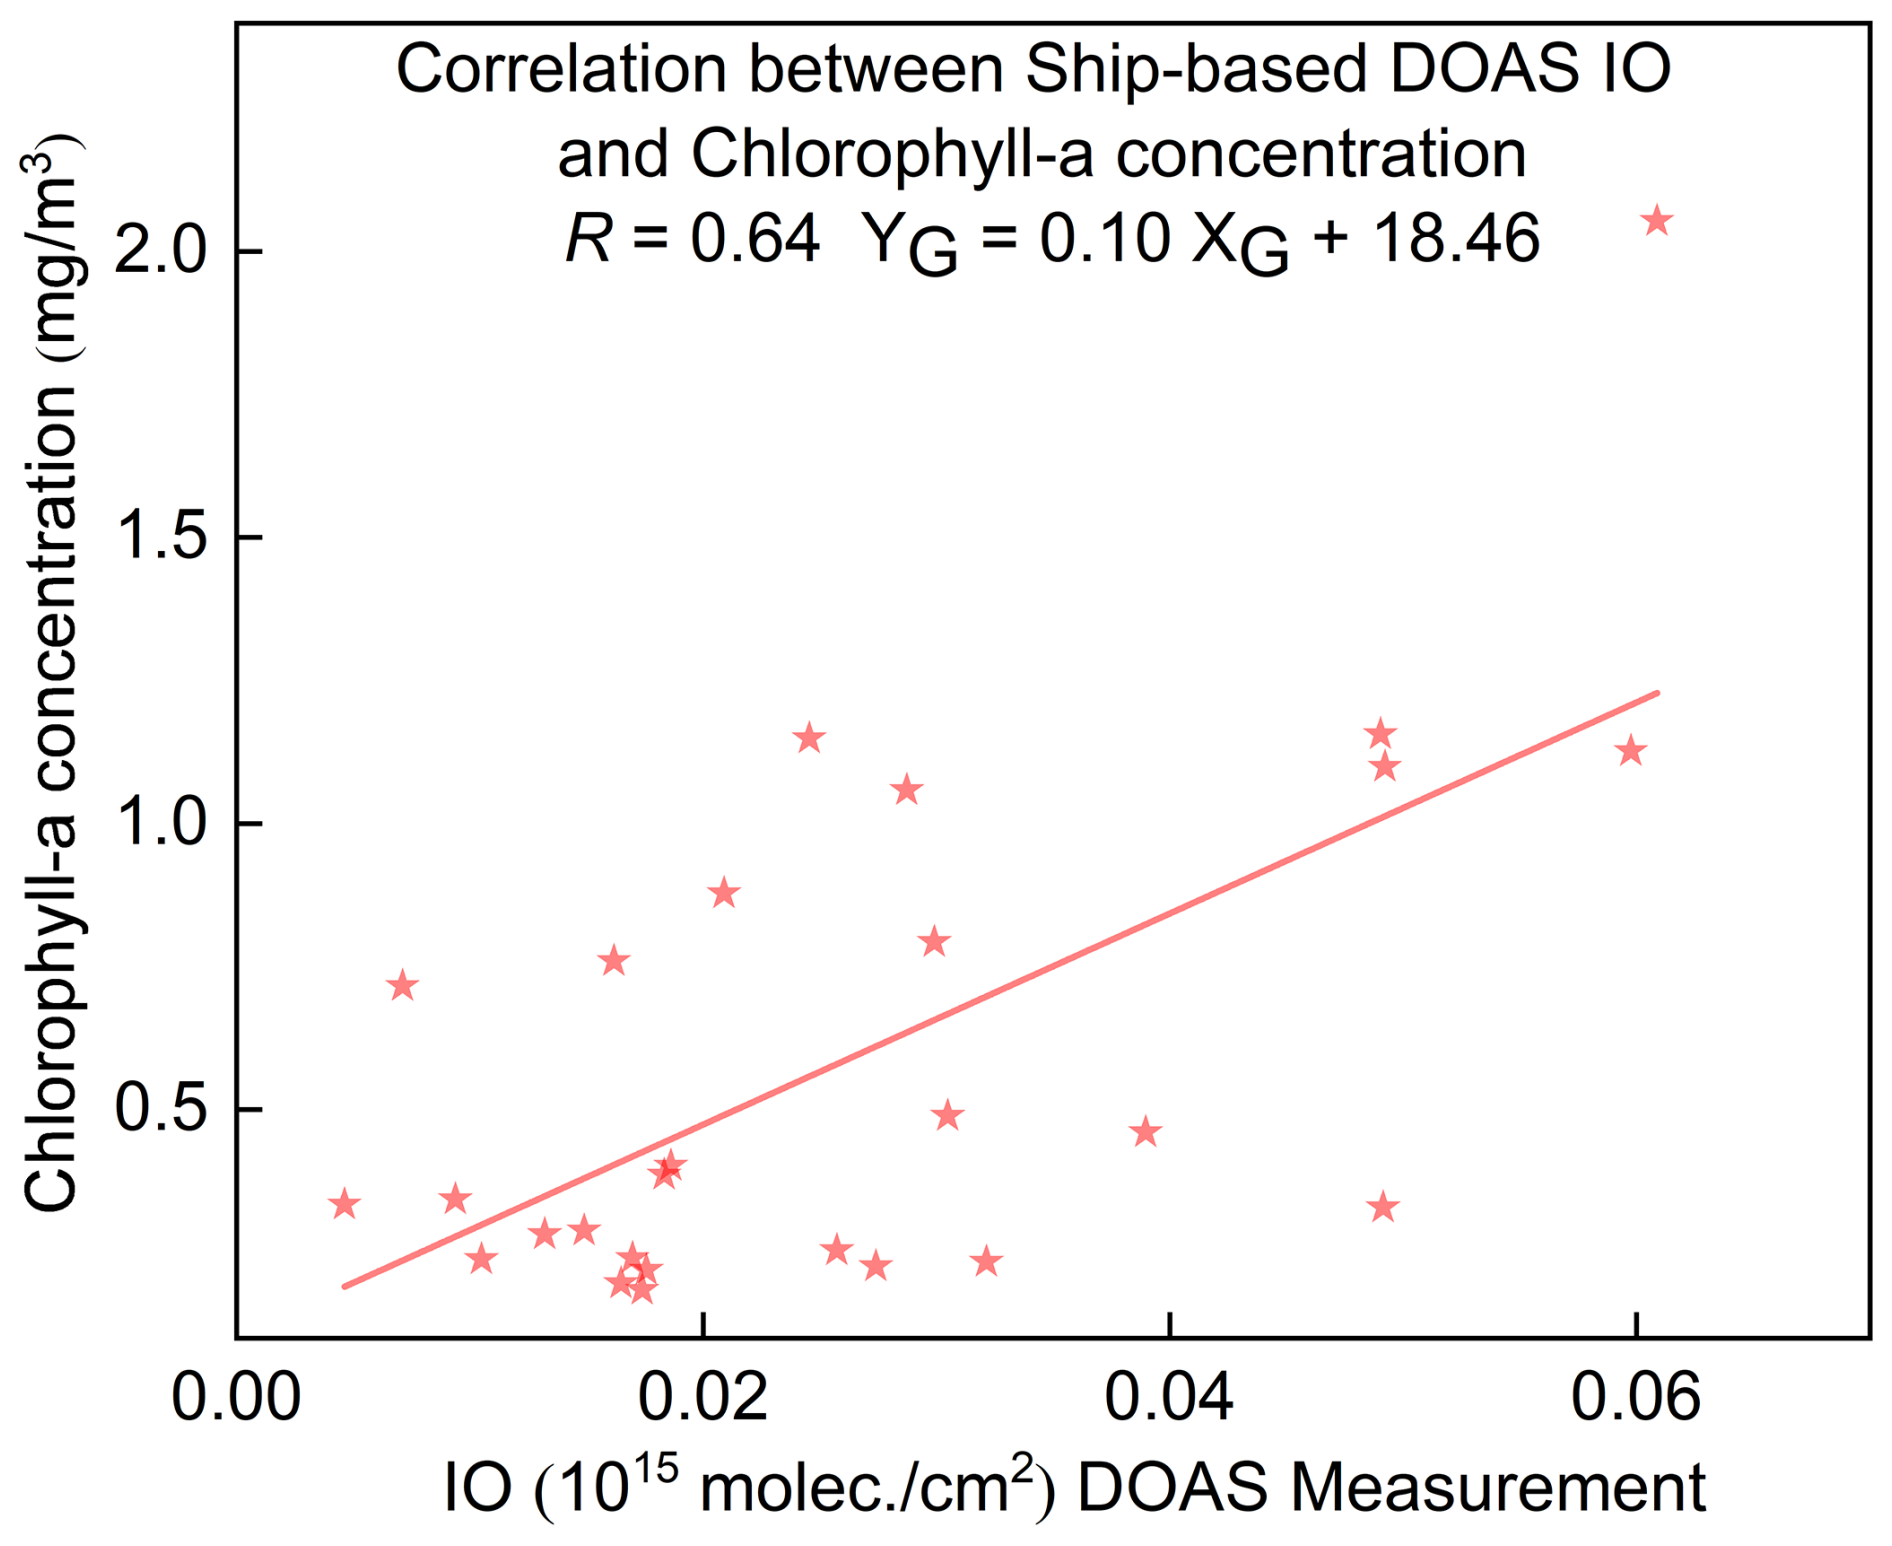
To quantify the relationship between ship-based MAX-DOAS measured IO VCDs and chlorophyll a concentrations, MODIS chlorophyll a data were averaged over a 0.1° × 0.1° grid within the daily coverage of ship-based IO observations. Correlation analysis with daily average IO VCDs yielded a moderate positive correlation (R = 0.64; Fig. 11), confirming biogenic sources as an important contributor to IO. Factors contributing to the moderate correlation may include: satellite observational constraints: MODIS cannot detect phytoplankton communities within and beneath sea ice, where the under-ice light environment and nutrient availability still support phytoplankton growth. This leads to incomplete characterization of biogenic iodine potential by chlorophyll a retrievals (Saiz-Lopez et al., 2015); Confounding abiotic processes: IO concentrations are also influenced by sea ice melting (which releases inorganic iodine) and photochemical oxidation (which regulates iodine species transformation), weakening the correlation with chlorophyll a (Saiz-Lopez et al., 2015).
Using backward trajectory data, PSCF analysis was performed to identify IO's potential source regions and quantify their contributions to IO concentrations at the observation site (Fig. 12). To delineate these source regions, ship-based high IO concentrations (threshold: 1.61 × 10¹³ molec. cm−2) were used as the benchmark. High-probability potential IO source regions are similar to those of BrO, concentrated in western Greenland, the seas north of North America, and the Arctic sea-ice edge zone. These regions likely support high phytoplankton biomass: phytoplankton enrich iodine in seawater via metabolic processes and release iodine species to the atmosphere through sea-water-atmosphere interface exchange. These species then participate in the photochemical production of reactive iodine compounds (Mahajan et al., 2021).
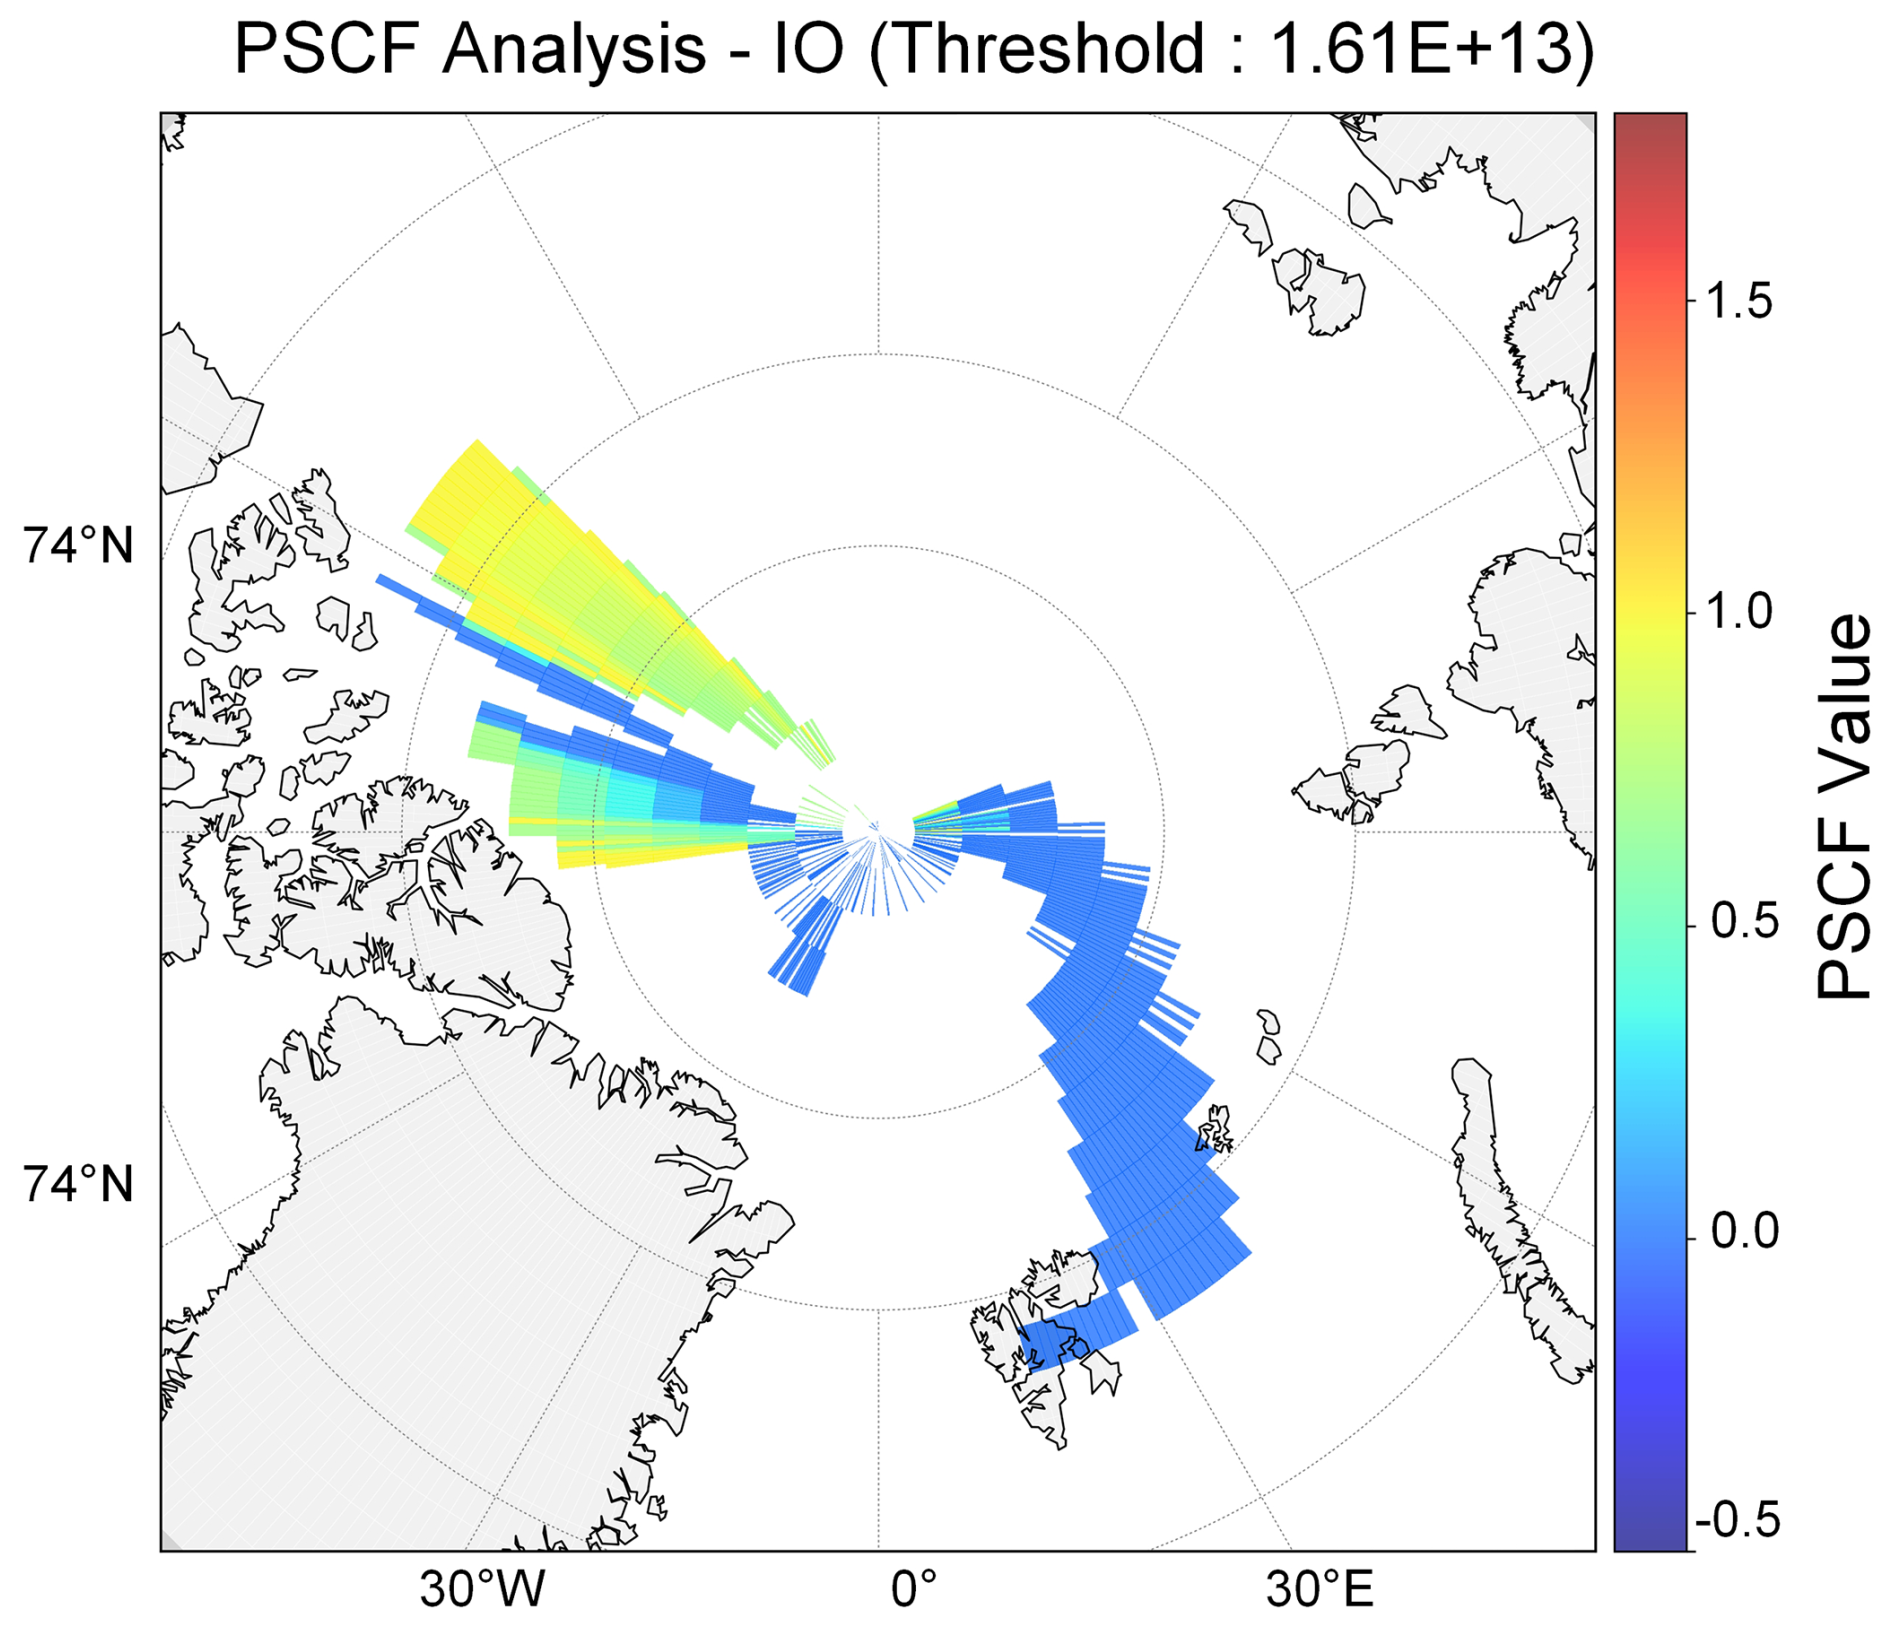
Figure 12PSCF analysis for IO in the Arctic.
Comparison of BrO and IO PSCF results reveals spatial differences in their potential source regions: BrO sources are concentrated in high-latitude sea-ice-covered areas, while IO sources are centered in mid-to-low-latitude coastal biologically active zones. In addition, correlation analysis of ship-based BrO and IO VCDs (see Fig. S20) yielded a correlation coefficient R = 0.5, indicating a moderate association between the two. This result is reasonably explained by the PSCF-identified source region characteristics: Arctic BrO and IO derive from a shared ice-ocean-atmosphere exchange environment (e.g., material exchange interfaces in the sea ice edge zone), which provides a basis for their correlation (Giesse et al., 2021; McFiggans et al., 2000; Saiz-Lopez et al., 2015); The distinct source biases revealed by PSCF, namely BrO's dominance of sea-ice sources and IO's reliance on biogenic sources, result in a relatively weak correlation.
This study presents the spatial distributions of trace gases (NO2, HCHO, BrO, and IO) captured during the 12th Chinese Arctic Scientific Expedition (July–September 2021) along a transect from Shanghai to the Arctic. Utilizing ship-based MAX-DOAS, we establish a robust ground validation dataset to assess the performance of TROPOMI, GEMS, and GOME-2 satellite products in polar regions. Statistical analyses yield correlation coefficients between 0.61 and 0.79, validating the efficacy of satellite remote sensing for monitoring atmospheric composition over the Arctic and adjacent oceans. Our findings demonstrate that tropospheric BrO is primarily controlled by sea-ice contact (SIC) duration, which accounts for 48.63 % of the variance in a GAM. Potential BrO source regions are identified in western Greenland, the high-latitude Canadian Arctic, and the marginal ice zone (MIZ). The R value between BrO and SIC improved from 0.73 to 0.77 after incorporating dynamic boundary layer height (BLH) constraints. Furthermore, meteorological conditions significantly modulate bromine activation: southwesterly winds enhanced the correlation to 0.84, whereas snowfall weakened it from 0.87 to 0.61. In contrast to the complex physicochemical regulation of BrO, IO variability is predominantly driven by biogenic emissions, correlating moderately with chlorophyll a (R = 0.64), particularly in phytoplankton-rich regions like the Bering Strait. Notably, we observe a distinct spatial divergence between the source regions of sea-ice-driven BrO and biogenic IO. However, a moderate correlation (R = 0.5) persists within the MIZ, suggesting that the ice-ocean-atmosphere interface facilitates shared precursors or formation pathways for these reactive halogens. In conclusion, this study provides high-precision validation for Arctic satellite retrievals and systematically characterizes the drivers of polar halogen species. These data offer critical constraints for optimizing emission parameterizations and halogen budget accounting in chemical transport models.
All measurement data used in this study are publicly available at Zenodo via the permanent DOI: https://doi.org/10.5281/zenodo.18072720 (Zhang et al., 2025). Additionally, they can also be made available for scientific purposes upon request to the authors (Cheng Liu, chliu81@ustc.edu.cn, and Chengzhi Xing, xingcz@aiofm.ac.cn).
The supplement related to this article is available online at https://doi.org/10.5194/acp-26-8387-2026-supplement.
QZ, CX and CL (Cheng Liu) designed the research and organized the paper. QZ wrote the paper, while CX and CL (Cheng Liu) edited it. QZ, CX, YL, HP, HL, WT, CL (Chao Liu), ZZ, WM and TT contributed to the retrieval of DOAS data and satellite data. QZ, CX, YL, HP, HL, WT, CL (Chao Liu), ZZ, WM and TT contributed to data analysis. All the above-mentioned authors contributed to the revision of the paper.
The contact author has declared that none of the authors has any competing interests.
Publisher's note: Copernicus Publications remains neutral with regard to jurisdictional claims made in the text, published maps, institutional affiliations, or any other geographical representation in this paper. The authors bear the ultimate responsibility for providing appropriate place names. Views expressed in the text are those of the authors and do not necessarily reflect the views of the publisher.
We would like to thank Zhouqing Xie's group for effectively organizing the observation. We thank the National Oceanic and Atmospheric Administration (NOAA) Air Resources Laboratory (ARL) for providing the open HYSPLIT transport and dispersion model.
This study was supported by the National Natural Science Foundation of China (grant no. 42225504).
This paper was edited by Steven Brown and reviewed by two anonymous referees.
Adachi, K., Tobo, Y., Koike, M., Freitas, G., Zieger, P., and Krejci, R.: Composition and mixing state of Arctic aerosol and cloud residual particles from long-term single-particle observations at Zeppelin Observatory, Svalbard, Atmos. Chem. Phys., 22, 14421–14439, https://doi.org/10.5194/acp-22-14421-2022, 2022.
Begoin, M., Richter, A., Weber, M., Kaleschke, L., Tian-Kunze, X., Stohl, A., Theys, N., and Burrows, J. P.: Satellite observations of long range transport of a large BrO plume in the Arctic, Atmos. Chem. Phys., 10, 6515–6526, https://doi.org/10.5194/acp-10-6515-2010, 2010.
Behrens, L. K., Hilboll, A., Richter, A., Peters, E., Alvarado, L. M. A., Kalisz Hedegaard, A. B., Wittrock, F., Burrows, J. P., and Vrekoussis, M.: Detection of outflow of formaldehyde and glyoxal from the African continent to the Atlantic Ocean with a MAX-DOAS instrument, Atmos. Chem. Phys., 19, 10257–10278, https://doi.org/10.5194/acp-19-10257-2019, 2019.
Blechschmidt, A.-M., Richter, A., Burrows, J. P., Kaleschke, L., Strong, K., Theys, N., Weber, M., Zhao, X., and Zien, A.: An exemplary case of a bromine explosion event linked to cyclone development in the Arctic, Atmos. Chem. Phys., 16, 1773–1788, https://doi.org/10.5194/acp-16-1773-2016, 2016.
Bloss, W. J., Lee, J. D., Johnson, G. P., Sommariva, R., Heard, D. E., Saiz-Lopez, A., Plane, J. M. C., McFiggans, G., Coe, H., Flynn, M., Williams, P., Rickard, A. R., and Fleming, Z. L.: Impact of halogen monoxide chemistry upon boundary layer OH and HO2 concentrations at a coastal site, Geophys. Res. Lett., 32, 1–4, https://doi.org/10.1029/2004GL022084, 2005.
Bognar, K., Zhao, X., Strong, K., Chang, R. Y. W., Frieß, U., Hayes, P. L., McClure-Begley, A., Morris, S., Tremblay, S., and Vicente-Luis, A.: Measurements of Tropospheric Bromine Monoxide Over Four Halogen Activation Seasons in the Canadian High Arctic, J. Geophys. Res.-Atmos., 125, e2020JD033015, https://doi.org/10.1029/2020JD033015, 2020.
Bougoudis, I., Blechschmidt, A.-M., Richter, A., Seo, S., Burrows, J. P., Theys, N., and Rinke, A.: Long-term time series of Arctic tropospheric BrO derived from UV–VIS satellite remote sensing and its relation to first-year sea ice, Atmos. Chem. Phys., 20, 11869–11892, https://doi.org/10.5194/acp-20-11869-2020, 2020.
Brockway, N., Peterson, P. K., Bigge, K., Hajny, K. D., Shepson, P. B., Pratt, K. A., Fuentes, J. D., Starn, T., Kaeser, R., Stirm, B. H., and Simpson, W. R.: Tropospheric bromine monoxide vertical profiles retrieved across the Alaskan Arctic in springtime, Atmos. Chem. Phys., 24, 23–40, https://doi.org/10.5194/acp-24-23-2024, 2024.
Cao, Y., Wang, Z., Liu, J., Ma, Q., Li, S., Liu, J., Li, H., Zhang, P., Chen, T., Wang, Y., Chu, B., Zhang, X., Saiz-Lopez, A., Francisco, J. S., and He, H.: Spontaneous Molecular Bromine Production in Sea-Salt Aerosols, Angew. Chem. Int. Edit., 63, e202409779, https://doi.org/10.1002/anie.202409779, 2024.
Carlos Gómez Martín, J., Spietz, P., and Burrows, J. P.: Spectroscopic studies of the I2/O3 photochemistry, J. Photoch. Photobio. A, 176, 15–38, https://doi.org/10.1016/j.jphotochem.2005.09.024, 2005.
Chan, K. L., Hartl, A., Lam, Y. F., Xie, P. H., Liu, W. Q., Cheung, H. M., Lampel, J., Poehler, D., Li, A., and Xu, J.: Observations of tropospheric NO2 using ground-based MAX-DOAS and OMI measurements during the Shanghai World Expo 2010, Atmos. Environ., 119, 45–58, https://doi.org/10.1016/j.atmosenv.2015.08.041, 2015.
Chan, K. L., Wiegner, M., Wenig, M., and Pöhler, D.: Observations of tropospheric aerosols and NO2 in Hong Kong over 5 years using ground-based MAX-DOAS, Sci. Total Environ., 619–620, 1545–1556, https://doi.org/10.1016/j.scitotenv.2017.10.153, 2018.
Chance, K. V. and Spurr, R. J. D.: Ring effect studies: Rayleigh scattering, including molecular parameters for rotational Raman scattering, and the Fraunhofer spectrum, Appl. Optics, 36, 5224–5230, https://doi.org/10.1364/AO.36.005224, 1997.
Chen, Y., Liu, S., Zhu, L., Seo, S., Richter, A., Li, X., Ding, A., Sun, W., Shu, L., Wang, X., Valks, P., Hendrick, F., Koenig, T. K., Volkamer, R., Bai, B., Wang, D., Pu, D., Sun, S., Li, J., Zuo, X., Fu, W., Li, Y., Zhang, P., Yang, X., and Fu, T. M.: Global Observations of Tropospheric Bromine Monoxide (BrO) Columns From TROPOMI, J. Geophys. Res.-Atmos., 128, e2023JD039091, https://doi.org/10.1029/2023JD039091, 2023.
Choi, S., Theys, N., Salawitch, R. J., Wales, P. A., Joiner, J., Canty, T. P., Chance, K., Suleiman, R. M., Palm, S. P., Cullather, R. I., Darmenov, A. S., da Silva, A., Kurosu, T. P., Hendrick, F., and Van Roozendael, M.: Link Between Arctic Tropospheric BrO Explosion Observed From Space and Sea-Salt Aerosols From Blowing Snow Investigated Using Ozone Monitoring Instrument BrO Data and GEOS-5 Data Assimilation System, J. Geophys. Res.-Atmos., 123, 6954–6983, https://doi.org/10.1029/2017JD026889, 2018.
Čížková, K., Láska, K., Metelka, L., and Staněk, M.: Assessment of spectral UV radiation at Marambio Base, Antarctic Peninsula, Atmos. Chem. Phys., 23, 4617–4636, https://doi.org/10.5194/acp-23-4617-2023, 2023.
Coburn, S., Dix, B., Sinreich, R., and Volkamer, R.: The CU ground MAX-DOAS instrument: characterization of RMS noise limitations and first measurements near Pensacola, FL of BrO, IO, and CHOCHO, Atmos. Meas. Tech., 4, 2421–2439, https://doi.org/10.5194/amt-4-2421-2011, 2011.
Crutzen, P. J.: The influence of nitrogen oxides on the atmospheric ozone content, Q. J. Roy. Meteor. Soc., 96, 320–325, https://doi.org/10.1002/qj.49709640815, 1970.
Cuevas, C. A., Maffezzoli, N., Corella, J. P., Spolaor, A., Vallelonga, P., Kjær, H. A., Simonsen, M., Winstrup, M., Vinther, B., Horvat, C., Fernandez, R. P., Kinnison, D., Lamarque, J. F., Barbante, C., and Saiz-Lopez, A.: Rapid increase in atmospheric iodine levels in the North Atlantic since the mid-20th century, Nat. Commun., 9, 1452, https://doi.org/10.1038/s41467-018-03756-1, 2018.
Dameris, M., Loyola, D. G., Nützel, M., Coldewey-Egbers, M., Lerot, C., Romahn, F., and van Roozendael, M.: Record low ozone values over the Arctic in boreal spring 2020, Atmos. Chem. Phys., 21, 617–633, https://doi.org/10.5194/acp-21-617-2021, 2021.
de Laat, A., van Geffen, J., Stammes, P., van der A, R., Eskes, H., and Veefkind, J. P.: The Antarctic stratospheric nitrogen hole: Southern Hemisphere and Antarctic springtime total nitrogen dioxide and total ozone variability as observed by Sentinel-5p TROPOMI, Atmos. Chem. Phys., 24, 4511–4535, https://doi.org/10.5194/acp-24-4511-2024, 2024.
Fleischmann, O. C., Hartmann, M., Burrows, J. P., and Orphal, J.: New ultraviolet absorption cross-sections of BrO at atmospheric temperatures measured by time-windowing Fourier transform spectroscopy, J. Photoch. Photobio. A, 168, 117–132, https://doi.org/10.1016/j.jphotochem.2004.03.026, 2004.
Frieß, U., Wagner, T., Pundt, I., Pfeilsticker, K., and Platt, U.: Spectroscopic measurements of tropospheric iodine oxide at Neumayer Station, Antarctica, Geophys. Res. Lett., 28, 1941–1944, https://doi.org/10.1029/2000GL012784, 2001.
Frieß, U., Hollwedel, J., König-Langlo, G., Wagner, T., and Platt, U.: Dynamics and chemistry of tropospheric bromine explosion events in the Antarctic coastal region, J. Geophys. Res.-Atmos., 109, D06305, https://doi.org/10.1029/2003JD004133, 2004.
Frieß, U., Deutschmann, T., Gilfedder, B. S., Weller, R., and Platt, U.: Iodine monoxide in the Antarctic snowpack, Atmos. Chem. Phys., 10, 2439–2456, https://doi.org/10.5194/acp-10-2439-2010, 2010.
Frieß, U., Sihler, H., Sander, R., Pöhler, D., Yilmaz, S., and Platt, U.: The vertical distribution of BrO and aerosols in the Arctic: Measurements by active and passive differential optical absorption spectroscopy, J. Geophys. Res.-Atmos., 116, D00R04, https://doi.org/10.1029/2011JD015938, 2011.
Frieß, U., Klein Baltink, H., Beirle, S., Clémer, K., Hendrick, F., Henzing, B., Irie, H., de Leeuw, G., Li, A., Moerman, M. M., van Roozendael, M., Shaiganfar, R., Wagner, T., Wang, Y., Xie, P., Yilmaz, S., and Zieger, P.: Intercomparison of aerosol extinction profiles retrieved from MAX-DOAS measurements, Atmos. Meas. Tech., 9, 3205–3222, https://doi.org/10.5194/amt-9-3205-2016, 2016.
Frieß, U., Kreher, K., Querel, R., Schmithüsen, H., Smale, D., Weller, R., and Platt, U.: Source mechanisms and transport patterns of tropospheric bromine monoxide: findings from long-term multi-axis differential optical absorption spectroscopy measurements at two Antarctic stations, Atmos. Chem. Phys., 23, 3207–3232, https://doi.org/10.5194/acp-23-3207-2023, 2023.
Giesse, C., Notz, D., and Baehr, J.: On the Origin of Discrepancies Between Observed and Simulated Memory of Arctic Sea Ice, Geophys. Res. Lett., 48, e91784, https://doi.org/10.1029/2020GL091784, 2021.
Gong, W., Beagley, S. R., Toyota, K., Skov, H., Christensen, J. H., Lupu, A., Pendlebury, D., Zhang, J., Im, U., Kanaya, Y., Saiz-Lopez, A., Sommariva, R., Effertz, P., Halfacre, J. W., Jepsen, N., Kivi, R., Koenig, T. K., Müller, K., Nordstrøm, C., Petropavlovskikh, I., Shepson, P. B., Simpson, W. R., Solberg, S., Staebler, R. M., Tarasick, D. W., Van Malderen, R., and Vestenius, M.: Modelling Arctic lower-tropospheric ozone: processes controlling seasonal variations, Atmos. Chem. Phys., 25, 8355–8405, https://doi.org/10.5194/acp-25-8355-2025, 2025.
Grebmeier, J. M., Overland, J. E., Moore, S. E., Farley, E. V., Carmack, E. C., Cooper, L. W., Frey, K. E., Helle, J. H., McLaughlin, F. A., and McNutt, S. L.: A Major Ecosystem Shift in the Northern Bering Sea, Science, 311, 1461–1464, https://doi.org/10.1126/science.1121365, 2006.
Hao, Y., Li, P., Gou, Y., Wang, Z., Tian, M., Chen, Y., Kuang, Y., Xu, H., Wan, F., Luo, Y., Huang, W., and Chen, J.: Divergent changes in aerosol optical hygroscopicity and new particle formation during a heatwave of summer 2022, Atmos. Chem. Phys., 25, 12811–12830, https://doi.org/10.5194/acp-25-12811-2025, 2025.
Hara, K., Osada, K., Yabuki, M., Matoba, S., Hirabayashi, M., Fujita, S., Nakazawa, F., and Yamanouchi, T.: Atmospheric sea-salt and halogen cycles in the Antarctic, Environ. Sci., 22, 2003–2022, https://doi.org/10.1039/D0EM00092B, 2020.
Hendrick, F., Van Roozendael, M., Chipperfield, M. P., Dorf, M., Goutail, F., Yang, X., Fayt, C., Hermans, C., Pfeilsticker, K., Pommereau, J.-P., Pyle, J. A., Theys, N., and De Mazière, M.: Retrieval of stratospheric and tropospheric BrO profiles and columns using ground-based zenith-sky DOAS observations at Harestua, 60° N, Atmos. Chem. Phys., 7, 4869–4885, https://doi.org/10.5194/acp-7-4869-2007, 2007.
Hindley, N. P., Wright, C. J., Smith, N. D., Hoffmann, L., Holt, L. A., Alexander, M. J., Moffat-Griffin, T., and Mitchell, N. J.: Gravity waves in the winter stratosphere over the Southern Ocean: high-resolution satellite observations and 3-D spectral analysis, Atmos. Chem. Phys., 19, 15377–15414, https://doi.org/10.5194/acp-19-15377-2019, 2019.
Hong, Q., Liu, C., Chan, K. L., Hu, Q., Xie, Z., Liu, H., Si, F., and Liu, J.: Ship-based MAX-DOAS measurements of tropospheric NO2, SO2, and HCHO distribution along the Yangtze River, Atmos. Chem. Phys., 18, 5931–5951, https://doi.org/10.5194/acp-18-5931-2018, 2018.
Hwang, J. H. and Kang, D. W.: Emission Control Routes in Liner Shipping between Korea and Japan, J. Mar. Sci. Eng., 11, 2250, https://doi.org/10.3390/jmse11122250, 2023.
Jozef, G. C., Cassano, J. J., Dahlke, S., Dice, M., Cox, C. J., and de Boer, G.: An overview of the vertical structure of the atmospheric boundary layer in the central Arctic during MOSAiC, Atmos. Chem. Phys., 24, 1429–1450, https://doi.org/10.5194/acp-24-1429-2024, 2024.
Khosravi, S., Rinke, A., Dorn, W., Lüpkes, C., Gryanik, V., Chechin, D., Jaiser, R., and Handorf, D.: The role of air-sea ice-ocean interaction processes for Arctic-midlatitude linkages, EGU General Assembly 2020, Online, 4–8 May 2020, EGU2020-15116, https://doi.org/10.5194/egusphere-egu2020-15116, 2020
Kuhlmann, G., Hartl, A., Cheung, H. M., Lam, Y. F., and Wenig, M. O.: A novel gridding algorithm to create regional trace gas maps from satellite observations, Atmos. Meas. Tech., 7, 451–467, https://doi.org/10.5194/amt-7-451-2014, 2014.
Luo, Y., Si, F., Zhou, H., Dou, K., Liu, Y., and Liu, W.: Observations and source investigations of the boundary layer bromine monoxide (BrO) in the Ny-Ålesund Arctic, Atmos. Chem. Phys., 18, 9789–9801, https://doi.org/10.5194/acp-18-9789-2018, 2018.
Mahajan, A. S., Biswas, M. S., Beirle, S., Wagner, T., Schönhardt, A., Benavent, N., and Saiz-Lopez, A.: Observations of iodine monoxide over three summers at the Indian Antarctic bases of Bharati and Maitri, Atmos. Chem. Phys., 21, 11829–11842, https://doi.org/10.5194/acp-21-11829-2021, 2021.
Mahajan, A. S., Wagh, S., Fernandez, R. P., Singh, S., Bucci, S., and Saiz-Lopez, A.: Differences in iodine chemistry over the Antarctic continent, Polar Sci., 40, 101014, https://doi.org/10.1016/j.polar.2023.101014, 2024.
McFiggans, G., Plane, J. M. C., Allan, B. J., Carpenter, L. J., Coe, H., and O'Dowd, C.: A modeling study of iodine chemistry in the marine boundary layer, J. Geophys. Res.-Atmos., 105, 14371–14385, https://doi.org/10.1029/1999JD901187, 2000.
McPhee, M. G.: The sea ice–ocean boundary layer, Sea Ice, 138–159, https://doi.org/10.1002/9781118778371.ch5, 2017.
Meller, R. and Moortgat, G. K.: Temperature dependence of the absorption cross sections of formaldehyde between 223 and 323 K in the wavelength range 225-375 nm, J. Geophys. Res.-Atmos., 105, 7089–7101, https://doi.org/10.1029/1999JD901074, 2000.
Nasse, J.-M., Zielcke, J., Frieß, U., Lampel, J., König-Langlo, G., and Platt, U.: Inference of cloud altitude and optical properties from MAX-DOAS measurements, Geophysical Research Abstracts, Vol. 17, EGU2015-7232, https://meetingorganizer.copernicus.org/EGU2015/EGU2015-7232.pdf (last access: 25 May 2026), 2015a.
Nasse, J.-M., Zielcke, J., Lampel, J., Buxmann, J., Frieß, U., and Platt, U.: Vertical distribution of tropospheric BrO in the marginal sea ice zone of the Northern Weddell Sea, Geophysical Research Abstracts, Vol. 17, EGU2015-7150, https://meetingorganizer.copernicus.org/EGU2015/EGU2015-7150.pdf (last access: 25 May 2026), 2015b.
Park, J., Kang, H., Gim, Y., Jang, E., Park, K.-T., Park, S., Jung, C. H., Ceburnis, D., O'Dowd, C., and Yoon, Y. J.: New particle formation leads to enhanced cloud condensation nuclei concentrations on the Antarctic Peninsula, Atmos. Chem. Phys., 23, 13625–13646, https://doi.org/10.5194/acp-23-13625-2023, 2023.
Pernov, J. B., Bossi, R., Lebourgeois, T., Nøjgaard, J. K., Holzinger, R., Hjorth, J. L., and Skov, H.: Atmospheric VOC measurements at a High Arctic site: characteristics and source apportionment, Atmos. Chem. Phys., 21, 2895–2916, https://doi.org/10.5194/acp-21-2895-2021, 2021.
Peterson, P. K., Pöhler, D., Sihler, H., Zielcke, J., General, S., Frieß, U., Platt, U., Simpson, W. R., Nghiem, S. V., Shepson, P. B., Stirm, B. H., Dhaniyala, S., Wagner, T., Caulton, D. R., Fuentes, J. D., and Pratt, K. A.: Observations of bromine monoxide transport in the Arctic sustained on aerosol particles, Atmos. Chem. Phys., 17, 7567–7579, https://doi.org/10.5194/acp-17-7567-2017, 2017.
Polissar, A. V., Hopke, P. K., and Harris, J. M.: Source regions for atmospheric aerosol measured at Barrow, Alaska, Environ. Sci. Technol., 35, 4214–4226, https://doi.org/10.1021/es0107529, 2001.
Polvani, L. M., Previdi, M., England, M. R., Chiodo, G., and Smith, K. L.: Substantial twentieth-century Arctic warming caused by ozone-depleting substances, Nat. Clim. Change, 10, 130–133, https://doi.org/10.1038/s41558-019-0677-4, 2020.
Prados-Roman, C., Gómez-Martín, L., Puentedura, O., Navarro-Comas, M., Iglesias, J., de Mingo, J. R., Pérez, M., Ochoa, H., Barlasina, M. E., Carbajal, G., and Yela, M.: Reactive bromine in the low troposphere of Antarctica: estimations at two research sites, Atmos. Chem. Phys., 18, 8549–8570, https://doi.org/10.5194/acp-18-8549-2018, 2018.
Pratt, K. A., Custard, K. D., Shepson, P. B., Douglas, T. A., Pöhler, D., General, S., Zielcke, J., Simpson, W. R., Platt, U., Tanner, D. J., Gregory Huey, L., Carlsen, M., and Stirm, B. H.: Photochemical production of molecular bromine in Arctic surface snowpacks, Nat. Geosci., 6, 351–356, https://doi.org/10.1038/ngeo1779, 2013.
Ranjithkumar, A., Duncan, E., Yang, X., Partridge, D., and Frey, M.: Modelling sea salt aerosol flux from blowing snow over a changing sea ice environment , EGU General Assembly 2023, Vienna, Austria, 24–28 Apr 2023, EGU23-6988, https://doi.org/10.5194/egusphere-egu23-6988, 2023.
Rothman, L. S., Gordon, I. E., Babikov, Y., Barbe, A., Chris Benner, D., Bernath, P. F., Birk, M., Bizzocchi, L., Boudon, V., Brown, L. R., Campargue, A., Chance, K., Cohen, E. A., Coudert, L. H., Devi, V. M., Drouin, B. J., Fayt, A., Flaud, J.-M., Gamache, R. R., Harrison, J. J., Hartmann, J.-M., Hill, C., Hodges, J. T., Jacquemart, D., Jolly, A., Lamouroux, J., Le Roy, R. J., Li, G., Long, D. A., Lyulin, O. M., Mackie, C. J., Massie, S. T., Mikhailenko, S., Müller, H. S. P., Naumenko, O. V., Nikitin, A. V., Orphal, J., Perevalov, V., Perrin, A., Polovtseva, E. R., Richard, C., Smith, M. A. H., Starikova, E., Sung, K., Tashkun, S., Tennyson, J., Toon, G. C., Tyuterev, V. G., and Wagner, G.: The HITRAN 2012 molecular spectroscopic database, J. Quant. Spectrosc. Ra., 130, 4–50, https://doi.org/10.1016/j.jqsrt.2013.07.002, 2013.
Roy, R., Kumar, P., Kuttippurath, J., and Lefevre, F.: Chemical ozone loss and chlorine activation in the Antarctic winters of 2013–2020, Atmos. Chem. Phys., 24, 2377–2386, https://doi.org/10.5194/acp-24-2377-2024, 2024.
Rozanov, A., Rozanov, V., Buchwitz, M., Kokhanovsky, A., and Burrows, J. P.: SCIATRAN 2.0 – A new radiative transfer model for geophysical applications in the 175–2400 nm spectral region, Adv. Space Res., 36, 1015–1019, https://doi.org/10.1016/j.asr.2005.03.012, 2005.
Saiz-Lopez, A., Mahajan, A. S., Salmon, R. A., Bauguitte, S. J.-B., Jones, A. E., Roscoe, H. K., and Plane, J. M. C.: Boundary Layer Halogens in Coastal Antarctica, Science, 317, 348–351, https://doi.org/10.1126/science.1141408, 2007.
Saiz-Lopez, A., Plane, J. M. C., Mahajan, A. S., Anderson, P. S., Bauguitte, S. J.-B., Jones, A. E., Roscoe, H. K., Salmon, R. A., Bloss, W. J., Lee, J. D., and Heard, D. E.: On the vertical distribution of boundary layer halogens over coastal Antarctica: implications for O3, HOx, NOx and the Hg lifetime, Atmos. Chem. Phys., 8, 887–900, https://doi.org/10.5194/acp-8-887-2008, 2008.
Saiz-Lopez, A., Baidar, S., Cuevas, C. A., Koenig, T. K., Fernandez, R. P., Dix, B., Kinnison, D. E., Lamarque, J.-F., Rodriguez-Lloveras, X., Campos, T. L., and Volkamer, R.: Injection of iodine to the stratosphere, Geophys. Res. Lett., 42, 6852–6859, https://doi.org/10.1002/2015GL064796, 2015.
Seo, S., Richter, A., Blechschmidt, A.-M., Bougoudis, I., and Burrows, J. P.: Spatial distribution of enhanced BrO and its relation to meteorological parameters in Arctic and Antarctic sea ice regions, Atmos. Chem. Phys., 20, 12285–12312, https://doi.org/10.5194/acp-20-12285-2020, 2020.
Serdyuchenko, A., Gorshelev, V., Weber, M., Chehade, W., and Burrows, J. P.: High spectral resolution ozone absorption cross-sections – Part 2: Temperature dependence, Atmos. Meas. Tech., 7, 625–636, https://doi.org/10.5194/amt-7-625-2014, 2014.
Simpson, W. R., Peterson, P. K., Frieß, U., Sihler, H., Lampel, J., Platt, U., Moore, C., Pratt, K., Shepson, P., Halfacre, J., and Nghiem, S. V.: Horizontal and vertical structure of reactive bromine events probed by bromine monoxide MAX-DOAS, Atmos. Chem. Phys., 17, 9291–9309, https://doi.org/10.5194/acp-17-9291-2017, 2017.
Song, Y., Xing, C., Liu, C., Lin, J., Wu, H., Liu, T., Lin, H., Zhang, C., Tan, W., Ji, X., Liu, H., and Li, Q.: Evaluation of transport processes over North China Plain and Yangtze River Delta using MAX-DOAS observations, Atmos. Chem. Phys., 23, 1803–1824, https://doi.org/10.5194/acp-23-1803-2023, 2023.
Spagnesi, A., Barbaro, E., Feltracco, M., Scoto, F., Vecchiato, M., Vardè, M., Mazzola, M., Burgay, F., Bruschi, F., Hoppe, C. J. M., Bailey, A., Gambaro, A., Barbante, C., and Spolaor, A.: Seasonal and interannual variability on the chemical composition of the Svalbard surface snowpack, Atmos. Chem. Phys., 25, 16215–16232, https://doi.org/10.5194/acp-25-16215-2025, 2025.
Stutz, J. and Platt, U.: Numerical analysis and estimation of the statistical error of differential optical absorption spectroscopy measurements with least-squares methods, Appl. Optics, 35, 6041–6053, https://doi.org/10.1364/AO.35.006041, 1996.
Stutz, J., Kim, E. S., Platt, U., Bruno, P., Perrino, C., and Febo, A.: UV-visible absorption cross sections of nitrous acid, J. Geophys. Res., 105, 14585–14592, https://doi.org/10.1029/2000JD900003, 2000.
Swanson, W. F., Graham, K. A., Halfacre, J. W., Holmes, C. D., Shepson, P. B., and Simpson, W. R.: Arctic Reactive Bromine Events Occur in Two Distinct Sets of Environmental Conditions: A Statistical Analysis of 6 Years of Observations, J. Geophys. Res.-Atmos., 125, e2019JD032139, https://doi.org/10.1029/2019JD032139, 2020.
Tack, F., Hendrick, F., Goutail, F., Fayt, C., Merlaud, A., Pinardi, G., Hermans, C., Pommereau, J.-P., and Van Roozendael, M.: Tropospheric nitrogen dioxide column retrieval from ground-based zenith–sky DOAS observations, Atmos. Meas. Tech., 8, 2417–2435, https://doi.org/10.5194/amt-8-2417-2015, 2015.
Tan, W., Liu, C., Wang, S., Xing, C., Su, W., Zhang, C., Xia, C., Liu, H., Cai, Z., and Liu, J.: Tropospheric NO2, SO2, and HCHO over the East China Sea, using ship-based MAX-DOAS observations and comparison with OMI and OMPS satellite data, Atmos. Chem. Phys., 18, 15387–15402, https://doi.org/10.5194/acp-18-15387-2018, 2018.
Thalman, R. and Volkamer, R.: Temperature dependent absorption cross-sections of O2-O2 collision pairs between 340 and 630 nm and at atmospherically relevant pressure, Phys. Chem. Chem. Phys., 15, 15371–15381, https://doi.org/10.1039/c3cp50968k, 2013.
Vandaele, A. C., Hermans, C., Simon, P. C., Carleer, M., Colin, R., Fally, S., Mérienne, M. F., Jenouvrier, A., and Coquart, B.: Measurements of the NO2 absorption cross-section from 42000 cm−1 to 10 000 cm−1 (238–1000 nm) at 220 K and 294 K, J. Quant. Spectrosc. Ra., 59, 171–184, https://doi.org/10.1016/S0022-4073(97)00168-4, 1998.
Wagner, T., Ibrahim, O., Sinreich, R., Frieß, U., von Glasow, R., and Platt, U.: Enhanced tropospheric BrO over Antarctic sea ice in mid winter observed by MAX-DOAS on board the research vessel Polarstern, Atmos. Chem. Phys., 7, 3129–3142, https://doi.org/10.5194/acp-7-3129-2007, 2007.
Wagner, T., Ibrahim, O., Shaiganfar, R., and Platt, U.: Mobile MAX-DOAS observations of tropospheric trace gases, Atmos. Meas. Tech., 3, 129–140, https://doi.org/10.5194/amt-3-129-2010, 2010.
Wang, X., Shen, Y., Lin, Y., Pan, J., Zhang, Y., Louie, P. K. K., Li, M., and Fu, Q.: Atmospheric pollution from ships and its impact on local air quality at a port site in Shanghai, Atmos. Chem. Phys., 19, 6315–6330, https://doi.org/10.5194/acp-19-6315-2019, 2019.
Welsh, B. A., Corrigan, M. E., Assaf, E., Nauta, K., Sebastianelli, P., Jordan, M. J. T., Fittschen, C., and Kable, S. H.: Photophysical oxidation of HCHO produces HO2 radicals, Nat. Chem., 15, 1350–1357, https://doi.org/10.1038/s41557-023-01272-4, 2023.
Wittrock, F., Oetjen, H., Richter, A., Fietkau, S., Medeke, T., Rozanov, A., and Burrows, J. P.: MAX-DOAS measurements of atmospheric trace gases in Ny-Ålesund - Radiative transfer studies and their application, Atmos. Chem. Phys., 4, 955–966, https://doi.org/10.5194/acp-4-955-2004, 2004.
Wu, F., Xie, P., Li, A., Mou, F., Chen, H., Zhu, Y., Zhu, T., Liu, J., and Liu, W.: Investigations of temporal and spatial distribution of precursors SO2 and NO2 vertical columns in the North China Plain using mobile DOAS, Atmos. Chem. Phys., 18, 1535–1554, https://doi.org/10.5194/acp-18-1535-2018, 2018.
Yang, X., Blechschmidt, A.-M., Bognar, K., McClure-Begley, A., Morris, S., Petropavlovskikh, I., Richter, A., Skov, H., Strong, K., Tarasick, D. W., Uttal, T., Vestenius, M., and Zhao, X.: Pan-Arctic surface ozone: modelling vs. measurements, Atmos. Chem. Phys., 20, 15937–15967, https://doi.org/10.5194/acp-20-15937-2020, 2020.
Yang, Y., Zhao, C., Wang, Q., Cong, Z., Yang, X., and Fan, H.: Aerosol characteristics at the three poles of the Earth as characterized by Cloud–Aerosol Lidar and Infrared Pathfinder Satellite Observations, Atmos. Chem. Phys., 21, 4849–4868, https://doi.org/10.5194/acp-21-4849-2021, 2021.
Yin, X., Kang, S., de Foy, B., Ma, Y., Tong, Y., Zhang, W., Wang, X., Zhang, G., and Zhang, Q.: Multi-year monitoring of atmospheric total gaseous mercury at a remote high-altitude site (Nam Co, 4730 m a.s.l.) in the inland Tibetan Plateau region, Atmos. Chem. Phys., 18, 10557–10574, https://doi.org/10.5194/acp-18-10557-2018, 2018.
Zhang, Q., Xing, C., Li, Y., Peng, H., Liu, H., Liu, C., Zhang, Z., Ma, W., Tang, T., and Liu, C.: Measurement report: Validation of multi-satellite remote sensing products and potential source apportionment of BrO and IO in the Arctic using ship-based DOAS, Zenodo [data set], https://doi.org/10.5281/zenodo.18072720, 2025.
Zhao, X., Strong, K., Adams, C., Schofield, R., Yang, X., Richter, A., Frieß, U., Blechschmidt, A.-M., and Koo, J.-H.: A case study of a transported bromine explosion event in the Canadian high arctic, J. Geophys. Res.-Atmos., 121, 457–477, https://doi.org/10.1002/2015JD023711, 2016.