the Creative Commons Attribution 4.0 License.
the Creative Commons Attribution 4.0 License.
 | 15 Jun 2026
On describing particle nucleation within the Volatility Basis Set
Lubna Dada
Dominik Stolzenburg
Eva Sommer
Mario Simon
Meredith Schervish
Jenna DeVivo
Alexandra Stinchfield
Natalie Burton
Nirvan Bhattacharyya
Brandon Lopez
Mingyi Wang
Wiebke Scholz
João Almeida
Martin Heinritzi
Hamish Gordon
Armin Hansel
Joachim Curtius
Katrianne Lehtipalo
Imad El Haddad
Jasper Kirkby
Richard Flagan
Markku Kulmala
Douglas Worsnop
We describe atmospheric particle nucleation within the Volatility Basis Set (VBS) by identifying nucleating vapors (“nucleators”) with sufficiently high saturation ratios to drive nucleation under either neutral (termed nLVOC) or ion induced (cLVOC) conditions. These vapors are a subset of Ultra Low Volatility Organic Compounds (ULVOCs, with a saturation mass concentration below 3 × 10⁻⁹ µg m−3), which mainly arise from the oxidation of monoterpenes and other volatile hydrocarbons in the atmosphere. We determine the effective nucleator concentrations via nucleation efficiencies based on critical saturation ratios for neutral and charged processes, and then apply these efficiencies to the overall volatility (concentration) distribution. The nucleator concentrations thus depend on the overall yield and volatility distribution of ULVOC species, as well as ambient temperature. Using organic vapor volatility distributions for α-pinene ozonolysis measured in the CERN CLOUD chamber, we can reproduce the experimental neutral and ion-induced nucleation rates between 223 and 298 K, over a wide range of ULVOC concentrations and nucleation rates, spanning typical atmospheric values. For this system of oxygenated organic molecules from α-pinene, two competing effects prevail. As temperature drops from 298 K, the slowing rate of autoxidation lowers the ULVOC yield and so initially reduces the nucleation rates. However, at about 263 K, the colder temperatures reduce the volatilities sufficiently for nucleation rates to reverse course and start to increase with further decrease in temperature. This effect is most pronounced for neutral nucleation. The CLOUD measurements show this behavior and it is faithfully reproduced in the VBS nucleation model.
- Article
(6504 KB) - Full-text XML
- BibTeX
- EndNote


New particle formation involving pure sulfuric acid (“binary” nucleation with water vapor) and sulfuric acid with ammonia (“ternary” nucleation) is well established as a nearly ubiquitous process in Earth's atmosphere (Kulmala et al., 1988; Vehkamaki and Riipinen, 2012; Chen et al., 2012). Organic nucleation without direct participation by inorganics is a second pathway that may be important in parts of the atmosphere (Kirkby et al., 2016), and these two mechanisms may interact as well (Riccobono et al., 2014).
More broadly, there are two basic mechanisms by which nucleation can occur throughout the atmosphere. Both require an almost non-volatile product to form a secondary particle. The first is oxidation (Ox) of a precursor to form an acid with some yield αA (McMurry, 1980), followed by proton-transfer reaction with a base in a nascent condensed phase.
Neutral bases are generally not formed in the atmosphere but rather emitted from the surface. Until recently, the acid-base reaction H2SO4 + NH3 ⇌ ⋅ was thought to be almost the only globally significant driver of new-particle formation (Clarke et al., 1998; Kulmala et al., 2000; Adams and Seinfeld, 2002; Kirkby et al., 2011), including ion-induced nucleation with a negatively charged ion acting as a conjugate base for H2SO4 (Lee et al., 2003; Yu et al., 2010; Kirkby et al., 2011).
The second nucleation mechanism is oxidation of a precursor to form product vapors {vi} in the gas phase, with yields {αi} and intrinsically low vapor pressures (or, equivalently, low saturation concentrations, ), followed by clustering (ui,j) and condensation of those products to form secondary particles.
The clusters in either mechanism may well be stabilized by agents such as water or charge (ions). Especially in the second mechanism, the vapors are also essentially always lost if they collide with other particles (the background condensation sink, “cond” in Reaction R5) and so exist in a steady state in the gas phase only while being continuously produced by Reaction (R3).
In this work we shall focus on the second mechanism, and specifically on the chemical formation of many products during oxidation of organic precursors. This has been discussed in the atmospheric context both for mixtures of organics and sulfuric acid (Zhang et al., 2004; Riccobono et al., 2014) and also pure organic oxidation products (Kirkby et al., 2016). Our objective is to develop a model for organic nucleation based on the Volatility Basis Set (Donahue et al., 2006, 2011) that also conforms with models of condensational growth of the stable nanoclusters (ui,j) leading to the formation of particles that can persist in the atmosphere.
The Volatility Basis Set groups compounds (mostly organic) based on their saturation concentrations (volatility), using bins separated by a factor of 10 at 300 K as the primary basis (Donahue et al., 2006). For VBS vapor vi, the sub-cooled liquid saturation concentration is ; sub-cooled liquid values with respect to a bulk (flat) condensed phase are generally used because the organic aerosol mixture is assumed to be an amorphous liquid or semi-solid (Pankow, 1994; Shiraiwa et al., 2011). In the VBS, the exact molecular structure, or even formula, may or may not be known, but the volatility is specified regardless. When volatility includes an activity coefficient we use the symbol for the effective saturation concentration (Donahue et al., 2006, 2014). A second dimension captures broad chemical composition, i.e. O:C (Donahue et al., 2011, 2012).
Reaction (R3) is typically a highly branched mechanism giving many products with a broad distribution of yields, {αi}. Figure 1 shows a notional volatility distribution in a 1D-VBS for both mass and number concentrations. The volatility range is vast, and the decadal bins are grouped in broad volatility classes, shown as colored bands in the figures (Donahue et al., 2009; Schervish and Donahue, 2020). Because we rely on factors of 10 extensively, here we shall use log =log 10 and ln =log e; we will also use as the “bin” number, so is the reference “bin zero” whereas “bin-14” is deep in the ULVOC class. We will also use “log c∘(300)” as a shorthand for “”, with µg m−3 as our mass concentration units. The volatility classes are defined with respect to log c∘(T), as follows:
-
VOC: Volatile Organic Compounds () are the gas-phase organics dominating atmospheric photochemistry.
-
IVOC: Intermediate Volatility Organic Compounds () have low volatility for gas-phase organics yet are entirely in the gas phase under atmospheric conditions.
-
SVOC: Semi Volatile Organic Compounds () are found substantially in both the gas and aerosol phases under atmospheric conditions.
-
LVOC: Low Volatility Organic Compounds () are largely in the aerosol phase under atmospheric conditions but have sufficient volatility to affect their behavior and are too volatile to condense to the smallest particles.
-
ELVOC: Extremely Low Volatility Organic Compounds () condense to essentially any particle.
-
ULVOC: Ultra Volatility Organic Compounds () are directly involved with nucleation.
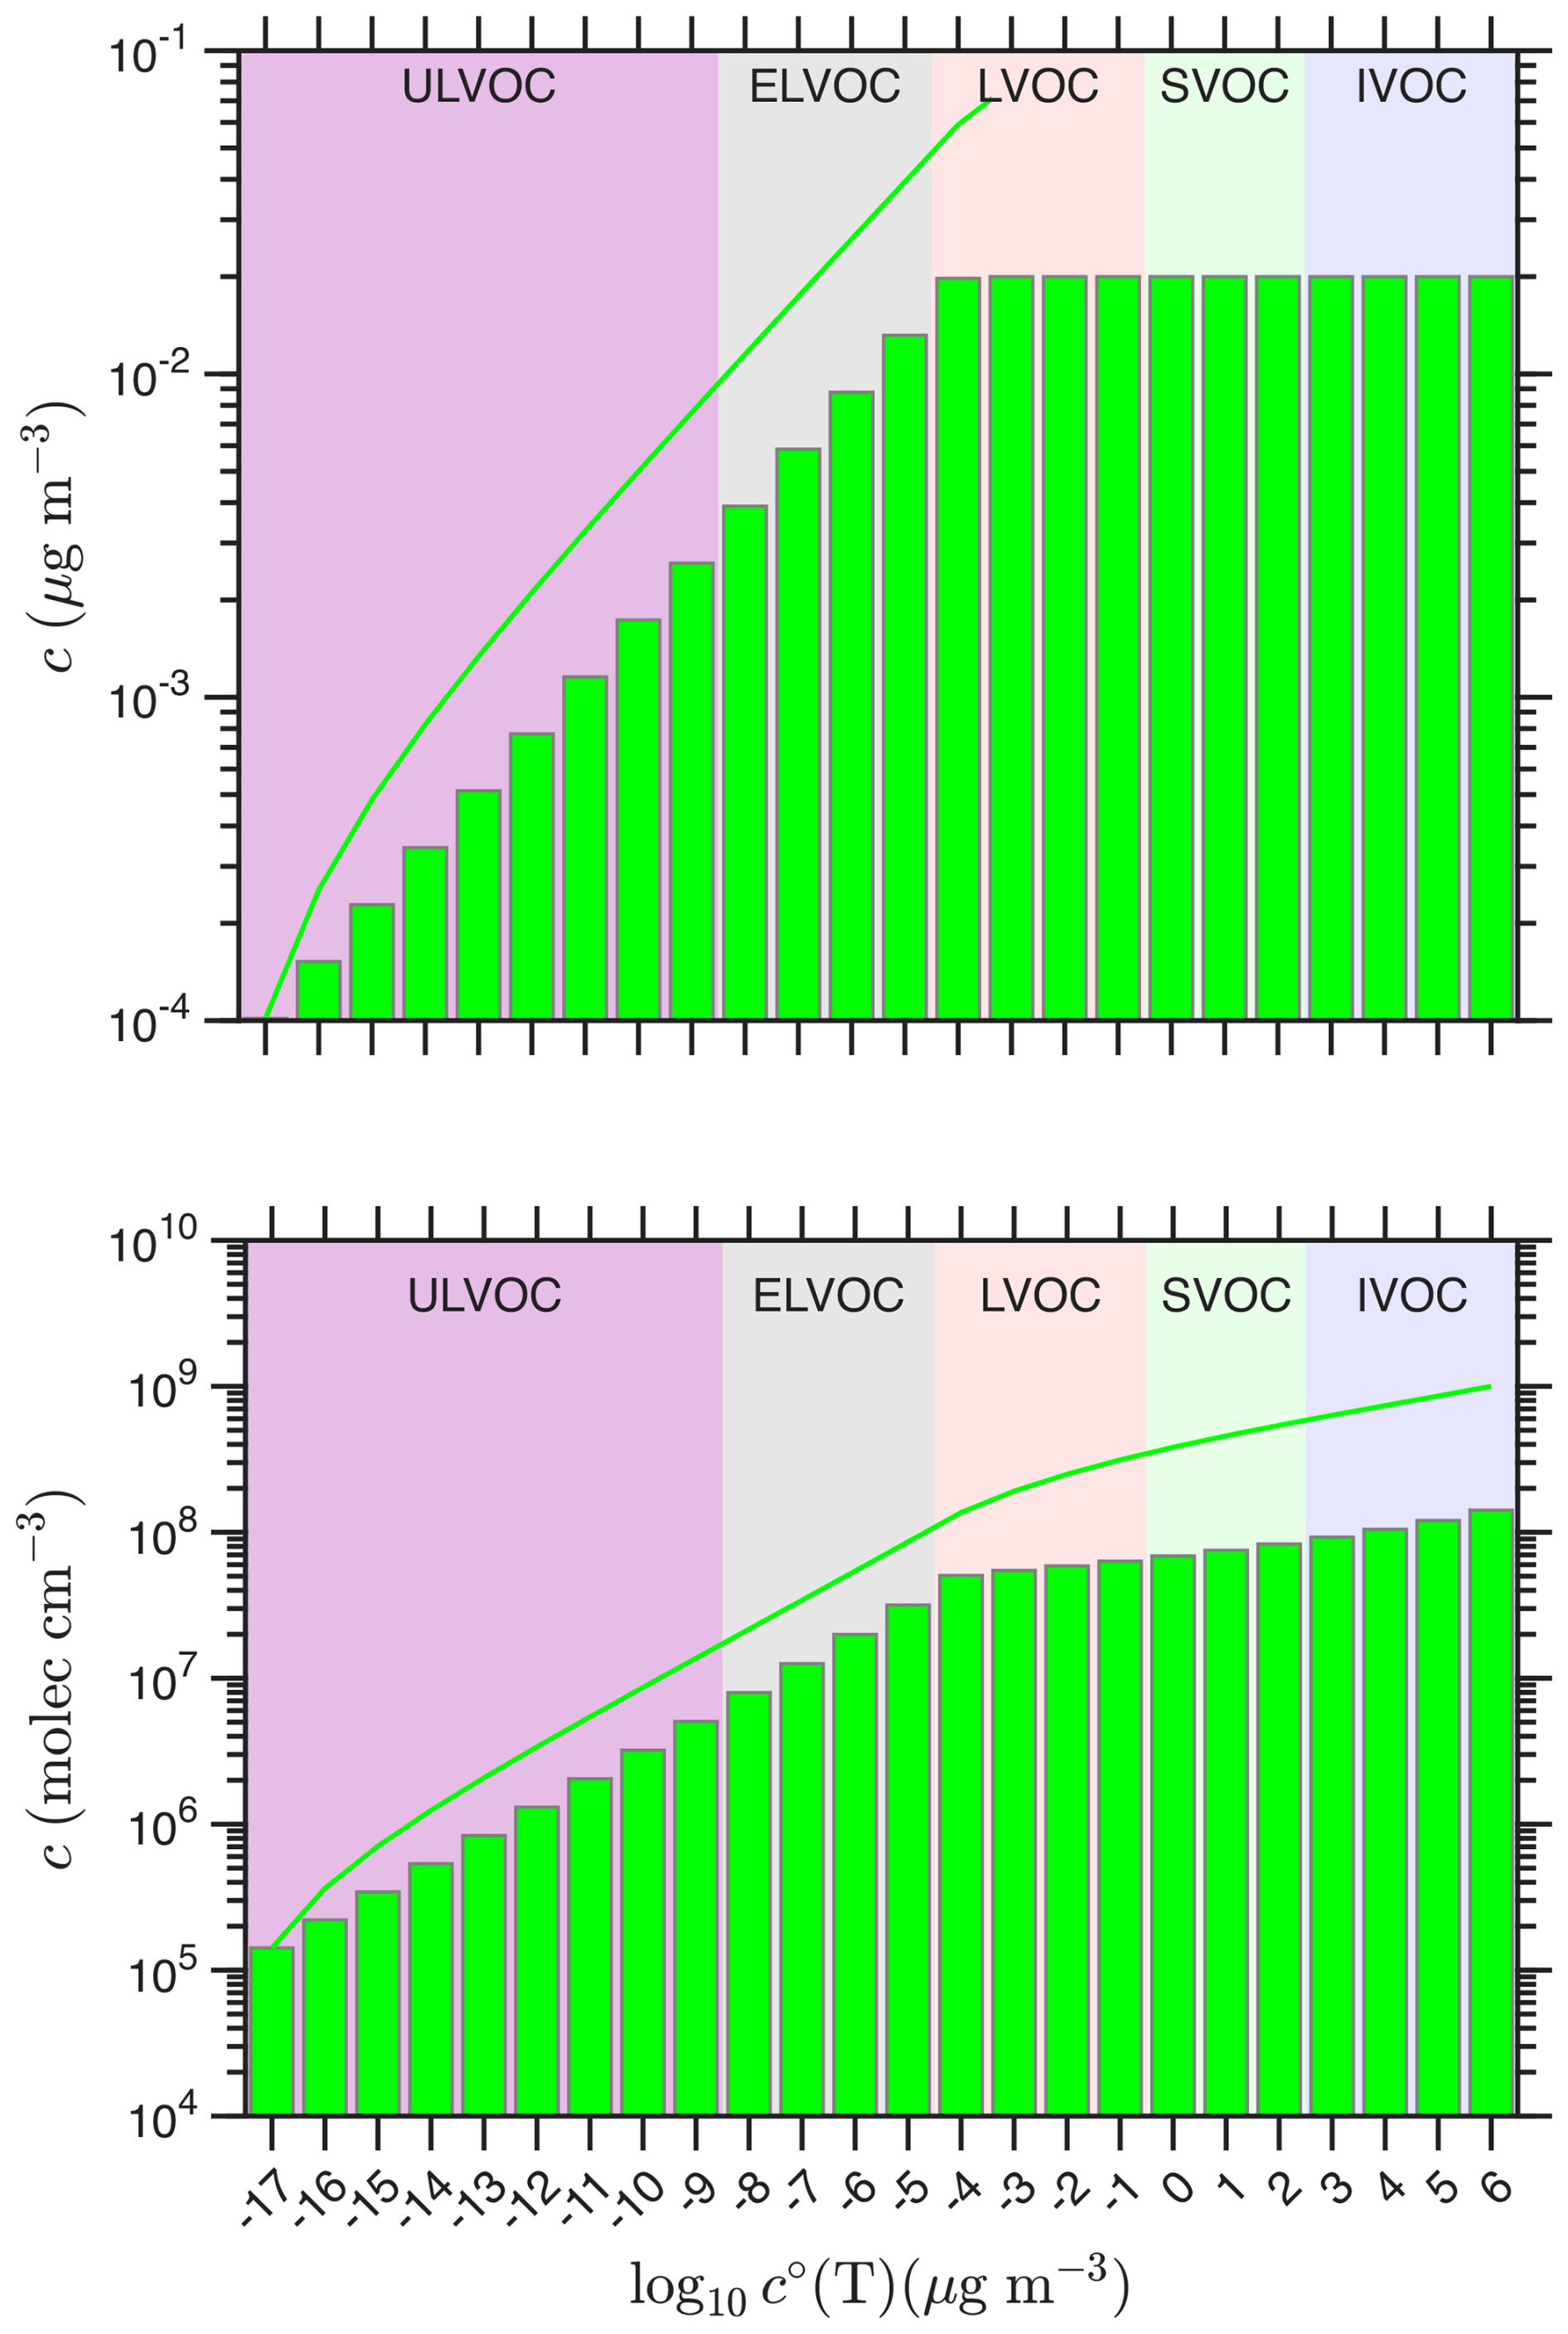
Figure 1A notional volatility basis set (VBS) “wedge” distribution of oxygenated organic vapors that drives nucleation. The VBS distribution is shown as mass concentrations in the top panel and number concentrations in the bottom panel. Volatility classes are indicated with colors (ULVOC, ELVOC, LVOC and SVOC). The mass concentrations increase by a factor of 1.5 in each bin through the ULVOC and ELVOC classes and then remain constant at 0.02 µg m−3. The corresponding number concentrations, required for the nucleation kinetics, follow a similar pattern but rise slightly since the molar mass decreases with increasing volatility. The solid curves are cumulative sums of concentrations up to and including the given bin so for example, the cumulative total ULVOC concentration is about 0.01 µg m−3 or 2 × 107 cm−3.
The volatility bins are established (and populated with molecules when such information exists) at 300 K but, because volatility varies strongly with temperature, the bins shift with temperature. However, because the volatility classes and general atmospheric behavior are defined with respect to ambient temperature; in the cold upper troposphere at 213 K, species that are SVOCs at 300 K near the surface will be well in the ELVOC or ULVOC range (Shen et al., 2024; Curtius et al., 2024; Bhattacharyya et al., 2025).
The VBS uses saturation mass concentration, and so the exact saturation number concentration varies within a bin, which contains species with different molecular masses but the same saturation (mass) concentration at 300 K (Donahue et al., 2012). There is thus no single conversion to number units, though for kinetic processes such as nucleation we ultimately employ number concentration units. The findings here are ultimately adjusted empirically, and so uncertainty in molecular mass has little effect on the conclusions. However, the boundary between ULVOC and ELVOC is 6 cm−3 and the boundary between ELVOC and LVOC is 8 × 104 cm−3. Analysis of experiments at the CERN CLOUD chamber have shown that organic nucleation rates scale well with observed ULVOC concentrations (Simon et al., 2020; Dada et al., 2023), with pure biogenic ion-induced nucleation rates proportional to ULVOC2 regardless of the mix of precursors (isoprene, monoterpenes, and sesquiterpenes) (Dada et al., 2023).
The actual value of the volatility of a vapor (or the saturation vapor pressure) does not control its behavior for particle nucleation and growth. Rather, it is the gas-phase saturation ratio (the activity, which, for water vapor, is the relative humidity) that governs the ability of a vapor to have net condensation onto or evaporation from a particle. Because organics almost always comprise a complex mixture, the VBS uses an effective saturation ratio for any given vapor, vi, with vapor concentration (Donahue et al., 2013).
That is, the saturation ratio of a VBS bin is given by the sum of the concentrations of all bins with volatilities less than or equal to that bin, all divided by the saturation concentration for the bin itself. This implicitly assumes an ideal solution. Figure 2 shows the effective saturation ratios for the notional VBS distribution in Fig. 1 along with a horizontal saturation line at s=1. Consistent with expectations, the SVOC have s≲1 and the LVOC are substantially supersaturated. The lower volatility classes are highly supersaturated.
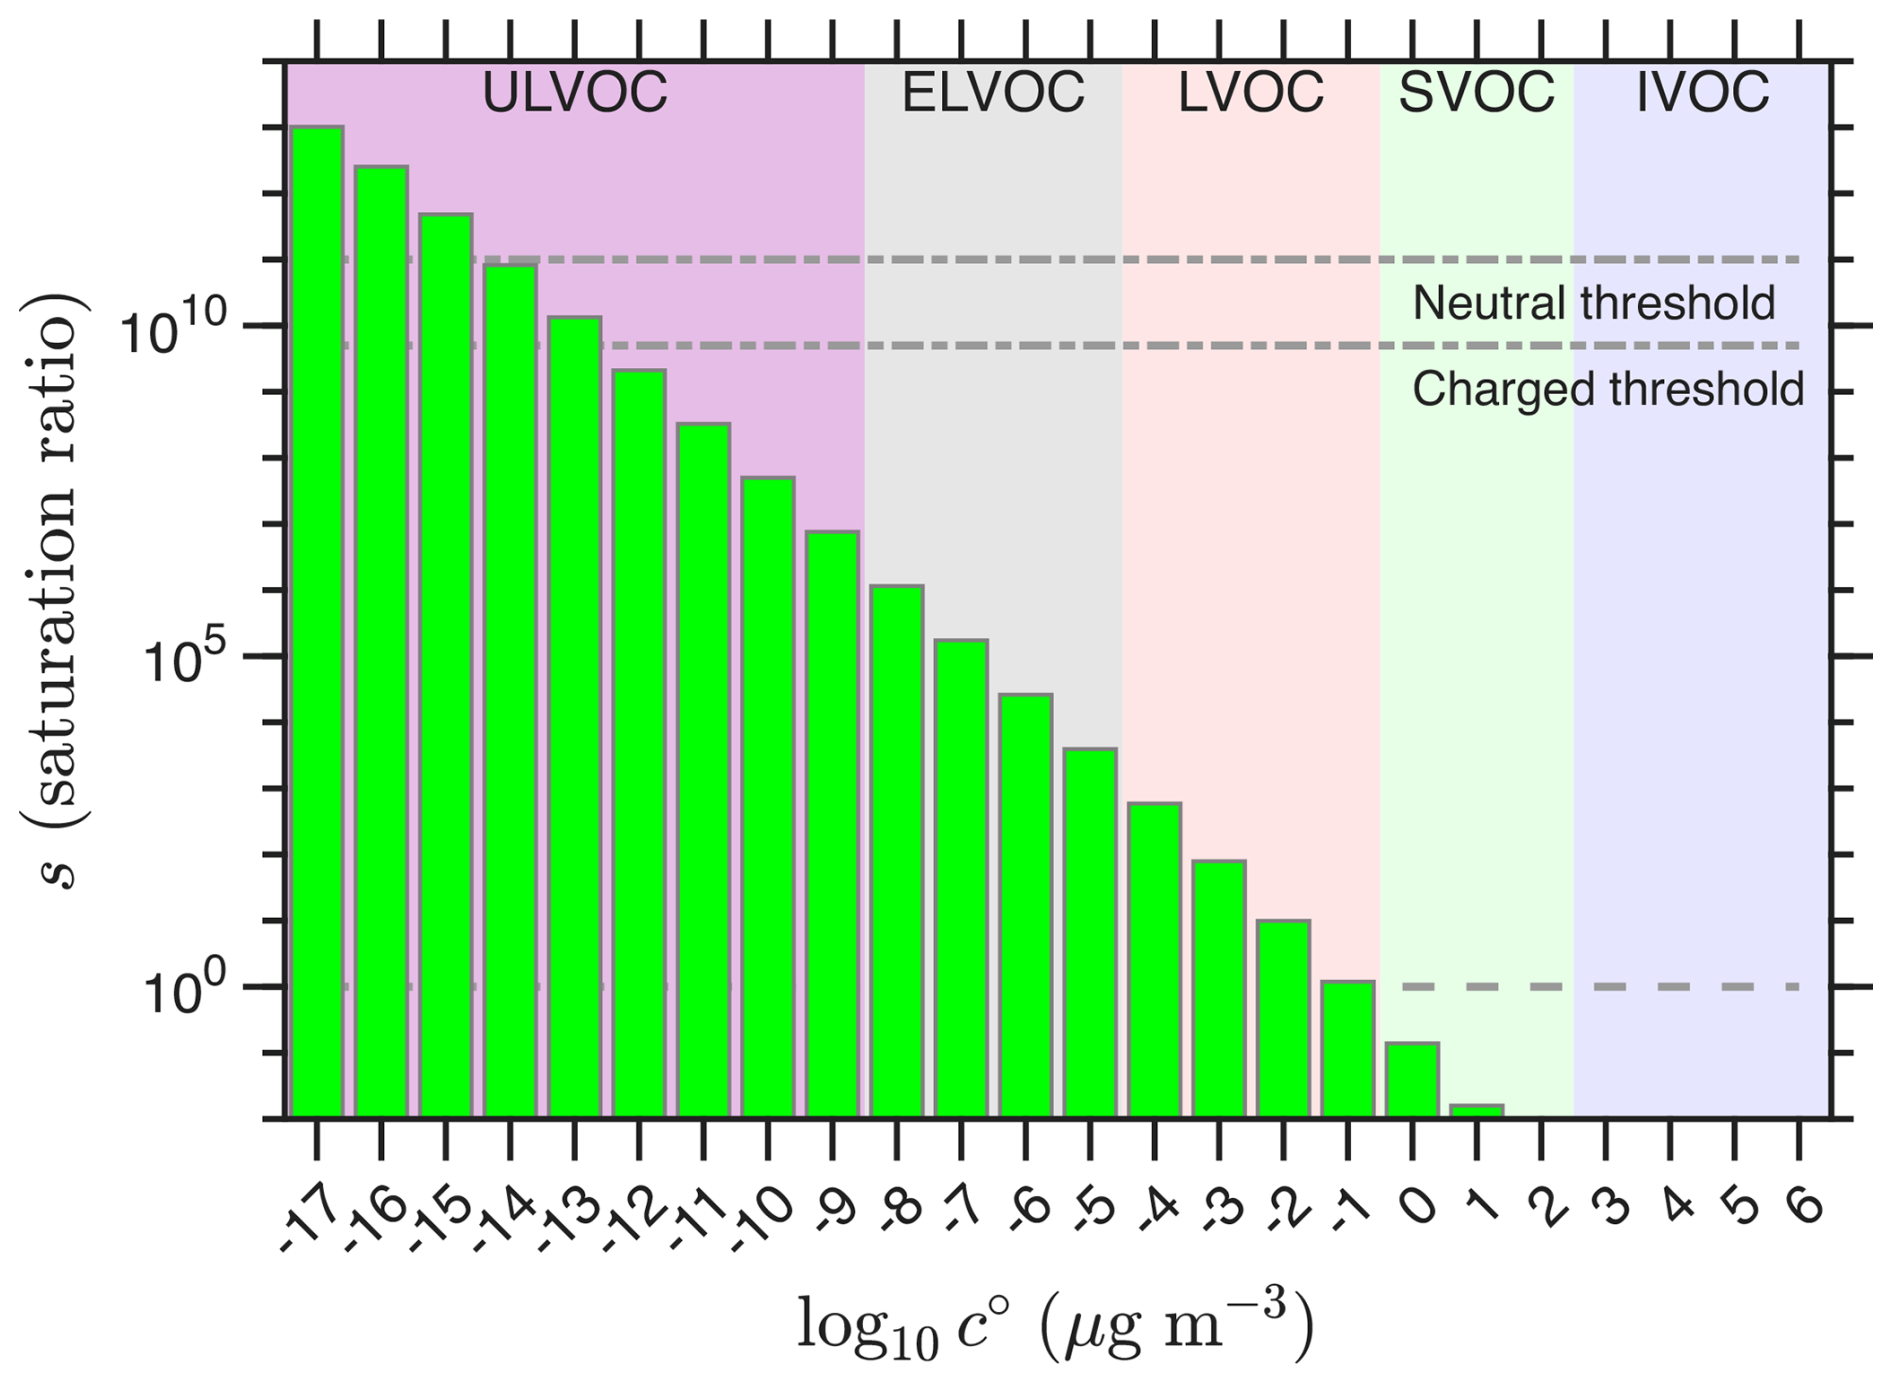
Figure 2Saturation ratios for a typical VBS distribution driving organic nucleation. Saturation ratios are defined with respect to a flat surface of the bulk condensed phase. Empirical saturation thresholds for kinetic nucleation are shown with dot-dashed horizontal lines for neutral and charged (ion-induced) processes. These are consistent with dimer evaporation rates. Unit saturation ratio is shown as a dashed horizontal line, with SVOC characteristically showing si≲ 1.
When phase partitioning to bulk aerosol in the ambient atmosphere is at issue (where 300 µg m−3 as well), there is no need to differentiate among the LVOC classes (“U” and “E” do not matter, and we can use “UELVOC” to refer to the whole ensemble, ULVOC + ELVOC + LVOC); thus the traditional “4-bin” (Lane et al., 2008) and “8-bin” (Shrivastava et al., 2008; Robinson et al., 2007) VBS have been applied to the SVOC and IVOC ranges. Though the saturation ratios of Fig. 2 obviously depend on the total (vapor) concentration, a typical ambient concentration range of 1–2 orders of magnitude means the qualitative volatility class behaviors are reasonably well defined. A broader range may be useful even when considering SOA mass; for example, when particles are warmed during analysis in a thermodenuder (Riipinen et al., 2010; Saleh and Khlystov, 2009), or using thermal desorption chemical ionization mass spectrometry (Lopez-Hilfiker et al., 2014; Wang et al., 2020; Ye et al., 2019), then consideration of lower volatility classes may assist with data analysis.
However, new-particle formation and growth require discrimination of the UELVOC ensemble. Here, UELVOC species may be produced in the gas phase and develop a substantial steady-state vapor concentration (and super saturation) before they find and condense to surfaces that include aerosols. Furthermore, these species will only be found in the gas phase if there is a significant gas phase source, as their equilibrium gas-phase concentration is exceedingly small (Donahue et al., 2006). Provided they condense to existing particles with unit efficiency (mass accommodation coefficient = 1), the gas-phase production rate is constrained by measured (steady-state) vapor concentrations, for a known aerosol condensation sink.
When particles are small, i.e. dp≲ 10 nm, curvature will substantially raise the aerosol-phase activity due to the Kelvin effect, making it more difficult for organic vapors to condense (Tröstl et al., 2016; Stolzenburg et al., 2018, 2022). Nucleation is an even greater challenge, since, at a minimum, it requires a cluster between two low volatility organic molecules to remain bound long enough for a third to condense. However, the rich mixture of thousands of different molecules implied by the VBS distribution in Figs. 1 and 2 has profound consequences, as there are always (some) molecules of lower volatility in the mix, and there are always (more) molecules of higher volatility as well.
With this in mind, there is an observed association between ULVOC concentrations and nucleation rates (Simon et al., 2020; Dada et al., 2023). This is more robust than simply associating nucleation with production of all highly oxygenated organic molecules (HOMs, which are similar to UELVOC but, rather than volatility, are defined based on oxygen content and formation pathway in Bianchi et al. (2019) ), as ULVOCs can explain the so-called “isoprene suppression” of nucleation by monoterpene vapors near 300 K (McFiggans et al., 2019; Heinritzi et al., 2020) (caused in large part by C5 isoprene products promoting formation of C15 association products instead of the lower-volatility C20 products found in the pure monoterpene chemistry) as well as the antidote of isoprene suppression via sesquiterpenes (which add C15 monomer products to the mix to counteract the C5 products) (Dada et al., 2023). VBS-based modeling schemes thus have been developed to use ULVOC collisions as nucleation proxies, with an empirical rate coefficient setting the nucleation rate (Schervish and Donahue, 2020, 2021; Zhao et al., 2020, 2021).
We thus care about the temperature dependence of phase partitioning, as well as the stability of dimer clusters, ui,j, between two vapors, vi and vj. This requires consideration of the thermodynamics of phase partitioning and how it relates to pairwise interaction energies, Ei,j. The consistent ansatz of the VBS is that atmospheric organics comprise such a rich mixture that average behaviors, rather than unique properties of individual molecules, are likely to best describe the overall behavior of the system. There are obvious exceptions: isoprene, for example, is so abundant and has a small enough set of oxidation products that their exact vapor pressures and interactions may well need to be considered (Russell et al., 2025). However, here we shall assume that the bulk property defining phase behavior (volatility), on average, does a reasonable job explaining the pairwise properties essential for nucleation. We will thus place ULVOC nucleation on a firmer theoretical basis and discriminate between ion-induced and neutral nucleation pathways.
Thermodynamic constraints
Appendix A presents a full discussion of the thermodynamics constraining the VBS. The essential features are that all equilibria – reactions, cluster formation and evaporation, and bulk condensation and evaporation – are governed by a free energy. The ratio of forward (kf) and reverse (kr) rate coefficients is the equilibrium coefficient, Kp, converted to concentration units, Kc.
For volatility of a pure compound this means
Here Mi is the molar mass (g mol−1) and is sub-cooled liquid saturation concentration (µg m−3). For the gas constant, R′ and R′′ indicate appropriate units. The VBS reference saturation concentration is log c∘(300 K) = 0 (1 µg m−3), and a typical molar mass is Mi≃ 250 g mole−1. The free energy of vaporization is thus
where δΔG is the change in free energy from one bin to the next. The VBS bins are defined by saturation concentration at 300 K, and so the vaporization free energy of those bins is known exactly.
We represent the temperature dependence of volatility with an expression resembling the Clausius–Clapeyron equation (Donahue et al., 2011; Stolzenburg et al., 2022).
This is discussed in detail in Appendix A.
Nucleation that does not involve a chemical reaction (notably a proton transfer in an acid-base reaction) is governed fundamentally by volatility and the saturation ratios of mixtures. For organic vapors consisting of a rich mixture, we can surmise that there will be some constituents of sufficiently low volatility that they will nucleate on every collision; once they collide to form a cluster it will never evaporate. This suggests intrinsically bimolecular (kinetic) nucleation where binary vapor collisions are rate limiting and the nucleation rate varies as the square of the nucleator concentration. This differs from classical nucleation theory, where a free-energy maximum for some cluster defines a point of equal condensation and evaporation rates (Flagan, 2007). Here we assume that for this rich mixture (including some exceptionally low volatility species) the free-energy maximum is the ensemble of vapors. The problem then becomes to identify this subset of vapors and then find their collision rate to define the particle formation rate.
A key concept associated with the VBS is that the distribution of volatilities leads to behaviors that are fundamentally different from individual molecules. There will always be some molecules that are so sticky that they never evaporate after forming a bimolecular cluster. Likewise, there will always be other molecules that are somewhat more volatile, but play a role, especially after two molecules have started the process. To illustrate the essential details of nucleation within the VBS, we can consider just three vapors (). The subscripts i, j, k are nominally volatility bins; here we shall generally assume these are in order of increasing volatility. Notionally, vi is a ULVOC, vj may be a ULVOC or an ELVOC, and vk is an ELVOC.
A second key assumption is that the total population of nucleating vapors can be represented as an equivalent concentration of these kinetic nucleators. The overall nucleation rate will thus be intrinsically second order, but conditions may change the effective concentration of nucleators; specifically, higher vapor concentrations, and thus higher saturation ratios, will increase the pool of nucleators and so increase the nucleator concentration even more. Because of this, the nucleation rate will likely be second order or higher (only in some pathological cases could it be sub second-order). For pure biogenic nucleation, this is supported by the observed quadratic dependence, consistent with a nucleator concentration about 10 % of the ULVOC concentration (for ion induced nucleation) (Dada et al., 2023). We shall still present nucleation rates as a function of the total (observable) ULVOC concentration, both because this is observed to show a good correlation with nucleation rates and because the nucleator concentrations themselves are a derived quantity.
Appendix B presents a full analysis of nucleation kinetics in the VBS. The key assumption is that the free energy of formation, ΔGi,j, for binary clusters, ui,j, is proportional to the free energy of vaporization for the corresponding organics in a bulk mixture, , which in turn defines the volatility bins. Thus for the clusters, . Further, at least for vapors in similar volatility bins, we assume an ideal mixture with no excess free energy in either case. The cluster formation free energy is somewhere between a factor of 2 and 3 smaller than the free energy of vaporization (i.e. 2 3) (Ortega et al., 2012). If the cluster free energy is a factor of 2 lower than the bulk vaporization free energy, the volatility of nucleating vapors is . That is well into the ULVOC range, consistent with a fraction of the observed ULVOC comprising the nucleators.
3.1 Parameterization
Consideration of cluster evaporation kinetics in the VBS simplifies multicomponent volatility-driven nucleation, but the development in Appendix B still requires at least pairwise interactions (Ei,j) and so depends on the entire volatility distribution. To further simplify this we shall assume that we can represent neutral and ion-induced nucleation by organics spanning a wide volatility range as quasi-kinetic. The overall rates are then given by simple kinetic expressions, contingent on finding the concentrations of “neutral” (vn) and “charged” (vc) nucleating vapors (the vapors are all neutral, but the “charged” vapors are those that nucleate with the assistance of an ion, n±).
The neutral process should be second order, with the kinetic (collision) rate coefficient, kkin. The charged process is more involved, as described in Appendix B, but we assume that it remains approximately second order in the organics while also adding a dependence on ion concentrations, with a (third order) ion induced nucleation coefficient, kiin. Charged (ion-induced) nucleation is also rate limited by the formation rate of the ions. The charged nucleators are presumably a superset of the neutral nucleators. It is also important to note that the ion-induced nucleation has no relationship to the kinetic collision limit for neutral species, as all the collisions and interaction coefficients will be for ion–molecule interactions (where “molecule” includes small clusters).
In the context of the VBS, we can use the volatility distribution to find the unknown concentrations of the quasi-kinetic nucleators, with
Once the nucleation rates are found, then the same volatility distribution will drive growth, which can be found as a function of size with the dynamic VBS (Schervish and Donahue, 2020; Stolzenburg et al., 2022).
3.2 VBS dynamics
The net condensation rate over a particle population, p, is governed by the activity difference, where the vapor activity is the saturation ratio, , and the excess vapor concentration, , determines the condensation rate
The Kelvin term Ki,p scales with a “Kelvin Diameter” for decadal change, dK10. We use base-10 to align with the VBS.
This relates the bulk properties (σi,ρp) to the molecular properties of clusters via the correspondence principle (potentially with higher-order terms). It is perhaps not widely recognized how small dK10 actually is; it is the diameter where the effective saturation concentration increases by 1 decade, and for typical surface tensions and densities, dK10≃ 4–5 nm (Stolzenburg et al., 2018; Donahue et al., 2019). If the bulk Kelvin term were to carry on to dimer clusters of order 1 nm, this would correspond to a value near 105 at the ULVOC-ELVOC boundary in Fig. 2, comparable to the bulk saturation ratio there.
3.3 Nucleation efficiency
The analysis in Appendix B suggests that we should be able to identify the effective nucleating species, nLVOC and cLVOC, and that there is a volatility threshold associated with each group. We now make a simplifying assumption that UELVOC species will nucleate with each other with an efficiency defined by some characteristic saturation ratio scrit.
This is a generally sigmoidal function, but we do not know the exact shape. The efficiency must be 1.0 for sufficiently low volatility, and it seems reasonable that it tends toward 0 for high volatility. A sigmoid seems reasonable. We include a gain, G, to provide some parametric flexibility, motivated as well by the proportionality factor connecting the binary cluster free energy to the bulk mixture free energy in Eq. (B10). Here we use G=0.75, in part because it gives reasonable results as presented below. The (empirical) values for gain and critical saturation ratios are coupled. Nucleation is a binary process and, as presented in Appendix B, the cluster evaporation of ui,j depends on the geometric mean (log average) of the volatility for an ideal system. However, this is unlikely to persist for organics with widely-separated volatilities, as both the different number of functional groups potentially binding clusters as well as the overall molecular size differences will destabilize the cluster from the ideal average (raising the activity coefficient of the binary cluster). We thus do expect the efficiency to fall off reasonably rapidly as the saturation ratio drops, meaning the gain cannot be too small.
With the efficiencies known, we can then calculate the concentrations of nucleating vapors.
It is possible that the charged nucleation efficiency depends on the identity of the primary ions. However, experimental evidence suggests that pure biogenic charged nucleation may not be sensitive to the chemical identity of the ion, namely it is the presence of charge that matters (Kirkby et al., 2016). This is directly related to the charging efficiency of different reagent ions in chemical ionization mass spectrometry, although the timescales are much longer and there is no high-energy region (i.e. a declustering quadrupole interface). It is also likely that the negative and positive efficiencies differ (Kirkby et al., 2016), with the atmospheric negative ions being or and the positive ions being (all likely clustered with water), but for now we shall consider the bipolar efficiencies to be the same.
The crucial element here is that the efficiency depends explicitly on the effective saturation ratio. Therefore, as concentrations rise (with a constant volatility distribution), the efficiency will shift towards higher volatility and the concentrations of the effective nucleating species will rise further as more-volatile species are involved. Fundamentally, the increased concentrations mean that a shorter cluster lifetime can still result in nucleation. The critical values are empirical; here we start with 1011 and 5 × 10⁹, based on results shown below. This is the critical saturation ratio for kinetic nucleation, where formation of a cluster via collision of two vapor molecules is rate limiting (and so evaporation of that cluster is slower than the arrival of a third condensing vapor molecule); the critical value is substantially larger than a typical critical saturation ratio in classical nucleation theory, as that applies to a critical cluster that often contains more than two molecules and so has less curvature. As we shall show, such enormous saturation ratios do occur in the atmosphere, consistent with Fig. 2. In the atmosphere, nucleation is essentially never a major vapor sink, and so saturation ratios sufficient to drive kinetic nucleation do arise.
As an example we shall consider the “wedge” distribution of oxygenated organic molecules (OOM) shown in Fig. 1. We can then use this case to calculate nucleation rates. The total concentration is cOOM = 109 cm−3, which, with a 500 s wall loss time constant, corresponds to a production rate POOM = 2 × 10⁶ . The corresponding saturation ratios are shown in Fig. 2.
4.1 Nucleating vapors
The nucleation efficiencies for neutral and charged nucleation are shown in Fig. 3. Both curves are confined largely to the ULVOC range, as expected. For the charged nucleation efficiency, the efficiency remains above 1 % throughout the ULVOC range, again justifying this boundary; however, an ELVOC species (bin) with an unusually high concentration could well contribute to and even dominate nucleation, albeit with an efficiency (effective concentration) less than 1 % of its true value.
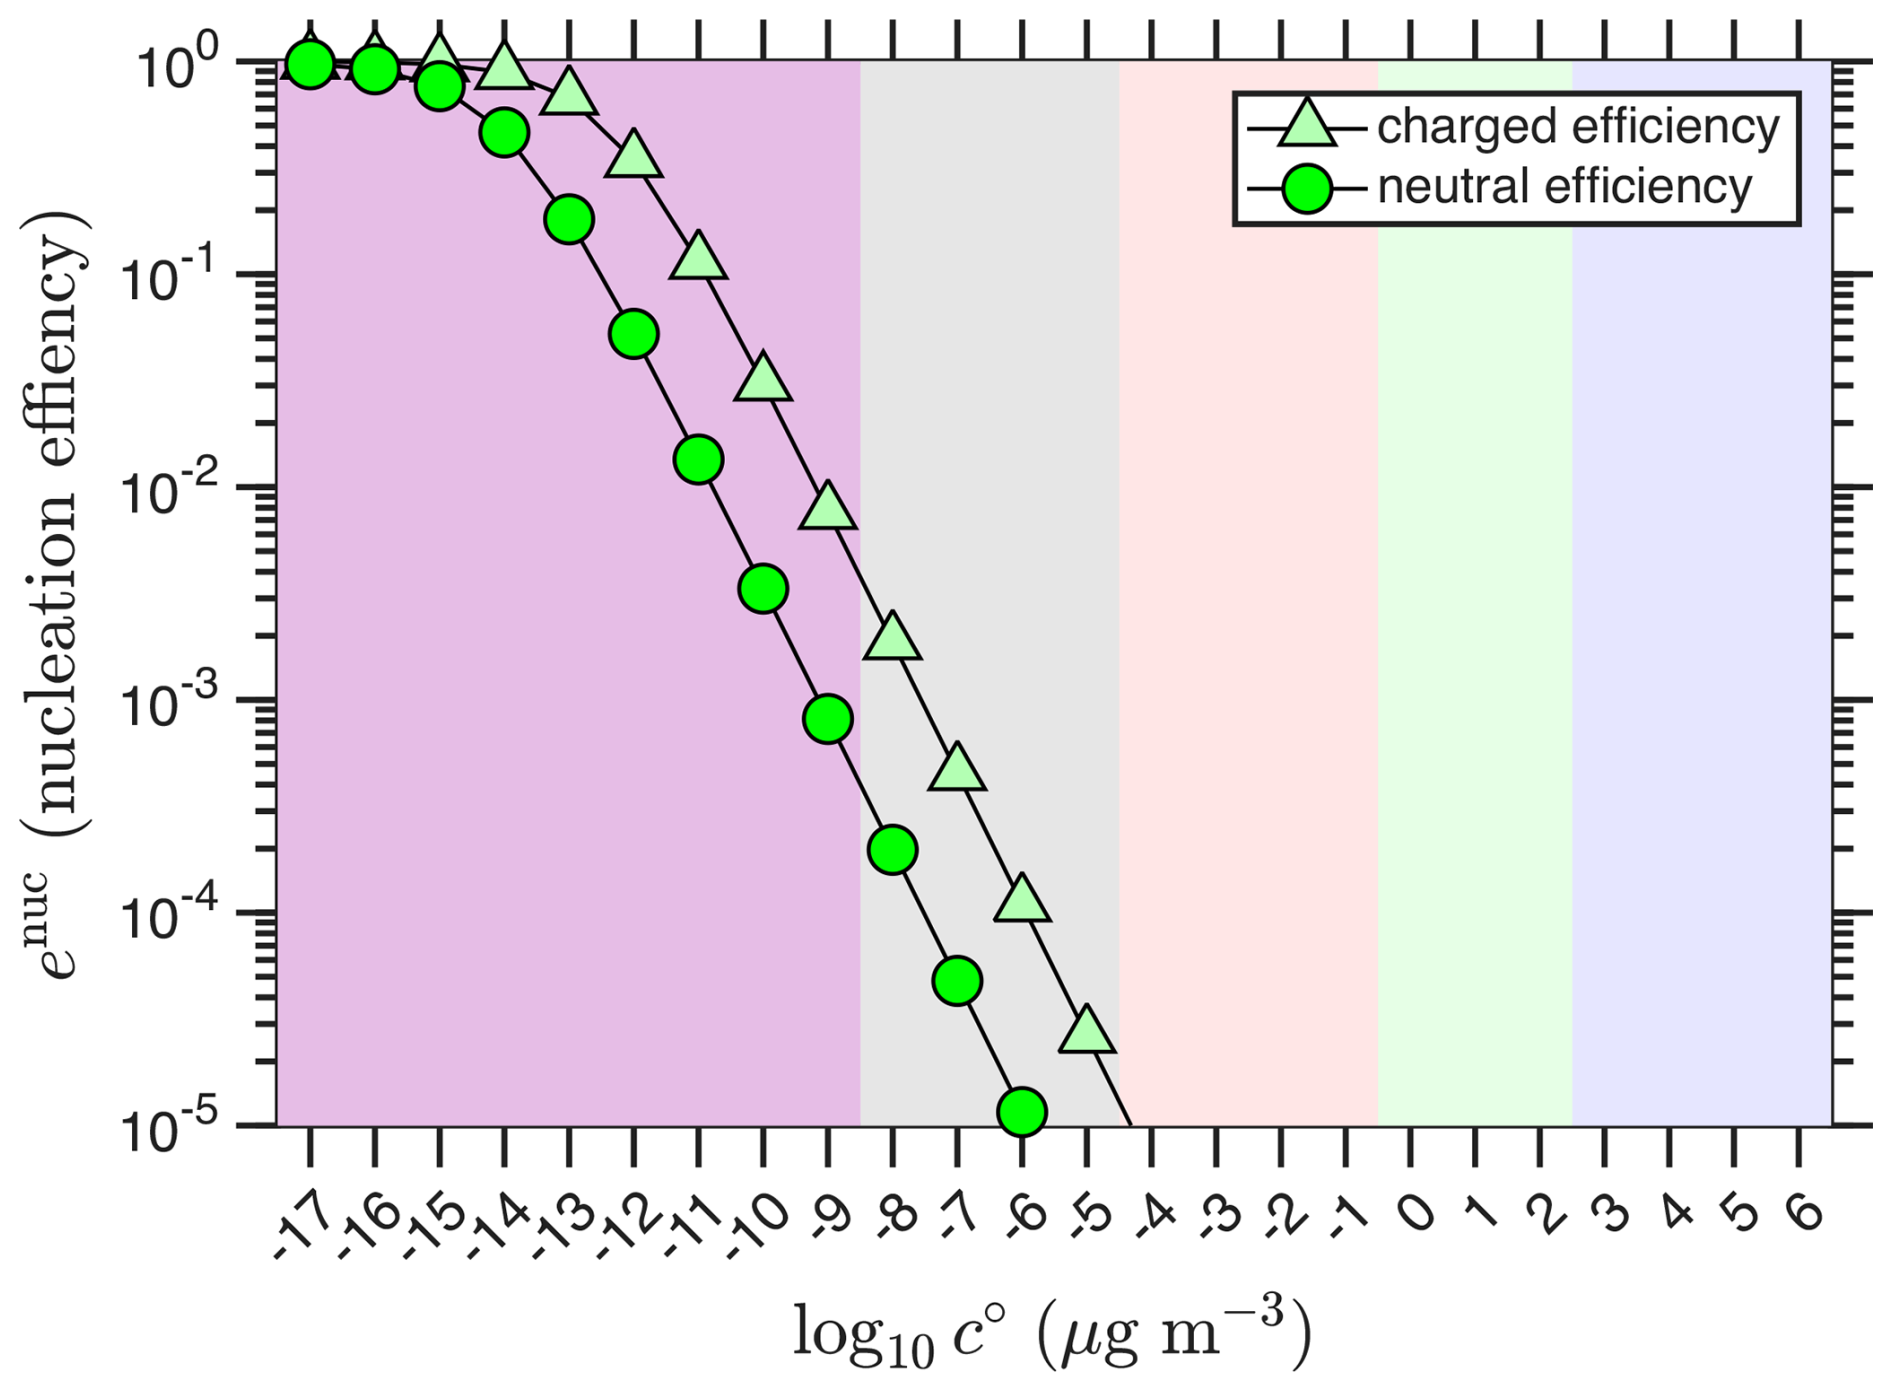
Figure 3Nominal nucleation efficiencies. Nucleation efficiencies for neutral and charged nucleation with 1012 and 109 and the example “wedge” volatility and saturation ratio distributions. Efficient nucleation is largely confined to the ULVOC range.
The nucleation efficiencies lead to the distributions of nLVOC and cLVOC shown in Fig. 4. The effective distributions both have maxima, which is one reason for extending the volatility distribution 8 decades into the ULVOC range. By this (empirical) scheme, the ULVOC are almost the only species involved in nucleation (thus they are the “nucleators”). The portions of each bin not involved in nucleation are shown as clear bars in Fig. 4. The portion of cLVOC shown in light green would not nucleate as neutral clusters. This component is vulnerable to disruption via neutralization; if an ion n∓ were to collide with a cluster before it crosses a critical stability threshold, the resulting neutral ui,j would be too volatile to sustain neutral nucleation and so evaporate.
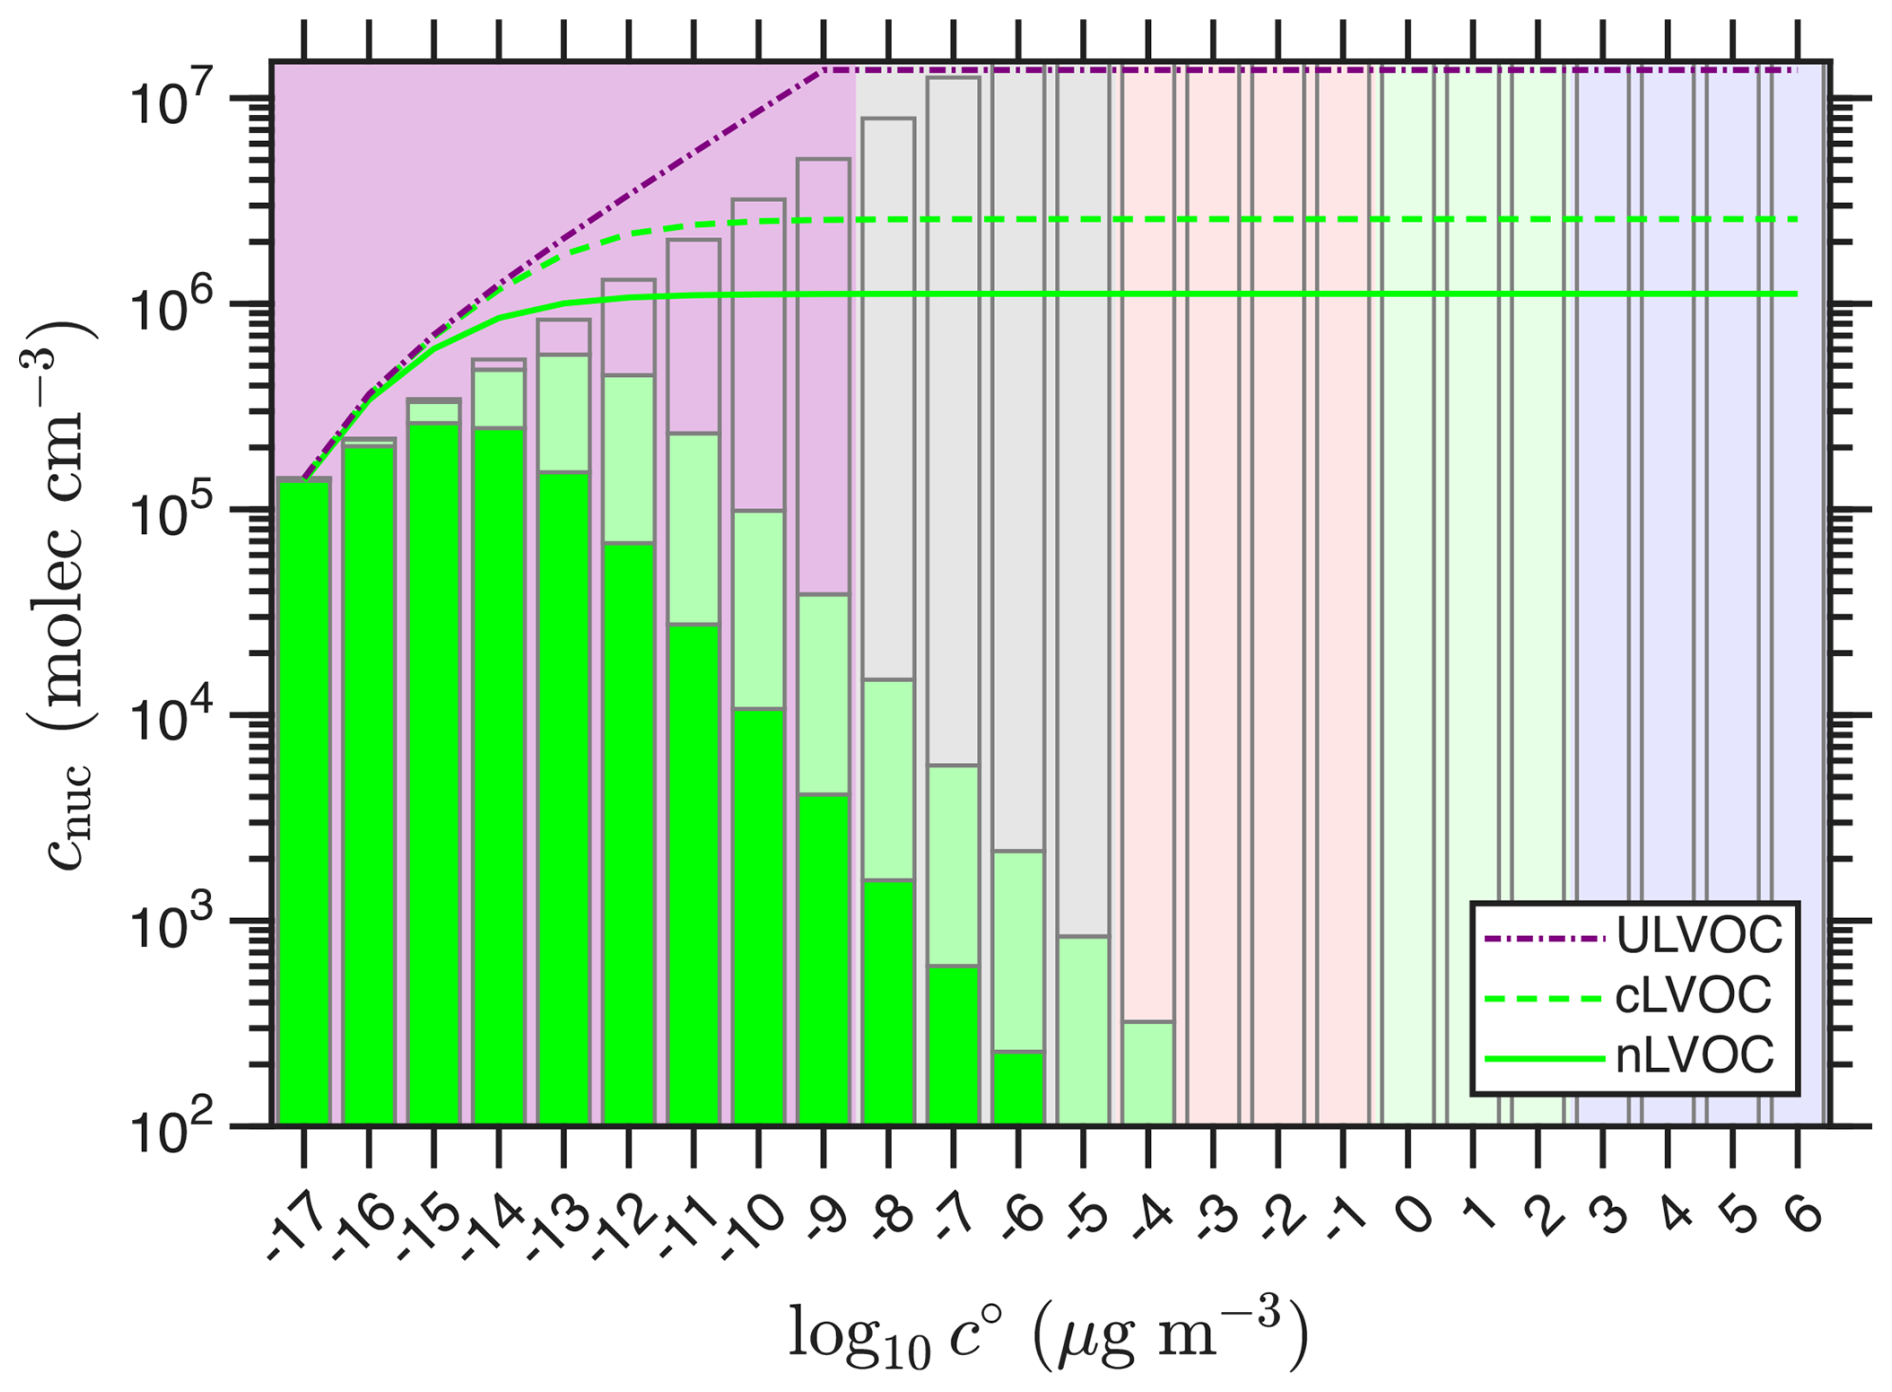
Figure 4Nucleating volatility distributions. Distributions for neutral (nLVOC; dark green bars) and charged (cLVOC; dark plus light green bars) species. Organics that are too volatile to participate are shown with clear bars. The cumulative sums of both are the curves, culminating in the final nLVOC and cLVOC concentrations.
4.2 Varying concentrations
Typical nucleation experiments involve systematically varying the concentration of the nucleating species and measuring new-particle formation rates. Here we vary the conditions by simply scaling the “wedge” distribution in Fig. 1 and then present all values versus the ULVOC concentration. We continue to plot the concentrations (and nucleation rates) versus ULVOC because this is useful empirically and because the nucleators are a relatively large (but variable) subset of all ULVOC.
Figure 5 shows the concentrations of nLVOC and cLVOC versus ULVOC. It also shows the “kinetic limit” if all ULVOC species were to nucleate via neutral nucleation (Dada et al., 2023), along with contours at 10 %, 1 % and 0.1 %. If 10 % of the ULVOC comprise nLVOC, then the nucleation rate would be 1 % of the “kinetic limit” because it is second order. Because the saturation ratio rises as the total concentration rises, the nucleation efficiency shifts towards higher volatility and both nLVOC and cLVOC rise more rapidly than ULVOC (the nucleation is somewhat more than second order in ULVOC). In general the cLVOC concentration is roughly a factor of 5–30 greater than nLVOC (so most cLVOC are not also nLVOC).
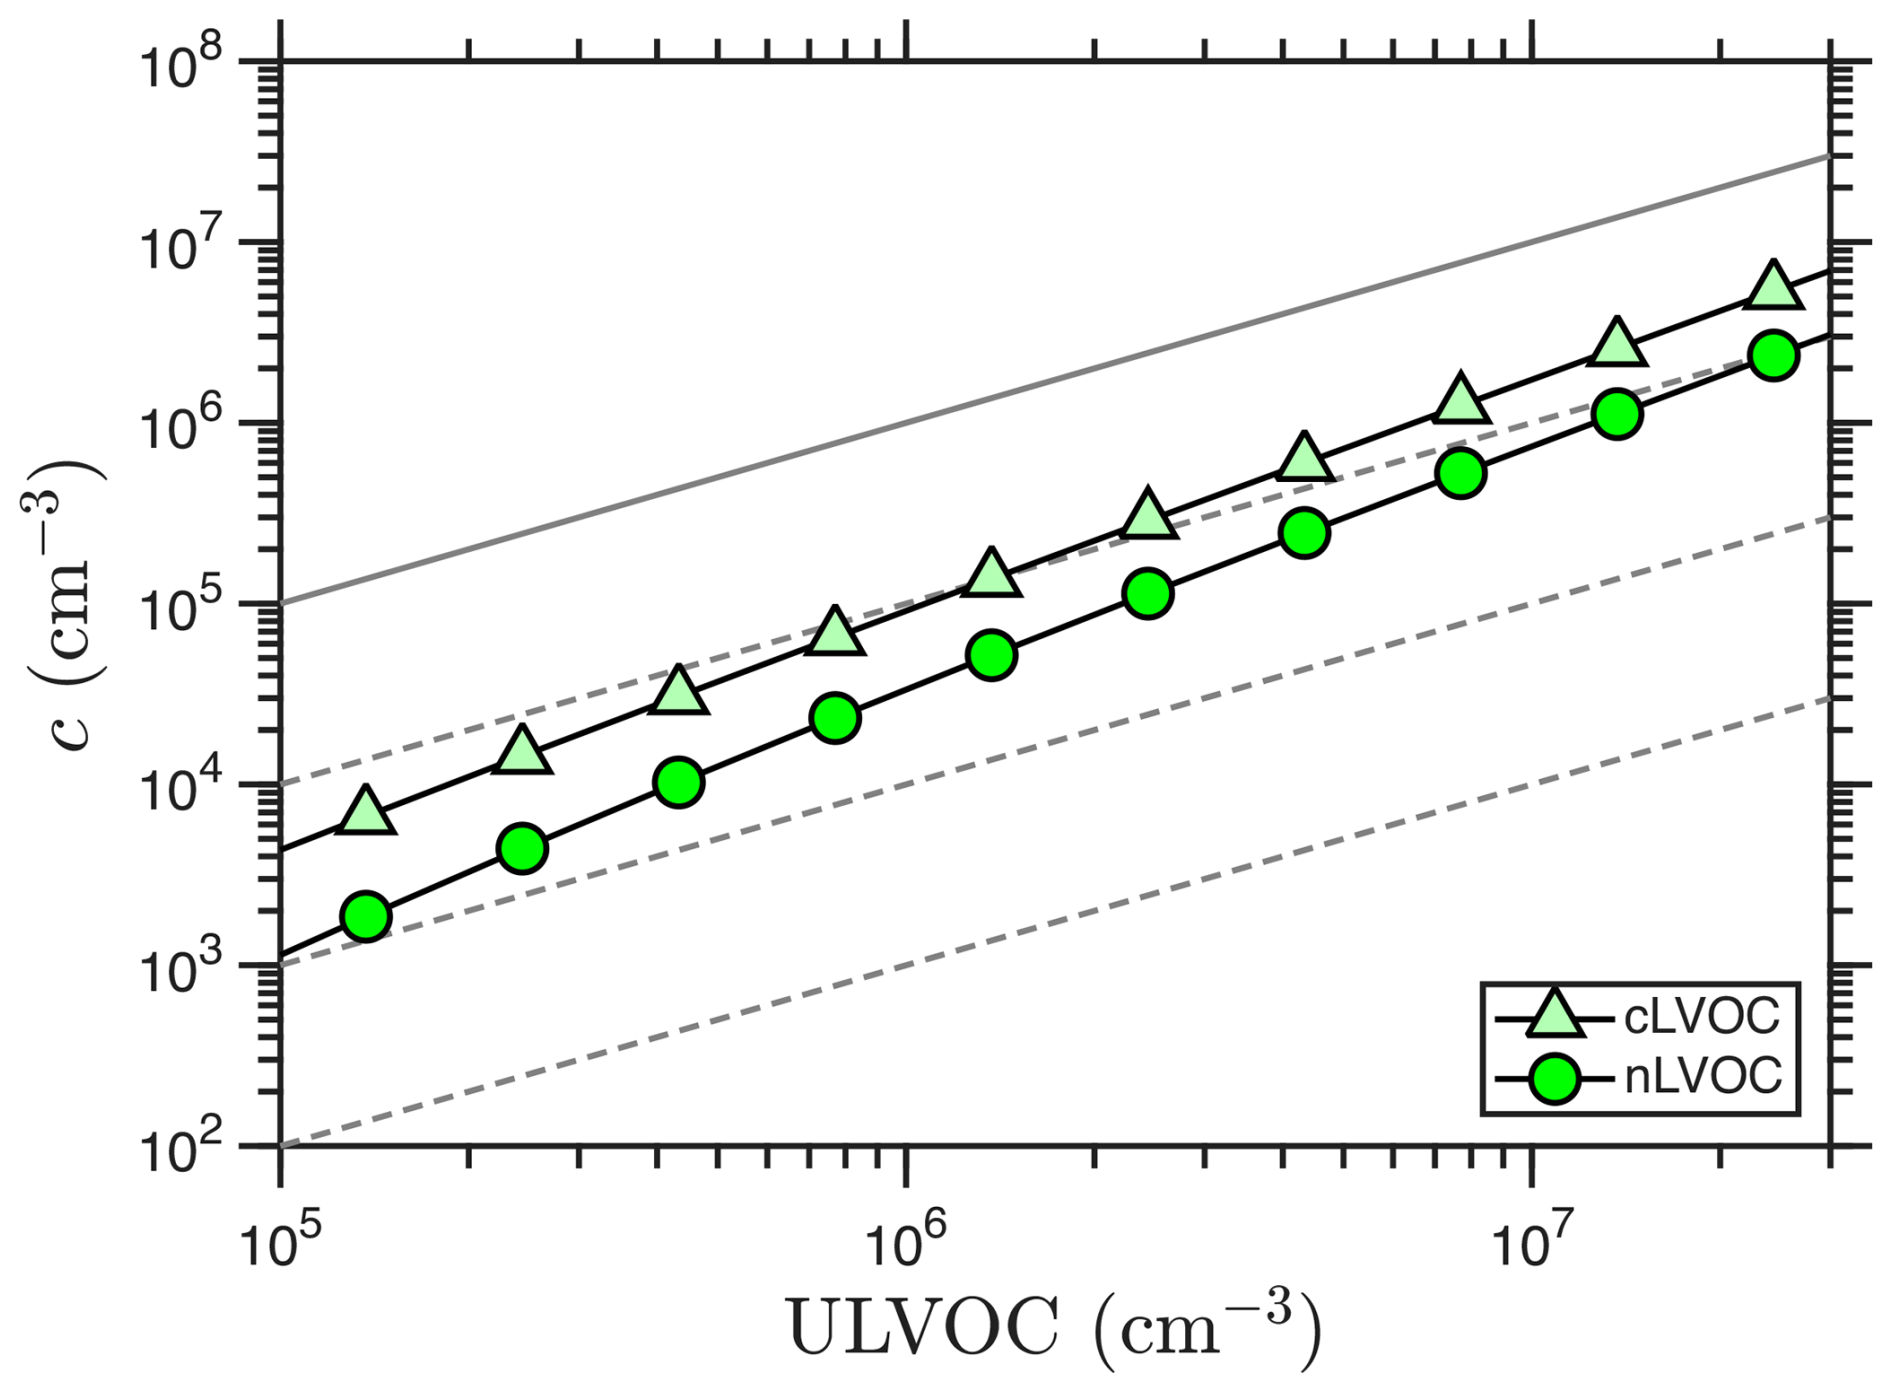
Figure 5Nucleator concentrations vs. ULVOC for the example case. The 1:1 line shows what would result if the neutral nucleators were simply ULVOC, with 10 %, 1 % and 0.1 % dashed contours as well.
4.3 Nucleation kinetics
We can model neutral (J∘) and ion-induced (J±) nucleation for the assumed VBS volatility distribution within a chamber experiment such as the CERN CLOUD chamber. We will assume an ion-pair production rate, Q, from galactic cosmic rays or the CERN particle beam.
We assume the following kinetics, including a steady state primary ion concentration that can be depleted by charged nucleation:
The steady state for primary ions is given by a balance of production and loss, with both a second-order ion-ion recombination term (kii) and a pseudo first-order term () combining wall (kw) and nucleation loss.
Nucleation is a sink for the primary ions, and as the ion induced nucleation rate rises towards the ion formation rate, the steady-state ion concentrations are depleted. This is shown in Fig. 6. Here for simplicity we assume that both polarities participate identically, so the asymptotic (saturated) ion-induced nucleation rate is twice the ion-pair formation rate, Jiin∼ 2Q. If the nucleation efficiencies were substantially different for the positive and negative channels, this asymptotic approach could have two steps, one at Q and one at 2Q. Conversely, an ion-induced nucleation rate nearing the ion formation limit requires that the ions be fully depleted via the nucleation process, again either at one common ULVOC concentration, such as in Fig. 6, or with two different depletion curves for asymmetrical ion-induced nucleation.
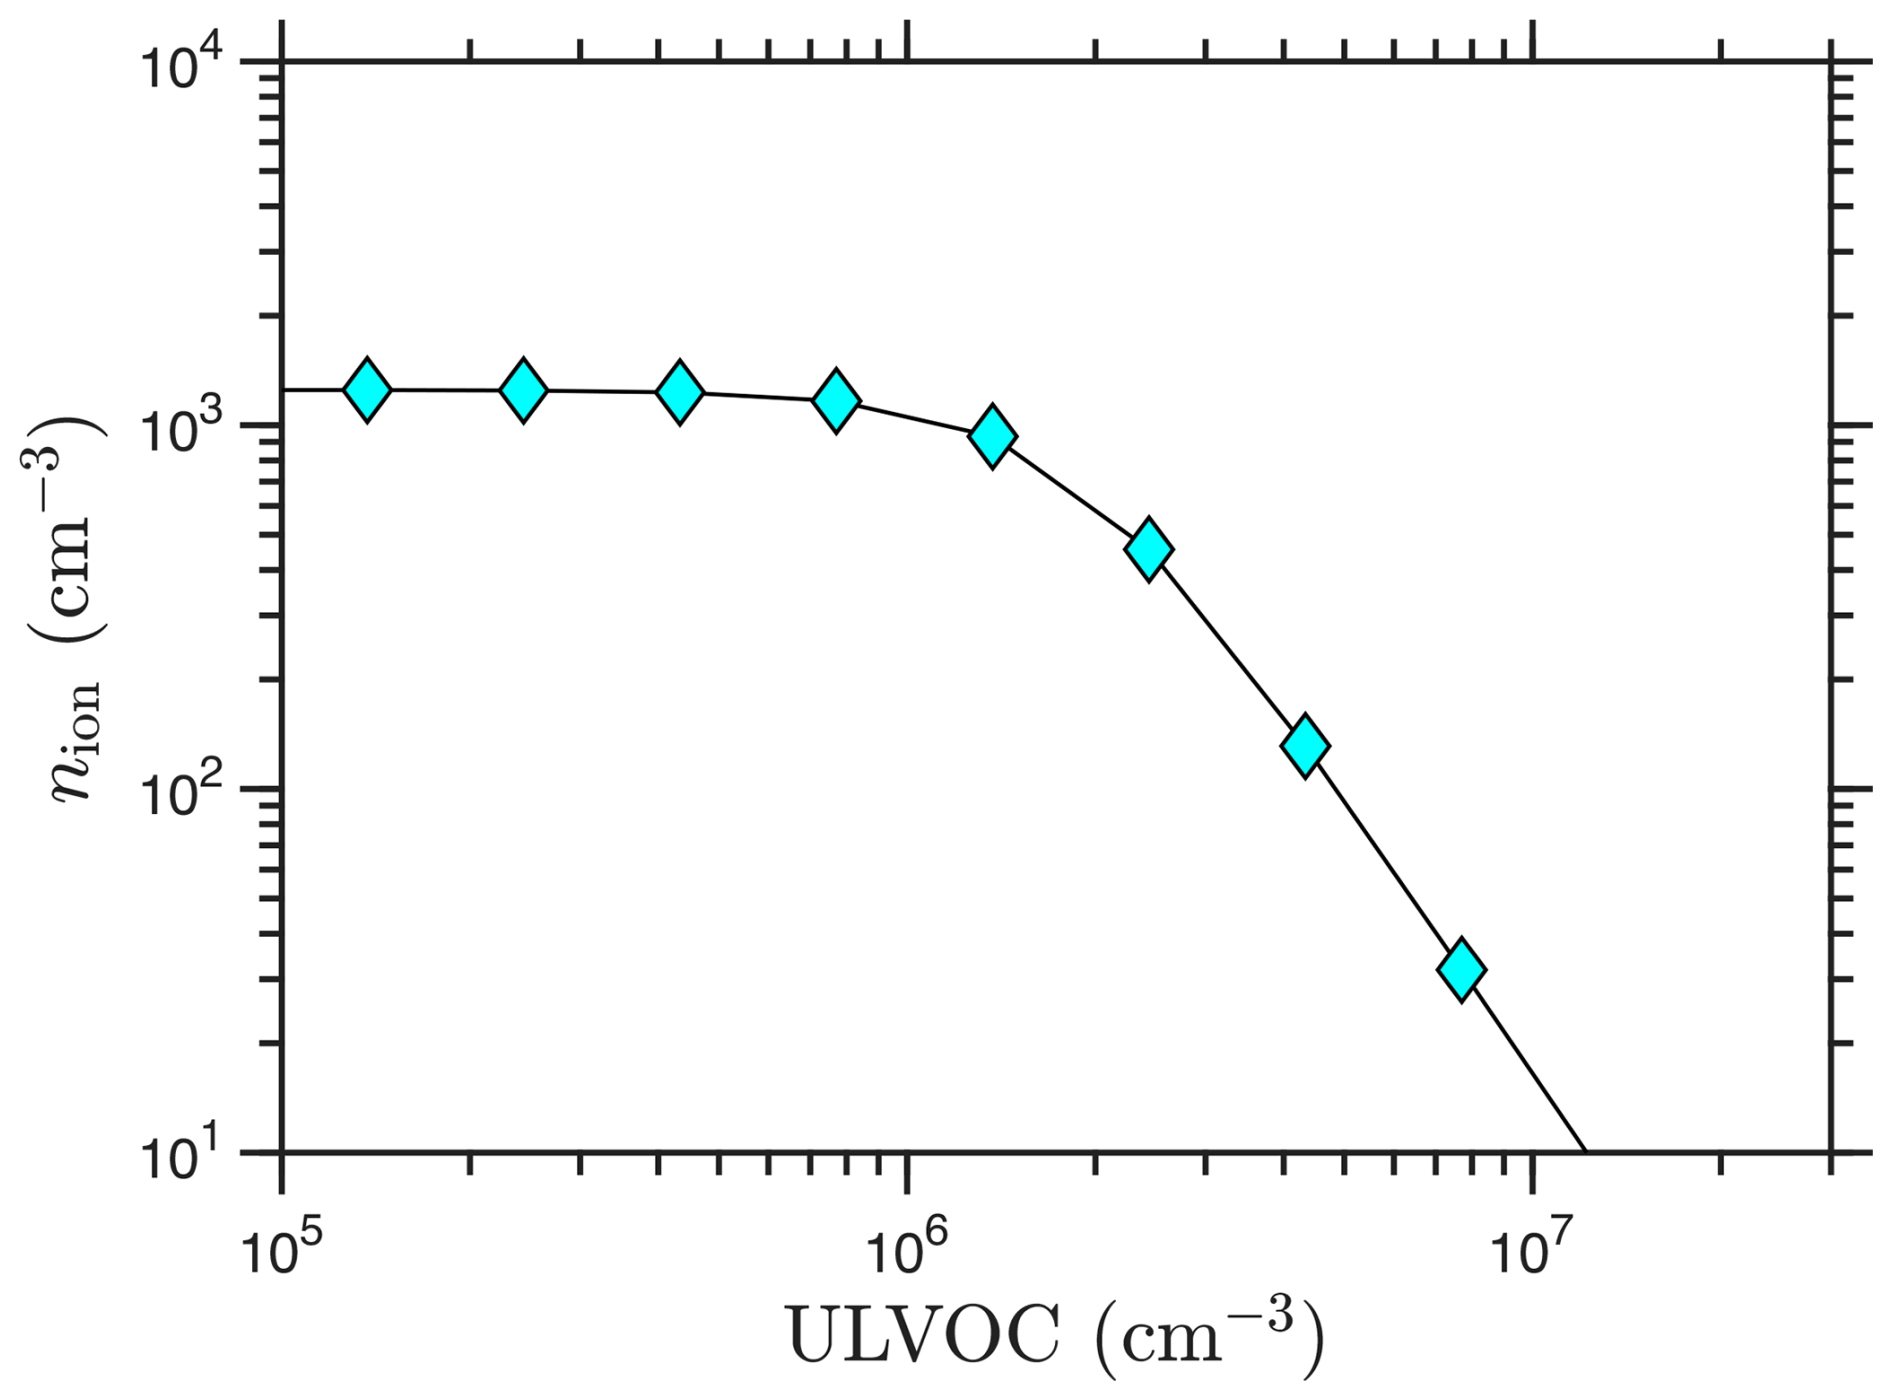
Figure 6Ion concentrations vs. ULVOC. Negative and positive ions have the same concentration; each is near 1200 cm−3 at low ULVOC. Ion induced nucleation depletes the primary ions for ULVOC > 106 cm−3.
Nucleation rates
We define the following nucleation rates, where “gcr” represents galactic cosmic rays:
The corresponding nucleation rates are shown in Fig. 7, where we assume an ion pair production rate, Q = 5 . These agree qualitatively with observations (Kirkby et al., 2016; Simon et al., 2020; Dada et al., 2023). Because of the increasing efficiency with increasing concentrations, the overall slope at low ULVOC is somewhat larger than 2, so the behavior is slightly steeper than quadratic. The exact slope depends strongly on the shape of the volatility distribution.
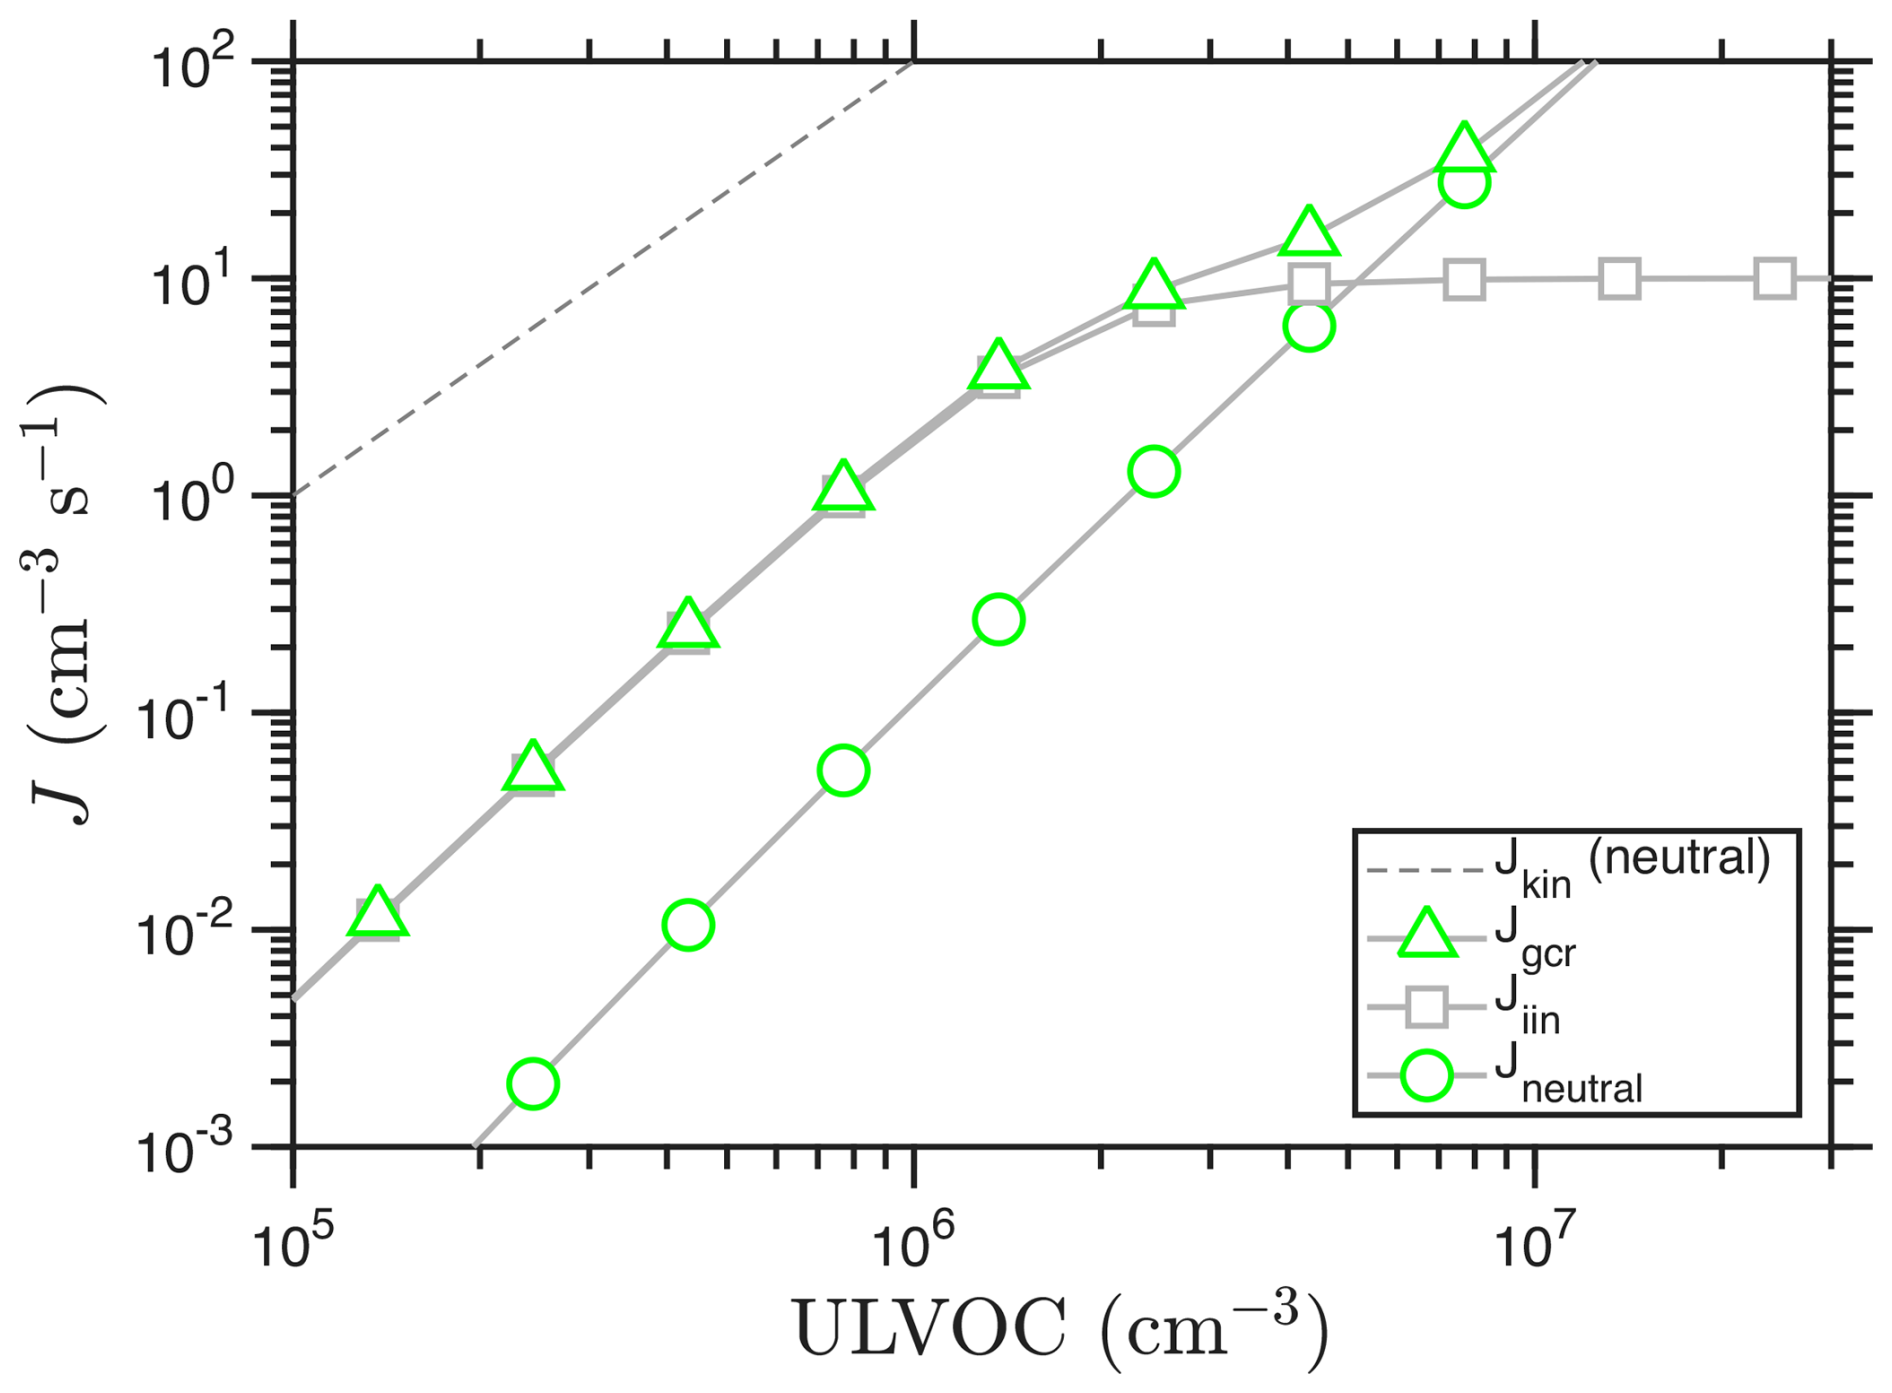
Figure 7Nucleation rates vs. ULVOC. Ion induced nucleation (iin) saturates at 2Q = 10 as primary ions of both polarities are depleted. Neutral nucleation is substantially slower at low ULVOC but eventually overtakes ion-induced nucleation because it does not have a “Q limit”. The combination is the nucleation rate under galactic cosmic ray conditions (Jgcr). The kinetic limit for neutral nucleation is shown as a dashed line.
The general shape of Fig. 7 is characteristic and was first presented by Raes et al. (1986), 30 years before it was observed in CLOUD (Kirkby et al., 2016). The ion-induced nucleation rate is typically a factor of 10–100 times faster than the neutral rate for low J (Kirkby et al., 2016; Simon et al., 2020). However, as the ion-induced nucleation rate saturates, it levels off, before the neutral nucleation rate eventually surpasses it. Thus the rate for gcr conditions and J≫Q converges with the neutral rate, as only neutral nucleation can exceed the ion-pair formation limit. This is also one reason that experiments must span nucleation rates below and above the ion-pair formation rate (which are also highly relevant in the atmosphere), as experiments with too-high nucleation rates will effectively be blind to the differences between charged and neutral pathways.
Simon et al. (2020) presented temperature-dependent nucleation rates from “pure biogenic” α-pinene oxidation by O3 in the CERN CLOUD chamber, along with a comprehensive analysis of the composition of organic vapors, measured by a combination of and PTR-3 (H3O+) chemical ionization mass spectrometry (CIMS). The left-hand column of Fig. 8, corresponding to Fig. 7 in Simon et al. (2020), shows measured volatility distributions when the overall α-pinene oxidation rate was 2–3 × 10⁶ , with saturation concentrations adjusted to the experimental temperature using the “NMD” parameters described in Appendix A: ΔHv,0 = 100 kJ mole−1, δΔH = 6 kJ mole−1 (Donahue et al., 2011). The original Simon et al. (2020) analysis used different “Stolzi” parameters from Stolzenburg et al. (2018), also presented in Appendix A.
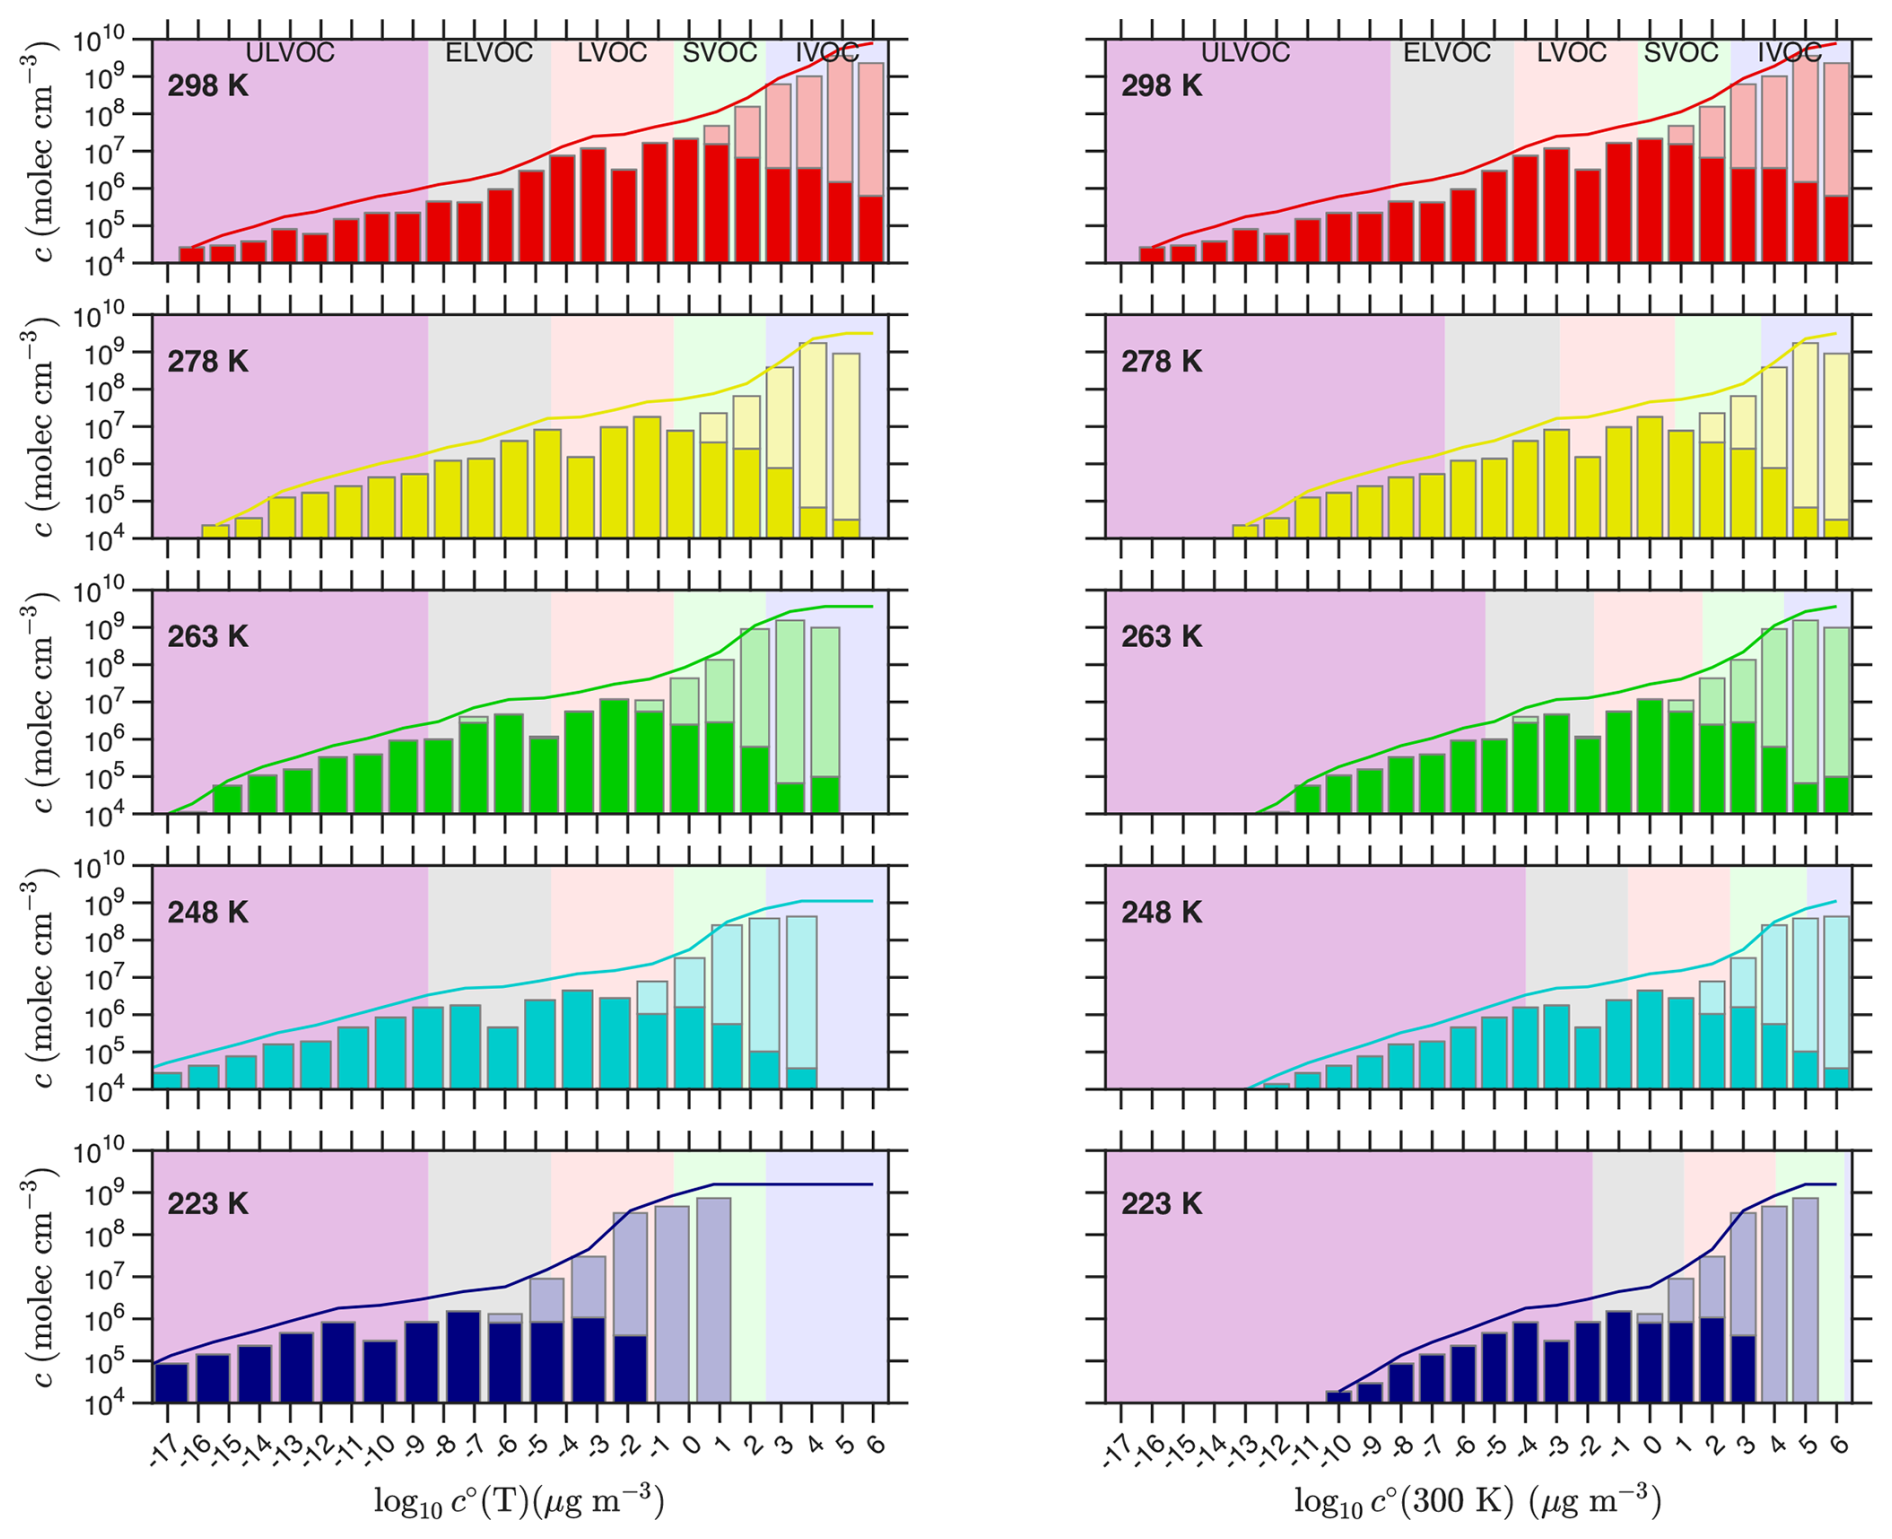
Figure 8Volatility distributions from α-pinene ozonolysis in CLOUD at various temperatures. Distributions at different temperatures (from Simon et al., 2020) are shown in two different ways in the two columns. In the left-hand column the plotted volatilities are adjusted to the chamber temperature (shifting progressively to the left as temperature drops), whereas in the right-hand column the bins are plotted vs. 300 K volatility but the volatility classes are adjusted to show the values in the chamber (the purple IVOC, etc shift progressively to the right as temperature drops). The left column highlights the actual volatility at each temperature, with bins shifting leftward with declining temperature but the overall colored classes remaining vertically aligned. The right column highlights the changing chemistry (less oxidation) as the chamber gets colder; here the bins remain fixed, but the counterbalancing volatility classes shift rightward due to the cold (some bins that were LVOCs at 298 K are ULVOCs at 223 K). Measured concentrations at each temperature are grouped into volatility bins at 300 K and adjusted to the chamber temperature using the “NMD” volatility parameters. Measurements combine CIMS and PTR-3; with the larger of the two measurements shown with the total bar. The dark portion of each bar is the CIMS measurement alone. The curve shows the cumulative sum of the total measurement.
In the right-hand column of Fig. 8, concentrations are plotted vs. log c∘(300), but the volatility classes (colors) are shifted (rightward) to show the ever decreasing volatility at the chamber temperature as it drops towards 223 K. The distributions in this column show that the chemistry slows dramatically as temperature drops. This is consistent with observations of particle composition using thermal desorption I− CIMS (Ye et al., 2019), as well as our understanding of H-transfer isomerization kinetics in RO2 autoxidation chemistry (Schervish and Donahue, 2020; Schervish et al., 2024). The distributions resemble the “wedge” distribution of Fig. 1, and even at 223 K there are still products with a ULVOC intrinsic volatility (). These are covalently bound C20 “dimers” made from RO2 that have undergone at least one round of isomerization/autoxidation (Schervish and Donahue, 2020; Simon et al., 2020). However, that reaction front of dimers does move to progressively higher bins as temperature drops, so many 298 K C20 species have undergone many rounds of autoxidation.
However, as temperature drops the rapidly declining volatility largely counterbalances the slowing chemistry, so less oxidized products fall into the ULVOC range. By 223 K, the lowering volatility outpaces the slowing chemistry and the products and the tip of the “wedge” have driven well to the left of the −17 bin in the left-hand column. These two effects approximately counterbalance each other – but not exactly. At 298 K the wedge extends to the −17 bin (for log c∘(T)), but as temperature drops towards 263 K the wedge retreats to the right, exposing bare ULVOC purple. In this range the slowing chemistry is out-pacing the decreasing volatility. However, as temperatures drop further toward 223 K, the lowering volatility finally wins out and the wedge moves leftward again. The δΔH term is also evident in the log c∘(T) (left) column, as the bins spread apart and the bars in the bar plot get noticeably wider.
For a 500 s−1 wall loss rate coefficient and P = 2.5 × 10⁶ , the steady state product concentration would be 1.25 × 109 cm−3. This is very close to the cumulative sum of the measurements for T≤ 263 K. At higher temperatures it is likely that the more volatile products are not lost efficiently to the walls, and so instead persist in the CLOUD chamber with a ventilation timescale (of order 5000 s) rather than a wall-loss timescale. Thus the warmer cumulative sums are higher by a factor of 5–10. Overall, the agreement between the expected and observed steady state confirms the mass spectrometer calibrations. We can thus be reasonably confident in the ULVOC concentrations. This is important, as nucleation rates scale with ULVOC2. However, the molar yield of a species (bin) with ci = 1.25 × 105 cm−3 is 10−4, or 10 ‰ (Schervish and Donahue, 2020). This is an exceedingly small number. It is also consistent with early estimates of nucleator yields from chamber kinetics experiments (Burkholder et al., 2007).
5.1 Nucleation rates
The VBS nucleation rates for each temperature using these distributions (and the “NMD” volatility parameters) are shown in Fig. 9. Here we use saturation thresholds of s0 = 1011 and s± = 5 × 10⁹. We assumed the volatility distributions in Fig. 8 are representative of the chemistry at the given temperature and simply scaled them as in the example case. This is not fully accurate, as many of the C20 ULVOCs arise from RO2 + RO2 reactions and so show a quadratic dependence on oxidation rate (Molteni et al., 2019). However, as long as the ULVOC volatility distribution remains relatively constant, the simple scaling should be sufficient to model the concentration dependence of the nucleation rate (as we are plotting against the ULVOC concentration, not the total α-pinene oxidation rate).
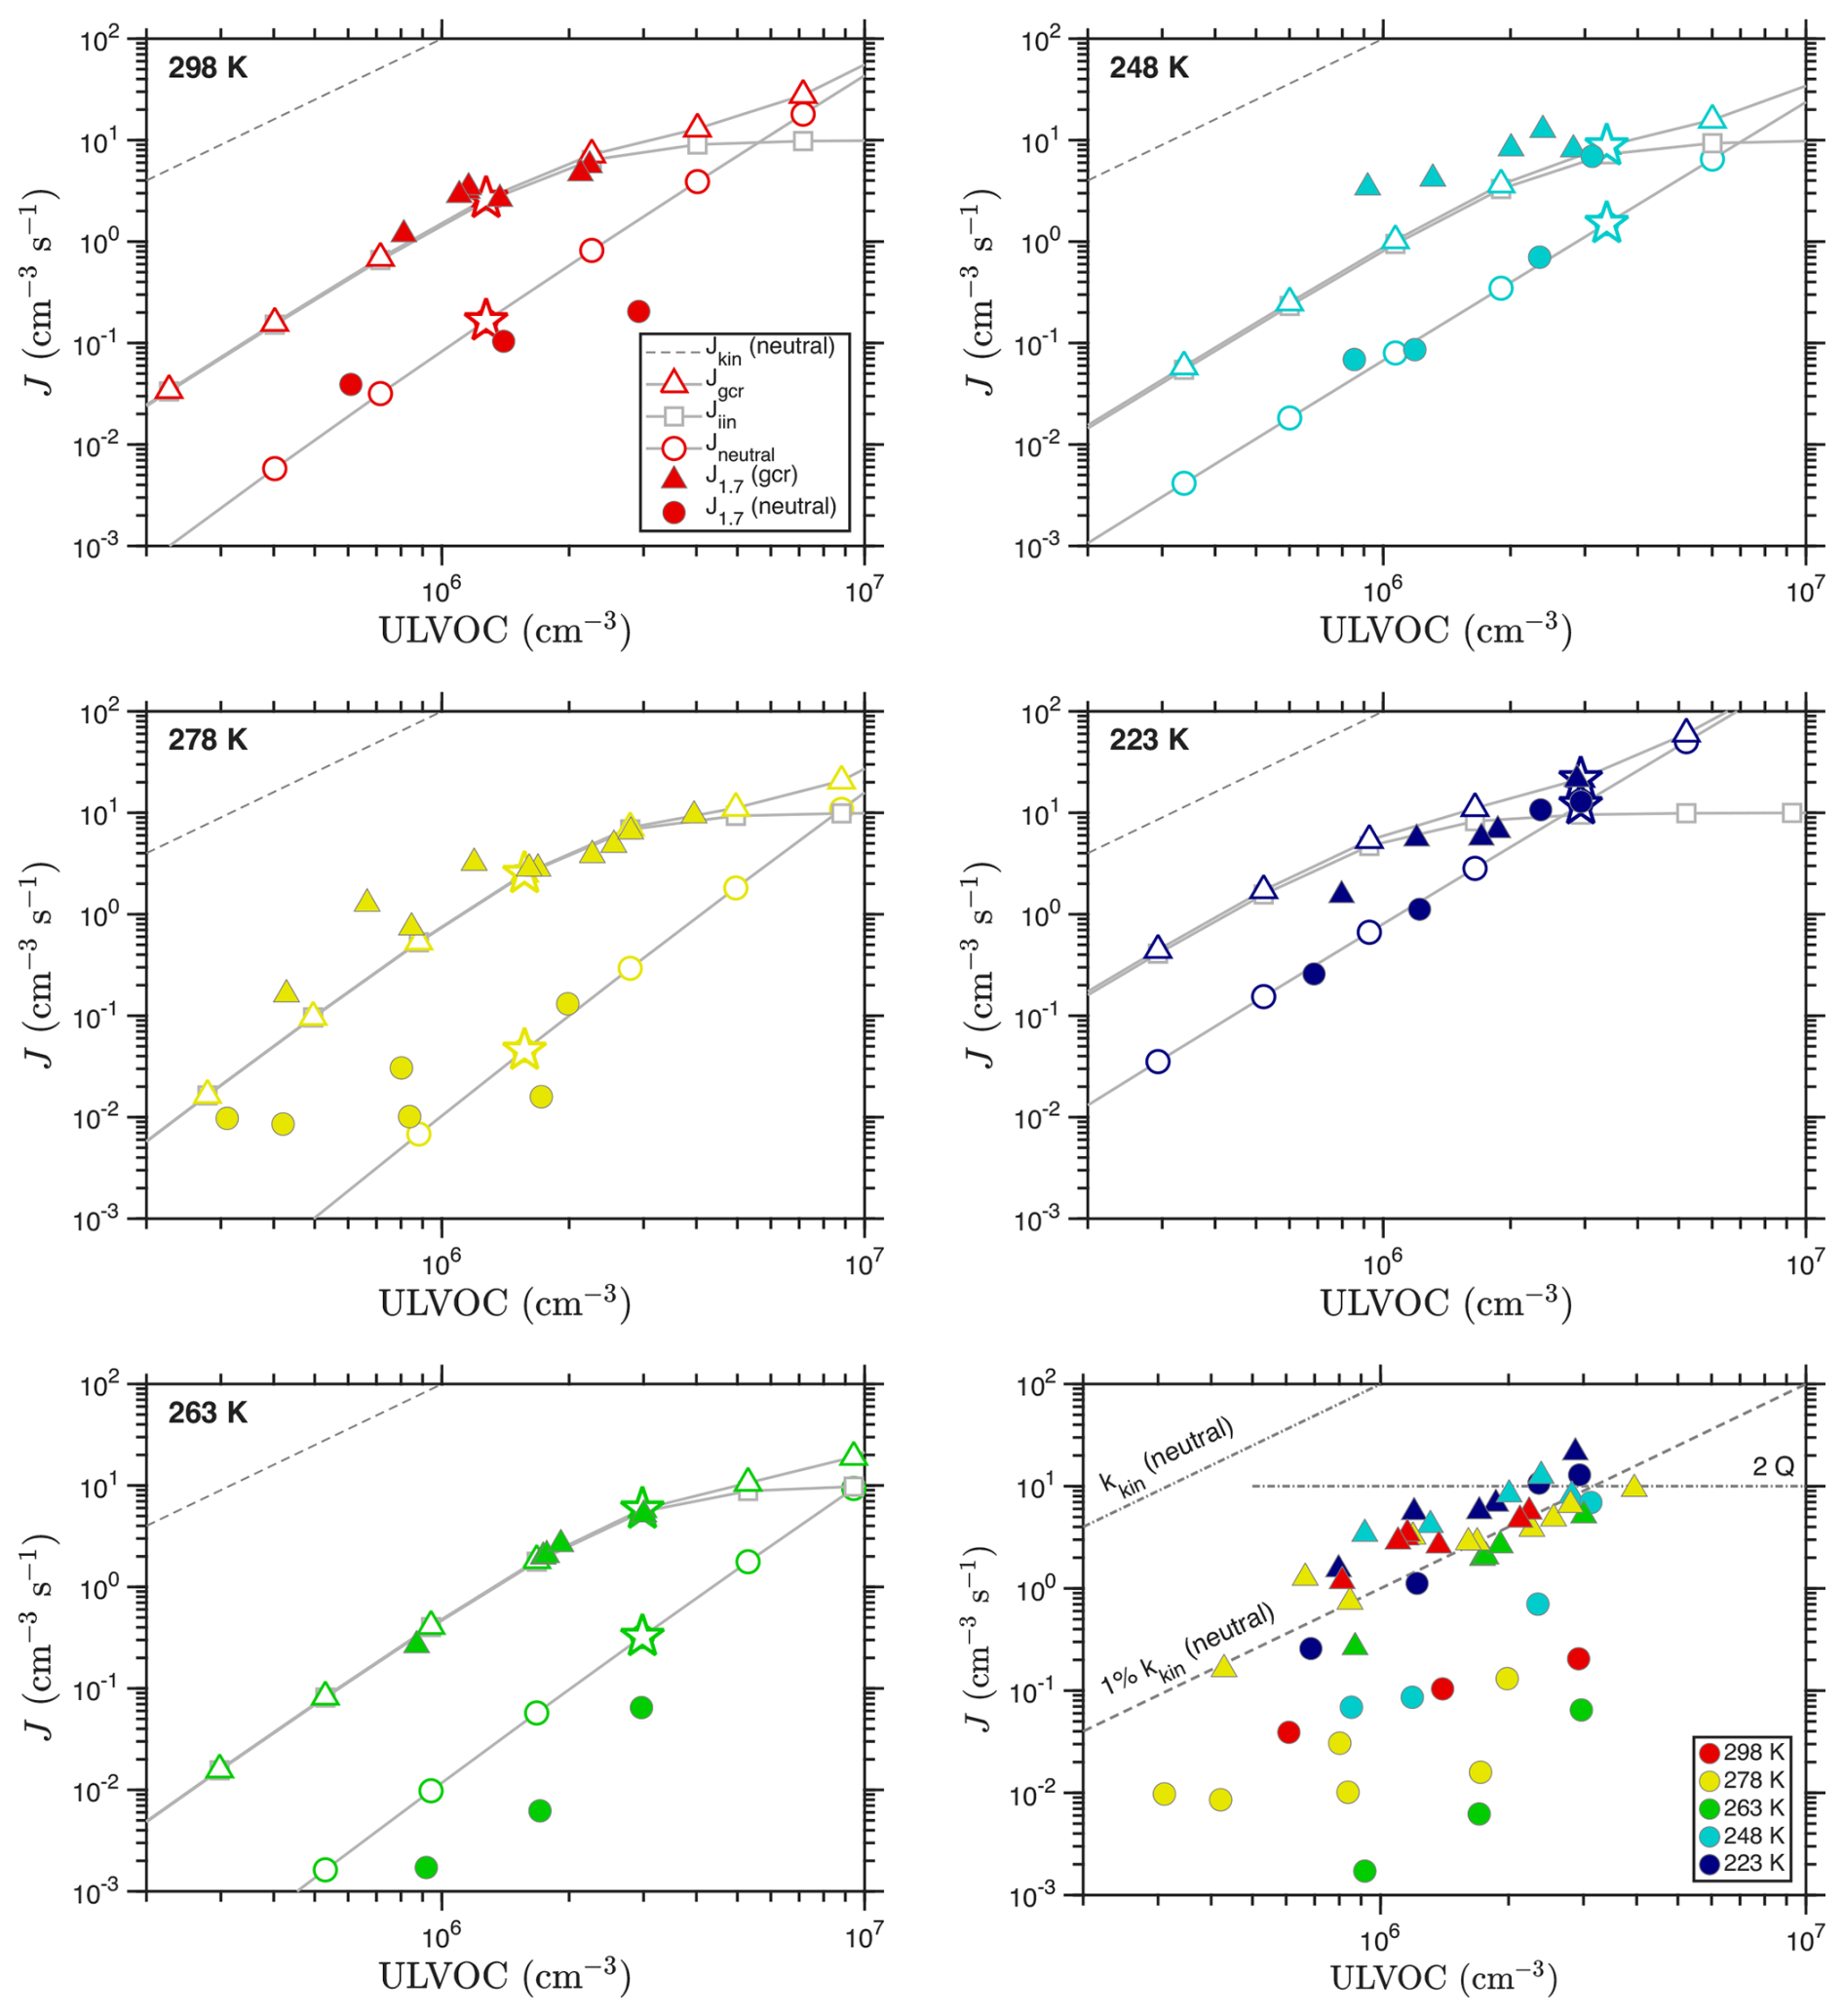
Figure 9Observed and predicted nucleation rates vs. ULVOC concentration for each temperature. Observations are filled symbols; the model values are open symbols connected with a gray curve. ULVOC concentrations for the model are obtained by scaling the volatility distributions shown in Fig. 8; the points with a scaling factor of 1.0 (the exact distribution in that figure) are shown with a star. The lower right panel shows all measured J vs. ULVOC, with color indicating temperature; this is comparable to Fig. 8d from Simon et al. (2020), without the error bars and with different asymptotes. The marked kinetic limits apply to neutral nucleation, as ion–molecule collisions have different (faster) coefficients.
Figure 9 shows that the VBS nucleation model captures the temperature dependence of the nucleation, with panels for each temperature showing model results as connected open symbols and experimental observations as filled symbols. The lower right panel also reprises the observations at all temperatures – this is similar to Figure 8d in Simon et al. (2020), although without the error bars. We compare to the measured J1.7 values reported in Simon et al. (2020) (dmob = 1.7 nm, so dp≃ 1.4 nm) without correcting for any potential wall losses between the dimer cluster and the 1.4 nm particles, as they are likely of a similar size. The aggregated measurements at all temperatures show that the observed ion induced (gcr) nucleation rates are all similar, and generally rise to approximately 2Q by ULVOC ≃ 2 × 106 cm−3. This is consistent with ion-induced nucleation fully depleting primary ions of both polarities (and requires that all ions be involved in nucleation). The model predictions likewise reproduce both the shape and absolute value of the ion-induced nucleation rates. These rates also fall along a line equal to roughly 1 % of the neutral collision limit for ULVOC, as seen in mixed terpene systems (Dada et al., 2023). However, the neutral kinetic limit, and the neutral collision rate coefficient, have no bearing on ion induced nucleation, and so while this provides a useful scale it is not meaningful. This is why the asymptotes are marked “neutral”.
Unlike the ion-induced rates, the neutral nucleation rates are more variable vs. temperature. They do show a systematic pattern, however. As temperature drops from 298 to 264 K, the neutral nucleation slows. However, as temperature drops further to 248 K and finally 223 K, the rates speed up again. This behavior is captured by the model, and it is exactly the same as the movement of the “wedge” evident in the volatility distributions in Fig. 8. The only substantive disagreement between the model and measurements is the exact temperature of the minimum in the nucleation rate. The measurements show a clear minimum at 263 K, while the model finds roughly equal rates at 278 and 263 K, suggesting a minimum between the two. The minimum exists in both the charged and neutral rates (the plotted y intercepts are a good way to evaluate this), but it is far more dramatic in the neutral rate. The relatively shallow nucleation slopes shown in the neutral observations at both 298 and 278 K are not easy to understand, as it is very difficult to explain a dependence shallower than ULVOC2 in a pure organic (volatility driven) system. Neutral nucleation rates at 278 K reported in Kirkby et al. (2016) vs. total HOM concentrations are more nearly quadratic, so this could well be ascribed to uncertain measurements for very low J ().
Overall, the VBS nucleation model is consistent with the observed ion-induced and neutral nucleation rates and, importantly, their temperature dependence. Specifically, both the measurements and model show that the neutral nucleation at first slows substantially as temperature drops, but then reverses and becomes comparatively strong at 223 K. This suggests that the ΔHv and δΔHv values in the “NMD” model used as our default are reasonable. We explore other enthalpy models in Appendix C (also varying the critical saturation ratio nucleation thresholds), and while the differences are not extraordinary, it is in general hard to find agreement at both very high and very low temperature with models using higher ΔHv values than our default model (which has the lowest ΔHv and δΔH).
An especially robust conclusion applies to the gas-phase chemistry leading to nucleation. The neutral nLVOC species are almost entirely covalently bound dimers, likely formed from RO2 that have undergone at least one round of autoxidation (Simon et al., 2020). This is true even at 223 K. This has important implications for the kinetics of at least some of the RO2 H-atom transfer reactions driving autoxidation (Bianchi et al., 2019; Schervish and Donahue, 2020).
Saturation limits
In Fig. 10 we show the volatility distributions for the fractions of each bin responsible for neutral (nLVOC) and charged (cLVOC) nucleation at each temperature, and at the same concentrations shown in Fig. 8. The figure also shows the cumulative sum of all ULVOC. Under these conditions, a relatively small fraction of the ULVOC are serving as nucleators under either neutral or charged conditions, and the modeled and observed nucleation rates are well below the neutral kinetic limit. In general, the nucleation efficiency of ELVOC species is essentially negligible. However, this does not rule out some participation in other cases for other systems. It is entirely possible a different precursor with different oxidation chemistry could generate relatively high ELVOC concentrations but very low ULVOC concentrations, and in that case the ELVOC could be a large fraction of the total nucleators. Here, however, that is not the case.
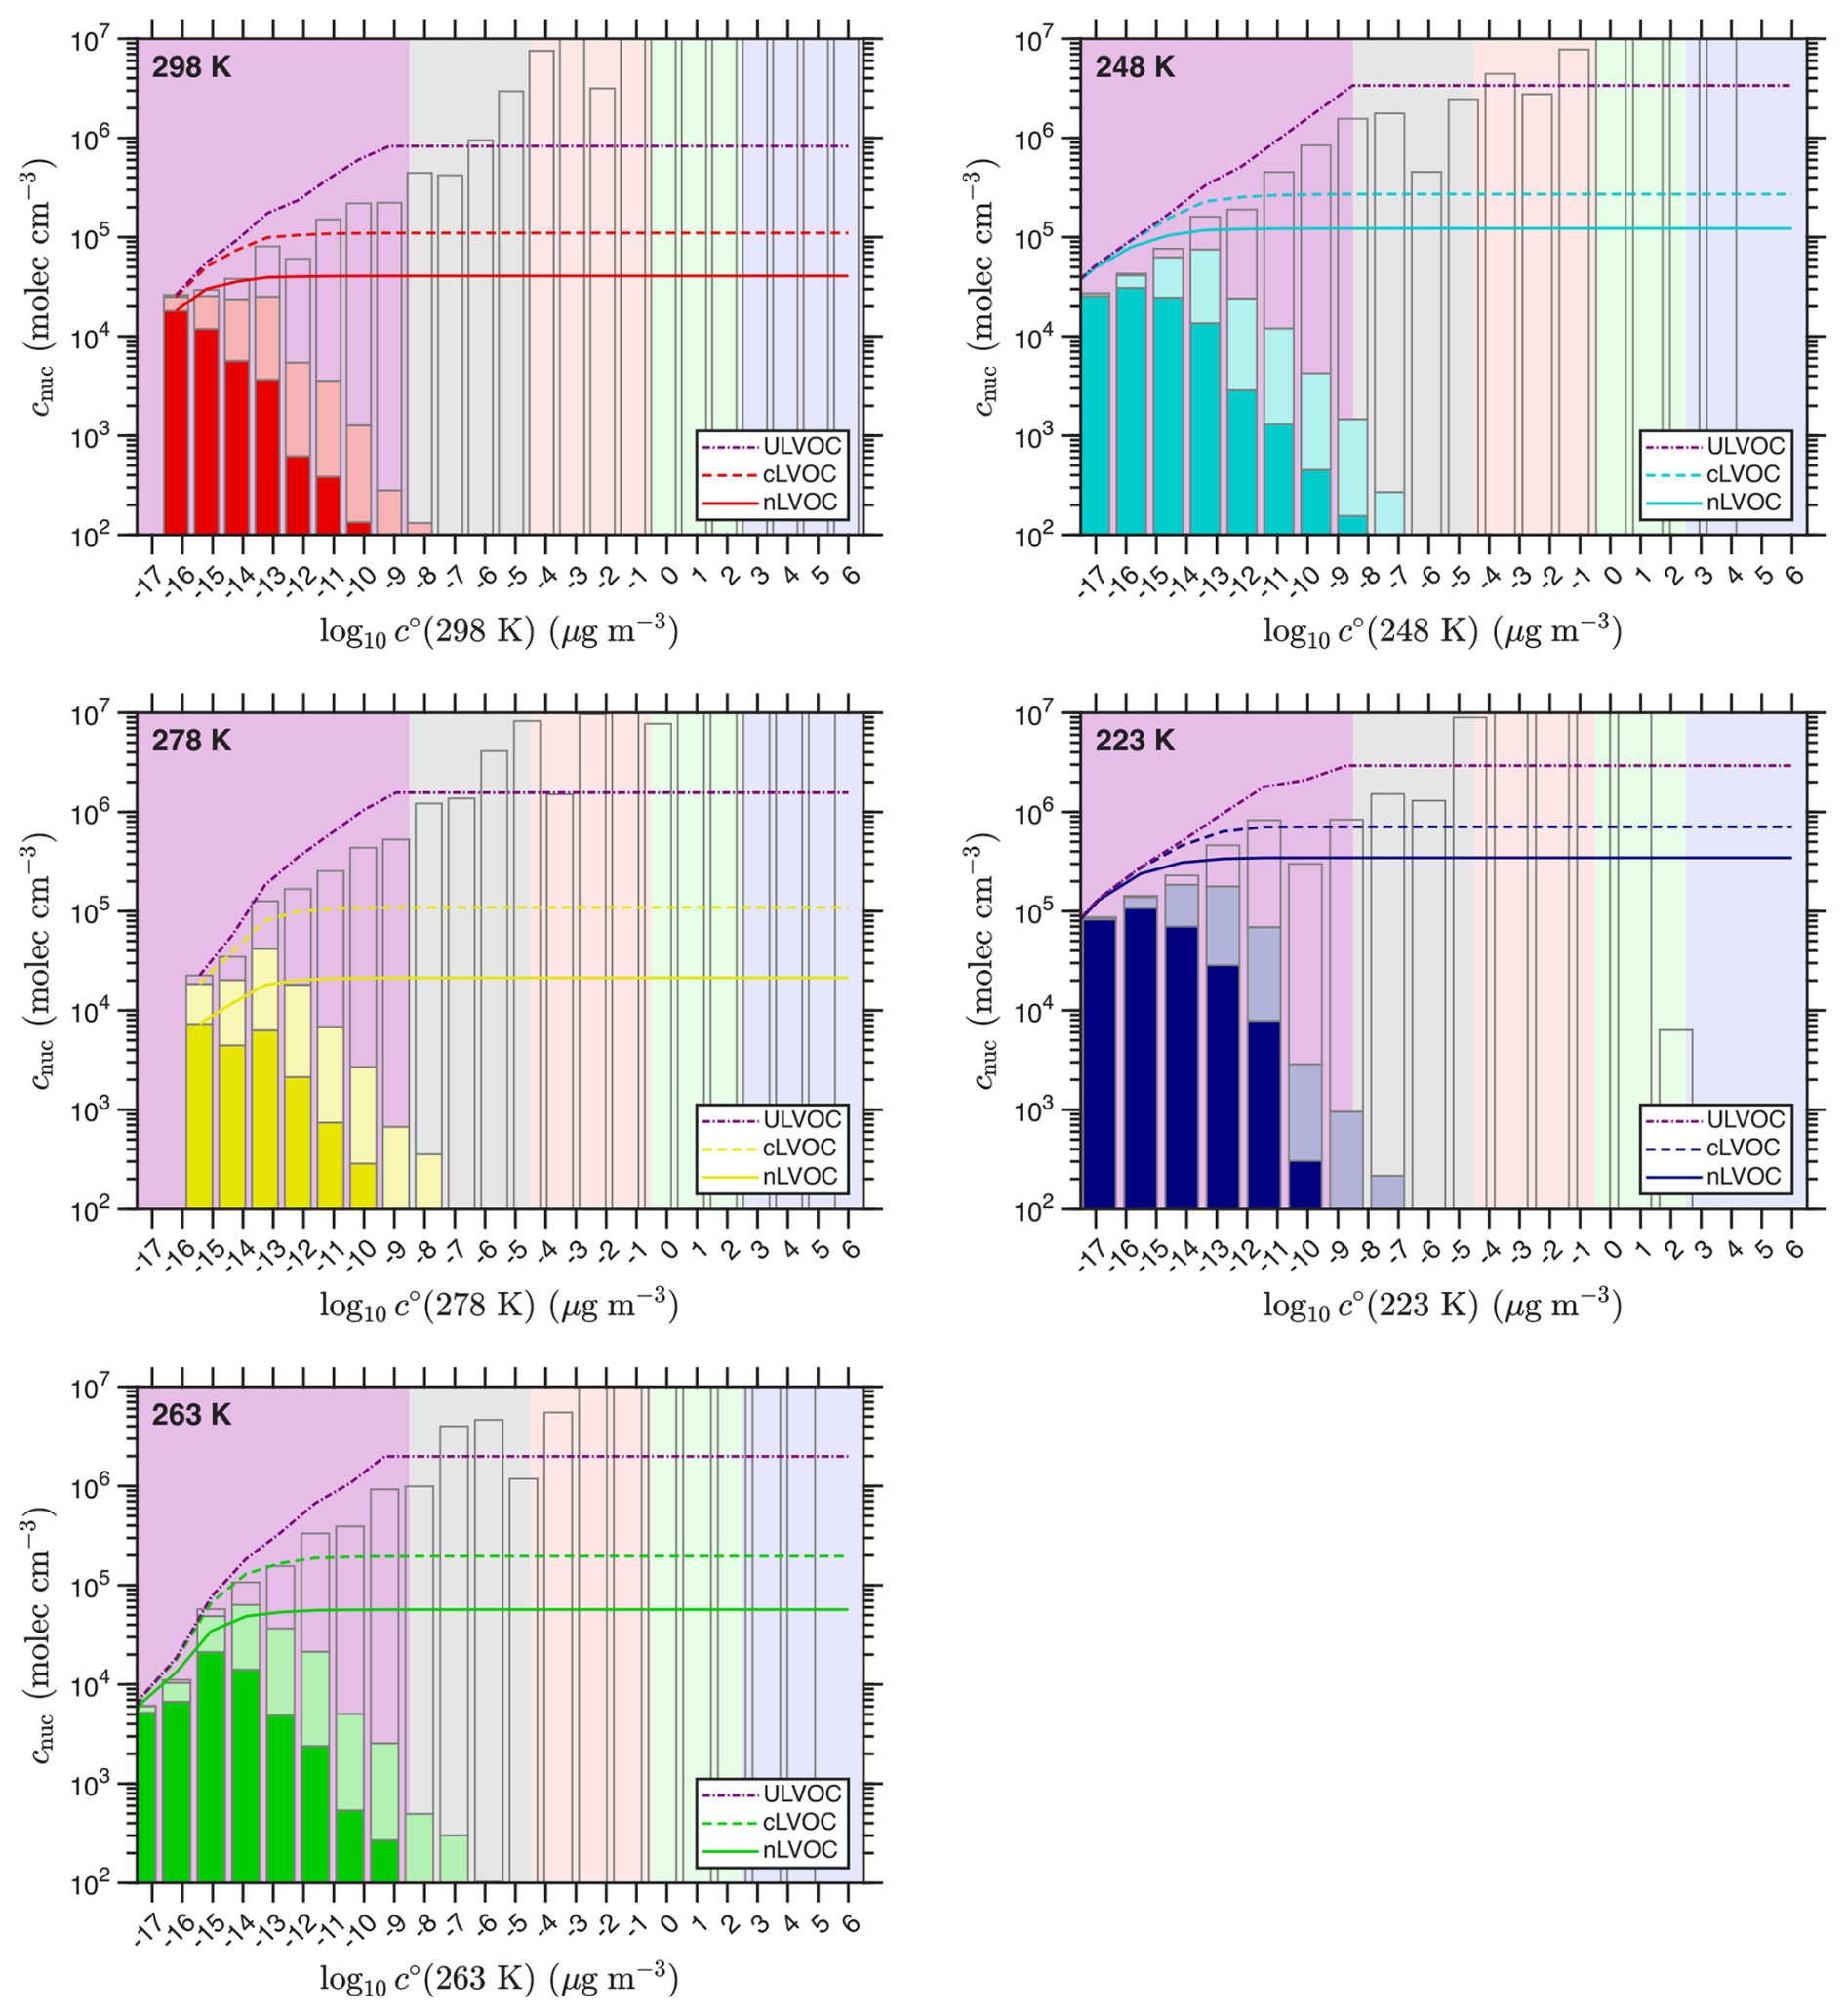
Figure 10Volatility distributions of neutral (nLVOC) and charged (cLVOC) nucleators from α-pinene ozonolysis in CLOUD at various temperatures. Concentrations are grouped into volatility bins at 300 K and adjusted to the chamber temperature using the “NMD” volatility parameters. The nLVOC fraction of each VBS bin is shown with a saturated bar, while the cLVOC increment in each bin is the faded bar. The curves are the cumulative sums of these distributions; nLVOC are solid, cLVOC are dashed, and total ULVOC are dot-dashed purple. The fraction in each bin that does not participate in nucleation is the unfilled remainder.
The saturation limits in Fig. 11 show how the shifting volatility distribution interacts with the saturation threshold values. The volatility temperature dependence and these empirical thresholds interact, though it is important that the thresholds are consistent with our theoretical expectations based on the correlation between the formation free energy of the nucleating dimer clusters and the bulk vaporization free energy vs. volatility. The saturation ratio exceeds the neutral threshold at roughly 10−18–10−16 µg m−3, which is consistent with those expectations.
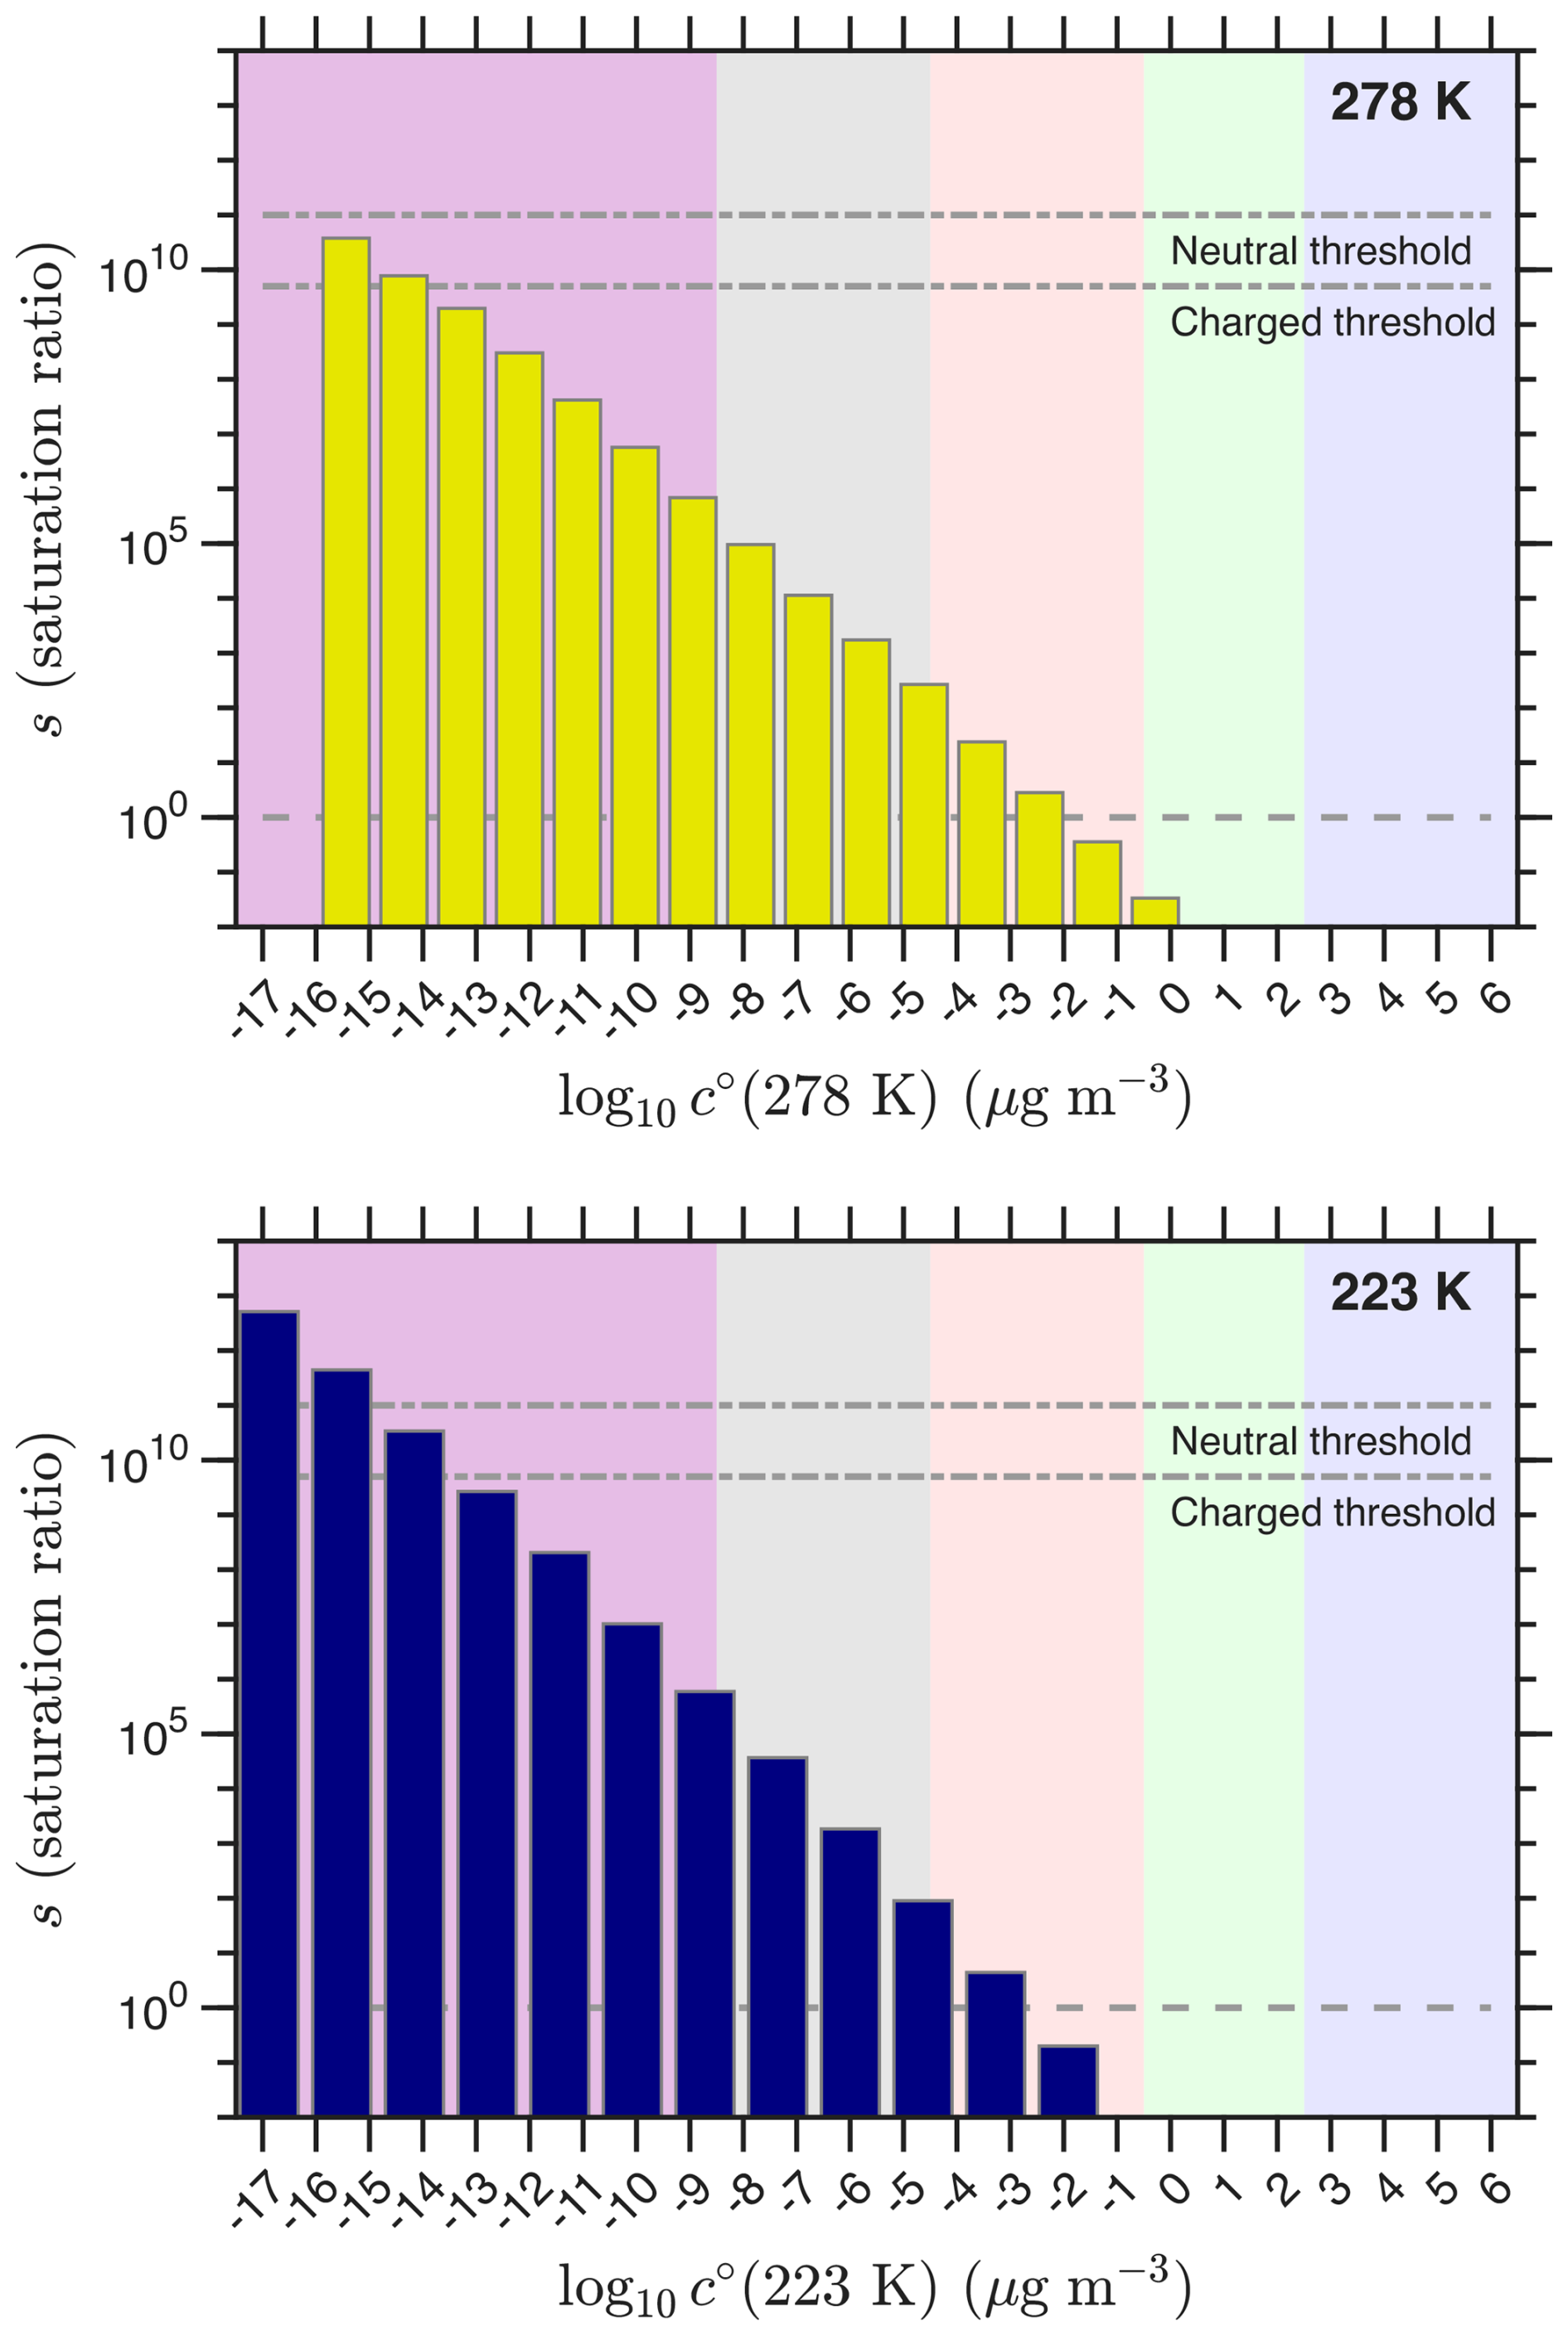
Figure 11Saturation ratios at 278 and 223 K. The horizontal lines show the thresholds for neutral and charged nucleation as well as the s=1 saturation limit.
The (empirical) saturation thresholds are significantly greater than expected from classical nucleation theory. There are three possible reasons. First, the classical theory extends the Kelvin term to the size of a “critical cluster”, which here has just two molecules. The evaporation free energies and evaporation rates of those smallest possible clusters almost certainly are not predicted by simply extending a bulk surface tension well into the quantum regime; this could be addressed by adding higher-order terms to the Kelvin expression, but the benefits are not obvious. As discussed above, the evaporation rates based on quantum chemical calculations are reasonably consistent with expectations, although the nominal saturation ratios are high compared to classical expectations. Second, the calibration and absolute yields of the ULVOCs remain uncertain, and the empirical saturation ratios depend on the absolute concentrations. Finally, the saturation concentrations are also uncertain; we often assume a one bin (one order of magnitude) uncertainty (Stolzenburg et al., 2018), but at these ultra low values the extrapolation from well constrained saturation vapor pressures could easily be two bins or more. Overall, this treatment is empirical and so relies on the precision (relative determination) of these quantities; provided that the calibration and volatility estimations are consistent across the dataset, the empirical thresholds apply to, at least, that dataset. However, we can assess the performance of the different vaporization enthalpy models with self-consistent temperature-dependent data, as we have shown.
5.2 Growth
For the nucleation VBS to be useful, it must also overlap reasonably with dynamical treatments of particle growth. Here we have assumed that condensation to a sufficiently stable cluster of the third vapor, vk, constitutes the first step of condensational growth. Because the nLVOC in this case are covalently bound C20 dimers, they have molecular masses near 700 amu, and the stable cluster of two of these nucleators will have a mass near 1400 amu. This is consistent with a physical size approaching 1.4 nm, which is a mobility diameter of roughly 1.7 nm. Thus the J1.7 measurements from CLOUD are very nearly direct measurements of nucleation for this system. We therefore consider the growth of particles at dp = 1.4, 4.7 and 9.7 nm (mobility diameters of 1.7, 5 and 10 nm) using the diagonal Volatility Basis Set (dVBS) (Lopez et al., 2025; Bhattacharyya et al., 2025).
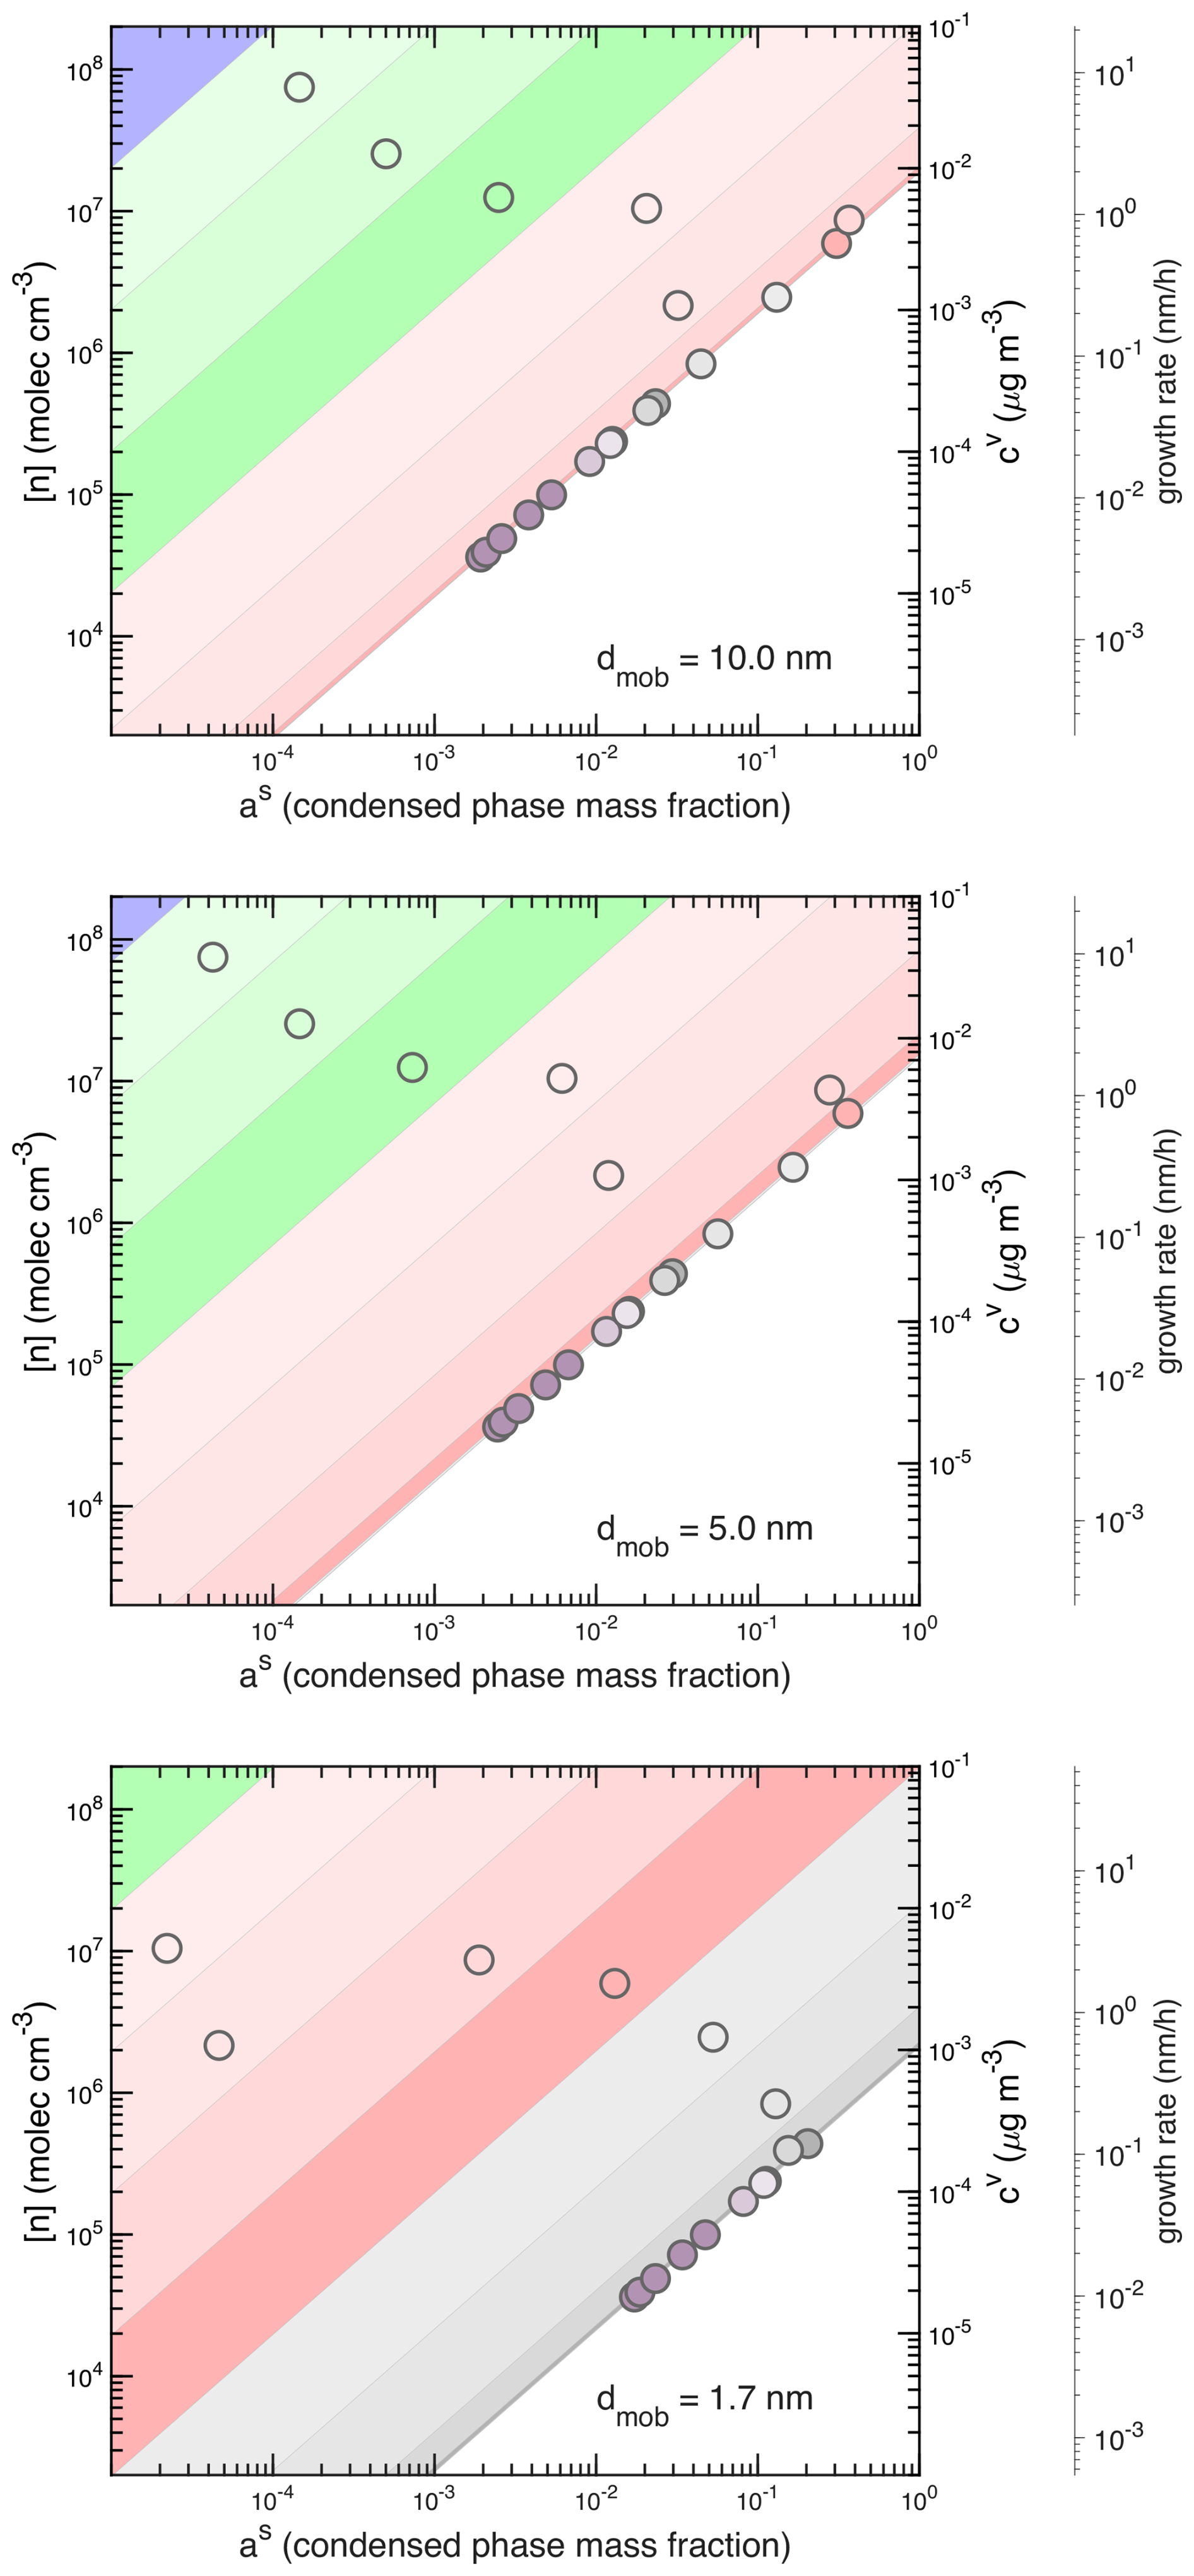
Figure 12Diagonal VBS for growth at mobility diameters of 1.7, 5 and 10 nm. The volatility distribution is from Simon et al. (2020) at 278 K. Symbol colors correspond to volatility, with each bin given by different hues of the volatility classes. The third y-axis is (partial) growth rate for species falling along the non-volatile “condensation” diagonal; the particle growth rate is at the right-hand intercept of the diagonal (at as=1). For example, the growth rate of a 1.7 nm mobility diameter particle is about 0.6 nm h−1.
In Fig. 12 we show the dVBS analysis for the 278 K volatility distribution from Fig. 8, based on the vapor measurements (volatility distributions) alone – the particle mass fractions on the x-axis and growth rates on the tertiary y-axis are predicted from the vapor measurements. These are similar to cases considered previously with the dynamical VBS growth model (Tröstl et al., 2016; Stolzenburg et al., 2018, 2022). The diagonal stripes in the dVBS are colored by the hues of the volatility classes, and within each class the saturation increases towards lower volatility. The bands are drawn for each decade, and so the actual vi volatility is not centered in a band at 278 K. However, the features of the Fig. 8 distribution are evident. For example, the distribution has a minimum towards the low end of the LVOC range, with a much higher concentration in a bin just straddling the ELVOC/LVOC divide. In Fig. 12 we see a salmon circle at low cv just at the left edge of the lowest (most saturated) LVOC band, and a higher concentration gray circle barely into the first gray ELVOC band.
Overall, Fig. 12 shows that at 1.4 nm, condensation to the freshly nucleated cluster includes all ULVOC species as well as the least volatile ELVOC species, consistent with our qualitative expectations for the third, vk vapor. The entire ULVOC range as well as the least volatile ELVOC bins have collapsed onto the non-volatile condensation diagonal and so the corresponding vapors line up along this diagonal according to their gas-phase concentrations. Thus, in qualitative terms, vk is all vapors with 10−8 µg m−3 with a total concentration of ck≃ 2 × 106 cm−3. The initial growth rate is roughly 1 nm h−1.
As the particle grows, the Kelvin term drops and, by 4.7 nm, all ELVOC and some LVOC species condense irreversibly to the particle, driving growth of nearly 3 nm h−1. This is the “Kelvin effect” acceleration previously described for the same chemical system at CLOUD (Tröstl et al., 2016; Stolzenburg et al., 2018). The increasing number of condensing species is somewhat counterbalanced by a decreasing line of centers collision velocity between the vapors and particles due to the microphysics of collisions, so the growth rate axis shifts upwards (growth slows for the same vapor concentrations) as diameter increases. By a 10 nm mobility diameter the system is very nearly at its bulk limit, given as well by the s=1 line in Fig. 11. Condensation is still mostly “non volatile” along the condensation limit diagonal, but now a concentration of 107 cm−3 drives 1 nm h−1 of growth.
Overall, the details of the volatility distribution deep in the ULVOC range define the efficiency for nucleation in our nucleating VBS model, which agrees with the observed nucleation rates. We expect, and observe, neutral nucleation that is somewhat beyond second order, with relatively low efficiency for nucleation of ULVOC species as a whole. We expect, and observe, ion induced nucleation that is faster (more efficient) than the neutral nucleation, involving a much larger subset of the ULVOC species and saturating at a rate confirming involvement of all (positive and negative) primary ions. The role of ions is to effectively shift the distributions (lower the critical saturation ratio) and the model accurately captures the temperature dependence of nucleation for both neutral and ion-induced nucleation with a fixed pair of critical saturation ratios. The overall nucleation behavior emerges from two competing effects: the decreasing extent of oxidation as lower temperatures slow autoxidation chemistry in RO2 radicals, but in opposition the sharply lower volatility with falling temperatures.
As particles grow, they quickly (by the third condensing organic vapor molecule) move into a region of dynamical growth that we have previously described successfully with the dynamical Volatility Basis Set (Tröstl et al., 2016; Stolzenburg et al., 2018, 2022). We have thus extended the original equilibrium VBS treatment of Secondary Organic Aerosol (Donahue et al., 2006, 2011) to dynamical growth of particles down to 1 nm diameter and now to nucleation itself.
To be quantitative, this requires a prodigious volatility range spanning some 20 orders of magnitude (and thus 20 bins). Representation in a 2D-VBS, with O:C bins as well, would quickly push the number of bins in the hundreds. This might be necessary to understand interactions of more and less oxidized molecules with similar volatility (i.e. activity coefficients). For example, it is possible that less oxidized hydrocarbon vapors (such as aircraft engine emissions) may have far less of an enhancement for charged vs. neutral nucleation. It is also likely that ΔHv (and ΔSv) are quite different for hydrocarbons than the oxygenated species considered here, and so a 2D-VBS temperature shift could show “shear” with more movement by more oxygenated vapors for a given temperature change.
The ULVOC-ELVOC boundary designation is somewhat arbitrary, and the method presented here provides a rational method to replace that hard, qualitative cutoff with a smooth drop in efficiency to provide a quantitative estimate of total nucleators that changes appropriately with saturation ratios, and not an arbitrary saturation concentration. However, the details of the enormous volatility range required for a detailed process-level model (even a simplification like the VBS) may well not be needed for transport model simulations. A reasonable correlation between nLVOC and cLVOC with total ULVOC (i.e. effective yields of both) could eliminate 8 ULVOC bins. Furthermore, unless accurate description of sub-10 nm growth is needed, the entire UELVOC range is more or less superfluous, and instead 8-bin and 4-bin VBS models centered on the SVOC range are entirely adequate. The tool must fit the task.
Overall, this analysis confirms the finding that ULVOC, and especially the covalently bound products of RO2 + RO2 association reactions, are the principal nucleators for pure organic nucleation under boundary-layer (warm) conditions (Kirkby et al., 2016; Heinritzi et al., 2020; Dada et al., 2023). This reinforces the importance of RO2 cross reactions for real atmospheric conditions, meaning that the oxidation mechanisms of different organic compounds will interact directly (McFiggans et al., 2019; Heinritzi et al., 2020) (i.e. not just indirectly via HOx and NOx chemistry; Kiendler-Scharr et al., 2009). This raises an experimental challenge, as the very small nucleator yields may be quite sensitive to specific conditions, but it also emphasizes that the pre-industrial and likely post-carbon (and low sulfur) atmospheres likely have rich chemistry driving new-particle formation.
The temperature dependence of saturation concentrations is crucial for understanding volatility behavior in the atmosphere and in instruments that use temperature to manipulate samples. However, because the basis set in the volatility basis set is defined by saturation concentration, there are strong constraints on the free energy of vaporization for each volatility bin, and thus the enthalpy and entropy of vaporization as well.
A1 Volatility and phase equilibria
An equilibrium constant is always given by
However, this is with respect to the reference state of the phases involved. Especially for the gas phase this is generally pressure (either 1 atm or 105 Pa) and so we use the symbol . When we use concentration units, we need to correct the reference state to the appropriate concentration units (), which depends on the change in (gas-phase) moles over the reaction, Δn (Benson, 1968).
Here R′ is the gas constant in the appropriate units (), so R′ = 106 , with R′′ = 8.206 × 10⁻⁵ ). In general, when we are discussing the progressive addition of a gas-phase monomer to either a molecular cluster or a bulk condensed phase, (2 monomers lead to one dimer, or one monomer vanishes into the condensed phase bulk), or, in general, the cluster or condensed phase adds one molecule and the gas phase loses one. The balance between forward and reverse rate coefficients given by
For vapor pressure and saturation concentration, the sense of the reaction is reversed (forward being evaporation), so , and the vapor pressure in standard units (bar) is by definition
For the saturation concentration in mass units we use R′′.
Here Mi is the molar mass (g mol−1) and is sub-cooled liquid saturation concentration (µg m−3). For typical HOM monomers near the reference log c∘(300 K) = 0, Mi≃ 250 g mole−1, the free energy of vaporization is
These values are immutable (and it is a coincidence that is almost exactly 10.0). It could just as well be called “the vaporization free energy basis set,” but that is much less catchy. The only uncertain value is the molar mass, and even that will not vary within a bin by a great deal.
A1.1 Volatility temperature dependence
Temperature has a dramatic effect on volatility, represented via an expression like the Clausius–Clapeyron equation
Because the basis set in the VBS comprises bins separated by factors of 10 at 300 K, we will use b to represent bin number, where in µg m−3; thus b=0 is the 300 K reference bin at 1 µg m−3. Differentiating Eqs. (A7) and (A11) and equating the temperature dependence (slope) gives
The free energy is always given by and it is ΔH that primarily controls the temperature dependence. However, because ΔG is known for any given , we also know
So for the reference volatility of 1 µg m−3,
The entropy of vaporization is not directly consequential for this work, but it does play two important roles.
First, it is a useful diagnostic, as the combination of ΔHv and ΔSv are known for many organic compounds (Kolská et al., 2005). Qualitatively, a high entropy of vaporization (compared with the constant value near 87.5 suggested by Trouton's rule) suggests a relatively ordered liquid phase compared to a disordered (and ideal) gas phase. A low entropy of vaporization thus indicates an unusually ordered vapor phase (i.e. molecules with multiple internal H-bonds leading to a few favored comformations in the vapor phase). However, this shares a common problem that the training data for known compounds are typically out of range for this case. The VBS vapor pressures for ULVOC and ELVOC especially are exceptionally low, and many of the molecules involved are exotic, with many polar functional groups.
The second important role of ΔSv is especially evident in the 2D-VBS. It may well be that hydrocarbons with O : C = 0 have very different ΔSv,0 from exotic HOMs with O:C ≥ 0.5; in this case the two groups would diverge at temperatures far from 300 K (though they also typically phase separate as well, You et al., 2012), and mixtures between VBS species with very different O:C have a high activity in the original VBS formulation (Donahue et al., 2011).
A1.2 VBS volatility temperature parameterizations
Though the ΔGv values for the VBS are certain, the actual values of the reference enthalpy for species with c∘ = 1 µg m−3 as well as the change in ΔHv for each VBS bin are both uncertain. The compounds as well as the absolute volatilities comprising e.g. ULVOC are far beyond the range covered by almost any other application or dataset. The actual volatilities are minute (ULVOC have saturation number concentrations well below 1 ) and the compounds are often exotic and highly functionalized. Because of this, simply interpolating datasets of known properties is impossible – instead we make extrapolations constrained by those known properties. Here we shall consider three different parameterizations that are all reasonable based on available data.
The original VBS (here called “NMD”) (Donahue et al., 2011) used
Both the enthalpy and entropy of vaporization are high but not unprecedented (Kolská et al., 2005), motivated by the high enthalpies known for dicarboxylic acids (Bilde et al., 2015).
Epstein et al. (2010) (here called “SAE”) found
These are based on known Antoine coefficients for organic with C, H, O composition (Epstein et al., 2010). The very high ΔHv,0 is at the high end of values for dicarboxylic acids (Bilde et al., 2015), and this requires a large counterbalancing trend in ΔSv correlated with volatility. This is qualitatively consistent with empirical group contributions (Kolská et al., 2005).
Stolzenburg et al. (2018) (here called “Stolzi”) used
This takes the higher intrinsic enthalpy of vaporization from SAE but following the logic of NMD that a 6 kJoule mole−1 difference in ΔHv at 300 K changes volatility by 1 order of magnitude, meaning δΔSv≃ 0.
The estimated group contribution for −OH groups at the normal boiling point is ΔHb,OH = 16.9 kJ mol−1 and ΔSb,OH = 18.4 , giving ΔGOH≃ 11.4 kJ mol−1 at 300 K. This is 2 orders of magnitude, reasonably consistent with the SIMPOL vapor pressure contribution of 2.2 orders of magnitude per −OH group (Pankow and Asher, 2008). There are no group contribution thermodynamic estimates for −OOH but the vapor pressure group contribution from SIMPOL is 2.4 orders of magnitude (Pankow and Asher, 2008), consistent with behavior similar to −OH.
The different parameter values are consequential. Specifically, we are interested in nucleation throughout the troposphere and also in vehicle exhaust, and so volatility over a temperature range from 200 to 400 K will matter. However, the formulation will ultimately rely on empirical parameters, and so it is vital that any formulation use a self consistent set. Here we use the NMD values as a default but explore sensitivity with the others. Much of the CLOUD literature also uses the Stolzenburg (“Stolzi”) parameters, and so it is important when comparing with published values to evaluate based on that, especially when comparing to or inverting the volatility calculations.
A2 Mixtures
Mixtures are central to the VBS. We will generally assume ideal solutions, meaning the excess free energy for a mixture, = 0. There is some subtlety here because the reference state in the condensed phase for the VBS is also the mass fraction – effectively molality for constant density – rather than molarity. Furthermore, we shall assume that the relation applies equally for = 0, and finally to the vaporization enthalpy. At the same time we shall assume that the pairwise interaction energy between constituents scales with the vaporization enthalpy, with come solvation or coordination number n.
Finally, we shall also assume this applies to the equilibrium free energy for dimer cluster formation
As we shall see, this motivates an enormous simplification for heterodimer evaporation.
Dimer formation free energies
Typical HOM dimers with volatility near 1 µg m−3 have formation free energies near 25 kJ mol−1 (6 kcal mol−1) (Ortega et al., 2016). If we assume this also scales with the vaporization free energy, the scaling factor is between 2 and 3, though it must be highly uncertain. It is of course possible – even likely – that certain functional groups and certain structures (i.e. a balance of H-bond acceptors and donors, and a sufficient number of each) contribute to both strong dimer formation as well as continued cluster growth. However, the foundational assumption of the prognostic VBS is that the average properties of compounds with a given c∘(300) and O:C can represent the overall behavior. This is distinct from the diagnostic VBS, where any molecules with known properties can be placed in the (c∘(300), O:C) coordinates. Therefore, for nucleation we will make the same assumption.
The fundamental physics behind nucleation and the VBS (volatility driven nucleation) is solution theory extended to the smallest possible condensed phase – a non-covalently bound molecular (dimer) cluster, ui,j formed from vapors vi and vj. The vapors involved in nucleation are all supersaturated and will tend to have a steady state concentration – in the atmosphere governed by condensation to existing particles (the condensation sink, kc) and in experiments governed by wall loss (kw) and also possibly the condensation sink.
The steady state is simply
The cluster can either evaporate or proceed to form a particle (p2.0, logically a trimer ) upon condensation of a third vapor, vk. As in all classical nucleation, it is the evaporation rates of small unstable clusters that governs the overall system behavior.
A necessary condition for kinetic nucleation is that the forward rate of the dimer cluster growth is larger than its evaporation rate. The sufficient condition is that this holds for all larger clusters as well. Here the rate-limiting step is the competition between the ui,j evaporation rate and growth to form a particle. For sufficiently slow evaporation rates, the rate limiting step becomes cluster formation, and the process becomes kinetic binary nucleation.
B1 Forward rate coefficient
Because we are assuming kinetic nucleation, by definition every collision between vapors and either other vapors or the binary clusters must lead to forward reaction (growth). The forward rate coefficient(s) is thus the collision coefficient(s), and to a reasonable level of approximation we can assume this coefficient is the same or similar for the species (including collisions of vapors with the dimer clusters).
The collision coefficient is given by a collision velocity and a cross section, σi,j, or impact parameter bi,j.
The mean velocity along a line of centers is given by . This has a weak positive dependence on temperature and negative dependence on (reduced) mass. However, the impact parameter is in some way related to the overall size (effective diameter, di) of the objects, but also augmented by an attractive (Van der Waals) potential between them, Vi,j(T). This will depend on temperature because at lower energy collisions farther out in the potential will still be captured.
Because the impact parameter will increase weakly with decreasing temperature as well as overall mass (size), the collision coefficient will remain relatively constant with both temperature and size over the relative small range of relevant sizes under consideration here (monomer vapors and dimers). There are many other less certain terms in the problem, especially considering the many individual interactions we average when simplifying to a VBS. We thus shall assume
B2 Cluster evaporation
The cluster evaporation rate constant is found from the equilibrium constant for the cluster and thus its free energy of formation
There are two important aspects to this.
First, for an ideal solution with , the evaporation rate for a heterodimer from a VBS bin will be the same as the “average” bin. For example, a dimer comprising two species from the log 10c∘ = −12 bin will have the same evaporation rate as one comprising a species from the log 10c∘ = −14 bin and the log 10c∘ = −10 bin. We can then invoke the correlation , with to estimate the dimer evaporation rate.
Second, the change in evaporation rates between (average) bins will be far less than the change in volatilities between neighboring bins (roughly a factor of 10 depending on temperature). That is because of the same proportionality. For n≃ 2.5 we have
At 300 K this leads to a factor of 2.5 separation in dimer evaporation rates for VBS bins separated by a factor of 10 in volatility. At 200 K this rises to a factor of 4 (but the bins are a factor of 30 apart).
Relating the evaporation rate to the bulk free energy, we have
With the saturation vapor pressure of the mixture (in atm) emerging as an important value.
B2.1 Single component nucleation
The simplest case for nucleation is a single component system (), in which case the transition towards kinetic (second-order) nucleation is a saturation phenomenon like Lindemann–Hinshelwood kinetics:
The falloff from kinetic nucleation toward third-order nucleation is described by a nucleation efficiency term, ei.
B2.2 Multicomponent nucleation
Returning to a multicomponent example, we can write a nucleation efficiency as
The efficiency depends on a ratio containing the saturation vapor pressure of the nucleating mixture and the partial pressure of the more volatile (but presumably more abundant) growth molecule vk. Because the concentrations of all vapors will be reasonably correlated, this has something to do with a saturation ratio.
B2.3 Atmospheric scaling
We can build basic scaling relations for the simplest case of a single-component system, . A figure of reference for atmospheric nucleation is a rate J = 1 . For kinetic nucleation, this means ci = 105 cm−3. However, this in turn means
That is about one per day. The rule of thumb is that 107 cm−3 condensible vapor will drive about 1 nm h−1 of growth, so this corresponds to 1 nm in 100 h. There is no circumstance where such a particle would show up in an experiment, given any realistic wall loss timescale, and even in the atmosphere it is almost beyond conception that a condensation sink would be so low as this.
This problem is well known for sulfuric acid, where even sub-kinetic nucleation at 1 s−1 with = 107 cm−3 would only drive 1 nm h−1 of growth. That was an early indication that condensation of organic vapors must be important to particle growth and survival from very small sizes (Metzger et al., 2010; Riipinen et al., 2011), which we now understand well within the context of the VBS (Tröstl et al., 2016; Stolzenburg et al., 2018; Lopez et al., 2025; Bhattacharyya et al., 2025). This also shows that even the 3rd vapor in, vk, must be more abundant than the organics driving any kinetic nucleation with ci×cj = 1010 cm−3, consistent with ELVOC levels near 107 cm−3 driving early growth.
In practice, the wall collision frequency in most chamber experiments addressing nucleation, such as CLOUD is roughly 10−3 s−1 (Duplissy et al., 2016), and so evaporation coefficients less than this make a cluster with 10−3 s−1 effectively immortal. However, this is also the arrival frequency when the third species drives growth with ck≳ 107 cm−3, consistent with 1 nm h−1 of growth. This occurs at 300 K for −70 kJ mole−1 (Fig. ED8 in Kirkby et al. is relevant as well (Kirkby et al., 2016)). Relating this to the bulk free energy of vaporization, this in turn implies 140–210 kJ mole−1. Thus −14 for n=2 and −27 for n=3. The higher value (−14) seems plausible but this is still several decades deep in the ULVOC range.
B3 Ion induced nucleation
Ions assist nucleation by stabilizing clusters; here we assume this occurs via formation of charged clusters rather than charge-transfer reactions. These reactions are identical to those in the ion–molecule reactor of a chemical ionization mass spectrometer. The evidence is that ion enhancements are not especially sensitive to the identity of the charging ion but may be sensitive to the polarity. We shall thus consider primary ions n+ and n−. Here the production and loss balances for charged species are more important than the simple steady state for neutral vapors for two reasons. First, ion production (Q) forms an upper limit to the ion induced nucleation rate, after which ion concentrations are depleted. Second, the charged clusters can also be neutralized, after which they may or may not evaporate, depending on their neutral stability.
Ion induced nucleation for pure organic systems is observed to extend up to (twice) the ion-pair formation rate, which means that the vapors that nucleate (vi and vj) must ultimately secure all the available charge – the presence of ions does not magic particles into existence (though there are some chances for catalysis), the ions must be directly involved. This means that charge either migrates from relatively volatile vk to less volatile vi,j or that essentially all vapors that form charged clusters participate in nucleation.
An important assumption is that when a cluster forms from a relatively volatile charged species interacting with a less volatile vapor, if the cluster decomposes the charge will remain with the less volatile vapor, making the overall interaction a charge transfer.
This is entirely consistent with our assumption that the cluster free energy correlates with volatility (for charged as well as neutral clusters) and is also how the ion induced nucleation rate can approach the ion-pair formation rate while involving only relatively low volatility vapors.
The important interaction coefficients here are the ion-ion recombination coefficient and the ion–molecule collision coefficient. For the sake of this discussion we shall assume that these are independent of polarity and similar for individual ions and small clusters. In reality positively charged primary ions tend to be more mobile than negatively charged ions, and the charged clusters are less mobile still; however, the volatility and decomposition rates vary over many orders of magnitude and the coefficients vary by less than an order of magnitude for the mobility range under consideration here. For this discussion, we shall assume
We shall assume that all species reach a steady state, and that the vapors losses are dominated by wall loss. The primary ion concentrations will be governed by recombination as well as first-order loss. Here as well, the family of ions, including both the primary ions (n±) as well as the clusters (v±).
The charged cluster(s) steady state will be
More volatile charged clusters will also have an additional loss from collisions with less volatile vapors, unless the charged cluster grows to a dimer cluster ui,j. The dimer cluster concentration(s) will then be
There are many opportunities for rate-limiting steps, but Reaction (BR6) (the ion-pair formation rate) and Reaction (BR14) (activating the charged cluster before decomposition) are the end points. In the first case, , but in the second case a clear rate-limiting step is less obvious
When the primary ions are not depleted (so J≪Q) then equally the growth of the charged clusters before they are lost or neutralized will likely not be fast; thus, while the nucleation rate law appears to be first-order in vi, the losses along the way will likely make the overall behavior closer to second order in vi (this is also observed empirically). The result is an overall termolecular rate coefficient that is nominally the ion–molecule collision coefficient divided by an average (or critical) vapor concentration.
The “NMD” enthalpy of vaporization parameters (Donahue et al., 2011) are our default when modeling the Simon et al. (2020) CLOUD results, and overall these do an excellent job of reproducing the observed dependence of both neutral and ion-induced nucleation on the ULVOC concentration, over the full temperature range. However, there are several other values described in Appendix A, which will affect the predicted volatility shift as temperature drops from the reference condition of 300 K (very close to the 298 K upper limit of the experimental data).
We can adjust the saturation thresholds for nucleation along with the different parameters and attempt to reproduce the observed nucleation rates vs. ULVOC and Temperature for the CLOUD data. However, the different models with different ΔHv values, especially in the ULVOC range, will differ in the way they present the counterbalancing effects of slowing chemistry and declining volatility as temperature drops.
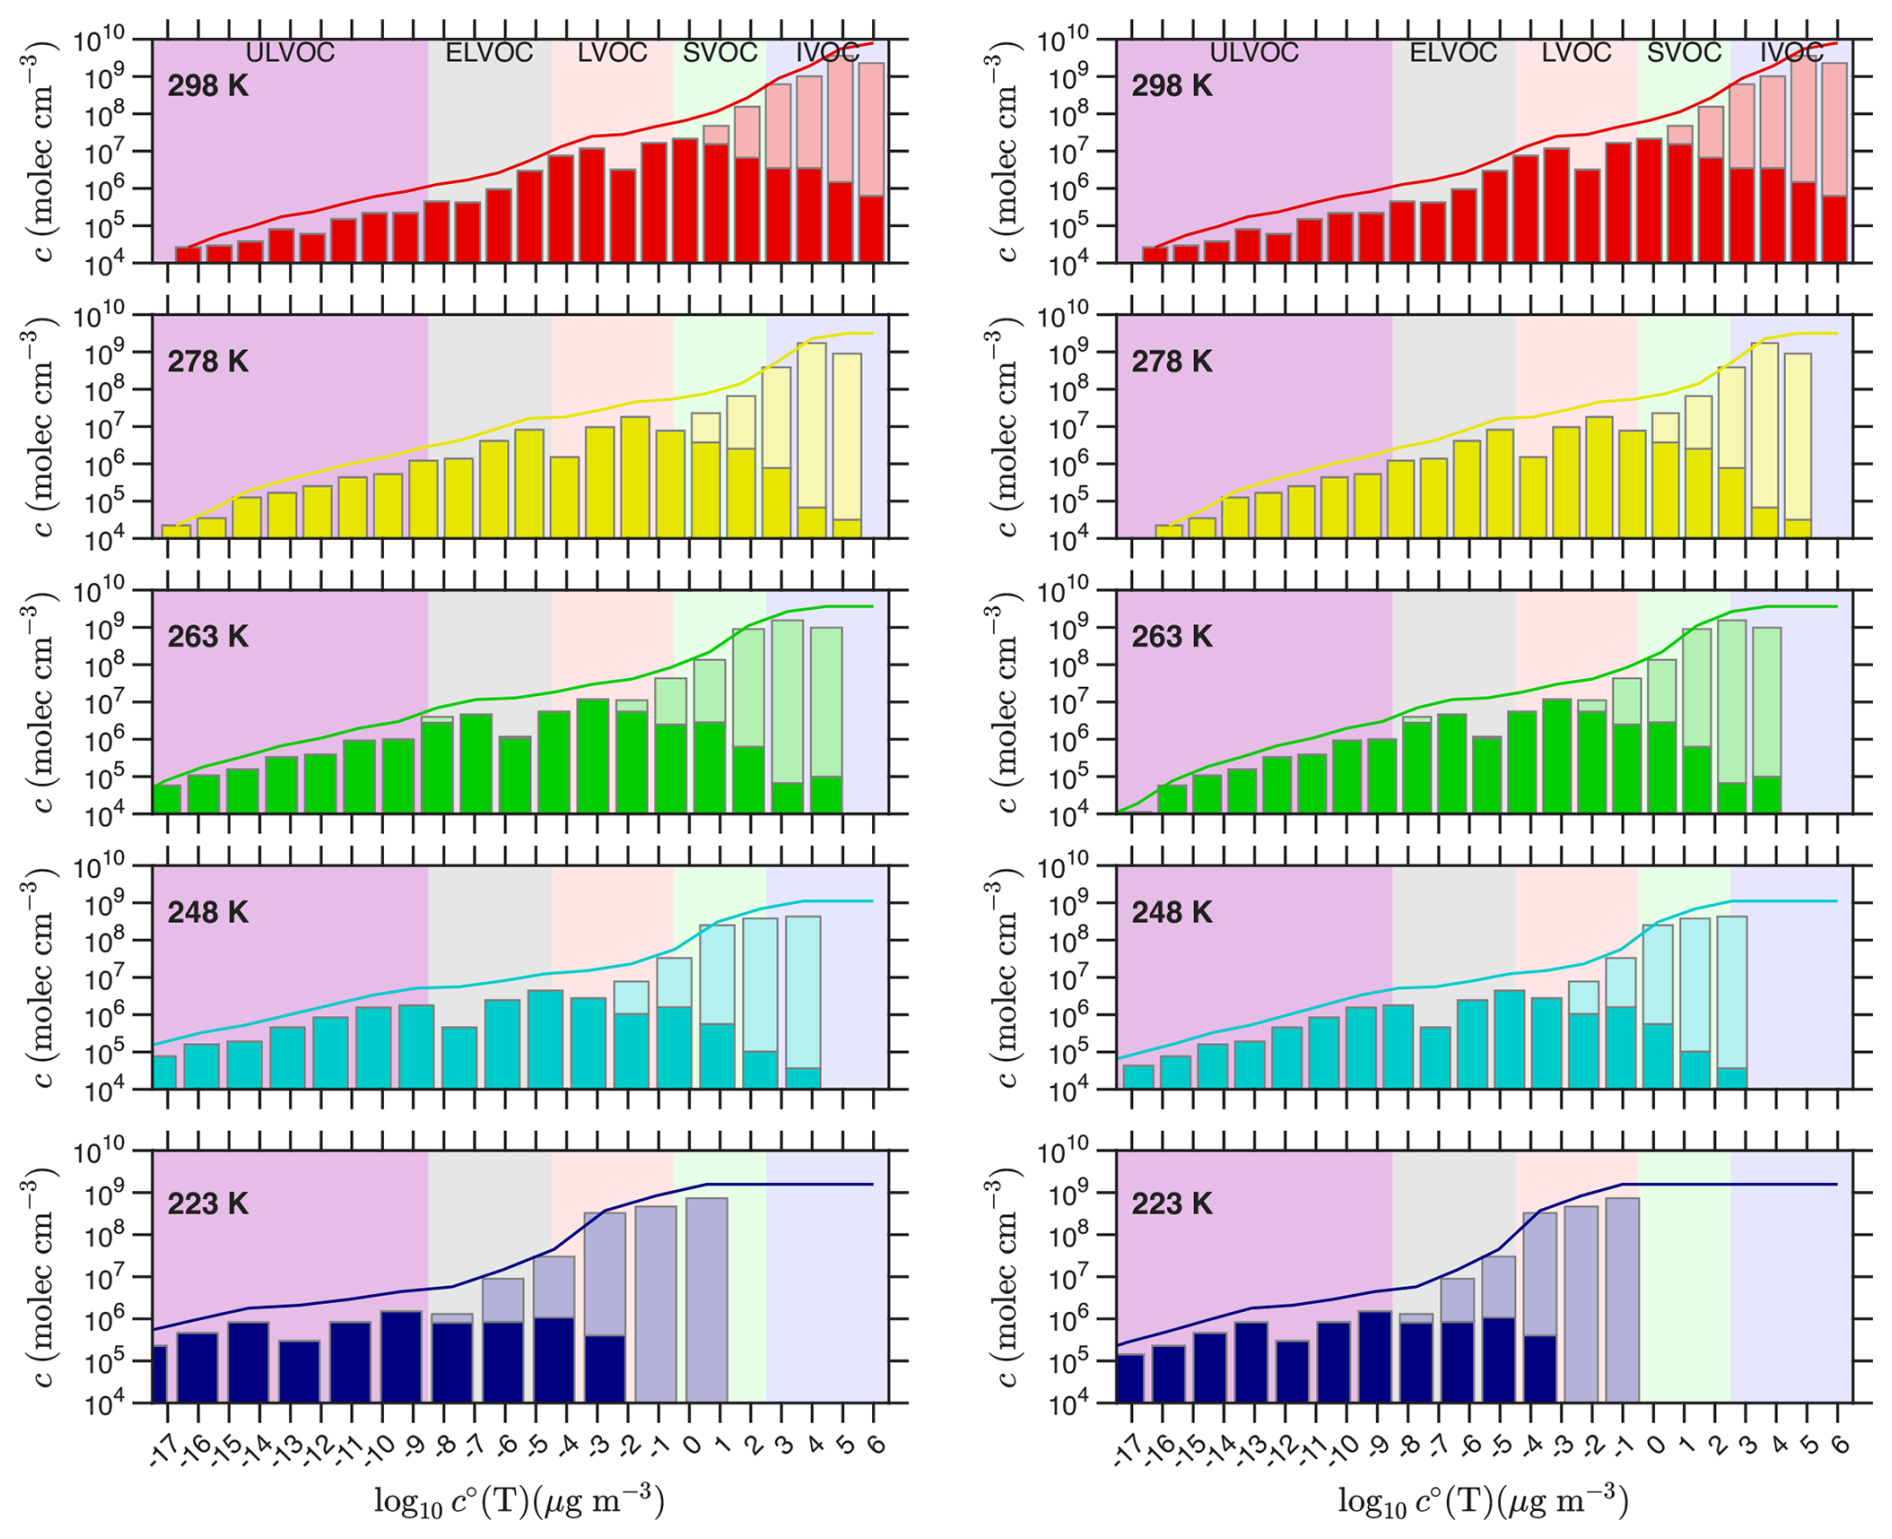
Figure C1Volatility distributions from α-pinene ozonolysis in CLOUD at various temperatures using two different parameterizations for the volatility temperature dependence. Concentrations are grouped into volatility bins at 300 K and adjusted to the chamber temperature using the “SAE” volatility parameters on the left and “Stolzi” parameters on the right. The SAE parameters have a far more aggressive change in vaporization enthalpy between bins, meaning they spread more as temperature drops. The Stolzi parameters are intermediate between the SAE and the base-case “NMD” parameters.
Figure C1 compares the “SAE” and “Stolzi” volatility distributions vs. temperature in two columns, showing only the c∘(T) distributions for each (i.e. comparable to the left-hand column in Fig. 8). In that base-case “NMD” distribution, at 223 K the ULVOC bin with the (local) minimum concentration is the first bin fully in the ULVOC range; with these far more aggressive parameters, that short bin is well inside the ULVOC range by 223 K, with fully two other bins within the ULVOC range but still more volatile than it. Overall, both these parameterizations have a more aggressive temperature dependence, and so the “volatility effect” of decreasing volatility with decreasing temperature overcomes the “chemistry effect” of slower oxidation at low temperature at a relatively higher temperature. Because we are assuming a single critical log c∘(T) value for the nucleation threshold, this will also tend to lead to either very low nucleator concentrations at higher temperature or very high nucleator concentrations at lower temperature.
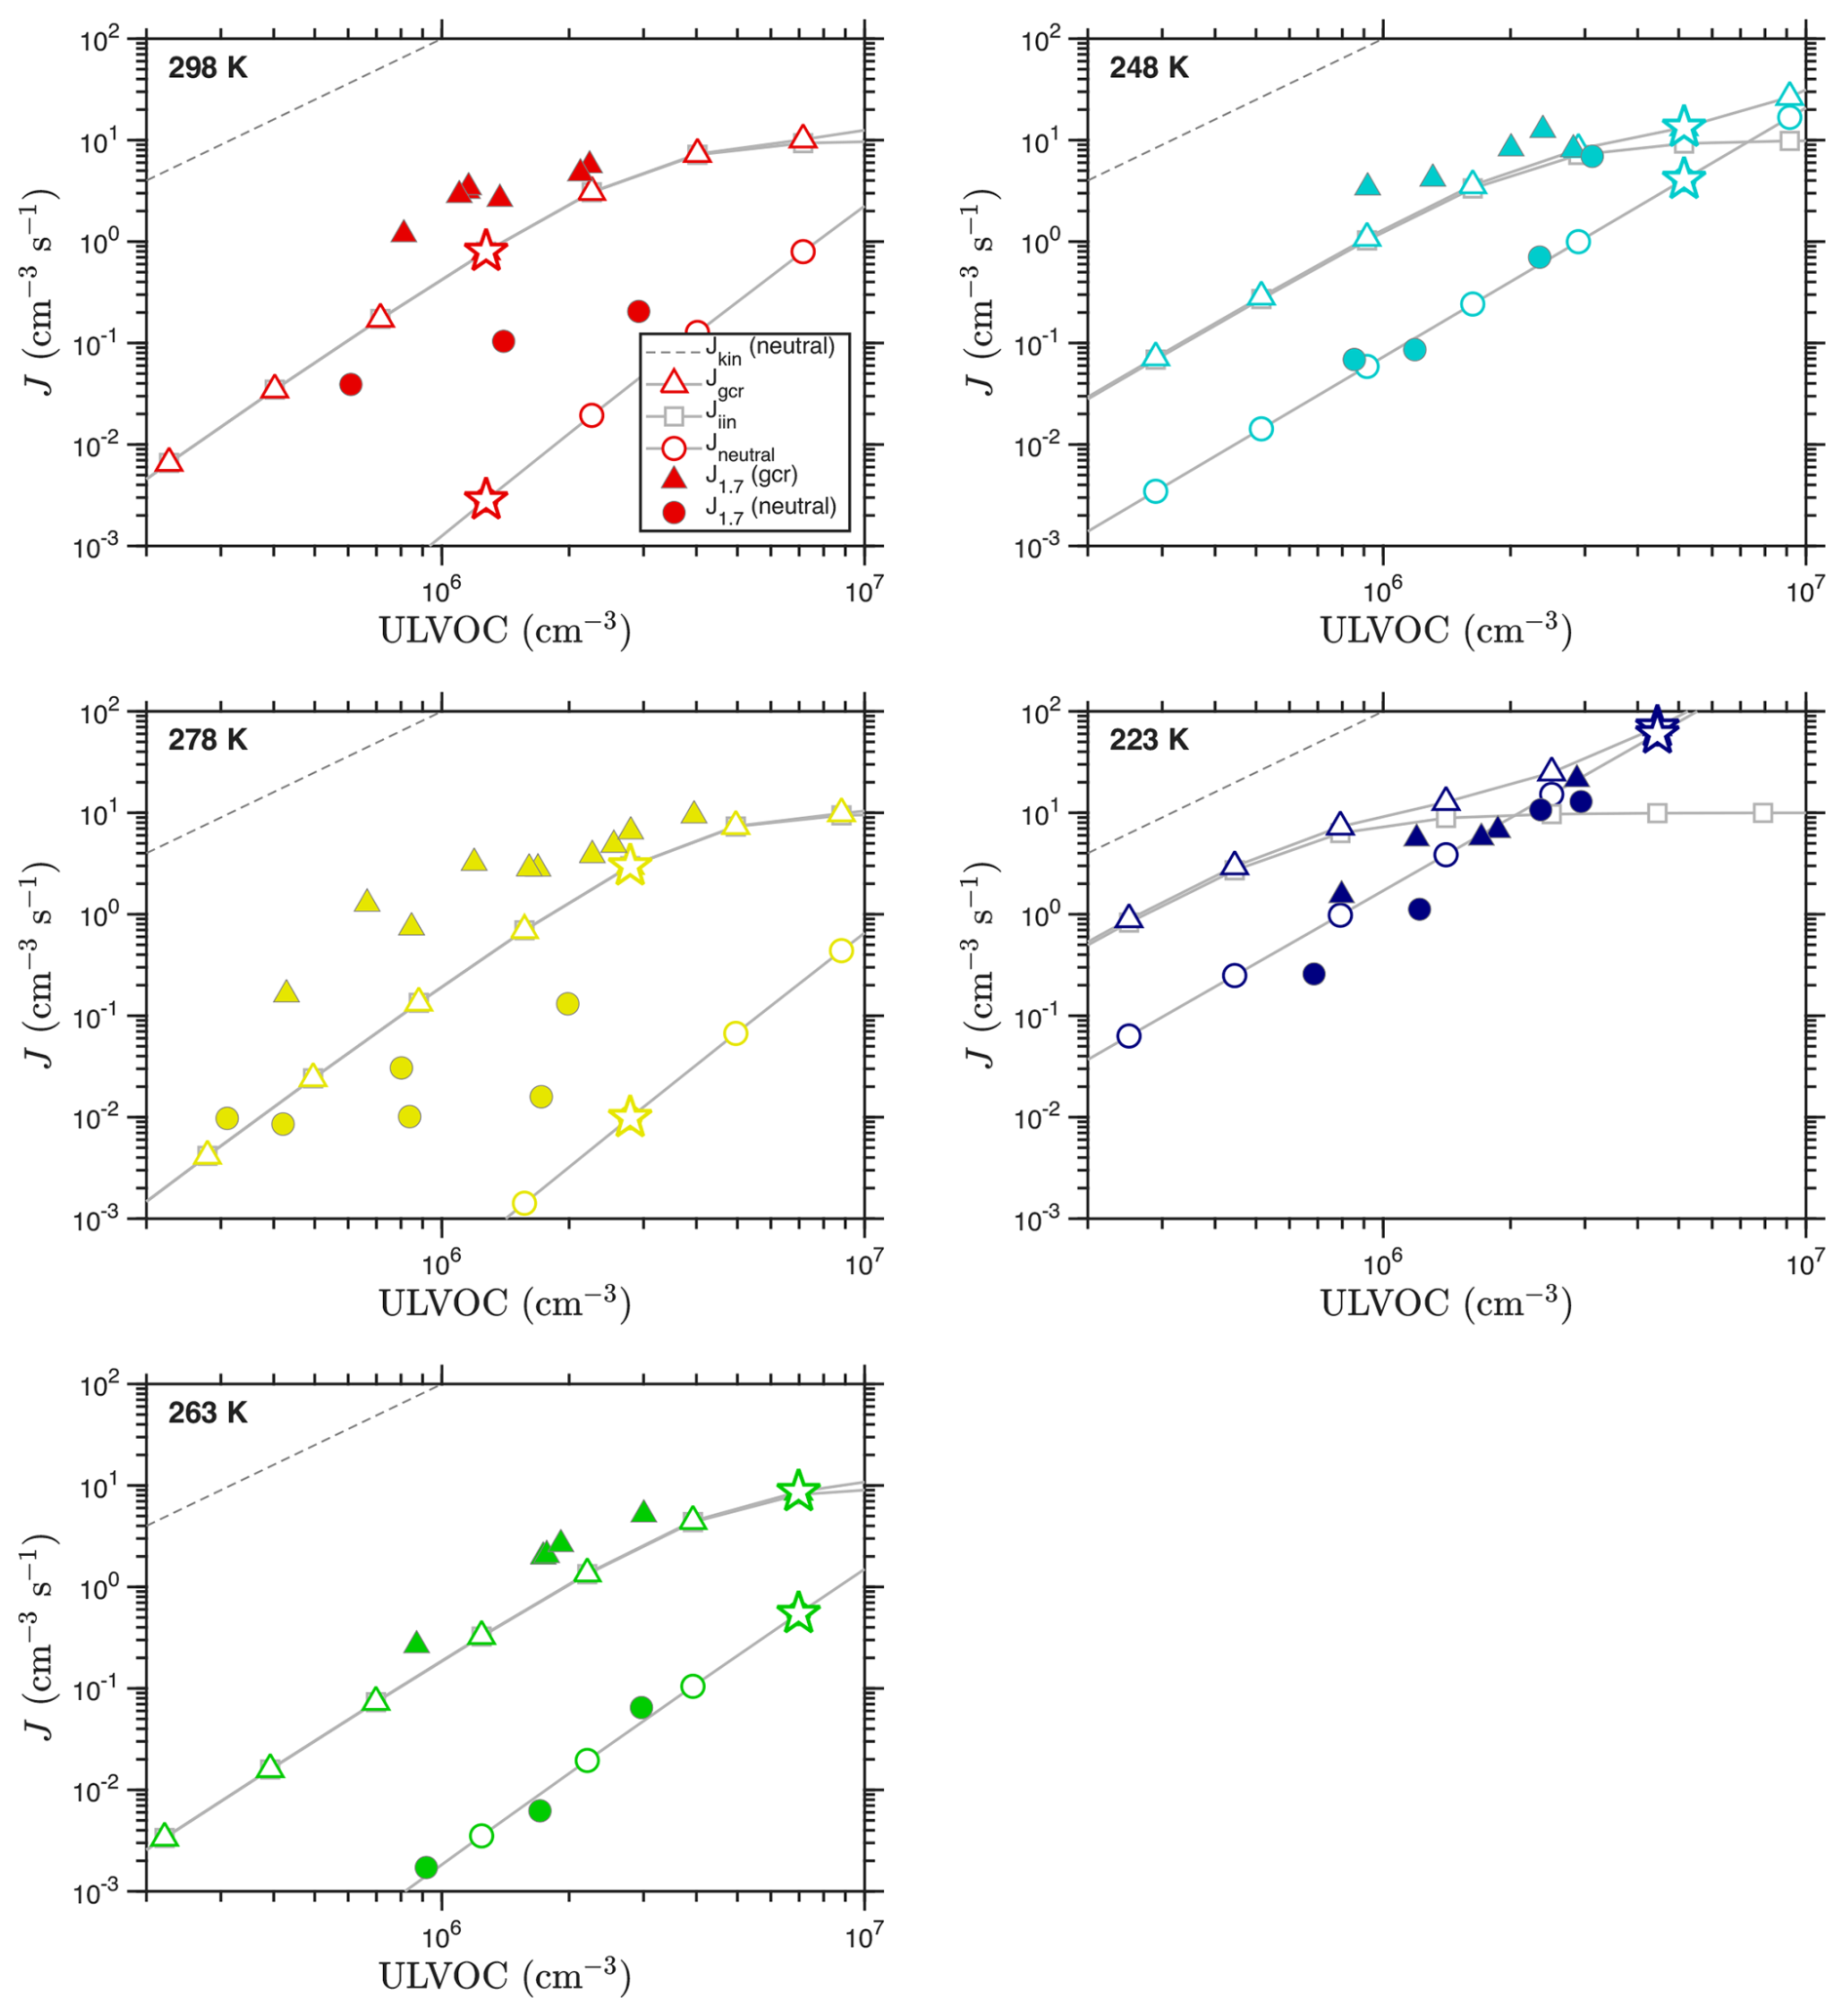
Figure C2Observed and predicted nucleation rates vs. ULVOC concentration for each temperature based on the SAE volatility parameterization. Observations are filled symbols; the model values are open symbols connected with a gray curve. Compared to the observations, higher temperature neutral nucleation rates in the model are dramatically too low, and ion induced nucleation at 223 K is too high.
C1 SAE model
Figure C2 shows the predicted nucleation rates for the Epstein et al. (2010) vaporization enthalpies parameters (SAE). The saturation thresholds are = 5 × 10¹² and = 5 × 10¹⁰. The more stringent thresholds prevent the lowest temperature nucleation from greatly exceeding the observed rates, but at the expense of systematically underpredicting nucleation at higher temperature. The model does, however, reproduce the 263 K midpoint very well (though it predicts even lower neutral nucleation at 278 K). While more extensive optimization might improve the fit, this is consistent with the SAE vaporization enthalpies being somewhat too aggressive and so leading to underestimated volatility (overestimated saturation ratios) at low temperature.
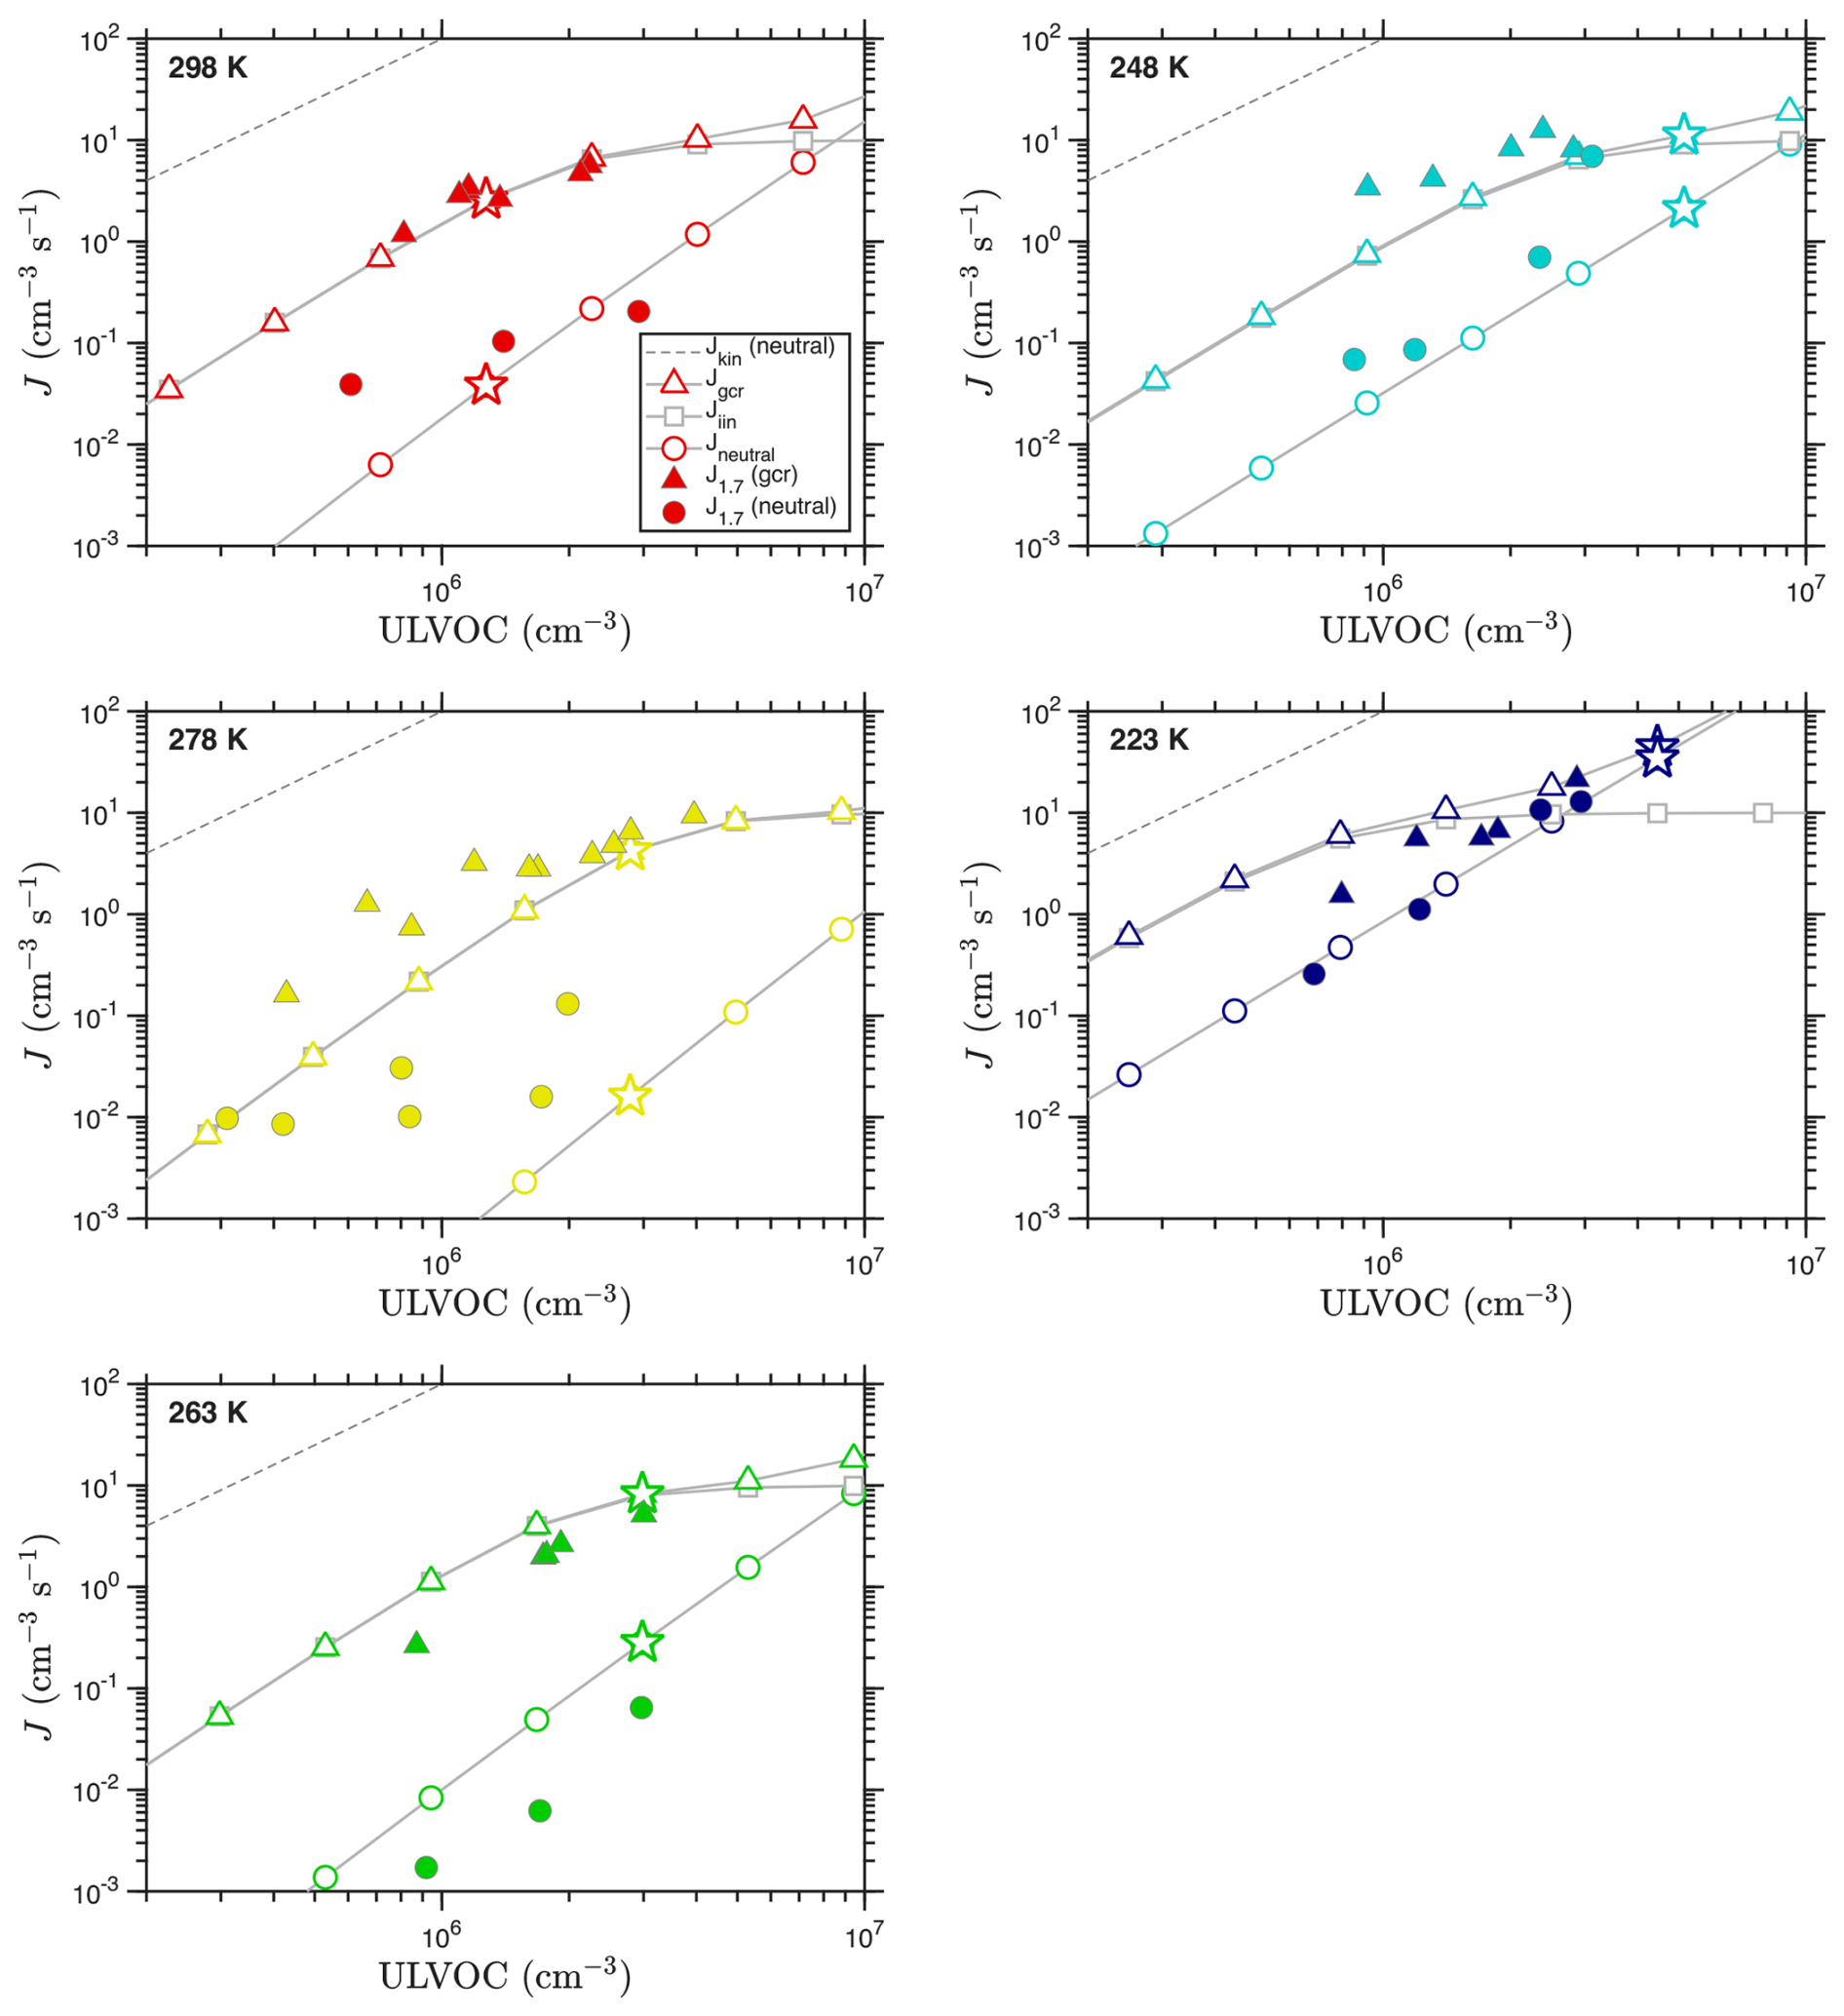
Figure C3Observed and predicted nucleation rates vs. ULVOC concentration for each temperature based on the Stolzi volatility parameterization. Observations are filled symbols; the model values are open symbols connected with a gray curve. The model performs better than the “SAE” parameterization but differs from observations especially for mid temperature (287 and 263 K) neutral nucleation.
C2 Stolzi model
Figure C3 shows results for the Stolzenburg et al. (2018) “Stolzi” parameters. These combine the “SAE” high intrinsic enthalpy of vaporization with a smaller spacing between bins, similar to “nmd”, and so less spreading of the bins with decreasing temperature. The saturation thresholds are = 5 × 10¹¹ and = 5 × 10⁹. While not as troubled by the temperature range as the SAE parameters, these parameters still predict that the minimum nucleation rate should be at 278 K, with roughly equal values at 263 and 248 K. This is not what is observed.
C3 Overall assessment
The differences between the volatility temperature dependence models are not overwhelming but they are notable. It may be that with the interdependence of different parameters a reasonable agreement between the model and observations would emerge for any of these models, but the default (“NMD”) model performs well at all temperatures and the other models differ notably from the observations. It is plausible that there is some evolution in the entropy of vaporization correlated with the enthalpy of vaporization, and so the original “NMD” parameters with a larger enthalpy term may prove to be the most accurate. However, authentic standards of such highly functionalized and exceptionally low volatility compounds are not easy to come by, and constraints such as those developed here are ultimately indirect.
Data for the figures are available on Zenodo at https://doi.org/10.5281/zenodo.20272605 (Donahue and CLOUD Collaboration, 2026).
NMD developed the theory and wrote the manuscript. LD, ES, MaS, MH provided underlying data, data analysis, and invaluable technical discussions. JK, MeS, NiB, WS, BZ, HG, IEH, MK critiqued the manuscript and provided invaluable technical discussions. DS, JD, AS, NB, NB, BL, MW, WS, JA, BZ, AH, JC, KL, RF, DW provided invaluable technical discussions.
At least one of the (co-)authors is a member of the editorial board of Atmospheric Chemistry and Physics. The peer-review process was guided by an independent editor, and the authors also have no other competing interests to declare.
Publisher's note: Copernicus Publications remains neutral with regard to jurisdictional claims made in the text, published maps, institutional affiliations, or any other geographical representation in this paper. The authors bear the ultimate responsibility for providing appropriate place names. Views expressed in the text are those of the authors and do not necessarily reflect the views of the publisher.
This research has been supported by the National Science Foundation (grant nos. AGS2431817 and AGS2442132), the National Aeronautics and Space Administration (grant no. 80NSSC19K0949), the Research Council of Finland (grant nos. 337549, 357902, and 302958), the Schweizerischer Nationalfonds zur Förderung der Wissenschaftlichen Forschung (grant no. 200021_213071), the Austrian Science Fund (grant no. PAT8221324), and the Vienna Science and Technology Fund (grant no. VRG22-003).
This paper was edited by Ivan Kourtchev and reviewed by two anonymous referees.
Adams, P. J. and Seinfeld, J. H.: Predicting global aerosol size distributions in general circulation models, J. Geophys. Res.-Atmos., 107, 4370, https://doi.org/10.1029/2001JD001010, 2002. a
Benson, S. W.: Thermochemical Kinetics: Methods for the Estimation of Thermochemical Data and Rate Parameters, Wiley, New York, ISBN 978-0471067801, 1968. a
Bhattacharyya, N., Lopez, B., DeVivo, J., Russell, D. M., Shen, J., Sommer, E., Almeida, J., Amorim, A., Beckmann, H. M., Busato, M., Caudillo-Plath, L., Chassaing, A., Christoudias, T., Dada, L., El-Haddad, I., Flagan, R. C., Harder, H., Judmaier, B., Sebastian, M. K., Kirkby, J., Klebach, H., Kulmala, M., Kunkler, F., Lehtipalo, K., Liu, L., Mentler, B., Möhler, O., Morawiec, A., Petäjä, T., Rato, P., Rörup, B., Ruhl, S., Scholz, W., Simon, M., Tóme, A., Tong, Y., Top, J., Umo, N. S., Volkamer, R., Weissbacher, J., Xenofontos, C., Yang, B., Yu, W., Zauner-Wieczorek, M., Zgheib, I., Zhang, J., Zheng, Z., He, X.-C., Stolzenburg, D., Schobesberger, S., Curtius, J., and Donahue, N. M.: Isoprene Aerosol Growth in the Upper Troposphere: Application of the Diagonal Volatility Basis Set to CLOUD Chamber Measurements, Environmental Science & Technology Air, 2, 2092–2104, https://doi.org/10.1021/acsestair.5c00106, 2025. a, b, c
Bianchi, F., Kurtén, T., Riva, M., Mohr, C., Rissanen, M., Pontus, R., Berndt, T., Crounse, J., Wennberg, P., Mentel, T. F., Wildt, J., Junninen, H., Jokinen, T., Kulmala, M., Worsnop, D., Thornton, J., Donahue, N. M., Kjaergaard, H. G., and Ehn, M.: Highly-oxygenated organic molecules (HOM) from gas-phase autoxidation of organic peroxy radicals: A key contributor to atmospheric aerosol, Chem. Rev., 119, 3472–3509, https://doi.org/10.1021/acs.chemrev.8b00395, 2019. a, b
Bilde, M., Barsanti, K., Booth, A., Cappa, C., Donahue, N. M., McFiggans, G., Krieger, U., Marcolli, C., Topping, D., Ziemann, P., Barley, M., Clegg, S., Dennis-Smither, B., Emanuelsson, E., Hallquist, M., Hallquist, Å., Khlystov, A., Kulmala, M., Mogensen, D., Percival, C., Pope, F., Reid, J., Rosenoern, T., Ribeiro da Silva, M., Salo, K., Soonsin, V., Yli-Juuti, T., Prisle, N., Pagels, J., Rarey, J., Zardini, A., and Riipinen, I.: Saturation vapor pressures and transition enthalpies of low-volatility organic molecules of atmospheric relevance: from dicarboxylic acids to complex mixtures, Chem. Rev., 115, 4115–4156, https://doi.org/10.1021/cr5005502, 2015. a, b
Burkholder, J. B., Baynard, T., Ravishankara, A. R., and Lovejoy, E. R.: Particle nucleation following the O3 and OH initiated oxidation of a-pinene and b-pinene between 278 and 320 K, J. Geophys. Res.-Atmos., 112, D10216, https://doi.org/10.1029/2006JD007783, 2007. a
Chen, M., Titcombe, M., Jiang, J., Jen, C., Kuang, C., Fischer, M. L., Eisele, F. L., Siepmann, J. I., Hanson, D. R., Zhao, J., and McMurry, P. H.: Acid–base chemical reaction model for nucleation rates in the polluted atmospheric boundary layer, P. Natl. Acad. Sci. USA, 109, 18713–18718, https://doi.org/10.1073/pnas.1210285109, 2012. a
Clarke, A., Davis, D., Kapustin, V., Eisele, F., Chen, G., Paluch, I. I., Lenschow, D., Bandy, A., Thornton, D., Moore, K., Mauldin, L., Tanner, D., Litchy, M., Carroll, M., Collins, J., and Albercook, G.: Particle nucleation in the tropical boundary layer and its coupling to marine sulfur sources, Science, 282, 89–92, https://doi.org/10.1126/science.282.5386.89, 1998. a
Curtius, J., Heinritzi, M., Beck, L. J., Pöhlker, M. L., Tripathi, N., Krumm, B. E., Holzbeck, P., Nussbaumer, C. M., Hernández Pardo, L., Klimach, T., Barmpounis, K., Andersen, S. T., Bardakov, R., Bohn, B., Cecchini, M. A., Chaboureau, J.-P., Dauhut, T., Dienhart, D., Dörich, R., Edtbauer, A., Giez, A., Hartmann, A., Holanda, B. A., Joppe, P., Kaiser, K., Keber, T., Klebach, H., Krüger, O. O., Kürten, A., Mallaun, C., Marno, D., Martinez, M., Monteiro, C., Nelson, C., Ort, L., Raj, S. S., Richter, S., Ringsdorf, A., Rocha, F., Simon, M., Sreekumar, S., Tsokankunku, A., Unfer, G. R., Valenti, I. D., Wang, N., Zahn, A., Zauner-Wieczorek, M., Albrecht, R. I., Andreae, M. O., Artaxo, P., Crowley, J. N., Fischer, H., Harder, H., Herdies, D. L., Machado, L. A. T., Pöhlker, C., Pöschl, U., Possner, A., Pozzer, A., Schneider, J., Williams, J., and Lelieveld, J.: Isoprene nitrates drive new particle formation in Amazon's upper troposphere, Nature, 636, 124–130, https://doi.org/10.1038/s41586-024-08192-4, 2024. a
Dada, L., Stolzenburg, D., Simon, M., Fischer, L., Heinritzi, M., Wang, M., Xiao, M., Vogel, A. L., Ahonen, L., Amorim, A., Baalbaki, R., Baccarini, A., Baltensperger, U., Bianchi, F., Daellenbach, K. R., DeVivo, J., Dias, A., Dommen, J., Duplissy, J., Finkenzeller, H., Hansel, A., He, X.-C., Hofbauer, V., Hoyle, C. R., Kangasluoma, J., Kim, C., Kürten, A., Kvashnin, A., Mauldin, R., Makhmutov, V., Marten, R., Mentler, B., Nie, W., Petäjä, T., Quéléver, L. L. J., Saathoff, H., Tauber, C., Tome, A., Molteni, U., Volkamer, R., Wagner, R., Wagner, A. C., Wimmer, D., Winkler, P. M., Yan, C., Zha, Q., Rissanen, M., Gordon, H., Curtius, J., Worsnop, D. R., Lehtipalo, K., Donahue, N. M., Kirkby, J., Haddad, I. E., and Kulmala, M.: Role of sesquiterpenes in biogenic new particle formation, Science Advances, 9, eadi5297, https://doi.org/10.1126/sciadv.adi5297, 2023. a, b, c, d, e, f, g, h, i
Donahue, N. M. and CLOUD Collaboration: On describing particle nucleation within the Volatility Basis Set: Data Resources (1.0.0), Zenodo [data set], https://doi.org/10.5281/zenodo.20272605, 2026. a
Donahue, N. M., Robinson, A. L., Stanier, C. O., and Pandis, S. N.: Coupled Partitioning, Dilution, and Chemical Aging of Semivolatile Organics, Environ. Sci. Technol., 40, 2635–2643, https://doi.org/10.1021/es052297c, 2006. a, b, c, d, e
Donahue, N. M., Robinson, A. L., and Pandis, S. N.: Atmospheric Organic Particulate Matter: From Smoke to Secondary Organic Aerosol, Atmos. Environ., 43, 94–106, https://doi.org/10.1016/j.atmosenv.2008.09.055, 2009. a
Donahue, N. M., Epstein, S. A., Pandis, S. N., and Robinson, A. L.: A two-dimensional volatility basis set: 1. organic-aerosol mixing thermodynamics, Atmos. Chem. Phys., 11, 3303–3318, https://doi.org/10.5194/acp-11-3303-2011, 2011. a, b, c, d, e, f, g, h
Donahue, N. M., Kroll, J. H., Pandis, S. N., and Robinson, A. L.: A two-dimensional volatility basis set – Part 2: Diagnostics of organic-aerosol evolution, Atmos. Chem. Phys., 12, 615–634, https://doi.org/10.5194/acp-12-615-2012, 2012. a, b
Donahue, N. M., Ortega, I. K., Chuang, W., Riipinen, I., Riccobono, F., Schobesberger, S., Dommen, J., Baltensperger, U., Kulmala, M., Worsnop, D. R., and Vehkamaki, H.: How Do Organic Vapors Contribute to New-Particle Formation?, Faraday Discuss., 16, 91–104, https://doi.org/10.1039/C3FD00046J, 2013. a
Donahue, N. M., Robinson, A. L., Trump, E. R., Riipinen, I., and Kroll, J. H.: Volatility and Aging of Atmospheric Organic Aerosols, in: Atmospheric and Aerosol Chemistry, vol. 339 of Topics in Current Chemistry, Springer, 97–144, https://doi.org/10.1007/128_2012_355, 2014. a
Donahue, N. M., Chuang, W. K., and Schervish, M.: Gas-Phase Organic Oxidation Chemistry and Atmospheric Particles, in: Advances in Chemistry of the Contemporary Atmosphere, vol. 2, World Scientific, 199–317, https://doi.org/10.1142/9789813271838_0004, 2019. a
Duplissy, J., Merikanto, J., Franchin, A., Tsagkogeorgas, G., Kangasluoma, J., Wimmer, D., Vuollekoski, H., Schobesberger, S., Lehtipalo, K., Flagan, R. C., Brus, D., Donahue, N. M., Vehkamäki, H., Almeida, J., Amorim, A., Barmet, P., Bianchi, F., Breitenlechner, M., Dunne, E. M., Guida, R., Henschel, H., Junninen, H., Kirkby, J., Kürten, A., Kupc, A., Määttänen, A., Makhmutov, V., Mathot, S., Nieminen, T., Onnela, A., Praplan, A. P., Riccobono, F., Rondo, L., Steiner, G., Tome, A., Walther, H., Baltensperger, U., Carslaw, K. S., Dommen, J., Hansel, A., Petäjä, T., Sipilä, M., Stratmann, F., Vrtala, A., Wagner, P. E., Worsnop, D. R., Curtius, J., and Kulmala, M.: Effect of ions on sulfuric acid-water binary particle formation II: Experimental data and comparison with QC-normalized classical nucleation theory, J. Geophys. Res.-Atmos., 212, 1752–1775, https://doi.org/10.1002/2015JD023539, 2016. a
Epstein, S. A., Riipinen, I., and Donahue, N. M.: A Semiempirical Correlation between Enthalpy of Vaporization and Saturation Concentration for Organic Aerosol, Environ. Sci. Technol., 44, 743–748, https://doi.org/10.1021/es902497z, 2010. a, b, c
Flagan, R. C.: A thermodynamically consistent kinetic framework for binary nucleation, J. Chem. Phys., 127, 214503, https://doi.org/10.1063/1.2800001, 2007. a
Heinritzi, M., Dada, L., Simon, M., Stolzenburg, D., Wagner, A. C., Fischer, L., Ahonen, L. R., Amanatidis, S., Baalbaki, R., Baccarini, A., Bauer, P. S., Baumgartner, B., Bianchi, F., Brilke, S., Chen, D., Chiu, R., Dias, A., Dommen, J., Duplissy, J., Finkenzeller, H., Frege, C., Fuchs, C., Garmash, O., Gordon, H., Granzin, M., El Haddad, I., He, X., Helm, J., Hofbauer, V., Hoyle, C. R., Kangasluoma, J., Keber, T., Kim, C., Kürten, A., Lamkaddam, H., Laurila, T. M., Lampilahti, J., Lee, C. P., Lehtipalo, K., Leiminger, M., Mai, H., Makhmutov, V., Manninen, H. E., Marten, R., Mathot, S., Mauldin, R. L., Mentler, B., Molteni, U., Müller, T., Nie, W., Nieminen, T., Onnela, A., Partoll, E., Passananti, M., Petäjä, T., Pfeifer, J., Pospisilova, V., Quéléver, L. L. J., Rissanen, M. P., Rose, C., Schobesberger, S., Scholz, W., Scholze, K., Sipilä, M., Steiner, G., Stozhkov, Y., Tauber, C., Tham, Y. J., Vazquez-Pufleau, M., Virtanen, A., Vogel, A. L., Volkamer, R., Wagner, R., Wang, M., Weitz, L., Wimmer, D., Xiao, M., Yan, C., Ye, P., Zha, Q., Zhou, X., Amorim, A., Baltensperger, U., Hansel, A., Kulmala, M., Tomé, A., Winkler, P. M., Worsnop, D. R., Donahue, N. M., Kirkby, J., and Curtius, J.: Molecular understanding of the suppression of new-particle formation by isoprene, Atmos. Chem. Phys., 20, 11809–11821, https://doi.org/10.5194/acp-20-11809-2020, 2020. a, b, c
Kiendler-Scharr, A., Wildt, J., Dal Maso, M., Hohaus, T., Kleist, E., Mentel, T. F., Tillmann, R., Uerlings, R., Schurr, U., and Wahner, A.: New particle formation in forests inhibited by isoprene emissions, Nature, 461, 381–384, 2009. a
Kirkby, J., Curtius, J., Almeida, J., Dunne, E., Duplissy, J., Ehrhart, S., Franchin, A., Gagne, S., Ickes, L., Kurten, A., Kupc, A., Metzger, A., Riccobono, F., Rondo, L., Schobesberger, S., Tsagkogeorgas, G., Wimmer, D., Amorim, A., Bianchi, F., Breitenlechner, M., David, A., Dommen, J., Downard, A., Ehn, M., Flagan, R. C., Haider, S., Hansel, A., Hauser, D., Jud, W., Junninen, H., Kreissl, F., Kvashin, A., Laaksonen, A., Lehtipalo, K., Lima, J., Lovejoy, E. R., Makhmutov, V., Mathot, S., Mikkila, J., Minginette, P., Mogo, S., Nieminen, T., Onnela, A., Pereira, P., Petaja, T., Schnitzhofer, R., Seinfeld, J. H., Sipila, M., Stozhkov, Y., Stratmann, F., Tome, A., Vanhanen, J., Viisanen, Y., Vrtala, A., Wagner, P. E., Walther, H., Weingartner, E., Wex, H., Winkler, P. M., Carslaw, K. S., Worsnop, D. R., Baltensperger, U., and Kulmala, M.: Role of sulphuric acid, ammonia and galactic cosmic rays in atmospheric aerosol nucleation, Nature, 476, 429–433, https://doi.org/10.1038/nature10343, 2011. a, b
Kirkby, J., Duplissy, J., Sengupta, K., Frege, C., Gordon, H., Williamson, C., Heinritzi, M., Simon, M., Yan, C., Almeida, J., Tröstl, J., Nieminen, T., Ortega, I. K., Wagner, R., Adamov, A., Amorim, A., Bernhammer, A.-K., Bianchi, F., Breitenlechner, M., Brilke, S., Chen, X., Craven, J., Dias, A., Ehrhart, S., Flagan, R. C., Franchin, A., Fuchs, C., Guida, R., Hakala, J., Hoyle, C. R., Jokinen, T., Junninen, H., Kangasluoma, J., Kim, J., Krapf, M., Kürten, A., Laaksonen, A., Lehtipalo, K., Makhmutov, V., Mathot, S., Molteni, U., Onnela, A., Peräkylä, O., Piel, F., Petäjä, T., Praplan, A. P., Pringle, K., Rap, A., Richards, N. A., Riipinen, I., Rissanen, M. P., Rondo, L., Sarnela, N., Schobesberger, S., Scott, C. E., Seinfeld, J. H., Sipilä, M., Steiner, G., Stozhkov, Y., Stratmann, F., Tomé, A., Virtanen, A., Vogel, A. L., Wagner, A., Wagner, P. E., Weingartner, E., Wimmer, D., Winkler, P. M., Ye, P., Zhang, X., Hansel, A., Dommen, J., Donahue, N. M., Worsnop, D. R., Baltensperger, U., Kulmala, M., Carslaw, K. S., and Curtius, J.: Ion-induced nucleation of pure biogenic particles, Nature, 530, 521–526, https://doi.org/10.1038/nature17953, 2016. a, b, c, d, e, f, g, h, i, j
Kolská, Z., Růžička, V., and Gani, R.: Estimation of the Enthalpy of Vaporization and the Entropy of Vaporization for Pure Organic Compounds at 298.15 K and at Normal Boiling Temperature by a Group Contribution Method, Ind. Eng. Chem. Res., 44, 8436–8454, https://doi.org/10.1021/ie050113x, 2005. a, b, c
Kulmala, M., Toivonen, A., and Mäkelä, J.: Analysis of the growth of nucleation mode particles observed in boreal forest, Tellus B, 50, 449–462, 1988. a
Kulmala, M., Pirjola, L., and Mäkelä, J. M.: Stable sulphate clusters as a source of new atmospheric particles, Nature, 404, 66–69, https://doi.org/10.1038/35003550, 2000. a
Lane, T. E., Donahue, N. M., and Pandis, S. N.: Effect of NOx on Secondary Organic Aerosol Concentrations, Environ. Sci. Technol., 42, 6022–6027, https://doi.org/10.1021/es703225a, 2008. a
Lee, S.-H., Reeves, J. M., Wilson, J. C., Hunton, D. E., Viggiano, A. A., Miller, T. M., Ballenthin, J. O., and Lait, L. R.: Particle Formation by Ion Nucleation in the Upper Troposphere and Lower Stratosphere, Science, 301, 1886–1889, https://doi.org/10.1126/science.1087236, 2003. a
Lopez, B., Bhattacharyya, N., DeVivo, J., Wang, M., Caudillo-Plath, L., Surdu, M., Bianchi, F., Brasseur, Z., Buchholz, A., Chen, D., Duplissy, J., He, X.-C., Hofbauer, V., Mahfouz, N., Makhmutov, V., Marten, R., Mentler, B., Philippov, M., Schervish, M., Wang, D. S., Weber, S. K., Welti, A., Haddad, I. E., Lehtipalo, K., Kulmala, M., Worsnop, D., Kirkby, J., Mauldin, R. L., Stolzenburg, D., Schobesberger, S., Flagan, R., and Donahue, N. M.: A diagonal volatility basis set to assess the condensation of organic vapors onto particles, Environmental Science: Atmospheres, 5, 1035–1061, https://doi.org/10.1039/D5EA00062A, 2025. a, b
Lopez-Hilfiker, F. D., Mohr, C., Ehn, M., Rubach, F., Kleist, E., Wildt, J., Mentel, Th. F., Lutz, A., Hallquist, M., Worsnop, D., and Thornton, J. A.: A novel method for online analysis of gas and particle composition: description and evaluation of a Filter Inlet for Gases and AEROsols (FIGAERO), Atmos. Meas. Tech., 7, 983–1001, https://doi.org/10.5194/amt-7-983-2014, 2014. a
McFiggans, G., Mentel, T. F., Wildt, J., Pullinen, I., Kang, S., Kleist, E., Schmitt, S., Springer, M., Tillmann, R., Wu, C., Zhao, D., Hallquist, M., Faxon, C., Le Breton, M., Hallquist, Å. M., Simpson, D., Bergström, R., Jenkin, M. E., Ehn, M., Thornton, J. A., Alfarra, M. R., Bannan, T. J., Percival, C. J., Priestley, M., Topping, D., and Kiendler-Scharr, A.: Secondary organic aerosol reduced by mixture of atmospheric vapours, Nature, 565, 587–593, https://doi.org/10.1038/s41586-018-0871-y, 2019. a, b
McMurry, P. H.: Photochemical aerosol formation from SO2: A theoretical analysis of smog chamber data, J. Colloid Interf. Sci., 78, 513–527, 1980. a
Metzger, A., Verheggen, B., Dommen, J., Duplissy, J., Prevot, A. S. H., Weingartner, E., Riipinen, I., Kulmala, M., Spracklen, D. V., Carslaw, K. S., and Baltensperger, U.: Evidence for the role of organics in aerosol particle formation under atmospheric conditions, P. Natl. Acad. Sci. USA, 107, 6646–6651, https://doi.org/10.1073/pnas.0911330107, 2010. a
Molteni, U., Simon, M., Heinritzi, M., Hoyle, C. R., Bernhammer, A.-K., Bianchi, F., Breitenlechner, M., Brilke, S., Dias, A., Duplissy, J., Frege, C., Gordon, H., Heyn, C., Jokinen, T., Kürten, A., Lehtipalo, K., Makhmutov, V., Petäjä, T., Pieber, S. M., Praplan, A. P., Schobesberger, S., Steiner, G., Stozhkov, Y., Tomé, A., Tröstl, J., Wagner, A. C., Wagner, R., Williamson, C., Yan, C., Baltensperger, U., Curtius, J., Donahue, N. M., Hansel, A., Kirkby, J., Kulmala, M., Worsnop, D. R., and Dommen, J.: Formation of Highly Oxygenated Organic Molecules from α-Pinene Ozonolysis: Chemical Characteristics, Mechanism, and Kinetic Model Development, Earth and Space Chemistry, 3, 873–883, https://doi.org/10.1021/acsearthspacechem.9b00035, 2019. a
Ortega, I. K., Kupiainen, O., Kurtén, T., Olenius, T., Wilkman, O., McGrath, M. J., Loukonen, V., and Vehkamäki, H.: From quantum chemical formation free energies to evaporation rates, Atmos. Chem. Phys., 12, 225–235, https://doi.org/10.5194/acp-12-225-2012, 2012. a
Ortega, I. K., Donahue, N. M., Kurtén, T., Kulmala, M., Focsa, C., and Vehkamäki, H.: Can highly oxidized organics contribute to atmospheric new-particle formation?, J. Phys. Chem. A, 120, 1452–1458, https://doi.org/10.1021/acs.jpca.5b07427, 2016. a
Pankow, J. F.: An absorption model of gas/particle partitioning of organic compounds in the atmosphere, Atmos. Environ., 28, 185–188, https://doi.org/10.1016/1352-2310(94)90093-0, 1994. a
Pankow, J. F. and Asher, W. E.: SIMPOL.1: a simple group contribution method for predicting vapor pressures and enthalpies of vaporization of multifunctional organic compounds, Atmos. Chem. Phys., 8, 2773–2796, https://doi.org/10.5194/acp-8-2773-2008, 2008. a, b
Raes, F., Janssens, A., and Van Dingenen, R.: The role of ion-induced aerosol formation in the lower atmosphere, J. Aerosol Sci., 17, 466–470, https://doi.org/10.1016/0021-8502(86)90135-7, 1986. a
Riccobono, F., Schobesberger, S., Scott, C. E., Dommen, J., Ortega, I. K., Rondo, L., Almeida, J., Amorim, A., Bianchi, F., Breitenlechner, M., David, A., Downard, A., Dunne, E., Duplissy, J., Ehrhart, S., Flagan, R. C., Franchin, A., Hansel, A., Junninen, H., Kajos, M., Keskinen, H., Kupc, A., Kupiainen, O., Kürten, A., Kurtén, T., Kvashin, A. N., Laaksonen, A., Lehtipalo, K., Makhmutov, V., Mathot, S., Nieminen, T., Olenius, T., Onnela, A., Petäjä, T., Praplan, A. P., Santos, F. D., Schallhart, S., Seinfeld, J. H., Sipilä, M., Spracklen, D. V., Stozhkov, Y., Stratmann, F., Tomé, A., Tsagkogeorgas, G., Vaattovaara, P., Vehkamäki, H., Viisanen, Y., Vrtala, A., Wagner, P. E., Weingartner, E., Wex, H., Wimmer, D., Carslaw, K. S., Curtius, J., Donahue, N. M., Kirkby, J., Kulmala, M., Worsnop, D. R., and Baltensperger, U.: Oxidation Products of Biogenic Emissions Contribute to Nucleation of Atmospheric Particles, Science, 344, 717–721, https://doi.org/10.1126/science.1243527, 2014. a, b
Riipinen, I., Pierce, J. R., Donahue, N. M., and Pandis, S. N.: Equilibration time scales of organic aerosol inside thermodenuders: Evaporation kinetics versus thermodynamics, Atmos. Environ., 44, 597–607, https://doi.org/10.1016/j.atmosenv.2009.11.022, 2010. a
Riipinen, I., Pierce, J. R., Yli-Juuti, T., Nieminen, T., Häkkinen, S., Ehn, M., Junninen, H., Lehtipalo, K., Petäjä, T., Slowik, J., Chang, R., Shantz, N. C., Abbatt, J., Leaitch, W. R., Kerminen, V.-M., Worsnop, D. R., Pandis, S. N., Donahue, N. M., and Kulmala, M.: Organic condensation: a vital link connecting aerosol formation to cloud condensation nuclei (CCN) concentrations, Atmos. Chem. Phys., 11, 3865–3878, https://doi.org/10.5194/acp-11-3865-2011, 2011. a
Robinson, A. L., Donahue, N. M., Shrivastava, M. K., Sage, A. M., Weitkamp, E. A., Grieshop, A. P., Lane, T. E., Pierce, J. R., and Pandis, S. N.: Rethinking Organic Aerosols: Semivolatile Emissions and Photochemical Aging, Science, 315, 1259–1263, https://doi.org/10.1126/science.1133061, 2007. a
Russell, D. M., Kunkler, F., Shen, J., Kohl, M., DeVivo, J., Bhattacharyya, N., Xenofontos, C., Klebach, H., Caudillo-Plath, L., Simon, M., Ahongshangbam, E., Almeida, J., Amorim, A., Beckmann, H., Busato, M., Canagaratna, M., Chassaing, A., Cruz-Simbron, R., Dada, L., Holzbeck, P., Judmaier, B., Sebastian, M. K., Koemets, P., Krüger, T., Liu, L., Martinez, M., Mentler, B., Morawiec, A., Onnela, A., Petäjä, T., Rato, P., Reza, M., Ruhl, S., Scholz, W., Sommer, E., Tomé, A., Tong, Y., Top, J., Umo, N. S., Unfer, G. R., Ward, R. X., Weissbacher, J., Yang, B., Yu, W., Zauner-Wieczorek, M., Zgheib, I., Zhang, J., Zheng, Z., Haddad, I. E., Flagan, R. C., Hansel, A., Junninen, H., Kulmala, M., Lehtipalo, K., Lelieveld, J., Möhler, O., Schobesberger, S., Volkamer, R., Winkler, P. M., Worsnop, D. R., Christoudias, T., Pozzer, A., Donahue, N. M., Harder, H., Kirkby, J., He, X.-C., and Curtius, J.: Isoprene chemistry under upper-tropospheric conditions, Nat. Commun., 16, 8555, https://doi.org/10.1038/s41467-025-64229-w, 2025. a
Saleh, R. and Khlystov, A.: Determination of Activity Coefficients of Semi-Volatile Organic Aerosols Using the Integrated Volume Method, Aerosol Sci. Technol., 43, 838–846, 2009. a
Schervish, M. and Donahue, N. M.: Peroxy radical chemistry and the volatility basis set, Atmos. Chem. Phys., 20, 1183–1199, https://doi.org/10.5194/acp-20-1183-2020, 2020. a, b, c, d, e, f, g
Schervish, M. and Donahue, N. M.: Peroxy radical kinetics and new particle formation, Environmental Science: Atmospheres, 1, 79–92, https://doi.org/10.1039/D0EA00017E, 2021. a
Schervish, M., Heinritzi, M., Stolzenburg, D., Dada, L., Wang, M., Ye, Q., Hofbauer, V., DeVivo, J., Bianchi, F., Brilke, S., Duplissy, J., El Haddad, I., Finkenzeller, H., He, X.-C., Kvashnin, A., Kim, C., Kirkby, J., Kulmala, M., Lehtipalo, K., Lopez, B., Makhmutov, V., Mentler, B., Molteni, U., Nie, W., Petäjä, T., Quéléver, L., Volkamer, R., Wagner, A. C., Winkler, P., Yan, C., and Donahue, N. M.: Interactions of peroxy radicals from monoterpene and isoprene oxidation simulated in the radical Volatility Basis Set, Environmental Science: Atmospheres, 4, 740–753, https://doi.org/10.1039/D4EA00056K, 2024. a
Shen, J., Russell, D. M., DeVivo, J., Kunkler, F., Baalbaki, R., Mentler, B., Scholz, W., Yu, W., Caudillo-Plath, L., Sommer, E., Ahongshangbam, E., Alfaouri, D., Almeida, J., Amorim, A., Beck, L. J., Beckmann, H., Berntheusel, M., Bhattacharyya, N., Canagaratna, M. R., Chassaing, A., Cruz-Simbron, R., Dada, L., Duplissy, J., Gordon, H., Granzin, M., Große Schute, L., Heinritzi, M., Iyer, S., Klebach, H., Krüger, T., Kürten, A., Lampimäki, M., Liu, L., Lopez, B., Martinez, M., Morawiec, A., Onnela, A., Peltola, M., Rato, P., Reza, M., Richter, S., Rörup, B., Kaniyodical Sebastian, M., Simon, M., Surdu, M., Tamme, K., Thakur, R. C., Tomé, A., Tong, Y., Top, J., Umo, N. S., Unfer, G., Vettikkat, L., Weissbacher, J., Xenofontos, C., Yang, B., Zauner-Wieczorek, M., Zhang, J., Zheng, Z., Baltensperger, U., Christoudias, T., Flagan, R. C., El Haddad, I., Junninen, H., Möhler, O., Riipinen, I., Rohner, U., Schobesberger, S., Volkamer, R., Winkler, P. M., Hansel, A., Lehtipalo, K., Donahue, N. M., Lelieveld, J., Harder, H., Kulmala, M., Worsnop, D. R., Kirkby, J., Curtius, J., and He, X.-C.: New particle formation from isoprene in the upper Troposphere, Nature, 636, 115–123, https://doi.org/10.1038/s41586-024-08196-0, 2024. a
Shiraiwa, M., Ammann, M., Koop, T., and Poeschl, U.: Gas uptake and chemical aging of semisolid organic aerosol particles, P. Natl. Acad. Sci. USA, 08, 11003–11008, https://doi.org/10.1073/pnas.1103045108, 2011. a
Shrivastava, M. K., Lane, T. E., Donahue, N. M., Pandis, S. N., and Robinson, A. L.: Effects of gas particle partitioning and aging of primary emissions on urban and regional organic aerosol concentrations, J. Geophys. Res.-Atmos., 113, D18301, https://doi.org/10.1029/2007JD009735, 2008. a
Simon, M., Dada, L., Heinritzi, M., Scholz, W., Stolzenburg, D., Fischer, L., Wagner, A. C., Kürten, A., Rörup, B., He, X.-C., Almeida, J., Baalbaki, R., Baccarini, A., Bauer, P. S., Beck, L., Bergen, A., Bianchi, F., Bräkling, S., Brilke, S., Caudillo, L., Chen, D., Chu, B., Dias, A., Draper, D. C., Duplissy, J., El-Haddad, I., Finkenzeller, H., Frege, C., Gonzalez-Carracedo, L., Gordon, H., Granzin, M., Hakala, J., Hofbauer, V., Hoyle, C. R., Kim, C., Kong, W., Lamkaddam, H., Lee, C. P., Lehtipalo, K., Leiminger, M., Mai, H., Manninen, H. E., Marie, G., Marten, R., Mentler, B., Molteni, U., Nichman, L., Nie, W., Ojdanic, A., Onnela, A., Partoll, E., Petäjä, T., Pfeifer, J., Philippov, M., Quéléver, L. L. J., Ranjithkumar, A., Rissanen, M. P., Schallhart, S., Schobesberger, S., Schuchmann, S., Shen, J., Sipilä, M., Steiner, G., Stozhkov, Y., Tauber, C., Tham, Y. J., Tomé, A. R., Vazquez-Pufleau, M., Vogel, A. L., Wagner, R., Wang, M., Wang, D. S., Wang, Y., Weber, S. K., Wu, Y., Xiao, M., Yan, C., Ye, P., Ye, Q., Zauner-Wieczorek, M., Zhou, X., Baltensperger, U., Dommen, J., Flagan, R. C., Hansel, A., Kulmala, M., Volkamer, R., Winkler, P. M., Worsnop, D. R., Donahue, N. M., Kirkby, J., and Curtius, J.: Molecular understanding of new-particle formation from α-pinene between −50 and +25 °C, Atmos. Chem. Phys., 20, 9183–9207, https://doi.org/10.5194/acp-20-9183-2020, 2020. a, b, c, d, e, f, g, h, i, j, k, l, m, n, o
Stolzenburg, D., Fischer, L., Vogel, A. L., Heinritzi, M., Schervish, M., Simon, M., Wagner, A. C., Dada, L., Ahonen, L. R., Amorim, A., Baccarini, A., Bauer, P. S., Baumgartner, B., Bergen, A., Bianchi, F., Breitenlechner, M., Brilke, S., Buenrostro Mazon, S., Chen, D., Dias, A., Draper, D. C., Duplissy, J., El Haddad, I., Finkenzeller, H., Frege, C., Fuchs, C., Garmash, O., Gordon, H., He, X., Helm, J., Hofbauer, V., Hoyle, C. R., Kim, C., Kirkby, J., Kontkanen, J., Kürten, A., Lampilahti, J., Lawler, M., Lehtipalo, K., Leiminger, M., Mai, H., Mathot, S., Mentler, B., Molteni, U., Nie, W., Nieminen, T., Nowak, J. B., Ojdanic, A., Onnela, A., Passananti, M., Petäjä, T., Quéléver, L. L. J., Rissanen, M. P., Sarnela, N., Schallhart, S., Tauber, C., Tomé, A., Wagner, R., Wang, M., Weitz, L., Wimmer, D., Xiao, M., Yan, C., Ye, P., Zha, Q., Baltensperger, U., Curtius, J., Dommen, J., Flagan, R. C., Kulmala, M., Smith, J. N., Worsnop, D. R., Hansel, A., Donahue, N. M., and Winkler, P. M.: Rapid growth of organic aerosol nanoparticles over a wide tropospheric temperature range, P. Natl. Acad. Sci. USA, 115, 9122–9127, https://doi.org/10.1073/pnas.1807604115, 2018. a, b, c, d, e, f, g, h, i, j
Stolzenburg, D., Wang, M., Schervish, M., and Donahue, N. M.: Tutorial: Dynamic organic growth modeling with a volatility basis set, J. Aerosol Sci., 166, 106063, https://doi.org/10.1016/j.jaerosci.2022.106063, 2022. a, b, c, d, e
Tröstl, J., Chuang, W. K., Heinritzi, M., Yan, C., Molteni, U., Ahlm, L., Frege, C., Bianchi, F., Wagner, R., Simon, M., Lehtipalo, K., Williamson, C., Craven, J. S., Duplissy, J., Adamov, A., Almeida, J., Bernhammer, A.-K., Breitenlechner, M., Brilke, S., Dias, A., Ehrhart, S., Flagan, R. C., Franchin, A., Fuchs, C., Gordon, H., Guida, R., Gysel, M., Hansel, A., Hoyle, C. R., Jokinen, T., Junninen, H., Kangasluoma, J., Keskinen, H., Kim, J., Krapf, M., Kürten, A., Laaksonen, A., Lawler, M., Leiminger, M., Mathot, S., Möhler, O., Nieminen, T., Onnela, A., Petäjä, T., Piel, F. M., Miettinen, P., Rissanen, M. P., Rondo, L., Sarnela, N., Schobesberger, S., Sengupta, K., Sipilä, M., Smith, J. N., Steiner, G., Tomè, A., Virtanen, A., Wagner, A. C., Weingartner, E., Wimmer, D., Winkler, P. M., Ye, P., Carslaw, K. S., Curtius, J., Dommen, J., Kirkby, J., Kulmala, M., Riipinen, I., Worsnop, D. R., Donahue, N. M., and Baltensperger, U.: The role of low-volatility organic compounds in initial particle growth in the atmosphere, Nature, 530, 527–531, https://doi.org/10.1038/nature18271, 2016. a, b, c, d, e
Vehkamaki, H. and Riipinen, I.: Thermodynamics and kinetics of atmospheric aerosol particle formation and growth, Chem. Soc. Rev., 41, 5160–5173, https://doi.org/10.1039/C2CS00002D, 2012. a
Wang, M., Chen, D., Xiao, M., Ye, Q., Stolzenburg, D., Hofbauer, V., Ye, P., Vogel, A. L., Mauldin III, R. L., Amorim, A., Baccarini, A., Baumgartner, B., Brilke, S., Dada, L., Dias, A., Duplissy, J., Finkenzeller, H., Garmash, O., He, X., Hoyle, C. R., Kim, C., Kvashnin, A., Lehtipalo, K., Lukas, F., Molteni, U., Petäjä, T., Pospisilova, V., Quéléver, L. L. J., Rissanen, M., Simon, M., Tauber, C., Tomé, A., Wagner, A. C., Weitz, L., Volkamer, R., Winkler, P. M., Kirkby, J., Worsnop, D. R., Baltensperger, U., Dommen, J., El Haddad, I., and Donahue, N. M.: Photo-oxidation of Aromatic Hydrocarbons Produces Low-Volatility Organic Compounds, Environ. Sci. Technol., 54, 7911–7921, https://doi.org/10.1021/acs.est.0c02100, 2020. a
Ye, Q., Wang, M., Hofbauer, V., Stolzenburg, D., Chen, D., Schervish, M., Vogel, A., Mauldin III, R. L., Baalbaki, R., Brilke, S., Dada, L., Dias, A., Duplissy, J., Haddad, I. E., Finkenzeller, H., Fischer, L., He, X., Kim, C., Kurten, A., Lamkaddam, H., Lee, C. P., Lehtipalo, K., Leiminger, M., Manninen, H. E., Marten, R., Mentler, B., Partoll, E., Petäjä, T., Rissanen, M., Schobesberger, S., Schuchmann, S., Simon, M., Tham, Y. J., Vazquez-Pufleau, M., Wagner, A. C., Wang, Y., Wu, Y., Xiao, M., Baltensperger, U., Curtius, J., Flagan, R., Kirkby, J., Kulmala, M., Volkamer, R., Winkler, P. M., Worsnop, D., and Donahue, N. M.: Molecular Composition and Volatility of Nucleated Particles from α-Pinene Oxidation between −50 C and +25 C, Environ. Sci. Technol., 53, 12357–12365, https://doi.org/10.1021/acs.est.9b03265, 2019. a, b
You, Y., Renbaum-Wolff, L., Carreras-Sospedra, M., Hanna, S. J., Hiranuma, N., Kamal, S., Smith, M. L., Zhang, X., Weber, R. J., Shilling, J. E., Dabdub, D., Martin, S. T., and Bertram, A. K.: Images reveal that atmospheric particles can undergo liquid–liquid phase separations, P. Natl. Acad. Sci. USA, 109, 13188–13193, https://doi.org/10.1073/pnas.1206414109, 2012. a
Yu, F., Luo, G., Bates, T. S., Anderson, B., Clarke, A., Kapustin, V., Yantosca, R. M., Wang, Y., and Wu, S.: Spatial distributions of particle number concentrations in the global troposphere: Simulations, observations, and implications for nucleation mechanisms, J. Geophys. Res.-Atmos., 115, https://doi.org/10.1029/2009JD013473, 2010. a
Zhang, R., Suh, I., Zhao, J., Zhang, D., Fortner, E., Tie, X., Molina, L., and Molina, M.: Atmospheric new particle formation enhanced by organic acids, Science, 304, 1487–1490, 2004. a
Zhao, B., Shrivastava, M., Donahue, N. M., Gordon, H., Schervish, M., Shilling, J. E., Zaveri, R. A., Wang, J., Andreae, M. O., Zhao, C., Gaudet, B., Liu, Y., Fan, J., and Fast, J. D.: High concentration of ultrafine particles in the Amazon free troposphere produced by organic new particle formation, P. Natl. Acad. Sci. USA, 117, 25344–25351, https://doi.org/10.1073/pnas.2006716117, 2020. a
Zhao, B., Fast, J. D., Donahue, N. M., Shrivastava, M., Schervish, M., Shilling, J. E., Gordon, H., Wang, J., Gao, Y., Zaveri, R. A., Liu, Y., and Gaudet, B.: Impact of Urban Pollution on Organic-Mediated New-Particle Formation and Particle Number Concentration in the Amazon Rainforest, Environ. Sci. Technol., 55, 4357–4367, https://doi.org/10.1021/acs.est.0c07465, 2021. a
- Abstract
- Introduction
- The Volatility Basis Set
- Nucleation of organic vapors
- VBS Nucleation Example Case
- CLOUD Experiments
- Conclusions
- Appendix A: Themodynamics
- Appendix B: Nucleation Kinetics
- Appendix C: CLOUD Results for Different Vaporization Models
- Data availability
- Author contributions
- Competing interests
- Disclaimer
- Financial support
- Review statement
- References