the Creative Commons Attribution 4.0 License.
the Creative Commons Attribution 4.0 License.
 | 12 Jun 2026
Measurement report: Ice nucleating particles variability across a megacity
Sebastián Mendoza-Téllez
Karla Valdés
David Ramírez
Jan Alexis Cedillo
Olivia Rivera-Hernández
Fernanda Córdoba
Harry Alvarez
Javier Miranda
Irma Rosas
Graciela B. Raga
Emma Negrete
Leticia Martínez
Eva Salinas
Luis A. Ladino
Megacities are a major source of urban aerosol particles, which can impact cloud formation and the local hydrological cycle. However, the aerosol-cloud interaction above megacities, especially in their different microclimates, is poorly understood. In the present study, the physicochemical and biological properties of urban aerosol particles, along with their ice nucleating particle (INP) concentration via immersion freezing and as a function of particle size (0.56–10 µm), were simultaneously characterized at two sites across the Mexico City Metropolitan Area (MCMA). We found differences in the chemical composition, criteria pollutants (PM2.5, O3, CO, NOx, and SO2), and biological content between northern and southern MCMA, separated by 16 km. The collected urban MCMA aerosol particles were found to act as INPs, with average concentrations ranging between (at −15 °C) and (at −30 °C). Although the measured INP concentrations were similar in both sites, the southern samples showed a higher INP concentration for larger aerosol particles (i.e., particles between 5.6–10 µm).
Although the urban aerosol's physicochemical properties, biological content, and its sources were found to differ at both sites, it did not strongly impact the INP concentrations, with the exception of the largest measured particles. This highlights the importance of considering that aerosol-cloud interactions above a megacity may vary, especially when assessing the role of INPs in cloud formation.
- Article
(1665 KB) - Full-text XML
-
Supplement
(2208 KB) - BibTeX
- EndNote


Mexico City and its Metropolitan Area (MCMA) is one of the top megacities worldwide with a population of 21 million inhabitants (Población, 2025). In the 1980s, the MCMA was reported as the most polluted city on Earth (Molina and Molina, 2004); however, since the 1990s, air quality has improved significantly (Molina and Molina, 2002). Even so, due to its size and the diverse anthropogenic activities, the MCMA atmospheric processes are complex and far from being completely understood (Molina et al., 2010). Nowadays, poor air quality is one of the major threats for the MCMA inhabitants' health (Riojas-Rodríguez et al., 2014). The impact of the high annual release of particulate matter (PM) (in the order of gigagrams, Gg) on the local climate remains poorly quantified (Castro Romero et al., 2024).
Several studies have provided substantial insights into the physicochemical properties of PM within the MCMA (Aldape et al., 1991; Edgerton et al., 1999; Doran et al., 2007; Querol et al., 2008). For example, Vega et al. (2004) characterized the PM2.5 composition of the MCMA, showing that the sulfate (), ammonium (), and total carbon (elemental carbon + organic carbon) average concentrations are higher in the north of the city compared to the southern part (higher by 1.16 µg m−3 (18.1 %), 0.8 µg m−3 (23.6 %), and 18.49 µg m−3 (51.1 %), respectively). This agrees with the data reported by the 2006 MILAGRO (Megacity Initiative: Local And Global Research Observations) project, where a complete evaluation of the regional and global impacts of Mexico's City atmospheric emissions was assessed (Molina et al., 2010).
Several studies found that organic matter has a huge impact on the MCMA's PM2.5 composition. Amador-Muñoz et al. (2011) reported a carbon preference index (CPI) larger than 1 on the southwest of the MCMA, suggesting that this part of the city contains more biogenic sources (Amador-Muñoz et al., 2013). Ladino et al. (2018) and Hernández-López et al. (2023) reported clear differences in polycyclic aromatic hydrocarbons (PAHs) between the north and south of the MCMA, with the highest concentrations reported in the northern part of the city. Gasoline-fueled vehicles are likely responsible for local PAHs emissions and could reinforce the presence of urban microclimates with independent local atmospheric processes, inside one megacity (Molina and Molina, 2004).
A microclimate can be referred to as a relative small-scale area with a distinctive climate over it as a whole (Met Office Factsheet 14; Met Office, 2023). Owing to its large area, and the clear variability of land use (e.g., industrial, rural, residential, commerce, and ecological preservation), the northern and southern MCMA present significant differences in temperature (heat islands), rainfall, wind patterns, humidity, aerosol and gas emissions, indicating the presence of a clear microclimate differentiation (Met Office, 2023; Molina and Molina, 2004; Amador-Muñoz et al., 2013; Castro Romero et al., 2024). Although the studies above highlight the clear differences in the sources and physicochemical properties of PM in different parts of the MCMA, studies that include simultaneous measurements at two or more sites are scarce. This is of high importance to understand the microclimates along the MCMA and their relationship with local precipitation events. Zhu et al. (2024) evaluated precipitation events across China, finding that precipitation characteristics could differ across climatic zones. Additionally, Li et al. (2019) showed that atmospheric circulation changes driven by global warming modulated the intensification of extreme precipitation events across North America.
Meteorological data and models indicate a predominance of northerly, southerly, southwesterly, and northeasterly wind events in MCMA, with frequencies of 20 %, 16 %, 15 %, and 13 %, respectively (Celada-Murillo et al., 2013). In addition, typically wind events with speeds ranging from 0.25–1.50 m s−1 appear mainly during the early morning, while other wind events with larger speeds (i.e., ranging from 1.5–5.50 m s−1) appear mainly during the afternoon and night (Celada-Murillo et al., 2013; Salcido et al., 2015). On the other hand, meteorological conditions in some defined area, as the presence of atmospheric stable conditions, or the well-known large-scale atmospheric circulation could help understanding the real perturbations of urban aerosols on cloud formation and precipitation events (Trofimov et al., 2022).
Given that most of the precipitation over the tropics comes from ice-containing clouds (Mülmenstädt et al., 2015) and that aerosol particles acting as ice nucleating particles (INPs) are key in mixed-phase cloud (MPC) formation (Rogers and Yau, 1996; Houze, 2014; Kanji et al., 2017), information on the interplay between aerosol particles and cloud formation in big cities such as the MCMA is urgently needed, especially because extreme precipitation events are predicted to increase with time (Tabari, 2020; Gimeno et al., 2022), causing huge economical and societal impacts in densely populated cities. Aerosol particles have the potential to influence the development of deep convective clouds, which are typically associated with extreme rainfall events (Burrows et al., 2022). Efficient INPs can promote specific processes as the seeder-feeder mechanism (Ohneiser et al., 2025) triggering primary ice particle formation as well as ice multiplication, increasing the ice water content in MPC (Purdy et al., 2005). These ice particles can grow at expenses of the surrounding water droplets, via the Wegner–Bergeron–Findeisen process, enhancing precipitation rates (Heymsfield et al., 2020; Ohneiser et al., 2025). Toll et al. (2024) showed that the presence of anthropogenic particles hot spots can modify cloud microphysics, leading to cloud glaciation and precipitation events under stratiform non-convective clouds.
The impact of urban particles on ice formation in MPCs is well documented (e.g., Hasenkopf et al., 2016; Pereira et al., 2021; Chen et al., 2024). For example, Zhao et al. (2019) reported that the presence of urban aerosol particles affects the microphysical properties of clouds under moderate convective conditions, decreasing ice crystal number concentration (ICNC) and thus increasing the ice particle effective radius (Rei). Chen et al. (2024) found that urban super-micron traffic-influenced road dust and construction-related dust particles were the primary source of INPs (heat-resistant INPs) at temperatures below −15 °C in Beijing, China. Nevertheless, given that urban aerosol particles are a complex multicomponent mixture (i.e., biological, dust, black carbon, and biomass burning (BB) particles, among others), they may contain components with contrasting ice nucleation abilities. Although urban centers clearly experience high aerosol concentrations, INP concentrations in megacities do not necessarily increase during heavily polluted periods (e.g., Bi et al., 2019; Cabrera-Segoviano et al., 2022; Chen et al., 2024).
The role of urban particles emitted in the MCMA in ice-cloud formation has been previously evaluated (Knopf et al., 2010; Pereira et al., 2021; Rodríguez-Gómez, 2021; Cabrera-Segoviano et al., 2022; Melchum et al., 2023). The first ice nucleation study in the MCMA was conducted by Knopf et al. (2010) as part of the MILAGRO project. The authors reported that the particles in the northern part of the City are dominated by organics, and can efficiently act as INP under cirrus and MPC conditions, i.e., relative humidity with respect to ice (RHice) of and temperatures of 205–255 K.
Regarding MPC, Pereira et al. (2021) found that the ubiquitous anthropogenic emissions did not have a significant impact on the INP concentrations, with samples collected in rural and urban sites, both in the south of the MCMA. Cabrera-Segoviano et al. (2022) reported an inter-annual variability of INP concentrations (a one order of magnitude difference at temperatures higher than −20 °C) at southern MCMA between 2018 and 2019, a fact that can be related to the variability in aerosol emissions like re-suspended dust. Rodríguez-Gómez (2021) reported higher INP concentrations in the planetary boundary layer compared to the free troposphere on samples collected in southern MCMA during the BB season, similar to previous studies (Prenni et al., 2012; Jahn et al., 2020; Jahl et al., 2021). Finally, Melchum et al. (2023) evaluated the INP abilities of different airborne microrganisms from tropical places such as MCMA and other sites across Mexico. The authors found that out of the 64 tested microorganisms, only the Cupriavidus pauculus (proteobacteria) and the Phaeocystis sp. (marine phytoplankton) can be relevant to MPC formation (with onset freezing temperatures of −11.8 and −16.0 °C, respectively).
Although PM and INPs have been previously characterized in the MCMA, simultaneous INP measurements at more than one site have never been reported. Therefore, there is a poor understanding of how urban aerosol particles could influence cloud formation across the different MCMA's microclimates. To fill this gap in knowledge, the present study reports the simultaneous characterization (physical, chemical, and biological) of PM2.5 as well as the INP concentration in a northern and a southern site within the MCMA. To the best of our knowledge, this is the first time that such comprehensive evaluation of the aerosol-cloud interactions is performed in this megacity.
2.1 Sampling location
Mexico City is a tropical city located at 2240 m a.s.l. (meter above sea level) (Población, 2025), with a particular topography that influences the accumulation of air pollutants (Molina and Molina, 2004). With a sub-humid climate, the city presents an average annual temperature (between 1950 and 2013) of 15–18 °C (Behzadi et al., 2020). The MCMA experiences three different seasons such as cold-dry: October–February, warm-dry: March–May, and wet season: June–October. The mean annual precipitation within 1950–2013 for Mexico City was reported to vary between 357 and 1298 mm yr−1 (Jáuregui, 2000; Molina et al., 2009; Behzadi et al., 2020; Cabrera-Segoviano et al., 2022).
A short-term field campaign was carried out simultaneously at the north and south of the MCMA during the dry-warm season, i.e., between 12 and 20 May 2022. Both sampling sites are located within Mexico City (Fig. 1), and they are ∼16 km away from each other.
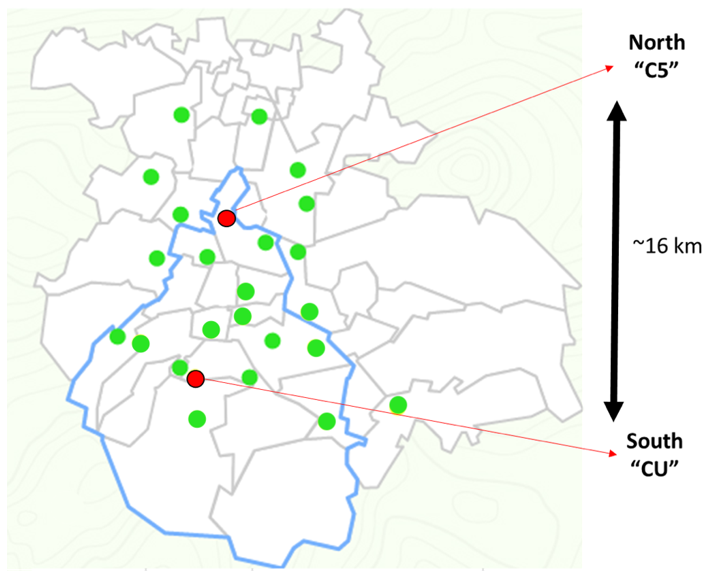
Figure 1Location of the MCMA showing Mexico City (blue contour) as well as northern and southern sampling sites (red circles). The green circles represent the Mexico City atmospheric monitoring stations. Modified from https://aire.cdmx.gob.mx/ (last access: 23 March 2026).
Sampling at the southern site (CU, 19.3262° N 99.1761° W) took place on the roof of the Institute for Atmospheric Sciences and Climate Change building (approx. 15 m a.g.l., meter above ground level), on the main campus of the Universidad Nacional Autónoma de México (UNAM). Traffic is the primary source of anthropogenic pollution at this site. However, an ecological reserve (237 ha) is located within the main UNAM campus, with the vegetation being dry and brown and susceptible to forest fires during the sampling period. It can provide biological material to the atmosphere through the native and introduced species of plants, animals, and microorganisms that live in it (Melchum et al., 2023).
On the other hand, the sampling at the northern site (C5, 19.483781° N 99.147312° W) took place on the roof of the Environmental Analysis Laboratory (C5) building (approx. 5 m a.g.l.) of the Mexico City Atmospheric Monitoring System (http://www.aire.cdmx.gob.mx/, last access: 23 March 2026). The C5 sampling site is subject to a wide range of anthropogenic sources, as it is located in the city's popularly known “industrial area.” Traffic, industrial, and other anthropogenic emissions contribute to high PM atmospheric concentrations at this sampling site (Castro Romero et al., 2024).
Meteorological (T, RH, wind direction, wind speed, solar radiation, and precipitation) and criteria pollutants (PM2.5, O3, CO, NOx, and SO2) data were recorded on both sites during the sampling campaign (Tables S1 and S2, and Figs. S1 and S2 in the Supplement). The campaign dates, total sampling times and volumes are shown in Table 1. The ionic composition and elemental composition were obtained using ion chromatography and X-ray fluorescence, respectively, on the 24 h collected samples. Culturable microorganisms were obtained through different microbiological analysis described in Sect. 2.2.5, on 5 min collected samples.
Table 1Sampling campaign description: dates, total sampling times, and sampling volume are shown for the three sampling methods: MiniVol (2.5 µm cut-off) for chemical analysis, MOUDI (0.56–10 µm cut-off, see Sect. 2.2.6) for INP analysis, and BioStage (10 µm cut-off) for biological analysis. Note that the sampling times were the same at both sites.
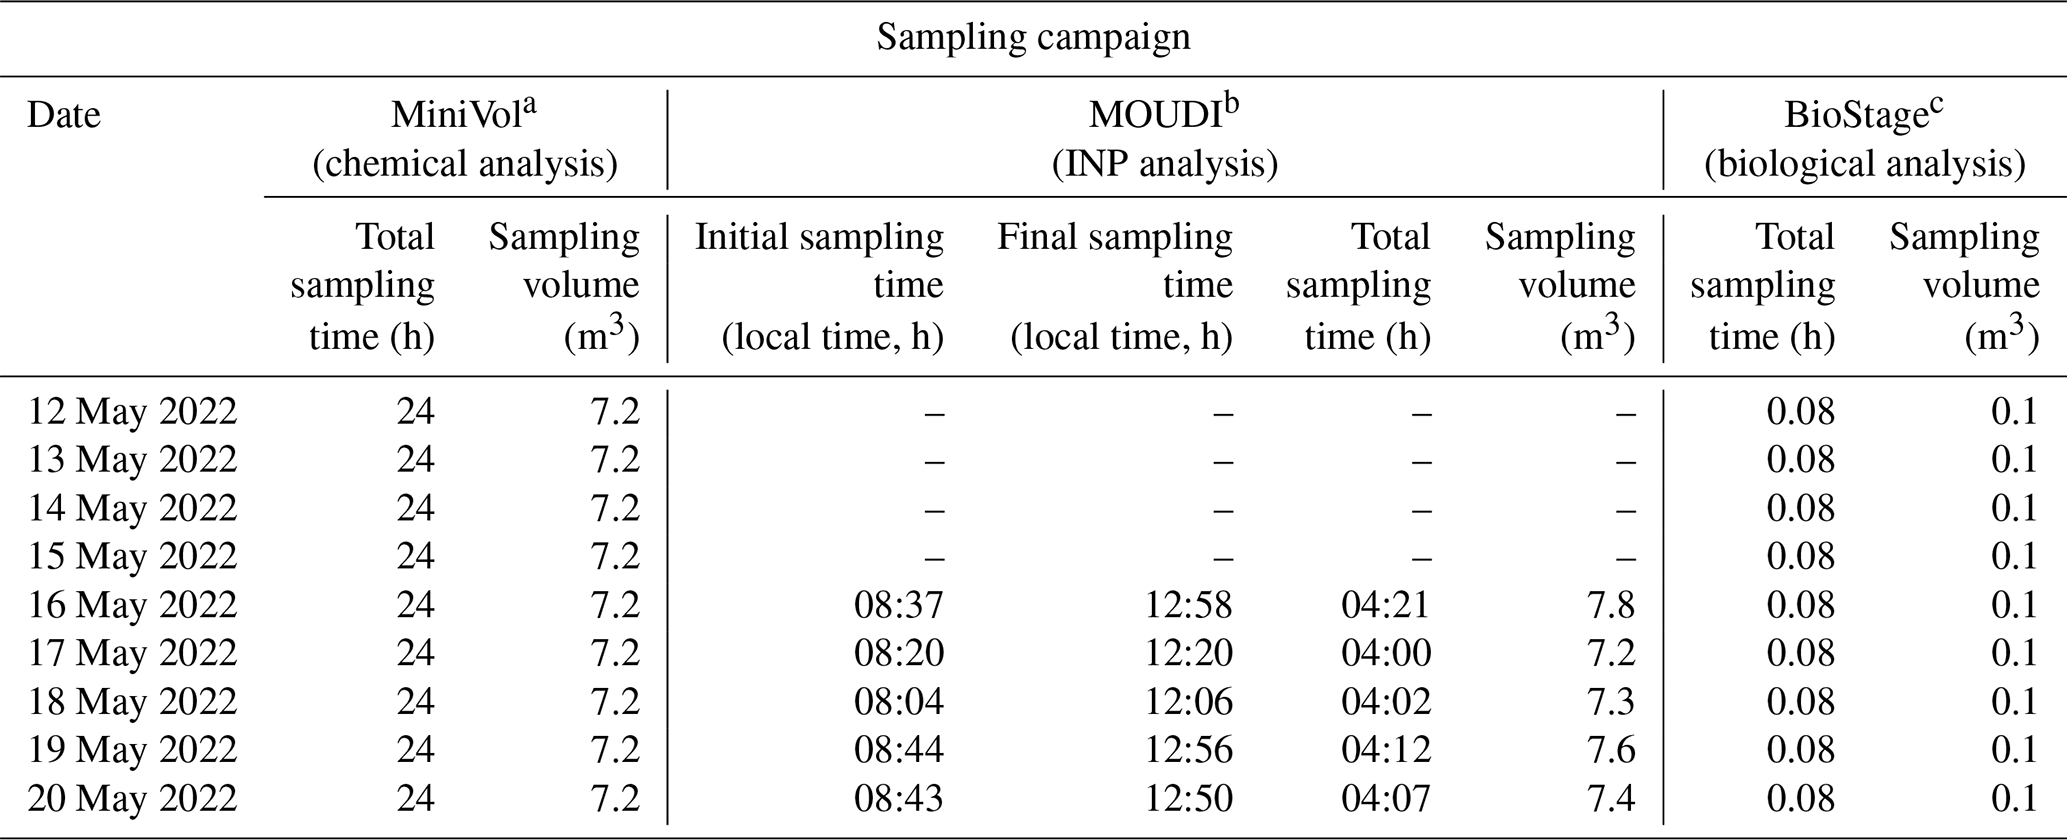
Flow rates: a 5 L min−1, b 30 L min−1, c 28.3 L min−1.
2.2 Sampling and instrumentation
The simultaneous sampling was performed using, per site, a MiniVol TAS (Tactical Air Sampler; Airmetrics) with a 2.5 µm cut-size inlet operated at 5 L min−1, an eight stage micro-orifice uniform deposit impactor (MOUDI 100R; MSP) operated at a 30 L min−1 flow rate to separate particles as a function of their aerodynamic diameter (cut sizes of 0.18, 0.32, 0.56, 1.0, 1.8, 3.2, 5.6 and 10 µm), and a single-stage BioStage Quick Take 30 cascade impactor for viable particles (SKC Inc. USA) operated at a 28.3 L min−1 flow rate. The MOUDI samples, used to evaluate the INP concentrations, were collected one time a day from 16–20 May 2022, with the sampling times shown in Table 1 (more details are provided in Sect. 2.2.6). The MiniVol samples were collected daily for 24 h on 12, 13, 16, 17, 18, 19 and 20 May 2022, on 47 mm Teflon filters (Pall Science), and were used for the ionic and elemental composition analysis. The BioStage impactor samples with a 10 µm cut-size inlet were used for culturable bacteria and fungi identification. They were collected once a day (at 10:00 a.m. for 5 min) on the same dates as the MiniVol samples (more details are described in Sect. 2.2.5). The general overview of the sampling campaign is shown in Table 1.
2.2.1 Meteorological data
Meteorological variables such as temperature, relative humidity, wind direction, wind speed, and solar radiation were obtained from the meteorological stations (Campbell Scientific) of the Red Universitaria de Observatorios Atmosféricos (RUOA) and the Programa de Estaciones Meteorológicas del Bachillerato Universitario (PEMBU) placed in CU and C5, respectively. Also, back trajectories of the air masses arriving in both sampling sites were obtained using the Hybrid Single-Particle Lagrangian Integrated Trajectory (HYSPLIT) model from the National Oceanic and Atmospheric Administration (NOAA) for 72 h at 250 m a.g.l. (Stein et al., 2015).
2.2.2 Criteria pollutants
The concentrations of O3, CO, NOx, and SO2, were measured with the Teledyne (Sandiego, CA) ultraviolet photometry API Model 400E non-dispersive infrared analyzer, API model 300E, and API model 200E, respectively. The PM2.5 was measured with a Thermo Scientific (Franklin, MA) tapered element oscillating microbalance (TEOM) Model 1400A ambient particulate monitor at a flow rate of 3 L min−1.
2.2.3 PM2.5 ionic composition
The ionic composition was obtained using a Dionex ICS-1500 ion chromatography (IC) at the Laboratorio de Aerosoles Atmosféricos of the Institute for Atmospheric Sciences and Climate Change, UNAM. For PM2.5 aerosol sample extraction, the MiniVol sample filters (i.e., 47 mm Teflon filters) were submerged in 10 mL of deionized water, sonicated for 1 h (using an ultrasonic bath at a temperature below 27 °C), and shaken at 350 rpm for 6 h (Sartorius CPA225D).
Anion analysis was performed using a Dionex IonPac AS23 column (4 mm×250 mm) and a carbonate solution (Na2CO3 4.5 mM – NaHCO3 0.8 mM) as the mobile phase at a flow rate of 1 mL min−1. Three anions (i.e., NO3−, , and Cl−) were measured using the described setup. Cation analysis was performed using a Dionex IonPac CS12A column (4 mm×250 mm) and a methanesulfonic acid (CH4O3S 20 mM) with a flow rate of 1 mL min−1 as a mobile phase. Five cations (i.e., Na+, K+, NH4+, and Ca2+) were measured using the described setup. The limits of quantification (LOQ) and determination (LOD) were calculated using the linear regression of standards calibration. More details about IC setup and similar methods can be found in Castro Romero et al. (2024).
2.2.4 PM2.5 X-ray fluorescence
The elemental composition analysis was performed at the Laboratorio de Aerosoles, Instituto de Física, UNAM following Espinosa et al. (2012). An X-ray fluorescence spectrometer with an Oxford Instruments (Scotts Valley, CA, USA) tube with Rh anode and an Amptek X-123SDD spectrometer (Bedford, MA, USA) was used to obtain the elemental composition of all MiniVol sample filters (i.e., 47 mm Teflon filters). The instrument was operated at 50 kV and a current of 750 µA, irradiating for 900 s per spectrum. More details of instrument calibration can be found at Espinosa et al. (2012). The chemical composition was quantified using the methodology reported by Espinosa et al. (2010). The percentage fraction for each element was determined by using the relationship between the analyzed element concentration and the total mass concentration.
2.2.5 Airborne culturable microorganisms' collection and identification
For the microorganism's identification (bacteria and fungi), petri dishes (100 mm×10 mm) with three different media were used to impact and collect particles of 10 µm or less in size, and grow the microorganisms using the BioStage impactor: trypto-casein soy agar (TSA, BD, Bioxon) supplemented with 100 mg L−1 of cycloheximide (Sigma-Aldrich) (to prevent growth fungal propagules) for mesophilic cultivable bacteria (MCB), Reasoner's 2A (R2A, Condalab) for slow-growing species of MCB, and malt extract agar (MEA, BD Bioxon) for cultivable fungal propagules. The sampling time on the BioStage impactor was set to 5 min.
The concentrations of cultivable bacteria were reported as Colony Forming Units per m3 of air (CFU m−3). The following procedure was applied as described in Melchum et al. (2023). The TSA, R2A, and MEA were cultured at 35, 35, and 25 °C, respectively. After 48 h (for TSA bacteria) and 72 h (for R2A bacteria and fungi), the CFU were quantified, and the Petri dishes were sealed with parafilm and stored at 4 °C for further analysis. Representative bacterial colonies were randomly selected and purified by several reseedings in TSA. Gram staining was performed to classify the bacteria as Gram-positive or Gram-negative by microscopic observation (100×) of the preparations. Isolated bacteria confirmation of identity was performed by mass spectroscopy, using the Microflex MALDI-TOF MS® (Bruker Daltonics, Bremen, Germany). The identification of fungal species was carried out at the genus level using taxonomic keys based on macroscopic colony characteristics and spore microscopic examination (60×) (Rodriguez-Gomez et al., 2020; Melchum et al., 2023).
2.2.6 Ice nucleation experiments
The INP concentration of the collected aerosol particles were obtained using a UNAM-Micro-orifice Uniform Deposit Impactor-Droplet Freezing Technique (UNAM-MOUDI-DFT), described in Córdoba et al. (2021) with its main features shown in Fig. S3 in the Supplement.
Aerosol particles were collected on hydrophobic glass coverslips as substrates at 0.56, 1.0, 1.8, 3.2, 5.6 and 10 µm cut-offs MOUDI stages (flow rate of 30.0 L min−1). After sampling, every substrate was stored in sealed, sterilized Petri dishes at 4 °C until its analysis.
Each glass coverslip was analyzed using the UNAM-MOUDI-DFT to simulate the immersion freezing mode between 0 and −40 °C. For the INP experiments, the glass coverslips were placed on a sample holder inside the cold cell with the sample holder at the top of two blocks for a sample temperature control: a heating block (copper-made block with two heating resistances, 100 W and 120 V) and a cooling block (cooled by refrigerator circulator, PRO-RP1090, LAUDA), with the cold block at the bottom. To induce droplet formation, humid air, carried by nitrogen (grade 4.8, INFRA), is directed toward the sample holder at 0 °C. Once approx. 30–40 droplets of ca. 170 µm radius are formed, a dry airstream is introduced into the cold cell to shrink the droplets, aiming to minimize contact between them. Finally, the cold cell was isolated, and a temperature ramp from 0 to −40 °C (at a cooling rate of 10 °C min−1) was run until the freezing of each drop was observed. The entire process was recorded with a video camera (MC500W, JVLAB) attached to an optical microscope (Axiolab Zeiss, Germany) with a magnification objective, the microscope objective being coupled to the sample holder via a glass coverslip at the top of the cold cell.
From the recorded video, it is possible to determine the freezing temperature for each droplet, which allows calculation of the frozen fraction (Fice) and the INP number concentration as a function of temperature ([INP(T)]). Fice was calculated using Eq. (1):
where Nice and Ndroplets are the number of frozen droplets (dimensionless) and the number of unfrozen droplets (dimensionless), respectively (Kanji et al., 2017).
The [INP(T)] was calculated using Eq. (2) (Mason et al., 2015; Córdoba et al., 2021):
where Nu(T) is the number of unfrozen droplets at T (°C), N0 is the total number of droplets (dimensionless), Adeposit is the total area of the aerosol particles deposited on the hydrophobic glass coverslip (cm2), ADFT is the area of the sample analyzed by the DFT (cm2), V is the volume of air through the MOUDI (L), fne is a correction factor to account for the uncertainty associated with the number of nucleation events in each experiment (dimensionless), and fnu is a correction factor to account for changes in particle concentration across each MOUDI sample (dimensionless). Additionally, this equation accounts for the possibility that multiple particles may be present within a droplet (Vali, 1996), the correction for the total area covered by particles deposited on the MOUDI coverslips, and corrections for inhomogeneities in particle deposition. More details of Eq. (2) and the applied corrections can be found in Mason et al. (2015).
2.2.7 Data analysis
The STATISTICA® 12 software (StatSoft, TIBCO Software Inc., USA) was employed to evaluate basic statistics and cluster analysis of data from the different analysis described in Sect. 2.2. With the main objective of identifying associations among chemical species and their possible sources, a cluster analysis using Ward's method of amalgamation and Pearson correlation coefficients was carried out to construct dendrograms for both sampling sites.
3.1 Frozen fraction and INP concentration variability
Following the procedure described in Sect. 2.2.6, the frozen fraction and the INP concentrations were obtained for each sample from 16–20 May. Figure S4 in the Supplement shows the frozen fraction (FF) as a function of particle size (aerodynamic diameters of 0.56–10 µm) for the northern and the southern sampling sites. This size range was selected considering that super-micron particles contribute more than 70 % to the total INP population (e.g., Mason et al., 2016; Córdoba et al., 2021). Aerosol particles collected in the present study were able to nucleate ice at temperatures warmer than those required to freeze supercooled liquid drops (i.e., homogeneous freezing, black line). The homogeneous freezing line was determined using the same procedure described in Sect. 2.2.6 with a brand-new substrate (i.e., without aerosol particles impacted on them). The FF curve of the homogeneous freezing experiments is comparable with other data for supercooled liquid drops such as the 100 µm and 89±7 µm liquid water drops reported by Shardt et al. (2022) and Tarn et al. (2021), respectively.
The total INP concentrations (i.e., the accumulated INP concentration, represented by the sum of each MOUDI stage INP concentration for each sample) at both sites are shown in Fig. 2. Although the INP concentrations measured at both sites were comparable, the exemption was the 20 May sample (Fig. 2a), where higher and statistically significant differences in INP concentrations were measured in the southern site between −19 and −22 °C (considering the Agresti and Coull (1998) method to calculate 95 % confidence intervals). Figure 2b also indicates that the INP concentrations from the present study agree well with those reported by Cabrera-Segoviano et al. (2022) for Mexico City and by Chen et al. (2024) for Beijing (between −19 and −22 °C), a polluted megacity such as the MCMA.
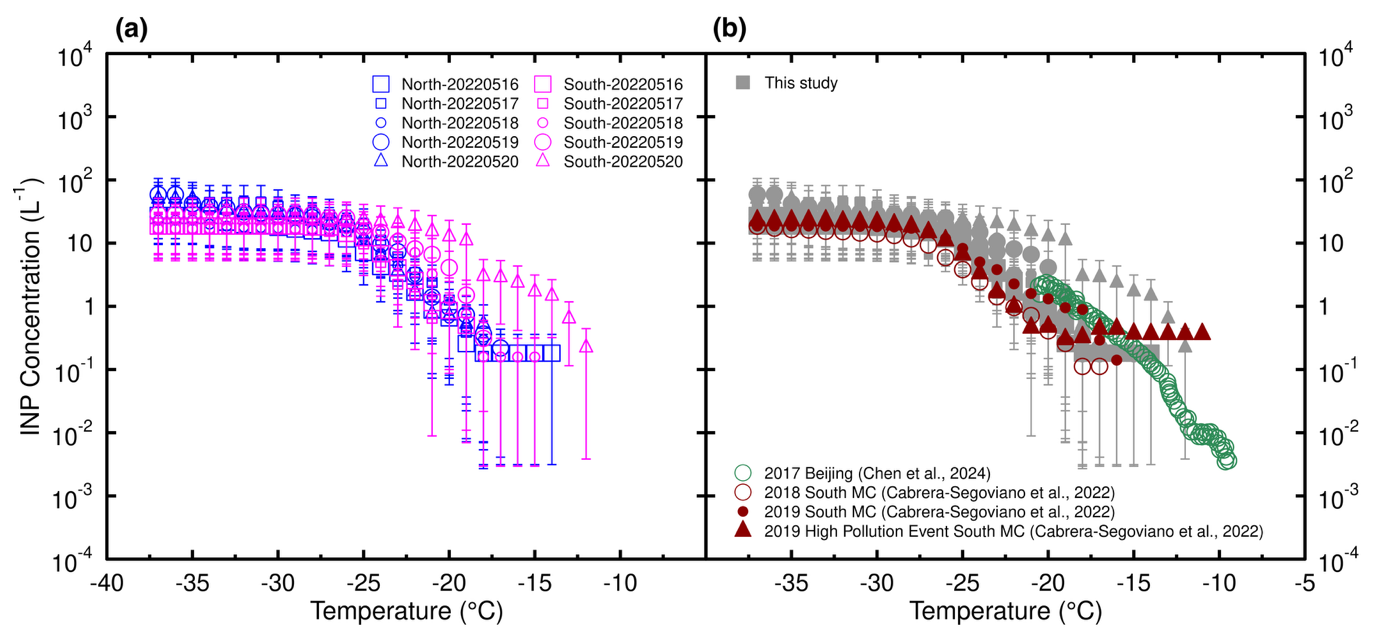
Figure 2INP concentration as a function of temperature for (a) the measurements performed between 16 and 20 May 2022 at the northern and southern site of the MCMA, and (b) literature measurements for the MCMA (2018 and 2019), and Beijing (2017) reported by Cabrera-Segoviano et al. (2022) and Chen et al. (2024), respectively. The dark red triangles in panel (b) represent the INP concentration values reported for a 2019 High Pollution Event at South MC (Cabrera-Segoviano et al., 2022). The error bars represent the carried experimental uncertainty calculated using the method described in Mason et al. (2015).
The impact of particle size on the frozen fraction at both sampling sites does not show a clear trend (Fig. S4). Likewise, Fig. 3 shows that the mean INP concentration (which represents the average of all samples for each MOUDI stage) measured on urban particles from the MCMA is not clearly size-dependent. In theory, particle size and INP efficiency are related. This relationship is attributed to surface active sites, as larger particles contain a higher concentration of active sites (Vali, 1996; Hoose and Möhler, 2012; Kanji et al., 2017); however, as urban ambient samples are a complex mixture of particles with different compositions, the relationship between particle size and INP is not straighforward as it requires deeper chemical analysis to undertand the heterogeinity in particles chemical compostion on each MOUDI stage.
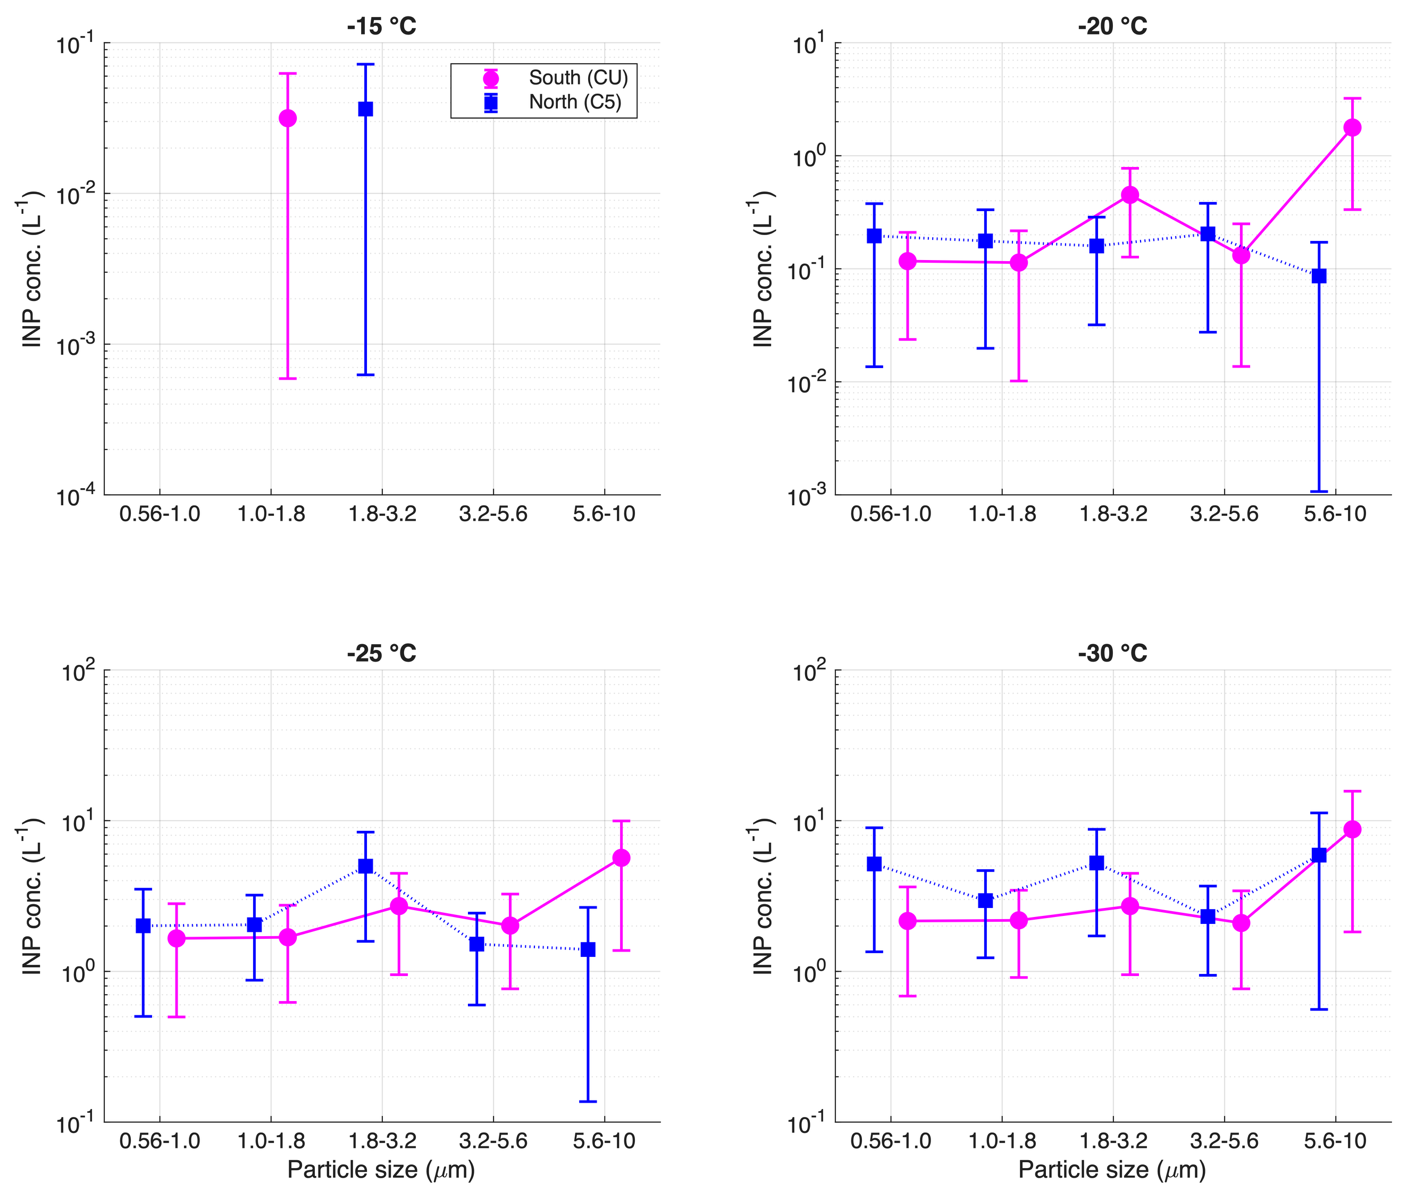
Figure 3INP average concentration as a function of particle size at −15, −20, −25, and −30 °C, for southern (CU, magenta) and northern (C5, blue) MCMA. The error bars represent the carried experimental uncertainty calculated using the method described by Mason et al. (2015).
Even though the particle size did not show a trend, a clear difference is observed at larger particle sizes (i.e., particles between 5.6–10 µm) between the two sampling sites. This shows that the contribution from larger particles to the INP concentrations was found to be greater in the south of the MCMA. Although there is no chemical composition information available for these large particles, we encourage future studies to help understating the importance of PM10 particles.
3.2 Ice nucleation activity vs. criteria pollutants
Time series of five criteria pollutant concentrations at both sites are shown in Fig. S2. PM2.5 concentration was found to be comparable at both sites, with a slight increase along the last part of the campaign. The maximum difference in PM2.5 concentration between both sites was 6.60 µg m−3. Although high hourly values of PM2.5 were measured (in the order of ), they cannot be considered as high pollution episodes as was the case described in Cabrera-Segoviano et al. (2022) where PM2.5 concentrations above 80 µg m−3 were measured (Carabali et al., 2021). Similar to previous studies performed within the MCMA, CO, SO2, and NOx concentrations were higher at the northern site, with 0.6 ppm, 14 and 60 ppm maximum difference between the northern and southern sites for CO, SO2, and NOx, respectively (Fig. S2). This behavior is related to local emissions, such as gasoline-fueled vehicular emissions and industrial activity (Vega et al., 2004; Castro Romero et al., 2024).
O3 concentrations were higher at the southern site (i.e., a 30 ppm maximum difference between both sites). Local emissions from vegetation cover prevalent in southern MCMA, such as volatile organic compounds (VOCs), together with local NOx emissions and transport can explain the O3 behavior. It is well known that VOCs may participate in O3 production by photochemistry and lead to higher concentrations (Pinto et al., 2010; Amador-Muñoz et al., 2016). Therefore, the southern site is likely enriched in biogenic secondary organic aerosols (SOA) compared to the northern site (Aiken et al., 2009; Cooke et al., 2024), with unknown implications in the INP population.
The INP concentrations shown in Fig. 2 were comparable at colder temperatures, with a slightly higher concentration at the southern site observed on the last sampling day at warm temperatures. Given that a slight increase in PM2.5 concentration was also observed on 20 May at the southern site (Fig. S2), there may be a small relationship between INP concentration at warm temperatures and PM2.5. Figure 4 shows the calculated Pearson correlation coefficients between the measured criteria pollutants and INP concentration at −20, −25, and −30 °C for both sampling sites (for particles ranging between 0.56 and 3.2 µm). Mean criteria pollutant concentrations between 08:00 h and 13:00 h local time were used to match the INP sampling periods. Figure 4 shows high correlations between PM2.5, O3, and the INP parameters at the southern site, implying that both pollutants can impact the physicochemical properties of the INP population at this site. On the other hand, no significant correlations were found at the northern site. As the INP sizes in both sites are identical, the observed differences are likely linked with differences in the PM2.5 composition. As shown in Figs. 5 and S5 in the Supplement, the PM2.5 elemental and ionic composition in the northern and southern sites have important differences. As the composition is clearly different, the interaction between fine particles, and hence INPs, with O3 is expected to differ in both sites as well. As the PM2.5 sampling time was much larger (24 h) than the 4 h INP sampling, a direct correlation between the elemental and ionic composition with the INP concentrations was not assessed.
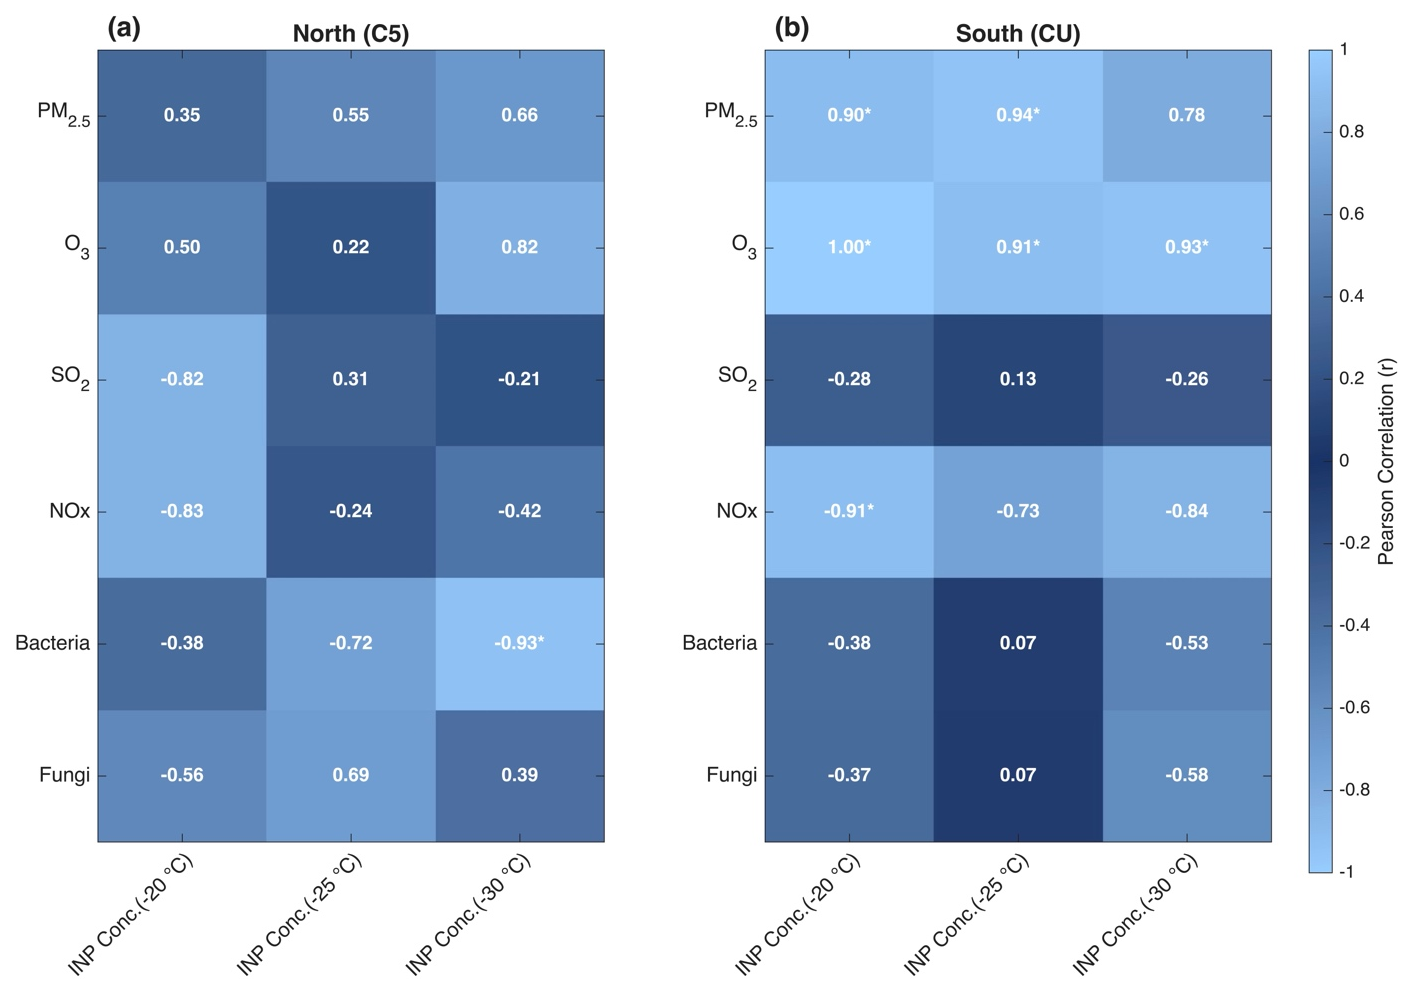
Figure 4Heat map with the Pearson correlation coefficients (r) for the relationships between the INP parameters (i.e., INP concentrations at −20, −25 and −30 °C) and the ambient criteria pollutants concentrations (i.e., PM2.5, O3, NOx, and SO2) for (a) northern (C5) site and (b) southern (CU) site of the MCMA. Correlation analysis between CO and INP parameters was excluded due to the unavailability of CO data for most INP sampling days. The statistically significant coefficients (with 95 % confidence level) are marked with an asterisk.
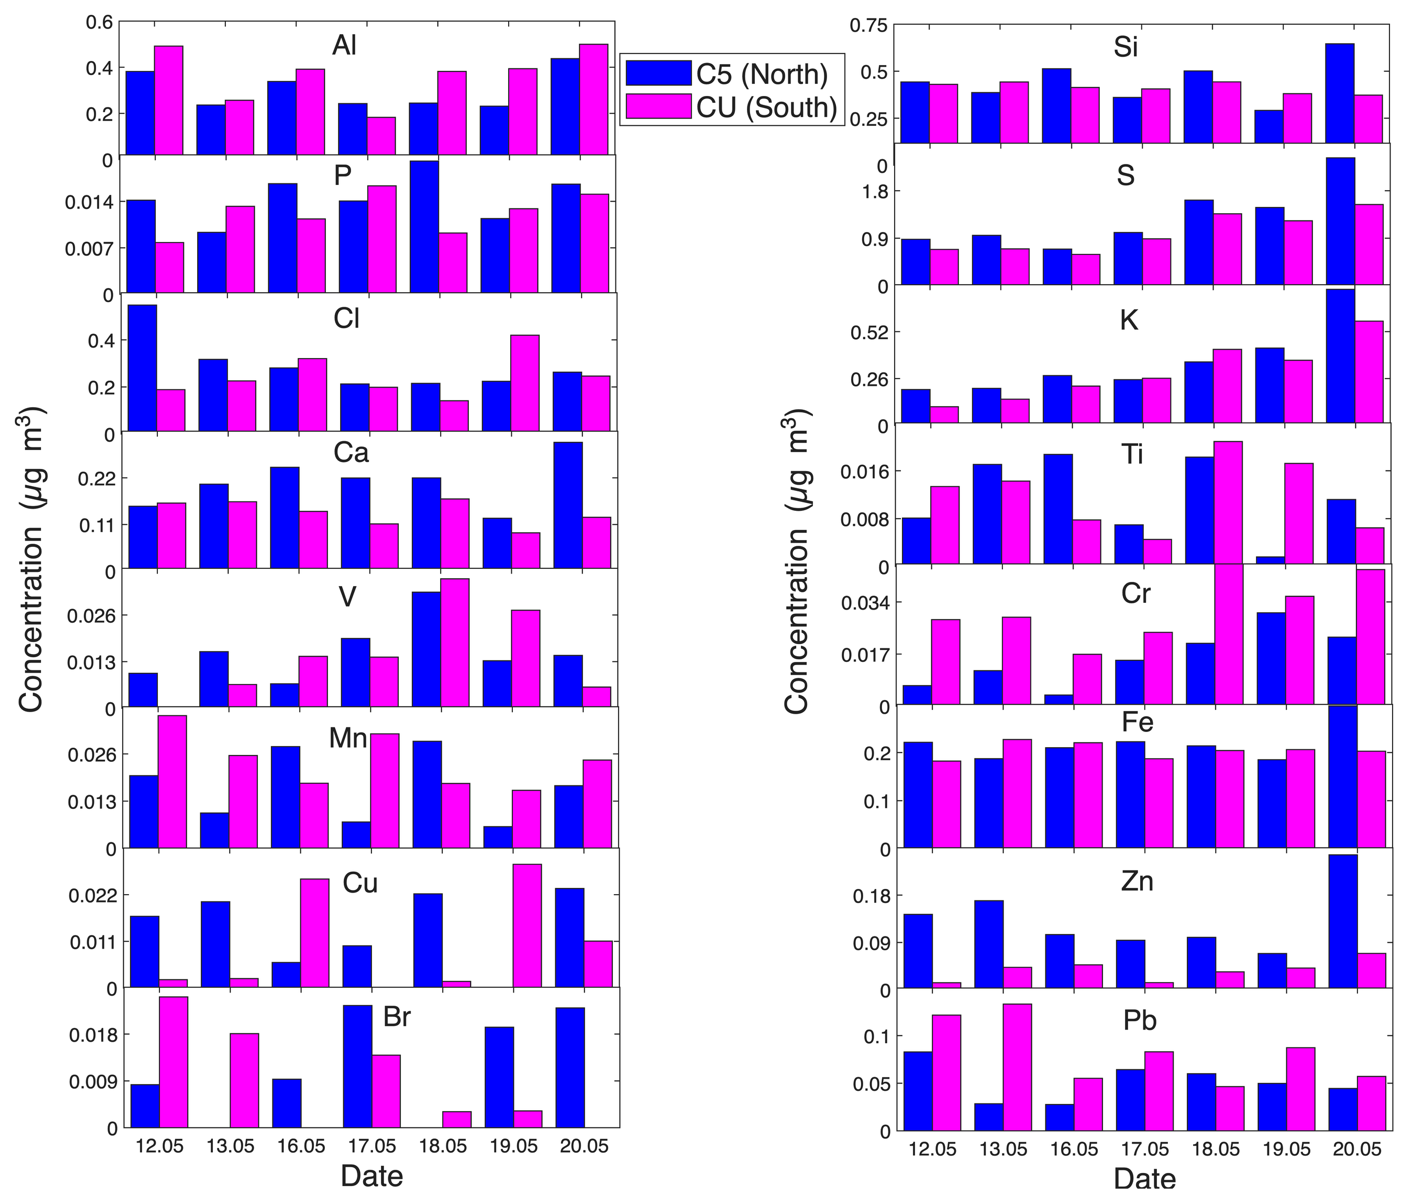
Figure 5Concentration of the different individual elements analyzed by XRF on PM2.5 at the northern (C5, blue) and southern (CU, magenta) sites.
This suggest that different sources of particles could be present at both MCMA sites, but no correlation was found that anthropogenic pollution could modify INP concentration. The relationship between PM2.5 and INP concentrations has been previously evaluated (Chen et al., 2018; Bi et al., 2019; Córdoba et al., 2021; Cabrera-Segoviano et al., 2022), with highly contrasting results, but showing that urban particle concentrations alone do not affect INP concentration.
The analysis of the elemental composition indicates that the concentration of 12 of the 16 analyzed elements (i.e., Si, P, S, Cl, K, Ca, Ti, V, Fe, Cu, Zn, and Br) was higher at the northern site as shown in Fig. 5. The maximum measured concentrations were reported for Al and Si, an indication of the presence of aluminum silicates from resuspended dust, as previously reported (Querol et al., 2019; Córdoba et al., 2021). Pb was present at both sampling sites with a maximum concentration of 0.13 and 0.08 µg m−3 for CU and C5, respectively. The Pb sources are typically linked with local industrial activities and the usage of low quality fuels (Moreno et al., 2008; Hernández-López et al., 2020). The World Health Organization (WHO) recommends an annual average airborne Pb concentration of 0.5 µg m−3 as part of its Global Air Quality Guidelines; therefore, the values reported in this work did not exceed this limit.
The maximum S concentration (i.e., 2.42 µg m−3) observed in C5 is lower than the values reported in previous studies (3.24 µg m−3, Castro et al., 2024; 3.38 µg m−3, IMADA, 1997; 5.10 µg m−3, Vega et al., 2004), likely related to differences in the sampling month, but higher than the highest S concentration reported in CU (i.e., 1.54 µg m−3). S and K are markers of high-pollution events in megacities, typically linked with industrial activity, gasoline combustion, and BB emissions (Ríos and Raga, 2018; Raga et al., 2021). In this study, a rise in S and K concentrations during the last sampling day (i.e., 20 May) is clearly observed (Figs. 5 and S5) and could be attributed to local and regional BB.
To further explore the chemical composition of urban aerosol particles at both sampling sites, the ion composition was analyzed. Figure S5 reinforces the significant differences in the urban particles' chemical composition between the two microclimates. The five analyzed cations (Na+, K+, Ca2+, , and Mg2+) and the three analyzed anions (Cl−, NO3, and ) showed higher concentrations at the northern site. The relationships among , , and at both sampling sites are shown in Tables S3 and S4. The strong observed correlation suggests the presence of (NH4)2SO4 and NH4NO3 at both sites, two compounds produced by photochemical reactions driven by gasoline and diesel emissions (Vega et al., 2004; Hernández-López et al., 2020; Castro Romero et al., 2024).
Figure S6 in the Supplement shows that the HYSPLIT backward trajectories at 250 m a.g.l. at both MCMA sites overlaid on the NASA FIRMS real-time active fire locations for the sampling period (i.e., 12–20 May 2022). Even though not all backward trajectories pass through active fires, the overlap between some back-trajectories and active fires suggests that the local and regional transport of BB particles could contribute to the observed differences in the chemical composition, as shown elsewhere (e.g., Carabali et al., 2021). Additionally, Fig. S6 shows that air-masses in both sampling sites came from very similar directions during the sampling period, so particle transport between two sites cannot be neglected at all.
To evaluate potential sources of the measured urban aerosol particles, a cluster analysis was applied using all the chemical species to generate a dendrogram for each sampling site. Hierarchical clustering was conducted using Ward's method, with Pearson correlation coefficients employed as the similarity measure. This technique groups variables by minimizing increases in within-cluster variance, leading to clusters of species with similar temporal patterns. The resulting dendrogram illustrates the level of similarity among variables, where shorter linkage distances represent stronger relationships. Principal cluster components can be linked to a potential source as shown in previous literature analysis of similar samples (Reynoso-Cruces et al., 2023). The dendrogram for the southern site (Fig. S7 in the Supplement) presents three groups: the orange cluster with anthropogenic oxidized and non-oxidized species and a contribution of BB regional emissions; the green cluster with geogenic oxidized and non-oxidized species; and the brown cluster with resuspended soil originated from rural areas with geogenic species and some anthropogenic contributions. Likewise, the dendrogram for the northern site (Fig. S8 in the Supplement) also shows three groups: the orange cluster, which corresponds to anthropogenic oxidized and non-oxidized species; the blue cluster, containing mostly anthropogenic oxidized species from fossil fuels; and the brown cluster with oxidized and non-oxidized resuspended soils. This cluster analysis highlights the effects of land use and BB on the chemical composition of the urban particles across these two microclimates of the MCMA and denotes sample complexity.
3.3 Ice nucleation activity vs. culturable microorganisms
To assess the presence of biological particles at both sampling sites, the concentrations of culturable bacteria and fungi were measured in parallel to the INPs. Significant daily variations in bacteria and fungi concentrations at both sampling sites were observed, as shown in Fig. 6. The measured CFU m−3 follow the same pattern at both sites, an inverse pattern with PM2.5 concentration. The average concentrations of bacteria and fungi at the northern site were 2774 and 433 CFU m−3, respectively; at the southern site, the average concentrations of bacteria and fungi were 3882 and 509 CFU m−3, respectively. The average bacteria concentrations reported in this study are higher than those reported for Yucatán, México (i.e., 69 CFU m−3) (Rodriguez-Gomez et al., 2020), Tijuana, México (i.e., 340 CFU m−3) (Hurtado et al., 2014), northwestern Amazon, Colombia (i.e., 228 CFU m−3) (Russy-Velandia et al., 2025), and Qingdao, China (i.e., 83 CFU m−3) (Li et al., 2011). In contrast, the average fungi concentrations reported in this work are lower than those reported for Yucatán, México (i.e., 1018 CFU m−3) (Rodriguez-Gómez et al., 2020), and are consistent with the results reported for northwestern Amazon, Colombia (i.e., 642 CFU m−3) (Russy-Velandia et al., 2025) and Qingdao, China (i.e., ) (Li et al., 2011). Consistent with the aforementioned studies, the Gram staining analysis indicated that 57 % of the culturable bacteria were Gram-positive
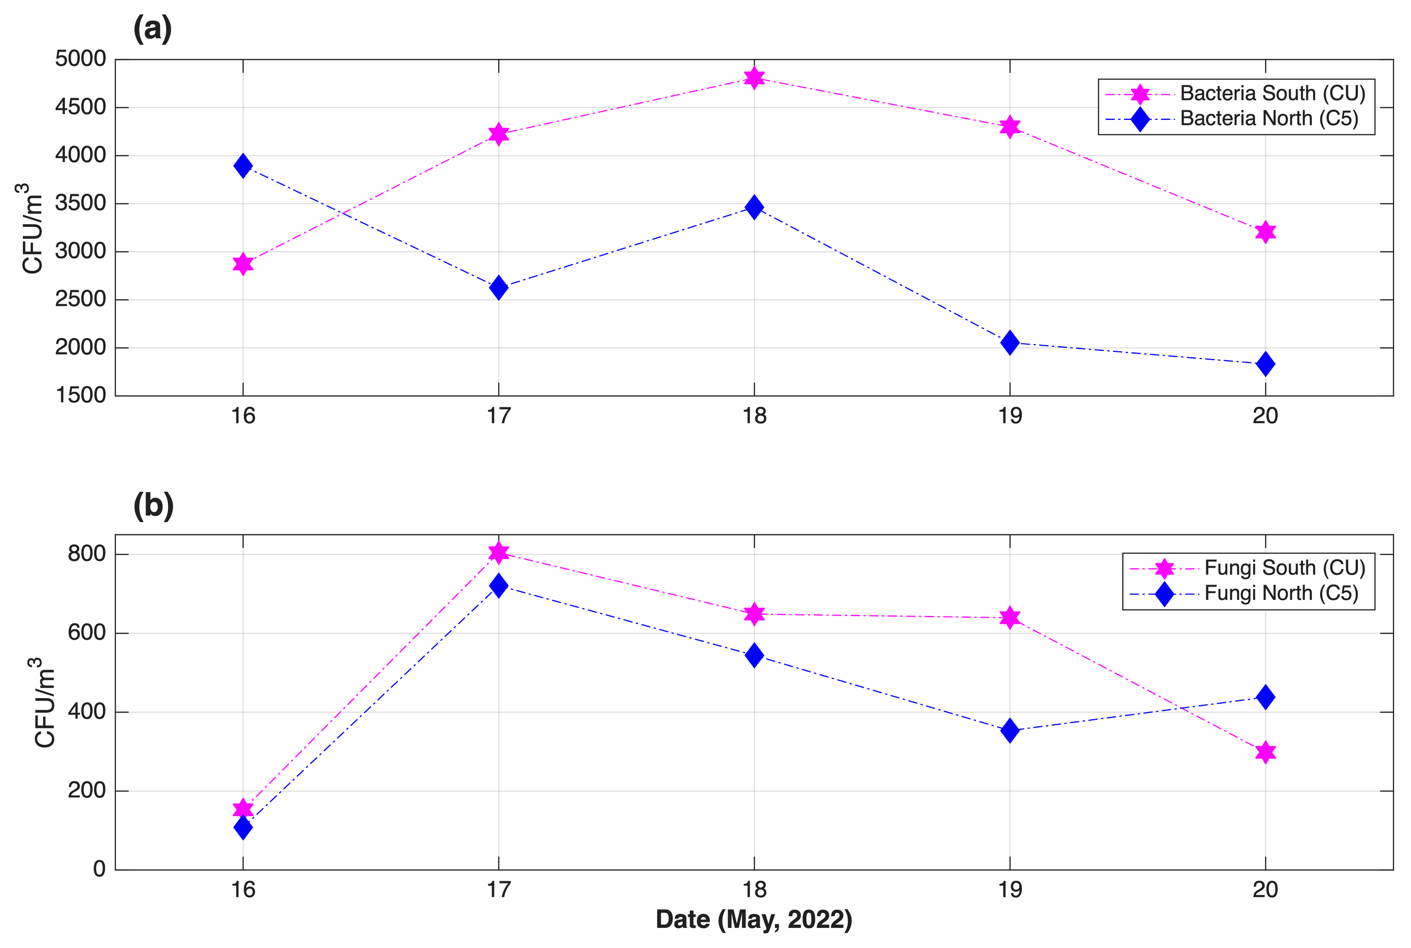
Figure 6Time series of the concentration (CFU m−3) of total mesophilic (a) bacteria and (b) fungi measured in the northern (C5, blue) and southern (CU, magenta) sites.
A total of 21 bacterial species and eight fungal genera were identified between both sampling sites (Tables S5 and S6 in the Supplement). Although bioparticles were clearly present at both sites, it is doubtful that they played a key role in the ice nucleating abilities of the collected urban particles. The FF reported in this work differ significantly with those reported for bioaerosols, typically showing activation close to −10 °C (Hoose et al., 2010; Knopf et al., 2011; Wex et al., 2015; Kunert et al., 2019). It is still possible that INP contributed by bioparticles are below the detection limit of our setup because of sampling methods (i.e., differences in cut-off and total sampling time). However, an overview of INP concentrations observed in the atmosphere by Petters and Wright, (2015) indicates that our detection limit of 0.1 L−1 is high enough to enable the detection of biological particles if they were present. Although the northern site showed relative higher, but not significant, correlations between microorganisms' concentration and INP concentrations (Fig. 4), all INP analysis indicate that the identified culturable microorganisms did not play a primary role in the measured INP concentration of the MCMA samples. Moreover, the sampling season (dry vegetation season) may be governing the relationship between biological particles and INP concentration reported here, making it necessary to assess INP concentrations at different times of year (i.e., across meteorological seasons).
Although some of the identified bacteria and fungi genera and species have been reported to act as INPs at warm temperatures (Tables S5 and S6), it is completely unknown if the MCMA microorganisms contained the INA protein. Melchum et al. (2023) showed that among the 64 analyzed species, the most efficient INP was the Cupriavidus pauculus bacteria, with an onset freezing temperature of −11.8 °C. Therefore, as demonstrated by Melchum et al. (2023) and previously by Schnell and Vali (1976), tropical biological particles appear to be inefficient INPs. The behavior of bacterial and fungal concentration between the northern and southern sites were evaluated by the Pearson correlation analysis shown in Tables S7 and S8 in the Supplement. As expected, mixed values of Pearson coefficients reflect that not all bacteria and fungi found at the southern site (closed to vegetated areas) are present in the northern site.
This work evaluated, for the first time, simultaneous measurements of INP concentration at two sites within one of the largest megacities worldwide. Aerosol particles sampled in the southern and northern parts of the MCMA acted as INPs, via immersion freezing. The average INP concentrations varied between (0.04±0.04) and at temperatures between −15 and −30 °C. The measured INP concentrations agree with those from previous studies conducted in Mexico City (Mexico) and Beijing (China), showing that INP concentrations are not affected by anthropogenic emissions but are indeed influenced by soil use and other local sources. Although earlier studies have shown that particle size plays a role in the INP concentration of Arctic, urban, marine, biomass burning, and mineral dust particles (e.g., Mason et al., 2016; Córdoba et al., 2021), the present results showed that the INP concentration of complex urban particles from the MCMA are not strongly size-dependent (see Figs. S4 and 3).
The present results clearly demonstrated the existence of microclimates within the MCMA. The INP parameters of the MCMA urban particles correlated with PM2.5 and O3, at the southern site, corroborating that particle mass concentration and ozone concentration are very important for the southern MCMA microclimate. Nevertheless, urban aerosol particles show similar INP concentrations across both sites, suggesting that INP activity does not depend on a specific aerosol type, but rather on the bulk complex mixture of aerosol particles or on the dominance of long-range-transported INPs, with no or only a few additional urban sources. Local emissions and the regional transport of different particles (e.g., BB, biogenic SOA, anthropogenic SOA, mineral dust particles, and bioaerosol), are highlighted as the primary sources of urban aerosol particles along the MCMA. These results are consistent with previous studies in the MCMA that have mostly focused on aerosol chemical composition (Molina et al., 2010; Amador-Muñoz et al., 2011; Ladino et al., 2018).
Although the distance between both sampling sites is just 16 km, aerosol sources and atmospheric processes linked to particle formation and aerosol aging (e.g., gas-to-particle conversion, organic coatings, and photochemistry) are quite different. This implies key local implications in particle characteristics (i.e., chemical composition, particle morphology, and particle size) that could impact the INP concentration. The present study demonstrates that a larger contribution of unknown large urban aerosol particles (i.e., particles between 5.6–10 µm) could be important for heterogeneous MPC formation at the southern MCMA site, as evidenced by the rise in INP concentration at −20 °C (see Figs. 2 and 3). Therefore, if we aim to improve the current understanding of aerosol-cloud interactions above this megacity, it is crucial to consider the different microclimates to avoid assuming that aerosol physicochemical and biological characteristics within the megacity are homogeneous. Thus, differences in the local anthropogenic activities, biogenic emissions, population density, and land use are key drivers that must be considered.
Although the present work shows that air pollutants such as PM2.5 and ozone can be linked with the ice nucleating abilities of urban aerosol particles, it is important to understand the role and the origin of the super-micron particles as they are a large contributor to the MCMA INP population.
The dataset is available for download at https://doi.org/10.5281/zenodo.17872149 (Mendoza-Téllez et al., 2026).
The supplement related to this article is available online at https://doi.org/10.5194/acp-26-8295-2026-supplement.
KV, DR, JAC, FC, and LAL performed the field measurements. KV, DR, JAC, FC, SM-T, and LAL analyzed the data. GBR and LAL designed the field campaigns and were responsible for funding acquisition. KV, SM-T, and EN conducted the INP analysis. OR-H supported the field campaigns and data acquisition. HA conducted the ionic composition analysis. JM conducted the X-ray fluorescence chemical analysis. JAC, IR, LM, and ES conducted the microorganism's identification analysis. SM-T and LAL wrote the paper, addressed the reviews and editing, with contributions from all coauthors.
At least one of the (co-)authors is a member of the editorial board of Atmospheric Chemistry and Physics. The peer-review process was guided by an independent editor, and the authors also have no other competing interests to declare.
Publisher's note: Copernicus Publications remains neutral with regard to jurisdictional claims made in the text, published maps, institutional affiliations, or any other geographical representation in this paper. The authors bear the ultimate responsibility for providing appropriate place names. Views expressed in the text are those of the authors and do not necessarily reflect the views of the publisher.
The authors thank Alison Ruiz, Maria Isabel Saavedra, Juan Carlos Pineda, and Manuel García for their invaluable help. We thank Miguel Sanchez from the Mexico City Atmospheric Monitoring System for sharing the criteria pollutants data and for his support in using their infrastructure. We also thank the RUOA and PEMBU for sharing their meteorological data. Finally, we thank the NOAA for facilitating the use of the surface maps and HYSPLIT and Sebastian Mendoza-Téllez thanks SECIHTI for his PhD fellowship.
This research has been supported by the Secretaría de Ciencia, Humanidades, Tecnología e Innovación (grant no. 1024827), the Marcos Moshinsky Foundation, and the Comisión Ambiental de la Megalópolis (CaME): Ensamble para alerta temprana de episodios y pronóstico de calidad del aire.
This paper was edited by Ari Laaksonen and reviewed by two anonymous referees.
Agresti, A. and Coull, B. A.: Approximate is Better than “Exact” for Interval Estimation of Binomial Proportions, Am. Stat., 52, 119–126, https://doi.org/10.1080/00031305.1998.10480550, 1998.
Aiken, A. C., Salcedo, D., Cubison, M. J., Huffman, J. A., DeCarlo, P. F., Ulbrich, I. M., Docherty, K. S., Sueper, D., Kimmel, J. R., Worsnop, D. R., Trimborn, A., Northway, M., Stone, E. A., Schauer, J. J., Volkamer, R. M., Fortner, E., de Foy, B., Wang, J., Laskin, A., Shutthanandan, V., Zheng, J., Zhang, R., Gaffney, J., Marley, N. A., Paredes-Miranda, G., Arnott, W. P., Molina, L. T., Sosa, G., and Jimenez, J. L.: Mexico City aerosol analysis during MILAGRO using high resolution aerosol mass spectrometry at the urban supersite (T0) – Part 1: Fine particle composition and organic source apportionment, Atmos. Chem. Phys., 9, 6633–6653, https://doi.org/10.5194/acp-9-6633-2009, 2009.
Aldape, F., Flores, M. J., Diaz, R. V., Morales, J. R., Cahill, T. A., and Saravia, L.: Seasonal study of the composition of atmospheric aerosols in Mexico City, Int. J. PIXE, 01, 355–371, https://doi.org/10.1142/S012908359100024X, 1991.
Amador-Muñoz, O., Villalobos-Pietrini, R., Miranda, J., and Vera-Avila, L. E.: Organic compounds of PM2.5 in Mexico Valley: Spatial and temporal patterns, behavior and sources, Sci. Total Environ., 409, 1453–1465, https://doi.org/10.1016/j.scitotenv.2010.11.026, 2011.
Amador-Muñoz, O., Bazán-Torija, S., Villa-Ferreira, S. A., Villalobos-Pietrini, R., Bravo-Cabrera, J. L., Munive-Colín, Z., Hernández-Mena, L., Saldarriaga-Noreña, H., and Murillo-Tovar, M. A.: Opposing seasonal trends for polycyclic aromatic hydrocarbons and PM10: Health risk and sources in southwest Mexico City, Atmos. Res., 122, 199–212, https://doi.org/10.1016/j.atmosres.2012.10.003, 2013.
Amador-Muñoz, O., Misztal, P. K., Weber, R., Worton, D. R., Zhang, H., Drozd, G., and Goldstein, A. H.: Sensitive detection of n-alkanes using a mixed ionization mode proton-transfer-reaction mass spectrometer, Atmos. Meas. Tech., 9, 5315–5329, https://doi.org/10.5194/amt-9-5315-2016, 2016.
Behzadi, F., Wasti, A., Haque Rahat, S., Tracy, J. N., and Ray, P. A.: Analysis of the climate change signal in Mexico City given disagreeing data sources and scattered projections, J. Hydrol. Reg. Stud., 27, 100662, https://doi.org/10.1016/j.ejrh.2019.100662, 2020.
Bi, K., McMeeking, G. R., Ding, D. P., Levin, E. J. T., DeMott, P. J., Zhao, D. L., Wang, F., Liu, Q., Tian, P., Ma, X. C., Chen, Y. B., Huang, M. Y., Zhang, H. L., Gordon, T. D., and Chen, P.: Measurements of Ice Nucleating Particles in Beijing, China, J. Geophys. Res.-Atmos., 124, 8065–8075, https://doi.org/10.1029/2019JD030609, 2019.
Burrows, S. M., McCluskey, C. S., Cornwell, G., Steinke, I., Zhang, K., Zhao, B., Zawadowicz, M., Raman, A., Kulkarni, G., China, S., Zelenyuk, A., and DeMott, P. J.: Ice-Nucleating Particles That Impact Clouds and Climate: Observational and Modeling Research Needs, Rev. Geophys., 60, e2021RG000745, https://doi.org/10.1029/2021RG000745, 2022.
Cabrera-Segoviano, D., Pereira, D. L., Rodriguez, C., Raga, G. B., Miranda, J., Alvarez-Ospina, H., and Ladino, L. A.: Inter-annual variability of ice nucleating particles in Mexico City, Atmos. Environ., 273, 118964, https://doi.org/10.1016/j.atmosenv.2022.118964, 2022.
Carabali, G., Villanueva-Macias, J., Ladino, L. A., Álvarez-Ospina, H., Raga, G. B., Andraca-Ayala, G., Miranda, J., Grutter, M., Silva, Ma. M., and Riveros-Rosas, D.: Characterization of aerosol particles during a high pollution episode over Mexico City, Sci. Rep.-UK, 11, 22533, https://doi.org/10.1038/s41598-021-01873-4, 2021.
Castro Romero, T., Peralta, O., Prieto, C., Santiago, N., Alvarez-Ospina, H., García Martínez, R., Saavedra Rosado, I., Espinosa Fuentes, M. D. L. L., Hernández, E., Miranda, J., Gómez, V., Solís, C., Salcedo, D., Torres-Jardón, R., Martínez-Arroyo, A., Ortínez Álvarez, A., Ruíz-Suárez, G., and Ortiz, E.: Characterization of PM2.5 during ACU15 campaign in Mexico City, Geofísica Int., 63, 1225–1238, https://doi.org/10.22201/igeof.2954436xe.2024.63.4.1745, 2024.
Celada-Murillo, A.-T., Carreón-Sierra, S., Salcido, A., Castro, T., Peralta, O., and Georgiadis, T.: Main Characteristics of Mexico City Local Wind Events during the MILAGRO 2006 Campaign within a Meso-β Scale Lattice Wind Modeling Approach, ISRN Meteorol., 2013, 1–14, https://doi.org/10.1155/2013/605210, 2013.
Chen, J., Wu, Z., Augustin-Bauditz, S., Grawe, S., Hartmann, M., Pei, X., Liu, Z., Ji, D., and Wex, H.: Ice-nucleating particle concentrations unaffected by urban air pollution in Beijing, China, Atmos. Chem. Phys., 18, 3523–3539, https://doi.org/10.5194/acp-18-3523-2018, 2018.
Chen, J., Wu, Z., Gong, X., Qiu, Y., Chen, S., Zeng, L., and Hu, M.: Anthropogenic Dust as a Significant Source of Ice-Nucleating Particles in the Urban Environment, Earths Future, 12, e2023EF003738, https://doi.org/10.1029/2023EF003738, 2024.
Cooke, M. E., Waters, C. M., Asare, J. Y., Mirrielees, J. A., Holen, A. L., Frauenheim, M. P., Zhang, Z., Gold, A., Pratt, K. A., Surratt, J. D., Ladino, L. A., and Ault, A. P.: Atmospheric Aerosol Sulfur Distribution and Speciation in Mexico City: Sulfate, Organosulfates, and Isoprene-Derived Secondary Organic Aerosol from Low NO Pathways, ACS EST Air, 1, 1037–1052, https://doi.org/10.1021/acsestair.4c00048, 2024.
Córdoba, F., Ramírez-Romero, C., Cabrera, D., Raga, G. B., Miranda, J., Alvarez-Ospina, H., Rosas, D., Figueroa, B., Kim, J. S., Yakobi-Hancock, J., Amador, T., Gutierrez, W., García, M., Bertram, A. K., Baumgardner, D., and Ladino, L. A.: Measurement report: Ice nucleating abilities of biomass burning, African dust, and sea spray aerosol particles over the Yucatán Peninsula, Atmos. Chem. Phys., 21, 4453–4470, https://doi.org/10.5194/acp-21-4453-2021, 2021.
Doran, J. C., Barnard, J. C., Arnott, W. P., Cary, R., Coulter, R., Fast, J. D., Kassianov, E. I., Kleinman, L., Laulainen, N. S., Martin, T., Paredes-Miranda, G., Pekour, M. S., Shaw, W. J., Smith, D. F., Springston, S. R., and Yu, X.-Y.: The T1-T2 study: evolution of aerosol properties downwind of Mexico City, Atmos. Chem. Phys., 7, 1585–1598, https://doi.org/10.5194/acp-7-1585-2007, 2007.
Edgerton, S. A., Bian, X., Doran, J. C., Fast, J. D., Hubbe, J. M., Malone, E. L., Shaw, W. J., Whiteman, C. D., Zhong, S., Arriaga, J. L., Ortiz, E., Ruiz, M., Sosa, G., Vega, E., Limon, T., Guzman, F., Archuleta, J., Bossert, J. E., Elliot, S. M., Lee, J. T., McNair, L. A., Chow, J. C., Watson, J. G., Coulter, R. L., Doskey, P. V., Gaffney, J. S., Marley, N. A., Neff, W., and Petty, R.: Particulate Air Pollution in Mexico City: A Collaborative Research Project, J. Air Waste Manage., 49, 1221–1229, https://doi.org/10.1080/10473289.1999.10463915, 1999.
Espinosa, A., Miranda, J., and Pineda, J. C.: Uncertainty evaluation in correlated quantities: application to elemental analysis of atmospheric aerosols, Rev. Mex. Fis., 56, 134–140, 2010.
Espinosa, A. A., Reyes-Herrera, J., Miranda, J., Mercado, F., Veytia, M. A., Cuautle, M., and Cruz, J. I.: Development of an X-ray fluorescence spectrometer for environmental science applications, Instrum. Sci. Technol., 40, 603–617, https://doi.org/10.1080/10739149.2012.693560, 2012.
Gimeno, L., Sorí, R., Vázquez, M., Stojanovic, M., Algarra, I., Eiras-Barca, J., Gimeno-Sotelo, L., and Nieto, R.: Extreme precipitation events, WIREs Water, 9, e1611, https://doi.org/10.1002/wat2.1611, 2022.
Hasenkopf, C. A., Veghte, D. P., Schill, G. P., Lodoysamba, S., Freedman, M. A., and Tolbert, M. A.: Ice nucleation, shape, and composition of aerosol particles in one of the most polluted cities in the world: Ulaanbaatar, Mongolia, Atmos. Environ., 139, 222–229, https://doi.org/10.1016/j.atmosenv.2016.05.037, 2016.
Hernández-López, A. E., Miranda Martín Del Campo, J., Mugica-Álvarez, V., Hernández-Valle, B. L., Mejía-Ponce, L. V., Pineda-Santamaría, J. C., Reynoso-Cruces, S., Mendoza-Flores, J. A., and Rozanes-Valenzuela, D.: A study of PM2.5 elemental composition in southwest Mexico City and development of receptor models with positive matrix factorization, Rev. Int. Contam. Ambie., https://www.redalyc.org/journal/370/37072384031/html/ (last access: 11 June 2026), 2020.
Hernández-López, A. E., Santos-Medina, G. L., Morton-Bermea, O., Hernández-Álvarez, E., Villalobos-Pietrini, R., and Amador-Muñoz, O.: Chemical speciation of organic compounds and elemental compositions of PM2.5 in Mexico City: Spatial-seasonal distribution, emission sources, and formation processes, Atmos. Res., 292, 106868, https://doi.org/10.1016/j.atmosres.2023.106868, 2023.
Heymsfield, A. J., Schmitt, C., Chen, C.-C.-J., Bansemer, A., Gettelman, A., Field, P. R., and Liu, C.: Contributions of the Liquid and Ice Phases to Global Surface Precipitation: Observations and Global Climate Modeling, J. Atmos. Sci., 77, 2629–2648, https://doi.org/10.1175/JAS-D-19-0352.1, 2020.
Hoose, C. and Möhler, O.: Heterogeneous ice nucleation on atmospheric aerosols: a review of results from laboratory experiments, Atmos. Chem. Phys., 12, 9817–9854, https://doi.org/10.5194/acp-12-9817-2012, 2012.
Hoose, C., Kristjánsson, J. E., and Burrows, S. M.: How important is biological ice nucleation in clouds on a global scale?, Environ. Res. Lett., 5, 024009, https://doi.org/10.1088/1748-9326/5/2/024009, 2010.
Houze, R. A.: Cloud dynamics, 2nd edn., Academic Press, Oxford, UK, ISBN 978-0-12-374266-7, 2014.
Hurtado, L., Rodríguez, G., López, J., Castillo, J. E., Molina, L., Zavala, M., and Quintana, P. J. E.: Characterization of atmospheric bioaerosols at 9 sites in Tijuana, Mexico, Atmos. Environ., 96, 430–436, https://doi.org/10.1016/j.atmosenv.2014.07.018, 2014.
Población: https://www.inegi.org.mx/temas/estructura/, last access: 10 October 2025.
Jahl, L. G., Brubaker, T. A., Polen, M. J., Jahn, L. G., Cain, K. P., Bowers, B. B., Fahy, W. D., Graves, S., and Sullivan, R. C.: Atmospheric aging enhances the ice nucleation ability of biomass-burning aerosol, Sci. Adv., 7, https://doi.org/10.1126/sciadv.abd3440, 2021.
Jahn, L. G., Polen, M. J., Jahl, L. G., Brubaker, T. A., Somers, J., and Sullivan, R. C.: Biomass combustion produces ice-active minerals in biomass-burning aerosol and bottom ash, P. Natl. Acad. Sci. USA, 117, 21928–21937, https://doi.org/10.1073/pnas.1922128117, 2020.
Jáuregui, E.: El clima de la Ciudad de México, 1st edn., Instituto de Geografía, UNAM: Plaza y Valdés Editores, México, D.F, 131 pp., ISBN 968-856-819-8, 2000.
Kanji, Z. A., Ladino, L. A., Wex, H., Boose, Y., Burkert-Kohn, M., Cziczo, D. J., and Krämer, M.: Overview of Ice Nucleating Particles, Meteorol. Monogr., 58, 1.1–1.33, https://doi.org/10.1175/AMSMONOGRAPHS-D-16-0006.1, 2017.
Knopf, D. A., Wang, B., Laskin, A., Moffet, R. C., and Gilles, M. K.: Heterogeneous nucleation of ice on anthropogenic organic particles collected in Mexico City, Geophys. Res. Lett., 37, 2010GL043362, https://doi.org/10.1029/2010GL043362, 2010.
Knopf, D. A., Alpert, P. A., Wang, B., and Aller, J. Y.: Stimulation of ice nucleation by marine diatoms, Nat. Geosci., 4, 88–90, https://doi.org/10.1038/ngeo1037, 2011.
Kunert, A. T., Pöhlker, M. L., Tang, K., Krevert, C. S., Wieder, C., Speth, K. R., Hanson, L. E., Morris, C. E., Schmale III, D. G., Pöschl, U., and Fröhlich-Nowoisky, J.: Macromolecular fungal ice nuclei in Fusarium: effects of physical and chemical processing, Biogeosciences, 16, 4647–4659, https://doi.org/10.5194/bg-16-4647-2019, 2019.
Ladino, L. A., Raga, G. B., and Baumgardner, D.: On particle-bound polycyclic aromatic hydrocarbons (PPAH) and links to gaseous emissions in Mexico City, Atmos. Environ., 194, 31–40, https://doi.org/10.1016/j.atmosenv.2018.09.022, 2018.
Li, C., Zwiers, F., Zhang, X., Chen, G., Lu, J., Li, G., Norris, J., Tan, Y., Sun, Y., and Liu, M.: Larger Increases in More Extreme Local Precipitation Events as Climate Warms, Geophys. Res. Lett., 46, 6885–6891, https://doi.org/10.1029/2019GL082908, 2019.
Li, M., Qi, J., Zhang, H., Huang, S., Li, L., and Gao, D.: Concentration and size distribution of bioaerosols in an outdoor environment in the Qingdao coastal region, Sci. Total Environ., 409, 3812–3819, https://doi.org/10.1016/j.scitotenv.2011.06.001, 2011.
Mason, R. H., Chou, C., McCluskey, C. S., Levin, E. J. T., Schiller, C. L., Hill, T. C. J., Huffman, J. A., DeMott, P. J., and Bertram, A. K.: The micro-orifice uniform deposit impactor–droplet freezing technique (MOUDI-DFT) for measuring concentrations of ice nucleating particles as a function of size: improvements and initial validation, Atmos. Meas. Tech., 8, 2449–2462, https://doi.org/10.5194/amt-8-2449-2015, 2015.
Mason, R. H., Si, M., Chou, C., Irish, V. E., Dickie, R., Elizondo, P., Wong, R., Brintnell, M., Elsasser, M., Lassar, W. M., Pierce, K. M., Leaitch, W. R., MacDonald, A. M., Platt, A., Toom-Sauntry, D., Sarda-Estève, R., Schiller, C. L., Suski, K. J., Hill, T. C. J., Abbatt, J. P. D., Huffman, J. A., DeMott, P. J., and Bertram, A. K.: Size-resolved measurements of ice-nucleating particles at six locations in North America and one in Europe, Atmos. Chem. Phys., 16, 1637–1651, https://doi.org/10.5194/acp-16-1637-2016, 2016.
Melchum, A., Córdoba, F., Salinas, E., Martínez, L., Campos, G., Rosas, I., Garcia-Mendoza, E., Olivos-Ortiz, A., Raga, G. B., Pizano, B., Silva, Ma. M., and Ladino, L. A.: Maritime and continental microorganisms collected in Mexico: An investigation of their ice-nucleating abilities, Atmos. Res., 293, 106893, https://doi.org/10.1016/j.atmosres.2023.106893, 2023.
Mendoza-Téllez, S., Valdés, K., Ramírez, D., Cedillo, J. A., Rivera-Hernández, O., Córdoba, F., Álvarez, H., Miranda, J., Rosas, I., B. Raga, G., Negrete, E., Martínez, L., Salinas, E., and Ladino, L. A.: Measurement report: Ice nucleating particles variability across a megacity, Zenodo [data set], https://doi.org/10.5281/zenodo.17872149, 2026.
Met Office: Microclimates, National Meteorological Library and Archive Factsheet 14, https://www.metoffice.gov.uk/binaries/content/assets/metofficegovuk/pdf/research/library-and-archive/library/publications/factsheets/factsheet_14-microclimates_2023.pdf (last access: 17 February 2026), 2023.
Molina, H., Yang, Y., Ruch, T., Kim, J.-W., Mortensen, P., Otto, T., Nalli, A., Tang, Q.-Q., Lane, M. D., Chaerkady, R., and Pandey, A.: Temporal Profiling of the Adipocyte Proteome during Differentiation Using a Five-Plex SILAC Based Strategy, J. Proteome Res., 8, 48–58, https://doi.org/10.1021/pr800650r, 2009.
Molina, L. T. and Molina, M. J.: Air Quality in the Mexico Megacity: An Integrated Assessment, Kluwer Academic Publishers: Dordrecht, the Netherlands, https://doi.org/10.1007/978-94-010-0454-1, 2002.
Molina, L. T., Madronich, S., Gaffney, J. S., Apel, E., de Foy, B., Fast, J., Ferrare, R., Herndon, S., Jimenez, J. L., Lamb, B., Osornio-Vargas, A. R., Russell, P., Schauer, J. J., Stevens, P. S., Volkamer, R., and Zavala, M.: An overview of the MILAGRO 2006 Campaign: Mexico City emissions and their transport and transformation, Atmos. Chem. Phys., 10, 8697–8760, https://doi.org/10.5194/acp-10-8697-2010, 2010.
Molina, M. J. and Molina, L. T.: Megacities and Atmospheric Pollution, J. Air Waste Manage., 54, 644–680, https://doi.org/10.1080/10473289.2004.10470936, 2004.
Moreno, T., Querol, X., Pey, J., Minguillón, M. C., Pérez, N., Alastuey, A., Bernabé, R. M., Blanco, S., Cárdenas, B., Eichinger, W., Salcido, A., and Gibbons, W.: Spatial and temporal variations in inhalable CuZnPb aerosols within the Mexico City pollution plume, J. Environ. Monitor., 10, 370, https://doi.org/10.1039/b716507b, 2008.
Mülmenstädt, J., Sourdeval, O., Delanoë, J., and Quaas, J.: Frequency of occurrence of rain from liquid-, mixed-, and ice-phase clouds derived from A-Train satellite retrievals, Geophys. Res. Lett., 42, 6502–6509, https://doi.org/10.1002/2015GL064604, 2015.
Ohneiser, K., Seifert, P., Schimmel, W., Senf, F., Gaudek, T., Radenz, M., Teisseire, A., Ettrichrätz, V., Vogl, T., Maherndl, N., Pfeifer, N., Henneberger, J., Miller, A. J., Omanovic, N., Fuchs, C., Zhang, H., Ramelli, F., Spirig, R., Kötsche, A., Kalesse-Los, H., Maahn, M., Corden, H., Berne, A., Hajipour, M., Griesche, H., Hofer, J., Engelmann, R., Skupin, A., Ansmann, A., and Baars, H.: Impact of seeder-feeder cloud interaction on precipitation formation: a case study based on extensive remote-sensing, in situ and model data, Atmos. Chem. Phys., 25, 17363–17386, https://doi.org/10.5194/acp-25-17363-2025, 2025.
Pereira, D. L., Silva, Ma. M., García, R., Raga, G. B., Alvarez-Ospina, H., Carabali, G., Rosas, I., Martinez, L., Salinas, E., Hidalgo-Bonilla, S., and Ladino, L. A.: Characterization of ice nucleating particles in rainwater, cloud water, and aerosol samples at two different tropical latitudes, Atmos. Res., 250, 105356, https://doi.org/10.1016/j.atmosres.2020.105356, 2021.
Petters, M. D. and Wright, T. P.: Revisiting ice nucleation from precipitation samples: Ice nucleation from precipitation, Geophys. Res. Lett., 42, 8758–8766, https://doi.org/10.1002/2015GL065733, 2015.
Pinto, D. M., Blande, J. D., Souza, S. R., Nerg, A.-M., and Holopainen, J. K.: Plant Volatile Organic Compounds (VOCs) in Ozone (O3) Polluted Atmospheres: The Ecological Effects, J. Chem. Ecol., 36, 22–34, https://doi.org/10.1007/s10886-009-9732-3, 2010.
Prenni, A. J., DeMott, P. J., Sullivan, A. P., Sullivan, R. C., Kreidenweis, S. M., and Rogers, D. C.: Biomass burning as a potential source for atmospheric ice nuclei: Western wildfires and prescribed burns, Geophys. Res. Lett., 39, https://doi.org/10.1029/2012gl051915, 2012.
Purdy, J. C., Austin, G. L., Seed, A. W., and Cluckie, I. D.: Radar evidence of orographic enhancement due to the seeder feeder mechanism, Meteorol. Appl., 12, 199–206, https://doi.org/10.1017/S1350482705001672, 2005.
Querol, X., Pey, J., Minguillón, M. C., Pérez, N., Alastuey, A., Viana, M., Moreno, T., Bernabé, R. M., Blanco, S., Cárdenas, B., Vega, E., Sosa, G., Escalona, S., Ruiz, H., and Artíñano, B.: PM speciation and sources in Mexico during the MILAGRO-2006 Campaign, Atmos. Chem. Phys., 8, 111–128, https://doi.org/10.5194/acp-8-111-2008, 2008.
Querol, X., Tobías, A., Pérez, N., Karanasiou, A., Amato, F., Stafoggia, M., Pérez García-Pando, C., Ginoux, P., Forastiere, F., Gumy, S., Mudu, P., and Alastuey, A.: Monitoring the impact of desert dust outbreaks for air quality for health studies, Environ. Int., 130, 104867, https://doi.org/10.1016/j.envint.2019.05.061, 2019.
Raga, G. B., Ladino, L. A., Baumgardner, D., Ramirez-Romero, C., Córdoba, F., Alvarez-Ospina, H., Rosas, D., Amador, T., Miranda, J., Rosas, I., Jaramillo, A., Yakobi-Hancock, J., Kim, J. S., Martínez, L., Salinas, E., and Figueroa, B.: ADABBOY: African Dust And Biomass Burning Over Yucatan, B. Am. Meteorol. Soc., 102, E1543–E1556, https://doi.org/10.1175/BAMS-D-20-0172.1, 2021.
Reynoso-Cruces, S., Miranda-Martín-Del-Campo, J., and Pineda-Santamaría, J. C.: Elemental composition of PM10 in indoor environments of a scientific research institution and risk assessment, Environ. Pollut. Bioavailab., 35, 2232108, https://doi.org/10.1080/26395940.2023.2232108, 2023.
Riojas-Rodríguez, H., Álamo-Hernández, U., Texcalac-Sangrador, J. L., and Romieu, I.: Health impact assessment of decreases in PM10 and ozone concentrations in the Mexico City Metropolitan Area. A basis for a new air quality management program, Salud Publica Mexico, 56, 579, https://doi.org/10.21149/spm.v56i6.7384, 2014.
Ríos, B. and Raga, G. B.: Spatio-temporal distribution of burned areas by ecoregions in Mexico and Central America, Int. J. Remote Sens., 39, 949–970, https://doi.org/10.1080/01431161.2017.1392641, 2018.
Rodríguez-Gómez, C.: Variabilidad de los núcleos de glaciación en la capa límite y la tropósfera libre en Altzomoni, y su influencia en la formación de nubes mixtas, Master thesis, Universidad Nacional Autónoma de México, 128 pp., https://repositorio.unam.mx/contenidos/3586139 (last access: 11 June 2026), 2021.
Rodriguez-Gomez, C., Ramirez-Romero, C., Cordoba, F., Raga, G. B., Salinas, E., Martinez, L., Rosas, I., Quintana, E. T., Maldonado, L. A., Rosas, D., Amador, T., Alvarez, H., and Ladino, L. A.: Characterization of culturable airborne microorganisms in the Yucatan Peninsula, Atmos. Environ., 223, 117183, https://doi.org/10.1016/j.atmosenv.2019.117183, 2020.
Rogers, R. R. and Yau, M. K.: A short course in cloud physics, 3rd edn., Butterworth-Heinemann, Burlington, Massachusetts, 1 p., ISBN 9780080570945, 1996.
Russy-Velandia, L., Ramírez, O., Barrera, J., Mendoza-Téllez, S., Álvarez, H., Patiño, M. C., and Ladino, L. A.: Approach to culturable bioaerosols and their environmental drivers at a border site in the northwestern Amazon, Atmos. Environ. X, 27, 100362, https://doi.org/10.1016/j.aeaoa.2025.100362, 2025.
Salcido, A., Carreón-Sierra, S., Georgiadis, T., Celada-Murillo, A.-T., and Castro, T.: Lattice Wind Description and Characterization of Mexico City Local Wind Events in the 2001–2006 Period, Climate, 3, 542–562, https://doi.org/10.3390/cli3030542, 2015.
Schnell, R. C. and Vali, G.: Biogenic Ice Nuclei: Part I. Terrestrial and Marine Sources, J. Atmos. Sci., 33, 1554–1564, https://doi.org/10.1175/1520-0469(1976)033%253C1554:BINPIT%253E2.0.CO;2, 1976.
Shardt, N., Isenrich, F. N., Waser, B., Marcolli, C., Kanji, Z. A., deMello, A. J., and Lohmann, U.: Homogeneous freezing of water droplets for different volumes and cooling rates, Phys. Chem. Chem. Phys., 24, 28213–28221, https://doi.org/10.1039/D2CP03896J, 2022.
Stein, A. F., Draxler, R. R., Rolph, G. D., Stunder, B. J. B., Cohen, M. D., and Ngan, F.: NOAA's HYSPLIT atmospheric transport and dispersion modeling system, Bull. Amer. Meteor. Soc., 96, 2059–2077, https://doi.org/10.1175/BAMS-D-14-00110.1, 2015.
Tabari, H.: Climate change impact on flood and extreme precipitation increases with water availability, Sci. Rep.-UK, 10, 13768, https://doi.org/10.1038/s41598-020-70816-2, 2020.
Tarn, M. D., Sikora, S. N. F., Porter, G. C. E., Shim, J., and Murray, B. J.: Homogeneous Freezing of Water Using Microfluidics, Micromachines, 12, 223, https://doi.org/10.3390/mi12020223, 2021.
Toll, V., Rahu, J., Keernik, H., Trofimov, H., Voormansik, T., Manshausen, P., Hung, E., Michelson, D., Christensen, M. W., Post, P., Junninen, H., Murray, B. J., Lohmann, U., Watson-Parris, D., Stier, P., Donaldson, N., Storelvmo, T., Kulmala, M., and Bellouin, N.: Glaciation of liquid clouds, snowfall, and reduced cloud cover at industrial aerosol hot spots, Science, 386, 756–762, https://doi.org/10.1126/science.adl0303, 2024.
Trofimov, H., Post, P., Gryspeerdt, E., and Toll, V.: Meteorological Conditions Favorable for Strong Anthropogenic Aerosol Impacts on Clouds, J. Geophys. Res.-Atmos., 127, e2021JD035871, https://doi.org/10.1029/2021JD035871, 2022.
Vali, G.: Ice Nucleation – a review, in: Nucleation and Atmospheric Aerosols 1996, Elsevier, 271–279, https://doi.org/10.1016/B978-008042030-1/50066-4, 1996.
Vega, E., Reyes, E., Ruiz, H., García, J., Sánchez, G., Martínez-Villa, G., González, U., Chow, J. C., and Watson, J. G.: Analysis of PM2.5 and PM10 in the Atmosphere of Mexico City during 2000–2002, J. Air Waste Manage., 54, 786–798, https://doi.org/10.1080/10473289.2004.10470952, 2004.
Wex, H., Augustin-Bauditz, S., Boose, Y., Budke, C., Curtius, J., Diehl, K., Dreyer, A., Frank, F., Hartmann, S., Hiranuma, N., Jantsch, E., Kanji, Z. A., Kiselev, A., Koop, T., Möhler, O., Niedermeier, D., Nillius, B., Rösch, M., Rose, D., Schmidt, C., Steinke, I., and Stratmann, F.: Intercomparing different devices for the investigation of ice nucleating particles using Snomax® as test substance, Atmos. Chem. Phys., 15, 1463–1485, https://doi.org/10.5194/acp-15-1463-2015, 2015.
Zhao, B., Wang, Y., Gu, Y., Liou, K.-N., Jiang, J. H., Fan, J., Liu, X., Huang, L., and Yung, Y. L.: Ice nucleation by aerosols from anthropogenic pollution, Nat. Geosci., 12, 602–607, https://doi.org/10.1038/s41561-019-0389-4, 2019.
Zhu, Z., Peng, C., Li, X., Zhang, R., Dai, X., Jiang, B., and Chen, J.: Remote Sensing-Based Analysis of Precipitation Events: Spatiotemporal Characterization across China, Water, 16, 2345, https://doi.org/10.3390/w16162345, 2024.