the Creative Commons Attribution 4.0 License.
the Creative Commons Attribution 4.0 License.
 | 10 Jun 2026
Quasi-Lagrangian observations of cloud transitions during the initial phase of marine cold air outbreaks in the Arctic – Part 2: Vertical cloud structure
Anna Weber
Fabian Hoffmann
Bernhard Mayer
The aim of this work is to study the vertical distribution of microphysical cloud properties, in particular the thermodynamic phase partitioning and the cloud droplet size, in low-level mixed-phase clouds during marine cold air outbreaks in the Arctic. For this purpose, high resolution observations of the initial phase of a strong marine cold air outbreak in the Fram Strait collected with the hyperspectral and polarized imaging system specMACS during the airborne HALO–(𝒜𝒞)3 campaign are analyzed. Pseudo-vertical profiles of the cloud thermodynamic phase generally showed increasing ice fractions with increasing height and decreasing temperature, except for a geometrically thin layer at the cloud top, which was more liquid-dominated. The measurements indicated that ice formation occurred preferentially at the coldest temperatures. In addition, the effective radius of the liquid cloud droplets increased with height, as expected. The observed vertical evolution of the liquid cloud droplets could be successfully modeled by an entraining parcel model. The good agreement between measured and calculated vertical profiles of the cloud droplet effect radius and additional information based on in situ measurements indicated that the influence of collision-coalescence and ice processes, such as riming, the Wegener-Bergeron-Findeisen mechanism, and ice formation through heterogeneous freezing, on the liquid cloud droplets was small for the observed clouds. The analyses and data presented can help to improve the representation of low-level Arctic mixed-phase clouds in models and to further our understanding of these clouds and the related microphysical processes.
- Article
(5199 KB) - Full-text XML
- Companion paper
-
Supplement
(1216 KB) - BibTeX
- EndNote


Meridional transports of heat and moisture are important components of the Arctic climate system and relevant for Arctic amplification (Wendisch et al., 2021). During marine cold air outbreaks (MCAOs), cold and dry Arctic airmasses are transported southwards from the cold sea ice over the warmer open ocean (Papritz and Spengler, 2017; Fletcher et al., 2016). The large temperature gradients between the cold advected airmasses and the ocean surface generate intense surface fluxes of heat and moisture, which may be responsible for 60 % to 80 % of oceanic heat loss during winter in the Nordic Seas, influencing deep water formation and sea ice dynamics (Papritz and Spengler, 2017; Svingen et al., 2023). Furthermore, the strong temperature contrasts create convection and lead to the formation of low-level clouds (Papritz and Spengler, 2017). The clouds usually first organize into cloud streets aligned with the mean wind direction and transition into cellular structures further downstream due to precipitation formation and a decoupling of the evolving atmospheric boundary layer (Brümmer, 1999; McCoy et al., 2017; Abel et al., 2017; Pithan et al., 2018; Tornow et al., 2021). MCAOs may be related to polar lows and severe weather events in the mid-latitudes, such as cold extremes or heavy snowfall (Pithan et al., 2018). The Fram Strait is one of the main pathways for MCAOs in the Arctic and this region experiences comparably frequent and intense MCAOs (Papritz and Spengler, 2017; Dahlke et al., 2022). The accurate modeling of the intense airmass transformations during meridional transports into and out of the Arctic is challenging for large-scale and high-resolution models (Sato et al., 2016; Pithan et al., 2016; Tomassini et al., 2017; Field et al., 2017; Wendisch et al., 2021). Models particularly struggle to correctly represent the microphysical evolution of clouds during MCAOs and warm air intrusions (Pithan et al., 2014; McCoy et al., 2015; Tan and Storelvmo, 2019; Field et al., 2014; Abel et al., 2017). As a result, projections of future Arctic climate remain highly uncertain (Smith et al., 2019; Cohen et al., 2020; Block et al., 2020).
The clouds that form during MCAOs are typically mixed-phase clouds and have a distinct vertical structure. A geometrically thin layer with supercooled liquid water is typically observed at the cloud top (e.g. Geerts et al., 2022; Schirmacher et al., 2024). Ice crystals form from this supercooled liquid layer through heterogeneous nucleation and sediment downwards (Morrison et al., 2012). The ice crystals in mixed-phase clouds can rapidly grow at the expense of liquid cloud droplets through the Wegener-Bergeron-Findeisen (WBF) mechanism (Wegener, 1911; Bergeron, 1935; Findeisen, 1938) and cloud liquid water can additionally be depleted through riming. However, Arctic mixed-phase clouds were observed to be very persistent with average lifetimes of 12 hours and occasionally up to several days (Shupe et al., 2006; Morrison et al., 2012). The partitioning and the spatial distribution of the cloud thermodynamic phase are important quantities since the spatial distribution of the supercooled liquid water droplets and ice crystals affects, for example, the efficiency of the WBF mechanism (Korolev et al., 2017; Korolev and Milbrandt, 2022) and therefore cloud cover and cloud lifetime (Pithan et al., 2014). In addition, the thermodynamic phase determines the radiative effect of the cloud (Choi et al., 2014; Matus and L'Ecuyer, 2017). The accurate modeling of mixed-phase clouds and their microphysics is challenging for climate and general circulation models (Morrison et al., 2012; Pithan et al., 2014; Komurcu et al., 2014; Cesana et al., 2015, 2022). Models of different scales struggle, in particular, to correctly represent cloud thermodynamic phase partitioning and the vertical distribution of cloud liquid water (Inoue et al., 2021; Kretzschmar et al., 2019, 2020). Observational data is needed to provide constraints to models (Pithan et al., 2018). The typical spatial scales of inhomogeneities in Arctic clouds are on the order of a few hundred meters (Schäfer et al., 2017, 2018). These scales require high-spatial resolution measurements to be resolved. Especially, information about the vertical distribution of cloud microphysical properties is needed.
The vertical cloud structure can, in general, be analyzed using active remote sensing measurements. Vertical information about the cloud microphysical properties can, however, also be derived from passive imaging. Rosenfeld and Lensky (1998) and Lensky and Rosenfeld (2006) combined two-dimensional fields of the effective radius of liquid cloud droplets and the cloud top temperature derived from passive satellite observations to create pseudo-vertical profiles of the droplet radius in convective clouds. This method assumes that the droplet effective radius is conserved for a given temperature and that the cloud top properties of different clouds at different evolution stages observed in a single snapshot are similar to those of an individual evolving cloud. The method was validated based on observational data as well as model data (Lensky and Rosenfeld, 2006; Zhang et al., 2011). It was first developed for pure liquid water clouds, but later also applied to deep convective clouds, which contain cloud ice (Freud et al., 2008).
This work is based on measurements of the specMACS instrument collected during the airborne HALO–(𝒜𝒞)3 field campaign, which was conducted in March and April 2022 and focused on airmass transformations during meridional transports into and out of the Arctic (Wendisch et al., 2024; Ehrlich et al., 2025). During HALO–(𝒜𝒞)3, the German High Altitude and LOng range research aircraft (HALO, Krautstrunk and Giez, 2012), containing remote sensing instrumentation, operated together with the Polar 5 and Polar 6 aircraft (Wesche et al., 2016), performing further remote sensing and in situ measurements. The measurements were conducted using a quasi-Lagrangian flight strategy, which allows for studying cloud evolution during MCAOs. The hyperspectral and polarized imaging system specMACS (Ewald et al., 2016; Weber et al., 2024) was installed in a downward-looking configuration on board HALO and provides high-spatial resolution information about macrophysical and microphysical properties of clouds, including cloud thermodynamic phase partitioning and the effective radius of liquid cloud droplets.
This work builds upon Weber et al. (2026), who investigated the temporal and spatial evolution of macrophysical and microphysical cloud properties during MCAOs using specMACS measurements during HALO–(𝒜𝒞)3. The objective of this work is to extend the analyses by Weber et al. (2026) and study the vertical distribution of microphysical cloud properties, in particular the thermodynamic phase partitioning and the cloud droplet size, in low-level Arctic mixed-phase clouds and their evolution during MCAOs. To this end, measurements of microphysical cloud properties from specMACS are combined with cloud top temperature measurements from the thermal imager on board HALO and cloud top height measurements from specMACS to construct pseudo-vertical profiles, following the method of Rosenfeld and Lensky (1998) and Lensky and Rosenfeld (2006). Specifically, the vertical distribution and the temperature dependence of the cloud thermodynamic phase, as well as their evolution with time, are analyzed in a quasi-Lagrangian framework based on backward airmass trajectories for the strong cold air outbreak observed on 1 April 2022 in the Fram Strait. In addition, the vertical distribution and evolution of the cloud droplet effective radius on this day is investigated. Furthermore, we test the ability of a simple parcel model to describe the observed vertical profiles of the droplet effective radius and study the influence of cloud ice on the supercooled liquid water droplets. This work aims to provide observational constraints to models, which struggle to accurately represent mixed-phase clouds, their thermodynamic phase partitioning, the vertical distribution of cloud liquid water, and evolution during MCAOs. In addition, the presented analyses can help to further our understanding of Arctic mixed-phase clouds and the associated microphysical processes.
This paper is structured as follows. The applied data and methods are introduced in Sect. 2. The results of the analyses are presented in Sect. 3 and discussed in Sect. 4, before the findings are summarized in Sect. 5.
2.1 Measurement data
In this work, measurements of the spectrometer of the Munich Aerosol Cloud Scanner (specMACS, Ewald et al., 2016; Weber et al., 2024) during the airborne HALO–(𝒜𝒞)3 measurement campaign in the Arctic are applied (Wendisch et al., 2024; Ehrlich et al., 2025). In particular, data from the research flight on 1 April 2022 in the Fram Strait are analyzed. The HALO flight on that day sampled the initial phase of a MCAO following a quasi-Lagrangian flight strategy (Wendisch et al., 2024), and was coordinated with the Polar 5 and Polar 6 aircraft. specMACS consists of two hyperspectral cameras sensitive to the visible and near-infrared and the shortwave infrared wavelength ranges (so-called VNIR and SWIR) and two 2D RGB polarization-resolving cameras, which are installed in a downward-looking perspective on board HALO. This work applies measurements of the SWIR spectrometer, which covers the wavelength range between 1000 and 2500 nm wavelength and has a field of view of 35.3 ° in across-track direction, and the polarization-resolving cameras, which have a maximum combined field of view of 91 °×117 ° in along-track and across-track direction. The specMACS measurements provide high-spatial resolution information about cloud macro- and microphysical properties, with resolutions between 10 and 100 m at typical flight altitudes, depending on the retrieved quantity.
The cloud top height is derived from measurements of the polarization-resolving cameras with the stereographic retrieval by Kölling et al. (2019), which was validated by Volkmer et al. (2024) based on synthetic data of a field of shallow cumulus clouds with a complex 3D cloud geometry. The effective radius of liquid cloud droplets is retrieved using the multi-angle polarimetric cloudbow retrieval by Pörtge et al. (2023). The cloud droplet effective radius is determined by fitting polarized scattering phase functions according to Mie theory to multi-angle polarization signals of the cloudbow, which is formed by single scattering on liquid cloud droplets. The retrieval was validated with synthetic data of shallow cumulus clouds with a complex 3D geometry by Volkmer et al. (2024), who found an average difference between the retrieved and simulated effective radii of . Further sensitivity studies showed that the cloudbow retrieval is not affected by the presence of cloud ice in mixed-phase clouds and yields reliable results for ice fractions up to 0.8. Since the retrieval is based on polarization, it is less affected by 3D radiative effects.
Information about the cloud thermodynamic phase is obtained with two different methods. First, the ice index, as defined by Ehrlich et al. (2008) and Ruiz-Donoso et al. (2020), is calculated from the radiances measured by the SWIR for all clouds. This index is based on spectral absorption differences between liquid water and ice in the near-infrared wavelength range and provides qualitative information about the cloud thermodynamic phase, which allows for an accurate phase classification. Sensitivity studies based on radiative transfer simulations showed that values below 20 correspond to a liquid water cloud, whereas values above 20 indicate a mixed-phase cloud (Ehrlich et al., 2009). The ice index is a well-established method for characterizing the cloud thermodynamic phase and has already been applied, e.g., by Ruiz-Donoso et al. (2020) to study clouds during MCAOs and warm air intrusions in the Arctic.
Second, a quantitative ice fraction was retrieved from the measurements of the polarization-resolving cameras using the polarimetric phase partitioning retrieval by Weber et al. (2025). It is determined by fitting multi-angle polarization signals obtained from a forward operator to measurements. The ice fraction is defined as the ratio of the ice optical thickness to the total cloud optical thickness under the assumption of a homogeneously mixed cloud. Depending on the observation geometry, either the cloudbow angular range, covering scattering angles between 135 and 165 °, or the slope angular range from 60 to 110 ° scattering angle, can be used. Further information about the retrieval, a detailed discussion of the retrieval uncertainties, and a validation based on synthetic data of low-level Arctic mixed-phase clouds with a complex 3D cloud geometry can be found in Weber et al. (2025). The uncertainties include measurement uncertainties, uncertainties due to retrieval assumptions, and uncertainties due to 3D radiative effects and vary across different retrieval configurations. Here, the results of the polarized retrieval for the green wavelength channel for the cloudbow angular range using the forward operator applying a parameterization of 3D cloud geometry are used, and only observations with saturated polarization signals are considered because these provide the smallest uncertainties (Weber et al., 2025). For the analyses in Sect. 3.1, however, data of the ice fraction derived from the more uncertain and less sensitive slope angular range had to be used, since the observation geometry did not allow for applying measurements in the cloudbow angular range.
Since the measurements of specMACS are based on passive remote sensing, they are representative for the cloud top. The spectral measurements used to determine the ice index originate from deeper cloud layers than the polarization measurements applied to retrieve the ice fraction and the effective radius of liquid cloud droplets, because the polarization signal is dominated by single scattering. For the same reason, the polarimetric retrievals are less affected by 3D radiative effects. The spectral ice index is very sensitive to cloud ice (Ehrlich et al., 2008), whereas the polarimetric phase retrieval can detect very small amounts of liquid water in ice clouds (Weber et al., 2025). The spectral and polarimetric phase retrievals complement each other due to their different sensitivities and provide information about the cloud thermodynamic phase at two different altitudes within the clouds due to their different penetration depths.
Similar to Weber et al. (2026), measurements above sea ice with sea ice concentrations larger than 80 % were excluded from the analyses to reduce additional uncertainties due to the influence of the (unknown) surface and due to the misclassification of clouds and sea ice in the marginal sea ice zone with the brightness-based cloud masks.
In addition to the specMACS observations, measurements of other instruments on board HALO and collocated in situ measurements collected by the Polar 6 aircraft were applied to characterize the observed clouds further. Information about cloud top temperature is available from the thermal imager VELOX (Schäfer et al., 2022) on board HALO, which measures brightness temperatures at six different wavelength channels between 7.7 and 12 µm and has a similar field of view and spatial resolution as the spectrometers of specMACS. Here, the brightness temperatures measured by the first broadband channel (covering the wavelength range between 7.7 and 12 µm) were used. For measurements in the Arctic, with low water vapor content in the atmosphere, the measurements of this channel are representative for the cloud top. Measurements of the lidar backscatter ratio and aerosol depolarization by the WALES lidar (Wirth et al., 2009) and the radar reflectivity measured by the HAMP 35 GHz cloud radar (Mech et al., 2014) on board HALO provide vertical information about the observed clouds. Furthermore, dropsonde measurements of air temperature, pressure, and relative humidity were collected.
In addition to the measurements from the various instruments on board HALO, collocated in situ observations by the Polar 6 aircraft were used. The different scattering and optical array probes installed on board Polar 6 measure the particle number size distribution, from which the cloud droplet and ice crystal number concentrations and the effective radius and diameter of liquid cloud droplets and ice crystals can be computed as described in Moser et al. (2023) and Ehrlich et al. (2025). The combined particle number size distributions measured by the Cloud Droplet Probe, Cloud Imagining Probe, and Precipitation Imaging Probe were integrated over size for particles smaller than 50 µm diameter, assuming these particles to be liquid, to calculate the cloud droplet number concentration and over particles larger than 50 µm diameter to obtain the ice crystal number concentration (Moser et al., 2023).
As in Weber et al. (2026), the measurements and retrieval results were combined with backward airmass trajectories to assign every measurement the time the airmass has traveled southwards since passing the sea ice edge. The backward trajectories were computed from ERA5 wind fields using Lagranto (Sprenger and Wernli, 2015).
2.2 Parcel model
The parcel model predicts vertical profiles of the liquid water content in a liquid water cloud resulting from the lifting of an air parcel. The cloud droplet number concentration is assumed to be vertically constant and the actual liquid water content is linearly related to the adiabatic liquid water content through the adiabaticity fad, which accounts for entrainment (Brenguier et al., 2000; Grosvenor et al., 2018). According to this model, vertical profiles of the effective radius of liquid cloud droplets can be computed with (Grosvenor et al., 2018; Brenguier et al., 2000)
Here, ρw is the density of liquid water and is the height above the cloud base height. k is the factor converting volume mean radii to effective radii, with k=0.8 a typical value for maritime clouds (Martin et al., 1994; Pawlowska and Brenguier, 2000). The condensation rate Cw depends on temperature and pressure and is computed from the dropsonde measurements using the formula given by Grosvenor et al. (2018). The adiabaticity fad accounts for the reduction in the condensation rate due to entrainment. A detailed discussion of uncertainties and assumptions of the adiabatic cloud model can be found in Grosvenor et al. (2018). Here, the adiabaticity was computed with an entrainment model to further account for variations of the entrainment with height (de Rooy et al., 2013):
with , which is a typical value for cumuliform clouds. The cloud base height of the liquid water cloud zbase was derived from dropsonde data and the cloud heights from the stereographic, respectively, cloudbow retrieval of specMACS as described below, and increases with time above open ocean as the boundary layer evolves. Regarding the dropsonde data, the cloud base height was defined as the height at which the relative humidity with respect to liquid water first exceeded 99 %. For the specMACS measurements, the minimum height of the measurements, at which an effective radius was determined with the cloudbow retrieval was used. A relation for the cloud base height as a function of time above open ocean was obtained by fitting a linear curve to the cloud base heights obtained from the dropsondes and specMACS. This relation is used to compute the effective radius for different times above open ocean. The cloud droplet number concentration Nd was derived from in situ measurements of the P6 aircraft, which performed collocated measurements with HALO on 1 April 2022, as described above. A more detailed discussion and analysis of the cloud droplet number concentration measurements is given in Sect. 3.2.
2.3 Case overview and synoptic situation
This section gives an overview of the research flight conducted by HALO on 1 April 2022, which is analyzed in detail in this work. The flight on 1 April 2022 targeted the Fram Strait region, where a MCAO was observed on that day, and was coordinated with the Polar 5 and Polar 6 aircraft. Figure 1 shows the MCAO index in panel (a), the MODIS satellite image in panel (b), and the backward trajectories together with the AMSR2-MODIS sea ice concentration in panel (c). The flight track is superimposed in red and contours of the mean sea level pressure and the geopotential height at 500 hPa from ERA5 data are displayed in panel (a). The MCAO index is a measure of the strength of the MCAO. It was computed from the potential skin temperature at the surface and the potential temperature at a pressure of 850 hPa using ERA5 data (Hersbach et al., 2023a, b) following Fletcher et al. (2016):
According to Papritz and Spengler (2017) and Dahlke et al. (2022), the event observed on this day with average MCAO indices of around 8 K in the Fram Strait region can be classified as a moderate to strong MCAO. It appears to be a typical event for this region at that time of the year (Kirbus et al., 2024). The synoptic situation was characterized by a high-pressure system over Greenland and the Central Arctic and a low-pressure system above Scandinavia, the Barents Sea, and Russia. This led, together with a local low-pressure system south of Svalbard, to a northerly flow in the Fram Strait as indicated by the backward trajectories in panel (c). The satellite image in Fig. 1b shows cloud streets extending southwards from the sea ice edge. In addition, there are local effects due to the topography of Svalbard visible with several convergence lines and cloud-free regions southwest of the island. The flight pattern targeted the initial phase of the MCAO following the quasi-Lagrangian sampling approach with flight legs oriented perpendicular to and along the wind direction (Wendisch et al., 2024). This quasi-Lagrangian observation strategy allows for studying the evolution of thermodynamic and cloud properties observed during the MCAO. The temporal and spatial evolution of cloud macro- and microphysical properties during this research flight was already analyzed in Weber et al. (2026). In the following, the evolution of the vertical cloud structure will be studied.
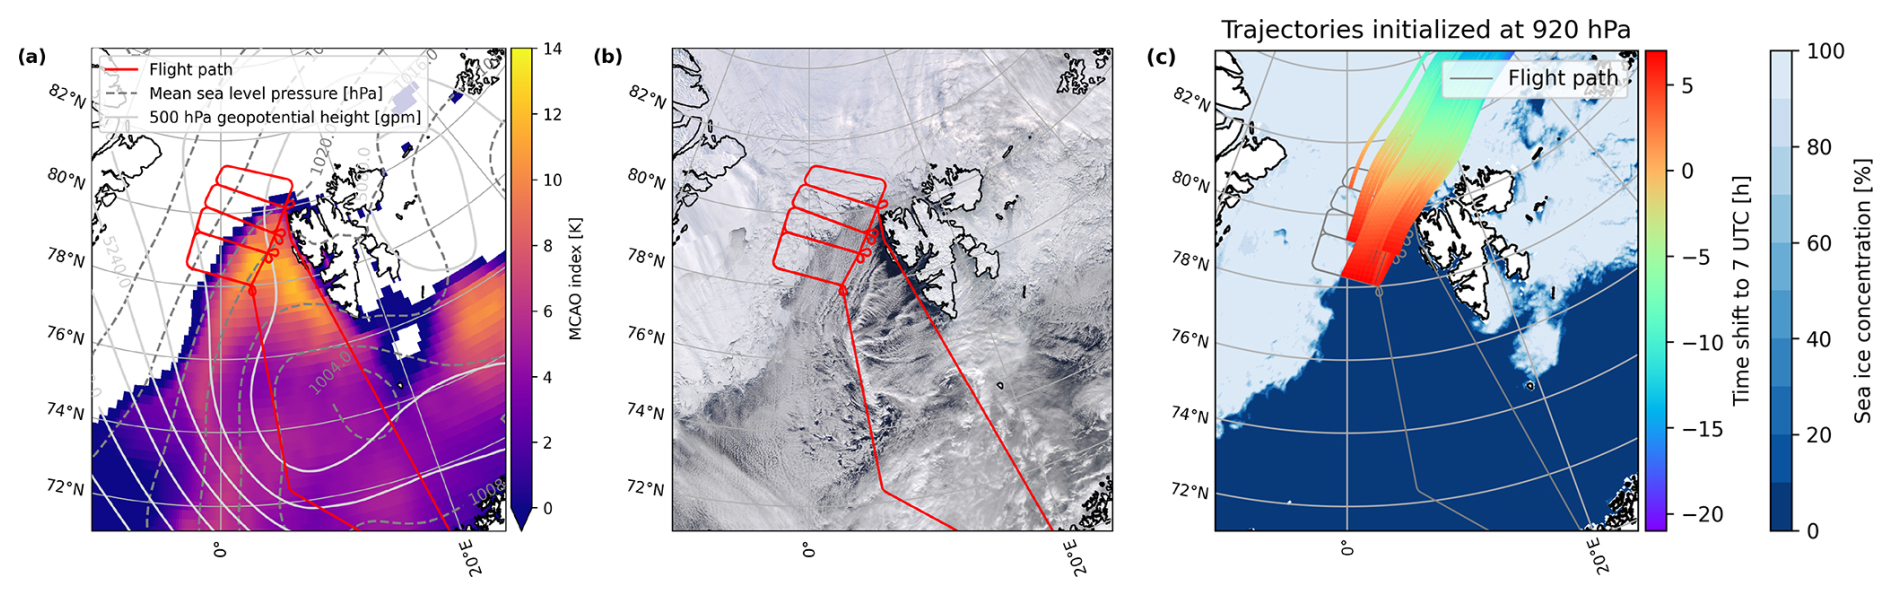
Figure 1MCAO index from ERA5 data (Hersbach et al., 2023a, b) (a), MODIS satellite image (Corrected Reflectance (True Color)) from NASA Worldview (https://worldview.earthdata.nasa.gov/, last access: 25 February 2025) (b), and backward airmass trajectories along the flight track together with AMSR2-MODIS sea ice concentration (Ludwig et al., 2020) (c) for the flight on 1 April 2022. The red lines indicate the flight track. In addition, the mean sea level pressure and geopotential height at 500 hPa from ERA5 are shown as gray dashed and solid lines, respectively, in panel (a). For better visibility, only every 20th backward trajectory is shown in panel (c). The color coding displays the time along the trajectories.
3.1 Temperature dependence and vertical distribution of cloud thermodynamic phase
To investigate the temperature dependence and the vertical distribution of the thermodynamic phase partitioning, retrieval results of the ice index and ice fraction from specMACS were combined with measurements of the cloud top temperature from the VELOX instrument, following the method of Rosenfeld and Lensky (1998) and Lensky and Rosenfeld (2006). As already mentioned above, the spectral and polarized phase retrievals complement each other due their different sensitivities to liquid water and ice and their different penetration depths and are therefore analyzed jointly. The measurements from VELOX and specMACS were matched to obtain corresponding cloud top temperature measurements for every ice index, respectively, ice fraction measurement. These data were then used to construct pseudo-vertical profiles of the cloud thermodynamic phase as a function of temperature. Based on the backward airmass trajectories, the measurements were sorted into different time ranges above open ocean to account for the strong airmass transformations and the related temporal and spatial evolution of the thermodynamic structure of the boundary layer during MCAOs. By applying this method to construct pseudo-vertical profiles, it is assumed that the distribution of the thermodynamic phase is horizontally homogeneous for a given height respectively temperature for a given time interval of the cloud evolution. A more detailed discussion about this assumption and further limitations is provided later in Sect. 4.3.
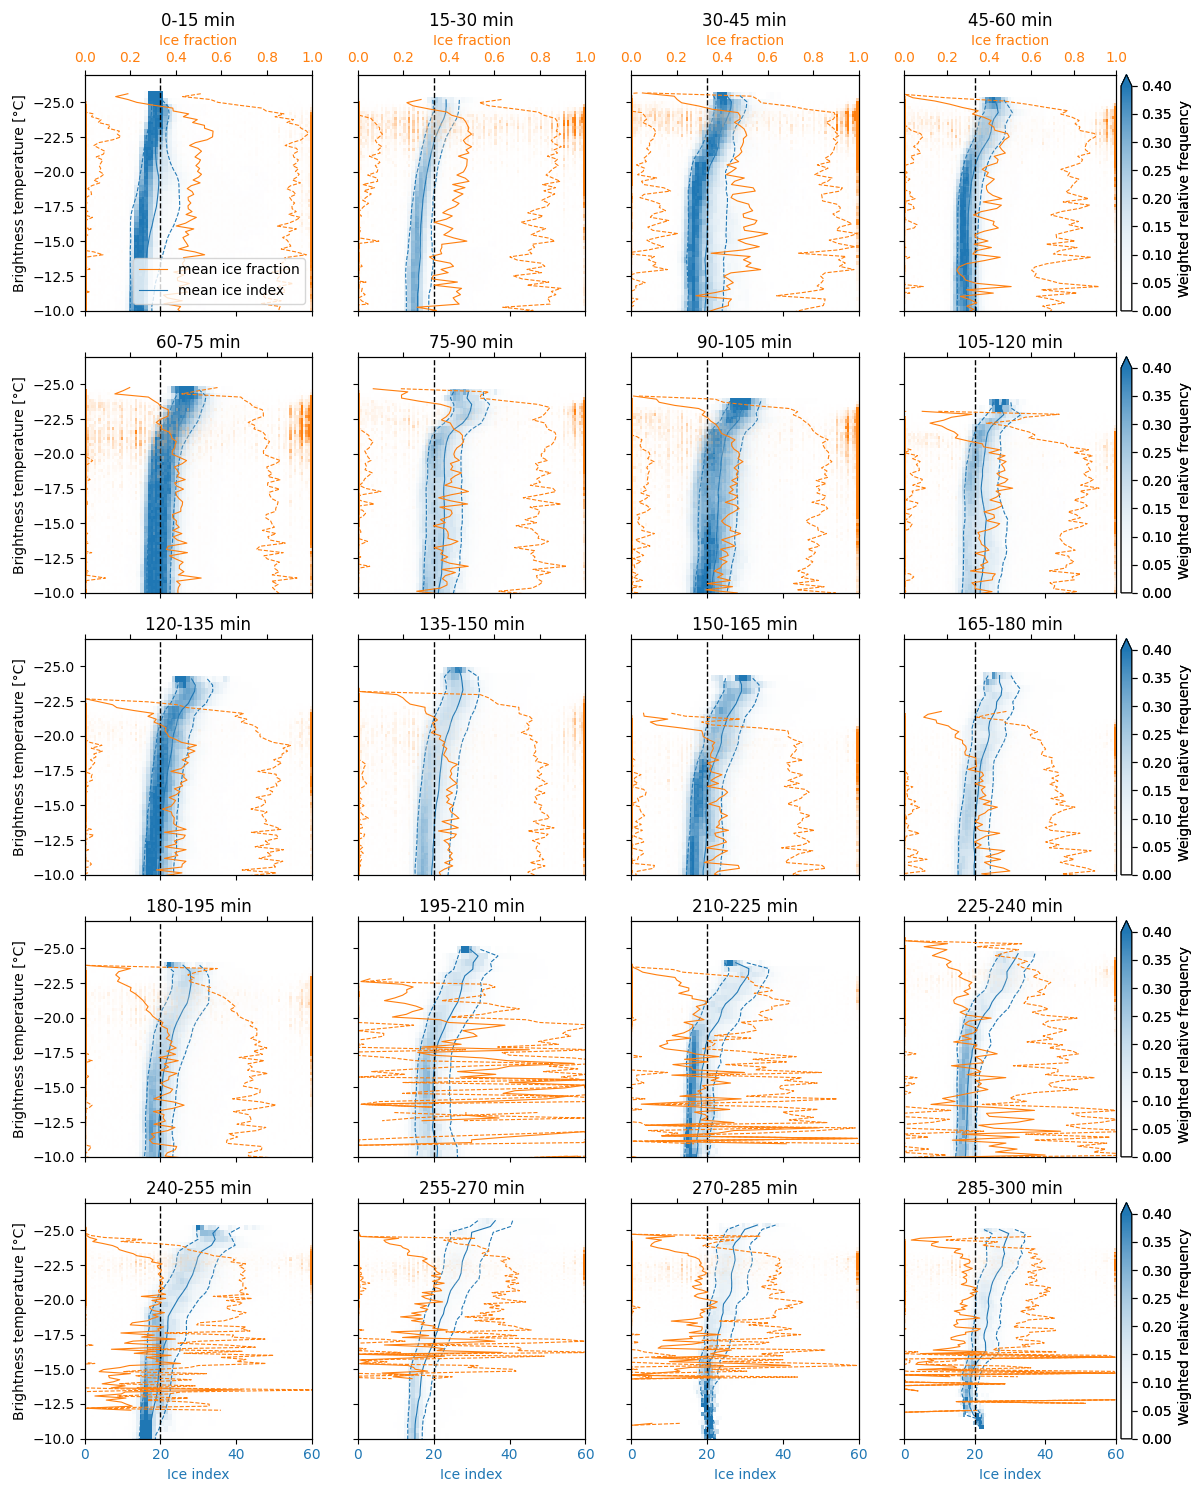
Figure 2Histograms of ice index (blue) and ice fraction (orange) derived from specMACS measurements as a function of the brightness temperature between 7.7 and 12 µm (representative for cloud top) measured by VELOX for different time ranges above open ocean. The blue and orange solid lines denote the respective mean and the corresponding dashed lines the standard deviation. The black dashed line indicates the threshold value of the ice index between the liquid water and the mixed phase. The ice fraction was derived with the IDEFAX parameterization of 3D cloud geometry for the slope angular range.
Figure 2 shows the ice index (blue) and ice fraction (orange) as a function of cloud top temperature. The individual panels correspond to different time ranges above open ocean. The measurements for every temperature bin are normalized by the total number of measurements in the respective bin. Vertical profiles of the air temperature and potential temperature measured by dropsondes during the research flight on 1 April 2022 are shown in Fig. 3. The dropsonde data were combined with trajectory data to assign every measurement a time above open ocean. In general, the temperature decreases with height, and an inversion marks the top of the boundary layer. The altitude of the inversion layer increases with time above open ocean as the boundary layer deepens. In addition, the temperature increases with time. A detailed study of the thermodynamic evolution of the MCAO on 1 April 2022 during HALO–(𝒜𝒞)3 can be found in Kirbus et al. (2024) and Wendisch et al. (2025). During the first hour above open ocean, high diabatic heating rates exceeding 6 K h−1 and moistening rates larger than 0.3 were observed at the surface. The heat and moisture are increasingly mixed upward as the time above open ocean increases and the boundary layer develops.
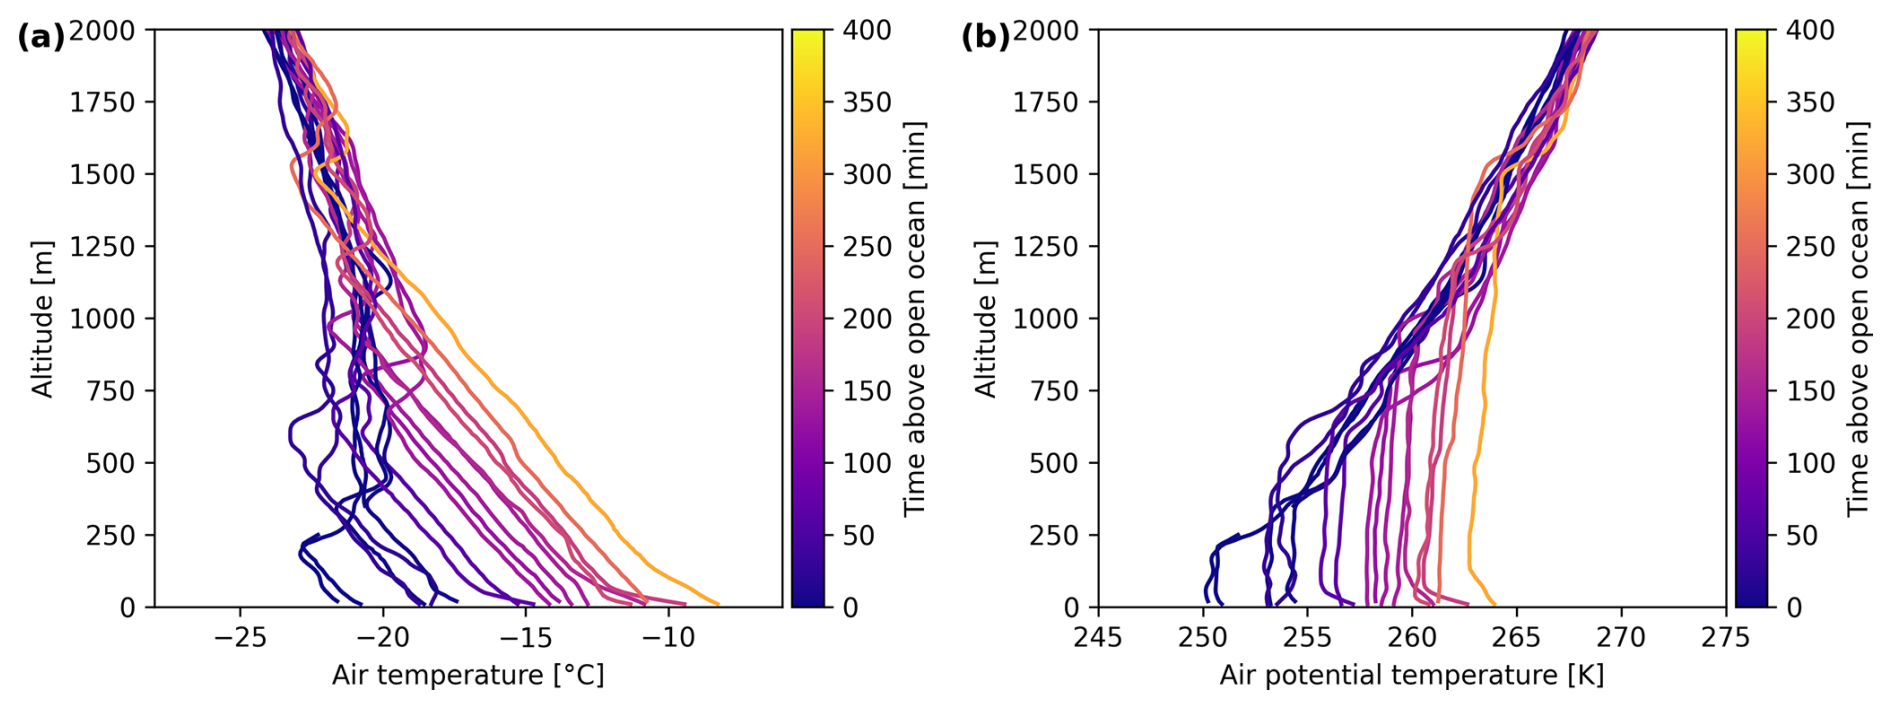
Figure 3Air temperature (a) and potential temperature (b) measured by the dropsondes on 1 April 2022. The colors indicate the time above open ocean at the location of the individual dropsondes.
During the first 15 min after passing the ice edge, the ice index in Fig. 2 is below the threshold value of 20 for all temperatures, indicating a liquid water cloud. At later times, the ice index is still almost constant with temperature except for the coldest temperatures, where it increases with decreasing temperature and crosses the threshold value from the liquid water into the mixed-phase regime. The increase in the ice index starting from the coldest temperatures indicates that ice formation occurs preferentially at the coldest temperatures. This is reasonable, as several studies based on in situ measurements have shown that the relative fraction of ice increases with decreasing temperature and the probability for freezing of supercooled liquid cloud droplets increases with decreasing temperatures (Korolev et al., 2017). With time, the transition from the liquid water to the mixed phase shifts to warmer temperatures, and the ice indices at the coldest temperatures further increase. This could be explained by ice, which is continuously formed at the coldest temperatures at the cloud top and sediments downwards. Consequently, the relative fraction of ice increases and liquid water might additionally be depleted through riming or the WBF mechanism. However, liquid water is still present also at lower altitudes. The observations are taken during the initial phase of a MCAO and the clouds are therefore observed during the very initial phase of their evolution from entirely liquid water clouds towards mixed-phase clouds. A similar structure of mixed-phase clouds above open ocean with increasing fractions of ice clouds with increasing height due to decreasing temperatures was also reported by Wendisch et al. (2024), based on in situ measurements during HALO–(𝒜𝒞)3.
The ice fraction derived with the polarimetric retrieval is mostly constant or slightly increasing with decreasing temperature, similar to the ice index. However, a strong decrease of the ice fraction with decreasing temperature can be observed at the coldest temperatures. This indicates that there is a very thin, more liquid-dominated layer at the cloud top, which is not or only partly detected by the spectral retrieval used to determine the ice index. The spectral retrieval is sensitive to deeper altitudes within the cloud than the polarized retrieval. Therefore, the ice fraction from the polarized retrieval is more strongly affected by a thin, more liquid-dominated layer at the cloud top than the ice index from the spectral retrieval if the thickness of this layer is smaller than the penetration depths of the spectral signal. In addition, the polarized retrieval is very sensitive to liquid water, whereas the spectral retrieval is more sensitive to ice. At longer times above open ocean in the last two rows of Fig. 2, the retrieved ice fraction becomes variable and uncertain due to increasing solar zenith angles and a decreasing number of data points.
The ice fraction in the first 15 min above open ocean is overestimated due to sea ice, which has been misclassified as clouds by the applied cloud mask. This is a well-known issue in passive remote sensing. However, it applies only to the retrieved ice fractions in the marginal sea ice zone, since the cloud mask of the polarization-resolving cameras relies on measurements in the visible wavelength range, where sea ice is bright, whereas a wavelength of 1640 nm was chosen for the cloud mask for the SWIR-derived ice indices, where sea ice is dark compared to the liquid-containing clouds. Due to the different field of views of the sensors, it was not possible to consistently use a single cloud mask. In addition, the ice fraction generally has a high bias (Weber et al., 2025). The threshold value between the liquid water and mixed phase indicated by the black dashed line in Fig. 2 only applies to the ice index. These facts have to be kept in mind, when analyzing and interpreting the observed absolute values, in particular in the first panels. This all together can explain the observed differences between the profiles of the ice index and ice fraction.
In general, the variability of the retrieved ice fractions is large. The distribution of the ice fraction shows an almost bimodal distribution, resulting in a large standard deviation. The horizontal distribution of the retrieved ice fractions (not shown) showed generally smaller ice fractions at the cloud centers and larger ice fractions towards the lower cloud sides. In addition, small-scale variability could be observed. Part of the large spread of the ice fraction, including values close to 0 and 1 in Fig. 2, however, has to be related to retrieval uncertainties, which have been characterized in detail in Weber et al. (2025). The horizontal distribution of the retrieved ice indices also exhibited some small-scale variability, which at least partly has to be attributed to 3D radiative effects and the related uncertainties. However, the influence of 3D radiative effects on the derived pseudo-vertical profiles is small (see the additional analyses provided in the Supplement). Given the large retrieval uncertainties for both ice index and ice fraction and the uncertainty of the necessary assumptions to construct pseudo-vertical profiles, the pseudo-vertical profiles of the ice index and ice fraction will be compared to radar and lidar measurements below, providing vertical information about the observed clouds.
The brightness temperatures measured by VELOX in Fig. 2 partly show warmer temperatures and a larger temperature range than the measurements of the dropsondes in Fig. 3. This can be explained by the influence of the warm ocean surface, which can lead to an overestimation of the measured brightness temperature for optically thin clouds. A cloud mask was applied to the data to filter the measurements, but some influence persisted in the warmer parts of the profiles. The number of affected data points is, however, small. The histograms in Fig. 2 are normalized by the total number of measurements for every temperature bin, leading to a false impression of many affected measurements.
Similar to the profiles of the ice index and ice fraction as a function of temperature, pseudo-vertical profiles of both quantities as a function of height can be constructed. The resulting plots are not shown here, since the temperature typically decreases with height and the results of both analyses are similar (see Fig. 3), but are provided in the Supplement. The ice index and ice fraction both increased with height, in agreement with the temperature dependence. At the very top, the ice fraction generally showed a strong and sharp decrease, which was also partly captured in the pseudo-vertical profiles of the ice index. However, this decrease was less pronounced for the ice index, for the same reasons as discussed above. This confirms the existence of a geometrically thin, more liquid-dominated mixed-phase layer compared to the altitudes directly below at cloud top. The layer with increased amounts of supercooled liquid water at cloud top had a geometrical thickness of about 100 to 200 m.
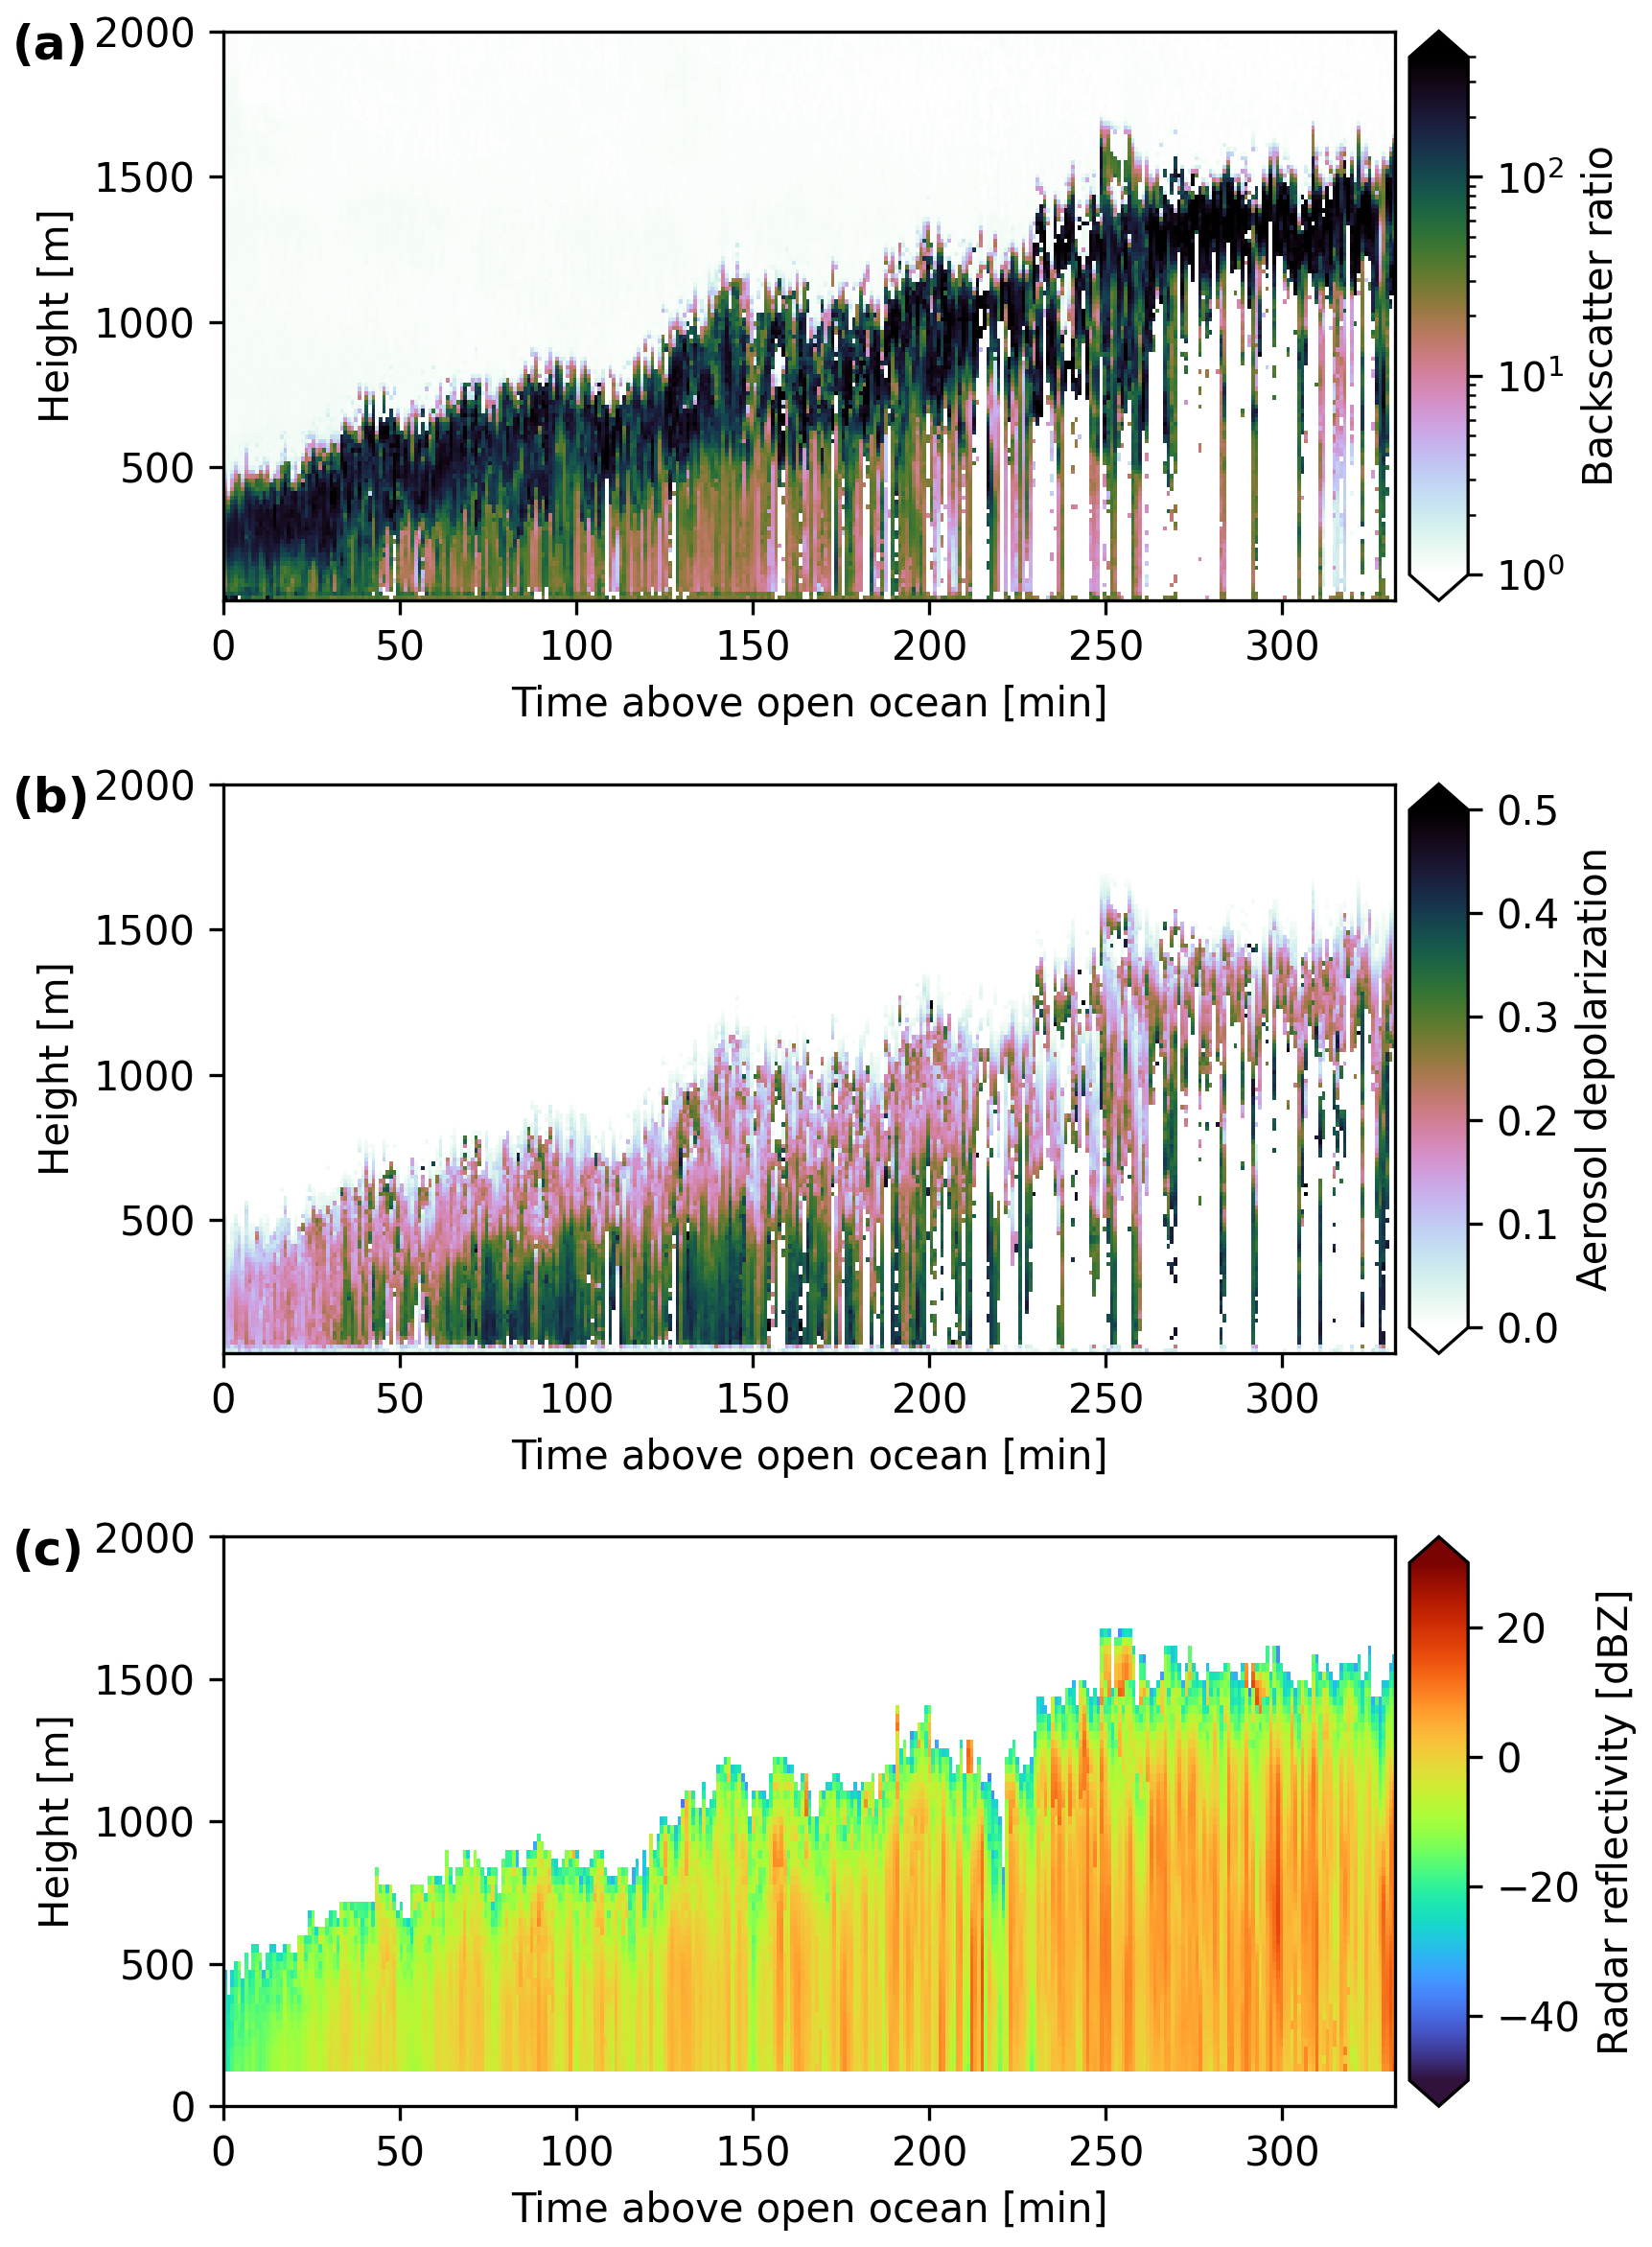
Figure 4Lidar and radar measurements as a function of time above open ocean on 1 April 2022. (a) Lidar backscatter ratio. (b) Aerosol depolarization. (c) Radar reflectivity. The depolarization data were filtered for cloud data only, with backscatter ratios larger than 10.
Additional vertical information is obtained from active remote sensing measurements. The lidar and radar measurements on board HALO were combined with backward airmass trajectories to create composites as a function of time above open ocean. To this end, the data were sorted into one-minute bins and all measurements of a certain time bin were averaged. Figure 4 shows the corresponding results for the lidar backscatter ratio (first row), aerosol depolarization (second row), and radar reflectivity (third row). The cloud top height in both lidar and radar data shows an increase with time, similar to the measurements of specMACS discussed in Weber et al. (2026). At cloud top, the lidar backscatter ratio is high and the depolarization is close to zero, indicating spherical particles. As the lidar is particularly sensitive to small liquid cloud droplets with a high number concentration, this hints at the presence of supercooled liquid water in this layer. The radar reflectivity increases with time and from cloud top towards the surface, as the radar signal is dominated by the larger ice crystals. These sediment downwards and grow further during their descent. After about 30 to 45 min above open ocean, the radar reflectivity exceeds the threshold value of −5 dBZ for precipitation (Schirmacher et al., 2024). Moreover, the high radar reflectivities at high altitudes indicate the presence of ice close to cloud top. An increasing radar reflectivity with decreasing height is not a contradiction to the observed increasing ice fraction with increasing height and decreasing temperature. The radar reflectivity is very sensitive to the size of the ice crystals, which increases with decreasing height as the larger ice crystals sediment and further grow during their descent, and is, to a lesser degree, influenced by the number concentration. In contrast, the ice fraction is a quantitative optical measure that reflects the optical thickness of both phases and depends on the sizes and number concentrations of cloud liquid water and cloud ice.
A geometrical thin layer with increased amounts of supercooled liquid water at cloud top from which ice crystals form and sediment downwards is the expected typical structure of low-level Arctic mixed-phase clouds (e.g. Morrison et al., 2012; Tan et al., 2023; Moser et al., 2026) and was also observed for mixed-phase clouds during MCAOs (Geerts et al., 2022; Schirmacher et al., 2024). Both passive and active remote sensing measurements qualitatively show this distinct structure.
3.2 Vertical evolution of the liquid cloud droplets
In addition to the vertical distribution of the cloud thermodynamic phase, the vertical evolution of the effective radius of the liquid cloud droplets is analyzed in the following. The analyses in the previous section and in Weber et al. (2026) showed that the liquid water clouds, which form at the very beginning of a MCAO close to the ice edge, rapidly transform into a mixed-phase regime. However, it was not investigated how ice processes influence the cloud liquid water over time and throughout the vertical extent of the cloud. For example, the WBF mechanism or riming could impact the cloud droplet size and number concentration. To further study these effects, measured pseudo-vertical profiles of the effective radius of the liquid cloud droplets are compared to vertical profiles calculated with the parcel model introduced in Sect. 2.2, which does not include ice processes. Differences or agreement between the theoretical and measured profiles provide insights into microphysical processes in the observed mixed-phase clouds and their temporal evolution.
Pseudo-vertical profiles of the effective radius of liquid cloud droplets are obtained from the measurements following the method of Rosenfeld and Lensky (1998) and Lensky and Rosenfeld (2006). To this end, the individual measurements of the effective radius of liquid cloud droplets are combined with the corresponding cloud top heights, yielding a combined pseudo-vertical profile. Similar to above, the data are divided into time bins along their temporal evolution. The input variables for the parcel model are computed from dropsonde measurements, in situ measurements, and measurements of specMACS as explained in Sect. 2.2. The cloud droplet number concentration, needed for the model and obtained from the in situ observations, and its temporal evolution and vertical distribution are further investigated by also combining the measurements with backward trajectories.
Figure 5 displays the cloud droplet number concentration as a function of time above open ocean. The color-coding denotes the height of the respective measurements. During the first 40 min above open ocean, the cloud droplet number concentration increases with time. In this time range, the clouds are decoupled from the surface, as indicated by the at least partly increasing potential temperature with height in Fig. 3b (Sotiropoulou et al., 2014; Gierens et al., 2020). Afterwards, the cloud droplet number concentration decreases with time. Decreasing number concentrations during the initial phase of MCAOs were also observed by, e.g., Murray-Watson et al. (2023) and can be explained with reduced supersaturation, entrainment, and aerosol scavenging through precipitation (Abel et al., 2017; Sanchez et al., 2022; Murray-Watson et al., 2023). The initial increase of the cloud droplet number concentration is missed in Murray-Watson et al. (2023), potentially due to the much coarser resolution and higher uncertainties of the satellite-derived measurements in this study compared to the in situ measurements applied here, but was also observed by, e.g., Abel et al. (2017).
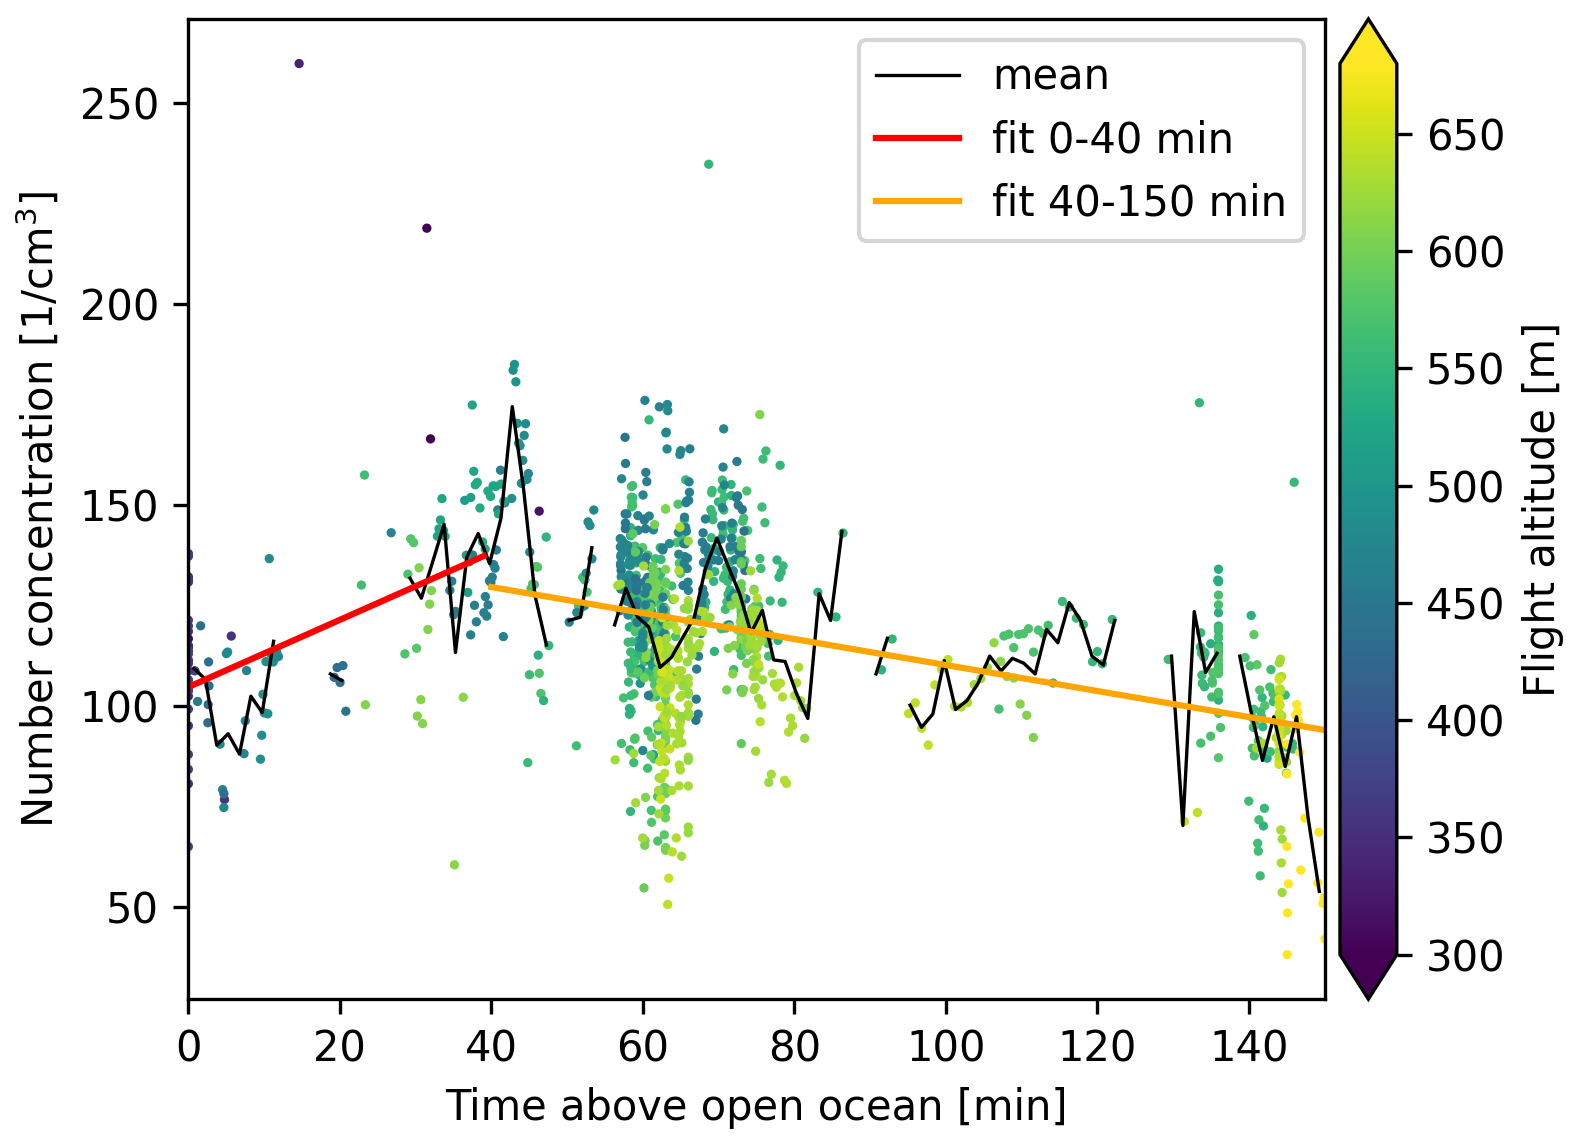
Figure 5Cloud droplet number concentration as a function of time above open ocean from in situ measurements. The color coding denotes the height of the measurements. The red and orange solid lines are linear fits to the data for times shorter and larger than 40 min, respectively. Only measurements with a LWC larger than 0.1 g m3 and with a sea ice concentration smaller than 80 % were used.
In addition, the number concentration in Fig. 5 shows only small variations with height. Lower number concentrations are measured at higher altitudes, which can, for example, be explained by the influence of entrainment or by heterogeneous freezing of liquid cloud droplets. However, the vertical variations of the number concentration are small compared to the uncertainties of the measurements, such that the cloud droplet number concentration can be assumed to be approximately constant with height. A vertically constant number concentration is a required assumption for the parcel model and this was also observed in other studies such as Brenguier et al. (2000); Painemal and Zuidema (2011) for stratocumulus clouds and by Gerber et al. (2008) for small cumulus clouds.
For the parcel model, linear fits were applied separately to times smaller and larger than 40 min to obtain a relation of the number concentration as a function of time above open ocean. The orange and red lines in Fig. 5 show the resulting fits. Due to the limited range of the Polar 6 aircraft, measurements of the number concentration are only available for the first 150 min above open ocean. They were extrapolated to larger times using the obtained linear fit. With this, the theoretical vertical profiles of the effective radius of liquid cloud droplets were calculated for any time above open ocean.

Figure 6Vertical profiles of the effective radius of liquid cloud droplets for different time ranges above open ocean. The black solid line indicates the mean measured effective radius from the specMACS observations and the dashed lines show the standard deviation of the measurements. The red solid lines are vertical profiles calculated using the parcel model (Sect. 2.2). The cloud top heights are given above the World Geodetic System 1984 (WGS84) ellipsoid.
Figure 6 shows the measured pseudo-vertical profiles of the effective radius of liquid cloud droplets for different time ranges above open ocean in black and the theoretical vertical profiles according to the parcel model in red. The measurements were again normalized by the number of measurements in every altitude bin and sorted into different time ranges above open ocean based on the backward trajectories. In general, the cloud droplet size increases with increasing cloud top height, as is expected. Moreover, the effective radius increases with increasing time above open ocean from initially about 5 µm to maximum values of approximately 10 µm during the observed time range, in agreement with Weber et al. (2026) and Murray-Watson et al. (2023).
Large deviations of the measured and calculated profiles are observed in the first row of Fig. 6, especially at lower altitudes. At these times, close to the sea ice edge, the clouds are decoupled from the surface, as discussed above, and the parcel model is not applicable. Cloud formation starts as soon as small fractions of open ocean exist in the marginal sea ice zone. Above sea ice, longwave radiative cooling at the surface causes a temperature inversion. The turbulence induced by the warm open ocean surface then leads to a coupling of the boundary layer and the associated clouds. In addition, the measured and calculated profiles mostly differ at the cloud base. A reason for this could be that the lowermost part of the clouds, with very small effective radii of the liquid cloud droplets, is too optically thin to be captured by the measurements, or is geometrically not visible at large viewing angles in combination with high cloud fractions. In addition, the initial growth of small liquid cloud droplets at the cloud base is fast and the cloud base height is difficult to determine, such that small uncertainties have a larger influence.
Besides that, there is generally good agreement between the profiles, indicating that the cloud ice did not significantly impact the cloud liquid water during the observed initial phase of the cold air outbreak on 1 April 2022 and that the parcel model is applicable here. The profiles calculated with the parcel model were not fitted to the measured pseudo-vertical profiles. Instead, the input variables were computed from measurements as described above. Deviations between the parcel model and the direct measurements are explained either by uncertainties of the input variables, by droplet collision and coalescence, or by ice processes, such as riming or the WBF mechanism, which are not accounted for in the parcel model. These will further be discussed in the following section.
In the previous section, pseudo-vertical profiles of the effective radius of liquid cloud droplets were presented. They generally showed increasing droplet sizes with increasing height and time above open ocean. In addition, theoretical profiles according to the parcel model introduced in Sect. 2.2 were calculated and compared to the measurements. This allows, on the one hand, to test the ability of the parcel model to describe the cloud liquid water in the observed mixed-phase clouds and, on the other hand, to study the influence of ice processes. The agreement between the measured and calculated vertical profiles of the cloud droplet effective radius in Fig. 6 was generally good, indicating the parcel model realistically represents the cloud liquid water in the observed mixed-phase clouds. To support this conclusion, the potential reasons for deviations between the measurements and the model, including measurement uncertainties, droplet collision-coalescence, and ice processes, are discussed in the following.
4.1 Uncertainties of input variables and model assumptions
First, the uncertainties of the input variables to the model are considered. The measurement uncertainties of the cloud droplet number concentration from in situ observations are about 10 % to 30 % (Moser et al., 2023), which corresponds to an uncertainty of the modeled effective radius of about 10 %. In addition, the vertical variation of the number concentration in Fig. 5 is about 50 %, which could explain deviations between the effective radii of up to 25 %. The cloud base height also has uncertainties, as it is derived from measurement data, but these uncertainties only shift the computed effective radius profile in the vertical direction. Other uncertainties arise from the interpolation between the condensation rates computed from the individual dropsondes and measurement uncertainties of the dropsondes due to, e.g., a broken cloud field. However, the cloud fraction was very high (see Fig. 3 in Weber et al., 2026) and the condensation rate varies only slightly with temperature and pressure in the observed temperature range.
Furthermore, an entrainment model (Eq. 2) was applied to compute the effective radius. The effective radius is, in general, only slightly influenced by entrainment (Freud et al., 2008). Variations of the adiabaticity by 10 % in Eq. (1) change the calculated effective radius by less than 4 % for the observed cloud droplet sizes. Nevertheless, the agreement between the measured and calculated vertical profiles of the effective radius varied depending on the chosen value of the adiabaticity. The good agreement between the observations and the theoretical profiles for the applied entrainment model indicates that this model realistically describes entrainment in the observed clouds. However, the adiabaticity could, in principle, also be reduced by other processes than entrainment. In mixed-phase clouds, simultaneously growing liquid cloud droplets and ice crystals compete for the available water vapor. This can lead to a reduced growth of liquid cloud droplets, similar to the influence of entrainment. At least a part of the reduction of the adiabaticity could potentially be attributed to this effect. From the measurements, it is not possible to directly distinguish between the effects of entrainment and ice crystals competing with the liquid cloud droplets for the available water vapor. However, the observed clouds are still dominated by liquid water, and the ice fraction and ice index are comparably small (see Fig. 2). In addition, the applied entrainment model is a realistic assumption. Thus, entrainment is likely the dominating factor here, but the influence of the ice crystals on the droplet growth introduces an additional uncertainty.
Moreover, the uncertainty of the measured effective radii from the cloudbow retrieval based on an evaluation with synthetic data is (Volkmer et al., 2024; Pörtge, 2024). These differences include the influence of 3D radiative effects. In summary, the uncertainties of the input variables used to model the effective radius and the uncertainties of the measured effective radii can explain the observed differences between the profiles.
4.2 Microphysical processes
Besides measurement uncertainties, microphysical processes, such as droplet collision and coalescence and ice processes, can lead to deviations of the observed profiles of the effective radius from the parcel model. Collision and coalescence of liquid cloud droplets are relevant if the effective radius of the droplets exceeds 14 µm (Freud and Rosenfeld, 2012). The observed liquid cloud droplets have maximum effective radii of about 10 µm, which is much smaller than this threshold. Therefore, collision and coalescence of liquid cloud droplets can be neglected in the observed clouds.
Another possible explanation for deviations between the parcel model and the observed effective radii is ice processes, such as ice formation through freezing of supercooled liquid water droplets, ice crystal growth through the WBF, and riming. Ice formation in mixed-phase clouds predominantly happens through heterogeneous freezing of supercooled liquid water droplets (de Boer et al., 2011; Cui et al., 2006; Ansmann et al., 2005). Hence, the formation of ice crystals decreases the cloud droplet number concentration. The probability that a supercooled liquid water droplet will freeze increases with increasing droplet size and decreasing temperature, but it also depends strongly on the efficiency of the ice nuclei. The ice crystal number concentration, computed from in situ measurements of the particle number size distributions from particles larger than 50 µm, amounts on average to about 20 L−1 with variations between 0 and 100 L−1, which is four orders of magnitude smaller than the observed cloud droplet number concentration. Hence, the influence of the conversion of liquid water droplets into ice crystals through freezing on the effective radius can be neglected.
A second ice process that can influence the liquid cloud droplets is the WBF mechanism. The WBF mechanism, however, is active only in a distinct regime with supersaturation with respect to ice and subsaturation with respect to liquid water (Korolev, 2007). Information about the supersaturation during the research flight on 1 April 2022 is available from the dropsondes released from HALO and the in situ measurements from the P6 aircraft. Figure 7 displays vertical profiles of the relative humidity above liquid water in panel (a) and above ice in panel (b) measured by the dropsondes. A layer with saturation above liquid water and supersaturation above ice is observed in the upper part for most times, which coincides with regions of high lidar backscatter ratio, indicating the presence of liquid cloud droplets. In this height range, liquid water droplets and ice crystals grow simultaneously. Close to the cloud top, there is usually a thin layer with supersaturation above ice only, which could be explained by entrainment of dry air. At lower altitudes, only supersaturation above ice is reached. This is the region where the WBF mechanism is active and larger radar reflectivities indicate the presence of ice.
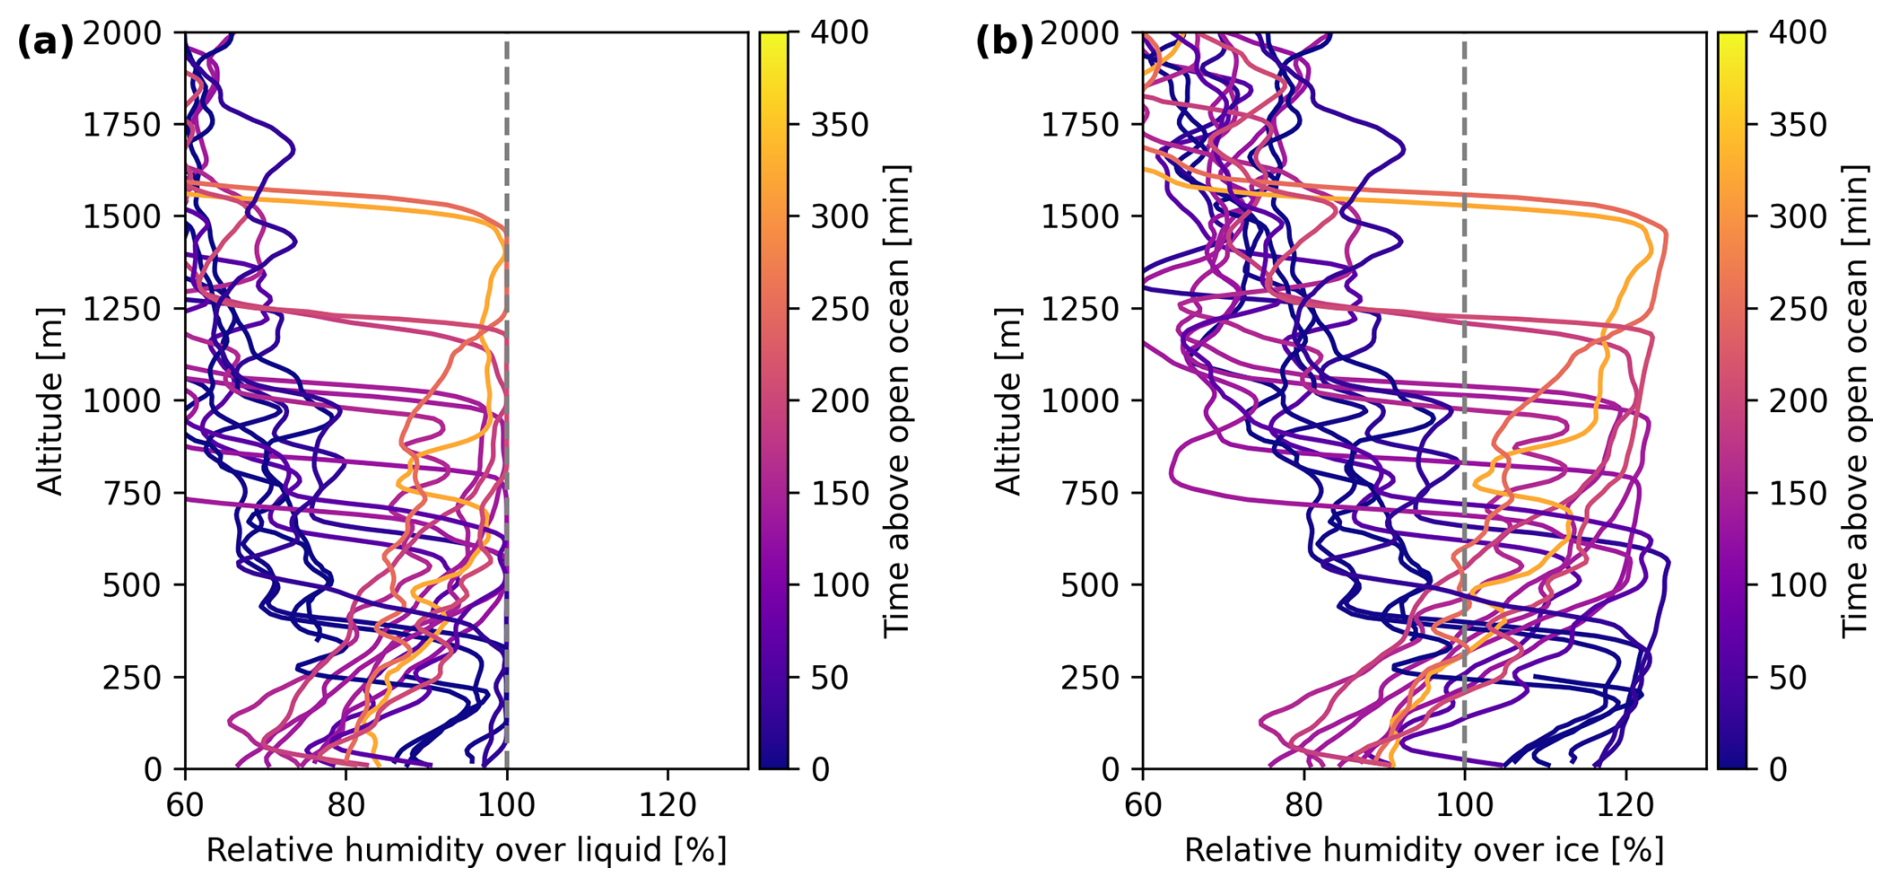
Figure 7Vertical profiles of the relative humidity with respect to liquid water (a) and ice (b) measured by the dropsondes on 1 April 2022. The colors indicate the time above open ocean of the respective dropsonde. The gray dashed line corresponds to 100 % relative humidity.
The measured profiles of the effective radius for the time range between 90 and 135 min show some variations of the slope with height and larger deviations from the parcel model in regions where the WBF mechanism could be active. However, there are only a few dropsonde measurements, which cover only parts of the time ranges, and the in situ data provide only limited vertical information. This makes it difficult to directly relate these deviations to the WBF mechanism, and the deviations are, in general, small compared to the measurement uncertainties. Moreover, the low ice crystal number concentration measured by the in situ probes indicates that no significant ice multiplication has taken place. Thus, even if the WBF mechanism is active, the measurements suggest that its influence on the cloud droplet effective radius is small. This can be due to inhomogeneous mixing of the liquid water and ice phases, the low ice crystal number concentration, or a combination of both, which makes the WBF mechanism less effective and limits its impact on the effective radius of the liquid cloud droplets. If highly resolved measurements of the vertical profiles of the cloud droplet number concentration were available, both effects could be distinguished.
Another ice process that can explain deviations between the parcel model and the measured effective radius profiles, especially in regions where the WBF mechanism is not active, is riming. Laboratory measurements indicate that the influence of riming on the cloud droplet size distribution is small (Ávila et al., 2009). According to the theoretically computed collision efficiencies, the liquid cloud droplets must reach a critical size for collisions with ice crystals, depending on the crystal shape (Wang and Ji, 2000). The retrieved effective radii smaller than 7.5 µm are close to the critical radius for riming. Smaller droplets can still participate in riming (Saleeby and Cotton, 2008), and actually riming was observed during the research flight on 1 April 2022 based on radar and in situ observations (Schirmacher et al., 2024; Maherndl et al., 2024). However, the collision probability is small due to the low ice crystal number concentration. Furthermore, the normalized rime masses computed from in situ and radar measurements by Maherndl et al. (2024) show only light riming with mean values of about 0.03 on this day, which is small.
In summary, there is agreement between the measured vertical profiles of the effective radius of liquid cloud droplets and the applied entraining parcel model within the range given by the measurement uncertainties. The measurements indicate that collision and coalescence processes of liquid cloud droplets can be neglected in the observed clouds. Furthermore, they suggest that ice processes, such as heterogeneous freezing of supercooled liquid cloud droplets, riming, and the WBF mechanism, did not significantly impact the cloud liquid water during the initial phase of this MCAO. The parcel model realistically describes the evolution of the liquid cloud droplets in the observed low-level Arctic mixed-phase clouds, except when the clouds are decoupled from the surface.
4.3 Limitations
Nevertheless, we discuss some limitations of the presented methods and results in the following. In general, the same limitations as in Weber et al. (2026) apply, including, for example, the issue of the cloud mask in the presence of sea ice, affecting the retrieved ice fractions in the marginal sea ice zone, and increased measurement uncertainties due to large solar zenith angles in the Arctic. Strictly speaking, the method by Rosenfeld and Lensky (1998) and Lensky and Rosenfeld (2006) for constructing pseudo-vertical profiles from passive imaging observations was only validated for the cloud droplet effective radius. Here, it was also applied to the cloud thermodynamic phase in Sect. 3.1, assuming that the thermodynamic phase is also a conserved quantity and horizontally homogeneous for a given temperature respectively height, similar to the effective radius, for every time interval along the cloud evolution. Therefore, the obtained pseudo-vertical profiles were compared to radar and lidar observations, which provide vertical information about the clouds and showed general agreement with the specMACS observations. In addition, the observations are in agreement with our theoretical understanding and with the literature. Nevertheless, a study similar to Lensky and Rosenfeld (2006), based on model data, should be repeated for cloud thermodynamic phase partitioning in future work to further investigate the validity of this assumption. Updrafts in the cloud centers or the influence of entrainment at the cloud sides could, for example, lead to variations of the thermodynamic phase partitioning and deviations from the assumption of homogeneity.
For the parcel model, the assumption of vertically constant cloud droplet number concentration is not entirely correct, and there are large uncertainties in all input parameters to the calculated effective radius profiles from the model. In the future, it would be helpful to have vertical profiles measured by the in situ probes. During the research flight analyzed here, measurements were only taken at a limited number of constant flight levels. Accurate and simultaneous measurements of the effective radius of liquid cloud droplets, pressure, temperature, supersaturation, and cloud droplet number concentration in regions with ice supersaturation and liquid water subsaturation where the WBF mechanism is active would allow to further study the effect of the WBF mechanism and even quantify it. Moreover, the observed low-level Arctic mixed-phase clouds were precipitating. In principle, the parcel model is only applicable to non-precipitating clouds. However, here it was applied only to the liquid part of the clouds, whereas the precipitation was in the ice phase.
It is important to note that the definition of the ice fraction can vary significantly across different studies, depending on the measurement techniques and the specific application (Korolev et al., 2017). These differences should be considered when comparing results from different studies. In this work, the ice fraction refers to an optical ice fraction based on the optical thickness, whereas the ice index provides qualitative information about cloud thermodynamic phase, which can be used for a phase classification.
This work investigated the vertical distribution of cloud microphysical properties and its evolution during the initial phase of the marine cold air outbreak observed on 1 April 2022 in the Fram Strait, based on measurements of the hyperspectral and polarized imaging system specMACS during the HALO–(𝒜𝒞)3 measurement campaign. In particular, the vertical distribution and temperature dependence of the cloud thermodynamic phase and the vertical evolution of the effective radius of liquid cloud droplets were analyzed within a quasi-Lagrangian framework. To this end, the method by Rosenfeld and Lensky (1998) and Lensky and Rosenfeld (2006) for constructing pseudo-vertical profiles of cloud properties was extended to Arctic mixed-phase clouds, and the measurements were combined with backward airmass trajectories.
The initially liquid water clouds transitioned to a mixed-phase regime during the first approximately 30 min the airmass spent above open ocean, according to the specMACS observations, as also discussed in Weber et al. (2026). The pseudo-vertical profiles of the ice index and ice fraction, quantifying the cloud thermodynamic phase, generally increased with decreasing temperature, indicating that ice formation occurred preferentially at the coldest temperatures. In agreement with this, the ice index and ice fraction increased with increasing height, except for a geometrically thin layer at the cloud top, where increasing fractions of supercooled liquid water were observed. This confirmed the existence of a thin, more liquid-dominated layer at the cloud top, as expected in low-level Arctic mixed-phase clouds and observed in previous studies. With increasing time above open ocean, the ice index and ice fraction generally increased and ice propagated increasingly towards lower altitudes. In addition, the measured pseudo-vertical profiles of the effective radius of liquid cloud droplets showed increasing droplet sizes with increasing height, as expected from theory.
Furthermore, vertical profiles of the cloud droplet effective radius were calculated using an entraining parcel model and compared to the measured pseudo-vertical profiles to test the ability of the model to describe cloud liquid water in the observed mixed-phase clouds and to study the influence of ice processes on the liquid cloud droplets. Agreement within the uncertainties of the measured and calculated vertical profiles of the effective radius of liquid water droplets was observed, except for short times above open ocean near the sea ice edge, when the clouds were still decoupled from the surface and the parcel model is not applicable. This indicated that ice processes, such as ice formation through heterogeneous freezing of supercooled liquid water droplets, riming, and the Wegener-Bergeron-Findeisen mechanism, did not significantly impact the cloud liquid water during the initial phase of the observed cold air outbreak. Collision and coalescence of liquid cloud droplets were not relevant in the observed clouds due to the small droplet sizes. It is concluded that the parcel model, combined with the applied entrainment model, realistically represents liquid water in the observed low-level Arctic mixed-phase clouds. The observations are, in general, in agreement with our theoretical understanding of Arctic mixed-phase clouds.
The findings of this work are based on a single case study. According to the MCAO index climatology, the observed MCAO on 1 April 2022 in the Fram Strait was a typical event for the region during the time of the year (Walbröl et al., 2024; Kirbus et al., 2024). However, the variability in the cloud evolution across the different observed MCAOs during HALO–(𝒜𝒞)3 was large (e.g. Weber et al., 2026), and the case on 1 April 2022 is therefore not necessarily representative of the evolution of clouds during MCAOs in general. At the same time, a previous study based on satellite observations observed a “phase-stable” MCAO regime with high and relatively constant fractions of liquid water clouds over a long period of time (Seppala et al., 2025). The MCAO on 1 April 2022 in the Fram Strait might be classified as one of these events.
Nevertheless, the analyses presented in this work provide unique observational data of microphysical properties of low-level Arctic mixed-phase clouds, their vertical distribution, and their evolution during a MCAO in the Arctic. In particular, the partitioning and vertical distribution of cloud thermodynamic phase and cloud liquid water were investigated, which are not well represented in models and are difficult to measure. These data can help to provide constraints to models to improve the representation of mixed-phase clouds and their evolution during MCAOs in the Arctic and to further our understanding of the microphysical processes in these clouds.
The data collected during the HALO–(𝒜𝒞)3 campaign are published on PANGAEA (Ehrlich et al., 2025). The measurements of the SWIR camera of specMACS are available at Weber et al. (2024) (https://doi.org/10.1594/PANGAEA.966992), VELOX measurements at Schäfer et al. (2023) (https://doi.org/10.1594/PANGAEA.963401), dropsonde measurements at George et al. (2024) (https://doi.org/10.1594/PANGAEA.968891), in situ observations at Moser et al. (2023) (https://doi.org/10.1594/PANGAEA.963247), measurements of the HAMP radar at Dorff et al. (2024) (https://doi.org/10.1594/PANGAEA.974108), the WALES lidar observations at Wirth and Groß (2024) (https://doi.org/10.1594/PANGAEA.967086), and the backward trajectories for Polar 6 at Kirbus and Wendisch (2024) (https://doi.org/10.1594/PANGAEA.971921). Retrieval results from specMACS, the HALO backward trajectories, and the analysis codes used in this work can be provided upon request from the corresponding author.
The supplement related to this article is available online at https://doi.org/10.5194/acp-26-8001-2026-supplement.
AW evaluated all data, performed the analyses, and wrote the manuscript with input from all co-athours. FH had the idea to apply the parcel model. FH and BM provided valuable feedback to the analyses and the outline of the study. All authors contributed to the discussion of the results.
At least one of the (co-)authors is a member of the editorial board of Atmospheric Measurement Techniques. The peer-review process was guided by an independent editor, and the authors also have no other competing interests to declare.
Publisher's note: Copernicus Publications remains neutral with regard to jurisdictional claims made in the text, published maps, institutional affiliations, or any other geographical representation in this paper. The authors bear the ultimate responsibility for providing appropriate place names. Views expressed in the text are those of the authors and do not necessarily reflect the views of the publisher.
This article is part of the special issue “HALO-(AC)³ – an airborne campaign to study air mass transformations during warm-air intrusions and cold-air outbreaks”. It is not associated with a conference.
We thank Benjamin Kirbus for computing the backward trajectories, and Manfred Wendisch for valuable feedback to the presented results. In addition, we would like to thank Lea Volkmer for applying the stereographic retrieval to the specMACS observations, Manuel Moser for help and explanations regarding the in situ data, and Sophie Rosenburg and Michael Schäfer for information to the VELOX observations. In addition, we thank the responsibles for the lidar data Martin Wirth and Silke Groß, Henning Dorff for the radar data, and Geet George for the data from the dropsondes, and the entire HALO-(𝒜𝒞)3 team involved in the realization of the measurement flights and the data processing. Furthermore, we thank the Institute of Environmental Physics, University of Bremen for the provision of the merged MODIS-AMSR2 sea-ice concentration data at https://data.seaice.uni-bremen.de/modis_amsr2 (last access: 18 September 2023).
This research has been supported by the Deutsche Forschungsgemeinschaft (grant no. 442667104 (SPP 1294)).
This paper was edited by Luisa Ickes and reviewed by two anonymous referees.
Abel, S. J., Boutle, I. A., Waite, K., Fox, S., Brown, P. R. A., Cotton, R., Lloyd, G., Choularton, T. W., and Bower, K. N.: The Role of Precipitation in Controlling the Transition from Stratocumulus to Cumulus Clouds in a Northern Hemisphere Cold-Air Outbreak, J. Atmos. Sci., 74, 2293–2314, https://doi.org/10.1175/JAS-D-16-0362.1, 2017. a, b, c, d
Ansmann, A., Mattis, I., Müller, D., Wandinger, U., Radlach, M., Althausen, D., and Damoah, R.: Ice formation in Saharan dust over central Europe observed with temperature/humidity/aerosol Raman lidar, J. Geophys. Res., 110, https://doi.org/10.1029/2004JD005000, 2005. a
Ávila, E. E., Castellano, N. E., Saunders, C. P. R., Bürgesser, R. E., and Aguirre Varela, G. G.: Initial stages of the riming process on ice crystals, Geophys. Res. Lett., 36, https://doi.org/10.1029/2009GL037723, 2009. a
Bergeron, T.: On the physics of cloud and precipitation, in: Proceedings of the Fifth Assembly of International Union of Geodesy and Geophysics, 156–178, Lisbon, Portugal, 1935. a
Block, K., Schneider, F. A., Mülmenstädt, J., Salzmann, M., and Quaas, J.: Climate models disagree on the sign of total radiative feedback in the Arctic, Tellus A, 72, 1–14, https://doi.org/10.1080/16000870.2019.1696139, 2020. a
Brenguier, J.-L., Pawlowska, H., Schüller, L., Preusker, R., Fischer, J., and Fouquart, Y.: Radiative Properties of Boundary Layer Clouds: Droplet Effective Radius versus Number Concentration, J. Atmos. Sci., 57, 803–821, https://doi.org/10.1175/1520-0469(2000)057<0803:RPOBLC>2.0.CO;2, 2000. a, b, c
Brümmer, B.: Roll and Cell Convection in Wintertime Arctic Cold-Air Outbreaks, J. Atmos. Sci., 56, 2613–2636, https://doi.org/10.1175/1520-0469(1999)056<2613:RACCIW>2.0.CO;2, 1999. a
Cesana, G., Waliser, D. E., Jiang, X., and Li, J.-L. F.: Multimodel evaluation of cloud phase transition using satellite and reanalysis data, J. Geophys. Res.-Atmos., 120, 7871–7892, https://doi.org/10.1002/2014JD022932, 2015. a
Cesana, G. V., Khadir, T., Chepfer, H., and Chiriaco, M.: Southern Ocean Solar Reflection Biases in CMIP6 Models Linked to Cloud Phase and Vertical Structure Representations, Geophys. Res. Lett., 49, e2022GL099777, https://doi.org/10.1029/2022GL099777, 2022. a
Choi, Y.-S., Ho, C.-H., Park, C.-E., Storelvmo, T., and Tan, I.: Influence of cloud phase composition on climate feedbacks, J. Geophys. Res.-Atmos., 119, 3687–3700, https://doi.org/10.1002/2013JD020582, 2014. a
Cohen, J., Zhang, X., Francis, J., Jung, T., Kwok, R., Overland, J., Ballinger, T. J., Bhatt, U. S., Chen, H. W., Coumou, D., Feldstein, S., Gu, H., Handorf, D., Henderson, G., Ionita, M., Kretschmer, M., Laliberte, F., Lee, S., Linderholm, H. W., Maslowski, W., Peings, Y., Pfeiffer, K., Rigor, I., Semmler, T., Stroeve, J., Taylor, P. C., Vavrus, S., Vihma, T., Wang, S., Wendisch, M., Wu, Y., and Yoon, J.: Divergent consensuses on Arctic amplification influence on midlatitude severe winter weather, Nat. Clim. Change, 10, 20–29, https://doi.org/10.1038/s41558-019-0662-y, 2020. a
Cui, Z., Carslaw, K. S., Yin, Y., and Davies, S.: A numerical study of aerosol effects on the dynamics and microphysics of a deep convective cloud in a continental environment, J. Geophys. Res.-Atmos., 111, https://doi.org/10.1029/2005JD005981, 2006. a
Dahlke, S., Solbès, A., and Maturilli, M.: Cold Air Outbreaks in Fram Strait: Climatology, Trends, and Observations During an Extreme Season in 2020, J. Geophys. Res.-Atmos., 127, e2021JD035741, https://doi.org/10.1029/2021JD035741, 2022. a, b
de Boer, G., Morrison, H., Shupe, M. D., and Hildner, R.: Evidence of liquid dependent ice nucleation in high-latitude stratiform clouds from surface remote sensors, Geophys. Res. Lett., 38, https://doi.org/10.1029/2010GL046016, 2011. a
de Rooy, W. C., Bechtold, P., Fröhlich, K., Hohenegger, C., Jonker, H., Mironov, D., Pier Siebesma, A., Teixeira, J., and Yano, J.-I.: Entrainment and detrainment in cumulus convection: an overview, Q. J. Roy. Meteor. Soc., 139, 1–19, https://doi.org/10.1002/qj.1959, 2013. a
Dorff, H., Aubry, C., Ewald, F., Hirsch, L., Jansen, F., Konow, H., Mech, M., Ori, D., Ringel, M., Walbröl, A., Crewell, S., Ehrlich, A., Wendisch, M., and Ament, F.: Unified Airborne Active and Passive Microwave Measurements over Arctic Sea Ice and Ocean during the HALO-(AC)3 Campaign in Spring 2022 (v2.7), PANGAEA [data set], https://doi.org/10.1594/PANGAEA.974108, 2024. a
Ehrlich, A., Bierwirth, E., Wendisch, M., Gayet, J.-F., Mioche, G., Lampert, A., and Heintzenberg, J.: Cloud phase identification of Arctic boundary-layer clouds from airborne spectral reflection measurements: test of three approaches, Atmos. Chem. Phys., 8, 7493–7505, https://doi.org/10.5194/acp-8-7493-2008, 2008. a, b
Ehrlich, A., Wendisch, M., Bierwirth, E., Gayet, J.-F., Mioche, G., Lampert, A., and Mayer, B.: Evidence of ice crystals at cloud top of Arctic boundary-layer mixed-phase clouds derived from airborne remote sensing, Atmos. Chem. Phys., 9, 9401–9416, https://doi.org/10.5194/acp-9-9401-2009, 2009. a
Ehrlich, A., Crewell, S., Herber, A., Klingebiel, M., Lüpkes, C., Mech, M., Becker, S., Borrmann, S., Bozem, H., Buschmann, M., Clemen, H.-C., De La Torre Castro, E., Dorff, H., Dupuy, R., Eppers, O., Ewald, F., George, G., Giez, A., Grawe, S., Gourbeyre, C., Hartmann, J., Jäkel, E., Joppe, P., Jourdan, O., Jurányi, Z., Kirbus, B., Lucke, J., Luebke, A. E., Maahn, M., Maherndl, N., Mallaun, C., Mayer, J., Mertes, S., Mioche, G., Moser, M., Müller, H., Pörtge, V., Risse, N., Roberts, G., Rosenburg, S., Röttenbacher, J., Schäfer, M., Schaefer, J., Schäfler, A., Schirmacher, I., Schneider, J., Schnitt, S., Stratmann, F., Tatzelt, C., Voigt, C., Walbröl, A., Weber, A., Wetzel, B., Wirth, M., and Wendisch, M.: A comprehensive in situ and remote sensing data set collected during the HALO–(𝒜𝒞)3 aircraft campaign, Earth Syst. Sci. Data, 17, 1295–1328, https://doi.org/10.5194/essd-17-1295-2025, 2025. a, b, c, d
Ewald, F., Kölling, T., Baumgartner, A., Zinner, T., and Mayer, B.: Design and characterization of specMACS, a multipurpose hyperspectral cloud and sky imager, Atmos. Meas. Tech., 9, 2015–2042, https://doi.org/10.5194/amt-9-2015-2016, 2016. a, b
Field, P. R., Cotton, R. J., McBeath, K., Lock, A. P., Webster, S., and Allan, R. P.: Improving a convection-permitting model simulation of a cold air outbreak, Q. J. Roy. Meteoro. Soc., 140, 124–138, https://doi.org/10.1002/qj.2116, 2014. a
Field, P. R., Brozkova, R., Chen, M., Dudhia, J., Lac, C., Hara, T., Honnert, R., Olson, J., Siebesma, P., de Roode, S., Tomassini, L., Hill, A., and McTaggart-Cowan, R.: Exploring the convective grey zone with regional simulations of a cold air outbreak, Q. J. Roy. Meteor. Soc., 143, 2537–2555, https://doi.org/10.1002/qj.3105, 2017. a
Findeisen, W.: Die kolloidmeteorologischen Vorgänge bei der Niederschlagsbildung, Meteor. Z., 55, 121–133, 1938. a
Fletcher, J., Mason, S., and Jakob, C.: The Climatology, Meteorology, and Boundary Layer Structure of Marine Cold Air Outbreaks in Both Hemispheres, J. Climate, 29, 1999–2014, https://doi.org/10.1175/JCLI-D-15-0268.1, 2016. a, b
Freud, E. and Rosenfeld, D.: Linear relation between convective cloud drop number concentration and depth for rain initiation, J. Geophys. Res.-Atmos., 117, https://doi.org/10.1029/2011JD016457, 2012. a
Freud, E., Rosenfeld, D., Andreae, M. O., Costa, A. A., and Artaxo, P.: Robust relations between CCN and the vertical evolution of cloud drop size distribution in deep convective clouds, Atmos. Chem. Phys., 8, 1661–1675, https://doi.org/10.5194/acp-8-1661-2008, 2008. a, b
Geerts, B., Giangrande, S. E., McFarquhar, G. M., Xue, L., Abel, S. J., Comstock, J. M., Crewell, S., DeMott, P. J., Ebell, K., Field, P., Hill, T. C. J., Hunzinger, A., Jensen, M. P., Johnson, K. L., Juliano, T. W., Kollias, P., Kosovic, B., Lackner, C., Luke, E., Lüpkes, C., Matthews, A. A., Neggers, R., Ovchinnikov, M., Powers, H., Shupe, M. D., Spengler, T., Swanson, B. E., Tjernström, M., Theisen, A. K., Wales, N. A., Wang, Y., Wendisch, M., and Wu, P.: The COMBLE Campaign: A Study of Marine Boundary Layer Clouds in Arctic Cold-Air Outbreaks, B. Am. Meteor. Soc., 103, E1371–E1389, https://doi.org/10.1175/BAMS-D-21-0044.1, 2022. a, b
George, G., Luebke, A. E., Klingebiel, M., Mech, M., and Ehrlich, A.: Dropsonde measurements from HALO and POLAR 5 during HALO-(AC)3 in 2022 (Level-3), PANGAEA, https://doi.org/10.1594/PANGAEA.968900, in: George, G et al. (2024): Dropsonde measurements from HALO and POLAR 5 during HALO-(AC)3 in 2022 [dataset bundled publication], PANGAEA, https://doi.org/10.1594/PANGAEA.968891, 2024. a
Gerber, H., Frick, G., Jensen, J., and Hudson, J.: Entrainment, Mixing, and Microphysics in Trade-Wind Cumulus, J. Meteor. Soc. Jpn., 86, 87–106, 2008. a
Gierens, R., Kneifel, S., Shupe, M. D., Ebell, K., Maturilli, M., and Löhnert, U.: Low-level mixed-phase clouds in a complex Arctic environment, Atmos. Chem. Phys., 20, 3459–3481, https://doi.org/10.5194/acp-20-3459-2020, 2020. a
Grosvenor, D. P., Sourdeval, O., Zuidema, P., Ackerman, A., Alexandrov, M. D., Bennartz, R., Boers, R., Cairns, B., Chiu, J. C., Christensen, M., Deneke, H., Diamond, M., Feingold, G., Fridlind, A., Hünerbein, A., Knist, C., Kollias, P., Marshak, A., McCoy, D., Merk, D., Painemal, D., Rausch, J., Rosenfeld, D., Russchenberg, H., Seifert, P., Sinclair, K., Stier, P., van Diedenhoven, B., Wendisch, M., Werner, F., Wood, R., Zhang, Z., and Quaas, J.: Remote Sensing of Droplet Number Concentration in Warm Clouds: A Review of the Current State of Knowledge and Perspectives, Rev. Geophys., 56, 409–453, https://doi.org/10.1029/2017RG000593, 2018. a, b, c, d
Hersbach, H., Bell, B., Berrisford, P., Biavati, G., Horányi, A., Muñoz Sabater, J., Nicolas, J., Peubey, C., Radu, R., Rozum, I., Schepers, D., Simmons, A., Soci, C., Dee, D., and Thépaut, J.-N.: ERA5 hourly data on pressure levels from 1940 to present, Copernicus Climate Change Service (C3S) Climate Data Store (CDS), https://doi.org/10.24381/cds.bd0915c6, 2023a. a, b
Hersbach, H., Bell, B., Berrisford, P., Biavati, G., Horányi, A., Muñoz Sabater, J., Nicolas, J., Peubey, C., Radu, R., Rozum, I., Schepers, D., Simmons, A., Soci, C., Dee, D., and Thépaut, J.-N.: ERA5 hourly data on single levels from 1940 to present, Copernicus Climate Change Service (C3S) Climate Data Store (CDS), https://doi.org/10.24381/cds.adbb2d47, 2023b. a, b
Inoue, J., Sato, K., Rinke, A., Cassano, J. J., Fettweis, X., Heinemann, G., Matthes, H., Orr, A., Phillips, T., Seefeldt, M., Solomon, A., and Webster, S.: Clouds and Radiation Processes in Regional Climate Models Evaluated Using Observations Over the Ice-free Arctic Ocean, J. Geophys. Res.-Atmos., 126, e2020JD033904, https://doi.org/10.1029/2020JD033904, 2021. a
Kirbus, B. and Wendisch, M.: Five-day backwards trajectories at one minute resolution along the flight tracks of the Polar 6 research aircraft during HALO-(AC)3, PANGAEA [data set], https://doi.org/10.1594/PANGAEA.971921, 2024. a
Kirbus, B., Schirmacher, I., Klingebiel, M., Schäfer, M., Ehrlich, A., Slättberg, N., Lucke, J., Moser, M., Müller, H., and Wendisch, M.: Thermodynamic and cloud evolution in a cold-air outbreak during HALO-(AC)3: quasi-Lagrangian observations compared to the ERA5 and CARRA reanalyses, Atmos. Chem. Phys., 24, 3883–3904, https://doi.org/10.5194/acp-24-3883-2024, 2024. a, b, c
Kölling, T., Zinner, T., and Mayer, B.: Aircraft-based stereographic reconstruction of 3-D cloud geometry, Atmos. Meas. Tech., 12, 1155–1166, https://doi.org/10.5194/amt-12-1155-2019, 2019. a
Komurcu, M., Storelvmo, T., Tan, I., Lohmann, U., Yun, Y., Penner, J. E., Wang, Y., Liu, X., and Takemura, T.: Intercomparison of the cloud water phase among global climate models, J. Geophys. Res.-Atmos., 119, 3372–3400, https://doi.org/10.1002/2013JD021119, 2014. a
Korolev, A.: Limitations of the Wegener-Bergeron-Findeisen Mechanism in the Evolution of Mixed-Phase Clouds, J. Atmos. Sci., 64, 3372–3375, https://doi.org/10.1175/JAS4035.1, 2007. a
Korolev, A. and Milbrandt, J.: How Are Mixed-Phase Clouds Mixed?, Geophysical Research Letters, 49, e2022GL099578, https://doi.org/10.1029/2022GL099578, 2022. a
Korolev, A., McFarquhar, G., Field, P. R., Franklin, C., Lawson, P., Wang, Z., Williams, E., Abel, S. J., Axisa, D., Borrmann, S., Crosier, J., Fugal, J., Krämer, M., Lohmann, U., Schlenczek, O., Schnaiter, M., and Wendisch, M.: Mixed-Phase Clouds: Progress and Challenges, Meteorol. Monogr., 58, 5.1–5.50, https://doi.org/10.1175/AMSMONOGRAPHS-D-17-0001.1, 2017. a, b, c
Krautstrunk, M. and Giez, A.: The Transition From FALCON to HALO Era Airborne Atmospheric Research, Springer Berlin Heidelberg, Berlin, Heidelberg, 609–624, ISBN 978-3-642-30183-4, https://doi.org/10.1007/978-3-642-30183-4_37, 2012. a
Kretzschmar, J., Salzmann, M., Mülmenstädt, J., and Quaas, J.: Arctic clouds in ECHAM6 and their sensitivity to cloud microphysics and surface fluxes, Atmos. Chem. Phys., 19, 10571–10589, https://doi.org/10.5194/acp-19-10571-2019, 2019. a
Kretzschmar, J., Stapf, J., Klocke, D., Wendisch, M., and Quaas, J.: Employing airborne radiation and cloud microphysics observations to improve cloud representation in ICON at kilometer-scale resolution in the Arctic, Atmos. Chem. Phys., 20, 13145–13165, https://doi.org/10.5194/acp-20-13145-2020, 2020. a
Lensky, I. M. and Rosenfeld, D.: The time-space exchangeability of satellite retrieved relations between cloud top temperature and particle effective radius, Atmos. Chem. Phys., 6, 2887–2894, https://doi.org/10.5194/acp-6-2887-2006, 2006. a, b, c, d, e, f, g, h
Ludwig, V., Spreen, G., and Pedersen, L. T.: Evaluation of a New Merged Sea-Ice Concentration Dataset at 1 km Resolution from Thermal Infrared and Passive Microwave Satellite Data in the Arctic, Remote Sens., 12, https://doi.org/10.3390/rs12193183, 2020. a
Maherndl, N., Moser, M., Lucke, J., Mech, M., Risse, N., Schirmacher, I., and Maahn, M.: Quantifying riming from airborne data during the HALO-(AC)3 campaign, Atmos. Meas. Tech., 17, 1475–1495, https://doi.org/10.5194/amt-17-1475-2024, 2024. a, b
Martin, G. M., Johnson, D. W., and Spice, A.: The Measurement and Parameterization of Effective Radius of Droplets in Warm Stratocumulus Clouds, J. Atmos. Sci., 51, 1823–1842, https://doi.org/10.1175/1520-0469(1994)051<1823:TMAPOE>2.0.CO;2, 1994. a
Matus, A. V. and L'Ecuyer, T. S.: The role of cloud phase in Earth's radiation budget, J. Geophys. Res.-Atmos., 122, 2559–2578, https://doi.org/10.1002/2016JD025951, 2017. a
McCoy, D. T., Hartmann, D. L., Zelinka, M. D., Ceppi, P., and Grosvenor, D. P.: Mixed-phase cloud physics and Southern Ocean cloud feedback in climate models, J. Geophys. Res.-Atmos., 120, 9539–9554, https://doi.org/10.1002/2015JD023603, 2015. a
McCoy, I. L., Wood, R., and Fletcher, J. K.: Identifying Meteorological Controls on Open and Closed Mesoscale Cellular Convection Associated with Marine Cold Air Outbreaks, J. Geophys. Res.-Atmos., 122, 11678–11702, https://doi.org/10.1002/2017JD027031, 2017. a
Mech, M., Orlandi, E., Crewell, S., Ament, F., Hirsch, L., Hagen, M., Peters, G., and Stevens, B.: HAMP – the microwave package on the High Altitude and LOng range research aircraft (HALO), Atmos. Meas. Tech., 7, 4539–4553, https://doi.org/10.5194/amt-7-4539-2014, 2014. a
Morrison, H., De Boer, G., Feingold, G., Harrington, J., Shupe, M., and Sulia, K.: Resilience of persistent Arctic mixed-phase clouds, Nat. Geosci., 5, 11–17, https://doi.org/10.1038/ngeo1332, 2012. a, b, c, d
Moser, M., Lucke, J., De La Torre Castro, E., Mayer, J., and Voigt, C.: DLR in situ cloud measurements during HALO-(AC)3 Arctic airborne campaign, PANGAEA [data set], https://doi.org/10.1594/PANGAEA.963247, 2023. a
Moser, M., Voigt, C., Jurkat-Witschas, T., Hahn, V., Mioche, G., Jourdan, O., Dupuy, R., Gourbeyre, C., Schwarzenboeck, A., Lucke, J., Boose, Y., Mech, M., Borrmann, S., Ehrlich, A., Herber, A., Lüpkes, C., and Wendisch, M.: Microphysical and thermodynamic phase analyses of Arctic low-level clouds measured above the sea ice and the open ocean in spring and summer, Atmos. Chem. Phys., 23, 7257–7280, https://doi.org/10.5194/acp-23-7257-2023, 2023. a, b, c
Moser, M., Voigt, C., Eppers, O., Lucke, J., De La Torre Castro, E., Mayer, J., Dupuy, R., Mioche, G., Jourdan, O., Clemen, H.-C., Schneider, J., Joppe, P., Mertes, S., Wetzel, B., Borrmann, S., Klingebiel, M., Mech, M., Lüpkes, C., Crewell, S., Ehrlich, A., Herber, A., and Wendisch, M.: The Arctic Low-Level Mixed-Phase Haze Regime and its Microphysical Differences to Mixed-Phase Clouds, Atmos. Chem. Phys., 26, 1867–1887, https://doi.org/10.5194/acp-26-1867-2026, 2026. a
Murray-Watson, R. J., Gryspeerdt, E., and Goren, T.: Investigating the development of clouds within marine cold-air outbreaks, Atmos. Chem. Phys., 23, 9365–9383, https://doi.org/10.5194/acp-23-9365-2023, 2023. a, b, c, d
Painemal, D. and Zuidema, P.: Assessment of MODIS cloud effective radius and optical thickness retrievals over the Southeast Pacific with VOCALS-REx in situ measurements, J. Geophys. Res.-Atmos., 116, https://doi.org/10.1029/2011JD016155, 2011. a
Papritz, L. and Spengler, T.: A Lagrangian Climatology of Wintertime Cold Air Outbreaks in the Irminger and Nordic Seas and Their Role in Shaping Air-Sea Heat Fluxes, J. Climate, 30, 2717–2737, https://doi.org/10.1175/JCLI-D-16-0605.1, 2017. a, b, c, d, e
Pawlowska, H. and Brenguier, J.-L.: Microphysical properties of stratocumulus clouds during ACE-2, Tellus B, 52, 868–887, https://doi.org/10.1034/j.1600-0889.2000.00076.x, 2000. a
Pithan, F., Medeiros, B., and Mauritsen, T.: Mixed-phase clouds cause climate model biases in Arctic wintertime temperature inversions, Clim. Dynam., https://doi.org/10.1007/s00382-013-1964-9, 2014. a, b, c
Pithan, F., Ackerman, A., Angevine, W. M., Hartung, K., Ickes, L., Kelley, M., Medeiros, B., Sandu, I., Steeneveld, G.-J., Sterk, H. A. M., Svensson, G., Vaillancourt, P. A., and Zadra, A.: Select strengths and biases of models in representing the Arctic winter boundary layer over sea ice: the Larcform 1 single column model intercomparison, J. Adv. Model. Earth Sy., 8, 1345–1357, https://doi.org/10.1002/2016MS000630, 2016. a
Pithan, F., Svensson, G., Caballero, R., Chechin, D., Cronin, T. W., Ekman, A. M. L., Neggers, R., Shupe, M. D., Solomon, A., Tjernström, M., and Wendisch, M.: Role of air-mass transformations in exchange between the Arctic and mid-latitudes, Nat. Geosci., 11, 805–812, https://doi.org/10.1038/s41561-018-0234-1, 2018. a, b, c
Pörtge, V., Kölling, T., Weber, A., Volkmer, L., Emde, C., Zinner, T., Forster, L., and Mayer, B.: High-spatial-resolution retrieval of cloud droplet size distribution from polarized observations of the cloudbow, Atmos. Meas. Tech., 16, 645–667, https://doi.org/10.5194/amt-16-645-2023, 2023. a
Pörtge, V. T.: Understanding cloud droplet size distributions from multi-angle polarimetric observations, https://doi.org/10.5282/edoc.34002, 2024. a
Rosenfeld, D. and Lensky, I. M.: Satellite-Based Insights into Precipitation Formation Processes in Continental and Maritime Convective Clouds, B. Am. Meteor. Soc., 79, 2457–2476, https://doi.org/10.1175/1520-0477(1998)079<2457:SBIIPF>2.0.CO;2, 1998. a, b, c, d, e, f
Ruiz-Donoso, E., Ehrlich, A., Schäfer, M., Jäkel, E., Schemann, V., Crewell, S., Mech, M., Kulla, B. S., Kliesch, L.-L., Neuber, R., and Wendisch, M.: Small-scale structure of thermodynamic phase in Arctic mixed-phase clouds observed by airborne remote sensing during a cold air outbreak and a warm air advection event, Atmos. Chem. Phys., 20, 5487–5511, https://doi.org/10.5194/acp-20-5487-2020, 2020. a, b
Saleeby, S. M. and Cotton, W. R.: A Binned Approach to Cloud-Droplet Riming Implemented in a Bulk Microphysics Model, J. Appl. Meteorol. Clim., 47, 694–703, https://doi.org/10.1175/2007JAMC1664.1, 2008. a
Sanchez, K. J., Zhang, B., Liu, H., Brown, M. D., Crosbie, E. C., Gallo, F., Hair, J. W., Hostetler, C. A., Jordan, C. E., Robinson, C. E., Scarino, A. J., Shingler, T. J., Shook, M. A., Thornhill, K. L., Wiggins, E. B., Winstead, E. L., Ziemba, L. D., Saliba, G., Lewis, S. L., Russell, L. M., Quinn, P. K., Bates, T. S., Porter, J., Bell, T. G., Gaube, P., Saltzman, E. S., Behrenfeld, M. J., and Moore, R. H.: North Atlantic Ocean SST-gradient-driven variations in aerosol and cloud evolution along Lagrangian cold-air outbreak trajectories, Atmos. Chem. Phys., 22, 2795–2815, https://doi.org/10.5194/acp-22-2795-2022, 2022. a
Sato, Y., Miura, H., Yashiro, H., Goto, D., Takemura, T., Tomita, H., and Nakajima, T.: Unrealistically pristine air in the Arctic produced by current global scale models, Sci. Rep., 6, https://doi.org/10.1038/srep26561, 2016. a
Schäfer, M., Bierwirth, E., Ehrlich, A., Jäkel, E., Werner, F., and Wendisch, M.: Directional, horizontal inhomogeneities of cloud optical thickness fields retrieved from ground-based and airbornespectral imaging, Atmos. Chem. Phys., 17, 2359–2372, https://doi.org/10.5194/acp-17-2359-2017, 2017. a
Schäfer, M., Loewe, K., Ehrlich, A., Hoose, C., and Wendisch, M.: Simulated and observed horizontal inhomogeneities of optical thickness of Arctic stratus, Atmos. Chem. Phys., 18, 13115–13133, https://doi.org/10.5194/acp-18-13115-2018, 2018. a
Schäfer, M., Wolf, K., Ehrlich, A., Hallbauer, C., Jäkel, E., Jansen, F., Luebke, A. E., Müller, J., Thoböll, J., Röschenthaler, T., Stevens, B., and Wendisch, M.: VELOX – a new thermal infrared imager for airborne remote sensing of cloud and surface properties, Atmos. Meas. Tech., 15, 1491–1509, https://doi.org/10.5194/amt-15-1491-2022, 2022. a
Schäfer, M., Rosenburg, S., Ehrlich, A., Röttenbacher, J., and Wendisch, M.: Two-dimensional cloud-top and surface brightness temperature with 1 Hz temporal resolution derived at flight altitude from VELOX during the HALO-(AC)3 field campaign, PANGAEA [data set], https://doi.org/10.1594/PANGAEA.963401, 2023. a
Schirmacher, I., Schnitt, S., Klingebiel, M., Maherndl, N., Kirbus, B., Ehrlich, A., Mech, M., and Crewell, S.: Clouds and precipitation in the initial phase of marine cold-air outbreaks as observed by airborne remote sensing, Atmos. Chem. Phys., 24, 12823–12842, https://doi.org/10.5194/acp-24-12823-2024, 2024. a, b, c, d
Seppala, H., Zhang, Z., and Zheng, X.: Developing a Lagrangian Frame Transformation on Satellite Data to Study Cloud Microphysical Transitions in Arctic Marine Cold Air Outbreaks, Geophys. Res. Lett., 52, e2025GL115637, https://doi.org/10.1029/2025GL115637, 2025. a
Shupe, M. D., Matrosov, S. Y., and Uttal, T.: Arctic Mixed-Phase Cloud Properties Derived from Surface-Based Sensors at SHEBA, J. Atmos. Sci., 63, 697–711, https://doi.org/10.1175/JAS3659.1, 2006. a
Smith, D. M., Screen, J. A., Deser, C., Cohen, J., Fyfe, J. C., García-Serrano, J., Jung, T., Kattsov, V., Matei, D., Msadek, R., Peings, Y., Sigmond, M., Ukita, J., Yoon, J.-H., and Zhang, X.: The Polar Amplification Model Intercomparison Project (PAMIP) contribution to CMIP6: investigating the causes and consequences of polar amplification, Geosci. Model Dev., 12, 1139–1164, https://doi.org/10.5194/gmd-12-1139-2019, 2019. a
Sotiropoulou, G., Sedlar, J., Tjernström, M., Shupe, M. D., Brooks, I. M., and Persson, P. O. G.: The thermodynamic structure of summer Arctic stratocumulus and the dynamic coupling to the surface, Atmos. Chem. Phys., 14, 12573–12592, https://doi.org/10.5194/acp-14-12573-2014, 2014. a
Sprenger, M. and Wernli, H.: The LAGRANTO Lagrangian analysis tool – version 2.0, Geosci. Model Dev., 8, 2569–2586, https://doi.org/10.5194/gmd-8-2569-2015, 2015. a
Svingen, K., Brakstad, A., Våge, K., von Appen, W.-J., and Papritz, L.: The Impact of Cold-Air Outbreaks and Oceanic Lateral Fluxes on Dense-Water Formation in the Greenland Sea from a 10-Year Moored Record (1999–2009), J. Phys. Oceanogr., 53, 1499–1517, https://doi.org/10.1175/JPO-D-22-0160.1, 2023. a
Tan, I. and Storelvmo, T.: Evidence of Strong Contributions From Mixed-Phase Clouds to Arctic Climate Change, Geophys. Res. Lett., 46, 2894–2902, https://doi.org/10.1029/2018GL081871, 2019. a
Tan, I., Sotiropoulou, G., Taylor, P. C., Zamora, L., and Wendisch, M.: A Review of the Factors Influencing Arctic Mixed-Phase Clouds: Progress and Outlook, chap. 5, 103–132, American Geophysical Union (AGU), ISBN 9781119700357, https://doi.org/10.1002/9781119700357.ch5, 2023. a
Tomassini, L., Field, P. R., Honnert, R., Malardel, S., McTaggart-Cowan, R., Saitou, K., Noda, A. T., and Seifert, A.: The “Grey Zone” cold air outbreak global model intercomparison: A cross evaluation using large-eddy simulations, J. Adv. Model. Earth Sy., 9, 39–64, https://doi.org/10.1002/2016MS000822, 2017. a
Tornow, F., Ackerman, A. S., and Fridlind, A. M.: Preconditioning of overcast-to-broken cloud transitions by riming in marine cold air outbreaks, Atmos. Chem. Phys., 21, 12049–12067, https://doi.org/10.5194/acp-21-12049-2021, 2021. a
Volkmer, L., Pörtge, V., Jakub, F., and Mayer, B.: Model-based evaluation of cloud geometry and droplet size retrievals from two-dimensional polarized measurements of specMACS, Atmos. Meas. Tech., 17, 1703–1719, https://doi.org/10.5194/amt-17-1703-2024, 2024. a, b, c
Walbröl, A., Michaelis, J., Becker, S., Dorff, H., Ebell, K., Gorodetskaya, I., Heinold, B., Kirbus, B., Lauer, M., Maherndl, N., Maturilli, M., Mayer, J., Müller, H., Neggers, R. A. J., Paulus, F. M., Röttenbacher, J., Rückert, J. E., Schirmacher, I., Slättberg, N., Ehrlich, A., Wendisch, M., and Crewell, S.: Contrasting extremely warm and long-lasting cold air anomalies in the North Atlantic sector of the Arctic during the HALO–(𝒜𝒞)3 campaign, Atmos. Chem. Phys., 24, 8007–8029, https://doi.org/10.5194/acp-24-8007-2024, 2024. a
Wang, P. K. and Ji, W.: Collision Efficiencies of Ice Crystals at Low–Intermediate Reynolds Numbers Colliding with Supercooled Cloud Droplets: A Numerical Study, J. Atmos. Sci., 57, 1001–1009, https://doi.org/10.1175/1520-0469(2000)057<1001:CEOICA>2.0.CO;2, 2000. a
Weber, A., Kölling, T., Pörtge, V., Baumgartner, A., Rammeloo, C., Zinner, T., and Mayer, B.: Polarization upgrade of specMACS: calibration and characterization of the 2D RGB polarization-resolving cameras, Atmos. Meas. Tech., 17, 1419–1439, https://doi.org/10.5194/amt-17-1419-2024, 2024. a, b
Weber, A., Pörtge, V., Zinner, T., and Mayer, B.: Spectral radiance measurements with the hyperspectral and polarized imaging system specMACS during the HALO-(AC)3 field campaign, PANGAEA [data set], https://doi.org/10.1594/PANGAEA.966992, 2024. a
Weber, A., Pörtge, V., Emde, C., and Mayer, B.: Retrieval of cloud thermodynamic phase partitioning from multi-angle polarimetric imaging of Arctic mixed-phase clouds, Atmos. Meas. Tech., 18, 7581–7601, https://doi.org/10.5194/amt-18-7581-2025, 2025. a, b, c, d, e, f
Weber, A., Kirbus, B., Wendisch, M., and Mayer, B.: Quasi-Lagrangian observations of cloud transitions during the initial phase of marine cold air outbreaks in the Arctic – Part 1: Temporal and spatial evolution, Atmos. Chem. Phys., 26, 3521–3540, https://doi.org/10.5194/acp-26-3521-2026, 2026. a, b, c, d, e, f, g, h, i, j, k, l
Wegener, A.: Thermodynamik der Atmosphäre, J. A. Barth, Leipzig, 1911. a
Wendisch, M., Handorf, D., Tegen, I., Neggers, R. A. J., and Spreen, G.: Glimpsing the Ins and Outs of the Arctic Atmospheric Cauldron, Eos, 102, https://doi.org/10.1029/2021EO155959, 2021. a, b
Wendisch, M., Crewell, S., Ehrlich, A., Herber, A., Kirbus, B., Lüpkes, C., Mech, M., Abel, S. J., Akansu, E. F., Ament, F., Aubry, C., Becker, S., Borrmann, S., Bozem, H., Brückner, M., Clemen, H.-C., Dahlke, S., Dekoutsidis, G., Delanoë, J., De La Torre Castro, E., Dorff, H., Dupuy, R., Eppers, O., Ewald, F., George, G., Gorodetskaya, I. V., Grawe, S., Groß, S., Hartmann, J., Henning, S., Hirsch, L., Jäkel, E., Joppe, P., Jourdan, O., Jurányi, Z., Karalis, M., Kellermann, M., Klingebiel, M., Lonardi, M., Lucke, J., Luebke, A. E., Maahn, M., Maherndl, N., Maturilli, M., Mayer, B., Mayer, J., Mertes, S., Michaelis, J., Michalkov, M., Mioche, G., Moser, M., Müller, H., Neggers, R., Ori, D., Paul, D., Paulus, F. M., Pilz, C., Pithan, F., Pöhlker, M., Pörtge, V., Ringel, M., Risse, N., Roberts, G. C., Rosenburg, S., Röttenbacher, J., Rückert, J., Schäfer, M., Schaefer, J., Schemann, V., Schirmacher, I., Schmidt, J., Schmidt, S., Schneider, J., Schnitt, S., Schwarz, A., Siebert, H., Sodemann, H., Sperzel, T., Spreen, G., Stevens, B., Stratmann, F., Svensson, G., Tatzelt, C., Tuch, T., Vihma, T., Voigt, C., Volkmer, L., Walbröl, A., Weber, A., Wehner, B., Wetzel, B., Wirth, M., and Zinner, T.: Overview: quasi-Lagrangian observations of Arctic air mass transformations – introduction and initial results of the HALO–(𝒜𝒞)3 aircraft campaign, Atmos. Chem. Phys., 24, 8865–8892, https://doi.org/10.5194/acp-24-8865-2024, 2024. a, b, c, d, e
Wendisch, M., Kirbus, B., Ori, D., Shupe, M. D., Crewell, S., Sodemann, H., and Schemann, V.: Observed and modeled Arctic airmass transformations during warm air intrusions and cold air outbreaks, Atmos. Chem. Phys., 25, 15047–15076, https://doi.org/10.5194/acp-25-15047-2025, 2025. a
Wesche, C., Steinhage, D., and Nixdorf, U.: Polar aircraft Polar5 and Polar6 operated by the Alfred Wegener Institute, Journal of Large-Scale Research Facilities, 2, A87, https://doi.org/10.17815/jlsrf-2-153, 2016. a
Wirth, M. and Groß, S.: Aircraft measurements of backscatter ratio, particle depolarization and water vapour molecular density profiles over Arctic sea ice and ocean during the HALO-(AC)3 campaign in spring 2022, PANGAEA [data set], https://doi.org/10.1594/PANGAEA.967086, 2024. a
Wirth, M., Fix, A., Mahnke, P., Schwarzer, H., Schrandt, F., and Ehret, G.: The airborne multi-wavelength water vapor differential absorption LIDAR WALES: system design and performance, Appl. Phys. B, 96, 201–213, https://doi.org/10.1007/s00340-009-3365-7, 2009. a
Zhang, S., Xue, H., and Feingold, G.: Vertical profiles of droplet effective radius in shallow convective clouds, Atmos. Chem. Phys., 11, 4633–4644, https://doi.org/10.5194/acp-11-4633-2011, 2011. a