the Creative Commons Attribution 4.0 License.
the Creative Commons Attribution 4.0 License.
 | 02 Jun 2026
Distinct dual-isotopic signatures of major methane sources in South Asia
Katja Belec
Henry Holmstrand
Josh Balacky
Abdus Salam
Krishnakant Budhavant
Mohanan Remani Manoj
Khaled Shaifullah Joy
Md. Alamin Hossain
Atinderpal Singh
Anil Patel
Neeraj Rastogi
Chinmay Mallik
Kirpa Ram
Gyanesh Kumar Singh
Örjan Gustafsson
Methane is a powerful greenhouse gas contributing significantly to global warming. South Asia is a major methane emission region, yet source-diagnostic isotopic signatures remain poorly constrained, limiting top-down source attribution. To address this gap, we conducted extensive sampling and isotopic analyses of major methane sources in South Asia. Our results reveal substantial deviations of South Asian methane source fingerprints from global means. Methane from C3 biomass burning is more depleted in δ13C () but more enriched in δ2H () relative to global means, while ruminant methane (C3) is strongly depleted in both δ13C () and δ2H (). In contrast, rice paddy methane is more enriched in δ13C () and δ2H () than global means, with their ratios signaling pre-emission oxidation. Wastewater methane shows enriched δ13C () and depleted δ2H () relative to global means, with minimal oxidation or spatial variation. These pronounced regional differences highlight the importance of using regionally constrained source fingerprints in isotope-based source apportionment. A global synthesis further shows that δ13C signatures of biomass burning and ruminant methane are primarily controlled by C3 C4 feedstocks, whereas δ2H is relatively insensitive to substrate type. Methane from rice paddies and wetlands exhibits strong latitudinal gradients worldwide. Combining emission inventories with source-specific isotope fingerprints reveals a mismatch with atmospheric methane in South Asia, suggesting an overestimation of rice paddy emissions and/or an underestimation of other microbial sources. These findings demonstrate the utility of top-down dual-isotope constraints to refine regional methane budgets and mitigation strategies.
- Article
(5466 KB) - Full-text XML
-
Supplement
(3002 KB) - BibTeX
- EndNote


Mitigating methane emissions is critical for achieving the Paris Agreement 2 °C target (e.g., Rogelj et al., 2016). Methane (CH4) is a potent greenhouse gas (GHG) with a 20 year global warming potential 84 times that of an equal mass of CO2, contributing ∼20 % to total global warming (Naik et al., 2023). Despite its significance, the drivers of recent methane increases remain uncertain (Nisbet et al., 2023; Schaeffer et al., 2025), although latest studies are beginning to address these gaps (Ciais et al., 2026; Nisbet and Manning, 2026), highlighting the need for precise monitoring and effective mitigation strategies. Anthropogenic emissions are major contributors (Bousquet et al., 2006; Zhang et al., 2022; Saunois et al., 2025) and understanding methane sources and sinks is essential for targeted reduction efforts. The tropics, particularly South Asia, account for an estimated ∼60 % of global methane emissions (Jackson et al., 2020; Feng et al., 2022; Saunois et al., 2025). South Asia is one of the largest and fastest-growing methane emitting regions, with contributions believed to be primarily from anthropogenic sources (Stavert et al., 2022). The region experiences extensive both natural and anthropogenic biomass burning (Kirschke et al., 2013; Saunois et al., 2025), hosts the world's largest ruminant population (Ganesan et al., 2017), is a major rice producer (Singh et al., 2021) and has substantial waste emissions from the dense population (Chakraborty et al., 2011). However, methane source apportionment and quantification in this region are limited and remain highly uncertain.
Methane sources are broadly classified as microbial, combustion and thermogenic (Whiticar, 1999). Microbial sources include e.g., wetlands, rice paddies, ruminants, landfills and wastewater (Masson-Delmotte et al., 2021). Combustion sources of methane are dominated by agricultural biomass burning and wildfire emissions but also include coal combustion, traffic emissions and other combustion processes (Saunois et al., 2025; Nisbet et al., 2025). Thermogenic methane originates from fugitive emissions during fossil fuel extraction, transport and processing, as well as geological sources (Sherwood et al., 2017; Menoud et al., 2022). The spatial and temporal variability of these sources, coupled with the atmosphere's open system, introduces substantial uncertainties in methane estimates (Saunois et al., 2025). Bottom-up estimates of methane emissions remain uncertain due to varying methodologies and biases across different source sectors (Zavala-Araiza et al., 2015; Hristov et al., 2017). Recent satellite-based top-down observations have helped to improve some estimates (Lauvaux et al., 2022; Shen et al., 2023; Cusworth et al., 2024), yet are challenged by dispersed sources such as from ruminants and waste that are distributed through the landscape.
Estimates of methane emissions based on isotopic constraints are promising for fingerprinting the relative source contributions in an intercepted receptor setting, yet remain limited by uncertainties in both source-specific isotopic signatures and in atmospheric sinks. Moreover, large-scale top-down isotopic observations are lacking. Nevertheless, isotopic analysis can be a powerful tool for not only the source attribution but also for quantification of their reaction sinks (Fischer et al., 2008; Bock et al., 2017; Dyonisius et al., 2020; Nisbet et al., 2023). However, methane isotopic studies in South Asia remain highly limited (Rao et al., 2008; Metya et al., 2022), with isotopic source signatures nearly completely lacking (Metya et al., 2022; Brownlow et al., 2017). Establishing regional isotopic source signatures is critical for achieving source apportionment and reducing uncertainties in estimates of methane emissions.
In this study, we analyzed δ13C and δ2H signatures from four key methane emitting sources in South Asia, namely biomass burning, ruminants, rice paddies and wastewater. By evaluating isotopic variability across emission processes, sampling techniques and geographic regions, this work aims to constrain methane isotopic source signatures and thereby facilitate subsequent top-down isotope-based source apportionment to reduce uncertainties in methane emissions. A global review of methane isotopic values was further conducted to compare with South Asian sources.
2.1 Gaseous and aqueous methane source sampling
Cattle ruminant samples in South Asia were collected using a custom-built sampling instrument. Sample air was passed through magnesium perchlorate (CAS# 10034-81-8, Alfa Aesar) to remove moisture, into an electrically-powered membrane pump (KNF Neuberger N86), and out into two cylindrical 1000 mL borosilicate 3.3 glass flasks (Normag, Germany) with axial inlet and outlet, connected in series. The inlet and outlet of each flask were sealed with a Normag needle valve with high-diffusion-minimized sealing. Tubing was made of PTFE and Synflex® and connections were Swagelok® and UltraTorr™. The flasks were pre-conditioned with clean air (Strandmøllen, 20.9 % oxygen, and 79.180 % nitrogen, CnHm≤3 ppm, CO2≤1 ppm, CO≤1 ppm, H2O≤3 ppm) to eliminate contaminants. Before sampling, the flasks were conditioned in a 4-step protocol: Evacuated at high vacuum at 50 °C for 12 h, purged with nitrogen at 50 °C for 2 h, again evacuated at high vacuum at 50 °C, for 3 h, and finally filled with pre-conditioned clean air to a pressure of 1.3 bar (absolute). Sampling was conducted by positioning a funnel 2–5 cm from the cattle's mouths to capture their breath. The sample air was pumped through the flasks for 5 min, then closing the outlet valve and letting pressure build up to 1.7 bar (absolute), after which the flask valves were closed. Finally, flask in- and outlets were sealed with parafilm to prevent contamination from dust etc.
For combustion sources, we collected exhaust samples from agricultural crop residue burning in South Asian fields using the same custom-built instrument. Sampling was performed 3–15 cm from the burning rice paddies. A 0.45 µm inline gas filter was placed between the PTFE tubing and the metal tubing to remove aerosols. Each sampling session lasted 5 min, with the final flask pressure reaching 1.2 bar (absolute).
Samples were also collected to constrain the isotope fingerprints of aqueous microbial sources in South Asia, including rice paddies and wastewater. Rice paddy sampling involved dividing each paddy into four quadrants and taking one to three replicate samples from the center of each quadrant, totaling 4–12 samples per paddy field. For wastewater, three replicate samples were collected from sewage at each location. Before sampling, glass vials (VMR) were rinsed thrice with 125 mL of either rice paddy water or wastewater. Samples were then collected by submerging the vials to mid-depth (approximately 20 cm depth, the exact depth varied depending on the flooding conditions in individual paddy fields) for 20 s until bubbling ceased, followed by an additional five-second hold. The vials were then sealed with a bromine butyl rubber stopper (Apodan Nordic) attached to a string. After sampling, 0.5 mL of saturated ZnCl2 solution was added as a preservative, and the vials were crimp-sealed, labeled, and stored at 4 °C in the dark before and after being shipped to Stockholm University for further analysis.
Thus, we collected a substantial number of methane samples from the four sources: ruminants, biomass burning, rice paddies and wastewater (see Data S1 in the Supplement for details of each sample). Among them, ruminants and biomass burning represent two major sources of gaseous methane, while rice paddies and wastewater are significant atmospheric sources of aqueous, dissolved methane. The ruminant samples were obtained from 6 farms across South Asia, totaling 40 samples. For biomass burning, we conducted 4 sampling campaigns in different regions, collecting a total of 17 samples. Rice paddy samples were collected from 18 different rice-growing areas, amounting to 185 samples. Wastewater samples were gathered from 13 sewage treatment plants, totaling 38 samples. The sample distribution is illustrated in Fig. 1, with gaseous methane samples from biomass burning and ruminants primarily collected in Bangladesh, while aqueous methane samples from rice paddies and wastewater are distributed across Bangladesh and several densely populated regions of India. The background color of Fig. 1 represents total methane fluxes in 2023, sourced from EDGAR (Crippa et al., 2024), indicating significant methane emissions in South Asia.
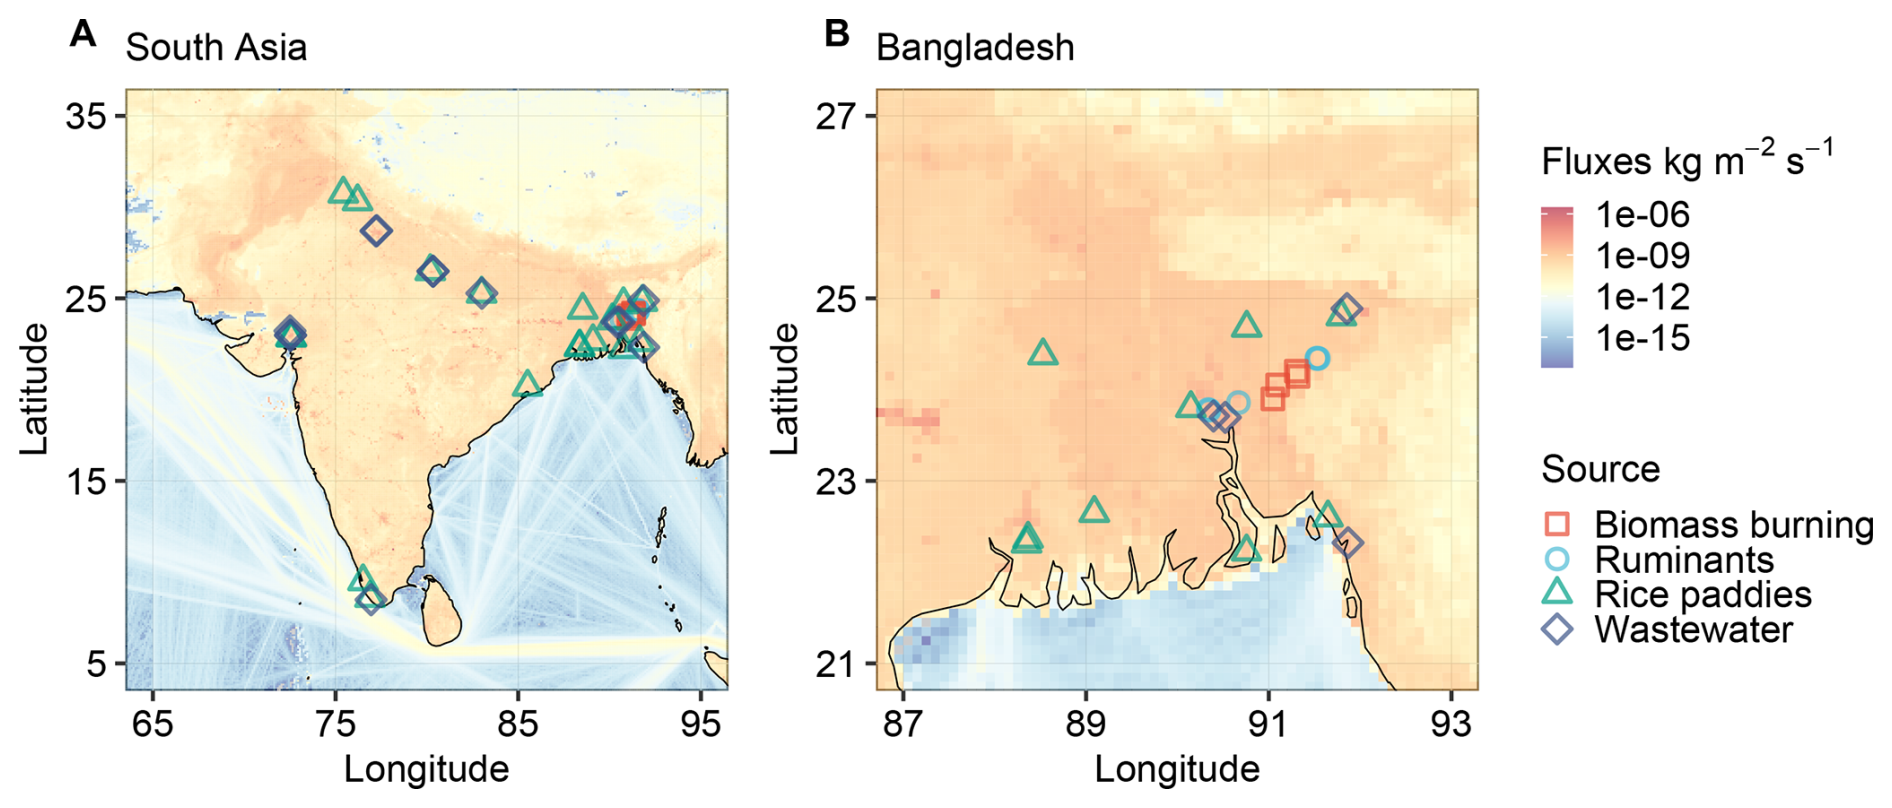
Figure 1Map of collected methane source samples for (A) entire South Asia and (B) a close-up for Bangladesh. The background color represents total methane fluxes in 2023, sourced from EDGAR (Crippa et al., 2024).
2.2 Analysis of methane mixing ratios and isotopic composition
Methane mixing ratios were measured using gas chromatography with flame ionization detection (GC-FID, Agilent Technologies 7890A). For gaseous source samples, methane was extracted from a glass flask using a syringe and injected directly into the instrument. For aqueous source samples, a portion of the liquid was extracted, and helium (He) was introduced. After equilibration for 2 h, a syringe was used to collect the headspace mixture of helium, methane and other dissolved gases for analysis. Three methane standards with multiple concentrations (1.6 ppm ±2 %, Air liquid; 80.3 ppm±2.0 ppm, Linde; 250 ppm±0.5 %, Strandmøllen; 95 % confidence) in synthetic air were used for calibration.
The equilibrium between the gaseous and aqueous phases was evaluated using Henry's Law (Eq. 1):
where c is the concentration of dissolved methane (nmol L−1), k is Henry's law constant, and P is the partial pressure of methane. For the calculations: the water volume was 40 mL, the headspace volume was 10 mL, the headspace pressure was 1 atm, the equilibration temperature was 25 °C, the gas constant R was 0.08025 , and Henry's Law constant k for methane at 25 °C was 0.0014 .
Once the methane mixing ratios were determined, gaseous and aqueous source samples were analyzed for δ13C and δ2H using gas chromatography isotope ratio mass spectrometry (GC-IRMS; Delta V Plus, Thermo Fisher). Due to variable methane mixing ratios in source samples, two methods were used: pre-concentration (Precon) for diluted samples (Rice et al., 2001) and direct injection, using the GC injector, for concentrated samples. The Precon system was modified with custom-built components to improve isotopic analysis. In this configuration, only liquid nitrogen was used as the cryogen for all traps. CO2 and water vapor were first removed with chemical absorbents, followed by Trap 1 for additional purification. Trap 2 (a stainless steel tube, 20 cm in length, packed with HayeSep D, mesh size 60–80) was then employed, with sufficient venting through the Precon six-port valve to remove most of the residual oxygen that could interfere with δ2H measurements. The sample was subsequently transferred to Trap 3 (a PoraPLOT capillary, 0.32 mm internal diameter), and final separation was performed on a 5 m×0.32 mm PoraPLOT column at −78 °C (dry ice). This procedure ensured effective resolution of the methane peak from any remaining oxygen before conversion in the high-temperature reactor. Any interference by krypton (Kr) in the δ13C analysis was eliminated by post-column GC separation from the methane-derived carbon dioxide peak (PoraPLOT 7 m×0.32 mm; Schmitt et al., 2013). To match the relatively narrow detection range of the IRMS, syringe dilutions with He were applied. Isotopic values were corrected for instrumental drift and calibrated using standards.
Isotope values are reported in δ notation, representing the relative deviation of isotope abundance in a sample compared to international standards: Vienna Pee Dee Belemnite (V-PDB) for δ13C and Vienna Standard Mean Ocean Water (V-SMOW) for δ2H. For diluted samples, the two standards used were both 1.85 ppm, with δ13C values of and , and δ2H values of and . For concentrated samples, δ13C was measured directly using a 100 ppm standard with a δ13C value of −43.8 ‰, while δ2H was measured after pre-dilution and corrected using the same approach as for diluted samples. Analytical uncertainties of the reported isotopic composition are 0.09 ‰ for δ13C and 2.1 ‰ for δ2H. The here constrained isotopic data of the major methane sources in South Asia are summarized in Data S1.
2.3 Determination of isotopic source signatures
To determine the isotopic values of the sources, we analyzed the isotopic data for all samples using the Keeling (Keeling, 1958; Pataki et al., 2003) and Miller–Tans (Miller and Tans, 2003) methods. These approaches follow the Eqs. (2) and (3):
where c represents the CH4 mixing ratio, and the subscripts obs, bg, and source denote atmospheric observations, background levels, and source contributions, respectively. The Miller–Tans approach, which yielded narrow uncertainties, was used in the main text, while the Keeling plots are provided as additional information in Figs. S1–S4 in the Supplement.
Both Keeling and Miller–Tans approaches are fundamentally based on isotopic mass balance:
When the source concentration is much higher than the background:
Equation (4) simplifies to:
This implies that when source concentrations are sufficiently high, the observed isotopic composition approaches that of the source. Therefore, high-concentration data points alone can provide a good approximation of the source isotopic signature, even without applying Keeling or Miller–Tans analyses.
We employed Kriging interpolation using the gstat package in R to evaluate the spatial distribution of isotopic values. This geostatistical method estimates values at unsampled locations based on the spatial autocorrelation of observed data, modeled through a fitted variogram. We applied this approach to interpolate δ2H values of global surface water and representative microbial methane sources (ruminants, wetlands and rice paddies, and waste) for comparative spatial analysis.
To calculate methane isotopic source signatures and integrate contributions from multiple sources, we used a combination of statistical approaches. Uncertainty propagation was quantified using Monte Carlo simulations (10 000 iterations), accounting for variability in both isotopic measurements and source fractions.
2.4 Literature review of isotopic signatures of global methane sources
A comprehensive literature review was conducted to compile isotopic source signatures, which were further assessed for major global and regional methane sources (Data S2 in the Supplement). The review was carefully curated to minimize the influence of individual studies by selecting only a single representative value per region from each publication. Source-specific mathematical approaches were applied, as detailed in the following sections.
In the final section, we integrated the synthesized isotopic signatures with a range of top-down and bottom-up estimates to evaluate the discrepancies between current emission inventories and isotopic source constraints. Global isotopic data were compiled from our extensive literature review (Data S2). Isotopic values for microbial sources were calculated using Monte Carlo simulations, integrating our findings with estimates from Saunois et al. (2025), Ito et al. (2023), and the IPCC (Masson-Delmotte et al., 2021) assessment. For South Asia, we incorporated isotopic signatures of rice paddy methane, while for natural wetlands, we retained tropical values from the global review, as there is no evidence indicating significant methane oxidation in South Asian wetlands. Thermogenic methane isotopic values were sourced from extensive global (Sherwood et al., 2017) and European (Menoud et al., 2022) databases. The South Asian dataset focuses on methane sources across Afghanistan, Bangladesh, India and Pakistan. Thermogenic methane primarily originates from natural gas, coalbed methane, shale gas and other methane emissions associated with fossil fuel extraction, transportation and processing. This thermogenic category also includes minor contributions from biogenic methane present in various mineral deposits, incorporated to facilitate the source analysis of atmospheric methane.
3.1 Methane from agricultural biomass burning
The isotopic source signatures of methane from agricultural crop residue burning (C3 biomass) in South Asia was constrained and compared to measurements elsewhere (Fig. 2, Table 1, and Data S1–S2) to establish robust and representative source end-member values. The δ13C and δ2H values derived from Miller–Tans plots (Fig. 2A and B) were and , respectively. Keeling plots yielded comparable δ13C values but slightly more enriched δ2H values (Fig. S1). Keeling and Miller–Tans plots are two formulations of the isotopic mass balance (Eq. 4), differing primarily in their treatment of background contributions. The Keeling approach (Eq. 2) derives the source signature from the intercept but is sensitive to background variability through its effect on the slope, which can distort linearity. In contrast, the Miller–Tans formulation (Eq. 3) derives the source signature from the slope, with background variability mainly affecting the intercept and increasing scatter while largely preserving linearity. As both methods rely on linear regression, increased scatter is generally less detrimental than distortion of linearity, making the Miller–Tans approach more robust in practical applications. Both approaches are most reliable when source-driven variability dominates over background variability. In our case, some high-concentration observations approach the condition csource≫cbg (Eq. 5), leading to δobs≈δsource (Eq. 6), such that the influence of atmospheric background variability becomes negligible. Further discussion of background effects is provided in Sect. S2 in the Supplement. In addition, the linear relationship between δ2H versus δ13C showed that the isotopic composition was influenced by mixing with atmospheric methane, with a gradient reflecting the transition from source to atmospheric background values (Fig. 2C).
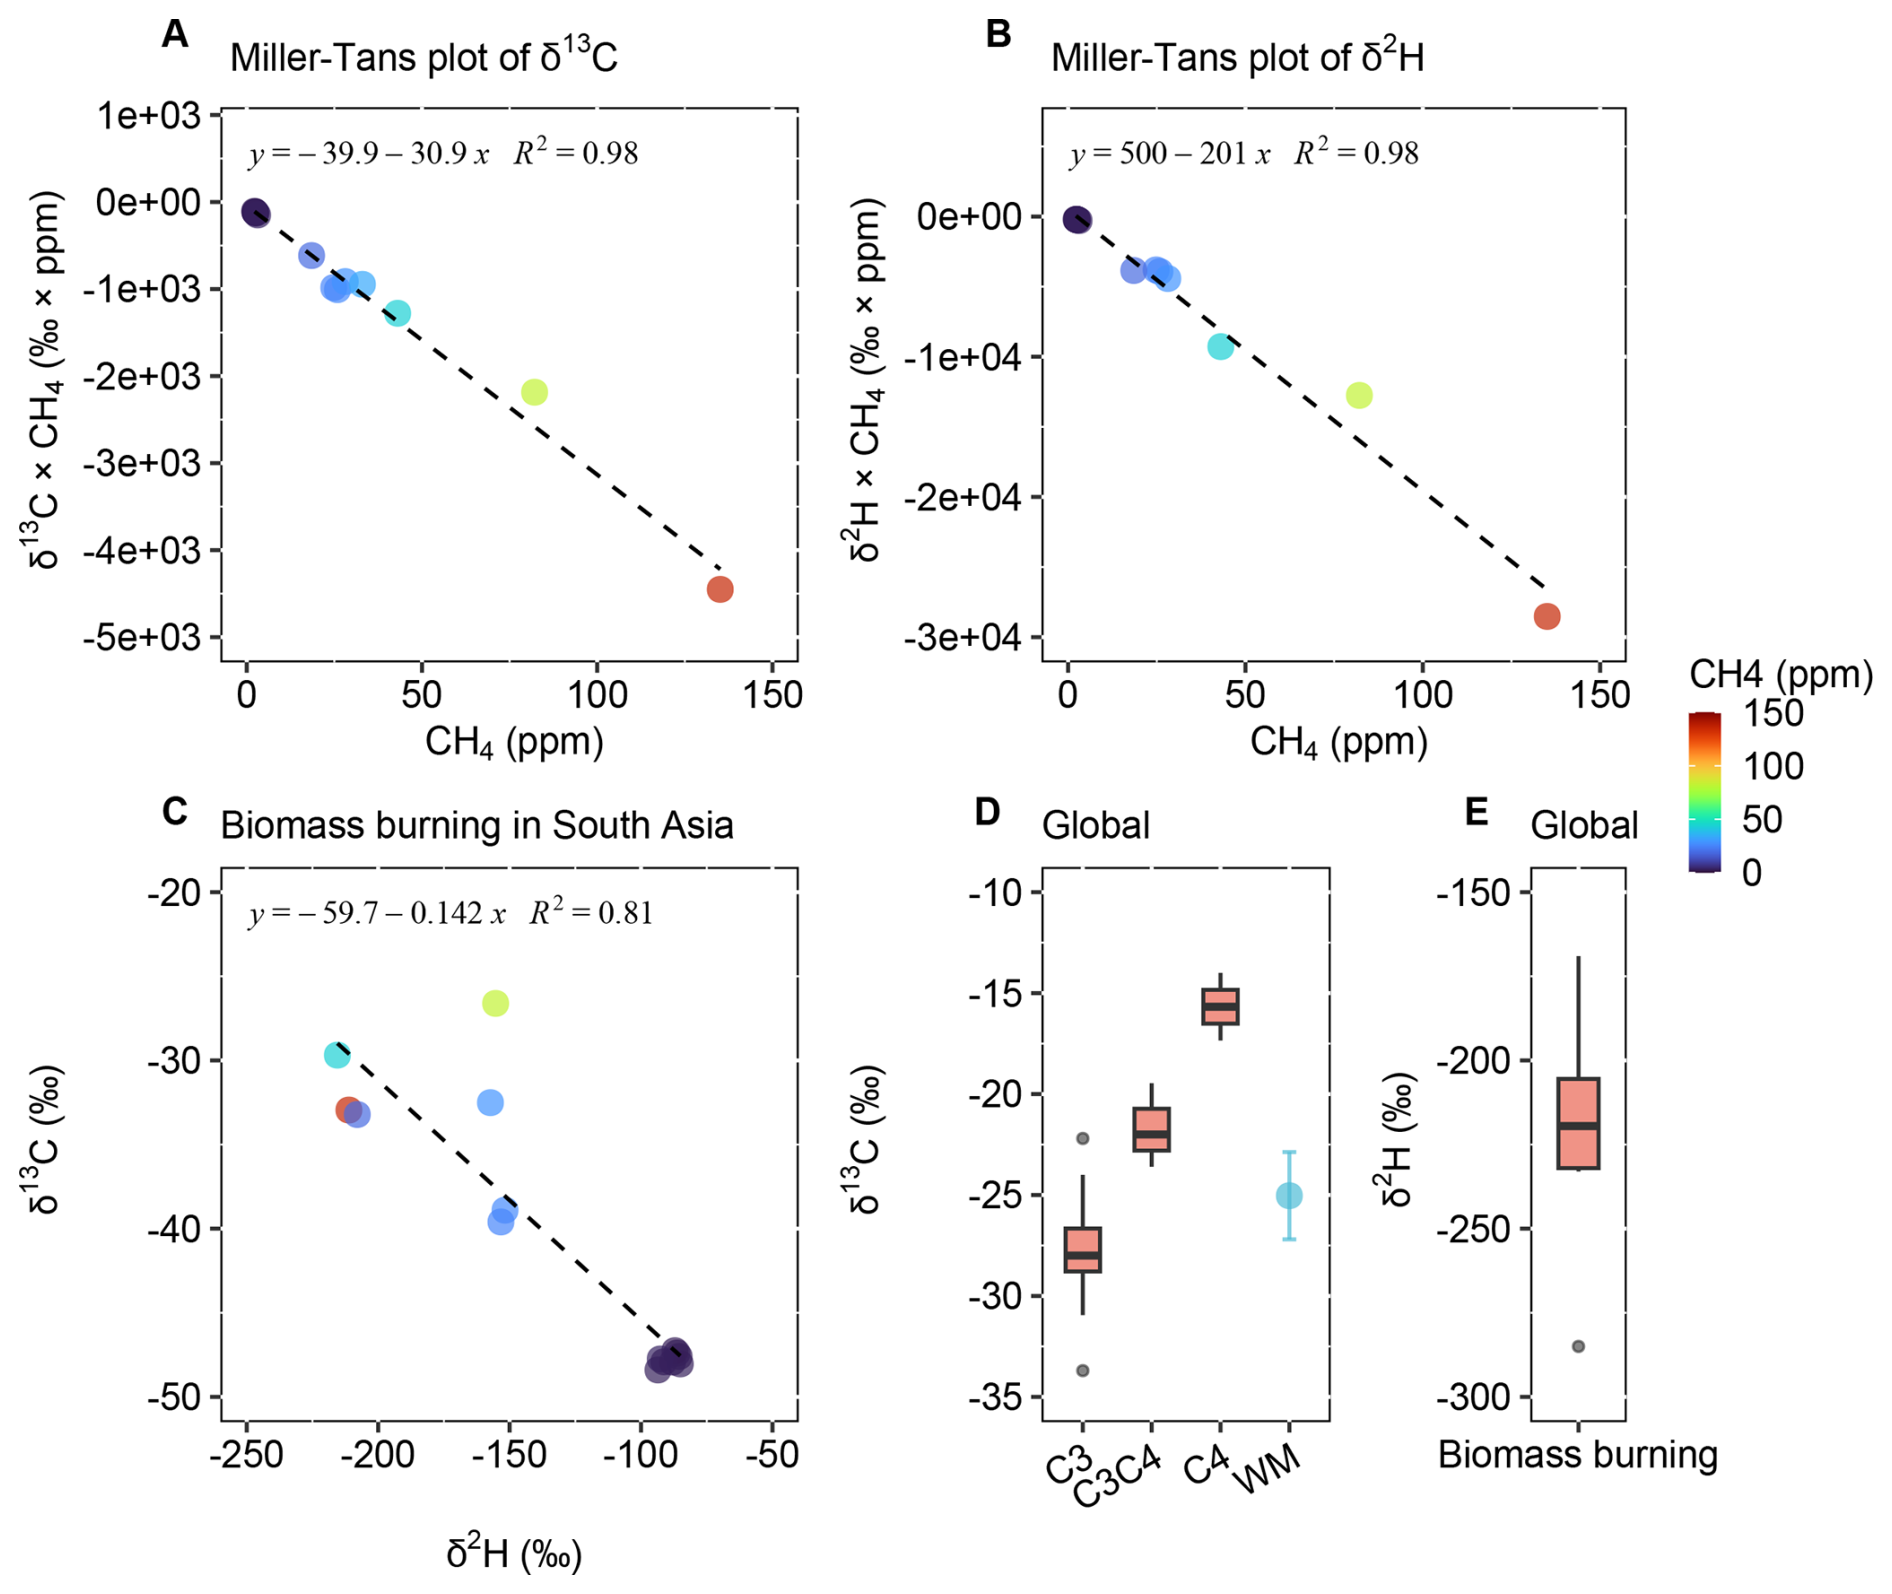
Figure 2Isotopic source signatures of methane from biomass burning in South Asia and globally. (A) Miller–Tans plot of δ13C–CH4 for South Asia crop residue burning. (B) Miller–Tans plot of δ2H–CH4 for South Asia crop residue burning. (C) Coupled variation in δ13C and δ2H. (D) Global δ13C values of biomass burning methane (C3 vs. C4 biomass, WM = weighted mean of C3 and C4 biomass). (E) Global δ2H values of biomass burning methane. Biomass burning in South Asia primarily here refers to agricultural wheat crop residue burning. Global review in Data S2.
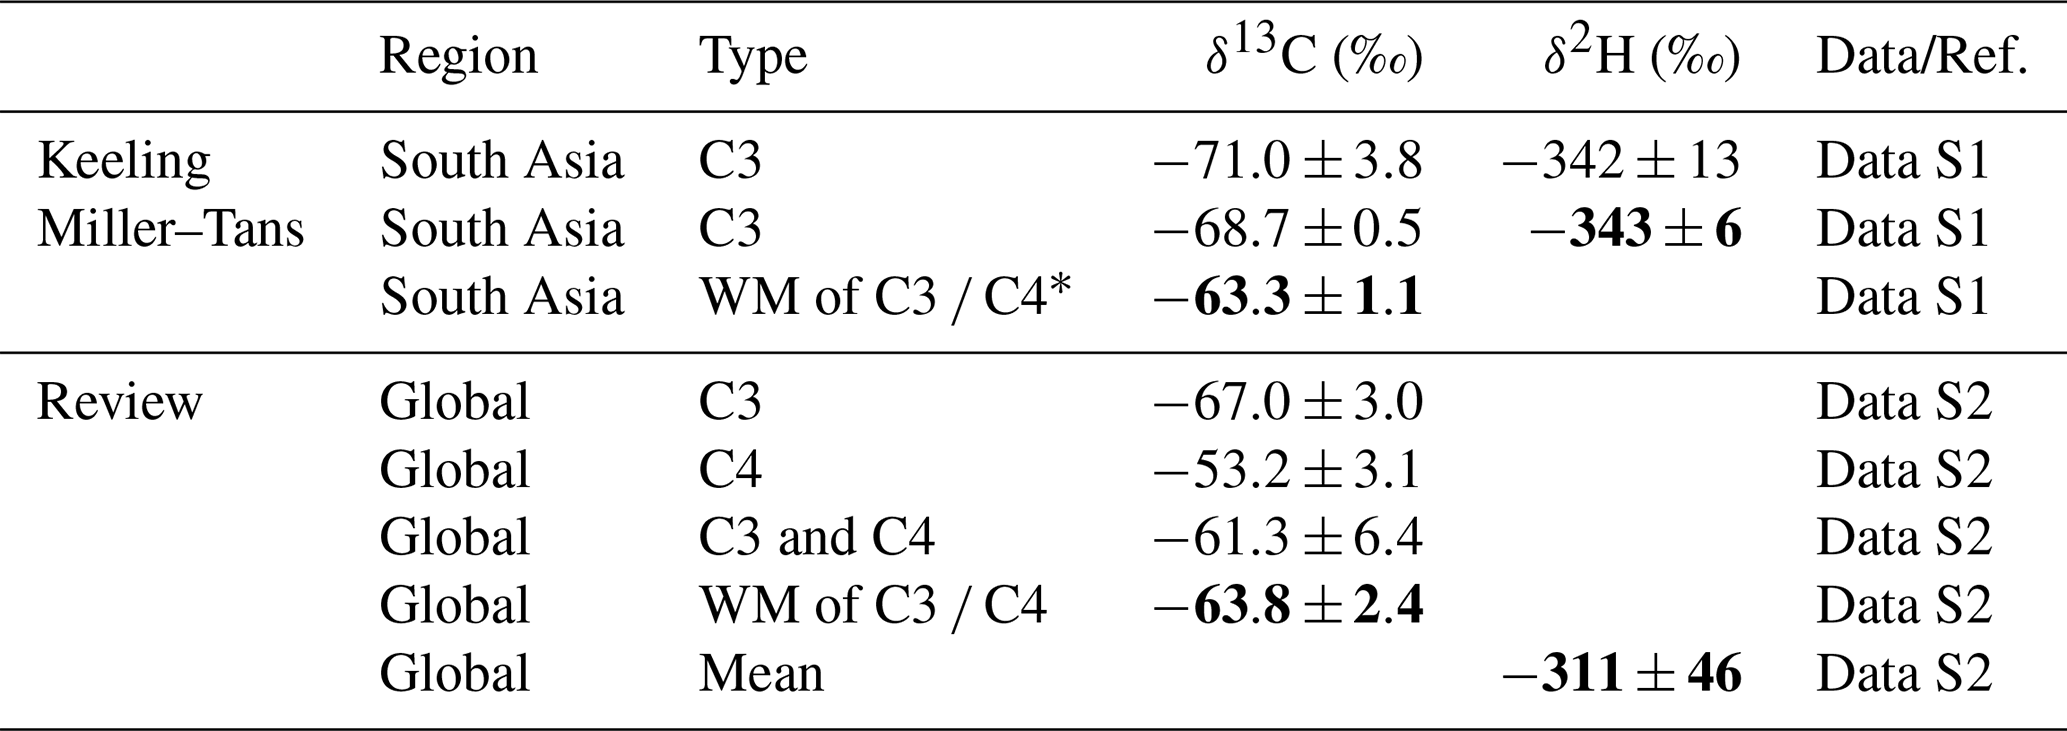
Table 1Isotopic source signatures of CH4 from biomass burning in South Asia and globally, as determined by various analytical and statistical methods.
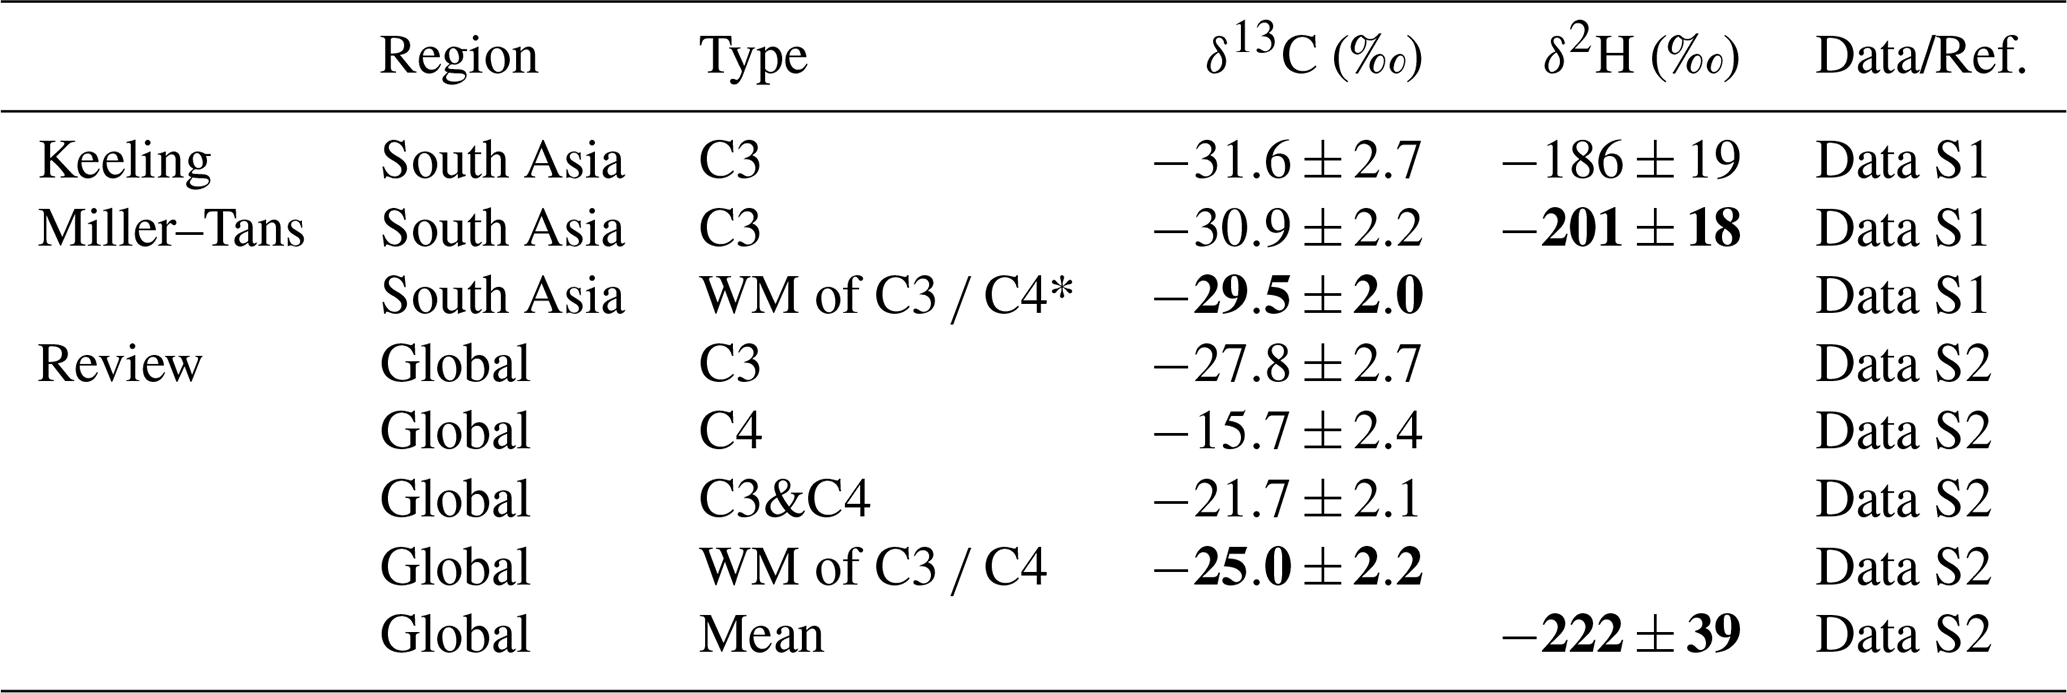
* The weighted mean (WM) δ-values for biomass burning methane in South Asia were based on a C3 : C4 ratio of 0.9 : 0.1, derived from an EC isotopic source apportionment study (Dasari et al., 2020). The global δ13C value for C4 biomass burning was applied in computing the weighted mean for the South Asian WM δ13C of C3 C4. For the global biomass burning methane, the WM δ13C of C3 C4 was calculated using a C3 : C4 ratio of 0.77:0.23, based on the global distribution of C3 and C4 vegetation (Still et al., 2003).
To minimize bias from overrepresented datasets in specific regions, our global review consolidated data from each study and region into a single representative value (Fig. 2D and Data S2). There appeared to be a significant δ13C difference between methane emissions from C3 and C4 biomass combustion globally (Vernooij et al., 2022; Nisbet et al., 2022), presumably driven by the differing δ13C content of the feedstocks (Yao et al., 2022). By weighting δ13C values according to the global proportions of C3 and C4 vegetation (77 % and 23 %) (Still et al., 2003), we derived a global biomass-type-weighted mean δ13C value of . In contrast, the δ2H values of methane from C3 vs. C4 biomass burning did not exhibit a clear distinction (Fig. 2E), suggesting that δ2H was not strongly influenced by biomass type. The mean δ2H value for global biomass burning methane was . Some studies have shown that δ2H in surface water exhibits spatial (latitudinal) variability (Zakharov et al., 2004; IAEA/WMO, 2023), which would logically also influence δ2H signatures of biomass burning. However, available δ2H source signatures for methane remain limited, preventing further differentiation at present.
Given that δ13C variability in methane from biomass burning is influenced by the relative contributions of C3 and C4 biomass, these factors must be carefully considered when characterizing atmospheric-receptor isotopic signatures in specific regions. Based on our previous isotopic source apportionment of elemental carbon (EC) in South Asian atmospheric aerosols, C3 and C4 biomass combustion accounted for 90 % and 10 % of EC in winter, respectively (Dasari et al., 2020). Since EC and methane are co-emitted during combustion, a first approximation is that they may have the same proportional contributions. Using the isotopic values measured for C3 combustion in South Asia, the global mean for C4 combustion, and the regional C3 C4 ratio, we derived a C3 C4-weighted δ13C value of for South Asia (Table 1). In contrast, δ2H was not influenced by C3 C4 composition and does not require such adjustment. Overall, methane from biomass burning in South Asia was more depleted in δ13C and more enriched in δ2H than the global mean ().
Global wildfire-related methane emissions may be underestimated due to undetected small fires (Zhao et al., 2025), highlighting the need for top-down constraints of biomass burning emissions. Estimates of methane emissions from tropical biomass burning spanned a wide range of 14–34 Tg yr−1 (Kirschke et al., 2013), highlighting the importance of alternative approaches for methane assessment in South Asia. A recent study reported δ13C values of CH4 from tropical biomass burning, ranging from −12 ‰ to −16 ‰ for grassland fires and −16 ‰ to −28 ‰ for farmland fires (Nisbet et al., 2022), which align with global estimates. The relative proportions of C3 and C4 biomass remain a key determinant of isotopic signatures globally, while geographic variations have a minor influence. Additionally, combustion conditions and fuel moisture content can influence isotopic signatures, necessitating additional research to refine isotopic source characterization (Vernooij et al., 2022).
In South Asia, biomass burning is dominated by agricultural residue combustion and other fire types, such as wildfires and forest fires, and are expected to have similar methane isotopic signatures. Other combustion sources, such as traffic and coal combustion, contribute modestly to methane emissions but exhibit δ13C signatures of their raw materials similar to C3 biomass (Yao et al., 2022). Improved isotopic characterization of these sources can enhance source attribution. In South Asia, biomass burning emissions displayed more depleted δ13C and enriched δ2H values than global means reported from elsewhere, reflecting regional variations in fuel type and C3 C4 biomass composition. Region-specific isotopic endmembers are therefore critical for accurate source apportionment.
3.2 Methane from ruminants
The isotopic source signatures of ruminant methane from South Asia were constrained and compared with such measurements globally (Fig. 3, Table 2, Data S1–S2). The δ13C and δ2H values derived from Miller–Tans plots (Fig. 3A–B), yielded (primarily reflecting C3 biomass) and , respectively. Keeling plots yielded comparable δ13C and δ2H values (Fig. S2). The relationship between δ2H and δ13C showed a clear gradient as the isotopic composition transitions from the source to the atmospheric background (Fig. 3C).
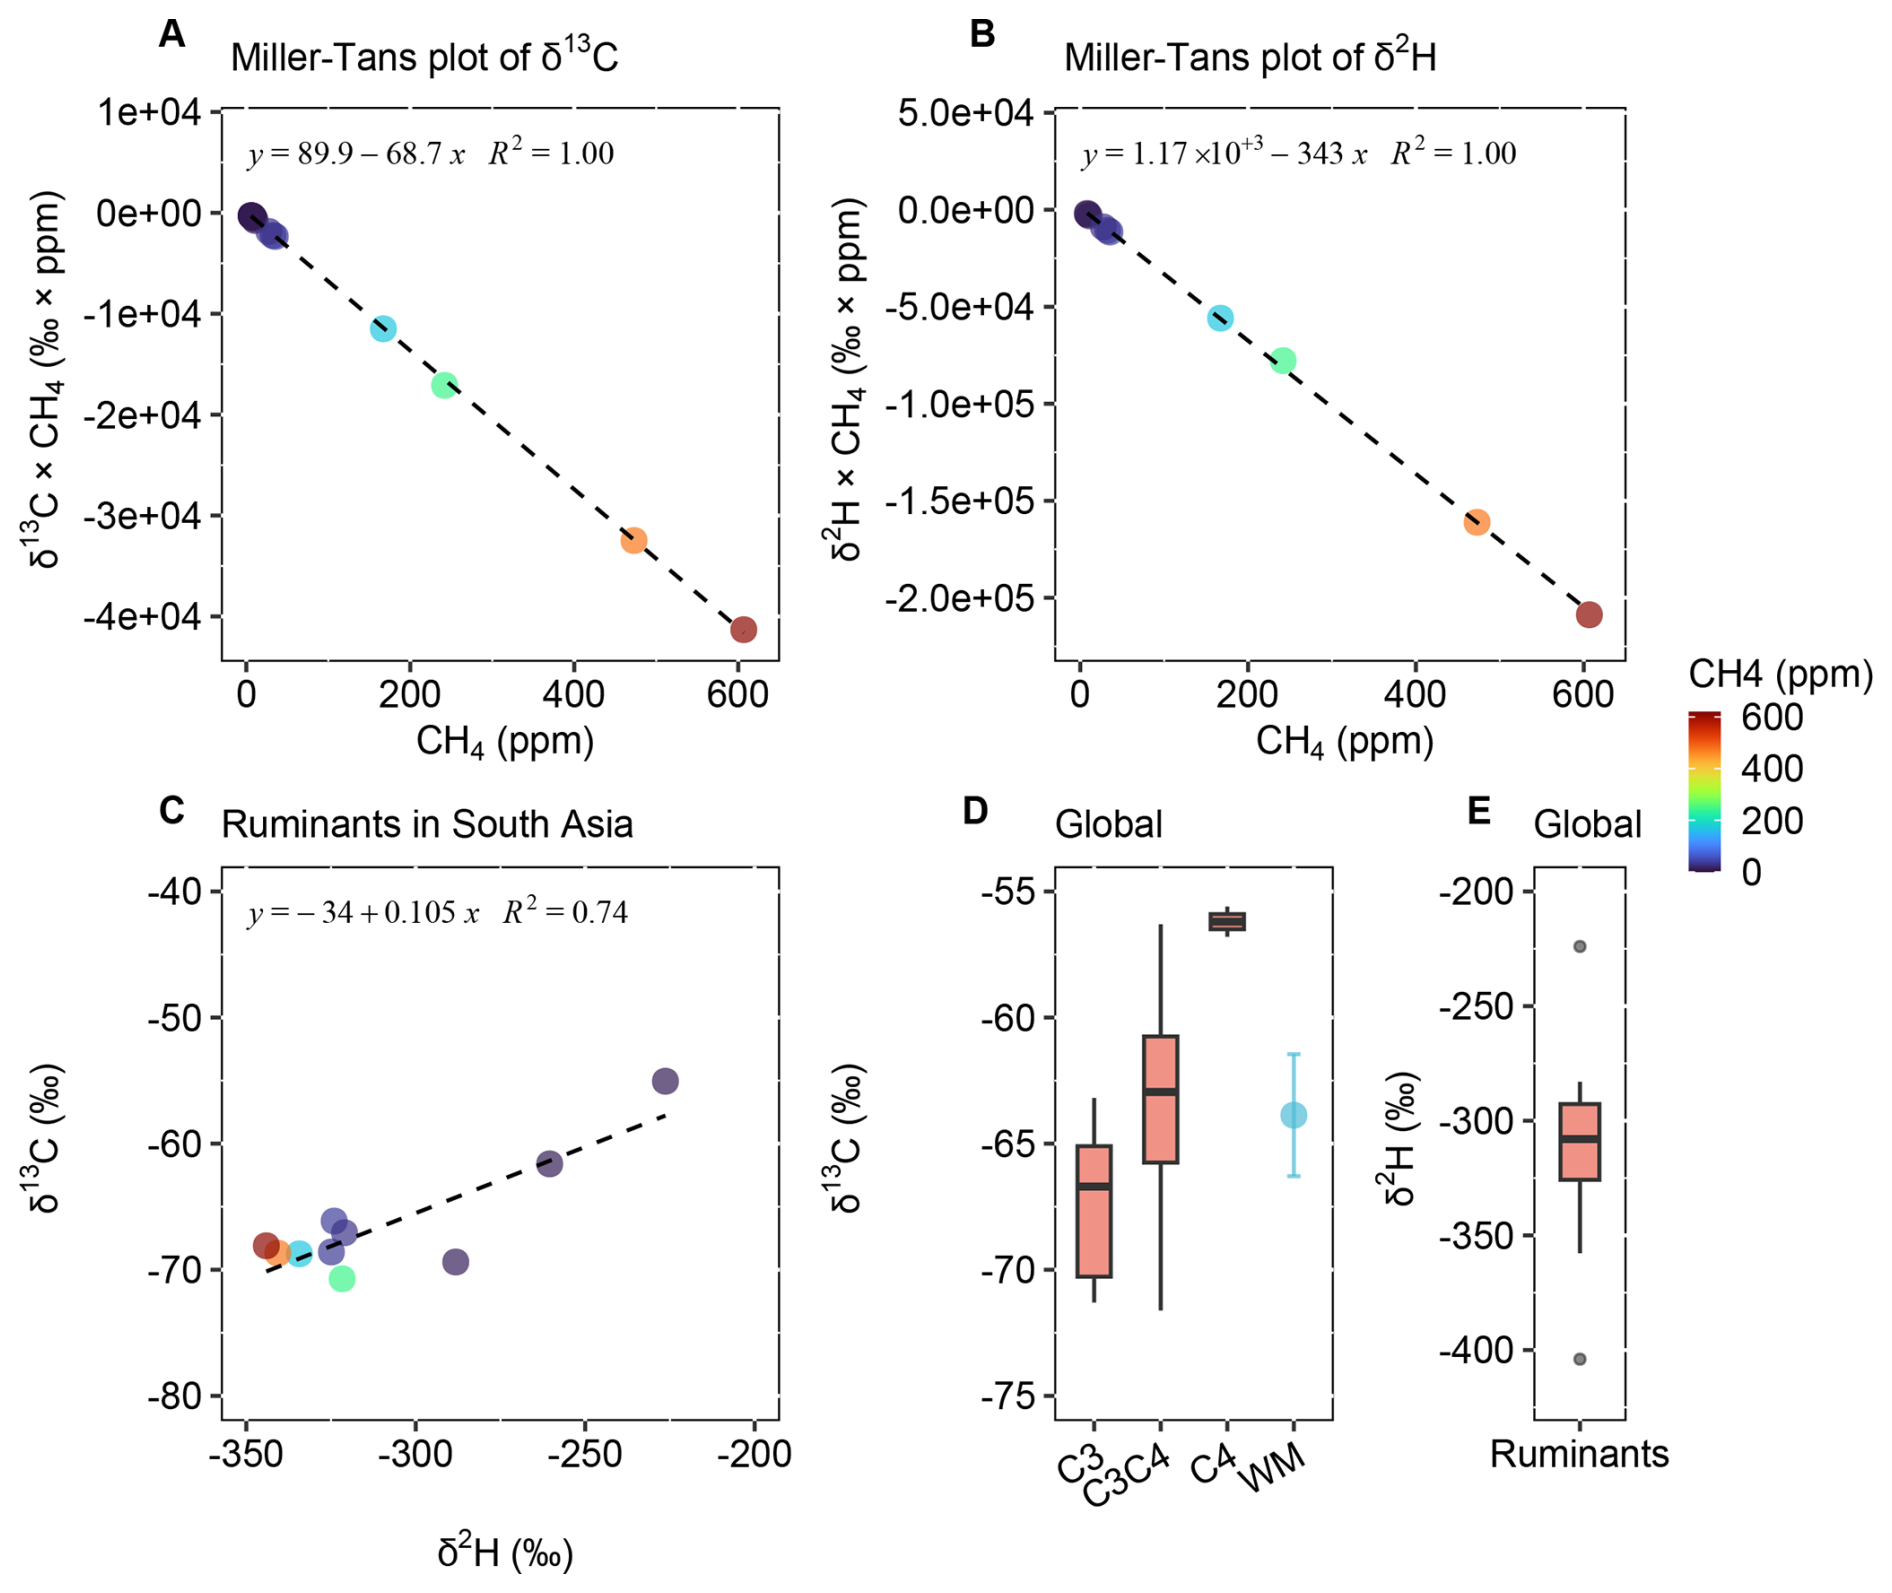
Figure 3Isotopic source signatures of methane from ruminants in South Asia and globally. (A) Miller–Tans plot of δ13C–CH4 for South Asia ruminants. (B) Miller–Tans plot of δ2H–CH4 for South Asia ruminants. (C) Coupled variation in δ13C and δ2H. (D) Global δ13C values of ruminant methane (C3 vs. C4 diets; WM = weighted mean of C3 and C4 diets). (E) Global δ2H values of ruminant methane. Global review in Data S2.
Table 2Isotopic source signatures of CH4 from ruminants in South Asia and globally, as determined by various analytical and statistical methods.
* The weighted mean (WM) δ-values for ruminant methane in South Asia were based on a C3 : C4 dietary of 0.65:0.35, reflecting the regional distribution of ruminant feed (Chang et al., 2019). For the global ruminant methane, the WM δ13C of C3 C4 was calculated using a C3 : C4 ratio of 0.7:0.3, based on the global mean feed composition (Chang et al., 2019).
Methane isotopic values from global ruminant sources were summarized from the literature (Fig. 3D), revealing a notable δ13C difference between C3 and C4 diets, driven by the distinct δ13C content of these feedstocks. By weighting δ13C values according to the global proportions of C3 and C4 diets (70 % and 30 %) from a recent database study (Chang et al., 2019), we calculated a global C3 C4 biomass-weighted mean δ13C value of . In contrast, the δ2H values for methane from ruminants globally showed no clear differentiation between C3 and C4 diets (Fig. 3E). The δ2H signature of methane is expected to be primarily derived from surface water, and thus may exhibit regional variability. The global mean δ2H value () likely reflects this variability, which may arise from differences in the isotopic composition of environmental water as well as variations in rumination processes.
Methane emissions from C3-fed ruminants in South Asia (, Fig. 3A) were more depleted in δ13C than the global mean of C3-fed ruminants (, Fig. 3D). However, regional variability in C3 C4 feed composition was an equally important factor that must be considered when determining the representative isotopic signature for South Asian ruminants. Based on a database study (Chang et al., 2019), ruminant diets in South Asia consisted of approximately 65 % C3 % and 35 % C4 plants. Using the isotopic values measured for C3 diet ruminants in South Asia, the global mean for C4 diet ruminants, and the regional C3 C4 ratio, we derived a C3 C4-weighted δ13C value of for South Asia, which is comparable to the global C3 C4-weighted mean (). In contrast, δ2H signatures showed a substantial discrepancy, with depletion exceeding by 32 ‰ in South Asia compared to the global mean, underscoring the importance of determining and using regionally-constrained source fingerprints in isotope-based source apportionment studies.
Recent studies have indicated that biogenic methane emissions have increased in the tropics, with considerable emissions from agricultural activities such as ruminant livestock farming and rice cultivation (Schaefer et al., 2016; Nisbet et al., 2025). South Asia, home to the world's largest ruminant stock, is potentially one of the major contributors to these emissions (Ganesan et al., 2017). Isotopic source fingerprinting to characterize ruminant methane emissions in the tropics and South Asia offers a promising approach to place quantitative constraints on the importance of ruminant and other sources. Isotopic source signatures must be carefully adjusted based on regional dietary compositions and environmental conditions, as the prevalence of C4 vegetation in tropical regions results in more enriched δ13C values in some areas, such as −57 ‰ in Kenya (Nisbet et al., 2022), −52 ‰ to −57 ‰ in Zimbabwe (Brownlow et al., 2017), −60 ‰ to −63 ‰ in Australia (Lu et al., 2021), and −65 ‰ in sub-Saharan Africa (Chang et al., 2019). Additionally, methane from ruminants is primarily produced in the rumen through enteric fermentation and then exhaled (Hook et al., 2010), but cattle are not the only ruminants contributing to methane emissions. While cattle are a major source, other domesticated species, including buffalo, sheep, and goats, as well as wild ruminants such as deer, also contribute substantially to methane emissions. Incorporating these additional ruminant sources may help develop a more comprehensive isotopic characterization. Ruminant methane showed similar δ13C source signatures globally but displayed distinct δ2H values in South Asia that deviate from the global mean (still within the uncertainty). Taken together, also for the ruminant releases, isotope-based source apportionment of atmospheric methane should employ region-specific endmember values.
3.3 Methane from rice paddies
The isotopic signatures of methane from South Asian rice paddies were quantified and compared with global values (Fig. 4, Table 3, and Data S1–S2). The δ13C and δ2H derived from Miller–Tans plots were and , respectively (Fig. 4A and B). In contrast, the Keeling plots showed reduced linearity and more enriched δ13C and δ2H values (Fig. S3), reflecting the complexity of methane production and processing in rice paddies (Sect. S3.2 in the Supplement). The sample concentration range spanned several orders of magnitude and some high-concentration samples satisfied the condition csource≫cbg (Eq. 5), yielding δobs≈δsource (Eq. 6), and their isotopic values still exhibited noticeable variability, indicating the coexistence of multiple methane sources and/or the influence of in situ oxidation within the water column. Both Keeling and Miller–Tans methods are fundamentally designed for single-source perturbations; in multi-source systems, they tend to be biased toward the highest-concentration source (Monte Carlo mixing simulation in Sect. S3.1 in the Supplement), while weaker sources are suppressed or even negligible when concentration differences are large. In the Keeling method, background contributions are incorporated into the slope (Eq. 2). Under multi-source conditions, lower-concentration methane sources do not represent true background, but their influence becomes effectively indistinguishable from background variability within the Keeling framework. As a result, the combined variability of background and lower-concentration sources became significant in rice paddy samples, leading to deviations from linearity and reduced robustness. In contrast, the Miller–Tans formulation incorporates background into the intercept (Eq. 3); when concentration differences spanned several orders of magnitude for rice paddy methane, the slope was primarily controlled by the highest-concentration source, resulting in a more stable and interpretable relationship. Consistently, alternative statistical approaches (quantiles, arithmetic means, and concentration-weighted means) yielded more enriched isotopic signatures than the Miller–Tans method (Fig. 4D–E). Among them, the concentration-weighted mean (, ) likely reflected methane dissolved in floodwater.
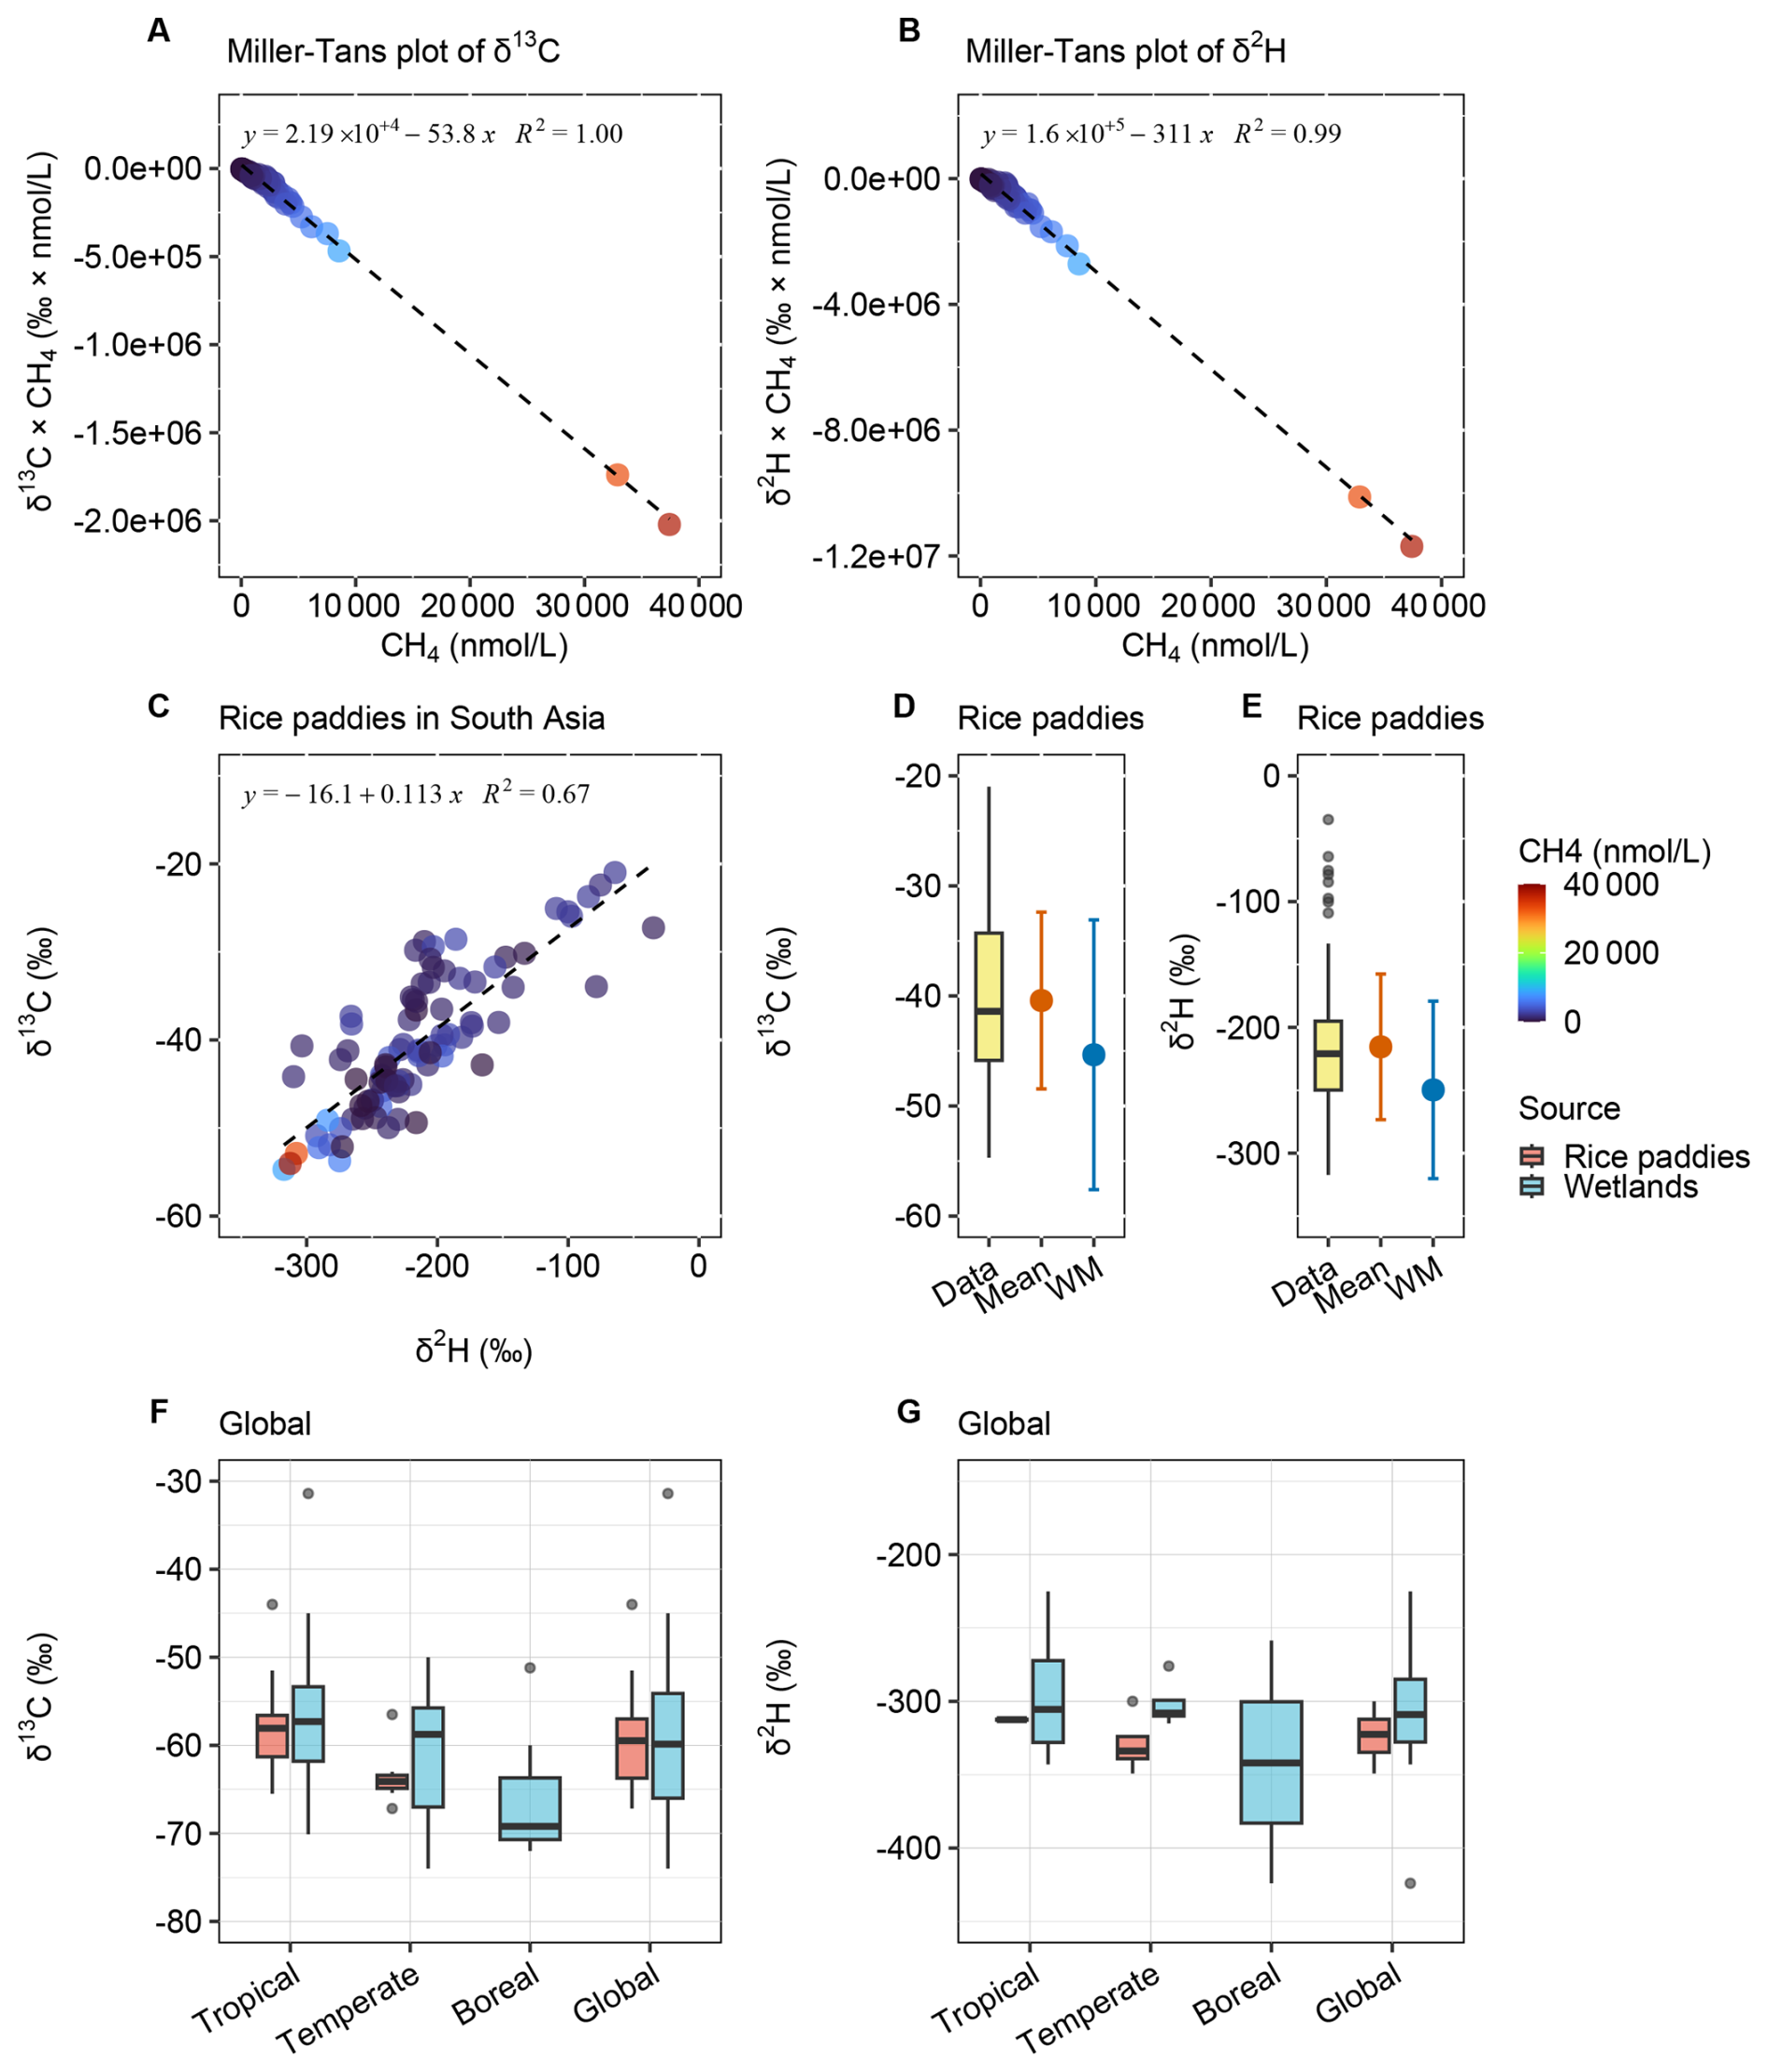
Figure 4Isotopic source signatures of methane from rice paddies in South Asia and globally. (A) Miller–Tans plot of δ13C–CH4 for South Asia rice paddies. (B) Miller–Tans plot of δ2H–CH4 for South Asia rice paddies. (C) Coupled variation in δ13C and δ2H. (D) Quantiles, arithmetic mean, and concentration-weighted mean of δ13C–CH4 for South Asia rice paddies. (E) Quantiles, arithmetic mean, and concentration-weighted mean of δ2H–CH4 for South Asia rice paddies. (F) Global δ13C values of methane from rice paddies and for comparison also from wetlands. (G) Global δ2H values of methane from rice paddies and for comparison also from wetlands. Global review in Data S2.
Table 3Isotopic source signatures of CH4 from rice paddies and wetlands in South Asia and globally, as determined by various analytical and statistical methods.
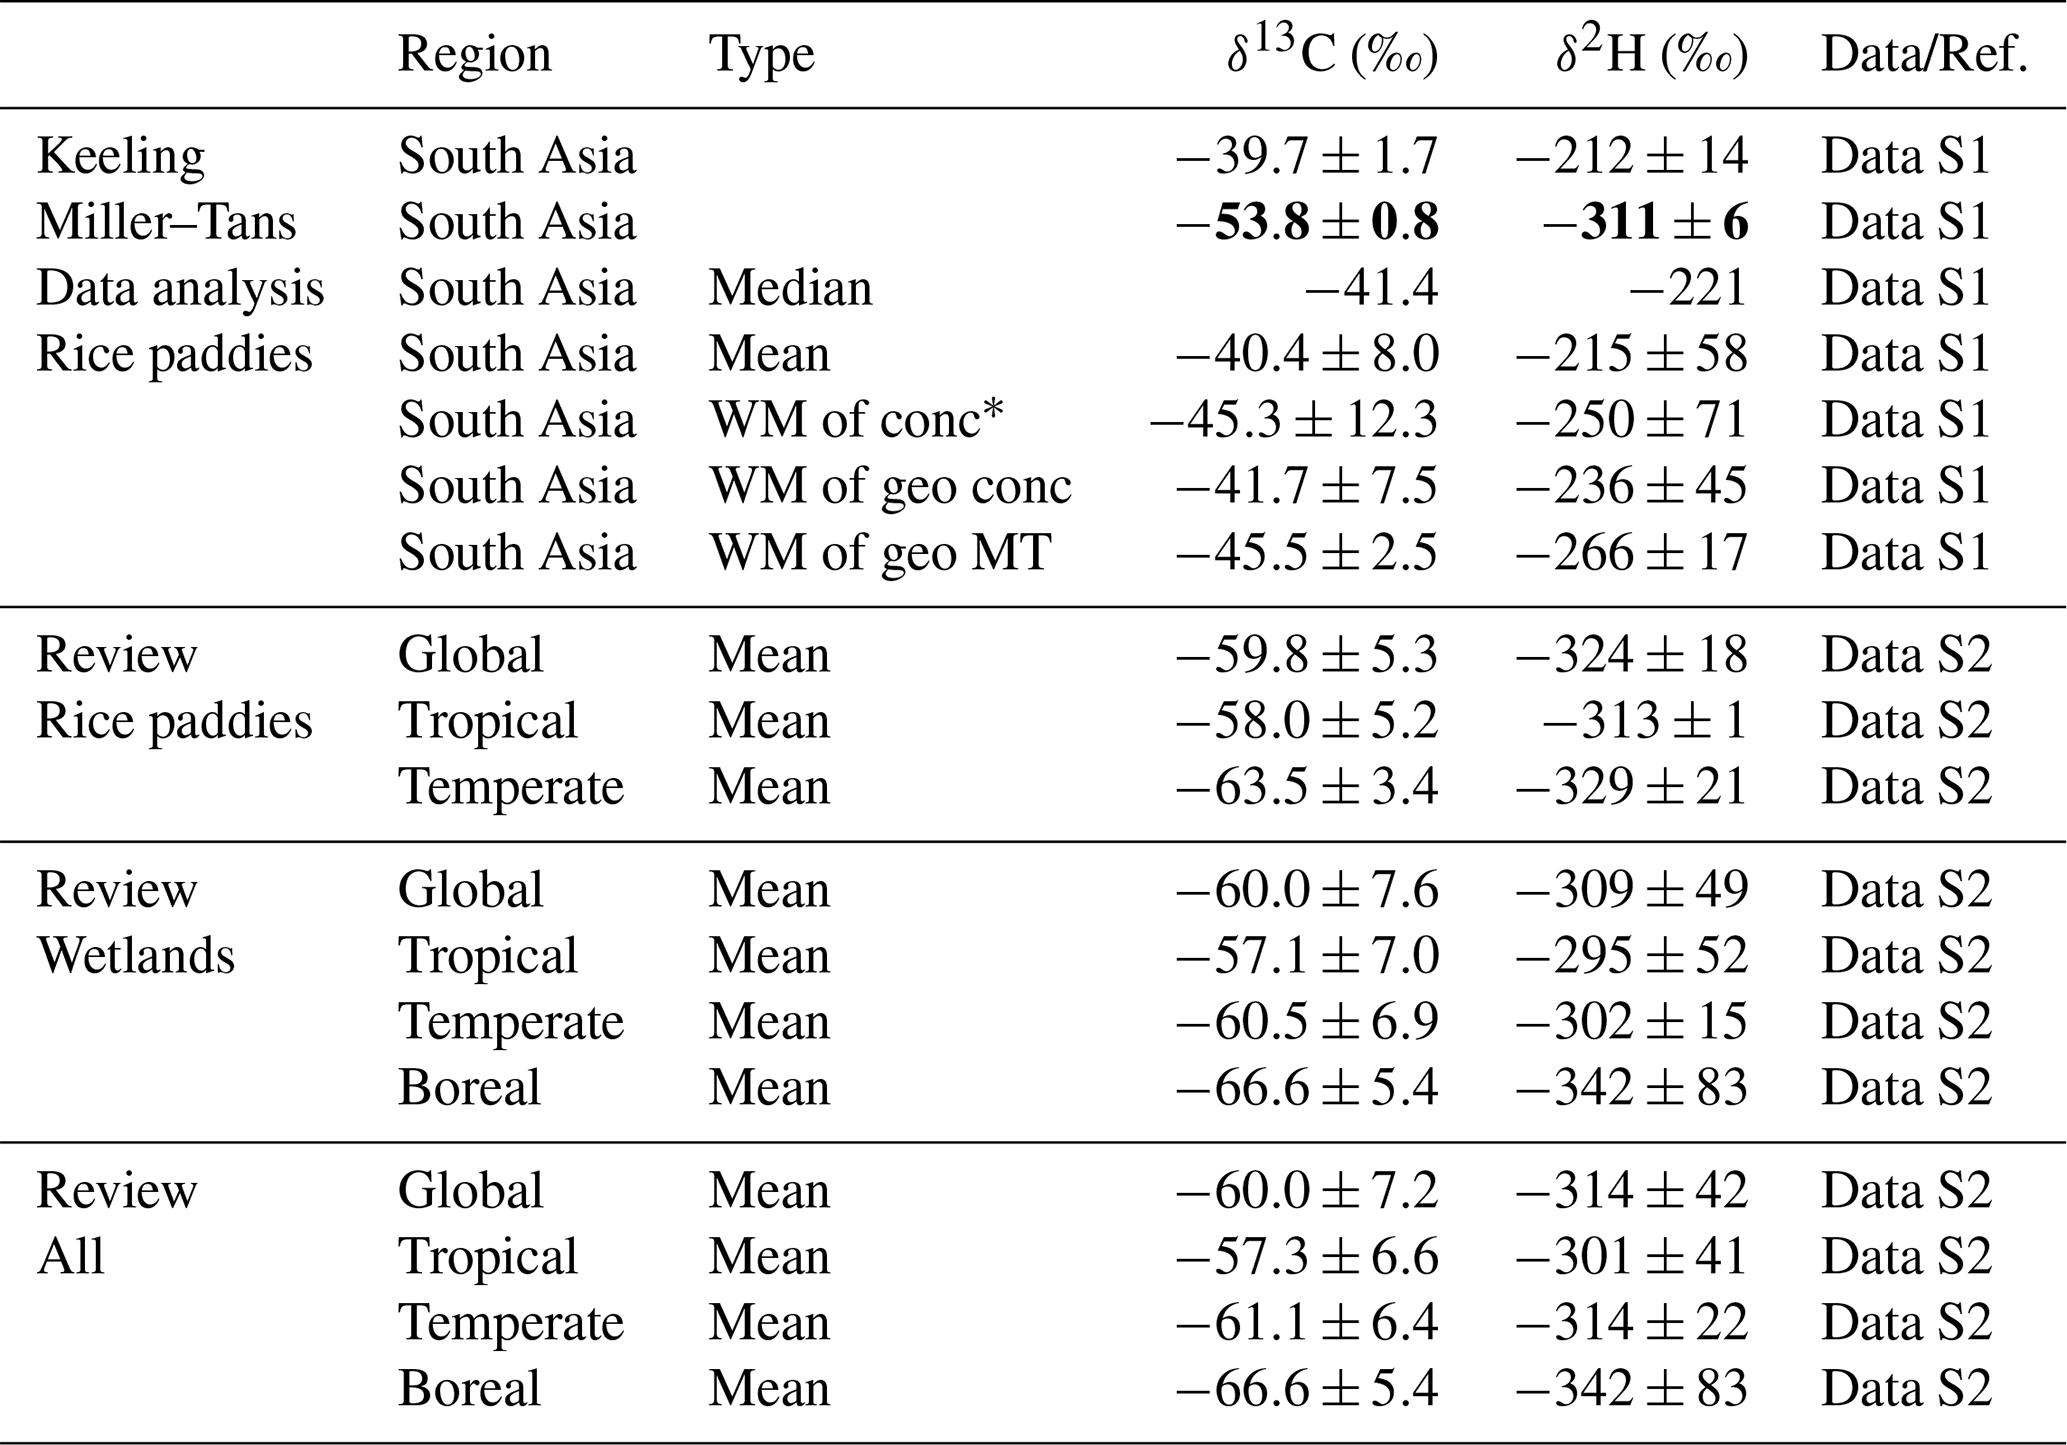
* “WM of conc” refers to the concentration-weighted mean δ-values of rice paddy methane in South Asia. “WM of geo conc” represents the geographically weighted mean, where each region's contribution is based on its concentration-weighted mean. “WM of geo MT” denotes the geographically weighted mean derived from Miller–Tans method results for each region.
A significant linear relationship between δ13C and δ2H (Fig. 4C) further supports the presence of methane oxidation, consistent with isotopic enrichment associated with methanotrophic activity (Schaefer and Whiticar, 2008). In rice paddies, only 1 %–2 % of methane is emitted via diffusion through floodwater, whereas ∼90 % is transported via plant-mediated pathways (aerenchyma) and 8 %–9 % through ebullition (Cicerone and Shetter, 1981; Schütz et al., 1989; Smartt et al., 2016; Li et al., 2025). Plant-mediated transport primarily transfers methane from subsurface anoxic layers and is therefore generally less affected by oxidation. However, due to mixing and circulation within the water column and the presence of oxic zones near roots, partially oxidized methane may also be entrained and transported through plant aerenchyma. Ebullition is also less affected by oxidation, while the diffusion pathway is more susceptible to isotopic enrichment through oxidation.
Previous studies have primarily relied on atmospheric sampling, whereas this study focuses on aquatic measurements, raising questions of representativeness. Key challenges include the presence of multiple sources, oxidation processes, and transport pathways. These issues are discussed in detail in Sect. S3.3–S3.4 in the Supplement. Briefly, both atmospheric and aquatic sampling may be subject to representativeness biases, as the Keeling and Miller–Tans methods are dominated by the highest-concentration source (Sect. S3.1), while contributions from lower-concentration sources may be indistinguishable from background variability within the fitting framework. Nevertheless, the Miller–Tans estimates are considered to best represent the isotopic signature of the dominant, minimally oxidized methane source and are therefore adopted as the most consistent metric across sampling approaches.
The global compilation of δ13C and δ2H values of methane emissions from rice paddies and wetlands revealed similar isotopic signatures of these two aquatic sources (Fig. 4F and G). The global mean δ13C and δ2H values for rice paddies were and , respectively, while these for wetlands were and . Both sources exhibited clear latitudinal trends, with more enriched isotopic signatures in tropical regions and more depleted values in boreal zones. These patterns were consistent with previous observations, which attributed the depletion in boreal wetland δ13C to reduced oxidation and the absence of C4 vegetation (France et al., 2022; Brownlow et al., 2017; Tyler et al., 1988; Fisher et al., 2017; Ganesan et al., 2018). In tropical and temperate zones, δ13C values for rice paddies and wetlands were nearly identical. However, due to the absence of rice paddies in boreal regions, the global mean δ13C value for rice paddy methane appeared slightly more enriched compared to that from wetlands. Conversely, global mean δ2H value was slightly more depleted, potentially reflecting data availability biases, as boreal wetlands exhibited the most depleted δ2H values. Methane from South Asian rice paddies (Miller–Tans values) was notably more enriched in δ13C compared to the global mean, while δ2H values are slightly enriched than the global mean. This enrichment was consistent with previous regional measurements (e.g., and −57.2 ‰; Rao et al., 2008) and might reflect the differences in precursor composition or pre-emission oxidation under South Asian field conditions.
Methane formation in rice paddies and wetlands primarily occurs via acetoclastic (acetate fermentation) and hydrogenotrophic (CO2 reduction with H2) pathways. The hydrogenotrophic pathway typically yields methane with more depleted δ13C values, whereas acetoclastic methanogenesis produces methane with relatively enriched δ13C values (Whiticar et al., 1986). The dominant pathway varies with substrate availability, temperature, and redox conditions across wetland and lake types. In wetlands, methane is also emitted through plant-mediated transport (; more than 90 % in some studies), ebullition (up to ∼60 %; more than 90 % in non-plant systems), and diffusion (up to ∼30 %) (Van Der Nat and Middelburg, 1998; Ding et al., 2002; Jeffrey et al., 2019; Villa et al., 2020; Ma et al., 2017), similar to rice paddies but with varying pathway contributions. Both methane source pathways and oxidation processes influence the isotopic composition of these aquatic emissions, although the extent of these effects remains uncertain and requires further study. Given the broad spatial coverage of our dataset, the Miller–Tans values for rice paddy methane reflected minimally oxidized isotopic signatures and were considered regionally representative. In contrast, isotopic values for wetland methane require further evaluation; currently, literature-based values from tropical regions are recommended. Given that approximately half of global methane emissions originate from aquatic ecosystems (Rosentreter et al., 2021) and South Asia accounts for ∼20 % of global rice production (Ganesan et al., 2017), applying region-specific isotopic source signatures and reducing the uncertainties are essential for accurately constraining methane emissions in South Asia.
3.4 Methane from wastewater
The isotopic source signatures of methane were constrained from South Asian wastewater and compared with global wastewater sources (Fig. 5, Table 4, and Data S1–S2). The δ13C and δ2H values derived from Miller–Tans plots (Fig. 5A and B), yielded and , respectively. Although Keeling plots exhibited moderate linearity and may be less reliable, they yielded similar δ13C and enriched δ2H values (Fig. S4). Methane oxidation would be expected to produce a characteristic co-enrichment trend in both isotopes. However, no clear relationship between δ13C and δ2H was observed for methane in wastewater (Fig. 5C). This lack of a systematic isotopic trend suggested minimal oxidation, indicating that degradation processes prior to release were limited for wastewater methane. The methane isotopic signatures were compared for isotopic quantiles, arithmetic means and concentration-weighted means (Fig. 5D and E). The median- and concentration-weighted means aligned closely with the values obtained from Miller–Tans plots, further supporting their reliability.
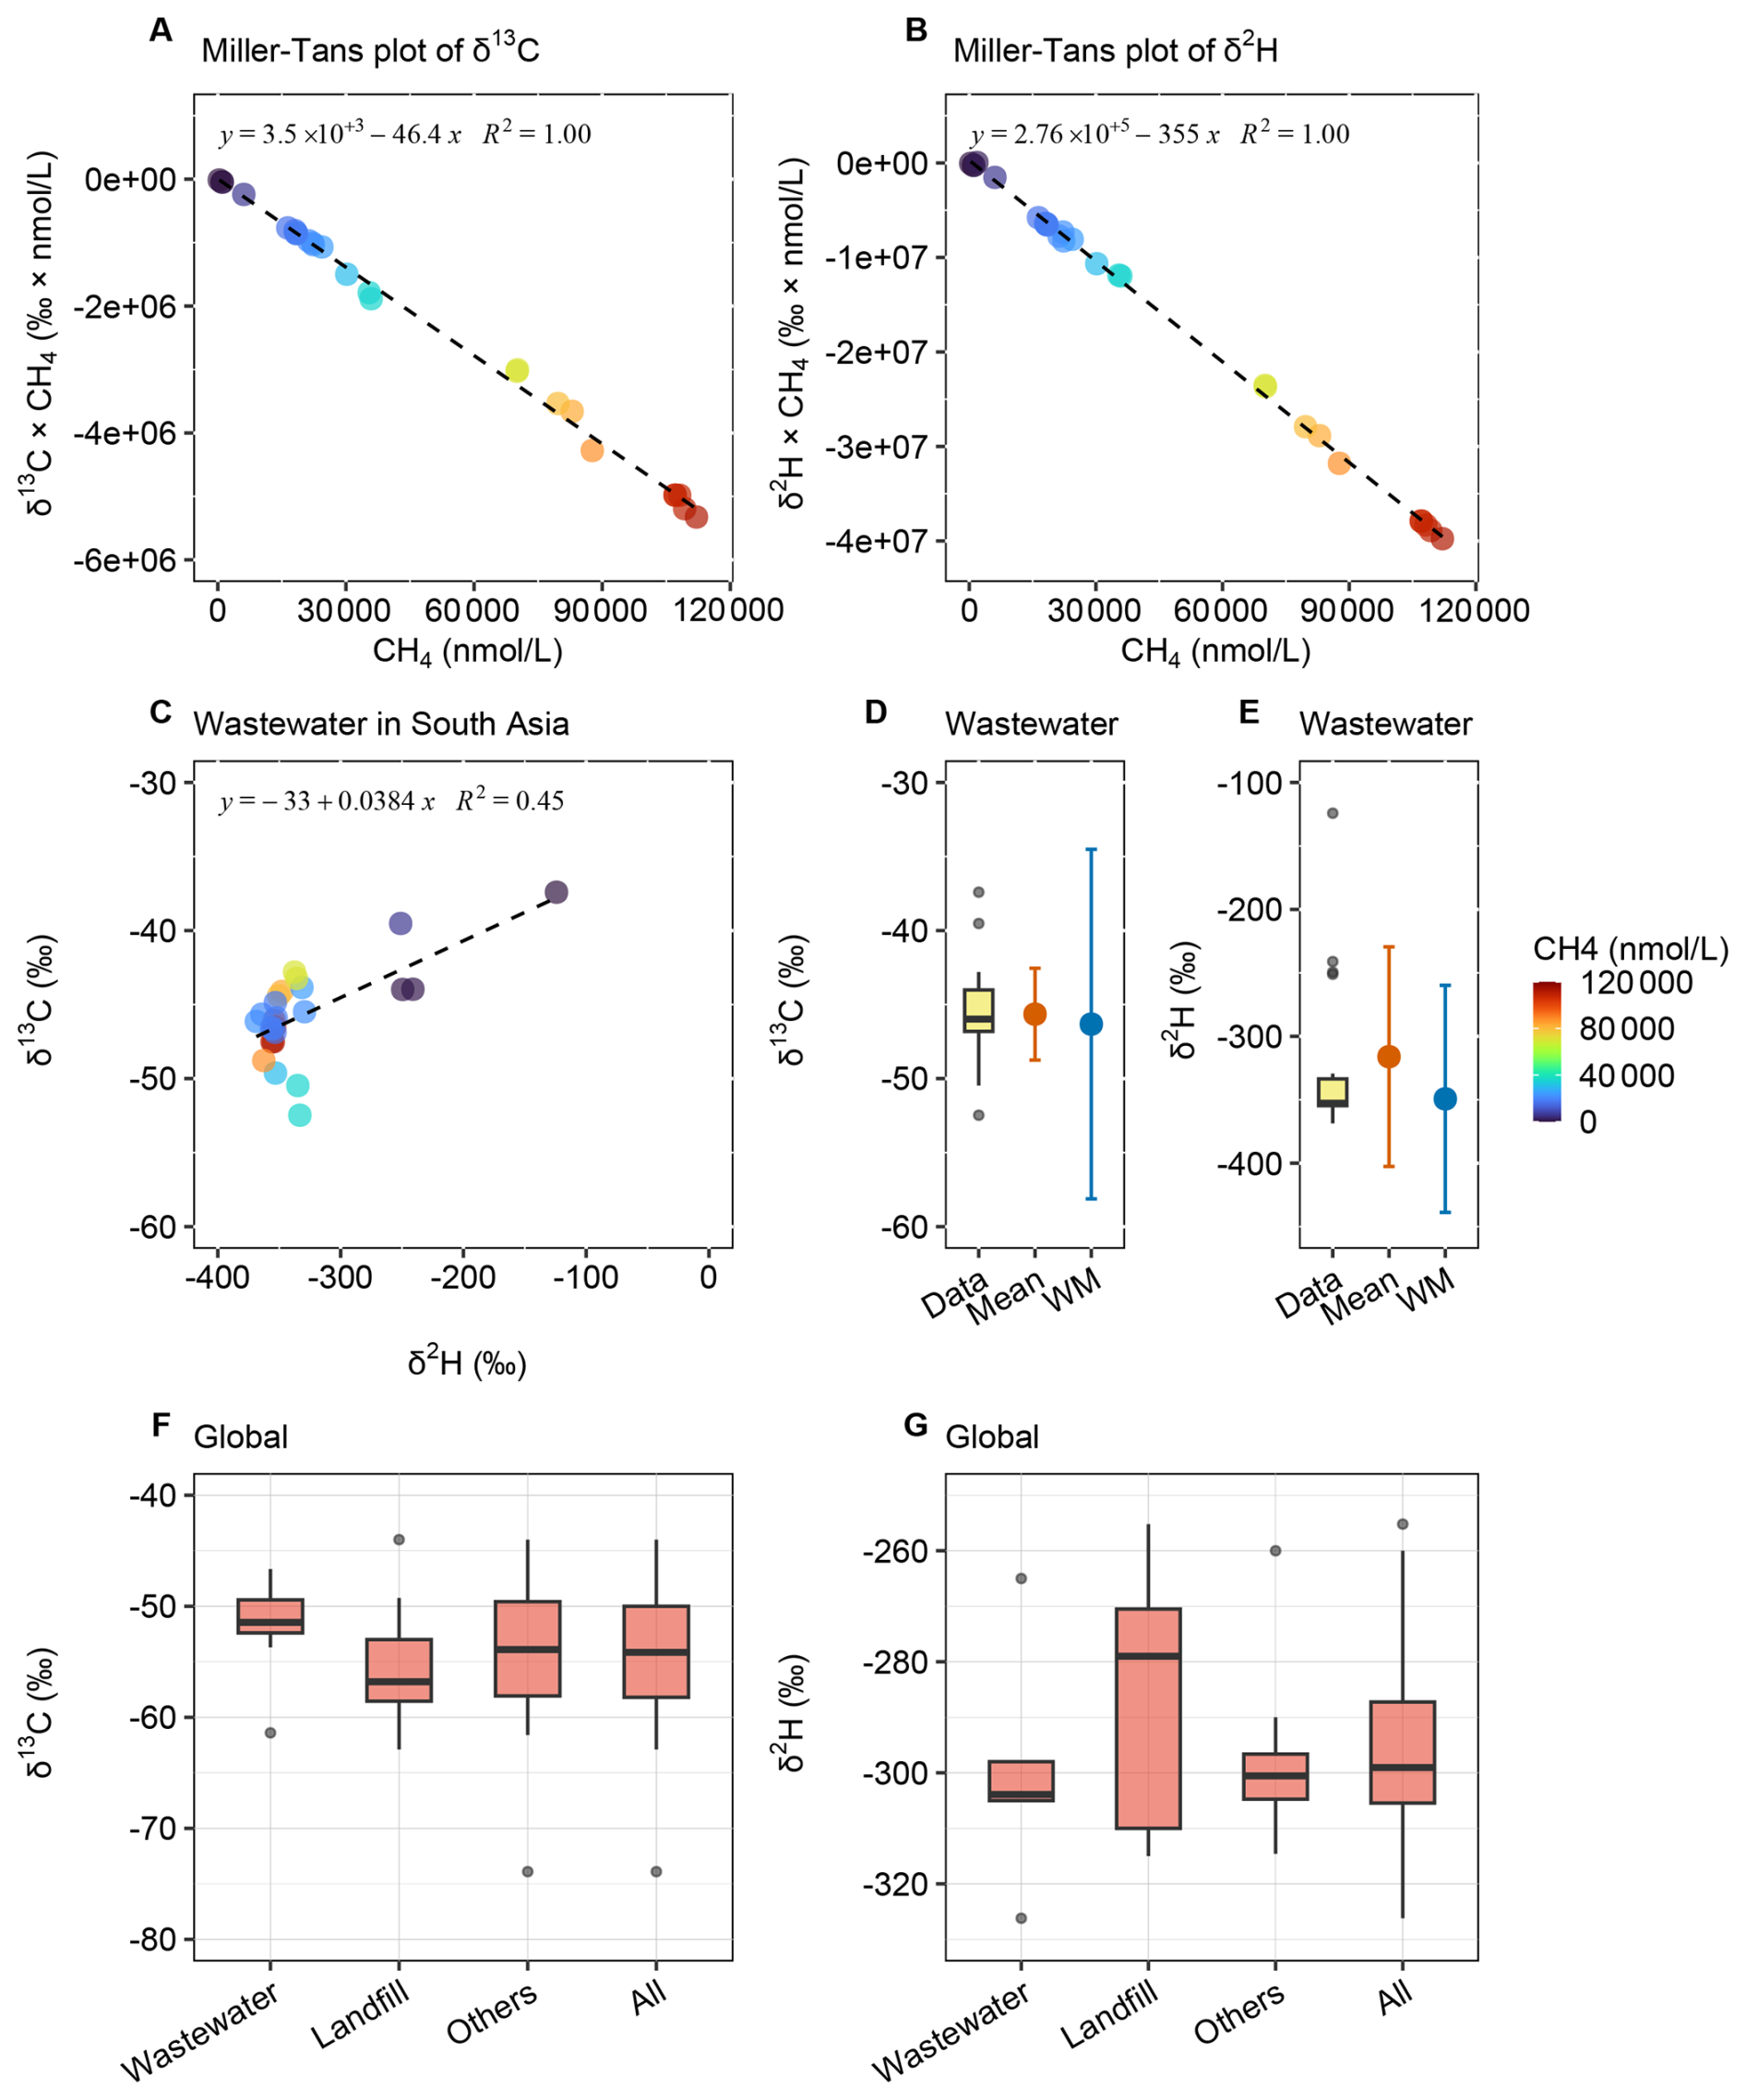
Figure 5Isotopic source signatures of methane from South Asian wastewater and global waste sources. (A) Miller–Tans plot of δ13C-CH4 for South Asia wastewater. (B) Miller–Tans plot of δ2H–CH4 for South Asia wastewater. (C) Coupled variation in δ13C and δ2H. (D) Quantiles, arithmetic mean, and concentration-weighted mean of δ13C–CH4 for South Asia wastewater. (E) Quantiles, arithmetic mean, and concentration-weighted mean of δ2H–CH4 for South Asia wastewater. (F) Global δ13C values of methane from waste sources. (G) Global δ2H values of methane from waste sources. Global review in Data S2.
Table 4Isotopic source signatures of CH4 from waste sources in South Asia and globally, as determined by various analytical and statistical methods.
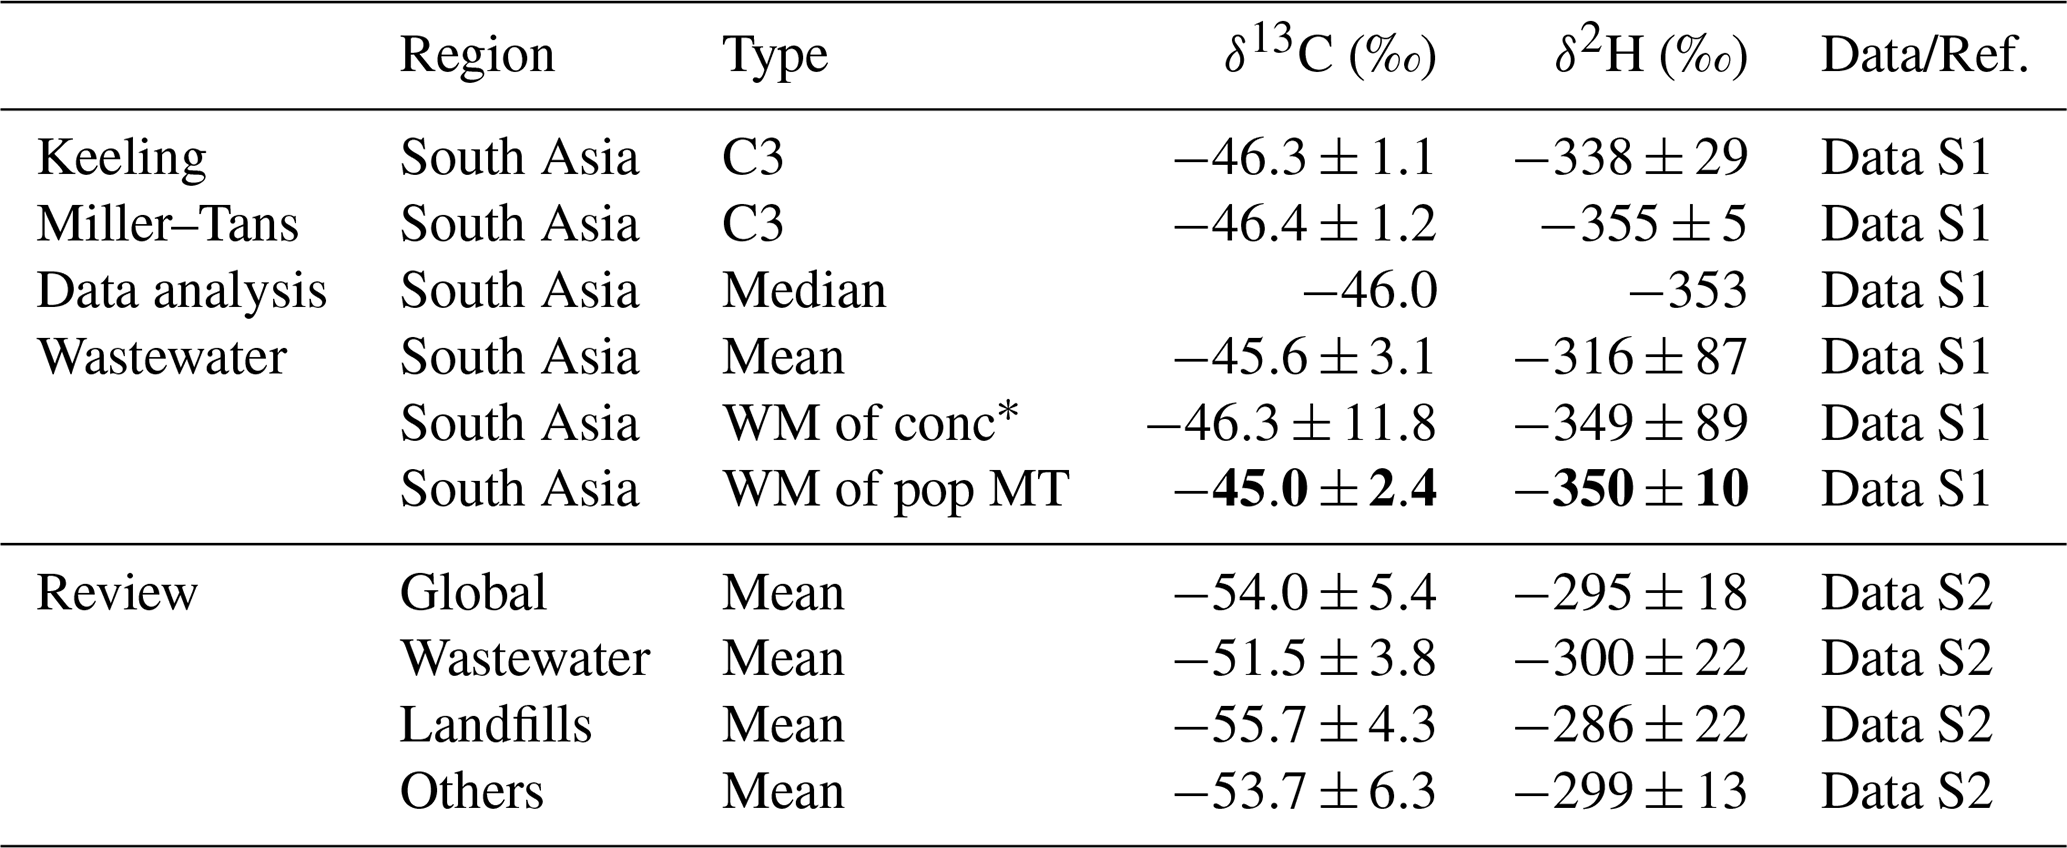
* “WM of conc” refers to the concentration-weighted mean δ-values of wastewater methane in South Asia. “WM of pop MT” denotes the population-weighted mean (weighted with the population of each province), calculated from the Miller–Tans method results for each region.
A global review of δ13C and δ2H values was conducted for methane emissions from waste sources (Fig. 5F and G), i.e., wastewater, landfills and other sources. The results indicated minor differences, suggesting that δ13C and δ2H signatures were not significantly distinct among various waste sources. Methane from global waste sources had mean δ13C and δ2H values of and , respectively. Slight differences existed between methane emissions from wastewater and landfills, with wastewater showing more enriched δ13C and slightly more depleted δ2H values. Other sources, such as composting, biogas fermentation and other organic waste decomposition (Lu et al., 2021; Bakkaloglu et al., 2022), exhibited wider range of values. Nonetheless, our findings showed that methane isotopic signatures from waste sources were consistent globally, which facilitated isotopic source apportionment. This similarity may be attributed to similar methane production mechanisms across these sources. Additionally, the narrow range of δ13C values for global waste methane suggested minimal latitudinal variation, making further differentiation unnecessary. However, in South Asia, methane from wastewater was more enriched in δ13C and depleted in δ2H compared to the global mean values.
Methane emissions from waste sources were estimated to contribute approximately 12 % of global anthropogenic emissions (Saunois et al., 2025). In South Asia, landfill methane emissions were particularly significant (Chakraborty et al., 2011), and atmospheric data also suggested that the waste sector played a key role in regional methane emissions, as supported by δ13C constraints (Metya et al., 2022). Emissions from waste sources were also influenced by a range of factors, including microbial communities, temperature, pH, the CH4 O2 ratio, nutrient levels and inhibitory chemicals (Polag et al., 2015; Nisbet et al., 2020; Woolley Maisch et al., 2025). Additionally, studies indicated that the operational status of landfills (active or closed) can influence the carbon isotopic signature (Bakkaloglu et al., 2022). However, our global review showed only minor distinctions among various waste sources, suggesting that the isotopic signatures we measured in South Asia should be representative for wastewater in the region. Further exploring other waste sources and various factors may improve our understanding of methane emissions from the waste sector. Although isotopic signatures of methane from waste sources showed limited variability globally, values in South Asia deviated significantly from the global mean. This highlights the need for region-specific isotopic endmembers also for waste sources in methane source apportionment studies.
3.5 Geographic distribution
There are geographic variations in methane isotopic compositions across the globe for any source class due to a combination of environmental factors and source materials. The isotopic signatures of microbial methane vary across regions due to multiple factors, including differences in raw materials, methanogenic pathways (Whiticar et al., 1986; Conrad, 2005), and the methane oxidation by methanotrophic bacteria. These factors are essential to consider and suggest that region-specific and sometimes system-specific isotope source fingerprinting are necessary to facilitate accurate isotope-based source apportionment. Previous studies identified correlations between methane isotopic values and regional environmental factors (Sherwood et al., 2017; Douglas et al., 2021). Building on our isotopic data and a comprehensive literature review, we investigated the geographic distribution of the isotopic signals of microbial methane in South Asia and worldwide.
The geographic distribution of methane isotopic signatures in South Asia was assessed for two microbial sources: rice paddies and wastewater (Fig. 6). Regional Miller–Tans-derived values for rice paddy methane showed substantial variability (Fig. 6A), with similar signatures in western India, the Indo-Gangetic Plain (IGP), and Bangladesh, but more depleted values in southern and eastern India. The enrichment in both δ13C and δ2H (Fig. 4C) suggested that multiple sources and/or pre-emission oxidation may drive the observed spatial variation. Given that rice cultivation was concentrated in the IGP and Bangladesh (Gumma, 2011), the production-weighted means of Miller–Tans values ( and ) represented pre-oxidation signatures of floodwater methane, though partial oxidation and associated fractionation may still be present. More enriched production-weighted concentration-weighted means ( and ) reflected the influence of oxidation. Although diffusion contributes only ∼1 %–2 % of rice paddy methane emissions, these fractionation processes may offer insights for wetlands, where diffusion accounts for a larger share (5 %–30 %). Nevertheless, the overall Miller–Tans values ( and ; Fig. 4A) were minimally influenced by oxidation and best represented the unaltered, source-specific isotopic signature of rice paddy methane.
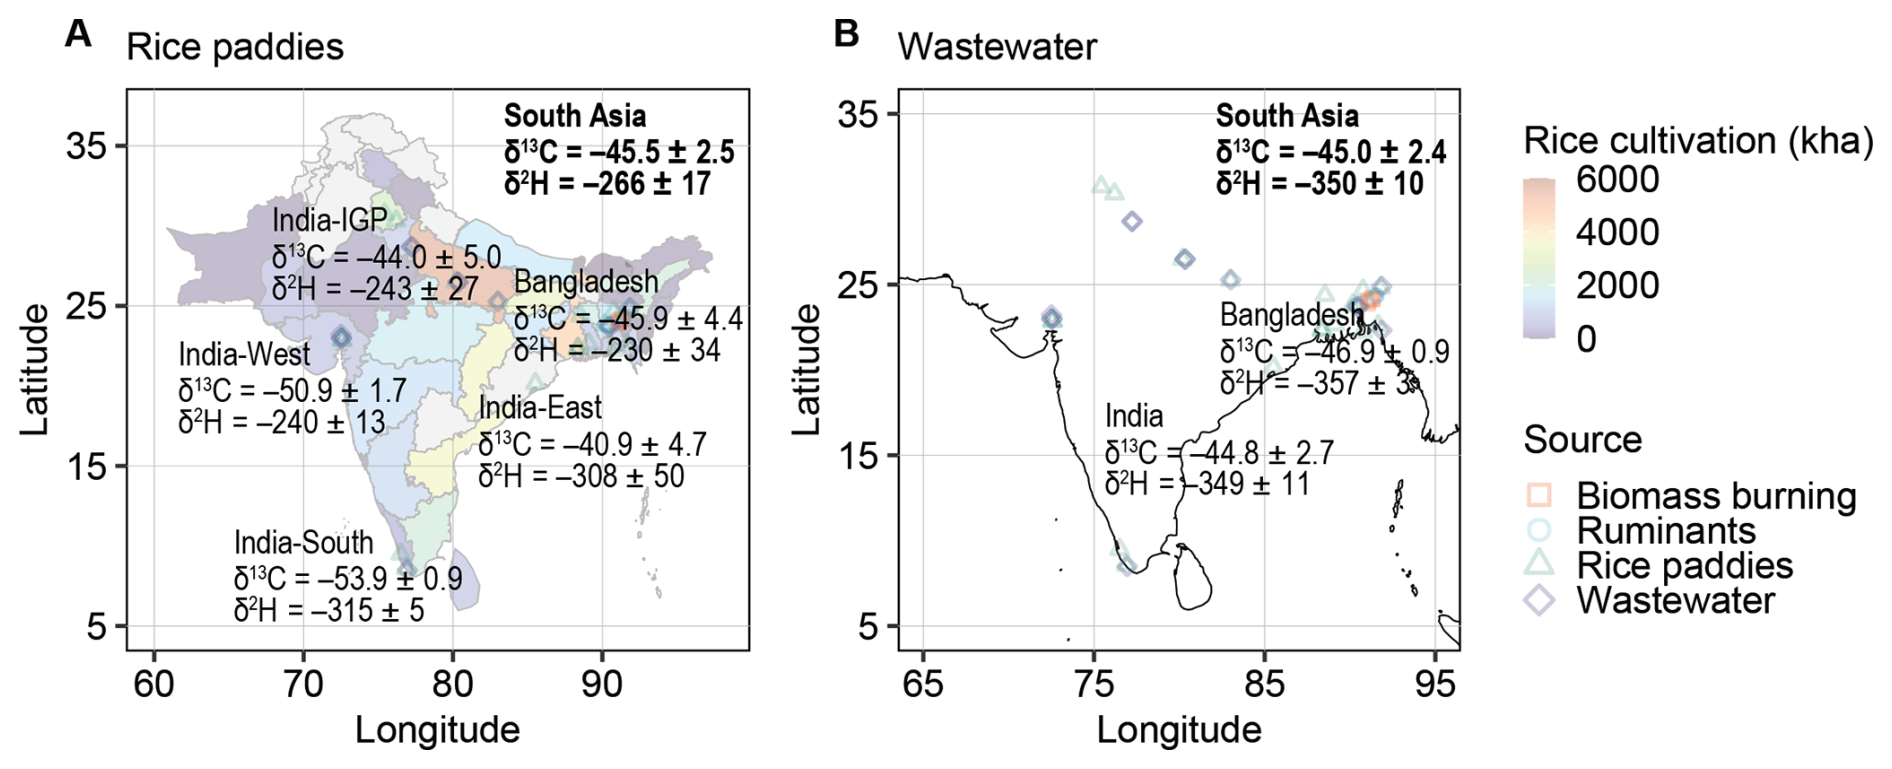
Figure 6Geographic distribution of methane isotopic signatures from two microbial sources in South Asia. (A) Rice paddies. (B) Wastewater. Rice cultivation data are derived from MODIS multitemporal data (Gumma, 2011). The isotopic signatures for rice paddies represent cultivation-weighted means, while those for wastewater are population-weighted means.
Wastewater methane isotopic signatures exhibited minimal regional variation, with India and Bangladesh showing similar δ13C values (Fig. 6B). Pre-emission oxidation of wastewater methane was negligible (Fig. 5C). To better represent regional emissions, we applied population-weighted averaging, assuming similar per capita methane production across South Asia, yielding and .
Our global synthesis revealed pronounced latitudinal variations in the isotopic signatures of methane from wetlands and rice paddies (Fig. 4F and G). Beyond the effects of oxidation and vegetation type, regional water conditions may also influence the hydrogen isotopic composition of microbial methane. To investigate this, we compared the global distributions of δ2H in surface water (H2O) and microbial methane (Fig. 7). Surface water isotopic data were sourced from the literature (Nan et al., 2019; IAEA/WMO, 2023; Halder et al., 2015), and microbial methane δ2H values were derived from our dataset and the global review. Global microbial methane δ2H exhibited a moderate or weak correlation with surface water δ2H (Fig. 7; R2=0.549 for ruminants, 0.363 for rice paddies and wetlands, 0.217 for waste), reflecting similar regional patterns among surface water and microbial sources. This correlation was particularly pronounced in North America. Hydrogen atoms in surface water likely served as a source for microbial methane (Whiticar et al., 1986; Whiticar, 1999), contributing to the observed spatial similarities in isotopic signatures. Among microbial sources, δ2H values varied by source category: ruminants exhibited the most depleted isotopic values, followed by waste, while rice paddies and wetlands were relatively more enriched in isotopic composition. In tropical regions, microbial methane δ2H values were more depleted than the global mean values, potentially indicating unique microbial, environmental processes, and/or different surface water δ2H that require further investigation. Variations across microbial sources mainly stem from differences in methanogenesis, with each source maintaining internal consistency.
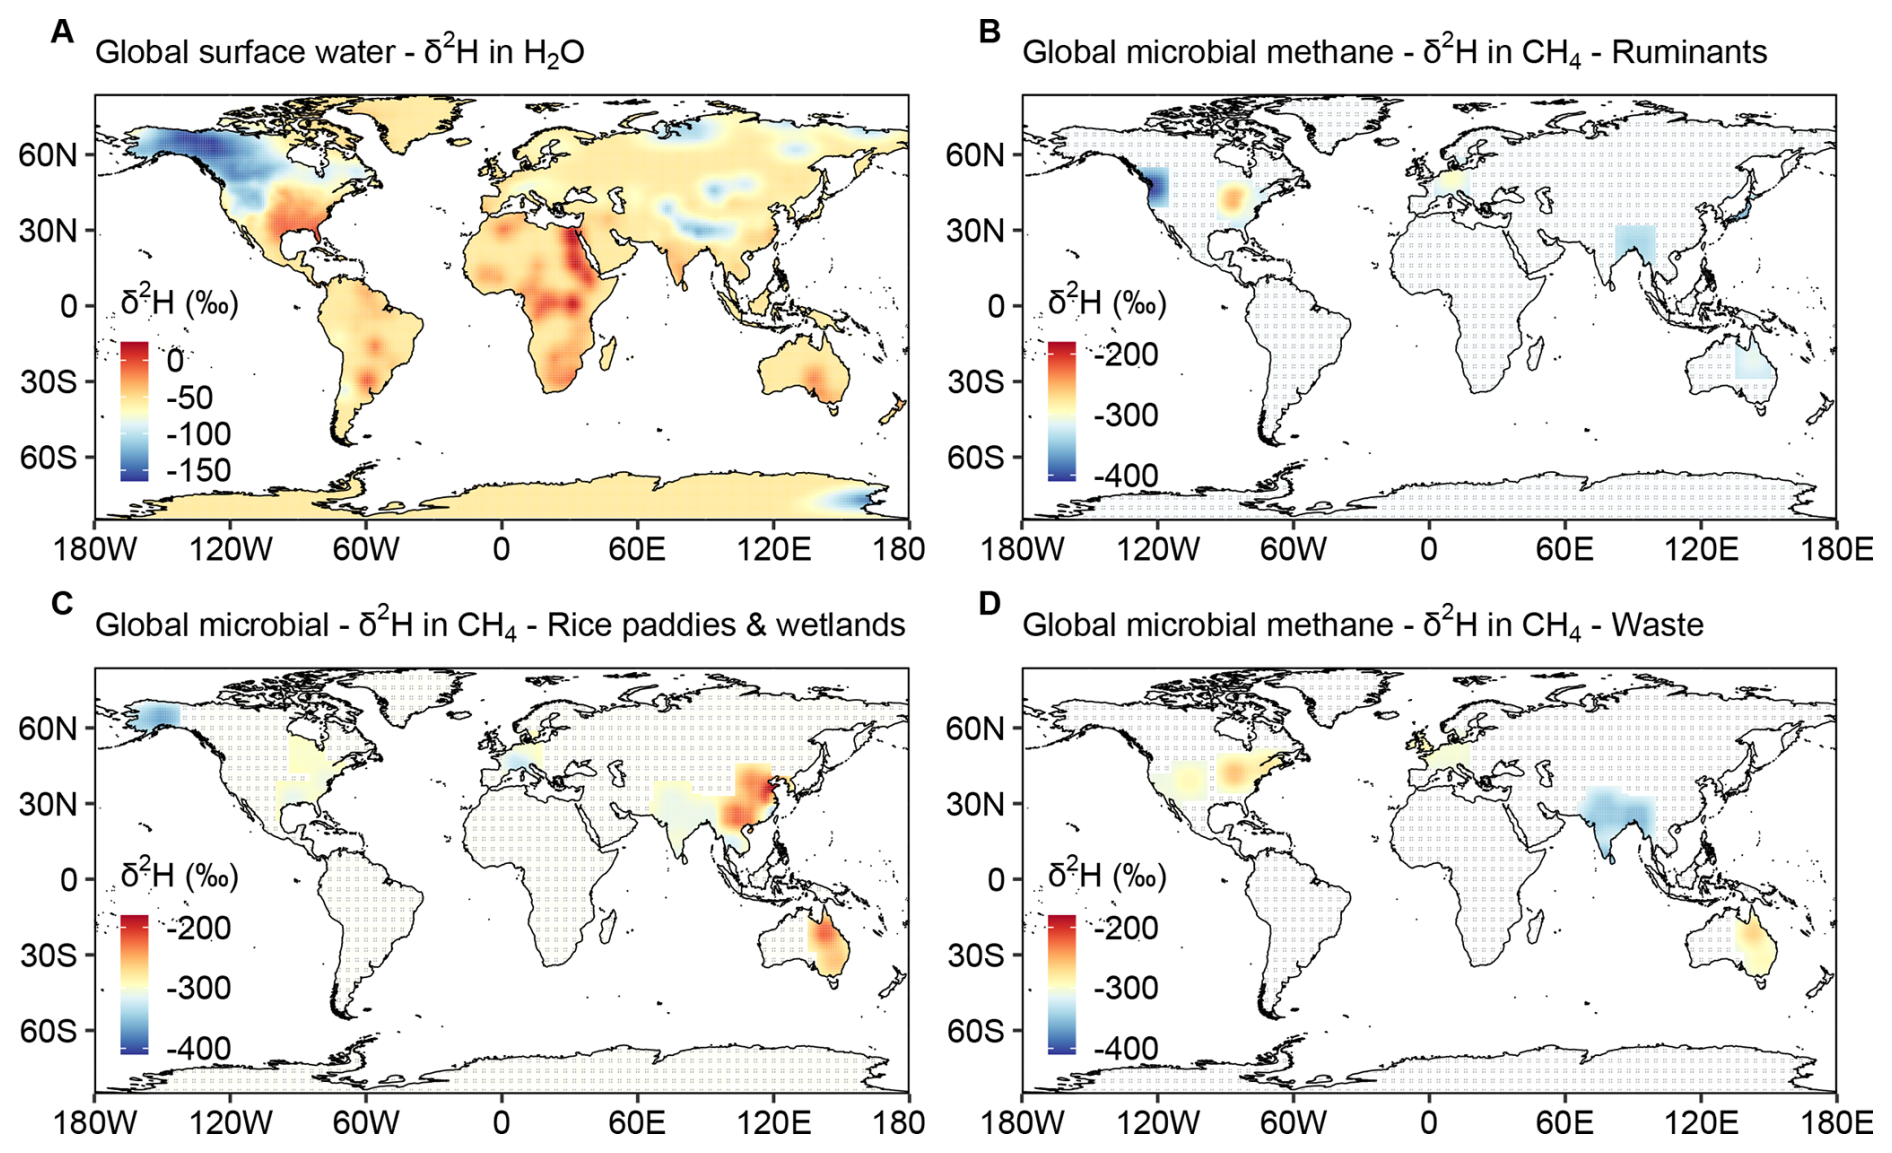
Figure 7Global distribution of δ2H in surface water and in microbial methane. (A) δ2H distribution in surface water systems, based on isotopic data from the literature (Nan et al., 2019; IAEA/WMO, 2023; Halder et al., 2015). (B) δ2H distribution in microbial methane from ruminants. (C) δ2H distribution in microbial methane from rice paddies and wetlands. (D) δ2H distribution in microbial methane from waste. The isotopic and geographic data of microbial methane are compiled from this study (South Asia) and the literature – global (Sherwood et al., 2017) and European (Menoud et al., 2022). Grid cells without any observation are marked with diagonal lines to indicate interpolation-only areas.
Latitudinal variations in aquatic methane δ2H (from rice paddies and wetlands) appeared to be influenced by both water isotopic composition and pre-emission oxidation. In South Asia, δ13C and δ2H enrichment in rice paddies methane (Fig. 4C) provided clear evidence of oxidation. Additionally, the latitudinal patterns of aquatic methane δ2H closely mirrored those of surface water δ2H (Figs. 7C, 4F and G), suggesting both factors may contribute. Similarly, ruminant methane exhibited parallel δ2H trends with surface water across latitudes but showed minimal oxidation, as reflected by depleted δ2H values (Fig. 7B) and a narrow δ2H range globally (Fig. 4G), likely due to direct atmospheric release. In contrast, waste sources showed minimal δ2H enrichment (Fig. 7D) and narrow δ13C and δ2H distributions globally (Fig. 5F and G), suggesting less influence from water sources and oxidation. In comparison, biomass burning methane exhibited a consistently narrow global δ2H range (Fig. 2E), as it was minimally influenced by surface water and was emitted directly into the atmosphere without oxidation.
Data scarcity in many regions limited the development of a comprehensive global distribution map (Fig. 7). Compared to the extensive observations and studies of δ13C (Nisbet et al., 2023), measurements and constraints based on δ2H remain much more limited, largely due to technical challenges associated with its analysis. However, a growing body of recent studies suggests that δ2H can provide valuable additional constraints on methane sources (Dasgupta et al., 2025; Riddell-Young et al., 2025). Nevertheless, other research indicated correlations between the δ2H of surface water (and precipitation) and the δ2H of aquatic methane sources in certain regions (Douglas et al., 2021). Our results indicated that δ2H followed predictable trends shaped by surface water isotopic composition and microbial processes. The correlation remained valid on a global scale (Fig. 7), though it was weaker, as numerous factors collectively influenced the isotopic signatures of each microbial source. Therefore, incorporating δ2H into isotopic source apportionment can enhance our understanding of the factors driving the rapid rise in global methane concentrations. In addition, previous studies have shown that the δ2H of H2 produced from biomass burning exhibits a latitudinal dependence (Röckmann et al., 2010). By analogy, the δ2H of CH4 from biomass burning may also be influenced by the isotopic composition of surface water and precipitation. However, as shown in Fig. 2E (Data S2), the currently available global dataset is too limited to resolve such variability. Despite progress, studies on methane isotopic source signatures remain incomplete, with significant data gaps across many regions. This study alleviated some of these gaps for South Asia, contributing to the required source fingerprint data for isotope-based source apportionment of airshed-receptor methane.
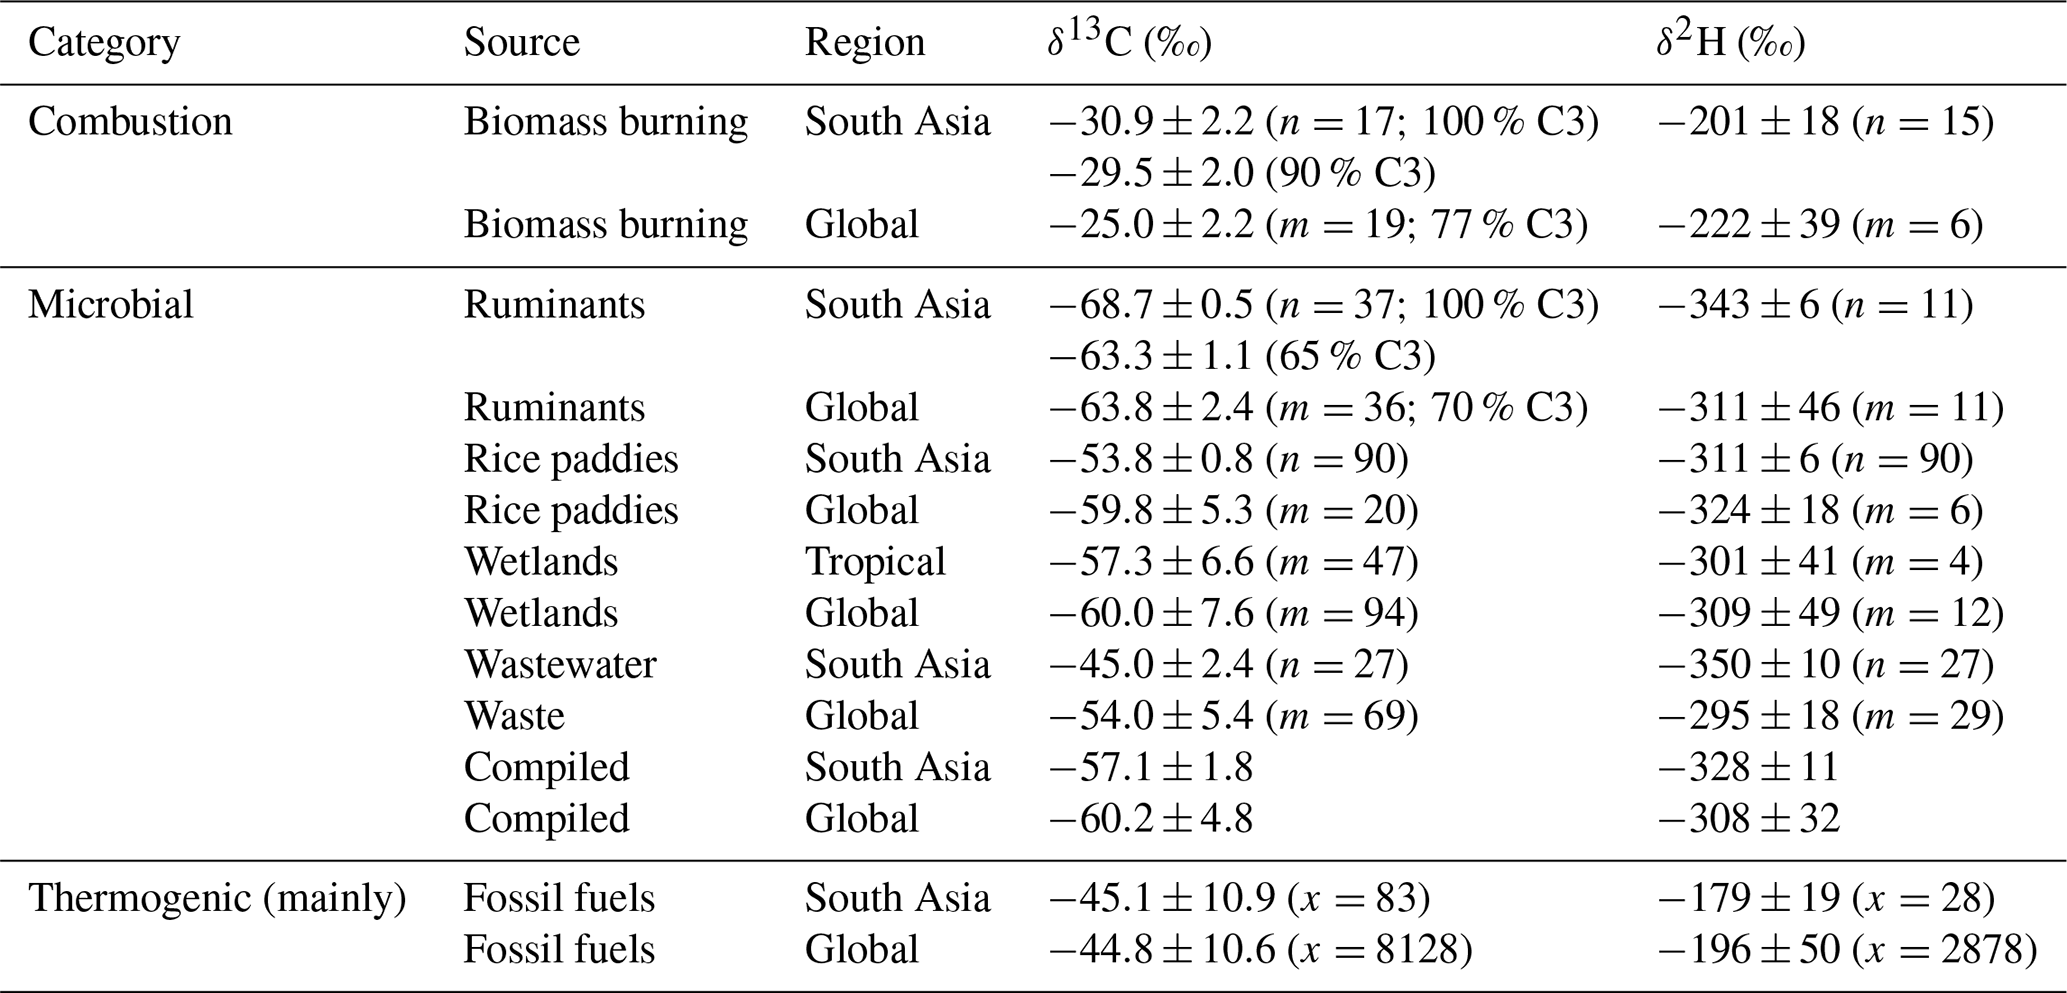
The extensive new source-isotope datasets were combined with earlier studies to yield updated dual-isotope endmember databases for South Asia and the globe (Fig. 8 and Table 5). Methane isotopic signatures for several sources differed in South Asia relative to their global means. Biomass burning and ruminant emissions in South Asia, both primarily associated with C3 biomass, exhibited more depleted δ13C values than global means (Fig. 8A). Conversely, methane from rice paddies displayed more enriched δ13C values than global means, and wastewater methane was more enriched in δ13C relative to global waste means (Fig. 8A) and also global wastewater means (Fig. 5 and Table 4). For δ2H, methane from biomass burning and thermogenic sources in South Asia was more enriched than global means (Fig. 8B). Among microbial sources, ruminants and wastewater were more depleted in δ2H, while rice paddies were more enriched than global values. The δ2H versus δ13C comparisons between South Asian and global methane sources provided a two-dimensional perspective (Fig. 9). While South Asian sources generally aligned with global categories, they exhibited distinct deviations. South Asian isotopic signatures showed a narrower distribution, whereas global isotopic signatures displayed greater variability. Among microbial sources, South Asian isotopic signatures appeared tighter constrained than their global counterparts.
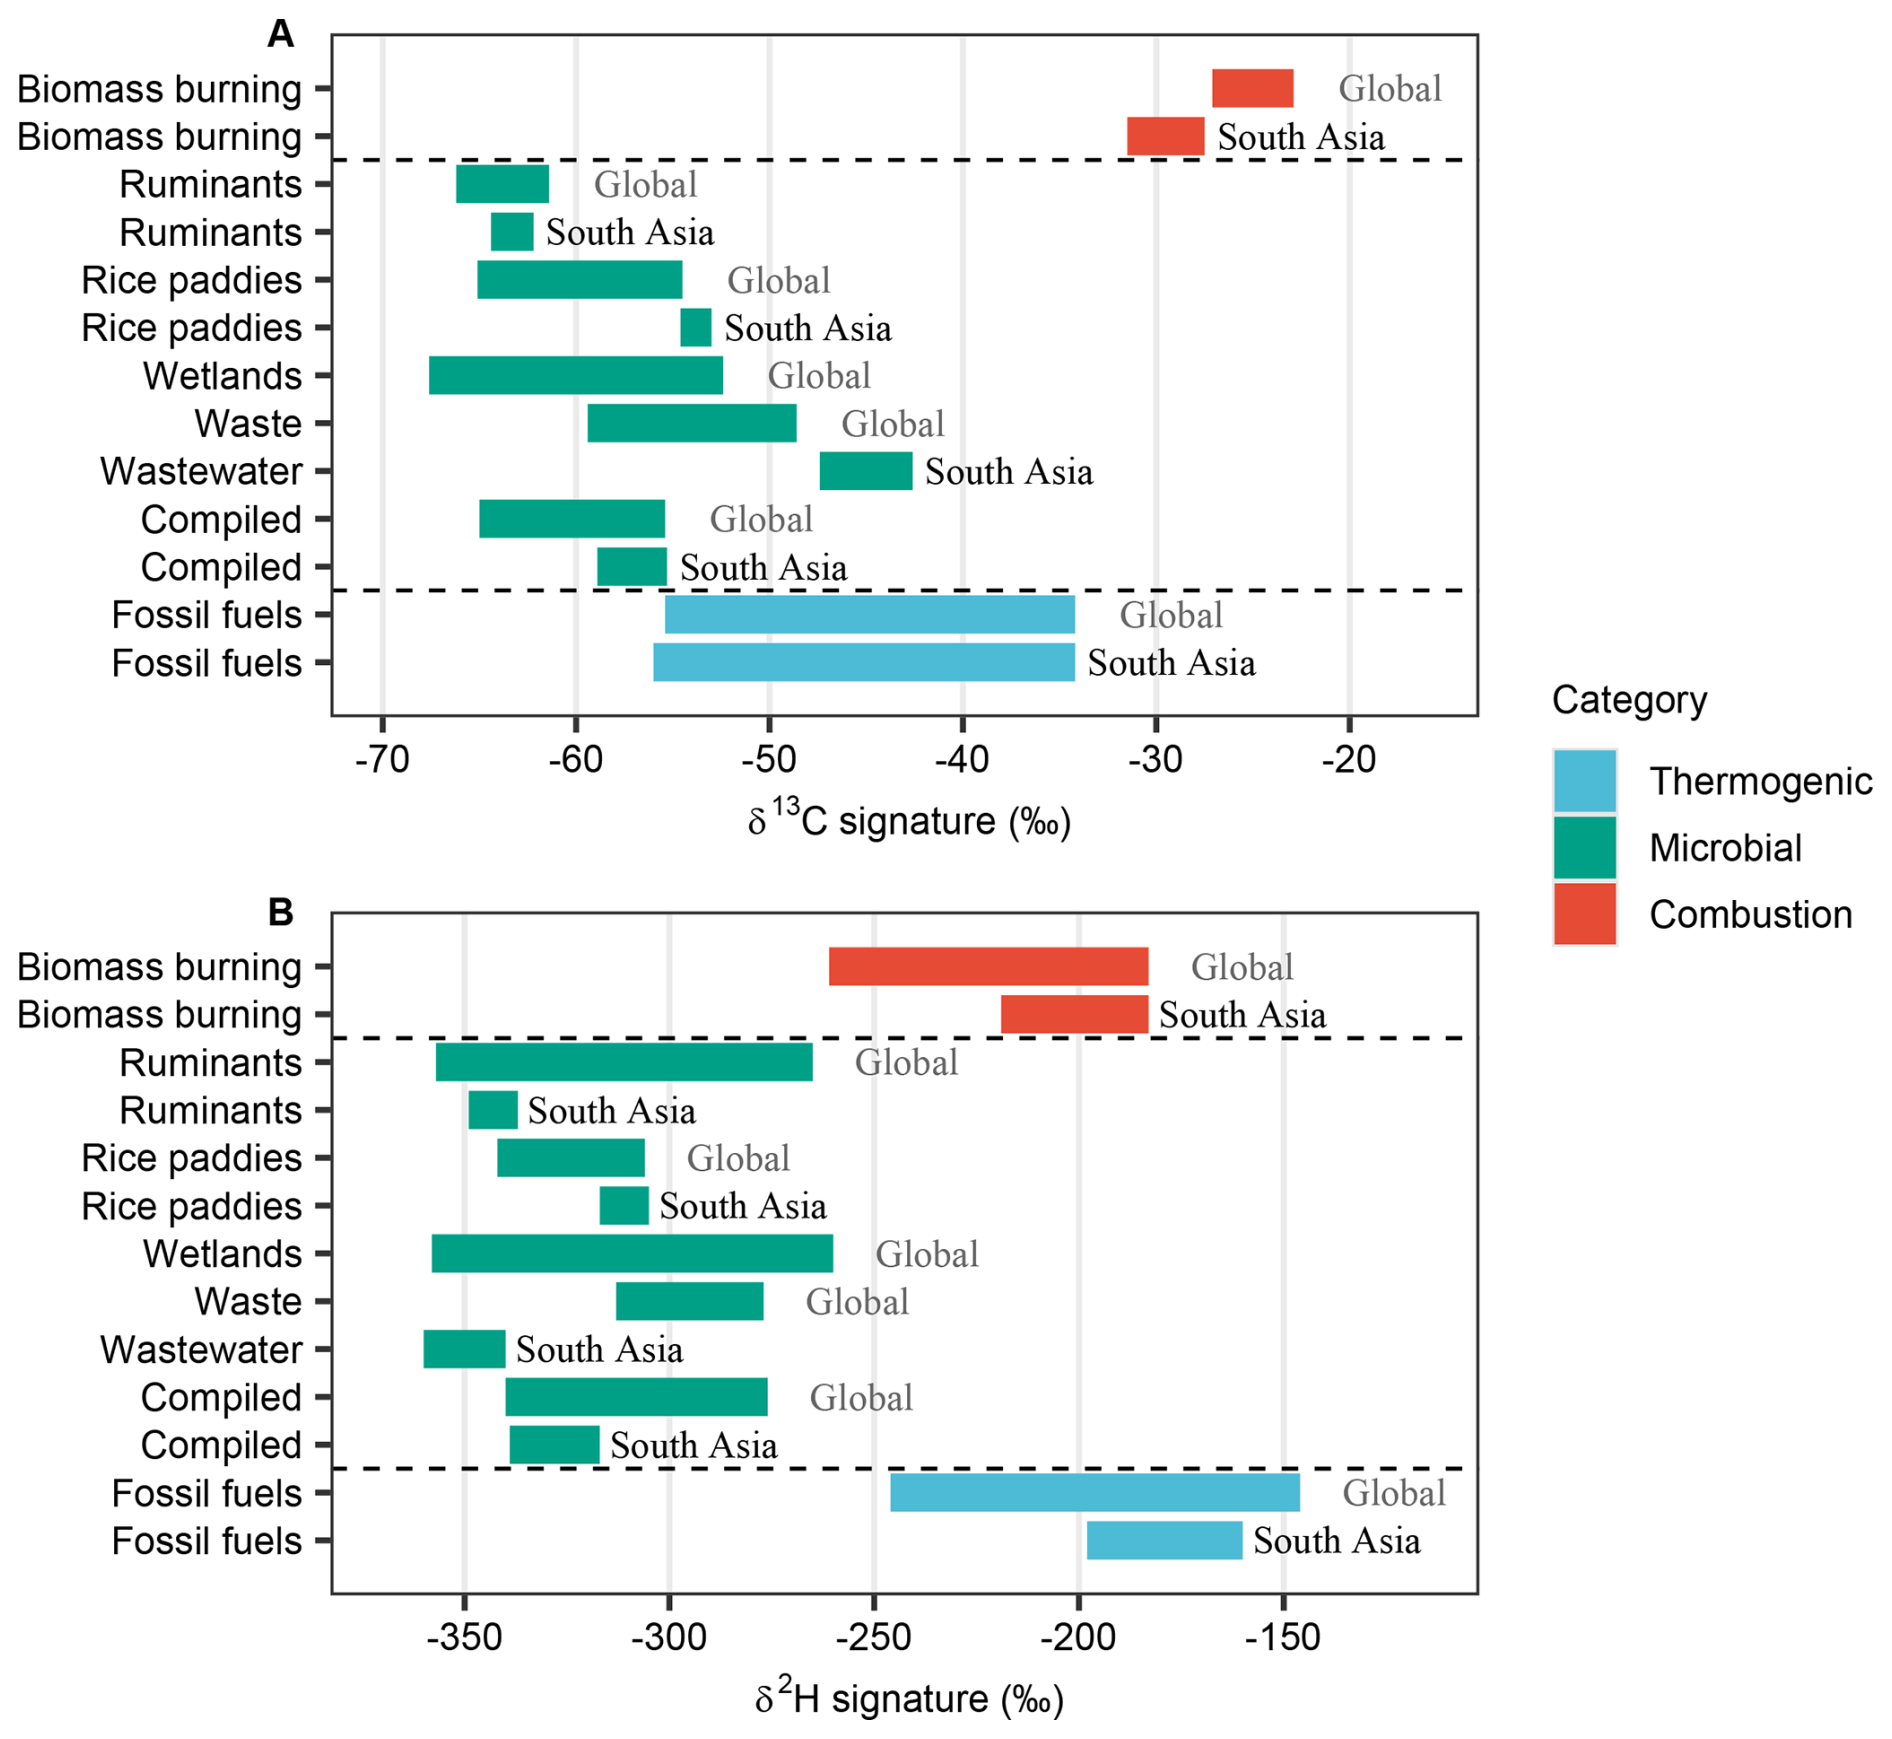
Figure 8Isotopic signatures of major methane sources in South Asia and globally. (A) δ13C signatures. (B) δ2H signatures.
Table 5Isotopic signatures of major methane sources in South Asia and globally. n represents to the number of samples analyzed in this study, while m indicates the number of literature sources summarized, where isotopic data from a specific region in a single study are compiled as a single entry. x refers to the number of isotopic data from the literature. Raw data, literature review and corresponding references are provided in Data S1–S2.
Based on previous bottom-up and top-down studies, emissions-weighted microbial methane isotopic signatures in South Asia ranged from and (Ito et al., 2023) to and (Saunois et al., 2025). These δ13C values are notably more enriched than the global compiled one ( and ) (Masson-Delmotte et al., 2021; Saunois et al., 2025), largely due to substantial rice paddy and waste contributions. Considering the δ13C of atmospheric methane in South Asia (e.g., in India; Metya et al., 2022) and accounting for isotopic fractionation during OH oxidation (approximately 6 ‰–7 ‰ in δ13C; Whiticar and Schaefer, 2007; Fischer et al., 2008; Schwietzke et al., 2016), the inferred isotopic values of the total source approach or even fall below the microbial estimates. This discrepancy suggests biases in current emission inventories, likely overestimating rice paddy emissions and underrepresenting other microbial sources. These uncertainties highlight the need for dual-isotope measurements at receptor sites to better constrain methane budgets in South Asia.
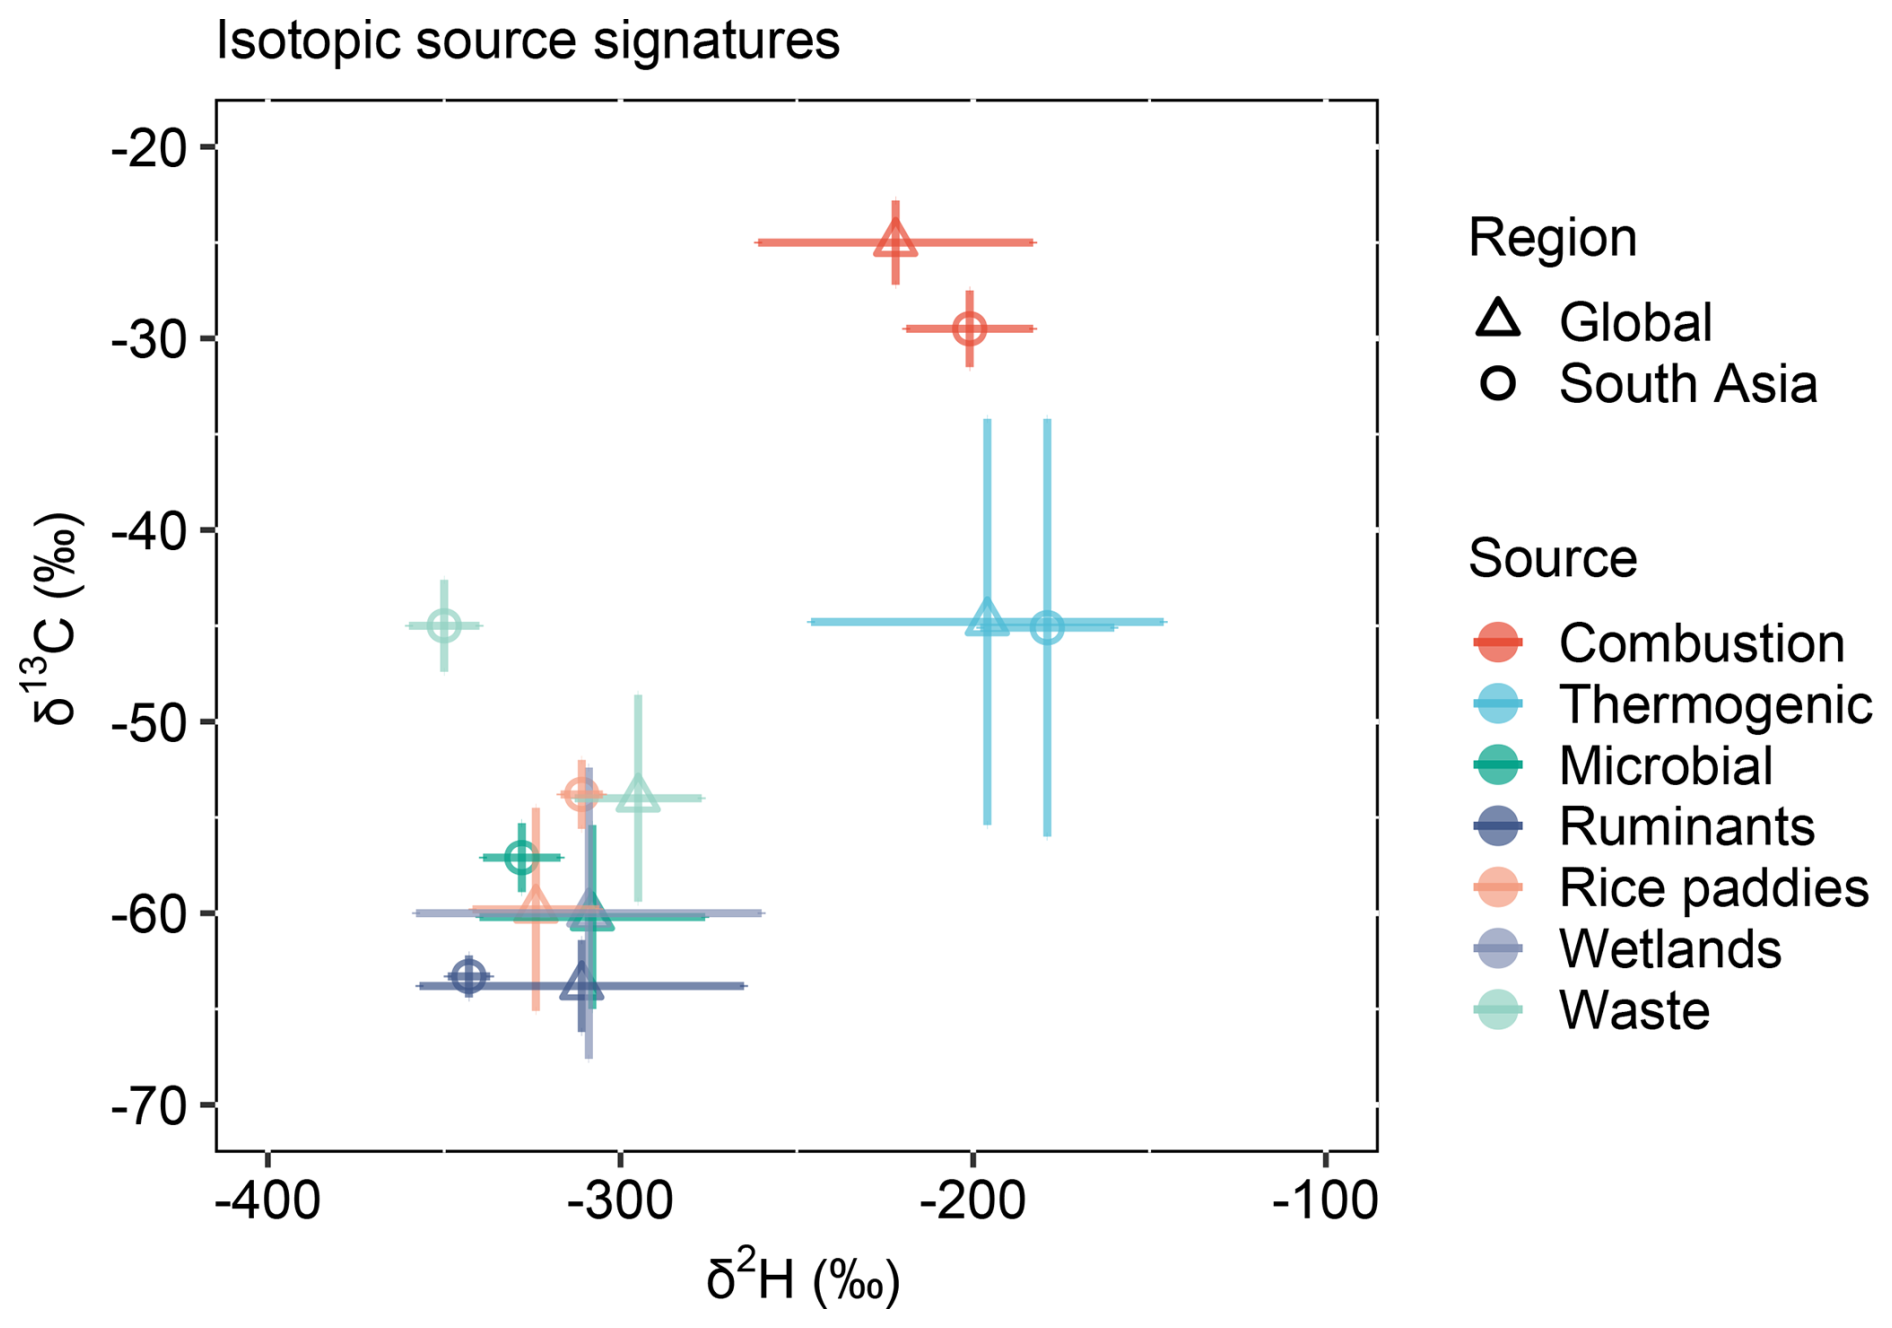
Figure 9Comparison of South Asian and global isotopic signatures of methane sources. δ2H versus δ13C. Microbial source refers to the compiled values of ruminants, rice paddies, wetlands, waste, etc.
Methane emission estimates remain considerably uncertain. Some studies attributed recent atmospheric methane increases primarily to microbial sources, including tropical wetlands (Saunois et al., 2025), waste and agriculture (Peng et al., 2022; Michel et al., 2024), while others highlighted contributions from thermogenic and ruminant sources (Chandra et al., 2021). Biomass burning was also proposed as a significant contributor (Zhao et al., 2025). Bottom-up inventories showed large discrepancies, with estimates differing substantially (Stavert et al., 2022). In South Asia, reported emissions varied substantially in both magnitude and source composition, from in the 2000s (Patra et al., 2013) to 50.3 Tg C yr−1 in more recent estimates (Ito et al., 2023), with further estimates of 52 Tg C yr−1 from top-down approaches (n=6) and 58 Tg C yr−1 from bottom-up approaches (n=27) (Saunois et al., 2025). Atmospheric methane in South Asia exhibited pronounced seasonal variations in both mixing ratios and isotopic composition (Rao et al., 2008; Tiwari et al., 2020; Metya et al., 2022; Guha et al., 2018), reflecting a combination of changes in source activity, transport, and atmospheric processing that are difficult to capture using conventional models. Given these limitations, regional isotopic source signatures, together with dual-isotope top-down approaches, offer an independent and valuable framework for improving constraints on regional methane budgets.
Comparisons of methane isotopic signatures between South Asian and global means revealed significant distinction (Figs. 8–9), underscoring the need for region-specific isotopic data to ensure accurate source apportionment. δ13C signatures reflected feedstock characteristics, distinguishing sources such as biomass burning and ruminants based on C3 C4 biomass ratios. Similarly, aquatic methane δ13C was influenced by organic precursors, with South Asian sources showing enriched values compared to other regions. Globally, δ2H in methane appeared linked to surface water and organic interactions, but highly depleted δ2H observed in South Asia suggests different microbial processes requiring further investigation. Additionally, pre-emission oxidation significantly affected methane from rice paddy water in South Asia, warranting more research to better understand this process and similar processes in other aqueous sources.
The availability and accuracy of isotopic source signatures was critical for constraining methane sources (Schwietzke et al., 2016). At present, isotopic measurements of tropical methane sources remain scarce, particularly for δ2H, still limiting their use in atmospheric top-down source constraints. While δ13C-based constraints are growing in applications globally (Nisbet et al., 2023; Tapin et al., 2026), δ2H constraints have been underutilized due to data limitations and unclear geographic distribution. Our study enhances the isotopic source fingerprint database, especially by adding δ2H data for sources in South Asia.
While isotopic source signatures of major methane sources in South Asia are now improved, estimating the isotopic composition of well-mixed atmospheric methane remains challenging due to fractionation during oxidation (e.g., OH and Cl radicals). Existing models applied fixed isotopic fractionation factors, yet these vary considerably across studies (Whiticar and Schaefer, 2007; Fischer et al., 2008; Rice et al., 2016; Schwietzke et al., 2016; Schaefer et al., 2016; Bock et al., 2017; Sherwood et al., 2017; Douglas et al., 2021; Nisbet et al., 2023; Michel et al., 2024; Thanwerdas et al., 2024; Fujita et al., 2025; Riddell-Young et al., 2025). Despite these uncertainties, background methane mixing ratios and isotopic compositions in South Asia and globally remain relatively stable, indicating that a steady-state approach, incorporating region-specific isotopic fingerprints, may help reconcile inconsistencies in current methane budget estimates.
The dataset will be hosted and maintained by a database management at the Bolin Centre for Climate Research at Stockholm University. The dataset is accessible at the Bolin Centre Database (https://doi.org/10.17043/yao-2026-methane-sources-1, Yao et al., 2026).
The supplement related to this article is available online at https://doi.org/10.5194/acp-26-7765-2026-supplement.
ÖG acquired funding and conceived the study. ÖG, HH, AbS, KrB, MRM, KSJ, MAH, AtS, AP, NR, CM, KR, and GKS. designed and conducted the field campaigns. PY, KaB, JB, and HH performed the isotope analyses. PY, KaB, HH, and ÖG conducted the data analysis and interpretation. PY, HH, and ÖG prepared the manuscript with contributions from all co-authors. All authors reviewed and edited the manuscript.
The contact author has declared that none of the authors has any competing interests.
Publisher's note: Copernicus Publications remains neutral with regard to jurisdictional claims made in the text, published maps, institutional affiliations, or any other geographical representation in this paper. The authors bear the ultimate responsibility for providing appropriate place names. Views expressed in the text are those of the authors and do not necessarily reflect the views of the publisher.
We thank Fangping Yan, Joakim Romson, Marenka Brussee, and Albin Eriksson for their insightful discussions. This work was supported by the Swedish Research Council VR (Distinguished Professor grant-no. 2017-01601) and the Swedish Research Council for Sustainable Development Formas (grant-no. 2023-01234).
This research has been supported by the Swedish Research Council VR (Distinguished Professor grant no. 2017-01601) and the Swedish Research Council for Sustainable Development Formas (grant no. 2023-01234).
The publication of this article was funded by the Swedish Research Council, Forte, Formas, and Vinnova.
This paper was edited by Bryan N. Duncan and reviewed by two anonymous referees.
Bakkaloglu, S., Lowry, D., Fisher, R. E., Menoud, M., Lanoisellé, M., Chen, H., Röckmann, T., and Nisbet, E. G.: Stable isotopic signatures of methane from waste sources through atmospheric measurements, Atmos. Environ., 276, 119021, https://doi.org/10.1016/j.atmosenv.2022.119021, 2022.
Bock, M., Schmitt, J., Beck, J., Seth, B., Chappellaz, J., and Fischer, H.: Glacial/interglacial wetland, biomass burning, and geologic methane emissions constrained by dual stable isotopic CH4 ice core records, P. Natl. Acad. Sci. USA, 114, E5778–E5786, https://doi.org/10.1073/pnas.1613883114, 2017.
Bousquet, P., Ciais, P., Miller, J. B., Dlugokencky, E. J., Hauglustaine, D. A., Prigent, C., Van der Werf, G. R., Peylin, P., Brunke, E.-G., Carouge, C., Langenfelds, R. L., Lathière, J., Papa, F., Ramonet, M., Schmidt, M., Steele, L. P., Tyler, S. C., and White, J.: Contribution of anthropogenic and natural sources to atmospheric methane variability, Nature, 443, 439–443, https://doi.org/10.1038/nature05132, 2006.
Brownlow, R., Lowry, D., Fisher, R. E., France, J. L., Lanoisellé, M., White, B., Wooster, M. J., Zhang, T., and Nisbet, E. G.: Isotopic Ratios of Tropical Methane Emissions by Atmospheric Measurement, Global Biogeochem. Cy., 31, 1408–1419, https://doi.org/10.1002/2017GB005689, 2017.
Chakraborty, M., Sharma, C., Pandey, J., Singh, N., and Gupta, P. K.: Methane emission estimation from landfills in Delhi: A comparative assessment of different methodologies, Atmos. Environ., 45, 7135–7142, https://doi.org/10.1016/j.atmosenv.2011.09.015, 2011.
Chandra, N., Patra, P. K., Bisht, J. S. H., Ito, A., Umezawa, T., Saigusa, N., Morimoto, S., Aoki, S., Janssens-Maenhout, G., Fujita, R., Takigawa, M., Watanabe, S., Saitoh, N., and Canadell, J. G.: Emissions from the Oil and Gas Sectors, Coal Mining and Ruminant Farming Drive Methane Growth over the Past Three Decades, J. Meteorol. Soc. Japan. Ser. II, 99, 2021–015, https://doi.org/10.2151/jmsj.2021-015, 2021.
Chang, J., Peng, S., Ciais, P., Saunois, M., Dangal, S. R. S., Herrero, M., Havlík, P., Tian, H., and Bousquet, P.: Revisiting enteric methane emissions from domestic ruminants and their δ13CCH4 source signature, Nat. Commun., 10, 3420, https://doi.org/10.1038/s41467-019-11066-3, 2019.
Ciais, P., Zhu, Y., Cai, Y., Lan, X., Michel, S. E., Zheng, B., Zhao, Y., Hauglustaine, D. A., Lin, X., Zhang, Y., Sun, S., Tian, X., Zhao, M., Wang, Y., Chang, J., Dou, X., Liu, Z., Andrew, R., Quinn, C. A., Poulter, B., Ouyang, Z., Yuan, W., Yuan, K., Zhu, Q., Li, F., Pan, N., Tian, H., Yu, X., Rocher-Ros, G., Johnson, M. S., Li, M., Li, M., Feng, D., Raymond, P., Yang, X., Canadell, J. G., Jackson, R. B., Yu, X., Li, Y., Saunois, M., Bousquet, P., and Peng, S.: Why methane surged in the atmosphere during the early 2020s, Science, 391, https://doi.org/10.1126/science.adx8262, 2026.
Cicerone, R. J. and Shetter, J. D.: Sources of atmospheric methane: Measurements in rice paddies and a discussion, J. Geophys. Res.-Oceans, 86, 7203–7209, https://doi.org/10.1029/JC086iC08p07203, 1981.
Conrad, R.: Quantification of methanogenic pathways using stable carbon isotopic signatures: a review and a proposal, Org. Geochem., 36, 739–752, https://doi.org/10.1016/j.orggeochem.2004.09.006, 2005.
Crippa, M., Guizzardi, D., Pagani, F., Banja, M., Muntean, M., Schaaf, E., Monforti-Ferrario, F., Becker, W., Quadrelli, R., Risquez Martin, A., Taghavi-Moharamli, P., Köykkä, J., Grassi, G., Rossi, S., Melo, J., Oom, D., Branco, A., San-Miguel, J., Manca, G., Pisoni, E., Vignati, E., and Pekar, F.: GHG emissions of all world countries, Publ. Off. Eur Union, Luxembourg, https://doi.org/10.2760/4002897, 2024.
Cusworth, D. H., Duren, R. M., Ayasse, A. K., Jiorle, R., Howell, K., Aubrey, A., Green, R. O., Eastwood, M. L., Chapman, J. W., Thorpe, A. K., Heckler, J., Asner, G. P., Smith, M. L., Thoma, E., Krause, M. J., Heins, D., and Thorneloe, S.: Quantifying methane emissions from United States landfills, Science, 383, 1499–1504, https://doi.org/10.1126/science.adi7735, 2024.
Dasari, S., Andersson, A., Stohl, A., Evangeliou, N., Bikkina, S., Holmstrand, H., Budhavant, K., Salam, A., and Gustafsson, Ö.: Source Quantification of South Asian Black Carbon Aerosols with Isotopes and Modeling, Environ. Sci. Technol., 54, 11771–11779, https://doi.org/10.1021/acs.est.0c02193, 2020.
Dasgupta, B., Pandey, S., Houweling, S., Menoud, M., van der Veen, C., Miller, J., Riddell-Young, B., Englund Michel, S., Sperlich, P., Morimoto, S., Fujita, R., Levin, I., Veidt, C., Platt, S., Groot Zwaaftink, C., Lund Myhre, C., Woolley Maisch, C., Fisher, R., G. Nisbet, E., France, J., Moss, R., Warwick, N., and Röckmann, T.: Global Methane Emission Estimates from a Dual-Isotope Inversion: New Constraints from δD–CH4, EGUsphere [preprint], https://doi.org/10.5194/egusphere-2025-5571, 2025.
Ding, W., Cai, Z., Tsuruta, H., and Li, X.: Effect of standing water depth on methane emissions from freshwater marshes in northeast China, Atmos. Environ., 36, 5149–5157, https://doi.org/10.1016/S1352-2310(02)00647-7, 2002.
Douglas, P. M. J., Stratigopoulos, E., Park, S., and Phan, D.: Geographic variability in freshwater methane hydrogen isotope ratios and its implications for global isotopic source signatures, Biogeosciences, 18, 3505–3527, https://doi.org/10.5194/bg-18-3505-2021, 2021.
Dyonisius, M. N., Petrenko, V. V., Smith, A. M., Hua, Q., Yang, B., Schmitt, J., Beck, J., Seth, B., Bock, M., Hmiel, B., Vimont, I., Menking, J. A., Shackleton, S. A., Baggenstos, D., Bauska, T. K., Rhodes, R. H., Sperlich, P., Beaudette, R., Harth, C., Kalk, M., Brook, E. J., Fischer, H., Severinghaus, J. P., and Weiss, R. F.: Old carbon reservoirs were not important in the deglacial methane budget, Science, 367, 907–910, https://doi.org/10.1126/science.aax0504, 2020.
Feng, L., Palmer, P. I., Zhu, S., Parker, R. J., and Liu, Y.: Tropical methane emissions explain large fraction of recent changes in global atmospheric methane growth rate, Nat. Commun., 13, 1378, https://doi.org/10.1038/s41467-022-28989-z, 2022.
Fischer, H., Behrens, M., Bock, M., Richter, U., Schmitt, J., Loulergue, L., Chappellaz, J., Spahni, R., Blunier, T., Leuenberger, M., and Stocker, T. F.: Changing boreal methane sources and constant biomass burning during the last termination, Nature, 452, 864–867, https://doi.org/10.1038/nature06825, 2008.
Fisher, R. E., France, J. L., Lowry, D., Lanoisellé, M., Brownlow, R., Pyle, J. A., Cain, M., Warwick, N., Skiba, U. M., Drewer, J., Dinsmore, K. J., Leeson, S. R., Bauguitte, S. J. B., Wellpott, A., O'Shea, S. J., Allen, G., Gallagher, M. W., Pitt, J., Percival, C. J., Bower, K., George, C., Hayman, G. D., Aalto, T., Lohila, A., Aurela, M., Laurila, T., Crill, P. M., McCalley, C. K., and Nisbet, E. G.: Measurement of the 13C isotopic signature of methane emissions from northern European wetlands, Global Biogeochem. Cy., 31, 605–623, https://doi.org/10.1002/2016GB005504, 2017.
France, J. L., Fisher, R. E., Lowry, D., Allen, G., Andrade, M. F., Bauguitte, S. J. B., Bower, K., Broderick, T. J., Daly, M. C., Forster, G., Gondwe, M., Helfter, C., Hoyt, A. M., Jones, A. E., Lanoisellé, M., Moreno, I., Nisbet-Jones, P. B. R., Oram, D., Pasternak, D., Pitt, J. R., Skiba, U., Stephens, M., Wilde, S. E., and Nisbet, E. G.: δ13C methane source signatures from tropical wetland and rice field emissions, Philos. T. R. Soc. A, 380, https://doi.org/10.1098/rsta.2020.0449, 2022.
Fujita, R., Graven, H., Zazzeri, G., Hmiel, B., Petrenko, V. V., Smith, A. M., Michel, S. E., and Morimoto, S.: Global Fossil Methane Emissions Constrained by Multi-Isotopic Atmospheric Methane Histories, J. Geophys. Res.-Atmos., 130, https://doi.org/10.1029/2024JD041266, 2025.
Ganesan, A. L., Rigby, M., Lunt, M. F., Parker, R. J., Boesch, H., Goulding, N., Umezawa, T., Zahn, A., Chatterjee, A., Prinn, R. G., Tiwari, Y. K., van der Schoot, M., and Krummel, P. B.: Atmospheric observations show accurate reporting and little growth in India's methane emissions, Nat. Commun., 8, 836, https://doi.org/10.1038/s41467-017-00994-7, 2017.
Ganesan, A. L., Stell, A. C., Gedney, N., Comyn-Platt, E., Hayman, G., Rigby, M., Poulter, B., and Hornibrook, E. R. C.: Spatially Resolved Isotopic Source Signatures of Wetland Methane Emissions, Geophys. Res. Lett., 45, 3737–3745, https://doi.org/10.1002/2018GL077536, 2018.
Guha, T., Tiwari, Y. K., Valsala, V., Lin, X., Ramonet, M., Mahajan, A., Datye, A., and Kumar, K. R.: What controls the atmospheric methane seasonal variability over India?, Atmos. Environ., 175, 83–91, https://doi.org/10.1016/j.atmosenv.2017.11.042, 2018.
Gumma, M. K.: Mapping rice areas of South Asia using MODIS multitemporal data, J. Appl. Remote Sens., 5, 053547, https://doi.org/10.1117/1.3619838, 2011.
Halder, J., Terzer, S., Wassenaar, L. I., Araguás-Araguás, L. J., and Aggarwal, P. K.: The Global Network of Isotopes in Rivers (GNIR): integration of water isotopes in watershed observation and riverine research, Hydrol. Earth Syst. Sci., 19, 3419–3431, https://doi.org/10.5194/hess-19-3419-2015, 2015.
Hook, S. E., Wright, A.-D. G., and McBride, B. W.: Methanogens: Methane Producers of the Rumen and Mitigation Strategies, Archaea, 2010, 1–11, https://doi.org/10.1155/2010/945785, 2010.
Hristov, A. N., Harper, M., Meinen, R., Day, R., Lopes, J., Ott, T., Venkatesh, A., and Randles, C. A.: Discrepancies and Uncertainties in Bottom-up Gridded Inventories of Livestock Methane Emissions for the Contiguous United States, Environ. Sci. Technol., 51, 13668–13677, https://doi.org/10.1021/acs.est.7b03332, 2017.
IAEA/WMO: Global Network of Isotopes in Precipitation (GNIP), The GNIP Database, https://nucleus.iaea.org/wiser (last access: 29 May 2026), 2023.
Ito, A., Patra, P. K., and Umezawa, T.: Bottom-Up Evaluation of the Methane Budget in Asia and Its Subregions, Global Biogeochem. Cy., 37, https://doi.org/10.1029/2023GB007723, 2023.
Jackson, R. B., Saunois, M., Bousquet, P., Canadell, J. G., Poulter, B., Stavert, A. R., Bergamaschi, P., Niwa, Y., Segers, A., and Tsuruta, A.: Increasing anthropogenic methane emissions arise equally from agricultural and fossil fuel sources, Environ. Res. Lett., 15, 071002, https://doi.org/10.1088/1748-9326/ab9ed2, 2020.
Jeffrey, L. C., Maher, D. T., Johnston, S. G., Kelaher, B. P., Steven, A., and Tait, D. R.: Wetland methane emissions dominated by plant-mediated fluxes: Contrasting emissions pathways and seasons within a shallow freshwater subtropical wetland, Limnol. Oceanogr., 64, 1895–1912, https://doi.org/10.1002/lno.11158, 2019.
Keeling, C. D.: The concentration and isotopic abundances of atmospheric carbon dioxide in rural areas, Geochim. Cosmochim. Ac., 13, 322–334, https://doi.org/10.1016/0016-7037(58)90033-4, 1958.
Kirschke, S., Bousquet, P., Ciais, P., Saunois, M., Canadell, J. G., Dlugokencky, E. J., Bergamaschi, P., Bergmann, D., Blake, D. R., Bruhwiler, L., Cameron-Smith, P., Castaldi, S., Chevallier, F., Feng, L., Fraser, A., Heimann, M., Hodson, E. L., Houweling, S., Josse, B., Fraser, P. J., Krummel, P. B., Lamarque, J.-F., Langenfelds, R. L., Le Quéré, C., Naik, V., O'Doherty, S., Palmer, P. I., Pison, I., Plummer, D., Poulter, B., Prinn, R. G., Rigby, M., Ringeval, B., Santini, M., Schmidt, M., Shindell, D. T., Simpson, I. J., Spahni, R., Steele, L. P., Strode, S. A., Sudo, K., Szopa, S., van der Werf, G. R., Voulgarakis, A., van Weele, M., Weiss, R. F., Williams, J. E., and Zeng, G.: Three decades of global methane sources and sinks, Nat. Geosci., 6, 813–823, https://doi.org/10.1038/ngeo1955, 2013.
Lauvaux, T., Giron, C., Mazzolini, M., D'Aspremont, A., Duren, R., Cusworth, D., Shindell, D., and Ciais, P.: Global assessment of oil and gas methane ultra-emitters, Science, 375, 557–561, https://doi.org/10.1126/science.abj4351, 2022.
Li, J., Chen, H., Ding, A., Chi, X., Ju, W., Zhang, Y., Ciais, P., Yuan, W., Peng, S., Ma, Z., Yu, G., and Chen, J. M.: Temporal variations of δ13C–CH4 in rice paddies dominated by the plant-mediated pathway, iScience, 28, 112886, https://doi.org/10.1016/j.isci.2025.112886, 2025.
Lu, X., Harris, S. J., Fisher, R. E., France, J. L., Nisbet, E. G., Lowry, D., Röckmann, T., van der Veen, C., Menoud, M., Schwietzke, S., and Kelly, B. F. J.: Isotopic signatures of major methane sources in the coal seam gas fields and adjacent agricultural districts, Queensland, Australia, Atmos. Chem. Phys., 21, 10527–10555, https://doi.org/10.5194/acp-21-10527-2021, 2021.
Ma, S., Jiang, J., Huang, Y., Shi, Z., Wilson, R. M., Ricciuto, D., Sebestyen, S. D., Hanson, P. J., and Luo, Y.: Data-Constrained Projections of Methane Fluxes in a Northern Minnesota Peatland in Response to Elevated CO2 and Warming, J. Geophys. Res.-Biogeo., 122, 2841–2861, https://doi.org/10.1002/2017JG003932, 2017.
Masson-Delmotte, V., Zhai, P., Pirani, A., Connors, S. L., Péan, C., Berger, S., Caud, N., Chen, Y., Goldfarb, L., and Gomis, M. I.: Climate change 2021: the physical science basis, Contrib. Work. Gr. I to sixth Assess. Rep. Intergov. panel Clim. Chang., 2, https://doi.org/10.1017/9781009157896, 2021.
Menoud, M., van der Veen, C., Lowry, D., Fernandez, J. M., Bakkaloglu, S., France, J. L., Fisher, R. E., Maazallahi, H., Stanisavljević, M., Nęcki, J., Vinkovic, K., Łakomiec, P., Rinne, J., Korbeń, P., Schmidt, M., Defratyka, S., Yver-Kwok, C., Andersen, T., Chen, H., and Röckmann, T.: New contributions of measurements in Europe to the global inventory of the stable isotopic composition of methane, Earth Syst. Sci. Data, 14, 4365–4386, https://doi.org/10.5194/essd-14-4365-2022, 2022.
Metya, A., Datye, A., Chakraborty, S., Tiwari, Y. K., Patra, P. K., and Murkute, C.: Methane sources from waste and natural gas sectors detected in Pune, India, by concentration and isotopic analysis, Sci. Total Environ., 842, 156721, https://doi.org/10.1016/j.scitotenv.2022.156721, 2022.
Michel, S. E., Lan, X., Miller, J., Tans, P., Clark, J. R., Schaefer, H., Sperlich, P., Brailsford, G., Morimoto, S., Moossen, H., and Li, J.: Rapid shift in methane carbon isotopes suggests microbial emissions drove record high atmospheric methane growth in 2020–2022, P. Natl. Acad. Sci. USA, 121, 2017, https://doi.org/10.1073/pnas.2411212121, 2024.
Miller, J. B. and Tans, P. P.: Calculating isotopic fractionation from atmospheric measurements at various scales, Tellus B, 55, 207, https://doi.org/10.3402/tellusb.v55i2.16697, 2003.
Naik, V., Szopa, S., Adhikary, B., Artaxo, P., Berntsen, T., Collins, W. D., Fuzzi, S., Gallardo, L., Kiendler-Scharr, A., and Klimont, Z.: Short-lived Climate Forcers, in: Climate Change 2021 – The Physical Science Basis, Cambridge University Press, 817–922, https://doi.org/10.1017/9781009157896.008, 2023.
Nan, Y., Tian, F., Hu, H., Wang, L., and Zhao, S.: Stable Isotope Composition of River Waters across the World, Water, 11, 1760, https://doi.org/10.3390/w11091760, 2019.
Van Der Nat, F.-J. W. A. and Middelburg, J. J.: Effects of two common macrophytes on methane dynamics in freshwater sediments, Biogeochemistry, 43, 79–104, https://doi.org/10.1023/A:1006076527187, 1998.
Nisbet, E. G. and Manning, M. R.: What is causing the methane surge?, Science, 391, 556–557, https://doi.org/10.1126/science.aee6226, 2026.
Nisbet, E. G., Fisher, R. E., Lowry, D., France, J. L., Allen, G., Bakkaloglu, S., Broderick, T. J., Cain, M., Coleman, M., Fernandez, J., Forster, G., Griffiths, P. T., Iverach, C. P., Kelly, B. F. J., Manning, M. R., Nisbet-Jones, P. B. R., Pyle, J. A., Townsend-Small, A., Al-Shalaan, A., Warwick, N., and Zazzeri, G.: Methane Mitigation: Methods to Reduce Emissions, on the Path to the Paris Agreement, Rev. Geophys., 58, 1–51, https://doi.org/10.1029/2019RG000675, 2020.
Nisbet, E. G., Allen, G., Fisher, R. E., France, J. L., Lee, J. D., Lowry, D., Andrade, M. F., Bannan, T. J., Barker, P., Bateson, P., Bauguitte, S. J. B., Bower, K. N., Broderick, T. J., Chibesakunda, F., Cain, M., Cozens, A. E., Daly, M. C., Ganesan, A. L., Jones, A. E., Lambakasa, M., Lunt, M. F., Mehra, A., Moreno, I., Pasternak, D., Palmer, P. I., Percival, C. J., Pitt, J. R., Riddle, A. J., Rigby, M., Shaw, J. T., Stell, A. C., Vaughan, A. R., Warwick, N. J., E. Wilde, S., Team, M., Nisbet, E. G., Allen, G., Fisher, R. E., France, J. L., Lee, J. D., Lowry, D., Andrade, M. F., Bannan, T. J., and Barker, P.: Isotopic signatures of methane emissions from tropical fires, agriculture and wetlands: the MOYA and ZWAMPS flights, Philos. T. R. Soc. A, 380, 20210112, https://doi.org/10.1098/rsta.2021.0112, 2022.
Nisbet, E. G., Manning, M. R., Dlugokencky, E. J., Michel, S. E., Lan, X., Röckmann, T., Denier van der Gon, H. A. C., Schmitt, J., Palmer, P. I., Dyonisius, M. N., Oh, Y., Fisher, R. E., Lowry, D., France, J. L., White, J. W. C., Brailsford, G., and Bromley, T.: Atmospheric Methane: Comparison Between Methane's Record in 2006–2022 and During Glacial Terminations, Global Biogeochem. Cy., 37, https://doi.org/10.1029/2023GB007875, 2023.
Nisbet, E. G., Manning, M. R., Lowry, D., Fisher, R. E., Lan, X. (Lindsay), Michel, S. E., France, J. L., Nisbet, R. E. R., Bakkaloglu, S., Leitner, S. M., Brooke, C., Röckmann, T., Allen, G., Denier van der Gon, H. A. C., Merbold, L., Scheutz, C., Woolley Maisch, C., Nisbet-Jones, P. B. R., Alshalan, A., Fernandez, J. M., and Dlugokencky, E. J.: Practical paths towards quantifying and mitigating agricultural methane emissions, Proc. R. Soc. A Math. Phys. Eng. Sci., 481, https://doi.org/10.1098/rspa.2024.0390, 2025.
Pataki, D. E., Ehleringer, J. R., Flanagan, L. B., Yakir, D., Bowling, D. R., Still, C. J., Buchmann, N., Kaplan, J. O., and Berry, J. A.: The application and interpretation of Keeling plots in terrestrial carbon cycle research, Global Biogeochem. Cy., 17, https://doi.org/10.1029/2001GB001850, 2003.
Patra, P. K., Canadell, J. G., Houghton, R. A., Piao, S. L., Oh, N.-H., Ciais, P., Manjunath, K. R., Chhabra, A., Wang, T., Bhattacharya, T., Bousquet, P., Hartman, J., Ito, A., Mayorga, E., Niwa, Y., Raymond, P. A., Sarma, V. V. S. S., and Lasco, R.: The carbon budget of South Asia, Biogeosciences, 10, 513–527, https://doi.org/10.5194/bg-10-513-2013, 2013.
Peng, S., Lin, X., Thompson, R. L., Xi, Y., Liu, G., Hauglustaine, D., Lan, X., Poulter, B., Ramonet, M., Saunois, M., Yin, Y., Zhang, Z., Zheng, B., and Ciais, P.: Wetland emission and atmospheric sink changes explain methane growth in 2020, Nature, 612, 477–482, https://doi.org/10.1038/s41586-022-05447-w, 2022.
Polag, D., May, T., Müller, L., König, H., Jacobi, F., Laukenmann, S., and Keppler, F.: Online monitoring of stable carbon isotopes of methane in anaerobic digestion as a new tool for early warning of process instability, Bioresource Technol., 197, 161–170, https://doi.org/10.1016/j.biortech.2015.08.058, 2015.
Rao, D. K., Bhattacharya, S. K., and Jani, R. A.: Seasonal variations of carbon isotopic composition of methane from Indian paddy fields, Global Biogeochem. Cy., 22, 1–5, https://doi.org/10.1029/2006GB002917, 2008.
Rice, A. L., Gotoh, A. A., Ajie, H. O., and Tyler, S. C.: High-Precision Continuous-Flow Measurement of δ13C and δD of Atmospheric CH4, Anal. Chem., 73, 4104–4110, https://doi.org/10.1021/ac0155106, 2001.
Rice, A. L., Butenhoff, C. L., Teama, D. G., Röger, F. H., Khalil, M. A. K., and Rasmussen, R. A.: Atmospheric methane isotopic record favors fossil sources flat in 1980 s and 1990 s with recent increase, P. Natl. Acad. Sci. USA, 113, 10791–10796, https://doi.org/10.1073/pnas.1522923113, 2016.
Riddell-Young, B., Michel, S. E., Lan, X., Tans, P., Röckmann, T., Dasgupta, B., Oh, Y., Bruhwiler, L. M. P., Fujita, R., Umezawa, T., Morimoto, S., and Miller, J. B.: Microbial driver of 2006–2023 CH4 growth indicated by trends in atmospheric δD–CH4 and δ13C–CH4, P. Natl. Acad. Sci. USA, 122, 1–10, https://doi.org/10.1073/pnas.2516543122, 2025.
Röckmann, T., Gómez Álvarez, C. X., Walter, S., van der Veen, C., Wollny, A. G., Gunthe, S. S., Helas, G., Pöschl, U., Keppler, F., Greule, M., and Brand, W. A.: Isotopic composition of H2 from wood burning: Dependency on combustion efficiency, moisture content, and δD of local precipitation, J. Geophys. Res.-Atmos., 115, 1–11, https://doi.org/10.1029/2009JD013188, 2010.
Rogelj, J., den Elzen, M., Höhne, N., Fransen, T., Fekete, H., Winkler, H., Schaeffer, R., Sha, F., Riahi, K., and Meinshausen, M.: Paris Agreement climate proposals need a boost to keep warming well below 2 °C, Nature, 534, 631–639, https://doi.org/10.1038/nature18307, 2016.
Rosentreter, J. A., Borges, A. V., Deemer, B. R., Holgerson, M. A., Liu, S., Song, C., Melack, J., Raymond, P. A., Duarte, C. M., Allen, G. H., Olefeldt, D., Poulter, B., Battin, T. I., and Eyre, B. D.: Half of global methane emissions come from highly variable aquatic ecosystem sources, Nat. Geosci., 14, 225–230, https://doi.org/10.1038/s41561-021-00715-2, 2021.
Saunois, M., Martinez, A., Poulter, B., Zhang, Z., Raymond, P. A., Regnier, P., Canadell, J. G., Jackson, R. B., Patra, P. K., Bousquet, P., Ciais, P., Dlugokencky, E. J., Lan, X., Allen, G. H., Bastviken, D., Beerling, D. J., Belikov, D. A., Blake, D. R., Castaldi, S., Crippa, M., Deemer, B. R., Dennison, F., Etiope, G., Gedney, N., Höglund-Isaksson, L., Holgerson, M. A., Hopcroft, P. O., Hugelius, G., Ito, A., Jain, A. K., Janardanan, R., Johnson, M. S., Kleinen, T., Krummel, P. B., Lauerwald, R., Li, T., Liu, X., McDonald, K. C., Melton, J. R., Mühle, J., Müller, J., Murguia-Flores, F., Niwa, Y., Noce, S., Pan, S., Parker, R. J., Peng, C., Ramonet, M., Riley, W. J., Rocher-Ros, G., Rosentreter, J. A., Sasakawa, M., Segers, A., Smith, S. J., Stanley, E. H., Thanwerdas, J., Tian, H., Tsuruta, A., Tubiello, F. N., Weber, T. S., van der Werf, G. R., Worthy, D. E. J., Xi, Y., Yoshida, Y., Zhang, W., Zheng, B., Zhu, Q., Zhu, Q., and Zhuang, Q.: Global Methane Budget 2000–2020, Earth Syst. Sci. Data, 17, 1873–1958, https://doi.org/10.5194/essd-17-1873-2025, 2025.
Schaefer, H. and Whiticar, M. J.: Potential glacial–interglacial changes in stable carbon isotope ratios of methane sources and sink fractionation, Global Biogeochem. Cy., 22, 1–18, https://doi.org/10.1029/2006GB002889, 2008.
Schaefer, H., Fletcher, S. E. M., Veidt, C., Lassey, K. R., Brailsford, G. W., Bromley, T. M., Dlugokencky, E. J., Michel, S. E., Miller, J. B., Levin, I., Lowe, D. C., Martin, R. J., Vaughn, B. H., and White, J. W. C.: A 21st-century shift from fossil-fuel to biogenic methane emissions indicated by 13CH4, Science, 352, 80–84, https://doi.org/10.1126/science.aad2705, 2016.
Schaeffer, R., Schipper, E. L. F., Ospina, D., Mirazo, P., Alencar, A., Anvari, M., Artaxo, P., Biresselioglu, M. E., Blome, T., Boeckmann, M., Brink, E., Broadgate, W., Bustamante, M., Cai, W., Canadell, J. G., Cardinale, R., Chidichimo, M. P., Ditlevsen, P., Eicker, U., Feron, S., Fikru, M. G., Fuss, S., Gaye, A. T., Gustafsson, Ö., Harring, N., He, C., Hebden, S., Heilemann, A., Hirota, M., Janardhanan, N., Juhola, S., Jung, T. Y., Kejun, J., Kilki, Ş., Kumarasinghe, N., Lapola, D., Lee, J.-Y., Levis, C., Lusambili, A., Maasakkers, J. D., MacIntosh, C., Mahmood, J., Mankin, J. S., Marchegiani, P., Martin, M., Mukherji, A., Muñoz-Erickson, T. A., Niazi, Z., Nyangon, J., Pandipati, S., Perera, A. T. D., Persad, G., Persson, Å., Redman, A., Riipinen, I., Rockström, J., Roffe, S., Roy, J., Sakschewski, B., Samset, B. H., Schlosser, P., Sharifi, A., Shih, W.-Y., Sioen, G. B., Sokona, Y., Stammer, D., Suk, S., Thiam, D., Thompson, V., Tullos, E., van Westen, R. M., Vargas Falla, A. M., Vecellio, D. J., Worden, J., Wu, H. C., Xu, C., Yang, Y., Zachariah, M., Zhang, Z., and Ziervogel, G.: Ten new insights in climate science 2024, One Earth, 101285, https://doi.org/10.1016/j.oneear.2025.101285, 2025.
Schmitt, J., Seth, B., Bock, M., van der Veen, C., Möller, L., Sapart, C. J., Prokopiou, M., Sowers, T., Röckmann, T., and Fischer, H.: On the interference of Kr during carbon isotope analysis of methane using continuous-flow combustion–isotope ratio mass spectrometry, Atmos. Meas. Tech., 6, 1425–1445, https://doi.org/10.5194/amt-6-1425-2013, 2013.
Schütz, H., Seiler, W., and Conrad, R.: Processes involved in formation and emission of methane in rice paddies, Biogeochemistry, 7, 33–53, https://doi.org/10.1007/BF00000896, 1989.
Schwietzke, S., Sherwood, O. A., Bruhwiler, L. M. P., Miller, J. B., Etiope, G., Dlugokencky, E. J., Michel, S. E., Arling, V. A., Vaughn, B. H., White, J. W. C., and Tans, P. P.: Upward revision of global fossil fuel methane emissions based on isotope database, Nature, 538, 88–91, https://doi.org/10.1038/nature19797, 2016.
Shen, L., Jacob, D. J., Gautam, R., Omara, M., Scarpelli, T. R., Lorente, A., Zavala-Araiza, D., Lu, X., Chen, Z., and Lin, J.: National quantifications of methane emissions from fuel exploitation using high resolution inversions of satellite observations, Nat. Commun., 14, 4948, https://doi.org/10.1038/s41467-023-40671-6, 2023.
Sherwood, O. A., Schwietzke, S., Arling, V. A., and Etiope, G.: Global Inventory of Gas Geochemistry Data from Fossil Fuel, Microbial and Burning Sources, version 2017, Earth Syst. Sci. Data, 9, 639–656, https://doi.org/10.5194/essd-9-639-2017, 2017.
Singh, A., Kuttippurath, J., Abbhishek, K., Mallick, N., Raj, S., Chander, G., and Dixit, S.: Biogenic link to the recent increase in atmospheric methane over India, J. Environ. Manage., 289, 112526, https://doi.org/10.1016/j.jenvman.2021.112526, 2021.
Smartt, A. D., Brye, K. R., and Norman, R. J.: Methane Emissions from Rice Production in the United States – A Review of Controlling Factors and Summary of Research, in: Greenhouse Gases, InTech, https://doi.org/10.5772/62025, 2016.
Stavert, A. R., Saunois, M., Canadell, J. G., Poulter, B., Jackson, R. B., Regnier, P., Lauerwald, R., Raymond, P. A., Allen, G. H., Patra, P. K., Bergamaschi, P., Bousquet, P., Chandra, N., Ciais, P., Gustafson, A., Ishizawa, M., Ito, A., Kleinen, T., Maksyutov, S., McNorton, J., Melton, J. R., Müller, J., Niwa, Y., Peng, S., Riley, W. J., Segers, A., Tian, H., Tsuruta, A., Yin, Y., Zhang, Z., Zheng, B., and Zhuang, Q.: Regional trends and drivers of the global methane budget, Glob. Change Biol., 28, 182–200, https://doi.org/10.1111/gcb.15901, 2022.
Still, C. J., Berry, J. A., Collatz, G. J., and DeFries, R. S.: Global distribution of C3 and C4 vegetation: Carbon cycle implications, Global Biogeochem. Cy., 17, https://doi.org/10.1029/2001GB001807, 2003.
Tapin, E., Berchet, A., Martinez, A., Menoud, M., Thanwerdas, J., Lan, X., Malina, E., Gasbarra, D., and Saunois, M.: A global dataset of δ13C–CH4 source signatures and associated uncertainties (1998–2022), with a sensitivity analysis to support isotopic inversions, Earth Syst. Sci. Data Discuss. [preprint], https://doi.org/10.5194/essd-2025-668, in review, 2026.
Thanwerdas, J., Saunois, M., Berchet, A., Pison, I., and Bousquet, P.: Investigation of the renewed methane growth post-2007 with high-resolution 3-D variational inverse modeling and isotopic constraints, Atmos. Chem. Phys., 24, 2129–2167, https://doi.org/10.5194/acp-24-2129-2024, 2024.
Tiwari, Y. K., Guha, T., Valsala, V., Lopez, A. S., Cuevas, C., Fernandez, R. P., and Mahajan, A. S.: Understanding atmospheric methane sub-seasonal variability over India, Atmos. Environ., 223, 117206, https://doi.org/10.1016/j.atmosenv.2019.117206, 2020.
Tyler, S. C., Zimmerman, P. R., Cumberbatch, C., Greenberg, J. P., Westberg, C., and Darlington, J. P. E. C.: Measurements and interpretation of δ13C of methane from termites, rice paddies, and wetlands in Kenya, Global Biogeochem. Cy., 2, 341–355, https://doi.org/10.1029/GB002i004p00341, 1988.
Vernooij, R., Dusek, U., Popa, M. E., Yao, P., Shaikat, A., Qiu, C., Winiger, P., van der Veen, C., Eames, T. C., Ribeiro, N., and van der Werf, G. R.: Stable carbon isotopic composition of biomass burning emissions – implications for estimating the contribution of C3 and C4 plants, Atmos. Chem. Phys., 22, 2871–2890, https://doi.org/10.5194/acp-22-2871-2022, 2022.
Villa, J. A., Ju, Y., Stephen, T., Rey-Sanchez, C., Wrighton, K. C., and Bohrer, G.: Plant-mediated methane transport in emergent and floating-leaved species of a temperate freshwater mineral-soil wetland, Limnol. Oceanogr., 65, 1635–1650, https://doi.org/10.1002/lno.11467, 2020.
Whiticar, M. and Schaefer, H.: Constraining past global tropospheric methane budgets with carbon and hydrogen isotope ratios in ice, Philos. T. R. Soc. A, 365, 1793–1828, https://doi.org/10.1098/rsta.2007.2048, 2007.
Whiticar, M. ., Faber, E., and Schoell, M.: Biogenic methane formation in marine and freshwater environments: CO2 reduction vs. acetate fermentation – Isotope evidence, Geochim. Cosmochim. Ac., 50, 693–709, https://doi.org/10.1016/0016-7037(86)90346-7, 1986.
Whiticar, M. J.: Carbon and hydrogen isotope systematics of bacterial formation and oxidation of methane, Chem. Geol., 161, 291–314, https://doi.org/10.1016/S0009-2541(99)00092-3, 1999.
Woolley Maisch, C. A., Fisher, R. E., France, J. L., Lowry, D., Lanoisellé, M., Röckmann, T., van der Veen, C., and Nisbet, E. G.: Characterising methane emissions from dairy farm sources using mobile and dual-isotope measurements in Jersey, Channel Islands, Atmos. Environ. X, 28, 100384, https://doi.org/10.1016/j.aeaoa.2025.100384, 2025.
Yao, P., Huang, R.-J., Ni, H., Kairys, N., Yang, L., Meijer, H. A. J., and Dusek, U.: 13C signatures of aerosol organic and elemental carbon from major combustion sources in China compared to worldwide estimates, Sci. Total Environ., 810, 151284, https://doi.org/10.1016/j.scitotenv.2021.151284, 2022.
Yao, P., Belec, K., Holmstrand, H., Balacky, J., Salam, A., Budhavant, K., Manoj, M. R., Joy, K. S., Hossain, Md. A., Singh, A., Patel, A., Rastogi, N., Mallik, C., Ram, K., Singh, G. K., and Gustafsson, Ö.: Isotopic values of major methane sources in South Asia and worldwide, Dataset version 1, Bolin Centre Database [data set], https://doi.org/10.17043/yao-2026-methane-sources-1, 2026.
Zakharov, V. I., Imasu, R., Gribanov, K. G., Hoffmann, G., and Jouzel, J.: Latitudinal distribution of the deuterium to hydrogen ratio in the atmospheric water vapor retrieved from IMG/ADEOS data, Geophys. Res. Lett., 31, 2–5, https://doi.org/10.1029/2004GL019433, 2004.
Zavala-Araiza, D., Lyon, D. R., Alvarez, R. A., Davis, K. J., Harriss, R., Herndon, S. C., Karion, A., Kort, E. A., Lamb, B. K., Lan, X., Marchese, A. J., Pacala, S. W., Robinson, A. L., Shepson, P. B., Sweeney, C., Talbot, R., Townsend-Small, A., Yacovitch, T. I., Zimmerle, D. J., and Hamburg, S. P.: Reconciling divergent estimates of oil and gas methane emissions, P. Natl. Acad. Sci. USA, 112, 15597–15602, https://doi.org/10.1073/pnas.1522126112, 2015.
Zhang, Z., Poulter, B., Knox, S., Stavert, A., McNicol, G., Fluet-Chouinard, E., Feinberg, A., Zhao, Y., Bousquet, P., Canadell, J. G., Ganesan, A., Hugelius, G., Hurtt, G., Jackson, R. B., Patra, P. K., Saunois, M., Höglund-Isaksson, L., Huang, C., Chatterjee, A., and Li, X.: Anthropogenic emission is the main contributor to the rise of atmospheric methane during 1993–2017, Natl. Sci. Rev., 9, https://doi.org/10.1093/nsr/nwab200, 2022.
Zhao, J., Ciais, P., Chevallier, F., Canadell, J. G., van der Velde, I. R., Chuvieco, E., Chen, Y., Zhang, Q., He, K., and Zheng, B.: Enhanced CH4 emissions from global wildfires likely due to undetected small fires, Nat. Commun., 16, 804, https://doi.org/10.1038/s41467-025-56218-w, 2025.