
the Creative Commons Attribution 4.0 License.
the Creative Commons Attribution 4.0 License.
 | 29 May 2026
Atmospheric forcing of dust source activation across East Asia
Kerstin Schepanski
Kai Zhang
Anya J. Crocker
Chuang Xuan
Paul A. Wilson
East Asian dust storms impact the health and livelihoods of millions but the atmospheric processes responsible are far from fully understood because suitable observations are lacking. Here we analyse dust source activation (DSA) frequency data for East Asia (80–130° E, 27–52° N, January 2016 through December 2023, Chen et al., 2025, https://doi.org/10.1088/1748-9326/addee6) to understand atmospheric controls on dust activation. We show that East Asia's two primary dust source regions (Chen et al., 2025) display distinct diurnal and seasonal variations in DSA frequency. A southern region, sandwiched between the Mongolian Plateau and the Tibetan Plateau, chiefly consisting of the Taklimakan Desert and the Alashan Plateau, is active year-round, with 40 %–60 % of events predominantly occurring during late morning (09:00–12:00 local solar time, LST) under clear-sky conditions. We show that breakdown of the Low-level Jet (LLJ) is a major control on dust activation across this region (not only the Taklimakan Desert), driven by morning heating of the land surface, deepening the convective boundary layer and momentum transfer to the land surface. Here, convective activities also contribute to cloud-associated dust source activations during summer afternoon (i.e., haboobs). A northern region, centred on the Mongolian Plateau-Gobi Desert is dust-active from morning to afternoon (08:00–19:00 LST), primarily under cloudy conditions, driven by the passage of low-pressure systems. A third (less active) dust source region, the Tibetan Plateau, is typically active during winter afternoons presumably in response to strong mountain-valley winds. Meso- and local-scale winds are more extensive drivers of dust activation across East Asia than previously documented, adding uncertainty to model predictions of future dust emissions in East Asia under a warming climate.
- Article
(14259 KB) - Full-text XML
-
Supplement
(29556 KB) - BibTeX
- EndNote


Mineral dust is a crucial component of the Earth system, influencing climate directly through its interactions with radiation budgets and cloud physics in the atmosphere (Kohfeld and Harrison, 2001), and indirectly through its impact on biogeochemical cycles, for example, by fertilizing terrestrial and marine ecosystems (Jickells et al., 2005; Swap et al., 1992). Estimates of the global atmospheric dust load from satellite measurements and atmospheric circulation models reveal a band of high Aerosol Optical Depth (AOD) and Aerosol Index (AI) (Ginoux et al., 2004; Prospero et al., 2002; Herman et al., 1997), extending from North Africa across the Arabian Peninsula and Central Asia, deep into East Asia. The overall correspondence between this atmospheric dust belt and the deserts and drylands of the northern hemisphere (Fig. 1a) gives an indication of the origin of the mineral dust load circulating in Earth's atmosphere. However, spaceborne and ground-based observation of low temporal and spatial resolution (e.g., MODIS satellite data and meteorological stations) conflate dust emissions with dust transport in the atmosphere and are therefore ill-suited to accurately identifying dust sources and quantifying their activation frequencies, limiting our understanding of the meteorological forcing mechanisms that drive dust emissions over local/regional scales. High frequency repeat observations from geostationary satellites can be used to overcome these limitations. Schepanski et al. (2009) used Meteosat Second Generation (MSG) Spinning Enhanced Visible and Infrared Imager (SEVIRI) data to pinpoint dust emissions in North Africa at three-hourly resolution, revealing the importance of several different atmospheric processes driving dust emissions. Subsequent studies have applied the same method to investigate dust emissions and their meteorological forcing functions on the Arabian Peninsula (Hennen et al., 2019) and across the Horn of Africa (Kunkelova et al., 2024; also see this study for a composite of African and Westernmost Asia datasets).
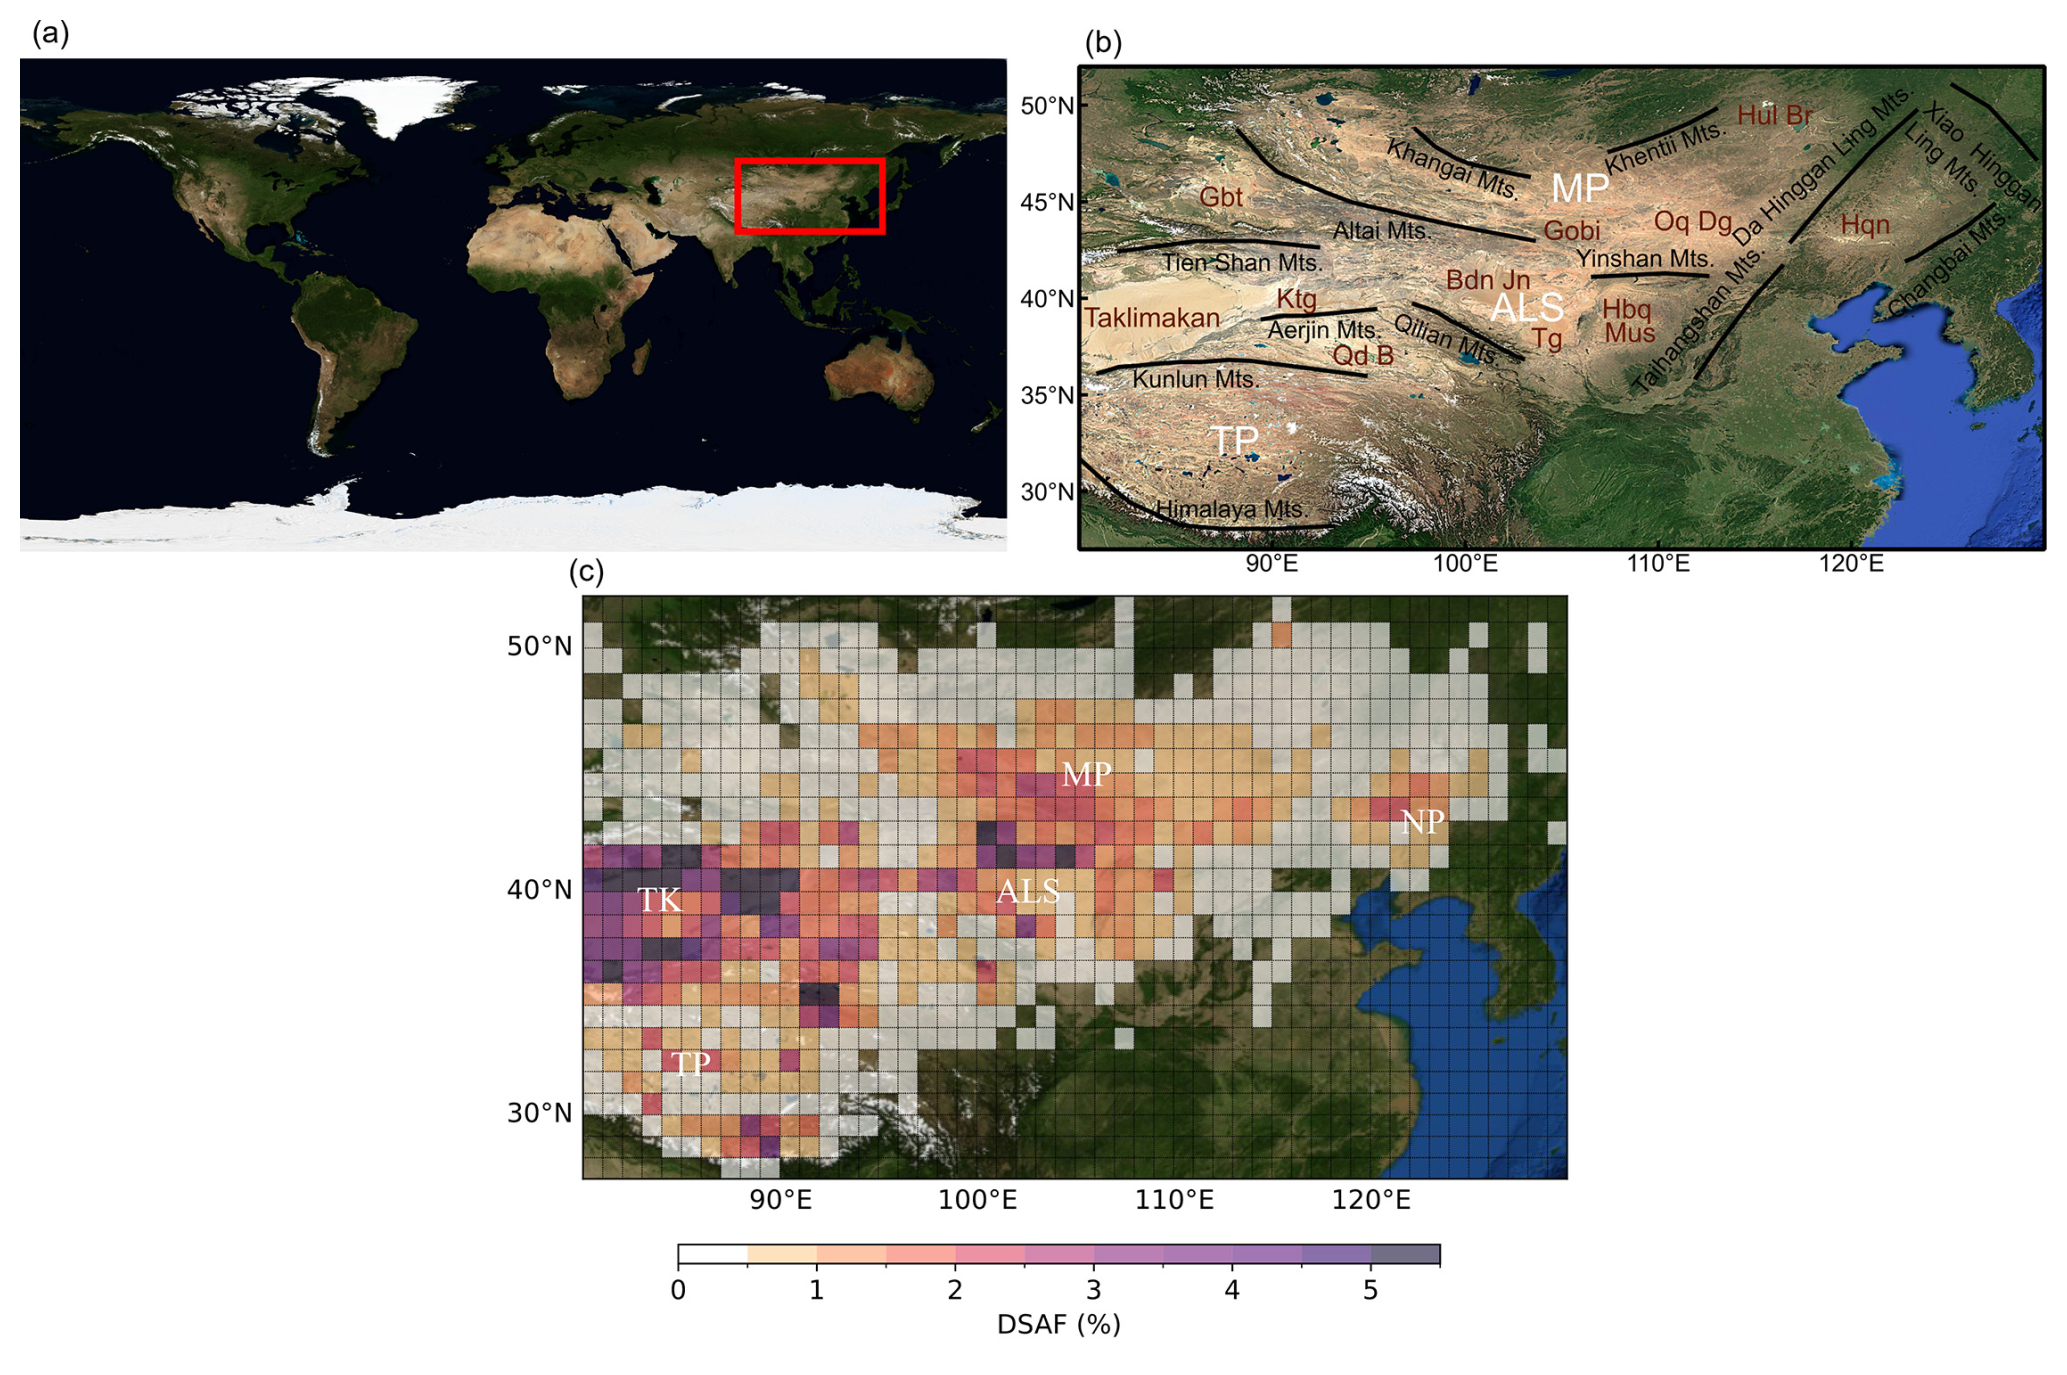
Figure 1(a) Global map showing the Northern Hemisphere “dust-production belt”, derived from NASA's Blue Marble dataset (Stöckli et al., 2005). The study region in East Asia (80–130° E and 27–52° N) is highlighted with a red box. (b) Topographical features of East Asia, showing mountain ranges (Mts.) with black lines and deserts in brown. Key geographical regions including the Mongolian Plateau (MP), the Alashan Plateau (ALS), and the Tibetan Plateau (TP) are labelled in white. Base map from Google Satellite (© Google). (c) Dust source activation frequency (DSAF) map for East Asia (Chen et al., 2025). Key dust producing regions include the Mongolian Plateau (MP), the Taklimakan Desert (TK), the Alashan Plateau (ALS), the Northeast Plain (NP) and the Tibetan Plateau (TP). Basemap from NASA Blue Marble.
East Asia is estimated to contribute approximately 20 % of the global annual atmospheric dust load (Kok et al., 2021). In a recent contribution, we presented a detailed analysis of dust source activation frequency (DSAF) for East Asia using infrared data with a repeat time of 10 min from the geostationary Himawari-8/9 satellites (Chen et al., 2025). In that contribution we focused on latitudinal and seasonal patterns in our data and studied land-surface controls on DSAF. Here, we focus on the timing of dust mobilization, which we quantify at hourly resolution, and compare dust activation events to meteorological data sets to evaluate the underlying atmospheric mechanistic controls.
Dust source activation is triggered by wind speeds that exceed the local threshold velocity for deflation with many different meteorological processes capable of acting as the underlying driving mechanism (Marticorena and Bergametti, 1995). In this section, we briefly review the mechanisms commonly invoked to explain dust mobilization in East Asia: turbulent mixing and increased wind speed driven by the passage of Mongolian extratropical cyclones, the nocturnal Low-level Jet (LLJ), deep convection, and mountain-valley winds.
2.1 Synoptic-scale Wind Systems
Numerous studies based on data from meteorological stations, satellite products and dust models have identified Mongolian cyclones and their associated cold fronts as the primary drivers of springtime dust storms in East Asia, particularly in the Gobi Desert (Qian et al., 2002; Sun and Zhao, 2008; Li et al., 2022; Zhao et al., 2006; Takemi and Seino, 2005; Fig. 1b). During spring, the temperature contrast between the high-latitudes (e.g., Siberia) and mid-latitudes of East Asia intensifies baroclinicity, fosters atmospheric instability and favours cyclogenesis (Zhang et al., 2012). Cyclogenesis is also favoured on the leeward side (i.e., lee genesis) of the mountains on the Mongolian Plateau (e.g., the Altai and the Khangai Mountains, Fig. 1b). Intense temperature gradients across passing cold fronts, strong vertical wind shear, and cold, dense air pushing under a warmer air mass to the south combine to drive dust emission (Roe, 2009; Takemi and Seino, 2005).
Cyclones and their associated cold fronts are also suggested to influence dust activation in the Taklimakan Desert (Saeedi and Khoshakhlagh, 2018; Mu et al., 2023; Fig. 1b) but here, topographic steering of synoptic air flows is suggested to spawn dust-triggering mesoscale winds (Aoki et al., 2005). Topographic steering results from the mountain ranges that semi-enclose the desert on its northern, western, and southern flanks (the Tianshan, Karakoram and Kunlun Mountain ranges respectively) but not its eastern flank which lies open to the wide Tarim Basin through a narrow gateway (Fig. 1b). This topographic configuration triggers mesoscale cold wind events in three distinct wind directions that lead to dust emissions: easterly, northerly, and westerly (Aoki et al., 2005).
Two types of synoptic-scale low-pressure system are suggested to trigger dust events over the northern Tibetan Plateau (Feng et al., 2023): (i) those that develop in the northeastern region of the plateau lead to south-easterly winds that sweep across the northeast Tibetan Plateau and (ii) those that develop over the western plateau drive south-westerly winds along the Qaidam Basin (Fig. 1b).
2.2 The Low-level Jet
The LLJ is characterized by a narrow layer of strong winds, with a core typically located 300–600 m above ground and a wind speed minimum 1–2 km above (Rife et al., 2010). The LLJ exhibits a distinct diurnal cycle, forming in the early evening and weakening after sunrise, with maximum wind speed around midnight to early morning. The diurnal variability of the LLJ is driven by the differential heating and cooling around mountain barriers, together with the decoupling/recoupling of winds from surface friction (Kraus et al., 1985). After sunrise, turbulent mixing transfers the jet's momentum downward, strengthening surface winds and triggering dust emission and uplift (Schepanski et al., 2009; Heinold et al., 2013).
Recent studies using satellite data (Ge et al., 2016), model simulations (Han et al., 2022) and field observations (Su et al., 2024) suggest that the nocturnal LLJ contributes to dust emissions under clear-sky conditions in the Taklimakan Desert. In the Tarim Basin, cooling of the desert surface at night leads to the formation of a stable boundary layer (inversion) and development of the LLJ. When the inversion breaks up after sunrise in response to rapid heating of the desert surface, strong surface gusts and dust emissions are triggered. Yet there is no general agreement on the seasonality and relative contributions of LLJ-induced dust emissions compared to cyclone-induced dust emissions. One study suggests that the LLJ is most important during the warm season when synoptic activities are less prevalent (Ge et al., 2016). However, cold front intrusions during cold season have also been suggested to favour nocturnal LLJ-formation and dust emissions in the Taklimakan Desert (Mu et al., 2023). LLJ-induced dust emissions are not widely reported outside the Taklimakan Desert, but some studies suggest that mid-level southeastward descent of high-momentum air impinging on the northern slope of the Tibetan Plateau (e.g., Qilian Mountains, Fig. 1b) leads to the formation of low-level barrier jets and associated dust storms (Chen et al., 2021).
2.3 Convective Activity
Dust activities associated with moist convection are well documented in the Sahara, North America, and the Middle East (Schepanski et al., 2009; Heinold et al., 2013); such events are commonly referred to as haboobs. Haboobs arise when downdrafts and cold pools generated by moist convective cells propagate as gust fronts, mobilising dust over exposed surfaces. These dust fronts typically originate beneath or at the leading edge of convective clouds and often exhibit arc-shaped structures during propagation. In East Asia, particularly over the Taklimakan Desert and the Alashan Plateau, “black dust storms” are also reported during summer afternoons (Gu et al., 2021). Both haboobs and black dust storms share a common dynamical feature: dust mobilisation by convectively generated outflow boundaries or gust fronts. Therefore, in this study we classify convectively generated black dust storms in East Asia as haboobs. In contrast, dust devils and dust haze are also reported in East Asia (Han et al., 2016), generally associated with dry convection and local turbulent mixing driven by surface heating during the afternoon. However, such small-scale dust events are not captured by Himawari-8/9 observations and are therefore excluded from our dataset.
2.4 Mountain-Valley Winds
The high, snow-capped mountain ranges on the Tibetan Plateau (Fig. 1b) with intervening open lake basins and wide valleys, generate strong temperature differences and pressure gradients, resulting in powerful afternoon winds blowing from peaks to basins (Zhu et al., 2024). These mountain-valley winds are particularly pronounced in winter due to reduced cloud cover and extensive snow cover, leading to strong daytime turbulence which can extend up to 3000 m above ground (Zhou et al., 2023). Furthermore, the east-west orientation of the mountain ranges on the Tibetan Plateau (Fig. 1b) induce the westerly mountain-valley winds to align with the planetary scale westerly jet (WJ) which tracks over the Tibetan Plateau in boreal winter (Schär et al., 2009). The resulting interaction between upper and lower troposphere circulation is suggested to strengthen the local westerlies and promote dust storm-triggering gusts and turbulence (Yao et al., 2018).
3.1 Himawari-8/9 Near-Time Images and Detection of Dust Activation Events
We used the DSAF data set for East Asia of Chen et al. (2025) and compared it to meteorological data sets to assess atmospheric forcing mechanisms. The detailed methodology used to develop the DSAF data set, together with limitations, are given in Chen et al. (2025). Briefly, over 420 000 RGB images from Himawari-8/9 with a temporal resolution of 10 min and a spatial resolution of 2 km × 2 km in the infrared spectrum were analysed to quantify dust source activation events across East Asia (80–130° E, 27–52° N) between January 2016 and December 2023. Dust plumes were identified by manual inspection of daily animations and traced back in time to their source seamlessly across day boundaries. The high temporal resolution of dust source activation (DSA) data makes it possible to estimate the starting time of emission for each dust event in hourly resolution (Shimizu, 2020) and distinguish locally activated dust at the site of interest from dust transported from other source regions. We categorized observed DSA events as originating under either clear-sky or cloud-associated conditions. Under clear-sky conditions, the dust plume is distinct within a grid cell (1° × 1°) whereas, under cloud-associated conditions, the grid cell point of origin is at least partially obscured by cloud cover. If the grid cell point of origin is entirely obscured by cloud cover but the point of origin of a developing dust plume is obvious from a consecutive sequence of satellite images, the dust plume is still recorded as cloud-obscured (Fig. S1 in the Supplement) but excluded from statistical analysis in this study. Under cyclonic conditions, band-structures of clouds (e.g., cold fronts) may extend beyond one grid cell. The associated wind fields can trigger the formation of dust plumes in regions experiencing the wind field but not covered by frontal clouds. Such cases are still classified as cloud-associated conditions based on visual assessment. Manual identification and calculations of DSAF follow the method of Schepanski et al. (2007):
Ns = total number of days with at least one dust event in 1° × 1° grid cell within a given interval, ND = number of days of available satellite observation within the same interval.
Our identification step used the full-resolution Himawari-8/9 data and our statistical summaries of them are reported to a 1° × 1° gridded representation to reduce human bias in spatial interpretation. Cross-comparison between our DSA dataset and aerosol optical depth (AOD) observations from the AErosol RObotic NETwork (AERONET) site at Dalanzadgad (43.58° N, 104.42° E) within the same grid demonstrates that our method accurately reproduces the timing of high-AOD events on diurnal timescales (Fig. S2), and our method captures dust source activation and eliminates bias by dust transport in the atmosphere. Note that AOD values vary among different DSA events (Fig. S2), thereby demonstrating that DSA indicates the timing and frequency but not mass flux of dust emissions.
3.2 Uncertainty of DSA identification
To assess uncertainty in the timing and location of DSA identification, we conducted an inter-operator consistency test using a subset (i.e., 4 months of data randomly distributed throughout the study interval) of our dust RGB imagery data set in which events were independently labelled by a second operator (Fig. S3). Overall, the primary operator identified 354 clear-sky and 690 cloud-associated DSA events (1044 events in total), compared with 411 clear-sky and 656 cloud-associated events (1067 events in total) identified by the second operator. The resulting maps are virtually indistinguishable when compared to one another (Fig. S3). Unmatched events mostly occur at the margins of dust-active regions, and many mismatches arise from differences in event classification (clear-sky versus cloud-associated) rather than from inconsistent event detection. Agreement between the two operators was quantified using the Critical Success Index (CSI) (Wilks, 2011), defined as
where I denotes the number of matched events, and C and K denote the total number of events identified independently by each labeller. CSI ranges from 0 (no agreement) to 1 (perfect agreement).
In core dust regions, where DSA occurs frequently, inter-operator consistency is higher and diurnal patterns are more coherent than along the margins of dust active regions where DSA occurs infrequently (Fig. S3). CSI is ∼ 0.3 under strict matching criteria (0 h, 0°) and increases rapidly to 0.5–0.6 with minor relaxation of temporal and spatial tolerances at ±1 h and ±1° (Fig. S4). Together with cross-comparison with our DSA dataset against independent AERONET observations, this analysis demonstrates that human subjectivity introduces no substantial bias into our DSA estimates.
3.3 ANOVA Analysis of Diurnal Variability in Dust Source Activation
To test whether diurnal variability represents a leading component of DSA temporal variability, we applied an analysis-of-variance (ANOVA) framework, following the approach used by Yu et al. (2021) to characterize diurnal variability in dust optical depth. This framework enables a quantitative comparison of variance contributions across seasonal and diurnal scales. The method is adapted here to accommodate the binary (presence–absence) nature of DSA datasets. Observed DSA events are coded as presence (1), whereas hours without observed events are treated as absence (0). DSA probability is then defined at each grid cell for each season and 3 h bin as the fraction of DSA hours relative to the total number of sampled hours. An ANOVA-based variance decomposition is applied independently at each grid cell to quantify the relative contributions of seasonal variability, diurnal timing, and their interaction to the total variance in dust-activation probability. The total sum of squares is defined as
where Ps,h denotes the probability in season s and hour bin h, and is the overall mean probability across all seasons and hours. Seasonal, diurnal and interaction (residual) components are computed as
where and are the seasonal and diurnal mean probabilities, respectively, and nh and ns denote the number of hour bins and seasons.
Finally, fractional contributions are defined as
This decomposition provides a spatially explicit diagnosis of whether DSA variability is dominated by diurnal cycles, seasonal cycles, or their interaction.
3.4 ERA5 Reanalysis and Diagnosis of Low-Level Jet and Convection
Surface meteorological observations are sparse in western China (Ge et al., 2016). To evaluate meteorological conditions and atmospheric processes fostering dust emission, we use the fifth generation European Centre for Medium-Range Weather Forecasts (ECMWF) atmospheric reanalysis (ERA5) data set (Hersbach et al., 2020). ERA5 provides high-quality, global atmospheric data with hourly resolution and spatial resolution of approximately 31 km and 137 pressure levels vertically. We use ERA5 hourly averaged data to analyze the wind speed (using the u component and v component of wind in meters per second; m s−1) across different pressure levels.
We identified the LLJ occurrence from low-level wind speed maxima by examining vertical wind profiles following Schepanski et al. (2009). The LLJ occurrence was defined based on the difference between the maximum wind speed within 3 km above ground level (a.g.l.) (the “jet-nose” speed) and the minimum wind speed near the ground. Given East Asia's highly variable topography, the jet-nose height was first determined as the altitude of maximum wind speed, with the requirement that wind speed decreases both above and below this level, and that it occurs within 3 km a.g.l. The jet-nose height occurs at different pressure levels across regions (Fig. S7, e.g., 875 hPa in the Taklimakan Desert, 900 hPa in the Northeast Plain, and 825 hPa on the Alashan Plateau). A LLJ was diagnosed based on a wind speed difference (Δv ≥ 5 m s−1) between the 975 hPa level and the jet-nose pressure at 06:00 LST. The LLJ frequency is defined as the number of days with a diagnosed LLJ divided by the total number of observation days. LLJ-associated DSA events were defined when DSA occurred during the late morning (i.e., 09:00–12:00 LST) under clear-sky conditions and when a LLJ was present at 06:00 LST on the same day.
Convective conditions were diagnosed using ERA5 convective available potential energy (CAPE), a column-integrated measure of atmospheric instability. As CAPE represents the capacity of the atmosphere to foster upward motion, CAPE is used as an indicator for potential deep moist convection and hence cloud formation. As the precise simulation of deep moist convection in ERA5 is challenging, we use CAPE to link cloud-associated DSA with convection. To account for the likelihood of spatial mismatches between dust fronts and convective cloud cores, CAPE was spatially averaged over a 3° × 3° grid window (i.e. the target grid cell and its eight surrounding neighbours) centred on each dust source activation location. CAPE was evaluated at 12:00 LST for each dust source grid cell to capture the typical diurnal maximum of convective activity over inland East Asia (see Sect. 4.5.1). Convective-associated DSA events were defined when DSA occurred during the summer afternoon (i.e., 12:00–18:00 LST) and when the 3° × 3° grid-averaged CAPE exceeded 50 J kg−1 at 12:00 LST on the same day (see Sect. 4.5.1).
4.1 Clear-sky and Cloud-associated Dust Source Activation
Dust source activation is widely reported with the passage of cloud-associated East Asian cyclones and cold fronts (Liu et al., 2003; Qian et al., 2002; Takemi and Seino, 2005; Zhao and Zhao, 2006), but much less extensively studied under clear-sky conditions (Song et al., 2024). Our data shows that DSA events occur frequently under both cloud-associated (∼ 60 % of total events) and clear-sky (∼ 40 % of total events) conditions (Fig. 2). Under cloud-associated conditions (Fig. 2a and c), DSA events predominantly originate over the Mongolian Plateau, the margins of the Taklimakan Desert, the northern Tibetan Plateau, the Qaidam Basin, the Alashan Plateau and the Northeast Plain. Under clear-sky conditions (Fig. 2b–c), the primary locations of DSA events are the Taklimakan Desert, especially at its eastern end, the Alashan Plateau, the Northeast Plain and the Ordos Plateau (Fig. 2b–c).
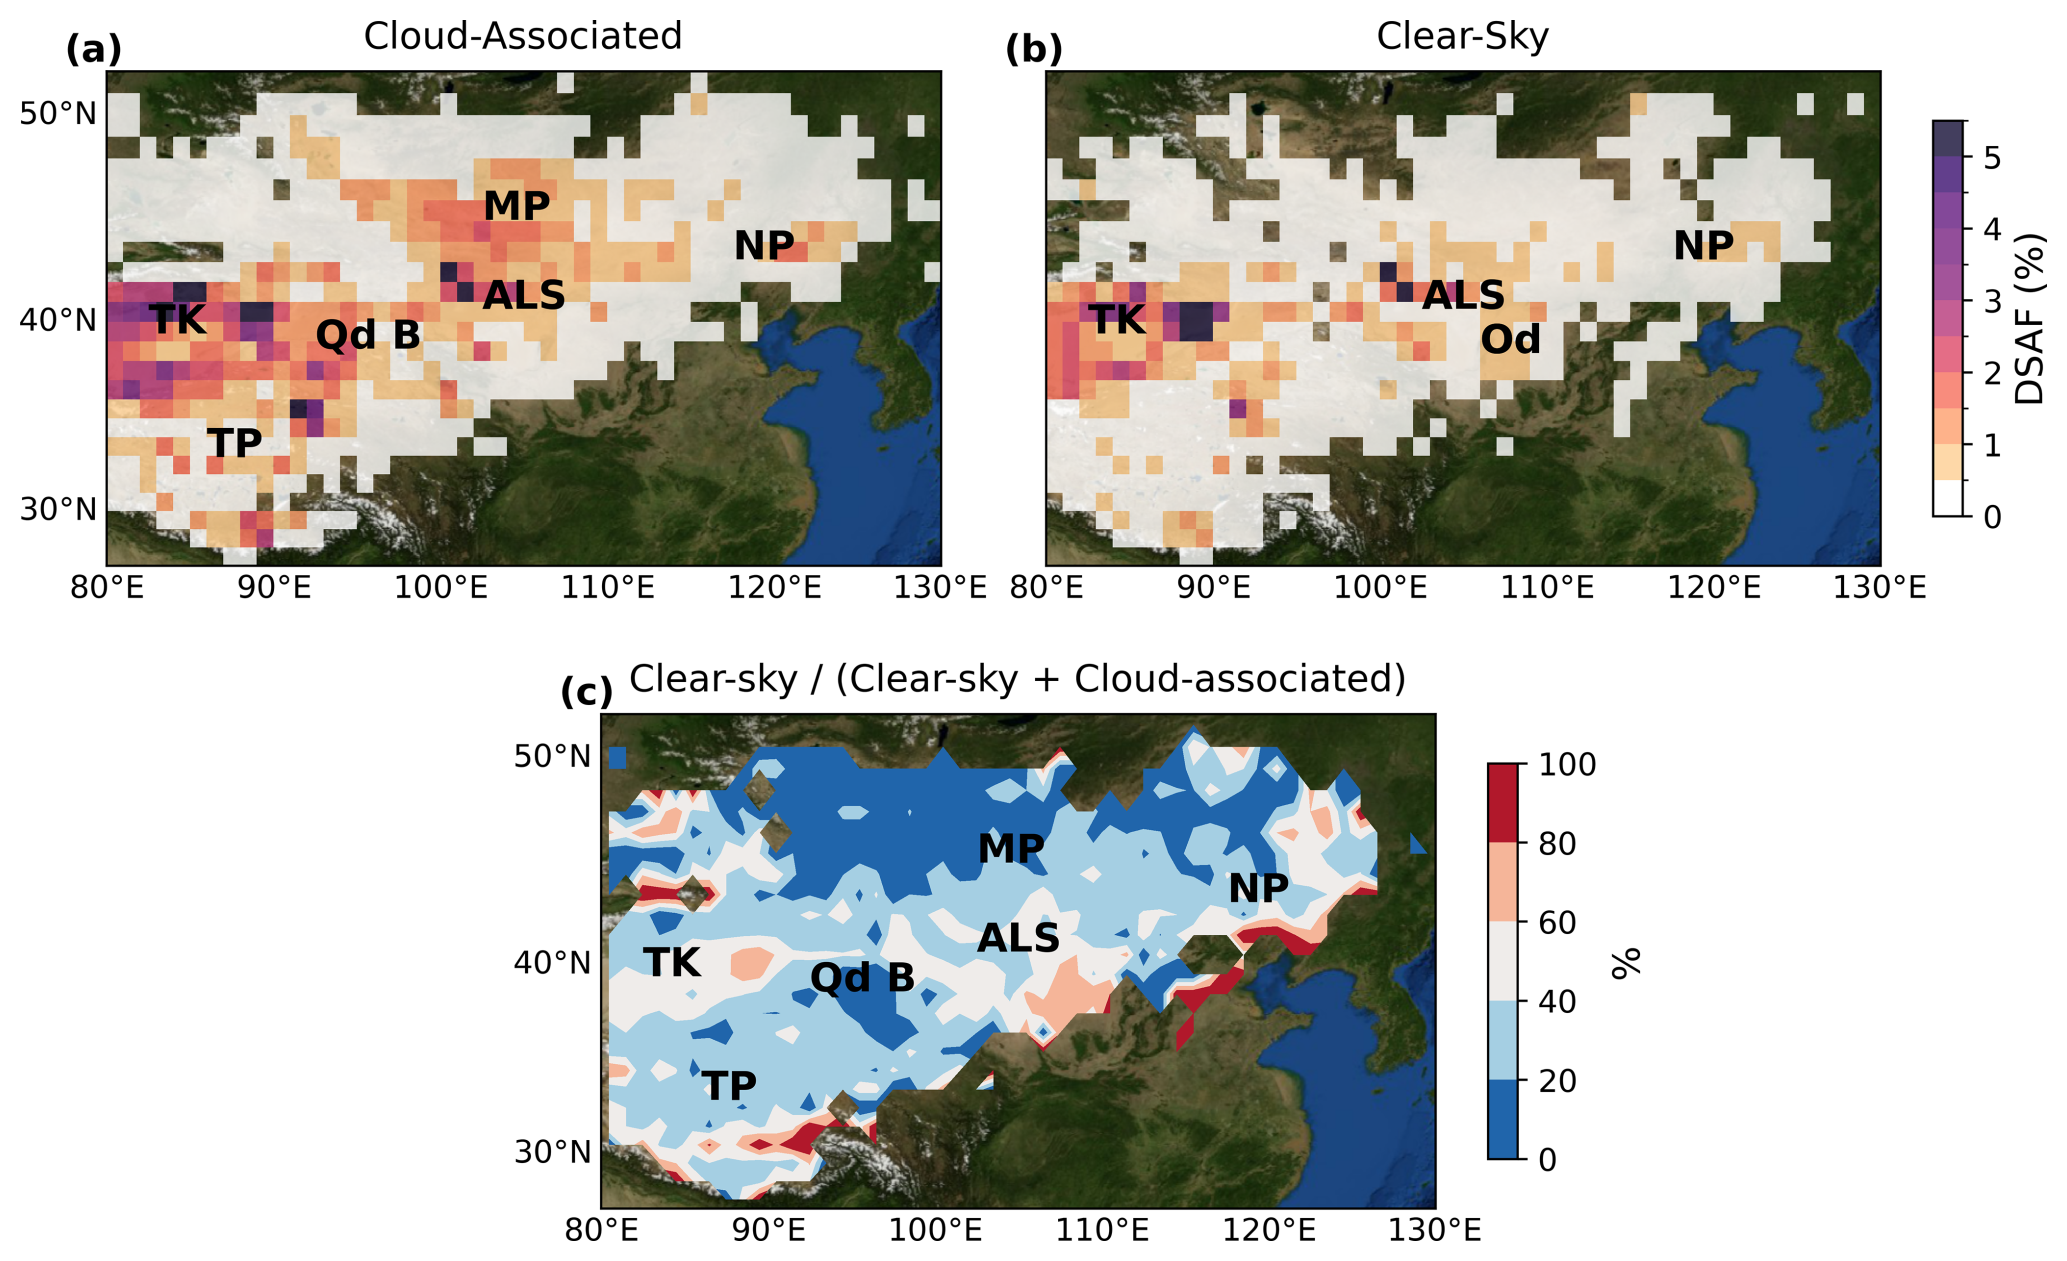
Figure 2Average annual dust source activation (DSA) frequency map for East Asia from 2016 to 2023 under (a) cloud-associated and (b) clear-sky conditions. (c) The percentage of clear-sky DSA (clear-sky DSA frequency divided by the total DSA frequency under both conditions). Dust source regions include the Mongolian Plateau (MP), the Alashan Plateau (ALS), the Northeast Plain (NP), the Taklimakan Desert (TK), the Qaidam Basin (Qd B), the Tibetan Plateau (TP) and the Ordos Plateau (Od). Basemap from NASA Blue Marble.
4.2 Diurnal Variability of Dust Source Activation in East Asia
Previous work on dust emissions in East Asia has focused on decadal, seasonal, monthly and daily timescales (Sun et al., 2001; Han et al., 2008; Ding et al., 2005; Chen et al., 2023). However, many meteorological processes important to dust source activation operate on much shorter timescales and these have received little attention (Song et al., 2024). Our data show that peak hours for DSA across most of East Asia are between 09:00 and 12:00 LST but slightly later in the day on the southern and eastern Tibetan Plateau (between 12:00 and 15:00 LST, Fig. 3a).
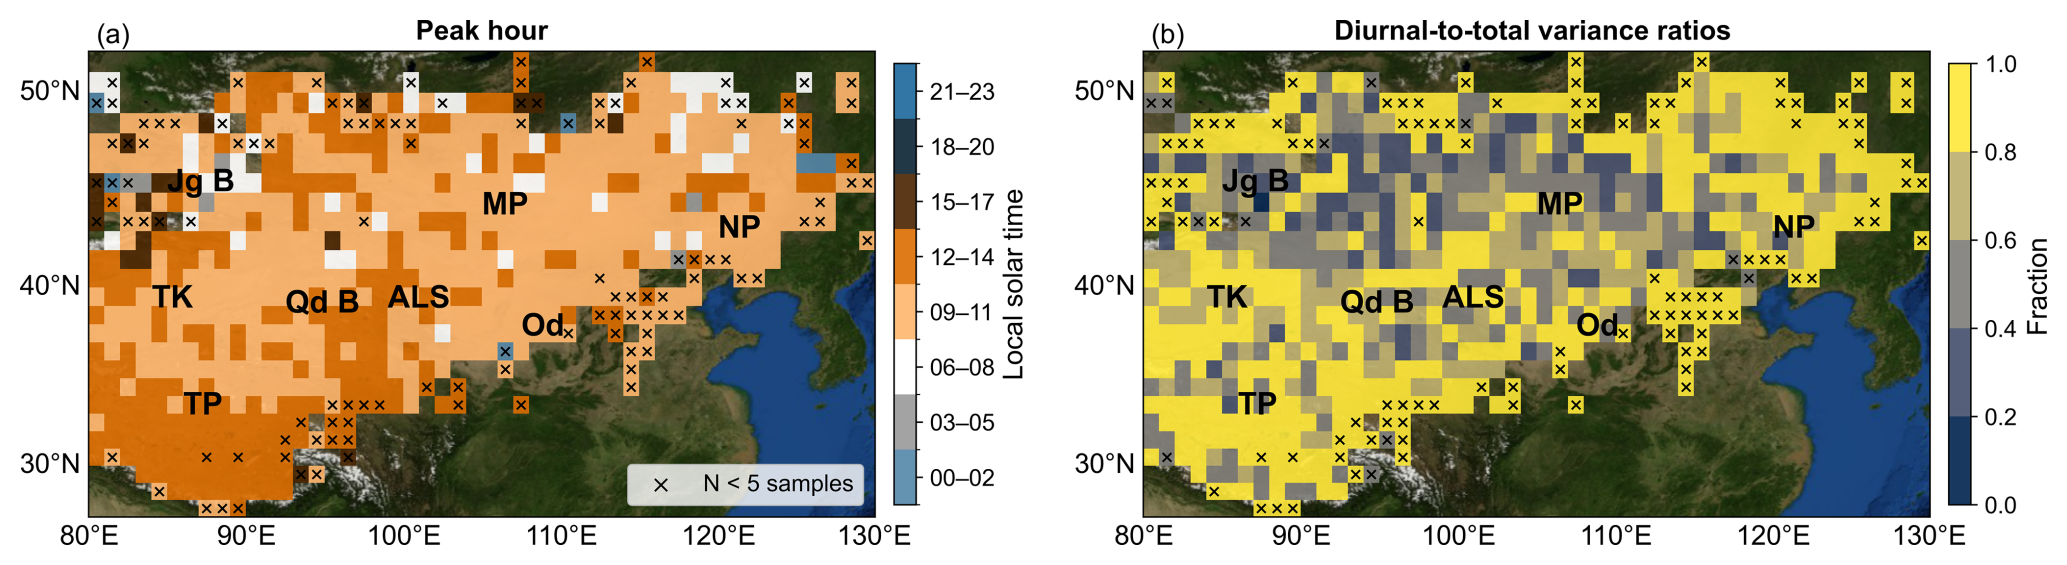
Figure 3Peak hours of dust source activation and diurnal variance dominance across East Asia (80–130° E, 27–52° N). (a) Peak hour of dust occurrence expressed in local solar time (LST) using 3 h bins, derived from the timing distribution of dust activation at each grid cell. (b) The proportion of diurnal-to-total variance was defined as the fraction of total temporal variance explained by the hour-of-day term in a two-factor ANOVA decomposition, where the diurnal variance is given by the hour-of-day sum of squares and the total variance by the total temporal sum of squares. Higher values indicate stronger control of dust activation timing by the diurnal cycle relative to seasonal and interaction components. Basemap imagery from NASA Blue Marble.
There is pronounced spatial variability in the diurnal variance of DSA timing (Fig. 3b). Diurnal variance is in high proportion of total variance (typically > 0.8) across the Taklimakan Desert, the Northeast Plateau, and the southern Tibetan Plateau, indicating that DSA variability is dominated by the diurnal cycle, with DSA occurring at a relatively consistent time of day across different seasons and years. In contrast, diurnal variance makes up a lower proportion of total variance (typically < 0.4) over the Mongolian Plateau, the northern Tibetan Plateau and Qaidam Basin indicating a broader spread in the timing of peak DSA, reflecting a strong influence of synoptic forcing.
4.3 Wind Gustiness as a Control on Dust Source Activation
To understand the underlying meteorological forcing on diurnal timing and variability of dust activations, we studied five areas of high DSAF (one taken from all of the main dust-active regions, i.e., MP, NP, ALS, TK, TP, see Figs. 1b and 4) and we calculated hourly DSA counts within these areas under both clear-sky and cloud-associated conditions and parsed their aggregated DSA counts into quarterly segments (Fig. 4). This distinction between clear-sky and cloud-associated DSA provides a first-order indication of the likely meteorological forcing. Cloud-associated activations are more likely linked to synoptic systems, cold fronts, and convective storms, whereas clear-sky activations are more likely associated with boundary-layer processes such as the LLJ breakdown. However, these categories should not be interpreted as one-to-one physical classifications and more detailed event-based comparisons are therefore required to evaluate the associated meteorological forcing mechanisms (see Sect. 4.4 and 4.5).
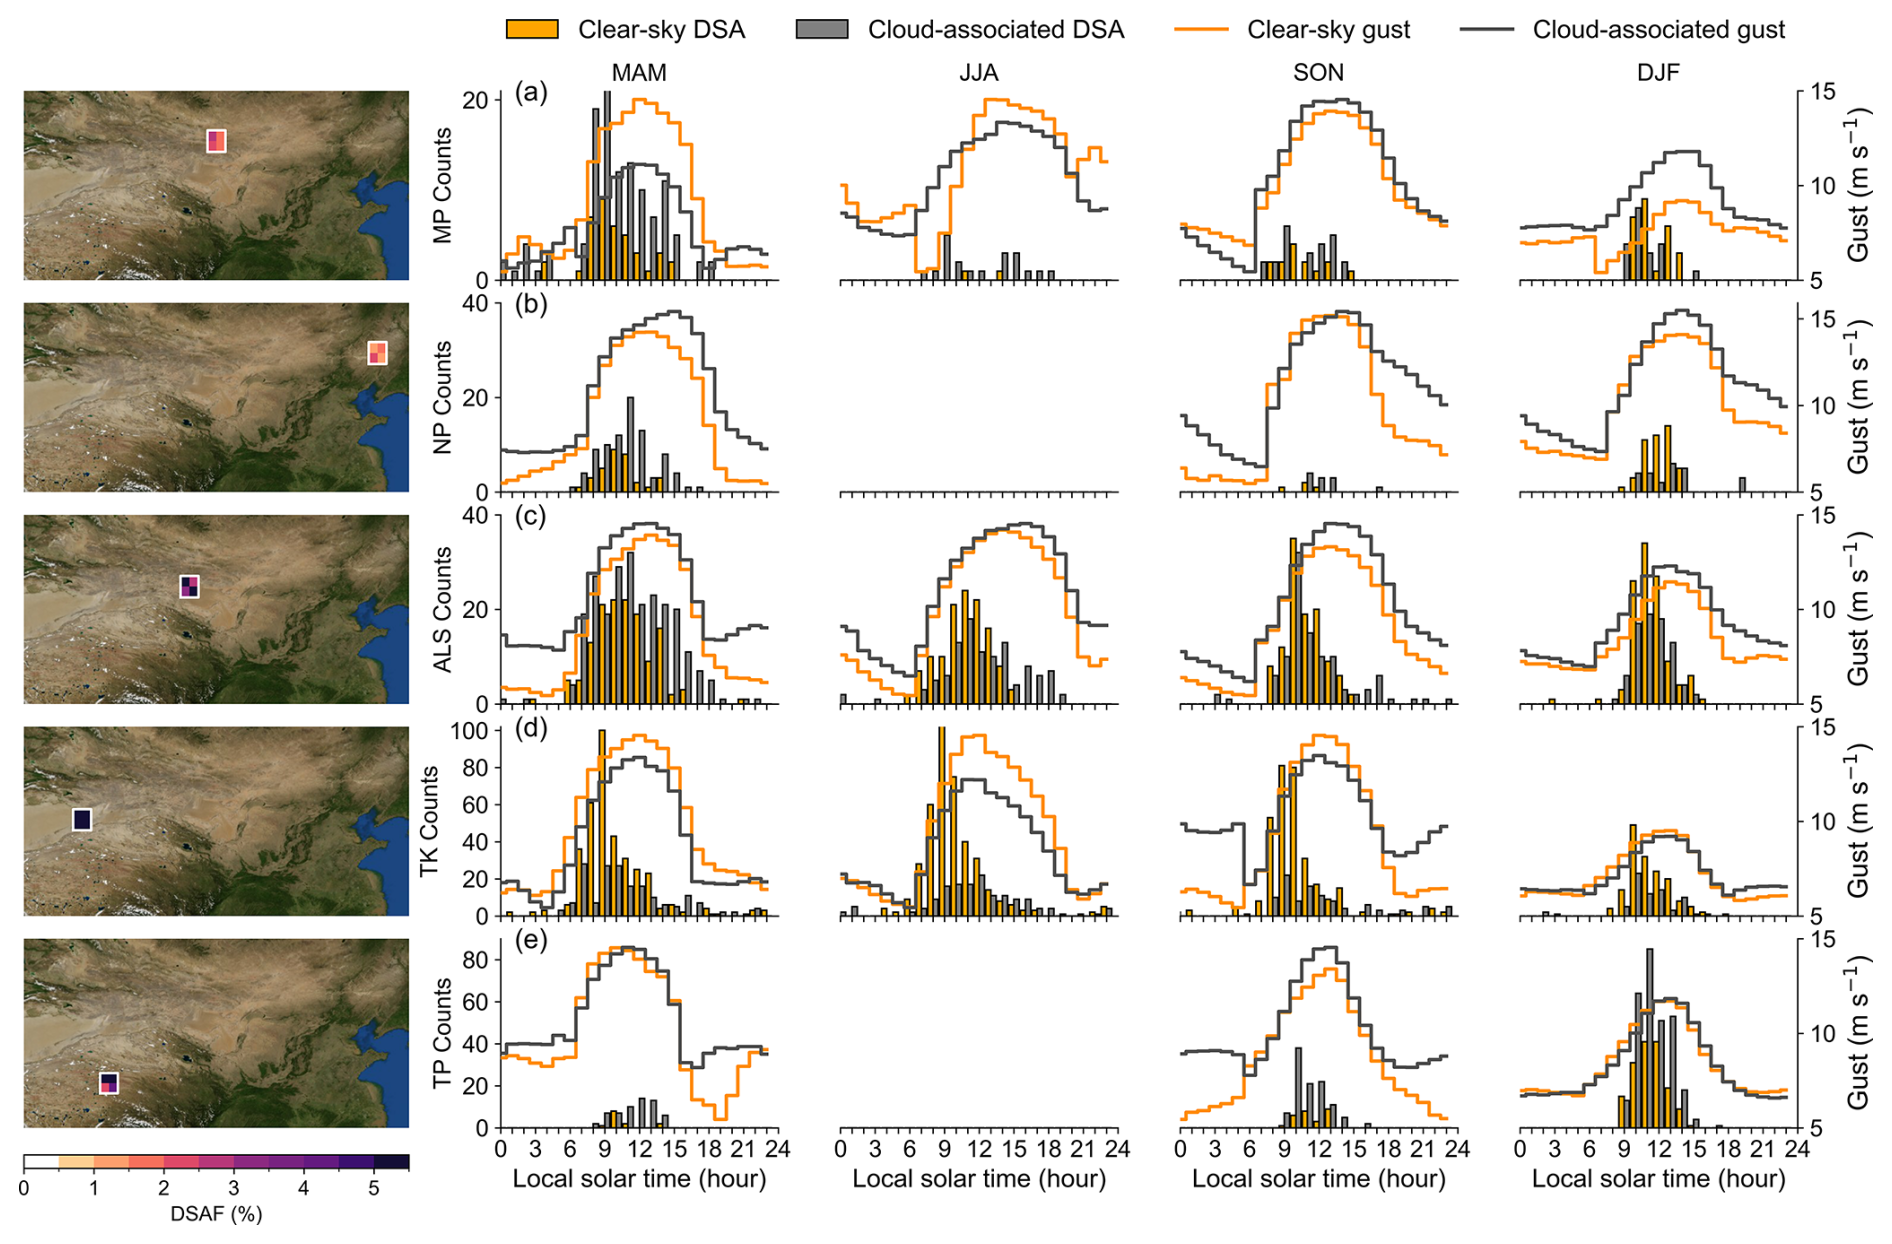
Figure 4Diurnal distributions of dust source activation (DSA) counts for sample localities from the main dust-active regions in East Asia under clear-sky and cloud-associated conditions across the four seasons: spring (March, April, May; MAM), summer (June, July, August; JJA), autumn (September, October, November; SON), and winter (December, January, February; DJF). The main dust-active regions are: (a) the Mongolian Plateau (MP; 103–105° E, 43–45° N), (b) the Northeast Plain (NP; 121–123° E, 43–45° N), (c) the Alashan Plateau (ALS; 100–102° E, 41–43° N), (d) the Taklimakan Desert (TK; 89–91° E, 39–41° N), and (e) the Tibetan Plateau (TP; 91–93° E, 34–36° N). For each region, the grids with the highest dust source activation frequency (see maps on the left) are used for the analysis. Bar plots represent the hourly counts of DSA events for each season, while the overlaid curves show the corresponding mean diurnal cycle of 10 m wind gust speed on DSA days under clear-sky (yellow) and cloud-associated (grey) conditions. Basemap from NASA Blue Marble.
Within each segment, we computed the mean 10 m wind gusts in hourly resolutions for days under clear-sky and cloud-associated DSA conditions respectively. We focus on representative grid cells to isolate core dust activation regions which exhibit the clearest and most persistent diurnal signals, thereby enabling a robust comparison with wind patterns in topographically complex East Asia.
The Mongolian Plateau (103–105° E, 43–45° N) is most dust active under cloud-associated conditions in spring between 09:00 and 12:00 LST (Fig. 4a). The Northeast Plain (121–123° E, 43–45° N) is also most dust active in spring but events are split near-equally between those occurring under clear-sky conditions between 09:00 and 12:00 LST, and cloud-associated conditions between 09:00 and 15:00 LST (Fig. 4b). We attribute the strong springtime signal in cloud-associated events in these two regions (Fig. 4a–b) to the well-documented seasonal peak in cyclone activities (Mu and Fiedler, 2025). A secondary peak in clear-sky and cloud-associated activations in the Mongolian Plateau (103–105° E, 43–45° N) occurs during winter between 12:00 and 18:00 LST (Fig. 4a). We attribute this result to solar radiation-induced heating of the land surface and resulting atmospheric convection as reported from the field studies of Liu et al. (2003). This interpretation is consistent with those based on sparse meteorological station data (Natsagdorj et al., 2003), indirect measurements of dust optical depth (DOD) (Tindan et al., 2023) and dust models (Liu et al., 2003).
Both the Alashan Plateau (100–102° E, 41–43° N) and the Taklimakan Desert (89–91° E, 39–41° N) are dust-active year-round (Fig. 4c–d). Both clear-sky and cloud-associated DSA events occur in all seasons but cloud-associated activations peak in spring. The clear-sky activations occur in a narrower daily interval 06:00–12:00 LST than the cloud-associated activations (06:00–18:00 LST) and these distinct diurnal patterns are consistent throughout the year (Fig. 4c–d). For the (eastern) Taklimakan Desert, the fraction of clear-sky DSA is larger than the fraction of cloud-associated DSA (Fig. 4d). The broader spread in the timing of peak DSA, together with the spring peak of cloud-associated dust activations, suggest that, as is the case further north, dust source activation in the Taklimakan Desert and the Alashan Plateau during spring is influenced by synoptic wind systems associated with the passage of cyclones and cold fronts, weather systems well documented in spring in these regions (Li et al., 2022). A different meteorological forcing mechanism is required to explain the clear-sky dust activation events that dominate spring and the rest of the year in the Taklimakan Desert and the Alashan Plateau and cloud-associated dust activations that dominate the rest of the year. On sunny days with weak winds, solar radiation enhances the ground sensible heat flux, lowers the air density and triggers dry convective activities, lifting dust devils or dusty plumes into the atmosphere predominantly in the afternoon (around 14:00 LST) as illustrated in the daily TOMS-AI data of Han et al. (2016), suggesting the important role of convection in this region. However, our data also show that clear-sky dust activation in the Taklimakan and the Alashan Plateau peak in the morning (06:00–12:00 LST; Fig. 4b–c), implying that other meteorological forcing mechanisms are responsible for clear-sky dust activations (see Sect. 4.4).
The Tibetan Plateau (91–93° E, 34–36° N) is most dust-active in winter and both clear-sky (∼ 40 % of total events) and cloud-associated activations (∼ 60 %) peak between 12:00 and 15:00 LST (Fig. 4e). This prominent diurnal peak in dust source activations corresponds closely with the timing of peak wind gust speeds (Fig. 4e). It is challenging to identify the drivers of local dust emissions on the Tibetan Plateau using field data because meteorological stations in this region are sparse and it is difficult to distinguish locally generated dust from remotely transported dust. To our knowledge, our study pioneers this effort and establishes this linkage for the first time. Owing to the high elevation and complex topography of the Tibetan Plateau, we do not attempt to diagnose the detailed physical mechanisms underlying these dust events using ERA5 data in this study. Instead, informed by meteorological station observations of afternoon mountain–valley channelled winds in Zhu et al. (2024), we infer that DSA events over the Tibetan Plateau may well be controlled by strong coupling between the atmospheric boundary layer and extreme topography, and are plausibly triggered by thermally driven upslope and valley wind circulations that intensify during the afternoon.
Across all five regions, peak DSA counts typically occur in the late morning, preceding the daily maximum in 10 m wind gusts during the mid-afternoon (Fig. 4), indicating that dust activation is governed by the exceedance of a critical wind-gust threshold rather than by the absolute daily maximum wind speed. The pronounced diurnal peak of wind gusts in these regions reflects the combined influence of meteorological processes driving DSA events, including the LLJ, convective storms, and mountain–valley circulations, all of which share distinct diurnal patterns and will be discussed in the following Sect. 4.4 and 4.5. There is no clear difference in the mean diurnal cycles of gusts under clear-sky and cloud-associated DSA conditions, likely because the daytime boundary-layer turbulence generates gusts under both conditions when averaged across all DSA days. However, gusts under cloud-associated DSA conditions tend to peak slightly later in the day than those under clear-sky conditions, particularly over the Mongolian Plateau and the Northeast Plain (Fig. 4a–c). In these regions, the passage of Mongolian cyclones generates gusts and DSA events during the afternoon, which are superimposed on the clear-sky gusts and DSA that typically occurs in the morning.
4.4 Role of the Low-level Jet in Dust Source Activation Across East Asia
The importance of the LLJ in driving dust activity has been documented in satellite and/or meteorological station data sets of high temporal resolution in the Sahara (Schepanski et al., 2007; Schepanski et al., 2014), the Middle East (Hennen et al., 2019), the Horn of Africa (Kunkelova et al., 2024) and Southern Africa (Clements and Washington, 2021). In extreme cases, the downward mixing of LLJ momentum to the surface is suggested to contribute up to 60 % of the total dust emissions in the Bodélé Depression (Fiedler et al., 2013; Schepanski et al., 2009). Recent studies using ERA-Interim data (Ge et al., 2016), WRF-Chem models (Han et al., 2022), and coherent Doppler wind lidar (Su et al., 2024) have explored the role of the LLJ in the Taklimakan Desert but LLJ-driven dust emissions have received little attention elsewhere in East Asia.
4.4.1 Low-Level Jet-Driven Mechanisms of Dust Source Activation in East Asia
To analyse the processes by which the LLJ drives clear-sky DSA events, we analysed three key regions where LLJ activity has been reported in other published data sets (Yan et al., 2021; Ge et al., 2016; Shu et al., 2024): the Taklimakan Desert, the Alashan Plateau and the Northeast Plain (Fig. 1c). We calculated hourly mean vertical profiles of wind speed for both dusty and non-dusty days under clear-sky conditions (Fig. 5). We make three basic observations. First, the profiles of mean vertical windspeed show well-developed nose-shaped maxima at depth, indicating the prevalence of LLJ occurrence in the Taklimakan Desert, the Alashan Plateau and the Northeast Plain. Second, because of the differences in altitude of the land surface between study regions, these jet-nose wind speed maxima occur at different pressure levels (e.g., ∼ 900 hPa in the Northeast Plain, ∼ 825 hPa in the Alashan Plateau and ∼ 875 hPa in the Taklimakan Desert, Fig. S7). Third, in all three regions, there is a marked difference in windspeed vertical profiles between dusty and non-dusty days with jet-nose wind speeds higher on dusty days than non-dusty days (Fig. 5). We note that jet-nose wind speeds on the Northeast Plain, the Alashan Plateau and the Taklimakan Desert reach their maxima at ca. 03:00–06:00 LST and minima at ca. 12:00–18:00 LST during both clear-sky non-dusty days and clear-sky dusty days. Under clear-sky conditions, ground-level wind speeds are higher (by ∼ 2.5 m s−1) on dusty days than non-dusty days in all three study regions and wind speed differences between the jet-nose level and ground level at 06:00 LST (i.e., the hour of peak jet-nose wind speed) are higher on dusty days (median value > 5 m s−1) than non-dusty days (median value by ∼ 2.5 m s−1). We examine the LLJ at 06:00 LST, when it reaches its maximum intensity and provides the strongest vertical shear that preconditions the boundary layer for the dust uplift observed around 09:00 LST.
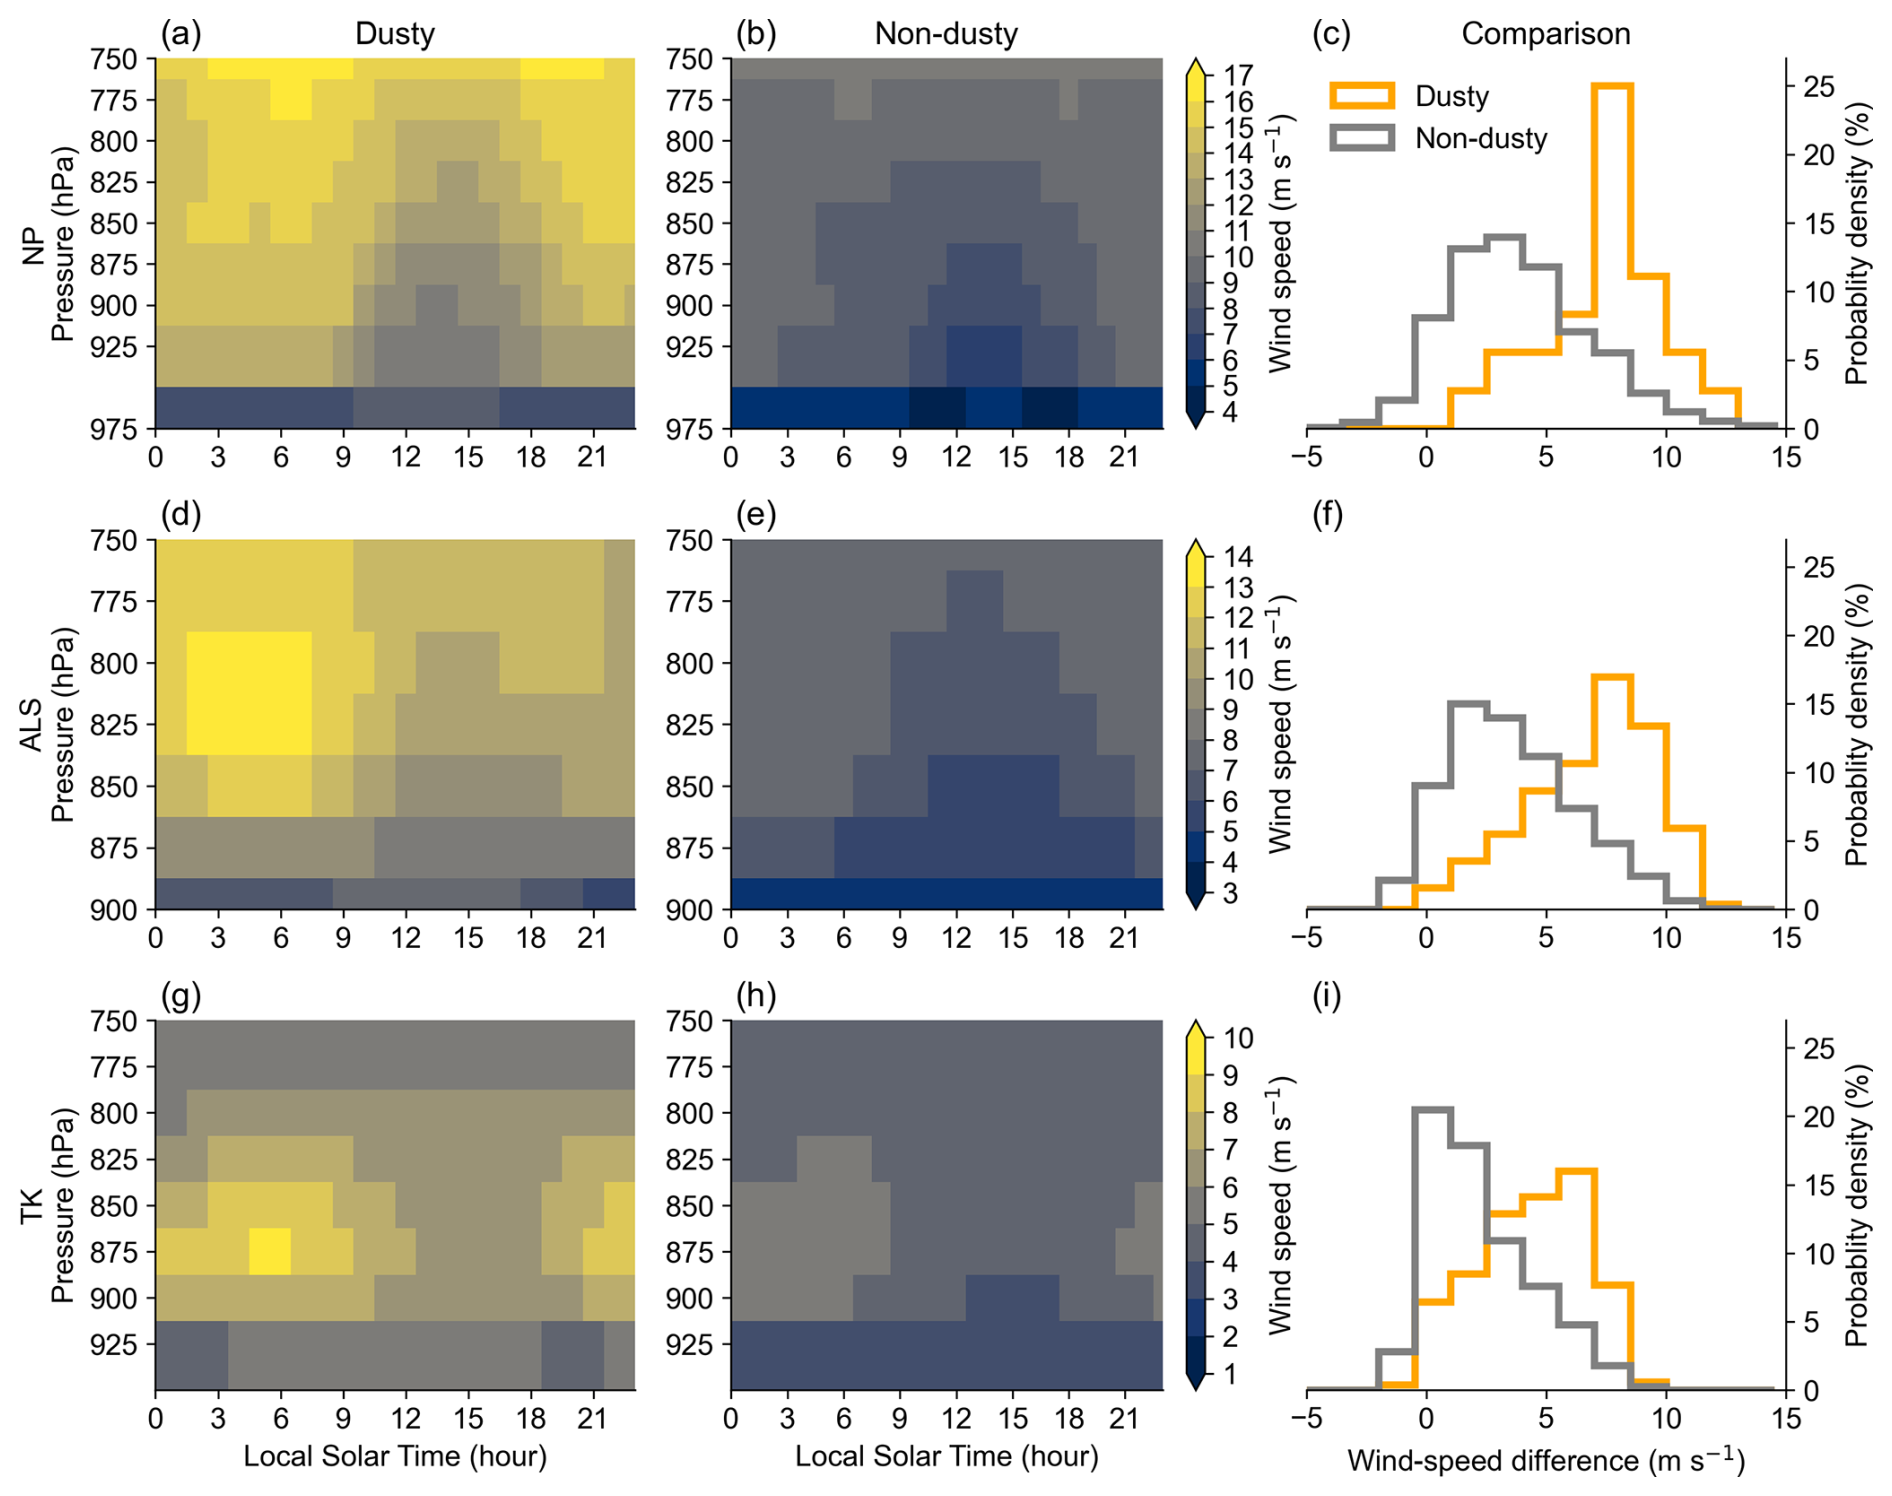
Figure 5Wind speed structure at different pressure levels and times of day for clear-sky dusty conditions and non-dusty days at different hours for three of the subregions analysed in Fig. 4: (a–b) NP (the Northeast Plain, 121–123° E, 43–45° N), (d–e) ALS (the Alashan Plateau, 100–102° E, 41–43° N), and (g–h) TK (the Taklimakan Desert, 89–91° E, 39–41° N). The rightmost column shows the wind speed difference between 975 hPa and the jet-nose pressure level at 06:00 LST (i.e., the time when the LLJ typically reaches its maximum intensity and preconditions the atmosphere for dust emission later in the morning) for dusty (yellow) and non-dusty (grey) days in: (c) NP, (f) ALS and (i) TK.
Our direct cross-comparison of dusty with non-dusty events, combined with ERA5 reanalysis data, provides mechanistic insight into the vertical structure and diurnal evolution of the atmospheric processes underlying DSAs under clear-sky conditions (Fig. 5). Overnight, radiative cooling stabilizes the boundary layer, allowing wind speeds aloft to accelerate (by ∼ 5 m s−1) and form a nocturnal LLJ that is decoupled from surface friction. After sunrise, solar heating destabilizes the lower atmosphere, enhancing turbulent kinetic energy and facilitating downward momentum transfer from the jet core to the surface. This rapid turbulent mixing produces a short-lived but intense increase of near-surface wind speed (by ∼ 2.5 m s−1) that can exceed the threshold friction velocity required for dust entrainment and favour a morning pulse of dust activation.
4.4.2 Low-level Jet-Associated Dust Source Activation Frequency in East Asia
To assess the spatiotemporal control of the LLJ on dust activation in our data, we firstly compute the LLJ occurrence by examining vertical wind profiles at 06:00 LST across East Asia between 2016 and 2023 and evaluating them for low-level wind speed maxima characteristic of the LLJ (see Sect. 3.4 for more details). We select 06:00 LST because the LLJ is typically strongest in the early morning, with its breakdown after sunrise enhancing downward momentum transfer and favouring peak dust activations between 09:00 and 12:00 LST (Figs. 3 and 4). This sequence of events has also been observed in WRF-Chem simulations of the Tarim Basin (Han et al., 2022).
Our reconstructions reveal a main LLJ belt (frequencies up to 50 %) in the low-lying regions that extend from the Taklimakan Desert eastward to the Northeast Plain sandwiched between the Tibetan Plateau to the south and the Mongolian Plateau to the north (Fig. 6a). Other LLJ hot spots exist in the low-lying basins that are surrounded by the Altai, Khanghai and Khentii mountains on the Mongolian Plateau (frequencies up to 50 %) as well as in the Junggar Basin (frequencies up to 25 %, Fig. 6a). LLJ events occur year-round in these regions with modest seasonal variability in frequency (Fig. S8). For example, a LLJ on the Northeast Plain is more frequent during cold seasons under stronger (northwesterly) winds than during warm seasons (Shu et al., 2024) while, in the Taklimakan Desert, a LLJ occurs more frequently during warm seasons when the Tarim Basin serves as a heat source (Song et al., 2024).
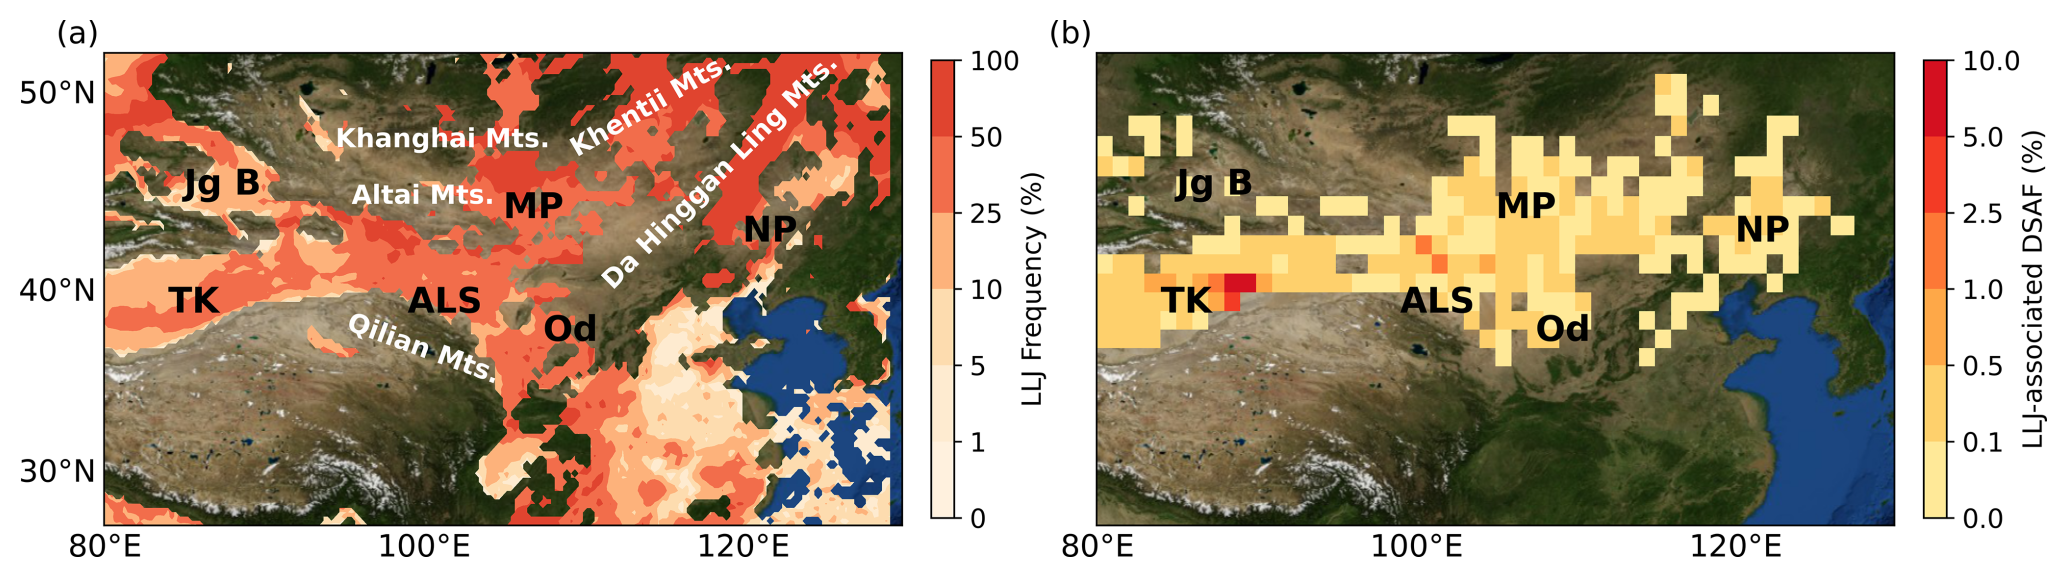
Figure 6(a) Frequency (%) of the Low-level Jet (LLJ, Δv ≥ 5 m s−1 between levels at 975 hPa and the jet-nose pressure) occurrence at 06:00 local solar time (LST), average from 2016 to 2023. The LLJ frequency is defined as the number of days with a diagnosed low-level jet divided by the total number of days over the 8-year study period. (b) LLJ-associated dust source activation frequency (DSAF) from 2016 to 2023, quantified as the percentage of clear-sky dust events between 09:00 and 12:00 LST that coincide with a low-level jet at 06:00 LST within the same date, normalised by the total number of observation days. High LLJ occurrence and LLJ-associated dust source activations regions labelled in black include Junggar Basin (Jg B), the Mongolian Plateau (MP), the Alashan Plateau (ALS), the Northeast Plain (NP), the Taklimakan Desert (TK), and the Ordos Plateau (Od). Main mountains (Mts.) are labelled in white. Basemap from NASA Blue Marble.
We identify the Taklimakan Desert as a hotspot for LLJ activity (Fig. 6a). This result is in keeping with previous suggestions based on six-hourly ERA-Interim reanalysis (Ge et al., 2016), the Weather Research and Forecasting Coupled Chemistry (WRF-Chem) model (Han et al., 2022), and coherent Doppler wind lidar analysis (Su et al., 2024). Our reconstruction shows that the southeastern part of the basin is most susceptible to LLJ activity (25 %–50 %). LLJ events (10 %–25 %) also occur on the Northeast Plain at the eastern edge of the Da Hinggan Ling Mountains (Fig. 6a). This result is consistent with interpretations of twice-daily radiosonde observations (Yan et al., 2021) and hourly ERA5 reanalysis data (Shu et al., 2024) (Fig. 6a). However, our analysis is the first to capture the wind speed difference between 975 hPa and the jet-nose height.
High LLJ frequencies (25 %–50 %) are observed on the Alashan Plateau, the Junggar Basin, the Ordos Plateau and China's east coast (Fig. 6a). These findings are consistent with the interpretations of Yan et al. (2021) based on their twice-daily radiosonde observations. However, our data, with its hourly resolution and broader spatial coverage, enables the reconstruction of the LLJ across the Mongolian Plateau and identifies dust LLJ hotspots including the northern side of the Altai Mountains and the northwest Mongolian Plateau (Fig. 6a).
To evaluate the LLJ contribution to dust activity, we calculate for each grid cell the frequency of DSA events that occur between 09:00 and 12:00 LST under clear-sky conditions and when an LLJ is present at 06:00 LST on the same day. These DSA events are referred to as LLJ-associated DSA events. The spatial correspondence between LLJ-associated DSA events and LLJ occurrence is striking (Fig. 6). The distribution of LLJ-associated DSA events (Fig. 6b) reveals hotspots in the Taklimakan Desert, the Alashan Plateau, the Ordos Plateau, the eastern Mongolian Plateau, the Northeast Plain, the Junggar Basin and the mountainous regions along the Mongolia and Kazakhstan border (Zhang et al., 2018; Fig. 6). LLJ-associated DSA exhibits differences between warm and cold seasons across East Asia (Fig. S9): during the cold season (spring and winter), LLJ-associated DSA events are more widespread at hotspots over the Taklimakan Desert, the Alashan Plateau, the Mongolian Plateau, the Northeast Plain, and the Junggar Basin. During the warm season (summer and autumn), LLJ-associated DSA is more spatially confined to the Taklimakan Desert and parts of the Alashan and Mongolian Plateau. We note that a LLJ may also develop in larger-scale synoptic systems such as cyclones and cold fronts (Mu et al., 2023). For example, the spring peak in LLJ-associated DSA frequency over the eastern Mongolian Plateau may reflect the influence of larger-scale synoptic controls operating together with LLJ activity (Fig. S9).
4.5 Role of Convection in Dust Source Activation across East Asia
Haboobs are well documented in the Sahara Desert and Middle East (Schepanski et al., 2009; Fiedler et al., 2013) but they have been only sporadically reported in the Taklimakan Desert and the Alashan Plateau and have not yet been systematically studied at the continental scale in East Asia (Gu et al., 2021). The somewhat short-lived nature of haboobs makes high-temporal-resolution datasets particularly essential for detecting and analysing these events.
4.5.1 Convection–Driven Mechanisms of Dust Source Activation in East Asia
To examine how convective activities modulate cloud-associated DSA across East Asia during summer afternoons, we focus on two regions where haboobs have been documented (Gu et al., 2021): the Taklimakan Desert and the Alashan Plateau (Fig. 1c). We focus on dusty days under cloud-associated conditions during summer afternoons (12:00–18:00 LST) and all non-dusty days during summer to compare their hourly CAPE (Fig. 7). We use CAPE as a diagnostic of convective conditions because it reflects the atmospheric potential for the buoyancy-driven updrafts that generate strong surface downdrafts. Because convective clouds are often displaced relative to the dust front, we compute CAPE as a spatial average over each target grid cell and its eight surrounding neighbours (a 3° × 3° window). Our results illustrate a pronounced diurnal evolution of CAPE under summer cloud-associated conditions (Fig. 7). In both regions, CAPE remains low during the night and early morning, reflecting a relatively stable lower troposphere, but increases thereafter, peaking in mid-afternoon as surface heating intensifies and convective instability develops. Cloud-associated DSAs during summer afternoons (12:00–18:00 LST) are associated with distinctly higher CAPE values than on non-dusty days (Fig. 7a–b and d–e), indicating enhanced convective potential and more favourable conditions for vigorous vertical mixing. The probability distributions of CAPE at 12:00 LST (Fig. 7c and f) further show that, in both regions, dusty days exhibit distributions shifted towards higher CAPE values relative to non-dusty days, implying a greater likelihood of convectively unstable conditions during dust events. This contrast suggests that cloud-associated summer afternoon DSA events in these two regions are preferentially associated with enhanced convective instability and mixing, consistent with a close link to convective activity.
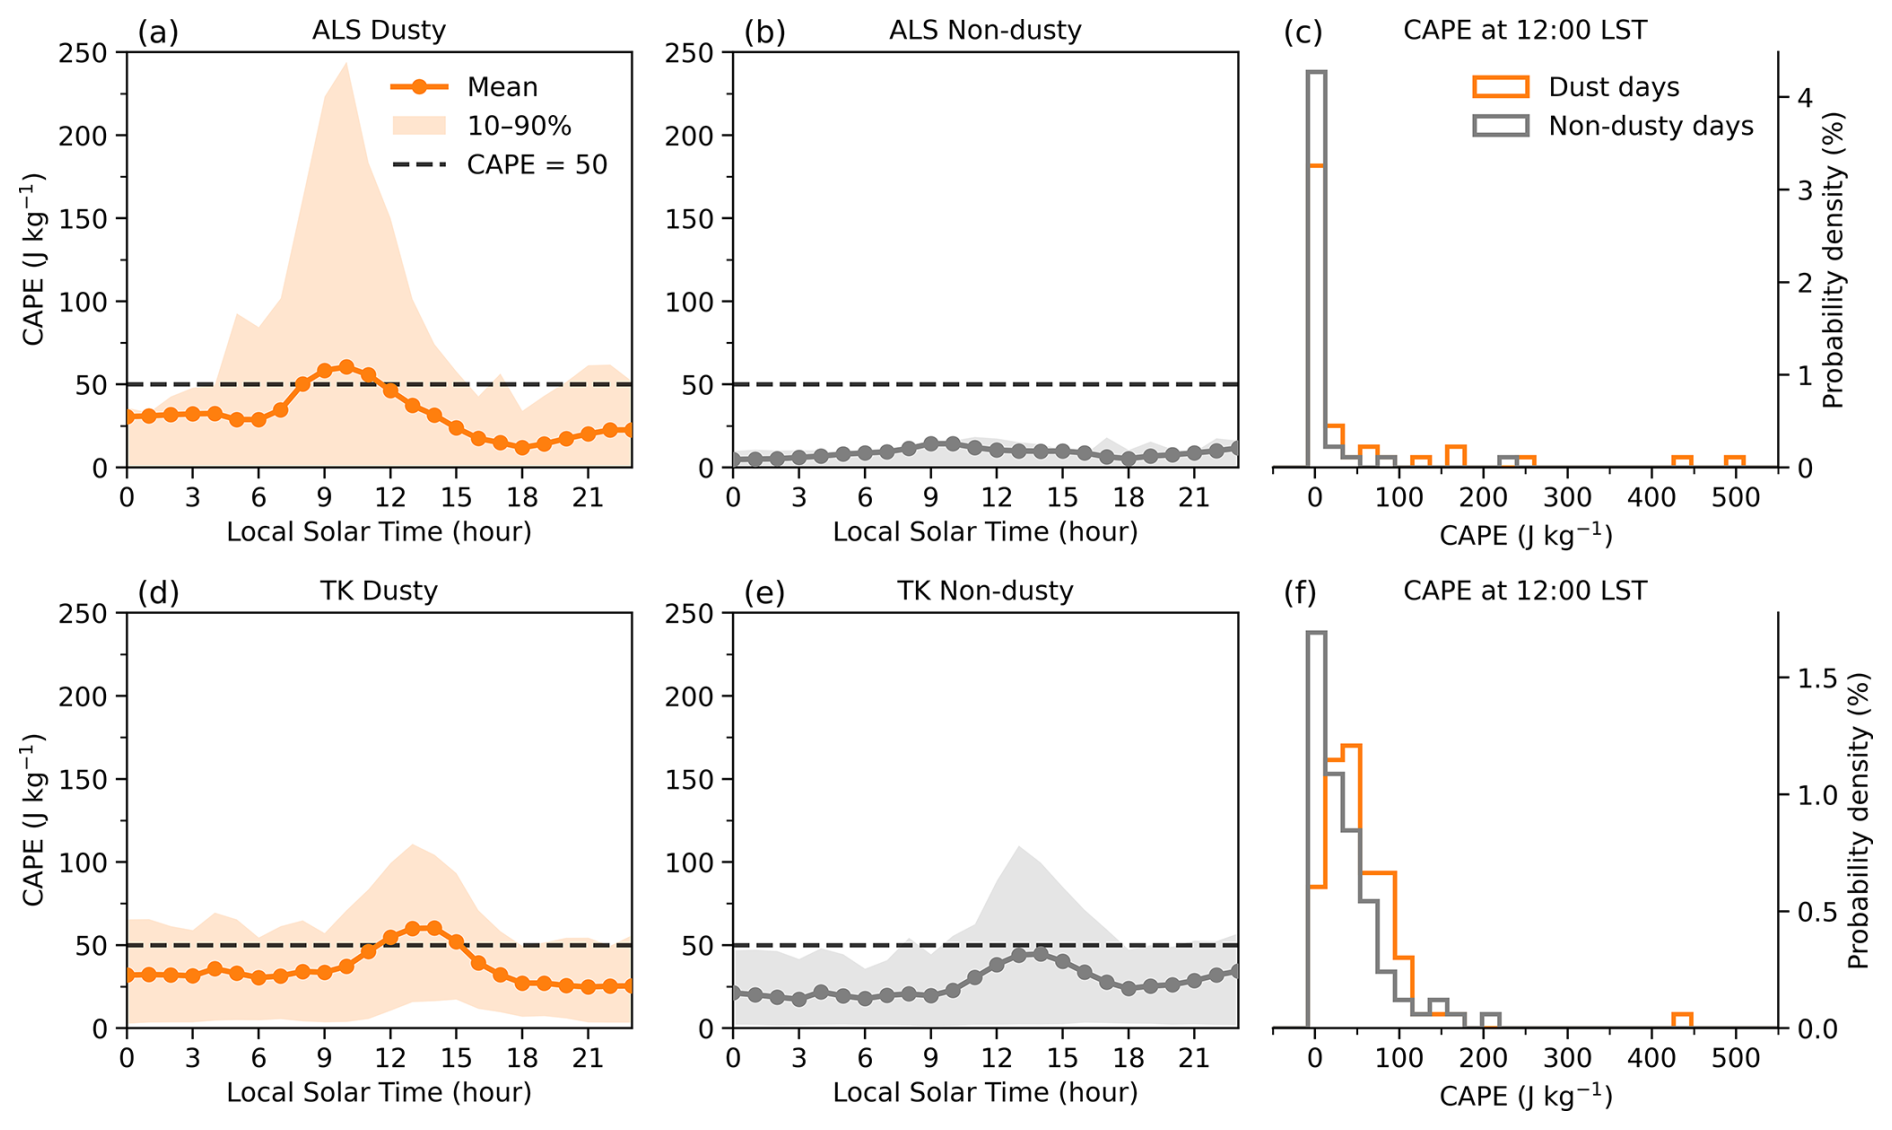
Figure 7Mean diurnal evolution of convective available potential energy (CAPE) for dusty (under summer cloud-associated conditions during 12:00–18:00 LST) and non-dusty days over two subregions: (a–b) ALS (the Alashan Plateau, 100–102° E, 41–43° N) and (d–e) TK (the Taklimakan Desert, 83–85° E, 40–42° N). Shading indicates the 10th–90th percentile range. The dashed horizontal line marks the CAPE threshold of 50 J kg−1. Panels (c) and (f) present the probability distributions of CAPE at 12:00 LST for dusty (orange) and non-dusty (grey) days over ALS and TK, respectively. All CAPE values are spatially averaged over a 3° × 3° grid (nine grid cells, ±1° grid) centred on each subregion to account for the spatial offsets that commonly occur between haboob events and associated convective clouds.
4.5.2 Convective–Associated Dust Source Activation Frequency across East Asia
To evaluate the contribution of haboob-like convection to dust activity in East Asia more generally, we examine the spatial distribution of CAPE at 12:00 LST during summer (June–August) for all cloud-associated DSA events occurring in the afternoon (15:00–18:00 LST). CAPE is shown as a 3° × 3° spatial mean centred on each 1° grid cell and averaged over days with cloud-associated summer afternoon DSA. We select 12:00 LST because this time corresponds to the period when convective boundary-layer mixing is strongest (Fig. 7), favouring efficient downward momentum transfer and subsequent dust activation later in the day (e.g. between 15:00 and 18:00 LST). Convective conditions are diagnosed when CAPE exceeds the threshold of 50 J kg−1 which is empirically derived from the observed CAPE distributions during summer afternoon cloud-associated DSA events in the Taklimakan Desert (Fig. 7c) and the Alashan Plateau (Fig. 7f). We further calculate, for each grid cell, the frequency of cloud-associated DSA events that occur between 15:00 and 18:00 LST under convective conditions. The resulting distribution of convective-associated DSA events (Fig. 8) reveals prominent hotspots in the Taklimakan Desert and the Alashan Plateau, which coincide with areas previously identified as prone to convective dust activity in arid and semi-arid environments (Gu et al., 2021). While previous studies have inferred the importance of convective activities in East Asia from limited station observations (Gu et al., 2021), our analysis based on hourly DSA dataset and a diagnostic of convection provides the first assessment of the connection between convective activities and summer afternoon dust source activation events across East Asia at the continental scale. Note that ERA5 does not resolve haboob dynamics explicitly and that modest spatial mismatches may exist between convective clouds and dust source activation sites, and that the choice of CAPE threshold used (see Fig. 7) is not unambiguous. Consequently, our analysis should be considered only a first step towards a large-scale representation of convective influences on dust source activation in East Asia.
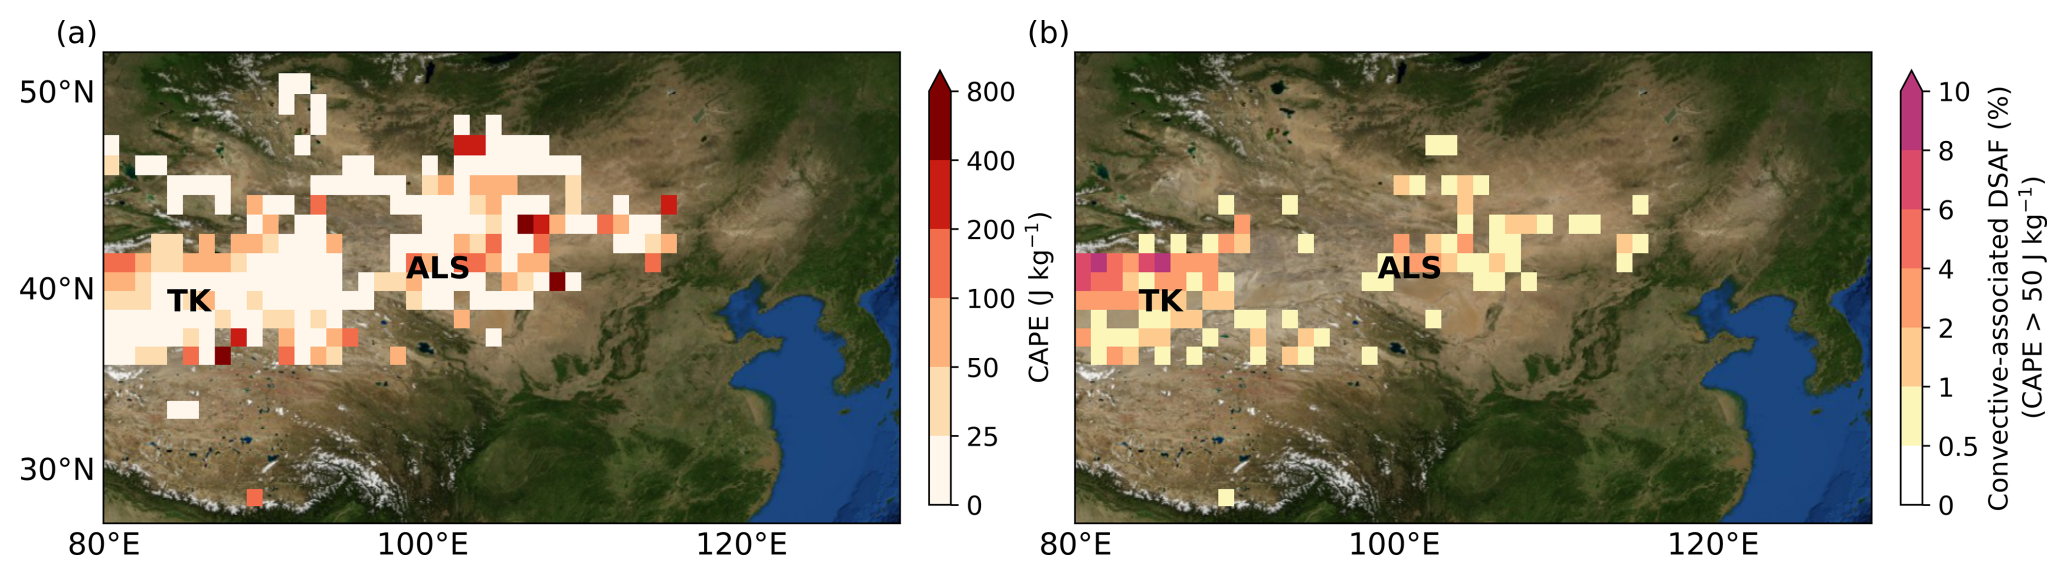
Figure 8(a) Summer (June–August) convective available potential energy (CAPE) at 12:00 LST, shown as a 9-gridcell (3° × 3°) mean centred on each 1° grid cell and averaged over days of cloud-associated summer afternoon (15:00–18:00 LST) dust source activations. (b) Convective-associated dust source activation frequency (DSAF), estimated as the percentage of summer days (June–August) with dust source activation events observed between 15:00 and 18:00 LST under cloud-associated convective conditions (CAPE at 12:00 LST > 50 J kg−1) from 2016 to 2023, normalised by the total number of summer observation days. Regions with high convective-associated DSA frequency are labelled in black, including the Alashan Plateau (ALS) and the Taklimakan Desert (TK). Basemap from NASA Blue Marble.
We identify the key atmospheric mechanisms driving dust generation across East Asia under both cloud-associated and clear-sky conditions through analysis of high-resolution spatial and temporal patterns of dust source activation and meteorological observations.
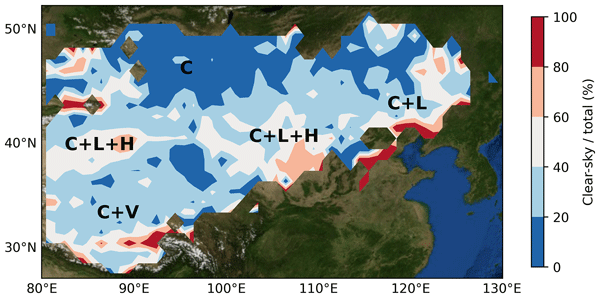
We report two primary dust source activation regions that display distinct diurnal, seasonal, and annual variations in activation frequency: a northern one and a southern one. In the northern one, centred on the Gobi Desert, the majority of DSA events occur during spring under cloud-associated conditions (> 60 % of total events, Fig. 9). Here DSA is principally induced by the passage of low-pressure systems (e.g., Mongolian cyclones). In the southern source region, both clear-sky (40 %–60 % of total events, Fig. 9) and cloud-associated DSAs occur. While cyclones contribute to the cloud-associated activation particularly during spring there, we attribute the clear-sky late-morning DSA events primarily to the breakdown of the nocturnal LLJ during morning land-surface heating, whereas the summer afternoon cloud-associated DSA events can be attributed to haboobs. We also report a third, less active, dust source region on the Tibetan Plateau. In its northeastern part, most events are cloud-associated activations (> 60 % of total events, Fig. 9) and most likely driven by synoptic winds, whereas its south-central part exhibits a mixture of cloud-associated and clear-sky activations (> 60 % of total events, Fig. 9), with the clear-sky activations likely driven by strong afternoon mountain-valley winds. It should be emphasised that the percentage of clear-sky DSA events relative to total events does not represent the true physical proportion of the underlying atmospheric forcing mechanisms. The LLJ, synoptic winds, and haboobs discussed here might overlap as interacting processes that collectively favour dust source activation across East Asia. Instead, Fig. 9 provides a diagnostic indication of their relative importance.
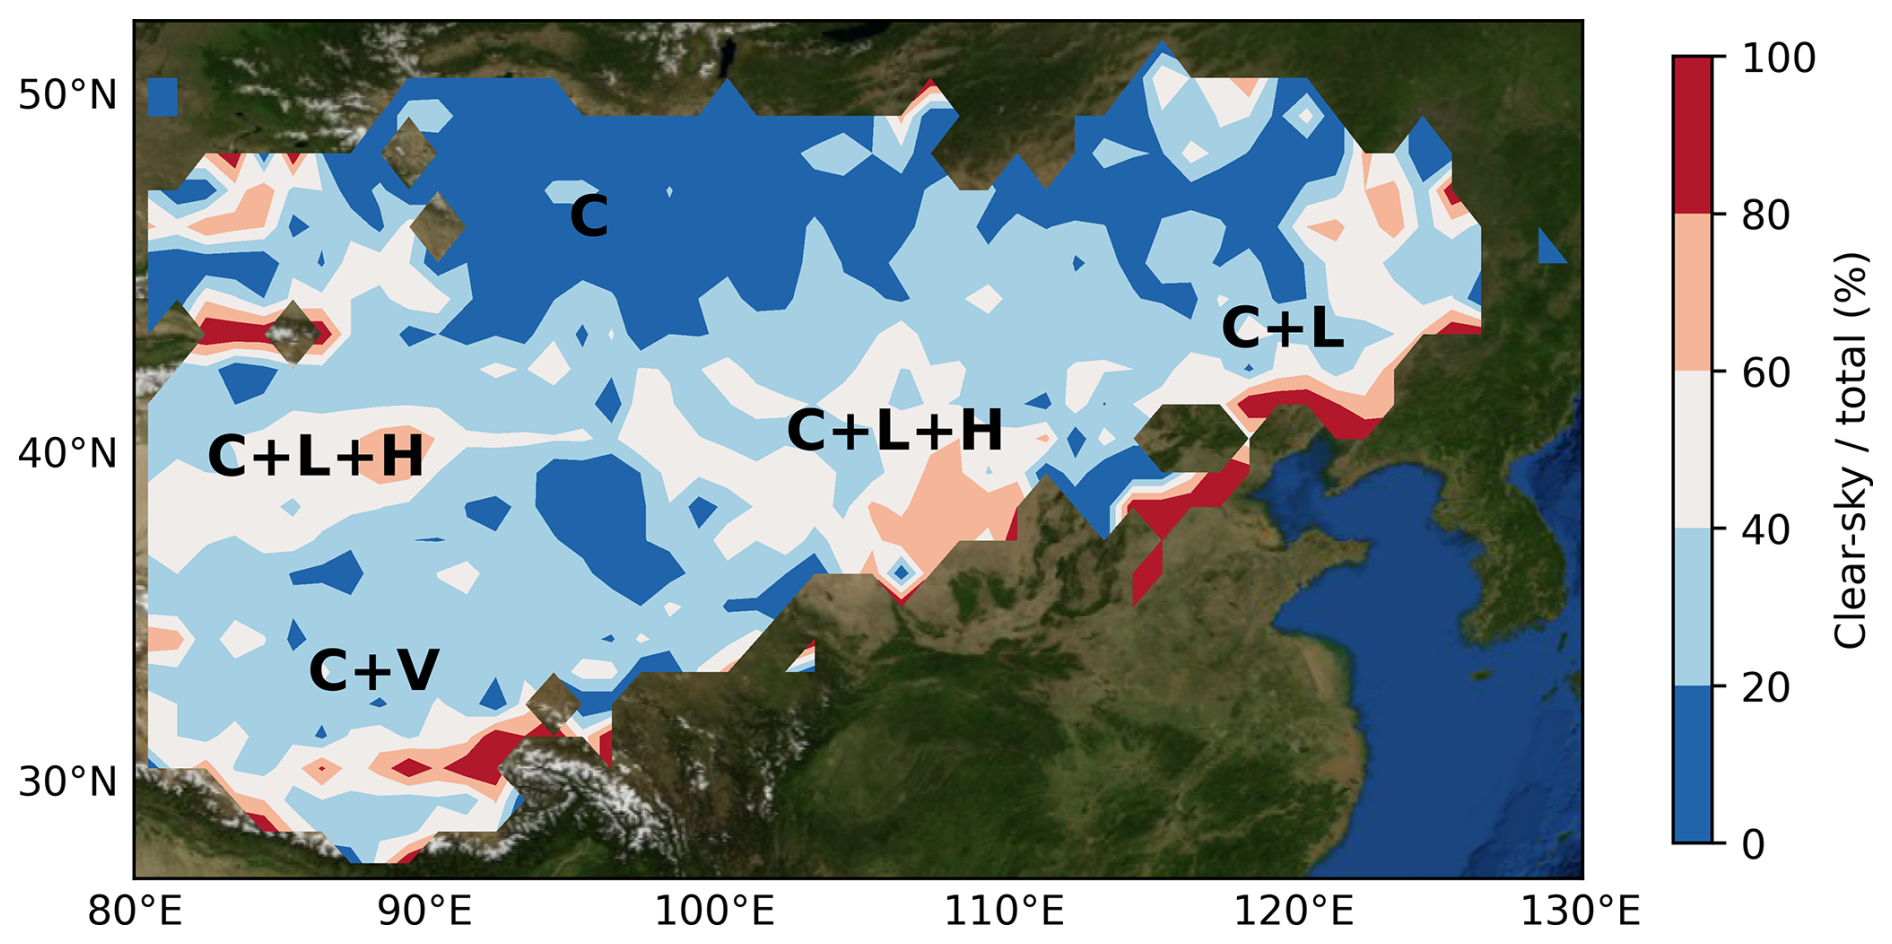
Figure 9Spatial distribution of the proportion of clear-sky dust source activation events relative to total (clear-sky + cloud-associated) dust source activations across East Asia. Clear-sky activations primarily reflect the influence of the low-level jet (LLJ) and mountain–valley winds, whereas cloud-associated activations reflect the influence of cyclones and haboobs. Identified dominant meteorological forcings are labelled in black: cyclones (C), low-level jet (L), haboobs (H), and mountain–valley winds (V). Basemap from NASA Blue Marble.
Our methodology overcomes the longstanding issue of atmospheric transport bias in satellite data sets by precisely identifying times and locations of dust activation events, enabling mechanistic assessments of atmospheric forcings on dust source activations near the land surface. It does not, however, quantify the mineral dust load associated with the resulting plume or its downwind propagation but overcoming those limitations, are obvious next steps.
Current dust models struggle to reproduce historical changes in atmospheric dust loadings, in part, because of the reliance on empirical dust source functions used to parameterize dust emissions (Kok et al., 2023). The effects of meso- and local-scale winds on dust emissions are underrepresented in many climate models, with existing studies focusing on the Sahara, leaving East Asia comparatively overlooked (Fiedler et al., 2015; Marsham et al., 2008; Tegen et al., 2013). Our findings show that meso- and local-scale mechanisms (e.g., the LLJ, convection and mountain-valley winds) exert a greater spatial influence on dust source activation in East Asia than previously documented. Regional climate model simulations reveal that LLJ activity tends to strengthen and shift geographically in response to global warming in hot spot regions such as West Africa but the long-term trends in East Asia remain understudied (Torres-Alavez et al., 2021). Our study provides valuable context to efforts aiming to improve predictions of dust activity in East Asia under future warming (Luiz and Fiedler, 2024), as well as for interpreting paleoclimate records of dust cycling across multiple geological timescales.
The Himawari-8/9 data were obtained from the P-Tree System, operated by the Japan Aerospace Exploration Agency (JAXA) (https://www.eorc.jaxa.jp/ptree/, last access: 20 May 2026). The ECMWF ERA5 climate reanalysis data were obtained through the Copernicus Climate Change Service Climate Data Store (https://cds.climate.copernicus.eu/datasets/, last access: 20 May 2026). The supplementary dataset supporting the findings of this study is available at Zenodo (https://doi.org/10.5281/zenodo.17527052, Chen, 2026).
The supplement related to this article is available online at https://doi.org/10.5194/acp-26-7523-2026-supplement.
LC led the study with input from all coauthors. LC conducted the analysis, visualised the results and wrote the manuscript. KZ contributed to the relabelling of the dust RGB imagery. KS supported the statistical analysis. PW and KS reviewed and edited the manuscript. CX and AC contributed to manuscript writing. PW, KS, CX and AC supervised the entire study.
The contact author has declared that none of the authors has any competing interests.
Publisher's note: Copernicus Publications remains neutral with regard to jurisdictional claims made in the text, published maps, institutional affiliations, or any other geographical representation in this paper. The authors bear the ultimate responsibility for providing appropriate place names. Views expressed in the text are those of the authors and do not necessarily reflect the views of the publisher.
The Himawari L1 Gridded data (produced from Himawari-8/9) used in this paper was supplied by the P-Tree System, Japan Aerospace Exploration Agency (JAXA). The authors acknowledge the AERONET team and the principal investigator (PI) at the site for their contributions to the measurements and data processing.
This work was supported by the Natural Environment Research Council (studentship NE/S007210/1 to LC through INSPIRE Doctoral Training Programme).
This paper was edited by Xavier Querol and reviewed by Yan Yu and two anonymous referees.
Aoki, I., Kurosaki, Y., Osada, R., Sato, T., and Kimura, F.: Dust storms generated by mesoscale cold fronts in the Tarim Basin, Northwest China, Geophys. Res. Lett., 32, https://doi.org/10.1029/2004gl021776, 2005.
Chen, L.: Atmospheric Forcing of Dust Source Activation across East Asia – Supplementary Table, Zenodo [data set], https://doi.org/10.5281/zenodo.17527052, 2026.
Chen, L., Schepanski, K., Crocker, A. J., Xuan, C., and Wilson, P. A.: Dust source activation frequency across East Asia, Environ. Res. Lett., 20, 074056, https://doi.org/10.1088/1748-9326/addee6, 2025.
Chen, S. H., McDowell, B., Huang, C. C., and Nathan, T. R.: Formation of a low-level barrier jet and its modulation by dust radiative forcing over the Hexi Corridor in Central China on March 17, 2010, Q. J. Roy. Meteor. Soc., 147, 1873–1891, https://doi.org/10.1002/qj.4000, 2021.
Chen, Y., Chen, S., Zhou, J., Zhao, D., Bi, H., Zhang, Y., Alam, K., Yu, H., Yang, Y., and Chen, J.: A super dust storm enhanced by radiative feedback, npj Climate and Atmospheric Science, 6, https://doi.org/10.1038/s41612-023-00418-y, 2023.
Clements, M. and Washington, R.: Atmospheric Controls on Mineral Dust Emission From the Etosha Pan, Namibia: Observations From the CLARIFY-2016 Field Campaign, J. Geophys. Res.-Atmos., 126, https://doi.org/10.1029/2021jd034746, 2021.
Ding, R., Li, J., Wang, S., and Ren, F.: Decadal change of the spring dust storm in northwest China and the associated atmospheric circulation, Geophys. Res. Lett., 32, https://doi.org/10.1029/2004gl021561, 2005.
Feng, X., Mao, R., Gong, D.-Y., Wu, G., Shi, C., Liang, G., and Wang, Y.: Two Typical Synoptic-Scale Weather Patterns of Dust Events over the Tibetan Plateau, Asia-Pac. J. Atmos. Sci., 59, 403–416, https://doi.org/10.1007/s13143-023-00325-5, 2023.
Fiedler, S., Schepanski, K., Heinold, B., Knippertz, P., and Tegen, I.: Climatology of nocturnal low-level jets over North Africa and implications for modeling mineral dust emission, J. Geophys. Res.-Atmos., 118, 6100–6121, https://doi.org/10.1002/jgrd.50394, 2013.
Fiedler, S., Knippertz, P., Woodward, S., Martin, G. M., Bellouin, N., Ross, A. N., Heinold, B., Schepanski, K., Birch, C. E., and Tegen, I.: A process-based evaluation of dust-emitting winds in the CMIP5 simulation of HadGEM2-ES, Clim. Dynam., 46, 1107–1130, https://doi.org/10.1007/s00382-015-2635-9, 2015.
Ge, J. M., Liu, H., Huang, J., and Fu, Q.: Taklimakan Desert nocturnal low-level jet: climatology and dust activity, Atmos. Chem. Phys., 16, 7773–7783, https://doi.org/10.5194/acp-16-7773-2016, 2016.
Ginoux, P., Prospero, J. M., Torres, O., and Chin, M.: Long-term simulation of global dust distribution with the GOCART model: correlation with North Atlantic Oscillation, Environ. Modell. Softw., 19, 113–128, https://doi.org/10.1016/S1364-8152(03)00114-2, 2004.
Gu, Z., He, Y., Zhang, Y., Su, J., Zhang, R., Yu, C. W., and Zhang, D.: An overview of triggering mechanisms and characteristics of local strong sandstorms in China and haboobs, Atmosphere, 12, 752, https://doi.org/10.3390/atmos12060752, 2021.
Han, Y., Fang, X., Kang, S., Wang, H., and Kang, F.: Shifts of dust source regions over central Asia and the Tibetan Plateau: Connections with the Arctic oscillation and the westerly jet, Atmos. Environ., 42, 2358–2368, https://doi.org/10.1016/j.atmosenv.2007.12.025, 2008.
Han, Y., Wang, K., Liu, F., Zhao, T., Yin, Y., Duan, J., and Luan, Z.: The contribution of dust devils and dusty plumes to the aerosol budget in western China, Atmos. Environ., 126, 21–27, https://doi.org/10.1016/j.atmosenv.2015.11.025, 2016.
Han, Z., Ge, J., Chen, X., Hu, X., Yang, X., and Du, J.: Dust Activities Induced by Nocturnal Low-Level Jet Over the Taklimakan Desert From WRF-Chem Simulation, J. Geophys. Res.-Atmos., 127, https://doi.org/10.1029/2021jd036114, 2022.
Heinold, B., Knippertz, P., Marsham, J., Fiedler, S., Dixon, N., Schepanski, K., Laurent, B., and Tegen, I.: The role of deep convection and nocturnal low-level jets for dust emission in summertime West Africa: Estimates from convection-permitting simulations, J. Geophys. Res.-Atmos., 118, 4385–4400, https://doi.org/10.1002/jgrd.50402, 2013.
Hennen, M., White, K., and Shahgedanova, M.: An Assessment of SEVIRI Imagery at Various Temporal Resolutions and the Effect on Accurate Dust Emission Mapping, Remote Sens., 11, 918, https://doi.org/10.3390/rs11080918, 2019.
Herman, J. R., Bhartia, P. K., Torres, O., Hsu, C., Seftor, C., and Celarier, E.: Global distribution of UV-absorbing aerosols from Nimbus 7/TOMS data, J. Geophys. Res.-Atmos., 102, 16911–16922, https://doi.org/10.1029/96jd03680, 1997.
Hersbach, H., Bell, B., Berrisford, P., Hirahara, S., Horányi, A., Muñoz-Sabater, J., Nicolas, J., Peubey, C., Radu, R., Schepers, D., Simmons, A., Soci, C., Abdalla, S., Abellan, X., Balsamo, G., Bechtold, P., Biavati, G., Bidlot, J., Bonavita, M., De Chiara, G., Dahlgren, P., Dee, D., Diamantakis, M., Dragani, R., Flemming, J., Forbes, R., Fuentes, M., Geer, A., Haimberger, L., Healy, S., Hogan, R. J., Hólm, E., Janisková, M., Keeley, S., Laloyaux, P., Lopez, P., Lupu, C., Radnoti, G., de Rosnay, P., Rozum, I., Vamborg, F., Villaume, S., and Thépaut, J. N.: The ERA5 global reanalysis, Q. J. Roy. Meteor. Soc., 146, 1999–2049, https://doi.org/10.1002/qj.3803, 2020.
Jickells, T., An, Z., Baker, A., Bergametti, G., Cao, J., Boyd, P., Duce, R., and Hunter, K.: Global iron connections between desert dust, ocean biogeochemistry, and climate, Science, 308, 67–71, https://doi.org/10.1126/science.1105959, 2005.
Kohfeld, K. E. and Harrison, S. P.: DIRTMAP: the geological record of dust, Earth-Sci. Rev., 54, 81–114, https://doi.org/10.1016/S0012-8252(01)00042-3, 2001.
Kok, J. F., Adebiyi, A. A., Albani, S., Balkanski, Y., Checa-Garcia, R., Chin, M., Colarco, P. R., Hamilton, D. S., Huang, Y., Ito, A., Klose, M., Li, L., Mahowald, N. M., Miller, R. L., Obiso, V., Pérez García-Pando, C., Rocha-Lima, A., and Wan, J. S.: Contribution of the world's main dust source regions to the global cycle of desert dust, Atmos. Chem. Phys., 21, 8169–8193, https://doi.org/10.5194/acp-21-8169-2021, 2021.
Kok, J. F., Storelvmo, T., Karydis, V. A., Adebiyi, A. A., Mahowald, N. M., Evan, A. T., He, C., and Leung, D. M.: Mineral dust aerosol impacts on global climate and climate change, Nature Reviews Earth and Environment, 4, 71–86, https://doi.org/10.1038/s43017-022-00379-5), 2023.
Kraus, H., Malcher, J., and Schaller, E.: A nocturnal low level jet during PUKK, Bound.-Lay. Meteorol., 31, 187–195, https://doi.org/10.1007/BF00121177, 1985.
Kunkelova, T., Crocker, A. J., Wilson, P. A., and Schepanski, K.: Dust Source Activation Frequency in the Horn of Africa, J. Geophys. Res.-Atmos., 129, https://doi.org/10.1029/2023jd039694, 2024.
Li, J., Hao, X., Liao, H., Yue, X., Li, H., Long, X., and Li, N.: Predominant Type of Dust Storms That Influences Air Quality Over Northern China and Future Projections, Earth's Future, 10, https://doi.org/10.1029/2022ef002649, 2022.
Liu, M., Westphal, D. L., Wang, S., Shimizu, A., Sugimoto, N., Zhou, J., and Chen, Y.: A high-resolution numerical study of the Asian dust storms of April 2001, J. Geophys. Res.-Atmos., 108, https://doi.org/10.1029/2002jd003178, 2003.
Luiz, E. W. and Fiedler, S.: Global Climatology of Low-Level-Jets: Occurrence, Characteristics, and Meteorological Drivers, J. Geophys. Res.-Atmos., 129, https://doi.org/10.1029/2023jd040262, 2024.
Marsham, J. H., Parker, D. J., Grams, C. M., Johnson, B. T., Grey, W. M. F., and Ross, A. N.: Observations of mesoscale and boundary-layer scale circulations affecting dust transport and uplift over the Sahara, Atmos. Chem. Phys., 8, 6979–6993, https://doi.org/10.5194/acp-8-6979-2008, 2008.
Marticorena, B. and Bergametti, G.: Modeling the atmospheric dust cycle: 1. Design of a soil-derived dust emission scheme, J. Geophys. Res.-Atmos., 100, 16415–16430, https://doi.org/10.1029/95JD00690, 1995.
Mu, F. and Fiedler, S.: How much do atmospheric depressions and Mongolian cyclones contribute to spring dust activities in East Asia?, npj Climate and Atmospheric Science, 8, https://doi.org/10.1038/s41612-025-00929-w, 2025.
Mu, F., Luiz, E. W., and Fiedler, S.: On the dynamics and air-quality impact of the exceptional East Asian dust outbreak in mid-March 2021, Atmos. Res., 292, 106846, https://doi.org/10.1016/j.atmosres.2023.106846, 2023.
Natsagdorj, L., Jugder, D., and Chung, Y. S.: Analysis of dust storms observed in Mongolia during 1937–1999, Atmos. Environ., 37, 1401–1411, https://doi.org/10.1016/s1352-2310(02)01023-3, 2003.
Prospero, J. M., Ginoux, P., Torres, O., Nicholson, S. E., and Gill, T. E.: Environmental Characterization of Global Sources of Atmospheric Soil Dust Identified with the Nimbus 7 Total Ozone Mapping Spectrometer (Toms) Absorbing Aerosol Product, Rev. Geophys., 40, https://doi.org/10.1029/2000rg000095, 2002.
Qian, W., Quan, L., and Shi, S.: Variations of the dust storm in China and its climatic control, J. Climate, 15, 1216–1229, https://doi.org/10.1175/1520-0442(2002)015<1216:VOTDSI>2.0.CO;2, 2002.
Rife, D. L., Pinto, J. O., Monaghan, A. J., Davis, C. A., and Hannan, J. R.: Global distribution and characteristics of diurnally varying low-level jets, J. Climate, 23, 5041–5064, https://doi.org/10.1175/2010JCLI3514.1, 2010.
Roe, G.: On the interpretation of Chinese loess as a paleoclimate indicator, Quaternary Res., 71, 150–161, https://doi.org/10.1016/j.yqres.2008.09.004, 2009.
Saeedi, A. and Khoshakhlagh, F.: A composite analysis of the morning cyclone in two Asian deserts, Theor. Appl. Climatol., 137, 713–727, https://doi.org/10.1007/s00704-018-2607-1, 2018.
Schär, C., Lüthi, D., and Schiemann, R.: Seasonality and Interannual Variability of the Westerly Jet in the Tibetan Plateau Region, J. Climate, 22, 2940–2957, https://doi.org/10.1175/2008jcli2625.1, 2009.
Schepanski, K., Tegen, I., Laurent, B., Heinold, B., and Macke, A.: A new Saharan dust source activation frequency map derived from MSG-SEVIRI IR-channels, Geophys. Res. Lett., 34, L18803, https://doi.org/10.1029/2007GL030168, 2007.
Schepanski, K., Tegen, I., Todd, M. C., Heinold, B., Bönisch, G., Laurent, B., and Macke, A.: Meteorological processes forcing Saharan dust emission inferred from MSG-SEVIRI observations of subdaily dust source activation and numerical models, J. Geophys. Res.-Atmos., 114, https://doi.org/10.1029/2008jd010325, 2009.
Schepanski, K., Knippertz, P., Fiedler, S., Timouk, F., and Demarty, J.: The sensitivity of nocturnal low-level jets and near-surface winds over the Sahel to model resolution, initial conditions and boundary-layer set-up, Q. J. Roy. Meteor. Soc., 141, 1442–1456, https://doi.org/10.1002/qj.2453, 2014.
Shimizu, A.: Introduction to Himawari-8 RGB composite imagery, Meteorological Satellite Center Technical Note no. 65, https://www.data.jma.go.jp/mscweb/technotes/msctechrep65-1.pdf (last access: 20 May 2026), 2020.
Shu, H., Zhang, F., Du, Y., Wang, Y., Guo, H., Song, Z., and Zhang, Q.: Characteristics and Formation Mechanisms of Low-Level Jets in Northeastern China, Adv. Atmos. Sci., 41, 2432–2445, https://doi.org/10.1007/s00376-024-3209-8, 2024.
Song, X., Zhou, T., Wang, Y., Li, X., Wu, D., Gu, Y., Lin, Z., Abdullaev, S. F., and Amonov, M. O.: Spatiotemporal evolution of dust over Tarim Basin under continuous clear-sky, Atmos. Res., 312, 107764, https://doi.org/10.1016/j.atmosres.2024.107764, 2024.
Stöckli, R., Vermote, E., Saleous, N., Simmon, R., and Herring, D.: The Blue Marble Next Generation – A true color earth dataset including seasonal dynamics from MODIS, NASA Earth Observatory [data set], https://eoimages.gsfc.nasa.gov/images/imagerecords/74000/74218/readme.pdf (last assess: 20 May 2026), 2005.
Sun, J. and Zhao, L.: Numerical simulation of two East Asian dust storms in spring 2006, Earth Surf. Proc. Land., 33, 1892–1911, https://doi.org/10.1002/esp.1734, 2008.
Sun, J., Zhang, M., and Liu, T.: Spatial and temporal characteristics of dust storms in China and its surrounding regions, 1960–1999: Relations to source area and climate, J. Geophys. Res.-Atmos., 106, 10325–10333, https://doi.org/10.1029/2000jd900665, 2001.
Su, L., Lu, C., Yuan, J., Wang, X., He, Q., and Xia, H.: Measurement report: The promotion of the low-level jet and thermal effects on the development of the deep convective boundary layer at the southern edge of the Taklimakan Desert, Atmos. Chem. Phys., 24, 10947–10963, https://doi.org/10.5194/acp-24-10947-2024, 2024.
Swap, R., Garstang, M., Greco, S., Talbot, R., and Kallberg, P.: Saharan dust in the Amazon Basin, Tellus B, 44, 133–149, https://doi.org/10.1034/j.1600-0889.1992.t01-1-00005.x, 1992.
Takemi, T. and Seino, N.: Dust storms and cyclone tracks over the arid regions in east Asia in spring, J. Geophys. Res.-Atmos., 110, https://doi.org/10.1029/2004jd004698, 2005.
Tegen, I., Schepanski, K., and Heinold, B.: Comparing two years of Saharan dust source activation obtained by regional modelling and satellite observations, Atmos. Chem. Phys., 13, 2381–2390, https://doi.org/10.5194/acp-13-2381-2013, 2013.
Tindan, J. Z., Jin, Q., and Pu, B.: Understanding day–night differences in dust aerosols over the dust belt of North Africa, the Middle East, and Asia, Atmos. Chem. Phys., 23, 5435–5466, https://doi.org/10.5194/acp-23-5435-2023, 2023.
Torres-Alavez, J. A., Das, S., Corrales-Suastegui, A., Coppola, E., Giorgi, F., Raffaele, F., Bukovsky, M. S., Ashfaq, M., Salinas, J. A., and Sines, T.: Future projections in the climatology of global low-level jets from CORDEX-CORE simulations, Clim. Dynam., 57, 1551–1569, https://doi.org/10.1007/s00382-021-05671-6, 2021.
Wilks, D. S.: Statistical methods in the atmospheric sciences, Academic Press, ISBN 978-0-12-385022-5, 2011.
Yan, Y., Cai, X., Wang, X., Miao, Y., and Song, Y.: Low-Level Jet Climatology of China Derived From Long-Term Radiosonde Observations, J. Geophys. Res.-Atmos., 126, https://doi.org/10.1029/2021jd035323, 2021.
Yao, Z., Li, X., and Xiao, J.: Characteristics of daily extreme wind gusts on the Qinghai-Tibet Plateau, China, J. Arid Land, 10, 673–685, https://doi.org/10.1007/s40333-018-0094-y, 2018.
Yu, Y., Kalashnikova, O. V., Garay, M. J., Lee, H., Choi, M., Okin, G. S., Yorks, J. E., Campbell, J. R., and Marquis, J.: A global analysis of diurnal variability in dust and dust mixture using CATS observations, Atmos. Chem. Phys., 21, 1427–1447, https://doi.org/10.5194/acp-21-1427-2021, 2021.
Zhang, G., Zhang, D.-L., and Sun, S.: On the Orographically Generated Low-Level Easterly Jet and Severe Downslope Storms of March 2006 over the Tacheng Basin of Northwest China, Mon. Weather Rev., 146, 1667–1683, https://doi.org/10.1175/mwr-d-17-0355.1, 2018.
Zhang, Y., Ding, Y., and Li, Q.: A climatology of extratropical cyclones over East Asia during 1958–2001, Acta Meteorol. Sin., 26, 261–277, https://doi.org/10.1007/s13351-012-0301-2, 2012.
Zhao, L. and Zhao, S.: Diagnosis and simulation of a rapidly developing cyclone related to a severe dust storm in East Asia, Global Planet. Change, 52, 105–120, https://doi.org/10.1016/j.gloplacha.2006.02.003, 2006.
Zhao, T., Gong, S., Zhang, X., Blanchet, J.-P., McKendry, I., and Zhou, Z.: A simulated climatology of Asian dust aerosol and its trans-Pacific transport. Part I: Mean climate and validation, J. Climate, 19, 88–103, https://doi.org/10.1175/JCLI3605.1, 2006.
Zhou, X., Zhang, C., Li, Y., and Zhang, Z.: Comparison of Spring Wind Gusts in the Eastern Part of the Tibetan Plateau and along the Coast: The Role of Turbulence, Remote Sens., 15, 3655, https://doi.org/10.3390/rs15143655, 2023.
Zhu, R., Sun, C., and Yan, Y.: Formation mechanism and development potential of wind energy resources on the Tibetan plateau, Renew. Energ., 227, 120527, https://doi.org/10.1016/j.renene.2024.120527, 2024.