
the Creative Commons Attribution 4.0 License.
the Creative Commons Attribution 4.0 License.
 | 29 May 2026
Exploring the mechanisms of dust emission and transport based on observations and GEOS-Chem simulations
Peili Zou
Rong Tian
Jianqi Zhao
Tong Yang
Yingying Ku
Dust aerosols play a significant role in climate and air quality, yet understanding of their emission and long-range transport mechanisms remains incomplete. By looking into a severe dust event occurred in northern China on April 2025, and conducting the comparative analysis against a 30-year climatic average and the historical dust events using multi-source observations and the GEOS-Chem model simulations, we systematically investigate its meteorological conditions, emission mechanisms, and transport processes. Results show that the dust event in April was originated in the western Inner Mongolia (WIM) source region, accompanied by wind speeds exceeding 8 m s−1 and hourly PM10 concentrations above 1900 µg m−3, and affected the southern China including Yangtze River Basin and Hainan Province. Under the influence of the Siberian high-pressure system and the Mongolian cyclone, the WIM experienced persistent dry-cold advection (relative humidity around 20 %, wind speeds exceeding 10 m s−1). Three months preceding the dust event, the WIM exhibited significantly high temperatures ( °C), reduced precipitation ( mm) and low volumetric soil water ( m3 m−3). Comparison with two other severe historical dust events in year 2021 and 2023, demonstrating that long-range transport in 2025 was primarily due to strong northerly winds that effectively guided southward transport of dust aerosols, which was mainly due to the sustained interaction between an intense Siberian High and a Mongolian cyclone, coupled with the southerly position of the cyclone. Furthermore, the dust in 2025 consistently moved southward but generally behind the rainband, which imply relatively low wet scavenging and thereby enabling stable long-range transport. The study confirms that persistent drought and strong winds triggered intense dust emission, and airflow transport under specific synoptic conditions dominated the long-range dust transport.
- Article
(16242 KB) - Full-text XML
-
Supplement
(2870 KB) - BibTeX
- EndNote


Dust aerosols, which commonly originate from arid and semi-arid regions, significantly reduce visibility (Seinfeld et al., 2004), directly threat socioeconomic activities and public health (Griffin Griffin and Kellogg, 2004; Miri and Middleton, 2022), alter regional climate through radiative effects (Twomey, 1977; Seinfeld et al., 2004), and by acting as ice nuclei modulate cloud microphysical processes and precipitation (Huang et al., 2006, 2014; Wang et al., 2010, 2015). Furthermore, dust-carried nutrients and pollutants can affect marine ecosystems, soil fertility, and vegetation growth, triggering complex ecological responses (Griffin et al., 2004; Wang et al., 2006; Gao et al., 2009; Gassó et al., 2010; Field et al., 2010). Observational studies indicate that dust aerosols emitted from East Asia can undergo long-range transport to Eastern China (Tan et al., 2012), Japan (Iwasaka et al., 1983), South Korea (Kim, 2008), and even North America (Guo et al., 2017), exerting multifaceted impacts on the climate, environment, and economy of these regions. The Inner Mongolia Autonomous Region of China is one of the most important dust source regions in East Asia (Zhang et al., 2003; Tan et al., 2017). The underlying surface in its western part is primarily desert, while the central part is mainly grassland, providing favorable underlying surface conditions for the occurrence of dust events. Previous studies have indicated that on longer time scales, the frequency of dust events in the Inner Mongolia region is primarily correlated with soil moisture and vegetation changes (Lee and Sohn, 2011; Munkhtsetseg et al., 2016; An et al., 2018; Bao et al., 2021). The occurrence of dust weather normally relates to unstable atmosphere (Idso, 1976; Knippertz and Fink, 2006; Shao et al., 2020) and soil condition in dust source regions (Sun et al., 2001; Tegen et al., 2002). Most dust storms in the Inner Mongolia Autonomous Region occur mainly in spring, due to low vegetation coverage, scarce spring precipitation, and the influence of Mongolian cyclones (Gao et al., 2009; Liu and Liu, 2015; Borjigin et al., 2024), since strong winds associated with intense Mongolian cyclones create favorable dynamic conditions for the initiation and development of dust events (Takemi and Seino, 2005; An et al., 2018; Liu et al., 2024), and low vegetation coverage combined with minimal rainfall leads to dry and loose surface soil, providing ample material for dust emission.
The horizontal and vertical of dust transport depend on the meteorological conditions over the source region and the synoptic features in the downwind areas (McKendry et al., 2001), as well as the associated dry and wet deposition processes (Tsai et al., 2008; Liu et al., 2009; Fu et al., 2014; Chen et al., 2017). In dust source regions, the vertical transport of dust aerosols is primarily associated with turbulence and convection (Wang, and Chamecki, 2018). Brief bursts of turbulence facilitate the initial entrainment of dust into the atmosphere to become dust aerosols, while sustained turbulence promotes their vertical transport (Zhang et al., 2022). In the Asian Pacific Regional Aerosol Characterization Experiment (ACE-Asia), dust aerosols are typically lifted to approximately 3 km above the source region (Tsai et al., 2008). Under certain weather conditions, strong upward currents further elevate dust aerosols, thereby facilitating their long-range transport (Tsai et al., 2008). Long-range dust transport from Inner Mongolia relies on the dynamic forcing of northwesterly airflows. Previous studies indicated that under the influence of the Mongolian cyclone, northwesterly flows in the rear of upper-level troughs guide the dust aerosols from Mongolia and Inner Mongolia toward lower latitudes (Liu et al., 2009). Park et al. (2010) found dry deposition was approximately ten times greater than wet deposition near the source area, whereas wet deposition accounted for over 50 % of the total in most downstream marine areas. Xiong et al. (2020) conducted a 20-year dust simulation and confirmed a significant seasonal variability in dust aerosol deposition over East Asia, with wet deposition consistently exceeding dry deposition in all months except December and January. Liang et al. (2022) analyzed an observed dust event in the Inner Mongolia Gobi Desert in March 2021 and found that wet deposition in the downwind North China Plain was approximately twice as effective as dry deposition.
In addition, the pathway and strengthens of dust long-range transport remains uncertain. Previous studies suggested that dust aerosols originating from Inner Mongolia primarily affect the North China Plain (Wang et al., 2004). For instance, during several typical dust events in March 2021, dust aerosols from northern China and southeastern Mongolia impacted regions including North China, southern Northeast China, and the northern Huang-Huai area (Yu et al., 2023). Dust aerosols from major Asian source regions (northern China and Mongolia) can be transported to southeastern Asia and the Pacific Ocean under the influence of westerly and southwesterly winds (Husar et al., 2001; Kai and Huiwang, 2007). Moreover, under specific meteorological conditions such as intense frontal cyclones, strong westerly jets, and limited precipitation-dominated wet deposition, dust aerosols from Mongolia and Inner Mongolia can undergo long-range transport to South Korea (Park et al., 2015), and Japan (Tsedendamba et al., 2019), and even North America (Zhao et al., 2008). The dust storm event occurred in western Inner Mongolia on 11 April 2025 is one of most severe dust events in recent years, which unusually penetrated southward across the Yangtze River Basin, eventually swept southwestern China and the South China Sea, so provides a comprehensive observations and opportunity for researchers to study dust-related processes. It is noteworthy that widespread precipitation occurred in the Yangtze River Basin during the transport of dust aerosols toward South China and Hainan Island. Under normal circumstances, such precipitation would significantly reduce aerosol concentrations through wet scavenging. However, in this event, the dust maintained relatively high concentrations and was still able to achieve ultra-long-range transport to Hainan Island. The mechanism behind this phenomenon of effective southward transport under strong wet scavenging conditions warrants in-depth discussion. This study integrates multi-source observational data with model simulations based on an improved GEOS-Chem model (Tian et al., 2021) to systematically analyze the dust emission characteristics, formation mechanisms, transport pathways, and the primary causes enabling the ultra-long-range transport of this dust event.
2.1 Observational data
The hourly PM2.5 and PM10 concentration provided by the China National Environmental Monitoring Center (http://www.cnemc.cn/, last access: 23 May 2026) over 2016 monitoring stations including 54 stations in western Inner Mongolia (37–43° N, 98–112° E) (Fig. 1a), and the daily Aerosol Optical Depth (AOD) at 550 nm from MODIS (Moderate-resolution Imaging Spectroradiometer)/Aqua Level 3 Dark Target Deep Blue Combined product (MOD08_M3, Collection 6.1) with 1°×1° spatial resolution, are employed to look into the dust events during the study period.
Meteorological variables such as near-surface wind speed, temperature, pressure, humidity, and precipitation, along with soil data, are obtained from the ECMWF ERA5 hourly reanalysis dataset from 1940 (https://cds.climate.copernicus.eu/, last access: 23 May 2026), with a spatial of 0.25°×0.25° and temporal resolution of 1 h. These data are utilized to analyze the transport characteristics of dust aerosols, the synoptic conditions during dust events, and to conduct comparative analyses against both the 30-year climatological baseline and historical dust cases. Additionally, near-surface temperature and relative humidity from 2167 meteorological stations (station distribution shown in Fig. 1b) operated by the China Meteorological Administration (CMA, http://data.cma.cn/, last access: 23 May 2026), with a temporal resolution of 3 h, are used to evaluate the model performance. It is noteworthy that, due to the lack of precipitation observations from meteorological stations, ERA5 reanalysis data are used instead to assess the model's simulation of precipitation.
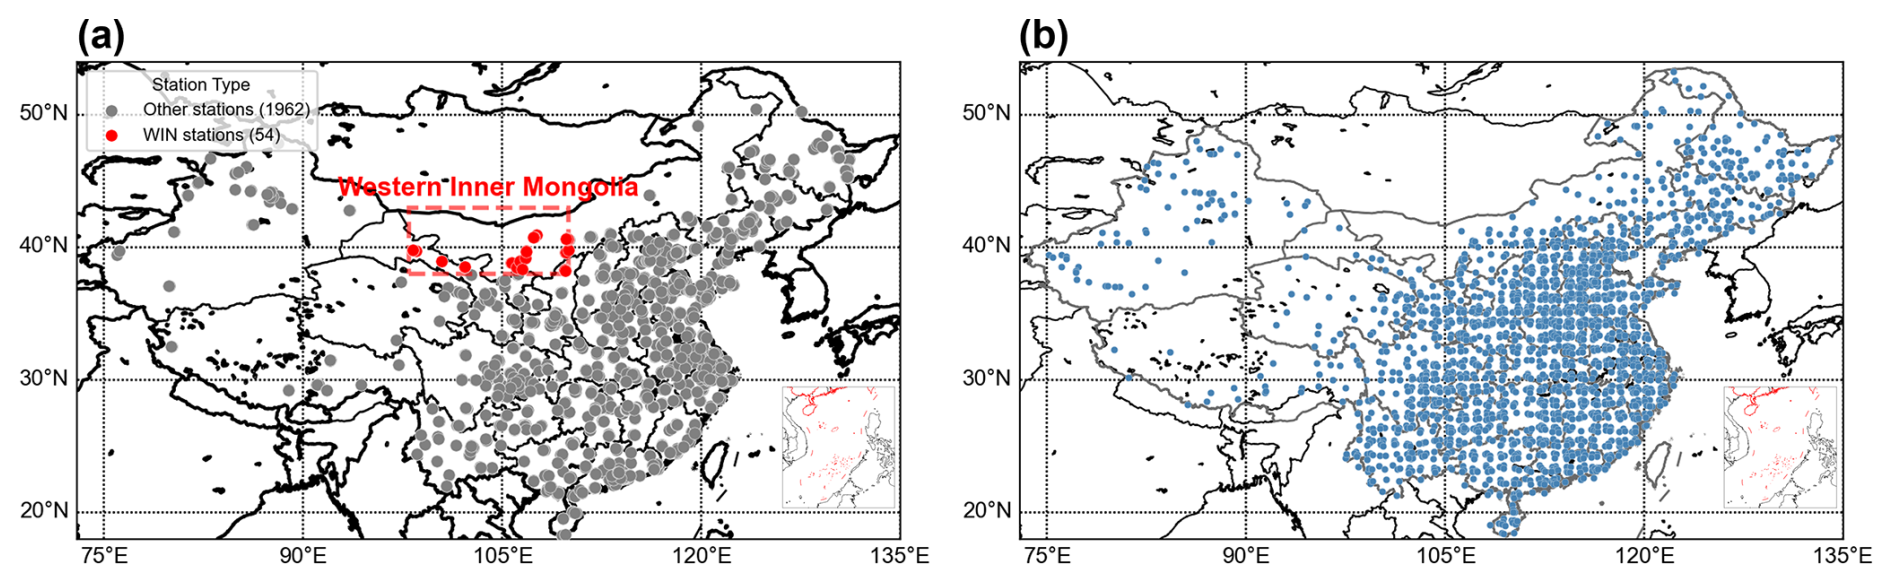
Figure 1(a) Distribution of air quality monitoring stations in China. The area within the red rectangle (38–43° N, 98–110° E) illustrates the distribution of stations in Western Inner Mongolia (WIM). Stations marked in red are located in WIM, while those in gray represent stations in other parts of China. (b) Distribution of Meteorological Stations in China. The small subplot in the lower right corner is the map of the Nine-Dash Line in the South China Sea.
2.2 Model description
The numerical simulations in this study were based on the GEOS-Chem model (https://doi.org/10.5281/zenodo.3507501, The International GEOS-Chem User Community, 2019). As a global three-dimensional atmospheric chemical transport model, GEOS-Chem possesses the capability to simulate atmospheric components from local to global scales and has been widely applied in various atmospheric composition studies.
This study used GEOS-Chem version 12.6.0, incorporating the dust emission scheme revised by Tian et al. (2021), The original dust emission scheme in GEOS-Chem is an empirical parameterization, in which the representation of many key physical quantities is highly simplified, particularly neglecting the spatiotemporal variations in surface conditions. This introduces substantial uncertainty into dust aerosol simulations. To better account for the effects of surface roughness elements and soil properties, Tian et al. (2021) replaced the originally assumed constant values with the actual spatial distributions of aerodynamic roughness length (α) and soil clay content (Mclay). Moreover, based on the global distribution of soil texture types, they improved the characterization algorithms for smooth-surface roughness length (z0s) and the sandblasting efficiency α, endowing them with clearer physical meaning. Additionally, they incorporated the Owen effect and stress partitioning into the dust emission process. Simulation results show that optimizing the stress partitioning effect and the spatial distribution of surface roughness elements can significantly improve the simulation of the threshold friction velocity (u∗t). The improved scheme not only substantially reduces the original scheme's underestimation of PM10 concentrations over China – lowering the normalized mean bias from −53 % to −22 % – but also more realistically reproduces the spatiotemporal variation characteristics of PM10 concentrations in northern China, while simultaneously improving the simulation of aerosol optical depth (AOD).
The meteorological field data used in the model were obtained from the GEOS-FP reanalysis product provided by NASA's Global Modeling and Assimilation Office. The simulation period spanned from 00:30 UTC on 8 April to 11:30 UTC on 15 April 2025. The model configuration featured a horizontal resolution of 2°×2.5°, 72 vertical layers, a global simulation domain, and an output time interval of 1 h.
During April 2025 a severe dust storm swept across the most regions of China, from the Northern China to the Southern China. As one of the most severe dust storms in recent years, this dust event provides an excellent opportunity to study the related dynamical and physical on the dust processes.
The PM10 concentration monitored at surface and AOD from satellite retrievals are used here to represent the dust mass concentrations. The spatiotemporal variations of PM10 and AOD, as well as wind fields during the dust periods are shown in Fig. 2. It is evident that on 10 April, both PM10 and AOD in China remain quite low, with PM10 concentrations below 200 µg m−3 and AOD below 0.4 in most of China. The regionally-averaged PM10, PM2.5 in the WIM region remains around 100, 20 µg m−3, and their ratio (PM2.5 to PM10) showed a downward trend over time, respectively before 10:00 BJT (Beijing Time) on 11 April, decreasing from 0.4 at 06:00 on 9 April to 0.2 at 10:00 on 11 April (Fig. 3). At 17:00 BJT on 11 April, a dust storm started to occur in WIM, accompanied by strong north winds over 8 m s−1. It is noticed that the hourly PM10 in WIM is greater than 1900 µg m−3, while the ratio of PM2.5 to PM10 dropped to approximately 0.2. The dust was rapidly transported southward, driven by strong northerly winds exceeding 10 m s−1. During the subsequent 72 h, the dust aerosols showed distinct spatiotemporal evolution, i.e. on 12 April, the dust reached the Yangtze River Basin, where the PM10 concentration exceeded 1000 µg m−3 and the ratio of PM2.5 to PM10 dropped below 0.2 (Fig. 4). Meanwhile, the AOD in WIM exceeded 2 (Fig. 2). By 13 April, the dust arrived at Hainan Island, with the PM10 concentration exceeding 300 µg m−3 (Fig. 2) and the ratio of PM2.5 to PM10 being below 0.3 (Fig. 4), marking the completion of long-range transport spanning 20° of latitude. By 14 April, the intensity of the dust had significantly weakened in the affected areas of Southeastern China, with PM10 concentration mostly dropping below 300 µg m−3, indicating the end of the dust event (Fig. 2). In summary, this dust event, which originated in the WIM region on 11 April and concluded by 14 April, significantly impacted a vast expanse of China through southward transport, affecting areas from the north and central to the southern parts of the country.
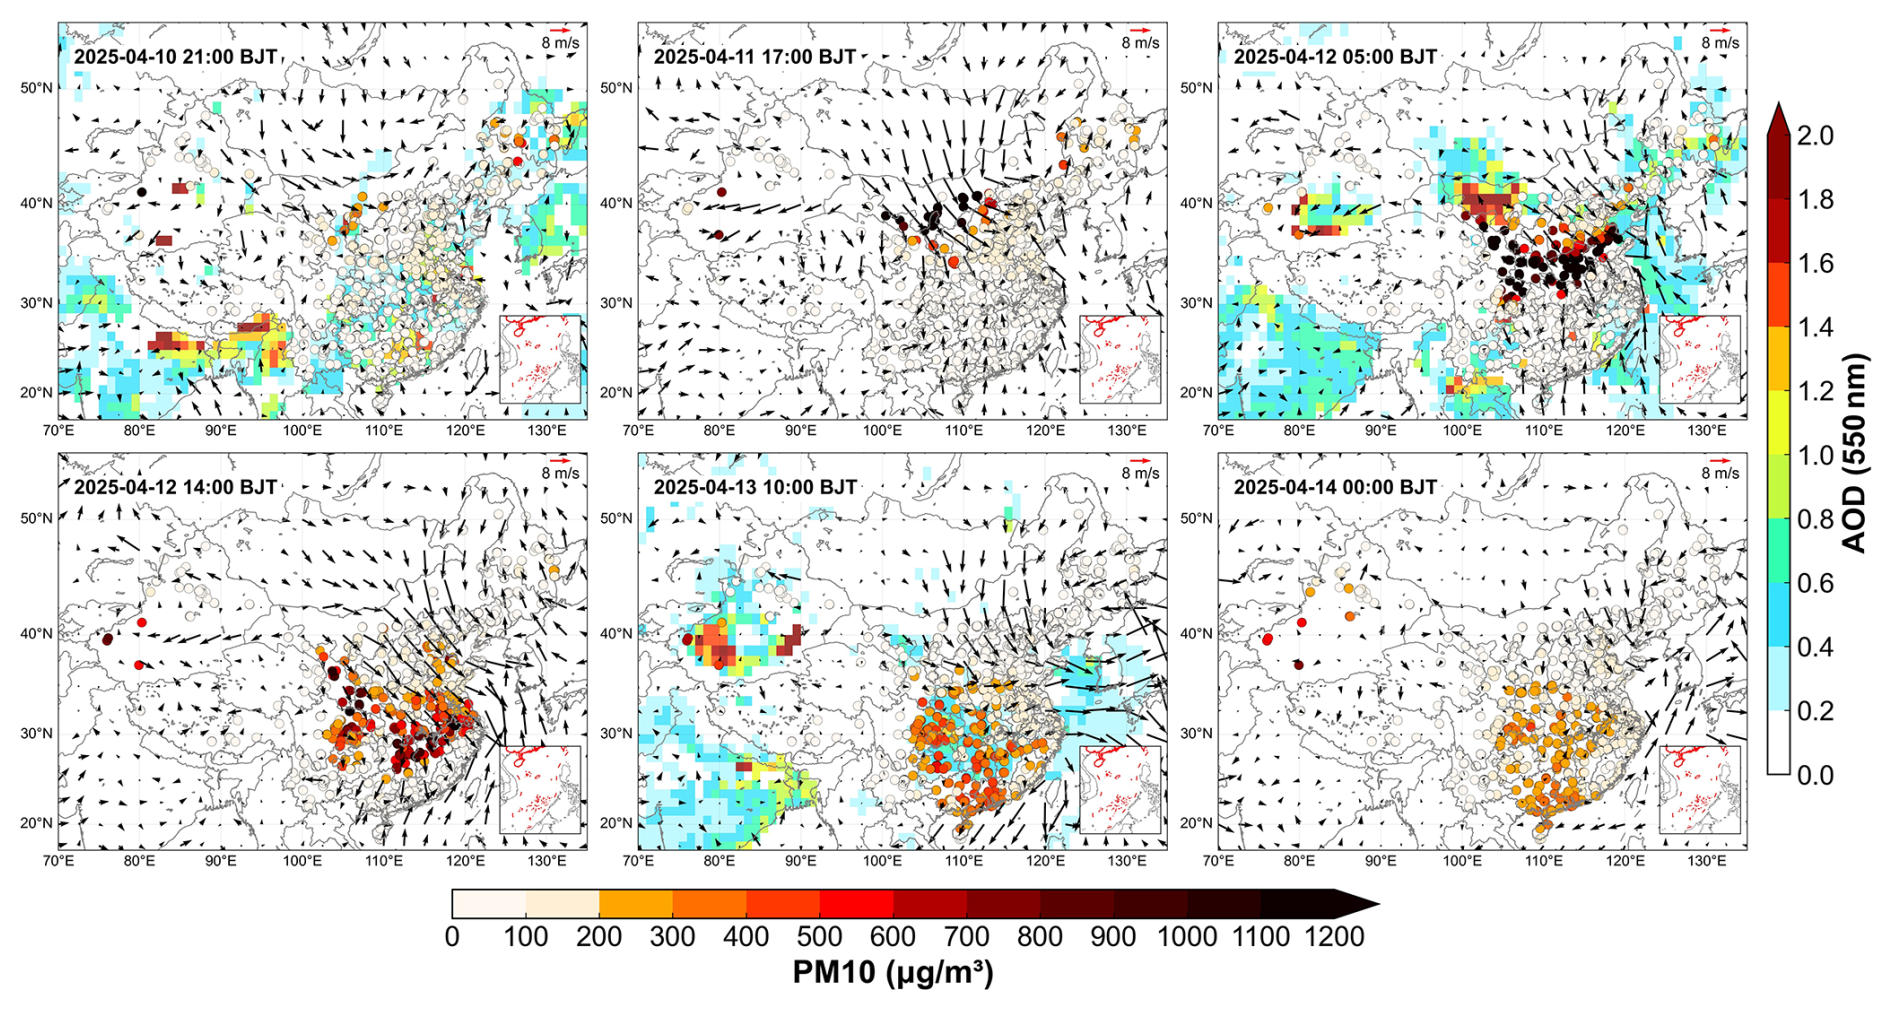
Figure 2Spatiotemporal variations of PM10 concentration (µg m−3) in China, AOD (MODIS) and surface wind fields (ERA5) over China and its surrounding areas from 10 to 14 April 2025 (BJT). The solid circles represent PM10 concentration, and the shaded plot represents AOD. The wind speed scale is located in the upper right corner of each panel, and the small subplot in the lower right corner is the map of the Nine-Dash Line in the South China Sea.
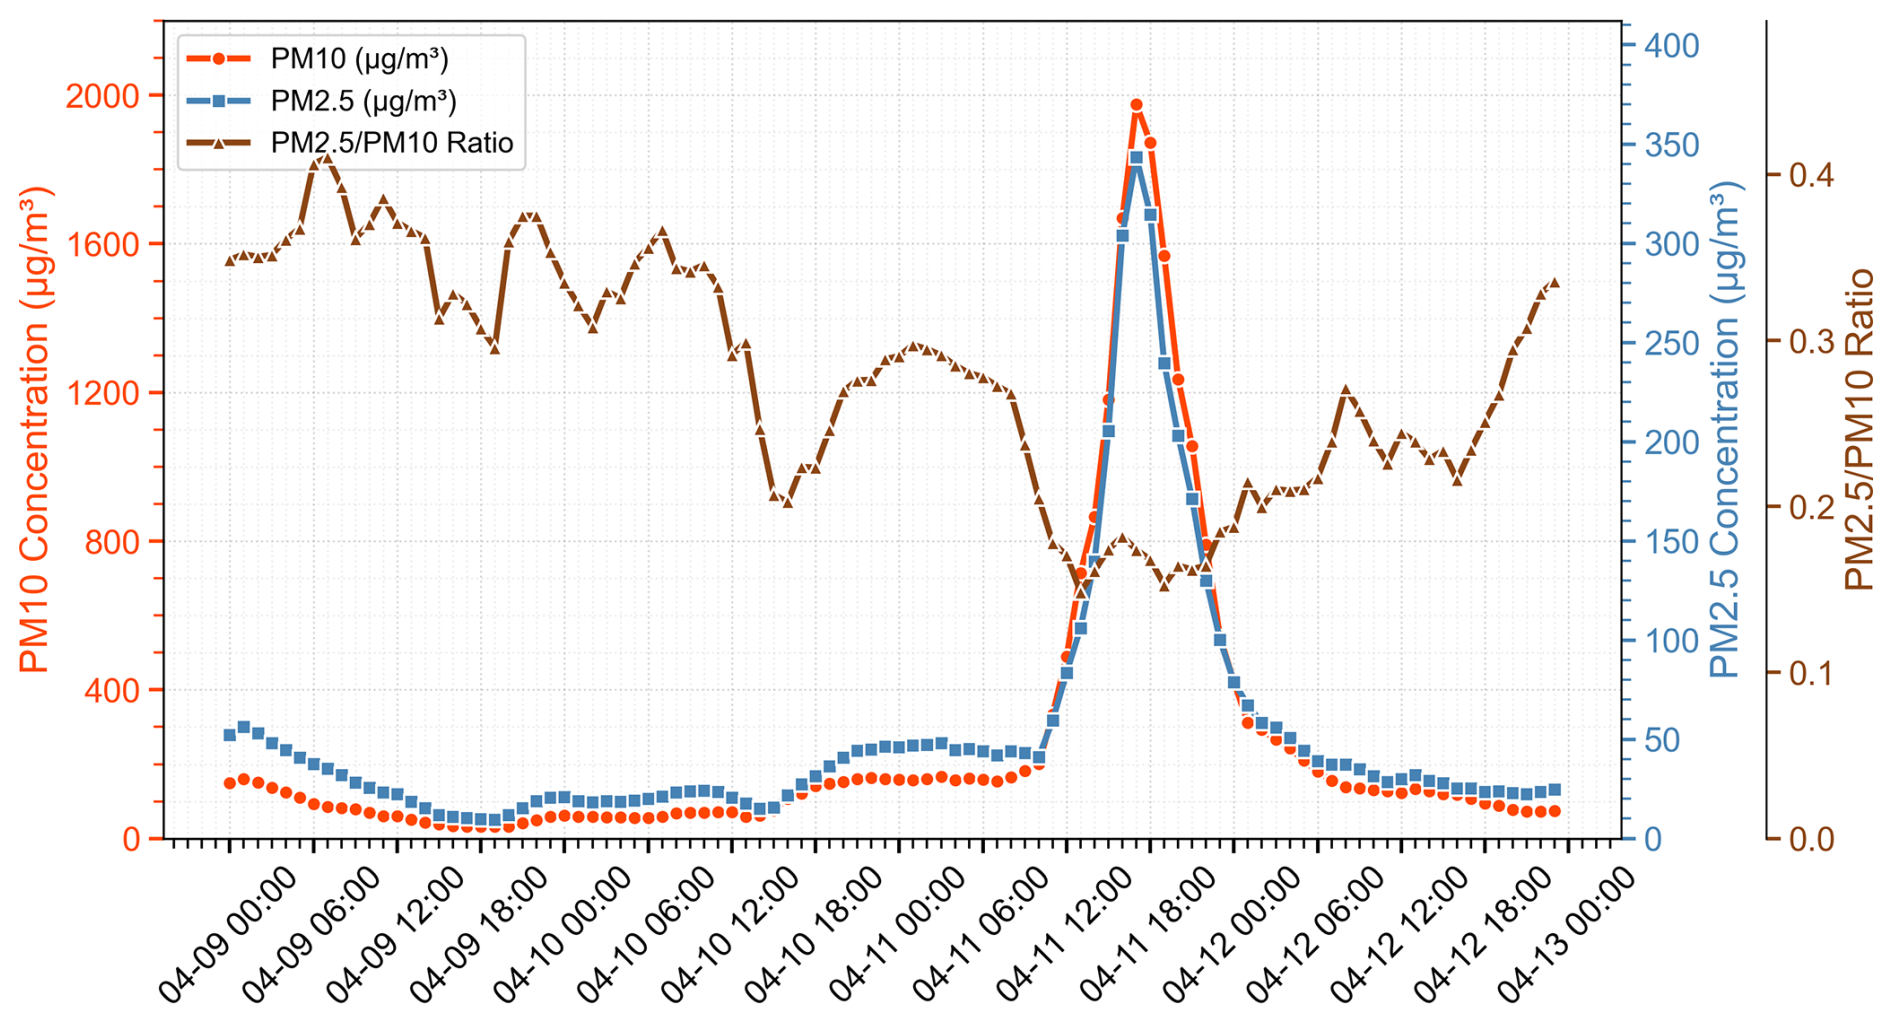
Figure 3The hourly variations of PM10, PM2.5 concentrations (µg m−3) and the PM2.5-to-PM10 ratio within the WIM region (38–43° N, 98–110° E) during the dust events from 9 to 12 April 2025 (BJT).
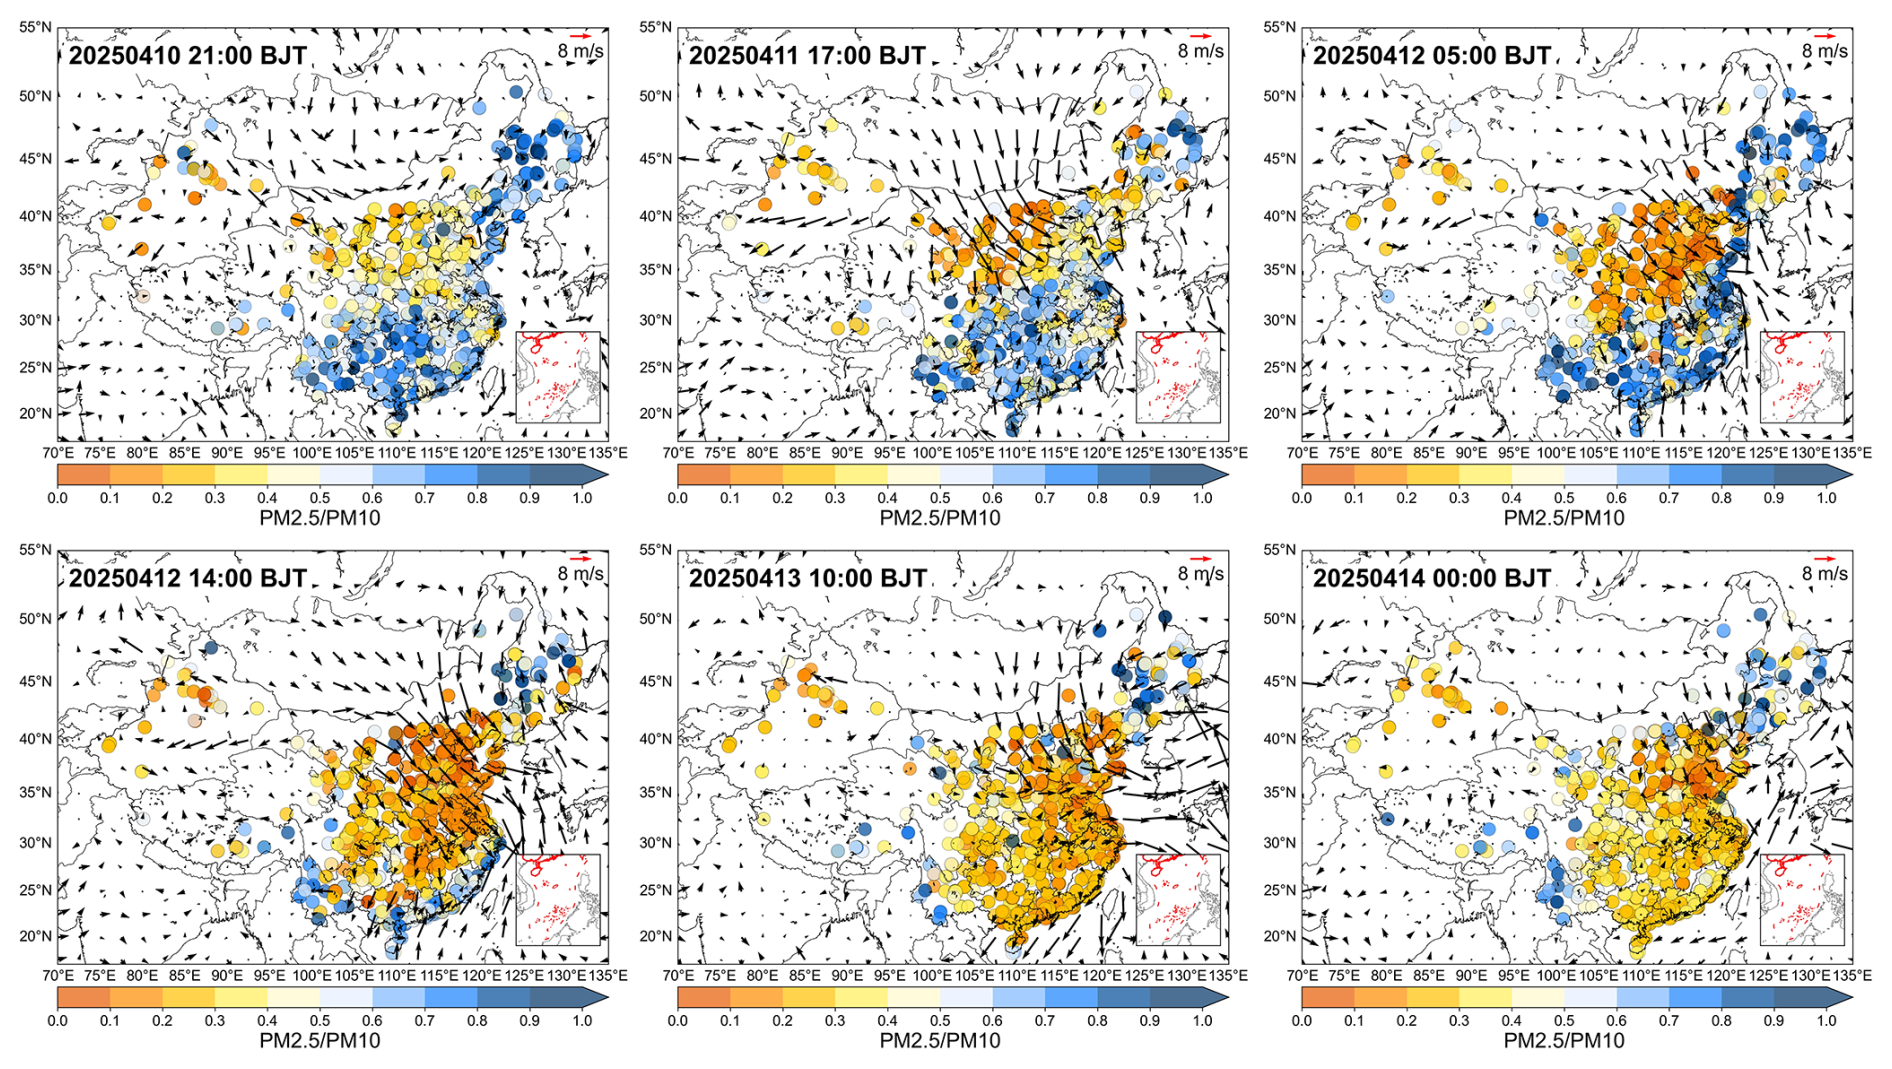
Figure 4During 10–14 April 2025 (BJT), the spatiotemporal variations of PM2.5-to-PM10 ratio and surface wind fields (ERA5) over China.
It is known that the meteorological conditions including temperature, relative humidity, and wind fields significantly influence dust emissions and transport (Chepil, 1956; Zhang et al., 2002; Ravi et al., 2004; Hussein et al., 2006; Zhu and Liu, 2024; Wang et al., 2021). Temperature and humidity affect dust emissions by modulating soil moisture, surface friability, and vegetation coverage in source regions, while strong winds provide the necessary dynamic forcing for aerosol entrainment into the atmosphere and subsequent long-range transport (Zou and Zhai, 2004; Liu et al., 2004; Xu et al., 2006; Guan et al., 2017). During transport, aerosols are primarily subject to dry and wet deposition (Bergametti and Forêt, 2014). Dry deposition removes the aerosol particles from the atmosphere and toward the surface due to gravitational settling and turbulence or diffusion (Pryor and Binkowski, 2004; Bergametti et al., 2014; Ma and von Salzen, 2006; Farmer et al., 2021). Wet deposition involves the incorporation of aerosols into hydrometeors (such as raindrops or cloud droplets), followed by their removal through precipitation (Zannetti, 1990; Pryor et al., 2004; Bergametti et al., 2014). Since turbulence intensity is often driven by thermal and mechanical energy (Roth et al., 2000; Hu et al., 2007), and droplet formation and fallout depend largely on precipitation, it is essential to consider meteorological factors when discussing aerosol transport.
4.1 Synoptic processes
Previous studies found that large-scale circulation systems such as the polar vortex and the westerly jet influence the occurrence and transport of dust by affecting the development of the Mongolian cyclone and the southward movement of cold air masses, thereby regulating the upper-level jet stream and surface wind speeds (Zhao et al., 2004; Yang et al., 2008). In East Asia, Mongolian cyclones are the primary synoptic system responsible for most spring dust events (Li et al., 2022). More than 50 % of the dust events occurring in Mongolia and northern China are solely triggered by Mongolian cyclones, while the remainder result from the combined influence of Mongolian cyclones and cold high-pressure systems (Borjigin et al., 2024).
For this dust event originating from the WIM region, particular attention should be paid to the role of the Mongolian cyclone and whether a cold Siberian high-pressure system is interacting with it. Figure 5 illustrates the evolution of synoptic conditions during the dust event from 10 to 13 April 2025. On 10 April, eastern Outer Mongolia was influenced by a low-pressure system (central pressure was approximately 996 hPa), while the Mongolian cyclone had not yet fully developed. A Siberian high-pressure system (central pressure was exceeding 1028 hPa) was located along the northwestern border of Mongolia. Inner Mongolia was dominated by dry air mass (relative humidity around 30 %) and influenced by cold northerly flow from Siberia, with westerly winds in the western region exceeding 10 m s−1. By 11 April, as the Siberian high (central pressure was exceeding 1036 hPa) moved southward to the northern border of Mongolia, the Mongolian cyclone formed over eastern Inner Mongolia with a central pressure below 996 hPa. The combined influence of these systems generated strong northerly winds exceeding 10 m s−1, transporting dry, cold air southward. Relative humidity in Inner Mongolia dropped below 30 %, with temperatures approaching 0 °C. On 12 April, the Mongolian cyclone migrated into northeastern China and intensified (central pressure near 996 hPa), while the Siberian high continued moving southward and weakened, with its central pressure dropping below 1030 hPa. Strong northerly winds persisted over Inner Mongolia and extended to the Yangtze River Basin, facilitating the southward transport of dry, cold air. The low-humidity center shifted to central China (relative humidity around 20 %), and temperature in Inner Mongolia fell below 0 °C. By 13 April, the Mongolian cyclone further intensified, exhibiting a central pressure below 988 hPa. This development resulted in strong northeasterly winds dominating the southeastern coastal regions, which efficiently transported the dry, cold air mass from central China toward the South China Sea, causing relative humidity in southern China to decrease to 40 %.
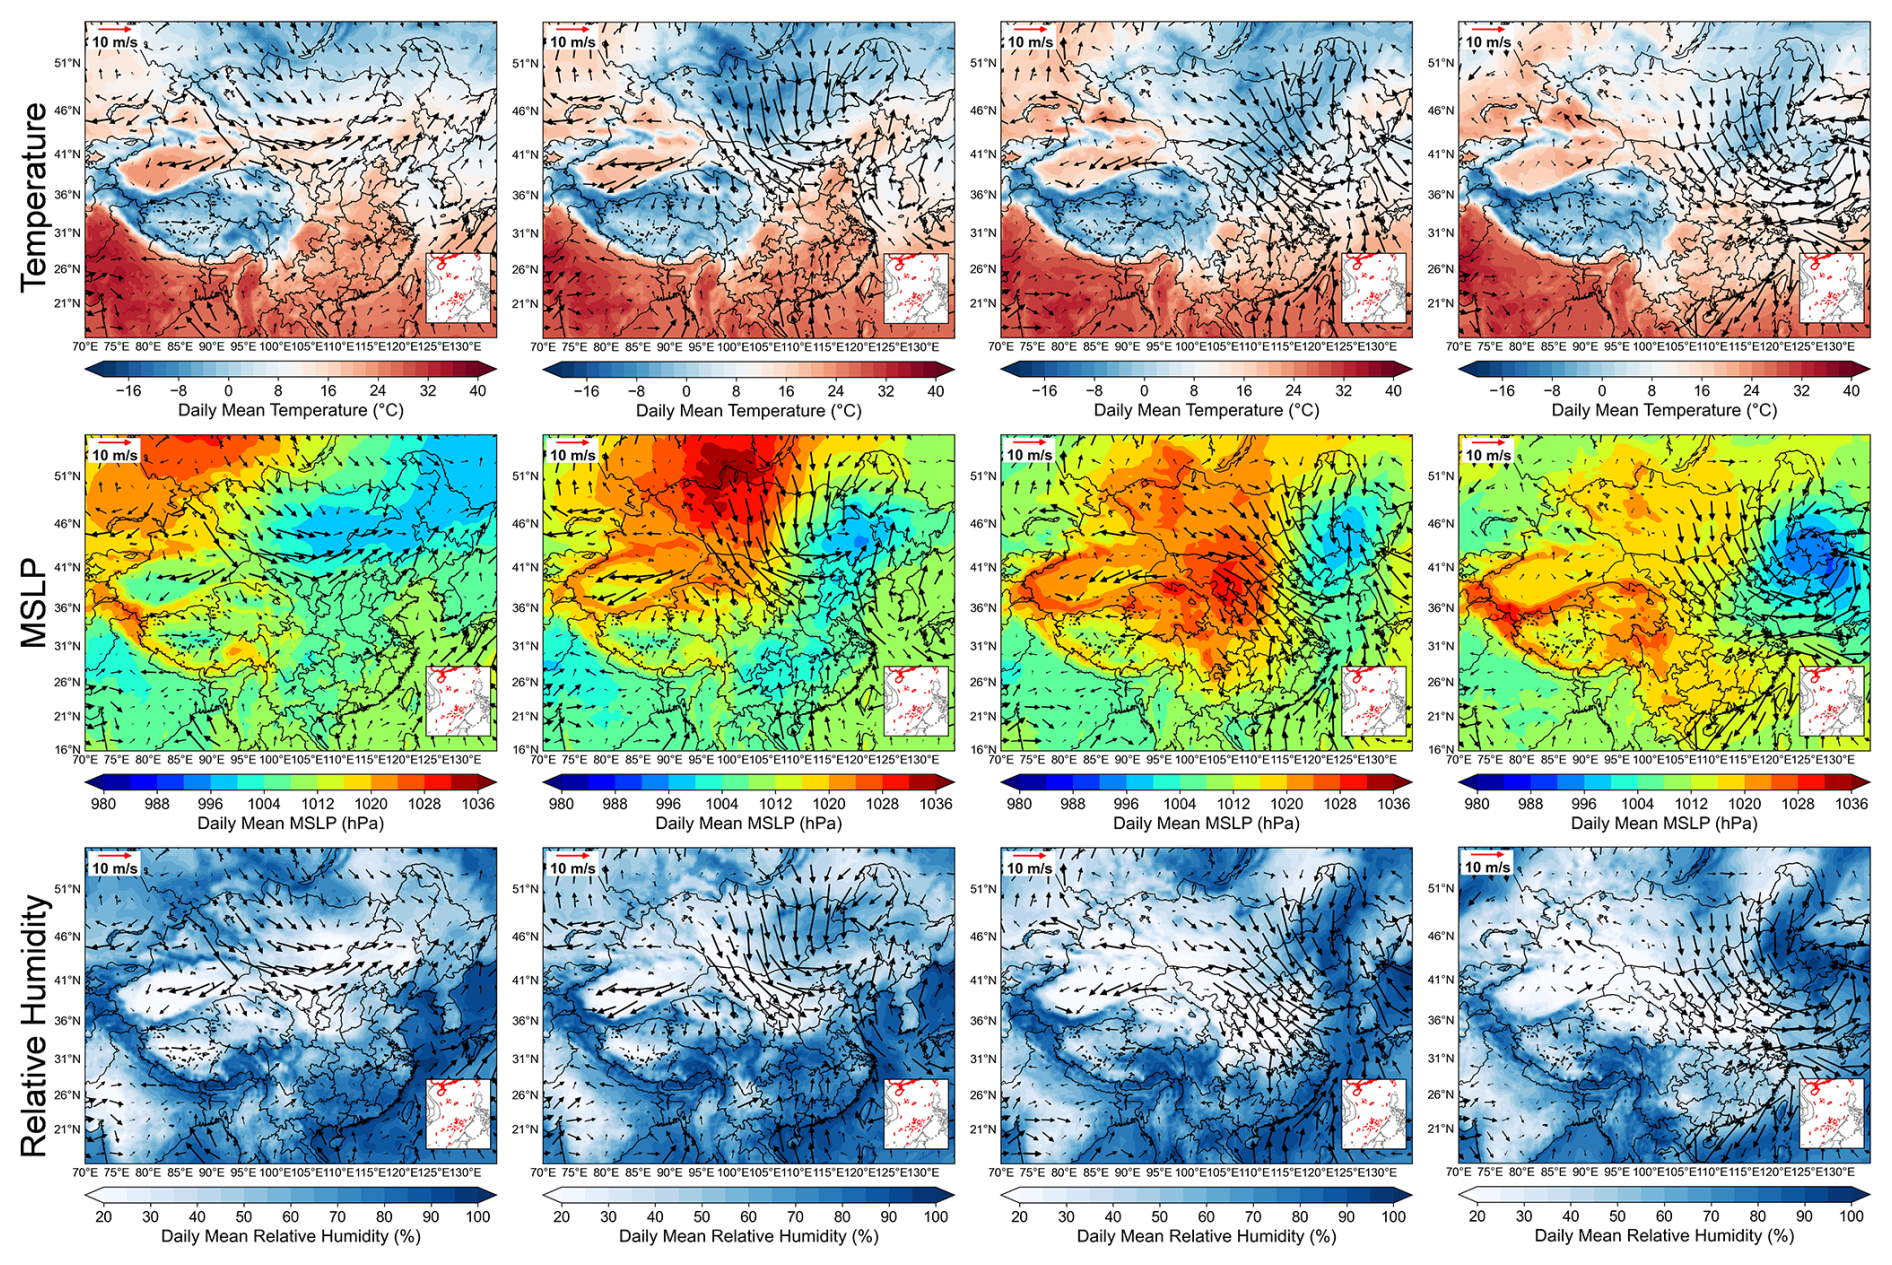
Figure 5Spatiotemporal variations of daily mean temperature (°C), mean sea level pressure (MSLP, unit: hPa), relative humidity (%), and surface wind fields over China from ERA5 during 10–13 April 2025 (BJT).
Throughout the event, WIM region remained under the influence of dry, cold air advection on the cyclone's western flank. The persistent occurrence of weather conditions characterized by low relative humidity and high wind speeds collectively created an optimal environment for dust transport. Meanwhile, the strong northerly winds generated by the synergistic effect of the Siberian high and Mongolian cyclone effectively transported dust toward the North China Plain (Fig. 2). Additionally, the southward extension of dry, cold air masses reaching the Yangtze River Delta provided favorable conditions for the unusual long-range transport of dust to Hainan. In summary, the synergistic interaction between the Siberian high and the Mongolian cyclone served as the primary driving mechanism for this dust event, promoting the southward propagation of dry, cold air masses and enabling the long-range transport of dust aerosols.
4.2 Dust emission and transport
In order to more comprehensively analyze the characteristics of this dust event, model simulations were employed to complement observational analysis, with a particular focus on the processes of dust emission and vertical transport. The available observational data can reveal the spatiotemporal distribution of dust concentrations, however, due to limited observational coverage – particularly the cessation of the CALIPSO satellite mission on 1 August 2023 – it is difficult to fully resolve the event's detailed characteristics. Using the GEOS-Chem model, we were able to simulate dust emission fluxes and vertical transport under realistic meteorological conditions. This combined approach of observations and simulations enables a more complete depiction of the dust event's features and facilitates a better understanding of the mechanisms behind its unusual intensity and long-range transport.
The GEOS-Chem model employing a revised dust emission version by Tian et al. (2021), in which the geographical variation of aerodynamic roughness length, smooth roughness length and soil texture, the Owen effect, and the formulation of the sandblasting efficiency α by Lu and Shao (1999) are incorporated to improve dust emission over China. We performed a systematic model evaluation before utilizing model outputs for analysis of the dust event. The simulated meteorological conditions including temperature, relative humidity, precipitation, and wind fields during this dust event are evaluated against the observations on the weather stations and ERA5 reanalysis data (Figs. S1 and S2 in the Supplement), while the simulated dust mass concentrations are evaluated with observed PM10 concentration, respectively (Fig. S3 in the Supplement). Our evaluation indicated that the model effectively captured the key characteristics of meteorological fields and the spatiotemporal variations of dust aerosols during the April 2025 dust event. Specifically, from 10 to 11 April, strong northerly winds (exceeding 8 m s−1) dominated northern and central China. A dry-cold air mass intruded into the Inner Mongolia region on 11 April, reducing relative humidity to below 30 % and temperatures to near 0 °C. High dust concentrations were located in western Inner Mongolia, with observed PM10 levels surpassing 950 µg m−3 and simulated dust aerosol concentrations exceeding 1000 µg m−3, while precipitation was primarily concentrated in central China. Between 12 and 13 April, the model continued to accurately capture the features of temperature, humidity, wind fields, and precipitation, as well as the general southward transport of dust aerosols. In a word, the model reproduced the southward movement of the dry-cold air mass, the transport of dust aerosols driven by northerly winds, and the concurrent southward shift of the precipitation.
Figure 6 shows the temporal variations of dust emission fluxes based on GEOS-Chem simulation. Relatively low dust emissions (less than 150 ) were present in WIM region at 08:00 BJT on 11 April, and dust emission fluxes exceeded 400 by 16:00 BJT, after which the emissions weakened. It is known that both magnitude and direction of dust transport could be impacted by dust emission fluxes and its vertical distribution. CALIPSO satellite retrievals are widely used to examine the vertical profiles of aerosols including dust (Liu et al., 2008; Uno et al., 2008; Ma et al., 2013; Zhao et al., 2020; Chaibou et al., 2020). Unfortunately, such CALIPSO data are not available since 1 August 2023. In order to look into the vertical distribution of dust and its temporal variations, the simulated vertical distribution of dust mass concentrations along 110° E at selected times from 11 to 13 April are presented (Fig. 7). At 16:30 BJT on 11 April, dust aerosols were concentrated between 35 and 40° N, with vertical transport heights exceeding 3.6 km. Subsequently, the dust aerosols transported toward lower latitudes, reaching 30° N by 08:30 BJT on 12 April, with transport heights decreasing to approximately 1.6 km. By 04:30 BJT on 13 April, the dust aerosols had transported to regions below 25° N, with transport heights further declining to around 0.8 km. Combined with Fig. 3, it can be observed that during this dust event, significant dust aerosol emissions occurred in WIM region at 16:30 BJT on 11 April, indicating the onset of the dust emission process. The dust aerosols entered the atmosphere and were lifted to altitudes above 3.6 km under the influence of strong winds and other factors. By 17:00 BJT on 11 April, the PM10 concentration in WIM region sharply increased, reaching its peak value. Intense dust emissions provided abundant source materials for this dust event, while the lifting of dust aerosols over 3 km in the source region facilitated long-range transport (Idso et al., 1976; Tsai et al., 2008).
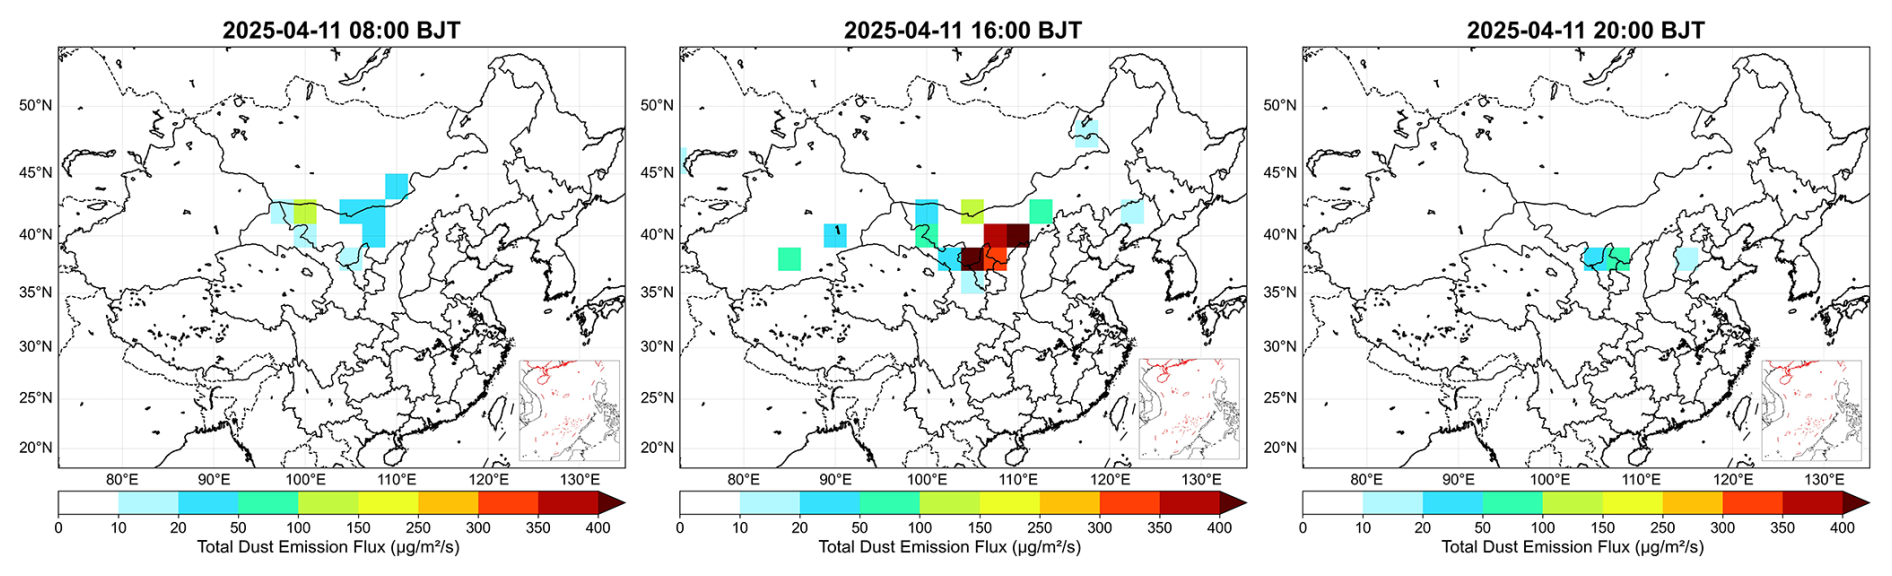
Figure 6Spatial distribution of model-simulated dust emission fluxes () on 11 April 2025 (BJT).
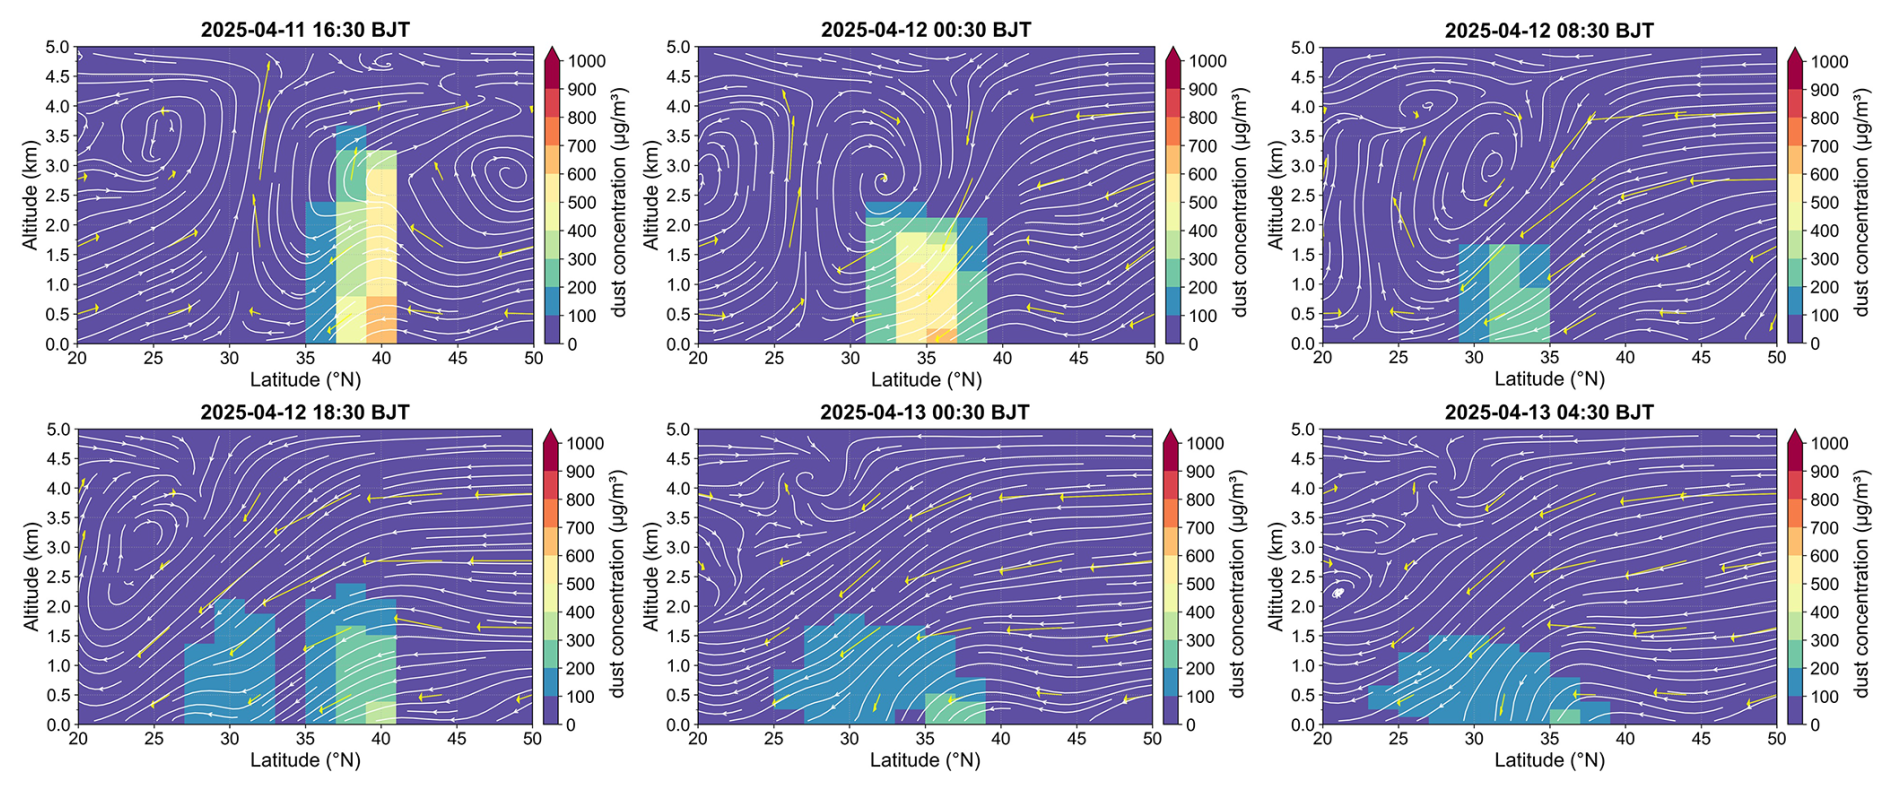
Figure 7Vertical cross-section of dust concentrations (µg m−3) along 110° E between 20 and 50° N during 11–13 April 2025 (BJT), with simulated vertical meridional wind streamlines.
4.3 Why is this dust storm so strong?
4.3.1 Comparison of meteorological conditions with 30-year climatological mean
To understand the driving role of meteorological factors in this dust event, we analyzed the anomalies of temperature, volumetric soil water, and precipitation during the four months preceding the dust event. These meteorological anomalies are relative to the 30-year climatological baseline. The spatial distribution of temperature, volumetric soil water, and total precipitation anomalies from 1 January 2025 to 14 April 2025 (Fig. 8a–c) indicates that relative to the 30-year climatological baseline, the WIM region (40–45° N, 95–105° E) exhibited higher-than-normal temperatures (Approximately +2 °C), lower-than-normal precipitation (Approximately −25 mm), and lower-than-normal volumetric soil water (Approximately −0.02 m3 m−3) both during and for the three months preceding the dust event. Moreover, it is essential to focus on wind speed anomalies on shorter time scales immediately preceding the dust event. Figure 8d shows the daily mean wind speed anomalies in the WIM region from 5 to 14 April 2025. Approximately +2 m s−1 daily mean wind speed anomalies occurred before the dust outbreak (10 April). Both the daily mean and daily maximum wind speed anomalies peaked (Approximately +2 and +4 m s−1) on the day of the dust event (11 April). To summarize, compared to the climatological baseline, the WIM region experienced generally warm and dry conditions from January to April 2025, accompanied by pronounced short-term strong winds preceding the dust event. These factors served as critical drivers of this intense dust episode, providing the necessary material and dynamic conditions for dust emission.
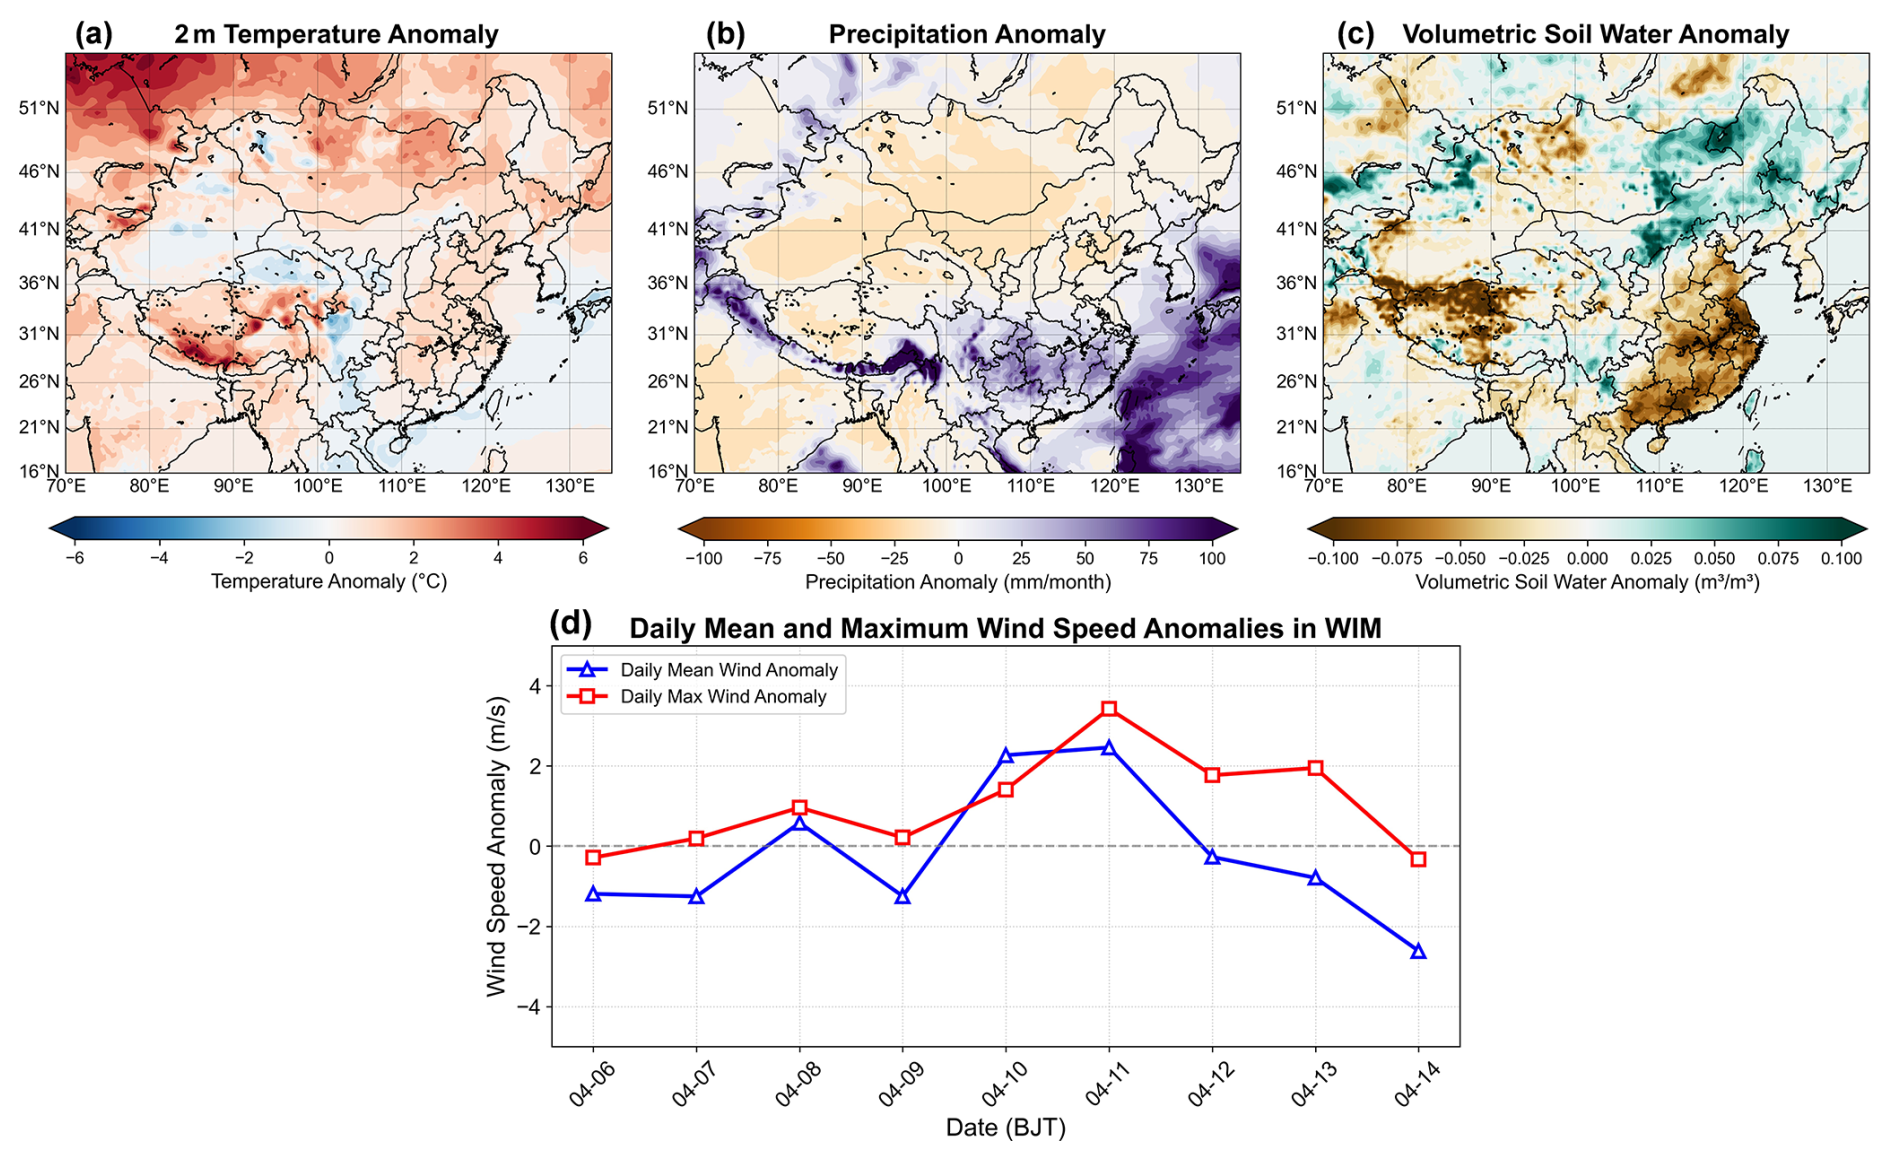
Figure 8Spatial distribution of mean anomalies for temperature (°), total precipitation (mm) and top-layer volumetric soil water (m3 m−3) over China from 1 January 2025 to 13 April 2025 BJT relative to the 30-year baseline of 1995–2024 (a–c). Daily anomaly time series of daily mean and maximum surface wind speed (m s−1) from 9 to 14 April 2025 BJT (relative to 30-year baseline: 1995–2024) in WIM (d). All data are from the ERA5 reanalysis.
4.3.2 Comparison with historical severe dust storms
A dust storm is a severe aeolian weather phenomenon characterized by strong winds lifting large amounts of dust from the surface into the air, resulting in exceptionally turbid atmospheric conditions and horizontal visibility reduced to less than one kilometer. Based on meteorological observation data, the China Meteorological Administration has recognized the dust events occurring in April 2023 and March 2021 as two severe dust storm episodes. The 2021 case represents peak intensity and lateral spread, yet stalled in central-eastern China, whereas the 2025 event achieved pronounced southward transport. The 2023 case showed southward potential but failed to penetrate deeply, unlike the 2025 event, which crossed the Yangtze River despite precipitation (Yu et al., 2023; Yang et al., 2025). In order to further explore the dynamical and physical processes during this dust event, the two severe dust events (one on 14 March 2021, and the other on 9 April 2023) are selected for comparison. Similar to the 2025 event, these historical events originated from source areas including WIM region and were primarily driven by Mongolian cyclones (Filonchyk, 2022; Filonchyk et al., 2024). However, neither historical event reached Hainan Province (Fig. S4 in the Supplement). By looking into the meteorological condition and soil moisture, we compare and understand the differences in the dust emission, transport, and scavenging processes for the selected dust events.
To compare the intensity of the three dust events occurring in March 2021, April 2023, and April 2025, the regional averages of daily maximum PM10 concentrations in the WIM region during these events were analysed. As shown in Fig. 9, the peak regional average daily maximum PM10 concentrations for the 2021, 2023, and 2025 dust events were 749, 708, and 841 µg m−3, respectively. This indicates that all three events were relatively intense, with no significant difference in their outbreak intensity. The meteorological conditions including precipitation, wind speed and surface temperature, as well as soil moisture in the dust source regions strongly influence dust emissions (Ishizuka et al., 2008; Kim and Choi, 2015; Yang et al., 2019). To further investigate the causes of the three dust events, Fig. 10 shows the time series of daily anomaly for precipitation, volumetric soil water, and surface temperature during the four months preceding the three dust events, as well as the daily anomalies of maximum wind speed for the five days before and after the dust events in the WIM region. Our analysis indicates that during the four months prior to the dust events and the month when the dust event occurred, precipitation and soil moisture were well correlated. The monthly total precipitation anomaly and volumetric soil water anomaly in 2025 were close to zero, whereas those in 2021 and 2023 were predominantly negative. The surface temperature in 2025 was about 8 K higher than the 30-year mean, while the positive anomalies in 2021 and 2023, though present, were lower than that of 2025. In addition, the daily maximum wind speed anomaly during the 2025 dust event peaked at about +4 m s−1 on the day of the dust outbreak (11 April 2025), which was higher than the peaks in the two historical events (about +3 m s−1 in 2023 and slightly above 0 m s−1 in 2021). Although the long-term precipitation and soil moisture before the 2025 event did not show conditions particularly favourable for dust emission, the persistent high temperature combined with a short-term strong wind event provided favourable conditions for the outbreak of the dust storm.
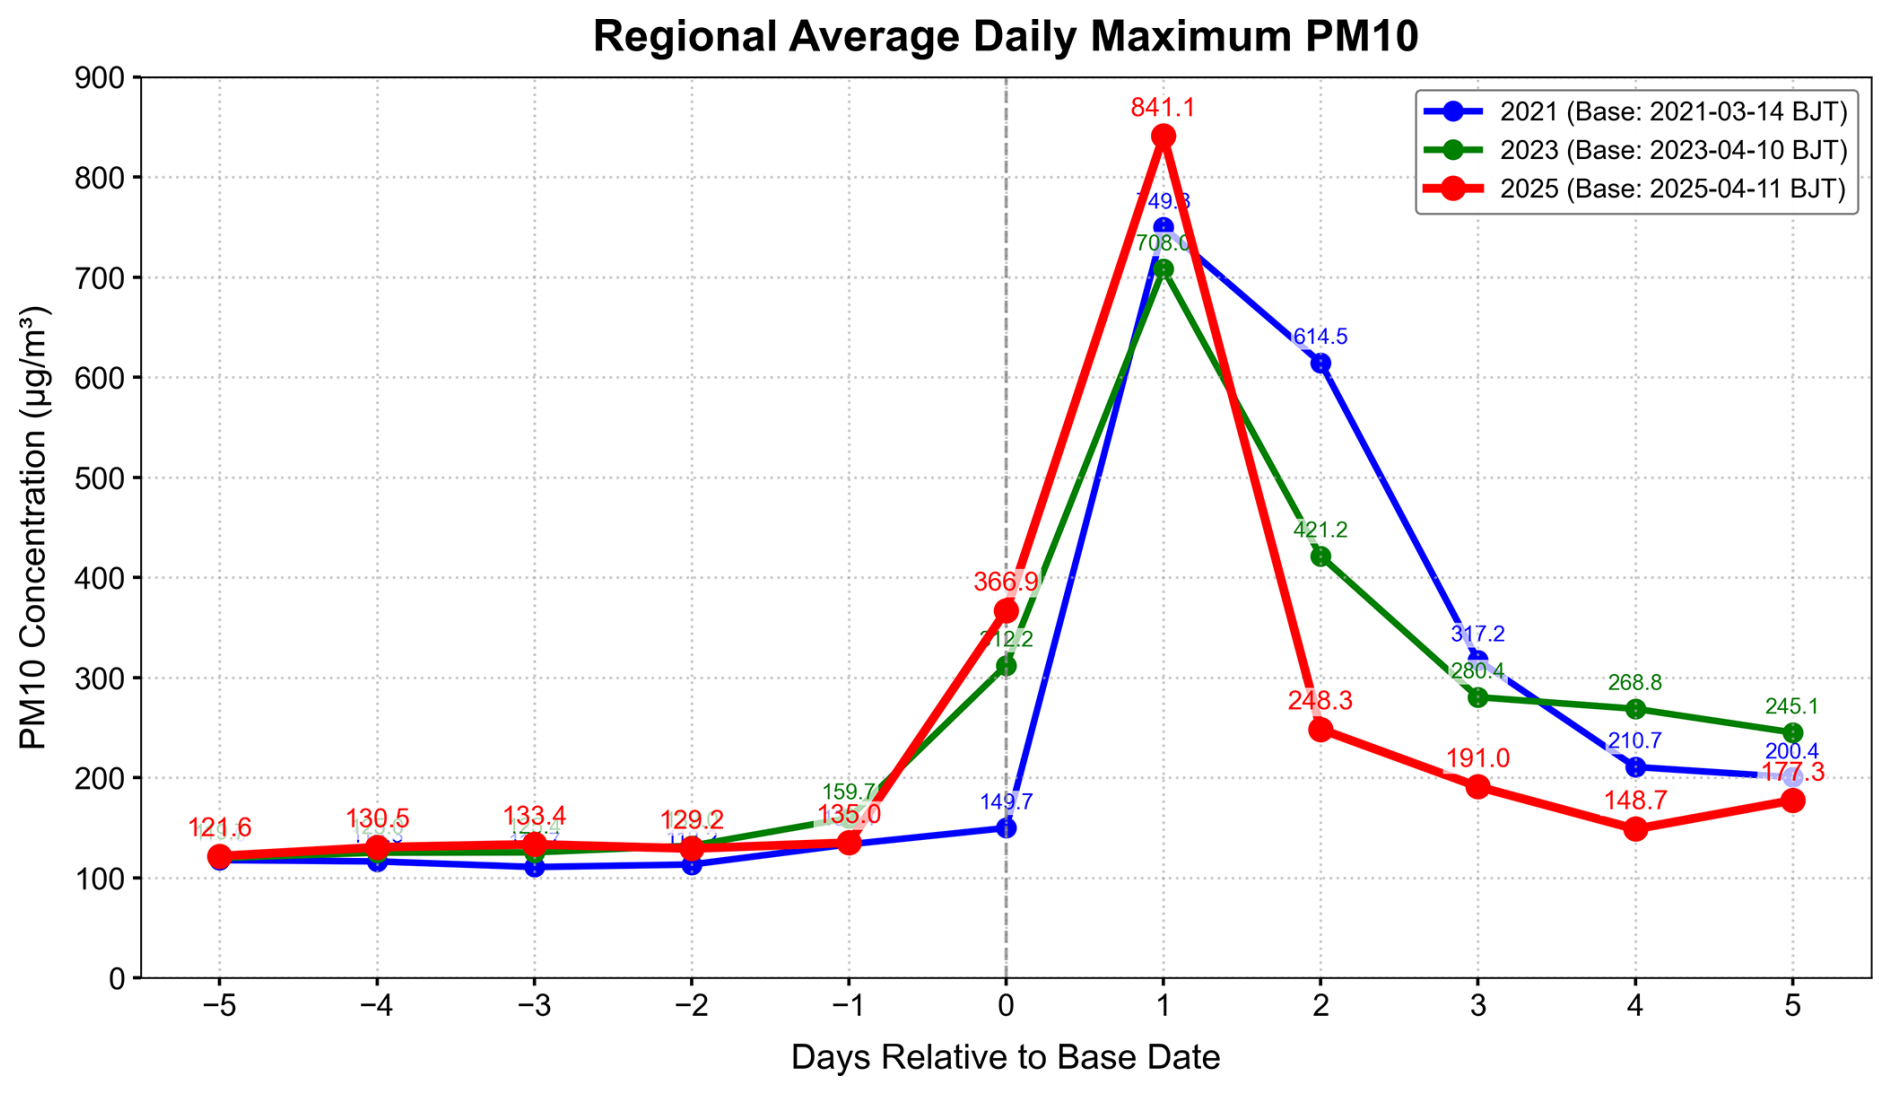
Figure 9The temporal evolution of regionally averaged PM10 concentrations (daily maximum, unit: µg m−3) from monitoring stations within the WIM region (38–43° N, 98–110° E), during dust events in March 2021, April 2023, and April 2025. Data are plotted relative to the dust event onset date (day 0) for each year, with ±5 d analysis windows. Gray dashed line marks the dust onset day (day 0).
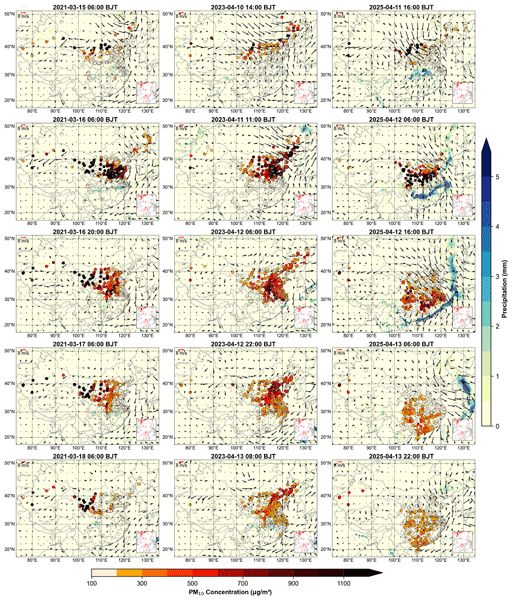
Figure 11 presents the spatial-temporal variations of the PM10 mass concentration, wind field, and precipitation during three dust event periods. It is clearly shown that although strong dust emissions occurred in WIM for three dust events (first–second rows), the magnitude and pathway of dust transport exhibits quite different behaviour (third–fifth rows). For the case in March 2021, strong northerly winds pushed dust particles to central-eastern China on 15 March, and then remain stagnant and had no further southern-ward transport until 16 March due to quite weak wind speed. For the case in April 2023, the wind speed was apparently stronger than that in 2021 case, so dust particles could be transported to eastern China and even northeast China. The lack of sustained strong northerly winds over the North China Plain on 11 and 12 April limited the southward spread of dust to southern China. Different from two above cases, dust aerosols in April 2025 reached the Yangtze River Basin, and sustained strong northerly winds exceeding 8 m s−1 provided sufficient momentum and make dust particles crossed the Yangtze River and further transport southward to the South China Sea. Wet scavenging of dust particles are negligible due to very limited precipitation for the 2021 and 2023 cases. In the April 2025 dust event, a distinct rainbelt was observed over eastern China. However, the dust aerosols consistently remained behind the rainbelt, and their southward transport was largely unaffected by wet scavenging. In contrast to the two historical cases, strong and persistent northerly winds during this event enhanced both dust emission and long-range transport. Consequently, with limited wet scavenging, the dust storm was able to reach the far south of China primarily due to the strong wind-driven transport.
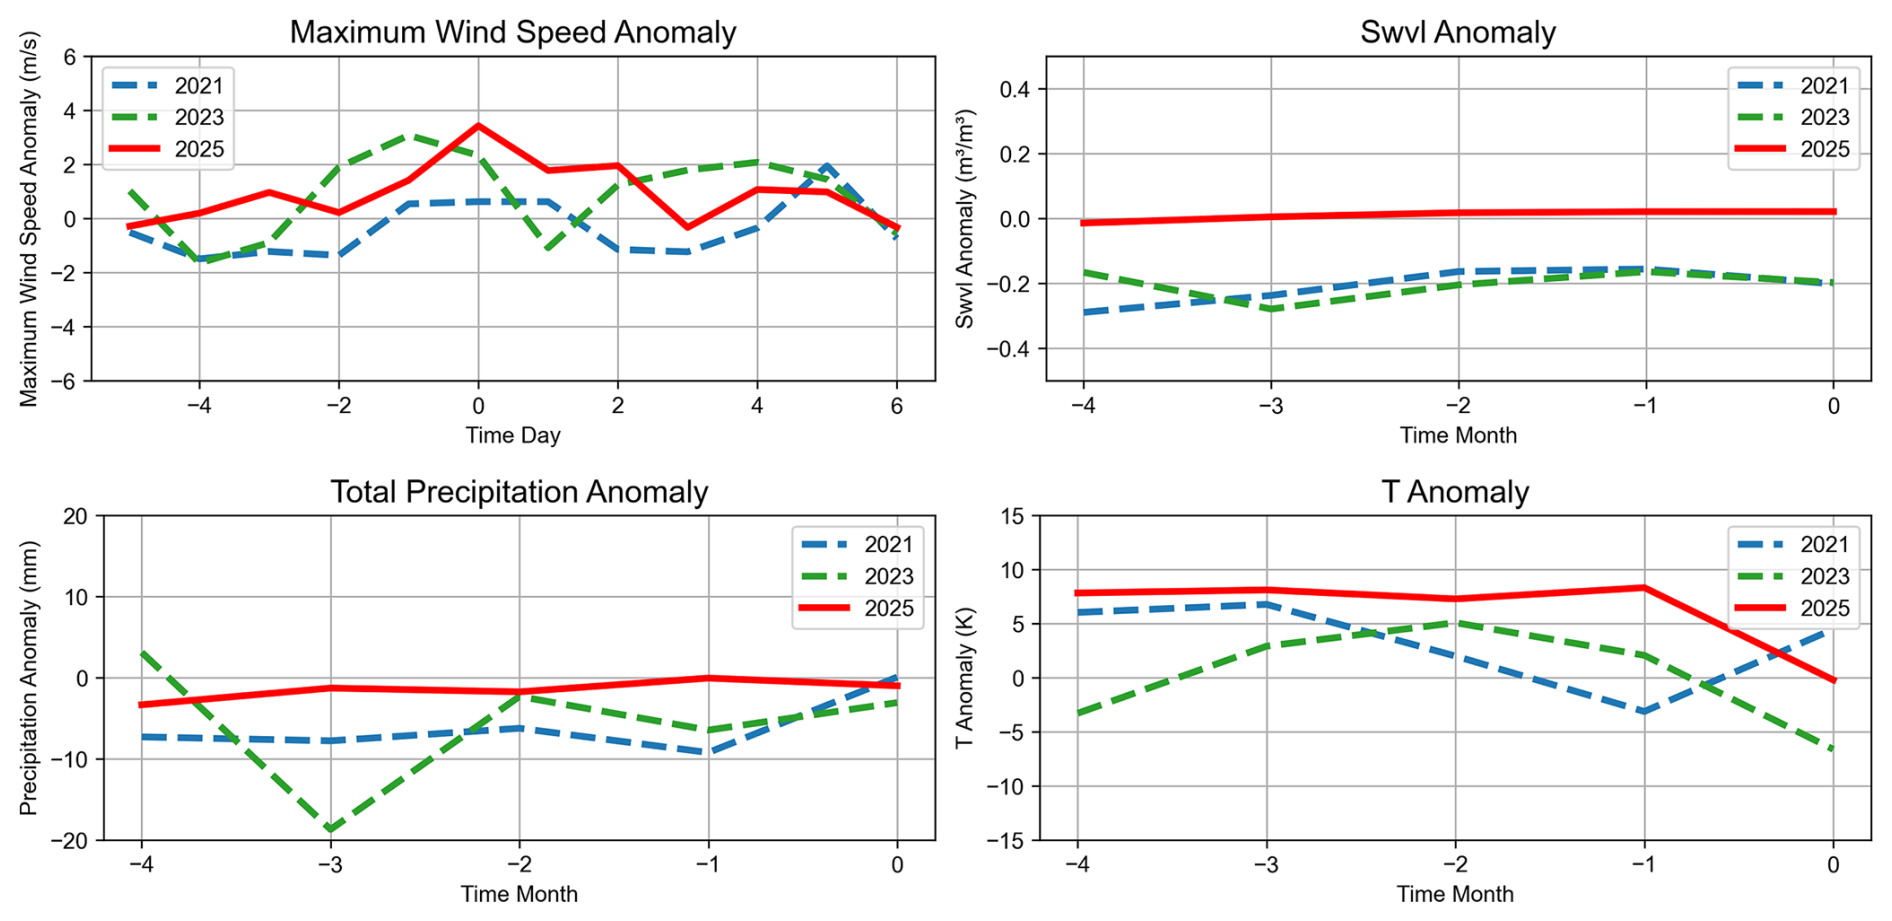
Figure 10Daily anomaly time series (5 d pre- and post-dust event onset) of surface maximum wind speed (m s−1) in WIM (38–43° N, 98–110° E). Monthly anomaly time series (4 months pre-dust event onset) of key parameters in WIM (38–43° N, 98–110° E), including top-layer volumetric soil water (Swvl, unit: m3 m−3), total precipitation (mm), surface temperature (T, unit: K).
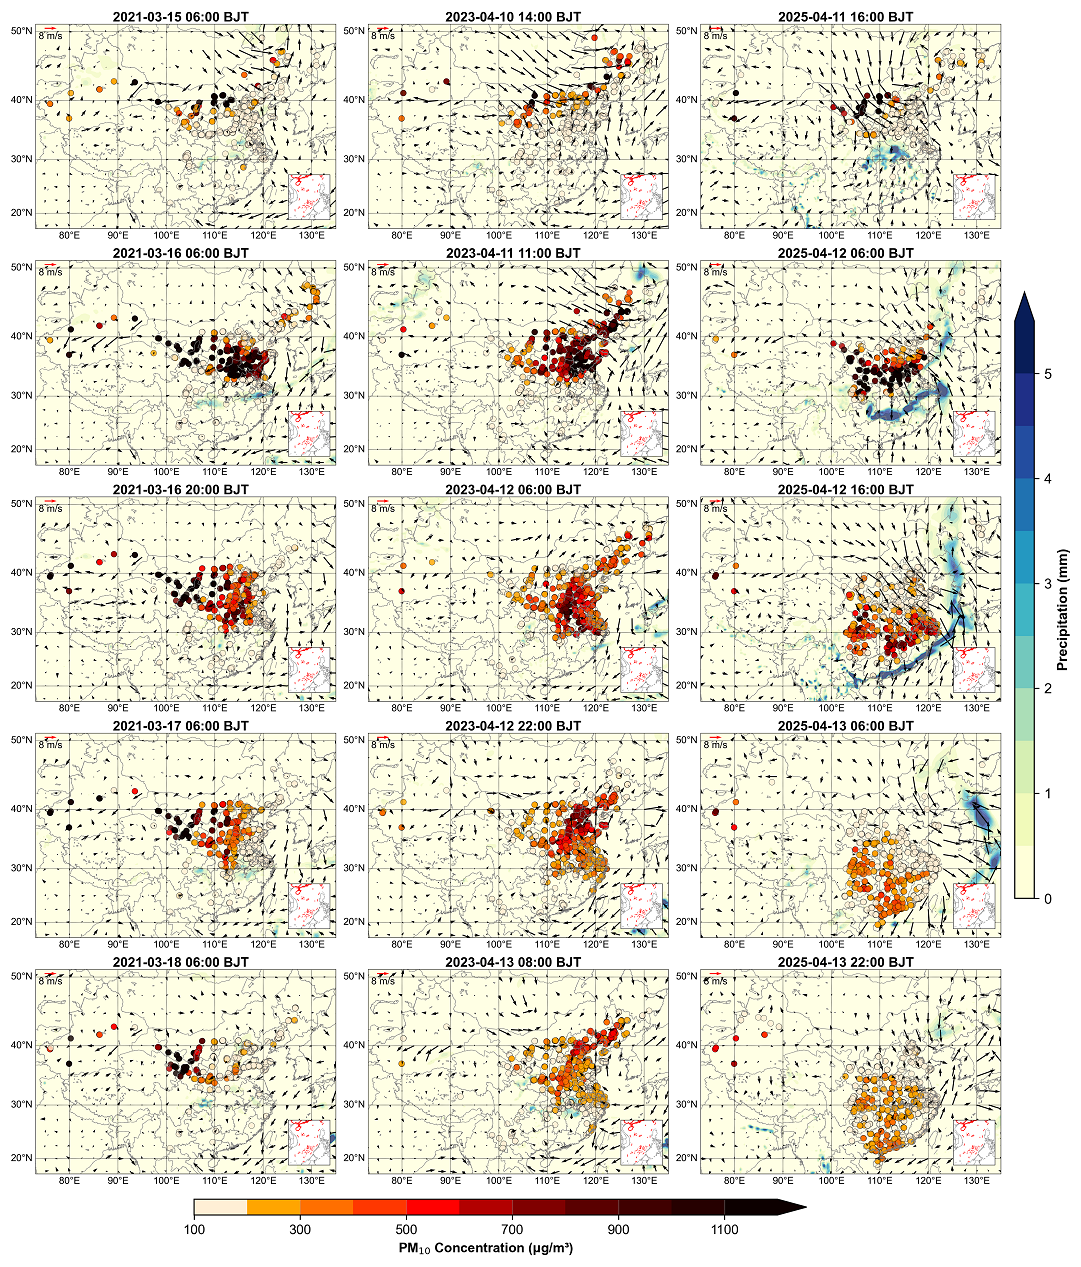
Figure 11Spatial distribution of hourly accumulated precipitation (mm), surface wind fields, and PM10 concentrations (µg m−3) over China during dust events: March 2021, April 2023, and April 2025. Precipitation is shown as color-filled maps, with PM10 displayed as filled circles. Hourly accumulated precipitation and surface wind fields data are sourced from ERA5, while hourly PM10 concentration data are obtained from surface monitoring stations.
To investigate the causes of the persistent strong northerly winds during the 2025 event, a comparative analysis of the dynamic mechanisms was conducted in relation to the atmospheric circulation patterns. Figures 5 and S5 in the Supplement illustrate the characteristics of atmospheric circulation during the 2025, 2021, and 2023 events. The analysis shows that the Mongolian cyclone was a key influencing system in all three events, but its evolution and configuration with the Siberian High differed significantly, leading to variations in the intensity and persistence of the northerly winds.
During the 2023 event, the Mongolian cyclone occurred in northern China and dominated the process, while the Siberian High played a relatively weaker role. Strong northerly winds were mainly observed on 10 and 11 April 2023, coinciding with the formation and development of the Mongolian cyclone. In both the 2021 and 2025 events, the combined influence of the Mongolian cyclone and the Siberian High was evident. During periods of strong northerly winds, the synergistic interaction between the two systems was pronounced (both were in the developmental stage with closely positioned pressure centers). However, differences existed in the duration and location of the Mongolian cyclone. In the 2021 event, the Mongolian cyclone dissipated relatively quickly (lasting only two days, 14 and 15 March 2021) and was primarily located in northern China. In the 2025 event, the Mongolian cyclone formed on the day of the dust outbreak and gradually intensified, with its location approximately 5° of latitude farther south compared to the other two events. In summary, the persistent and strong northerly winds during the 2025 event were primarily driven by the sustained synergistic interaction between the intense Siberian High and the Mongolian cyclone, coupled with the southerly displacement of the cyclone's position. These factors collectively provided the sustained and robust dynamic conditions essential for the long-range southward transport of dust.
We analyze the basic characteristics of the outbreak and transport processes of a severe dust event that occurred in northern China on 11 April 2025, especially focus on its emission and vertical transport, and then investigate the dust emission mechanisms and transport pathways involved by comparing meteorological conditions against the 30-year climatological average and contrasting the event with two severe historical dust storms.
Starting from 17:00 Beijing Time on 11 April 2025, a dust storm occurred in WIM accompanied by strong northerly winds exceeding 8 m s−1, and the hourly PM10 concentration surged to over 1900 µg m−3. The GEOS-Chem model simulations indicate that the emission flux exceeded 400 , and vertical transport reached 3.6 km. Usually, dust emissions in source regions can reach approximately 500 (Zhao et al., 2020), and dust aerosols can be vertically transported to about 3 km above the source region (Tsai et al., 2008). Under the synergistic effect of the Siberian cold high-pressure system and the Mongolian cyclone, WIM remained within the dry-cold advection zone west of the cyclone. The combination of low relative humidity and wind speeds over 10 m s−1 provided favorable dynamic conditions for dust emission. Furthermore, strong northerly winds in the WIM region guided the dust toward the North China Plain. The dust reached the Yangtze River Basin on 12 April and arrived at Hainan Island by 13 April, where observed PM10 exceeded 200 µg m−3 and simulated dust concentration surpassed 20 µg m−3. During this event, dust aerosols originating from the WIM region were transported an exceptionally long distance to Hainan Province, marking a phenomenon that has not been clearly documented in observational records of East Asian dust events in recent years.
The comparisons of meteorological conditions during this dust event against the 30-year climatological mean from ERA5 reanalysis data indicate that the dust source region (WIM) exhibited persistent high-temperature and drought conditions during the four months preceding the event, i.e. air temperature was approximately +2 °C above the baseline, precipitation was about 25 mm below normal, and volumetric soil water content was approximately 0.02 m3 m−3 lower than the baseline. Short-term wind field analysis before dust emission showed a positive average wind speed anomaly of approximately +2 m s−1 on the day before the outbreak (10 April), which peaked on the dust event day (11 April). Besides, maximum wind speed anomaly was approximately +4 m s−1 on 11 April. Prolonged high temperature and drought led to desiccated and loosened surface soil, providing ample source material for dust emission, while the strong winds preceding the event supplied crucial dynamic conditions. The synergistic interaction of these factors constituted the core triggering mechanism for this dust event.
To further discuss the reasons causing the long-range transport during this dust event, we selected two severe historical dust events in northern China (14 March 2021 and 9 April 2023) for comparative analysis. Although all three events originated from the same source regions including WIM and were primarily driven by Mongolian cyclones, the 2025 event achieved ultra-long-range transport to Hainan, while the historical events did not affect southern China. Comparison of the daily maximum PM10 concentrations in the WIM region revealed values of 749 µg m−3 (2021) and 708 µg m−3 (2023), whereas the 2025 event reached 841 µg m−3, indicating slightly higher intensity. Analysis of dust emission conditions for the three events based on ERA5 reanalysis data indicates a clear correspondence between precipitation and soil moisture, with anomaly values for both in 2025 close to zero, whereas distinct negative anomalies are observed in the historical events of 2023 and 2021. The surface temperature in 2025 was approximately 8 K higher than the 30-year mean, significantly exceeding the anomalies in 2021 and 2023. In addition, the regional average daily maximum wind speed anomaly on the day of the 2025 event (approximately +4 m s−1) was markedly stronger than that during the two historical events. While long-term moisture conditions were not particularly conducive, the combination of persistent high temperatures and a short-term strong wind event generated conditions that favored dust emission in 2025.
To look into long-range transport conditions, the PM10 concentrations, and wind fields and precipitation patterns during the emission and transport periods of the three dust events were compared. Our study found that both the 2021 and 2023 events were limited by the lack of persistent strong northerly winds along their transport paths (over North and Central China), ultimately preventing long-range transport to southern China. In contrast, the 2025 event exhibited two key features: (1) dust aerosols consistently remained behind the rainband and moved southward synchronously with it, effectively avoiding wet scavenging; and (2) sustained strong northerly winds exceeding 8 m s−1 continuously pushed the dust over the Yangtze River Basin, enabling ultra-long-range transport to Hainan. The formation of these two key features is primarily attributable to the unique characteristics of the driving “Mongolian Cyclone–Siberian High” coupling during this event, particularly in terms of its intensity configuration (prolonged duration) and spatial configuration (southerly-displaced position of the cyclone).
In summary, this study demonstrates that under the sustained interaction of the “Mongolian Cyclone–Siberian High” system, coupled with the southerly displacement of the Mongolian cyclone, the southward movement of a dry-cold air mass driven by persistent strong northerly winds resulted in coordinated southward movement of dust and the rainband. which collectively facilitated the stable long-range transport of dust in the 2025 event. These results highlight the critical leading role of airflow transport under specific synoptic conditions.
Code used in this work can be accessed by contacting Peili Zou (202412030268@nuist.edu.cn).
Data used in this work can be accessed according to the information given in Sect. 2.1. The model outputs and can be accessed by contacting Peili Zou (202412030268@nuist.edu.cn).
The supplement related to this article is available online at https://doi.org/10.5194/acp-26-7485-2026-supplement.
PZ was responsible for data analysis and drafted the manuscript. XM participated in the conceptualization of the study, data analysis, and article writing. RT contributed to the model simulations and, together with JZ, TY, and YK, assisted in the manuscript preparation.
The contact author has declared that none of the authors has any competing interests.
Publisher's note: Copernicus Publications remains neutral with regard to jurisdictional claims made in the text, published maps, institutional affiliations, or any other geographical representation in this paper. The authors bear the ultimate responsibility for providing appropriate place names. Views expressed in the text are those of the authors and do not necessarily reflect the views of the publisher.
We are thankful to the GEOS-Chem Support Team for their management and maintenance of the GEOS-Chem model. We acknowledge the use of ERA5 reanalysis data provided by the European Centre for Medium-Range Weather Forecasts (ECMWF). We are also grateful to NASA, the Chinese Ministry of Environmental Protection, and the Chinese National Meteorological Center for providing the MODIS datasets, surface PM10 observations and meteorological measurements respectively
This research has been supported by the National Natural Science Foundation of China (grant nos. 42575082, 42061134009, and 41975002).
This paper was edited by Zhibo Zhang and reviewed by two anonymous referees.
An, L. C., Che, H. Z., Xue, M., Zhang, T. H., Wang, H., Wang, Y. Q., Zhou, C. H., Zhao, H. J., Gui, K., Zheng, Y., Sun, T. Z., Liang, Y. X., Sun, E. W., Zhang, H. D., and Zhang, X. Y.: Temporal and spatial variations in sand and dust storm events in East Asia from 2007 to 2016: Relationships with surface conditions and climate change, Sci. Total Environ., 633, 452–462, https://doi.org/10.1016/j.scitotenv.2018.03.068, 2018.
Bao, C. L., Yong, M., Bi, L. G., Gao, H. L., Li, J., and Bao, Y. H.: Impacts of Underlying Surface on the Dusty Weather in Central Inner Mongolian Steppe, China, Earth Space Sci., 8, 17, https://doi.org/10.1029/2021ea001672, 2021.
Bergametti, G. and Forêt, G.: Dust deposition, in: Mineral dust: A key player in the earth system, Springer, 179–200, https://doi.org/10.1007/978-94-017-8978-3_8, 2014.
Borjigin, A., Bueh, C., Yong, M., Purevjav, G., and Xie, Z. W.: Cross-Border Sand and Dust Storms between Mongolia and Northern China in Spring and Their Driving Weather Systems, Remote Sens., 16, 22, https://doi.org/10.3390/rs16122164, 2024.
Chaibou, A. A. S., Ma, X., Kumar, K. R., Jia, H., Tang, Y., and Sha, T.: Evaluation of dust extinction and vertical profiles simulated by WRF-Chem with CALIPSO and AERONET over North Africa, J. Atmos. Sol.-Terr. Phy., 199, 105213, https://doi.org/10.1016/j.jastp.2020.105213, 2020.
Chen, S. Y., Huang, J. P., Li, J. X., Jia, R., Jiang, N. X., Kang, L. T., M., X. J., and Xie, T. T.: Comparison of dust emissions, transport, and deposition between the Taklimakan Desert and Gobi Desert from 2007 to 2011, Sci. China Earth Sci., 60, 1338–1355, https://doi.org/10.1007/s11430-016-9051-0, 2017.
Chepil, W.: Influence of moisture on erodibility of soil by wind, Soil Sci. Soc. Am. J., 20, 288–292, https://doi.org/10.2136/sssaj1956.03615995002000020033x, 1956.
Farmer, D. K., Boedicker, E. K., and DeBolt, H. M.: Dry Deposition of Atmospheric Aerosols: Approaches, Observations, and Mechanisms, in: Annual Review of Physical Chemistry, Vol. 72, edited by: Johnson, M. A. and Martinez, T. J., Annual Review of Physical Chemistry, Annual Reviews, Palo Alto, 375–397, https://doi.org/10.1146/annurev-physchem-090519-034936, 2021.
Field, J. P., Belnap, J., Breshears, D. D., Neff, J. C., Okin, G. S., Whicker, J. J., Painter, T. H., Ravi, S., Reheis, M. C., and Reynolds, R. L.: The ecology of dust, Front. Ecol. Environ., 8, 423–430, https://doi.org/10.1890/090050, 2010.
Filonchyk, M.: Characteristics of the severe March 2021 Gobi Desert dust storm and its impact on air pollution in China, Chemosphere, 287, 132219, https://doi.org/10.1016/j.chemosphere.2021.132219, 2022.
Filonchyk, M., Peterson, M. P., Zhang, L., and Yan, H.: An analysis of air pollution associated with the 2023 sand and dust storms over China: Aerosol properties and PM10 variability, Geosci. Front., 15, 101762, https://doi.org/10.1016/j.gsf.2023.101762, 2024.
Fu, X., Wang, S. X., Cheng, Z., Xing, J., Zhao, B., Wang, J. D., and Hao, J. M.: Source, transport and impacts of a heavy dust event in the Yangtze River Delta, China, in 2011, Atmos. Chem. Phys., 14, 1239–1254, https://doi.org/10.5194/acp-14-1239-2014, 2014.
Gao, H., Qi, J., Shi, J., Shi, G., and Feng, S.: Long-range Transport of Asian Dust and Its Effects on Ocean Ecosystem, Advances in Earth Science, 24, 1, http://www.adearth.ac.cn/EN/10.11867/j.issn.1001-8166.2009.01.0001 (last access: 23 May 2026), 2009.
Gassó, S., Grassian, V. H., and Miller, R. L.: Interactions between mineral dust, climate, and ocean ecosystems, Elements, 6, 247–252, https://doi.org/10.2113/gselements.6.4.247, 2010.
Griffin, D. W. and Kellogg, C. A.: Dust storms and their impact on ocean and human health: dust in Earth's atmosphere, EcoHealth, 1, 284–295, https://doi.org/10.1007/s10393-004-0120-8, 2004.
Guan, Q. Y., Sun, X. Z., Yang, J., Pan, B. T., Zhao, S. L., and Wang, L.: Dust Storms in Northern China: Long-Term Spatiotemporal Characteristics and Climate Controls, J. Climate, 30, 6683–6700, https://doi.org/10.1175/jcli-d-16-0795.1, 2017.
Guo, J., Lou, M., Miao, Y., Wang, Y., Zeng, Z., Liu, H., He, J., Xu, H., Wang, F., and Min, M.: Trans-Pacific transport of dust aerosols from East Asia: Insights gained from multiple observations and modeling, Environ. Pollut., 230, 1030–1039, https://doi.org/10.1016/j.envpol.2017.07.062, 2017.
Hu, Y., Chen, J., and Zuo, H.: Theorem of turbulent intensity and macroscopic mechanism of the turbulence development, Sci. China Ser. D, 50, 789–800, https://doi.org/10.1007/s11430-007-0002-3, 2007.
Huang, J., Wang, T., Wang, W., Li, Z., and Yan, H.: Climate effects of dust aerosols over East Asian arid and semiarid regions, J. Geophys. Res.-Atmos., 119, 11398–311416, https://doi.org/10.1002/2014JD021796, 2014.
Huang, J. P., Lin, B., Minnis, P., Wang, T. H., Wang, X., Hu, Y. X., Yi, Y. H., and Ayers, J. K.: Satellite-based assessment of possible dust aerosols semi-direct effect on cloud water path over East Asia, Geophys. Res. Lett., 33, 5, https://doi.org/10.1029/2006gl026561, 2006.
Husar, R. B., Tratt, D., Schichtel, B. A., Falke, S., Li, F., Jaffe, D., Gasso, S., Gill, T., Laulainen, N. S., and Lu, F.: Asian dust events of April 1998, J. Geophys. Res.-Atmos., 106, 18317–18330, https://doi.org/10.1029/2000jd900788, 2001.
Hussein, T., Karppinen, A., Kukkonen, J., Härkönen, J., Aalto, P. P., Hämeri, K., Kerminen, V.-M., and Kulmala, M.: Meteorological dependence of size-fractionated number concentrations of urban aerosol particles, Atmos. Environ., 40, 1427–1440, https://doi.org/10.1016/j.atmosenv.2005.10.061, 2006.
Idso, S. B.: Dust storms, Sci. Am., 235, 108–115, https://doi.org/10.1016/s0016-0032(35)90387-8, 1976.
Ishizuka, M., Mikami, M., Leys, J., Yamada, Y., Heidenreich, S., Shao, Y., and McTainsh, G.: Effects of soil moisture and dried raindroplet crust on saltation and dust emission, J. Geophys. Res.-Atmos., 113, https://doi.org/10.1029/2008jd009955, 2008.
Iwasaka, Y., Minoura, H., and Nagaya, K.: The transport and spacial scale of Asian dust-storm clouds: a case study of the dust-storm event of April 1979, Tellus B, 35, 189–196, https://doi.org/10.1111/j.1600-0889.1983.tb00023.x, 1983.
Kai, Z. and Huiwang, G.: The characteristics of Asian-dust storms during 2000–2002: From the source to the sea, Atmos. Environ., 41, 9136–9145, https://doi.org/10.1016/j.atmosenv.2007.08.007, 2007.
Kim, H. and Choi, M.: Impact of soil moisture on dust outbreaks in East Asia: Using satellite and assimilation data, Geophys. Res. Lett., 42, 2789–2796, https://doi.org/10.1002/2015gl063325, 2015.
Kim, J.: Transport routes and source regions of Asian dust observed in Korea during the past 40 years (1965–2004), Atmos. Environ., 42, 4778–4789, https://doi.org/10.1016/j.atmosenv.2008.01.040, 2008.
Knippertz, P. and Fink, A. H.: Synoptic and dynamic aspects of an extreme springtime Saharan dust outbreak, Q. J. Roy. Meteor. Soc., 132, 1153–1177, https://doi.org/10.1256/qj.05.109, 2006.
Lee, E.-H. and Sohn, B.-J.: Recent increasing trend in dust frequency over Mongolia and Inner Mongolia regions and its association with climate and surface condition change, Atmos. Environ., 45, 4611–4616, https://doi.org/10.1016/j.atmosenv.2011.05.065, 2011.
Pryor, S. and Binkowski, F.: An analysis of the time scales associated with aerosol processes during dry deposition, Aerosol Sci. Technol., 38, 1091–1098, https://doi.org/10.1080/027868290885827, 2004.
Liang, L., Han, Z., Li, J., Xia, X., Sun, Y., Liao, H., Liu, R., Liang, M., Gao, Y., and Zhang, R.: Emission, transport, deposition, chemical and radiative impacts of mineral dust during severe dust storm periods in March 2021 over East Asia, Sci. Total Environ., 852, 158459, https://doi.org/10.1016/j.scitotenv.2022.158459, 2022.
Liu, L., Wang, Z., Che, H., Wang, D., Gui, K., Liu, B., Ma, K., and Zhang, X.: Climate factors influencing springtime dust activities over Northern East Asia in 2021 and 2023, Atmos. Res., 303, 107342, https://doi.org/10.1016/j.atmosres.2024.107342, 2024.
Liu, T.-H., Tsai, F., Hsu, S.-C., Hsu, C.-W., Shiu, C.-J., Chen, W.-N., and Tu, J.-Y.: Southeastward transport of Asian dust: Source, transport and its contributions to Taiwan, Atmos. Environ., 43, 458–467, https://doi.org/10.1016/j.atmosenv.2008.07.066, 2009.
Liu, X., Yin, Z. Y., Zhang, X., and Yang, X.: Analyses of the spring dust storm frequency of northern China in relation to antecedent and concurrent wind, precipitation, vegetation, and soil moisture conditions, J. Geophys. Res.-Atmos., 109, https://doi.org/10.1029/2004JD004615, 2004.
Liu, Y. and Liu, R.: Climatology of dust storms in northern China and Mongolia: Results from MODIS observations during 2000–2010, J. Geogr. Sci., 25, 1298–1306, https://doi.org/10.1007/s11442-015-1235-2, 2015.
Liu, Z., Omar, A., Vaughan, M., Hair, J., Kittaka, C., Hu, Y., Powell, K., Trepte, C., Winker, D., and Hostetler, C.: CALIPSO lidar observations of the optical properties of Saharan dust: A case study of long-range transport, J. Geophys. Res.-Atmos., 113, https://doi.org/10.1029/2007jd008878, 2008.
Lu, H. and Shao, Y.: A new model for dust emission by saltation bombardment, J. Geophys. Res.-Atmos., 104, 16827–16842, https://doi.org/10.1029/1999jd900169, 1999.
Ma, X. and Von Salzen, K.: Dynamics of the sulphate aerosol size distribution on a global scale, J. Geophys. Res.-Atmos., 111, https://doi.org/10.1029/2005jd006620, 2006.
Ma, X., Bartlett, K., Harmon, K., and Yu, F.: Comparison of AOD between CALIPSO and MODIS: significant differences over major dust and biomass burning regions, Atmos. Meas. Tech., 6, 2391–2401, https://doi.org/10.5194/amt-6-2391-2013, 2013.
McKendry, I., Hacker, J., Stull, R., Sakiyama, S., Mignacca, D., and Reid, K.: Long-range transport of Asian dust to the lower Fraser Valley, British Columbia, Canada, J. Geophys. Res.-Atmos., 106, 18361–18370, https://doi.org/10.1029/2000JD900359, 2001.
Miri, A. and Middleton, N.: Long-term impacts of dust storms on transport systems in south-eastern Iran, Nat. Hazards, 114, 291–312, https://doi.org/10.1007/s11069-022-05390-z, 2022.
Munkhtsetseg, E., Shinoda, M., Gillies, J. A., Kimura, R., King, J., and Nikolich, G.: Relationships between soil moisture and dust emissions in a bare sandy soil of Mongolia, Particuology, 28, 131–137, https://doi.org/10.1016/j.partic.2016.03.001, 2016.
Park, S. and Allen, R. J.: Understanding influences of convective transport and removal processes on aerosol vertical distribution, Geophys. Res. Lett., 42, 10438–410444, https://doi.org/10.1002/2015gl066175, 2015.
Park, S.-U., Choe, A., and Park, M.-S.: Estimates of Asian dust deposition over the Asian region by using ADAM2 in 2007, Sci. Total Environ., 408, 2347–2356, https://doi.org/10.1016/j.scitotenv.2010.02.001, 2010.
Pryor, S. and Binkowski, F.: An analysis of the time scales associated with aerosol processes during dry deposition, Aerosol Sci. Technol., 38, 1091–1098, https://doi.org/10.1080/027868290885827, 2004.
Ravi, S., D'Odorico, P., Over, T. M., and Zobeck, T. M.: On the effect of air humidity on soil susceptibility to wind erosion: The case of air-dry soils, Geophys. Res. Lett., 31, https://doi.org/10.1029/2004gl019485, 2004.
Richter, D. and Chamecki, M.: Inertial effects on the vertical transport of suspended particles in a turbulent boundary layer, Bound.-Lay. Meteorol., 167, 235–256, https://doi.org/10.1007/s10546-017-0325-3, 2018.
Roth, M.: Review of atmospheric turbulence over cities, Q. J. Roy. Meteor. Soc., 126, 941–990, https://doi.org/10.1002/qj.49712656409, 2000.
Seinfeld, J. H., Carmichael, G. R., Arimoto, R., Conant, W. C., Brechtel, F. J., Bates, T. S., Cahill, T. A., Clarke, A. D., Doherty, S. J., and Flatau, P. J.: ACE-ASIA: Regional climatic and atmospheric chemical effects of Asian dust and pollution, B. Am. Meteorol. Soc., 85, 367–380, https://doi.org/10.1175/BAMS-85-3-367, 2004.
Shao, Y., Zhang, J., Ishizuka, M., Mikami, M., Leys, J., and Huang, N.: Dependency of particle size distribution at dust emission on friction velocity and atmospheric boundary-layer stability, Atmos. Chem. Phys., 20, 12939–12953, https://doi.org/10.5194/acp-20-12939-2020, 2020.
Sun, J., Zhang, M., and Liu, T.: Spatial and temporal characteristics of dust storms in China and its surrounding regions, 1960–1999: Relations to source area and climate, J. Geophys. Res.-Atmos., 106, 10325–10333, https://doi.org/10.1029/2000jd900665, 2001.
Tan, S.-C., Shi, G.-Y., and Wang, H.: Long-range transport of spring dust storms in Inner Mongolia and impact on the China seas, Atmos. Environ., 46, 299–308, https://doi.org/10.1016/j.atmosenv.2011.09.058, 2012.
Tan, S.-C., Li, J., Che, H., Chen, B., and Wang, H.: Transport of East Asian dust storms to the marginal seas of China and the southern North Pacific in spring 2010, Atmos. Environ., 148, 316–328, https://doi.org/10.1016/j.atmosenv.2016.10.054, 2017.
Takemi, T. and Seino, N.: Dust storms and cyclone tracks over the arid regions in east Asia in spring, J. Geophys. Res.-Atmos., 110, https://doi.org/10.1029/2004jd004698, 2005.
Tegen, I., Harrison, S. P., Kohfeld, K., Prentice, I. C., Coe, M., and Heimann, M.: Impact of vegetation and preferential source areas on global dust aerosol: Results from a model study, J. Geophys. Res.-Atmos., 107, AAC 14-11–AAC 14-27, https://doi.org/10.1029/2001jd000963, 2002.
The International GEOS-Chem User Community: geoschem/geos-chem: GEOS-Chem 12.6.0 (12.6.0), Zenodo [code], https://doi.org/10.5281/zenodo.3507501, 2019.
Tian, R., Ma, X., and Zhao, J.: A revised mineral dust emission scheme in GEOS-Chem: improvements in dust simulations over China, Atmos. Chem. Phys., 21, 4319–4337, https://doi.org/10.5194/acp-21-4319-2021, 2021.
Tsai, F., Chen, G. T. J., Liu, T. H., Lin, W. D., and Tu, J. Y.: Characterizing the transport pathways of Asian dust, J. Geophys. Res.-Atmos., 113, https://doi.org/10.1029/2007jd009674, 2008.
Tsedendamba, P., Dulam, J., Baba, K., Hagiwara, K., Noda, J., Kawai, K., Sumiya, G., McCarthy, C., Kai, K., and Hoshino, B.: Northeast Asian dust transport: A case study of a dust storm event from 28 March to 2 April 2012, Atmosphere, 10, 69, https://doi.org/10.3390/atmos10020069 2019.
Twomey, S.: The influence of pollution on the shortwave albedo of clouds, J. Atmos. Sci, 34, 1149–1152, https://doi.org/10.1175/1520-0469(1977)034<1149:TIOPOT>2.0.CO;2, 1977.
Uno, I., Yumimoto, K., Shimizu, A., Hara, Y., Sugimoto, N., Wang, Z., Liu, Z., and Winker, D.: 3D structure of Asian dust transport revealed by CALIPSO lidar and a 4DVAR dust model, Geophys. Res. Lett., 35, https://doi.org/10.1029/2007gl032329, 2008.
Wang, L.-P.: On the dispersion of heavy particles by turbulent motion, Washington State University, https://doi.org/10.1175/1520-0469(1993)050<1897:dohpbt>2.0.co;2, 1990.
Wang, S., Yu, Y., Zhang, X.-X., Lu, H., Zhang, X.-Y., and Xu, Z.: Weakened dust activity over China and Mongolia from 2001 to 2020 associated with climate change and land-use management, Environ. Res. Lett., 16, 124056, https://doi.org/10.1088/1748-9326/ac3b79, 2021.
Wang, W., Huang, J., Minnis, P., Hu, Y., Li, J., Huang, Z., Ayers, J. K., and Wang, T.: Dusty cloud properties and radiative forcing over dust source and downwind regions derived from A‐Train data during the Pacific Dust Experiment, J. Geophys. Res.-Atmos., 115,https://doi.org/10.1029/2010JD014109, 2010.
Wang, W., Sheng, L., Jin, H., and Han, Y.: Dust aerosol effects on cirrus and altocumulus clouds in Northwest China, J. Meteorol. Res., 29, 793–805, https://doi.org/10.1007/s13351-015-4116-9, 2015.
Wang, W., Samat, A., Abuduwaili, J., Ge, Y., De Meyer, P., and Van de Voorde, T.: Temporal characterization of sand and dust storm activity and its climatic and terrestrial drivers in the Aral Sea region, Atmos. Res., 275, 106242, https://doi.org/10.1016/j.atmosres.2022.106242, 2022.
Wang, X., Dong, Z., Zhang, J., and Liu, L.: Modern dust storms in China: an overview, J. Arid Environ., 58, 559–574, https://doi.org/10.1016/j.jaridenv.2003.11.009, 2004.
Wang, X., Oenema, O., Hoogmoed, W., Perdok, U., and Cai, D.: Dust storm erosion and its impact on soil carbon and nitrogen losses in northern China, Catena, 66, 221–227, https://doi.org/10.1016/j.catena.2006.02.006, 2006.
Xiong, J., Zhao, T., Bai, Y., Liu, Y., Han, Y., and Guo, C.: Climate characteristics of dust aerosol and its transport in major global dust source regions, J. Atmos. Sol.-Terr. Phy., 209, 105415, https://doi.org/10.1016/j.jastp.2020.105415, 2020.
Xu, X., Levy, J. K., Zhaohui, L., and Hong, C.: An investigation of sand–dust storm events and land surface characteristics in China using NOAA NDVI data, Global Planet. Change, 52, 182–196, https://doi.org/10.1016/j.gloplacha.2006.02.009, 2006.
Yang, H., Zhu, X., Qiu, D., Fang, Z., Hu, Y., and Li, X.: Research of two dust transport pollution in northern China in 2023: Perspectives from LiDAR and multi source data, Atmos. Pollut. Res., 16, 102441, https://doi.org/10.1016/j.apr.2025.102441, 2025.
Yang, X., Zhou, C., Huo, W., Yang, F., Liu, X., and Mamtimin, A.: A study on the effects of soil moisture, air humidity, and air temperature on wind speed threshold for dust emissions in the Taklimakan Desert, Nat. Hazards, 97, 1069–1081, https://doi.org/10.1007/s11069-019-03686-1, 2019.
Yang, Y. Q., Hou, Q., Zhou, C. H., Liu, H. L., Wang, Y. Q., and Niu, T.: Sand/dust storm processes in Northeast Asia and associated large-scale circulations, Atmos. Chem. Phys., 8, 25–33, https://doi.org/10.5194/acp-8-25-2008, 2008.
Yu, T., Xiaole, P., Yujie, J., Yuting, Z., Weijie, Y., Hang, L., Shandong, L., and Zifa, W.: East Asia dust storms in spring 2021: Transport mechanisms and impacts on China, Atmos. Res., 290, 106773, https://doi.org/10.1016/j.atmosres.2023.106773, 2023.
Zannetti, P.: Dry and wet deposition, in: Air Pollution Modeling: Theories, Computational Methods and Available Software, Springer, 249–262, https://doi.org/10.1007/978-1-4757-4465-1_10, 1990.
Zhang, L., Zhang, H., Li, Q., Cai, X., and Song, Y.: Vertical dispersion mechanism of long-range transported dust in Beijing: Effects of atmospheric turbulence, Atmos. Res., 269, 106033, https://doi.org/10.1016/j.atmosres.2022.106033, 2022.
Zhang, R., Han, Z., Wang, M., and Zhang, X.: Dust storm weather in China: New characteristics and origins, Quaternary Sciences, 22, 374–380, http://www.dsjyj.com.cn/en/article/id/dsjyj_9350 (last access: 23 May 2026), 2002.
Zhang, X.-Y., Gong, S., Zhao, T., Arimoto, R., Wang, Y., and Zhou, Z.: Sources of Asian dust and role of climate change versus desertification in Asian dust emission, Geophys. Res. Lett., 30, https://doi.org/10.1029/2003GL018206, 2003.
Zhao, C., Dabu, X., and Li, Y.: Relationship between climatic factors and dust storm frequency in Inner Mongolia of China, Geophys. Res. Lett., 31, https://doi.org/10.1029/2003gl018351, 2004.
Zhao, J., Ma, X., Wu, S., and Sha, T.: Dust emission and transport in Northwest China: WRF-Chem simulation and comparisons with multi-sensor observations, Atmos. Res., 241, 104978, https://doi.org/10.1016/j.atmosres.2020.104978, 2020.
Zhao, T. L., Gong, S. L., Zhang, X. Y., and Jaffe, D. A.: Asian dust storm influence on North American ambient PM levels: observational evidence and controlling factors, Atmos. Chem. Phys., 8, 2717–2728, https://doi.org/10.5194/acp-8-2717-2008, 2008.
Zhu, Q. and Liu, Y.: The dominant factor in extreme dust events over the Gobi Desert is shifting from extreme winds to extreme droughts, npj Climate and Atmospheric Science, 7, 141, https://doi.org/10.1038/s41612-024-00689-z, 2024.
Zou, X. K. and Zhai, P. M.: Relationship between vegetation coverage and spring dust storms over northern China, J. Geophys. Res.-Atmos., 109, https://doi.org/10.1029/2003jd003913, 2004.
- Abstract
- Introduction
- Data and measurements
- A severe dust storm during 11–14 April 2025 in Northern China
- Meteorological factors and dust processes
- Summary and conclusion
- Code availability
- Data availability
- Author contributions
- Competing interests
- Disclaimer
- Acknowledgements
- Financial support
- Review statement
- References
- Supplement
- Abstract
- Introduction
- Data and measurements
- A severe dust storm during 11–14 April 2025 in Northern China
- Meteorological factors and dust processes
- Summary and conclusion
- Code availability
- Data availability
- Author contributions
- Competing interests
- Disclaimer
- Acknowledgements
- Financial support
- Review statement
- References
- Supplement