
the Creative Commons Attribution 4.0 License.
the Creative Commons Attribution 4.0 License.
 | 28 May 2026
Exploring biases in the GISS ModelE Earth system model brown carbon representation with in-situ flight observations
Maegan A. DeLessio
Kostas Tsigaridis
Susanne E. Bauer
The inclusion of brown carbon (BrC), the subset of organic aerosols (OAs) that absorb light in the near UV to visible wavelength range, in climate models is necessary to represent an abundant atmospheric constituent and to improve OA radiative forcing estimates. However, the large degree in variability of laboratory and field measurements of BrC properties makes model representation difficult. We utilized in-situ observations of BrC absorption from the DC3, SEAC4RS, ATom, WE-CAN, and FIREX-AQ flight campaigns to evaluate the GISS ModelE Earth system model BrC scheme. We focused on measurements influenced by biomass burning (BB) and the region of temperate and boreal North America. Average vertical profile comparisons of measured versus simulated absorption, corrected for model biases in carbon monoxide and black carbon (commonly co-emitted with BrC) concentrations, revealed a systematic underestimation in modelled BrC absorption. To explore possible causes of this bias, we evaluated the model's BrC-to-OA relationship. Sensitivity tests were run to determine if parameter changes could improve model performance and therefore substantiate the potential causes of bias identified. Increasing model organic aerosol-to-organic carbon (OA-to-OC) mass ratio for BB and aged OAs greatly improved alignment to measured OA-to-OC but decreased OA burden and increased BrC bias in the upper troposphere. Decreasing wet removal of BrC appeared to partially address the bias in aged air masses and fire plumes, while other potential BrC-specific biases, like missing secondary sources, could not be substantiated. These tests informed an improved configuration of the ModelE BrC scheme with an estimated global, annual average BrC radiative effect of 0.03 ± 0.01 W m−2. This study highlights BrC processes that require further research and future directions for model development.
- Article
(5265 KB) - Full-text XML
- BibTeX
- EndNote


Carbonaceous aerosols consist of black carbon (BC) and organic aerosols (OAs). BC is emitted from combustion of fuel and biomass, while OAs originate from both biomass burning (BB) and secondary organic aerosol (SOA) formation via volatile organic compound (VOC) partitioning (Ito and Penner, 2005; Shrivastava et al., 2017; Mahilang et al., 2021). Though they have similar sources, the two aerosol species have distinct effects as short-lived climate forcers: BC is strongly absorbing (Jacobson, 2001; Ramanathan and Carmichael, 2008; Bond et al., 2013), with an estimated effective radiative forcing (ERF) of 0.11 W m−2, while OAs cool the atmosphere with an estimated ERF of −0.21 W m−2 (Szopa et al., 2021). OAs are expected to grow in importance, as warming temperatures and changes in precipitation drive increased wildfires (Flannigan et al., 2009; Keywood et al., 2013), SOA burdens grow (Tsigaridis and Kanakidou, 2007), and emission controls lead to reductions in anthropogenic aerosols sources (Bauer et al., 2022). Despite this, OAs pose a large gap in aerosol modeling, with an estimated ERF uncertainty of ±0.23 W m−2, greater than the magnitude of the forcing itself (Szopa et al., 2021). To improve estimates of OA cooling, the subset of OAs that absorbs light, brown carbon (BrC), must be represented in climate models.
BrC is a classification of aerosols, rather than a specific compound or compounds class. It is characterized by its spectrally-dependent absorption in the near-UV to visible wavelength range, with less absorption at longer visible wavelengths (Laskin et al., 2015). Like other OAs, it is emitted by smoldering fires and other incomplete combustion (McMeeking et al., 2009; Chakrabarty et al., 2010), but can also form as an SOA from gaseous or aqueous precursors (Lee et al., 2014). Observations of BrC have shown its properties have large spatial and temporal variability. For instance, the ratio of BrC to non-absorbing OA in BB emission varies across different vegetation biomes (Jo et al., 2016), and its imaginary refractive index (RI) varies with combustion conditions and fuel type, in the case of primary BrC (Fleming et al., 2020). BrC also undergoes aging in the atmosphere, with changes in absorption, volatility, and molecular weight over time (Di Lorenzo and Young, 2016; Di Lorenzo et al., 2017; Hems et al., 2021). In terms of absorption, BrC has been shown to brown, leading to increased absorption (Cheng et al., 2020; Schnitzler et al., 2020; Hems et al., 2020), as well as bleach, leading to decreased absorption (Zhao et al., 2015).
Such variability in observed properties makes model representation of BrC difficult. To simulate BrC, models make assumptions and use simplified parameterizations to represent aerosol properties and aging. This, combined with variable baseline model configurations, results in a large range of estimated BrC radiative effect: 0.03–0.57 W m−2 (Feng et al., 2013; Lin et al., 2014; Wang et al., 2014; Saleh et al., 2015; Hammer et al., 2016; Jo et al., 2016; Brown et al., 2018; Wang et al., 2018; Tuccella et al., 2020; Zhang et al., 2020; Carter et al., 2021; Drugé et al., 2022; Xu et al., 2024). Continued evaluation of models with observations and retrievals can help constrain BrC schemes and, therein, BrC radiative effect estimates. The majority of BrC modelling studies use data from the ground-based Aerosol Robotic Network (AERONET; Sinyuk et al., 2020) to evaluate scheme performance (Feng et al., 2013; Lin et al., 2014; Wang et al., 2014; Jo et al., 2016; Brown et al., 2018; Wang et al., 2018; Tuccella et al., 2020; Zhu et al., 2021; Drugé et al., 2022; Skyllakou et al., 2024; Wang et al., 2024; Xu et al., 2024).
In a previous study, we introduced BrC into the NASA GISS ModelE Earth system model (ESM; referred to as ModelE) (DeLessio et al., 2024), then evaluated total model performance with our scheme against AERONET, as well as Moderate Resolution Imaging Spectroradiometer data (MODIS; Levy et al., 2013). We found we were unable to constrain the BrC scheme with these data, primarily due to a limitation in ModelE's radiation scheme: ModelE computes radiative properties, including aerosol optical depth (AOD) and absorbing aerosol optical depth (AAOD) over broad radiation bands, rather than distinct wavelengths (Bauer et al., 2010). For the UV-to-visible (UV-VIS) wavelength range–the BrC relevant range–ModelE produces radiative properties over the entire visible band. These properties are indicative of 550 nm, the spectrally-weighted average of light from 300–770 nm. Our results showed that a BrC scheme did not have a discernible effect on ModelE total AOD and AAOD at this wavelength, inhibiting our ability to constrain the scheme's properties. We were not able to use the absorption Ångström exponent (AAE) retrieval product from AERONET, relevant due to the spectrally-dependent absorption pattern of BrC, because that cannot be computed in ModelE within a radiation band.
Following the work of DeLessio et al. (2024), we used a retrieval of BrC from AERONET to evaluate the ModelE scheme (DeLessio et al., 2025a). In this subsequent study, we were able to constrain our scheme by aligning ModelE's BrC physical and optical properties as closely as possible to those assumed by the retrieval. However, this speciated AERONET retrieval used simplified parametrizations to represent BrC (Schuster et al., 2016), meaning it was not indicative of in-situ BrC chemistry and microphysics. For a more “physically correct” evaluation, we need to look to in-situ measurements of BrC. Laboratory studies have measured in-situ BrC properties, but they utilize either individual compounds as proxies or singular fuel sources in lab-burns (Saleh et al., 2014; Di Lorenzo and Young, 2016; Liu et al., 2016; Tang et al., 2016; Lin et al., 2018; Al Nimer et al., 2019; Shetty et al., 2019; Wong et al., 2019; Li et al., 2020). Here, we focus on flight campaigns that can measure BrC as it is emitted and evolves in the atmosphere, for a more in-depth in model scheme evaluation.
This work follows several studies that have either evaluated their BrC schemes against in-situ measurements from flight campaigns (Wang et al., 2018; Zhang et al., 2020; Carter et al., 2021), or have used them to estimate BrC effect through radiative transfer calculations (Zeng et al., 2020). Past analyses of such measurements have shown an enhancement of BrC absorption, relative to that of BC, in the upper troposphere (Zhang et al., 2017). While the precise mechanism behind this enhancement is not known, some studies propose it's a result of distinct BrC behavior in deep convection (e.g. different processing and removal within a convective cloud environment) or in-cloud production of brown SOA (Wu et al., 2024; Zhang et al., 2020). As observations suggest BrC may be an important climate forcer relative to BC at higher altitudes, it is necessary for models to capture not just total column properties, but also the vertical distribution of BrC. This further supports the use of flight campaigns, which take measurements at varying altitudes, for model evaluation, as they can provide information unavailable in the column products of AERONET and MODIS.
In this study, we present a BB-focused evaluation of ModelE's BrC scheme with in-situ BrC data from five flight campaigns: the Deep Convective Clouds and Chemistry (DC3) campaign, the Studies of Emissions, Atmospheric Composition, Clouds and Climate Coupling by Regional Surveys (SEAC4RS) campaign, the Atmospheric Tomography Mission (ATom), the Western Wildfire Experiment for Cloud Chemistry, Aerosol, Absorption and Nitrogen (WE-CAN), and the Fire Influence on Regional to Global Environmental Experiment-Air Quality (FIREX-AQ). Since each campaign measured other aerosol species simultaneously with BrC, our analysis focuses not just on the vertical profiles of BrC aerosols, but also on the relationships between BrC, total OAs and BC. We first examined model simulated BC compared to campaign measurements to identify general biases in BB aerosols. Then, correcting for model BC bias, we evaluated the base case of BrC representation. Finally, we varied BrC and total OA properties in a series of sensitivity tests. The results of these sensitivity tests informed an updated configuration of the ModelE BrC scheme, which was used to estimate global BrC radiative effect. The analysis of this paper identifies possible sources of bias in ModelE's BrC and OA schemes and proposes improvements in both to reduce them.
2.1 Aircraft measurements
We discuss here, in chronological order, each flight campaign from which aircraft measurements were used for model evaluation. The Deep Convective Clouds and Chemistry (DC3) campaign was conducted over the central and south-eastern US from May to June of 2012 (Barth et al., 2015). The focus of the campaign was storms, with sampling targeting convective inflow and outflows of storms. To evaluate ModelE's BrC scheme, we made use of measurements made on the NASA DC-8 aircraft of OA absorption (which we treat as BrC) and water-soluble organic carbon (WSOC) mass. BrC absorption was measured from liquid extracts of Teflon filters, sampled every 5 min with a 4.1 µm aerodynamic diameter cut-off. For offline analysis, filters were first extracted in water then methanol. Absorption of these extracts were measured in the 200 to 800 nm range, and the water-soluble (WS) and methanol-soluble (MS) absorption at 365 nm was reported in units of Mm−1. WSOC mass concentration was measured from the water extracts in a liquid waveguide capillary cell coupled to a total organic carbon analysis (LWCC-TOC) (Zhang et al., 2017).
To assess whether ModelE captures the relationships between BrC and co-emitted species, we also used total OA mass concentration, OA-to-OC ratio, BC mass concentration, and carbon monoxide (CO) concentration measurements. OA mass and OA-to-OC ratio were measured online with a high-resolution time of flight Aerodyne aerosol mass spectrometer (HR-ToF-AMS; (DeCarlo et al., 2006). Black carbon mass was measured online with a single-particle soot photometer (SP2; Schwarz et al., 2006) and CO was measured online via diode laser spectrometry (Sachse et al., 1987). Finally, to help narrow our analysis to samples impacted by BB, we used the PALMS BB aerosol number fraction, a variable determined through particle analysis by laser mass spectrometry, where single aerosol particles are classified into several particle type (Thomson et al., 2000). The Studies of Emissions, Atmospheric Composition, Clouds and Climate Coupling by Regional Surveys (SEAC4RS) campaign was conducted over a similar region as DC3, from August to September of 2013 (Toon et al., 2016). The goal of this campaign was to investigate atmospheric composition over North America. As such, it included NASA DC8 flights that studied smoke from wildfires in western forests and from agricultural fires in the Mississippi Valley. We used the same measurements, each obtained with similar techniques, from SEAC4RS as DC3 (Zhang et al., 2017).
The Atmospheric Tomography Mission (ATom) conducted flights along the central Pacific and Atlantic oceans, systematically profiling from the near surface up to approximately 13 km above sea-level (Thompson et al., 2022). There was a total of four ATom deployments, with BrC absorption measurements made in ATom-2 (January to February 2017), ATom-3 (September to October 2017), and ATom-4 (April to May 2018). BrC and WSOC ATom measurement techniques were generally consistent with those of DC3 and SEAC4RS. Filter samples were taken at < 5 min intervals at lower altitudes and at a maximum interval of 15 min at higher altitudes (Zeng et al., 2020). Unlike earlier campaigns, absorption was reported at multiple wavelengths between 200 and 800 nm, allowing for a calculation of absorption Ångström exponent (AAE). Only WS BrC absorption was used for evaluation, consistent with Zeng et al. (2020) who noted high blanks associated with methanol extraction. While ATom employed the same measurement techniques for OA mass, BC mass, and BB number fraction as previous campaigns, CO was measured with a Picarro cavity ring-down spectrometer (McKain and Sweeney, 2021). ATom-2 had limited spatial coverage of BrC absorption above the limit of detection (LOD), primarily covering the mid-Atlantic, and did not include WSOC measurements. As such, it was removed from consideration in our study; since ATom-3 and ATom-4 took samples over the mid-Atlantic region, the main region covered in ATom-2 can still be studied using later deployments.
The Western Wildfire Experiment for Cloud Chemistry, Aerosol, Absorption and Nitrogen (WE-CAN) investigated the emissions and evolution of gases and aerosols from wildfires and prescribed burns, primarily over the western US, from July to August of 2018 (Sullivan et al., 2022). This campaign included online measurements of BrC absorption and WSOC mass taken during C-130 research flights; this is the only campaign in which offline filter measurements were not collected. Instead, a particle into liquid sampler was used to collect aerosols (Zeng et al., 2021). The liquid sample was then passed through an LWCC-TOC for absorption and WSOC measurement. Because this used a particle into liquid sampler, rather than filter extracts, BrC measurements were limited to WS absorption only. OA measurements were made with an AMS (Garofalo et al., 2019), BC was measured with SP2 (specifically using a counter-flow virtual impactor; Shingler et al., 2012), and CO was measured with a quantum-cascade laser (Ren et al., 2012). BB number fraction was not reported for WE-CAN, but such measurements aren't necessary for our analysis, as the campaign design inherently produced samples influenced by BB.
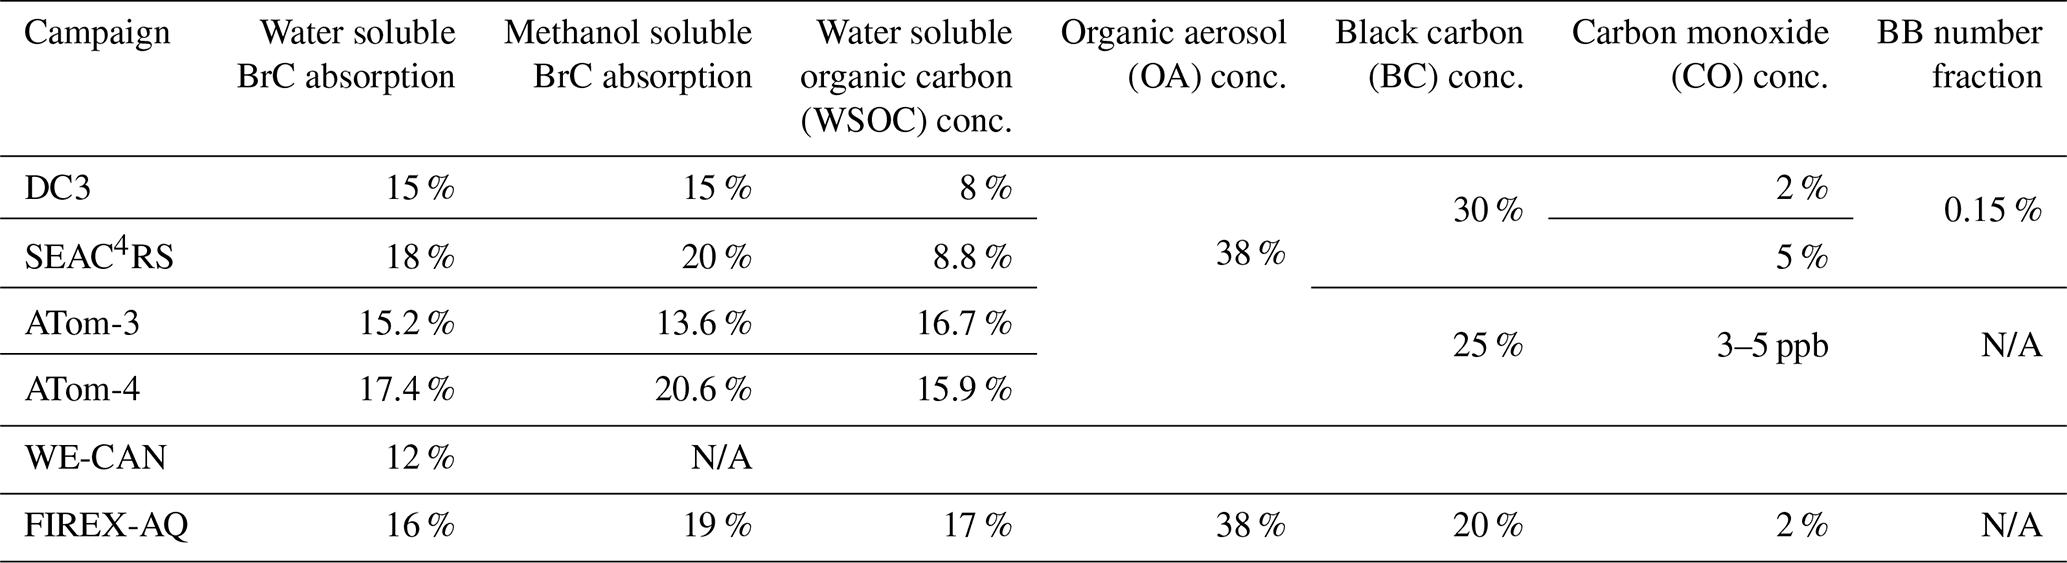
The final campaign we used for evaluation was the Fire Influence on Regional to Global Environmental Experiment-Air Quality (FIREX-AQ) campaign (Warneke et al., 2023). The purpose of this comprehensive campaign was to obtain detailed measurements of trace gas and aerosol emission from wildfires and prescribed burns using aircraft, satellite, and ground-based measurements. FIREX-AQ included NASA DC8 flights designed to characterize fire plumes, deployed over the western and south-eastern U.S. This campaign took both online and offline measurements of BrC, but to be consistent with other campaigns and allow for both WS and MS absorption data (unlike WE-CAN), we are using DC8 filter samples (Zeng et al., 2022). These were subject to the same offline analysis as DC3, SEAC4RS, and ATom. Like the latter, BrC absorption is provided at multiple wavelengths, allowing for a calculation of AAE (Zeng et al., 2021). Measurement of co-emitted species was consistent with DC3 and SEAC4RS campaigns, with OA measured via AMS, BC via SP2, and CO via diode laser spectrometry. Unlike these campaigns, however, OA-to-OC ratio was not available in FIREX-AQ merged data. Like WE-CAN, BB number fraction was not reported and not needed, as this campaign focused on BB plumes. The list of variables used for evaluation from each campaign, along with their associated measurement uncertainties (when available) are provided in Table 1.
Table 1Reported (either in published papers about flight campaigns or in information about flight instruments) uncertainties of measured variables used in this study. N/A is specified if the data wasn't collected or used for analysis in this study. We were unable to find uncertainty information for several WE-CAN variables, so these boxes have been left blank.
Some additional treatment of BrC absorption measurements was required for comparison to model output, as the campaign measurements used were absorption in dissolved solution (“bulk”), not ambient suspended particle absorption. To estimate ambient BrC absorption, we follow the procedure used by previous studies and multiply bulk measurements by a factor of 2 (Zhang et al., 2017; Wang et al., 2018; Zeng et al., 2020). Additionally, when MS BrC measurements aren't available (for instance in ATom and WE-CAN campaigns) or are below instrument limit-of-detection, we follow previous studies, assume the WS fraction makes up about 50 % of total absorption, and thus multiply that absorption by 2. So, in the case where only WS BrC bulk absorption is reported, we would multiply that value by a factor of 4 to get from WS to total, and then from bulk to ambient absorption. If WS BrC is also not available, the entire datapoint is excluded. The factor of 2 for WS to total absorption conversion is inherently uncertain, as studies have reported this ratio ranging from 25 % to 80 % (Zeng et al., 2020), and some have specifically noted that water-insoluble (WI) BrC is more absorbing than WS (Laskin et al., 2015; Lin et al., 2018). If that latter is true, then a factor of 2 may bias the total measured BrC absorption low. The magnitude and spatial distribution of resulting BrC absorption data from each campaign, filtered for values below LOD and converted to total ambient absorption, can be seen in Figs. 1 and 2.
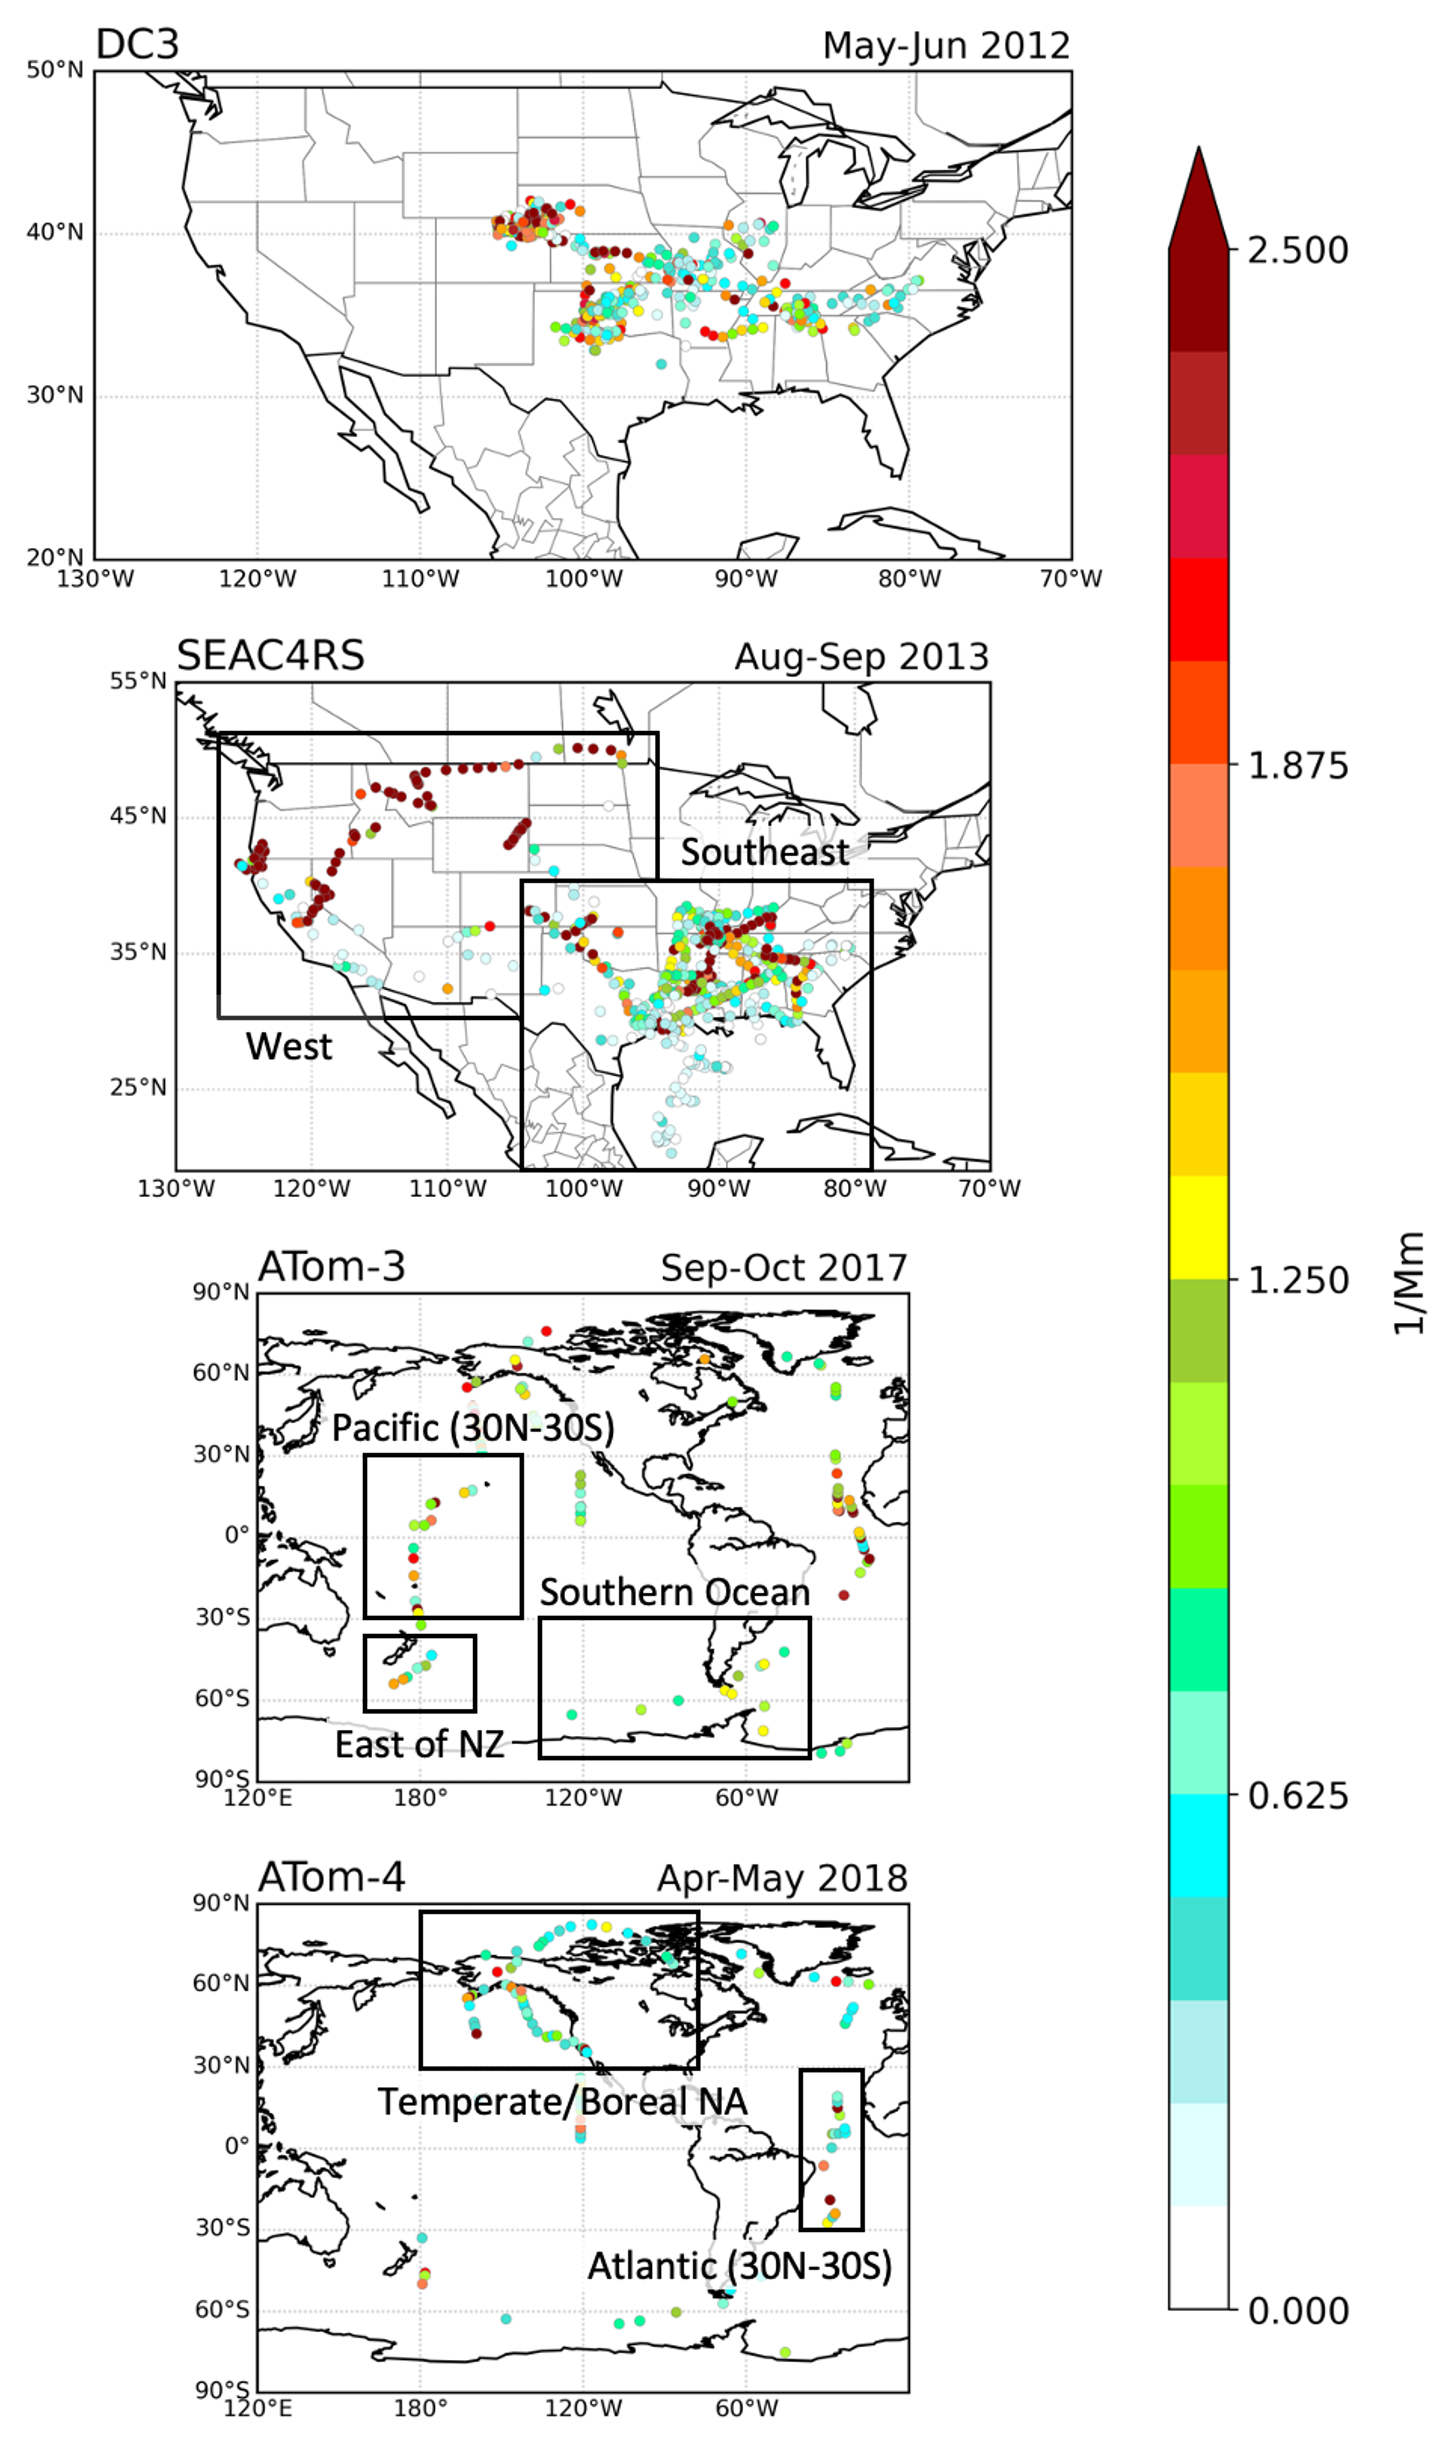
Figure 1Map of BrC absorption coefficient measurements, at 365 nm, collected during the DC3, SEAC4RS, ATom-3, ATom-4 flight campaigns. Total ambient absorption is calculated from water soluble (WS) and, if available, methanol-soluble filter measurements above the reported limit of detection. Regions identified for analysis are shown in black boxes and labelled. “Temperate/Boreal NA” refers to Temperate and Boreal North America, while “East of NZ” refers to the region southeast of New Zealand.
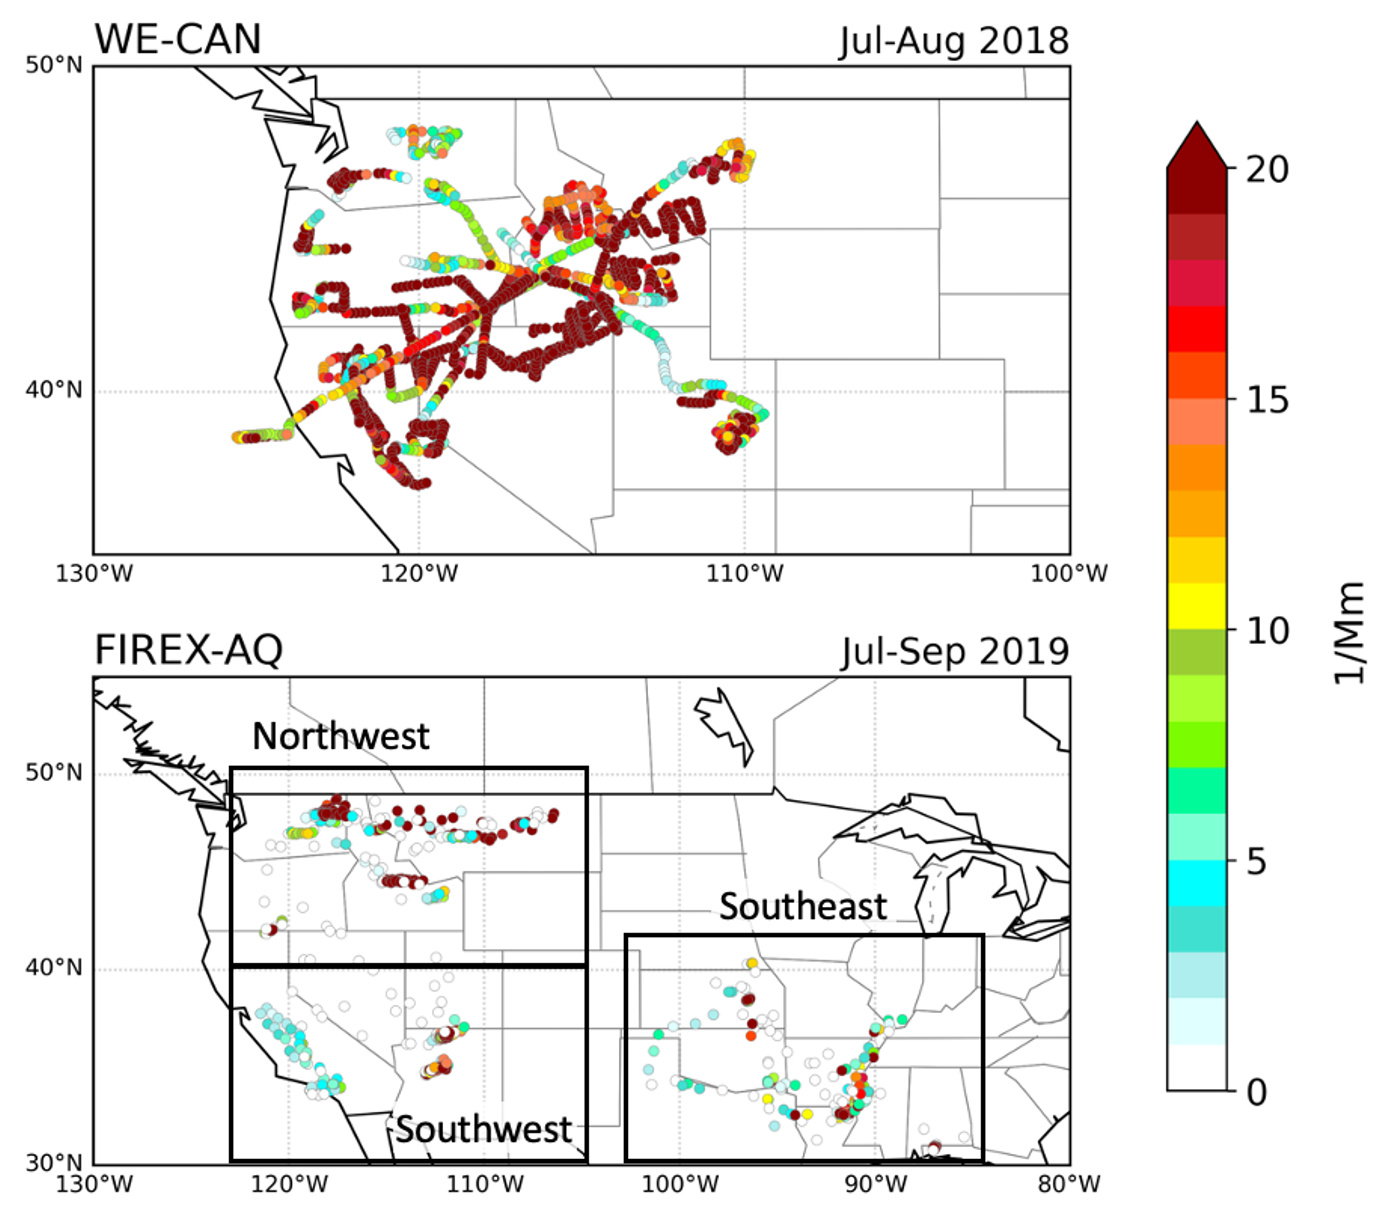
Figure 2Map of BrC absorption coefficient measurements, at 365 nm, collected during the WE-CAN and FIREX-AQ flight campaigns. WE-CAN ambient absorption is calculated from online WS absorption measurements, while FIREX-AQ ambient absorption is calculated from water soluble (WS) and, if available, methanol-soluble filter measurements above the reported limit of detection. Regions identified for analysis are shown in black boxes and labelled.
Campaign data shown in Figs. 1 and 2 are grouped into labelled-regions for narrowed analysis, with the exceptions of the DC3 and WE-CAN campaigns that took measurements over smaller areas. To avoid overlap, regions covered by both ATom-3 and ATom-4 are only examined in one campaign. Further, measurements from ATom flight tracks with limited temporal coverage (that fall into too few model, 30 min timesteps), for instance the track along 120° W, are excluded.
2.2 Model description and experiments
2.2.1 The GISS ModelE Earth System Model
We used version 2.1 of the GISS ModelE Earth system model (“ModelE”) (Kelley et al., 2020), with a horizontal resolution of 2° latitude by 2.5° longitude and 40 vertical layers from the surface to 0.1 hPa, for this study. For aerosol representation, we used the One-Moment Aerosol (OMA) module (Bauer et al., 2020), which is fully interactive within ModelE in terms of emissions, transport, removal, climate, and chemistry. OMA is a mass-based scheme where aerosols are assumed to have prescribed and constant size distributions. Represented aerosol components are sulfate, nitrate, ammonium, dust, sea salt, and carbonaceous aerosols. The latter consist of BC and OAs from both non-BB anthropogenic and BB sources. Biogenic SOA formation is simulated with a two-product model, producing aerosols from isoprene and α-pinene gases. These are the only sources of SOA in ModelE, as aromatic gases which would produce aromatic SOA are not explicitly represented. Sea salt, dimethyl sulfide (leading to methanesulfonic acid), isoprene, and dust emission fluxes are calculated interactively, while all other emissions (including BB fluxes) are prescribed. OA emissions inputs are in units of mass of organic carbon, while ModelE tracks OAs and provides output in units of total organic aerosol mass. To convert between these, ModelE uses an organic aerosol-to-organic carbon (OA-to-OC) ratio of 1.4 : 1. This OA-to-OC ratio value is consistent with OA schemes used in other models (Tsigaridis et al., 2014) and is constant across all OAs. In this study, however, we investigate the effect of varying this ratio on model performance relative to campaign data (see Sect. 3.3.1). In the model default, all OAs have the same hygroscopicity (κ factor; 0.15), solubility (fraction of aerosol that dissolves in water; 0.8), density (1.5 g cm−3), and radius (0.2 µm).
OMA aerosols are removed from the atmosphere through wet and dry deposition. Wet deposition of aerosols can occur either through in-cloud scavenging or rainout. In-cloud scavenging relies on the aerosol fraction considered water soluble as well as cloud properties, while rainout relies only on cloud properties and precipitation (it is independent of aerosol composition by using a universal factor for all aerosols; Koch et al., 1999). In terms of dry deposition, the deposition velocity of particles is parameterized in ModelE to represent both gravitational settling and turbulent dry deposition. This deposition velocity, along with particle mass concentrations above the surface and a parameterization of turbulent transfer, are used to determine net surface flux (Clifton et al., 2024).
Aerosol-radiation interactions (ARIs) and aerosol-cloud interactions (ACIs) are calculated within the radiation and cloud schemes. Mie scattering is used to compute size-dependent scattering properties of clouds and aerosols, with wet aerosol size and complex RI as inputs. Apart from swelling with water and coating of mineral dust, all OMA aerosols are treated as externally mixed. Optical properties, and therein ARIs, are computed for wide wavelength bands rather than specific wavelengths – 6 bands in the shortwave (SW) and 33 in the longwave (LW) (Bauer et al., 2010). The UV-visible (UV-VIS) radiation band (1 of 6 SW bands) extends from 300 to 770 nm, so spectrally-weighted optical properties for the entire band are approximately equivalent to properties at 550 nm. OMA also includes the first indirect effect of aerosol-cloud interactions (ACIs; Bauer et al., 2020).
2.2.2 Brown carbon scheme
The BrC aerosol scheme (DeLessio et al., 2024) includes four key properties, or processes, defined to simulate BrC aerosols: BB emissions, formation of secondary BrC, optical properties (specifically, absorption) of primary and secondary BrC, and chemical aging of primary BrC. All other aerosol properties, including removal, density, hygroscopicity, and real RI are consistent with other OAs (see Sect. 2.2.1). DeLessio et al. (2024) provides a detailed description of the scheme, including how each of the four properties/processes was estimated and justified, but we also provide a summary here. Regarding BB emissions: BB inventories don't currently include BrC. So, to simulate the emissions of primary BrC, a proportion of prescribed, BB OA emissions are considered brown, and the remaining portion considered non-absorbing. To determine this proportion, DeLessio et al. (2024) looked at BrC-to-OA emissions ratios used by similar modeling studies and calculated a ratio using a parameterization of BC-to-OA BB emissions ratio from the Community Emissions Data System. On average, other models used a ratio of 0.35 (Feng et al., 2013; Wang et al., 2014; Jo et al., 2016; Zhang et al., 2020), and the global average ratio of the BC-to-OA parameterization was 0.366, so 0.35 was used as the proportion of BB OA emissions attributed to BrC. The same ratio, 0.35 BrC-to-OA, was used in the current study.
BrC tracers have the same real RI as non-absorbing OAs, 1.53, but are distinguished by their absorptivity. To simulate secondary BrC, distinct, non-zero imaginary RIs (iRIs) were assigned to four biogenic SOA species in ModelE. These values were based on high- and low-NOx mass absorption efficiency (MAE) measurements of isoprene and α-pinene SOAs (Liu et al., 2016), and were ≤ 0.002 in the UV-VIS band, making secondary BrC weakly absorbing. Similarly, a non-zero iRI of 0.0165 was assigned to primary BrC. DeLessio et al. (2024) used two different parameterizations to estimate a range of reasonable iRIs of emitted BrC; 0.0165 was the midpoint of this range. Since BrC demonstrates limited absorption past 800 nm (Laskin et al., 2015), BrC optical properties were only modified in the UV-VIS band; the optical properties of BrC in all other bands are the same as non-absorbing OAs. UV-VIS band BrC RIs are provided for reference in Table A1.
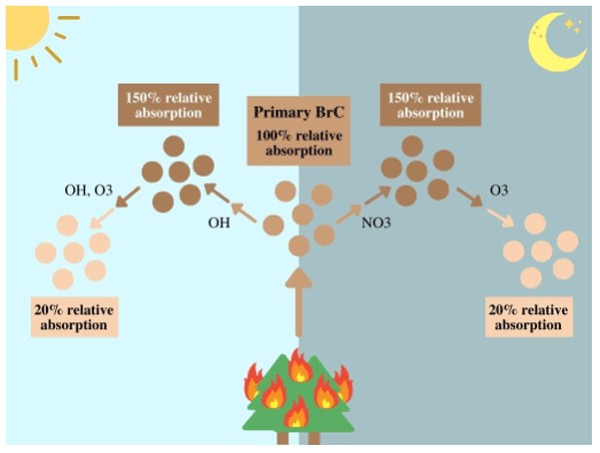
Finally, an oxidant-concentration-driven aging scheme was introduced to simulate primary BrC aging: the heterogenous browning and bleaching of BrC is represented as mass transferred between BrC species with iRIs proportionally higher (more-absorbing) or lower (less-absorbing) than emitted BrC. Mass transfer between these primary BrC tracers occurs at a rate determined by second-order rate constants for each reaction of BrC with hydroxyl and nitrate radicals and with ozone. Specifically, emitted BrC browns according to hydroxyl and nitrate radical concentrations, then that more-absorbing BrC bleaches according to hydroxyl and ozone concentrations. A diagram of this aging scheme is reproduced from DeLessio et al. (2024) in Appendix A (Fig. A1) for reference. The typical chemical lifetimes of ModelE-simulated emitted and “browner” BrC in this scheme are 9.36 h and 6.79 min, respectively. Therefore, the entire aging process occurs on average over about 10 h, consistent in magnitude with atmospheric lifetimes predicted by laboratory studies, with browning over several hours and rapid bleaching (Hems et al., 2021; Zhao et al., 2015).
Together, these four scheme properties make up the “base case” of BrC representation. These parameters are based on laboratory and field studies, but they naturally use assumptions and simplifications, like the fact that they are constant throughout a simulation. BrC properties remain consistent with the original scheme introduced in DeLessio et al. (2024). As noted in Sect. 1, the previous two studies utilizing this ModelE scheme were either unable to constrain BrC properties (DeLessio et al, 2024) or constrained properties against data that does not represent in-situ chemistry and physics (DeLessio et al., 2025a). Thus, this study aims to improve the ModelE BrC scheme by constraining the same representation case through a different evaluation approach.
There are limitations in this BrC scheme that should be noted. Firstly, as noted in Sect. 2.2.1, ModelE optical properties are computed over wide wavelengths bands, with the UV-VIS band encompassing nearly the entire range at which BrC absorbs light. As a result, ModelE is not able to capture the spectral dependence of BrC absorption in UV-VIS wavelengths. Another limitation is that OMA aerosols, and therefore BrC aerosols, are externally mixed. This represents a simplification that may not be representative of in-situ microphysics. The BrC scheme is also missing some BrC sources and processes. As noted in Sect. 2.2.1, aromatic gases and therefore aromatic SOAs are not explicitly represented in ModelE. Since these SOA have been shown to absorb light (Liu et al., 2016; Li et al., 2023), this may cause BrC absorption to be underestimated. However, this is partially balanced by the fact that brown biogenic SOA do not bleach in the current scheme: the BrC aging scheme is incompatible with the two-product model used to parameterize semi-volatile biogenic SOA in ModelE. Finally, this scheme does not include aqueous-phase or in-cloud production of BrC: while there are limited observations, some studies have suggested this could be an important source of BrC at higher altitudes (Zhang et al., 2017, 2020; Kuang et al., 2025; Wu et al., 2024).
2.2.3 Simulations for evaluation
Nudged, transient model simulations were used for comparison against campaign data. After a five-year spin-up, 30 min output was produced for each day covered by each flight campaign. 30 min is the highest temporal resolution available, as that is the length of a single ModelE time step. The specific dates for these periods of high temporal resolution model output can be seen in Appendix A (Table A2). BB emissions, including BrC, BC, and total OAs, were prescribed by the Global Fire Assimilation System version 1.2 (GFAS; Kaiser et al., 2012). GFAS was used, instead of other fire emission inventories, because it contains information of plume injection height in each grid cell rather than the model default of emissions injected uniformly in the boundary layer. Since GFAS provides daily emissions, ModelE divides those by the number of time steps in a UTC-day to generate constant emissions for each 30 min time step. This must be kept in mind in evaluating the model, as real-time fire emissions sampled by flights typically follow a strong diurnal cycle and are not constant. This limitation could result in an underestimation of fire emissions during the day, and an overestimate during the night (Tang et al., 2022). All other prescribed fluxes (referenced in Sect. 2.2.1) are from the Community Emissions Data System (CEDS; Hoesly et al., 2018). These simulations were nudged towards 3-hourly winds provided by Modern-Era Retrospective Analysis for Research and Applications, version 2 (MERRA2; Gelaro et al., 2017). We use the base-case of BrC representation in simulations as a starting point for model comparison, but also run simulations with changes to individual OA or BrC properties for additional sensitivity tests (see Sect. 3.3 for more details).
To “sample” the model for comparison against flight data, the UTC time-step and grid cell each campaign datapoint falls into was determined, based on merged dataset time and location information. Model output from that time step and cell is then pulled out, so it can be compared to the corresponding datapoint. Since flight measurements are typically taken at resolutions shorter than 30 min, datapoints that are in the same grid cell and same 30 min period are grouped together. The spatial resolution of ModelE poses a limitation for exact comparison to campaign measurements: while a flight samples aerosol mass and absorption of a fire plume or, more generally, an inhomogeneous air mass at points along its flight track, the same sample source, if captured by ModelE, is averaged over an entire grid cell. Thus, ModelE can't capture the same magnitude of aerosol properties for aerosol plumes not representative of a broad region, even if all emissions and processes are correct, inherently biasing the model low. To try to resolve this, we multiply model output of BrC, OA, and BC by a CO scaling factor, following Eq. (1):
As fires are a major source of CO, and it has a long atmospheric lifetime, it can be used as a tracer of fires (van der Werf et al., 2017; Zeng et al., 2021; Sullivan et al., 2022; Washenfelder et al., 2022). So, applying such a factor should account for the inability of the model to capture the same magnitude of emissions within the same grid cell. This does not, however, address the potential low bias from emissions or plumes transported in the model falling in an adjacent grid cell and not being sampled. This also introduces some potential uncertainty, as BB is not the only source of CO in the atmosphere. We aim to address this by narrowing analysis to samples influenced by BB whenever possible. This is inherent to samples from WE-CAN and FIREX-AQ, as fire plumes were directly sampled. For DC3 and SEAC4RS, only data with a BB number fraction greater than 0.5 is used. The same filtering cannot be applied to ATom campaigns, as it would leave too limited data for analysis. However, this uncertainty is limited in this case as CO concentrations in ATom regions of analysis are relatively lower and indicative of background levels (< 150 ppbV), suggesting less influence of CO sources (BB or not).
ModelE's calculation of optical properties in radiation bands, rather than distinct wavelengths, must also be addressed to aid flight comparisons. As mentioned in Sect. 2.2.1–2, radiation calculations (relevant to BrC) are done over UV-VIS band, making model BrC absorption coefficient indicative of 550 nm. Since most campaigns report BrC absorption at 365 nm (see Sect. 2.1) we use this wavelength for evaluation, and an AAE value must be used to convert ModelE absorption from 550 to 365 nm. When measured BrC absorption is available at multiple wavelengths (in ATom and FIREX-AQ campaigns), we calculate AAE for each datapoint. When this isn't available, we assume a UV-VIS AAE value of 5.25, consistent with the average of a uniform AAEBrC distribution from 4.1 to 6.4, as discussed in Zhang et al. (2017). Just as the imaginary RI of BrC varies with combustion source and processing, AAEBrC likely varies in the atmosphere (Forrister et al., 2015; Sumlin et al., 2018), so assuming one value for this introduces additional uncertainty to our analysis.
3.1 Background biases in BC comparisons
To evaluate model simulations of aerosols, each campaign measurement, along with ModelE data sampled in the same model timestep and grid cell (see Sect. 2.2.3), is binned into 500 m altitude bins ranging from the surface to 14 km. The median of datapoints is then compared over the entire campaign period and the horizontal extent of the identified region of analysis (or the entire measurement area, as is the case for DC3 and WE-CAN campaigns). The result is a vertical profile, showing horizontally- and temporally-grouped median aerosol concentration, or absorption, measured in-situ and simulated by ModelE, as a function of altitude. The focus of this study is ModelE's BrC and OA scheme, specifically their simulation of BB-influenced airmasses. But because BC is often co-emitted with BrC and OAs from BB (Lack et al., 2012; Saleh et al., 2014; Pokhrel et al., 2016) it is helpful to first look at the performance of ModelE's BC simulation: if there are biases in model BC concentrations, subsequent biases seen in BrC could be a result of general aerosol processing or BB emissions, rather than specific improvements needed for BrC and OA representation.
We present vertical profiles of median BC mass concentration over land, or in regions assumed to be near BB sources, in Fig. 3. Figure 4, on the other hand, shows median BC profiles in more remote regions. In each of these figures, model-simulated BC is compared to campaign measurements, which in turn have an uncertainty between 20 %–30 % (see Table 1). This is important to keep in mind, as model evaluation against these measurements will have some inherent uncertainty. As mentioned previously, ModelE simulated data are multiplied by a CO-scaling factor. The vertical profiles of median campaign and ModelE CO, for near-source and remote regions, are provided in Appendix A for reference (see Figs. A2–A3).
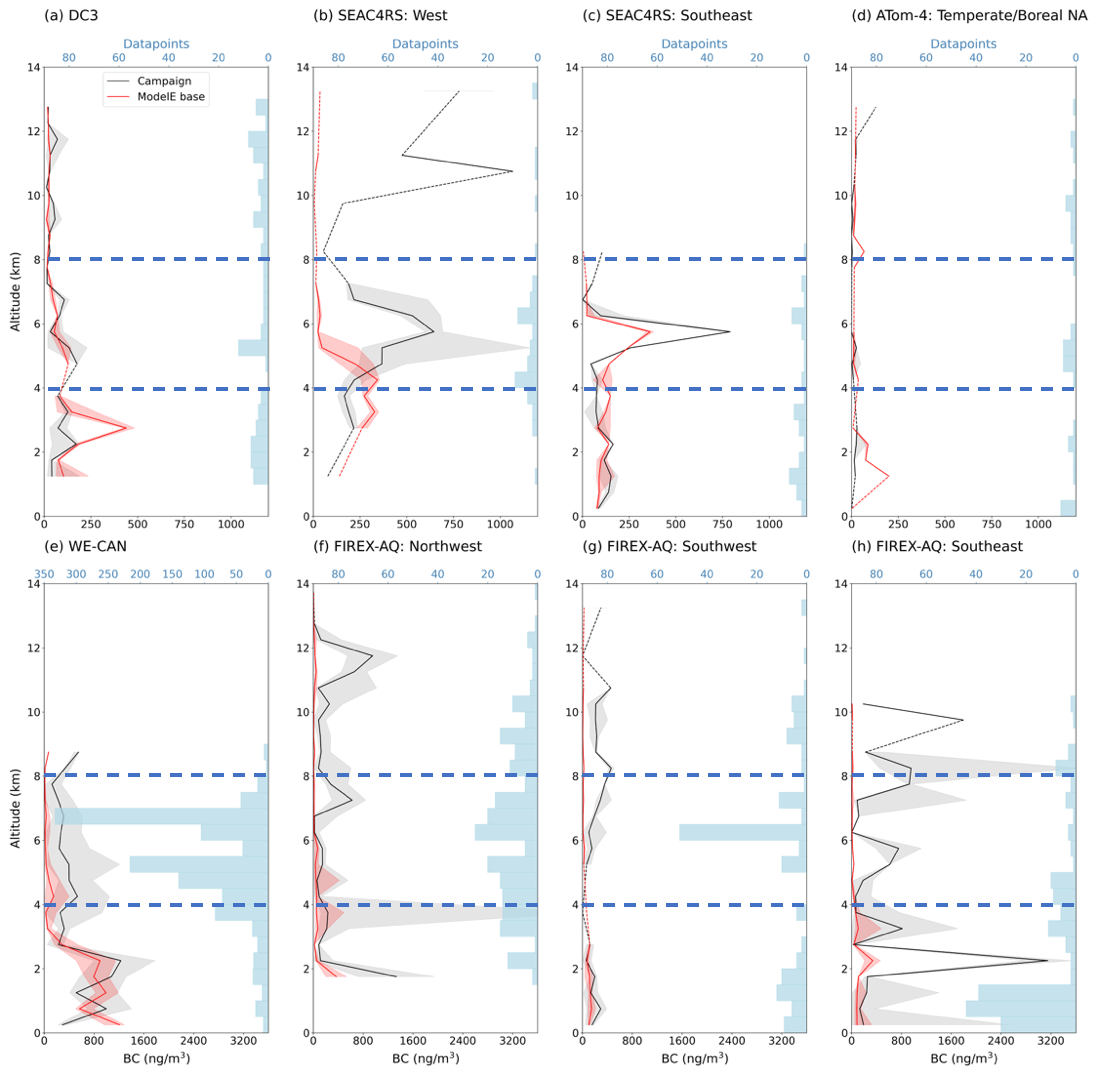
Figure 3Vertical profiles of median BC mass concentration measured by flight campaigns (black) and simulated by ModelE's base case of BrC representation (red), over land/near sources, reported in units of ng m−3. Model data has been multiplied by a CO scaling factor (Eq. 1) and is plotted at the mid-point of each altitude bin. Campaign and specific region of analysis is indicated on the top left of each plot. Dashed lines provide linear interpolation over altitudes with no data to allow for easier interpretation of results. Shaded areas show variability (expressed as the interquartile range – IQR) of BC mass in each altitude bin, blue bars show the number of datapoints grouped in each bin. Horizontal blue dashed lines separate profiles into the lower-troposphere (0–4 km), the mid-troposphere (4–8 km), and the upper-troposphere (8–14 km). Data from DC3 and SEAC4RS campaigns have been further filtered for datapoints with BB aerosol number fraction greater than 0.5 to narrow analysis to BB-influenced samples. Note: this BB fraction filter was not applied to ATom, despite it being measured in that campaign, because it would reduce the already limited amount of data for analysis.
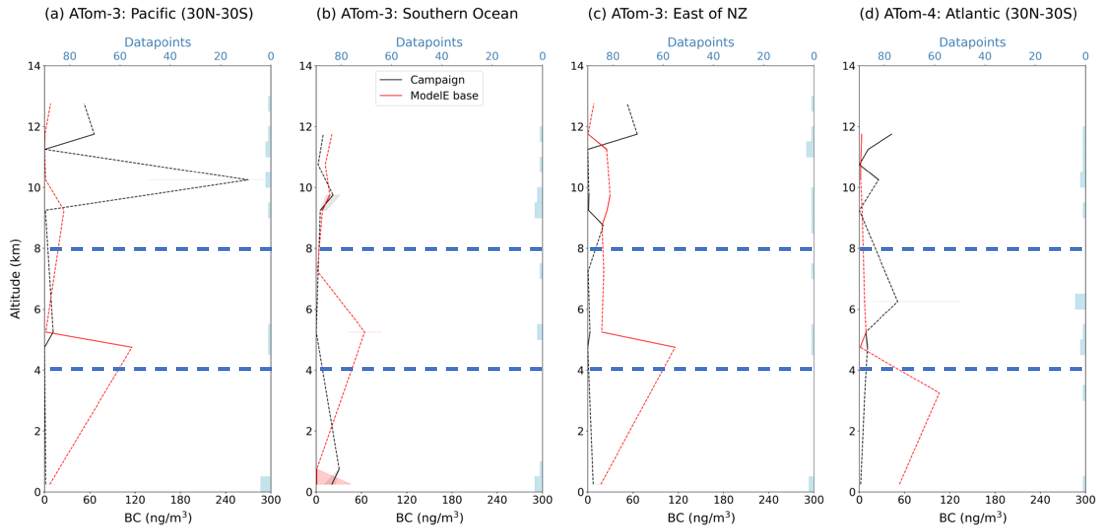
Figure 4Vertical profiles of median BC mass concentration, measured by flight campaigns (black) and simulated by ModelE's base case of BrC representation (red), in remote regions, reported in units of ng m−3. Consistent with Fig. 3, a CO scaling factor (Eq. 1) has been applied to model data, the midpoint of altitude bins is plotted, campaign and specific region of analysis is indicated on the top left of each plot, dashed lines interpolate over altitudes with no data, shaded areas show the IQR of BC in each altitude bin, blue bars show the number of datapoints grouped in each bin, and horizontal blue dashed-lines separate the lower-, mid-, and upper-troposphere. Unlike Fig. 3, there is no BB number fraction filter applied, as data is already limited.
Looking at the near-source regions in Fig. 3, there is low model bias in the lower-troposphere, with ModelE capturing or slightly overestimating BC mass, except in the case of northwest and southeast FIREX-AQ (Fig. 3f, h). In these regions, the model appears to underestimate BC near the surface. As mentioned previously, there is some negative bias due to dilution: any fire plume sampled by FIREX-AQ would be averaged out over an entire grid-cell in ModelE, inherently decreasing simulated BC magnitude. However, although the WE-CAN campaign also sampled aerosols directly from fire plumes, ModelE appears to align well with WE-CAN-measured BC mass in the lower-troposphere. Another possible cause of underestimated BC mass near the surface is low, or even missing, BB aerosol emissions over the US during the FIREX-AQ campaign period (July–September 2019). Since the model's BB emissions are prescribed by GFAS2.1, we don't explore this possible bias further, as the evaluation of a fire emissions inventory is beyond the scope of this work.
In the mid-troposphere, ModelE slightly underestimates BC concentrations in most near-source regions (Fig. 3b–c, e–h). There are several possible explanations for such negative biases at these altitudes. Low BB emissions including a possible underestimation due to ModelE's lack of diurnal emissions, as discussed previously, could bias aerosol mass low in the entire air column. However, since model BC is close to campaign data across most campaigns in the lower-troposphere of near-source regions, emissions is likely not a systematic cause of bias. Transport is another possible source of bias here: if ModelE doesn't simulate the vertical or horizontal transport of plumes or air masses as they occurred in the atmosphere, our analysis would show negative biases even if the correct magnitudes of BC mass were simulated. As ModelE is an Eulerian ESM, we cannot quantify this potential bias. Finally, excess removal could contribute to low model BC in the mid-troposphere. A case study about the effect of cloud layers on tropospheric aerosols during SEAC4RS noted that layers of altocumulus (Ac) clouds in the mid-troposphere can cause the detrainment of aerosols, followed by microphysical processing and scavenging (Reid et al., 2019). It is possible that ModelE simulates too much scavenging, or too many clouds, and therefore removal of BC aerosols in such detrainment layers, creating a negative bias. This cannot be definitively stated, though, as studying cloud cover or the incidence of clouds at this altitude was beyond the scope of this work.
This negative BC bias isn't observed in the mid-troposphere with DC3 and in the ATom-4 temperate and boreal North America region (Fig. 3a, d). These campaigns have the lowest BC concentrations in near-source regions, suggesting ModelE is less able to capture mid-troposphere BC mass at higher magnitudes. While there is more limited data, results in near-source upper troposphere follow a similar pattern as the mid-troposphere. In the lower and mid-troposphere over remote regions (Fig. 4), the model tends to overestimate low magnitude BC mass in ATom-3 Pacific, Southern Ocean, and East of NZ remote regions (Fig. 4a–c), again suggesting negative bias in ModelE doesn't occur with small BC concentrations. BC is similarly overestimated in the lower troposphere of the ATom-4 mid-Atlantic region but is underestimated in the mid-troposphere (Fig. 4d). This could indicate biases in BC transport or sinks as air masses move over the Atlantic, but it's difficult to draw meaningful conclusions from this, as these regional analyses are more limited in data and show much smaller magnitudes of measured BC mass than that of Fig. 3.
Through this evaluation of model-simulated BC mass concentration, we've identified potential sources of bias–low emissions, imperfect transport, excess scavenging–that are applicable to BB aerosols in general. To evaluate ModelE's BrC and OA schemes (the purpose of this study) we next need to determine if there is specific bias in model OAs, in addition to biases seen by BC aerosols. Figure 5 shows a scatterplot of BC versus total OA mass concentrations, for campaigns and ModelE.
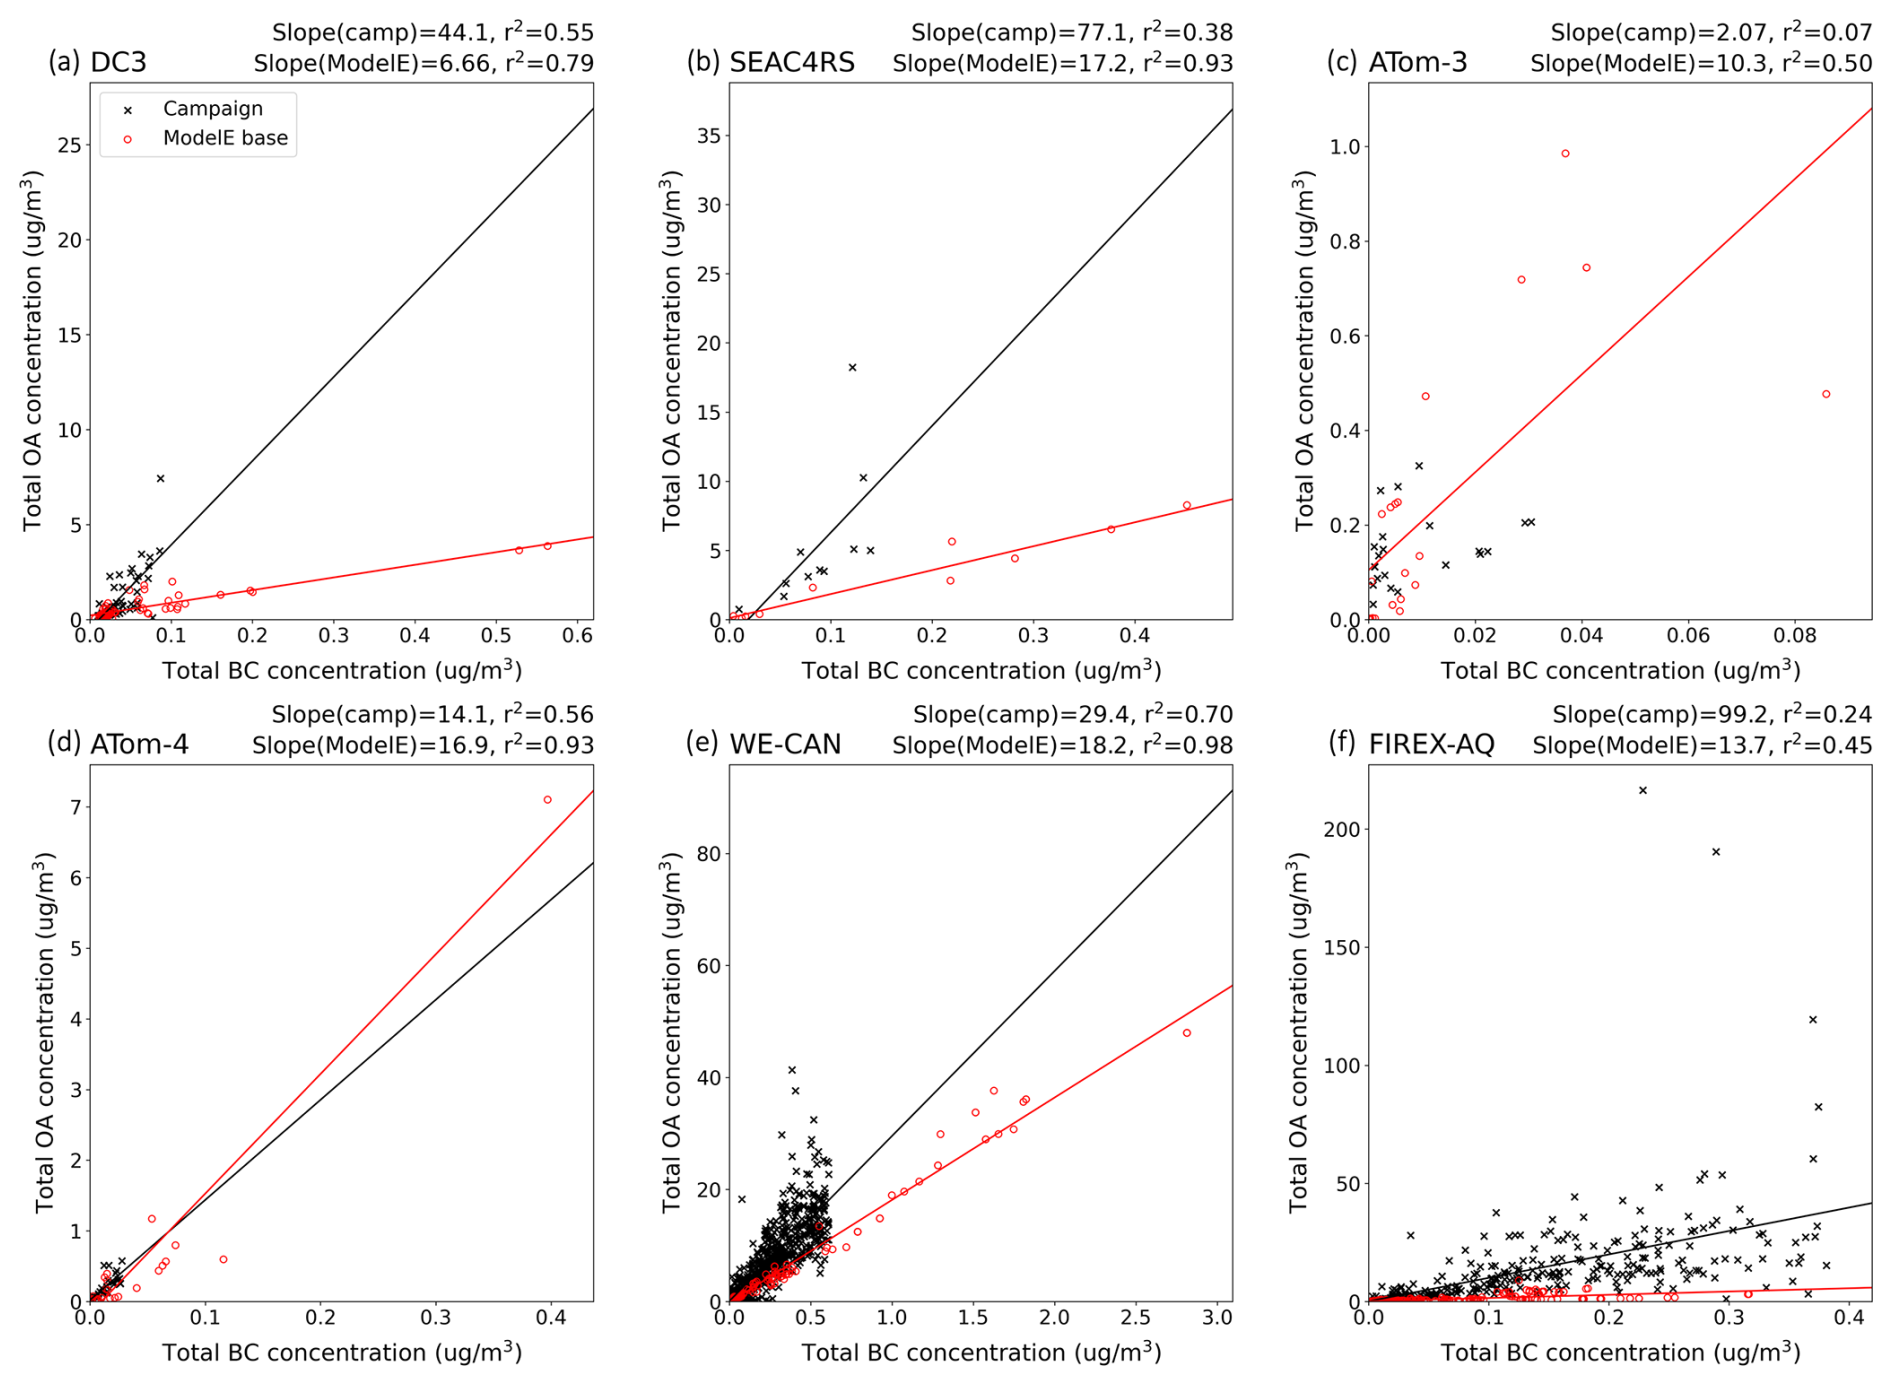
Figure 5Total OA concentration plotted against BC concentration, both in units of µg m−3, as measured by flight campaigns (black x's) and simulated by ModelE (red o's). For each campaign (labelled on the top-left of each plot), data has been filtered to remove points outside of the regions used for vertical profile analysis and points outside the IQR (to ensure consistent comparison with vertical profiles). Linear regression lines are included, and the slope and r2 of these regressions are displayed on the top-right of each plot.
This shows that in most near-source regions (Fig. 5a–b, e–f), ModelE underestimates the ratio of OAs to BC. The model appears closer to the OA-to-BC relationship in ATom-3 and ATom-4, but data is more limited in these campaigns. It should be noted that these observed relationships are not definitive, as campaign OA concentration measurements have an uncertainty of 38 % (see Table 1), in addition to BC measurement uncertainty. Nonetheless, these results suggest that, in some regions, there is bias specific to ModelE organics. To explore this further and remove the general BB aerosol biases seen in BC from consideration, we applied an additional scaling, or correction, factor to model output of BrC and OAs. The factor is calculated following Eq. (2):
By multiplying model output by this factor, in addition to the CO-scaling factor (see Eq. 1), we can look at BrC scheme performance and remove from consideration biases in model processes that are not unique or specific to BrC and OAs. This does not mean related components, like the model's ability to capture a fire and transport its plume, are unbiased, but that these biases are not the focus of our study. Like the CO-factor, this BC-scaling factor introduces some uncertainty as ModelE BC can be produced from industrial combustion, in addition to BB. As mentioned previously, we aim to address this by narrowing focus to BB samples whenever possible. The combined use of CO and BC factors together further limit these uncertainties: BC and CO are emitted in higher relative quantities through incomplete BB (compared to anthropogenic combustion), and the two species have distinct lifetimes (approximately 3 months and 1 week for CO and BC, respectively). So, an observed peak in both likely corresponds to BB, and when both factors are applied to scale-up BrC absorption or OA concentrations, it is reasonable to assume this represents a fire event not captured by the model.
3.2 Evaluation of ModelE BrC absorption
Figures 6 and 7 show vertical profile comparisons of median BrC absorption at 365 nm (BrC-Abs) measured in-situ and simulated by ModelE (with CO and BC scaling factors applied), in near-source and remote regions, respectively. It is important to remember that campaign measured absorption has its own uncertainty, with WS-Abs uncertainty between 12 %–18 % and MS-Abs uncertainty between 15 %–21 % (see Table 1). Therefore, the following comparisons cannot be considered definitive, but they do utilize the best available measurements for evaluation. Vertical profiles of median total OAs and WSOC mass concentrations, with the same scaling factors applied, are provided in Figs. A4–A7, for reference.
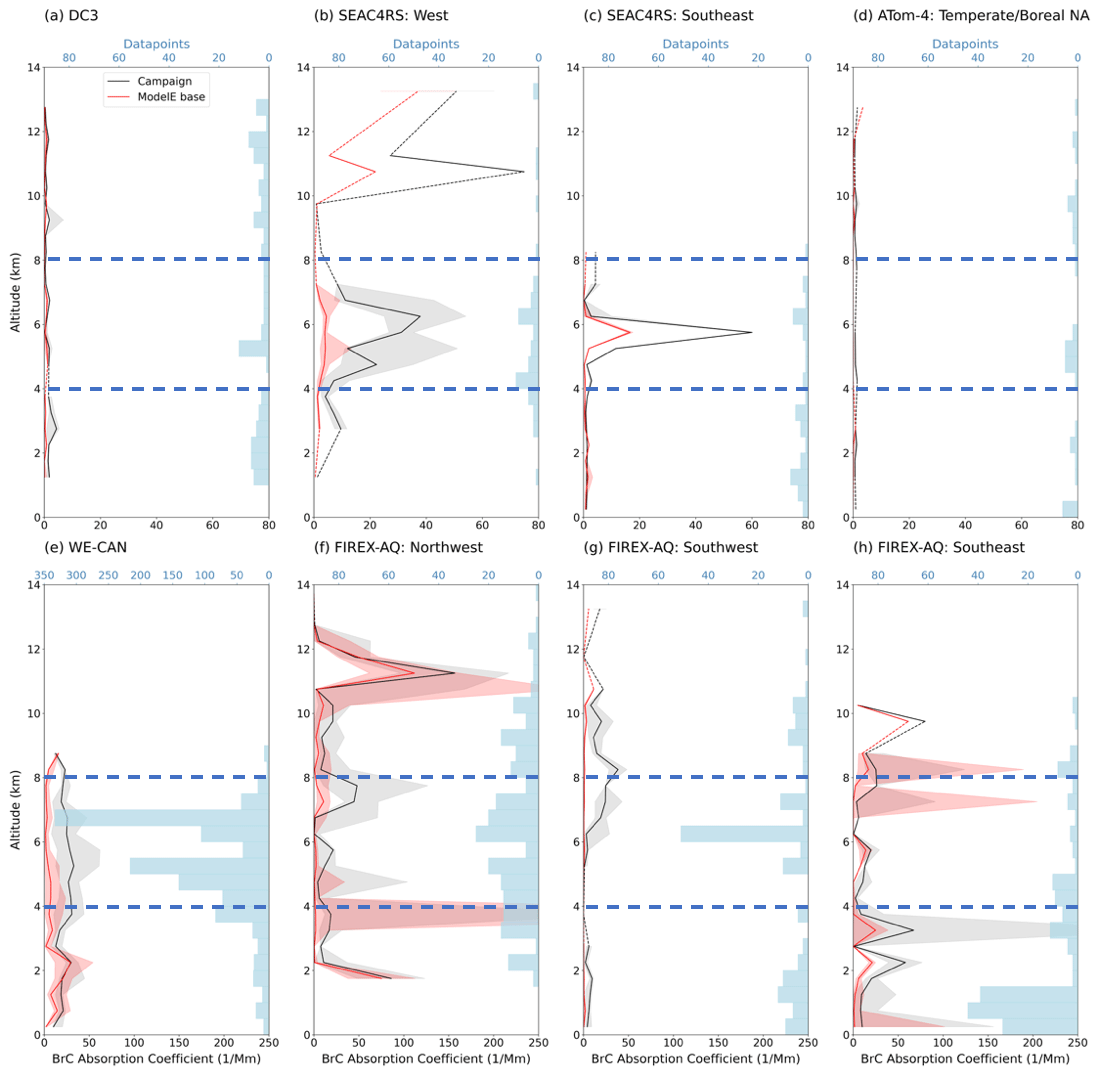
Figure 6Vertical profiles of median BrC absorption (BrC-Abs) at 365 nm, measured by flight campaigns (black) and simulated by ModelE's base case of BrC representation (red), over land/near sources, reported in units of Mm−1. Model absorption has been multiplied by a CO and BC scaling factor (Eqs. 1–2). Consistent with Figs. 3 and 4, campaign and specific region of analysis is indicated on the top left of each plot, the midpoint of altitude bins in plotted, dashed lines interpolate over altitudes with no data, shaded areas show the IQR of data (here, BrC-Abs) in each altitude bin, blue bars show the number of datapoints grouped in each bin, and horizontal blue dashed-lines separate the lower-, mid-, and upper-troposphere. Data is also filtered for BB number fraction (when relevant).
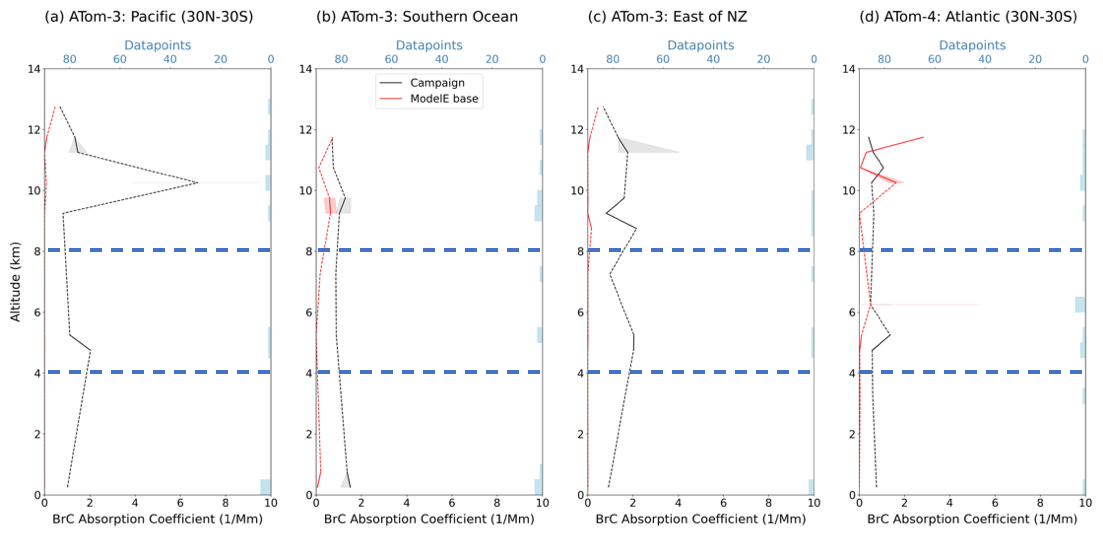
Figure 7Vertical profiles of median BrC absorption (BrC-Abs) at 365 nm, measured by flight campaigns (black) and simulated by (red), in remote regions, reported in units of Mm−1. Consistent with Fig. 6, a CO and BC scaling factor (Eqs. 1–2) have been applied to model data, campaign and specific region of analysis is indicated on the top left of each plot, the midpoint of each altitude bin is plotted, dashed lines interpolate over altitudes with no data, shaded areas show the IQR of BrC-Abs in each altitude bin, blue bars show the number of datapoints grouped in each bin, and horizontal blue dashed-lines separate the lower-, mid-, and upper-troposphere. Data is not filtered for BB number fraction.
ModelE appears to underestimate BrC-Abs across most regions and altitudes. To confirm this, we calculated the relative differences between model-simulated and campaign-measured median BrC-Abs, following to Eq. (3):
Table 2 provides average relative differences for the lower-, mid- and upper troposphere as well as the entire atmospheric column, across all campaigns and sub-regions of analysis.
Table 2Relative difference of median BrC absorption (calculated according to Eq. 3) for each campaign and sub-region of analysis. Averages of these differences are provided for the lower (0–4 km), mid- (4–8 km), and upper troposphere (8–14 km), as well as the entire atmospheric column. Campaigns and sub-regions are listed in the same order they appear in vertical profile analyses for near-source (Figs. 3 and 6) and remote (Figs. 4 and 7) regions. “Temperate/Boreal NA” refers to Temperate and Boreal North America, while “East of NZ” refers to the region southeast of New Zealand.
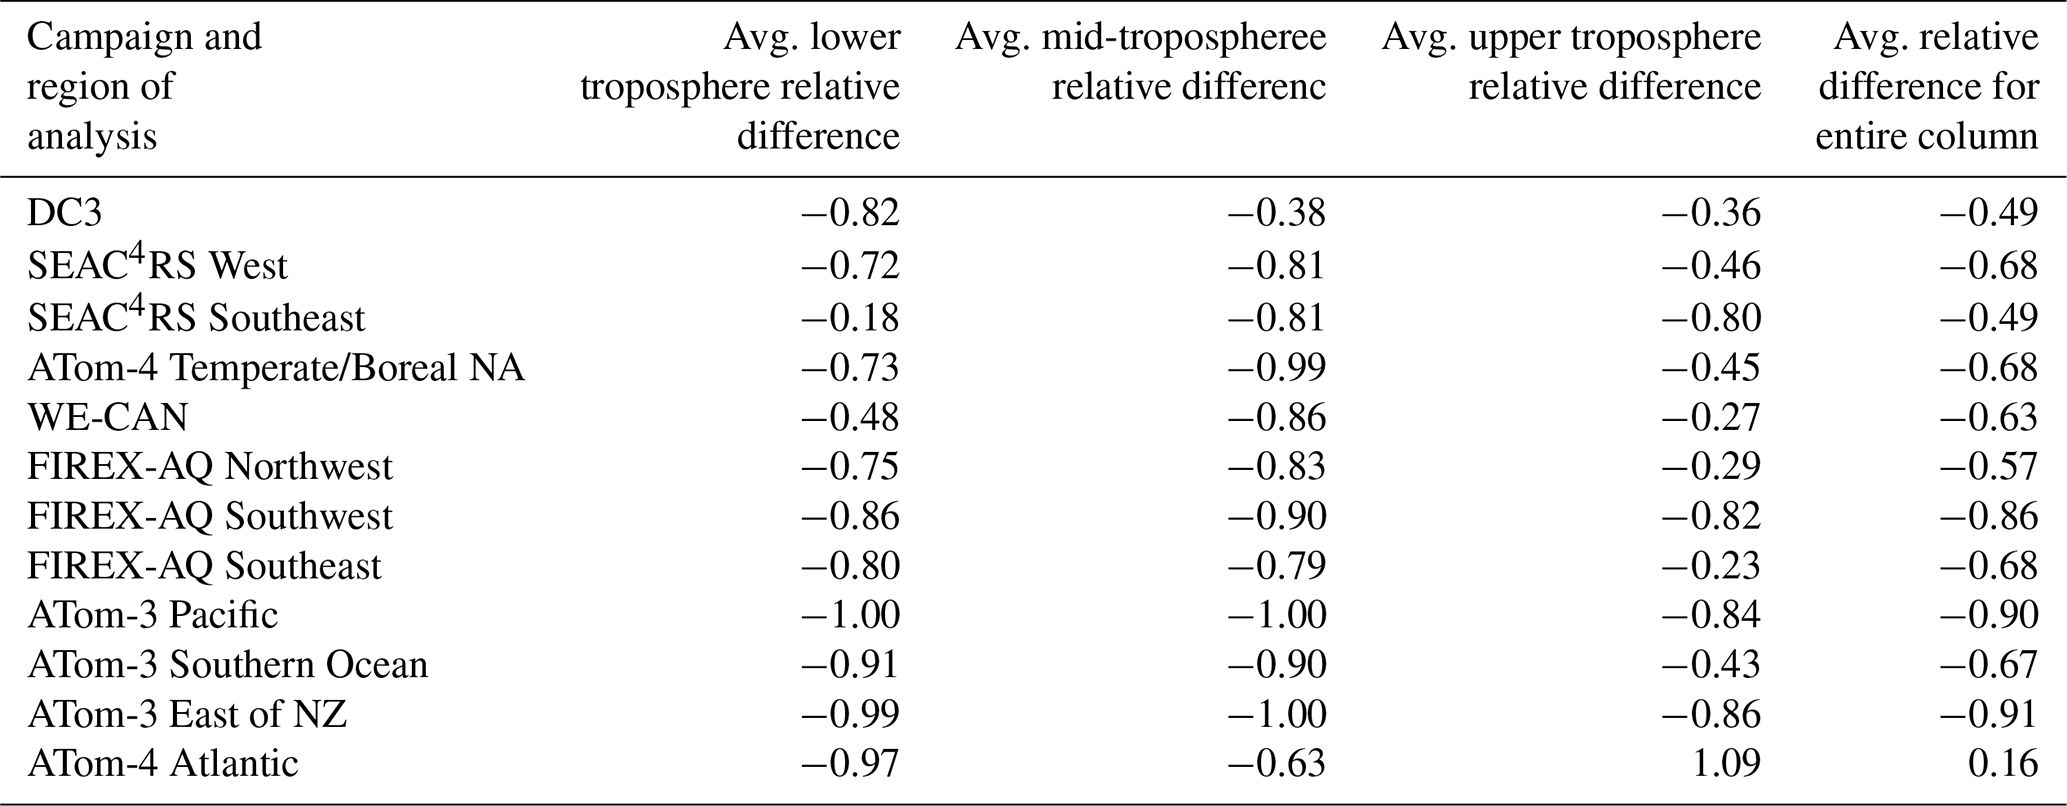
While there appears to be a nearly systematic underestimation of BrC absorption, the relative magnitudes differ, and there are some instances when model absorption exceeds that of the campaign.
Looking first at absorption over near-source regions (Fig. 6), biases in the lower troposphere are not consistent across all campaigns. BrC-Abs appears to be more underestimated during DC3, in the SEAC4RS western region, the ATom-4 temperate/boreal North America region, and the FIREX-AQ southeast regions (Fig. 6a–b, d, g), while model absorption appears closer to measurements in the SEAC4RS southeast region and FIREX-AQ northwest and southeast regions, as well as during WE-CAN (Fig. 6c, e–f, h). OA comparisons (Fig. A4) in the same campaigns and regions generally follow similar patterns in the lower troposphere: where BrC-Abs is more underestimated, model OA mass is also low, but where model absorption is closer to measurements, OAs align well with or are overestimated compared to campaign data. Exceptions to this are the SEAC4RS southeast region, where OAs are more underestimated than BrC-Abs, and ATom-4, where model OAs are closer to observations than BrC-Abs. Near-source WSOC mass (Fig. A6), while more variable in the lower troposphere, also follow a similar pattern (again, except for the SEAC4RS southeast region in which WSOC is more underestimated). This could suggest general bias in OAs, not specific to BrC. One potential cause of such bias is BB OA emissions being too low during certain campaign periods, as emissions influence the lower troposphere amount of all three of these variables.
There is an apparent underestimation in BrC-Abs in the mid-troposphere in all near-source regions. This is most apparent during the SEAC4RS campaign (Fig. 6b–c), and least during the DC3 campaign (with a smaller average relative difference of −0.38; Fig. 6a). DC3 measured lower BrC-Abs, compared to some other near source regions, suggesting there could be less near-source model bias with smaller magnitudes of BrC-Abs. OAs and WSOC do not show the same consistent pattern of underestimation at these altitudes: model OA and WSOC mass is either less underestimated or well-aligned with measurements. Finally, where there is data available, absorption is also underestimated in the upper troposphere of most near-source regions (Fig. 6a–c, e–h), but the relative magnitude of this negative bias is smaller than in the mid-troposphere. Model OAs and WSOC at these altitudes and in these regions are either closer to or greater than campaign measurements.
Vertical profile comparisons in more remote regions (Fig. 7) support the results shown in Fig. 6. Model absorption is typically underestimated in the lower and mid-troposphere across these regions, with some convergence in the upper troposphere (particularly in the Atlantic during ATom-4 – Fig. 7d; this was also seen in the ATom-4 temperate/boreal NA region – Fig. 6d). Also consistent with near-source mid- and upper troposphere results, OAs and WSOC in remote regions tend to be closer to or greater than campaign data (the latter is particularly true for OAs). Figures 6 and 7, considered together, suggest that there may be biases specific to BrC in aged air masses and fire plumes (at higher altitudes and over remote regions).
To further investigate this, we looked at BrC-Abs versus total OA mass concentration across all campaigns, as shown in Fig. 8.
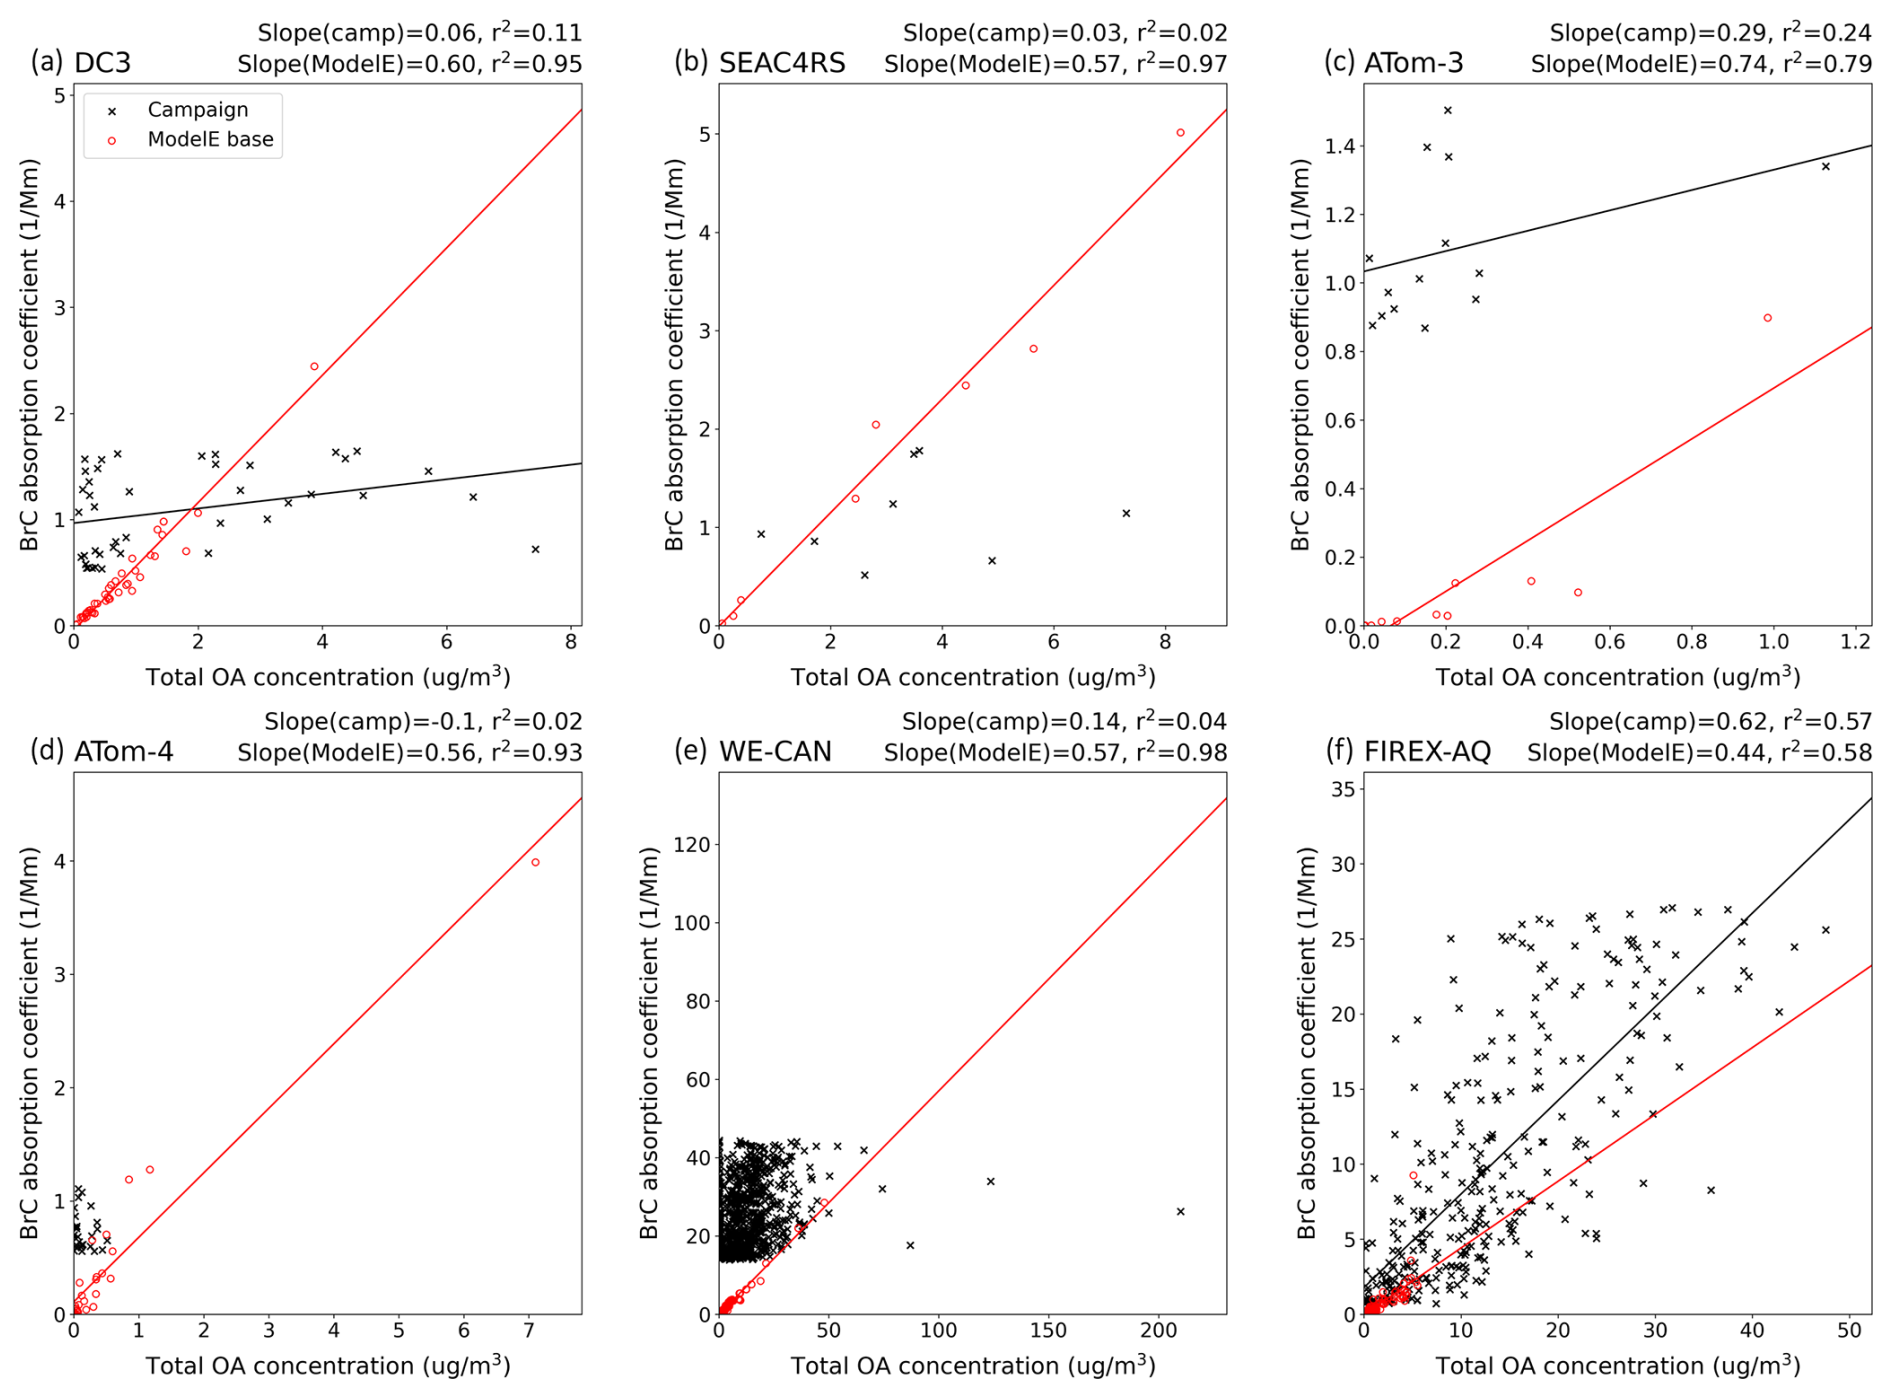
Figure 8BrC absorption coefficient, in units of Mm−1, plotted against total OA concentration, in units of µg m−3, as measured by flight campaigns (black x's) and simulated by ModelE (red o's). For each campaign (labelled on the top-left of each plot), data has been filtered to remove points outside of the regions used for vertical profile analysis and points outside the IQR (for consistent comparison with vertical profiles). The slope and r2 of linear regressions for measured and simulated data are displayed on the top-right of each plot. Regression lines are plotted for all campaigns except SEAC4RS, ATom-4, and WE-CAN (as the r2 is too low).
Figure 8 suggests ModelE is underestimating BrC absorption, relative to OA mass, compared to most flight campaigns. The most significant bias appears with WE-CAN which sampled fresh BB plumes. This negative bias is evident even in data from DC3: despite some spread, the majority of datapoints appear to fall above the model. This trend is not seen with SEAC4RS, but there is limited data. Overall, these results suggest that ModelE's scheme is either simulating too little BrC mass, or the BrC mass present is not absorbing enough.
3.3 Designing sensitivity tests for potential sources of bias
In the previous section, we identified a pattern of underestimation in model BrC-Abs that could be driven by biases with model OAs (in the lower troposphere) as well as biases specific to the BrC scheme (in aged air masses and fire plumes). The next step is to identify specific mechanisms that could be driving these biases, then determine changes to ModelE BrC and OA schemes to test these potential bias sources. We introduce and provide rationale for several model sensitivity tests in this section, then present the results of these tests in Sect. 3.4.
We consider two factors that could contribute to a negative bias in model OAs in the lower troposphere: (1) model constant OA-to-OC ratio of 1.4 being too low (biasing OA emissions and, therefore, BB BrC mass low), and (2) low BB OA emissions. Additionally, specific BrC biases in aged air masses and fire plumes could be due to missing secondary sources or excess sinks of BrC. Because ModelE currently only has biogenic sources of SOA, we focus on the latter and investigate the impact of two possible excess BrC sinks in ModelE: (1) rapid BrC aging, and (2) wet removal of BrC. These four potential sources of bias are explored with four distinct sensitivity tests, detailed below in Sect. 3.3.1–4.
3.3.1 Varying OA-to-OC ratios
The low bias in model OAs could be driven by the OA-to-OC ratio used for ModelE's OAs, mentioned in Sect. 2.2.1. If the model's constant value of 1.4 is too low, then OA emissions, and therefore BB BrC mass, would also be biased low. Since the DC3, SEAC4RS, ATom, and WE-CAN campaigns provided both OA and OC mass measurements, the ModelE value can be directly evaluated against in-situ data. A linear regression to campaign data of OA and OC mass was applied, using the datapoints sampled for vertical profile analysis (within the IQR), to calculate average OA-to-OC ratios for each flight campaign (taken from the slope of the linear regression). The average DC3 ratio was 2.02, SEAC4RS was 1.73, ATom-3 was 2.10, ATom-4 was 1.83, and WE-CAN was 1.81. This confirms the prescribed ModelE ratio is too low, particularly for campaigns sampling more aged OAs in remote regions. Laboratory and field studies of OAs have also suggested the traditional model value of 1.4 may be too low: aged organics have been found to have higher OA-to-OC ratios, and while 1.4 may be appropriate for urban and industrial OAs (with a suggested range of 1.4–1.6), oxidized organics have ratios around 2.0, and BB OAs are somewhere in the middle (1.6–1.8) (Aiken et al., 2008; Philip et al., 2014; Tsigaridis et al., 2014; Canagaratna et al., 2015; Chrit et al., 2018; Zhu et al., 2023). Canagaratna et al. (2015) reported chamber SOA ratios to be as high as 2.3.
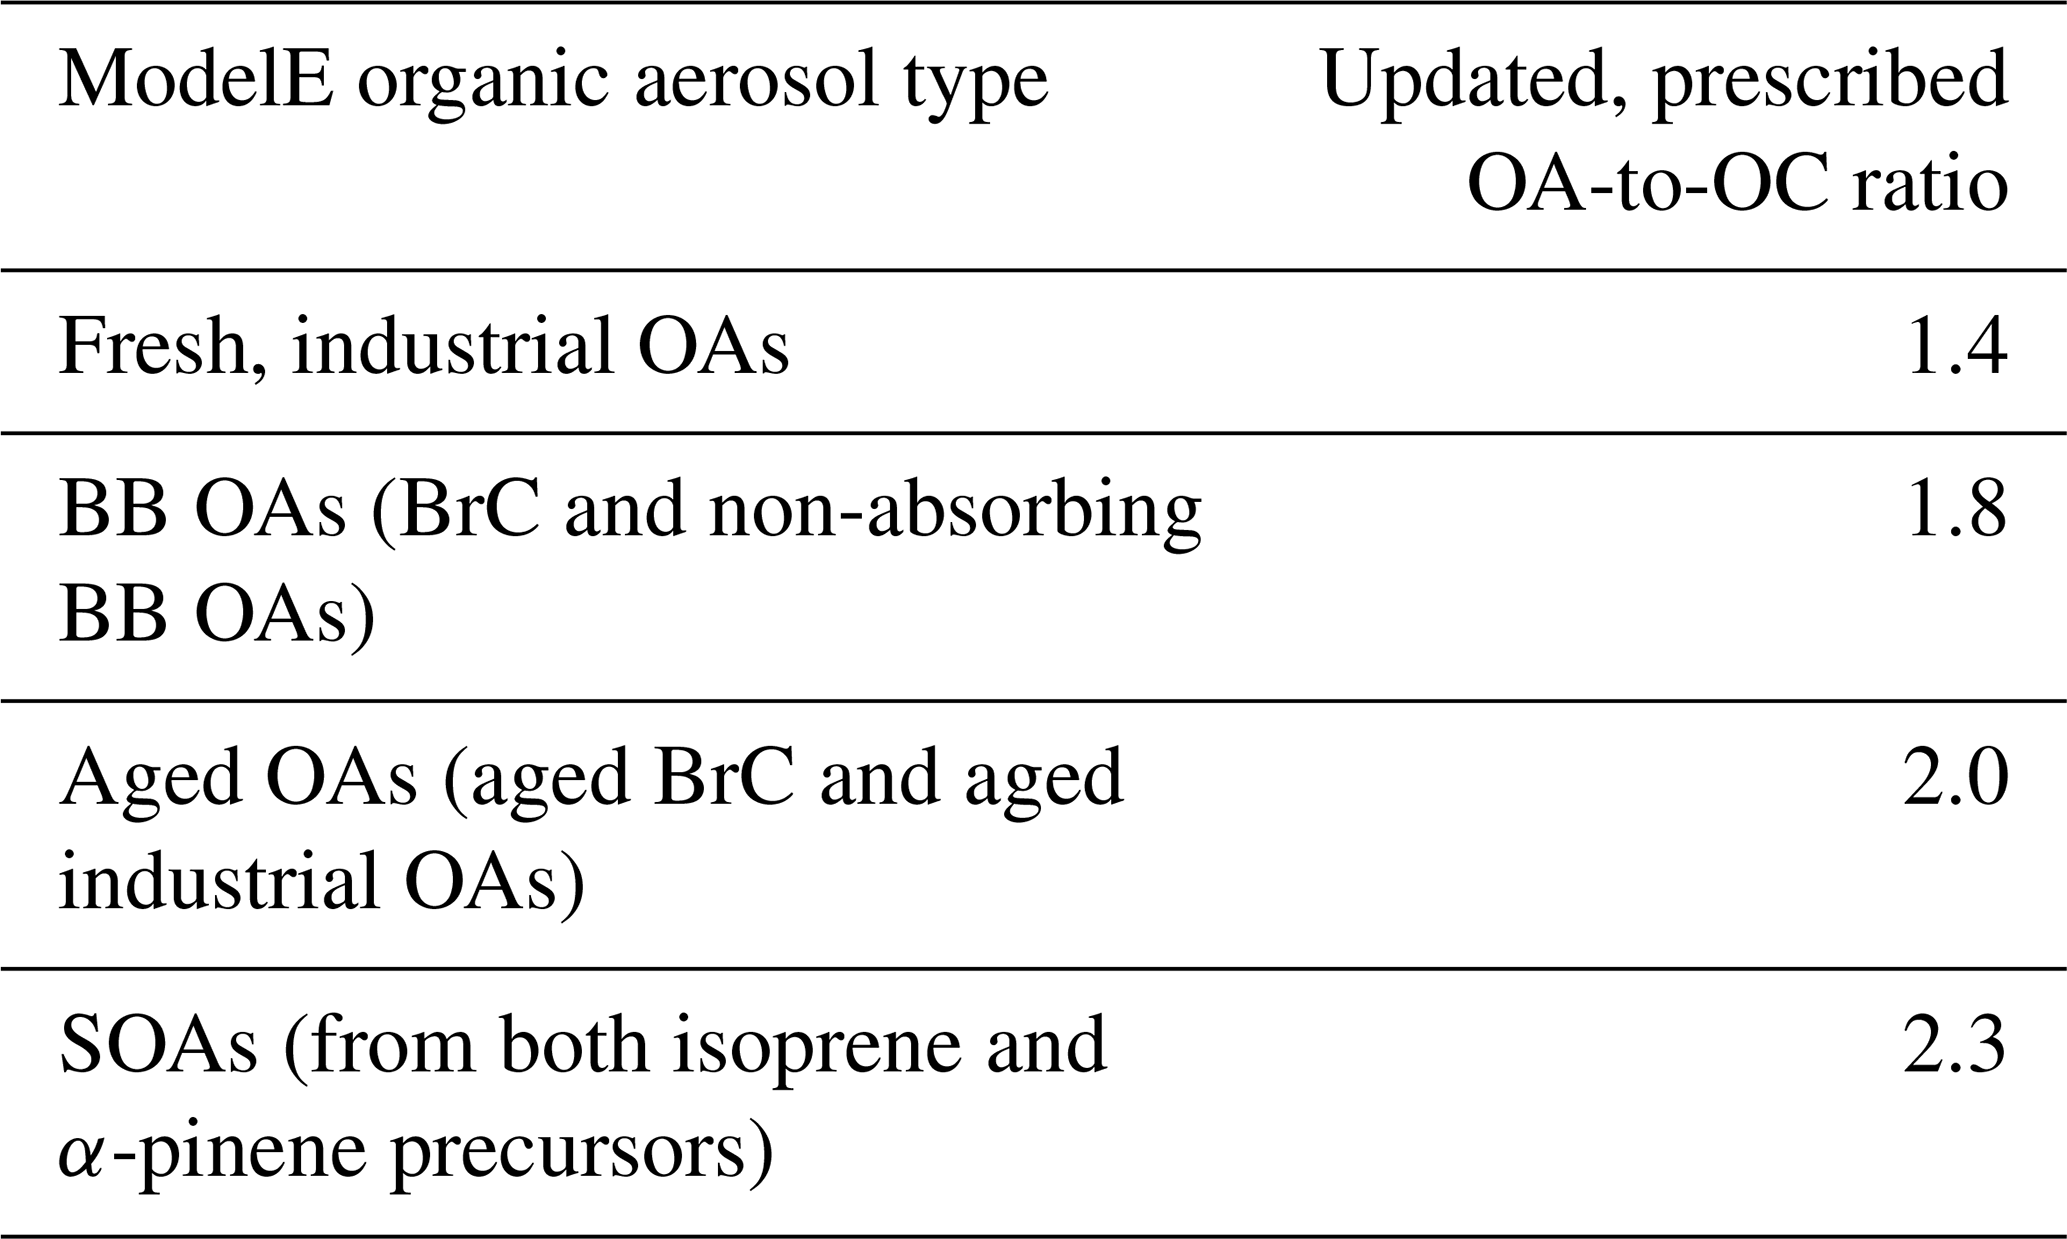
As flight campaign data suggest the ModelE OA-to-OC ratio value of 1.4 is too low, and previous literature reports different values for different types of OAs, we assigned new values to some of the OA species in the model. The specific values are listed in Table 3, but, in general, the fresh industrial OA ratio remained the same, while the ratios of BB OAs, all aged OAs, and SOAs were increased.
Table 3Updated values of prescribed organic aerosol-to-organic carbon (OA-to-OC) ratios used by ModelE organic aerosol species.
With these changes, we ran a simulation over campaign periods to test the efficacy of the new OA-to-OC ratios. Figure 9, a scatterplot of OC versus total OA mass concentration for each campaign and model simulation, shows the effect of varying OA-to-OC ratios by species.
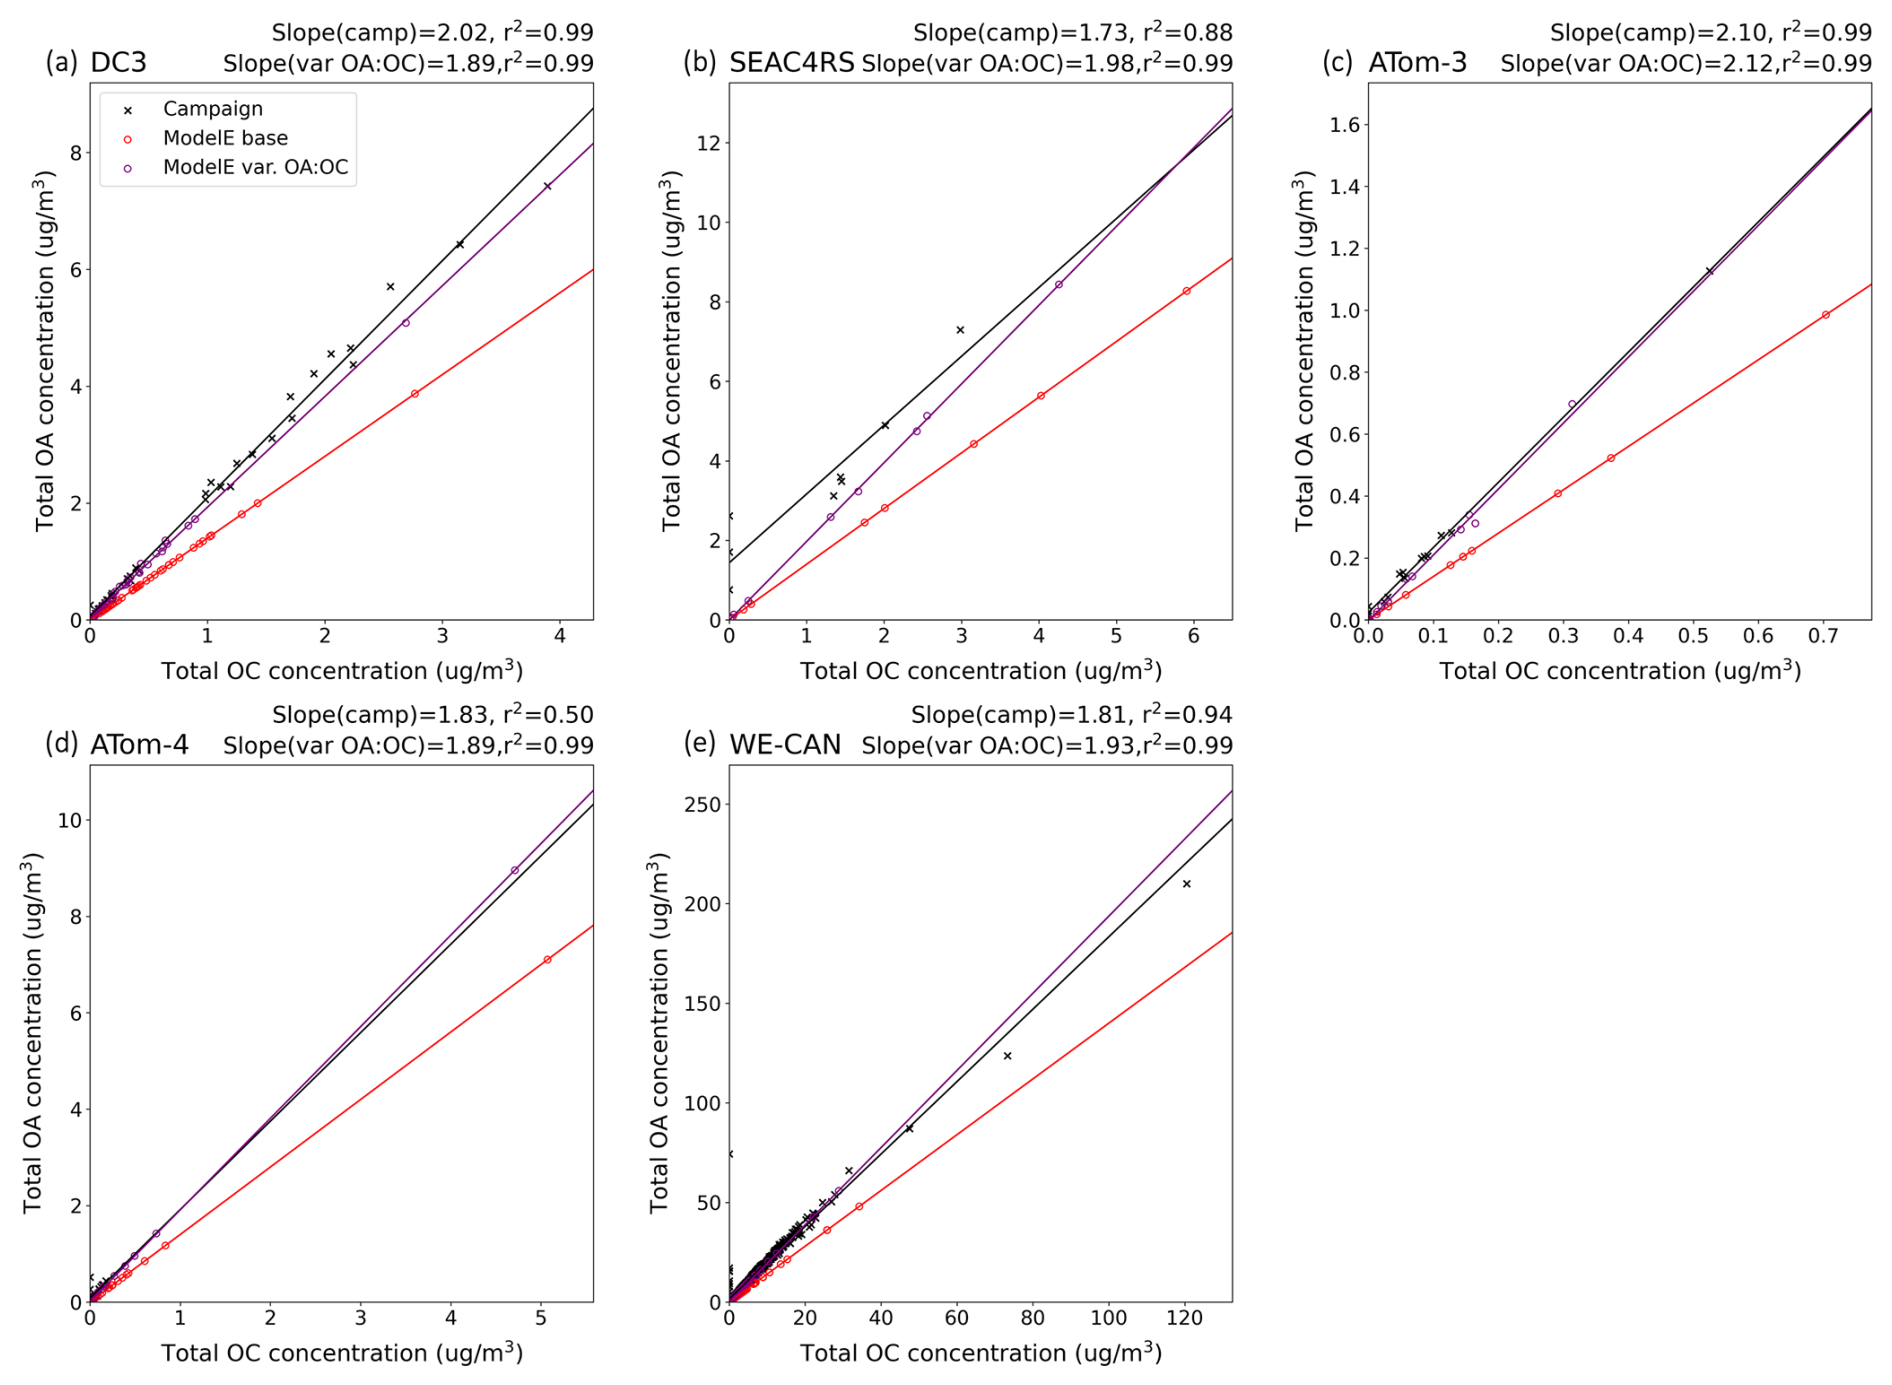
Figure 9Total OA concentration plotted against OC concentration, both in units of µg m−3, as measured by flight campaigns (black x's), simulated by the base case of ModelE OA representation (red o's), and simulated by the revised ModelE case with variable OA-to-OC ratios (purple o's). For each campaign that provided both OC and OA measurements (labelled on the top-left of each plot), data has been filtered to remove points outside of the regions used for vertical profile analysis and points outside of the IQR (for comparison with vertical profiles). Linear regression lines for campaign data and all model simulations are included. The slope and r2 of campaign and revised-case regressions are displayed on the top-right of each plot for comparison–these slopes are indicative of average OA-to-OC ratios. The slope and r2 of the model base case is not provided because the value (1.4) is constant across all campaign periods and regions.
Varying the OA-to-OC ratio by OA species greatly improved model agreement with measured OC versus OA concentrations in every flight campaign. The large impact of such a simple change to OA representation is a key finding for this study. This is also consistent with the findings presented in Petrenko et al. (2025), which shows that OA-to-OC values adopted by models contributes significantly to simulated AOD and aerosol forcing. It should be noted, however, that these changes linearly increased OA sources, for instance BB OA emissions increased by 28.5 % (new ratio-old ratio/old ratio; 1.8–1.41.4 = 0.285), but they also near-linearly increased all sinks. Since OA sinks occur across all latitudes and longitudes, while sources occur only in certain areas, the net effect of this change was a decrease in global average OA burden. While these changes will likely not reduce the apparent negative bias in OA mass and BrC-Abs, it is clearly more physically accurate than the base case. As such, these updated OA-to-OC ratios were used for all subsequent sensitivity tests in this study.
3.3.2 Scaling OA BB emissions
Low BB OA emissions were also identified as a possible explanation for the underestimation of BrC-Abs (as well as OAs and WSOC) seen in the near-source lower troposphere during some campaigns (Fig. 6a–b, d, g), and seen to a lesser degree during others (Fig. 6c, e–f, h). To address this, we ran a sensitivity test that uniformly scaled up global BB OA emissions by 50 %.
3.3.3 Limiting primary BrC aging
Assuming general bias from transport has been accounted for with the BC scaling factor, underestimation bias specific to BrC in aged air masses and fire plumes could be due to missing secondary sources or excess sinks. Secondary production of BrC in fire plumes could be a source of bias as ModelE doesn't include this process. Laboratory and field studies have found that BBSOA could be an important source of BrC (Saleh et al., 2013; Kumar et al., 2018; Saleh, 2020; Palm et al., 2020; Kuang et al., 2025). Such BBSOA production could help explain observations from WE-CAN and FIREX-AQ: there was no clear evidence of BrC aging observed in fresh plumes (approximately up to 9 h in age) in either of these campaigns (Sullivan et al., 2022; Washenfelder et al., 2022). One study of FIREX-AQ measurements reported no consistent pattern in BrC production or depletion, attributing this to the likely complex evolution of BrC in smoke (Zeng et al., 2022). No change in BrC absorption in a plume could mean either the BrC present is stable and not bleaching, or secondary production of BrC is balancing the aging and removal of primary BrC. While we can't currently represent BBSOA in ModelE, a common issue across many models, we could limit the aging in our BrC scheme to try to capture this pattern. Schnitzler et al. (2022) developed a kinetic model of BrC aging, via oxidation by ozone, that considered relative humidity (RH) and temperature, and found that the BrC aging timescale of ∼1 d employed by several models is only applicable below the planetary boundary layer (PBL). They suggest that above the PBL, aging is much slower due to low RH and temperature. Based on this study, we ran a sensitivity test that removed any aging for BrC above the PBL. This change aims to both increase the physical correctness of the BrC scheme and reduce the bias of BrC-Abs at higher altitudes.
3.3.4 Reducing BrC wet removal
In-cloud production could be another source of BrC our scheme isn't able to capture, as the process isn't currently represented in ModelE. Zhang et al. (2017) attributed enhancements of BrC, relative to BC, observed in the mid- and upper-troposphere during DC3 to either secondary BrC from in-cloud processing or enhanced convection of BrC. In a subsequent modelling study, the same group found that reducing wet scavenging of BrC improved alignment of the Community Earth System Model (CESM) BrC scheme with both DC3 and SEAC4RS data (Zhang et al., 2020). Here, they reduced sinks of BrC, rather than adding an in-cloud source as there wasn't enough observational data to inform the model development of such a mechanism. We could follow the same approach: ModelE doesn't have an in-cloud OA chemistry mechanism in which BrC production could be implemented, but we can reduce the fraction of BrC defined as water-soluble (WS). This would reduce wet removal of BrC, particularly in clouds and convective systems, and could address the underestimation of BrC-Abs in the mid- and upper-troposphere.
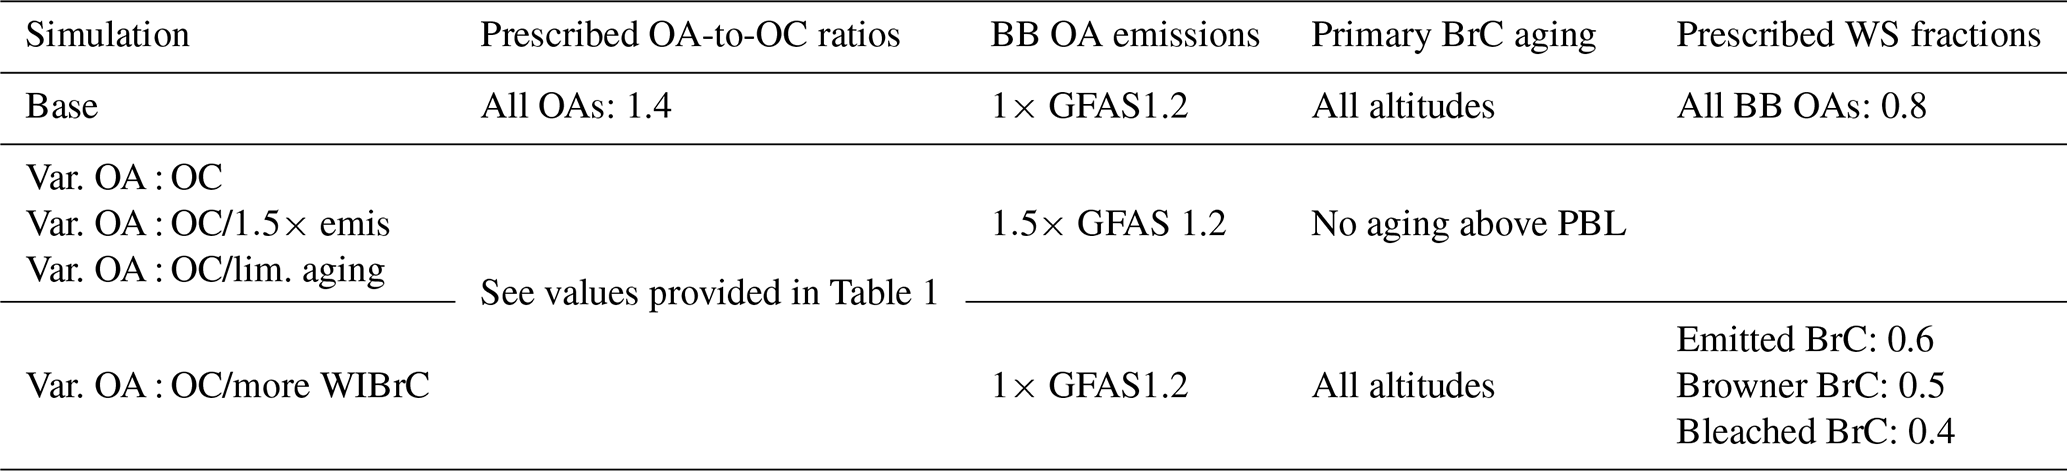
In the base case of BrC representation, there are three primary BrC species–an emitted BrC, a browner BrC, and bleached BrC–that all have the same prescribed WS fraction of 0.8 (DeLessio et al., 2024). To decrease wet removal of BrC, a sensitivity test that reduced the emitted BrC fraction to 0.6, the browner fraction to 0.5, and the bleached fraction to 0.4 was run. These values are more consistent with the range provided in literature (Laskin et al., 2015; Zeng et al., 2020), and allow for the WS fraction to decrease with age. The latter point is consistent with field measurements that have found methanol-soluble (MS) BrC-Abs decreases at a slower rate than WS BrC-Abs, meaning more aged BrC, with some recalcitrant absorption, would have a large water-insoluble fraction (Wong et al., 2019). The WS fractions of biogenic SOA, which are considered brown, were not changed from their constant value of 0.8. This value is not only commonly used by other modeling groups (Tsigaridis et al., 2014), but it is also consistent with field measurements of SOA in the southeast U.S., a region dominated by biogenic SOA and focused on in this study (Xu et al., 2017).
Table 4 provides a summary of BrC and OA properties in each sensitivity test described here, as well as those of the BrC base case for reference. As stated previously, varied OA-to-OC ratios were found to increase physical correctness of the OA scheme, and thus used in all sensitivity tests.
Table 4BrC and OA scheme properties for base case of representation and additional sensitivity tests.
3.4 Sensitivity test results
Figures 10 and 11 show the same vertical profile analysis, comparing flight campaign measured and ModelE simulated median BrC-Abs in near-source and remote regions, as Figs. 6 and 7, but with the results of additional sensitivity tests. The vertical profiles of the ModelE base case, shown in Figs. 6 and 7, are also included for reference.
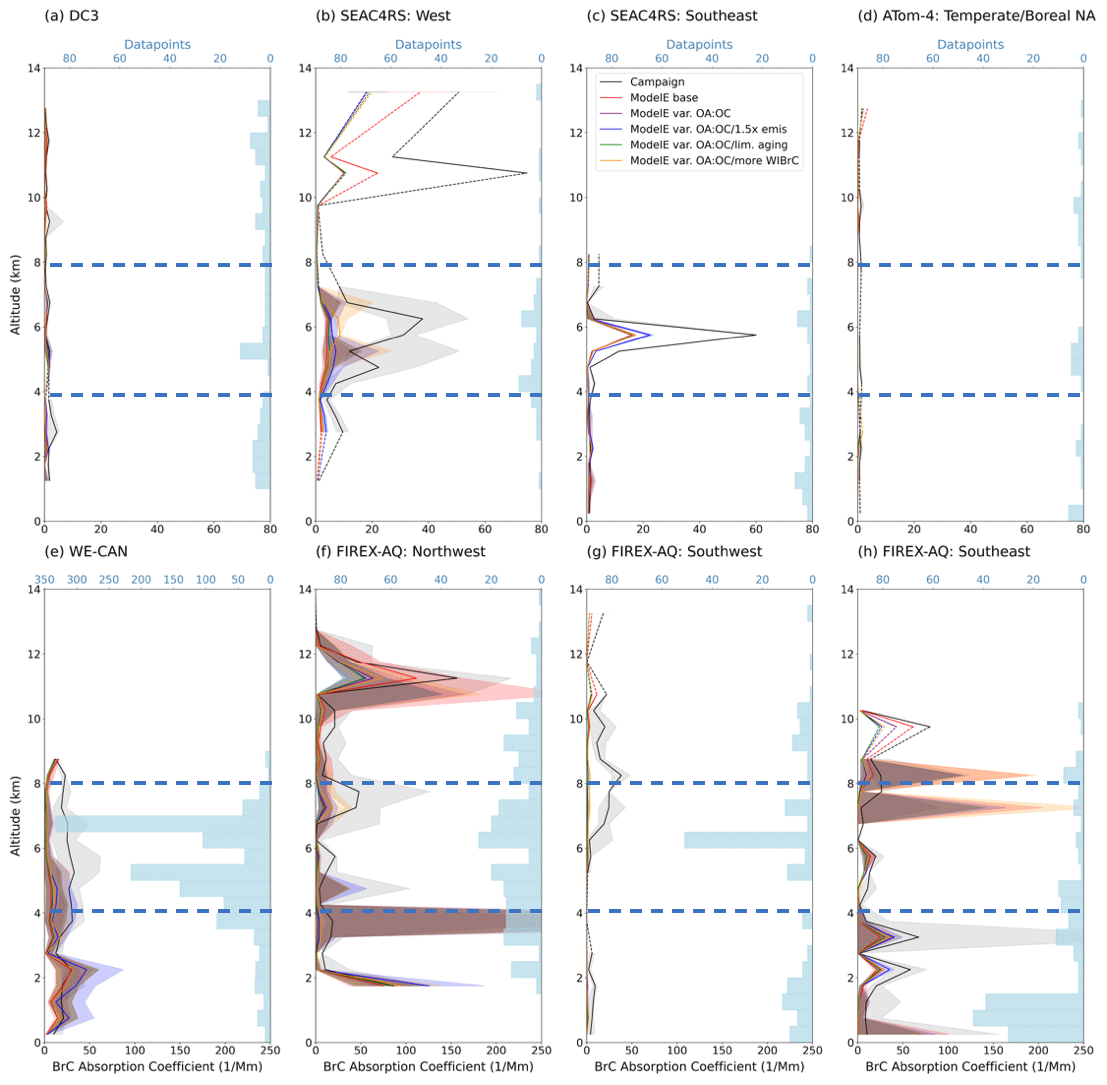
Figure 10Vertical profiles of median BrC absorption (BrC-Abs) at 365 nm, measured by flight campaigns (black) and simulated by ModelE's base case of BrC representation (red), variable OA-to-OC ratio case (purple), 1.5 times BB OA emissions case (blue), limited aging case (green), and larger fraction of WIBrC case (orange). Regions of analysis are over land/near sources, and data is in units of Mm−1. Consistent with Fig. 6, a CO and BC scaling factor (Eqs. 1–2) have been applied to model data, campaign and specific region of analysis is indicated on the top left of each plot, the midpoint of altitude bins is plotted, dashed lines interpolate over altitudes with no data, shaded areas show the IQR of BrC-Abs in each altitude bin, blue bars show the number of datapoints grouped in each bin, horizontal blue dashed-lines separate the lower-, mid-, and upper-troposphere, and data is filtered for BB number fraction (when relevant).
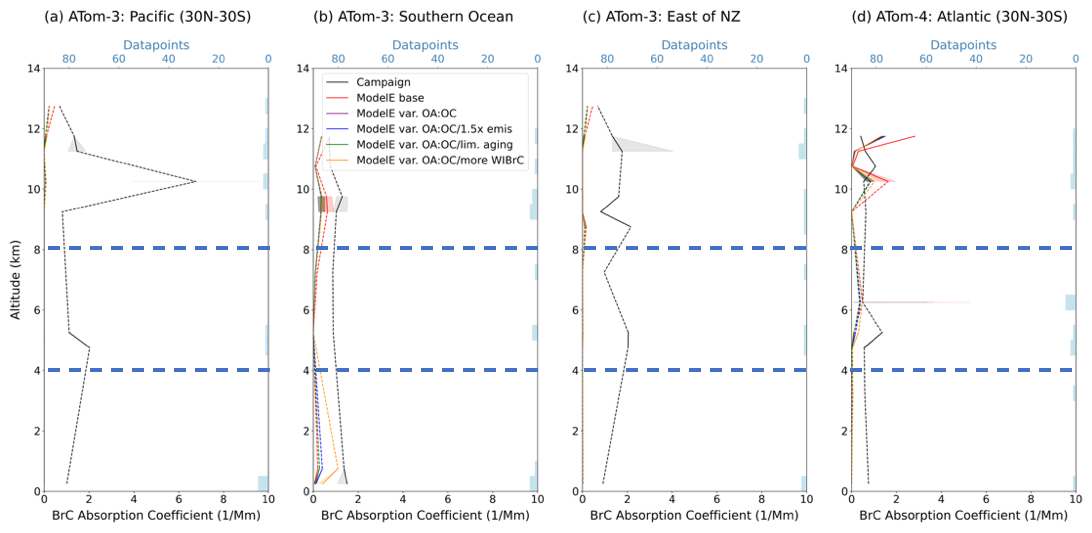
Figure 11Vertical profiles of median BrC absorption (BrC-Abs) at 365 nm, measured by flight campaigns (black) and simulated by ModelE's base case of BrC representation (red), variable OA-to-OC ratio case (purple), 1.5 times BB OA emissions case (blue), limited aging case (green), and larger fraction of WIBrC case (orange). Analysis is over remote regions, and data is in units of Mm−1. Consistent with Fig. 7, a CO and BC scaling factor (Eqs. 1–2) have been applied to model data, campaign and specific region of analysis is indicated on the top left of each plot, the midpoint of altitude bins is plotted, dashed lines interpolate over altitudes with no data, shaded areas show the IQR of BrC-Abs in each altitude bin, blue bars show the number of datapoints averaged in each bin, and horizontal blue dashed-lines separate the lower-, mid-, and upper-troposphere. Data is not filtered for BB number fraction.
Looking at the lower-troposphere in near-source regions, there appears to be a small increase in BrC-Abs with the varied OA-to-OC, limited aging, and increased WIBrC cases during DC3, in the SEAC4RS West region, in the ATom-4 temperate/boreal NA region, during WE-CAN, and in the FIREX-AQ north- and southwest regions (Fig. 10a–b, d–g). In most of these regions, the effects of these cases are not distinguishable from each other; the increased WIBrC case shows a distinct absorption enhancement in the lower troposphere of the ATom-4 temperate/boreal North America (above 2 km; Fig. 10d) and FIREX-AQ northwest regions (above 3 km; Fig. 10f), as well as in the lower troposphere (above 3 km; Fig. 10e) during WE-CAN. In contrast to these results, all sensitivity tests showed a slight decrease in BrC-Abs below 2 km in the SEAC4RS and FIREX-AQ southeast regions (Fig. 10c, h). This could be due to the increase in OA-to-OC ratios, particularly SOAs: biogenic SOAs, rather than BB OAs, tend to dominate in the southeast US, so a reduction in SOA burden because of this model change could have a greater impact in the PBL here.
Enhanced BB OA emissions increased lower troposphere BrC-Abs relative to other sensitivity tests across all near-source regions except the ATom-4 temperate/boreal NA region (Fig. 10d), which sampled air masses further from direct emission sources. This sensitivity test brought the model closer to measured lower troposphere absorption in most cases, excluding the previously mentioned southeast regions (Fig. 10c, h), but WE-CAN and the FIREX-AQ northwest are notable exceptions to this (Fig. 10e–f). In the base case of BrC representation, model BrC-Abs in the lower troposphere was close to WE-CAN (below 3 km) and FIREX-AQ northwest (below 2 km) data, so the uniform enhancement in emissions led to ModelE overestimating absorption at the same altitudes. It's evident that while increased BB OA emissions can improve model performance, it should not be applied uniformly without consideration for regional and temporal differences.
In the near-source mid-troposphere, all sensitivity tests showed enhanced BrC-Abs compared to the base case, except for the FIREX-AQ southeast region. The increased WIBrC case was distinguishable in more regions at these altitudes: in regions and campaigns presumably influenced by larger fires (SEAC4RS west, WE-CAN, and all FIREX-AQ regions; Fig. 10b, e–g), this test resulted in similar or greater BrC-Abs increases as the enhanced emissions case, with the relative impact increasing with altitude. This supports the idea that excess wet removal of BrC could contribute to a negative bias in BrC absorption in fire plumes. Despite absorption enhancements due to increased emissions and WIBrC, there is still persistent underestimation of model BrC-Abs in the near-source mid-troposphere. Where data is available, all sensitivity tests appear to simulate less absorption than the base case in the upper troposphere of near-source regions. This is likely because all tests utilize the updated OA-to-OC ratios. Though these are more physically correct, they reduce OA and BrC burden (see Sect. 3.3), and evidently exacerbate upper troposphere BrC-Abs biases.
Sensitivity tests in remote regions generally support the results in near-source regions. Consistent with the mid-troposphere of near-source regions, where remote region BrC-Abs was underestimated in the base case, that negative bias persists across all sensitivity tests. Further, the same pattern of lower simulated BrC-Abs in the near-source upper troposphere with sensitivity test cases, compared to the base case, is also seen in the upper and even mid- troposphere of remote regions, as seen in the ATom-3 Southern Ocean region. Below the upper troposphere, the ATom-3 Pacific and east of NZ regions show little to no change with sensitivity tests (Fig. 11a, c). As with the base case, it appears ModelE simply doesn't capture the BrC signal here. However, more differentiation between sensitivity tests can be seen in the other two remote regions. The increased WIBrC case showed the greatest increase in BrC-Abs in the mid-troposphere of the ATom-4 Atlantic region (Fig. 11d). This case also showed significant increases in BrC-Abs, relative to all other test cases, from the surface to approximately 5 km in the ATom-3 Southern Ocean region (Fig. 11b). It appears that less wet removal of BrC impacts the aged air masses in both regions.
In both near-source and remote regions, the limited aging sensitivity test is nearly indistinguishable from the varied OA-to-OC ratio case; the test effect is only apparent in the upper troposphere of the FIREX-AQ southeast region, where it simulated the least absorption of all test cases. The only difference between the aging and OA-to-OC cases is the limit of no primary BrC aging above the PBL, so this scheme change had no evident effect. Average chemical lifetime of emitted BrC (global average over 2018, as an example) increased by only 0.13 % and lifetime of browned BrC did not change, confirming the altitude-limit had no impact. It is likely that all primary BrC aging in ModelE takes place within the PBL, so removing aging above that point does nothing–BrC has already browned then bleached. This suggests an additional limitation would need to be applied to the primary BrC aging scheme to investigate this potential bias.
In the current scheme, aging is simulated through mass transfer from one type of BrC to the next (emitted to browner, and browner to bleached, or threshold, BrC; DeLessio et al., 2024). Rather than computing the rate of transfer between BrC species from second-order rate constants and local model oxidant concentrations (the current aging scheme), a fixed lifetime of 1 d could be set (note: 15+ h is the plume age at which FIREX-AQ data began to show BrC bleaching). Though this would reduce the chemical complexity of the BrC scheme, it could slow down aging, presumably improving model alignment with in-situ absorption measurements. Alternatively, Zhang et al. (2020) found that in addition to reducing BrC wet scavenging (noted in Sect. 3.3), limiting photobleaching to BrC outside of convective clouds improved model alignment with flight campaign data. Implementing such a limit in ModelE would first require the development of an in-cloud OA chemistry scheme. BrC aging could then be differentiated, and limited, by cloud type. It bears mentioning that implementing additional sources of BrC, for instance production of BBSOA or in-cloud SOA, could help balance the effect of primary BrC aging on BrC-Abs evolution.
3.5 Estimating global BrC radiative effect
The sensitivity tests conducted here can inform an updated configuration for the BrC scheme. Because literature studies and results discussed in the previous section suggest varied OA-to-OC ratios and lower WSBrC fractions can improve OA and BrC representation, these were included in the updated configuration. While limiting BrC aging above the PBL showed no effect in the model, literature suggests it is a more physically accurate change, so this was also included in the updated case. Results showed that scaling up BB OA emissions did not unilaterally improve model performance. As such, this change was not included in the updated case – it is solely used as a sensitivity test. After implementing these three changes to OA and BrC aerosol schemes, the radiative effect of BrC was estimated. BrC radiative effect is defined here as the global average difference in total organic, top-of-atmosphere radiative forcing between a ModelE climatological simulation including BrC and a control simulation where all organics are non-absorbing. Each climatological simulation is representative of a decadal mean centered around the year 2000. For the updated configuration, BrC radiative effect is 0.03 ± 0.01 W m−2. This can be compared to the range of estimated global BrC effect from previous modeling studies, 0.03–0.57 W m−2 (Feng et al., 2013; Lin et al., 2014; Wang et al., 2014; Saleh et al., 2015; Hammer et al., 2016; Jo et al., 2016; Brown et al., 2018; Wang et al., 2018; Tuccella et al., 2020; Zhang et al., 2020; Carter et al., 2021; Drugé et al., 2022; Xu et al., 2024) and the estimates from our previous studies, 0.03–0.04 W m−2 (DeLessio et al., 2024, 2025a). Overall, the ModelE BrC radiative effect is robust across different scheme configurations.
Representation of BrC aerosols, the subset of OAs that absorb light in the UV-to-visible wavelength range, in climate models is necessary to constrain estimates of OA radiative forcing. This is especially true because OAs are becoming more prominent with increasing frequency and intensity of wildfires but estimates of their radiative forcing remain highly uncertain ( W m−2; Szopa et al., 2021). In a previous study, a BrC scheme was implemented in the NASA GISS ModelE ESM (DeLessio et al., 2024). While the addition of prognostic BrC improved the physical and chemical complexity of OAs in ModelE, using simplified parameterizations to represent highly variable observed BrC properties left the scheme with many uncertainties. In this study, we used in-situ measurements of BrC absorption (BrC-Abs) from five different flight campaigns – DC3, SEAC4RS, ATom, WE-CAN, and FIREX-AQ – to evaluate and constrain ModelE's BrC scheme. Through vertical profile comparisons, a systematic underestimation of model BrC-Abs relative to campaign measurements was found. By correcting for biases in CO and BC, then examining the measured and simulated relationships between BrC and total OAs, possible causes of this bias were identified. Finally, sensitivity tests were run to assess whether model changes can reduce bias. The results of these sensitivity tests informed an improved configuration of the ModelE BrC scheme, allowing for an estimate of global, annual average BrC radiative effect of 0.03 ± 0.01 W m−2.
The first model change, varying OA-to-OC ratio by model OA species rather than using one value for all OAs, greatly improved model alignment to the same metric reported by flight campaigns. As these updated values improved the physical correctness of the ModelE OA scheme, and were supported by literature values, they were maintained in all additional tests despite the resulting decrease in OA burden. Scaling up BB OA emissions by 50 %, the next sensitivity test, improved model performance in some near-source regions, but led to overestimation compared to the WE-CAN campaign. This suggests that while increasing BB emissions can reduce model bias, particularly in the lower-troposphere near sources, it should not be done uniformly over space and time. Remaining sensitivity tests aimed to address biases specific to BrC: underestimations in absorption could be partially due to missing sources or excess sinks; we explored the latter. Increasing WIBrC fractions resulted in distinguishable increases in mid-troposphere BrC-Abs over regions influenced by larger fires and some remote regions, appearing to partially address the possible bias of excess BrC sinks in fire plumes and aged air masses. The sensitivity test that limited aging of primary BrC to below the PBL, on the other hand, had limited effect on model data.
Despite implementing physically correct changes based on literature studies, like variable OA-to-OC ratios and more reasonable WS BrC fractions, there are persistent biases between ModelE BrC absorption and in-situ measurements. As such, it's important to discuss remaining potential factors that could be driving this underestimation. Firstly, there are general biases in model processes, like dilution and numerical diffusion, as well as BB aerosol processes, like emissions and transport, that fall outside the scope of our study. These were removed from consideration to the greatest extent possible by applying both CO and BC scaling factors to BrC and OA model output. Nonetheless, broader model evaluation studies, focusing on these mechanisms, can strengthen more specific model components, like the present BrC scheme, and should be further explored.
There are also remaining biases specific to the BrC scheme. The most straightforward way to address BrC-abs underestimation would be to increase the imaginary RI, and therefore MAE, of BrC species. This would linearly increase absorption at all altitudes. Since the magnitude of BrC biases differed between the lower, mid-, and upper troposphere, we did not focus on this, and instead investigated chemical or physical processes that could explain differences across altitudes. Of course, unilaterally increasing absorption remains an option to reduce BrC-abs underestimation and improve the ModelE scheme. Increasing WIBrC fractions seemed to account for some of the potential bias of excess sinks, but further bias due to aging of primary BrC could not be addressed. We can't conclude this is because it doesn't cause bias in BrC absorption – the scheme changes made simply had no effect on model output. Since this potential bias can't be eliminated, future work should implement more effective changes to the primary BrC chemical aging scheme. Possible modifications, like adding a fixed lifetime or limiting aging to non-convective transport, were discussed in Sect. 3.4. We were also unable to investigate missing secondary BrC sources as a cause of low absorption bias. As discussed in Sect. 3.3, recent studies have highlighted the likely importance of BBSOA and in-cloud production of SOA as sources of BrC, but ModelE doesn't currently simulate either SOA type. Like excess aging, we are unable to rule these out as potential causes of bias. Representation of these two SOAs is a priority for OA scheme development in ModelE. In the meantime, further laboratory and field studies of BBSOA/in-cloud SOA absorption are needed to guide implementation of BrC into these SOA schemes, when model capability allows. Finally, we were unable to study the impact of mixing state of BrC on model bias as all OMA aerosols are externally mixed. In future work, BrC could be incorporated into the MATRIX aerosol scheme in ModelE, an aerosol microphysics scheme with variable mixing state, to explore this.
The results of this study are consistent with previous work, where ModelE was evaluated against a BrC retrieval of AERONET data. Comparisons of retrieved and simulated BrC AOD, AAOD, and mass suggested the model's base case of representation didn't simulate enough absorption per unit mass (DeLessio et al., 2025a). This comparison also found that changing BB emissions can improve model performance, but should be done with a region-specific approach, not uniformly. Unlike the present work, however, biases were investigated and addressed by aligning model properties to retrieval assumptions, which lead to less physically correct changes like eliminating primary BrC aging completely. Additionally, the previous study focused on several different BB regions. The results presented here, however, are mostly indicative of temperate and boreal North America, specifically the continental US. This is because the DC3, SEAC4RS, WE-CAN, and FIREX-AQ campaigns operated out of and flew over the US, while the ATom campaign, which did sample a greater variety of more remote regions, had limited data available for our analysis. More systematic measurements of BrC absorption are needed to constrain model representations on a global scale.
As mentioned in Sect. 2.2.3, there are limitations to evaluating an ESM like ModelE against flight campaign measurements. Comparing data collected at a single point in space and time to a model with 30 min timesteps and 2° by 2.5° grid cells is difficult. Sub 30 min changes in measured BrC absorption are averaged out when converting to the model time resolution, and fire plumes or point sources of BrC become diluted when averaged over a model grid box. There are also limitations specific to BrC. An assumed water soluble-to-methanol soluble BrC ratio of 0.5, as well as an assumed bulk to ambient conversion factor of 2, were used to obtain ambient BrC absorption from in-situ filter measurements. When AAE couldn't be computed from campaign data, an assumed AAE of 5.25 was used to convert model absorption in the UV-VIS band (indicative of 550 nm) to absorption at 365 nm. Each of these assumptions were based on previous laboratory and field studies, but they still introduce uncertainty into results. Finally, there are inherent uncertainties associated with in-situ measurements from flights, which was noted in Table 1 and referenced throughout this work. In this study, we focused on scheme parameters that could contribute to model biases in BrC absorption, taking measurements not as the definitive truth, but instead as the best available information for model evaluation. However, the sensitivity of the model-campaign comparison to these uncertainties also warrants future consideration. Additionally, model-comparison sensitivity to variable water soluble-to-methanol soluble and bulk-to-ambient absorption conversion factors, as well as AAE should be explored. Further sensitivity tests like these could complement this work, investigating not just the skill of the current BrC scheme but also the efficacy of model evaluation against in-situ flight measurements.
Despite the limitations and uncertainties outlined above, a consistent underestimation bias in ModelE BrC absorption coefficient was observed across five different flight campaigns. The results and subsequent discussion presented here allowed us to highlight important processes of BrC, OAs, and BB aerosols in general, and to identify areas that require additional study. Finally, these results showed that varying OA-to-OC ratios by OA species can greatly improve model alignment to observations. This is a simple but important improvement that should be applied to the representation of OAs in other ESMs.
Table A1UV-VIS band averaged (indicative of 550 nm), complex refractive index of ModelE BrC tracers. For details of the calculation of these values, see DeLessio et al. (2024), Sect. 2.2.3. The imaginary RI of ModelE BrC can be compared to the range of values used in other ESM implementations of BrC: 0.01–0.045 (Colarco et al., 2017; Brown et al., 2018; Zhang et al., 2020; Drugé et al., 2022; Xu et al., 2024).
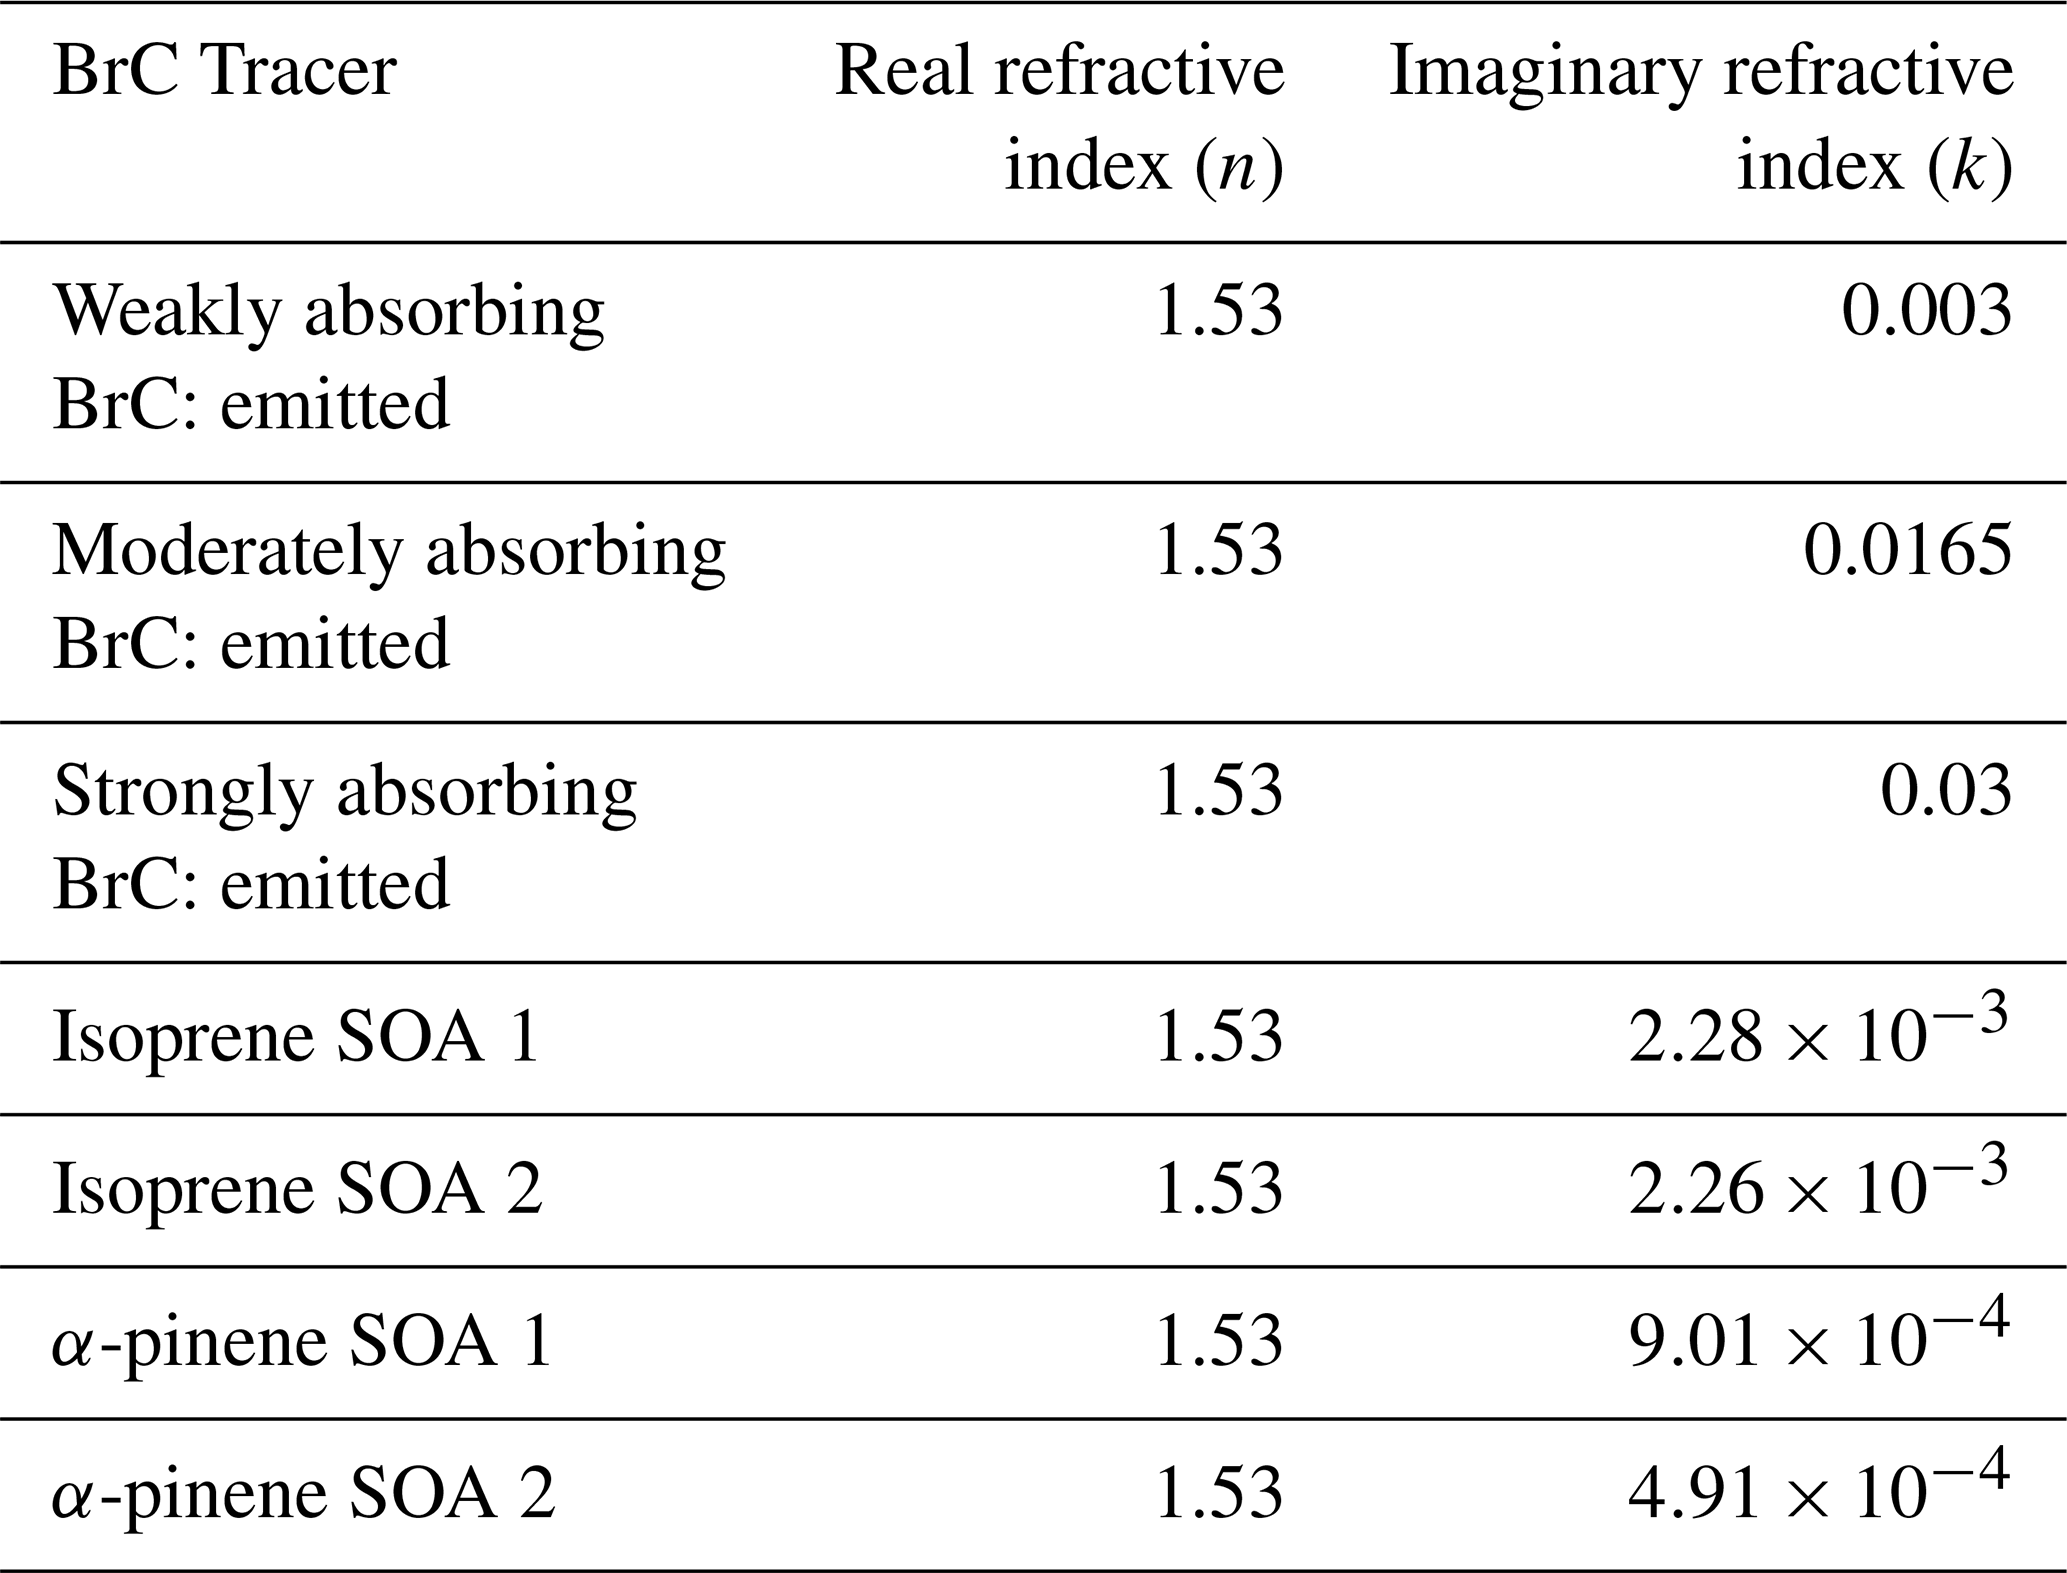
Table A2Dates used for analysis, during which ModelE outputted simulated data in 30 min timesteps, for each flight campaign studied.
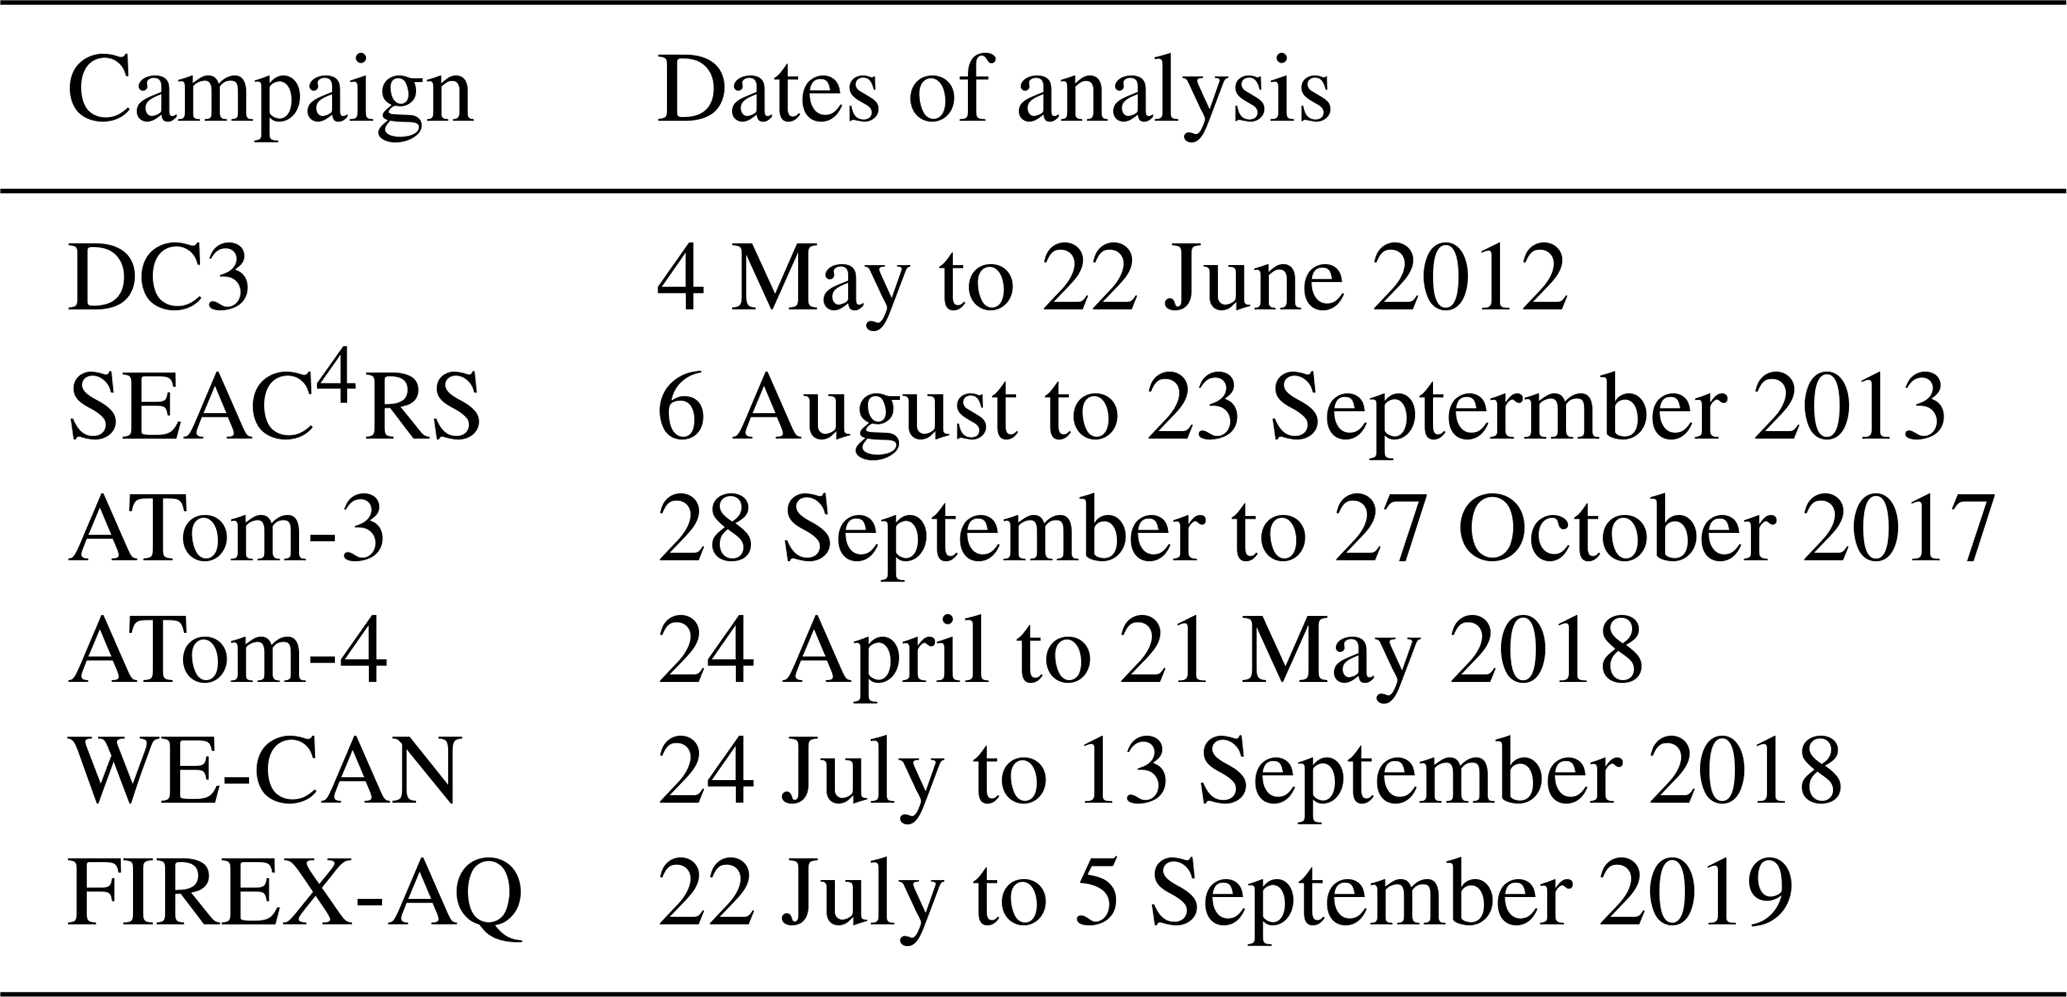
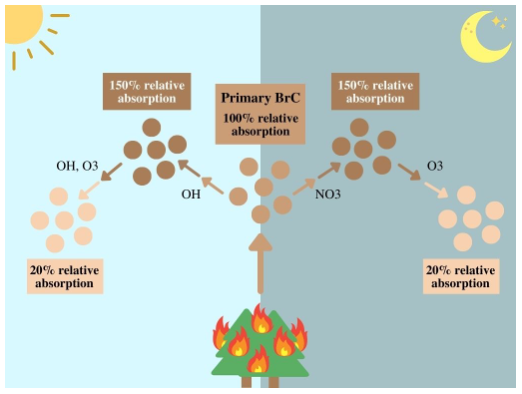
Figure A1Chemical aging scheme of primary BrC in GISS ModelE. The large arrow represents emission of BrC mass from BB, while smaller arrows represent mass transfer between BrC types. Reproduced from DeLessio et al. (2024), Fig. 3.
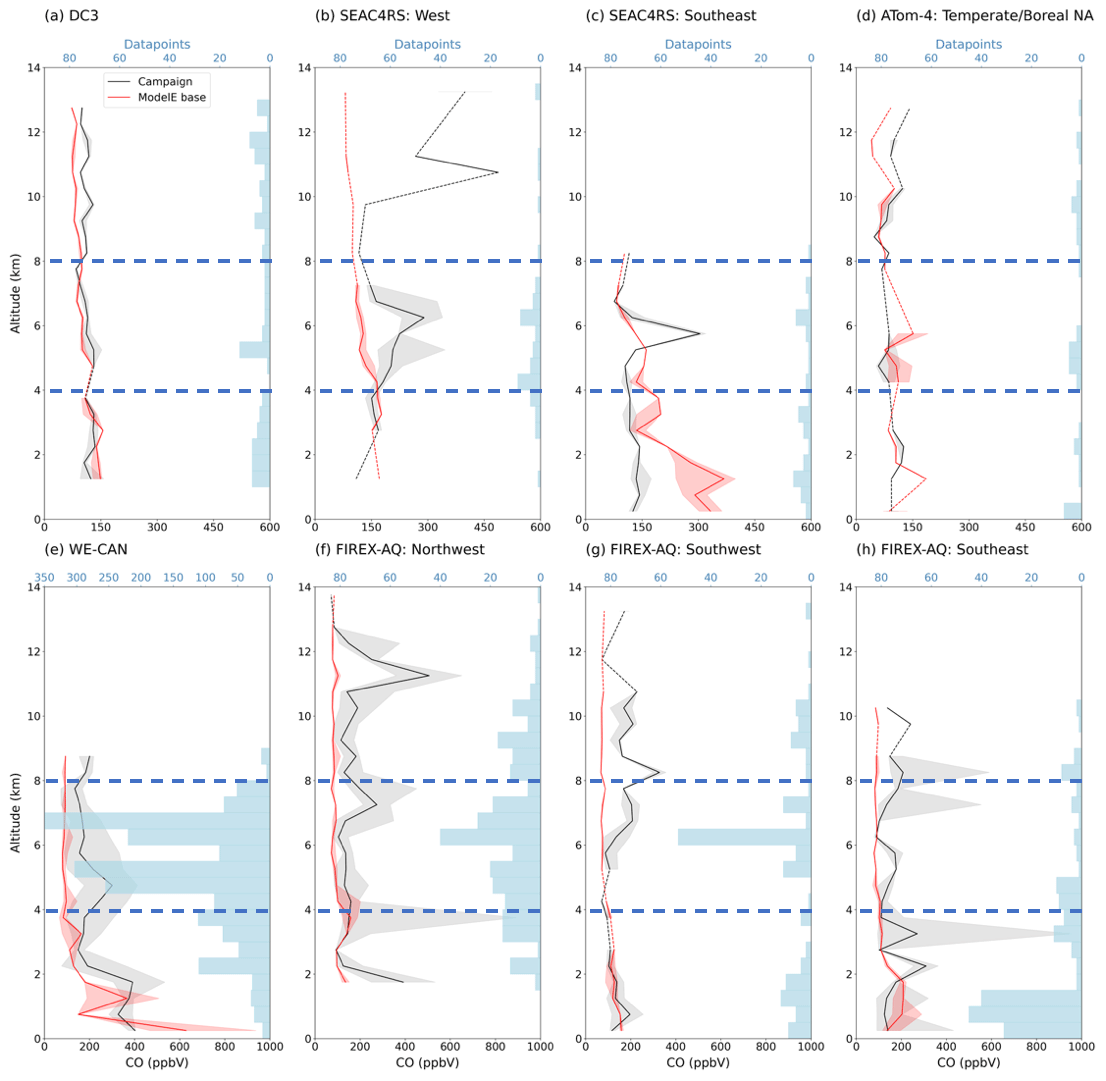
Figure A2Vertical profiles of median carbon monoxide (CO) concentration measured by flight campaigns (black) and simulated by ModelE's base case of BrC representation (red), over land/near sources, reported in units of ppbV. Campaign and specific region of analysis is indicated on the top left of each plot, data is plotted at the midpoint of each altitude bin, dashed lines interpolate over altitudes with no data, shaded areas show the interquartile range (IQR) of data in each altitude bin, blue bars show the number of datapoints grouped in each bin, and horizontal blue dashed-lines separate the lower-, mid-, and upper-troposphere. Data is filtered for BB number fraction (when relevant).
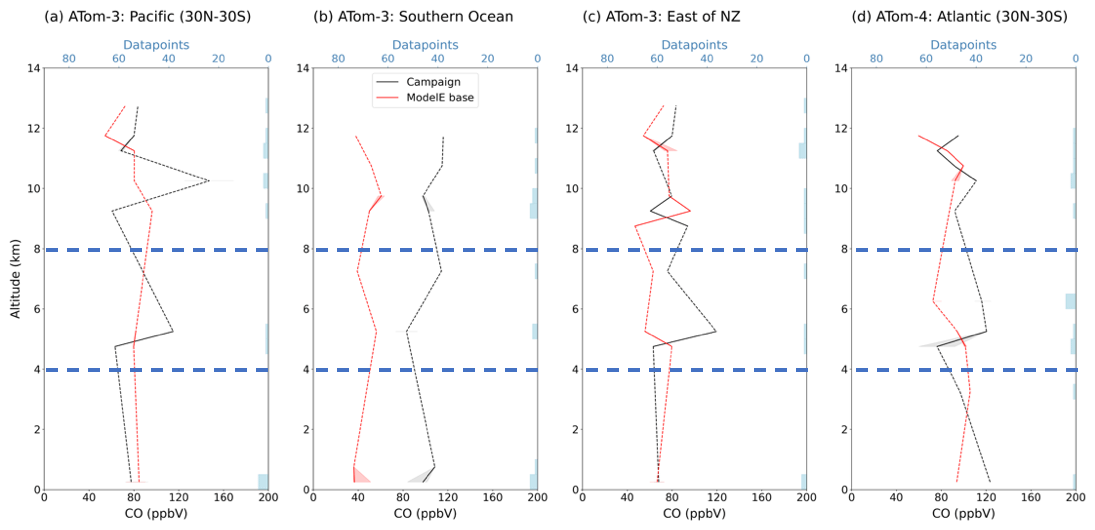
Figure A3Vertical profiles of median carbon monoxide (CO) concentration measured by flight campaigns (black) and simulated by ModelE's base case of BrC representation (red), over remote regions, reported in units of ppbV. Consistent with Fig. A2, campaign and specific region of analysis is indicated on the top left of each plot, the midpoint of altitude bins is plotted, dashed lines interpolate over altitudes with no data, shaded areas show IQR of data in each altitude bin, blue bars show the number of datapoints grouped in each bin, and horizontal blue dashed-lines separate the lower-, mid-, and upper-troposphere. Data is not filtered for BB number fraction.
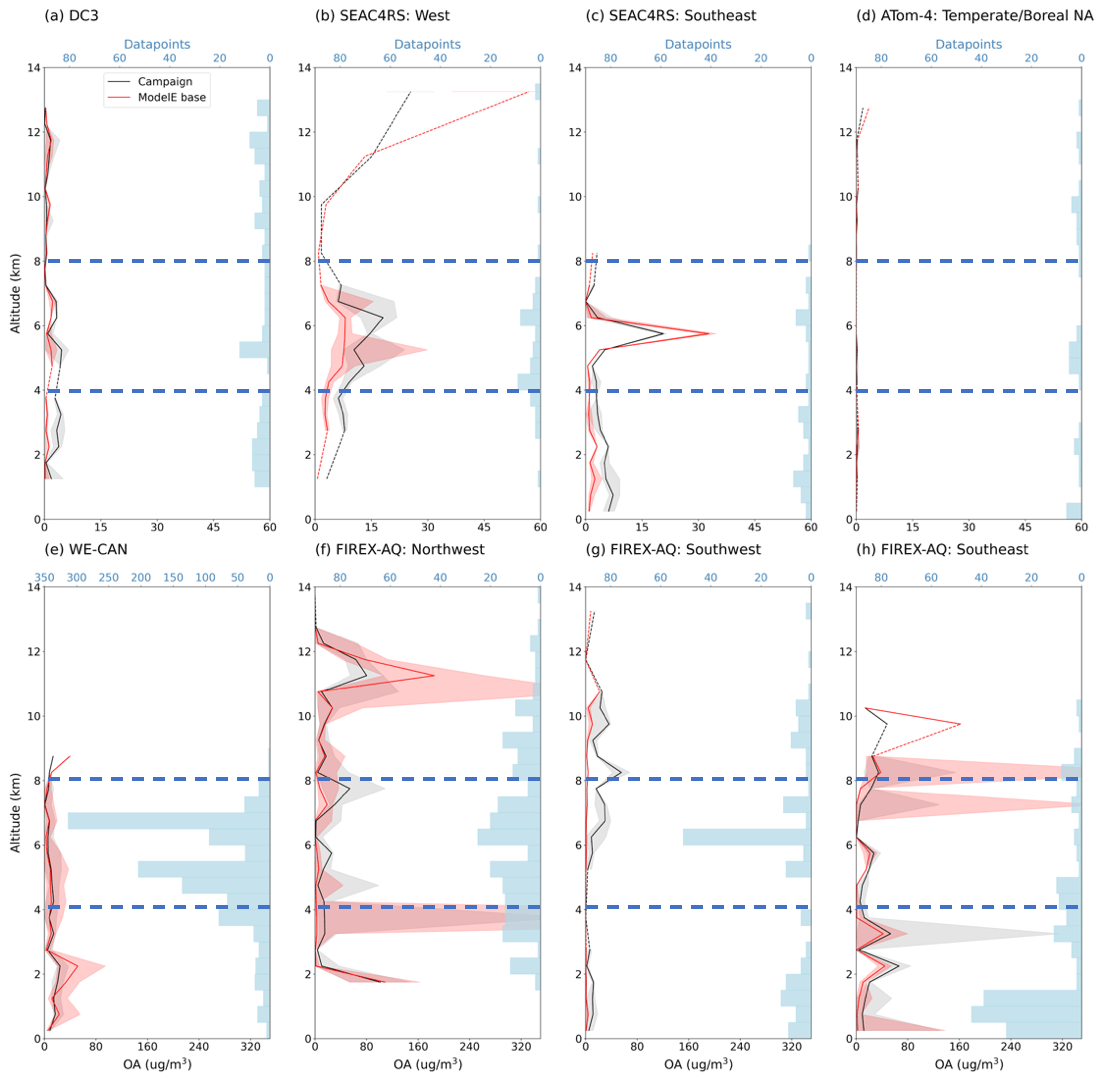
Figure A4Vertical profiles of median, total organic aerosol (OA) concentration measured by flight campaigns (black) and simulated by ModelE's base case of BrC representation (red), over land/near sources, reported in units of µg m−3. Model data has been multiplied by a CO and BC scaling factor (Eqs. 1–2). Consistent with Fig. A2, campaign and specific region of analysis is indicated on the top left of each plot, the midpoint of altitude bins is plotted, dashed lines interpolate over altitudes with no data, shaded areas show the IQR of data in each altitude bin, blue bars show the number of datapoints grouped in each bin, horizontal blue dashed-lines separate the lower-, mid-, and upper-troposphere, and data is filtered for BB number fraction (when relevant).
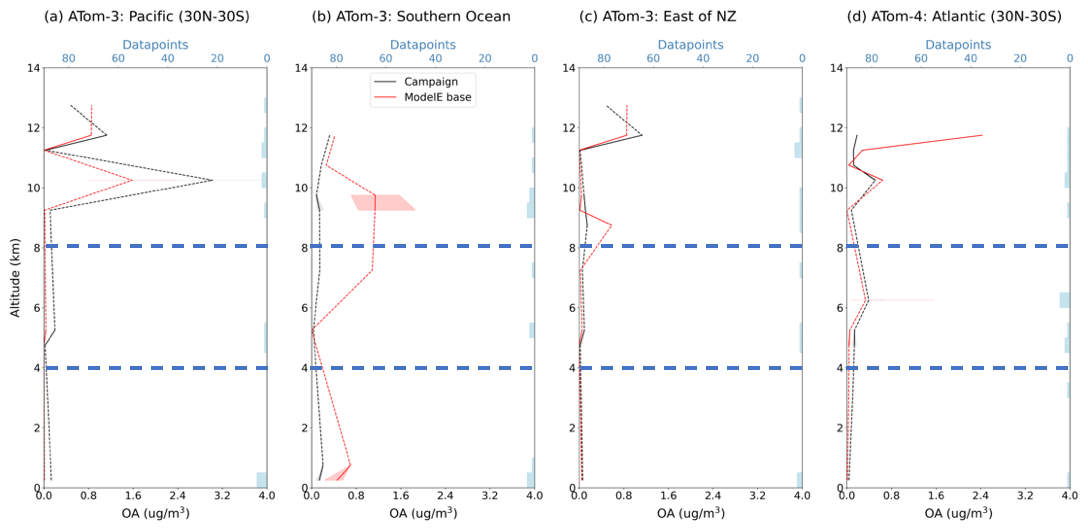
Figure A5Vertical profiles of median, total organic aerosol (OA) concentration measured by flight campaigns (black) and simulated by ModelE's base case of BrC representation (red), over remote regions, reported in units of µg m−3. Consistent with Fig. A4, a CO and BC scaling factor (Eqs. 1–2) have been applied to model data, campaign and specific region of analysis is indicated on the top left of each plot, the midpoint of altitude bins is plotted, dashed lines interpolate over altitudes with no data, shaded areas show the IQR of data in each altitude bin, blue bars show the number of datapoints grouped in each bin, and horizontal blue dashed-lines separate the lower-, mid-, and upper-troposphere. Data is not filtered for BB number fraction.
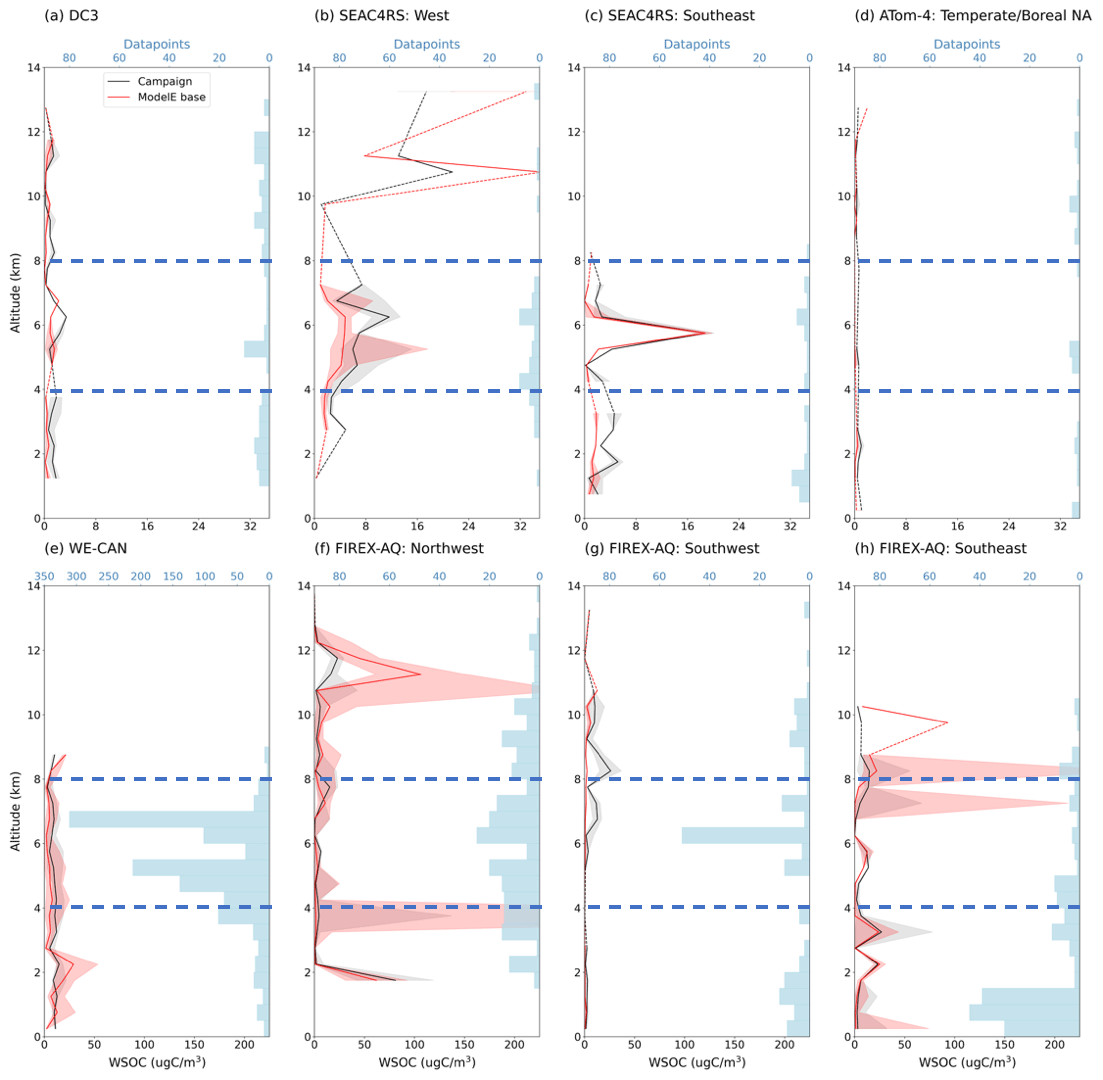
Figure A6Vertical profiles of median water-soluble organic carbon (WSOC) concentration measured by flight campaigns (black) and simulated by ModelE's base case of BrC representation (red), over land/near sources, reported in units of µgC m−3. Consistent with Fig. A4, a CO and BC scaling factor (Eqs. 1–2) have been applied to model data, campaign and specific region of analysis is indicated on the top left of each plot, the midpoint of altitude bins is plotted, dashed lines interpolate over altitudes with no data, shaded areas show the IQR of data in each altitude bin, blue bars show the number of datapoints grouped in each bin, horizontal blue dashed-lines separate the lower-, mid-, and upper-troposphere, and data is filtered for BB number fraction (when relevant).
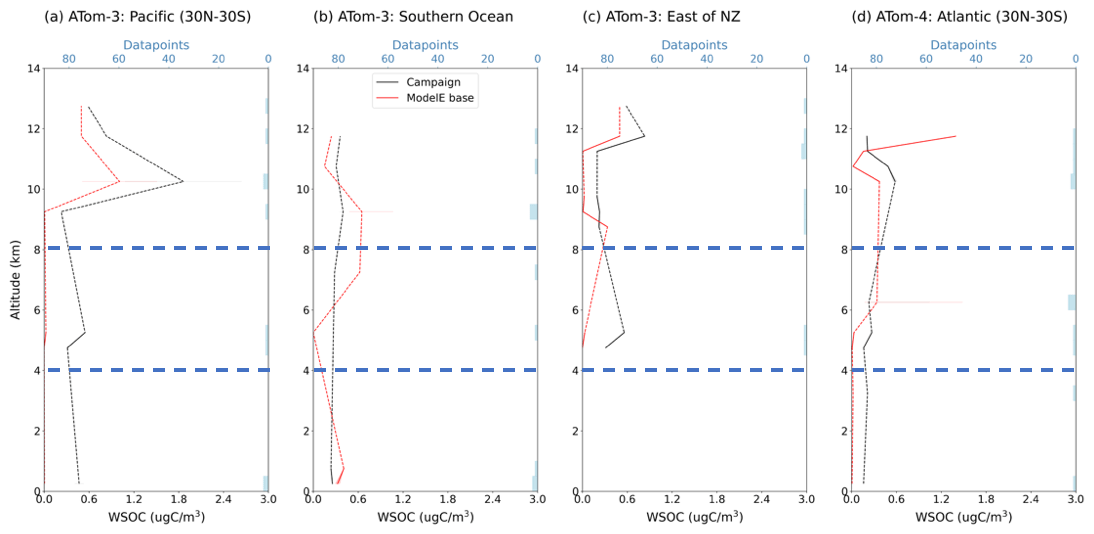
Figure A7Vertical profiles of median water-soluble organic carbon (WSOC) concentration measured by flight campaigns (black) and simulated by ModelE's base case of BrC representation (red), over remote regions, reported in units of µgC m−3. Consistent with Fig. A4, a CO and BC scaling factor (Eqs. 1–2) have been applied to model data, campaign and specific region of analysis is indicated on the top left of each plot, the midpoint of altitude bins is plotted, dashed lines interpolate over altitudes with no data, shaded areas show the IQR of data in each altitude bin, blue bars show the number of datapoints grouped in each bin, and horizontal blue dashed-lines separate the lower-, mid-, and upper-troposphere. Data is not filtered for BB number fraction.
The GISS ModelE code is publicly available at https://simplex.giss.nasa.gov/snapshots/ (last access: 26 March 2025) (National Aeronautics and Space Administration, 2025). The most recent public version is E2.1.2. The Fortran code used for the simulations described in this study, along with the model output, is available at https://doi.org/10.5281/zenodo.15092997 (DeLessio et al., 2025b). The model code can be found in the file titled “ModelE_code_032625.tar.gz”; model output is in the file titled “ModelE_SimulationData.tar.gz”. Model simulation data sampled at the same time and location of measurements is provided for each campaign. MERRA-2 reanalysis is available at https://doi.org/10.5067/QBZ6MG944HW0 (GMAO, 2015). DC3 campaign data are available at https://www-air.larc.nasa.gov/cgi-bin/ArcView/dc3 (NASA, 2025a). SEAC4RS campaign data are available at https://www-air.larc.nasa.gov/cgi-bin/ArcView/seac4rs (NASA, 2025b). ATom campaign data are available at https://doi.org/10.3334/ORNLDAAC/1925 (Wofsy et al., 2021). WE-CAN and FIREX-AQ campaign merged data are available at https://www-air.larc.nasa.gov/cgi-bin/ArcView/firexaq?MERGE=1 (NASA, 2025c). BrC absorption and WSOC mass concentration measurements from WE-CAN are not included in merged data but can be found individually at https://doi.org/10.26023/CRHY-NDT9-C30V (Sullivan et al., 2021).
MAD, KT, and SEB conceived the study. All model development was done by MAD, guided by KT and SEB. MAD conducted all model simulations and analysis, created all figures, and drafted the first version of this manuscript. All authors contributed to later drafts.
At least one of the (co-)authors is a member of the editorial board of Atmospheric Chemistry and Physics. The peer-review process was guided by an independent editor, and the authors also have no other competing interests to declare.
Publisher's note: Copernicus Publications remains neutral with regard to jurisdictional claims made in the text, published maps, institutional affiliations, or any other geographical representation in this paper. The authors bear the ultimate responsibility for providing appropriate place names. Views expressed in the text are those of the authors and do not necessarily reflect the views of the publisher.
Climate modeling at GISS is supported by the NASA Modeling, Analysis, and Prediction Program. Maegan A. DeLessio acknowledges support from the Future Investigators in NASA Earth and Space Science and Technology program (grant no. 80NSSC22K1442). Kostas Tsigaridis acknowledges support from the Plankton, Aerosol, Cloud, ocean Ecosystem project (grant no. 80NSSC20M0205). Maegan A. DeLessio acknowledges useful guidance from Róisín Commane and Faye McNeill. We thank Rodney Weber, the PI of BrC measurements taken in DC3, SEAC4RS, ATom, and FIREX-AQ flight campaigns, and Amy Sullivan, the PI of BrC measurements taken in the WE-CAN campaign. We thank Mary Barth/Chris Cantrell, Brian Toon, Steven Wofsy, Emily Fischer (and others), and Carsten Warnecke (and others) for their work as PIs of the DC3, SEAC4RS, ATom, WE-CAN, and FIREX-AQ campaigns, respectively. We thank Ru-Shan Gao, Joshua Schwarz, and Paul DeMott, the PIs of BC measurements. We thank Jose Jimenez, Lauren Garofalo, and Delphine Farmer, the PIs of OA measurements. We thank Glenn Diskin, Kathryn McKain, and Colm Sweeney, the PIs of CO measurements. Finally, we thank Karl Froyd and Daniel Murphy, the PIs of DC3 and SEAC4RS PALMS data. Resources for this work were provided by the NASA High-End Computing (HEC) Program through the NASA Center for Climate Simulation (NCCS) at Goddard Space Flight Center.
This research has been supported by the National Aeronautics and Space Administration (grant no. 80NSSC22K1442).
This paper was edited by Eleanor Browne and reviewed by two anonymous referees.
Aiken, A. C., DeCarlo, P. F., Kroll, J. H., Worsnop, D. R., Huffman, J. A., Docherty, K. S., Ulbrich, I. M., Mohr, C., Kimmel, J. R., Sueper, D., Sun, Y., Zhang, Q., Trimborn, A., Northway, M., Ziemann, P. J., Canagaratna, M. R., Onasch, T. B., Alfarra, M. R., Prevot, A. S. H., Dommen, J., Duplissy, J., Metzger, A., Baltensperger, U., and Jimenez, J. L.: O/C and OM/OC Ratios of Primary, Secondary, and Ambient Organic Aerosols with High-Resolution Time-of-Flight Aerosol Mass Spectrometry, Environ. Sci. Technol., 42, 4478–4485, https://doi.org/10.1021/es703009q, 2008.
Al Nimer, A., Rocha, L., Rahman, M. A., Nizkorodov, S. A., and Al-Abadleh, H. A.: Effect of Oxalate and Sulfate on Iron-Catalyzed Secondary Brown Carbon Formation, Environ. Sci. Technol., 53, 6708–6717, https://doi.org/10.1021/acs.est.9b00237, 2019.
Barth, M. C., Cantrell, C. A., Brune, W. H., Rutledge, S. A., Crawford, J. H., Huntrieser, H., Carey, L. D., MacGorman, D., Weisman, M., Pickering, K. E., Bruning, E., Anderson, B., Apel, E., Biggerstaff, M., Campos, T., Campuzano-Jost, P., Cohen, R., Crounse, J., Day, D. A., Diskin, G., Flocke, F., Fried, A., Garland, C., Heikes, B., Honomichl, S., Hornbrook, R., Huey, L. G., Jimenez, J. L., Lang, T., Lichtenstern, M., Mikoviny, T., Nault, B., O'Sullivan, D., Pan, L. L., Peischl, J., Pollack, I., Richter, D., Riemer, D., Ryerson, T., Schlager, H., Clair, J. S., Walega, J., Weibring, P., Weinheimer, A., Wennberg, P., Wisthaler, A., Wooldridge, P. J., and Ziegler, C.: The Deep Convective Clouds and Chemistry (DC3) Field Campaign, Bulletin of the American Meteorological Society, 96, 1281–1309, https://doi.org/10.1175/BAMS-D-13-00290.1, 2015.
Bauer, S. E., Menon, S., Koch, D., Bond, T. C., and Tsigaridis, K.: A global modeling study on carbonaceous aerosol microphysical characteristics and radiative effects, Atmos. Chem. Phys., 10, 7439–7456, https://doi.org/10.5194/acp-10-7439-2010, 2010.
Bauer, S. E., Tsigaridis, K., Faluvegi, G., Kelley, M., Lo, K. K., Miller, R. L., Nazarenko, L., Schmidt, G. A., and Wu, J.: Historical (1850–2014) Aerosol Evolution and Role on Climate Forcing Using the GISS ModelE2.1 Contribution to CMIP6, Journal of Advances in Modeling Earth Systems, 12, e2019MS001978, https://doi.org/10.1029/2019MS001978, 2020.
Bauer, S. E., Tsigaridis, K., Faluvegi, G., Nazarenko, L., Miller, R. L., Kelley, M., and Schmidt, G.: The Turning Point of the Aerosol Era, Journal of Advances in Modeling Earth Systems, 14, e2022MS003070, https://doi.org/10.1029/2022MS003070, 2022.
Bond, T. C., Doherty, S. J., Fahey, D. W., Forster, P. M., Berntsen, T., DeAngelo, B. J., Flanner, M. G., Ghan, S., Kärcher, B., Koch, D., Kinne, S., Kondo, Y., Quinn, P. K., Sarofim, M. C., Schultz, M. G., Schulz, M., Venkataraman, C., Zhang, H., Zhang, S., Bellouin, N., Guttikunda, S. K., Hopke, P. K., Jacobson, M. Z., Kaiser, J. W., Klimont, Z., Lohmann, U., Schwarz, J. P., Shindell, D., Storelvmo, T., Warren, S. G., and Zender, C. S.: Bounding the role of black carbon in the climate system: A scientific assessment, Journal of Geophysical Research: Atmospheres, 118, 5380–5552, https://doi.org/10.1002/jgrd.50171, 2013.
Brown, H., Liu, X., Feng, Y., Jiang, Y., Wu, M., Lu, Z., Wu, C., Murphy, S., and Pokhrel, R.: Radiative effect and climate impacts of brown carbon with the Community Atmosphere Model (CAM5), Atmos. Chem. Phys., 18, 17745–17768, https://doi.org/10.5194/acp-18-17745-2018, 2018.
Canagaratna, M. R., Jimenez, J. L., Kroll, J. H., Chen, Q., Kessler, S. H., Massoli, P., Hildebrandt Ruiz, L., Fortner, E., Williams, L. R., Wilson, K. R., Surratt, J. D., Donahue, N. M., Jayne, J. T., and Worsnop, D. R.: Elemental ratio measurements of organic compounds using aerosol mass spectrometry: characterization, improved calibration, and implications, Atmos. Chem. Phys., 15, 253–272, https://doi.org/10.5194/acp-15-253-2015, 2015.
Carter, T. S., Heald, C. L., Cappa, C. D., Kroll, J. H., Campos, T. L., Coe, H., Cotterell, M. I., Davies, N. W., Farmer, D. K., Fox, C., Garofalo, L. A., Hu, L., Langridge, J. M., Levin, E. J. T., Murphy, S. M., Pokhrel, R. P., Shen, Y., Szpek, K., Taylor, J. W., and Wu, H.: Investigating Carbonaceous Aerosol and Its Absorption Properties From Fires in the Western United States (WE-CAN) and Southern Africa (ORACLES and CLARIFY), Journal of Geophysical Research: Atmospheres, 126, e2021JD034984, https://doi.org/10.1029/2021JD034984, 2021.
Chakrabarty, R. K., Moosmüller, H., Chen, L.-W. A., Lewis, K., Arnott, W. P., Mazzoleni, C., Dubey, M. K., Wold, C. E., Hao, W. M., and Kreidenweis, S. M.: Brown carbon in tar balls from smoldering biomass combustion, Atmos. Chem. Phys., 10, 6363–6370, https://doi.org/10.5194/acp-10-6363-2010, 2010.
Cheng, Z., Atwi, K. M., Yu, Z., Avery, A., Fortner, E. C., Williams, L., Majluf, F., Krechmer, J. E., Lambe, A. T., and Saleh, R.: Evolution of the light-absorption properties of combustion brown carbon aerosols following reaction with nitrate radicals, Aerosol Science and Technology, 54, 849–863, https://doi.org/10.1080/02786826.2020.1726867, 2020.
Chrit, M., Sartelet, K., Sciare, J., Majdi, M., Nicolas, J., Petit, J.-E., and Dulac, F.: Modeling organic aerosol concentrations and properties during winter 2014 in the northwestern Mediterranean region, Atmos. Chem. Phys., 18, 18079–18100, https://doi.org/10.5194/acp-18-18079-2018, 2018.
Clifton, O. E., Bauer, S. E., Tsigaridis, K., Aleinov, I., Cowan, T. G., Faluvegi, G., and Kelley, M.: Influence of More Mechanistic Representation of Particle Dry Deposition on 1850–2000 Changes in Global Aerosol Burdens and Radiative Forcing, Journal of Advances in Modeling Earth Systems, 16, e2023MS003952, https://doi.org/10.1029/2023MS003952, 2024.
Colarco, P. R., Gassó, S., Ahn, C., Buchard, V., da Silva, A. M., and Torres, O.: Simulation of the Ozone Monitoring Instrument aerosol index using the NASA Goddard Earth Observing System aerosol reanalysis products, Atmos. Meas. Tech., 10, 4121–4134, https://doi.org/10.5194/amt-10-4121-2017, 2017.
DeCarlo, P. F., Kimmel, J. R., Trimborn, A., Northway, M. J., Jayne, J. T., Aiken, A. C., Gonin, M., Fuhrer, K., Horvath, T., Docherty, K. S., Worsnop, D. R., and Jimenez, J. L.: Field-Deployable, High-Resolution, Time-of-Flight Aerosol Mass Spectrometer, Anal. Chem., 78, 8281–8289, https://doi.org/10.1021/ac061249n, 2006.
DeLessio, M. A., Tsigaridis, K., Bauer, S. E., Chowdhary, J., and Schuster, G. L.: Modeling atmospheric brown carbon in the GISS ModelE Earth system model, Atmos. Chem. Phys., 24, 6275–6304, https://doi.org/10.5194/acp-24-6275-2024, 2024.
DeLessio, M. A., Bauer, S. E., Tsigaridis, K., and Schuster, G. L.: Harmonizing Aerosol Model Parameters With Retrieval Property Assumptions: Brown Carbon as a Case Study, Journal of Geophysical Research: Atmospheres, 130, e2024JD043040, https://doi.org/10.1029/2024JD043040, 2025a.
DeLessio, M., Bauer, S., and Tsigaridis, K.: Exploring biases in the GISS ModelE Earth system model brown carbon representation with in-situ flight observations, Zenodo [data set] and [code], https://doi.org/10.5281/zenodo.15092997, 2025b.
Di Lorenzo, R. A. and Young, C. J.: Size separation method for absorption characterization in brown carbon: Application to an aged biomass burning sample, Geophysical Research Letters, 43, 458–465, https://doi.org/10.1002/2015GL066954, 2016.
Di Lorenzo, R. A., Washenfelder, R. A., Attwood, A. R., Guo, H., Xu, L., Ng, N. L., Weber, R. J., Baumann, K., Edgerton, E., and Young, C. J.: Molecular-Size-Separated Brown Carbon Absorption for Biomass-Burning Aerosol at Multiple Field Sites, Environ. Sci. Technol., 51, 3128–3137, https://doi.org/10.1021/acs.est.6b06160, 2017.
Drugé, T., Nabat, P., Mallet, M., Michou, M., Rémy, S., and Dubovik, O.: Modeling radiative and climatic effects of brown carbon aerosols with the ARPEGE-Climat global climate model, Atmos. Chem. Phys., 22, 12167–12205, https://doi.org/10.5194/acp-22-12167-2022, 2022.
Feng, Y., Ramanathan, V., and Kotamarthi, V. R.: Brown carbon: a significant atmospheric absorber of solar radiation?, Atmos. Chem. Phys., 13, 8607–8621, https://doi.org/10.5194/acp-13-8607-2013, 2013.
Flannigan, M. D., Krawchuk, M. A., de Groot, W. J., Wotton, B. M., and Gowman, L. M.: Implications of changing climate for global wildland fire, Int. J. Wildland Fire, 18, 483, https://doi.org/10.1071/WF08187, 2009.
Fleming, L. T., Lin, P., Roberts, J. M., Selimovic, V., Yokelson, R., Laskin, J., Laskin, A., and Nizkorodov, S. A.: Molecular composition and photochemical lifetimes of brown carbon chromophores in biomass burning organic aerosol, Atmos. Chem. Phys., 20, 1105–1129, https://doi.org/10.5194/acp-20-1105-2020, 2020.
Forrister, H., Liu, J., Scheuer, E., Dibb, J., Ziemba, L., Thornhill, K. L., Anderson, B., Diskin, G., Perring, A. E., Schwarz, J. P., Campuzano-Jost, P., Day, D. A., Palm, B. B., Jimenez, J. L., Nenes, A., and Weber, R. J.: Evolution of brown carbon in wildfire plumes, Geophysical Research Letters, 42, 4623–4630, https://doi.org/10.1002/2015GL063897, 2015.
Garofalo, L. A., Pothier, M. A., Levin, E. J. T., Campos, T., Kreidenweis, S. M., and Farmer, D. K.: Emission and Evolution of Submicron Organic Aerosol in Smoke from Wildfires in the Western United States, ACS Earth Space Chem., 3, 1237–1247, https://doi.org/10.1021/acsearthspacechem.9b00125, 2019.
Gelaro, R., McCarty, W., Suárez, M. J., Todling, R., Molod, A., Takacs, L., Randles, C. A., Darmenov, A., Bosilovich, M. G., Reichle, R., Wargan, K., Coy, L., Cullather, R., Draper, C., Akella, S., Buchard, V., Conaty, A., Silva, A. M. da, Gu, W., Kim, G.-K., Koster, R., Lucchesi, R., Merkova, D., Nielsen, J. E., Partyka, G., Pawson, S., Putman, W., Rienecker, M., Schubert, S. D., Sienkiewicz, M., and Zhao, B.: The Modern-Era Retrospective Analysis for Research and Applications, Version 2 (MERRA-2), Journal of Climate, 30, 5419–5454, https://doi.org/10.1175/JCLI-D-16-0758.1, 2017.
Global Modeling and Assimilation Office (GMAO): MERRA2 inst3_3d_asm_Np: 3d,3-Hourly,Instantaneous,PressureLevel,Assimilation,Assimilated Meteorological Fields V5.12.4, Greenbelt, MD, USA, Goddard Earth Sciences Data and Information Services Center (GES DISC) [data set], https://doi.org/10.5067/QBZ6MG944HW0, 2015.
Hammer, M. S., Martin, R. V., van Donkelaar, A., Buchard, V., Torres, O., Ridley, D. A., and Spurr, R. J. D.: Interpreting the ultraviolet aerosol index observed with the OMI satellite instrument to understand absorption by organic aerosols: implications for atmospheric oxidation and direct radiative effects, Atmos. Chem. Phys., 16, 2507–2523, https://doi.org/10.5194/acp-16-2507-2016, 2016.
Hems, R. F., Schnitzler, E. G., Bastawrous, M., Soong, R., Simpson, A. J., and Abbatt, J. P. D.: Aqueous Photoreactions of Wood Smoke Brown Carbon, ACS Earth Space Chem., 4, 1149–1160, https://doi.org/10.1021/acsearthspacechem.0c00117, 2020.
Hems, R. F., Schnitzler, E. G., Liu-Kang, C., Cappa, C. D., and Abbatt, J. P. D.: Aging of Atmospheric Brown Carbon Aerosol, ACS Earth Space Chem., 5, 722–748, https://doi.org/10.1021/acsearthspacechem.0c00346, 2021.
Hoesly, R. M., Smith, S. J., Feng, L., Klimont, Z., Janssens-Maenhout, G., Pitkanen, T., Seibert, J. J., Vu, L., Andres, R. J., Bolt, R. M., Bond, T. C., Dawidowski, L., Kholod, N., Kurokawa, J.-I., Li, M., Liu, L., Lu, Z., Moura, M. C. P., O'Rourke, P. R., and Zhang, Q.: Historical (1750–2014) anthropogenic emissions of reactive gases and aerosols from the Community Emissions Data System (CEDS), Geosci. Model Dev., 11, 369–408, https://doi.org/10.5194/gmd-11-369-2018, 2018.
Ito, A. and Penner, J. E.: Historical emissions of carbonaceous aerosols from biomass and fossil fuel burning for the period 1870–2000, Global Biogeochemical Cycles, 19, https://doi.org/10.1029/2004GB002374, 2005.
Jacobson, M. Z.: Strong radiative heating due to the mixing state of black carbon in atmospheric aerosols, Nature, 409, 695–697, https://doi.org/10.1038/35055518, 2001.
Jo, D. S., Park, R. J., Lee, S., Kim, S.-W., and Zhang, X.: A global simulation of brown carbon: implications for photochemistry and direct radiative effect, Atmos. Chem. Phys., 16, 3413–3432, https://doi.org/10.5194/acp-16-3413-2016, 2016.
Kaiser, J. W., Heil, A., Andreae, M. O., Benedetti, A., Chubarova, N., Jones, L., Morcrette, J.-J., Razinger, M., Schultz, M. G., Suttie, M., and van der Werf, G. R.: Biomass burning emissions estimated with a global fire assimilation system based on observed fire radiative power, Biogeosciences, 9, 527–554, https://doi.org/10.5194/bg-9-527-2012, 2012.
Kelley, M., Schmidt, G. A., Nazarenko, L. S., Bauer, S. E., Ruedy, R., Russell, G. L., Ackerman, A. S., Aleinov, I., Bauer, M., Bleck, R., Canuto, V., Cesana, G., Cheng, Y., Clune, T. L., Cook, B. I., Cruz, C. A., Del Genio, A. D., Elsaesser, G. S., Faluvegi, G., Kiang, N. Y., Kim, D., Lacis, A. A., Leboissetier, A., LeGrande, A. N., Lo, K. K., Marshall, J., Matthews, E. E., McDermid, S., Mezuman, K., Miller, R. L., Murray, L. T., Oinas, V., Orbe, C., García-Pando, C. P., Perlwitz, J. P., Puma, M. J., Rind, D., Romanou, A., Shindell, D. T., Sun, S., Tausnev, N., Tsigaridis, K., Tselioudis, G., Weng, E., Wu, J., and Yao, M.: GISS-E2.1: Configurations and Climatology, J. Adv. Model Earth Syst., 12, https://doi.org/10.1029/2019MS002025, 2020.
Keywood, M., Kanakidou, M., Stohl, A., Dentener, F., Grassi, G., Meyer, C. P., Torseth, K., Edwards, D., Thompson, A. M., Lohmann, U., and Burrows, J.: Fire in the Air: Biomass Burning Impacts in a Changing Climate, Critical Reviews in Environmental Science and Technology, 43, 40–83, https://doi.org/10.1080/10643389.2011.604248, 2013.
Koch, D., Jacob, D., Tegen, I., Rind, D., and Chin, M.: Tropospheric sulfur simulation and sulfate direct radiative forcing in the Goddard Institute for Space Studies general circulation model, Journal of Geophysical Research: Atmospheres, 104, 23799–23822, https://doi.org/10.1029/1999JD900248, 1999.
Kuang, Y., Luo, B., Huang, S., Liu, J., Hu, W., Peng, Y., Chen, D., Yue, D., Xu, W., Yuan, B., and Shao, M.: Formation of highly absorptive secondary brown carbon through nighttime multiphase chemistry of biomass burning emissions, Atmos. Chem. Phys., 25, 3737–3752, https://doi.org/10.5194/acp-25-3737-2025, 2025.
Kumar, N. K., Corbin, J. C., Bruns, E. A., Massabó, D., Slowik, J. G., Drinovec, L., Močnik, G., Prati, P., Vlachou, A., Baltensperger, U., Gysel, M., El-Haddad, I., and Prévôt, A. S. H.: Production of particulate brown carbon during atmospheric aging of residential wood-burning emissions, Atmos. Chem. Phys., 18, 17843–17861, https://doi.org/10.5194/acp-18-17843-2018, 2018.
Lack, D. A., Langridge, J. M., Bahreini, R., Cappa, C. D., Middlebrook, A. M., and Schwarz, J. P.: Brown carbon and internal mixing in biomass burning particles, Proceedings of the National Academy of Sciences, 109, 14802–14807, https://doi.org/10.1073/pnas.1206575109, 2012.
Laskin, A., Laskin, J., and Nizkorodov, S. A.: Chemistry of Atmospheric Brown Carbon, Chem. Rev., 115, 4335–4382, https://doi.org/10.1021/cr5006167, 2015.
Lee, H. J. (Julie), Aiona, P. K., Laskin, A., Laskin, J., and Nizkorodov, S. A.: Effect of Solar Radiation on the Optical Properties and Molecular Composition of Laboratory Proxies of Atmospheric Brown Carbon, Environ. Sci. Technol., 48, 10217–10226, https://doi.org/10.1021/es502515r, 2014.
Levy, R. C., Mattoo, S., Munchak, L. A., Remer, L. A., Sayer, A. M., Patadia, F., and Hsu, N. C.: The Collection 6 MODIS aerosol products over land and ocean, Atmos. Meas. Tech., 6, 2989–3034, https://doi.org/10.5194/amt-6-2989-2013, 2013.
Li, C., He, Q., Hettiyadura, A. P. S., Käfer, U., Shmul, G., Meidan, D., Zimmermann, R., Brown, S. S., George, C., Laskin, A., and Rudich, Y.: Formation of Secondary Brown Carbon in Biomass Burning Aerosol Proxies through NO3 Radical Reactions, Environ. Sci. Technol., 54, 1395–1405, https://doi.org/10.1021/acs.est.9b05641, 2020.
Li, Q., Liu, D., Jiang, X., Tian, P., Wu, Y., Li, S., Hu, K., Liu, Q., Huang, M., Li, R., Bi, K., Kong, S., Ding, D., and Yu, C.: Concurrent photochemical whitening and darkening of ambient brown carbon, Atmos. Chem. Phys., 23, 9439–9453, https://doi.org/10.5194/acp-23-9439-2023, 2023.
Lin, G., Penner, J. E., Flanner, M. G., Sillman, S., Xu, L., and Zhou, C.: Radiative forcing of organic aerosol in the atmosphere and on snow: Effects of SOA and brown carbon, Journal of Geophysical Research: Atmospheres, 119, 7453–7476, https://doi.org/10.1002/2013JD021186, 2014.
Lin, P., Fleming, L. T., Nizkorodov, S. A., Laskin, J., and Laskin, A.: Comprehensive Molecular Characterization of Atmospheric Brown Carbon by High Resolution Mass Spectrometry with Electrospray and Atmospheric Pressure Photoionization, Anal. Chem., 90, 12493–12502, https://doi.org/10.1021/acs.analchem.8b02177, 2018.
Liu, J., Lin, P., Laskin, A., Laskin, J., Kathmann, S. M., Wise, M., Caylor, R., Imholt, F., Selimovic, V., and Shilling, J. E.: Optical properties and aging of light-absorbing secondary organic aerosol, Atmos. Chem. Phys., 16, 12815–12827, https://doi.org/10.5194/acp-16-12815-2016, 2016.
Mahilang, M., Deb, M. K., and Pervez, S.: Biogenic secondary organic aerosols: A review on formation mechanism, analytical challenges and environmental impacts, Chemosphere, 262, 127771, https://doi.org/10.1016/j.chemosphere.2020.127771, 2021.
McKain, K. and Sweeney, C.: ATom: CO2, CH4, and CO Measurements from Picarro, 2016–2018, ORNL DAAC, Oak Ridge, Tennessee, USA [data set], https://doi.org/10.3334/ORNLDAAC/1732, 2021.
McMeeking, G. R., Kreidenweis, S. M., Baker, S., Carrico, C. M., Chow, J. C., Collett Jr., J. L., Hao, W. M., Holden, A. S., Kirchstetter, T. W., Malm, W. C., Moosmüller, H., Sullivan, A. P., and Wold, C. E.: Emissions of trace gases and aerosols during the open combustion of biomass in the laboratory, Journal of Geophysical Research: Atmospheres, 114, https://doi.org/10.1029/2009JD011836, 2009.
NASA: NASA Airborne Science Data for Atmospheric Composition: https://www-air.larc.nasa.gov/cgi-bin/ArcView/dc3, last access: 26 March 2025a.
NASA: NASA Airborne Science Data for Atmospheric Composition: https://www-air.larc.nasa.gov/cgi-bin/ArcView/seac4rs, last access: 26 March 2025b.
NASA: NASA Airborne Science Data for Atmospheric Composition: https://www-air.larc.nasa.gov/cgi-bin/ArcView/firexaq?MERGE=1, last access: 26 March 2025c.
National Aeronautics and Space Administration: GISS ModelE Source Code Snapshots, NASA [code], https://simplex.giss.nasa.gov/snapshots/ (last access: 26 March 2025), 2025.
Palm, B. B., Peng, Q., Fredrickson, C. D., Lee, B. H., Garofalo, L. A., Pothier, M. A., Kreidenweis, S. M., Farmer, D. K., Pokhrel, R. P., Shen, Y., Murphy, S. M., Permar, W., Hu, L., Campos, T. L., Hall, S. R., Ullmann, K., Zhang, X., Flocke, F., Fischer, E. V., and Thornton, J. A.: Quantification of organic aerosol and brown carbon evolution in fresh wildfire plumes, Proceedings of the National Academy of Sciences, 117, 29469–29477, https://doi.org/10.1073/pnas.2012218117, 2020.
Petrenko, M., Kahn, R., Chin, M., Bauer, S. E., Bergman, T., Bian, H., Curci, G., Johnson, B., Kaiser, J. W., Kipling, Z., Kokkola, H., Liu, X., Mezuman, K., Mielonen, T., Myhre, G., Pan, X., Protonotariou, A., Remy, S., Skeie, R. B., Stier, P., Takemura, T., Tsigaridis, K., Wang, H., Watson-Parris, D., and Zhang, K.: Biomass burning emission analysis based on MODIS aerosol optical depth and AeroCom multi-model simulations: implications for model constraints and emission inventories, Atmos. Chem. Phys., 25, 1545–1567, https://doi.org/10.5194/acp-25-1545-2025, 2025.
Philip, S., Martin, R. V., Pierce, J. R., Jimenez, J. L., Zhang, Q., Canagaratna, M. R., Spracklen, D. V., Nowlan, C. R., Lamsal, L. N., Cooper, M. J., and Krotkov, N. A.: Spatially and seasonally resolved estimate of the ratio of organic mass to organic carbon, Atmospheric Environment, 87, 34–40, https://doi.org/10.1016/j.atmosenv.2013.11.065, 2014.
Pokhrel, R. P., Wagner, N. L., Langridge, J. M., Lack, D. A., Jayarathne, T., Stone, E. A., Stockwell, C. E., Yokelson, R. J., and Murphy, S. M.: Parameterization of single-scattering albedo (SSA) and absorption Ångström exponent (AAE) with EC / OC for aerosol emissions from biomass burning, Atmos. Chem. Phys., 16, 9549–9561, https://doi.org/10.5194/acp-16-9549-2016, 2016.
Ramanathan, V. and Carmichael, G.: Global and regional climate changes due to black carbon, Nature Geosci., 1, 221–227, https://doi.org/10.1038/ngeo156, 2008.
Reid, J. S., Posselt, D. J., Kaku, K., Holz, R. A., Chen, G., Eloranta, E. W., Kuehn, R. E., Woods, S., Zhang, J., Anderson, B., Bui, T. P., Diskin, G. S., Minnis, P., Newchurch, M. J., Tanelli, S., Trepte, C. R., Thornhill, K. L., and Ziemba, L. D.: Observations and hypotheses related to low to middle free tropospheric aerosol, water vapor and altocumulus cloud layers within convective weather regimes: a SEAC4RS case study, Atmos. Chem. Phys., 19, 11413–11442, https://doi.org/10.5194/acp-19-11413-2019, 2019.
Ren, W., Farooq, A., Davidson, D. F., and Hanson, R. K.: CO concentration and temperature sensor for combustion gases using quantum-cascade laser absorption near 4.7 µm, Appl. Phys. B, 107, 849–860, https://doi.org/10.1007/s00340-012-5046-1, 2012.
Sachse, G. W., Hill, G. F., Wade, L. O., and Perry, M. G.: Fast-response, high-precision carbon monoxide sensor using a tunable diode laser absorption technique, Journal of Geophysical Research: Atmospheres, 92, 2071–2081, https://doi.org/10.1029/JD092iD02p02071, 1987.
Saleh, R.: From Measurements to Models: Toward Accurate Representation of Brown Carbon in Climate Calculations, Curr. Pollution Rep., 6, 90–104, https://doi.org/10.1007/s40726-020-00139-3, 2020.
Saleh, R., Hennigan, C. J., McMeeking, G. R., Chuang, W. K., Robinson, E. S., Coe, H., Donahue, N. M., and Robinson, A. L.: Absorptivity of brown carbon in fresh and photo-chemically aged biomass-burning emissions, Atmos. Chem. Phys., 13, 7683–7693, https://doi.org/10.5194/acp-13-7683-2013, 2013.
Saleh, R., Robinson, E. S., Tkacik, D. S., Ahern, A. T., Liu, S., Aiken, A. C., Sullivan, R. C., Presto, A. A., Dubey, M. K., Yokelson, R. J., Donahue, N. M., and Robinson, A. L.: Brownness of organics in aerosols from biomass burning linked to their black carbon content, Nature Geosci., 7, 647–650, https://doi.org/10.1038/ngeo2220, 2014.
Saleh, R., Marks, M., Heo, J., Adams, P. J., Donahue, N. M., and Robinson, A. L.: Contribution of brown carbon and lensing to the direct radiative effect of carbonaceous aerosols from biomass and biofuel burning emissions, Journal of Geophysical Research: Atmospheres, 120, 10285–10296, https://doi.org/10.1002/2015JD023697, 2015.
Schnitzler, E. G., Liu, T., Hems, R. F., and Abbatt, J. P. D.: Emerging investigator series: heterogeneous OH oxidation of primary brown carbon aerosol: effects of relative humidity and volatility, Environmental Science: Processes & Impacts, 22, 2162–2171, https://doi.org/10.1039/D0EM00311E, 2020.
Schnitzler, E. G., Gerrebos, N. G. A., Carter, T. S., Huang, Y., Heald, C. L., Bertram, A. K., and Abbatt, J. P. D.: Rate of atmospheric brown carbon whitening governed by environmental conditions, Proceedings of the National Academy of Sciences, 119, e2205610119, https://doi.org/10.1073/pnas.2205610119, 2022.
Schuster, G. L., Dubovik, O., and Arola, A.: Remote sensing of soot carbon – Part 1: Distinguishing different absorbing aerosol species, Atmos. Chem. Phys., 16, 1565–1585, https://doi.org/10.5194/acp-16-1565-2016, 2016.
Schwarz, J. P., Gao, R. S., Fahey, D. W., Thomson, D. S., Watts, L. A., Wilson, J. C., Reeves, J. M., Darbeheshti, M., Baumgardner, D. G., Kok, G. L., Chung, S. H., Schulz, M., Hendricks, J., Lauer, A., Kärcher, B., Slowik, J. G., Rosenlof, K. H., Thompson, T. L., Langford, A. O., Loewenstein, M., and Aikin, K. C.: Single-particle measurements of midlatitude black carbon and light-scattering aerosols from the boundary layer to the lower stratosphere, Journal of Geophysical Research: Atmospheres, 111, https://doi.org/10.1029/2006JD007076, 2006.
Shetty, N. J., Pandey, A., Baker, S., Hao, W. M., and Chakrabarty, R. K.: Measuring light absorption by freshly emitted organic aerosols: optical artifacts in traditional solvent-extraction-based methods, Atmos. Chem. Phys., 19, 8817–8830, https://doi.org/10.5194/acp-19-8817-2019, 2019.
Shingler, T., Dey, S., Sorooshian, A., Brechtel, F. J., Wang, Z., Metcalf, A., Coggon, M., Mülmenstädt, J., Russell, L. M., Jonsson, H. H., and Seinfeld, J. H.: Characterisation and airborne deployment of a new counterflow virtual impactor inlet, Atmos. Meas. Tech., 5, 1259–1269, https://doi.org/10.5194/amt-5-1259-2012, 2012.
Shrivastava, M., Cappa, C. D., Fan, J., Goldstein, A. H., Guenther, A. B., Jimenez, J. L., Kuang, C., Laskin, A., Martin, S. T., Ng, N. L., Petaja, T., Pierce, J. R., Rasch, P. J., Roldin, P., Seinfeld, J. H., Shilling, J., Smith, J. N., Thornton, J. A., Volkamer, R., Wang, J., Worsnop, D. R., Zaveri, R. A., Zelenyuk, A., and Zhang, Q.: Recent advances in understanding secondary organic aerosol: Implications for global climate forcing, Reviews of Geophysics, 55, 509–559, https://doi.org/10.1002/2016RG000540, 2017.
Sinyuk, A., Holben, B. N., Eck, T. F., Giles, D. M., Slutsker, I., Korkin, S., Schafer, J. S., Smirnov, A., Sorokin, M., and Lyapustin, A.: The AERONET Version 3 aerosol retrieval algorithm, associated uncertainties and comparisons to Version 2, Atmos. Meas. Tech., 13, 3375–3411, https://doi.org/10.5194/amt-13-3375-2020, 2020.
Skyllakou, K., Korras-Carraca, M.-B., Matsoukas, C., Hatzianastassiou, N., Pandis, S. N., and Nenes, A.: Predicted Concentrations and Optical Properties of Brown Carbon from Biomass Burning over Europe, ACS EST Air, 714–725, https://doi.org/10.1021/acsestair.4c00032, 2024.
Sullivan, A.: Particle Into Liquid Sampler 1 (PILS1) Sixteen second integrated Abs365, Version 2.0, UCAR/NCAR – Earth Observing Laboratory [data set], https://doi.org/10.26023/CRHY-NDT9-C30V (last access: 26 March 2025), 2021.
Sullivan, A. P., Pokhrel, R. P., Shen, Y., Murphy, S. M., Toohey, D. W., Campos, T., Lindaas, J., Fischer, E. V., and Collett Jr., J. L.: Examination of brown carbon absorption from wildfires in the western US during the WE-CAN study, Atmos. Chem. Phys., 22, 13389–13406, https://doi.org/10.5194/acp-22-13389-2022, 2022.
Sumlin, B. J., Heinson, Y. W., Shetty, N., Pandey, A., Pattison, R. S., Baker, S., Hao, W. M., and Chakrabarty, R. K.: UV–Vis–IR spectral complex refractive indices and optical properties of brown carbon aerosol from biomass burning, Journal of Quantitative Spectroscopy and Radiative Transfer, 206, 392–398, https://doi.org/10.1016/j.jqsrt.2017.12.009, 2018.
Szopa, S., Naik, V., Adhikary, B., Artaxo, P., Berntsen, T., Collins, W. D., Fuzzi, S., Gallardo, L., Kiendler-Scharr, A., Klimont, Z., Liao, H., Unger, N., and Zanis, P.: Short-Lived Climate Forcers, in: Climate Change 2021: The Physical Science Basis. Contribution of Working Group I to the Sixth Assessment Report of the Intergovernmental Panel on Climate Change, edited by: Masson-Delmotte, V., Zhai, P., Pirani, A., Connors, S. L., Péan, C., Berger, S., Caud, N., Chen, Y., Goldfarb, L., Gomis, M. I., Huang, M., Leitzell, K., Lonnoy, E., Matthews, J. B. R., Maycock, T. K., Waterfield, T., Yelekçi, O., Yu, R., and Zhou, B., Cambridge University Press, Cambridge, United Kingdom and New York, NY, USA, 817–922, https://doi.org/10.1017/9781009157896.008, 2021.
Tang, M., Alexander, J. M., Kwon, D., Estillore, A. D., Laskina, O., Young, M. A., Kleiber, P. D., and Grassian, V. H.: Optical and Physicochemical Properties of Brown Carbon Aerosol: Light Scattering, FTIR Extinction Spectroscopy, and Hygroscopic Growth, J. Phys. Chem. A, 120, 4155–4166, https://doi.org/10.1021/acs.jpca.6b03425, 2016.
Tang, W., Emmons, L. K., Buchholz, R. R., Wiedinmyer, C., Schwantes, R. H., He, C., Kumar, R., Pfister, G. G., Worden, H. M., Hornbrook, R. S., Apel, E. C., Tilmes, S., Gaubert, B., Martinez-Alonso, S.-E., Lacey, F., Holmes, C. D., Diskin, G. S., Bourgeois, I., Peischl, J., Ryerson, T. B., Hair, J. W., Weinheimer, A. J., Montzka, D. D., Tyndall, G. S., and Campos, T. L.: Effects of Fire Diurnal Variation and Plume Rise on U.S. Air Quality During FIREX-AQ and WE-CAN Based on the Multi-Scale Infrastructure for Chemistry and Aerosols (MUSICAv0), Journal of Geophysical Research: Atmospheres, 127, e2022JD036650, https://doi.org/10.1029/2022JD036650, 2022.
Thompson, C. R., Wofsy, S. C., Prather, M. J., Newman, P. A., Hanisco, T. F., Ryerson, T. B., Fahey, D. W., Apel, E. C., Brock, C. A., Brune, W. H., Froyd, K., Katich, J. M., Nicely, J. M., Peischl, J., Ray, E., Veres, P. R., Wang, S., Allen, H. M., Asher, E., Bian, H., Blake, D., Bourgeois, I., Budney, J., Bui, T. P., Butler, A., Campuzano-Jost, P., Chang, C., Chin, M., Commane, R., Correa, G., Crounse, J. D., Daube, B., Dibb, J. E., DiGangi, J. P., Diskin, G. S., Dollner, M., Elkins, J. W., Fiore, A. M., Flynn, C. M., Guo, H., Hall, S. R., Hannun, R. A., Hills, A., Hintsa, E. J., Hodzic, A., Hornbrook, R. S., Huey, L. G., Jimenez, J. L., Keeling, R. F., Kim, M. J., Kupc, A., Lacey, F., Lait, L. R., Lamarque, J.-F., Liu, J., McKain, K., Meinardi, S., Miller, D. O., Montzka, S. A., Moore, F. L., Morgan, E. J., Murphy, D. M., Murray, L. T., Nault, B. A., Neuman, J. A., Nguyen, L., Gonzalez, Y., Rollins, A., Rosenlof, K., Sargent, M., Schill, G., Schwarz, J. P., Clair, J. M. S., Steenrod, S. D., Stephens, B. B., Strahan, S. E., Strode, S. A., Sweeney, C., Thames, A. B., Ullmann, K., Wagner, N., Weber, R., Weinzierl, B., Wennberg, P. O., Williamson, C. J., Wolfe, G. M., and Zeng, L.: The NASA Atmospheric Tomography (ATom) Mission: Imaging the Chemistry of the Global Atmosphere, Bulletin of the American Meteorological Society, 103, E761–E790, https://doi.org/10.1175/BAMS-D-20-0315.1, 2022.
Thomson, D. S., Schein, M. E., and Murphy, D. M.: Particle Analysis by Laser Mass Spectrometry WB-57F Instrument Overview, Aerosol Science and Technology, 33, 153–169, https://doi.org/10.1080/027868200410903, 2000.
Toon, O. B., Maring, H., Dibb, J., Ferrare, R., Jacob, D. J., Jensen, E. J., Luo, Z. J., Mace, G. G., Pan, L. L., Pfister, L., Rosenlof, K. H., Redemann, J., Reid, J. S., Singh, H. B., Thompson, A. M., Yokelson, R., Minnis, P., Chen, G., Jucks, K. W., and Pszenny, A.: Planning, implementation, and scientific goals of the Studies of Emissions and Atmospheric Composition, Clouds and Climate Coupling by Regional Surveys (SEAC4RS) field mission, Journal of Geophysical Research: Atmospheres, 121, 4967–5009, https://doi.org/10.1002/2015JD024297, 2016.
Tsigaridis, K. and Kanakidou, M.: Secondary organic aerosol importance in the future atmosphere, Atmospheric Environment, 41, 4682–4692, https://doi.org/10.1016/j.atmosenv.2007.03.045, 2007.
Tsigaridis, K., Daskalakis, N., Kanakidou, M., Adams, P. J., Artaxo, P., Bahadur, R., Balkanski, Y., Bauer, S. E., Bellouin, N., Benedetti, A., Bergman, T., Berntsen, T. K., Beukes, J. P., Bian, H., Carslaw, K. S., Chin, M., Curci, G., Diehl, T., Easter, R. C., Ghan, S. J., Gong, S. L., Hodzic, A., Hoyle, C. R., Iversen, T., Jathar, S., Jimenez, J. L., Kaiser, J. W., Kirkevåg, A., Koch, D., Kokkola, H., Lee, Y. H., Lin, G., Liu, X., Luo, G., Ma, X., Mann, G. W., Mihalopoulos, N., Morcrette, J.-J., Müller, J.-F., Myhre, G., Myriokefalitakis, S., Ng, N. L., O'Donnell, D., Penner, J. E., Pozzoli, L., Pringle, K. J., Russell, L. M., Schulz, M., Sciare, J., Seland, Ø., Shindell, D. T., Sillman, S., Skeie, R. B., Spracklen, D., Stavrakou, T., Steenrod, S. D., Takemura, T., Tiitta, P., Tilmes, S., Tost, H., van Noije, T., van Zyl, P. G., von Salzen, K., Yu, F., Wang, Z., Wang, Z., Zaveri, R. A., Zhang, H., Zhang, K., Zhang, Q., and Zhang, X.: The AeroCom evaluation and intercomparison of organic aerosol in global models, Atmos. Chem. Phys., 14, 10845–10895, https://doi.org/10.5194/acp-14-10845-2014, 2014.
Tuccella, P., Curci, G., Pitari, G., Lee, S., and Jo, D. S.: Direct Radiative Effect of Absorbing Aerosols: Sensitivity to Mixing State, Brown Carbon, and Soil Dust Refractive Index and Shape, Journal of Geophysical Research: Atmospheres, 125, e2019JD030967, https://doi.org/10.1029/2019JD030967, 2020.
van der Werf, G. R., Randerson, J. T., Giglio, L., van Leeuwen, T. T., Chen, Y., Rogers, B. M., Mu, M., van Marle, M. J. E., Morton, D. C., Collatz, G. J., Yokelson, R. J., and Kasibhatla, P. S.: Global fire emissions estimates during 1997–2016, Earth Syst. Sci. Data, 9, 697–720, https://doi.org/10.5194/essd-9-697-2017, 2017.
Wang, F., Lu, Z., Lin, G., Carmichael, G. R., and Gao, M.: Brown Carbon in East Asia: Seasonality, Sources, and Influences on Regional Climate and Air Quality, ACS Environ. Au, https://doi.org/10.1021/acsenvironau.4c00080, 2024.
Wang, X., Heald, C. L., Ridley, D. A., Schwarz, J. P., Spackman, J. R., Perring, A. E., Coe, H., Liu, D., and Clarke, A. D.: Exploiting simultaneous observational constraints on mass and absorption to estimate the global direct radiative forcing of black carbon and brown carbon, Atmos. Chem. Phys., 14, 10989–11010, https://doi.org/10.5194/acp-14-10989-2014, 2014.
Wang, X., Heald, C. L., Liu, J., Weber, R. J., Campuzano-Jost, P., Jimenez, J. L., Schwarz, J. P., and Perring, A. E.: Exploring the observational constraints on the simulation of brown carbon, Atmos. Chem. Phys., 18, 635–653, https://doi.org/10.5194/acp-18-635-2018, 2018.
Warneke, C., Schwarz, J. P., Dibb, J., Kalashnikova, O., Frost, G., Al-Saad, J., Brown, S. S., Brewer, Wm. A., Soja, A., Seidel, F. C., Washenfelder, R. A., Wiggins, E. B., Moore, R. H., Anderson, B. E., Jordan, C., Yacovitch, T. I., Herndon, S. C., Liu, S., Kuwayama, T., Jaffe, D., Johnston, N., Selimovic, V., Yokelson, R., Giles, D. M., Holben, B. N., Goloub, P., Popovici, I., Trainer, M., Kumar, A., Pierce, R. B., Fahey, D., Roberts, J., Gargulinski, E. M., Peterson, D. A., Ye, X., Thapa, L. H., Saide, P. E., Fite, C. H., Holmes, C. D., Wang, S., Coggon, M. M., Decker, Z. C. J., Stockwell, C. E., Xu, L., Gkatzelis, G., Aikin, K., Lefer, B., Kaspari, J., Griffin, D., Zeng, L., Weber, R., Hastings, M., Chai, J., Wolfe, G. M., Hanisco, T. F., Liao, J., Campuzano Jost, P., Guo, H., Jimenez, J. L., Crawford, J., and Team, T. F.-A. S.: Fire Influence on Regional to Global Environments and Air Quality (FIREX-AQ), Journal of Geophysical Research: Atmospheres, 128, e2022JD037758, https://doi.org/10.1029/2022JD037758, 2023.
Washenfelder, R. A., Azzarello, L., Ball, K., Brown, S. S., Decker, Z. C. J., Franchin, A., Fredrickson, C. D., Hayden, K., Holmes, C. D., Middlebrook, A. M., Palm, B. B., Pierce, R. B., Price, D. J., Roberts, J. M., Robinson, M. A., Thornton, J. A., Womack, C. C., and Young, C. J.: Complexity in the Evolution, Composition, and Spectroscopy of Brown Carbon in Aircraft Measurements of Wildfire Plumes, Geophysical Research Letters, 49, e2022GL098951, https://doi.org/10.1029/2022GL098951, 2022.
Wofsy, S. C., Afshar, S., Allen, H. M., Apel, E. C., Asher, E. C., Barletta, B., Bent, J., Bian, H., Biggs, B. C., Blake, D. R., Blake, N., Bourgeois, I., Brock, C. A., Brune, W. H., Budney, J. W., Bui, T. P., Butler, A., Campuzano-Jost, P., Chang, C. S., Chin, M., Commane, R., Correa, G., Crounse, J. D., Cullis, P. D., Daube, B. C., Day, D. A., Dean-Day, J. M., Dibb, J. E., DiGangi, J. P., Diskin, G. S., Dollner, M., Elkins, J. W., Erdesz, F., Fiore, A. M., Flynn, C. M., Froyd, K. D., Gesler, D. W., Hall, S. R., Hanisco, T. F., Hannun, R. A., Hills, A. J., Hintsa, E. J., Hoffman, A., Hornbrook, R. S., Huey, L. G., Hughes, S., Jimenez, J. L., Johnson, B. J., Katich, J. M., Keeling, R. F., Kim, M. J., Kupc, A., Lait, L. R., McKain, K., Mclaughlin, R. J., Meinardi, S., Miller, D. O., Montzka, S. A., Moore, F. L., Morgan, E. J., Murphy, D. M., Murray, L. T., Nault, B. A., Neuman, J. A., Newman, P. A., Nicely, J. M., Pan, X., Paplawsky, W., Peischl, J., Prather, M. J., Price, D. J., Ray, E. A., Reeves, J. M., Richardson, M., Rollins, A. W., Rosenlof, K. H., Ryerson, T. B., Scheuer, E., Schill, G. P., Schroder, J. C., Schwarz, J. P., St.Clair, J. M., Steenrod, S. D., Stephens, B. B., Strode, S. A., Sweeney, C., Tanner, D., Teng, A. P., Thames, A. B., Thompson, C. R., Ullmann, K., Veres, P. R., Wagner, N. L., Watt, A., Weber, R., Weinzierl, B. B., Wennberg, P. O., Williamson, C. J., Wilson, J. C., Wolfe, G. M., Woods, C. T., Zeng, L. H., and Vieznor, N.: ATom: Merged Atmospheric Chemistry, Trace Gases, and Aerosols, Version 2, ORNL DAAC, Oak Ridge, Tennessee, USA [data set], https://doi.org/10.3334/ORNLDAAC/1925, 2021.
Wong, J. P. S., Tsagkaraki, M., Tsiodra, I., Mihalopoulos, N., Violaki, K., Kanakidou, M., Sciare, J., Nenes, A., and Weber, R. J.: Atmospheric evolution of molecular-weight-separated brown carbon from biomass burning, Atmos. Chem. Phys., 19, 7319–7334, https://doi.org/10.5194/acp-19-7319-2019, 2019.
Wu, C., Liu, X., Zhang, K., Zhang, S., Cao, C., Li, J., Li, R., Zhang, F., and Wang, G.: Measurement report: Formation of tropospheric brown carbon in a lifting air mass, Atmos. Chem. Phys., 24, 9263–9275, https://doi.org/10.5194/acp-24-9263-2024, 2024.
Xu, L., Guo, H., Weber, R. J., and Ng, N. L.: Chemical Characterization of Water-Soluble Organic Aerosol in Contrasting Rural and Urban Environments in the Southeastern United States, Environ. Sci. Technol., 51, 78–88, https://doi.org/10.1021/acs.est.6b05002, 2017.
Xu, L., Lin, G., Liu, X., Wu, C., Wu, Y., and Lou, S.: Constraining Light Absorption of Brown Carbon in China and Implications for Aerosol Direct Radiative Effect, Geophysical Research Letters, 51, e2024GL109861, https://doi.org/10.1029/2024GL109861, 2024.
Zeng, L., Zhang, A., Wang, Y., Wagner, N. L., Katich, J. M., Schwarz, J. P., Schill, G. P., Brock, C., Froyd, K. D., Murphy, D. M., Williamson, C. J., Kupc, A., Scheuer, E., Dibb, J., and Weber, R. J.: Global Measurements of Brown Carbon and Estimated Direct Radiative Effects, Geophysical Research Letters, 47, e2020GL088747, https://doi.org/10.1029/2020GL088747, 2020.
Zeng, L., Sullivan, A. P., Washenfelder, R. A., Dibb, J., Scheuer, E., Campos, T. L., Katich, J. M., Levin, E., Robinson, M. A., and Weber, R. J.: Assessment of online water-soluble brown carbon measuring systems for aircraft sampling, Atmos. Meas. Tech., 14, 6357–6378, https://doi.org/10.5194/amt-14-6357-2021, 2021.
Zeng, L., Dibb, J., Scheuer, E., Katich, J. M., Schwarz, J. P., Bourgeois, I., Peischl, J., Ryerson, T., Warneke, C., Perring, A. E., Diskin, G. S., DiGangi, J. P., Nowak, J. B., Moore, R. H., Wiggins, E. B., Pagonis, D., Guo, H., Campuzano-Jost, P., Jimenez, J. L., Xu, L., and Weber, R. J.: Characteristics and evolution of brown carbon in western United States wildfires, Atmos. Chem. Phys., 22, 8009–8036, https://doi.org/10.5194/acp-22-8009-2022, 2022.
Zhang, A., Wang, Y., Zhang, Y., Weber, R. J., Song, Y., Ke, Z., and Zou, Y.: Modeling the global radiative effect of brown carbon: a potentially larger heating source in the tropical free troposphere than black carbon, Atmos. Chem. Phys., 20, 1901–1920, https://doi.org/10.5194/acp-20-1901-2020, 2020.
Zhang, Y., Forrister, H., Liu, J., Dibb, J., Anderson, B., Schwarz, J. P., Perring, A. E., Jimenez, J. L., Campuzano-Jost, P., Wang, Y., Nenes, A., and Weber, R. J.: Top-of-atmosphere radiative forcing affected by brown carbon in the upper troposphere, Nature Geosci., 10, 486–489, https://doi.org/10.1038/ngeo2960, 2017.
Zhao, R., Lee, A. K. Y., Huang, L., Li, X., Yang, F., and Abbatt, J. P. D.: Photochemical processing of aqueous atmospheric brown carbon, Atmos. Chem. Phys., 15, 6087–6100, https://doi.org/10.5194/acp-15-6087-2015, 2015.
Zhu, H., Martin, R. V., Croft, B., Zhai, S., Li, C., Bindle, L., Pierce, J. R., Chang, R. Y.-W., Anderson, B. E., Ziemba, L. D., Hair, J. W., Ferrare, R. A., Hostetler, C. A., Singh, I., Chatterjee, D., Jimenez, J. L., Campuzano-Jost, P., Nault, B. A., Dibb, J. E., Schwarz, J. S., and Weinheimer, A.: Parameterization of size of organic and secondary inorganic aerosol for efficient representation of global aerosol optical properties, Atmos. Chem. Phys., 23, 5023–5042, https://doi.org/10.5194/acp-23-5023-2023, 2023.
Zhu, Y., Wang, Q., Yang, X., Yang, N., and Wang, X.: Modeling Investigation of Brown Carbon Aerosol and Its Light Absorption in China, Atmosphere, 12, 892, https://doi.org/10.3390/atmos12070892, 2021.