
the Creative Commons Attribution 4.0 License.
the Creative Commons Attribution 4.0 License.
 | 26 May 2026
Vertically-resolved source contributions to climate-relevant aerosol properties in Southern Greenlandic fjord systems
Joanna Alden
Nora Bergner
Benjamin Heutte
Lionel Favre
Mihnea Surdu
Julian Weng
Marta Augugliaro
Patrik Winiger
Berkay Dönmez
Roman Pohorsky
Radiance Calmer
Carmelle Chatterjee
Kalliopi Violaki
Athanasios Nenes
Luke Gregor
Silvia Henning
Greenlandic fjords are rapidly changing environments where ocean, ice, land, and atmosphere interact, yet aerosol sources and their role in cloud formation remain relatively unconstrained. To address this gap, we conducted an intensive field campaign in Narsaq, Southern Greenland, during summer 2023 as part of the GreenFjord project, combining ground-based sampling with a tethered balloon (24 flights to ∼700 m). Over six weeks, we measured meteorology, aerosol number size distributions, particle and CCN number concentrations, as well as optical properties. Aerosol characteristics varied markedly in time and altitude, reflecting four main sources: fresh anthropogenic pollution, aged background aerosols from local anthropogenic and marine origins, transported biomass burning, and new particle growth events. Local pollution dominated ∼50 % of the campaign, while growth events and Canadian wildfire plumes each contributed ∼8 %; the remainder (∼34 %) reflected aged marine background aerosols. Number size distributions were typically Aitken-mode dominated, presumably due to the frequently observed growth events. Biomass burning advection, in contrast, was marked by accumulation-mode particles. During plume periods, median CCN concentrations at 0.5 % supersaturation increased by a factor of 1.7–3.7 relative to median background concentrations, while median absorption and scattering coefficients increased by factors of 1.8–4.0 and 1.4–4.8, respectively. The enhancement factors are similar to or even exceed the enhancements from local anthropogenic pollution and highlight the substantial role that long-range transported biomass burning may have in modulating aerosol–cloud–radiation interactions over southern Greenland.
- Article
(16079 KB) - Full-text XML
-
Supplement
(3311 KB) - BibTeX
- EndNote


Greenland hosts the world's second-largest ice sheet and is undergoing rapid transformation due to climate change. The Greenland Ice Sheet currently discharges ∼1000 Gt yr−1 of freshwater into coastal oceans primarily via fjord systems (Bamber et al., 2012). In the last two decades alone, freshwater runoff and glacial discharge in Southern Greenland have increased by nearly 50 % (Bamber et al., 2012; Böning et al., 2016; Sejr et al., 2017), significantly impacting the marine (Meire et al., 2017; Oksman et al., 2022), terrestrial (Wrona et al., 2016), and atmospheric components of fjordic ecosystems (Meire et al., 2015). Arctic coastal regions are hotspots of chemical and biological activity (Schmale et al., 2024) with increasing freshwater input from glaciers altering fjord dynamics, stratification, sedimentation, and bio-productivity (Arrigo et al., 2017; Holding et al., 2019; Juul-Pedersen et al., 2015; Meire et al., 2016, 2017, 2023; Mortensen et al., 2013, 2014). These changes also have critical implications on regional greenhouse gas fluxes and potentially influence aerosol formation and cloud properties in the Arctic (Feltracco et al., 2021; Meire et al., 2015; Schmale et al., 2024; Verdugo et al., 2022). For example, Holding et al. (2019) found that fjords with marine-terminating glaciers are more bio-productive than land-terminating glacier fjords where only streams enter the fjord. It is hence conceivable that marine-terminating glacier fjords lead to relatively higher emissions of marine biogenic compounds in two ways: either by emission of volatile organic compounds (VOCs) such as dimethylsulfide (DMS), which act as precursors to aerosol formation (Beck et al., 2020), or as direct, primary emissions of biogenic aerosols through sea spray emissions (Fahlgren et al., 2015). Hence fjord systems can be important local contributors to the aerosol population. Understanding how glacial retreat affects aerosols and clouds is essential for assessing climate feedbacks comprehensively in this rapidly evolving environment, particularly in fjordic ecosystems that sit at the intersection of the ocean, land, cryosphere, atmosphere, and biosphere. These interconnected systems are especially sensitive to climate change, with each component responding acutely to the pressures of rising global temperatures.
While geographically remote, southern Greenland is influenced by a combination of local anthropogenic emissions and long-range transported pollutants. Both source types inject aerosols at different altitudes throughout the atmosphere, and paired with frequent temperature inversions in the boundary layer, add an additional layer of complexity to fjord-atmosphere interactions. Local emissions from urbanised areas may contribute to aerosols in the region, despite the relatively low population density. These emissions most likely arise from combustion processes, such as those associated with transportation and residential activities. A recent study in Qaanaaq, Greenland, demonstrated that open waste burning can significantly elevate local PM2.5 levels, underscoring the potential for measurable local emission contributions even in sparsely populated Greenlandic settlements (Yasunari et al., 2024). Beyond local anthropogenic sources, long-range transport of pollution from more industrialized regions – particularly the East coast of the United States (Quennehen et al., 2011; Schmale et al., 2011), also affects the aerosol composition over Greenland. In addition, it has been shown that also emissions from biomass burning in North America contribute episodically and significantly to specifically absorbing aerosol concentrations in Greenland during the summer months (Dibb et al., 1996; Thomas et al., 2017), affecting the melt of the ice sheet. With increasing incidences of boreal forest fires in Canada due to a warming climate (Kirchmeier-Young et al., 2017; Wang, 2024), emissions from biomass burning (BB) are expected to have an increasingly important influence (Flannigan et al., 2006; Gramlich et al., 2024; Kommula et al., 2024; Soja et al., 2007).
Understanding of aerosol sources in Southern Greenland is crucial, as they directly affect the availability of cloud condensation nuclei (CCN), which in turn play a key role in cloud formation. CCN influence cloud properties by modulating droplet size distributions, cloud phase, lifetime, and albedo (e.g., Fan et al., 2016), ultimately impacting surface radiative fluxes and the surface energy balance. This is of particular importance during Arctic summer, when surface melt of the Greenland Ice Sheet is at its peak. Low-level mixed-phase and liquid clouds, which are common during summer, have been shown to significantly affect the surface energy budget increasing surface melt (Hofer et al., 2019; Niwano et al., 2019; Ryan et al., 2022; Van Tricht et al., 2016). However, more recent analysis by Ryan (2024) suggests that, over the period of 2002–2023, cloud radiative forcing exerted only a limited influence on ice sheet melt. This contrast highlights the need to better understand the processes governing cloud properties. Since a particle's ability to act as a CCN is dependent on the particle size and composition, it is important to understand aerosol sources and processes relevant for Greenland. This understanding will allow us to better predict Arctic warming consequences such as ice sheet melt and glacial retreat.
In this study, we discuss results from the atmospheric part of the project “Greenlandic Fjord ecosystems in a changing climate: Socio-cultural and environmental interactions” (GreenFjord). Greenfjord is a multi-disciplinary program that aims to better understand how climate change is reshaping Southern Greenlandic fjord ecosystems from both an environmental and a social perspective. Here we elucidate processes which influence the aerosol characteristics, specifically CCN and optical properties, in Southern Greenland during summer. We seek to answer how local, remote, natural and anthropogenic aerosol sources contribute, taking into account the vertical structure of the boundary layer.
2.1 Sampling site
The field campaign took place from 16 June to 5 August 2023, in Narsaq, Greenland with remote sensing, and in-situ ground-based and vertical observations via tethered balloon (helikite)-supported measurements. Airborne measurements took place between 25 June and 2 August 2023. The ground station and helikite base were established at the Narsaq International Research Station, hereafter referred to as NIRS, (lat: 60.92°, lon: −46.05°, 17 m a.s.l.), an independent non-profit research platform. A schematic of the region with station and sampling locations is given in Fig. 1.
Narsaq is primarily a fishing town, and agriculture is also practised. It is the ninth largest town of Greenland, and home to an estimated 1285 people, 2.27 % of Greenland's population. The town holds around 230 motor vehicles, 120 of which are cars, and electricity is provided by a 70 km distant hydropower plant (Statistics Greenland, 2024). The region immediately surrounding Narsaq is only accessible by boat with few land-based transport routes. Narsaq is situated at the intersection between two fjords: Nordre Sermilik fjord, and Tunulliarfik fjord, and is therefore, surrounded on three sides by water. Approximately 2 km east of Narsaq lie the Tasiigaaq and Qaqqarsuaq mountains, rising to 364 and 685 m, respectively. To the northeast, the surrounding mountain range includes peaks approaching 1400 m.
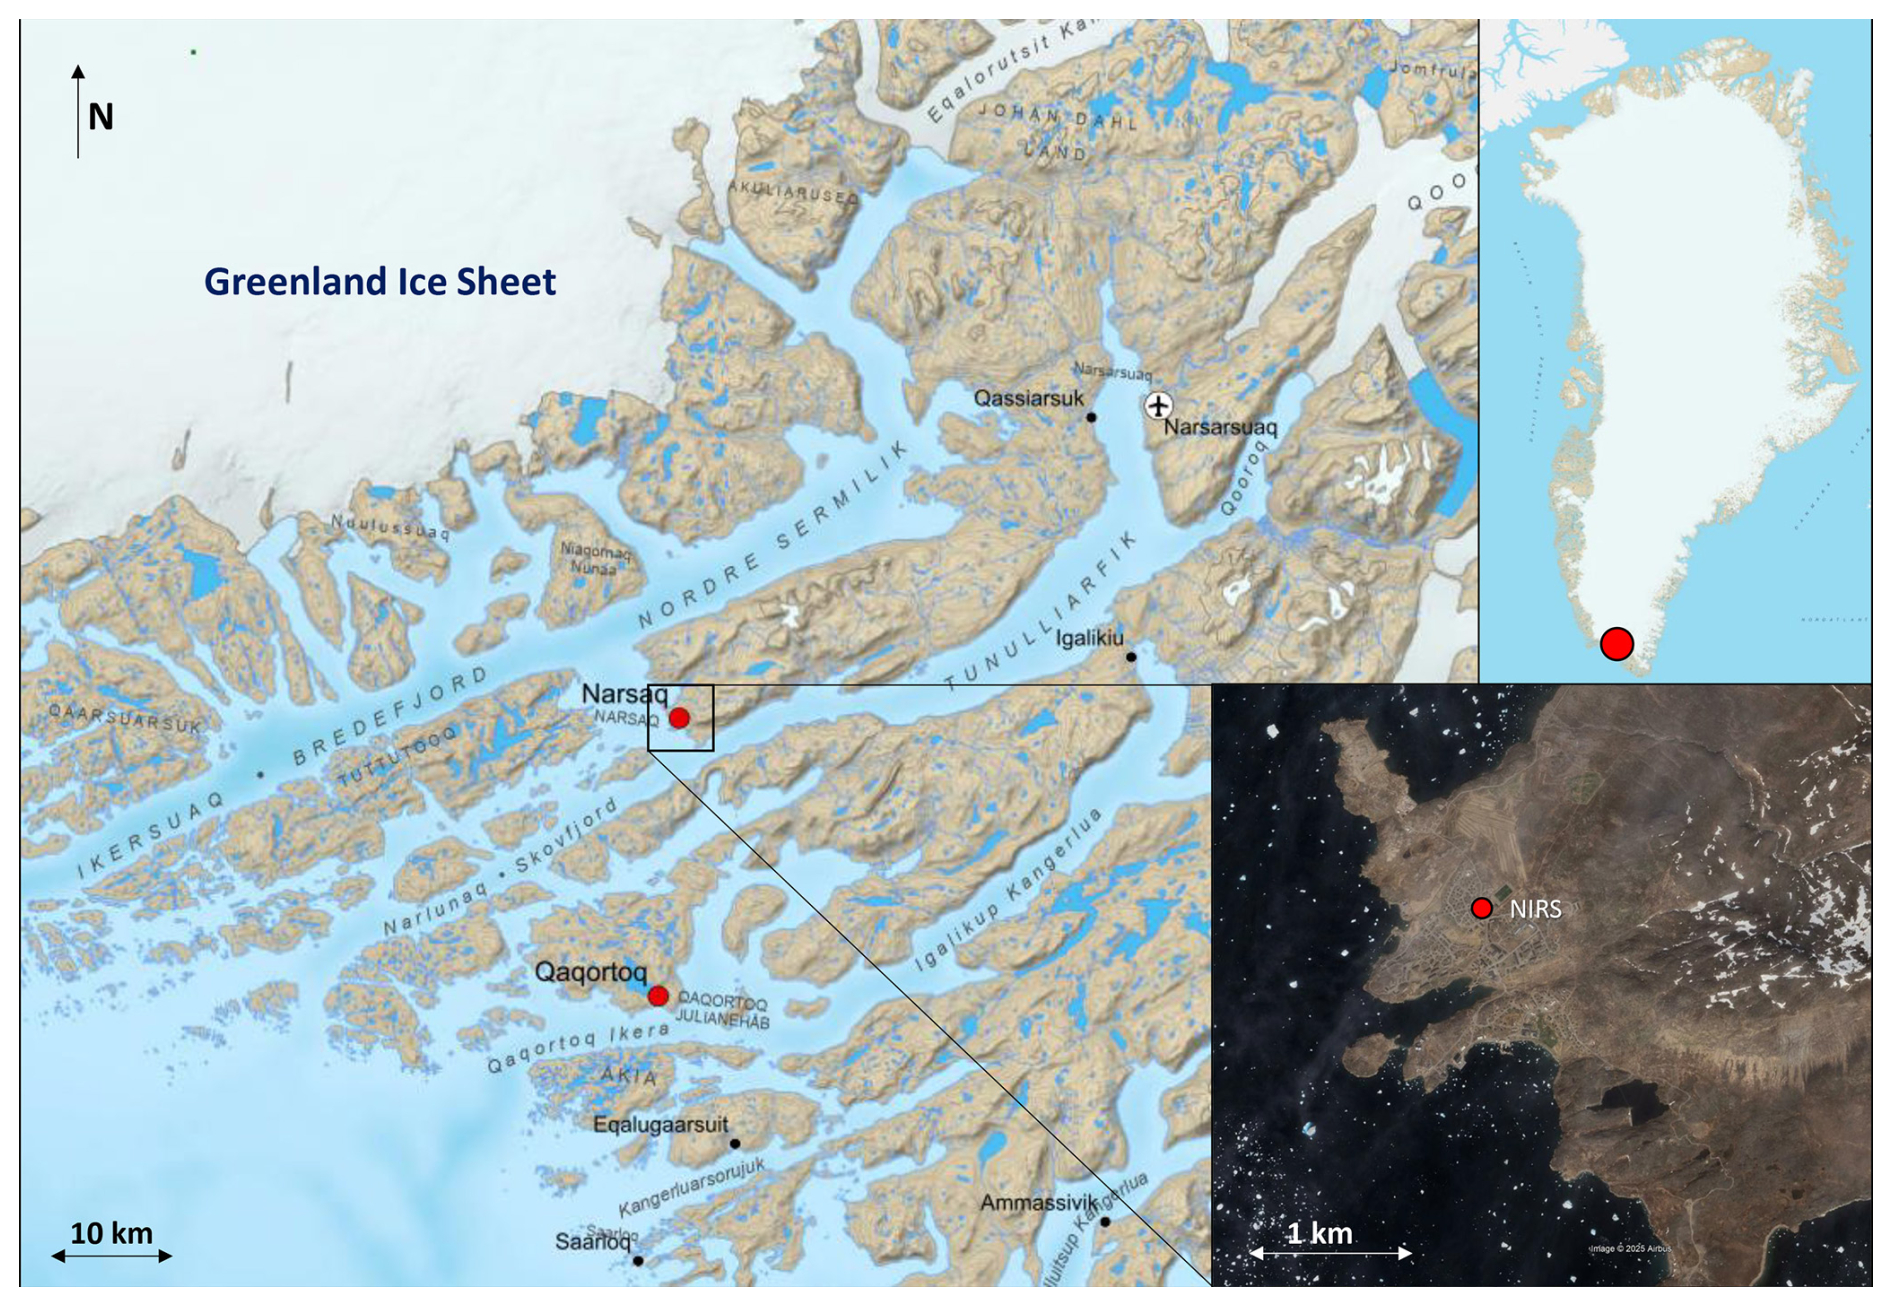
Figure 1Map of the region around Narsaq with insets highlighting the region's location in Southern Greenland and a zoomed in view on Narsaq. Maps data: Map with blue background © GEUS 2025 (https://maps.greenmin.gl/geusmap/, last access: 20 October 2025), satellite image © Google Earth Pro 2026; images © 2026 CNES/Airbus.
2.2 Ground-based measurements
The atmospheric measurement hut was equipped with four inlets: one PM1 interstitial inlet with a flow of ∼15 L min−1, two total suspended particle inlets with a flow ∼15 L min−1, and a third total suspended particle inlet with a flow rate of ∼100 L min−1 (all inlet heads by Digitel Elektronik AG). The particle cutoff for the interstitial and total inlets were 1 and 40 µm respectively. A schematic of the instrumental and inlet set up is provided in Fig. 2. An overview of all ground-based instruments used in this work can be found in Table 1.
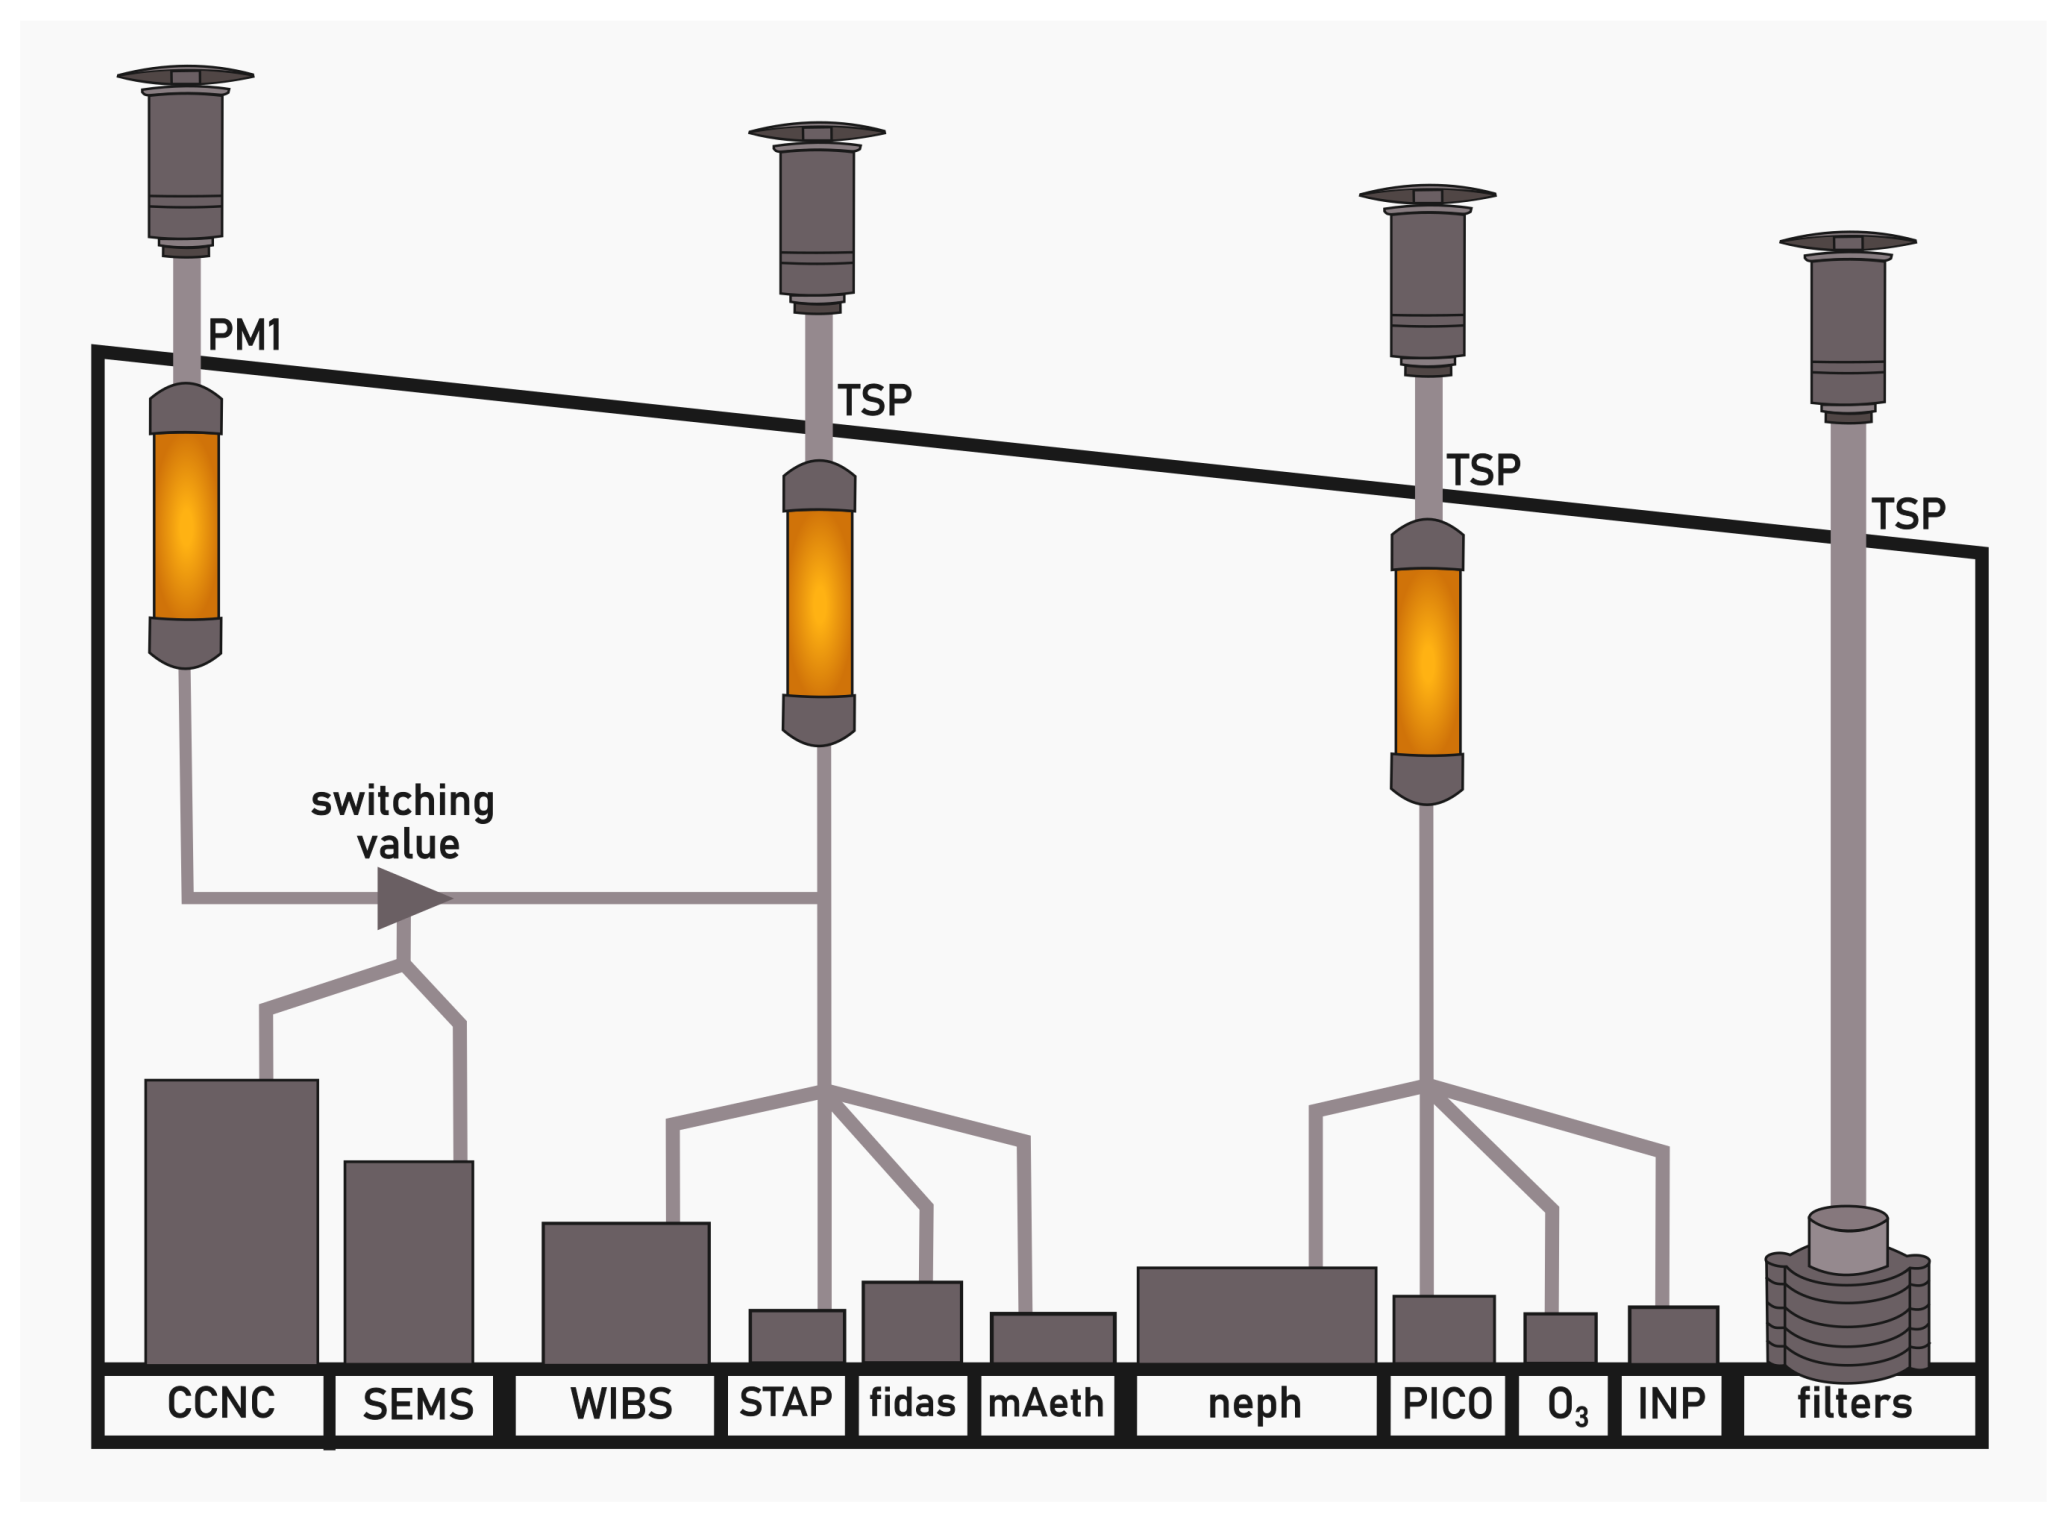
Figure 2Schematic of the instrumental setup inside the measurement hut at NIRS. All four aerosol inlets are shown and their connections, via Silicagel dryers (orange), to the instruments. CCNC: Cloud Condensation Nuclei Counter, SEMS: Scanning Electrical Mobility Spectrometer; WIBS: Wideband Integrated Bioaerosol Sensors; STAP: Single-channel tricolor absorption photometer; fidas: Fidas Frog fine dust monitor; mAeth: micro aethalometer; neph: nephelometer; PICO: MIRA Pico Nitrous Oxide and CO gas analyser; O3: ozone monitor; INP: Ice Nucleating Particle filter sampler; filters: cascade impactor.
Inlets 1 to 3 were fitted with hygrometers (model HC2, Rotronic AG, Bassersdorf, Switzerland) in a flow bypass to measure temperature (T) and relative humidity (RH). Silica gel dryers before the hygrometers were intended to reduce the ambient RH sampled by the instrumentation to below 40 %. However, due to the consistently high ambient humidity, it was not always possible to sufficiently reduce the ambient RH within the sample line. Note, inlet air T and RH are given in the data files (see data availability). All inlets were positioned directly upwards through the roof of the hut with a clearance of 1.5 m. Inlets 1 (interstitial) and 2 (total) were connected to a valve that could be switched to allow quantification of both activated and non-activated particles in the case of ground-level fog. Without fog, inlet 2 was used as standard. Ground-level fog events were rare with interstitial inlet data representing less than 1 % of the aerosol data. As such, we only report here on the total inlet data.
Table 1List of instruments at NIRS ground station and in the helikite payload as well as measured variables.
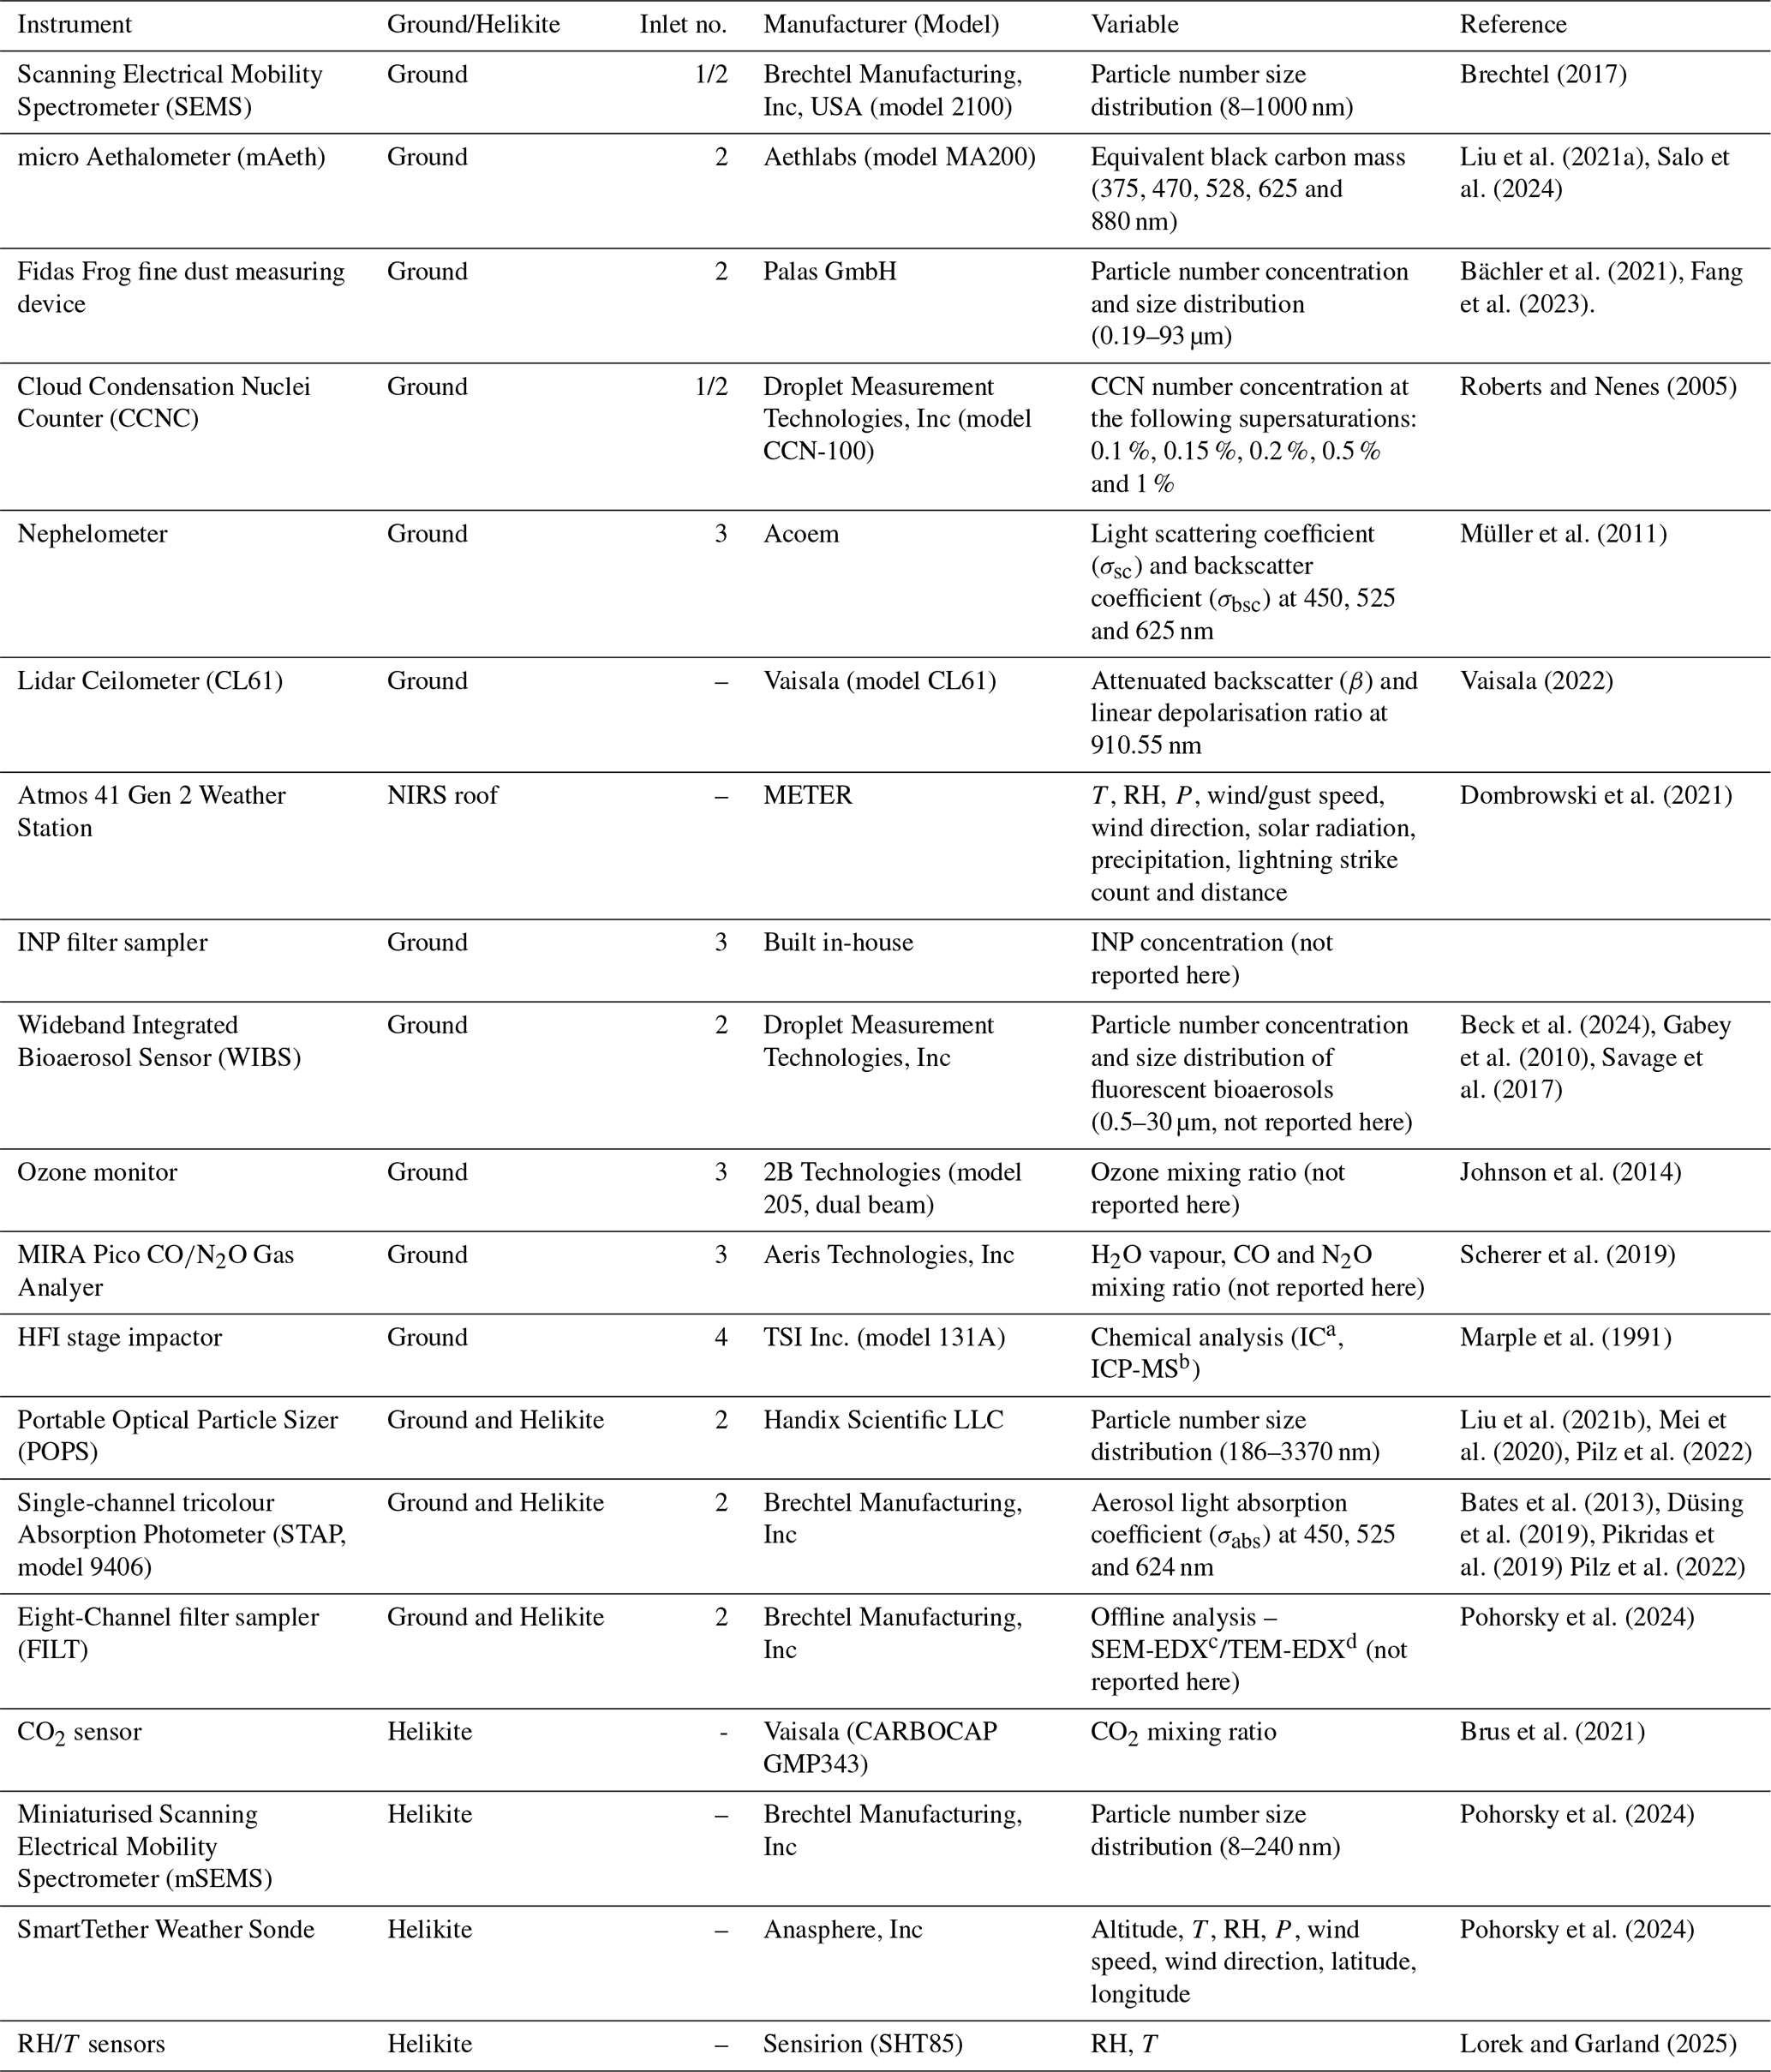
a IC: Ion Chromatography, b ICP-MS: Inductively Coupled Plasma Mass Spectrometry, c SEM-EDX: Scanning Electron Microscopy with Energy Dispersive Xray analysis, d TEM-EDX: Transmission Electron Microscopy with Energy Dispersive Xray analysis.
2.2.1 Particle number concentration and size distributions
A Scanning Electrical Mobility Spectrometer (SEMS) and Fidas Frog (fidas) were used to measure particle number concentration (PNC) and size distributions (PNSD) for both fine and coarse mode aerosols, respectively. The SEMS is a particle size spectrometer which provides high time resolution aerosol PNSD measurements with a diameter range of 8 to 1000 nm. It is made up of a soft X-ray neutraliser, a differential mobility analyser (DMA) column, and a mixing condensation particle counter (mCPC). The SEMS was run in scanning mode with 120 bins, at 1 s per bin, for both up and down scans. The DMA sheath air flow was set at 4 L min−1, and the sample flow at 0.34 L min−1. The effect on particle losses by tubing was considered in the SEMS software and is therefore accounted for (Brechtel Manufacturing Inc., 2021). The fidas is an optical particle counter and was used for the continuous measurements of particle number size distributions between 0.19 and 93 µm, also allowing coarse mode aerosol mass to be derived (PM1, PM2.5, PM5, PM10 and PMtot; Bächler et al., 2021; Fang et al., 2023).
2.2.2 Aerosol absorption and scattering coefficients
Two instruments were implemented for measuring aerosol absorption to provide a continuous timeseries on the ground and during flights: a micro-aethalometer (mAeth) and a Single-channel Tricolour Absorption Photometer (STAP). Both instruments use filter-based absorption techniques, which measure the absorption of light by a sample filter at multiple wavelengths and compare this to a clean reference filter. The STAP uses quartz-fiber glass filters to detect attenuation at 450, 525 and 624 nm, at a resolution of 1 s, with a measurement uncertainty reported by Brechtel Manufacturing Inc of 0.2 Mm−1 for a 60 s averaging period. The performance of the STAP has been studied previously (Bates et al., 2013; Düsing et al., 2019; Pikridas et al., 2019; Pilz et al., 2022). Note, Brechtel Inc. includes within the STAP software a correction for scattering incurred in filter-based measurements, based on correction by Ogren (2010).
The mAeth (MA200) is a portable photometer that uses deposition of aerosols onto a PTFE filter band to measure attenuation at 375, 470, 528, 625 and 880 nm (Aethlabs). Measurements were outputted at a resolution of 60 s for this work. Using SingleSpot™ mode, Aethlabs reports the limit of detection of 30 ng m−3 of black carbon (BC) for a 5 min averaging period at a 150 mL flow rate. The performance of the mAeth has previously been studied (Liu et al., 2021a; Salo et al., 2024). The mAeth gives equivalent BC (eBC) values and the absorption coefficients at each wavelength can be calculated using the mass absorption coefficient (MAC). The MAC value is calculated from the wavelength specific attenuation cross-section, σATN(λ), and the multiple scattering coefficient, C, given by the manufacturer as 1.3, which compensates for the enhanced scattering properties of the filters used. The MAC and absorption coefficients are calculated as follows:
The σATN(λ) values are provided by AethLabs and are 10.120, 14.091, 17.028, 19.070 and 24.069 m2 g−1 for 880, 625, 528, 470 and 375 nm, respectively. For comparison of the calculated σabs from the mAeth measurements with the measured σabs from the STAP, in addition to discussion on the differences between these values, see Fig. S1 and associated text in the Supplement. Unless otherwise stated, absorption coefficients discussed in this manuscript refer to those measured by the STAP, while eBC concentrations are taken from the mAeth.
The Aurora 3000 nephelometer was used to measure scattering and backscattering coefficients with an LED light source from 9–170°. This instrument is a multi-wavelength integrating nephelometer and measures in-situ light scattering of aerosols at 450, 525 and 635 nm. The time resolution during the campaign was 60 s, with the lower limit of detection given by the manufacturer as 0.3 Mm−1 for a 60 s averaging period. The Nephelometer was calibrated before the campaign and periodic zero tests were conducted throughout the campaign. A span gas check and calibration were performed on 11 July 2023 but with values that fell outside the recommended range of the manufacturer. Therefore, a flag is applied to data following the unsuccessful calibration although no discernible shift or step-change in the data was observed.
2.2.3 Cloud condensation nuclei number concentrations
CCN concentrations were measured using a Cloud Condensation Nuclei Counter (CCNC) at a 1 s time resolution, stepping through supersaturations (SS) of 0.1 %, 0.15 %, 0.2 %, 0.5 % and 1.0 % at a frequency in minutes of 20, 10, 10, 10 and 10 leading to a 1 h measurement cycle. The supersaturation of 0.1 % was measured for double the time due to the increased time needed to equilibrate from the drop of 1 % to 0.1 % SS. Data points where the temperature was not stable within the instrument column were removed in postprocessing as were data which occurred within the cooling cycle at the start of the 1 h run, and data directly after switching between the later supersaturations. This corresponds to removing the first 10 min of each hour, followed by the first 2 min and last 1 min of data at the start of 0.15 %, 0.2 %, 0.5 % and 1 % supersaturations. Calibration of the CCNC was performed following the ACTRIS procedure, detailed in Gysel and Stratmann (2013) and Rose et al. (2008), with ammonium sulfate particles both before and after the campaign to ensure supersaturation values remained consistent, with post-campaign results showing good agreement with the pre-campaign calibration. For correlation of 1 % SS NCCN with N8−1000 across the entire campaign at different activation diameter cut-offs see Fig. S2.
2.2.4 Ceilometer attenuated backscatter and linear depolarisation ratio
Measurements of attenuated back-scatter (β) and linear depolarisation ratio (LDR), providing insight into the presence of hydrometeors and aerosols and the phase of water in clouds, respectively, were made by a light detection and ranging (LiDAR) instrument with depolarisation measurement capabilities (Vaisala Lidar Ceilometer CL61). For the duration of the campaign, the ceilometer was mounted outside NIRS and took measurements every 1 min. The ceilometer operates at a wavelength of 910.55 nm, sending short laser pulses vertically into the atmosphere at a frequency and duration of 9.5 kHz and 160 ns, respectively, at a maximum average power of 50 mW. The attenuated backscatter is a measure of the proportion of emitted light from the ceilometer, which is scattered back and measured by a receiver, diminished in strength by atmospheric absorption, scattering and the natural attenuation of light, which occurs during the path of the light up through the atmosphere and back down once scattered. The LDR is a measure of the change in polarisation of the emitted light when it is scattered back to the receiver. Since every particle the laser light interacts with will alter light polarisation, with the exception of spherical particles such as liquid cloud droplets, the water and ice phase of hydrometeors can be inferred from their measured LDR. Spherical particles are expected to return non-depolarised light whereas non-spherical particles return significantly depolarised light due to reflections at the solid-air interface. Multiple scattering can also occur within optically thick clouds leading to depolarisation even if scattering particles in clouds are spherical in nature (Vaisala, 2022).
Raw data from the ceilometer, after pre-processing by Vaisala's internal processing algorithm, was then post-processed to give a clean dataset. Values, where the attenuated backscatter were negative or where the depolarisation ratio value was outside of the expected range between 0 and 1, were removed within a rolling mean smoothing window of 10 min and 50 m. Noisy data was observed in the case of low backscatter from clear sky days, or when the range of laser light is almost fully attenuated. The LDR was found to be more susceptible to noise than β.
2.2.5 Meteorological measurements
Meteorological measurements including T, RH, atmospheric pressure (P), wind/gust speed, wind direction, solar radiation and maximum precipitation rate were made by an ATMOS41 Gen 2 weather station. Solar radiation was measured by a pyranometer, which measures total (direct and diffuse) solar radiation. The wind speed and wind direction were measured with an anemometer. The vapor pressure sensor measures RH and T, then uses these measurements to compute the vapor pressure. The sensor was protected by a Teflon enclosure to keep water and dust away from the sensor whilst measurements were being taken. RH was calculated using the following equation:
where eair is the vapor pressure of the air and esat(Tair) is the saturation vapor pressure at a given air temperature.
2.3 Tethered balloon measurements
Vertical measurements were taken using a tethered helium balloon system, i.e., helikite (64 m3) and a payload of up to 25 kg (Pohorsky et al., 2024). An overview of all helikite-based instruments used in this work can be found in Table 1. The helikite payload is designed in a modular style meaning the set of instruments can be customised to suit the science question for each flight. Flights typically lasted between 3 and 5 h, were carried out sometimes twice a day, and reached altitudes up to 760 m. Flight patterns were flexible and primarily targeted towards specific observations, such as measurements of new particle formation, local anthropogenic emissions and elevated long-range transported pollution plumes. A list of all flights and their details is provided in Table S1 in the Supplement. In total 24 instrumented science flights were performed. In brief, flown instruments included the following. The mSEMS is a compact, miniaturised version of the SEMS, working in the same way. The mSEMS was set to measure particles in the diameter range from 8 to 240 nm, for a sample flow rate of 0.36 L min−1, scanning across 40 bins, giving a total run time of 2 min and 4 s including scan delay. For full details of characterisation of the mSEMS, see Pohorsky et al. (2024). A comparison between the mSEMS and SEMS was done in the field with good agreement in total PNC and PNSD, shown in Fig. S3. The deployed POPS is a lightweight optical particle counter, which measures PNSD and total PNC between 186 and 3370 nm in our case (Gao et al., 2016; Liu et al., 2021b; Pilz et al., 2022; Pohorsky et al., 2024). The STAP has been described above. More information on the CO2 probe and Smart Tether can be found in Pohorsky et al. (2024).
2.4 Data processing, pollution flagging, and environmental condition categorization
Data processing was completed using Python 3.11.7 and we report final data, where times with zero-particle filter tests, flow checks, calibrations or inlet maintenance are removed. Those activities were conducted on a 3 d rotational basis on the ground and at a daily frequency for the flight payload. All ground-based aerosol and trace gas datasets were individually flagged for local pollution. Local pollution in this context refers to sudden and short-term perturbations in the data, i.e., spikes, due to anthropogenic emissions from local activities such as vehicle exhausts or occasional firework displays. Flags were created by first using a pollution detection algorithm (PDA), described fully in Beck et al. (2022), and then any extraneous pollution spikes missed by the algorithm were flagged manually. All pollution flags were double checked by a co-author. This divides the data into a “clean” and “polluted” category with 50.4 % ground SEMS data being flagged as polluted, for example. Unless when focusing on pollution, we report “clean” data. Throughout this work, the following terminology will be used to categorize and discuss different conditions:
-
Background (BG). This category represents conditions primarily influenced by local marine aerosol and aged anthropogenic pollution. While specific sources cannot be individually identified, persistent local emissions are likely encompassed in this background signal. This category therefore represents a persistent aerosol background, against which we compare other data categories. To isolate a stable background signal, short-lived spikes from fresh anthropogenic pollution were excluded. In addition, data affected by new particle growth events, fog, and biomass burning were removed, as each of these processes can strongly perturb the background aerosol population.
-
Biomass burning plume events (BB). This category contains data only from when the biomass burning plumes were identified by the ceilometer. This is regardless of what the balloon-borne vertical or ground-based aerosol data showed. As with the background category, strong, short-lived spikes in anthropogenic pollution have been removed. The plume periods are hereafter defined as the following times: 27 June, 21:20, to 29 June, 15:00; the 5 July, 20:13, to 8 July, 01:42; and the 17 July, 11:47, to 18 July, 18:17 (identification and description of plumes can be found in Sect. 3.4). Because these periods are strictly time-constrained, coincident and concurrent new particle growth events have been retained within the plume category to provide a more complete representation.
-
New particle growth events (GE). This category contains data only from time periods defined as growth events. We define this to include the period from the first appearance of a nucleation mode in the PNSD to 6 h post this time, when typically the distinction over background was not recognizable anymore. As with the background and BB categories, strong, short-lived spikes in anthropogenic pollution have been removed. We have defined these events as GE rather than new particle formation (NPF) events since our instruments only observed particles >8 nm and therefore captured the subsequent growth periods. Growth rates were calculated for all identified events (Tables S4, S8), providing quantitative confirmation of the coherent size evolution in each case.
-
Fresh pollution (pollution). This category contains only the short-lived spikes from anthropogenic pollution, i.e. the data removed from the previous 3 categories. Figure S4 gives an example time series over 1 d showing the short-lived pollution spikes visible on top of the background aerosol concentrations. Examples for other conditions can also be found in Fig. S4.
2.5 K-means clustering of particle number size distributions
The measured PNSDs from the ground SEMS and the flight mSEMS were categorized using the k-means clustering algorithm, as commonly used for clustering aerosol PNSDs (Beddows et al., 2009; Boyer et al., 2023; Dall'Osto et al., 2018; Heutte et al., 2025; Pernov et al., 2022). Because the PNSD data reflected very large ambient variability, we split the dataset a priori into the four categories – pollution, background, growth events and biomass burning – and kept ground and vertical observations separate. For each data category clustered, the number of clusters was varied between 3 and 10, and it was concluded per dataset what number best described the PNSDs. The optimum cluster number was derived using the Within Cluster Sum of Squares (WCSS) and Silhouette score (Lloyd, 1982; Morissette and Chartier, 2013; Rousseeuw, 1987; Steinley and Brusco, 2011). WCSS is a measure of cluster cohesion made through summing the squared distances between each data point and its assigned clusters centroid. The Silhouette score is another measure of the similarity of the PNSDs within each cluster, compared to other clusters. Larger values therefore indicate a high degree of similarity within a cluster, but a low degree of similarity with PNSDs in other clusters. For PNSDs, the Silhouette score will start initially at higher values and decrease as the separation between clusters decreases. The WCSS will also start high but will decrease rapidly as the addition of clusters provides little additional information describing the system. It is convention to take the point where the graph of WCSS vs cluster number starts to level off, the “elbow point”, as the ideal cluster number. From these two measures and understanding of the data and time series, the ideal cluster number per dataset was judged. WCSS is discussed further in Sect. S2 and Fig. S5 in the Supplement. The total number of clusters per data category is detailed in Table S2. To facilitate comparison over the same particle size range for the clusters from the SEMS and the mSEMS instruments, the ground-based data clustering was run on the PNSDs including from 8 to ∼240 nm to be in line with the instrumental size range of the mSEMS Ground clustering using size ranges of 8–1000 and 8–240 nm produced nearly identical particle number size distributions (PNSDs), differing on average by less than 5 %.
K-means clustering was run again using aerosol PNSDs observed by the mSEMS flown in the helikite payload to compare ground and elevated PNSDs. Data within lowest 100–150 m of each profile were not considered due to the fast take-off phase, where usually only one or very few scans of the mSEMS were available, and hence there were not sufficient data.
3.1 Campaign overview
In 2023, Narsaq experienced an exceptionally sunny and dry summer with average temperatures of 10.4 °C, and daily values ranging between 0 and 21.1 °C (Fig. 3). Throughout the period of 2013–2023, average monthly values of temperature for June, July and August have ranged from 6.2–9.9 °C (Statistics Greenland, 2025). Due to the prevalence of clear sky conditions, global solar radiation at the ground was relatively high with average daytime values of 360 W m−2, ranging between 0 and 1046 W m−2. Wind speeds were typically low, except for a few days and individual gusts owing to katabatic winds from the ice sheet to the West (Fig. 3c). The dominant wind directions at the ground were westerly (defined here as between 247.5 and 292.5°) for ∼51 % of the time, and northerly (defined here as between 337.5 and 22.5°) for 22 % of the time (see Fig. S6). The occurrences of each wind direction category can be found in Table S3. Despite dry conditions, 10 fog events were recorded (Fig. 3b), with 26.4 % of their total duration occurring at ground level. Fog periods were identified primarily from ceilometer data using Vaisala's mid- and high-density liquid classifications (see Sect. S3 in the Supplement), and were further confirmed by high relative humidity measurements from ground meteorological data, along with direct visual observations. This manuscript does not further address aerosol–fog interactions. In addition, 6 rainy periods were measured. For a full description of precipitation and fog periods see Table S4.
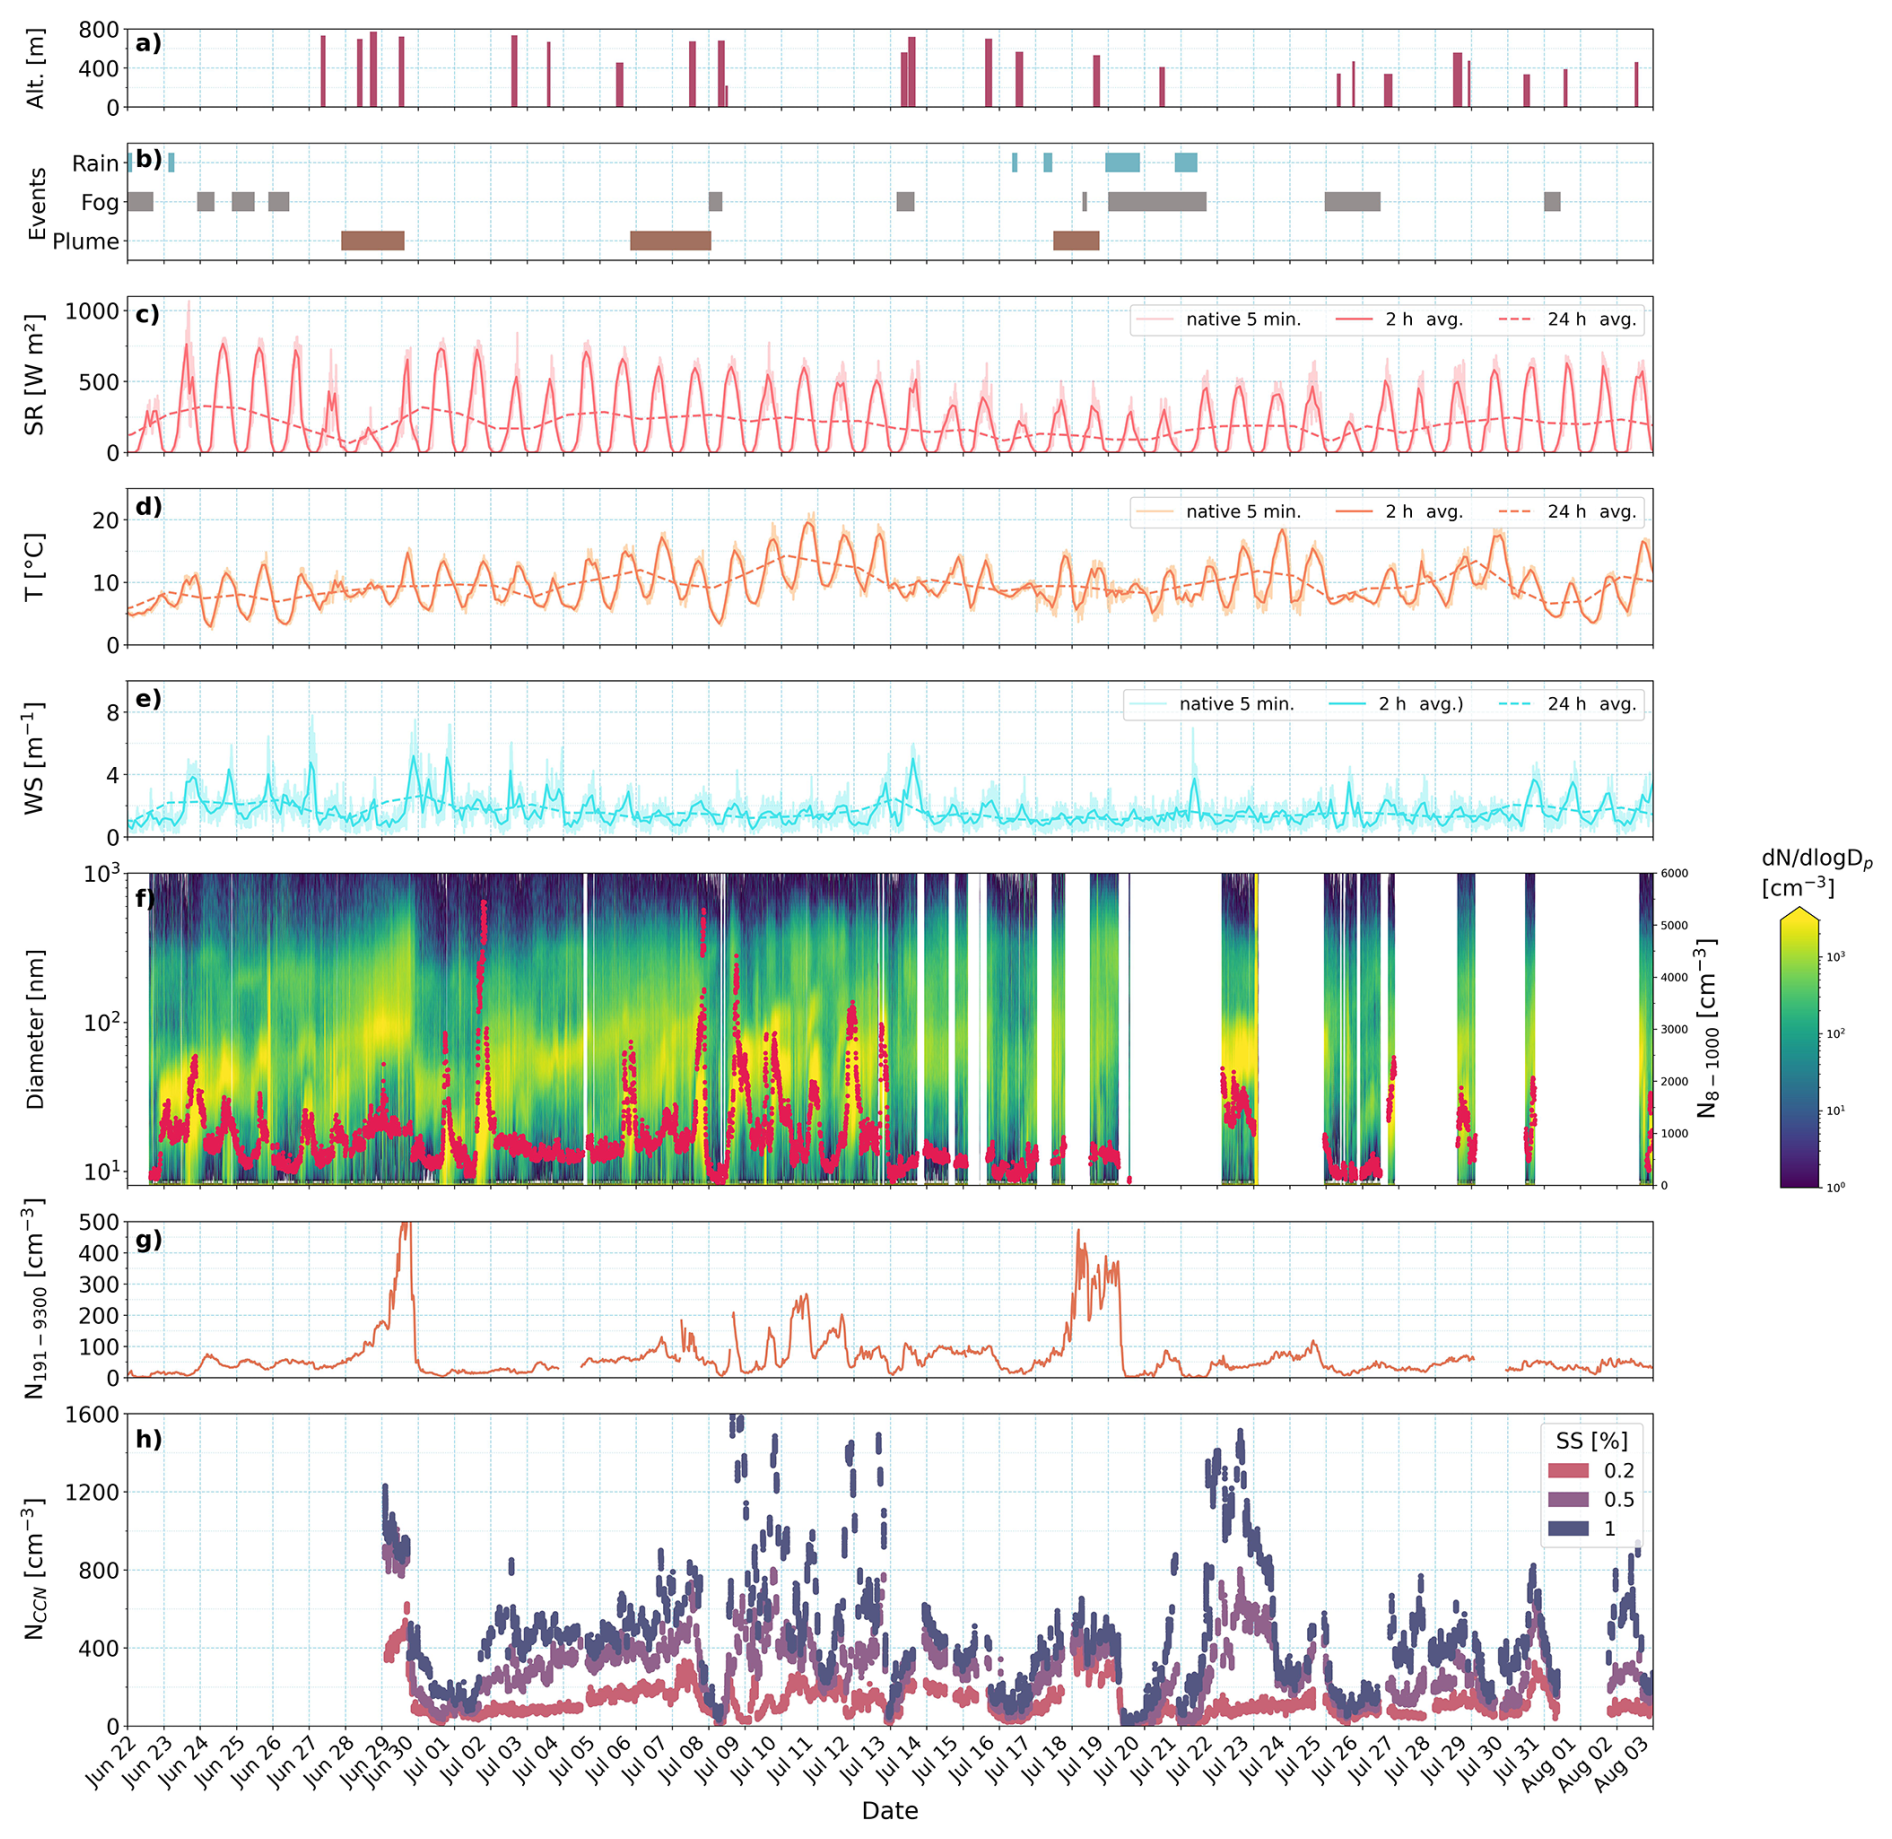
Figure 3Time series overview of (a) flight periods and altitudes above ground level (alt., dark pink bars); (b) time periods of rain (mid blue bars), fog (grey) and BB plumes (brown bars); (c) solar radiation (W m−2, red, median average of 5 min, 2 h and 24 h); (d) air temperature (°C, orange, median average of 5 min, 2 h and 24 h); (e) wind speed (m s−1, light blue, median average of 5 min, 2 h and 24 h); (f) particle number size distribution, (heatmap) between 8 and 1000 nm with total number concentration in the same size range (N8−1000, cm−3, red scatter, based on the SEMS); (g) total number concentration between 191 and 9300 nm (N191−9300, cm−3, dark orange, from the fidas); (h) total number concentration of CCN (NCCN, cm−3) for supersaturations of 0.2 % (pink scatter), 0.5 % (purple scatter) and 1 % (midnight blue scatter). and NCCN are without polluted data, see Sect. 2.4 for details. For the heatmap of PNSD between 8–1000 nm flagged pollution data have not been removed. Blank spaces in panel (f) correspond to time periods when the SEMS instrument was not measuring.
Aerosol properties exhibited considerable variability over the course of the campaign. After excluding direct perturbations from frequently occurring growth events, long-range transport of biomass burning plumes, and scavenging during ground-level fog periods, the median (interquartile range, IQR) background concentrations of N8−1000 and N191−9300 were 601 (412–941) and 40 (23–59) cm−3, respectively. Table 2 summarizes the mean, standard deviation, median, and IQR of several additional aerosol variables. Narsaq is a sub-Arctic coastal site, and particle number concentrations there are considerably lower than at Mace Head, a mid-latitude European coastal site (Dall'Osto et al., 2010), but much higher than at the Zeppelin Mountain Observatory in Svalbard (Tunved et al., 2013) or Villum Research Station in northern Greenland (Nguyen et al., 2016), which are also coastal sites.
A notable feature of summer 2023 was the advection of three BB aerosol plumes originating from Canadian forest fires. and NCCN all showed enhancements in total number concentrations, though the magnitude varied between the three events (Fig. 3f–h). Frequent particle growth events were also observed, totalling 17 across the campaign period. After excluding these perturbations, the median background CCN number concentrations were 90, 234, and 375 cm−3 at 0.2 %, 0.5 %, and 1 % SS, respectively (Fig. 3h). In general, high concentrations of coarse-mode aerosols (N191−9300) covaried with high CCN number concentrations throughout the time series. However, two periods – early July and 21–24 July – exhibited enhanced CCN number concentrations at higher supersaturations without a corresponding increase in N191−9300.
Table 2Summary of median, mean, and IQR of for supersaturations of 0.2 %, 0.5 % and 1 %, eBC, and σbsc,525 under BG and polluted BG (BG + pollution events), as well as growth events and plume conditions. Polluted BG conditions have data from particle growth, biomass burning and fog events removed, while keeping short-lived spikes from local anthropogenic emissions. BG also has these events removed, and in addition the anthropogenic emission spikes are removed.
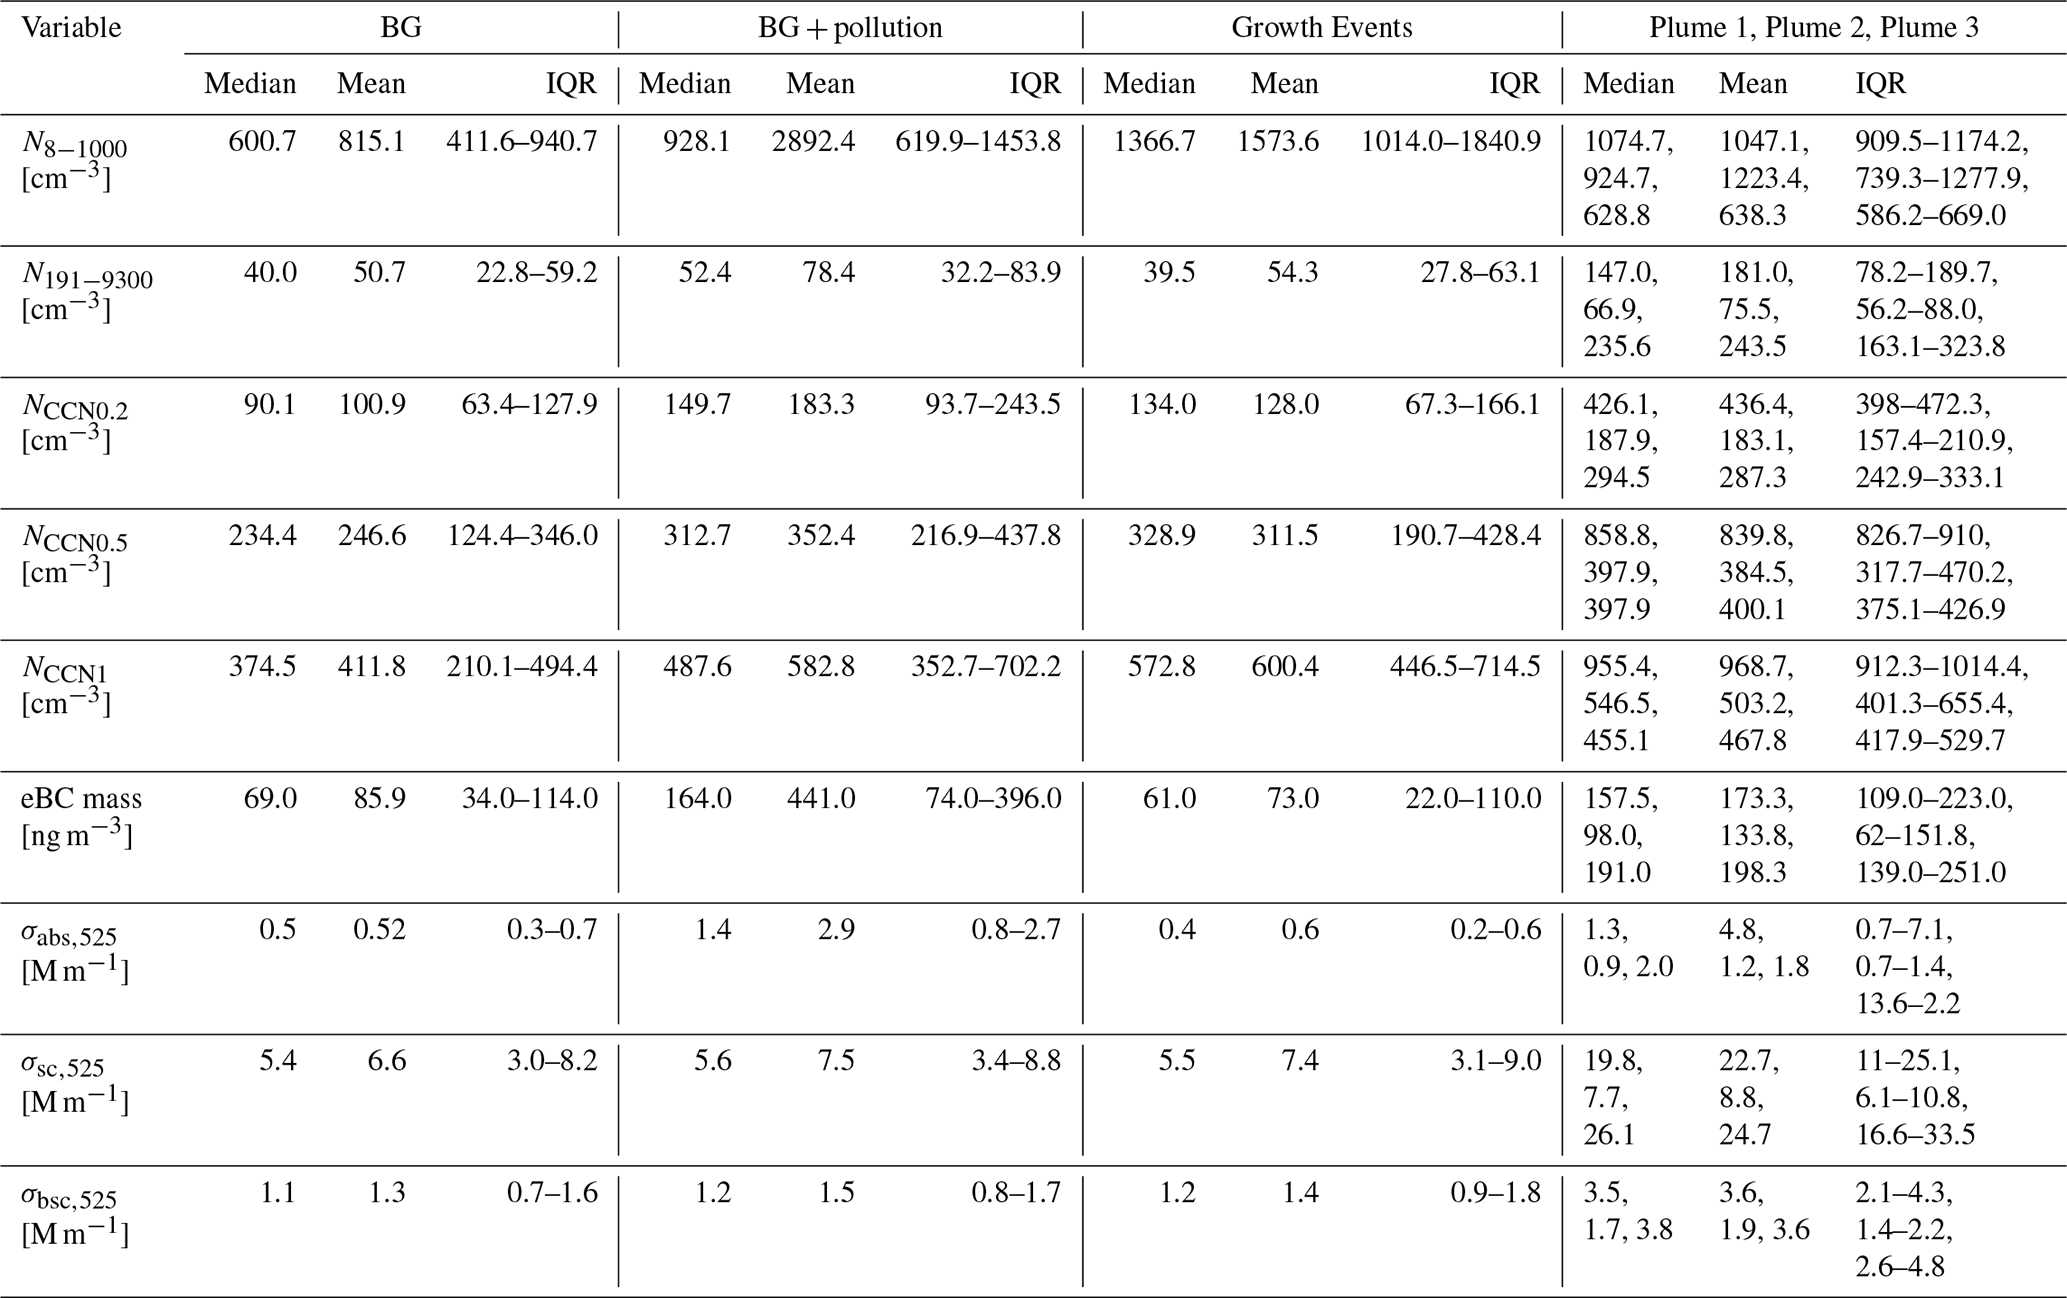
Figure 4 shows the diurnal variation of solar radiation, T, wind speed, and NCCN for supersaturations of 0.2 % and 0.5 %, as well as optical properties, . The diurnals were plotted taking data from the BG dataset so that the various defined perturbations did not influence the average pattern. Solar radiation peaked on average between 12:00–13:00 LT (local time), with median peak values of 560 W m−2. Air temperature on the ground peaked between 15:00 and 16:00 LT, 3 h after solar noon, with a median peak value of 12 °C. The wind speed was generally low throughout the campaign, as is typical for summertime in the region, with wind speed peaking alongside temperature between 15:00 and 16:00 at 2.3 m s−1. The maximum wind speed reached during the campaign period was between 7–8 m s−1. The median N8−1000 was at a minimum of 480 cm−3 overnight and peaked at 1290 cm−3 at ∼17:00. N8−1000 remained low after sunrise on average, usually until ∼10:00 LT, peaking between 16:00–18:00 LT, co-varying with diurnal patterns of temperature and wind speed, before falling back to night-time levels by 22:00 LT. In contrast to the finer mode aerosols, N191−9300, showed a less distinct, more variable diurnal pattern, while the elevated concentrations over mid-day coincide with wind speed picking up, suggesting potentially wind-induced particle generation. On average, N191−9300 was at a minimum between 22:00 and 24:00 LT, with a median value of 40 cm−3, while the concentration peaked on average at 16:00 LT at 55 cm−3. No strong diurnal pattern was observed in NCCN for lower SS as expected given the little variation of N191−9300. At 0.5 % SS, the NCCN diurnal pattern starts resembling N8−1000, increasing throughout the morning and peaking in the early afternoon with median peak value of 367 cm−3. The optical properties σabs,525 and σsc,525 show little diurnal pattern, except σsc,525 features higher values in the 90th percentile between 00:00 and 09:00 LT, but without any clear connection to other aerosol variables.
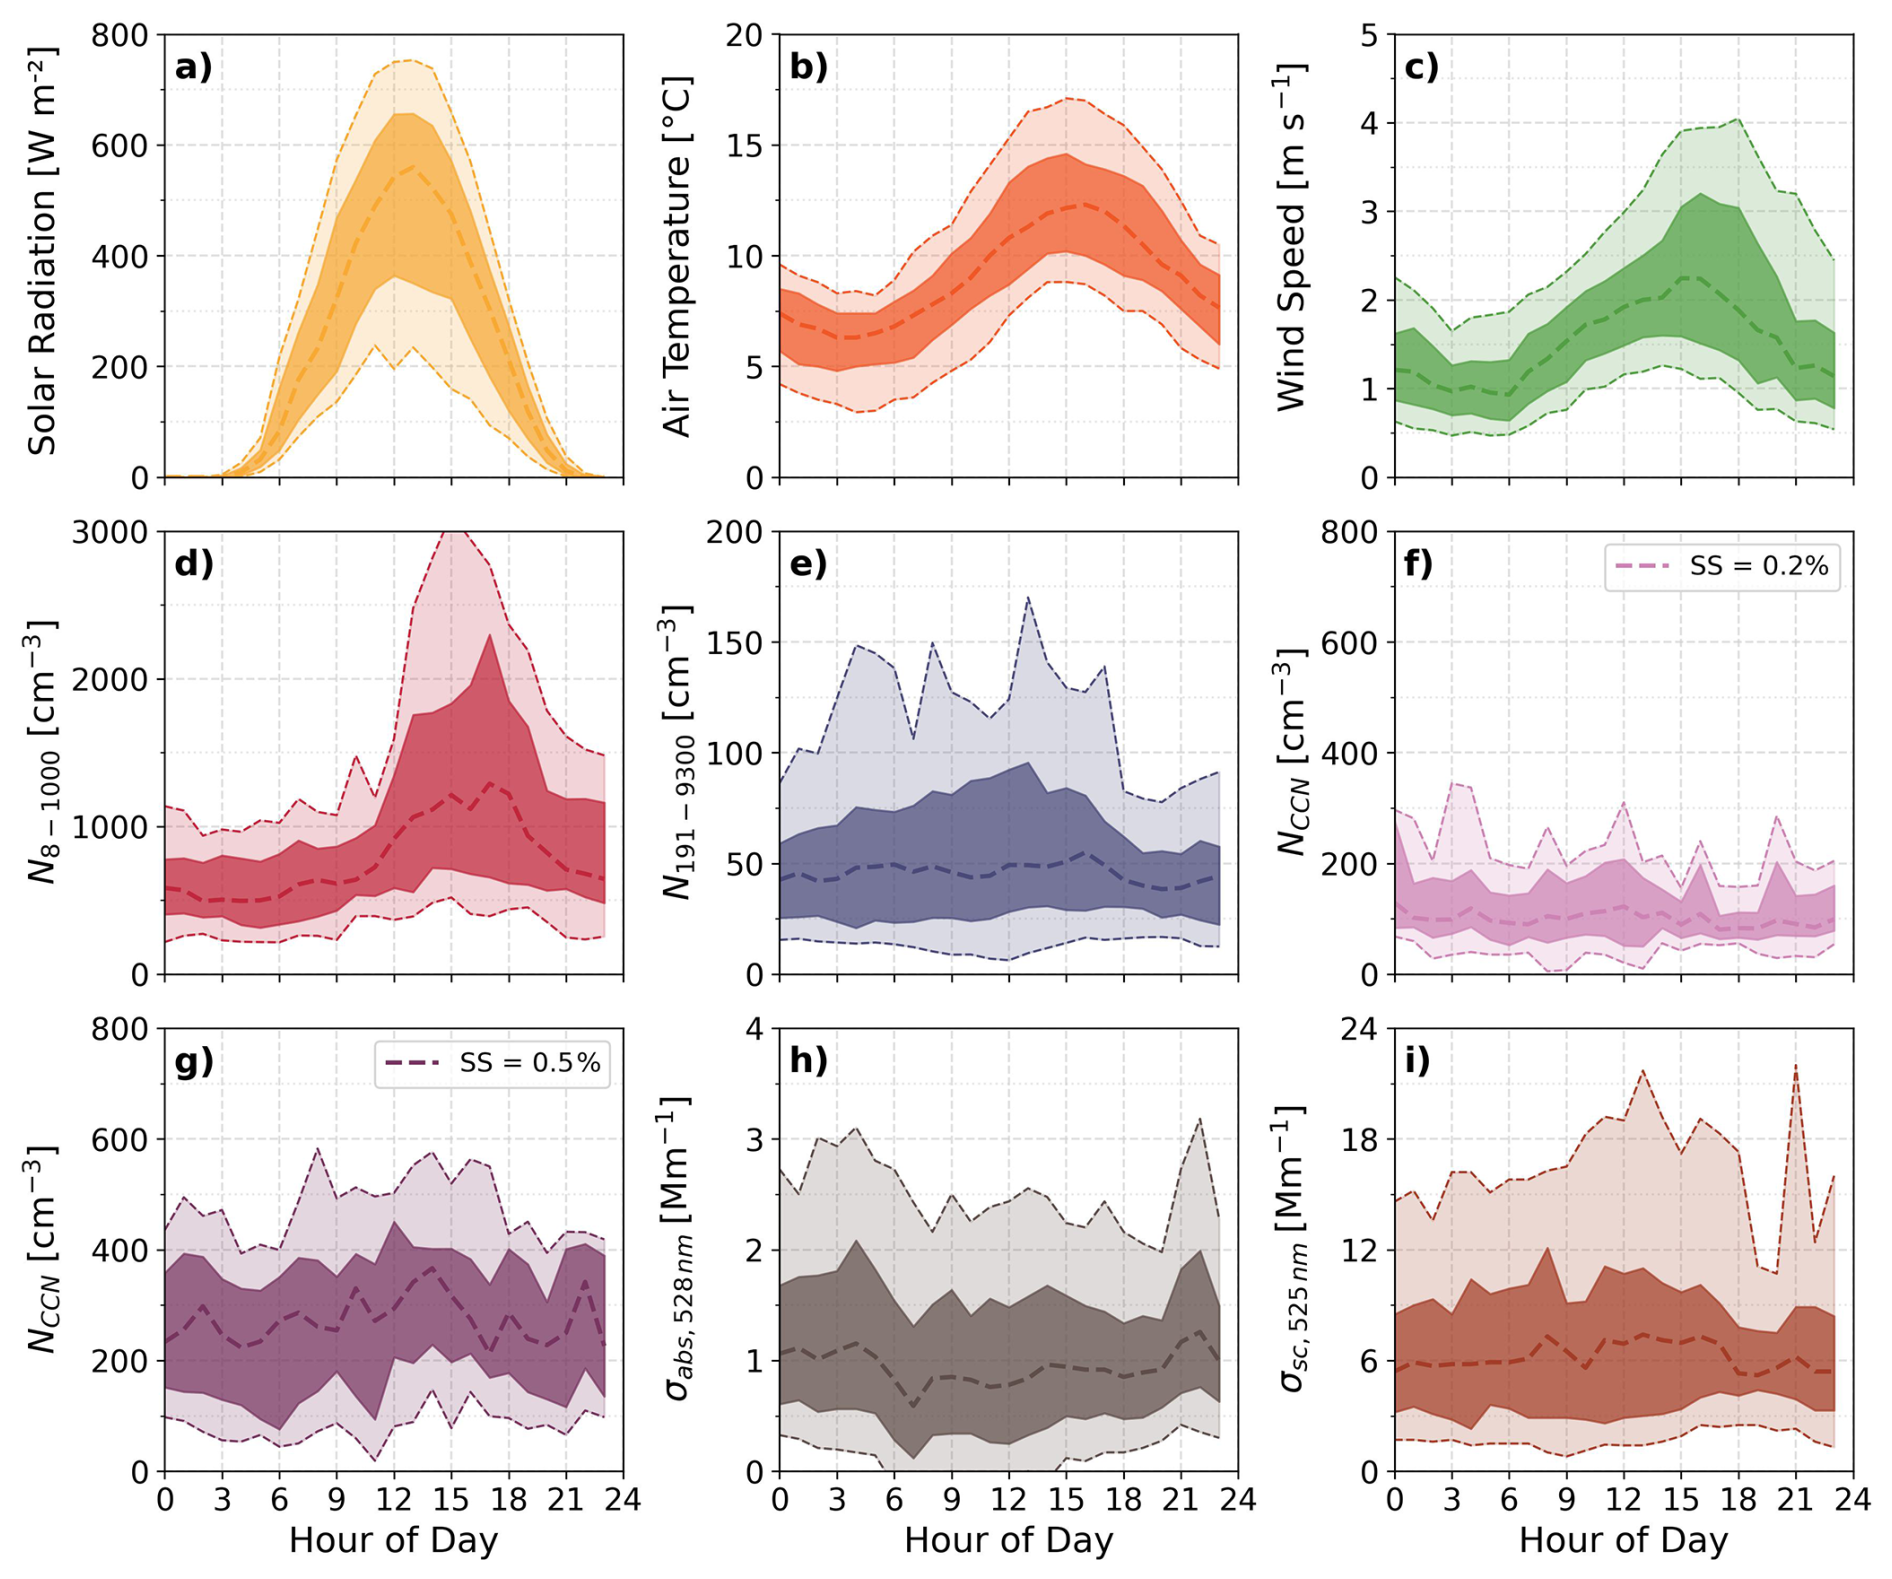
Figure 4Hourly-resolved diurnal profiles of BG data with median (dashed lines), IQR (dark shaded regions) and 10th/90th percentiles (light shaded regions) for measured medians of (a) solar radiation, (b) T, (c) wind speed, (d) N8−1000, (e) N191−9300, (f) NCCN with supersaturations of 0.2 % and 0.5 %, (g) σabs,525 and (h) σsc,525.
For deeper analysis we broke the time series into four distinct conditions based on the different proposed sources dominating the aerosol population: (1) a persistent aerosol background influenced primarily by local marine aerosol and aged anthropogenic pollution occurred 33.5 % of the time (Table S2); (2) local short-lived anthropogenic pollution (50.4 % of the time); (3) particle growth events (8.0 % of the time); and (4) biomass burning plume events (8.1 % of the time). We clustered the ground-based and vertical PNSD for each condition separately and discuss results throughout the remainder of Sect. 3. The discussion aims to answer the following:
-
Section 3.2: Can local pollution be distinguished from background aerosol?
-
Section 3.3: Does particle growth occur on the ground or aloft?
-
Section 3.4: To what extent do biomass burning plumes perturb the PNSD observed on the ground in periods where they are identified above the boundary layer?
-
Section 3.5: What effect do pollution, biomass burning plumes and growth events have on climate relevant aerosol properties?
3.2 Background versus fresh pollution regimes
As summarised in Table 2, BG conditions are characterised by low aerosol and CCN number concentrations, and low eBC mass concentrations and absorption coefficients compared to fresh pollution and BB plume event periods. Based on the SEMS ground measurements, BG conditions accounted for ∼33.5 % of the campaign period. Fresh pollution events consist solely of the short-lived anthropogenic pollution spikes excluded from BG, BB, and GE categories. These spikes represent sharp perturbations to ambient aerosol conditions. They provide an insight into the impact of fresh local anthropogenic emissions on the aerosol population. In contrast to the BG conditions, fresh pollution periods occurred 50.4 % of the time in the SEMS measurements.
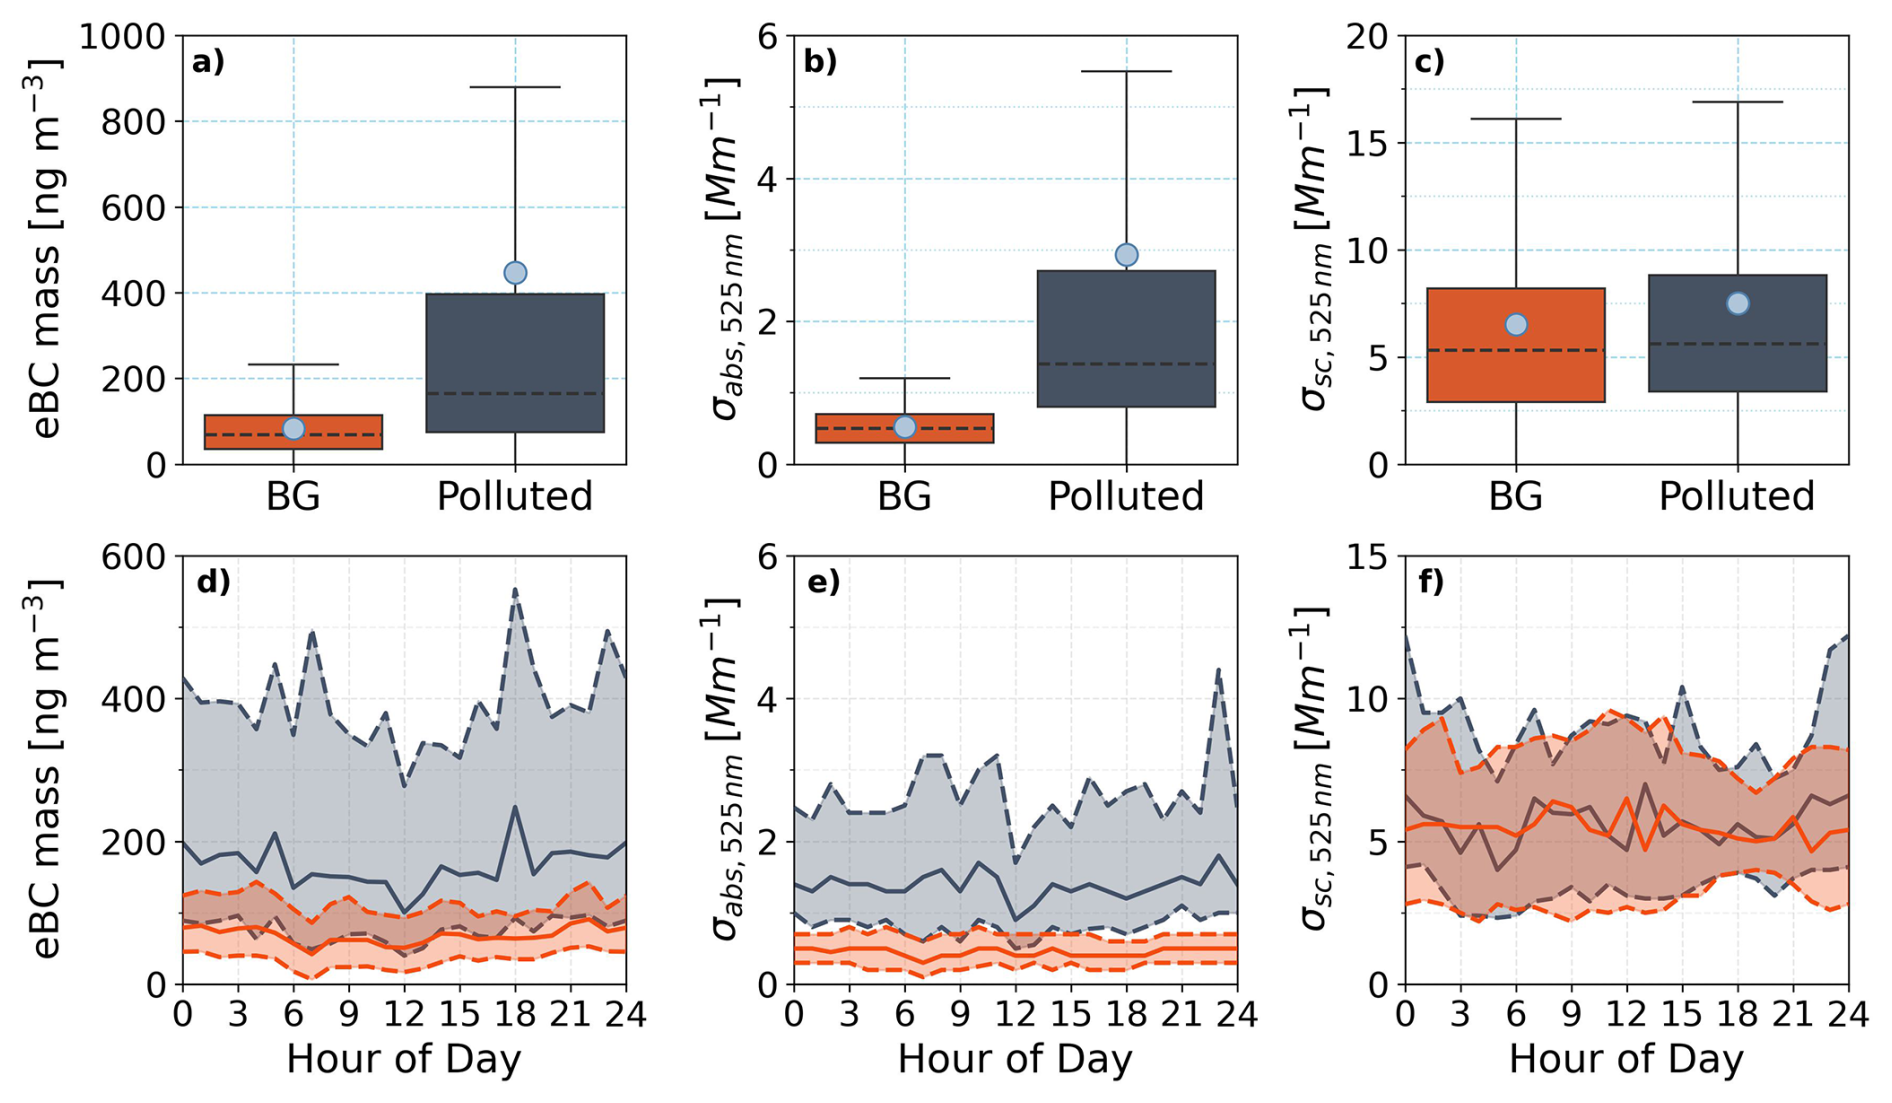
Figure 5Comparison of BG (33.5 % of time) and fresh pollution (50.4 % of time) source contributions to the aerosol population in Narsaq. The top panel shows boxplots comparing (a) aerosol eBC mass (ng m−3), (b) σabs,525 nm (M m−1) and (c) σsc,525 nm (M m−1) for both BG and freshly polluted conditions. Bottom panel shows median average diurnals with interquartile ranges in shaded regions for (d) eBC mass, (e) σabs,525 nm and (c) σsc,525 nm. It is worth noting that eBC values are given by a mAeth, while σabs,525 nm values are measured by the STAP. Due to the reduced data coverage on the ground by the STAP as a consequence of its usage on the tethered balloon, the clean dataset from the mAeth contains 9705 more 1 min data points than the STAP dataset (26 924 vs. 36 629 data points). Due to the increased sensitivity and temporal resolution of the STAP compared to the mAeth, 46 % of the dataset is flagged as polluted while only 40 % of the mAeth data is flagged. This also contributes to the difference in data coverage for both categories. Note: the y axis for panels (a), (b) and (c) differ from that of (d), (e) and (f).
There is a clear statistical difference between the BG and fresh pollution conditions including diurnal patterns for eBC mass, σabs,525 nm and σsc,525 nm (Fig. 5). Specifically, eBC mass and σabs,525 nm are enhanced in fresh pollution conditions with median values increasing by a factor of 2.2 and 2.7, respectively. Median values of σsc,525 nm however, show only minor enhancement suggesting that aerosol scattering is largely controlled by the persistent, presumably marine, aerosol background. While the diurnal patterns in all three variables are relatively weak, eBC under fresh pollution conditions shows an enhancement over the night compared to daytime, potentially related to domestic activities and a shallower boundary layer. Despite the frequent occurrence of fresh pollution spikes, the underlying BG conditions exhibit low and stable eBC mass and σabs,525 nm. These pollution events do not appear to significantly modify the background state.
This interpretation is further supported by the clustering of PNSDs. The result provides additional insight into how transient emissions alter, or do not alter, the prevailing aerosol characteristics (Fig. 6). K-means clustering on the BG data yielded one bi-modal and two uni-modal clusters: (1) BG c1 peaking broadly in the lower Aitken mode at 30 nm and showing a shoulder in the nucleation mode at ∼22 nm; (2) BG c2 peaking in the Aitken mode at 51 nm occurring the highest percentage of the time (39 %) and at the highest concentration compared to the other clusters; and (3) BG c3 peaking in the Aitken mode at the highest diameter of 68 nm. The relatively high prevalence of BG c1 (30 %) is likely due to the frequent particle growth events observed in the region, indicating that any meaningful representation of background conditions must inherently account for the influence of these growth events (Sect. 3.3). Ground-based cluster classification is summarised with the relative abundance of each cluster per condition in Table S5. Given the generally low wind speeds across the campaign period, with median values of 2.4±1.3 m s−1, and the dominance of the wind direction from the west and north-west, i.e. from down/across the fjord, ice sheet, and open ocean, it is reasonable to assume background clusters are highly likely to be marine in origin, and potentially mixed with fresh or aged local anthropogenic emissions.
Results from clustering of the pollution events show also three clusters (Fig. 6): (1) pollution c1 peaking at 27 nm; (2) pollution c2 peaking in the Aitken mode at 52 nm and; (3) pollution c3 peaking in the Aitken mode at the highest diameter of 77 nm. Despite the similarity of the main modes of the clusters in the background and polluted conditions, there are clear differences in the magnitude and variability, with pollution being more variable. The internal variability within the background clusters is consistent with the background category definition, which retains aged and processed anthropogenic aerosol alongside the marine signal, with only the short-lived fresh pollution spikes that are excluded, and it reflects natural day-to-day variability in the relative contributions of these sources under changing meteorological conditions. Primary exhaust particles, while their characteristics are strongly affected by vehicle type and fuel, have been shown to have PNSDs dominated by sub-50 nm particles, and even in some cases sub-10 nm (Alanen et al., 2015; Rönkkö et al., 2006; Rönkkö and Timonen, 2019; Weimer et al., 2009). Due to the large-scale and permanent influence of marine airmasses on the aerosol populations, it is conceivable that the fresh pollution category still contains a marine aerosol signature and hence it is not surprising that the clustered PNSDs for both conditions are similar. We hypothesize that the local pollution spikes do not modify the BG conditions significantly and in the long-term, and instead are short-lived perturbations on top of a dominant marine-influenced background.
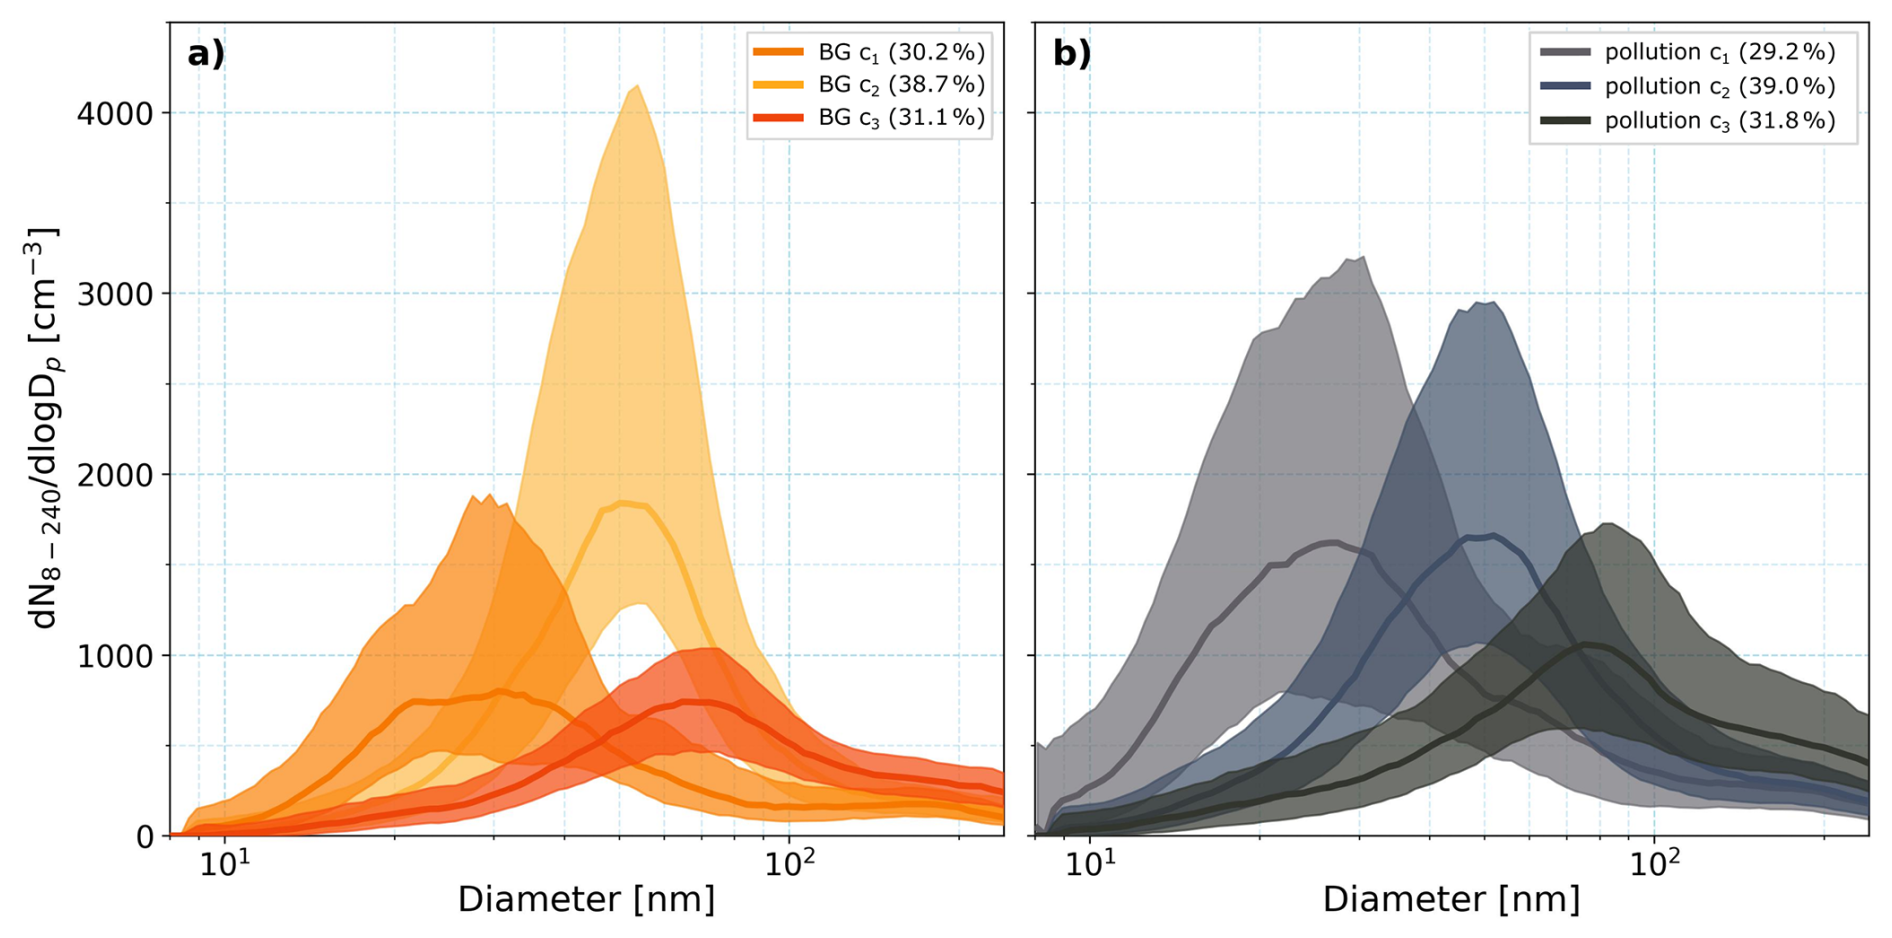
Figure 6Clustered PNSD for (a) BG and (b) fresh pollution conditions. Legend shows percentage occurrence of each cluster within each dataset. Median values and IQR are shown for each clustered PNSD.
The vertical structure of specific aerosols properties under background conditions was assessed using tethered balloon and ceilometer data (see Sect. S3, Tables S6–S7 and Figs. S7–S8 in the Supplement). These data suggest that the background aerosol regime as observed at the surface generally extends up to ∼200–300 m, where a significant decrease in the particle number concentration towards higher altitudes was observed, though the limited number of flights (8 flights) prevents robust conclusions. The ceilometer data covers much more time, and the clustering algorithm suggests that the “smoke/pollution/marine” category extended up to 500–700 m, depending on the hour of the day. Since helikite flights did not reach higher than 700 m, it cannot be assessed with the in-situ observations whether another sharp decline in concentrations occurred further aloft. It seems justified to assume that the ground-based background observations are representative throughout the boundary layer in absence of specific other events.
3.3 Particle growth events
Throughout the campaign period, 17 growth events were identified. A 6 h time window (Sect. 2.4) was chosen to capture the initial growth phase while distinguishing both the point in time, when grown particles start resembling the background conditions, and overlapping events, where one event subsides as another begins. Figure 7 displays the PNSD for a representative growth event on the 1 July 2023, clearly showing the increase in N8−1000. The growth rate between 8 and 25 nm (GR8−25) for this event was calculated to be 2.7 nm h−1. During the campaign, the GR8−25 ranged from 1.5 to 7.6 nm h−1, with an average value of 3.9 nm h−1. Compared to high Arctic sites, these GRs are higher, more comparable with lower latitude remote and rural sites (Kerminen et al., 2018). A comprehensive summary of each GE, including time intervals, growth rates, coagulation and condensation sinks and the associated aerosol and meteorological conditions, is provided in Table S8 with a full description of how particle growth parameters were calculated (Sect. S4 in the Supplement). The full campaign time series (Fig. 3) shows that the frequent occurrence of these events – at times on a daily basis – substantially influenced the average PNSD over the campaign and that they constitute an intrinsic component of the regional background aerosol population. Based on the 6 h definition, growth events occurred 8 % of the time during the campaign.
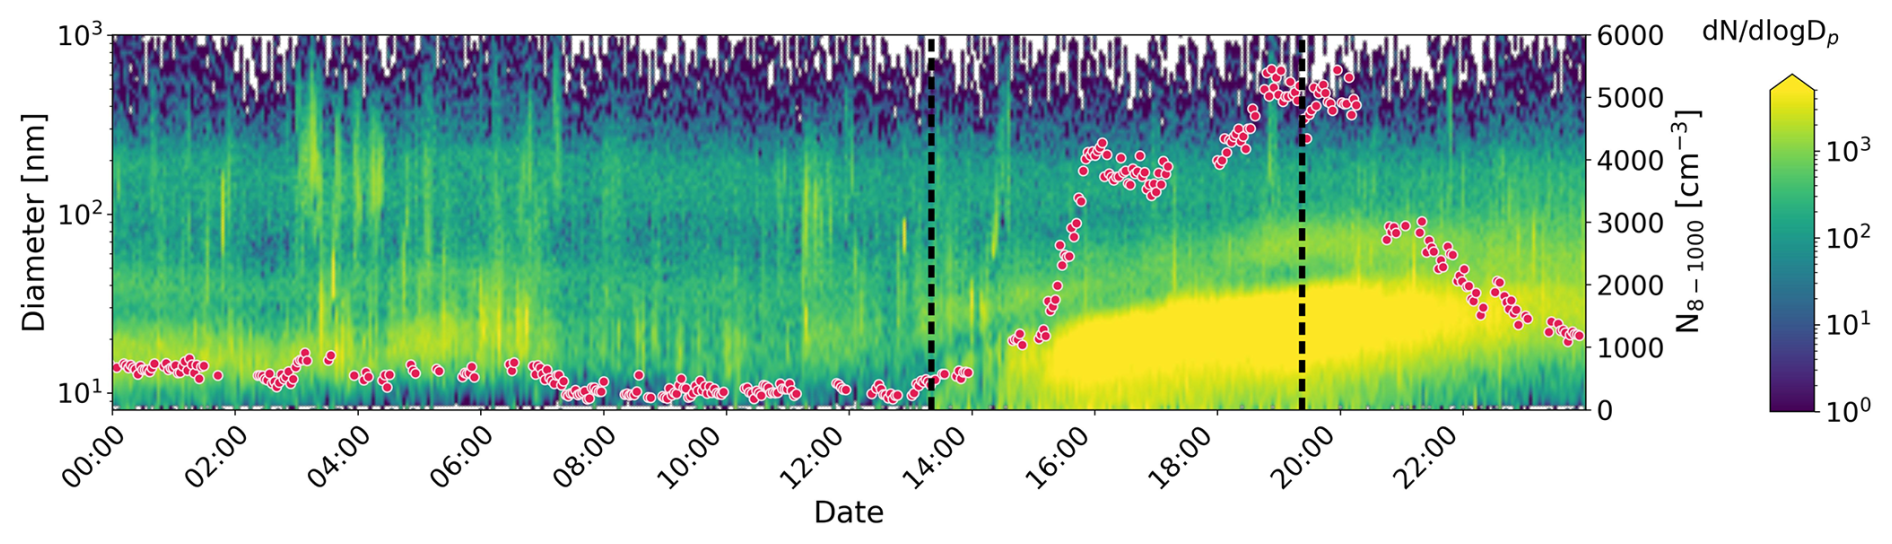
Figure 7Normalised PNSD, (heatmap), between 8 to 1000 nm with N8−1000 (red scatter) overlaid for a growth event on 1 July 2023. Black dashes represent the defined start and end (start +6 h) of this growth event.
Figure 8 shows the clustered PNSDs for the GE periods at the ground. Two bi-modal and one uni-modal clusters were found: (1) GE c1 peaking in the nucleation and Aitken modes at 17 and 40 nm, respectively; (2) GE c2 peaking in the nucleation and Aitken modes at 25 and 73 nm, and (3) GE c3 peaking in the Aitken modes at 53 nm overlapping in the Aitken mode with background cluster BG c2. Notably, 44 % of the GE data reached mode diameters characteristic of BG c2, the most commonly observed BG cluster. The GE clusters likely represent temporal evolution of particle growth, where particles begin at GE c1 at the onset and subsequently growth through GE c2 and c3. This interpretation explains why GE c1 is associated with the highest solar radiation – corresponding to the earliest stage of the event and usually corresponding to solar noon when photochemical-induced nucleation is the strongest. Eventually, the PNSD evolves toward that of BG c2, illustrating not only the rapid growth of particles but also that, beyond the 6 h definition from onset, much of the background aerosol is influenced by growth events. Across clusters, neither wind direction nor speed showed variability. There was no indication of the presence of a clear mode below 8 nm in any of the three growth-related clusters, although GE c1 exhibited a tail extending into this range, below the SEMS' lower cut off, with a shoulder around 8 nm, supporting the hypothesis that new particles are mainly transported from their nucleation site to Narsaq. Ground-based GEs were consistently associated with westerly winds travelling over the fjord (Fig. 8d). Based on the wind speed and calculated GR8−25 between 1.5 to 7.6 nm h−1, estimated distances from the nucleation source to the measurement site ranged from 5.5 to 31.8 km (see Sect. S5 in the Supplement). Figure S9 shows a regional map illustrating the estimated distances from nucleation sources as concentric circles around Narsaq. Given that wind is predominantly from the west, NPF appears to happen within the fjord system, close to the termination of the Greenland ice sheet. If biological productivity is active in the marine-terminating glacier fjords, it is expected that there are emissions of gas phase precursors for the nucleation, such as DMS, that can be oxidized and then lead to formation and growth of new particles. It is noteworthy that particle growth events measured on the ground were much less common for periods where the wind direction was not persistently westerly. A full discussion and analysis of the effect of marine and land-terminating glaciers on NPF observed in fjord systems in Southern Greenland will follow in a separate paper based on ship-borne observations.
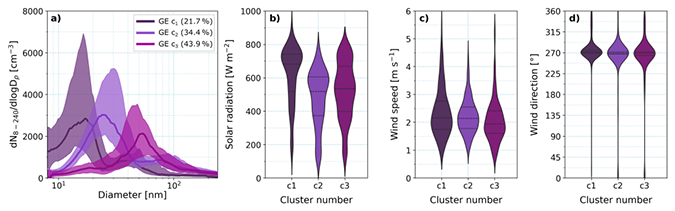
Figure 8Panel (a) shows clustered PNSD for particle GE. Anthropogenic pollution spikes have been removed from the data. Median values and IQR are shown. Legend shows percentage occurrence of each cluster within each dataset. Panels (b)–(d) show violin plots of solar radiation, wind speed, and wind direction for each cluster.
While ground-based analysis provides a detailed view of GEs experienced at the surface, it does not capture how these particles evolve vertically in the lower atmosphere, and whether the source is indeed at the surface. To address this, we examine one vertically resolved case study, for the time period of 12:05 to 18:00 on 28 July, to explore the influence of atmospheric structure and vertical transport on the dispersion and growth of nucleation-mode particles above Narsaq. Although several flights occurred during particle growth events throughout the campaign, these cases did not allow for vertical clustering due to the helikite's ascent and descent speeds within the lowest 200 m, which were too fast to collect sufficient scans with the mSEMS. Nevertheless, the thermodynamic conditions for the chosen case study were typical of those during growth events across the campaign, featuring an elevated temperature inversion at ∼320 m above ground and the maximum measured altitude of 560 m. Of the 24 flights in total, elevated temperature inversions were observed in 14, and surface-based temperature inversions were observed in seven. The vertical profiles of temperature for the flights during this case study show the thermodynamic structure and the presence of temperature inversions in Fig. S10, while Sect. S6 in the Supplement describes how inversions were determined.
In this case study, to establish a reference for interpreting the vertical aerosol structure, we first applied k-means clustering to the ground-based PNSDs during the case-study period. Figure 9a shows two distinct surface (s) clusters: (1) sGE c2, a tri-modal distribution peaking at 24, 65 and 173 nm, observed after ∼14:00 when the wind direction became persistently westerly; and (2) sGE c1, a tri-modal distribution peaking at 21, 57 and 172 nm, seen before ∼14:00 under mixed westerly and north-westerly influence. The temporal evolution of the two identified clusters (Fig. 9b) suggests they represent different phases of the same growth event: (1) a pre-event stage with lower nucleation mode concentration (sGE c1) and (2) a subsequent advected growth event (sGE c2). From the time when the westerly airmass became more dominant, the nucleation mode around ∼24 nm increasingly dominated over the Aitken mode in the ground distributions.
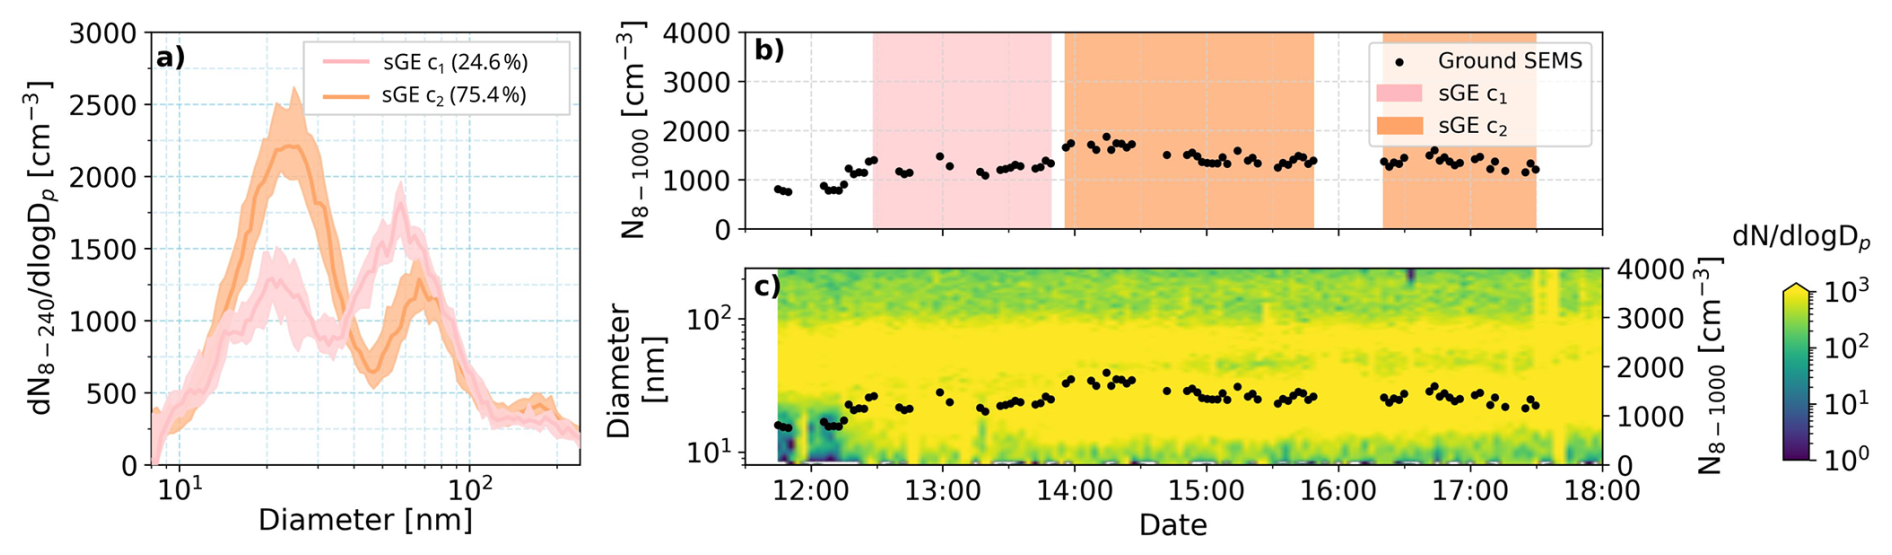
Figure 9Panel (a) shows clustered PNSDs using ground SEMS measurements for the time period of flight 8 on 28 July, corresponding to vertical measurements shown in Fig. 10. The legend shows of the percentage of SEMS runs for each cluster during the shown period. (b) Time series of N8−1000 (black scatter, cm−3) with shading corresponding to the occurrence of each cluster. (c) Heatmap of particle number size distribution, with same time series of N8−1000 as in (b).
Clustering of the vertical aerosol profiles revealed varying complexity across altitude layers, with 2, 1, 1, and 2 clusters identified in the ground level, 200–300, 300–450, and 450–550 m altitude ranges, respectively. Figure 10a–c show the clustered PNSDs for the flight, Fig. 10d the time series of the altitude track with the occurrence of each cluster shaded and Fig. 10e shows the heatmap of PNSD over the course of the flight. The slow descent profile from ∼550 to 200 m was used to characterise the vertical aerosol population. Altitude bins for clustering were chosen to represent the distinct vertical aerosol layers observed and the presence of a temperature inversion above ∼300 m up to the maximum height of the flight (Fig. S10).
Comparing ground and elevated observations at 200–300 m, there is strong similarity in the aerosol populations: the two vertical clusters – vGE_200 c1 and c2 – closely resemble the ground clusters sGE c1 and c2, indicating a well-mixed boundary layer up to 300 m (see Fig. S11 for a direct comparison of the clusters). Within the elevated inversion, between 300 and 450 m, only one cluster was identified, with mode diameters different from the layers below and potentially a mode below 10 nm (Fig. 10b). This suggests that the elevated inversion inhibits mixing of particles from below and hence features a distinct aerosol population. At the highest elevation range, 450–550 m, and still above the elevated inversion, two clusters are observed with a similar Aitken mode diameter around 60 nm compared to the layer below, however without or with strongly depleted smaller modes. Wind direction information (see insets in Fig. 10), indicates different source regions for these layers: in the 450–550 m range, winds came directly from the south, while at 300–450 m they were a mix of southerly and south-easterly, and at the surface again predominantly southerly with a smaller south-easterly component. This points to potentially different source regions in these three layers.
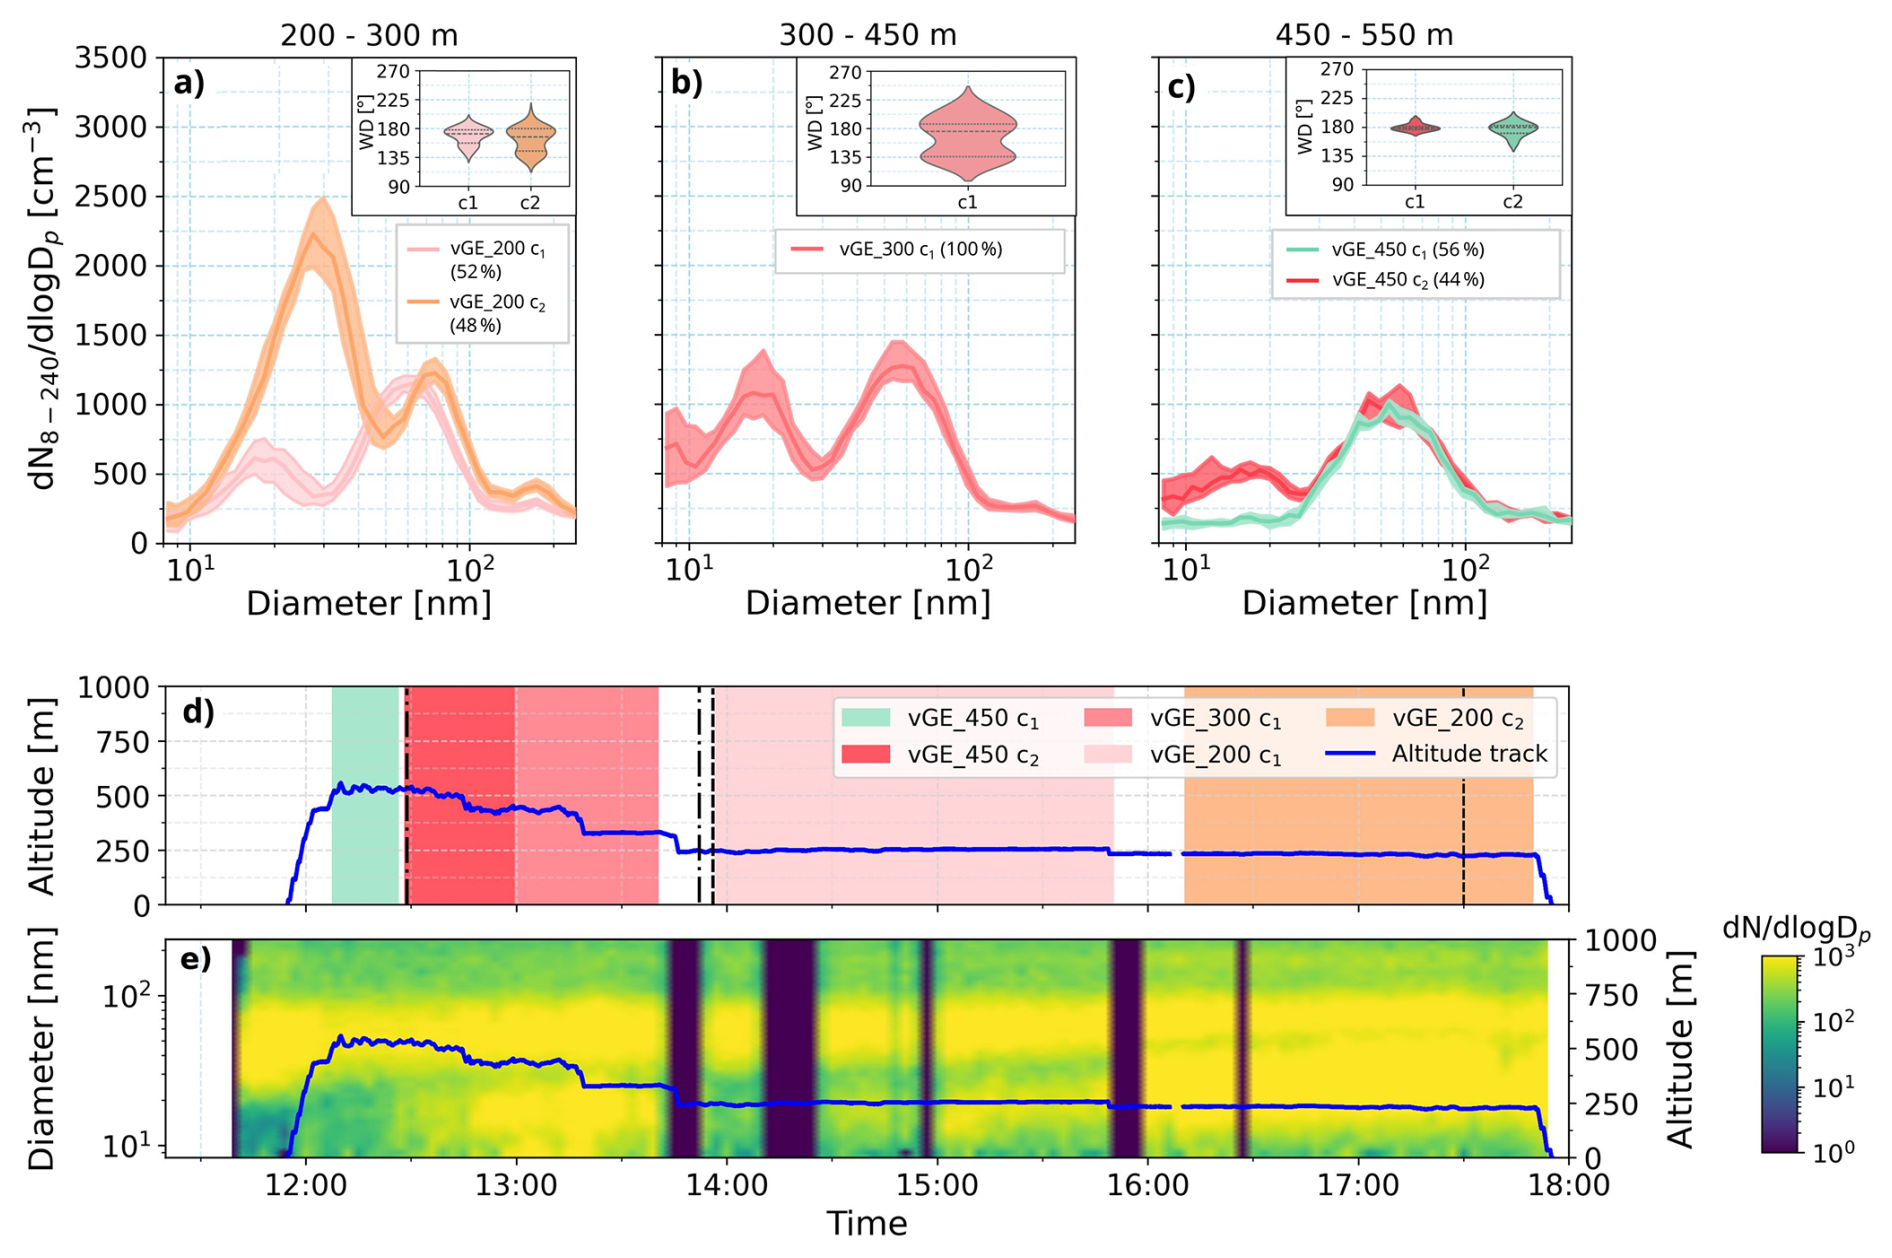
Figure 10Clustered PNSDs (median and IQR) using mSEMS vertical measurements for altitude bins of (a) 200 to 300 m (light pink and orange), (b) 300 to 450 m (pink), and (c) 450 to 550 m (red and turquoise), above ground level. Legends show percentages of mSEMS scans in each cluster. Insets provide violin plots of wind direction for each cluster. Panel (d) displays the altitude of the helikite (blue) over the course of the flight, with shaded regions showing the chronological occurrence of each cluster throughout the flight period, while the heatmap of the particle number size distribution from the flight is shown in panel (e). The region between black dashed lines in panel (d) represents time during which sGE c1 was present on the ground, while the region between black dash-dotted lines represents time during which sGE c2 was present on the ground. Direct comparison of ground and vertical cluster distributions is provided in Fig. S11.
Overall, the analysis suggests that the growth events measured at the surface mainly occur at the ground rather than aloft. The cluster with a smaller nucleation mode (<25 nm) between 200–300 m, i.e. vGE 200 c1 is diluted compared to its ground analogue sGE c1 (Fig. S13), while the cluster with the larger nucleation mode (around 30 nm, vGE 200 c2) is as strong as the ground cluster sGE c2. Given the slightly larger mode diameter aloft, the particles seem to have been around for longer in the region and were able to disperse also in the vertical below the inversion. Moreover, size distributions within and above the elevated surface inversion are distinct from the ground. That said, these size distributions contain nucleation mode particles and it can hence not be excluded that NPF and growth also takes place above the well mixed part of the boundary layer, indicating that NPF can occur at the surface as well as aloft. The complex structure of the boundary layer seems to allow multiple particle sources to form distinct vertical layers that will only mix over time scales longer than is possible to observe during helikite flights (i.e. >5 h).
3.4 Biomass burning plume advection
Three different BB plumes from Canada were transported towards Narsaq, arriving during the following periods: 27 June, 21:20 to 29 June, 15:00; 5 July, 20:13 to 8 July, 01:42; and 17 July, 11:47 to 18 July, 18:17 (all LT). A time series overview including BB plume periods can be found in Fig. 3. Figure 11 shows the time series of β observations from the ceilometer for the three plume periods. Plume 1 arrived about within 300 m above the ground with a thickness of roughly 2 km (Fig. 11a). Throughout the entire plume 1 period, there is pronounced variability in the vertical structure of the plume, including a layer of clouds occasionally capping the plume (light pink color) with several short precipitation events (yellow) reaching the ground. Unlike the first plume, plume 2 maintains an altitude between 1 and 5 km until mid-day on 6 July (Fig. 11b). Thereafter additional plumes occur further aloft. The lower plume 2 gradually thins and increases in altitude with time and appears to be less affected by vertical mixing. In plume 2, β is lower compared to plume 1, suggesting a less dense aerosol concentration. Plume 3 appears to reach within 1 km of the surface, and is the thinnest plume with regard to vertical extent, with visible layers appearing over the night between 17 and 18 July between 1 and 2 km (Fig. 11c). On the second day of the event, evidence of rising motion can be seen in the afternoon, after a morning ground-level fog event between 07:00 and 10:00.
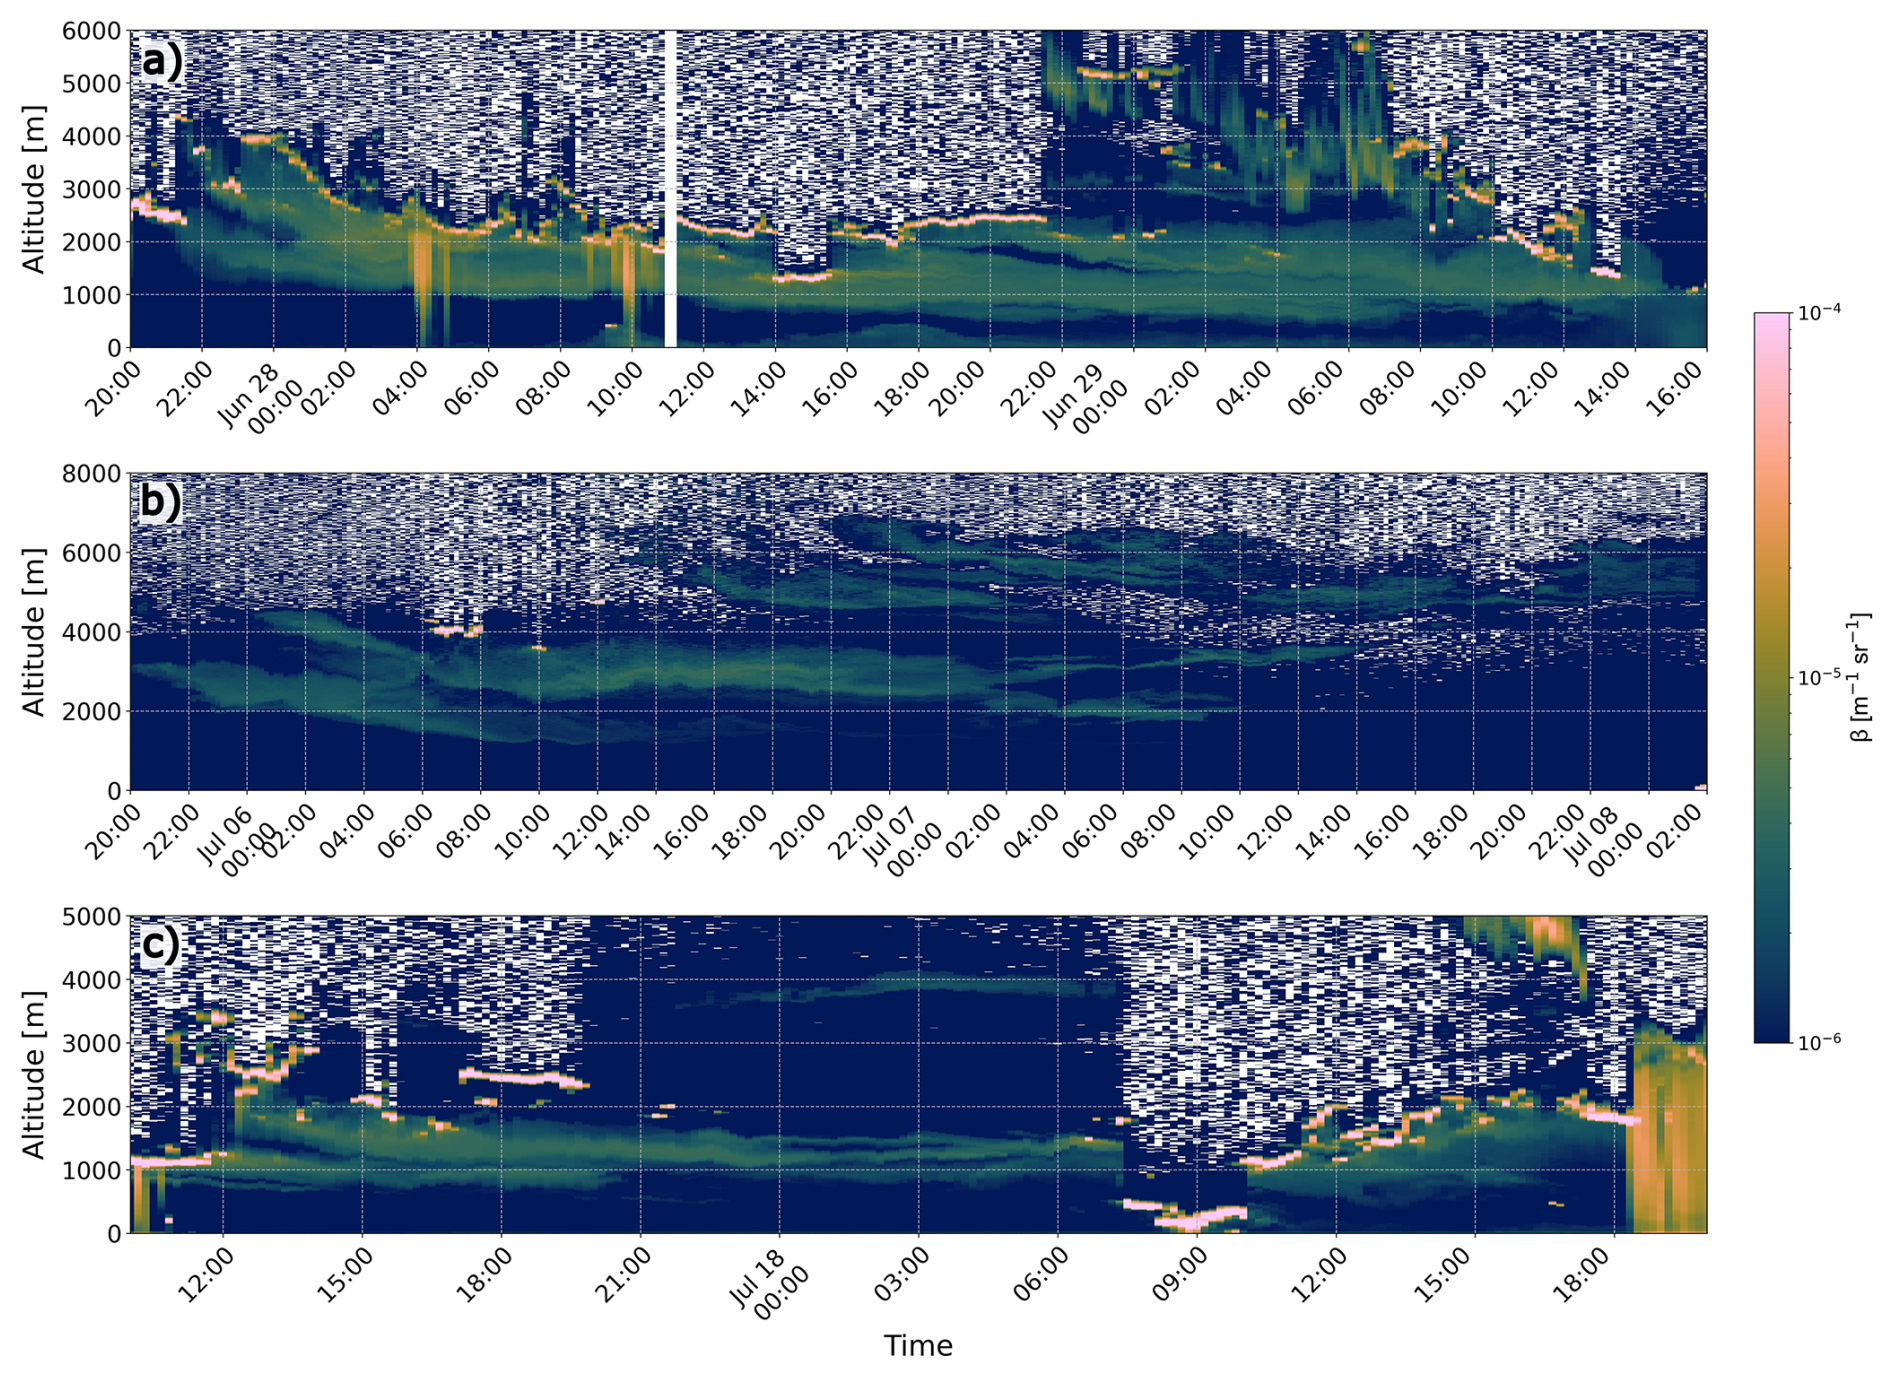
Figure 11Time series of β (m−1 sr−1) as a function of altitude measured by the ceilometer for periods of (a) plume 1, (b) plume 2 and (c) plume 3. Blue, green, yellow and pink colors signify clear atmosphere, aerosols, mid-density liquid (precipitation) and high-density liquid (clouds), respectively.
While ceilometer observations show the main aerosol layers remained aloft, the instrument's optimal sensitivity to particles over 900 nm means it has limited detection capability for smaller particles (Sundström et al., 2009). Consequently, smaller particle fractions from the plume edges, which likely reached the surface, would not be visible in the ceilometer data. This interpretation is supported by the substantial variability and elevated values observed in ground-based fine and coarse mode aerosol concentrations, which likely reflect the surface arrival of smaller particles not detected by the ceilometer. The variation of N8−1000 and N191−9300 for each plume is compared to the background conditions (Fig. 12). Across all plume periods, coarse mode particle concentrations were significantly elevated relative to BG conditions, with statistical significance confirmed by Mann-Whitney U tests (p<0.05 for all plume–background comparisons for N191−9300). The largest enhancement in N191−9300 was observed during plume 3, followed by plume 1. In contrast, N8−1000 was elevated during plumes 1 and 2, but not plume 3. The relatively stronger enhancement of coarse mode particles during plume 3, compared to plumes 1 and 2, may indicate difference in emitting fire types, i.e. smouldering vs. flaming (Virkkula et al., 2014), or greater atmospheric aging, such as photochemical oxidation and subsequent condensation of low-volatility compounds, promoting particle growth and shifting the aerosol size distribution towards larger diameters. While coagulation dominates in the early hours post-emission of plumes, photochemical aging typically unfolds over longer atmospheric residence times. Some studies report size or mass enhancements linked to secondary organic aerosol formation (Hodshire et al., 2019; Shrivastava et al., 2017), while others note mass loss from evaporation or oxidative fragmentation (Cappa et al., 2020; Reid et al., 2005). Notably, Farley et al. (2022) documented wildfire plumes with transport times of up to 10 d, during which aerosol oxygen-to-carbon () ratios and modal diameters increased, consistent with progressive aging. The coarse mode enhancement in plume 3 aligns with this aging-related growth, as reported in other multi-day transport studies. This interpretation is further supported by back-trajectory analysis using the Lagranto Lagrangian analysis tool (Sprenger and Wernli, 2015; Wernli and Davies, 1997). Back-trajectories were calculated for 120 h, using ERA5 3-hourly re-analysis data, with a starting pressure range of 750–650 hPa – chosen to represent the upper bound of the observed plume altitudes. Figure S12 shows the trajectories initiated at the plume start time, and 24 and 48 h later, providing insight into the evolution of the airmass history. For plumes 1 and 2, airmasses originated more directly from fire regions, with shorter transport times of 1–2 d. In contrast, airmasses associated with plume 3 spent more time over Quebec before crossing the Labrador Sea. Notably, some back-trajectories during plume 3 also crossed fire clusters in Western Canada as early as 5 d before reaching Narsaq (not shown). The extended transit time may have allowed for enhanced photochemical processing and continued particle growth.
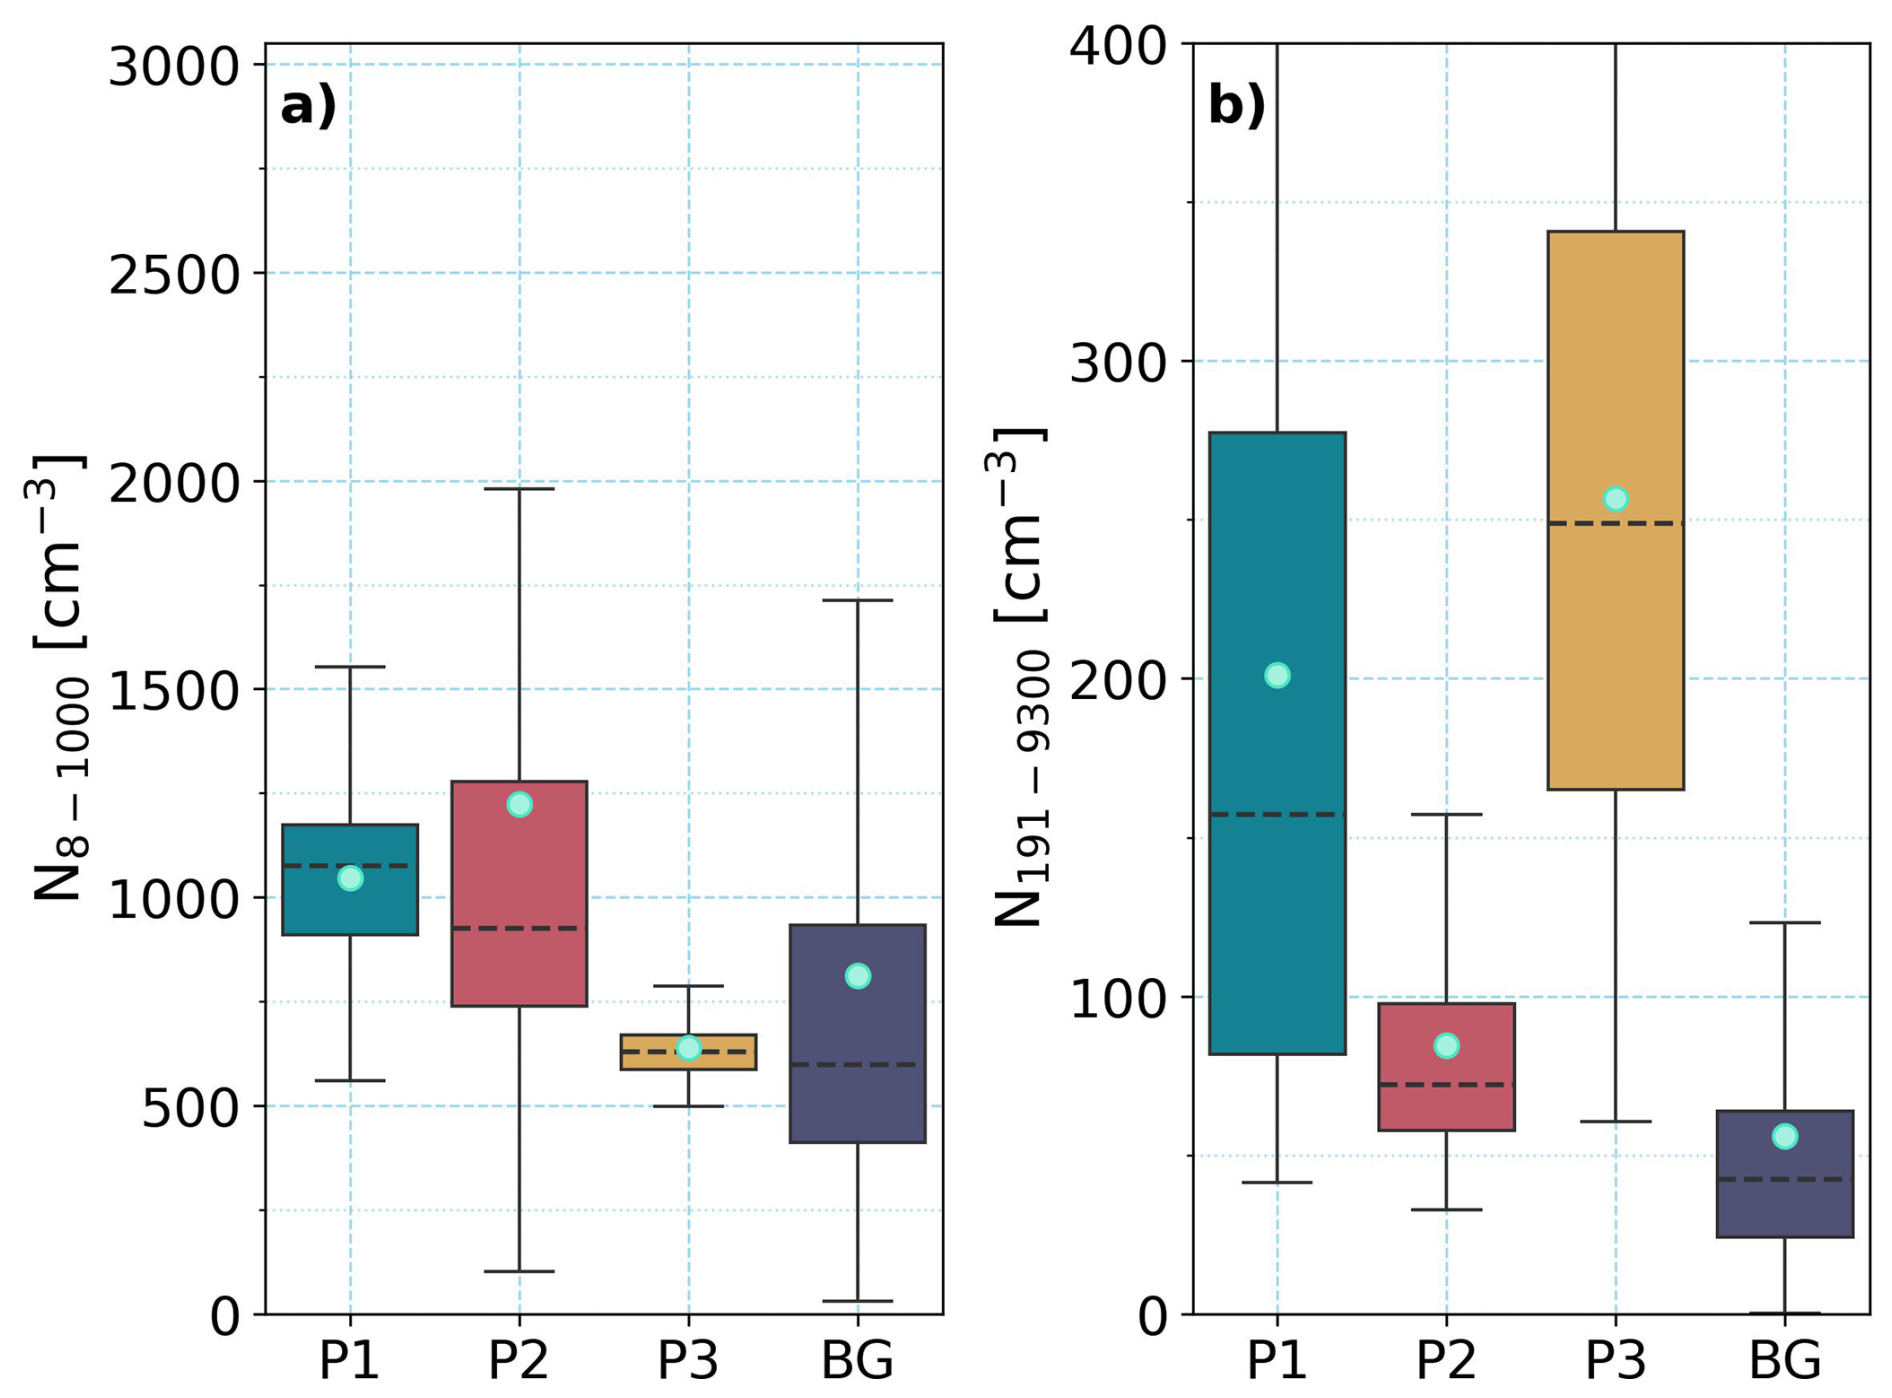
Figure 12Boxplots with median, IQR and 10th/90th percentiles showing variation in (a) total number concentration of N8−1000, and (b) N191−9300, for periods of plume 1 (P1), plume 2 (P2) and plume 3 (P3) compared to the background (BG) observations. Dots represent averages.
To better understand how these transported plumes impacted the ground-level aerosol population in Narsaq, we applied k-means clustering to the PNSDs measured during each plume period. This allowed us to characterise distinct aerosol modes associated with each plume and assess their evolution over time and with respect to the local boundary layer structure. Figure 13a–d shows the clustered PNSDs for the period of plume 1 from the ground-based SEMS measurements in comparison to the background clusters. For plume 1 four clusters were found to describe this plume on the ground: (1) a tri-modal cluster peaking in the nucleation mode at 18 nm, and twice in the Aitken mode at 48 and 75 nm (P1 c1), (2) a uni-modal cluster peaking at 77 nm (P1 c2), (3) a second uni-modal cluster peaking at 91 nm (P1 c3), and (4) a bi-modal cluster with a peak in the Aitken mode at 91 nm and a broadened peak in the accumulation mode between 100–200 nm (P1 c4). A distinct shift towards higher diameters can be seen for all clusters in comparison to the background clusters (depicted in Fig. 13a–d as the BG c1 to c3). Figure 13e shows the time series of N8−1000 with the occurrence of each cluster shaded. There is a clear evolution over time as clusters occur in successive order. There is a shift in the Aitken mode peak from 75 nm in P1 c1 to 91 nm in P1 c4, as well as the distinct concentration enhancement in accumulation mode particles in all bins >100 nm by up to a factor of ∼2.5 from c1 to c4. This observed evolution coincides with the dissipation of an elevated temperature inversion (starting at 300 m) over the course of the day (Fig. S13), suggesting that the thermodynamic structure of the atmosphere above Narsaq plays a role in the extent to which the plume can mix towards the surface.
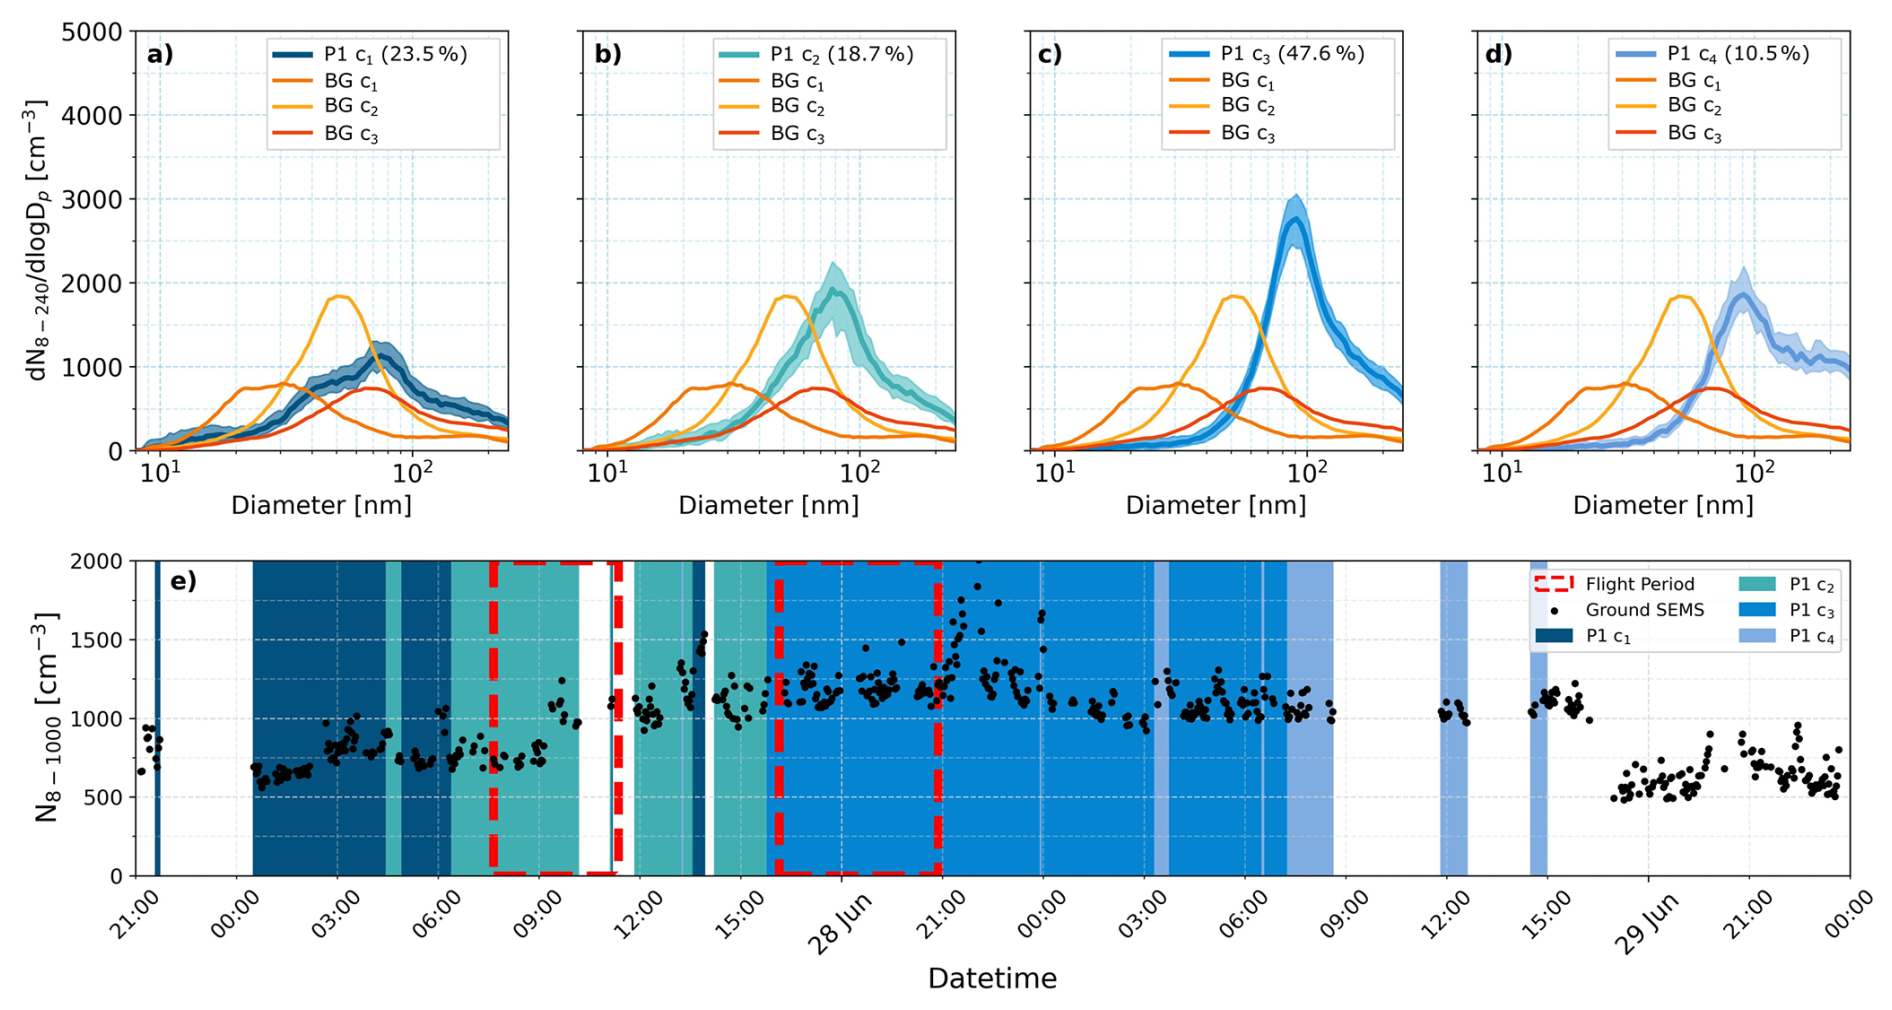
Figure 13Panels (a) to (d) show clustered PNSD at ground level covering the time period of plume 1 (blue) compared to the clean background clusters (yellow, orange and red). Median values and IQR are shown for each cluster. Panel (e) shows the time series of N8−1000 (black scatter) with the occurrence of each cluster shaded. Time periods corresponding to helikite flights are boxed in red dashes. Legend shows the percentage occurrence of each cluster in the overall category.
To investigate the vertical structure of the aerosol population per plume event and compare with the ground PNSD, k-means clustering was applied to the mSEMS data for flights occurring within a plume period. For each plume, altitude bins were chosen to best represent a section of the vertical transect, ensuring enough data points per altitude to provide reasonable statistical information. The flights during plume 1, described in this section, are the only flights where we directly measured inside a plume.
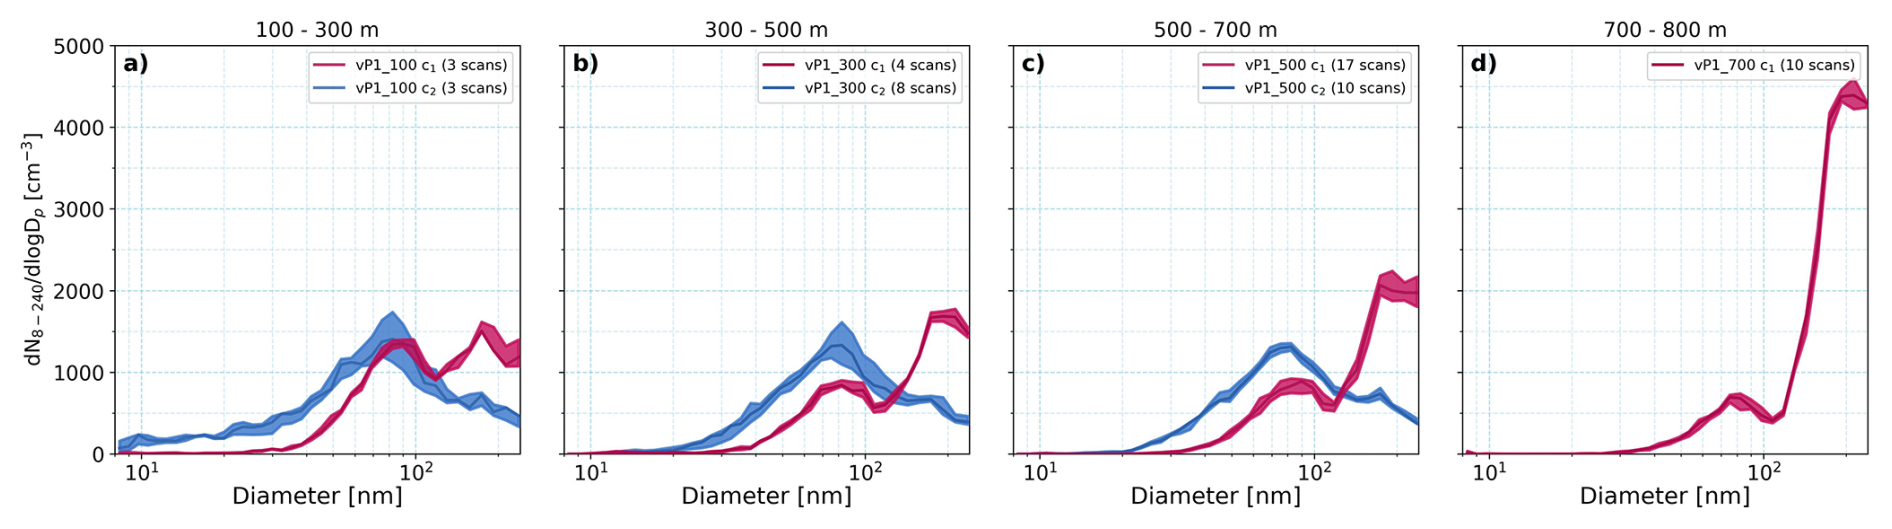
Figure 14Clustered PNSDs using mSEMS vertical measurements for altitude bins of (a) 100 to 300 m, (b) 300 to 500 m, (c) 500 to 700 m and, (d) 700 to 800 m above ground level. Median values and IQR are shown for each clustered PNSD. Legends show number of scans within each cluster.
Figure 14 shows clustered PNSDs for morning and afternoon flights during plume 1, where data from both flights were combined per altitude section. Figure S13 shows the temperature profiles between 07:39–11:22 LT and 16:08–20:52 LT. Throughout 100–300 m, a bi-modal cluster (blue, vP1100 c2) peaking at ∼82 nm in the Aitken mode and weakly at ∼170 nm in the accumulation mode, was visible and fading in occurrence up to 700 m (follow the blue cluster in Fig. 14), and was no longer present above 700 m. The altitude range of 700–800 m corresponded to when the helikite entered the lowermost boundary of the plume according to the ceilometer observations (Fig. 11). The second cluster (vP1_100 c2) is relatively similar to P1 c2 observed on the ground (Fig. 13b). This cluster (dark pink) was also bi-modal, peaking at ∼65–75 and ∼190–210 nm, and showed increasing dominance of the accumulation mode with larger proximity to the plume going upwards. This shift was accompanied by a gradual increase in Aitken mode diameter while the overall concentration in this mode decreased with each altitude bin. We expect that the vertical distribution of aerosols is affected by the elevated inversion in the morning. Results from the vertical PNSD clusters, observed with the mSEMS at higher altitudes, suggest that upward mixing of the ground-cluster, observed with the SEMS at ground level, higher than 700 m was inhibited, while the inversion did not seem to fully stop the downward mixing of plume cluster. The distinct peak >100 nm in the accumulation mode, which appears to be an indicative signature of the plume, is however not seen clearly in any of the ground clusters for this period. This is in line with the vertical observation, where the intensity of the distinct accumulation mode cluster decreases towards the ground. Within the plume itself, the accumulation mode peak is narrower and centred around 213 nm whereas below the plume this mode is closer to 170 nm and spans a wider diameter range. This is likely due to mixing of plume aerosols with other aerosol populations at lower altitudes. Plumes 2 and 3 are discussed in detail in the supplement (Sects. S7 and S8, Figs. S14–S19 in the Supplement).
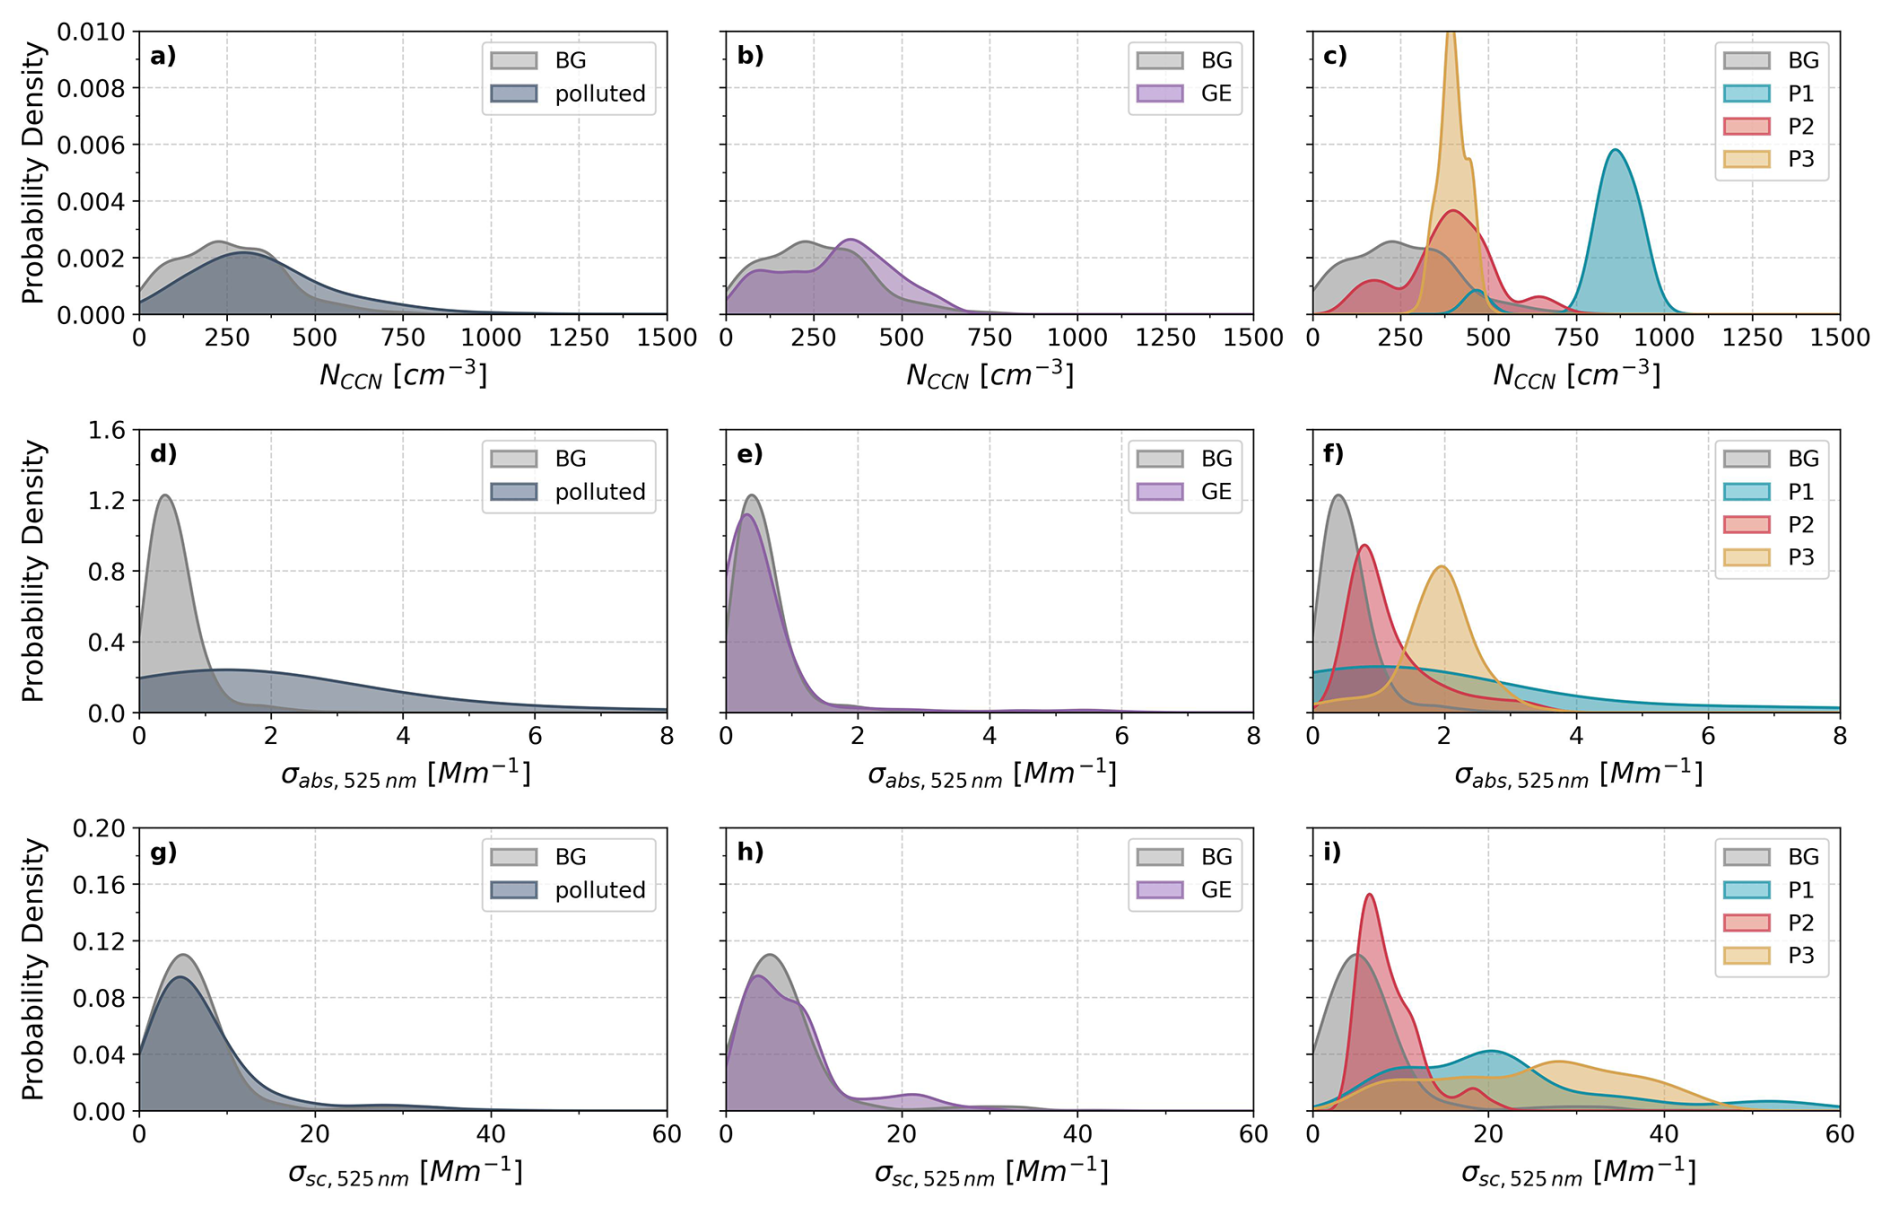
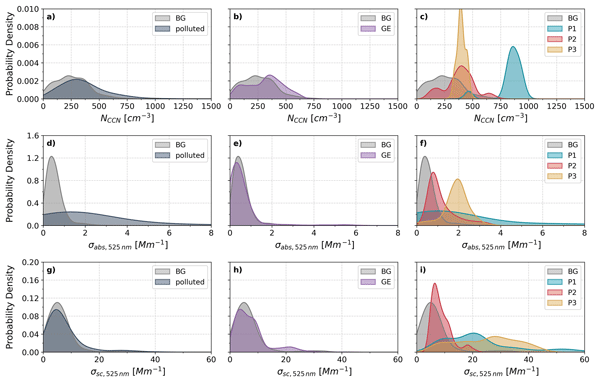
Figure 15Probability density estimates of (a–c) NCCN at 0.5 % SS, (d–f) σabs,525 nm and (g–f) σsc,525 nm for polluted (navy), growth event (purple), plume 1 (blue), plume 2 (red) and plume 3 (yellow) conditions relative to BG (grey) conditions.
3.5 Source contributions to climate relevant aerosol properties
To evaluate the influence of distinct aerosol sources on climate-relevant aerosol properties, we assessed changes in , and σsc,525 nm for the different aerosol source categories relative to background conditions (Fig. 15). We could clearly identify periods over BG (Fig. 15a–c), with increased droplet activation potential across anthropogenic emissions, particle growth events, and biomass burning sources. The variability in distribution for 0.2 % to 1 % SS is presented in Fig. S20. Among these different sources, plume 1 contributed the largest increase in NCCN, followed by plumes 2 and 3, highlighting the importance of biomass burning aerosol transport but also aging and transport history in shaping CCN activity with the three plumes showing substantial variability in both NCCN magnitude and distribution shape. This difference is likely influenced not only by the intrinsic properties of plumes, but also by their vertical position and the degree of dilution before reaching the surface. Plume 1, being closest to the ground, delivered a larger fraction of its BB aerosol directly to the measurement site, resulting in higher NCCN over this period. Plumes 2 and 3, by contrast, occurred at higher altitudes and likely experienced more dilution and mixing before reaching the surface, which could contribute to their lower NCCN despite comparable aerosol loads aloft.
Both local anthropogenic pollution and growth events slightly skew the CCN number concentration to higher values, but much less than the biomass burning plumes. For σabs,525 nm, polluted conditions display a wide variability (Fig. 15d), driven by fluctuating local emissions. Plumes 2 and 3 exhibit more distinct enhancement in σabs,525 nm, while plume 1 shows elevated absorption with a broader distribution and higher absolute values, reflecting differences in plume composition, transport history, ageing processes and fire source characteristics. Growth events do not show distinct variation from the BG distribution as expected given the hypothesis that they are a significant source of the background aerosol population and contribute non-absorbing and primarily scattering chemical compounds from low-volatility vapor condensation. Wavelength dependent absorption differences between plumes are showcased in Fig. S21. All three plumes show enhanced σsc,525 nm relative to BG (Fig. 15i), though plumes 1 and 3 display greater variability, potentially due to differences in particle size distribution or varying proportions of scattering species. In contrast, σsc,525 nm remains relatively unchanged under polluted conditions compared to BG (Fig. 15g), indicating a limited influence of short-lived local emissions on aerosol scattering properties. Growth events, however, exhibit a modest shift to larger σsc,525 nm (Fig. 15h), consistent with increased particle number concentrations. Overall, local anthropogenic emissions have the largest impact on σabs,525 nm compared to their impact on NCCN or σsc,525 nm. Growth events are similar to background observations as expected, while biomass burning particles strongly enhance all three properties, with their variability driven by differences in plume origin, altitude, transport, dilution, and composition.
In situ ground-based and tethered-balloon measurements were conducted over a six-week campaign in Narsaq, Southern Greenland, from June to August 2023, as part of the GreenFjord project (“Greenlandic Fjord Ecosystems in a Changing Climate: Socio-cultural and Environmental Interactions”). The campaign aimed to quantify the contribution of different aerosol sources to climate-relevant particle properties.
Narsaq, a small town (population ∼1300) located in a sub-Arctic fjord system, experienced an exceptionally dry summer with high solar radiation and low wind speeds. Based on aerosol characteristics and air mass origins, we classified the observations into four categories: persistent aged aerosol background conditions, local fresh anthropogenic pollution, regional particle growth events, and long-range transported biomass burning (BB) plumes from Canada. Local pollution dominated 50 % of the observation period, background conditions accounted for ∼34 %, while growth events and BB plumes each contributed ∼8 %.
Overall, number size distributions were typically Aitken-mode dominated, consistent with marine-influenced environments where new particle formation and growth play a major role (Croft et al., 2019, 2021; Gong et al., 2020; Heintzenberg et al., 2000; O'Dowd et al., 2004; Park et al., 2020). Fresh anthropogenic pollution particle number size distributions were similar to the background conditions and could not be disentangled completely due to their intermittent nature. Local pollution is likely caused by traffic and domestic activities, including residential heating powered by varied fuel sources, and therefore had a strong influence on the aerosol absorption coefficient. Biomass burning plumes, by contrast, contained aged accumulation-mode particles with enhanced NCCN, σabs,525 nm and σsc,525 nm. Particle growth events were primarily linked to marine air masses advected from the west, likely associated with biological activity during the summer bloom period. Growth events seem to be an important contributor to the background aerosol population.
Although our observations only extended down to 8 nm particle size, the presence of nucleation modes peaking above this limit indicates that new particle formation occurred upwind of Narsaq, within roughly 30 km. This estimate assumes relatively direct transport, which may not fully apply in the complex fjord terrain, where flow channelling and deflection can occur. Vertical profiles showed that growth events developed near the surface within the lower boundary layer and were partly confined by elevated temperature inversions. On several occasions, nucleation-mode particles were also observed above these inversions, suggesting that new particle formation and growth can occur at multiple altitudes.
Analysis of biomass burning plume periods revealed significant variations in aerosol concentrations, size distributions and optical properties at the ground. A distinct accumulation mode was evident throughout the vertical column, diminishing in intensity toward the surface. Ceilometer and thermodynamic data indicated that mixing of the plumes downward was limited by temperature inversions, yet ground-level perturbations in aerosol properties confirmed that transported BB aerosols influenced the surface even without full plume descent.
Both local pollution and advected BB aerosols substantially modified climate-relevant aerosol properties. Local pollution primarily enhanced the absorption coefficient, though with large temporal variability. The three BB plumes differed markedly in their microphysical and optical properties but consistently produced strong increases in median CCN number concentration (at 0.5 % SS), as well as in median absorption and scattering coefficients, by factors of between 1.7–3.7, 1.8–4.0, and 1.4–4.8, respectively. Growth events slightly shifted the probability distributions of the scattering coefficient and CCN number concentration toward higher values, while modestly reducing absorption.
These findings show that different aerosol sources exert distinct influences on particle number, size, and optical characteristics, as well as on CCN activity. Such source-specific characterization is essential for constraining aerosol–cloud–radiation interactions, particularly in rapidly changing sub-Arctic coastal regions where both climate and human activity are evolving. The pronounced impact of biomass burning aerosols is especially noteworthy given the projected increase in wildfire frequency and intensity across the boreal belt.
Data is publicly available on Zenodo at https://doi.org/10.5281/zenodo.15388080 (Alden et al., 2025a), https://doi.org/10.5281/zenodo.15386988 (Alden et al., 2025c), https://doi.org/10.5281/zenodo.15386786 (Alden et al., 2025b), https://doi.org/10.5281/zenodo.15387919 (Alden et al., 2025d), https://doi.org/10.5281/zenodo.15387706 (Alden et al., 2025e), https://doi.org/10.5281/zenodo.15387546 (Alden et al., 2025f), https://doi.org/10.5281/zenodo.15387480 (Alden et al., 2025g), https://doi.org/10.5281/zenodo.15387460 (Alden et al., 2025h), https://doi.org/10.5281/zenodo.15388013 (Bergner et al., 2025a), https://doi.org/10.5281/zenodo.15387584 (Bergner et al., 2025b), https://doi.org/10.5281/zenodo.15387340 (Bergner et al., 2025c), and https://doi.org/10.5281/zenodo.15387063 (Favre et al., 2025).
The supplement related to this article is available online at https://doi.org/10.5194/acp-26-7165-2026-supplement.
JA, NB, LF, BH, JW, MS, KV and JS took part in field campaign to collect ground-based and vertical measurements. JS conceptualized the measurements and acquired funding. JA processed and analysed ground data with support from NB and BH. JA processed and analysed helikite data. JA and JS interpreted the data and wrote the manuscript. JW, MA and PW provided their expertise on biomass burning plume content. KV, JW and PW provided the expertise with offline filter and chemical composition analysis. SH provided expertise on CCN measurements. LF provided technical support and expertise during the field campaign with both ground-based instrumentation and the helikite platform. All co-authors contributed to the editing and improvement of the manuscript.
The contact author has declared that none of the authors has any competing interests.
Publisher's note: Copernicus Publications remains neutral with regard to jurisdictional claims made in the text, published maps, institutional affiliations, or any other geographical representation in this paper. The authors bear the ultimate responsibility for providing appropriate place names. Views expressed in the text are those of the authors and do not necessarily reflect the views of the publisher.
Julia Schmale holds the Ingvar Kamprad chair for Extreme Environments Research sponsored by Ferring Pharmaceuticals. We thank the Narsaq International Research Station team, especially Lise Autogena, and the residents of Narsaq for their generosity, curiosity, and close collaboration throughout our work. We are grateful to the Kujalleq commune for their support and for granting the land-use permissions that made this research possible. We recognize that our study took place on the traditional lands of the Greenlandic people and deeply appreciate the opportunity to carry out this research in a spirit of respect and cooperation with the community. We would like to thank Jakob Pernov, Michael Lonardi, Yolanda Temel and Kathleen Alden for their contribution to multiple scientific discussions and their support of Joanna Alden for the preparation of this manuscript and the science within.
This research has been supported by the Swiss Polar Institute (grant no. SPI-FLAG-2021-002 Greenfjord), the Schweizerischer Nationalfonds zur Förderung der Wissenschaftlichen Forschung (grant no. 200021_212101), and the École Polytechnique Fédérale de Lausanne (ENAC Flagship 2022 ECO-Plains). This project has received funding from the European Union's Horizon 2020 research and innovation program under grant agreement no. 101003826 via project CRiceS (Climate Relevant interactions and feedbacks: the key role of sea ice and Snow in the polar and global climate system).
This paper was edited by Tuukka Petäjä and reviewed by two anonymous referees.
Alanen, J., Saukko, E., Lehtoranta, K., Murtonen, T., Timonen, H., Hillamo, R., Karjalainen, P., Kuuluvainen, H., Harra, J., Keskinen, J., and Rönkkö, T.: The formation and physical properties of the particle emissions from a natural gas engine, Fuel, 162, 155–161, https://doi.org/10.1016/j.fuel.2015.09.003, 2015.
Alden, J., Bergner, N., Heutte, B., Farinotti, D., Favre, L., and Schmale, J.: Meteorological data from multiple weather stations in Narsarsuaq and Narsaq, South Greenland during Greenfjord 2023, Zenodo [data set], https://doi.org/10.5281/zenodo.15388080, 2025a.
Alden, J., Bergner, N., Heutte, B., Weng, J., Violaki, K., Favre, L., Henning, S., and Schmale, J.: Cloud Condensation Nuclei measurements in summertime in Narsaq, South Greenland during Greenfjord 2023, Zenodo [data set], https://doi.org/10.5281/zenodo.15386786, 2025b.
Alden, J., Bergner, N., Heutte, B., Weng, J., Violaki, K., Favre, L., and Schmale, J.: Scanning Electrical Mobility Spectrometer (SEMS) measurements of aerosol particle number concentration and size distribution in summertime in Narsaq, South Greenland during Greenfjord 2023, Zenodo [data set], https://doi.org/10.5281/zenodo.15386988, 2025c.
Alden, J., Bergner, N., Heutte, B., Weng, J., Violaki, K., Favre, L., and Schmale, J.: Single-Channel Tricolour Absorption Photometer (STAP) measurements of aerosol absorption coefficients in summertime in Narsaq, South Greenland during Greenfjord 2023, Zenodo [data set], https://doi.org/10.5281/zenodo.15387919, 2025d.
Alden, J., Bergner, N., Heutte, B., Weng, J., Violaki, K., Favre, L., and Schmale, J.: Ozone (O3) measurements in summertime in Narsaq, South Greenland during Greenfjord 2023, Zenodo [data set], https://doi.org/10.5281/zenodo.15387706, 2025e.
Alden, J., Bergner, N., Heutte, B., Weng, J., Violaki, K., Favre, L., and Schmale, J.: Equivalent Black Carbon (eBC) mass concentrations in summertime in Narsaq, South Greenland during Greenfjord 2023, Zenodo [data set], https://doi.org/10.5281/zenodo.15387546, 2025f.
Alden, J., Bergner, N., Heutte, B., Favre, L., Weng, J., Violaki, K., and Schmale, J.: Vertical aerosol, trace gas and weather data taken with a tethered balloon system in summertime in Narsaq, South Greenland during Greenfjord 2023, Zenodo [data set], https://doi.org/10.5281/zenodo.15387480, 2025g.
Alden, J., Bergner, N., Heutte, B., Weng, J., Violaki, K., Favre, L., and Schmale, J.: Carbon monoxide (CO) measurements in summertime in Narsaq, South Greenland during Greenfjord 2023, Zenodo [data set], https://doi.org/10.5281/zenodo.15387460, 2025h.
Arrigo, K. R., van Dijken, G. L., Castelao, R. M., Luo, H., Rennermalm, Å. K., Tedesco, M., Mote, T. L., Oliver, H., and Yager, P. L.: Melting glaciers stimulate large summer phytoplankton blooms in southwest Greenland waters, Geophys. Res. Lett., 44, 6278–6285, https://doi.org/10.1002/2017GL073583, 2017.
Bächler, P., Müller, T. K., Warth, T., Yildiz, T., and Dittler, A.: Impact of ambient air filters on PM concentration levels at an urban traffic hotspot (Stuttgart, Am Neckartor), Atmos. Pollut. Res., 12, 101059, https://doi.org/10.1016/j.apr.2021.101059, 2021.
Bamber, J., Van Den Broeke, M., Ettema, J., Lenaerts, J., and Rignot, E.: Recent large increases in freshwater fluxes from Greenland into the North Atlantic, Geophys. Res. Lett., 39, 2012GL052552, https://doi.org/10.1029/2012GL052552, 2012.
Bates, T. S., Quinn, P. K., Johnson, J. E., Corless, A., Brechtel, F. J., Stalin, S. E., Meinig, C., and Burkhart, J. F.: Measurements of atmospheric aerosol vertical distributions above Svalbard, Norway, using unmanned aerial systems (UAS), Atmos. Meas. Tech., 6, 2115–2120, https://doi.org/10.5194/amt-6-2115-2013, 2013.
Beck, I., Angot, H., Baccarini, A., Dada, L., Quéléver, L., Jokinen, T., Laurila, T., Lampimäki, M., Bukowiecki, N., Boyer, M., Gong, X., Gysel-Beer, M., Petäjä, T., Wang, J., and Schmale, J.: Automated identification of local contamination in remote atmospheric composition time series, Atmos. Meas. Tech., 15, 4195–4224, https://doi.org/10.5194/amt-15-4195-2022, 2022.
Beck, I., Moallemi, A., Heutte, B., Pernov, J. B., Bergner, N., Rolo, M., Quéléver, L. L. J., Laurila, T., Boyer, M., Jokinen, T., Angot, H., Hoppe, C. J. M., Müller, O., Creamean, J., Frey, M. M., Freitas, G., Zinke, J., Salter, M., Zieger, P., Mirrielees, J. A., Kempf, H. E., Ault, A. P., Pratt, K. A., Gysel-Beer, M., Henning, S., Tatzelt, C., and Schmale, J.: Characteristics and sources of fluorescent aerosols in the central Arctic Ocean, Elem. Sci. Anth., 12, 00125, https://doi.org/10.1525/elementa.2023.00125, 2024.
Beck, L. J., Sarnela, N., Junninen, H., Hoppe, C. J. M., Garmash, O., Bianchi, F., Riva, M., Rose, C., Peräkylä, O., Wimmer, D., Kausiala, O., Jokinen, T., Ahonen, L., Mikkilä, J., Hakala, J., He, X.-C., Kontkanen, J., Wolf, K. K. E., Cappelletti, D., Mazzola, M., Traversi, R., Petroselli, C., Viola, A. P., Vitale, V., Lange, R., Massling, A., Nøjgaard, J. K., Krejci, R., Karlsson, L., Zieger, P., Jang, S., Lee, K., Vakkari, V., Lampilahti, J., Thakur, R. C., Leino, K., Kangasluoma, J., Duplissy, E.-M., Siivola, E., Marbouti, M., Tham, Y. J., Saiz-Lopez, A., Petäjä, T., Ehn, M., Worsnop, D. R., Skov, H., Kulmala, M., Kerminen, V.-M., and Sipilä, M.: Differing mechanisms of new particle formation at two Arctic sites., Geophys. Res. Lett., 48, e2020GL091334, https://doi.org/10.1029/2020GL091334, 2020.
Beddows, D. C. S., Dall'Osto, M., and Harrison, R. M.: Cluster Analysis of Rural, Urban, and Curbside Atmospheric Particle Size Data, Environ. Sci. Technol., 43, 4694–4700, https://doi.org/10.1021/es803121t, 2009.
Bergner, N., Alden, J., Heutte, B., Favre, L., Farinotti, D., and Schmale, J.: Portable Optical Particle Sizer (POPS) measurements of aerosol particle number concentration and size distribution in summertime in Narsarsuaq and Narsaq, South Greenland during Greenfjord 2023, Zenodo [data set], https://doi.org/10.5281/zenodo.15388013, 2025a.
Bergner, N., Alden, J., Heutte, B., Weng, J., Violaki, K., Favre, L., and Schmale, J.: Nephelometer measurements of aerosol particle scattering and backscattering coefficients in summertime in Narsaq, South Greenland during Greenfjord 2023, Zenodo [data set], https://doi.org/10.5281/zenodo.15387584, 2025b.
Bergner, N., Alden, J., Heutte, B., Weng, J., Violaki, K., Favre, L., and Schmale, J.: Fidas measurements of total aerosol number concentration and number size distributions in summertime in Narsaq, South Greenland during Greenfjord 2023, Zenodo [data set], https://doi.org/10.5281/zenodo.15387340, 2025c.
Böning, C. W., Behrens, E., Biastoch, A., Getzlaff, K., and Bamber, J. L.: Emerging impact of Greenland meltwater on deepwater formation in the North Atlantic Ocean, Nat. Geosci., 9, 523–527, https://doi.org/10.1038/ngeo2740, 2016.
Boyer, M., Aliaga, D., Pernov, J. B., Angot, H., Quéléver, L. L. J., Dada, L., Heutte, B., Dall'Osto, M., Beddows, D. C. S., Brasseur, Z., Beck, I., Bucci, S., Duetsch, M., Stohl, A., Laurila, T., Asmi, E., Massling, A., Thomas, D. C., Nøjgaard, J. K., Chan, T., Sharma, S., Tunved, P., Krejci, R., Hansson, H. C., Bianchi, F., Lehtipalo, K., Wiedensohler, A., Weinhold, K., Kulmala, M., Petäjä, T., Sipilä, M., Schmale, J., and Jokinen, T.: A full year of aerosol size distribution data from the central Arctic under an extreme positive Arctic Oscillation: insights from the Multidisciplinary drifting Observatory for the Study of Arctic Climate (MOSAiC) expedition, Atmos. Chem. Phys., 23, 389–415, https://doi.org/10.5194/acp-23-389-2023, 2023.
Brechtel, F. J.: Compact Nanoparticle Size Distribution Measurement System for Unmanned Aerial Systems (UAS), Brechtel Manufacturing Incorporated, https://doi.org/10.2172/1371927, 2017.
Brechtel Manufacturing Inc.: Brechtel SEMS 2100 Instrument Manual, Brechtel Manufacturing Inc., https://www.brechtel.com/wp-content/uploads/2021/08/bmi_model_2100_SEMS_manual_v3.1.pdf (last access: 20 October 2025), 2021.
Brus, D., Gustafsson, J., Vakkari, V., Kemppinen, O., de Boer, G., and Hirsikko, A.: Measurement report: Properties of aerosol and gases in the vertical profile during the LAPSE-RATE campaign, Atmos. Chem. Phys., 21, 517–533, https://doi.org/10.5194/acp-21-517-2021, 2021.
Cappa, C. D., Lim, C. Y., Hagan, D. H., Coggon, M., Koss, A., Sekimoto, K., de Gouw, J., Onasch, T. B., Warneke, C., and Kroll, J. H.: Biomass-burning-derived particles from a wide variety of fuels – Part 2: Effects of photochemical aging on particle optical and chemical properties, Atmos. Chem. Phys., 20, 8511–8532, https://doi.org/10.5194/acp-20-8511-2020, 2020.
Croft, B., Martin, R. V., Leaitch, W. R., Burkart, J., Chang, R. Y.-W., Collins, D. B., Hayes, P. L., Hodshire, A. L., Huang, L., Kodros, J. K., Moravek, A., Mungall, E. L., Murphy, J. G., Sharma, S., Tremblay, S., Wentworth, G. R., Willis, M. D., Abbatt, J. P. D., and Pierce, J. R.: Arctic marine secondary organic aerosol contributes significantly to summertime particle size distributions in the Canadian Arctic Archipelago, Atmos. Chem. Phys., 19, 2787–2812, https://doi.org/10.5194/acp-19-2787-2019, 2019.
Croft, B., Martin, R. V., Moore, R. H., Ziemba, L. D., Crosbie, E. C., Liu, H., Russell, L. M., Saliba, G., Wisthaler, A., Müller, M., Schiller, A., Galí, M., Chang, R. Y.-W., McDuffie, E. E., Bilsback, K. R., and Pierce, J. R.: Factors controlling marine aerosol size distributions and their climate effects over the northwest Atlantic Ocean region, Atmos. Chem. Phys., 21, 1889–1916, https://doi.org/10.5194/acp-21-1889-2021, 2021.
Dall'Osto, M., Ceburnis, D., Martucci, G., Bialek, J., Dupuy, R., Jennings, S. G., Berresheim, H., Wenger, J., Healy, R., Facchini, M. C., Rinaldi, M., Giulianelli, L., Finessi, E., Worsnop, D., Ehn, M., Mikkilä, J., Kulmala, M., and O'Dowd, C. D.: Aerosol properties associated with air masses arriving into the North East Atlantic during the 2008 Mace Head EUCAARI intensive observing period: an overview, Atmos. Chem. Phys., 10, 8413–8435, https://doi.org/10.5194/acp-10-8413-2010, 2010.
Dall'Osto, M., Geels, C., Beddows, D. C. S., Boertmann, D., Lange, R., Nøjgaard, J. K., Harrison, Roy. M., Simo, R., Skov, H., and Massling, A.: Regions of open water and melting sea ice drive new particle formation in North East Greenland, Sci. Rep., 8, 6109, https://doi.org/10.1038/s41598-018-24426-8, 2018.
Dibb, J. E., Talbot, R. W., Whitlow, S. I., Shipham, M. C., Winterle, J., McConnell, J., and Bales, R.: Biomass burning signatures in the atmosphere and snow at Summit, Greenland: An event on 5 August 1994, Atmos. Environ., 30, 553–561, https://doi.org/10.1016/1352-2310(95)00328-2, 1996.
Dombrowski, O., Hendricks Franssen, H.-J., Brogi, C., and Bogena, H. R.: Performance of the ATMOS41 All-in-One Weather Station for Weather Monitoring, Sensors, 21, 741, https://doi.org/10.3390/s21030741, 2021.
Düsing, S., Wehner, B., Müller, T., Stöcker, A., and Wiedensohler, A.: The effect of rapid relative humidity changes on fast filter-based aerosol-particle light-absorption measurements: uncertainties and correction schemes, Atmos. Meas. Tech., 12, 5879–5895, https://doi.org/10.5194/amt-12-5879-2019, 2019.
Fahlgren, C., Gómez-Consarnau, L., Zábori, J., Lindh, M. V., Krejci, R., Mårtensson, E. M., Nilsson, D., and Pinhassi, J.: Seawater mesocosm experiments in the Arctic uncover differential transfer of marine bacteria to aerosols, Env. Microbiol. Rep., 7, 460–470, https://doi.org/10.1111/1758-2229.12273, 2015.
Fan, J., Wang, Y., Rosenfeld, D., and Liu, X.: Review of aerosol–cloud interactions: Mechanisms, significance, and challenges, J. Atmos. Sci., 73, 4221–4252, 2016.
Fang, G.-C., Peng, Y.-P., Kao, C.-L., and Zhuang, Y.-J.: Measurements of ambient air fine (PM=2.5) and coarse (PM>2.5) particulates concentrations by using of a dust monitoring system, Environ. Forensics, 24, 1–8, https://doi.org/10.1080/15275922.2021.1940377, 2023.
Farley, R., Bernays, N., Jaffe, D. A., Ketcherside, D., Hu, L., Zhou, S., Collier, S., and Zhang, Q.: Persistent Influence of Wildfire Emissions in the Western United States and Characteristics of Aged Biomass Burning Organic Aerosols under Clean Air Conditions, Environ. Sci. Technol., 56, 3645–3657, https://doi.org/10.1021/acs.est.1c07301, 2022.
Favre, L., Heutte, B., Alden, J., Bergner, N., and Schmale, J.: Lidar ceilometer (CL61) measurements of attenuated backscatter coefficient and linear depolarisation ratio in summertime in Narsaq, South Greenland during Greenfjord 2023, Zenodo [data set], https://doi.org/10.5281/zenodo.15387063, 2025.
Feltracco, M., Barbaro, E., Hoppe, C. J. M., Wolf, K. K. E., Spolaor, A., Layton, R., Keuschnig, C., Barbante, C., Gambaro, A., and Larose, C.: Airborne bacteria and particulate chemistry capture Phytoplankton bloom dynamics in an Arctic fjord, Atmos. Environ., 256, 118458, https://doi.org/10.1016/j.atmosenv.2021.118458, 2021.
Flannigan, M. D., Amiro, B. D., Logan, K. A., Stocks, B. J., and Wotton, B. M.: Forest Fires and Climate Change in the 21ST Century, Mitig. Adapt. Strat. Glob. Change, 11, 847–859, https://doi.org/10.1007/s11027-005-9020-7, 2006.
Gabey, A. M., Gallagher, M. W., Whitehead, J., Dorsey, J. R., Kaye, P. H., and Stanley, W. R.: Measurements and comparison of primary biological aerosol above and below a tropical forest canopy using a dual channel fluorescence spectrometer, Atmos. Chem. Phys., 10, 4453–4466, https://doi.org/10.5194/acp-10-4453-2010, 2010.
Gao, R. S., Telg, H., McLaughlin, R. J., Ciciora, S. J., Watts, L. A., Richardson, M. S., Schwarz, J. P., Perring, A. E., Thornberry, T. D., Rollins, A. W., Markovic, M. Z., Bates, T. S., Johnson, J. E., and Fahey, D. W.: A light-weight, high-sensitivity particle spectrometer for PM2.5 aerosol measurements, Aerosol Sci. Technol., 50, 88–99, https://doi.org/10.1080/02786826.2015.1131809, 2016.
Gong, X., Wex, H., Voigtländer, J., Fomba, K. W., Weinhold, K., van Pinxteren, M., Henning, S., Müller, T., Herrmann, H., and Stratmann, F.: Characterization of aerosol particles at Cabo Verde close to sea level and at the cloud level – Part 1: Particle number size distribution, cloud condensation nuclei and their origins , Atmos. Chem. Phys., 20, 1431–1449, https://doi.org/10.5194/acp-20-1431-2020, 2020.
Gramlich, Y., Siegel, K., Haslett, S. L., Cremer, R. S., Lunder, C., Kommula, S. M., Buchholz, A., Yttri, K. E., Chen, G., Krejci, R., Zieger, P., Virtanen, A., Riipinen, I., and Mohr, C.: Impact of Biomass Burning on Arctic Aerosol Composition, ACS Earth Space Chem., 8, 920–936, https://doi.org/10.1021/acsearthspacechem.3c00187, 2024.
Gysel, M. J. and Stratmann, F.: WP3 – NA3: In-situ chemical, physical and optical properties of aerosols, Deliverable D3.11: Standardized protocol for CCN measurements, Tech. rep., 2013.
Heintzenberg, J., Covert, D. C., and Dingenen, R. V.: Size distribution and chemical composition of marine aerosols: a compilation and review, Tellus B, 52, 1104–1122, https://doi.org/10.3402/tellusb.v52i4.17090, 2000.
Heutte, B., Bergner, N., Angot, H., Pernov, J. B., Dada, L., Mirrielees, J. A., Beck, I., Baccarini, A., Boyer, M., Creamean, J. M., Daellenbach, K. R., El Haddad, I., Frey, M. M., Henning, S., Laurila, T., Moschos, V., Petäjä, T., Pratt, K. A., Quéléver, L. L. J., Shupe, M. D., Zieger, P., Jokinen, T., and Schmale, J.: Observations of high-time-resolution and size-resolved aerosol chemical composition and microphysics in the central Arctic: implications for climate-relevant particle properties, Atmos. Chem. Phys., 25, 2207–2241, https://doi.org/10.5194/acp-25-2207-2025, 2025.
Hodshire, A. L., Bian, Q., Ramnarine, E., Lonsdale, C. R., Alvarado, M. J., Kreidenweis, S. M., Jathar, S. H., and Pierce, J. R.: More Than Emissions and Chemistry: Fire Size, Dilution, and Background Aerosol Also Greatly Influence Near-Field Biomass Burning Aerosol Aging, J. Geophys. Res.-Atmos., 124, 5589–5611, https://doi.org/10.1029/2018JD029674, 2019.
Hofer, S., Tedstone, A. J., Fettweis, X., and Bamber, J. L.: Cloud microphysics and circulation anomalies control differences in future Greenland melt, Nat. Clim. Chang., 9, 523–528, https://doi.org/10.1038/s41558-019-0507-8, 2019.
Holding, J. M., Markager, S., Juul-Pedersen, T., Paulsen, M. L., Møller, E. F., Meire, L., and Sejr, M. K.: Seasonal and spatial patterns of primary production in a high-latitude fjord affected by Greenland Ice Sheet run-off, Biogeosciences, 16, 3777–3792, https://doi.org/10.5194/bg-16-3777-2019, 2019.
Johnson, T., Capel, J., and Ollison, W.: Measurement of microenvironmental ozone concentrations in Durham, North Carolina, using a 2B Technologies 205 Federal Equivalent Method monitor and an interference-free 2B Technologies 211 monitor, J. Air Waste Manage., 64, 360–371, https://doi.org/10.1080/10962247.2013.839968, 2014.
Juul-Pedersen, T., Arendt, K., Mortensen, J., Blicher, M., Søgaard, D., and Rysgaard, S.: Seasonal and interannual phytoplankton production in a sub-Arctic tidewater outlet glacier fjord, SW Greenland, Mar. Ecol. Prog. Ser., 524, 27–38, https://doi.org/10.3354/meps11174, 2015.
Kerminen, V.-M., Chen, X., Vakkari, V., Petäjä, T., Kulmala, M., and Bianchi, F.: Atmospheric new particle formation and growth: review of field observations, Environ. Res. Lett., 13, 103003, https://doi.org/10.1088/1748-9326/aadf3c, 2018.
Kirchmeier-Young, M. C., Zwiers, F. W., Gillett, N. P., and Cannon, A. J.: Attributing extreme fire risk in Western Canada to human emissions, Clim. Change, 144, 365–379, https://doi.org/10.1007/s10584-017-2030-0, 2017.
Kommula, S. M., Buchholz, A., Gramlich, Y., Mielonen, T., Hao, L., Pullinen, I., Vettikkat, L., Ylisirniö, A., Joutsensaari, J., Schobesberger, S., Tiitta, P., Leskinen, A., Rees, D. H.-, Haslett, S. L., Siegel, K., Lunder, C., Zieger, P., Krejci, R., Romakkaniemi, S., Mohr, C., and Virtanen, A.: Effect of Long-Range Transported Fire Aerosols on Cloud Condensation Nuclei Concentrations and Cloud Properties at High Latitudes, Geophys. Res. Lett., 51, e2023GL107134, https://doi.org/10.1029/2023GL107134, 2024.
Liu, X., Hadiatullah, H., Zhang, X., Hill, L. D., White, A. H. A., Schnelle-Kreis, J., Bendl, J., Jakobi, G., Schloter-Hai, B., and Zimmermann, R.: Analysis of mobile monitoring data from the microAeth® MA200 for measuring changes in black carbon on the roadside in Augsburg, Atmos. Meas. Tech., 14, 5139–5151, https://doi.org/10.5194/amt-14-5139-2021, 2021a.
Liu, Z., Osborne, M., Anderson, K., Shutler, J. D., Wilson, A., Langridge, J., Yim, S. H. L., Coe, H., Babu, S., Satheesh, S. K., Zuidema, P., Huang, T., Cheng, J. C. H., and Haywood, J.: Characterizing the performance of a POPS miniaturized optical particle counter when operated on a quadcopter drone, Atmos. Meas. Tech., 14, 6101–6118, https://doi.org/10.5194/amt-14-6101-2021, 2021b.
Lloyd, S.: Least squares quantization in PCM, IEEE Trans. Inform. Theory, 28, 129–137, https://doi.org/10.1109/TIT.1982.1056489, 1982.
Lorek, A. and Garland, S. P.: Humidity measurements in carbon dioxide with Sensirion SHT85 humidity sensors under simulated Martian atmospheric conditions, Geosci. Instrum. Method. Data Syst., 14, 131–138, https://doi.org/10.5194/gi-14-131-2025, 2025.
Marple, V. A., Rubow, K. L., and Behm, S. M.: A Microorifice Uniform Deposit Impactor (MOUDI): Description, Calibration, and Use, Aerosol Sci. Technol., 14, 434–446, https://doi.org/10.1080/02786829108959504, 1991.
Mei, H., Han, P., Wang, Y., Zeng, N., Liu, D., Cai, Q., Deng, Z., Wang, Y., Pan, Y., and Tang, X.: Field Evaluation of Low-Cost Particulate Matter Sensors in Beijing, Sensors, 20, 4381, https://doi.org/10.3390/s20164381, 2020.
Meire, L., Søgaard, D. H., Mortensen, J., Meysman, F. J. R., Soetaert, K., Arendt, K. E., Juul-Pedersen, T., Blicher, M. E., and Rysgaard, S.: Glacial meltwater and primary production are drivers of strong CO2 uptake in fjord and coastal waters adjacent to the Greenland Ice Sheet, Biogeosciences, 12, 2347–2363, https://doi.org/10.5194/bg-12-2347-2015, 2015.
Meire, L., Meire, P., Struyf, E., Krawczyk, D. W., Arendt, K. E., Yde, J. C., Juul Pedersen, T., Hopwood, M. J., Rysgaard, S., and Meysman, F. J. R.: High export of dissolved silica from the Greenland Ice Sheet, Geophys. Res. Lett., 43, 9173–9182, https://doi.org/10.1002/2016GL070191, 2016.
Meire, L., Mortensen, J., Meire, P., Juul-Pedersen, T., Sejr, M. K., Rysgaard, S., Nygaard, R., Huybrechts, P., and Meysman, F. J. R.: Marine-terminating glaciers sustain high productivity in Greenland fjords, Glob. Change Biol., 23, 5344–5357, https://doi.org/10.1111/gcb.13801, 2017.
Meire, L., Paulsen, M. L., Meire, P., Rysgaard, S., Hopwood, M. J., Sejr, M. K., Stuart-Lee, A., Sabbe, K., Stock, W., and Mortensen, J.: Glacier retreat alters downstream fjord ecosystem structure and function in Greenland, Nat. Geosci., 16, 671–674, 2023.
Morissette, L. and Chartier, S.: The k-means clustering technique: General considerations and implementation in Mathematica, TQMP, 9, 15–24, https://doi.org/10.20982/tqmp.09.1.p015, 2013.
Mortensen, J., Bendtsen, J., Motyka, R. J., Lennert, K., Truffer, M., Fahnestock, M., and Rysgaard, S.: On the seasonal freshwater stratification in the proximity of fast-flowing tidewater outlet glaciers in a sub-Arctic sill fjord, J. Geophys. Res.-Oceans, 118, 1382–1395, https://doi.org/10.1002/jgrc.20134, 2013.
Mortensen, J., Bendtsen, J., Lennert, K., and Rysgaard, S.: Seasonal variability of the circulation system in a west Greenland tidewater outlet glacier fjord, Godthåbsfjord (64° N): Godthåbsfjord, J. Geophys. Res.-Earth Surf., 119, 2591–2603, https://doi.org/10.1002/2014JF003267, 2014.
Müller, T., Laborde, M., Kassell, G., and Wiedensohler, A.: Design and performance of a three-wavelength LED-based total scatter and backscatter integrating nephelometer, Atmos. Meas. Tech., 4, 1291–1303, https://doi.org/10.5194/amt-4-1291-2011, 2011.
Nguyen, Q. T., Glasius, M., Sørensen, L. L., Jensen, B., Skov, H., Birmili, W., Wiedensohler, A., Kristensson, A., Nøjgaard, J. K., and Massling, A.: Seasonal variation of atmospheric particle number concentrations, new particle formation and atmospheric oxidation capacity at the high Arctic site Villum Research Station, Station Nord, Atmos. Chem. Phys., 16, 11319–11336, https://doi.org/10.5194/acp-16-11319-2016, 2016.
Niwano, M., Hashimoto, A., and Aoki, T.: Cloud-driven modulations of Greenland ice sheet surface melt, Sci. Rep., 9, 10380, https://doi.org/10.1038/s41598-019-46152-5, 2019.
O'Dowd, C. D., Facchini, M. C., Cavalli, F., Ceburnis, D., Mircea, M., Decesari, S., Fuzzi, S., Yoon, Y. J., and Putaud, J.-P.: Biogenically driven organic contribution to marine aerosol, Nature, 431, 676–680, 2004.
Ogren, J. A.: Comment on “Calibration and Intercomparison of Filter-Based Measurements of Visible Light Absorption by Aerosols,” Aerosol Sci. Technol., 44, 589–591, https://doi.org/10.1080/02786826.2010.482111, 2010.
Oksman, M., Kvorning, A. B., Larsen, S. H., Kjeldsen, K. K., Mankoff, K. D., Colgan, W., Andersen, T. J., Nørgaard-Pedersen, N., Seidenkrantz, M.-S., Mikkelsen, N., and Ribeiro, S.: Impact of freshwater runoff from the southwest Greenland Ice Sheet on fjord productivity since the late 19th century, The Cryosphere, 16, 2471–2491, https://doi.org/10.5194/tc-16-2471-2022, 2022.
Park, J., Dall'Osto, M., Park, K., Gim, Y., Kang, H. J., Jang, E., Park, K.-T., Park, M., Yum, S. S., Jung, J., Lee, B. Y., and Yoon, Y. J.: Shipborne observations reveal contrasting Arctic marine, Arctic terrestrial and Pacific marine aerosol properties, Atmos. Chem. Phys., 20, 5573–5590, https://doi.org/10.5194/acp-20-5573-2020, 2020.
Pernov, J. B., Beddows, D., Thomas, D. C., Dall'Osto, M., Harrison, R. M., Schmale, J., Skov, H., and Massling, A.: Increased aerosol concentrations in the High Arctic attributable to changing atmospheric transport patterns, npj Clim. Atmos. Sci., 5, 62, https://doi.org/10.1038/s41612-022-00286-y, 2022.
Pikridas, M., Bezantakos, S., Močnik, G., Keleshis, C., Brechtel, F., Stavroulas, I., Demetriades, G., Antoniou, P., Vouterakos, P., Argyrides, M., Liakakou, E., Drinovec, L., Marinou, E., Amiridis, V., Vrekoussis, M., Mihalopoulos, N., and Sciare, J.: On-flight intercomparison of three miniature aerosol absorption sensors using unmanned aerial systems (UASs), Atmos. Meas. Tech., 12, 6425–6447, https://doi.org/10.5194/amt-12-6425-2019, 2019.
Pilz, C., Düsing, S., Wehner, B., Müller, T., Siebert, H., Voigtländer, J., and Lonardi, M.: CAMP: an instrumented platform for balloon-borne aerosol particle studies in the lower atmosphere, Atmos. Meas. Tech., 15, 6889–6905, https://doi.org/10.5194/amt-15-6889-2022, 2022.
Pohorsky, R., Baccarini, A., Tolu, J., Winkel, L. H. E., and Schmale, J.: Modular Multiplatform Compatible Air Measurement System (MoMuCAMS): a new modular platform for boundary layer aerosol and trace gas vertical measurements in extreme environments, Atmos. Meas. Tech., 17, 731–754, https://doi.org/10.5194/amt-17-731-2024, 2024.
Quennehen, B., Schwarzenboeck, A., Schmale, J., Schneider, J., Sodemann, H., Stohl, A., Ancellet, G., Crumeyrolle, S., and Law, K. S.: Physical and chemical properties of pollution aerosol particles transported from North America to Greenland as measured during the POLARCAT summer campaign, Atmos. Chem. Phys., 11, 10947–10963, https://doi.org/10.5194/acp-11-10947-2011, 2011.
Reid, J. S., Koppmann, R., Eck, T. F., and Eleuterio, D. P.: A review of biomass burning emissions part II: intensive physical properties of biomass burning particles, Atmos. Chem. Phys., 5, 799–825, https://doi.org/10.5194/acp-5-799-2005, 2005.
Roberts, G. C. and Nenes, A.: A Continuous-Flow Streamwise Thermal-Gradient CCN Chamber for Atmospheric Measurements, Aerosol Sci. Technol., 39, 206–221, https://doi.org/10.1080/027868290913988, 2005.
Rönkkö, T. and Timonen, H.: Overview of Sources and Characteristics of Nanoparticles in Urban Traffic-Influenced Areas, JAD, 72, 15–28, https://doi.org/10.3233/JAD-190170, 2019.
Rönkkö, T., Virtanen, A., Vaaraslahti, K., Keskinen, J., Pirjola, L., and Lappi, M.: Effect of dilution conditions and driving parameters on nucleation mode particles in diesel exhaust: Laboratory and on-road study, Atmos. Environ., 40, 2893–2901, https://doi.org/10.1016/j.atmosenv.2006.01.002, 2006.
Rose, D., Gunthe, S. S., Mikhailov, E., Frank, G. P., Dusek, U., Andreae, M. O., and Pöschl, U.: Calibration and measurement uncertainties of a continuous-flow cloud condensation nuclei counter (DMT-CCNC): CCN activation of ammonium sulfate and sodium chloride aerosol particles in theory and experiment, Atmos. Chem. Phys., 8, 1153–1179, https://doi.org/10.5194/acp-8-1153-2008, 2008.
Rousseeuw, P. J.: Silhouettes: A graphical aid to the interpretation and validation of cluster analysis, J. Comput. Appl. Math., 20, 53–65, https://doi.org/10.1016/0377-0427(87)90125-7, 1987.
Ryan, J. C.: Contribution of surface and cloud radiative feedbacks to Greenland Ice Sheet meltwater production during 2002–2023, Commun. Earth. Environ., 5, 538, https://doi.org/10.1038/s43247-024-01714-y, 2024.
Ryan, J. C., Smith, L. C., Cooley, S. W., Pearson, B., Wever, N., Keenan, E., and Lenaerts, J. T. M.: Decreasing surface albedo signifies a growing importance of clouds for Greenland Ice Sheet meltwater production, Nat. Commun., 13, 4205, https://doi.org/10.1038/s41467-022-31434-w, 2022.
Salo, L., Saarnio, K., Saarikoski, S., Teinilä, K., Barreira, L. M. F., Marjanen, P., Martikainen, S., Keskinen, H., Mustonen, K., Lepistö, T., Aakko-Saksa, P., Hakkarainen, H., Pfeiffer, T., Jalava, P., Karjalainen, P., Keskinen, J., Kuittinen, N., Timonen, H., and Rönkkö, T.: Black carbon instrument responses to laboratory generated particles, Atmos. Pollut. Res., 15, 102088, https://doi.org/10.1016/j.apr.2024.102088, 2024.
Savage, N. J., Krentz, C. E., Könemann, T., Han, T. T., Mainelis, G., Pöhlker, C., and Huffman, J. A.: Systematic characterization and fluorescence threshold strategies for the wideband integrated bioaerosol sensor (WIBS) using size-resolved biological and interfering particles, Atmos. Meas. Tech., 10, 4279–4302, https://doi.org/10.5194/amt-10-4279-2017, 2017.
Scherer, J. J., Paul, J. B., Thiebaud, J., and So, S.: MIRA: A New, Ultrasensitive, Middle Infrared Laser-Based “Lab in a Lunchbox,” in: Optical Sensors and Sensing Congress (ES, FTS, HISE, Sensors), Optics and Photonics for Sensing the Environment, Optica Publishing Group, 2019, ETu2A.1, https://doi.org/10.1364/ES.2019.ETu2A.1, 2019.
Schmale, J., Schneider, J., Ancellet, G., Quennehen, B., Stohl, A., Sodemann, H., Burkhart, J. F., Hamburger, T., Arnold, S. R., Schwarzenboeck, A., Borrmann, S., and Law, K. S.: Source identification and airborne chemical characterisation of aerosol pollution from long-range transport over Greenland during POLARCAT summer campaign 2008, Atmos. Chem. Phys., 11, 10097–10123, https://doi.org/10.5194/acp-11-10097-2011, 2011.
Schmale, J., Heutte, B., and Dyson, J.: Unveiling the Implicit: Arctic Coastal Aerosol Processes, Chimia, 78, 748–753, https://doi.org/10.2533/chimia.2024.748, 2024.
Sejr, M. K., Stedmon, C. A., Bendtsen, J., Abermann, J., Juul-Pedersen, T., Mortensen, J., and Rysgaard, S.: Evidence of local and regional freshening of Northeast Greenland coastal waters, Sci. Rep., 7, 13183, https://doi.org/10.1038/s41598-017-10610-9, 2017.
Shrivastava, M., Cappa, C. D., Fan, J., Goldstein, A. H., Guenther, A. B., Jimenez, J. L., Kuang, C., Laskin, A., Martin, S. T., Ng, N. L., Petaja, T., Pierce, J. R., Rasch, P. J., Roldin, P., Seinfeld, J. H., Shilling, J., Smith, J. N., Thornton, J. A., Volkamer, R., Wang, J., Worsnop, D. R., Zaveri, R. A., Zelenyuk, A., and Zhang, Q.: Recent advances in understanding secondary organic aerosol: Implications for global climate forcing, Rev. Geophys., 55, 509–559, https://doi.org/10.1002/2016RG000540, 2017.
Soja, A. J., Tchebakova, N. M., French, N. H. F., Flannigan, M. D., Shugart, H. H., Stocks, B. J., Sukhinin, A. I., Parfenova, E. I., Chapin, F. S., and Stackhouse, P. W.: Climate-induced boreal forest change: Predictions versus current observations, Glob. Planet. Change, 56, 274–296, https://doi.org/10.1016/j.gloplacha.2006.07.028, 2007.
Sprenger, M. and Wernli, H.: The LAGRANTO Lagrangian analysis tool – version 2.0, Geosci. Model Dev., 8, 2569–2586, https://doi.org/10.5194/gmd-8-2569-2015, 2015.
Statistics Greenland: Greenland in figures 2024, Nuuk, Greenland, edited by: Kleemann, N., Statistics Greenland, ISBN 978-87-998113-9-7, 2024.
Statistics Greenland: Average monthly air temperature [ENE1MID], ASIAQ Greenland Survey, https://bank.stat.gl/pxweb/en/Greenland/Greenland__EN__EN30/ENX1MID.px/?rxid=ENX1MID20-05-2026 15%3A09%3A26 (last access: 20 May 2026), 2025.
Steinley, D. and Brusco, M. J.: Choosing the number of clusters in Ê-means clustering., Psychol. Methods, 16, 285–297, https://doi.org/10.1037/a0023346, 2011.
Sundström, A.-M., Nousiainen, T., and Petäjä, T.: On the Quantitative Low-Level Aerosol Measurements Using Ceilometer-Type Lidar, J. Atmos. Ocean. Tech., 26, 2340–2352, https://doi.org/10.1175/2009JTECHA1252.1, 2009.
Thomas, J. L., Polashenski, C. M., Soja, A. J., Marelle, L., Casey, K. A., Choi, H. D., Raut, J. -C., Wiedinmyer, C., Emmons, L. K., Fast, J. D., Pelon, J., Law, K. S., Flanner, M. G., and Dibb, J. E.: Quantifying black carbon deposition over the Greenland ice sheet from forest fires in Canada, Geophys. Res. Lett., 44, 7965–7974, https://doi.org/10.1002/2017GL073701, 2017.
Tunved, P., Ström, J., and Krejci, R.: Arctic aerosol life cycle: linking aerosol size distributions observed between 2000 and 2010 with air mass transport and precipitation at Zeppelin station, Ny-Ålesund, Svalbard, Atmos. Chem. Phys., 13, 3643–3660, https://doi.org/10.5194/acp-13-3643-2013, 2013.
Vaisala: Vaisala Lidar Ceilometer CL61 User Guide, Vaisala, https://docs.vaisala.com/r/M212475EN-E/en-US (last access: 20 May 2026), 2022.
Van Tricht, K., Lhermitte, S., Lenaerts, J. T. M., Gorodetskaya, I. V., L'Ecuyer, T. S., Noël, B., Van Den Broeke, M. R., Turner, D. D., and Van Lipzig, N. P. M.: Clouds enhance Greenland ice sheet meltwater runoff, Nat. Commun., 7, 10266, https://doi.org/10.1038/ncomms10266, 2016.
Verdugo, J., Damm, E., Schaffer, J., Bauch, D., Meyer, H., and Kaiser, J.: Impacts of glacier and sea ice melt on methane pathways on the Northeast Greenland shelf, Cont. Shelf Res., 243, 104752, https://doi.org/10.1016/j.csr.2022.104752, 2022.
Virkkula, A., Levula, J., Pohja, T., Aalto, P. P., Keronen, P., Schobesberger, S., Clements, C. B., Pirjola, L., Kieloaho, A.-J., Kulmala, L., Aaltonen, H., Patokoski, J., Pumpanen, J., Rinne, J., Ruuskanen, T., Pihlatie, M., Manninen, H. E., Aaltonen, V., Junninen, H., Petäjä, T., Backman, J., Dal Maso, M., Nieminen, T., Olsson, T., Grönholm, T., Aalto, J., Virtanen, T. H., Kajos, M., Kerminen, V.-M., Schultz, D. M., Kukkonen, J., Sofiev, M., De Leeuw, G., Bäck, J., Hari, P., and Kulmala, M.: Prescribed burning of logging slash in the boreal forest of Finland: emissions and effects on meteorological quantities and soil properties, Atmos. Chem. Phys., 14, 4473–4502, https://doi.org/10.5194/acp-14-4473-2014, 2014.
Wang, Y.: The Effect of Climate Change on Forest Fire Danger and Severity in the Canadian Boreal Forests for the Period 1976–2100, J. Geophys. Res.-Atmos., 129, e2023JD039118, https://doi.org/10.1029/2023JD039118, 2024.
Weimer, S., Mohr, C., Richter, R., Keller, J., Mohr, M., Prévôt, A. S. H., and Baltensperger, U.: Mobile measurements of aerosol number and volume size distributions in an Alpine valley: Influence of traffic versus wood burning, Atmos. Environ., 43, 624–630, https://doi.org/10.1016/j.atmosenv.2008.10.034, 2009.
Wernli, H. and Davies, H. C.: A Lagrangian-based analysis of extratropical cyclones. I: The method and some applications, Q. J. Roy. Meteor. Soc., 123, 467–489, https://doi.org/10.1002/qj.49712353811, 1997.
Wrona, F. J., Johansson, M., Culp, J. M., Jenkins, A., Mård, J., Myers-Smith, I. H., Prowse, T. D., Vincent, W. F., and Wookey, P. A.: Transitions in Arctic ecosystems: Ecological implications of a changing hydrological regime, J. Geophys. Res.-Biogeo., 121, 650–674, https://doi.org/10.1002/2015JG003133, 2016.
Yasunari, T. J., Kajikawa, T., Matsumi, Y., and Kim, K.: Increased atmospheric PM2.5 events due to open waste burning in Qaanaaq, Greenland, summer of 2022, Atmos. Sci. Lett., 25, e1231, https://doi.org/10.1002/asl.1231, 2024.