the Creative Commons Attribution 4.0 License.
the Creative Commons Attribution 4.0 License.
 | 20 May 2026
Airborne remote sensing of nitrous acid in the troposphere: potential sources of excess HONO
Benjamin Weyland
Simon Rosanka
Domenico Taraborrelli
Birger Bohn
Andreas Zahn
Florian Obersteiner
Eric Förster
Mariano Mertens
Patrick Jöckel
Helmut Ziereis
Katharina Kaiser
Horst Fischer
John N. Crowley
Nijing Wang
Achim Edtbauer
Jonathan Williams
Maria Dolores Andrés Hernández
John P. Burrows
Flora Kluge
Meike K. Rotermund
Andre Butz
Klaus Pfeilsticker
The photolysis of nitrous acid (HONO) produces hydroxyl radicals (OH), the most important cleaning agent of the troposphere. For decades, HONO has been measured in concentrations which exceed the photo-stationary concentration arising from its gas phase formation via the reaction NO + OH and destruction by photolysis. Several photochemical and heterogeneous formation mechanisms, including the photolysis of nitrate have been proposed which may explain this excess HONO. This study reports on airborne remote sensing measurements of the mini-DOAS instrument over continental Europe, Southeast Asia, and the tropical Atlantic. The observations form a C-shaped profile in the troposphere with maximum volume mixing ratios of approximately 150 ppt in the planetary boundary layer, about 10 ppt in the free troposphere and up to 100 ppt in the tropical upper troposphere. These measurements of HONO throughout the troposphere exceed model predictions by up to an order of magnitude. Together with a host of other measured species and parameters, various formation mechanisms are explored to investigate in situ HONO sources. Although a precise formation mechanism in the polluted boundary layer remains elusive, the photolysis of particulate nitrate may explain excess HONO in the marine boundary layer. The excess HONO observed in the upper troposphere requires a gas phase source with a formation rate of up to 300 ppt h−1. The possible role of peroxynitrous acid (HOONO), formed by the reactions NO + HO2 + M and NO2 + OH + M, and further oxidation by reactions with NO or O3, is explored.
- Article
(5769 KB) - Full-text XML
- BibTeX
- EndNote


Since its discovery in the atmosphere (Nash, 1974), the tropospheric sources and sinks of nitrous acid (HONO) have been a matter of intense debate (Perner and Platt, 1979). HONO is a key species in atmospheric photochemistry, in particular in the polluted environment, due to its effects on the formation of hydroxyl radicals (OH) and its potential to recycle reactive nitrogen (e.g., Perner and Platt, 1979; Platt et al., 1980; Jacob, 2000; Zhou et al., 2001; Alicke et al., 2003; Kleffmann et al., 2005; Acker et al., 2006; Zhang et al., 2009; Li et al., 2014; Ye et al., 2016a, 2017, 2018, and others). In the polluted boundary layer (PBL) or even in remote regions (Villena et al., 2011b) the rate of production of OH from the photolysis of HONO may outpace OH production from the reaction of O(1D) with H2O, particularly in the morning.
However, past studies – mainly performed at the ground – revealed much larger HONO volume mixing ratios (VMR) (up to some ppb) and source strengths (up to several ppb h−1) than the well known gas phase formation reaction (Reaction R1), destruction by photolysis (Reaction R2), and reaction with the OH radical (Reaction R3) can explain (e.g., Acker et al., 2006; Villena et al., 2011a; Kleffmann et al., 2005; Wang et al., 2015; Tong et al., 2016, and others).
During the daytime, Reactions (R1) to (R3) result in a photo-stationary state (PSS) from which the HONO concentration can be calculated:
Daytime HONO measurements can then be compared to [HONO]PSS to quantify sources that exceed Reaction (R1) (further on called excess HONO). Since in near-surface measurements in the polluted environment Reaction (R1) was often found to be insufficient to explain measured HONO, a large set of homogeneous and heterogeneous reactions including the photolysis of nitrate were investigated, mainly in laboratory studies, which are discussed in the following and tabulated in the appendix (see Table A1).
There is some consensus that in the polluted boundary layer and lower atmosphere, in addition to Reaction (R1), HONO is produced mainly by heterogeneous reactions involving NOx on macroscopic surfaces (e.g., infrastructure and vegetation), and/or on the surface and/or in the bulk of atmospheric aerosols (e.g., Lammel and Cape, 1996; Ammann et al., 1998; Reisinger, 2000; Kleffmann et al., 2003; Monge et al., 2010; Ma et al., 2013b; Cheng et al., 2016; Tong et al., 2016; Lu et al., 2018, and many others). It has also been recognized that its production is greatly enhanced by the presence of organics attached to surfaces and potentially within the aerosol when exposed to sunlight (George et al., 2005; Stemmler et al., 2006).
In addition, photolysis of HNO3 adsorbed to surfaces (Laufs and Kleffmann, 2016), including those of vegetation (Zhou et al., 2003, 2007) and snowpack (Zhou et al., 2001), has also been suggested as a major source of daytime HONO in low-NOx environments. Moreover, different HONO sources in the topsoil have also recently been identified, which are mostly mediated by soil bacterial processes (e.g., Su et al., 2011; Oswald et al., 2013; Wu et al., 2019; Song et al., 2023b). The photolysis of particulate nitrate has also been frequently discussed in the literature (Scharko et al., 2014; Ye et al., 2016a; Reed et al., 2017; Andersen et al., 2023). These HONO formation mechanisms have been summarized in several review papers (Kleffmann, 2007; Ma et al., 2013a; Spataro and Ianniello, 2014; Wang et al., 2025).
In previous studies HONO in near surface air was typically investigated. There, the formation of HONO in the gas phase (Reactions R1 to R3), by heterogeneous reactions on and within the aerosol, on macroscopic surfaces and within the topsoil occurs simultaneously and therefore are difficult to distinguish. To date only a few studies investigated the sources and sinks of HONO in air from the upper regions of the PBL and free troposphere. In this case, the sources of HONO from the ground heterogeneous chemistry, from the soil and macroscopic surfaces can largely be excluded, at least during the day because the HONO lifetime of approximately 10 min (Reactions R2 and R3) is significantly shorter than the timescale for vertical transport from the surface (e.g., Ye et al., 2018).
Previous airborne studies of HONO include those of Zhang et al. (2009), Li et al. (2014), Neuman et al. (2016), Ye et al. (2016b), Ye et al. (2018) and Andersen et al. (2023). In airborne investigations, the techniques most commonly used to measure HONO are wet chemical techniques such as long-path absorption photometry (e.g., by Li et al., 2014; Ye et al., 2016b, 2018) and high performance liquid chromatography (described by Huang et al., 2002; Zhang et al., 2009). Recently, chemical ionization mass spectrometry (CIMS) (e.g. Neuman et al., 2016) and differential optical absorption spectroscopy (DOAS) (e.g. Heue et al., 2014, and this study) measurements have also been employed in airborne HONO studies. Each technique has specific strengths and weaknesses, but nevertheless recent comparisons indicated a reasonable agreement among the different instruments and retrieval techniques used for the detection of HONO, at least for large HONO VMRs (in the ppb range) such as those met in polluted environments (Wang et al., 2017; Crilley et al., 2019).
Despite decades of research, the mechanism and rate of formation of HONO in the atmosphere remains poorly quantified. This study reports measurements of HONO in different regions and at different altitudes in the troposphere and aims to reconcile the observed HONO with the potential HONO formation mechanisms. Airborne measurements of a variety of precursors of HONO and aerosols were also made. Due to the short photolytic lifetime of HONO in the atmosphere, airborne observations should not be strongly influenced by HONO emissions from or near the surface. Moreover, the influence of thick wildfire plumes can be excluded with the images of the sky captured by a digital camera. Consequently, we assume that these sources are negligible for our study performed in the upper part of the boundary layer, and in the free and upper troposphere. HONO found there needs to be produced in-situ rather transported from elsewhere. An overview of previously proposed HONO formation mechanisms potentially relevant for the present study (i.e. excluding ground processes) is given in Table A1. Some mechanisms (in particular the Mechanisms 1, 2, 3, 4, and 6) have already been shown to be insufficient to explain daytime observations of HONO (for details see the comments at the bottom of Table A1).
This study investigates the presence and potential formation mechanisms of HONO throughout the troposphere in different photochemical environments over Europe, East Asia, and the tropical Atlantic. Using an airborne DOAS instrument (Hüneke et al., 2017; Stutz et al., 2017), remote sensing measurements of nitrous acid, formaldehyde, and nitrogen dioxide are reported from 25 scientific flights of the high altitude and long range research aircraft HALO (operated by the German Aerospace Center (DLR)). DOAS measurements are complemented by simultaneous in situ measurements of photochemically related trace gases, as well as measurements of relevant atmospheric parameters performed by other instruments on board the HALO aircraft. For the research missions, EMeRGe (2017/2018) and CAFE-Africa (2018), EMAC (ECHAM/MESSy Atmospheric Chemistry) and MECO(n) (MESSy-fied ECHAM and COSMO) model data is also available for comparison.
The paper is structured as follows: In Sect. 2, we provide some information on how HONO and other UV/Vis absorbing species are measured. Section 3 describes the measurements, Sect. 4 contextualizes those measurements within three regimes of the troposphere, and Sect. 5 concludes the study.
This study employs measurements of several instruments operated on board the HALO aircraft, including the remote sensing mini-DOAS instrument, and in situ instruments. It also utilizes simulations of the EMAC and MECO(n) models for comparison and interpretation.
2.1 The mini-DOAS instrument
The mini-DOAS instrument records scattered skylight in the ultraviolet/visible/near-infrared wavelength ranges in nadir and limb direction (Stutz et al., 2017; Hüneke et al., 2017; Werner et al., 2017; Rotermund et al., 2021; Kluge et al., 2020, 2023). Here, solely the data collected in limb direction (telescope elevation angle 0°) are reported.
The interpretation of air-borne mini-DOAS observations requires the DOAS analysis of the measured skylight spectra, radiative transfer modeling of the observation conditions with a Monte Carlo model such as McArtim (Deutschmann et al., 2011), and the conversion of inferred differential slant column densities (dSCDs) retrieved with the DOAS technique into VMRs using the scaling method (Stutz et al., 2017; Hüneke et al., 2017). In this study, the focus is on limb geometry measurements of NO2, HCHO and HONO, which were performed during 25 scientific flights of the EMeRGe (e.g. https://acp.copernicus.org/articles/special_issue1074.html, last access: 10 April 2026, Andrés Hernández et al., 2022; Lin et al., 2023; Förster et al., 2023) and CAFE-Africa (e.g. Tadic et al., 2021; Nussbaumer et al., 2021b; Hamryszczak et al., 2023) missions during 2017 and 2018.
HONO retrievals
HONO is retrieved in the UV-A range 337–373 nm according to the recommendations by Wang et al. (2017, 2019), with slight modifications. For example, the Taylor terms for NO2 at 298 K as described by Puķīte et al. (2010) and recommended by Wang et al. (2017, 2019) are not included. While they are recommended for spectral retrievals in the UV, the low optical densities (ODs) arising from NO2 absorption (several 10−3) measured by the air-borne optical instrumentation in limb direction does not necessitate the inclusion of these Taylor terms. This was investigated in a sensitivity study (not shown here) which indicates the inclusion of the Taylor terms only has a minor impact on the retrieved HONO dSCDs (in the range of about 1 %–2 %).
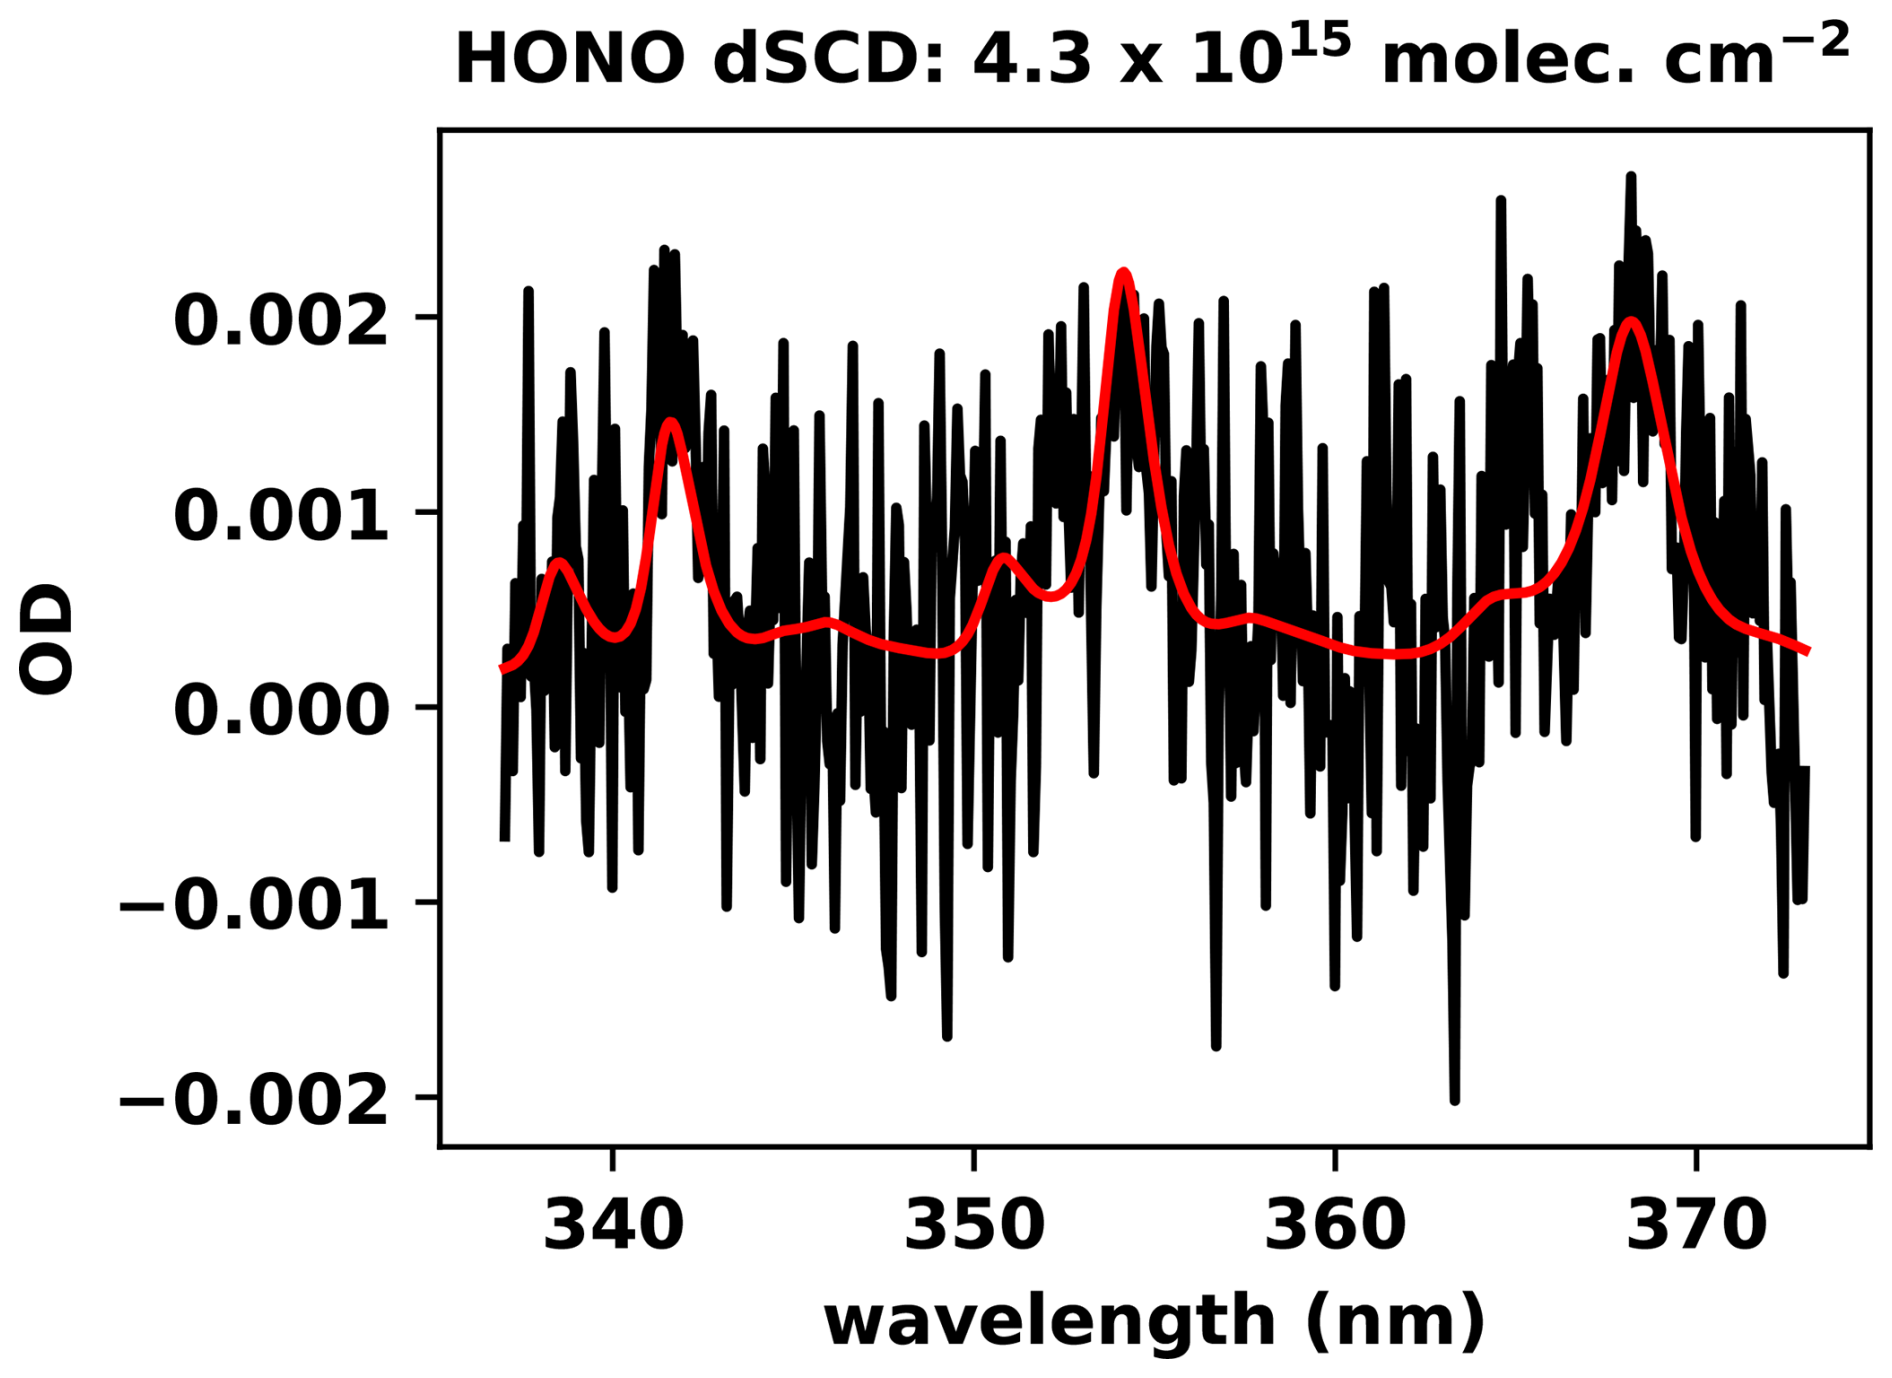
Figure 1Example of a HONO spectral retrieval in the UV-A wavelength range for a limb spectrum recorded at 14 km altitude, at 17:17 on the 24 August 2018 (i.e. during the CAFE-Africa campaign). Measured optical depth (OD) is shown as a function of wavelength in black. The scaled absorption cross-section of HONO is plotted in red. The differential slant column density (dSCD) is the quotient of the OD and the absorption cross-section.
Here, the HONO absorption cross-section from Stutz et al. (2000) is used, though a recent study by Li et al. (2024) reveals that it is overestimated by over 20 %. A smaller HONO absorption cross-section would accordingly increase the DOAS retrieved HONO VMRs and at the same time would reduce the HONO photolysis frequencies. In effect, it would not affect the major conclusion of our study that HONOmeas often exceeds HONOPSS (see Eq. 1).
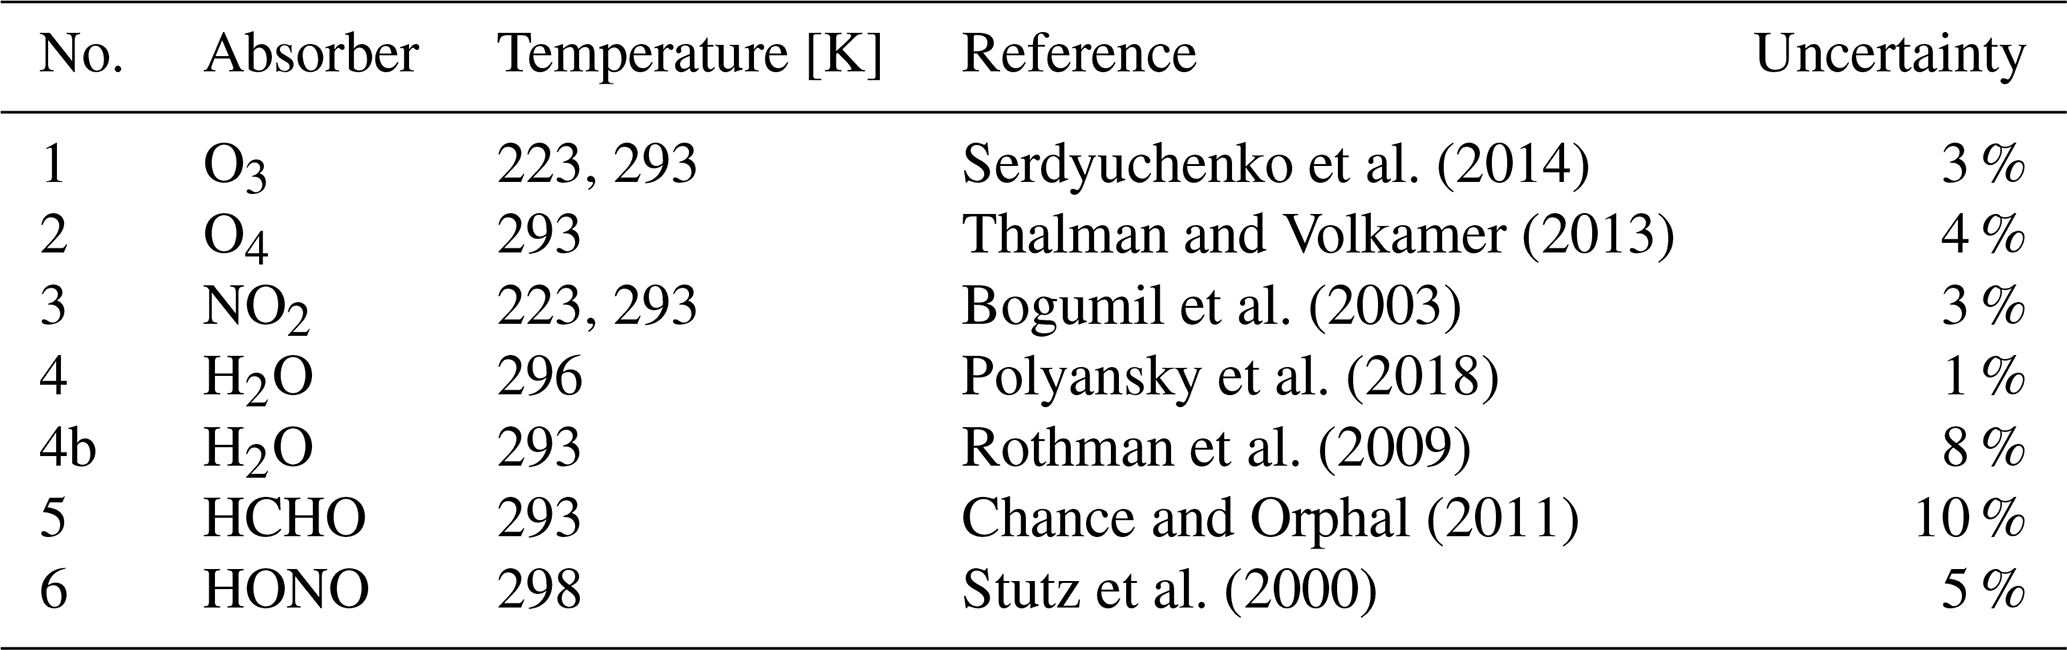
Moreover, no low temperature absorption cross-sections of HONO have been published to date. The absorption cross-section (T=298 K) is reported for the wavelength range 292 to 404 nm (Stutz et al., 2000). For the retrieval parameters shown in Table 1, one example of a retrieved HONO spectrum is shown in Fig. 1.
Serdyuchenko et al. (2014)Thalman and Volkamer (2013)Bogumil et al. (2003)Polyansky et al. (2018)Rothman et al. (2009)Chance and Orphal (2011)Stutz et al. (2000)Table 1For each absorbing gas, the absorption cross-sections used for the spectral retrievals, their temperatures and uncertainties are listed.
To convert dSCDs into SCDs, the absorption already present in the Fraunhofer reference spectrum (SCDref) must be determined. This is most often accomplished using a priori information from the EMAC and MECO(n) models, in combination with the radiative transfer (RT) model McArtim. SCDrefs are determined at altitudes where modeled SCDs approximate measured dSCDs well (in the absence of clouds), and can otherwise be assumed to be zero at high enough altitudes for gases which do not absorb much light overhead (i.e in the stratosphere, e.g. HONO).
2.2 The scaling method
The attribution of the determined SCDs to VMRs of the targeted gases in space and time in the atmosphere is performed using the scaling method (e.g. Hüneke et al., 2017; Stutz et al., 2017; Kluge et al., 2020; Rotermund et al., 2021; Kluge et al., 2023). The scaling method relies on information about the radiative transfer inferred from co-measured or calculated absorption of a gas with a known concentration or extinction [P]i in an atmospheric layer i. Weighting factors, i.e. relative detection sensitivities of the targeted gas [X]i and the scaling gas [Y]i (further on called α factors), are determined by combining air mass factors calculated by the radiative transfer model McArtim (Deutschmann et al., 2011) and the chosen a priori profiles for both gases.
The radiative transfer model is provided the time and the geolocation of the measurements and in-situ temperatures and pressures provided by the aircraft's navigation and monitoring system, climatological aerosol profiles as well as a priori profiles of the target and scaling gas.
Climatological aerosol profiles are determined from the stratospheric aerosol and gas experiment (384 and 520 nm) instrument from the international space station and the lidar climatology of vertical aerosol structure (355 and 532 nm) light detection and ranging instrument, while parameterization of the single scattering albedo (Heintzenberg et al., 1997) and Henyey-Greenstein phase function (Toublanc, 1996) are also included.
The a priori extinction profiles of the O4 collisional complex are calculated from the oxygen concentration and the collisional absorption cross-section. The a priori profile of ozone is determined from in situ ozone measurements and ozone mapping and profiler suite satellite data. The a priori profiles of the target gases are taken from the EMAC or MECO(n) models, where available.
Previously, the sensitivity of inferred VMRs with respect to uncertainties related to the a priori profile was studied (see Fig. 1 in Kluge et al., 2023), and it was found that after a few iteration steps (i.e. the inferred profile of the targeted gas in step i are used as a priori for the retrieval of step i+1), a priori profiles converge to a final profile. This is corroborated by another sensitivity study, an investigation of the erroneous retrieval of HONO VMRs in the free troposphere above a layer of intense air pollution in the boundary layer. It was found that the scaling method robustly avoids mis-attributing absorption from the boundary layer to higher altitudes as long as the a priori information captures the general shape of the trace gas profile (see Fig. 2).
Furthermore, the scaling method converts a detection limit defined by the DOAS retrieval error into VMRs which vary with altitude. The detection limit for HONO for example ranges from 1 to 15 ppt from the boundary layer to the upper troposphere.
The precision of the scaling method is primarily limited by the signal to noise ratio of the DOAS retrieval of the target gas. Other sources of error include the determination of the SCDref of the scaling gas, differences between a priori and measured profiles, and misalignment of the telescopes during flight. For details see Hüneke et al. (2017), Stutz et al. (2017).
The integration of spectra in the UV lasts 30 s on average – during which the aircraft moves at 100 m s−1 – while the mean path length at 360 nm increases with altitude. The retrievals of the mini-DOAS instrument represent averages over a volume, the horizontal area of which ranges from dozens to hundreds of square kilometers.
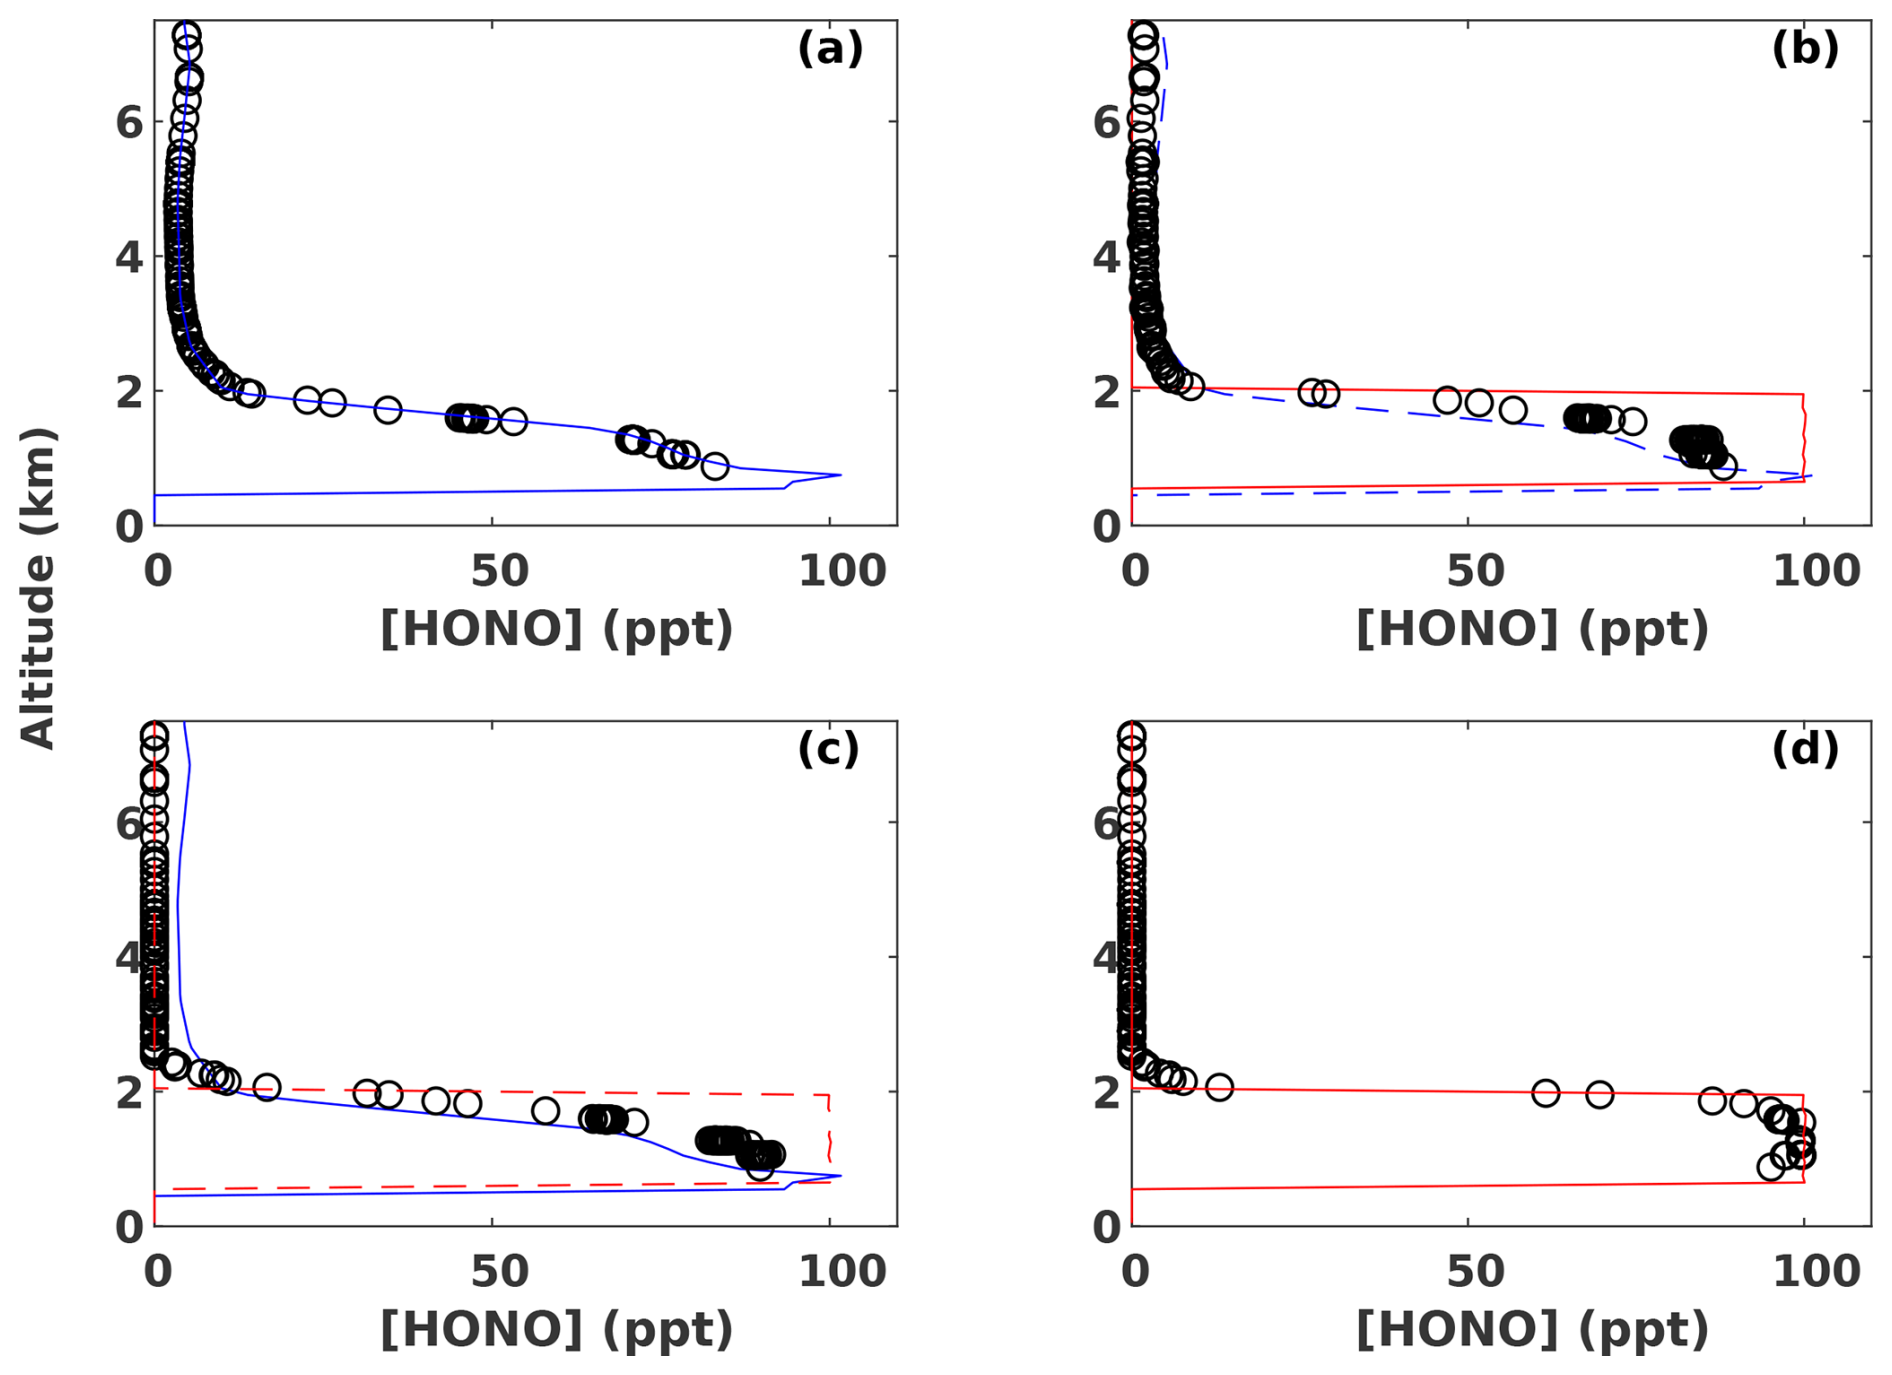
Figure 2HONO VMRs retrieved by the scaling method using virtual measurements. In each panel, virtual measurements are created from the profiles shown as solid lines. Those virtual measurements are then scaled with alpha factors generated from an a priori profile shown as dashed lines. The blue lines are a representative HONO profile, the red lines are a Heaviside function representing a loaded boundary layer. In panel (a), virtual measurements created from a representative HONO profile are scaled using alpha factors generated from the same representative profile. In panel (b), scaling virtual measurements which were produced by a loaded boundary layer using alpha factors determined from a representative profile results in an underestimation of HONO within the boundary layer, as well as an overestimation of HONO of some 10 % – decreasing with increasing altitude – up to 1 km above the boundary layer. In panel (c), scaling virtual measurements which were produced by a representative profile using alpha factors determined from a loaded boundary layer results in an overestimation of HONO within the boundary layer as well as an underestimation of HONO above the boundary layer. In panel (d), virtual measurements created from a loaded boundary layer are scaled using alpha factors generated from the same profile.
2.3 Ancillary instruments on board the HALO aircraft
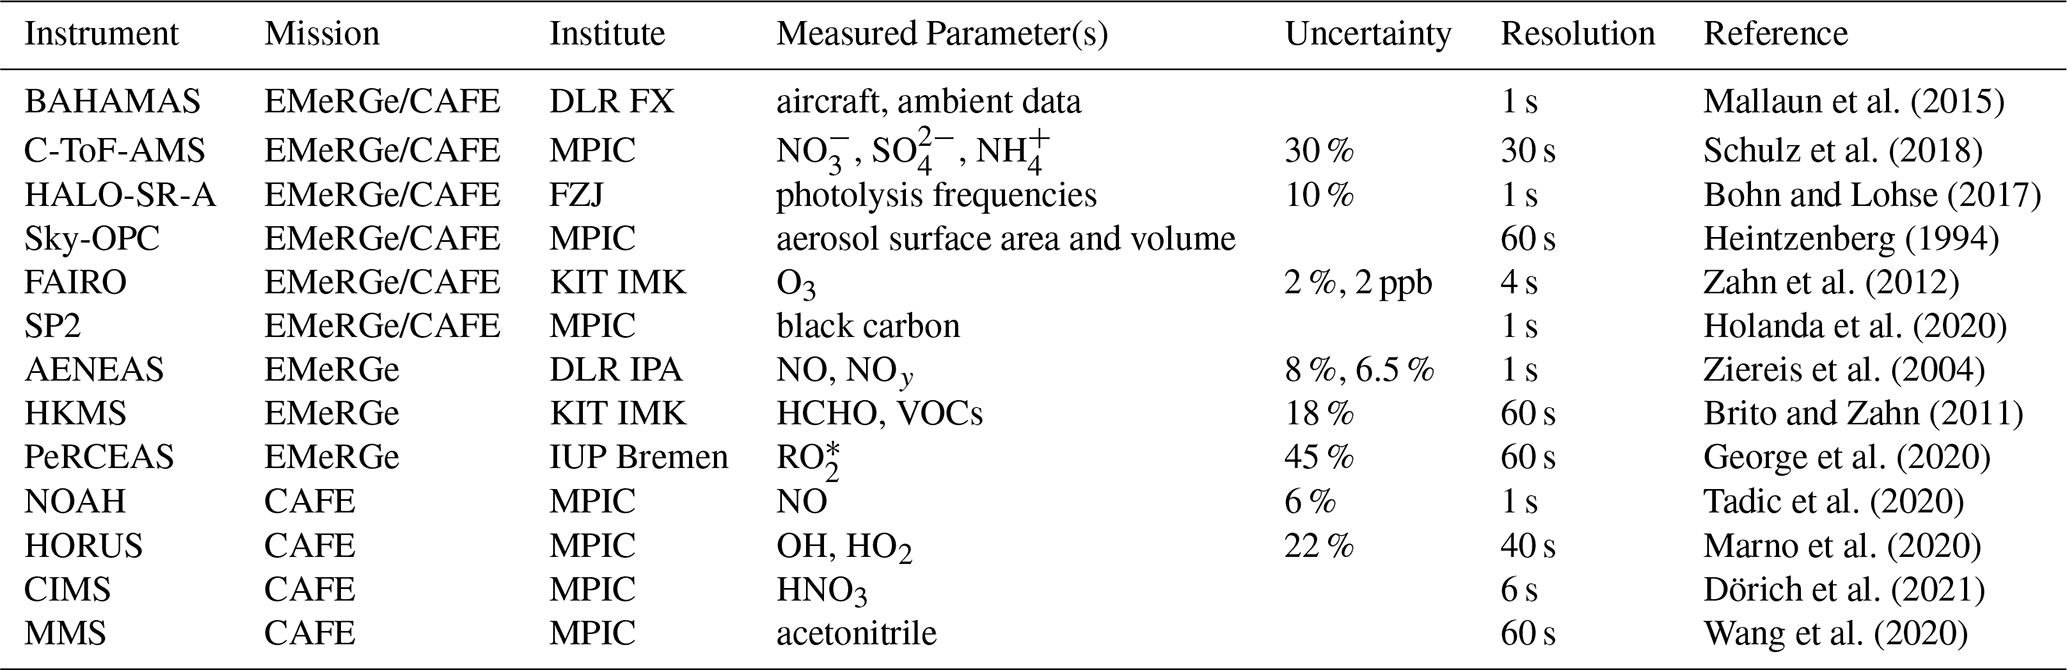
The interpretation and contextualization of the measurements of the mini-DOAS instrument require observations of complementary instrumentation operated on board the HALO aircraft, although the package of instruments varied between the different missions. Those instruments which were present for the EMeRGe mission as well as the CAFE-Africa mission are listed in Table 2, as well as those instruments which were present only for one mission or the other. Further details of the instruments are provided in the respective publications listed in the last column of Table 2.
Mallaun et al. (2015)Schulz et al. (2018)Bohn and Lohse (2017)Heintzenberg (1994)Zahn et al. (2012)Holanda et al. (2020)Ziereis et al. (2004)Brito and Zahn (2011)George et al. (2020)Tadic et al. (2020)Marno et al. (2020)Dörich et al. (2021)Wang et al. (2020)Table 2The instruments, missions, institutions, measured parameters, uncertainty and resolution thereof (if specified).
2.4 Atmospheric chemistry models
In the absence of an in situ instrument which measures HONO, or satellite measurements thereof, the VMRs of HONO observed by the mini-DOAS instrument are compared to the simulations of atmospheric chemistry models. Model outputs are also compared to the measured HCHO and NO2 VMRs. These simulations are used to construct a priori profiles of the target gases for the scaling method. The two models used in this study are the EMAC and MECO(n) chemistry climate models. Neither model is suited for fine spatial (and temporal) scale comparison of parameters measured from the aircraft, in particular with the VMR ratios measured by our instrument near emissions or around the boundaries of air masses with different trace gas concentrations. This is not due to a deficiency of either model per se, but rather that the concentrations of the investigated gases may vary near strong sources of pollution on spatial and temporal scales which in these cases neither model resolves (see below). However, model predictions should still be broadly representative of atmospheric composition, and capture the general spatial distribution of the target gases in the free and upper troposphere.
2.4.1 EMAC
The ECHAM/MESSy Atmospheric Chemistry (EMAC) model is a numerical chemistry and climate simulation system that includes sub-models describing tropospheric and middle atmosphere processes and their interaction with oceans, land and human influences (Jöckel et al., 2010). It uses the second version of the Modular Earth Submodel System (MESSy2) to link multi-institutional computer codes. The core atmospheric model is the 5th generation European Centre Hamburg general circulation model (ECHAM5 Roeckner et al., 2006). The physics subroutines of the original ECHAM code have been modularized and re-implemented as MESSy submodels and have continuously been further developed. Only the spectral transform core, the flux-form semi-Lagrangian large scale advection scheme, and the nudging routines for Newtonian relaxation are remaining from ECHAM. We applied EMAC (ECHAM5 version 5.3.02, MESSy version 2.54.0) in the T42L90MA-resolution, i.e. with a spherical truncation of T42 (corresponding to a quadratic Gaussian grid of approx. 2.8 by 2.8° in latitude and longitude) with 90 vertical hybrid pressure levels up to 0.01 hPa. Anthropogenic emissions are prescribed monthly average values following the IPCC RCP8.5 scenario. For the longer-lived greenhouse gases, pseudo emissions are applied by prescribing zonally and monthly averaged mixing ratios at the surface. To facilitate a comparison with the observations, EMAC is nudged (by Newtonian relaxation) against ECMWF ERA-Interim data. The chemical mechanism considers the basic gas-phase chemistry of ozone, methane and odd nitrogen. Alkanes and alkenes are included up to C4. Halogen chemistry includes bromine and chlorine species. For the chemistry of isoprene plus a few selected non-methane hydrocarbons (NMHCs), we used version 1 of the Mainz Isoprene Mechanism (MIM1). Further details of the model set-up as well as the considered chemical processes are described by (Jöckel et al., 2016).
EMAC model data is available for both phases of the EMeRGe mission and for the CAFE-Africa mission.
2.4.2 MECO(n)
MECO(n) is a global-regional chemistry-climate model, which couples EMAC and the regional chemistry-climate model COSMO-CLM/MESSy online (Kerkweg and Jöckel, 2012a, b). The dynamics of EMAC, in the simulation of which the results are analyzed here, was nudged towards ECMWF ERA-Interim as described above. The dynamics in COSMO-CLM/MESSy is not nudged, the forcing at the lateral boundaries of the regional model domains are on-line provided by the global EMAC model (first nested COSMO-CLM/MESSy instance), or from the next coarser resolved COSMO-CLM/MESSy instance, respectively.
The simulations for EMeRGe-Europe features 40 vertical levels and three refinements with the finest resolution of 7 km which has been used for analyses. The simulations for EMeRGe-Asia feature 45 vertical levels and 2 refinements with the finest resolution of 12 km, which has been used for the analyses. The simulations for Europe used EDGAR 4.3.2 anthropogenic emissions. For Asia the EDGAR 5.0 emissions have been used. In MECO(n) the same chemistry scheme as for EMAC has been applied (see above). The overall set-up is very similar to the one described by Mertens et al. (2016).
In both cases, EMAC and MECO(n), the analyzed model data has been sampled on-line along the flight-tracks of the research aircraft(s) with the S4D submodel (Jöckel et al., 2010) at a frequency corresponding to the model time step length, i.e. every 12 min in EMAC, every 60 s in the 7 km instance of MECO(n) and every 120 s in the 12 km instance of MECO(n).
The mini-DOAS instrument was deployed on several missions between 2017 and 2019. This study focuses on the analysis of data collected during three missions: EMeRGe-EU (July 2017), EMeRGe-Asia (March and April 2018) – which are two phases of the same broader mission (EMeRGe) – and CAFE-Africa (August and September 2018). The missions are chosen according to the flight patterns, and the presence of complementary instruments on board the HALO aircraft during those missions which are used to augment the investigations of the trace gases measured with the mini-DOAS instrument. The geographical areas and flight altitudes probed during these missions vary significantly, providing a broad overview of the concentrations of the trace gases studied in different seasons, layers of the troposphere and regions of the globe.
3.1 EMeRGe
The EMeRGe mission investigated the composition, transport and transformation of pollution plumes from mega-cities and major population centers. Airborne measurements of relevant atmospheric parameters, trace gases, and aerosols were made on board the HALO aircraft at different altitudes over Europe in July 2017 and the East China and South China Seas between the Philippines and Japan in spring 2018 (during the inter-monsoon period, which favors the outflow of pollutants from East Asia). These airborne observations were complemented by a suite of ground- and satellite-based measurements, as well as photochemical transport and chemistry climate modeling (e.g. EMAC, MECO(n), …) (Andrés Hernández et al., 2022). The field observations concentrated on the characterization of different air mass types downwind from various emission sources (e.g., those of anthropogenic, biogenic, and biomass burning origin as well as background air). The transformation of the suite of trace gases and radicals as well as aerosol parameters (e.g., particle number, size distribution, and chemical composition) has been used to provide insights into chemical processing (and mixing) of these air masses during their atmospheric transport (Förster et al., 2023). Of particular importance are the measurements of peroxy radicals , which are strongly influenced by the OH produced from the photolysis of HONO (George et al., 2023). A detailed description of the objectives, instrument payload, and findings of the EMeRGe mission is found in publications of the ACP/AMT inter-journal EMeRGe special issue (https://acp.copernicus.org/articles/special_issue1074.html, last access: 10 April 2026), specifically in the EMeRGe-EU overview paper by Andrés Hernández et al. (2022).
During both EMeRGe phases, the measurement flights had a duration of 8 h on average. The take off was typically in the mornings and landings occurred in the afternoon, i.e. flights were exclusively during daylight. While the flight levels spanned measurement altitudes from a few dozen meters above sea level to up to 12 500 m, 72 % of the air masses analyzed were within the lowermost 4 km of the atmosphere, i.e. in the boundary layer and free troposphere. As a consequence of the altitude range and season, the ambient temperatures were mostly above 0 °C; the high ambient temperatures and associated cabin temperatures reduced the data coverage of the DOAS instrument during some flights. The measurement flights sampled large geographical areas, spanning continental Europe and East Asia.
Detailed flight tracks together with air mass tags (see Sect. 3.3) are shown in Fig. 3. During the European deployments, most of the flight time was spent over land, in contrast with deployments in Asia, where much of the flight time was spent over the East China Sea and South China Sea. Various atmospheric conditions characterized each flight, such as the occurrence of thunderstorms in Southern Europe, as well as the presence of anthropogenic pollution plumes.
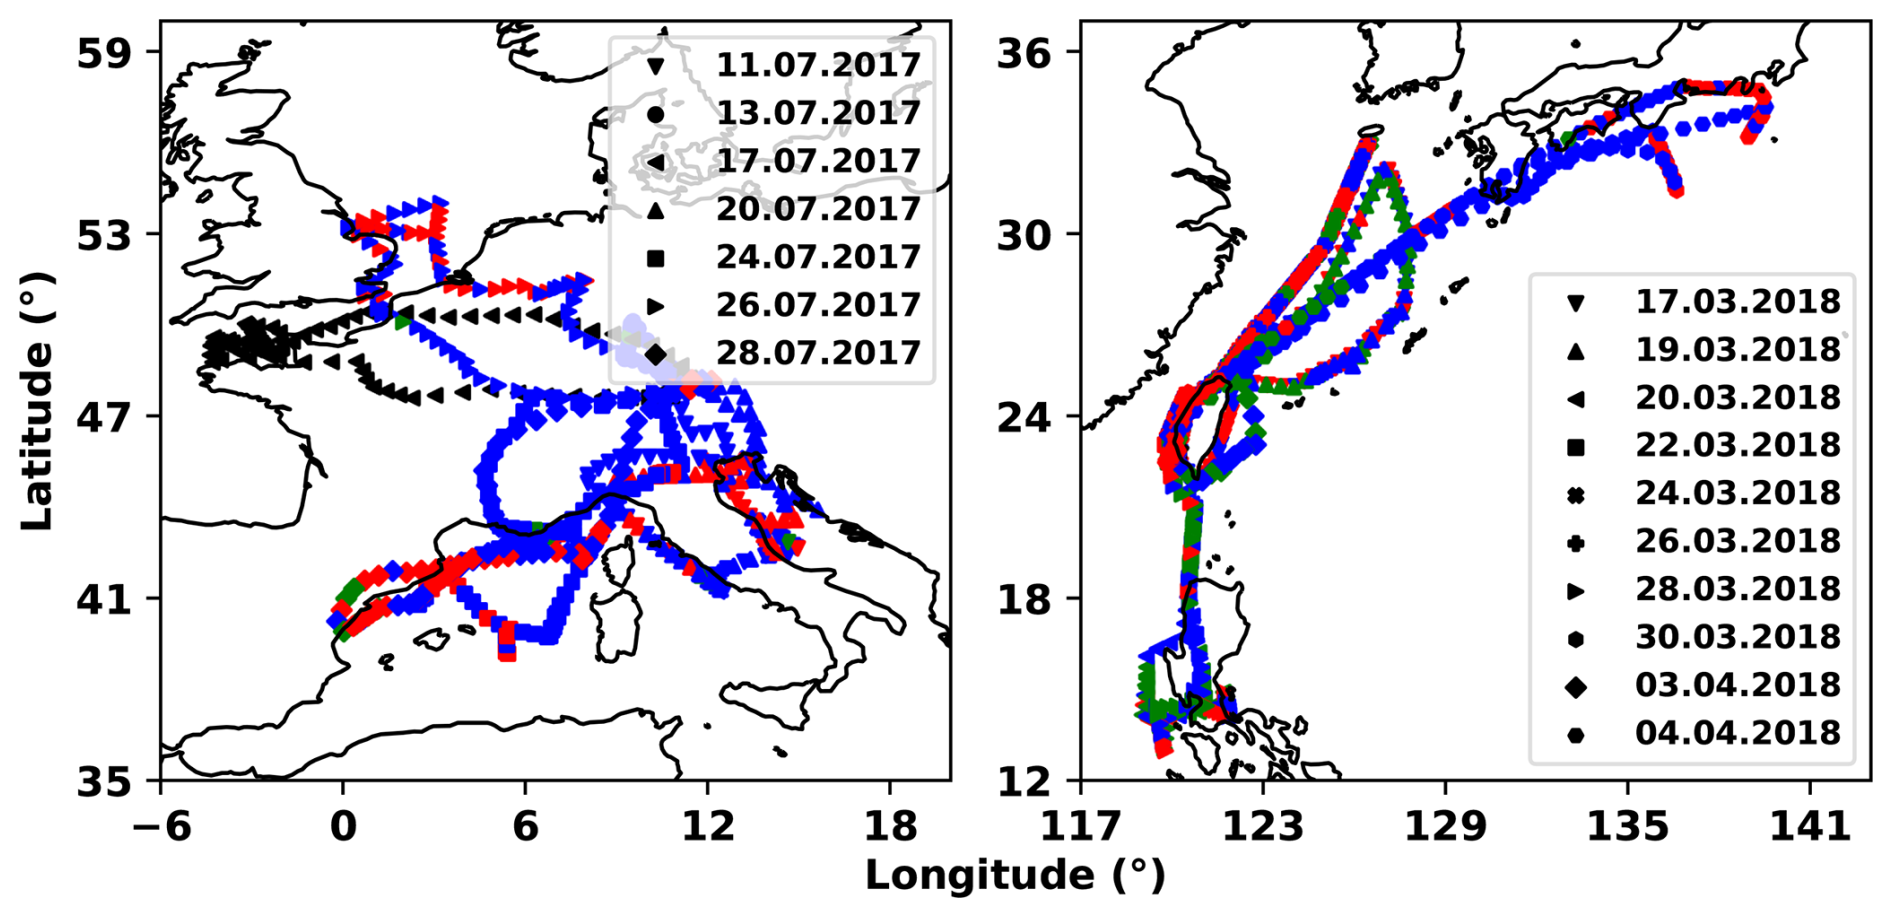
Figure 3The flight tracks of the seventeen scientific flights of the two phases of the EMeRGe mission during July 2017 and March/April 2018. The operational base of EMeRGe-EU (left panel) was Oberpfaffenhofen, Germany; EMeRGe-Asia (right panel) was based out of Tainan, Taiwan. Transfer flights to and from Tainan during EMeRGe-Asia are excluded. The coordinates of the flight tracks are colored by air mass tags inferred from VOC measurements of the HKMS instrument (Förster et al., 2023) (see Sect. 3.3), except for the flight on 17 July 2017 due to an instrument failure (shown in black). Red coloring indicates primarily anthropogenic emissions, green indicates biomass burning, while blue indicates neither, and is assumed to be aged background air.
3.2 CAFE-Africa
The CAFE-Africa (https://mpic.de/4130589/cafe-africa, last access: 10 April 2026) mission was based in Sal, Cape Verde and took place in August and September of 2018. The area of study was the tropical troposphere over the Atlantic Ocean and western Africa. Of the 14 scientific flights, 12 are analyzed here since the transfer flights are excluded. The scientific objectives of CAFE-Africa included the study of oxidation chemistry, thunderstorm effects, radiative forcing, and long-range transport of pollutants from biomass burning. The investigated region overlaps with the inter-tropical convergence zone, while the maximum flight altitude was around 15 km. The flight tracks are shown in Fig. 4.
The measurement flights took off in the mornings, landed in the evenings and were primarily conducted during daylight (except for the flight on 26.08.2018, which continued past sunset). Most of the flight time was spent at high altitudes, over the Atlantic Ocean. The ambient temperature was therefore usually well below 0 °C, enhancing the temperature stability of the mini-DOAS instrument.
During the CAFE-Africa mission, simultaneous measurements of OH, NO, and JHONO allow the quantification of gas phase HONO formation. Airborne measurements of HONO within the same region (and at similar altitudes) the following year, reported by Andersen et al. (2023), largely corroborate the HONO reported by this study.
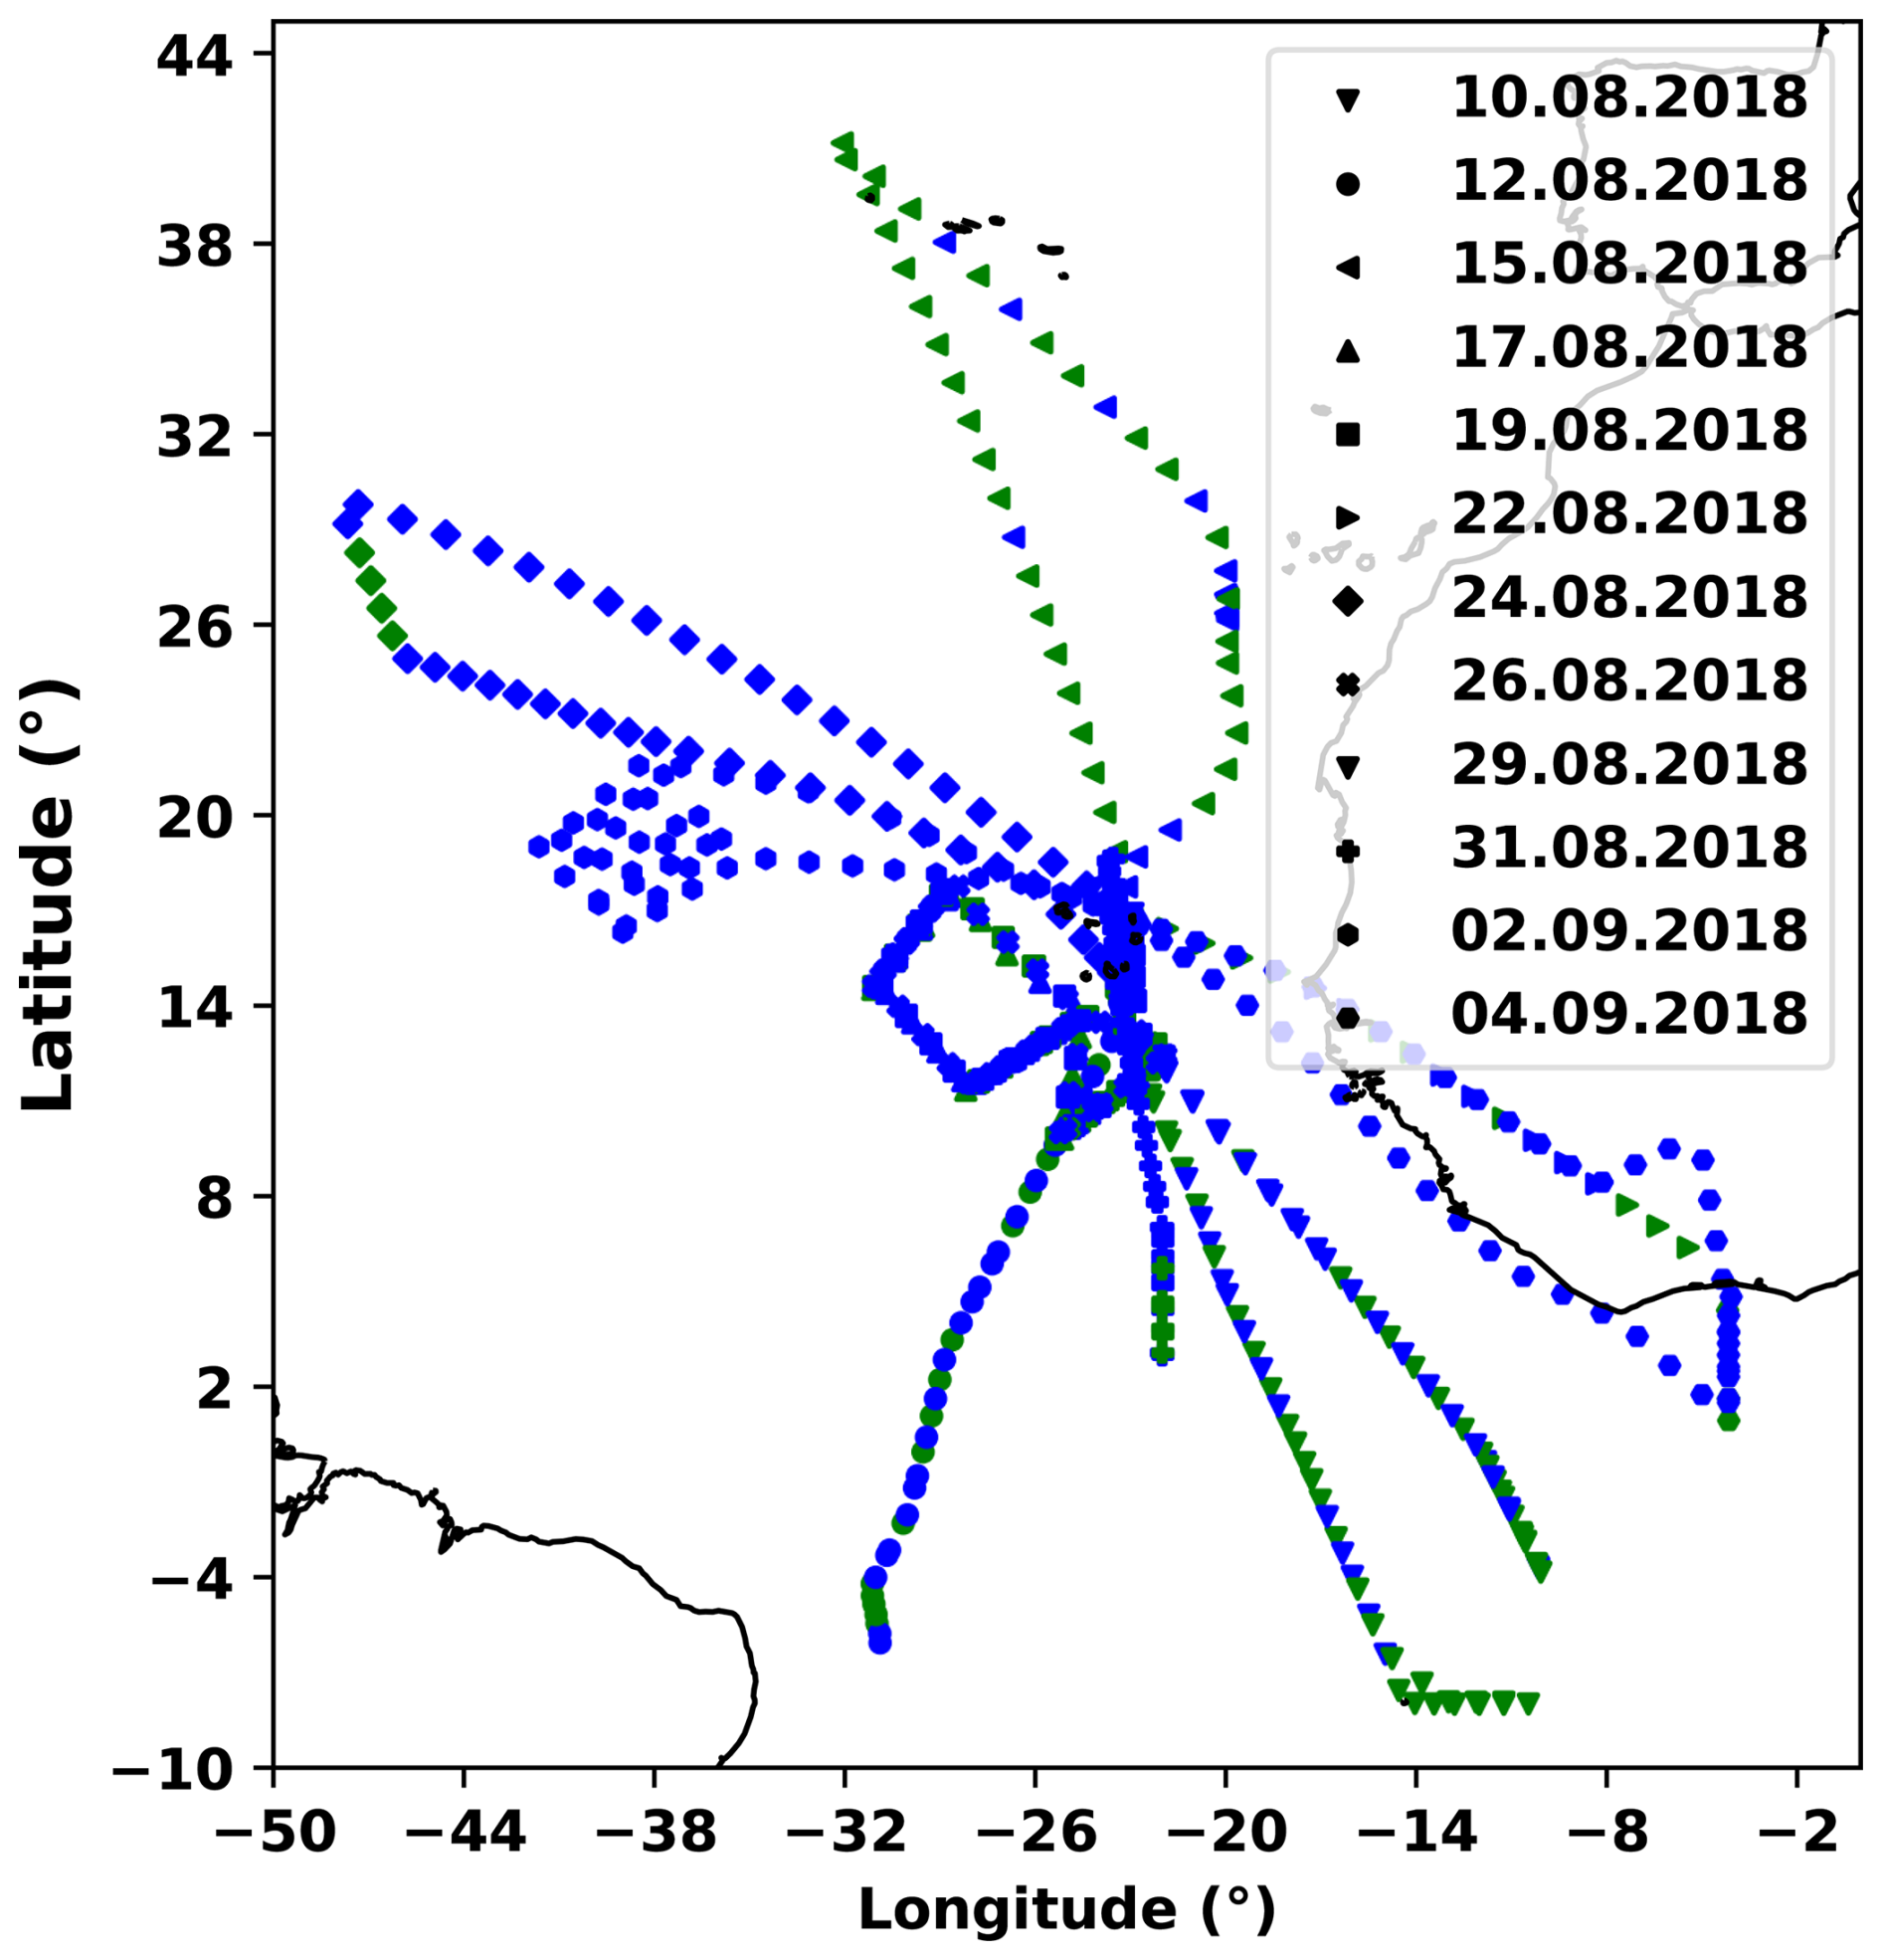
Figure 4The flight tracks of the 12 scientific flights of the CAFE-Africa mission in August and September of 2018 (the transfer flights are excluded). The operational base was Sal, Cape Verde. As in Fig. 3, the coordinates of the flight tracks are colored according to the air mass tags described in Sect. 3.3. Green indicates biomass burning, blue indicates background air.
3.3 Air mass characterization
The origin and composition of an air mass may determine the concentrations of trace gases sampled from the HALO aircraft. In keeping with the scientific objectives of the EMeRGe mission, the air masses probed are characterized with plume tags, which are interpolated to a one-second resolution from the volatile organic compound (VOC) measurements of the HKMS instrument (Förster et al., 2023). Elevated VMRs of acetonitrile (above 145 ppt) are indicative of biomass burning influence, whereas VMRs of benzene (above 19 ppt) are indicative of anthropogenic pollution. Across all flights, 34 % of air masses observed during the EMeRGe missions are tagged with anthropogenic influence, 14 % contain signatures of biomass burning, and the remaining 51 % are assumed to be otherwise aged background air. These percentages vary from flight to flight and across mission phases. As expected, less biomass burning influenced air was found during the deployments in Europe, compared to those probed over Asia (Förster et al., 2023). Since the HKMS instrument was not part of the CAFE-Africa mission, the same thresholds were applied to the acetonitrile measurements of the MMS instrument to differentiate biomass burning (BB) air masses accordingly (Crowley et al., 2025). Fine and coarse aerosol surface area (SA) and volume (V) data calculated from the measurements of the Sky-OPC instrument may also be used to identify dust events (Weger et al., 2018).
3.4 Availability of measurements
The measurements reported here are derived from several thousand limb spectra successfully recorded with the mini-DOAS instrument. Rarely, there are periods during some flights when skylight could not be collected, or when measured skylight spectra cannot be analyzed. The former includes highly variable cloud conditions, when the aircraft flew inside or next to bright clouds, since then the spectrometers tend to become over-saturated (in the post-flight analysis such periods are identified by inspecting images captured with the IDS uEye camera). The latter occurs when the detector and/or spectrometer temperature increase beyond approximately 4 °C, since increasing detector temperatures increase the dark current and changing spectrometer temperatures degrade the imaging of the spectrometers (by broadening the instrument's spectral response function). Temperature stability for some flights lasted up to 9 h, while when flying for longer periods at higher ambient temperatures (i.e. at low altitudes), the stable measurement interval lasted only 3 h in some cases (particularly during the EMeRGe mission). Spectra recorded during sharp turns of the aircraft are also discarded from analysis. Communication problems between the BAHAMAS and mini-DOAS instruments during four flights of the EMeRGe mission prevented the live alignment of the telescopes with the horizon, rendering the correct attribution of observed absorption to a particular layer in the atmosphere practically impossible. Therefore, the affected flights on 26 July 2017, 28 July 2017, 22 March 2018, and 3 April 2018 are excluded from the analysis.
Unfortunately, not only failure or malfunctions of the mini-DOAS instrument restrict our analysis, but also the availability of the necessary data measured by the complementary instruments operated on board the HALO aircraft. For example, during the EMeRGe mission, measurements of VOCs made by the HKMS instrument (and consequently the air mass characterizing plume tags) are not available on 17 July 2017, while measured with the PERCEAS instrument is not available on 17 March 2018. During the CAFE-Africa mission, measurements of NO, OH, and HO2 are unavailable on 10 August 2018, while measurements of HNO3 with the CIMS instrument are not available for the first four flights of the mission on 10 August 2018, 12 August 2018, 15 August 2018, and 17 August 2018.
This section presents the retrieved trace gas VMRs from the EMeRGe and CAFE-Africa missions. While the NO2 and HCHO measured by the mini-DOAS instrument compare well with model simulations (see Figs. A1 and A2 in the appendix), the measured HONO is often in excess of model predictions, which requires further discussion and explanation (see Sect. 4.1). Potential heterogeneous and homogeneous sources of the excess HONO are investigated and analyzed in three separate regimes of the troposphere, the MBL, lower and upper troposphere in Sect. 4.2, 4.3, and 4.4, respectively. Before discussing the different reasons for inferred excess HONO, we first compare our measured HONO with atmospheric observations of HONO previously published (see Fig. 5).
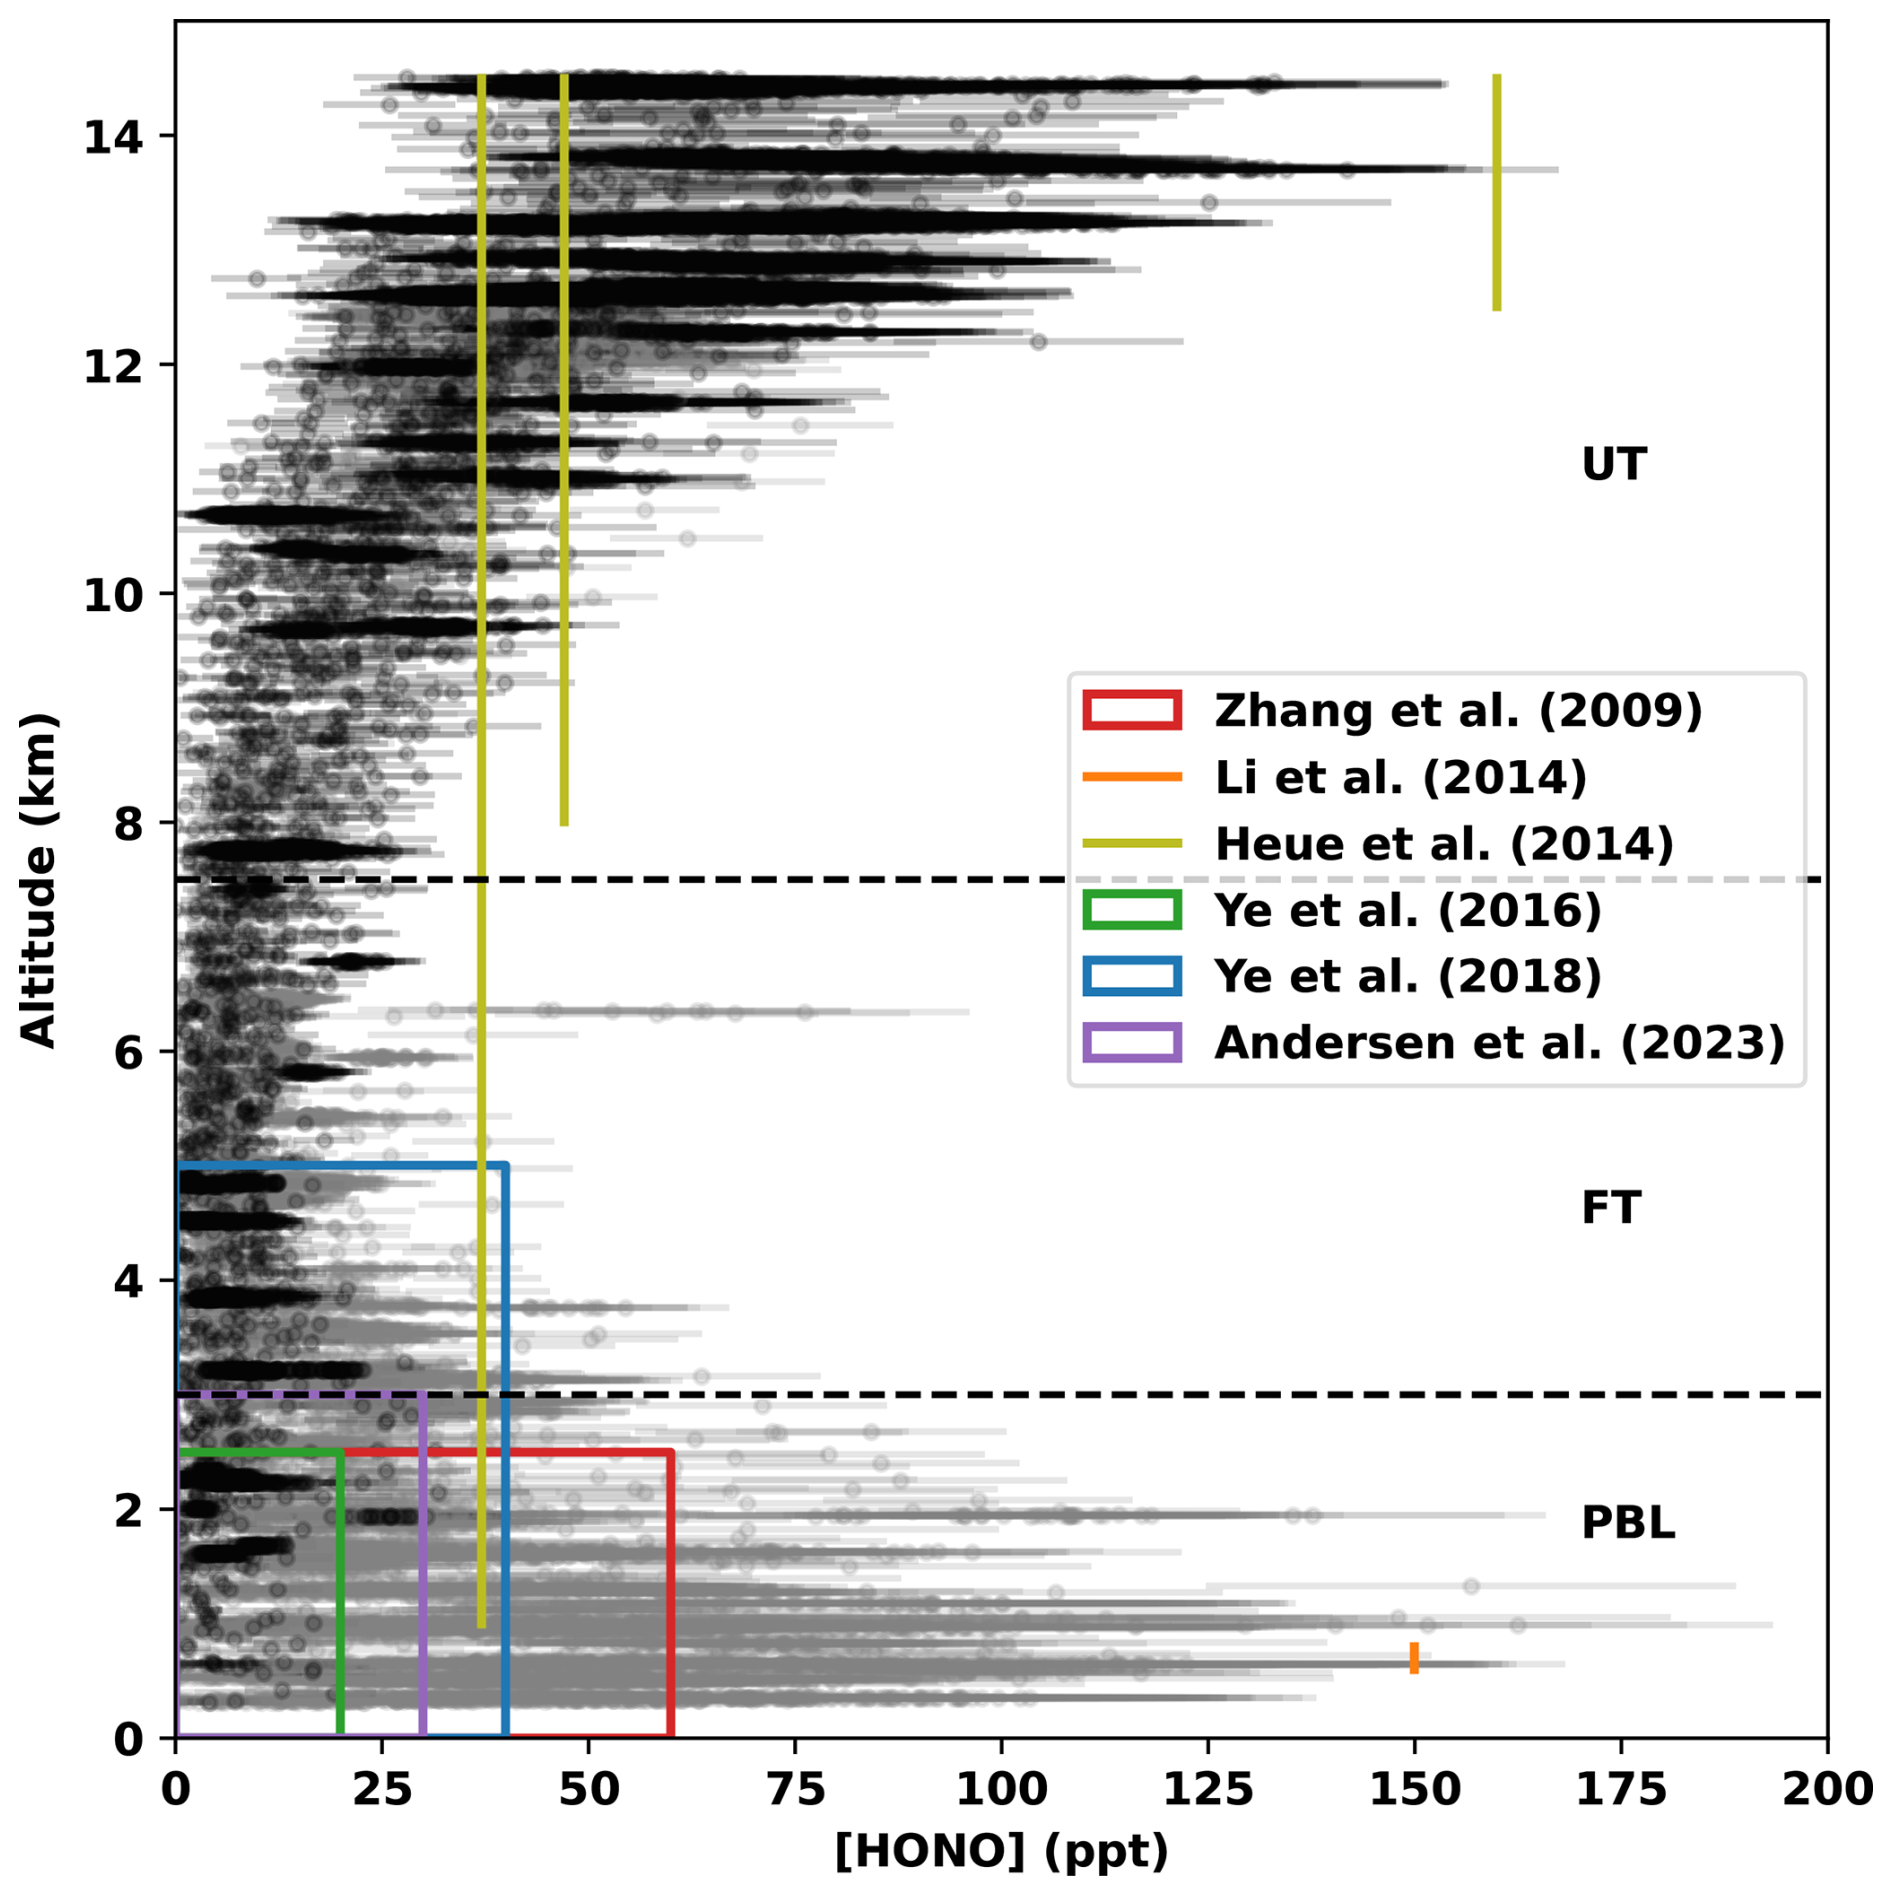
Figure 5Comparison of airborne HONO altitude profiles reported here, as well as regions representing the range of airborne HONO observations reported previously (Zhang et al., 2009; Li et al., 2014; Heue et al., 2014; Ye et al., 2016a, 2018; Andersen et al., 2023). Data from the EMeRGe missions is drawn in gray, data from the CAFE-Africa mission is drawn in black. Previously reported HONO observations from aircraft are limited to the LT with only one exception (Heue et al., 2014), the altitude of which is not precisely defined. The HONO VMRs reported by Heue et al. (2014) are converted from DOAS retrievals within a thunderstorm cloud and are sensitive to the assumed cloud height. The horizontal dashed-lines visually distinguish the PBL (Sect. 4.2), as well as the free (Sect. 4.3) and upper (Sect. 4.4) troposphere.
4.1 (Excess) HONO in the troposphere
The HONO VMRs retrieved from the mini-DOAS observations made on board HALO are high in the PBL and free troposphere (FT) (up to 150 ppt) for every flight of the EMeRGe mission (see Fig. 5) compared to our expectations from known homogeneous sources (Reactions R1 to R3). In addition, in the upper troposphere (UT), mixing ratios of up to 75 ppt were observed during the two flights of the EMeRGe-Asia mission which probed those altitudes. Comparatively little HONO is observed in the free troposphere (FT) (less than 50 ppt) in all missions. In comparison to the EMeRGe mission, where the flight tracks passed through highly polluted air masses, during the CAFE-Africa mission, which took place over the Atlantic Ocean, lower HONO VMRs are retrieved in the FT. Nevertheless, some tens of ppt are still observed within the MBL. In the UT, the HONO VMRs are elevated: more than 100 ppt during all flights of the CAFE-Africa mission. In summary, the HONO VMR measurements in EMeRGe-EU, EMeRGe-Asia and CAFE-Africa are consistently found to be in excess relative to the expectations based on the known gas phase formation mechanisms and thus model predictions (see below).
Zhang et al. (2009), Li et al. (2014), Heue et al. (2014), Ye et al. (2016b, 2018), Andersen et al. (2023) measured HONO from aircraft and a Zeppelin in disparate regions: over a forested region in North Michigan, over the Po Valley of Northern Italy, in a convective cloud over the Caribbean Sea, over the North Atlantic Ocean, over the southeastern US, and in the remote Atlantic troposphere, respectively. Given the individuality of each set of HONO observations, our measurements compare reasonably well, except for some peculiarities addressed below.
Figure 6 compares the HONO measured by the mini-DOAS instrument with the predictions of the EMAC and MECO(n) models. So far the EMAC and MECO(n) simulations only include the known gas phase formation mechanisms of HONO (Reactions R1 to R3).
For EMeRGe-EU, the EMAC model predicts at most 35 ppt of HONO along the flight track of the HALO aircraft in the boundary layer. The MECO(n) model, by comparison, predicts up to 60 ppt of HONO along the HALO flight track. Neither model predicts appreciable VMRs of HONO in the FT. During EMeRGe-Asia, the EMAC model predicts at most 16 ppt HONO in the PBL along the flight track. The MECO(n) model, by comparison, predicts up to 127 ppt of HONO there. While the MECO(n) model predicts only 2 ppt of HONO in the UT, the EMAC model predicts up to 10 ppt of HONO at 12 km altitude for the HALO flights from Taiwan towards Japan.
During both phases of EMeRGe (over Europe and Eastern Asia), the observed HONO VMRs exceed both models' predictions throughout the probed altitude ranges (see Fig. 6). During the European phase, the observations are in excess of model predictions by at least a factor of two, and up to a factor of five. During the Asian phase, the excess relative to predictions is model and altitude dependent and may exceed one order of magnitude. For the CAFE-Africa mission, only the EMAC model simulations are available for comparison. The retrieved HONO VMRs are here, again, much larger than the model predictions. The EMAC model correctly predicts the general shape of the retrieved HONO profiles, but on average predicts VMRs in the single digits (ppt), and never more than 18 ppt along the flight track of the HALO aircraft (at 12.5 km altitude).
Since there is general agreement between model predictions and observations of the mini-DOAS instrument for HCHO and NO2 (see Figs. A1 and A2 in the appendix), the discrepancies between model predicted HONO and the observations of the mini-DOAS instrument are unlikely to be due to the model resolution, instrumental or methodological issues. Rather, HONO formation in the troposphere (especially the UT) may act via a mechanism (or mechanisms) which are altogether not represented in the models.
While during the CAFE-Africa campaign, in situ measurements of OH, NO, and JHONO are available to quantify [HONO]PSS, the measured HONO is still in excess of what would be expected based on those measurements (see below).
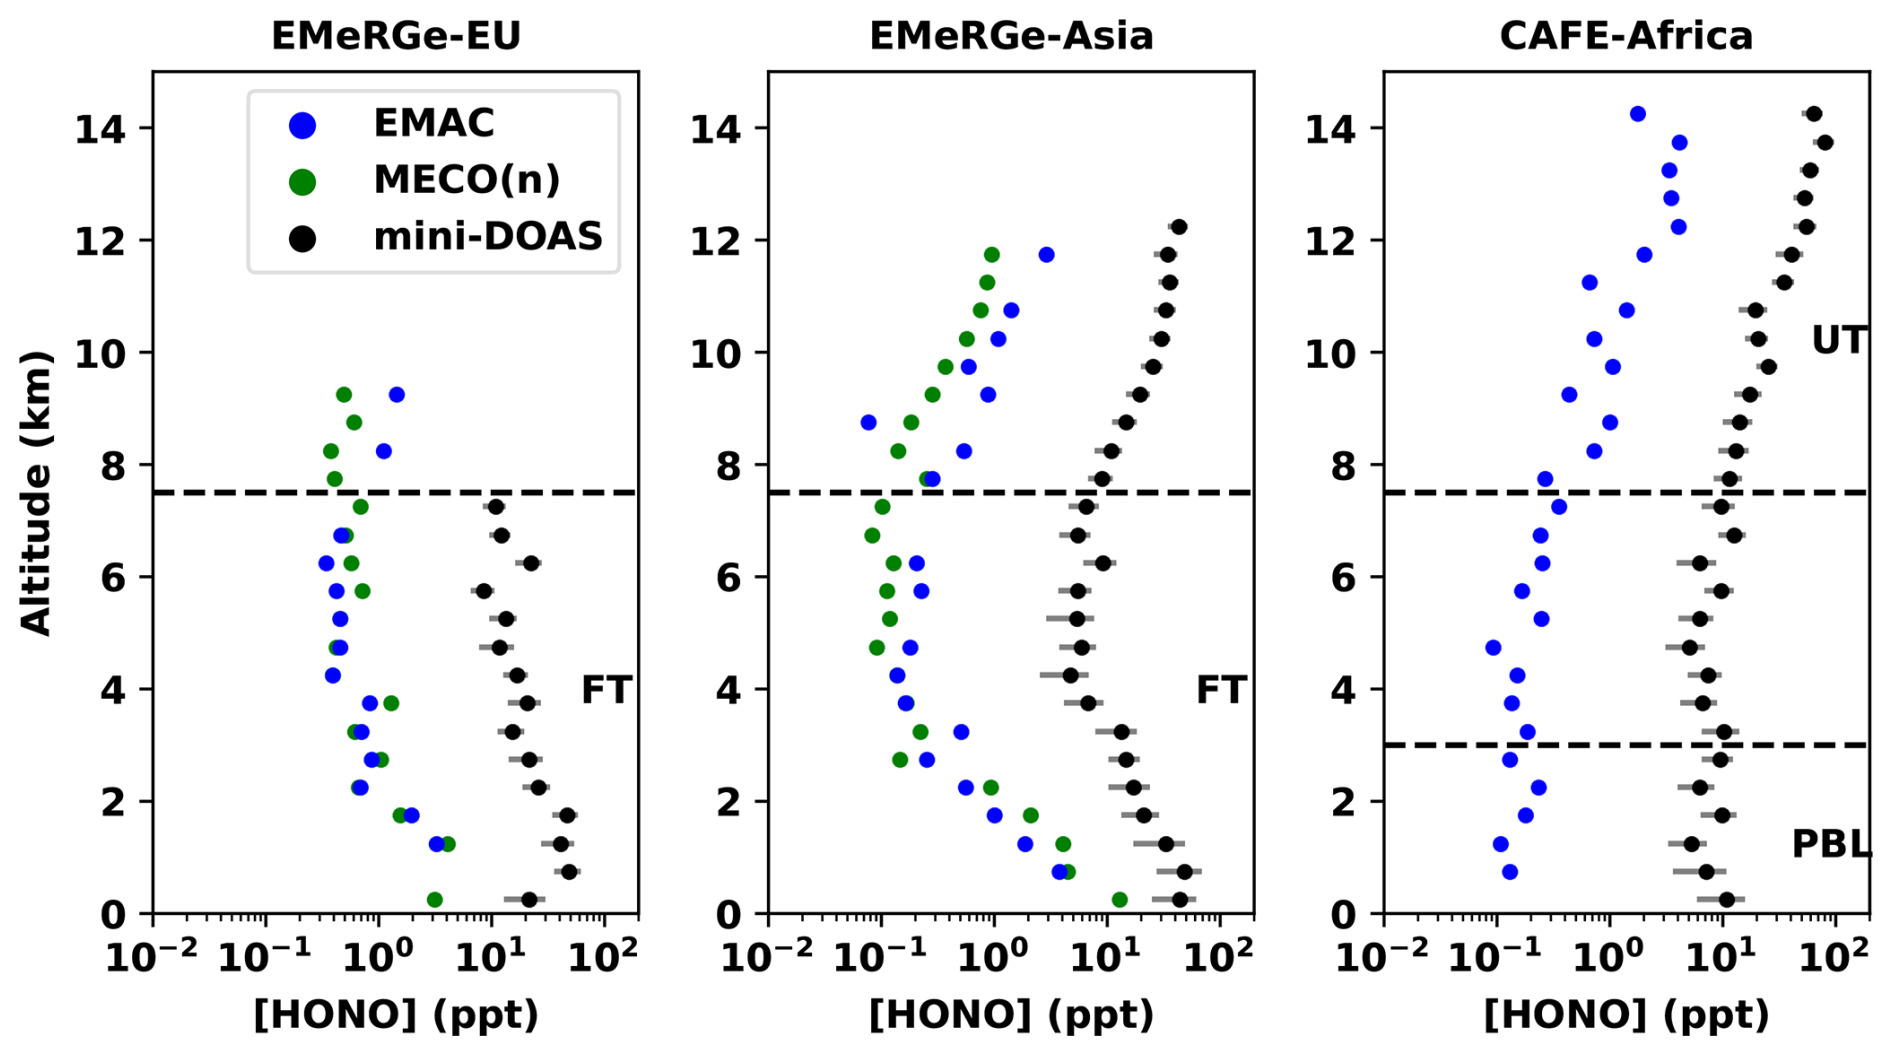
Figure 6Altitude profiles of HONO as observed by the mini-DOAS instrument (black – with uncertainty in gray), as predicted by the EMAC model (blue), and as predicted by the MECO(n) model (green), for the three research missions: EMeRGe-EU (left), EMeRGe-Asia (center), and CAFE-Africa (right). MECO(n) data is not available for the CAFE-Africa mission. Note the logarithmic x axes. VMRs are binned by 500 m altitude ranges. The horizontal dashed-lines visually distinguish the PBL (Sect. 4.2), the FT (Sect. 4.3) and UT (Sect. 4.4).
The excess HONO VMRs observed with the mini-DOAS instrument require explanation. In the low-NOx marine boundary layer (MBL), our observations largely corroborate previous HONO measurements performed with another technique (see Andersen et al., 2023), and thus also serve to validate both sets of measurements (see Sect. 4.2). The latter provides consistent evidence on the importance of particulate nitrate photolysis as the cause for observed HONO in the MBL (see Sect. 4.2). In the polluted PBL and FT more broadly, we investigate heterogeneous formation of HONO (Sect. 4.3). In the cold upper troposphere (UT), we suggest that a heretofore unknown gas-phase mechanism may produce HONO (Sect. 4.4).
4.2 (Excess) HONO in the MBL during CAFE-Africa: Further evidence of particulate nitrate photolysis
Within the low-NOx regime of the marine MBL, a growing body of research attempts to account for observed HONO VMRs by invoking the photolysis of particulate nitrate (Ye et al., 2016a; Reed et al., 2017; Andersen et al., 2023). While the photolysis frequency of particulate nitrate is not measured directly, it has been argued that it is possibly up to two orders of magnitude larger than the photolysis frequency of gaseous nitric acid (Ye et al., 2016a, 2017). The enhancement factors (EF) for nitrate photolysis, defined as
which are derived from field measurements have been significantly different from those determined in laboratories (Romer et al., 2018; Shi et al., 2021). Recently, Andersen et al. (2023) speculated that this discrepancy may arise from a saturation effect, whereby the EF decreases with increasing particulate nitrate concentration in the aerosols, although details of the underlying processes are unclear. Here, we follow the approach of Andersen et al. (2023) and construct the photolysis EF necessary to explain our HONO observations using measured quantities from around the Cape Verde Islands during the CAFE-Africa mission. In the low-NOx environment of the MBL, HONO production may be assumed to be largely driven by particulate nitrate photolysis. Under this assumption, as well as the assumption of a photo-stationary state, the EFs can be derived from the following:
Here, we only consider the HONO production channel from the photolysis of particulate nitrate.
During CAFE-Africa, the C-ToF-AMS instrument measured in sub-micron aerosol, which is unlikely to constitute the whole aerosol nitrate load, due to an unknown fraction tied in coarse mode aerosols (Hrdina et al., 2021). Unfortunately, even though information on the aerosol mass in the micron range is available from the SKY-OPC instrument, the nitrate fraction across different size regimes cannot be assumed to be constant (Lee et al., 2008) and therefore total particulate nitrate cannot be inferred. However, other quantities (NO, NO2, HONO, SAtotal, and ) measured from the HALO aircraft during the CAFE-Africa mission are largely in range of and thus corroborate the measurements of Andersen et al. (2023) for the MBL around the Cape Verde islands in summer.
Assuming that either (a) all aerosol nitrate resides in the sub-micron aerosols or that (b) only a fraction of total nitrates are found in the sub-micron aerosol (Hrdina et al., 2021) modulates the resultant EFs (panel a versus panel b in Fig. 7).
In both cases, a decrease in EFs with the particulate nitrate concentration is observed, in agreement with the findings of Andersen et al. (2023). Further, a more consistent picture arises compared to the findings of Andersen et al. (2023) when coarse mode nitrate is taken into account (panel b in Fig. 7). The missing HONO source strength and rate of particulate nitrate photolysis also then match better with those observed by Ye et al. (2016b) and Andersen et al. (2023).
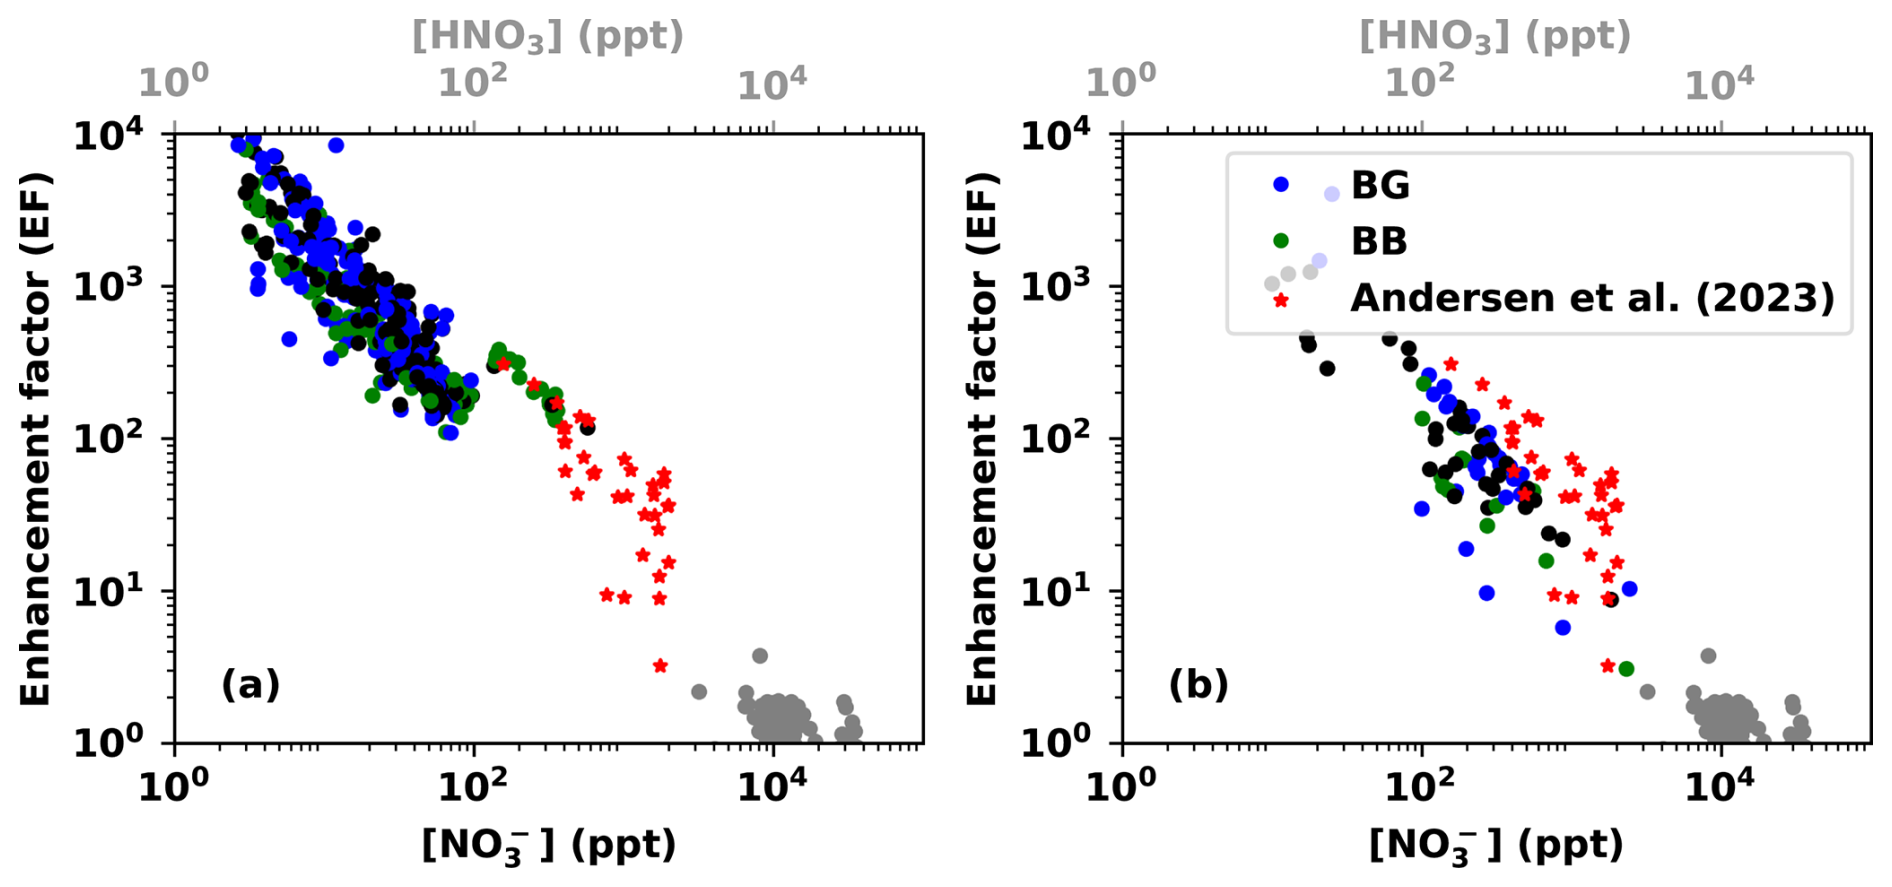
Figure 7Inferred enhancement factor (EF) in the photolysis frequency of particulate nitrate relative to that of gaseous nitric acid necessary to match the missing HONO source, plotted as a function of the (sub-micron) particulate nitrate VMR (ppt), when the measured sub-micron to total aerosol volume ratio is not taken into account (a). The color of the plotted point is indicative of the influence of biomass burning, shown in green, while background air is in blue. Data with missing tags are shown in black. For comparison, the data from Andersen et al. (2023) are shown as red stars. In gray, the EFs are calculated relative to the amount of HNO3 observed by the CIMS instrument. In panel (b), the observed sub-micron particulate nitrate concentration has been scaled by the ratio of coarse mode particle volume to fine mode particle volume, reducing the resulting EFs. Data are from the lowermost 3 km from flights to and from the island of Sal, Cape Verde in August 2018 during the CAFE-Africa mission. Note the logarithmic axes.
Moreover, the degree to which particulate nitrate photolysis can contribute to HONO formation can also be inferred from HNO3 as measured by the CIMS instrument and the photolysis frequency measured by the HALO-SR-A instrument. Note that the CIMS instrument was designed to measure PAN rather than nitric acid and (through use of a thermal dissociation inlet) not only measures gaseous nitric acid, but also detects some particulate at the same mass-to-charge ratio (62 and 190) if the nitrate is thermally labile (i.e. ammonium nitrate or HNO3 weakly bound to black carbon).
If all the HNO3 measured by the CIMS instrument were actually in particulate form rather than gas phase, the resulting high levels of particulate nitrate would mean that no enhancement in the frequency of particulate nitrate photolysis (relative to the frequency of gaseous nitric acid photolysis) would be necessary to explain our HONO observations. However, this is unlikely, as the HNO3 detected by the CIMS instrument exceeds the particulate nitrate measured by the C-ToF-AMS instrument by orders of magnitude, and the two are not strictly correlated.
Nevertheless, it can be seen that measured HNO3 concentrations only fit into the overall picture with EFs which reach unity under the assumptions that the measured HNO3 is actually particulate nitrate, and that the photolysis of particulate nitrate exclusively produces HONO. Otherwise, the quantum yield for HONO formation by HNO3 photolysis is much less than one, and it is unlikely that it contributes to re-noxification (or HONO formation) in the MBL.
4.3 HONO in the polluted PBL and FT during EMeRGe: Evidence for heterogeneous HONO formation?
The air masses sampled during EMeRGe-EU were primarily confined to the PBL and FT, particularly to less than 6 km altitude (Andrés Hernández et al., 2022). EMeRGe-EU is characterized by mostly continental background air, with some instances of anthropogenic influence (Förster et al., 2023); many of the air masses sampled were in high-NOx environments. The HONO VMRs observed in the PBL and FT during the EMeRGe-EU mission exceed predictions of the EMAC and MECO(n) models, which are based on gas phase production. Therefore, we next consider possible heterogeneous sources of HONO. Like the EMeRGe-EU mission, the -Asia mission was largely confined to the PBL and FT, with exceptions only during the final two flights leading from Taiwan towards Japan at high altitudes. The air masses sampled were high-NOx environments, and there was regular detection of benzene from anthropogenic plumes. In addition, the air masses sampled during EMeRGe-Asia were often influenced by biomass burning (Lin et al., 2023). Here, as before, HONO VMRs observed with the mini-DOAS instrument exceed model simulations. This excess HONO certainly requires heterogeneous sources beyond the photolysis of particulate nitrate.
In order to investigate if either (a) a specific parameter directly or (b) which of the many proposed HONO formation mechanisms listed in Table A1 correlates well with the observed HONO VMRs, for both options the Spearman correlations are investigated (Fig. 8, left column for case a and right column of case b). For case (b) the reactants from each formation mechanism are multiplied and their product is correlated with the observed HONO (Fig. 8, right column). Correlations are determined with the Spearman correlation coefficient rather than the Pearson coefficient, to account for the case that the relationship is non-linear (for example due to saturation effects). While the HONO formation rate necessary to match its loss via photolysis is what should be correlated with the reactants of these mechanisms, many include photolysis frequencies themselves. Therefore, the correlation analysis is performed against the retrieved HONO VMRs to avoid a correlation between photolysis frequencies measured by the HALO-SR-A instrument. Similarly, the correlations are determined between VMRs instead of concentrations to avoid correlations as a function of atmospheric density. Several of the in situ instruments have time resolutions of only 15, 30, or 60 s, so for each spectrum recorded by the mini-DOAS instrument, all data reported by the in situ instruments are averaged over the integration time of the mini-DOAS spectra (30 s). This down-sampling avoids interpolation or repeated values, which may lead to spurious or diluted correlations, respectively.
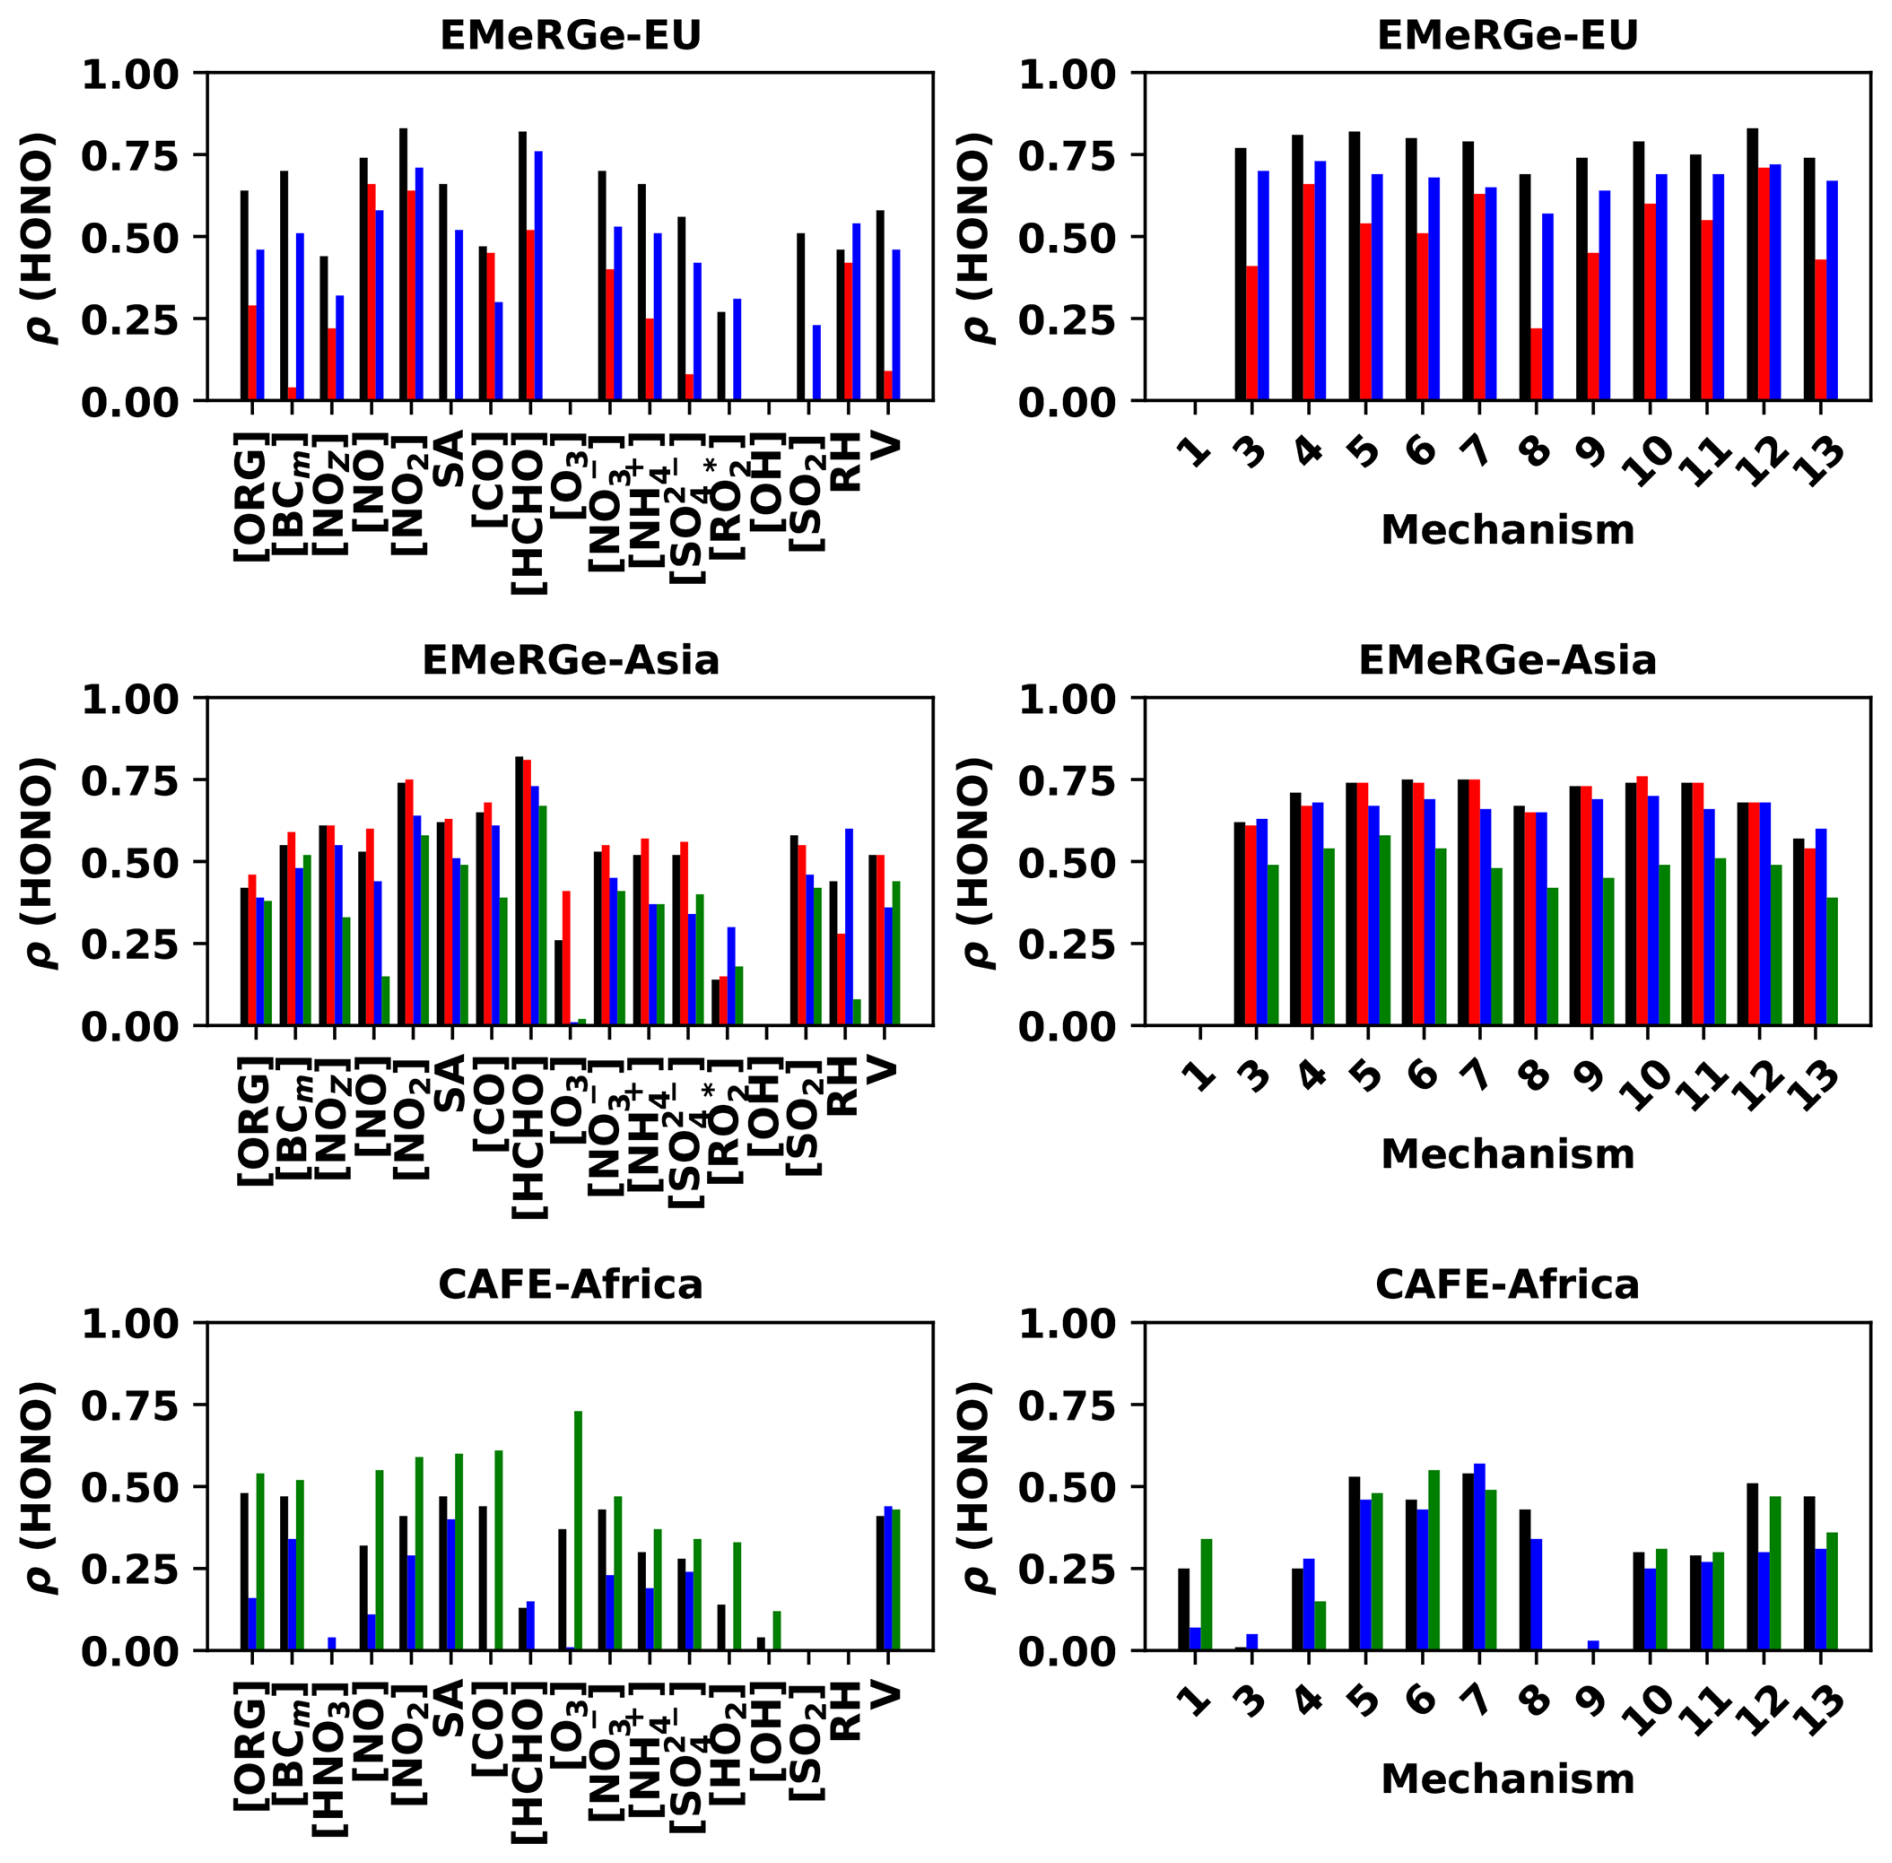
Figure 8Spearman correlation coefficients ρ between the observed HONO VMRs and other parameters simultaneously measured on board the HALO aircraft (left column) (for the measured parameters see Table 2) and the product of reactants of twelve of the thirteen HONO formation mechanisms listed in Table A1 (right column) for the EMeRGe-EU (upper), EMeRGe-Asia (middle), and CAFE-Africa (lower) missions. The data shown here is from the PBL and FT. The data in red, green, blue and black are those tagged as anthropogenic (AG), biomass burning (BB), background (BG), or all data, respectively. SA, RH, and V refer to aerosol surface area, relative humidity, and aerosol volume, respectively.
The observed HONO VMRs may however also be correlated directly with other gases and atmospheric parameters simultaneously observed on board the HALO aircraft. The trace gases retrieved with the mini-DOAS usually share a strong correlation (ρ>0.7). While the correlation between HCHO and HONO is not necessitated by their photochemical relationship, Hendrick et al. (2014) also observed a strong correlation of HONO with NO2. Since most of the heterogeneous sources of HONO proposed in Table A1 require NO2 as a reactant, the correlation between HONO and NO2 is to be expected. However, any correlation between the observed HONO and some other gas, parameter, or the product of the reactants of some hypothetical formation mechanism should ideally correlate more strongly than this threshold, i.e. the correlation with NO2 (0.7).
Furthermore, not all species listed in Table A1 were measured during the EMeRGe mission (for details see Andrés Hernández et al., 2022). Indeed, no instrumentation to detect nitro-phenols was available for any of the three missions, so Mechanism 2 is left out of this analysis entirely. Nitric acid data is unavailable during the EMeRGe mission, therefore a proxy (NOz) is constructed by subtracting NOx (NO + NO2) from the NOy measured by the AENEAS instrument. OH was measured during the CAFE-Africa mission but not during both EMeRGe missions, precluding analysis of Mechanism 1 for the latter, while measured may only serve as a proxy for HO2 during the EMeRGe missions.
The observed HONO correlates with several other simultaneously measured species, as well as with the formation mechanisms proposed in Table A1 (see Fig. 8). Unsurprisingly, the proposed formation mechanisms are correlated to varying strengths with the observed HONO. The strength of the Spearman correlation coefficient varies with air mass type (anthropogenic, biomass burning, background), so filtering the lower tropospheric EMeRGe data further according to air mass type yields different correlations.
Across the EMeRGe mission, in high-NOx air masses, nearly every mechanism correlates with the observed HONO. Separating the observations according to their air mass tags reveals that some correlations are weaker in the biomass burning plumes probed during EMeRGe-Asia and in anthropogenic air during EMeRGe-EU (see Fig. 8). The proposed formation mechanisms all have some humidity dependence, since water vapor is likely a necessary, but not sufficient, component of the formation of HONO in the PBL and FT.
Generally, Mechanisms 5, 7 and 12 are correlated best with the observed HONO in all probed environments, while Mechanisms 9, 10 and 11 only correlate with the observed HONO in the polluted high-NOx air masses during the EMeRGe mission. The lack of correlation between the observed HONO and Mechanisms 8 and 13 may arise from underestimation of measured particulate nitrate and gaseous nitric acid. Otherwise, the use of NOz as a proxy for HNO3 for the EMeRGe mission may obscure any correlation. The dependence of the EF for the photolysis of particulate nitrate on the nitrate load (see Sect. 4.2) may also confound a simple monotonic relationship between the observed HONO and the components of Mechanism 13. The observed HONO is correlated with the presence of NO2, daylight, and some catalytic surface (i.e. soot, mineral dust, organics) in all air masses, as well as with haze aerosol water reactions in polluted air masses and to a lesser extent with the photolysis of nitrates in pristine air masses.
Previous studies have found similar relationships between NO2, aerosol and HONO. Xing et al. (2023) found that the heterogeneous reaction of NO2 on aerosols produces HONO. The photolytic nature of heterogeneous HONO production has also been reported previously: Lee et al. (2016) found a HONO source from NO2 requiring sunlight. Zheng et al. (2020b), Jiang et al. (2020) and Yu et al. (2022) describe photo-enhanced heterogeneous conversion of NO2 to HONO on aerosol surfaces. Singh et al. (2021) found during eclipse conditions that the HONO source must be photochemical. Hu et al. (2022) speculated that the conversion of NO2 on BC enhanced by light may be a likely heterogeneous source of HONO, along with the photolysis of particulate nitrate.
This analysis is limited by the spatial and temporal resolutions of the mini-DOAS instrument, as well as those of the in situ instruments: the necessary down-sampling of parameters reported by in situ instruments may obscure correlations. Chemical interferences of the in situ instruments also obscure a precise attribution of observed HONO formation to a particular mechanism or even phase (Mechanisms 8 and 13). The suitability of proxies also limits the scope of the analysis, e.g. whether black carbon mass (or number) is a suitable proxy for the presence of soot, particularly fresh soot (Mechanism 5). NOz may be also a poor proxy for HNO3 (Mechanisms 8 and 9), while although HCHO is indicative of active VOC chemistry, it does not represent total VOCs (Mechanism 9). Moreover, volume, mass, and number of particles with a diameter larger than 500 nm are the only quantities available to determine the presence of dust (Mechanism 7).
We also lack any measurements of aerosol pH, while the aerosol water content is represented only by relative humidity. These variables are not directly interchangeable, but instrumentation to observe aerosol water content and pH directly were not present, and attempts to model aerosol water content and pH with ISORROPIA led to nonphysical results. Moreover, the amount of particulate ammonium is not synonymous with that of gas phase ammonia (Mechanism 10). Nor does the amount of aerosol sulfate equal that of gas phase SO2 (Mechanism 11). Indeed, the C-ToF-AMS instrument analyzes only non-refractory sub-micron aerosol and thereby presents an incomplete picture of the aerosol composition; a more complete aerosol chemical composition would be necessary to investigate Mechanisms 10, 11, 12, and especially 13 in more detail.
Moreover, the pH of haze is not well understood (Tao et al., 2020), though sub-micron aerosol is generally acidic (Weber et al., 2016). Aerosol acidity is lower in China than in Europe (Ding et al., 2019), in large part due to the partitioning of gas phase ammonia and particulate ammonium (Zheng et al., 2020a). Without measurements of these quantities (aerosol pH, gas phase ammonia), we can only observe the output of the aerosol chemistry. Further, the products of aerosol nitrate photolysis seem to also be pH dependent (Scharko et al., 2014; Benedict et al., 2017).
Fu et al. (2019) describe modeling of heterogeneous reactions on surfaces producing HONO, and reports improved model performance for O3 and PM2.5. In another modeling study, Zhang et al. (2021) found that HONO produced by heterogeneous reactions increased the concentration of OH by a factor of two, increased aerosol nitrate via the conversion of NO2, and increased SOA formation via reactions of OH with VOCs (see also Xing et al., 2019). Heterogeneous HONO formation mechanisms have also been implemented in a chemistry-climate model (Ha et al., 2023), where the heterogeneous formation reactions were found to contribute more to HONO formation than direct emissions, particularly those on aerosol surfaces. Heterogeneous HONO formation mechanisms in the LT then represent a critical subject in the understanding of tropospheric oxidation capacity.
In summary, because of the lack of data and/or the weak correlations inferred from the relevant parameters, we cannot firmly conclude on or reject any of the proposed heterogeneous HONO formation mechanisms listed in Table A1. Further, it is also likely that some HONO formation mechanisms act in parallel, though at varying strengths over time, which complicates deciphering the relevant HONO mechanisms from field data.
However, the field data easily allow inferring the necessary source strength for closing the excess HONO budget. The necessary source strength reaches up to 0.3 ppb h−1 in the MBL, up to 1 ppb h−1 in the polluted PBL, up to 0.6 ppb h−1 in the FT and ranges from 0.3 to 1.6 ppb h−1 in the UT. This may represent a significant modification to the oxidation capacity of the PBL and the lower part of the FT. Previously reported daytime heterogeneous HONO sources in the NOx polluted atmosphere include those reported by Li et al. (2012) (0.77 ppb h−1), Ryan et al. (2018) (1 ppb h−1), Jiang et al. (2020) (0.64 ppb h−1), and Yu et al. (2022) (0.65 ppb h−1), albeit at lower altitudes.
4.4 Gas phase formation and oxidation of peroxynitrous acid (HOONO): A possible explanation for excess-HONO in the cold UT?
HONO VMRs in the tropical UT inferred from the mini-DOAS measurements during the CAFE-Africa mission are largely more than (about a factor of five) what may be expected according to the known gas phase formation mechanisms and what is predicted by the EMAC model. While the presence of enhanced NOx and HOx from lightning are likely at these altitudes (Wennberg et al., 1998; Winterrath et al., 1999; Zhu et al., 2019; Mao et al., 2021; Brune et al., 2021; Tadic et al., 2021), the in situ measurements of NO and OH by the MPIC and of JHONO by the HALO-SR from on board the HALO aircraft allow us to quantify the gas phase formation of HONO and thus excess HONO (see Fig. 9). Meanwhile, heterogeneous formation of HONO by one of the processes listed in Table A1 can largely be excluded based on the low aerosol surface and the necessary HONO formation rates which are in the range of hundreds of ppt h−1.
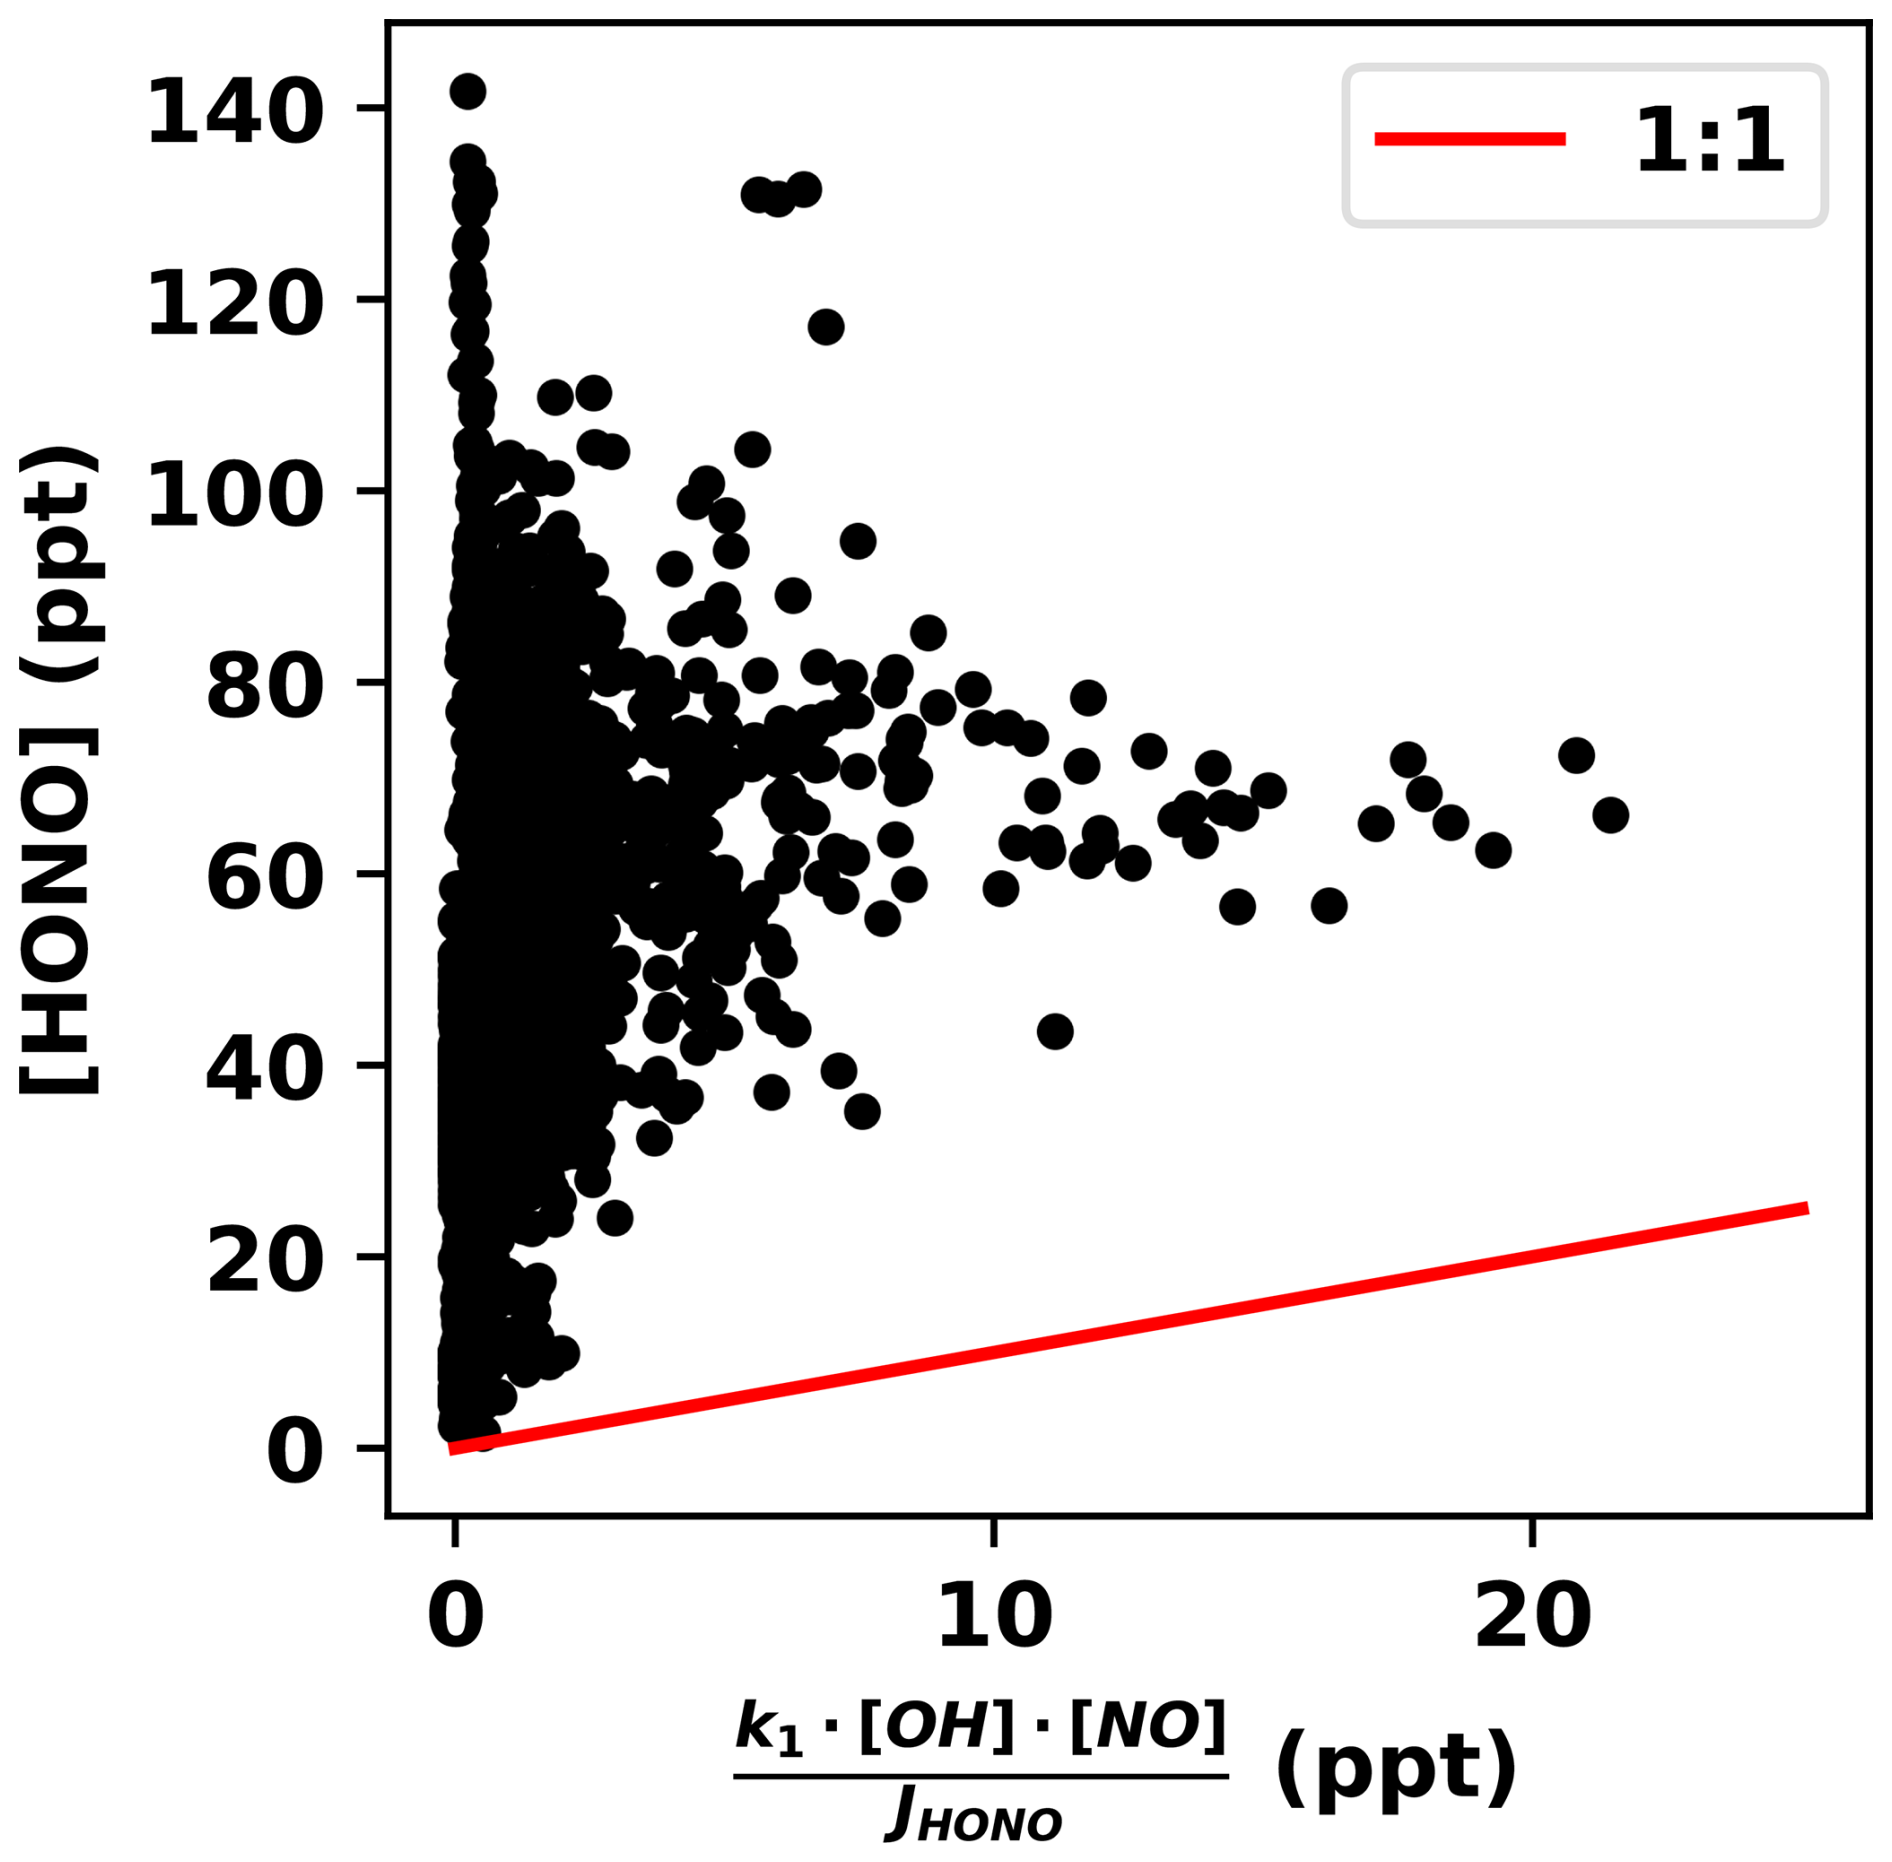
Figure 9[HONO] as measured by the mini-DOAS instrument plotted as a function of [HONO]PSS determined from in situ measurements of [OH], [NO], and JHONO. Data are from the UT, i.e. above 7.5 km altitude during the CAFE-Africa mission.
Unexpectedly high HONO SCDs have also previously been observed using DOAS measurements in the limb direction from a balloon in the vicinity of a cumulonimbus cloud reaching the tropopause over Northeastern Brazil on 13 June 2005, but due to some clouds within the line of sight, [HONO] could not be inferred (Kritten, 2009). Further, Heue et al. (2014) reported increased amounts of HONO (∼ 160 ppt) (and of HCHO and NOx) in a thunderstorm cloud probed by the CARIBIC flying laboratory (Civil Aircraft for the Regular investigation of the atmosphere based on an Instrument Container) over the Caribbean Sea in August 2011. Recent studies (Brune et al., 2021; Jenkins and Brune, 2025) highlight that oxidants and indeed HONO may be produced by lightning. Such extreme HONO production events in the vicinity of thunderstorm clouds may explain the variable HONO VMRs retrieved by the mini-DOAS at constant altitude, given the averaging volume of the scaling method compared to the in-situ measurements of NO, OH, and JHONO.
In contrast, a preliminary analysis of spectra collected in polar air-masses in the low-NOx UT indicates only 15 ppt of HONO, an order of magnitude less than the VMRs observed during CAFE-Africa. The excess HONO observed in the UT during CAFE-Africa as well as EMeRGe-Asia (see Fig. 6) then indicates the necessity of sufficient NOx precursors.
Another indication of the present deficit in our understanding of the coupled NOx and HOx cycles in the UT comes from two findings. First, it has been known for some time that in the UT, the measured (Leighton) ratio is often much larger than modeled when accounting for all known NO oxidants (Silvern et al., 2018; Shah et al., 2023). Second, also based on measurements of OH and HO2 (or HOx in the UT at twilight), Wennberg et al. (1999) speculated on a photolytic pathway for HO2 production by peroxynitric acid (HNO4) photolysis in the wavelength range nm.
Here, we suggest and investigate in some detail another explanation to reconcile our findings and the findings listed above, i.e. the existence of peroxynitrous acid (HOONO) in the cold UT, a potential intermediate candidate to form HONO and a so far overlooked species in the coupling of the NOx and HOx cycles.
Based on the suggestion of Amedro et al. (2020) that peroxynitrous acid (HOONO) may be present in the UT, we investigated its potential role to explain (a) our observation of excess HONO, (b) help to close the gap between measured and modeled and (c) provide a source for additional HO2 at twilight in the UT.
Unfortunately, to date there are no reported measurements of HOONO in the atmosphere, but there are a wealth of experimental and theoretical studies on HOONO available, from which some information can be gained for our study (Golden et al., 2003; Zhu and Lin, 2003; Bohn and Zetzsch, 1997; Fry et al., 2004; Zhang and Donahue, 2006; Mollner et al., 2010; Bean et al., 2003; Chebbi et al., 2024; Butkovskaya et al., 2007). Unfortunately, most studies involve warmer (ambient) temperatures than relevant for the upper troposphere ≤220 K, which at present may limit a further quantification of the role HOONO may play in the UT.
Given the body of information already available on HOONO, there are several open questions regarding its potential role in UT photochemistry: (1) which reactions produce and destroy HOONO in the cold UT? (2) what are their temperature and pressure dependencies? (3) how much HOONO can be expected to be found in the cold UT? (4) may photochemical reactions of HOONO with oxidants efficiently produce HONO?
Accordingly, in the following we briefly review several theoretical and experimental studies of HOONO to determine what is known or controversial about the formation of HOONO in the atmosphere (for a possible reaction diagram see Fig. A4 in the appendix).
From theoretical and laboratory studies, it is known that HOONO forms in a side channel (8 %) of the well studied reaction of OH and NO2 which otherwise forms nitric acid (Mollner et al., 2010):
Moreover, Butkovskaya et al. (2007) suggested that again in a side channel (or as an intermediate) the reaction of HO2 and NO into OH and NO2:
may not only produce nitric acid,
while ab initio and master equation studies (Zhu and Lin, 2003; Zhang and Donahue, 2006) suggest that Reaction (R6) may proceed via HOONO as an intermediate.
These reactions are summarized in Fig. A4 in the appendix.
While unimolecular thermal decay is rapid at room temperatures, under the temperature and pressure conditions of the UT, the loss coefficient for thermal decomposition recommended by the IUPAC is 10−6 s−1 (Golden et al., 2003). While such a slow decay could lead to some 80 ppt of HOONO in the UT, this is very much an upper bound and will be reduced by UV photolysis and reaction with OH (Fry et al., 2004).
Of note is that since most if not all laboratory studies of HOONO were conducted at room temperature, the short lifetime of HOONO may have obscured details of its unimolecular decay, unlike the information provided by theoretical studies. However, these theoretical studies suggest that in the cold UT, the known thermal decomposition of HOONO into its products OH and NO2 may take up to 14 d, and therefore sizable amounts of HOONO would build up in this part of the atmosphere.
More recent studies also calculated the photolysis frequency of HOONO in the IR or UV. It was found that the lifetime of HOONO against photolysis may be limited to 45 h in the IR (Fry et al., 2004) and 30 min in the UV (Chebbi et al., 2024).
Noteworthy is also, that neither unimolecular decay nor photolysis of HOONO would produce HONO, since besides being thermo-chemically unfavorable, it would require a rearrangement of the host molecule.
Further, since all reactive nitrogen may not build up as HOONO, it must be removed from the UT by either photolysis, or oxidation or both (see below). However, unless the photolysis rate of HOONO proceeds apace of the HONO photolysis rate, it cannot explain our HONO observations.
Instead, we further discuss thermo-chemically favorable loss mechanisms of HOONO, specifically three reactions which on paper lead from HOONO to HONO.
In order to investigate the steady state abundance of the relevant species (HOONO, HO2, NO, NO2, HONO, …) from which the required reaction rate coefficients for both the formation and destruction of HOONO can be estimated, we use on board measured photolysis frequencies and VMRs of OH, NO, HO2, NO2, HONO, and O3 .
By considering a PSS, we quantify the reaction rate coefficients needed for the formation of relevant amounts of HOONO and oxidation into HONO at UT temperatures. From the known HONO destruction rate (JHONO [HONO]) of hundreds of ppt h−1, we can determine the required production rate of HONO and hence the production rate of HOONO (k(R7) [HO2] [NO] + k(R4) [HO] [NO2]) and finally the reaction rate with an unknown oxidant (X) leading to HONO.
In consequence, the necessary production rate of HONO is
Since in the UT, [HO2] is much more abundant than [OH], the reaction of OH with NO2 can be discarded in this context.
In the following, we consider three potential oxidants: O3, OH, and NO (=X), of which the reactions with HOONO are all exothermic (see Table A3).
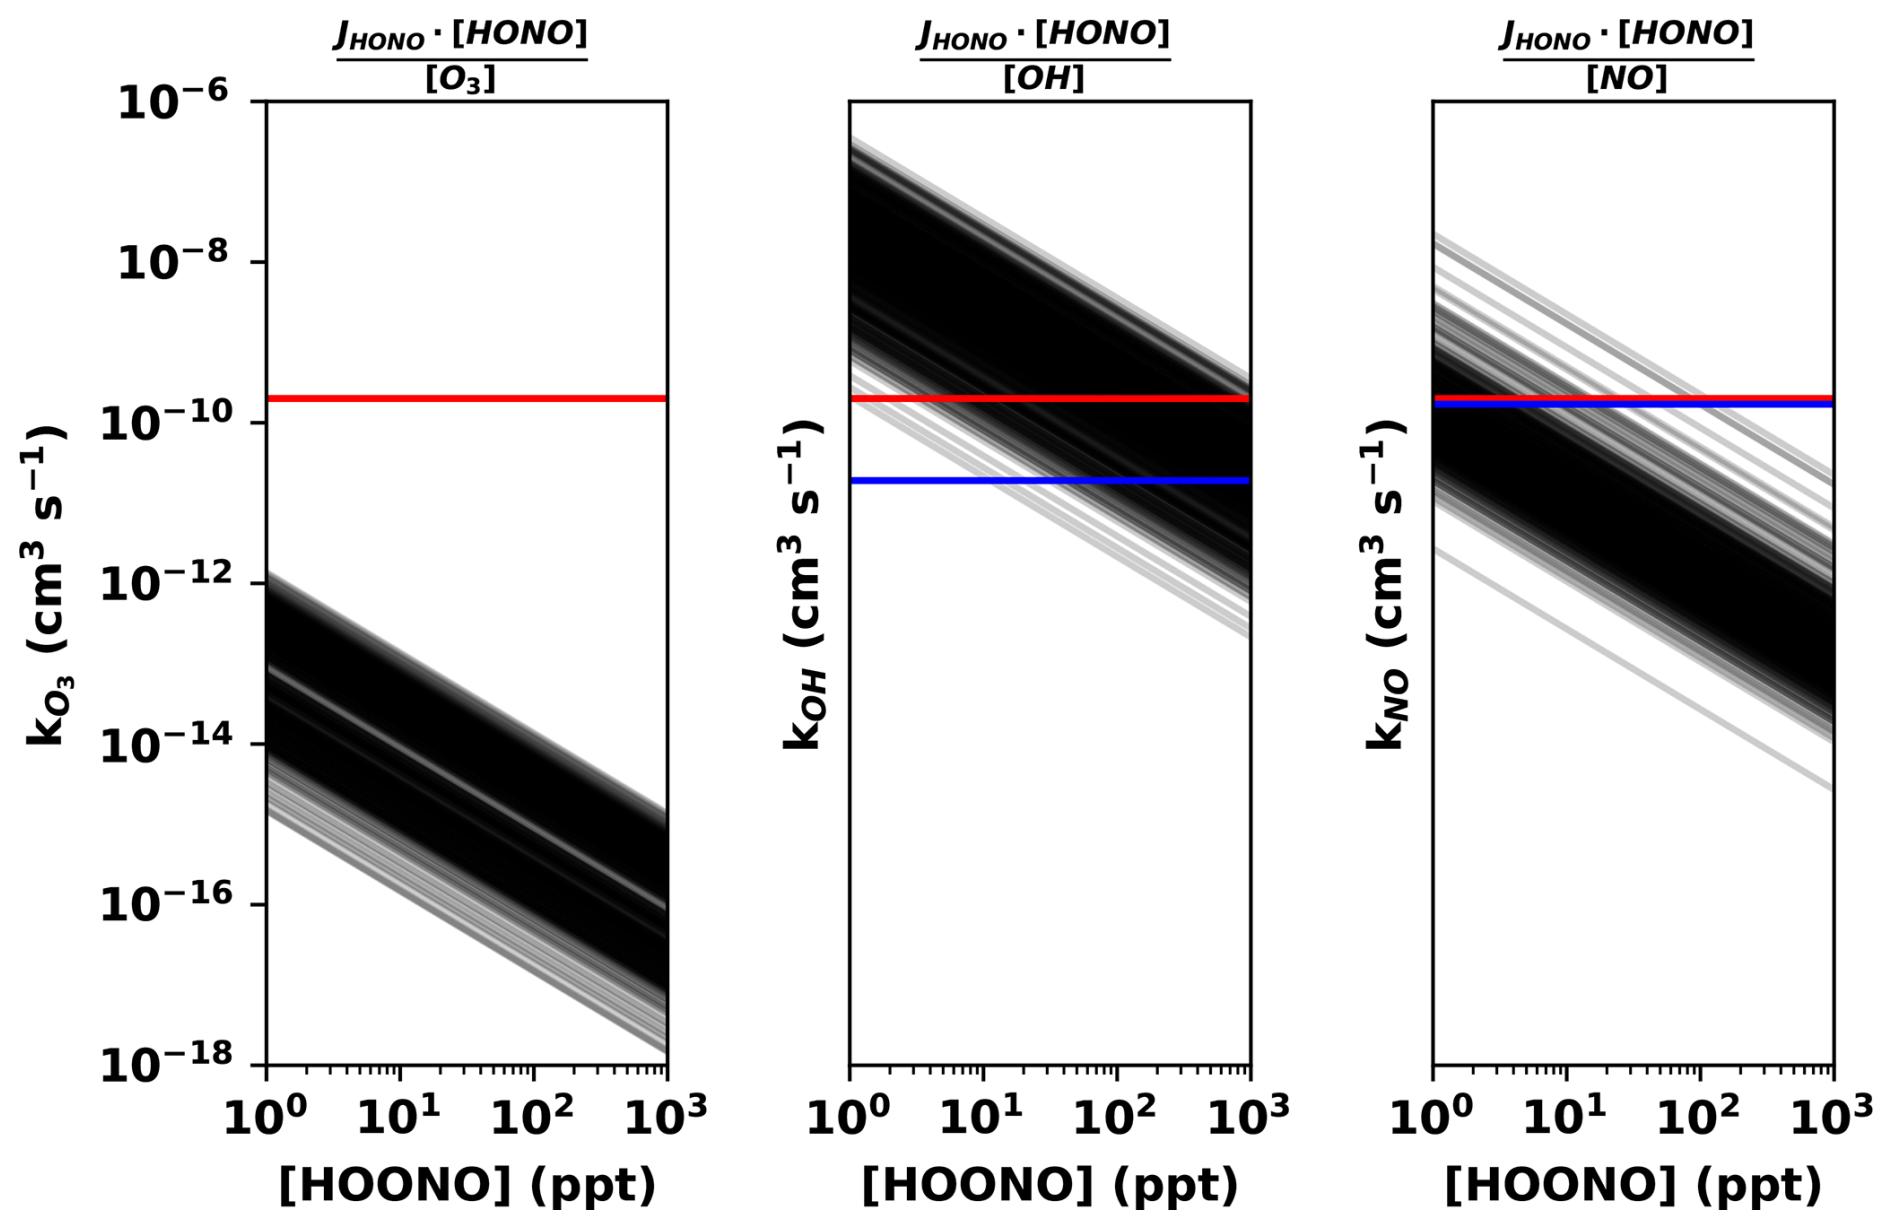
Figure 10Required (two body) reaction rate coefficient kX to solve Eq. (5) for measured concentrations of O3, OH, and NO (=X) as a function of assumed HOONO VMRs. Each straight black line represent a single measurement of the involved species from the CAFE-Africa mission, i.e. data from eleven CAFE-Africa flights visually overlap. The horizontal red line in each panel represents the maximum reaction rate coefficient possible if each collision of the reactants would be successful. Accounting for activation energies reduces the upper bound further (blue lines); the upper bound for O3 is 14 orders of magnitude below the graph at this scale. The steric effects (due to the relative orientations of the reactants) would further reduce the reaction rate in practice. Note the logarithmic axes.
In the absence of kinetic data or quantum chemical calculations regarding the reaction of HOONO with X and by rearrangement of Eq. (5), we estimate the necessary reaction rate coefficients as a function of HOONO, for each (see Fig. 10).
It is unlikely that the reaction of HOONO with OH may explain our HONO observations (see Fig. 10), since the necessary reaction rate coefficient exceeds the maximum possible gas phase reaction rate coefficient for most measurements of OH, unless more than 1 ppb HOONO is assumed (which would often exceed the NOy budget in the UT (Wei et al., 2025)).
Meanwhile, the necessary reaction of HOONO with NO could explain a HONO source term if HOONO is found in the tens of ppt, as is predicted by Amedro et al. (2020), and O3 is abundant enough to explain a potential HONO source term, provided that HOONO exists only in the parts per trillion. However, both reactions would have a significant effect on the nitrogen and ozone budgets of the UT, which for ozone is unlikely based on field observations. Here, the necessary reaction of HOONO with O3 would create an unlikely several ppb per day loss term for O3 in the UT (), which is not observed (Nussbaumer et al., 2023). Also, Reaction (R8) would require a rearrangement of intramolecular (bonded) O atoms through potentially large energy barriers, which is rather unlikely. Both arguments practically exclude Reaction (R8).
The proposed reaction of HOONO with NO would produce NO2, creating a net-zero effect on the nitrogen budget by substituting Reactions (R7) and (R10) for Reaction (R5), followed by the photolysis of HONO into OH and NO.
In this way, HOONO would act as a reservoir of NO2 (and HOx), biasing atmospheric measurements of NO2 at temperatures sufficient to thermally dissociate HOONO (see Silvern et al., 2018; Nussbaumer et al., 2021a; Shah et al., 2023). Since OH would be recycled in the photolysis of HONO, the formation of HOONO and reaction with NO would also not have an impact on HOx in the UT, but HOONO would simply serve as a temporary reservoir for OH.
Figure 10 indicates plausible pathways for the production of HONO from HOONO. However, there remain some open questions:
-
Past laboratory studies of the HO2 + NO reaction have been performed at or near room temperature (Bohn and Zetzsch, 1997; Mertens et al., 2022), where HOONO would thermally decompose faster than the time frame given by the experiment, which would preclude HOONO detection. Further, the presence of NO in the reaction chamber would potentially destroy HOONO. On the other hand, Butkovskaya et al. (2005, 2007) only measure some of the relevant species, precluding the detection of intermediates entirely. To what extent could the formation/presence of HOONO have been overlooked in these experiments? To date, only Butkovskaya et al. (2005, 2007) conducted experiments at these cold temperatures of the UT, and their results remain uncorroborated.
-
The formation of HOONO via Reaction (R7) is potentially much more efficient than by Reaction (R4), and the reactants are also more abundant in the UT during the CAFE-Africa mission (OH ≈1 ppt, NO2 < 100 ppt, NO >> 100 ppt, HO2 ≈ 10 ppt). If Reaction (R4) produces HOONO at a sufficient rate to accumulate tens of ppt of HOONO in the UT against thermal decomposition or photolysis (Amedro et al., 2020), then even a minor branching ratio between Reactions (R7) and (R5) would significantly increase the production (and therefore concentration) of HOONO (and potentially HONO) expected in the cold UT.
Our HONO measurements in the UT during CAFE-Africa offer a new line of evidence regarding necessary modifications of the NOx and HOx photochemistry in the cold UT. Peroxynitrous acid may become a precursor for HONO only if it is formed at a sufficient yield by Reaction (R7), survives thermal decomposition at the cold temperatures of the UT, and reacts with some oxidant at a sufficient rate to sustain HONO formation against its loss via photolysis. Here, we show that the reaction of HOONO with NO or O3 is possible only on thermochemical grounds, and while the abundances of O3 and NO are sufficiently large, kinetic data at low temperatures (and pressures) are still missing. Whether the potential formation of HOONO via Reaction (R7) is fast enough to sustain the reservoir is also unclear.
Most necessary to investigate this subject further are measurements of HOONO and its photolysis frequency in the atmosphere. In the absence of HOONO measurements, the mechanism may be inferred by observing HONO formation, or OH-HO2 cycle chain lengths under certain conditions. The reaction rate coefficient of Reaction (R7) needs to be quantified in the laboratory, especially at cold temperatures. Experimental and quantum chemical investigations of the potential reactions of HOONO with e.g. NO, O3 are essential to reduce uncertainty regarding the lifetime and fate of HOONO and the potential for it to be a significant source of HONO in the UT.
Discussions among the co-authors suggested HONO formation mechanisms which share reactants with those listed in Table A1, which this analysis cannot entirely exclude. For example, the reaction of HO2 with NO2, which has been determined to be negligible (Graham et al., 1977), is similar to mechanism 3. The ostensibly heterogeneous reaction of HNO3 with HCHO suggested by Chatfield (1994) may be investigated with the correlations of mechanism 9. Mechanism 6, the reaction of N2O4 – the formation of which is temperature dependent – on water surfaces (Horváth et al., 1988), should be more relevant in the UT. Unfortunately, aerosol surface area is limited within the air masses observed during the CAFE-Africa mission and correlation analysis does not validate any particular formation mechanism (see Fig. A3 in the appendix). These and other gas phase reactions and heterogeneous routes to HONO should be investigated in a study on the global atmospheric budget of HONO.
The present study reports on novel airborne remote sensing observations of nitrous acid in the troposphere from the HALO aircraft during 25 scientific flights of the EMeRGe-EU, -Asia, and CAFE-Africa missions in summer 2017, spring 2018, and fall 2018, respectively. This work encompasses 200 DOAS retrievals of SCDs of O3, O4, NO2, HCHO and HONO, in the UV-A and visible wavelength ranges, which are converted to VMRs using the O3/O4 scaling method. The observations of nitrous acid are complemented by coincident measurements of HCHO and NO2, as well as simultaneous measurements of other trace gases and atmospheric parameters from a suite of in situ instruments on board the HALO aircraft. The atmospheric chemistry models EMAC and MECO(n) provide simulations for a priori information and post analysis comparison.
Since no other in situ instrument on board the HALO aircraft measures HONO, our mini-DOAS HONO measurements can only be compared with HONO measurements in climatologically similar conditions (a) made by a different technique within in the MBL around the Cape Verde Islands, (b) those made within the PBL, FT and UT made elsewhere in the world, and (c) model predictions (see Fig. 5 and related references). For the latter it is in general found that, both the EMAC and MECO(n) models predict less HONO than is observed during all missions. This excess HONO has been observed in previous studies in the boundary layer and free troposphere (e.g. Li et al., 2014; Lee et al., 2016; Jiang et al., 2020), but rarely from aircraft, especially in the UT. Elevated HONO is often observed in the PBL and FT, and has only previously been reported in the UT from air-borne DOAS measurements.
While the HCHO and NO2 measurements compare well to model predictions, the observed HONO VMRs exceed model predictions by more than a factor of five and often up to an order of magnitude. Given the lifetime of HONO against photolysis (approximately 8–12 min according to the measurements of the HALO-SR-A instrument) and the time scales for vertical transport, the HONO measured outside the lower boundary layer cannot be explained by surface fluxes, especially the elevated HONO observed in the FT and UT. This work therefore presents further compelling evidence for unidentified HONO sources in the troposphere, though the dominant HONO production mechanism may change with altitude and ambient conditions. Also, since these HONO production mechanisms may operate in parallel at varying strength, it is difficult or even impossible to decipher their relative strengths at any time and location without additional information, i.e. measurements of the relevant parameters (as evidenced in Table A1).
The HONO measured in the MBL at low-NOx concentrations during the CAFE-Africa mission over the tropical Atlantic largely corroborates the findings, i.e. the potential production of HONO by nitrate photolysis, of Andersen et al. (2023) in the same region. This agreement of HONO measured with two different techniques in similar ambient conditions provides further evidence that the excess HONO observed with the mini-DOAS instrument is not due to methodological issues related to the employed limb spectroscopy. Moreover, the observed HONO in the 10 to 20 ppt range may be explained primarily by the photolysis of nitrates, in agreement with previous studies (Ye et al., 2016b; Reed et al., 2017; Andersen et al., 2023). In particular, the EF in the frequency of particulate nitrate photolysis (relative to the photolysis frequency of gaseous nitric acid) is found to depend on the nitrate load. Unfortunately, our inferred EF cannot be precisely determined with the instruments on board the HALO aircraft, since only a minor fraction of total particulate nitrate was measured.
Within more polluted air masses, observed HONO may not be explained by the photolysis of nitrates alone. Excess HONO observed during the EMeRGe missions is largely confined to the PBL and FT, where most species implicated in the literature as potential HONO sources also have elevated VMRs, especially in the high-NOx polluted boundary layer probed during those missions. Determining a single dominant HONO source in this context proves confounding. Several mechanisms may work in concert, depending on the chemical composition of the specific air mass being probed. In general, the reaction of NO2 on humid aerosol surfaces are photo-sensitized or -catalyzed and are likely to be relevant in the context of our measurements. This study joins several others which find that HONO is related to production from photo-sensitized reactions of NO2 (Lee et al., 2016; Zheng et al., 2020b; Jiang et al., 2020; Singh et al., 2021; Yu et al., 2022; Hu et al., 2022; Xing et al., 2023). More precisely determining a specific heterogeneous HONO formation mechanism would require additional instrumentation to quantify the pH of the aerosol, total nitrate load, mineral dust concentrations, etc.
While much of the excess HONO observed during the EMeRGe and CAFE-Africa missions in the PBL and FT can be attributed to formation mechanisms described as heterogeneous, excess HONO in the UT requires an alternative explanation given the timescale for uptake of HONO precursors on aerosols and the required rate of HONO formation. Gas phase explanations in the UT also require a quantification of the HOx and NOx budgets. During the EMeRGe missions, coincidentally measured species did not include OH (or HO2, but ), precluding analysis of the HOx budget in the UT. Furthermore, measurements of HNO3 – which enable an analysis of the NOy budget – are not available.
Excess HONO (relative to the PSS HONO from measured NO, OH, and JHONO) was also observed during the CAFE-Africa mission within the cold UT. Here, measurements of OH, NO2, NO, and HO2 enable the analysis of the HOx and NOx budgets. An investigation into the possibility of a gas phase HONO source, namely the oxidation of HOONO by OH, NO, or O3, raises several hypotheses regarding the as yet largely unexplored photochemistry of HOONO at cold temperatures. In the absence of HOONO measurements in the atmosphere, and lacking kinetic data on HOONO formation and destruction at cold temperatures, our hypotheses that HONO is possibly formed by reactions of NO with HOONO is largely speculative.
The ubiquitous presence of HONO in the troposphere suggests that inconsistencies with models are not from a misunderstood emission strength, but rather a lack of representation and quantification of the reactions which produce HONO (Akimoto and Tanimoto, 2021). Attempts to model heterogeneous HONO formation mechanisms (Fu et al., 2019; Zhang et al., 2021; Ha et al., 2023) narrow (but do not close) the gap between measurements and models. Meanwhile, unquantified NOx reservoirs evidenced by observed Leighton ratios (Silvern et al., 2018), as well as sources of HOx (Wennberg et al., 1999) in the UT may arise from the presence of HONO and HOONO at those altitudes.
This study joins a limited set of airborne HONO observations in the upper boundary layer, free and UT under different photochemical conditions (Zhang et al., 2009; Heue et al., 2014; Li et al., 2014; Neuman et al., 2016; Ye et al., 2016b, 2018; Andersen et al., 2023). To our knowledge, the observations reported here represent the most extensive measurements of HONO in the atmosphere to date. The mini-DOAS instrument has been deployed on several other missions of the HALO aircraft around the globe, the analysis of which may complement the present study, to illuminate the presence and formation mechanism(s) of HONO in the troposphere.
The results of our study clearly indicate that further investigation of the presence and formation mechanism(s) of HONO in the troposphere is necessary. These airborne observations of excess HONO in the UT urgently require corroborating studies in the laboratory and field. For an improved understanding of excess HONO in the polluted BL and FT, instruments which provide a more complete picture of the aerosol chemical composition and pH would behoove any further investigation. Indeed, it is rather likely that HONO is formed via multiple mechanisms, depending on the chemical composition of the air masses.
Future missions of the HALO aircraft which investigate tropospheric photochemistry should include measurements of HONO, since it is central to understand the HOx budget and the oxidation capacity of the troposphere. Within the present study, the HONO budget could not be closed, therefore further study would require simultaneous airborne measurements of all species relevant to potential HONO formation mechanisms, in particular OH, NO, NO2, HO2, HNO3, HOONO and HNO4, as well as relevant aerosol parameters (e.g. chemical composition, pH, and water content). Additionally, instrumentation to determine the presence of ice-clouds would benefit the investigation of HONO formation.
The observed HONO, upon photolysis, represents an OH source term with a strength of up to 0.25 ppt s−1 or 0.9 ppb h−1, depending on the altitude, location, and photochemical regime. This represents a significant source of OH in the troposphere, thereby affecting the atmospheric lifetime (and consequent radiative forcing) of greenhouse gases, such as methane. The presence and sources of HONO in the troposphere thereby affects our understanding of climate change, the fate of most air pollutants, and consequently, human health.
Table A1Homogeneous (gas phase) and heterogeneous (mixed phase) HONO formation mechanisms investigated in past studies.
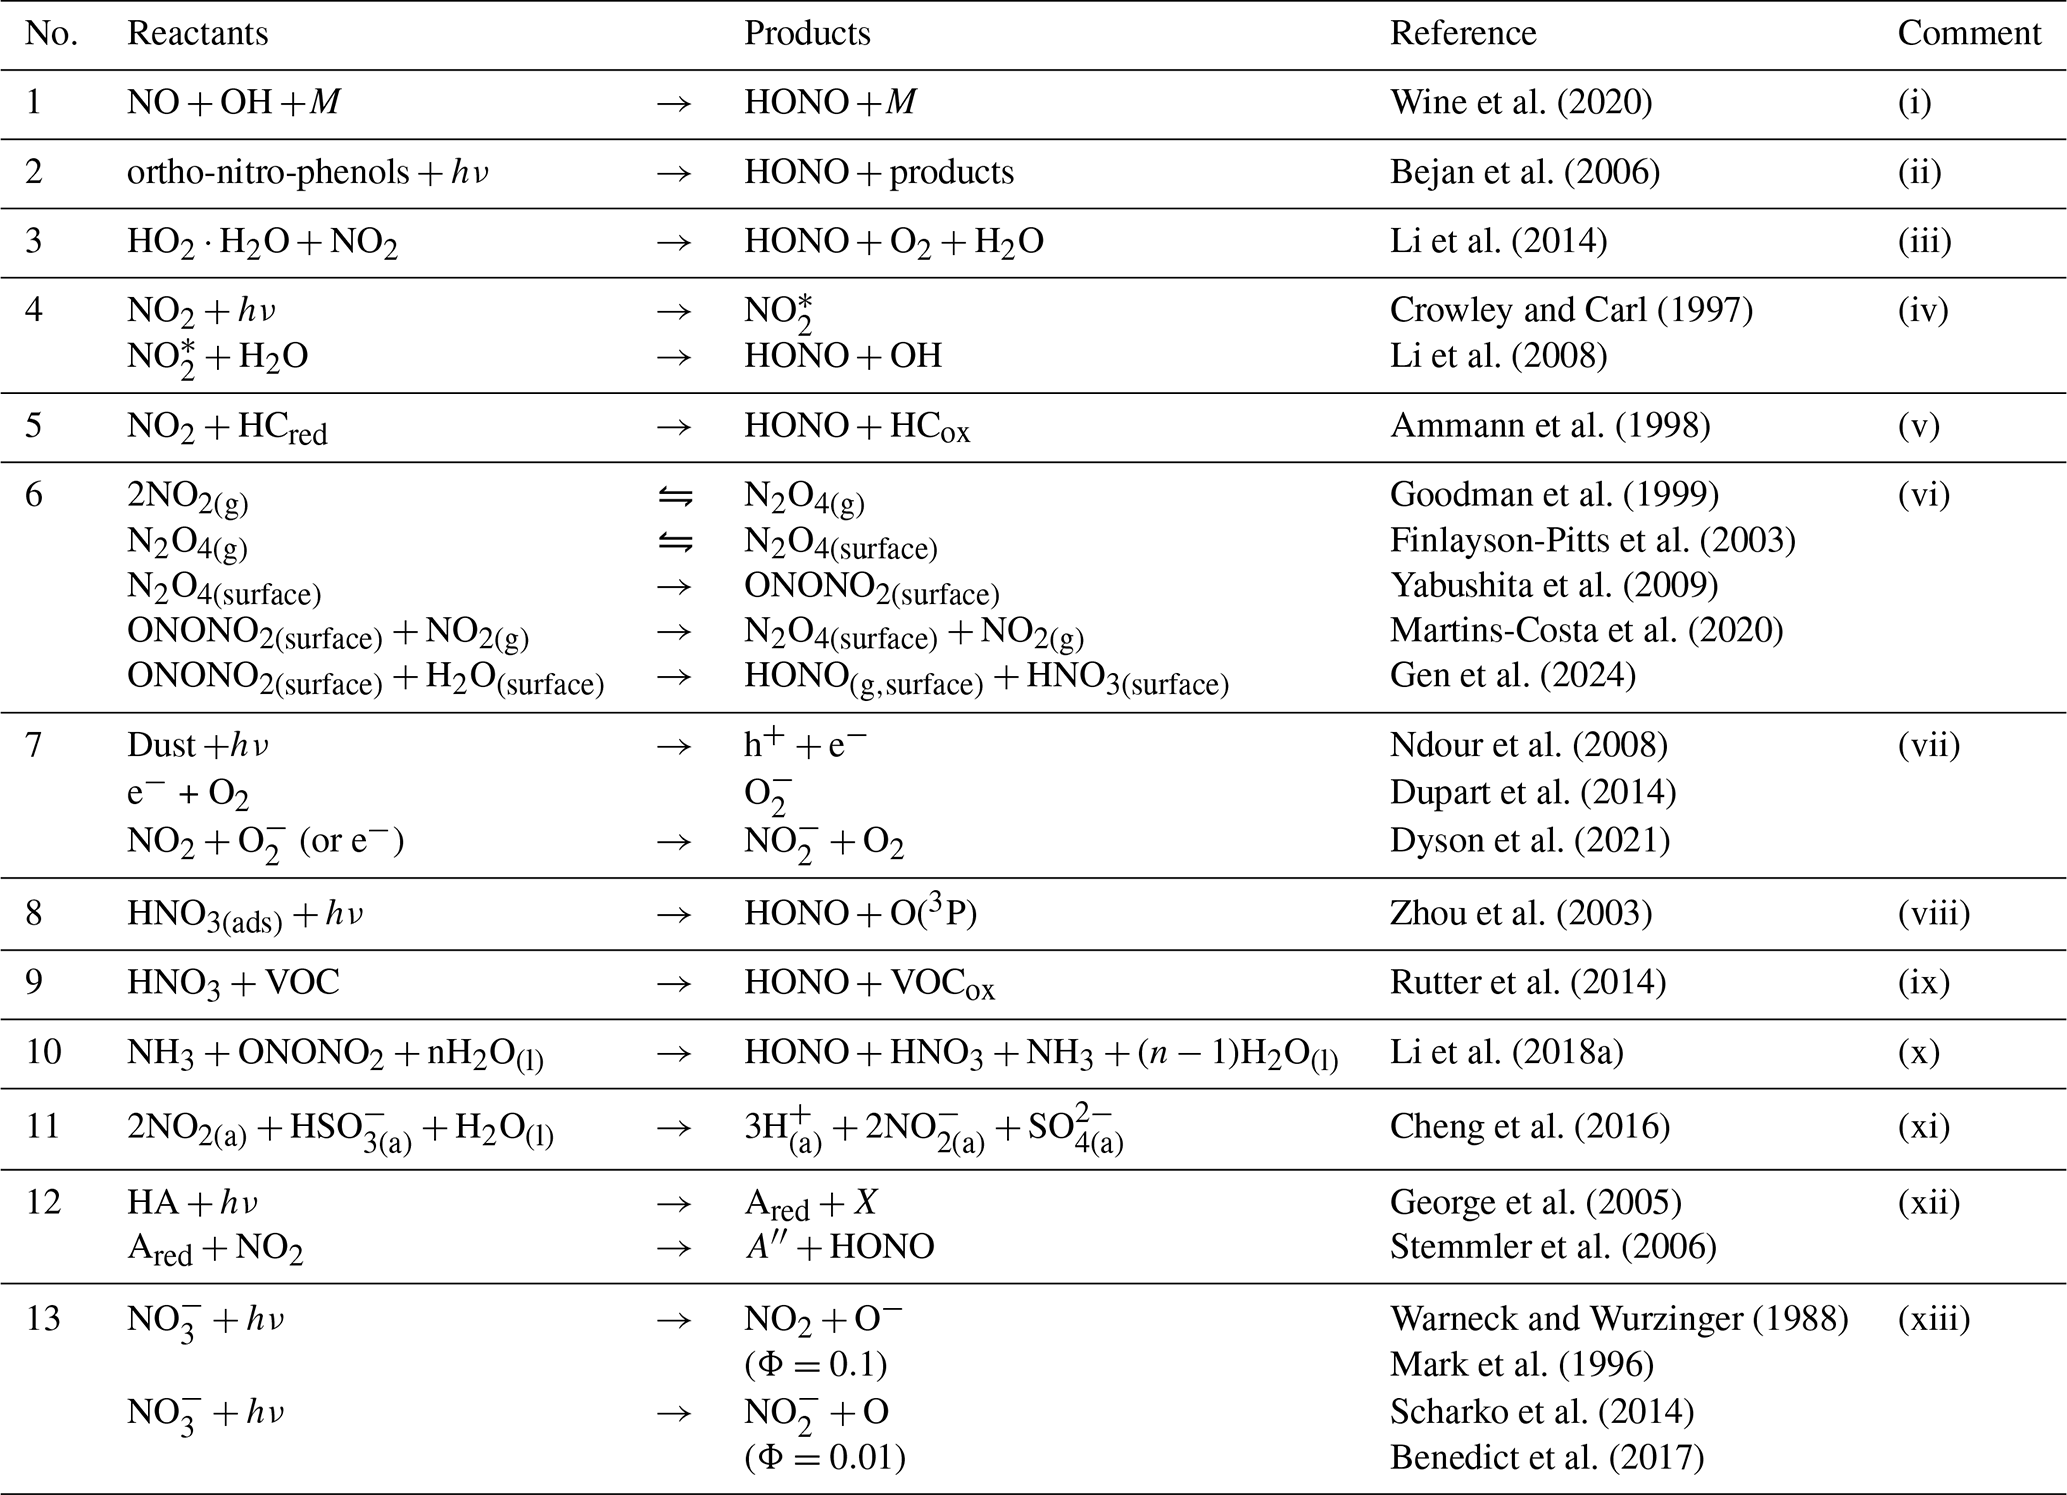
Comments: (i) Included in atmospheric chemistry models. (ii) Ortho-nitro-phenols are not measured in this work. (iii) Refuted by Ye et al. (2015) due to a small HONO yield (<0.03), though Li et al. (2015) maintained that a gas phase source of HONO consumes nitrogen oxides in the troposphere. (iv) In the atmosphere, the rate is too small. See also Crowley and Carl (1997), Li et al. (2008), Amedro et al. (2011), Dillon and Crowley (2018). (v) A rapid HONO formation (but not of HNO3) is observed from reactions of NO2 on fresh soot, but soot becomes deactivated after a few seconds (Kalberer et al., 1999). UV radiation increases the reactivity of the soot (Monge et al., 2010). (vi) Finlayson-Pitts et al. (2003) found that the reaction is first order with respect to NO2 due to its chemical equilibrium with N2O4. The equilibrium constant of N2O4 is too small for atmospheric concentrations of NO2, even though it may increase with decreasing temperature. See also Yabushita et al. (2009), Martins-Costa et al. (2020), Gen et al. (2024). (vii) Under UV-A irradiation, Dupart et al. (2014) found γ=0.6– and a HONO yield of 30 %. Goodman et al. (1999) performed their experiment on hydrated silica particles, though the reaction applies to surfaces generally. (viii) Laufs and Kleffmann (2016) found s−1 and for the secondary produced NO2 a s−1 both at (SZA = 0 °, and 50 % RH). Sullivan et al. (2018) noted the strong dependence of the absorption cross-section of adsorbed HNO3 on RH. See also Zhou et al. (2003); Ziemba et al. (2010); Song et al. (2023a). (ix) This mechanism was studied in the context of diesel exhaust. The phase is disputed (Spataro and Ianniello, 2014). (x) NH3 mediation reduces the energy barrier for the reaction to 0.5 kJ mol−1. See also Xu et al. (2019). (xi) This reaction may be pH dependent; aerosol pH was not measured in this work. See also Li et al. (2018b). (xii) HA: humic acid; Ared: reductive centers; X: oxidant. George et al. (2005) found a humidity and irradiation dependence. (xiii) Scharko et al. (2014) found that the addition of an organic OH scavenger increased the HONO formation by a factor of four. Benedict et al. (2017) determined the quantum yield (ϕ()) in the photolysis of to 1.1 % (at 313 nm, 50 µM nitrate, pH ≥5). They demonstrated that the larger ϕ() than previously assumed is primarily due to the presence of an OH scavenger.
Table A2For each target trace gas retrieved with DOAS analysis, the retrieval scenario parameters including wavelength range, included absorbers (see Table 1), I0 effect, Ring effect (R), DOAS polynomial order, and offset polynomial order are specified.
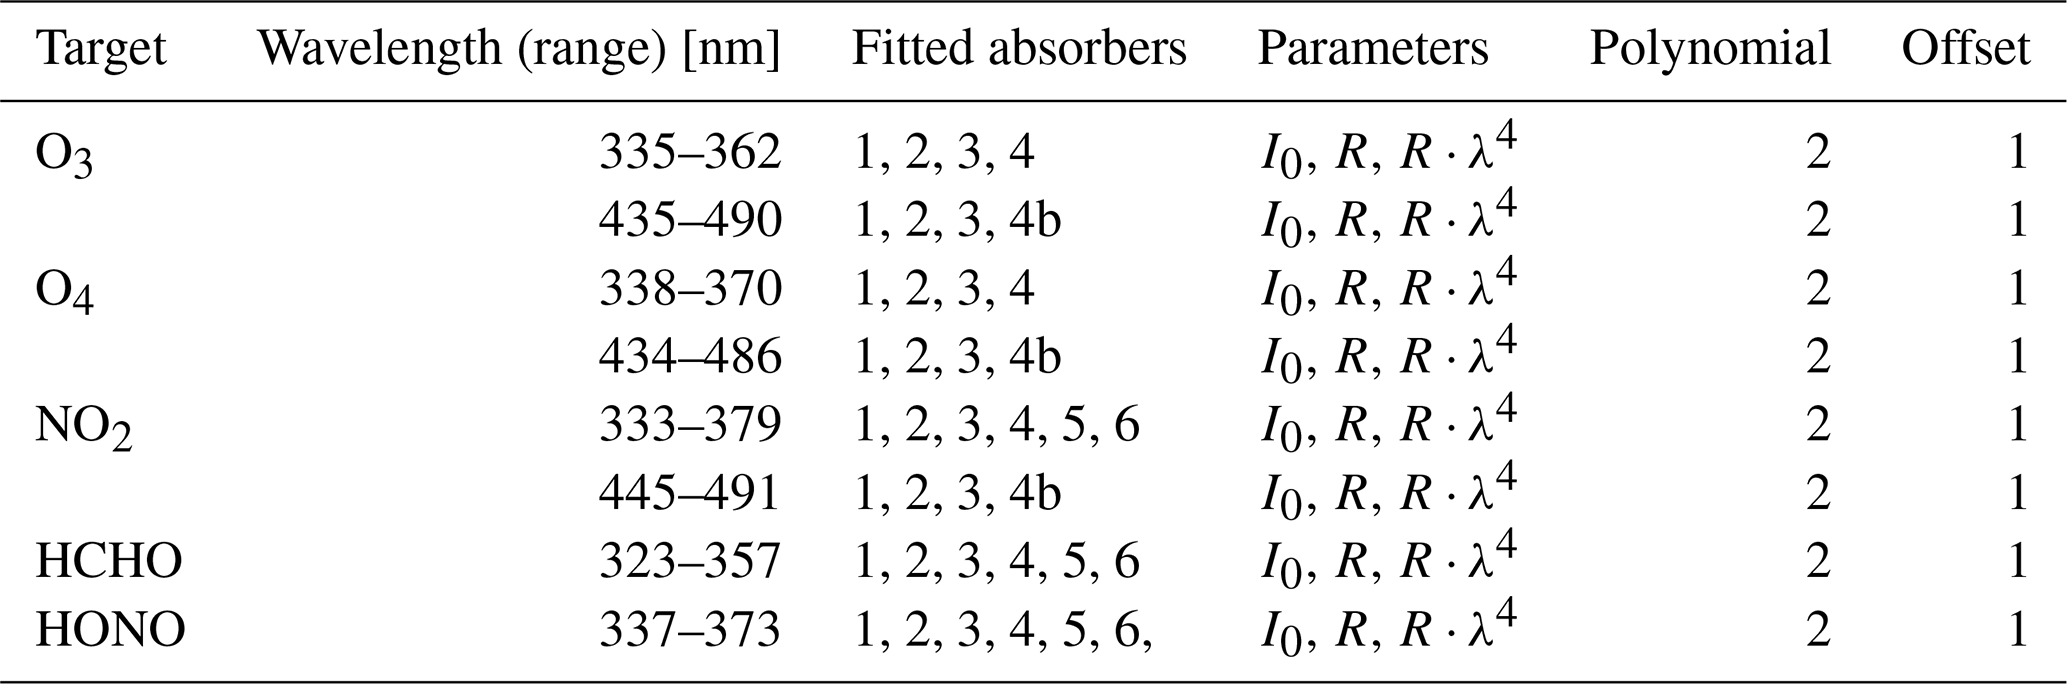
Table A3Thermochemistry of Reactions (R8), (R9), and (R10) at 220 K. For each reaction, the enthalpy (H), the product of entropy (S) and temperature (T), and the Gibbs free energy (G). Entropy and enthalpy data are from https://webbook.nist.gov (last access: 10 April 2026) and https://atct.anl.gov (last access: 10 April 2026), except for HOONO, which is taken from Szakács et al. (2011).
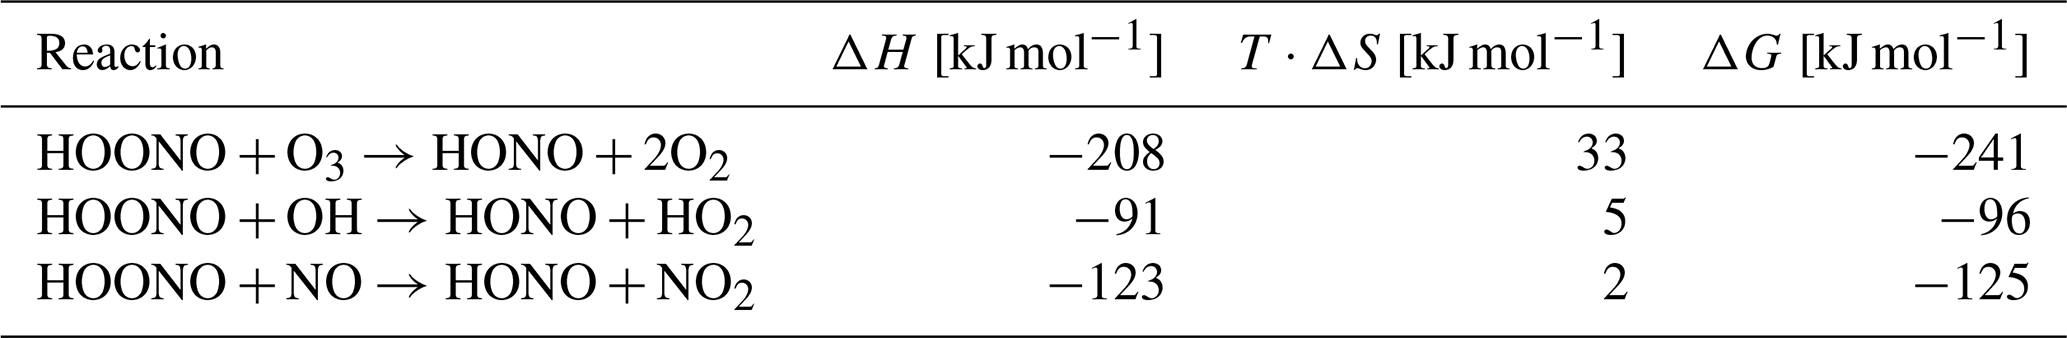
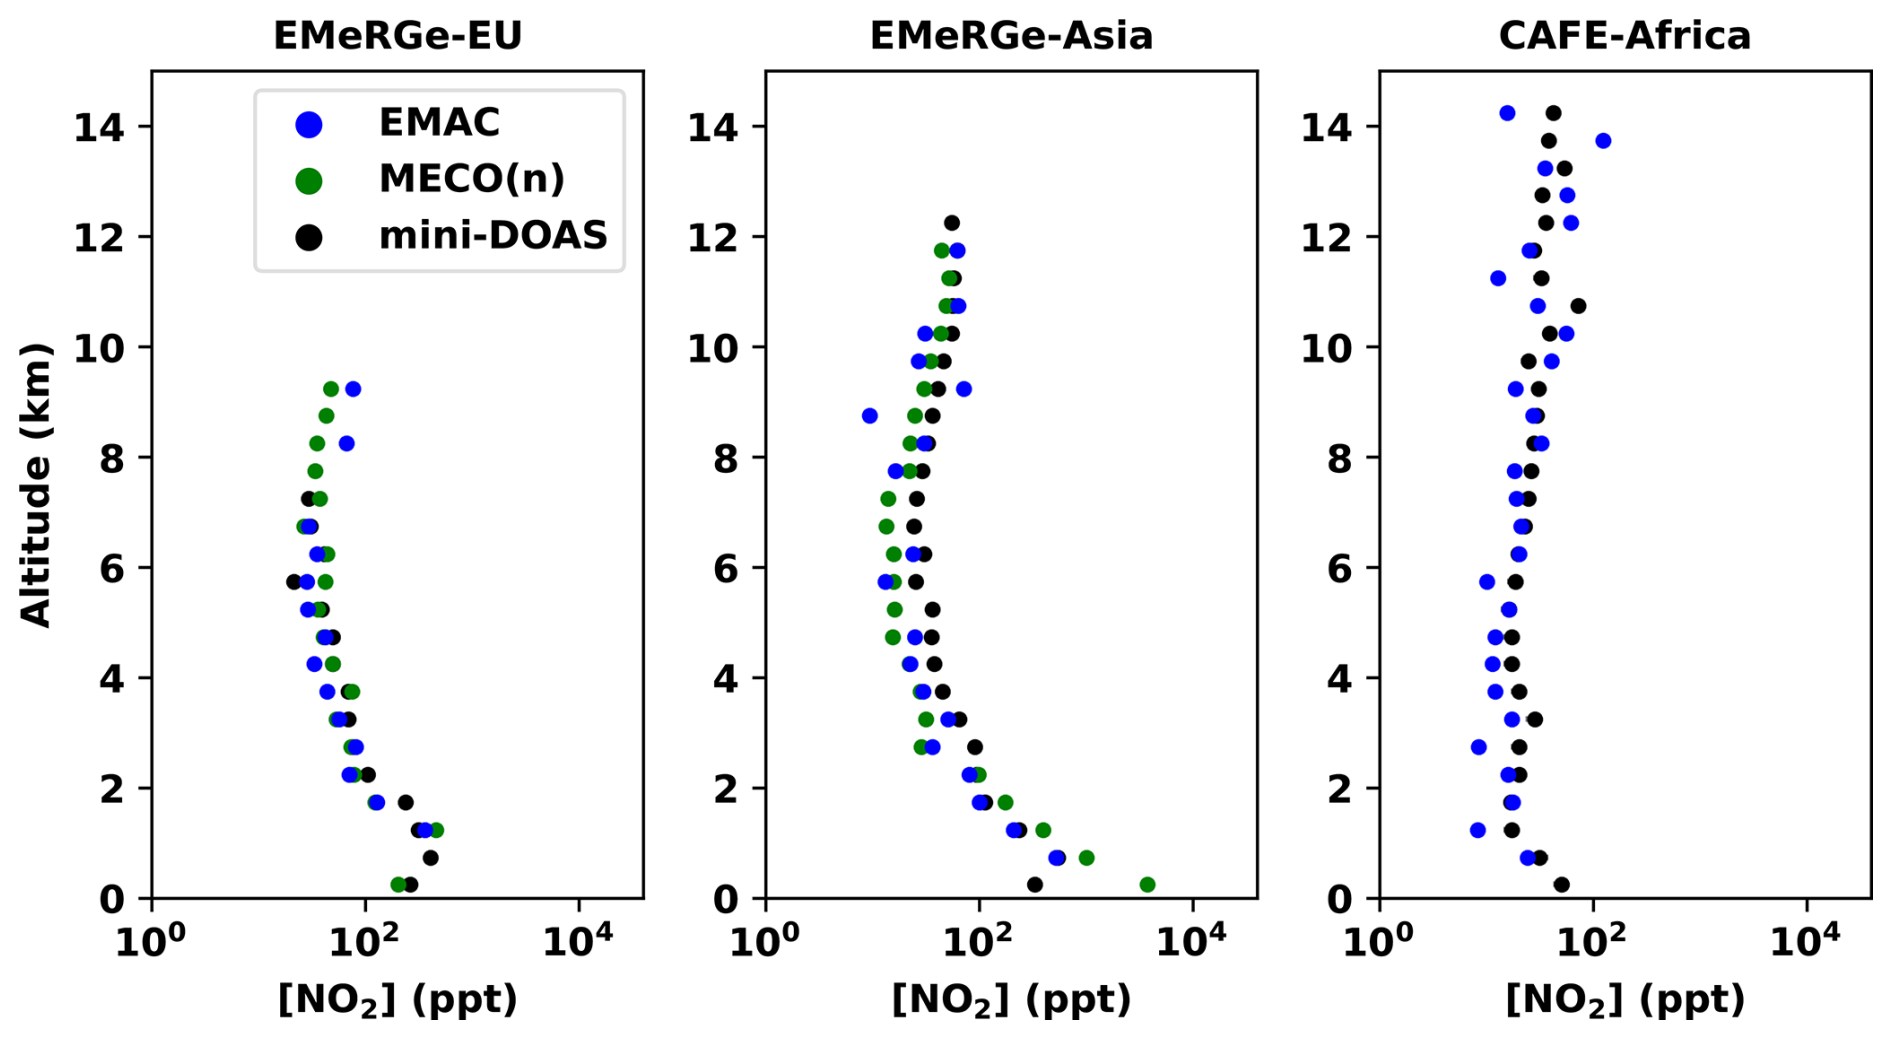
Figure A1Altitude profiles of NO2 as observed by the mini-DOAS instrument (black – uncertainties in gray), as predicted by the EMAC model (blue), and as predicted by the MECO(n) model (green), for the three research missions: EMeRGe-EU (left), EMeRGe-Asia (center), and CAFE-Africa (right). MECO(n) data is not available for the CAFE-Africa mission. Note the logarithmic x axes. VMRs are binned by 500 m altitude ranges.
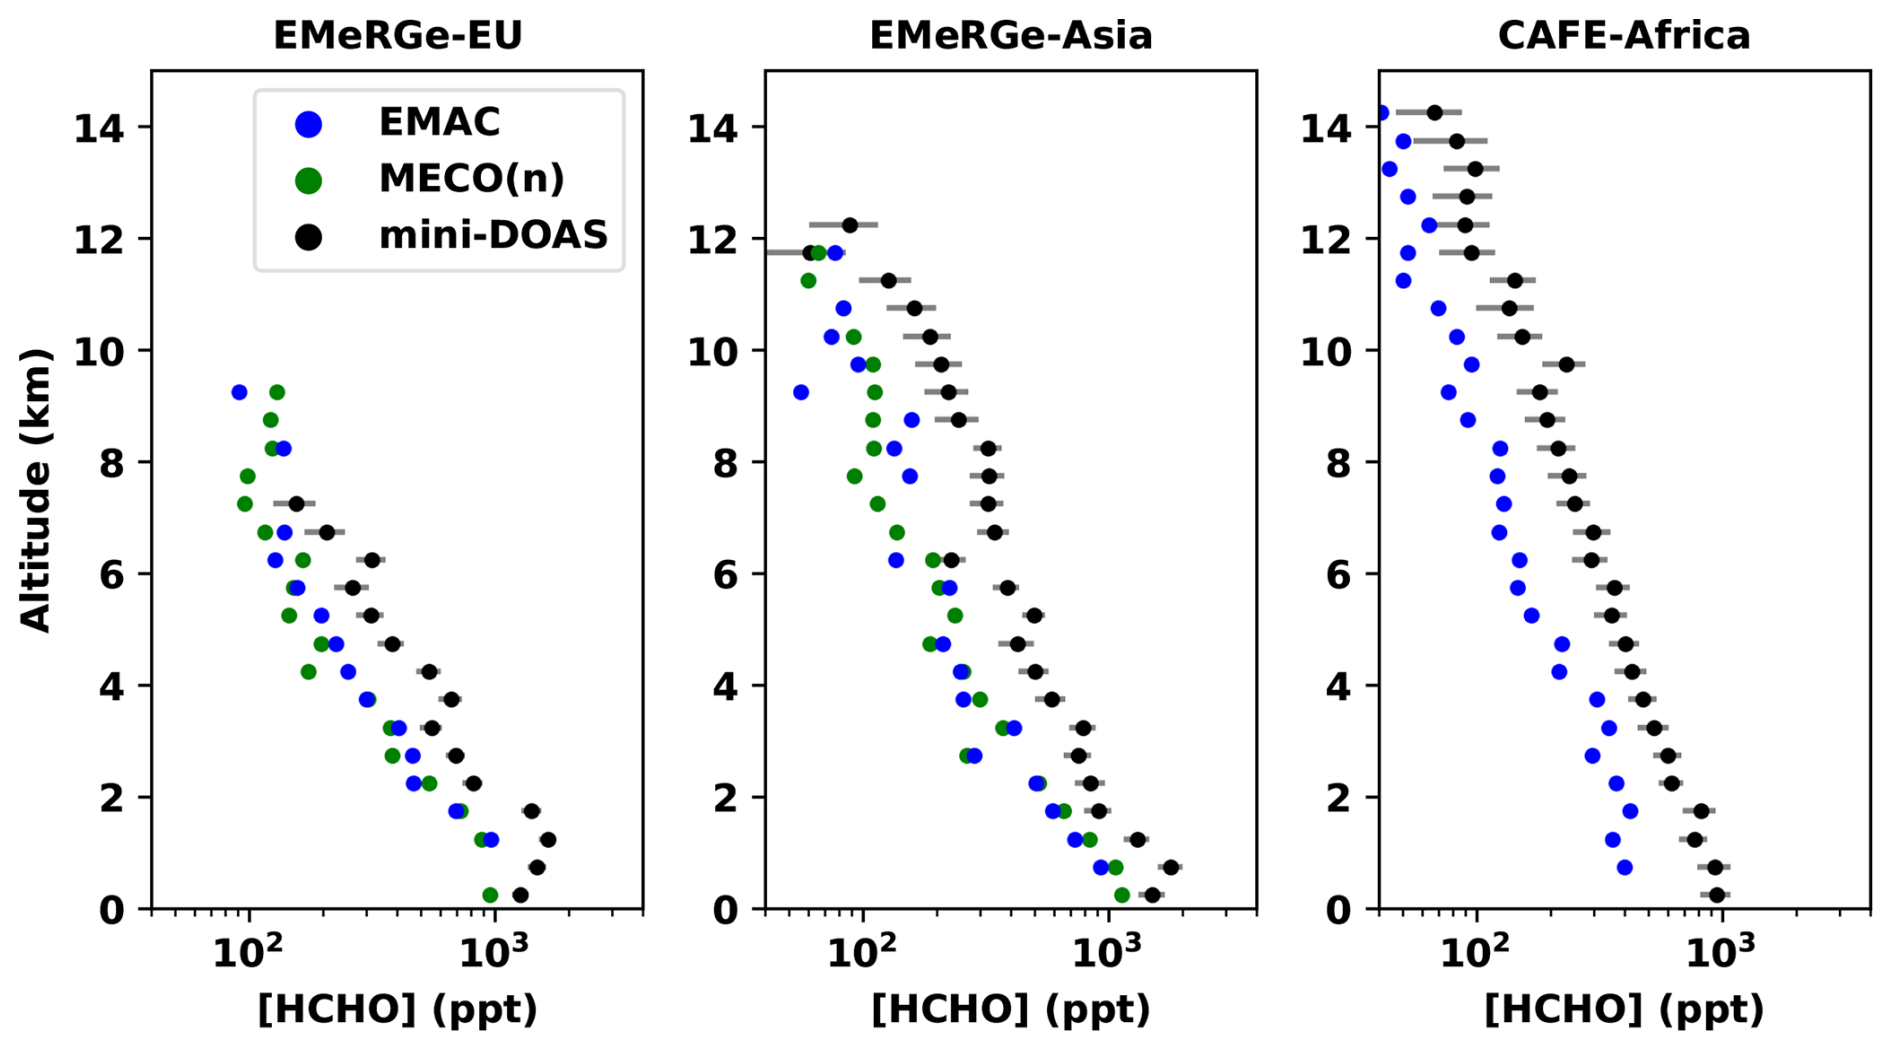
Figure A2Altitude profiles of HCHO as observed by the mini-DOAS instrument (black – uncertainties in gray), as predicted by the EMAC model (blue), and as predicted by the MECO(n) model (green), for the three research missions: EMeRGe-EU (left), EMeRGe-Asia (center), and CAFE-Africa (right). MECO(n) data is not available for the CAFE-Africa mission. Note the logarithmic x axes. VMRs are binned by 500 m altitude ranges.
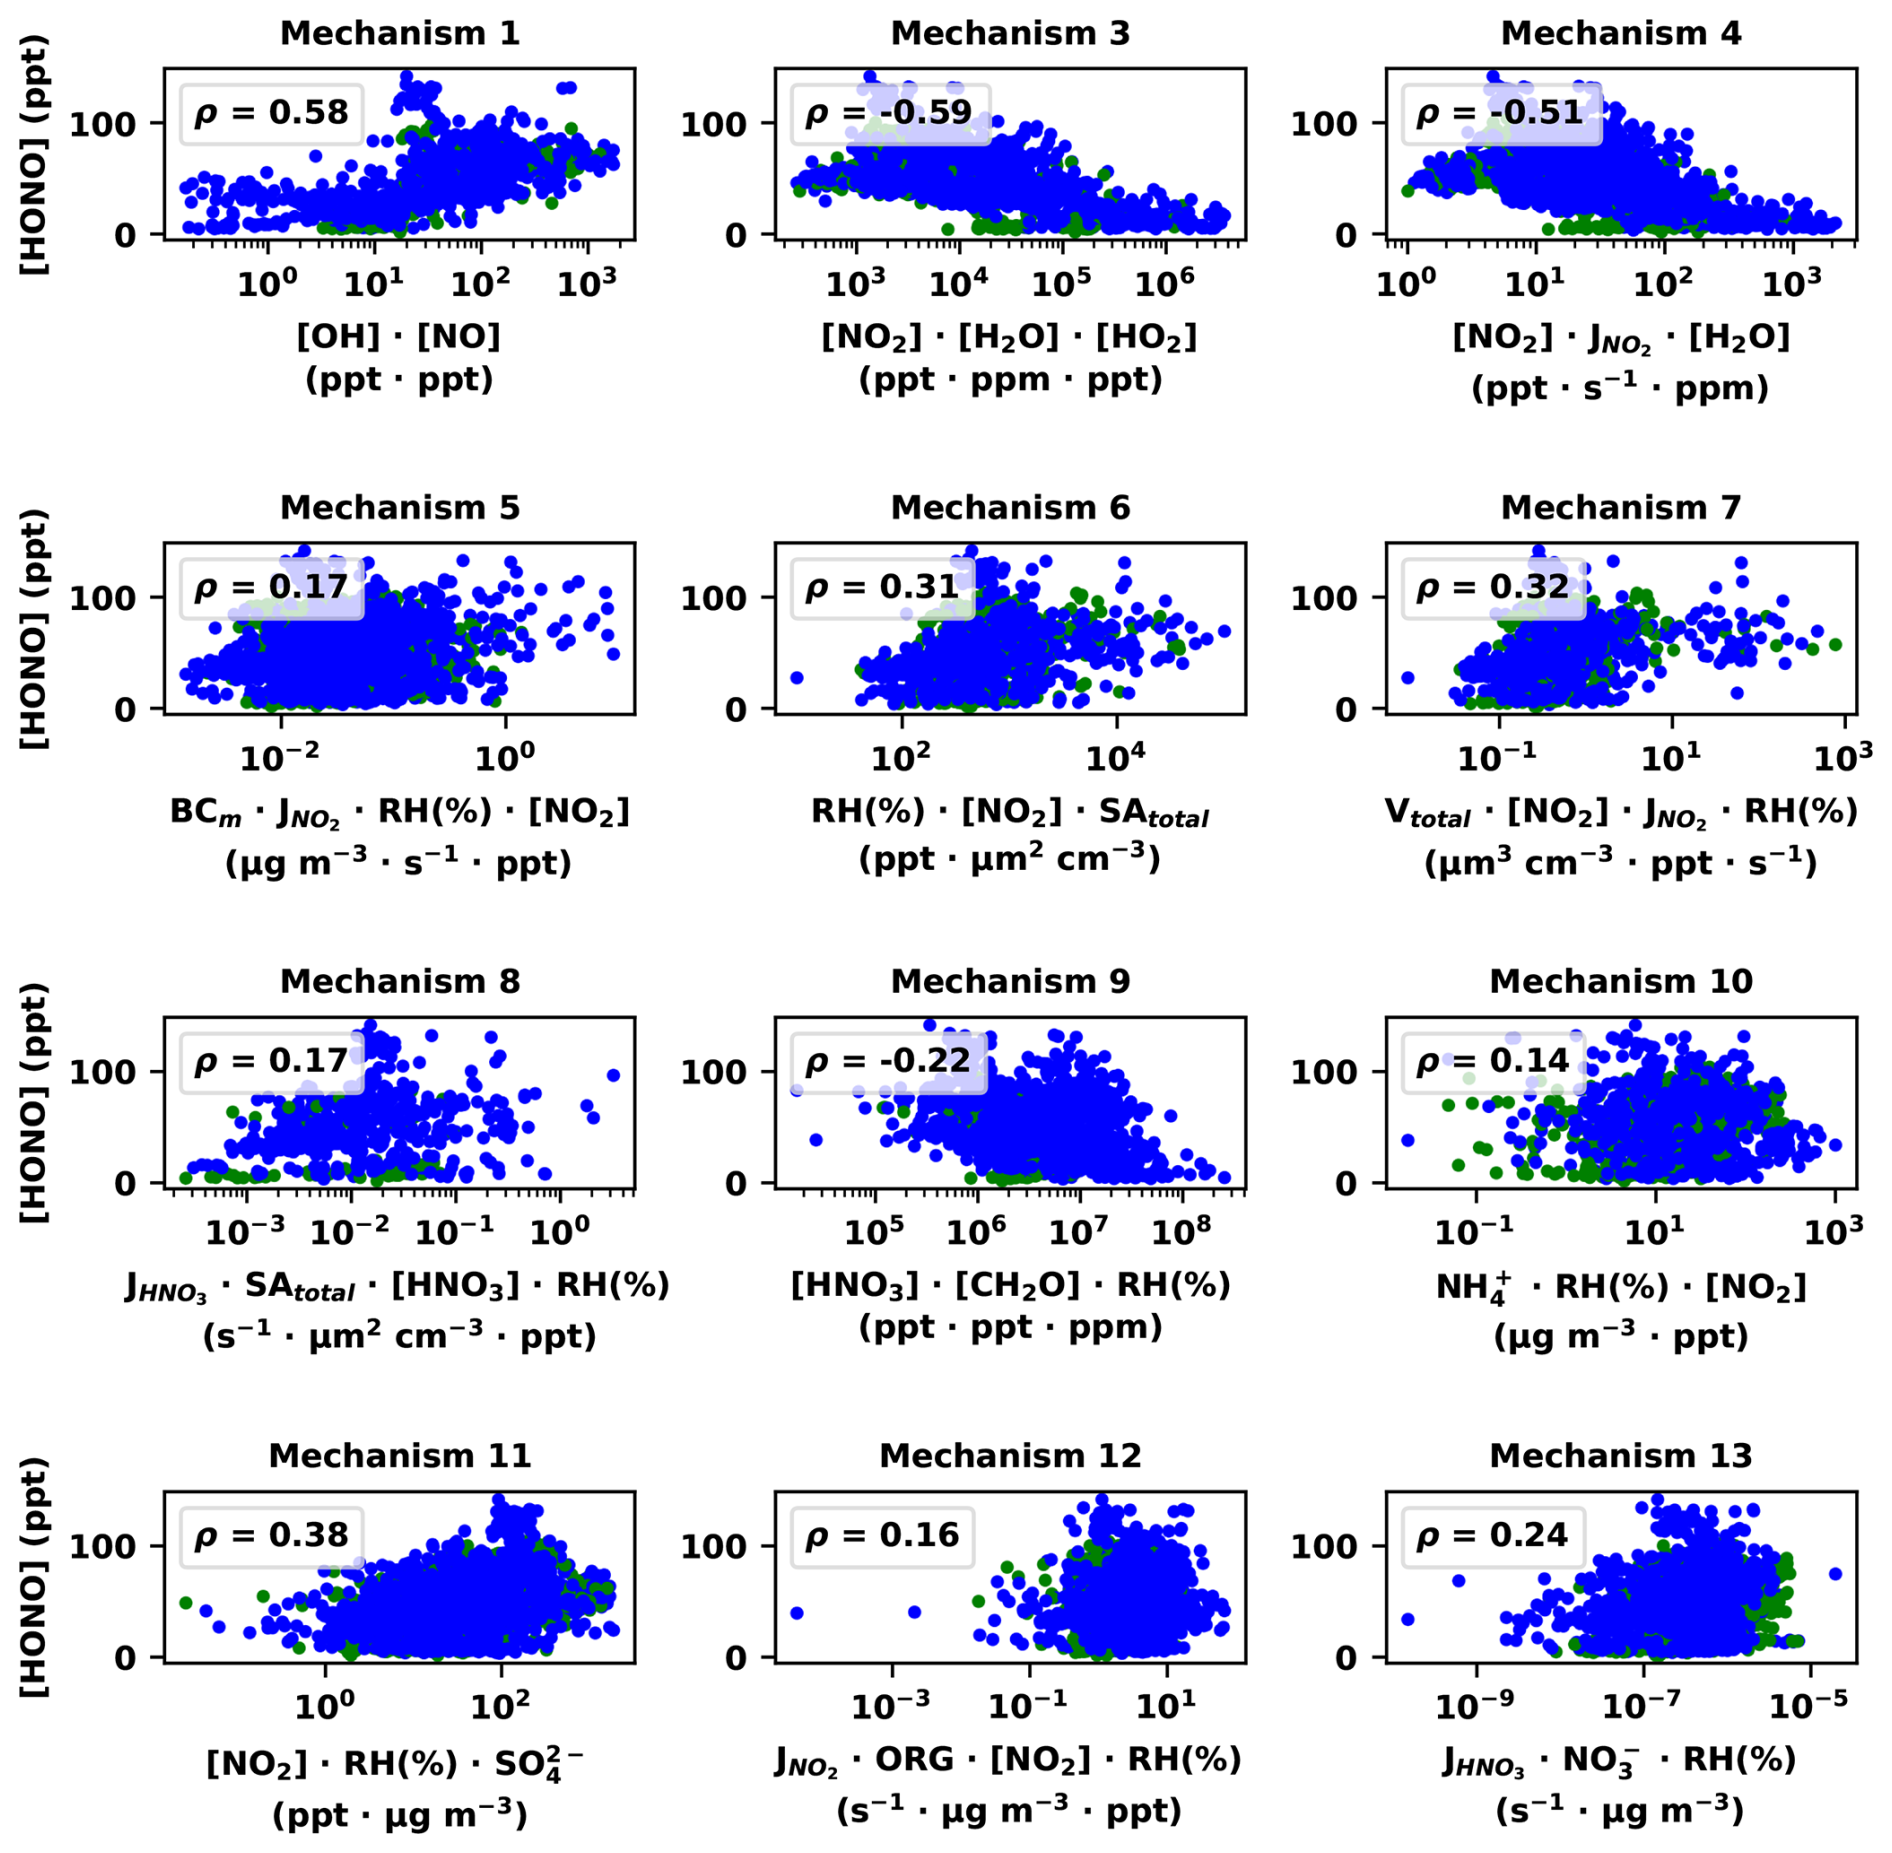
Figure A3For twelve of the thirteen potential HONO formation mechanisms listed in Table A1, the observed HONO VMRs retrieved from 3374 spectra are plotted against the product of any measured reactants (or proxies thereof), from the CAFE-Africa mission, in the UT. In each panel, the Spearman correlation coefficient ρ is given. Data is colored by the tags described in Sect. 3.3; green represents biomass burning influence, and blue is assumed to be background air. Missing tags are excluded. Note the logarithmic x axes. Mechanism 2 is excluded entirely because ortho-nitro-phenols were never measured.
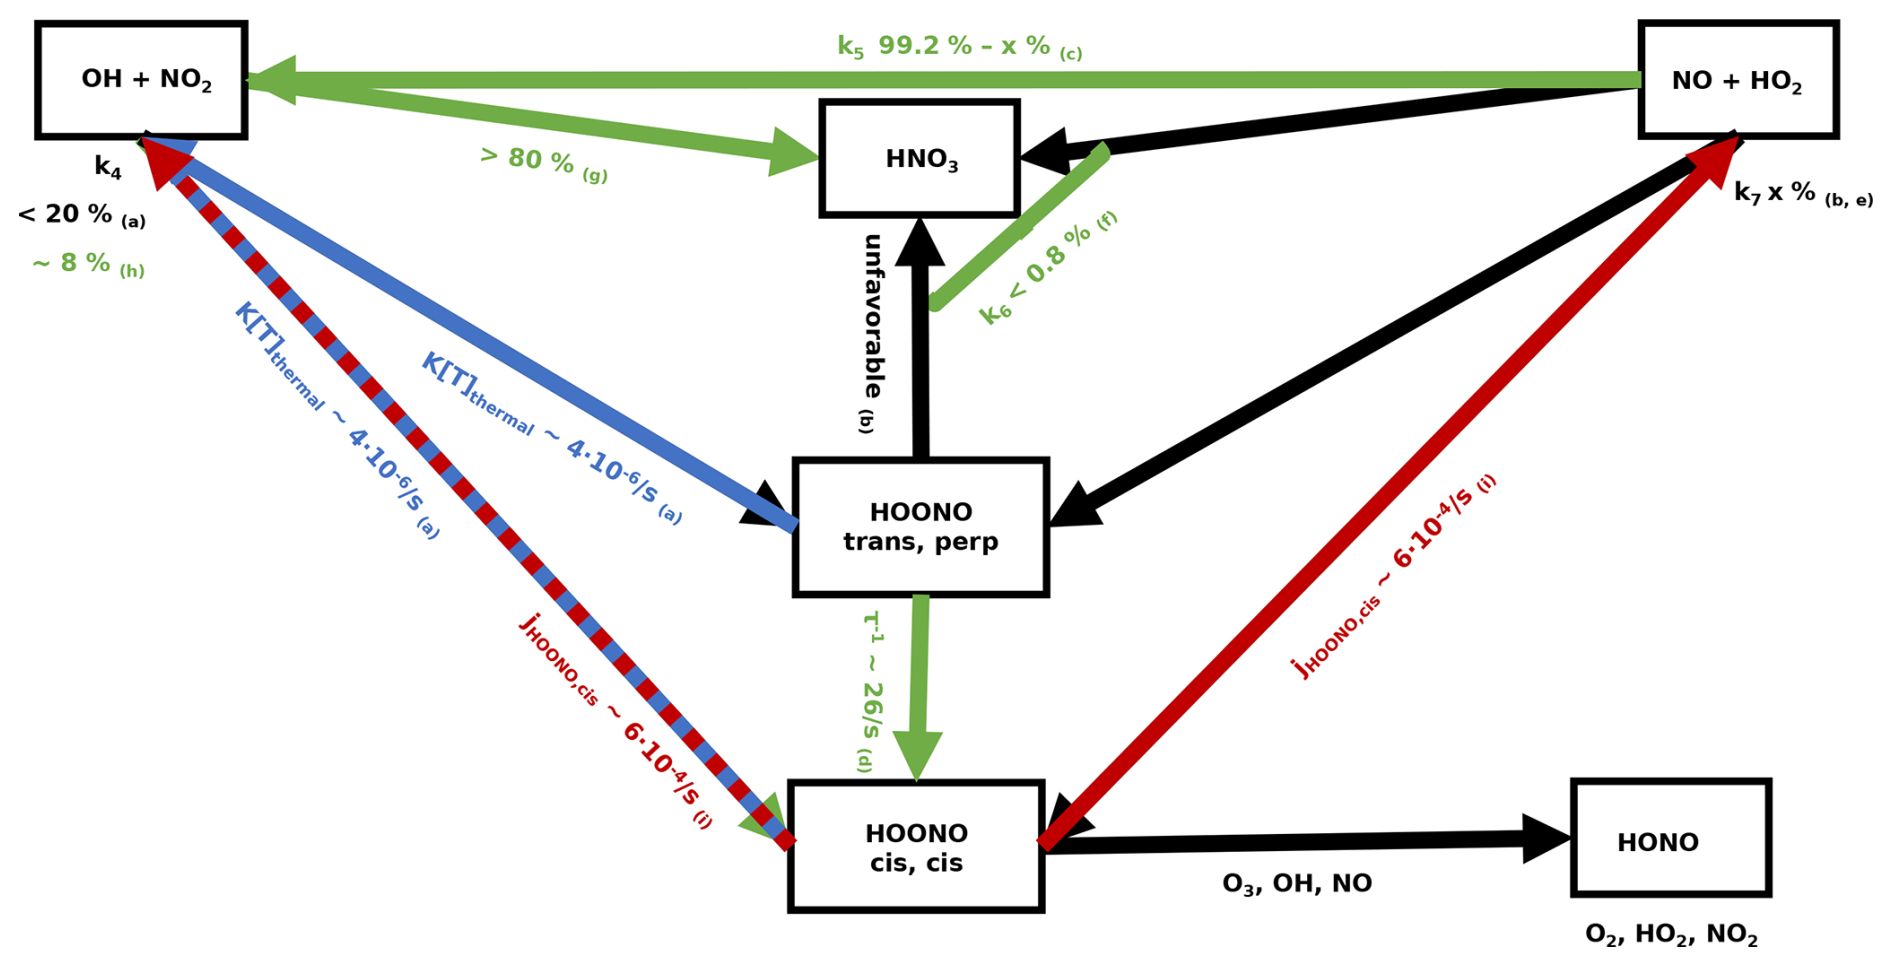
Figure A4Possible reaction diagram leading to the formation and destruction of HOONO at temperature and pressure conditions of the UT, based on a review of the available literature (studies (a) to (i): Golden et al., 2003; Zhu and Lin, 2003; Bohn and Zetzsch, 1997; Fry et al., 2004; Zhang and Donahue, 2006; Butkovskaya et al., 2007; Mollner et al., 2010; Bean et al., 2003; Chebbi et al., 2024). Green arrows represent experimental measurements, while black arrows represent master equation or ab initio studies. The blue arrows represent the thermal decomposition of HOONO, k[T]thermal (at 220 K and 267 mbar), while the red arrows represent photolysis.
The mini-DOAS data – as well as data from the other instruments on board HALO – are archived in the HALO repository https://halo-db.pa.op.dlr.de/ (last access: 10 April 2026), which can be accessed after signing a data protocol.
BW and MR operated the mini-DOAS instrument. SR and PJ performed the EMAC simulations. MM performed the MECO(n) simulations. BW performed the data analysis and wrote the manuscript, with contributions from all co-authors.
At least one of the (co-)authors is a member of the editorial board of Atmospheric Chemistry and Physics. The peer-review process was guided by an independent editor, and the authors also have no other competing interests to declare.
Publisher's note: Copernicus Publications remains neutral with regard to jurisdictional claims made in the text, published maps, institutional affiliations, or any other geographical representation in this paper. While Copernicus Publications makes every effort to include appropriate place names, the final responsibility lies with the authors.
We are grateful to the HALO community for organizing the research missions. JPB and AMD proposed, coordinated, and provided the scientific leadership for the EMeRGe campaigns in Europe and Asia. These initiatives were partly funded through the Priority Program (Schwerpunktprogramm) SPP 1294, Atmospheric and Earth System Research with HALO – High Altitude and Long Range Research Aircraft, of the Deutsche Forschungsgemeinschaft (DFG, German Research Foundation), as well as by the University and State of Bremen. In addition, the University and State of Bremen supported the individual research of JPB and AMD. DT and SR gratefully acknowledge the Gauss Centre for Supercomputing e.V. (http://www.gauss-centre.eu, last access: 10 April 2026) for funding this project by providing computing time on the GCS Supercomputer JUWELS (Alvarez, 2021) and by the John von Neumann Institute for Computing (NIC) at the Jülich Supercomputing Centre (JSC). The authors gratefully acknowledge the Earth System Modelling Project (ESM) for funding this work by providing computing time on the ESM partition of the supercomputer JUWELS at the JSC. This work used resources of the Deutsches Klimarechenzentrum (DKRZ) granted by its Scientific Steering Committee (WLA) under project ID bd0617. Further, datasets provided by MESSy via the DKRZ data pool were used. We also thank Simone Andersen, Lucy Carpenter, and James Lee for providing their data.
This research was supported by the German Research Foundation (DFG; HALO-SPP 1294), specifically the research grants (DFG; grant nos. PF 384/7-1, PF 384/9-1, PF 384/16-1, PF 384/17, PF 384/19, PF 384/24-1, BU 688/27-1, BU 2599/10-1, BO 1829/10-1, SCHN 1138/5-1). HKMS measurements were funded by the DFG (grant no. NE 2150/1-1) and by the Karlsruhe Institute of Technology.
This paper was edited by Carl Percival and reviewed by three anonymous referees.
Acker, K., Möller, D., Wieprecht, W., Meixner, F. X., Bohn, B., Gilge, S., Plass-Dülmer, C., and Berresheim, H.: Strong daytime production of OH from HNO2 at a rural mountain site, Geophys. Res. Lett., 33, L02809, https://doi.org/10.1029/2005GL024643, 2006. a, b
Akimoto, H. and Tanimoto, H.: Review of Comprehensive Measurements of Speciated NOy and its Chemistry: Need for Quantifying the Role of Heterogeneous Processes of HNO3 and HONO, Aerosol Air Qual. Res., 21, 200395, https://doi.org/10.4209/aaqr.2020.07.0395, 2021. a
Alicke, B., Geyer, A., Hofzumahaus, A., Holland, F., Konrad, S., Pätz, H. W., Schäfer, J., Stutz, J., Volz-Thomas, A., and Platt, U.: OH formation by HONO photolysis during the BERLIOZ experiment, J. Geophys. Res.-Atmos., 108, 8247, https://doi.org/10.1029/2001JD000579, 2003. a
Alvarez, D.: JUWELS Cluster and Booster: Exascale Pathfinder with Modular Supercomputing Architecture at Juelich Supercomputing Centre, Journal of large-scale research facilities JLSRF, 7, A183–A183, https://doi.org/10.17815/jlsrf-7-183, 2021. a
Amedro, D., Parker, A. E., Schoemaecker, C., and Fittschen, C.: Direct observation of OH radicals after 565 nm multi-photon excitation of NO2 in the presence of H2O, Chem. Phys. Lett., 513, 12–16, https://doi.org/10.1016/j.cplett.2011.07.062, 2011. a
Amedro, D., Berasategui, M., Bunkan, A. J. C., Pozzer, A., Lelieveld, J., and Crowley, J. N.: Kinetics of the OH + NO2 reaction: effect of water vapour and new parameterization for global modelling, Atmos. Chem. Phys., 20, 3091–3105, https://doi.org/10.5194/acp-20-3091-2020, 2020. a, b, c
Ammann, M., Kalberer, M., Jost, D. T., Tobler, L., Rössler, E., Piguet, D., Gäggeler, H. W., and Baltensperger, U.: Heterogeneous production of nitrous acid on soot in polluted air masses, Nature, 395, 157–160, https://doi.org/10.1038/25965, 1998. a, b
Andersen, S. T., Carpenter, L. J., Reed, C., Lee, J. D., Chance, R., Sherwen, T., Vaughan, A. R., Stewart, J., Edwards, P. M., Bloss, W. J., Sommariva, R., Crilley, L. R., Nott, G. J., Neves, L., Read, K., Heard, D. E., Seakins, P. W., Whalley, L. K., Boustead, G. A., Fleming, L. T., Stone, D., and Fomba, K. W.: Extensive field evidence for the release of HONO from the photolysis of nitrate aerosols, Sci. Adv., 9, eadd6266, https://doi.org/10.1126/sciadv.add6266, 2023. a, b, c, d, e, f, g, h, i, j, k, l, m, n, o, p, q
Andrés Hernández, M. D., Hilboll, A., Ziereis, H., Förster, E., Krüger, O. O., Kaiser, K., Schneider, J., Barnaba, F., Vrekoussis, M., Schmidt, J., Huntrieser, H., Blechschmidt, A.-M., George, M., Nenakhov, V., Harlass, T., Holanda, B. A., Wolf, J., Eirenschmalz, L., Krebsbach, M., Pöhlker, M. L., Kalisz Hedegaard, A. B., Mei, L., Pfeilsticker, K., Liu, Y., Koppmann, R., Schlager, H., Bohn, B., Schumann, U., Richter, A., Schreiner, B., Sauer, D., Baumann, R., Mertens, M., Jöckel, P., Kilian, M., Stratmann, G., Pöhlker, C., Campanelli, M., Pandolfi, M., Sicard, M., Gómez-Amo, J. L., Pujadas, M., Bigge, K., Kluge, F., Schwarz, A., Daskalakis, N., Walter, D., Zahn, A., Pöschl, U., Bönisch, H., Borrmann, S., Platt, U., and Burrows, J. P.: Overview: On the transport and transformation of pollutants in the outflow of major population centres – observational data from the EMeRGe European intensive operational period in summer 2017, Atmos. Chem. Phys., 22, 5877–5924, https://doi.org/10.5194/acp-22-5877-2022, 2022. a, b, c, d, e
Bean, B. D., Mollner, A. K., Nizkorodov, S. A., Nair, G., Okumura, M., Sander, S. P., Peterson, K. A., and Francisco, J. S.: Cavity Ringdown Spectroscopy of cis-cis HOONO and the HOONO/HONO2 Branching Ratio in the Reaction OH + NO2 + M, J. Phys. Chem. A, 107, 6974–6985, https://doi.org/10.1021/jp034407c, 2003. a, b
Bejan, I., Abd El Aal, Y., Barnes, I., Benter, T., Bohn, B., Wiesen, P., and Kleffmann, J.: The photolysis of ortho -nitrophenols: a new gas phase source of HONO, Phys. Chem. Chem. Phys., 8, 2028–2035, https://doi.org/10.1039/B516590C, 2006. a
Benedict, K. B., McFall, A. S., and Anastasio, C.: Quantum Yield of Nitrite from the Photolysis of Aqueous Nitrate above 300 nm, Environ. Sci. Technol., 51, 4387–4395, https://doi.org/10.1021/acs.est.6b06370, 2017. a, b, c
Bogumil, K., Orphal, J., Homann, T., Voigt, S., Spietz, P., Fleischmann, O. C., Vogel, A., Hartmann, M., Kromminga, H., Bovensmann, H., Frerick, J., and Burrows, J. P.: Measurements of molecular absorption spectra with the SCIAMACHY pre-flight model: instrument characterization and reference data for atmospheric remote-sensing in the 230–2380 nm region, J. Photoch. Photobiol. A, 157, 167–184, https://doi.org/10.1016/S1010-6030(03)00062-5, 2003. a
Bohn, B. and Lohse, I.: Calibration and evaluation of CCD spectroradiometers for ground-based and airborne measurements of spectral actinic flux densities, Atmos. Meas. Tech., 10, 3151–3174, https://doi.org/10.5194/amt-10-3151-2017, 2017. a
Bohn, B. and Zetzsch, C.: Rate Constants of HO2 + NO Covering Atmospheric Conditions. 1. HO2 Formed by OH + H2O2, J. Phys. Chem. A, 101, 1488–1493, https://doi.org/10.1021/jp961396x, 1997. a, b, c
Brito, J. and Zahn, A.: An unheated permeation device for calibrating atmospheric VOC measurements, Atmos. Meas. Tech., 4, 2143–2152, https://doi.org/10.5194/amt-4-2143-2011, 2011. a
Brune, W. H., McFarland, P. J., Bruning, E., Waugh, S., MacGorman, D., Miller, D. O., Jenkins, J. M., Ren, X., Mao, J., and Peischl, J.: Extreme oxidant amounts produced by lightning in storm clouds, Science, 372, 711–715, https://doi.org/10.1126/science.abg0492, 2021. a, b
Butkovskaya, N., Kukui, A., Pouvesle, N., and Le Bras, G.: Formation of Nitric Acid in the Gas-Phase HO2 + NO Reaction: Effects of Temperature and Water Vapor, J. Phys. Chem. A, 109, 6509–6520, https://doi.org/10.1021/jp051534v, 2005. a, b
Butkovskaya, N., Kukui, A., and Le Bras, G.: HNO3 Forming Channel of the HO2 + NO Reaction as a Function of Pressure and Temperature in the Ranges of 72–600 Torr and 223–323 K, J. Phys. Chem. A, 111, 9047–9053, https://doi.org/10.1021/jp074117m, 2007. a, b, c, d, e
Chance, K. and Orphal, J.: Revised ultraviolet absorption cross sections of H2CO for the HITRAN database, J. Quant. Spectrosc. Ra., 112, 1509–1510, https://doi.org/10.1016/j.jqsrt.2011.02.002, 2011. a
Chatfield, R. B.: Anomalous HNO3/NOx ratio of remote tropospheric air: Conversion of nitric acid to formic acid and NO2?, Geophys. Res. Lett., 21, 2705–2708, https://doi.org/10.1029/94GL02659, 1994. a
Chebbi, W., Derbel, N., Alijah, A., and Cours, T.: UV-spectrum and photodecomposition of peroxynitrous acid in the troposphere, Phys. Chem. Chem. Phys., 26, 123–129, https://doi.org/10.1039/D3CP04580C, 2024. a, b, c
Cheng, Y., Zheng, G., Wei, C., Mu, Q., Zheng, B., Wang, Z., Gao, M., Zhang, Q., He, K., Carmichael, G., Pöschl, U., and Su, H.: Reactive nitrogen chemistry in aerosol water as a source of sulfate during haze events in China, Sci. Adv., 2, e1601530, https://doi.org/10.1126/sciadv.1601530, 2016. a, b
Crilley, L. R., Kramer, L. J., Ouyang, B., Duan, J., Zhang, W., Tong, S., Ge, M., Tang, K., Qin, M., Xie, P., Shaw, M. D., Lewis, A. C., Mehra, A., Bannan, T. J., Worrall, S. D., Priestley, M., Bacak, A., Coe, H., Allan, J., Percival, C. J., Popoola, O. A. M., Jones, R. L., and Bloss, W. J.: Intercomparison of nitrous acid (HONO) measurement techniques in a megacity (Beijing), Atmos. Meas. Tech., 12, 6449–6463, https://doi.org/10.5194/amt-12-6449-2019, 2019. a
Crowley, J. N. and Carl, S. A.: OH Formation in the Photoexcitation of NO2 beyond the Dissociation Threshold in the Presence of Water Vapor, J. Phys. Chem. A, 101, 4178–4184, https://doi.org/10.1021/jp970319e, 1997. a, b
Crowley, J. N., Dörich, R., Eger, P., Helleis, F., Tadic, I., Fischer, H., Williams, J., Edtbauer, A., Wang, N., Holanda, B. A., Poehlker, M., Pöschl, U., Pozzer, A., and Lelieveld, J.: Peroxy acetyl nitric anhydride (PAN) and peroxy acetic acid (PAA) over the Atlantic west of Africa during CAFE-Africa and the influence of biomass-burning, Environ. Sci.: Atmospheres, 5, 620–635, https://doi.org/10.1039/D5EA00006H, 2025. a
Deutschmann, T., Beirle, S., Frieß, U., Grzegorski, M., Kern, C., Kritten, L., Platt, U., Prados-Román, C., Puķīte, J., Wagner, T., Werner, B., and Pfeilsticker, K.: The Monte Carlo atmospheric radiative transfer model McArtim: Introduction and validation of Jacobians and 3D features, J. Quant. Spectrosc. Ra., 112, 1119–1137, https://doi.org/10.1016/j.jqsrt.2010.12.009, 2011. a, b
Dillon, T. J. and Crowley, J. N.: Reactive quenching of electronically excited NO and NO by H2O as potential sources of atmospheric HOx radicals, Atmos. Chem. Phys., 18, 14005–14015, https://doi.org/10.5194/acp-18-14005-2018, 2018. a
Ding, J., Zhao, P., Su, J., Dong, Q., Du, X., and Zhang, Y.: Aerosol pH and its driving factors in Beijing, Atmos. Chem. Phys., 19, 7939–7954, https://doi.org/10.5194/acp-19-7939-2019, 2019. a
Dupart, Y., Fine, L., D’Anna, B., and George, C.: Heterogeneous uptake of NO2 on Arizona Test Dust under UV-A irradiation: An aerosol flow tube study, Aeolian Res., 15, 45–51, https://doi.org/10.1016/j.aeolia.2013.10.001, 2014. a, b
Dyson, J. E., Boustead, G. A., Fleming, L. T., Blitz, M., Stone, D., Arnold, S. R., Whalley, L. K., and Heard, D. E.: Production of HONO from NO2 uptake on illuminated TiO2 aerosol particles and following the illumination of mixed TiO2 / ammonium nitrate particles, Atmos. Chem. Phys., 21, 5755–5775, https://doi.org/10.5194/acp-21-5755-2021, 2021. a
Dörich, R., Eger, P., Lelieveld, J., and Crowley, J. N.: Iodide CIMS and 62: the detection of HNO3 as NO in the presence of PAN, peroxyacetic acid and ozone, Atmos. Meas. Tech., 14, 5319–5332, https://doi.org/10.5194/amt-14-5319-2021, 2021. a
Finlayson-Pitts, B. J., Wingen, L. M., Sumner, A. L., Syomin, D., and Ramazan, K. A.: The heterogeneous hydrolysis of NO2 in laboratory systems and in outdoor and indoor atmospheres: An integrated mechanism, Phys. Chem. Chem. Phys., 5, 223–242, https://doi.org/10.1039/B208564J, 2003. a, b
Förster, E., Bönisch, H., Neumaier, M., Obersteiner, F., Zahn, A., Hilboll, A., Kalisz Hedegaard, A. B., Daskalakis, N., Poulidis, A. P., Vrekoussis, M., Lichtenstern, M., and Braesicke, P.: Chemical and dynamical identification of emission outflows during the HALO campaign EMeRGe in Europe and Asia, Atmos. Chem. Phys., 23, 1893–1918, https://doi.org/10.5194/acp-23-1893-2023, 2023. a, b, c, d, e, f
Fry, J. L., Nizkorodov, S. A., Okumura, M., Roehl, C. M., Francisco, J. S., and Wennberg, P. O.: Cis-cis and trans-perp HOONO: Action spectroscopy and isomerization kinetics, The Journal of Chemical Physics, 121, 1432–1448, https://doi.org/10.1063/1.1760714, 2004. a, b, c, d
Fu, X., Wang, T., Zhang, L., Li, Q., Wang, Z., Xia, M., Yun, H., Wang, W., Yu, C., Yue, D., Zhou, Y., Zheng, J., and Han, R.: The significant contribution of HONO to secondary pollutants during a severe winter pollution event in southern China, Atmos. Chem. Phys., 19, 1–14, https://doi.org/10.5194/acp-19-1-2019, 2019. a, b
Gen, M., Zheng, H., Sun, Y., Xu, W., Ma, N., Su, H., Cheng, Y., Wang, S., Xing, J., Zhang, S., Xue, L., Xue, C., Mu, Y., Tian, X., Matsuki, A., and Song, S.: Rapid hydrolysis of NO2 at High Ionic Strengths of Deliquesced Aerosol Particles, Environ. Sci. Technol., 58, 7904–7915, https://doi.org/10.1021/acs.est.3c08810, 2024. a, b
George, C., Strekowski, S. R., Kleffmann, J., Stemmler, K., and Ammann, M.: Photoenhanced uptake of gaseous NO2 on solid organic compounds: a photochemical source of HONO?, Faraday Discuss., 130, 195–210, https://doi.org/10.1039/B417888M, 2005. a, b, c
George, M., Andrés Hernández, M. D., Nenakhov, V., Liu, Y., and Burrows, J. P.: Airborne measurement of peroxy radicals using chemical amplification coupled with cavity ring-down spectroscopy: the PeRCEAS instrument, Atmos. Meas. Tech., 13, 2577–2600, https://doi.org/10.5194/amt-13-2577-2020, 2020. a
George, M., Andrés Hernández, M. D., Nenakhov, V., Liu, Y., Burrows, J. P., Bohn, B., Förster, E., Obersteiner, F., Zahn, A., Harlaß, T., Ziereis, H., Schlager, H., Schreiner, B., Kluge, F., Bigge, K., and Pfeilsticker, K.: Airborne observations of peroxy radicals during the EMeRGe campaign in Europe, Atmos. Chem. Phys., 23, 7799–7822, https://doi.org/10.5194/acp-23-7799-2023, 2023. a
Golden, D. M., Barker, J. R., and Lohr, L. L.: Master Equation Models for the Pressure- and Temperature-Dependent Reactions HO + NO2 → HONO2 and HO + NO2 → HOONO, J. Phys. Chem. A, 107, 11057–11071, https://doi.org/10.1021/jp0353183, 2003. a, b, c
Goodman, A. L., Underwood, G. M., and Grassian, V. H.: Heterogeneous Reaction of NO2: Characterization of Gas-Phase and Adsorbed Products from the Reaction, 2NO2(g) + H2O(a) → HONO(g) + HNO3(a) on Hydrated Silica Particles, J. Phys. Chem. A, 103, 7217–7223, https://doi.org/10.1021/jp9910688, 1999. a, b
Graham, R. A., Winer, A. M., and Pitts, J. N.: Temperature dependence of the unimolecular decomposition of pernitric acid and its atmospheric implications, Chem. Phys. Let., 51, 215–220, https://doi.org/10.1016/0009-2614(77)80387-4, 1977. a
Ha, P. T. M., Kanaya, Y., Taketani, F., Andrés Hernández, M. D., Schreiner, B., Pfeilsticker, K., and Sudo, K.: Implementation of HONO into the chemistry–climate model CHASER (V4.0): roles in tropospheric chemistry, Geosci. Model Dev., 16, 927–960, https://doi.org/10.5194/gmd-16-927-2023, 2023. a, b
Hamryszczak, Z., Dienhart, D., Brendel, B., Rohloff, R., Marno, D., Martinez, M., Harder, H., Pozzer, A., Bohn, B., Zöger, M., Lelieveld, J., and Fischer, H.: Measurement report: Hydrogen peroxide in the upper tropical troposphere over the Atlantic Ocean and western Africa during the CAFE-Africa aircraft campaign, Atmos. Chem. Phys., 23, 5929–5943, https://doi.org/10.5194/acp-23-5929-2023, 2023. a
Heintzenberg, J.: Properties of the Log-Normal Particle Size Distribution, Aerosol Sci. Technol., 21, 46–48, https://doi.org/10.1080/02786829408959695, 1994. a
Heintzenberg, J., Charlson, R. J., Clarke, A. D., Liousse, C., Ramaswamy, V., Shine, K. P., Wendisch, M., and Helas, G.: Measurements and modelling of aerosol single-scattering albedo: Progress, problems and prospects, Contributions to Atmospheric Physics, 70, 249–263, https://hal.science/hal-03358225, 1997. a
Hendrick, F., Müller, J.-F., Clémer, K., Wang, P., De Mazière, M., Fayt, C., Gielen, C., Hermans, C., Ma, J. Z., Pinardi, G., Stavrakou, T., Vlemmix, T., and Van Roozendael, M.: Four years of ground-based MAX-DOAS observations of HONO and NO2 in the Beijing area, Atmos. Chem. Phys., 14, 765–781, https://doi.org/10.5194/acp-14-765-2014, 2014. a
Heue, K.-P., Riede, H., Walter, D., Brenninkmeijer, C. A. M., Wagner, T., Frieß, U., Platt, U., Zahn, A., Stratmann, G., and Ziereis, H.: CARIBIC DOAS observations of nitrous acid and formaldehyde in a large convective cloud, Atmos. Chem. Phys., 14, 6621–6642, https://doi.org/10.5194/acp-14-6621-2014, 2014. a, b, c, d, e, f, g
Holanda, B. A., Pöhlker, M. L., Walter, D., Saturno, J., Sörgel, M., Ditas, J., Ditas, F., Schulz, C., Franco, M. A., Wang, Q., Donth, T., Artaxo, P., Barbosa, H. M. J., Borrmann, S., Braga, R., Brito, J., Cheng, Y., Dollner, M., Kaiser, J. W., Klimach, T., Knote, C., Krüger, O. O., Fütterer, D., Lavrič, J. V., Ma, N., Machado, L. A. T., Ming, J., Morais, F. G., Paulsen, H., Sauer, D., Schlager, H., Schneider, J., Su, H., Weinzierl, B., Walser, A., Wendisch, M., Ziereis, H., Zöger, M., Pöschl, U., Andreae, M. O., and Pöhlker, C.: Influx of African biomass burning aerosol during the Amazonian dry season through layered transatlantic transport of black carbon-rich smoke, Atmos. Chem. Phys., 20, 4757–4785, https://doi.org/10.5194/acp-20-4757-2020, 2020. a
Horváth, M., Lengyel, I., and Bazsa, G.: Kinetics and mechanism of autocatalytic oxidation of formaldehyde by nitric acid, International Journal of Chemical Kinetics, 20, 687–697, https://doi.org/10.1002/kin.550200903, 1988. a
Hrdina, A., Murphy, J. G., Hallar, A. G., Lin, J. C., Moravek, A., Bares, R., Petersen, R. C., Franchin, A., Middlebrook, A. M., Goldberger, L., Lee, B. H., Baasandorj, M., and Brown, S. S.: The role of coarse aerosol particles as a sink of HNO3 in wintertime pollution events in the Salt Lake Valley, Atmos. Chem. Phys., 21, 8111–8126, https://doi.org/10.5194/acp-21-8111-2021, 2021. a, b
Hu, B., Duan, J., Hong, Y., Xu, L., Li, M., Bian, Y., Qin, M., Fang, W., Xie, P., and Chen, J.: Exploration of the atmospheric chemistry of nitrous acid in a coastal city of southeastern China: results from measurements across four seasons, Atmos. Chem. Phys., 22, 371–393, https://doi.org/10.5194/acp-22-371-2022, 2022. a, b
Huang, G., Zhou, X., Deng, G., Qiao, H., and Civerolo, K.: Measurements of atmospheric nitrous acid and nitric acid, Atmos. Environ., 36, 2225–2235, https://doi.org/10.1016/S1352-2310(02)00170-X, 2002. a
Hüneke, T., Aderhold, O.-A., Bounin, J., Dorf, M., Gentry, E., Grossmann, K., Grooß, J.-U., Hoor, P., Jöckel, P., Kenntner, M., Knapp, M., Knecht, M., Lörks, D., Ludmann, S., Matthes, S., Raecke, R., Reichert, M., Weimar, J., Werner, B., Zahn, A., Ziereis, H., and Pfeilsticker, K.: The novel HALO mini-DOAS instrument: inferring trace gas concentrations from airborne UV/visible limb spectroscopy under all skies using the scaling method, Atmos. Meas. Tech., 10, 4209–4234, https://doi.org/10.5194/amt-10-4209-2017, 2017. a, b, c, d, e
Jacob, D. J.: Heterogeneous chemistry and tropospheric ozone, Atmos. Environ., 34, 2131–2159, https://doi.org/10.1016/S1352-2310(99)00462-8, 2000. a
Jenkins, J. M. and Brune, W. H.: Spatially separate production of hydrogen oxides and nitric oxide in lightning, Atmos. Chem. Phys., 25, 5041–5052, https://doi.org/10.5194/acp-25-5041-2025, 2025. a
Jiang, Y., Xue, L., Gu, R., Jia, M., Zhang, Y., Wen, L., Zheng, P., Chen, T., Li, H., Shan, Y., Zhao, Y., Guo, Z., Bi, Y., Liu, H., Ding, A., Zhang, Q., and Wang, W.: Sources of nitrous acid (HONO) in the upper boundary layer and lower free troposphere of the North China Plain: insights from the Mount Tai Observatory, Atmos. Chem. Phys., 20, 12115–12131, https://doi.org/10.5194/acp-20-12115-2020, 2020. a, b, c, d
Jöckel, P., Kerkweg, A., Pozzer, A., Sander, R., Tost, H., Riede, H., Baumgaertner, A., Gromov, S., and Kern, B.: Development cycle 2 of the Modular Earth Submodel System (MESSy2), Geosci. Model Dev., 3, 717–752, https://doi.org/10.5194/gmd-3-717-2010, 2010. a, b
Jöckel, P., Tost, H., Pozzer, A., Kunze, M., Kirner, O., Brenninkmeijer, C. A. M., Brinkop, S., Cai, D. S., Dyroff, C., Eckstein, J., Frank, F., Garny, H., Gottschaldt, K.-D., Graf, P., Grewe, V., Kerkweg, A., Kern, B., Matthes, S., Mertens, M., Meul, S., Neumaier, M., Nützel, M., Oberländer-Hayn, S., Ruhnke, R., Runde, T., Sander, R., Scharffe, D., and Zahn, A.: Earth System Chemistry integrated Modelling (ESCiMo) with the Modular Earth Submodel System (MESSy) version 2.51, Geosci. Model Dev., 9, 1153–1200, https://doi.org/10.5194/gmd-9-1153-2016, 2016. a
Kalberer, M., Ammann, M., Arens, F., Gäggeler, H. W., and Baltensperger, U.: Heterogeneous formation of nitrous acid (HONO) on soot aerosol particles, J. Geophys. Res.-Atmos., 104, 13825–13832, https://doi.org/10.1029/1999JD900141, 1999. a
Kerkweg, A. and Jöckel, P.: The 1-way on-line coupled atmospheric chemistry model system MECO(n) – Part 2: On-line coupling with the Multi-Model-Driver (MMD), Geosci. Model Dev., 5, 111–128, https://doi.org/10.5194/gmd-5-111-2012, 2012a. a
Kerkweg, A. and Jöckel, P.: The 1-way on-line coupled atmospheric chemistry model system MECO(n) – Part 1: Description of the limited-area atmospheric chemistry model COSMO/MESSy, Geosci. Model Dev., 5, 87–110, https://doi.org/10.5194/gmd-5-87-2012, 2012b. a
Kleffmann, J.: Daytime Sources of Nitrous Acid (HONO) in the Atmospheric Boundary Layer, Chem. Phys. Chem., 8, 1137–1144, https://doi.org/10.1002/cphc.200700016, 2007. a
Kleffmann, J., Kurtenbach, R., Lörzer, J., Wiesen, P., Kalthoff, N., Vogel, B., and Vogel, H.: Measured and simulated vertical profiles of nitrous acid – Part I: Field measurements, Atmos. Environ., 37, 2949–2955, https://doi.org/10.1016/S1352-2310(03)00242-5, 2003. a
Kleffmann, J., Gavriloaiei, T., Hofzumahaus, A., Holland, F., Koppmann, R., Rupp, L., Schlosser, E., Siese, M., and Wahner, A.: Daytime formation of nitrous acid: A major source of OH radicals in a forest, Geophys. Res. Lett., 32, L05818, https://doi.org/10.1029/2005GL022524, 2005. a, b
Kluge, F., Hüneke, T., Knecht, M., Lichtenstern, M., Rotermund, M., Schlager, H., Schreiner, B., and Pfeilsticker, K.: Profiling of formaldehyde, glyoxal, methylglyoxal, and CO over the Amazon: normalized excess mixing ratios and related emission factors in biomass burning plumes, Atmos. Chem. Phys., 20, 12363–12389, https://doi.org/10.5194/acp-20-12363-2020, 2020. a, b
Kluge, F., Hüneke, T., Lerot, C., Rosanka, S., Rotermund, M. K., Taraborrelli, D., Weyland, B., and Pfeilsticker, K.: Airborne glyoxal measurements in the marine and continental atmosphere: comparison with TROPOMI observations and EMAC simulations, Atmos. Chem. Phys., 23, 1369–1401, https://doi.org/10.5194/acp-23-1369-2023, 2023. a, b, c
Kritten, L.: Time dependent profiling of UV/vis absorbing radicals by balloon-borne spectroscopic Limb measurements and implications for stratospheric photochemistry, dissertation, Heidelberg University, https://archiv.ub.uni-heidelberg.de/volltextserver/10461/ (last access: 10 April 2026), https://doi.org/10.11588/heidok.00010461, 2009. a
Lammel, G. and Cape, J. N.: Nitrous acid and nitrite in the atmosphere, Chem. Soc. Rev., 25, 361–369, https://doi.org/10.1039/cs9962500361, 1996. a
Laufs, S. and Kleffmann, J.: Investigations on HONO formation from photolysis of adsorbed HNO3 on quartz glass surfaces, Phys. Chem. Chem. Phys., 18, 9616–9625, https://doi.org/10.1039/C6CP00436A, 2016. a, b
Lee, J. D., Whalley, L. K., Heard, D. E., Stone, D., Dunmore, R. E., Hamilton, J. F., Young, D. E., Allan, J. D., Laufs, S., and Kleffmann, J.: Detailed budget analysis of HONO in central London reveals a missing daytime source, Atmos. Chem. Phys., 16, 2747–2764, https://doi.org/10.5194/acp-16-2747-2016, 2016. a, b, c
Lee, T., Yu, X. Y., Ayres, B., Kreidenweis, S. M., Malm, W. C., and Collett, J. L.: Observations of fine and coarse particle nitrate at several rural locations in the United States, Atmos. Environ., 42, 2720–2732, https://doi.org/10.1016/j.atmosenv.2007.05.016, 2008. a
Li, L., Duan, Z., Li, H., Zhu, C., Henkelman, G., Francisco, J. S., and Zeng, X. C.: Formation of HONO from the NH3-promoted hydrolysis of NO2 dimers in the atmosphere, P. Natl. Acad. Sci. USA, 115, 7236–7241, https://doi.org/10.1073/pnas.1807719115, 2018a. a
Li, L., Hoffmann, M. R., and Colussi, A. J.: Role of Nitrogen Dioxide in the Production of Sulfate during Chinese Haze-Aerosol Episodes, Environ. Sci. Technol., 52, 2686–2693, https://doi.org/10.1021/acs.est.7b05222, 2018b. a
Li, S., Matthews, J., and Sinha, A.: Atmospheric Hydroxyl Radical Production from Electronically Excited NO2 and H2O, Science, 319, 1657–1660, https://doi.org/10.1126/science.1151443, 2008. a, b
Li, X., Brauers, T., Häseler, R., Bohn, B., Fuchs, H., Hofzumahaus, A., Holland, F., Lou, S., Lu, K. D., Rohrer, F., Hu, M., Zeng, L. M., Zhang, Y. H., Garland, R. M., Su, H., Nowak, A., Wiedensohler, A., Takegawa, N., Shao, M., and Wahner, A.: Exploring the atmospheric chemistry of nitrous acid (HONO) at a rural site in Southern China, Atmos. Chem. Phys., 12, 1497–1513, https://doi.org/10.5194/acp-12-1497-2012, 2012. a
Li, X., Rohrer, F., Hofzumahaus, A., Brauers, T., Häseler, R., Bohn, B., Broch, S., Fuchs, H., Gomm, S., Holland, F., Jäger, J., Kaiser, J., Keutsch, F. N., Lohse, I., Lu, K., Tillmann, R., Wegener, R., Wolfe, G. M., Mentel, T. F., Kiendler-Scharr, A., and Wahner, A.: Missing Gas-Phase Source of HONO Inferred from Zeppelin Measurements in the Troposphere, Science, 344, 292–296, https://doi.org/10.1126/science.1248999, 2014. a, b, c, d, e, f, g, h
Li, X., Rohrer, F., Hofzumahaus, A., Brauers, T., Häseler, R., Bohn, B., Broch, S., Fuchs, H., Gomm, S., Holland, F., Jäger, J., Kaiser, J., Keutsch, F. N., Lohse, I., Lu, K., Tillmann, R., Wegener, R., Wolfe, G. M., Mentel, T. F., Kiendler-Scharr, A., and Wahner, A.: Response to Comment on “Missing gas-phase source of HONO inferred from Zeppelin measurements in the troposphere”, Science, 348, 1326–1326, https://doi.org/10.1126/science.aaa3777, 2015. a
Li, X., Tian, S., Zu, K., Xie, S., Dong, H., Wang, H., Chen, S., Li, Y., Lu, K., and Zhang, Y.: Revisiting the Ultraviolet Absorption Cross Section of Gaseous Nitrous Acid (HONO): New Insights for Atmospheric HONO Budget, Environ. Sci. Technol., 58, 4247–4256, https://doi.org/10.1021/acs.est.3c08339, 2024. a
Lin, C.-Y., Chen, W.-C., Chien, Y.-Y., Chou, C. C. K., Liu, C.-Y., Ziereis, H., Schlager, H., Förster, E., Obersteiner, F., Krüger, O. O., Holanda, B. A., Pöhlker, M. L., Kaiser, K., Schneider, J., Bohn, B., Pfeilsticker, K., Weyland, B., Andrés Hernández, M. D., and Burrows, J. P.: Effects of transport on a biomass burning plume from Indochina during EMeRGe-Asia identified by WRF-Chem, Atmos. Chem. Phys., 23, 2627–2647, https://doi.org/10.5194/acp-23-2627-2023, 2023. a, b
Lu, X., Wang, Y., Li, J., Shen, L., and Fung, J. C. H.: Evidence of heterogeneous HONO formation from aerosols and the regional photochemical impact of this HONO source, Environ. Res. Lett., 13, 114002, https://doi.org/10.1088/1748-9326/aae492, 2018. a
Ma, J., Liu, Y., Han, C., Ma, Q., Liu, C., and He, H.: Review of heterogeneous photochemical reactions of NOy on aerosol – A possible daytime source of nitrous acid (HONO) in the atmosphere, J. Environ. Sci., 25, 326–334, https://doi.org/10.1016/S1001-0742(12)60093-X, 2013a. a
Ma, J. Z., Beirle, S., Jin, J. L., Shaiganfar, R., Yan, P., and Wagner, T.: Tropospheric NO2 vertical column densities over Beijing: results of the first three years of ground-based MAX-DOAS measurements (2008–2011) and satellite validation, Atmos. Chem. Phys., 13, 1547–1567, https://doi.org/10.5194/acp-13-1547-2013, 2013b. a
Mallaun, C., Giez, A., and Baumann, R.: Calibration of 3-D wind measurements on a single-engine research aircraft, Atmos. Meas. Tech., 8, 3177–3196, https://doi.org/10.5194/amt-8-3177-2015, 2015. a
Mao, J., Zhao, T., Keller, C. A., Wang, X., McFarland, P. J., Jenkins, J. M., and Brune, W. H.: Global Impact of Lightning-Produced Oxidants, Geophys. Res. Lett., 48, e2021GL095740, https://doi.org/10.1029/2021GL095740, 2021. a
Mark, G., Korth, H. G., Schuchmann, H. P., and von Sonntag, C.: The photochemistry of aqueous nitrate ion revisited, J. Photoch. Photobiol. A, 101, 89–103, https://doi.org/10.1016/S1010-6030(96)04391-2, 1996. a
Marno, D., Ernest, C., Hens, K., Javed, U., Klimach, T., Martinez, M., Rudolf, M., Lelieveld, J., and Harder, H.: Calibration of an airborne HOx instrument using the All Pressure Altitude-based Calibrator for HOx Experimentation (APACHE), Atmos. Meas. Tech., 13, 2711–2731, https://doi.org/10.5194/amt-13-2711-2020, 2020. a
Martins-Costa, M. T. C., Anglada, J. M., Francisco, J. S., and Ruiz-López, M. F.: The Aqueous Surface as an Efficient Transient Stop for the Reactivity of Gaseous NO2 in Liquid Water, J. Am. Chem. Soc., 142, 20937–20941, https://doi.org/10.1021/jacs.0c10364, 2020. a, b
Mertens, L. A., Winiberg, F. A. F., Allen, H. M., Sander, S. P., and Okumura, M.: Yields of HONO2 and HOONO Products from the Reaction of HO2 and NO Using Pulsed Laser Photolysis and Mid-Infrared Cavity-Ringdown Spectroscopy, J. Phys. Chem. A, 126, 7342–7360, https://doi.org/10.1021/acs.jpca.2c04643, 2022. a
Mertens, M., Kerkweg, A., Jöckel, P., Tost, H., and Hofmann, C.: The 1-way on-line coupled model system MECO(n) – Part 4: Chemical evaluation (based on MESSy v2.52), Geosci. Model Dev., 9, 3545–3567, https://doi.org/10.5194/gmd-9-3545-2016, 2016. a
Mollner, A. K., Valluvadasan, S., Feng, L., Sprague, M. K., Okumura, M., Milligan, D. B., Bloss, W. J., Sander, S. P., Martien, P. T., Harley, R. A., McCoy, A. B., and Carter, W. P. L.: Rate of Gas Phase Association of Hydroxyl Radical and Nitrogen Dioxide, Science, 330, 646–649, https://doi.org/10.1126/science.1193030, 2010. a, b, c
Monge, M. E., D’Anna, B., Mazri, L., Giroir-Fendler, A., Ammann, M., Donaldson, D. J., and George, C.: Light changes the atmospheric reactivity of soot, P. Natl. Acad. Sci. USA, 107, 6605–6609, https://doi.org/10.1073/pnas.0908341107, 2010. a, b
Nash, T.: Nitrous acid in the atmosphere and laboratory experiments on its photolysis, Tellus, 26, 175–179, https://doi.org/10.3402/tellusa.v26i1-2.9768, 1974. a
Ndour, M., D'Anna, B., George, C., Ka, O., Balkanski, Y., Kleffmann, J., Stemmler, K., and Ammann, M.: Photoenhanced uptake of NO2 on mineral dust: Laboratory experiments and model simulations, Geophys. Res. Lett., 35, L05812, https://doi.org/10.1029/2007GL032006, 2008. a
Neuman, J. A., Trainer, M., Brown, S. S., Min, K.-E., Nowak, J. B., Parrish, D. D., Peischl, J., Pollack, I. B., Roberts, J. M., Ryerson, T. B., and Veres, P. R.: HONO emission and production determined from airborne measurements over the Southeast U.S., J. Geophys. Res.-Atmos., 121, 9237–9250, https://doi.org/10.1002/2016JD025197, 2016. a, b, c
Nussbaumer, C. M., Parchatka, U., Tadic, I., Bohn, B., Marno, D., Martinez, M., Rohloff, R., Harder, H., Kluge, F., Pfeilsticker, K., Obersteiner, F., Zöger, M., Doerich, R., Crowley, J. N., Lelieveld, J., and Fischer, H.: Modification of a conventional photolytic converter for improving aircraft measurements of NO2 via chemiluminescence, Atmos. Meas. Tech., 14, 6759–6776, https://doi.org/10.5194/amt-14-6759-2021, 2021a. a
Nussbaumer, C. M., Tadic, I., Dienhart, D., Wang, N., Edtbauer, A., Ernle, L., Williams, J., Obersteiner, F., Gutiérrez-Álvarez, I., Harder, H., Lelieveld, J., and Fischer, H.: Measurement report: In situ observations of deep convection without lightning during the tropical cyclone Florence 2018, Atmos. Chem. Phys., 21, 7933–7945, https://doi.org/10.5194/acp-21-7933-2021, 2021b. a
Nussbaumer, C. M., Fischer, H., Lelieveld, J., and Pozzer, A.: What controls ozone sensitivity in the upper tropical troposphere?, Atmos. Chem. Phys., 23, 12651–12669, https://doi.org/10.5194/acp-23-12651-2023, 2023. a
Oswald, R., Behrendt, T., Ermel, M., Wu, D., Su, H., Cheng, Y., Breuninger, C., Moravek, A., Mougin, E., Delon, C., Loubet, B., Pommerening-Röser, A., Sörgel, M., Pöschl, U., Hoffmann, T., Andreae, M. O., Meixner, F. X., and Trebs, I.: HONO Emissions from Soil Bacteria as a Major Source of Atmospheric Reactive Nitrogen, Science, 341, 1233–1235, https://doi.org/10.1126/science.1242266, 2013. a
Perner, D. and Platt, U.: Detection of nitrous acid in the atmosphere by differential optical absorption, Geophys. Res. Lett., 6, 917–920, https://doi.org/10.1029/GL006i012p00917, 1979. a, b
Platt, U., Perner, D., Harris, G. W., Winer, A. M., and Pitts Jr., J. N.: Observations of nitrous acid in an urban atmosphere by differential optical absorption, Nature, 285, 312–314, https://doi.org/10.1038/285312a0, 1980. a
Polyansky, O. L., Kyuberis, A. A., Zobov, N. F., Tennyson, J., Yurchenko, S. N., and Lodi, L.: ExoMol molecular line lists XXX: a complete high-accuracy line list for water, Mon. Not. R. Astron. Soc., 480, 2597–2608, https://doi.org/10.1093/mnras/sty1877, 2018. a
Puķīte, J., Kühl, S., Deutschmann, T., Platt, U., and Wagner, T.: Extending differential optical absorption spectroscopy for limb measurements in the UV, Atmos. Meas. Tech., 3, 631–653, https://doi.org/10.5194/amt-3-631-2010, 2010. a
Reed, C., Evans, M. J., Crilley, L. R., Bloss, W. J., Sherwen, T., Read, K. A., Lee, J. D., and Carpenter, L. J.: Evidence for renoxification in the tropical marine boundary layer, Atmos. Chem. Phys., 17, 4081–4092, https://doi.org/10.5194/acp-17-4081-2017, 2017. a, b, c
Reisinger, A. R.: Observations of HNO2 in the polluted winter atmosphere: possible heterogeneous production on aerosols, Atmos. Environ., 34, 3865–3874, https://doi.org/10.1016/S1352-2310(00)00179-5, 2000. a
Roeckner, E., Brokopf, R., Esch, M., Giorgetta, M., Hagemann, S., Kornblueh, L., Manzini, E., Schlese, U., and Schulzweida, U.: Sensitivity of Simulated Climate to Horizontal and Vertical Resolution in the ECHAM5 Atmosphere Model, J. Climate, 19, 3771–3791, https://doi.org/10.1175/JCLI3824.1, 2006. a
Romer, P. S., Wooldridge, P. J., Crounse, J. D., Kim, M. J., Wennberg, P. O., Dibb, J. E., Scheuer, E., Blake, D. R., Meinardi, S., Brosius, A. L., Thames, A. B., Miller, D. O., Brune, W. H., Hall, S. R., Ryerson, T. B., and Cohen, R. C.: Constraints on Aerosol Nitrate Photolysis as a Potential Source of HONO and NOx, Environ. Sci. Technol., 52, 13738–13746, https://doi.org/10.1021/acs.est.8b03861, 2018. a
Rotermund, M. K., Bense, V., Chipperfield, M. P., Engel, A., Grooß, J.-U., Hoor, P., Hüneke, T., Keber, T., Kluge, F., Schreiner, B., Schuck, T., Vogel, B., Zahn, A., and Pfeilsticker, K.: Organic and inorganic bromine measurements around the extratropical tropopause and lowermost stratosphere: insights into the transport pathways and total bromine, Atmos. Chem. Phys., 21, 15375–15407, https://doi.org/10.5194/acp-21-15375-2021, 2021. a, b
Rothman, L. S., Gordon, I. E., Barbe, A., Benner, D. C., Bernath, P. F., Birk, M., Boudon, V., Brown, L. R., Campargue, A., Champion, J. P., Chance, K., Coudert, L. H., Dana, V., Devi, V. M., Fally, S., Flaud, J. M., Gamache, R. R., Goldman, A., Jacquemart, D., Kleiner, I., Lacome, N., Lafferty, W. J., Mandin, J. Y., Massie, S. T., Mikhailenko, S. N., Miller, C. E., Moazzen-Ahmadi, N., Naumenko, O. V., Nikitin, A. V., Orphal, J., Perevalov, V. I., Perrin, A., Predoi-Cross, A., Rinsland, C. P., Rotger, M., Šimečková, M., Smith, M. A. H., Sung, K., Tashkun, S. A., Tennyson, J., Toth, R. A., Vandaele, A. C., and Vander Auwera, J.: The HITRAN 2008 molecular spectroscopic database, J. Quant. Spectrosc. Ra., 110, 533–572, https://doi.org/10.1016/j.jqsrt.2009.02.013, 2009. a
Rutter, A. P., Malloy, Q. G. J., Leong, Y. J., Gutierrez, C. V., Calzada, M., Scheuer, E., Dibb, J. E., and Griffin, R. J.: The reduction of HNO3 by volatile organic compounds emitted by motor vehicles, Atmos. Environ., 87, 200–206, https://doi.org/10.1016/j.atmosenv.2014.01.056, 2014. a
Ryan, R. G., Rhodes, S., Tully, M., Wilson, S., Jones, N., Frieß, U., and Schofield, R.: Daytime HONO, NO2 and aerosol distributions from MAX-DOAS observations in Melbourne, Atmos. Chem. Phys., 18, 13969–13985, https://doi.org/10.5194/acp-18-13969-2018, 2018. a
Scharko, N. K., Berke, A. E., and Raff, J. D.: Release of Nitrous Acid and Nitrogen Dioxide from Nitrate Photolysis in Acidic Aqueous Solutions, Environ. Sci. Technol., 48, 11991–12001, https://doi.org/10.1021/es503088x, 2014. a, b, c, d
Schulz, C., Schneider, J., Amorim Holanda, B., Appel, O., Costa, A., de Sá, S. S., Dreiling, V., Fütterer, D., Jurkat-Witschas, T., Klimach, T., Knote, C., Krämer, M., Martin, S. T., Mertes, S., Pöhlker, M. L., Sauer, D., Voigt, C., Walser, A., Weinzierl, B., Ziereis, H., Zöger, M., Andreae, M. O., Artaxo, P., Machado, L. A. T., Pöschl, U., Wendisch, M., and Borrmann, S.: Aircraft-based observations of isoprene-epoxydiol-derived secondary organic aerosol (IEPOX-SOA) in the tropical upper troposphere over the Amazon region, Atmos. Chem. Phys., 18, 14979–15001, https://doi.org/10.5194/acp-18-14979-2018, 2018. a
Serdyuchenko, A., Gorshelev, V., Weber, M., Chehade, W., and Burrows, J. P.: High spectral resolution ozone absorption cross-sections – Part 2: Temperature dependence, Atmos. Meas. Tech., 7, 625–636, https://doi.org/10.5194/amt-7-625-2014, 2014. a
Shah, V., Jacob, D. J., Dang, R., Lamsal, L. N., Strode, S. A., Steenrod, S. D., Boersma, K. F., Eastham, S. D., Fritz, T. M., Thompson, C., Peischl, J., Bourgeois, I., Pollack, I. B., Nault, B. A., Cohen, R. C., Campuzano-Jost, P., Jimenez, J. L., Andersen, S. T., Carpenter, L. J., Sherwen, T., and Evans, M. J.: Nitrogen oxides in the free troposphere: implications for tropospheric oxidants and the interpretation of satellite NO2 measurements, Atmos. Chem. Phys., 23, 1227–1257, https://doi.org/10.5194/acp-23-1227-2023, 2023. a, b
Shi, Q., Tao, Y., Krechmer, J. E., Heald, C. L., Murphy, J. G., Kroll, J. H., and Ye, Q.: Laboratory Investigation of Renoxification from the Photolysis of Inorganic Particulate Nitrate, Environ. Sci. Technol. 55, 854–861, https://doi.org/10.1021/acs.est.0c06049, 2021. a
Silvern, R. F., Jacob, D. J., Travis, K. R., Sherwen, T., Evans, M. J., Cohen, R. C., Laughner, J. L., Hall, S. R., Ullmann, K., Crounse, J. D., Wennberg, P. O., Peischl, J., and Pollack, I. B.: Observed NO/NO2 Ratios in the Upper Troposphere Imply Errors in NO-NO2-O3 Cycling Kinetics or an Unaccounted NOx Reservoir, Geophys. Res. Lett., 45, 4466–4474, https://doi.org/10.1029/2018GL077728, 2018. a, b, c
Singh, A., Crilley, L. R., Pope, F. D., and Bloss, W. J.: Insights into HONO sources from observations during a solar eclipse, Environ. Sci.: Atmospheres, 1, 395–405, https://doi.org/10.1039/D1EA00010A, 2021. a, b
Song, M., Zhao, X., Liu, P., Mu, J., He, G., Zhang, C., Tong, S., Xue, C., Zhao, X., Ge, M., and Mu, Y.: Atmospheric NOx oxidation as major sources for nitrous acid (HONO), npj Climate and Atmospheric Science, 6, 1–8, https://doi.org/10.1038/s41612-023-00357-8, 2023a. a
Song, Y., Xue, C., Zhang, Y., Liu, P., Bao, F., Li, X., and Mu, Y.: Measurement report: Exchange fluxes of HONO over agricultural fields in the North China Plain, Atmos. Chem. Phys., 23, 15733–15747, https://doi.org/10.5194/acp-23-15733-2023, 2023b. a
Spataro, F. and Ianniello, A.: Sources of atmospheric nitrous acid: State of the science, current research needs, and future prospects, J. Air Waste Manag. A., 64, 1232–1250, https://doi.org/10.1080/10962247.2014.952846, 2014. a, b
Stemmler, K., Ammann, M., Donders, C., Kleffmann, J., and George, C.: Photosensitized reduction of nitrogen dioxide on humic acid as a source of nitrous acid, Nature, 440, 195–198, https://doi.org/10.1038/nature04603, 2006. a, b
Stutz, J., Kim, E. S., Platt, U., Bruno, P., Perrino, C., and Febo, A.: UV-visible absorption cross sections of nitrous acid, J. Geophys. Res.-Atmos., 105, 14585–14592, https://doi.org/10.1029/2000JD900003, 2000. a, b, c
Stutz, J., Werner, B., Spolaor, M., Scalone, L., Festa, J., Tsai, C., Cheung, R., Colosimo, S. F., Tricoli, U., Raecke, R., Hossaini, R., Chipperfield, M. P., Feng, W., Gao, R.-S., Hintsa, E. J., Elkins, J. W., Moore, F. L., Daube, B., Pittman, J., Wofsy, S., and Pfeilsticker, K.: A new Differential Optical Absorption Spectroscopy instrument to study atmospheric chemistry from a high-altitude unmanned aircraft, Atmos. Meas. Tech., 10, 1017–1042, https://doi.org/10.5194/amt-10-1017-2017, 2017. a, b, c, d, e
Su, H., Cheng, Y., Oswald, R., Behrendt, T., Trebs, I., Meixner, F. X., Andreae, M. O., Cheng, P., Zhang, Y., and Pöschl, U.: Soil Nitrite as a Source of Atmospheric HONO and OH Radicals, Science, 333, 1616–1618, https://doi.org/10.1126/science.1207687, 2011. a
Sullivan, M. N., Chu, L. T., and Zhu, L.: Comment on “Investigations on HONO formation from photolysis of adsorbed HNO3 on quartz glass surfaces” by S. Laufs and J. Kleffmann, Phys. Chem. Chem. Phys., 2016, 18, 9616, Phys. Chem. Chem. Phys., 20, 30537–30539, https://doi.org/10.1039/C8CP04497J, 2018. a
Szakács, P., Csontos, J., Das, S., and Kállay, M.: High-Accuracy Theoretical Thermochemistry of Atmospherically Important Nitrogen Oxide Derivatives, J. Phys. Chem. A, 115, 3144–3153, https://doi.org/10.1021/jp112116x, 2011. a
Tadic, I., Crowley, J. N., Dienhart, D., Eger, P., Harder, H., Hottmann, B., Martinez, M., Parchatka, U., Paris, J.-D., Pozzer, A., Rohloff, R., Schuladen, J., Shenolikar, J., Tauer, S., Lelieveld, J., and Fischer, H.: Net ozone production and its relationship to nitrogen oxides and volatile organic compounds in the marine boundary layer around the Arabian Peninsula, Atmos. Chem. Phys., 20, 6769–6787, https://doi.org/10.5194/acp-20-6769-2020, 2020. a
Tadic, I., Nussbaumer, C. M., Bohn, B., Harder, H., Marno, D., Martinez, M., Obersteiner, F., Parchatka, U., Pozzer, A., Rohloff, R., Zöger, M., Lelieveld, J., and Fischer, H.: Central role of nitric oxide in ozone production in the upper tropical troposphere over the Atlantic Ocean and western Africa, Atmos. Chem. Phys., 21, 8195–8211, https://doi.org/10.5194/acp-21-8195-2021, 2021. a, b
Tao, W., Su, H., Zheng, G., Wang, J., Wei, C., Liu, L., Ma, N., Li, M., Zhang, Q., Pöschl, U., and Cheng, Y.: Aerosol pH and chemical regimes of sulfate formation in aerosol water during winter haze in the North China Plain, Atmos. Chem. Phys., 20, 11729–11746, https://doi.org/10.5194/acp-20-11729-2020, 2020. a
Thalman, R. and Volkamer, R.: Temperature dependent absorption cross-sections of O2–O2 collision pairs between 340 and 630 nm and at atmospherically relevant pressure, Phys. Chem. Chem. Phys., 15, 15371–15381, https://doi.org/10.1039/C3CP50968K, 2013. a
Tong, S., Hou, S., Zhang, Y., Chu, B., Liu, Y., He, H., Zhao, P., and Ge, M.: Exploring the nitrous acid (HONO) formation mechanism in winter Beijing: direct emissions and heterogeneous production in urban and suburban areas, Faraday Discuss., 189, 213–230, https://doi.org/10.1039/C5FD00163C, 2016. a, b
Toublanc, D.: Henyey–Greenstein and Mie phase functions in Monte Carlo radiative transfer computations, Appl. Optics, 35, 3270–3274, https://doi.org/10.1364/AO.35.003270, 1996. a
Villena, G., Kleffmann, J., Kurtenbach, R., Wiesen, P., Lissi, E., Rubio, M. A., Croxatto, G., and Rappenglück, B.: Vertical gradients of HONO, NOx and O3 in Santiago de Chile, Atmos. Environ., 45, 3867–3873, https://doi.org/10.1016/j.atmosenv.2011.01.073, 2011a. a
Villena, G., Wiesen, P., Cantrell, C. A., Flocke, F., Fried, A., Hall, S. R., Hornbrook, R. S., Knapp, D., Kosciuch, E., Mauldin III, R. L., McGrath, J. A., Montzka, D., Richter, D., Ullmann, K., Walega, J., Weibring, P., Weinheimer, A., Staebler, R. M., Liao, J., Huey, L. G., and Kleffmann, J.: Nitrous acid (HONO) during polar spring in Barrow, Alaska: A net source of OH radicals?, J. Geophys. Res.-Atmos., 116, https://doi.org/10.1029/2011JD016643, 2011b. a
Wang, L., Wen, L., Xu, C., Chen, J., Wang, X., Yang, L., Wang, W., Yang, X., Sui, X., Yao, L., and Zhang, Q.: HONO and its potential source particulate nitrite at an urban site in North China during the cold season, Sci. Total Environ., 538, 93–101, https://doi.org/10.1016/j.scitotenv.2015.08.032, 2015. a
Wang, L., Chai, J., Gaubert, B., and Huang, Y.: A review of measurements and model simulations of atmospheric nitrous acid, Atmos. Environ., 347, 121094, https://doi.org/10.1016/j.atmosenv.2025.121094, 2025. a
Wang, N., Edtbauer, A., Stönner, C., Pozzer, A., Bourtsoukidis, E., Ernle, L., Dienhart, D., Hottmann, B., Fischer, H., Schuladen, J., Crowley, J. N., Paris, J.-D., Lelieveld, J., and Williams, J.: Measurements of carbonyl compounds around the Arabian Peninsula: overview and model comparison, Atmos. Chem. Phys., 20, 10807–10829, https://doi.org/10.5194/acp-20-10807-2020, 2020. a
Wang, Y., Beirle, S., Hendrick, F., Hilboll, A., Jin, J., Kyuberis, A. A., Lampel, J., Li, A., Luo, Y., Lodi, L., Ma, J., Navarro, M., Ortega, I., Peters, E., Polyansky, O. L., Remmers, J., Richter, A., Puentedura, O., Van Roozendael, M., Seyler, A., Tennyson, J., Volkamer, R., Xie, P., Zobov, N. F., and Wagner, T.: MAX-DOAS measurements of HONO slant column densities during the MAD-CAT campaign: inter-comparison, sensitivity studies on spectral analysis settings, and error budget, Atmos. Meas. Tech., 10, 3719–3742, https://doi.org/10.5194/amt-10-3719-2017, 2017. a, b, c
Wang, Y., Dörner, S., Donner, S., Böhnke, S., De Smedt, I., Dickerson, R. R., Dong, Z., He, H., Li, Z., Li, Z., Li, D., Liu, D., Ren, X., Theys, N., Wang, Y., Wang, Y., Wang, Z., Xu, H., Xu, J., and Wagner, T.: Vertical profiles of NO2, SO2, HONO, HCHO, CHOCHO and aerosols derived from MAX-DOAS measurements at a rural site in the central western North China Plain and their relation to emission sources and effects of regional transport, Atmos. Chem. Phys., 19, 5417–5449, https://doi.org/10.5194/acp-19-5417-2019, 2019. a, b
Warneck, P. and Wurzinger, C.: Product quantum yields for the 305-nm photodecomposition of nitrate in aqueous solution, The Journal of Physical Chemistry, 92, 6278–6283, https://doi.org/10.1021/j100333a022, 1988. a
Weber, R. J., Guo, H., Russell, A. G., and Nenes, A.: High aerosol acidity despite declining atmospheric sulfate concentrations over the past 15 years, Nat. Geosci., 9, 282–285, https://doi.org/10.1038/ngeo2665, 2016. a
Weger, M., Heinold, B., Engler, C., Schumann, U., Seifert, A., Fößig, R., Voigt, C., Baars, H., Blahak, U., Borrmann, S., Hoose, C., Kaufmann, S., Krämer, M., Seifert, P., Senf, F., Schneider, J., and Tegen, I.: The impact of mineral dust on cloud formation during the Saharan dust event in April 2014 over Europe, Atmos. Chem. Phys., 18, 17545–17572, https://doi.org/10.5194/acp-18-17545-2018, 2018. a
Wei, N., Marais, E. A., Lu, G., Ryan, R. G., and Sauvage, B.: Characterization of reactive oxidized nitrogen in the global upper troposphere using recent and historic commercial and research aircraft campaigns and GEOS-Chem, Atmos. Chem. Phys., 25, 7925–7940, https://doi.org/10.5194/acp-25-7925-2025, 2025. a
Wennberg, P. O., Hanisco, T. F., Jaeglé, L., Jacob, D. J., Hintsa, E. J., Lanzendorf, E. J., Anderson, J. G., Gao, R.-S., Keim, E. R., Donnelly, S. G., Negro, L. A. D., Fahey, D. W., McKeen, S. A., Salawitch, R. J., Webster, C. R., May, R. D., Herman, R. L., Proffitt, M. H., Margitan, J. J., Atlas, E. L., Schauffler, S. M., Flocke, F., McElroy, C. T., and Bui, T. P.: Hydrogen Radicals, Nitrogen Radicals, and the Production of O3 in the Upper Troposphere, Science, 279, 49–53, https://doi.org/10.1126/science.279.5347.49, 1998. a
Wennberg, P. O., Salawitch, R. J., Donaldson, D. J., Hanisco, T. F., Lanzendorf, E. J., Perkins, K. K., Lloyd, S. A., Vaida, V., Gao, R. S., Hintsa, E. J., Cohen, R. C., Swartz, W. H., Kusterer, T. L., and Anderson, D. E.: Twilight observations suggest unknown sources of HOx, Geophys. Res. Lett., 26, 1373–1376, https://doi.org/10.1029/1999GL900255, 1999. a, b
Werner, B., Stutz, J., Spolaor, M., Scalone, L., Raecke, R., Festa, J., Colosimo, S. F., Cheung, R., Tsai, C., Hossaini, R., Chipperfield, M. P., Taverna, G. S., Feng, W., Elkins, J. W., Fahey, D. W., Gao, R.-S., Hintsa, E. J., Thornberry, T. D., Moore, F. L., Navarro, M. A., Atlas, E., Daube, B. C., Pittman, J., Wofsy, S., and Pfeilsticker, K.: Probing the subtropical lowermost stratosphere and the tropical upper troposphere and tropopause layer for inorganic bromine, Atmos. Chem. Phys., 17, 1161–1186, https://doi.org/10.5194/acp-17-1161-2017, 2017. a
Wine, P. H., Wilmouth, D. M., Percival, C. J., Orkin, V. L., Kurylo, M. J., Kolb, C. E., Huie, R. E., Dibble, T. S., Crounse, J. D., Cappa, C., Barker, J. R., Abbatt, J. P. D., Sander, S. P., and Burkholder, J. B.: Chemical kinetics and photochemical data for use in atmospheric studies; evaluation number 19, Jet Propulsion Laboratory, https://ntrs.nasa.gov/citations/20210006316 (last access: 10 April 2026), 2020. a
Winterrath, T., Kurosu, T. P., Richter, A., and Burrows, J. P.: Enhanced O3 and NO2 in thunderstorm clouds: Convection or production?, Geophys. Res. Lett., 26, 1291–1294, https://doi.org/10.1029/1999GL900243, 1999. a
Wu, D., Horn, M. A., Behrendt, T., Müller, S., Li, J., Cole, J. A., Xie, B., Ju, X., Li, G., Ermel, M., Oswald, R., Fröhlich-Nowoisky, J., Hoor, P., Hu, C., Liu, M., Andreae, M. O., Pöschl, U., Cheng, Y., Su, H., Trebs, I., Weber, B., and Sörgel, M.: Soil HONO emissions at high moisture content are driven by microbial nitrate reduction to nitrite: tackling the HONO puzzle, The ISME Journal, 13, 1688–1699, https://doi.org/10.1038/s41396-019-0379-y, 2019. a
Xing, C., Xu, S., Song, Y., Liu, C., Liu, Y., Lu, K., Tan, W., Zhang, C., Hu, Q., Wang, S., Wu, H., and Lin, H.: A new insight into the vertical differences in NO2 heterogeneous reaction to produce HONO over inland and marginal seas, Atmos. Chem. Phys., 23, 5815–5834, https://doi.org/10.5194/acp-23-5815-2023, 2023. a, b
Xing, L., Wu, J., Elser, M., Tong, S., Liu, S., Li, X., Liu, L., Cao, J., Zhou, J., El-Haddad, I., Huang, R., Ge, M., Tie, X., Prévôt, A. S. H., and Li, G.: Wintertime secondary organic aerosol formation in Beijing–Tianjin–Hebei (BTH): contributions of HONO sources and heterogeneous reactions, Atmos. Chem. Phys., 19, 2343–2359, https://doi.org/10.5194/acp-19-2343-2019, 2019. a
Xu, W., Kuang, Y., Zhao, C., Tao, J., Zhao, G., Bian, Y., Yang, W., Yu, Y., Shen, C., Liang, L., Zhang, G., Lin, W., and Xu, X.: NH3-promoted hydrolysis of NO2 induces explosive growth in HONO, Atmos. Chem. Phys., 19, 10557–10570, https://doi.org/10.5194/acp-19-10557-2019, 2019. a
Yabushita, A., Enami, S., Sakamoto, Y., Kawasaki, M., Hoffmann, M. R., and Colussi, A. J.: Anion-Catalyzed Dissolution of NO2 on Aqueous Microdroplets, J. Phys. Chem. A, 113, 4844–4848, https://doi.org/10.1021/jp900685f, 2009. a, b
Ye, C., Zhou, X., Pu, D., Stutz, J., Festa, J., Spolaor, M., Cantrell, C., Mauldin, R. L., Weinheimer, A., and Haggerty, J.: Comment on “Missing gas-phase source of HONO inferred from Zeppelin measurements in the troposphere”, Science, 348, 1326–1326, https://doi.org/10.1126/science.aaa1992, 2015. a
Ye, C., Gao, H., Zhang, N., and Zhou, X.: Photolysis of Nitric Acid and Nitrate on Natural and Artificial Surfaces, Environ. Sci. Technol., 50, 3530–3536, https://doi.org/10.1021/acs.est.5b05032, 2016a. a, b, c, d, e
Ye, C., Zhou, X., Pu, D., Stutz, J., Festa, J., Spolaor, M., Tsai, C., Cantrell, C., Mauldin, R. L., Campos, T., Weinheimer, A., Hornbrook, R. S., Apel, E. C., Guenther, A., Kaser, L., Yuan, B., Karl, T., Haggerty, J., Hall, S., Ullmann, K., Smith, J. N., Ortega, J., and Knote, C.: Rapid cycling of reactive nitrogen in the marine boundary layer, Nature, 532, 489–491, https://doi.org/10.1038/nature17195, 2016b. a, b, c, d, e, f
Ye, C., Zhang, N., Gao, H., and Zhou, X.: Photolysis of Particulate Nitrate as a Source of HONO and NOx, Environ. Sci. Technol., 51, 6849–6856, https://doi.org/10.1021/acs.est.7b00387, 2017. a, b
Ye, C., Zhou, X., Pu, D., Stutz, J., Festa, J., Spolaor, M., Tsai, C., Cantrell, C., Mauldin III, R. L., Weinheimer, A., Hornbrook, R. S., Apel, E. C., Guenther, A., Kaser, L., Yuan, B., Karl, T., Haggerty, J., Hall, S., Ullmann, K., Smith, J., and Ortega, J.: Tropospheric HONO distribution and chemistry in the southeastern US, Atmos. Chem. Phys., 18, 9107–9120, https://doi.org/10.5194/acp-18-9107-2018, 2018. a, b, c, d, e, f, g
Yu, Y., Cheng, P., Li, H., Yang, W., Han, B., Song, W., Hu, W., Wang, X., Yuan, B., Shao, M., Huang, Z., Li, Z., Zheng, J., Wang, H., and Yu, X.: Budget of nitrous acid (HONO) at an urban site in the fall season of Guangzhou, China, Atmos. Chem. Phys., 22, 8951–8971, https://doi.org/10.5194/acp-22-8951-2022, 2022. a, b, c
Zahn, A., Weppner, J., Widmann, H., Schlote-Holubek, K., Burger, B., Kühner, T., and Franke, H.: A fast and precise chemiluminescence ozone detector for eddy flux and airborne application, Atmos. Meas. Tech., 5, 363–375, https://doi.org/10.5194/amt-5-363-2012, 2012. a
Zhang, J. and Donahue, N. M.: Constraining the Mechanism and Kinetics of OH + NO2 and HO2 + NO Using the Multiple-Well Master Equation, J. Phys. Chem. A, 110, 6898–6911, https://doi.org/10.1021/jp0556512, 2006. a, b, c
Zhang, N., Zhou, X., Shepson, P. B., Gao, H., Alaghmand, M., and Stirm, B.: Aircraft measurement of HONO vertical profiles over a forested region, Geophys. Res. Lett., 36, L15820, https://doi.org/10.1029/2009GL038999, 2009. a, b, c, d, e, f
Zhang, S., Sarwar, G., Xing, J., Chu, B., Xue, C., Sarav, A., Ding, D., Zheng, H., Mu, Y., Duan, F., Ma, T., and He, H.: Improving the representation of HONO chemistry in CMAQ and examining its impact on haze over China, Atmos. Chem. Phys., 21, 15809–15826, https://doi.org/10.5194/acp-21-15809-2021, 2021. a, b
Zheng, G., Su, H., Wang, S., Andreae, M. O., Pöschl, U., and Cheng, Y.: Multiphase buffer theory explains contrasts in atmospheric aerosol acidity, Science, 369, 1374–1377, https://doi.org/10.1126/science.aba3719, 2020a. a
Zheng, J., Shi, X., Ma, Y., Ren, X., Jabbour, H., Diao, Y., Wang, W., Ge, Y., Zhang, Y., and Zhu, W.: Contribution of nitrous acid to the atmospheric oxidation capacity in an industrial zone in the Yangtze River Delta region of China, Atmos. Chem. Phys., 20, 5457–5475, https://doi.org/10.5194/acp-20-5457-2020, 2020b. a, b
Zhou, X., Beine, H. J., Honrath, R. E., Fuentes, J. D., Simpson, W., Shepson, P. B., and Bottenheim, J. W.: Snowpack photochemical production of HONO: A major source of OH in the Arctic boundary layer in springtime, Geophys. Res. Lett., 28, 4087–4090, https://doi.org/10.1029/2001GL013531, 2001. a, b
Zhou, X., Gao, H., He, Y., Huang, G., Bertman, S. B., Civerolo, K., and Schwab, J.: Nitric acid photolysis on surfaces in low-NOx environments: Significant atmospheric implications, Geophys. Res. Lett., 30, 2217, https://doi.org/10.1029/2003GL018620, 2003. a, b, c
Zhou, X., Huang, G., Civerolo, K., Roychowdhury, U., and Demerjian, K. L.: Summertime observations of HONO, HCHO, and O3 at the summit of Whiteface Mountain, New York, J. Geophys. Res.-Atmos., 112, https://doi.org/10.1029/2006JD007256, 2007. a
Zhu, Q., Laughner, J. L., and Cohen, R. C.: Lightning NO2 simulation over the contiguous US and its effects on satellite NO2 retrievals, Atmos. Chem. Phys., 19, 13067–13078, https://doi.org/10.5194/acp-19-13067-2019, 2019. a
Zhu, R. S. and Lin, M. C.: Ab initio study of the HO2+NO reaction: Prediction of the total rate constant and product branching ratios for the forward and reverse processes, The Journal of Chemical Physics, 119, 10667–10677, https://doi.org/10.1063/1.1619373, 2003. a, b, c
Ziemba, L. D., Dibb, J. E., Griffin, R. J., Anderson, C. H., Whitlow, S. I., Lefer, B. L., Rappenglück, B., and Flynn, J.: Heterogeneous conversion of nitric acid to nitrous acid on the surface of primary organic aerosol in an urban atmosphere, Atmos. Environ., 44, 4081–4089, https://doi.org/10.1016/j.atmosenv.2008.12.024, 2010. a
Ziereis, H., Minikin, A., Schlager, H., Gayet, J. F., Auriol, F., Stock, P., Baehr, J., Petzold, A., Schumann, U., Weinheimer, A., Ridley, B., and Ström, J.: Uptake of reactive nitrogen on cirrus cloud particles during INCA, Geophys. Res. Lett., 31, L05115, https://doi.org/10.1029/2003GL018794, 2004. a