the Creative Commons Attribution 4.0 License.
the Creative Commons Attribution 4.0 License.
 | 15 Jan 2026
Cloud base height determines fog occurrence patterns in the Namib Desert
Hendrik Andersen
Jan Cermak
Roland Vogt
Bianca Adler
In the hyper-arid Namib Desert, fog serves as the only regular source of moisture, vital for sustaining local ecosystems. While fog occurrence in the region is typically associated with the advection of marine stratus clouds and their interaction with topography, its spatial distribution is strongly influenced by cloud base height, which remains poorly understood. To address this gap, this study utilizes ground-based remote sensing and in-situ observations to analyze systematic spatial and temporal patterns of cloud base height. Our results reveal clear seasonality and a diurnal cycle, with cloud base lowering moderately (10–50 m h−1) during the evening and early night, and lifting rapidly (30–150 m h−1) after sunrise, especially inland. Additionally, the findings indicate that these rates are influenced by horizontal gradients in cloud thickness. Quantile regression highlights the tight relationship between cloud base height and near-surface relative humidity () that is expected in well-mixed boundary layer, which can therefore be employed to estimate cloud base height across FogNet sites. In a case study, the potential value of the estimated cloud base height for separating fog from low clouds in satellite-based products is shown. In the future, a full integration of the estimated cloud base height with a satellite-based fog and low-cloud product can enable a spatially continuous mapping of fog in the region for the first time, which would facilitate fog ecological impact studies.
- Article
(9202 KB) - Full-text XML
- BibTeX
- EndNote


Fog is a characteristic meteorological phenomenon in the Namib Desert, one of the driest regions on Earth, which lies along the southwestern coast of Africa, and serves a critical function in supplying moisture to the desert's ecosystems. It thereby supports the persistence of plant and animal life in this otherwise arid environment (e.g. Seely and Henschel, 1998; Shanyengana et al., 2002; Ebner et al., 2011; Azúa-Bustos et al., 2011; Roth-Nebelsick et al., 2012; Eckardt et al., 2013; McHugh et al., 2015). An example of this is the existence of fertile islands of vegetation, known as “Fog-Plant-Oases” (Gan et al., 2024), which depend on fog deposition for their water supply. In addition, fog can transport nutrients and pollutants (Weathers et al., 2020), potentially impacting biogeochemistry where fog water is deposited (Warren-Rhodes et al., 2013; Gottlieb et al., 2019). In light of expected regional climatic changes in southern Africa (warmer and drier, Maúre et al., 2018), Namib fog could become even more important to regional ecosystems in the future.
The Namib Desert experiences fog throughout the year; however, historical station observations (Nagel, 1959; Lancaster et al., 1984) and more recent data from the FogNet observation stations (Andersen et al., 2019) show a clear seasonal variation in spatial fog occurrence patterns. These patterns are closely related to the distance from the coast, the elevation of the land surface, and the seasonally varying vertical position of the low stratus layer. Fog in the Namib Desert is predominantly of advective nature (Olivier and Stockton, 1989; Seely and Henschel, 1998; Andersen et al., 2019; Spirig et al., 2019; Formenti et al., 2019; Andersen et al., 2020), with advection fog frequently occurring in a narrow coastal area (less than 15 km) and an advected stratus cloud often extending further inland, historically referred to as “advective fog” and “high fog” respectively in Seely and Henschel (1998). This advected stratus layer is typically lower-lying (≈ 200 m AMSL, above mean sea level, referred to as the “Low-FLC Season”, Andersen et al., 2019) during the austral winter, but during the austral summer, it rises to around 400 m AMSL (referred to as the “High-FLC Season”, Andersen et al., 2019) and can extend more than 60 km inland, where it may intercept the terrain and manifest as fog (Olivier, 1992; Andersen et al., 2019). These spatio-temporal patterns of the advected fog and low stratus clouds can be observed using satellites (Olivier, 1995; Cermak, 2012; Andersen and Cermak, 2018; Andersen et al., 2019). However, distinguishing fog from other very low-lying stratiform clouds in satellite images is very challenging and not conclusively solved (Cermak and Bendix, 2011; Egli et al., 2018). While studies by Cermak (2018) and Qiao et al. (2022) highlight the potential of satellite-based lidar observations for fog detection, the data's sparse coverage limits its suitability for continuous spatiotemporal fog mapping. As in advected stratus situations, the stratus base frequently does not reach the surface near the lower-lying coastal areas (Andersen et al., 2019), the vertical position of the stratus layer is a critical parameter that partially determines fog occurrence patterns. In the similar environment of the Coastal Cordillera of the Atacama Desert, in-situ optical observation-based estimates have been used to characterize the vertical structure of advective fog (Del Río et al., 2021), though it provides only limited detail on the vertical dynamics of fog layer evolution. For the Namib Desert, only the seasonal cycle of the cloud base has been analyzed with sparsely available ground-based remote sensing data. Diurnal vertical developments during the fog and low cloud (FLC) life cycle, such as cloud base lowering after the stratus is advected inland and stratus lifting in the fog dissipation phase, have only been documented for a small number of cases (Spirig et al., 2019).
This study aims to address this gap by analyzing cloud base height (CBH) measurements from multiple ceilometers across a transect from the coast to inland locations. This study seeks to document typical seasonal and diurnal CBH patterns, and to investigate the potential of using local in-situ measurements of surface relative humidity (RH) to estimate CBH with a statistical model. Since marine stratus and stratocumulus clouds typically develop within a well-mixed boundary layer (Wood and Bretherton, 2004), a strong correlation between near-surface RH and CBH is expected in the Namib Desert as the receptor region of these marine clouds. Previous studies have demonstrated the applicability of this approach through the lifting condensation level, which links surface temperature and humidity to the expected cloud base height (Craven et al., 2002; Vogelmann et al., 2015; Kutta and Hubbart, 2023; Lobos-Roco et al., 2024). Given that RH measurements are available at more locations for a longer time period, this approach could be used to generate a continuous, long-term dataset of estimated CBH across the range of FogNet stations. Our research aims to answer the following key questions:
-
What are the patterns of CBH development during the FLC life cycle, and do they vary with coastal proximity and season?
-
Can local station measurements of RH be used to accurately estimate CBH of FLCs?
2.1 The study region: The Central Namib
The Central Namib Desert, particularly the area monitored by the FogNet station network (Kaspar et al., 2015) (≈ 22.5–24° S and 14–15.5° E, Fig. 1), is a focal point for investigating FLCs due to their high frequency of occurrence (Andersen et al., 2019) and historical station measurements (Nagel, 1959; Lancaster et al., 1984). The cold Benguela ocean current along the coast of the Namib Desert facilitates the formation of extensive low-level stratus clouds over the ocean (Andrews and Hutchings, 1980), which often advect eastward after sunset. To the east, near Gobabeb, the terrain rises up to 406 m for 56 km inland distance, intercepting the advected stratus clouds to form fog where CBH reaches the surface. Only rarely, fog occurs further inland than 100 km (Olivier, 1992), or ≈ 15°30′ E in the region shown in Fig. 1.
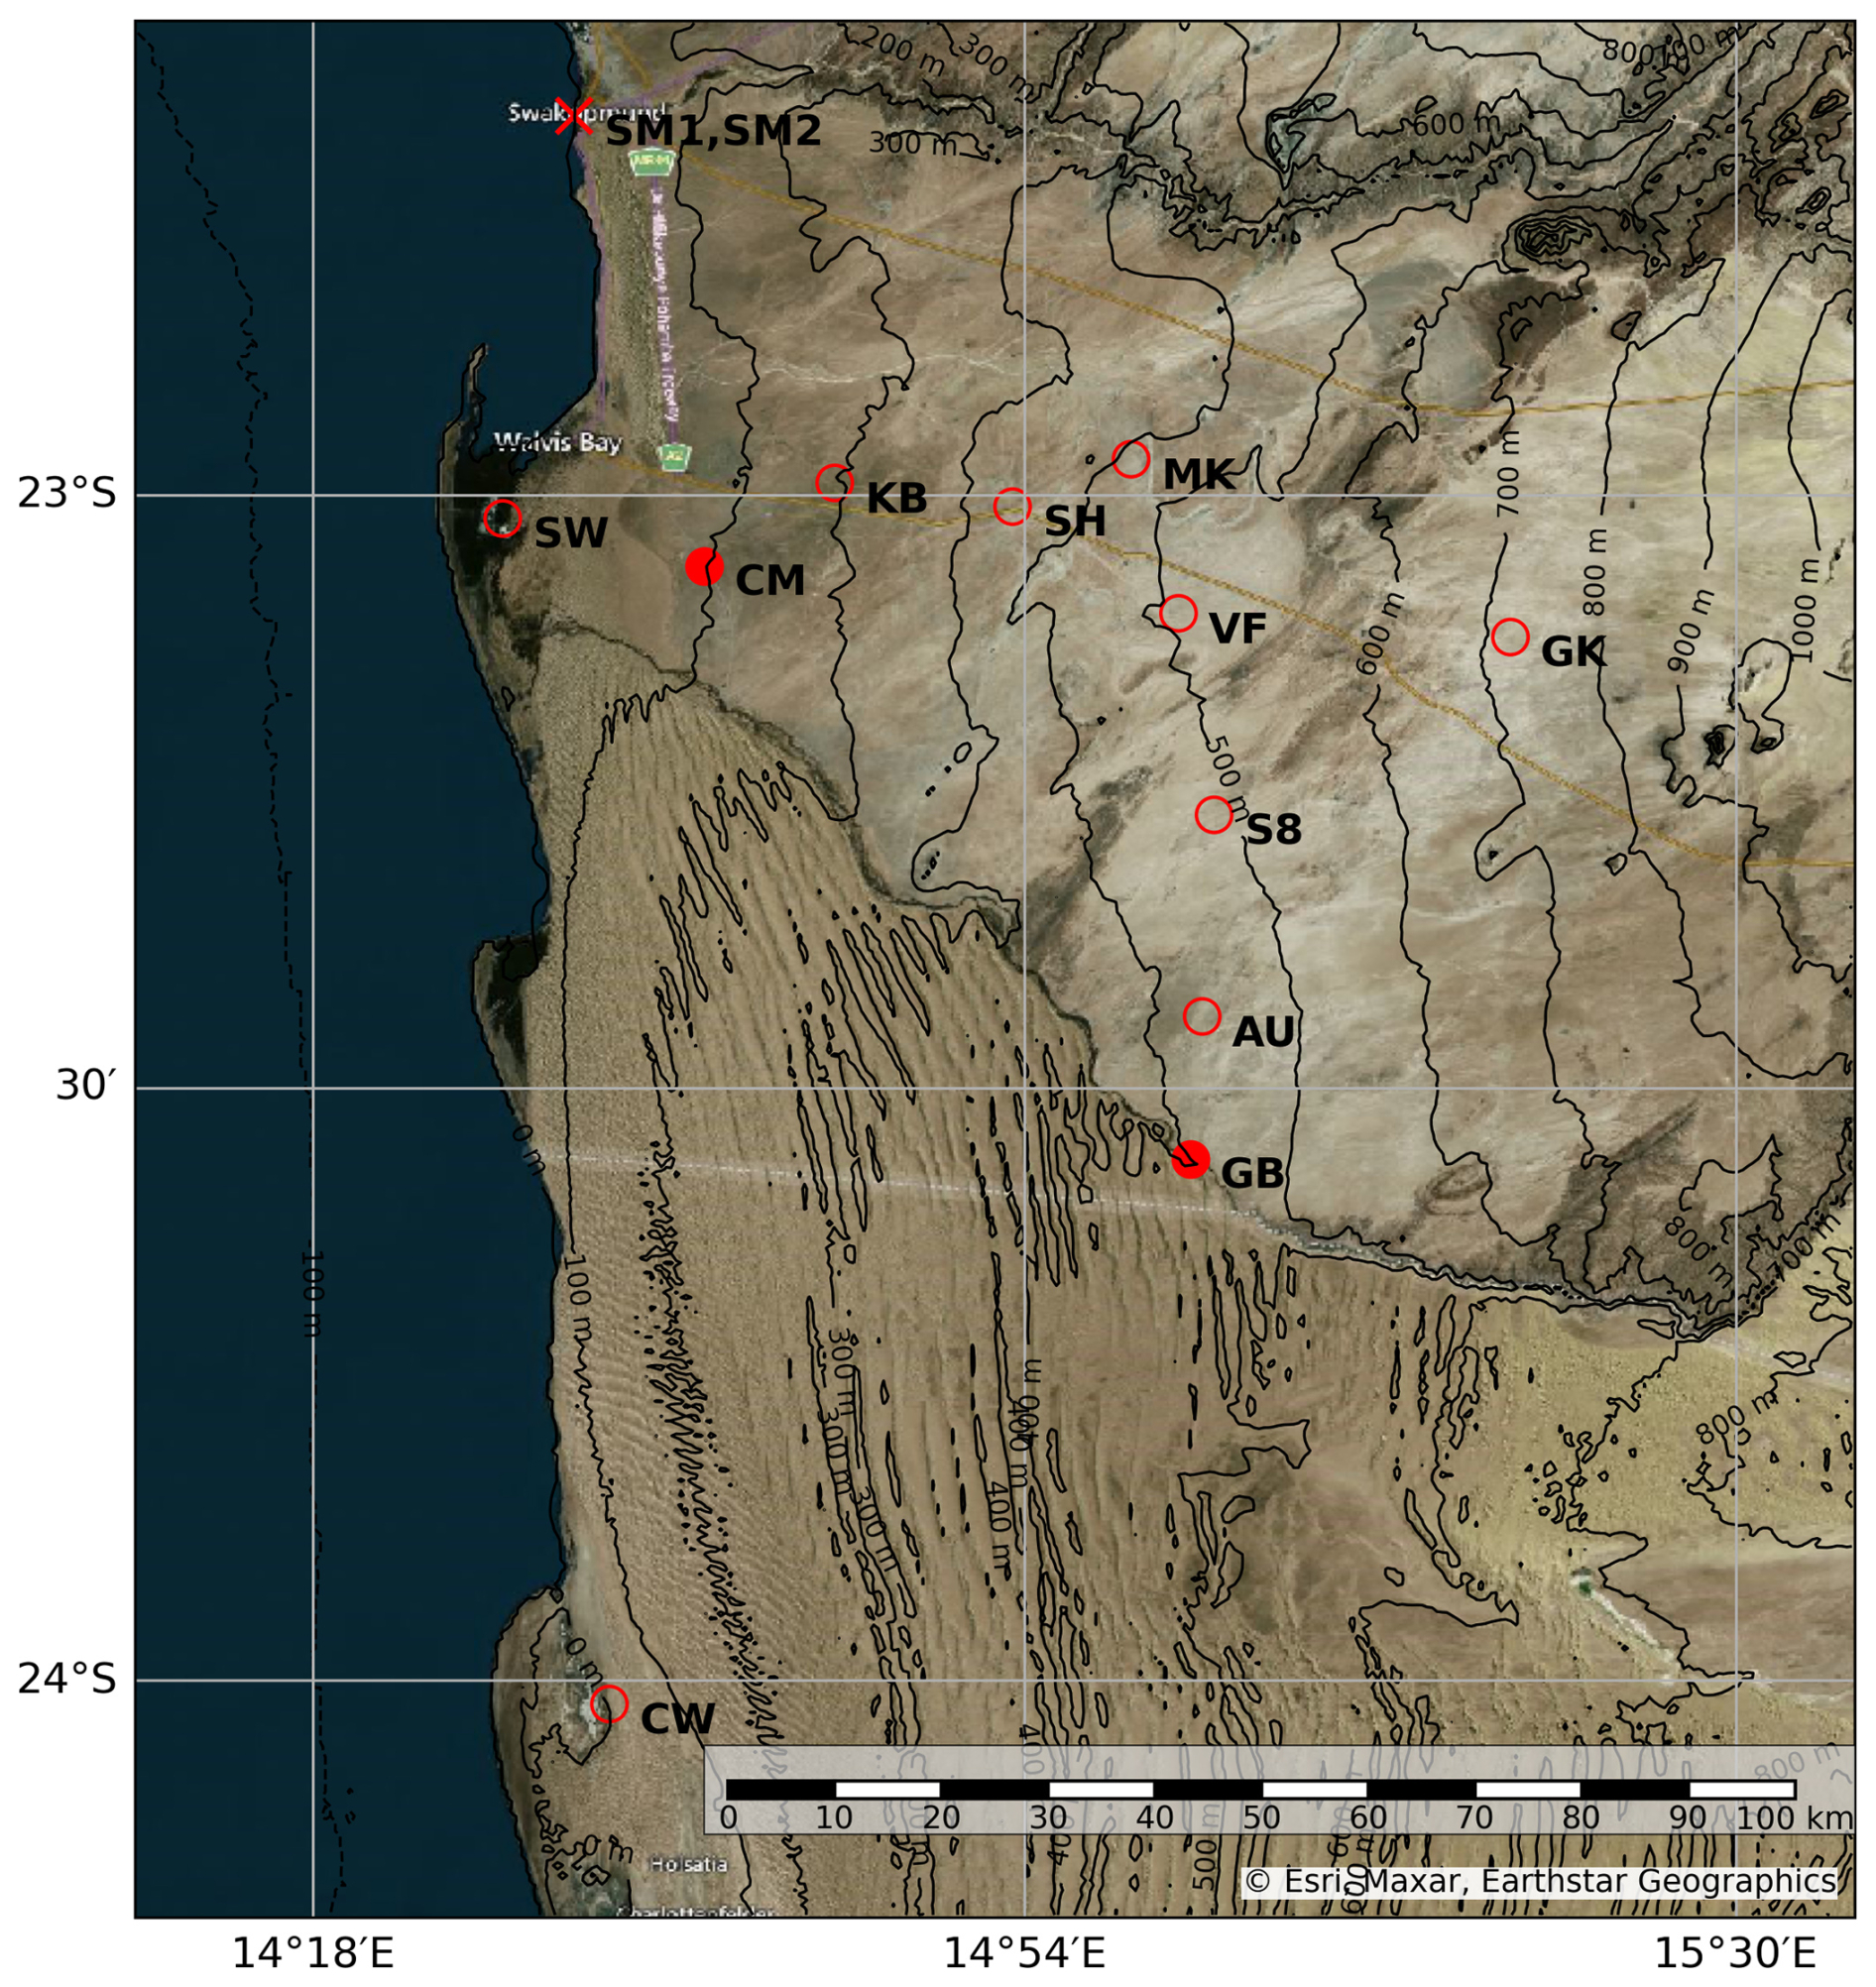
Figure 1Map showing the research area in the central Namib and the spatial distribution of the FogNet stations described in Table 2. The stations marked with filled red dots (GB:Gobabeb and CM:Coastal Met) and at Swakopmund (SM1 and SM2, marked as ×, not a part of FogNet) are equipped with ceilometers, providing continuous CBH observations.
2.2 Ceilometer Measurements
For this study, ceilometer data were sourced from two key instruments deployed in the Central Namib region (Fig. 1): the Vaisala CL31 at Coastal Met (CM) and Swakopmund (SM), and the Campbell Scientific CS135 at Gobabeb (GB). Operating ceilometers in harsh desert environments such as Namibia is challenging due to extreme conditions, dust, and infrequent maintenance, which can lead to substantial data gaps. Regular maintenance at Gobabeb has nevertheless ensured relatively consistent availability, providing a valuable and continuous record (Fig. 2). Notably, the CL31 at Swakopmund was repositioned by ≈ 500 m towards the coast in 2022.
Key instrument specifications are summarized in Table 1 (Weigner et al., 2019; Vaisala, 2024; Barbato et al., 2016; CampbellScientific, 2018; Wagner et al., 2024). While both instruments are well-suited for detecting fog and low clouds, differences in wavelength, resolution, and blind zones may lead to small systematic differences in retrieved cloud base height. For example, cloud base height estimates for liquid water clouds can vary by 50–100 m between the CL31 and CS135 due to firmware definitions (Wagner et al., 2024). To ensure consistency, we adopt a minimum reliable detection limit of 40 m and exclude CBH values exceeding 1000 m to focus exclusively on fog and low cloud conditions. While ceilometers are reliable instruments for vertical atmospheric profiling, it is important to note that they are typically not calibrated against one another. Consequently, small biases may occur between measurements from identical instruments, as discussed in (Weigner et al., 2019). All measurements were recorded using Campbell Scientific data loggers and processed into .dat files with LoggerNet software (CampbellScientific, 2007).
Table 1Summary of ceilometer instrument characteristics used in this study.

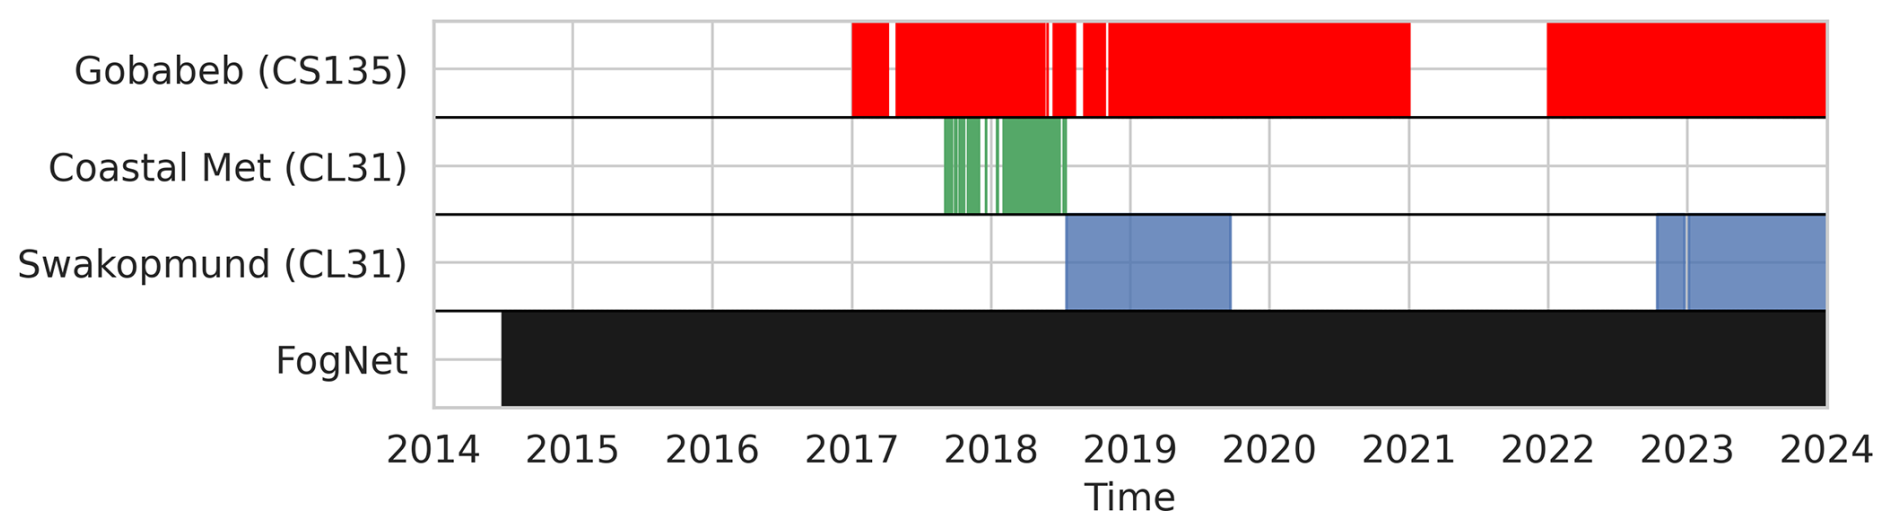
Figure 2Temporal coverage of ceilometer (CL31 and CS135) and in-situ meteorological (FogNet) data used in this study across key locations in the Central Namib.
2.3 FogNet Station Data
In addition to ceilometer data, this study incorporates meteorological observations from the FogNet network (Kaspar et al., 2015). FogNet comprises a network of meteorological stations strategically positioned along two transects (N–S, and W–E) (as shown in Fig. 1, with further details on the individual stations provided in Table 2). The stations measure fog precipitation (using the Juvik fog collector (Juvik and Nullet, 1995), usually with a 30 min delay; Spirig et al., 2019), temperature and humidity (Campbell Scientific CS215 sensor; CampbellScientific, 2013b), wind speed and direction (R.M Young Model 05103 Wind Monitor; CampbellScientific, 2013a), net radiation (CNR4 Net Radiometer; CampbellScientific, 2017), and other meteorological variables at 1 min intervals. These observations offer valuable insights into the characteristics related to the occurrence of fog and low clouds (Spirig et al., 2019). Notably, the availability of these meteorological datasets has been consistent over about a decade, with data available since 1 July 2014, as illustrated in Fig. 2. While short-term outages may occur occasionally, the overall data coverage remains reliably continuous.
Table 2Latitude, longitude, elevation, and distance to the coast of the FogNet stations, sorted from west to east. Station positions are shown in Fig. 1.
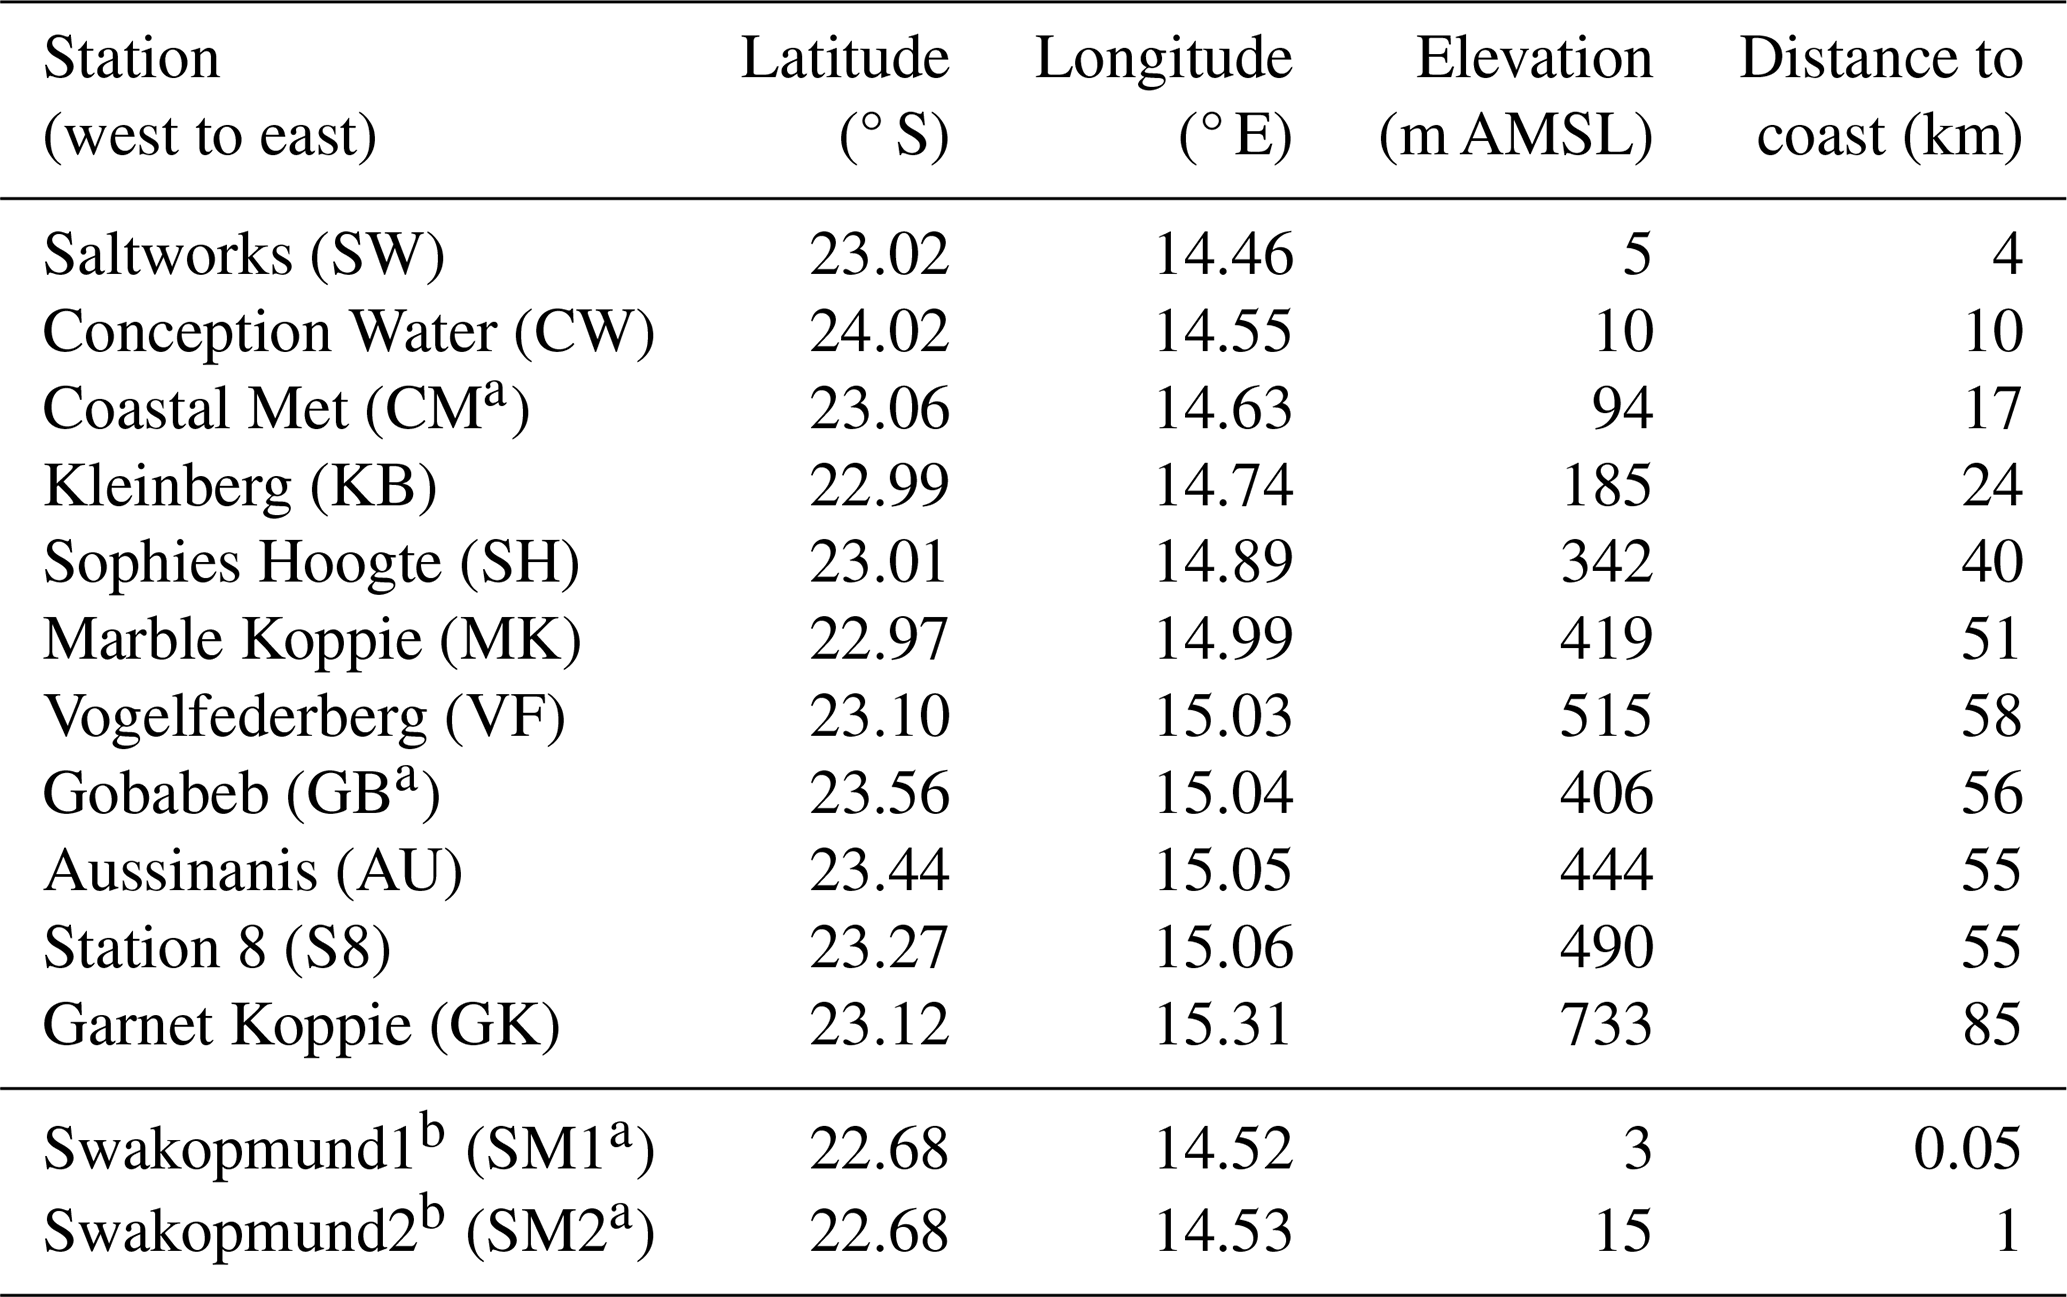
a Stations with ceilometers installed. b Station not a part of FogNet network.
2.4 FLC Satellite Product
Monitoring fog and low cloud cover in regions with sparse observational networks, such as the Namib Desert, requires reliable remote sensing techniques. This study employs a satellite-based fog and low cloud (FLC) product (Andersen and Cermak, 2018) that is based on Spinning Enhanced Visible and Infrared Imager (SEVIRI) observations mounted on the geostationary Meteosat Second Generation (MSG) satellites. By making use of thermal infrared observations, FLCs can be detected during day and night at the native 15 min and 3 km (at nadir) resolutions. The validation against surface net radiation measurements has shown a high accuracy, with a 97 % correctness of the classifications and a false alarm rate of 12 %. The FLC product has previously been used to study the spatio-temporal patterns of FLC occurrence (Andersen et al., 2019), as well as FLC processes (Andersen et al., 2020; Mass et al., 2025). However, note that this satellite-based method is not able to differentiate between fog and low clouds, a general limitation of fog retrievals from satellite imagers. In this study, the FLC product is employed to align ground-based measurements with satellite observations by masking fog and low-cloud time steps in the FogNet station records.
2.5 Estimation of FLC Lowering/Lifting Rates
To gain deeper insights into CBH dynamics during FLC events, this study estimates CBH lowering and lifting rates using a rolling regression approach (Zivot and Wang, 2003). To mitigate short-term fluctuations and enhance the robust quantification of lowering and lifting phases in the raw CBH data, which is resampled at a 1 min resolution, a 1 h rolling window is applied. This window length balances sensitivity and stability, preserving sufficient temporal resolution to capture gradual CBH variations. Within each 1 h window, a linear regression is performed to compute the slope of the CBH trend, representing the rate of change in CBH. Positive slopes indicate a lifting of the cloud base, while negative slopes signify a lowering. This approach yields a continuous time series of average hourly CBH rate of change (m h−1) at a 1 min temporal resolution. Figure 3 illustrates the methodology, showing a 1 h rolling regression applied to CBH data. The shaded region marks an exemplary regression window, with the slope of the fitted black line representing the CBH rate of change at the center timestep, in this case, a lifting event with a slope of 82.3 m h−1 at 22:00 UTC. This example demonstrates the method's capacity to capture underlying CBH trends while minimizing short-term variability. To further analyze diurnal patterns in CBH dynamics, the computed CBH rates are first resampled to hourly averages and then grouped by hour of the day across all days, months, and years. This resampling provides a structured view of the diurnal evolution of CBH changes and facilitates the quantification of the number of lifting and lowering events within each hourly interval during the observational period.
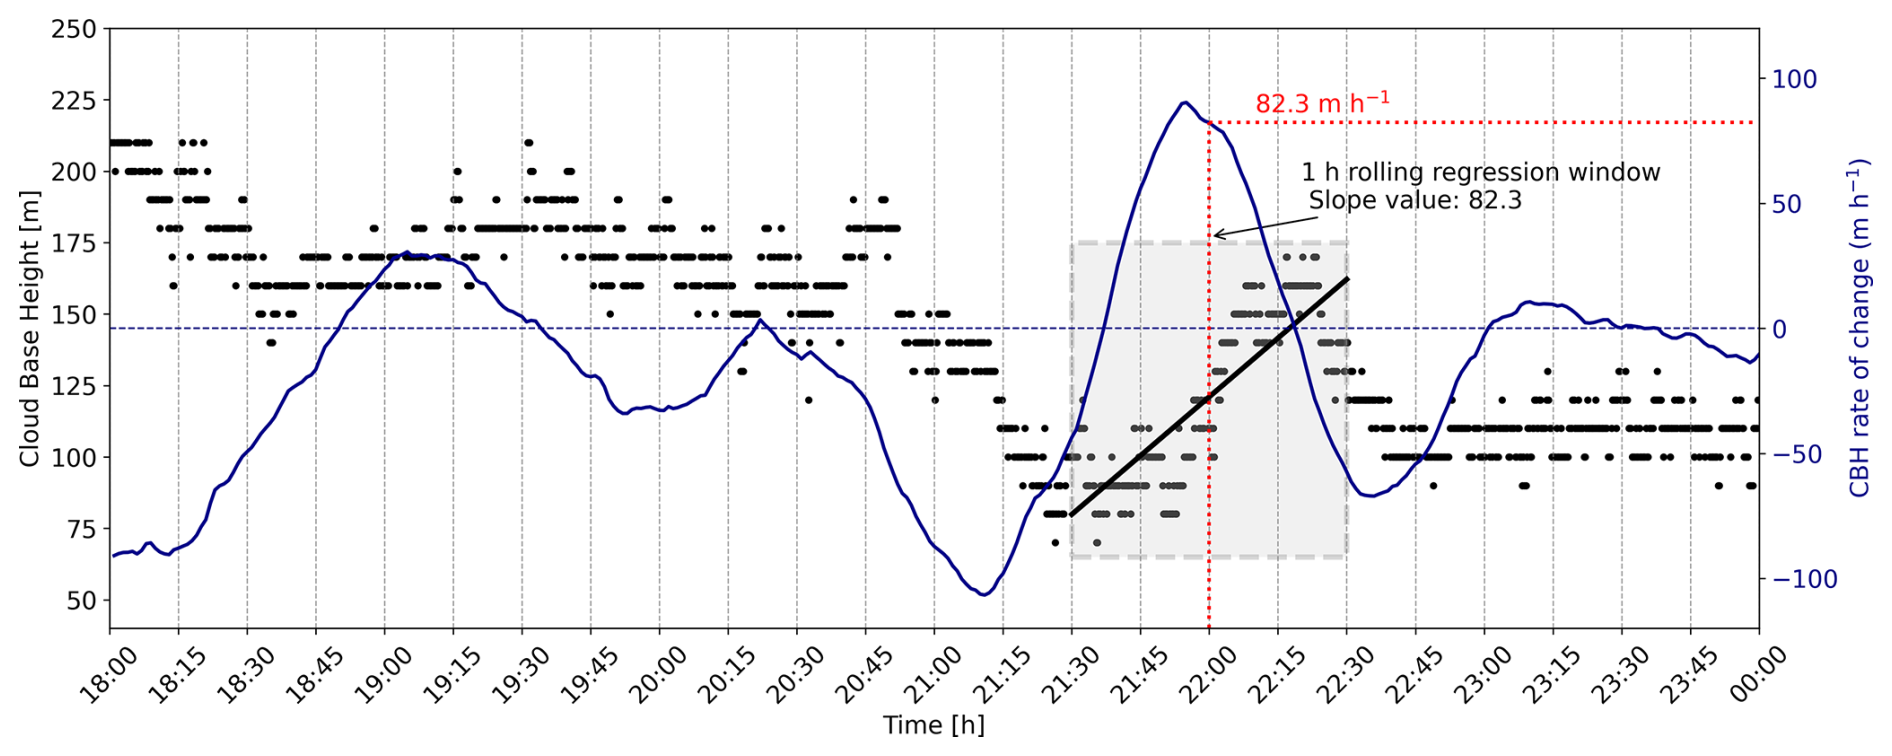
Figure 3Illustration of the 1 h rolling regression method applied to 1 min resolution CBH data. Black dots denote individual CBH measurements; the blue line shows the computed CBH rate of change (m h−1). The shaded region indicates the 1 h regression window centered around the 22:00 timestep. The slope of the fitted black line within this window corresponds to the rate of CBH change at 22:00.
2.6 CBH Estimation from FogNet Station Measurements
Due to the sparsity of ceilometer measurements in the Central Namib region, this study explores the potential of using local station measurements from the FogNet network to estimate CBH. RH is used to predict CBH using a quantile (0.5) regression model (Koenker and Hallock, 2001). Quantile regression is employed to model the conditional distribution of a predictand at different quantiles. Unlike Ordinary Least Squares regression (OLS), which models only the conditional mean, quantile regression allows for the estimation of CBH across various percentiles, thereby accounting for, offering advantages over OLS regression by capturing the full distributional behavior of the response, particularly in the presence of heteroscedasticity or non-normal residuals. Unlike OLS, which minimizes the squared residuals to estimate the conditional mean, quantile regression minimizes the quantile loss function:
where is the residual, τ is the target quantile (here, 0.5), and 𝕀 is the indicator function (equal to 1 if u<0, and 0 otherwise). This loss function yields estimates that are more robust to outliers and skewed distributions, which are common in CBH and RH dataset. To illustrate the method, consider a simplified example where RH measurements (%) are used to estimate CBH (m) at a single station. Suppose a quantile regression model of the form
is fitted to the data, yielding coefficients β0=500 and . This implies that the median CBH decreases by 22 m for every 1 % increase in RH, consistent with the physical expectation that higher RH correlates with lower cloud bases. The model thereby captures the central tendency of the CBH–RH relationship while accounting for data asymmetry and variability.
Leveraging the continuous RH data available from FogNet stations, this approach aims to generate extended time series of estimated CBH (CBHe), even in the absence of direct ceilometer measurements. To assess regional consistency of the CBH-RH relationship, CBH is regressed upon RH individually for the Coastal Met and Gobabeb stations.
3.1 Diurnal and Seasonal Patterns of CBH
Diurnal and seasonal patterns of CBH and their variability across the three ceilometer locations are shown in Fig. 4. Each panel displays seasonal variation along the horizontal axis (month) and diurnal variation along the vertical axis (hour of day – centered on midnight as FLCs occur during the night/early morning). For a comprehensive comparison, we analyze each row across columns, highlighting spatial differences in CBH behavior.
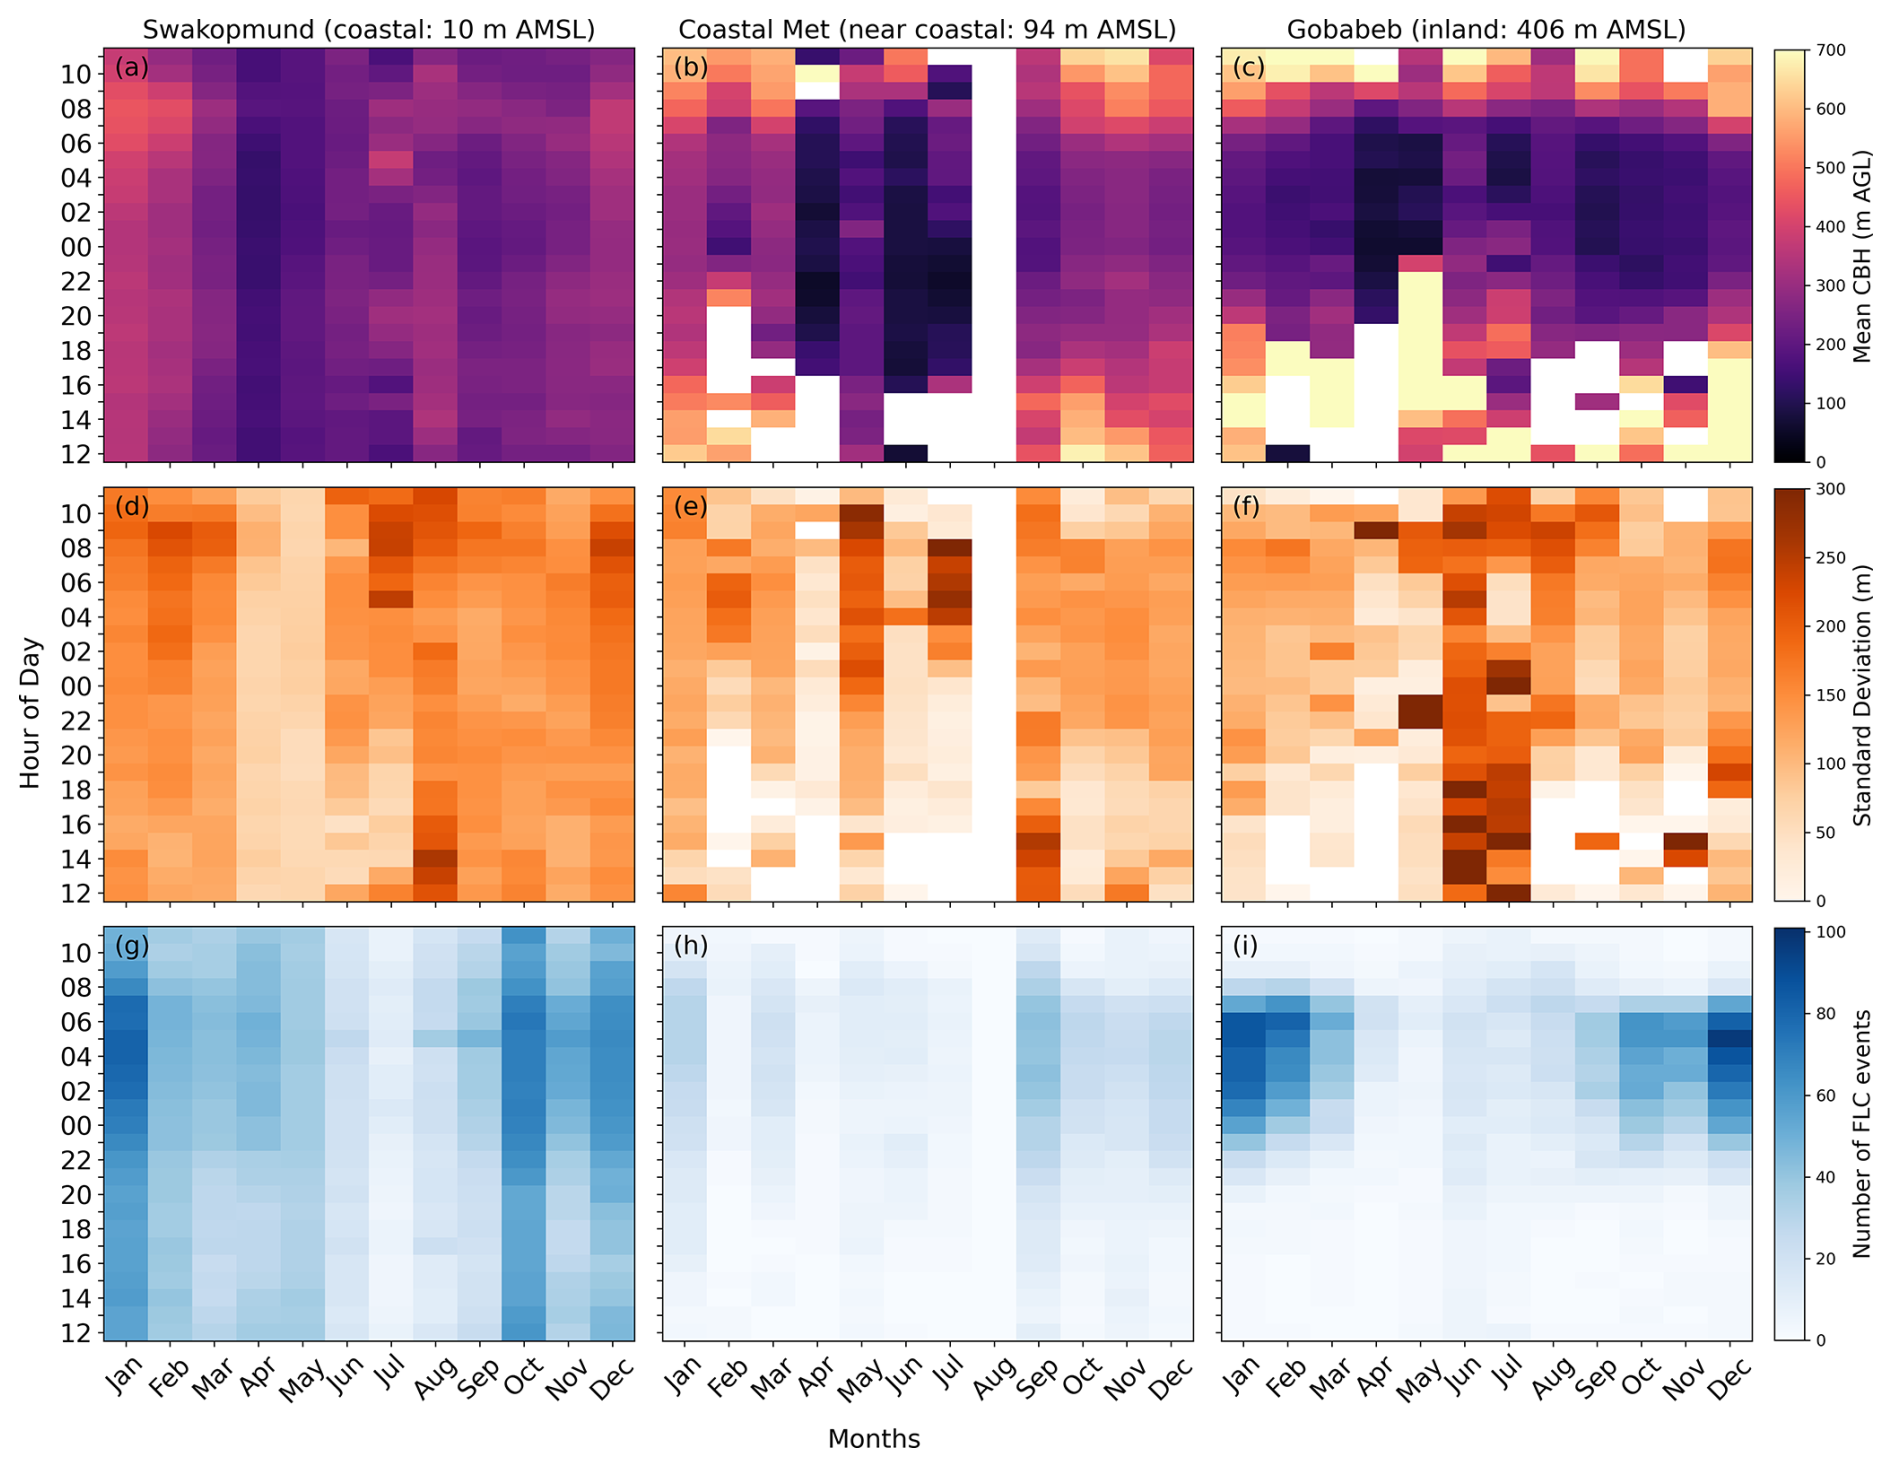
Figure 4Diurnal and seasonal variations in CBH statistics at Swakopmund (left column), Coastal Met (middle column), and Gobabeb (right column).The first row (a–c) shows the mean CBH above ground level, the second row (d–f) presents the standard deviation of mean CBH, and the third row (g–i) indicates the number of FLC events on which the statistics are based. The x-axis denotes the months of the year, while the y-axis corresponds to the time (hour of the day, UTC).
The first row of Fig. 4 illustrates the diurnal and seasonal patterns of mean CBH above ground level (AGL) for each location. At Swakopmund, the diurnal variation in CBH is not as clearly pronounced as the seasonality, likely due to frequent advection fog forming at the surface, which often attenuates the ceilometer signal. Additionally, the persistent marine boundary layer contributes to stable atmospheric conditions throughout the day and night. This contrasts sharply with Coastal Met and Gobabeb, where distinct diurnal fluctuations are evident. At these near-coast and inland locations, mean CBH is typically lower during the nighttime, aligning with the occurrence of nocturnal fog. Seasonal variations in mean CBH are evident at all three locations, though their prominence varies. These seasonal variations are more pronounced at inland sites, where CBH fluctuations are greater compared to the more stable conditions near the coast. At Swakopmund and Coastal Met, the lowest mean CBH values are observed during April, May, and June, coinciding with the “Low-FLC season”. During this period, mean CBH is relatively higher at Swakopmund than at Coastal Met, suggesting that the advected stratus layer resides at around 150 m AGL at Swakopmund (10 m AMSL) and below 100 m AGL at Coastal Met (94 m AMSL). However, Gobabeb follows a similar but extended seasonal pattern, with the lowest CBH values peaking from April to November. The predominant period occurs from September to November, coincides with the “High-FLC season”, when cloud events reaching inland are more frequent. The relatively lower mean CBH values at Gobabeb during April and May may also reflect sampling limitations, as only a few FLC events are detectable inland during this period. At both Coastal Met and Gobabeb, fog formation occurs as advected stratus clouds interact with the local topography, though this process is seasonally distinct, prevailing in the Low-FLC season near the coast and in the High-FLC season inland (Andersen et al., 2019). The seasonal differences in CBH patterns between coastal and inland stations emphasize the spatial extent of the cloud deck across the Namib Desert. However, in this analysis, a direct comparison of CBH above mean sea level across the stations, which could offer clearer insight into the vertical structure of the cloud field, is limited by differing observational periods and associated sampling inconsistencies. The second row (Fig. 4d, e, f) displays the standard deviation of CBH, providing insights into the variability of mean CBH across locations. Swakopmund exhibits fairly consistent low CBH variability throughout the year. While in Coastal Met and Gobabeb there is a higher variability during austral winter. However, these statistics are also based on a very limited amount of FLC events. The last row of Fig. 4g, h, i provides important context regarding the number of FLC events (days) contributing to the presented CBH statistics, which is driven by both the frequency of cloud events during each hour and month and the measurement times. Data availability (Fig. 2) at Coastal Met experiences significant data gaps due to its limited observational period, which is reflected in the number of FLC events recorded. However, at Swakopmund and Gobabeb, data availability remains relatively stable throughout the year, ensuring a consistent representation of FLC events. Additionally, Gobabeb exhibits a reduced number of FLC events during the austral winter (AMJ), when FLC typically do not reach far inland (Andersen et al., 2019). This also suggests a selection bias in the calculated statistics, as only higher-level FLCs are observed inland at Gobabeb. Overall, the spatial differences in CBH observed in Fig. 4 underscore the interplay of coastal influence, atmospheric stability, and topographical effects in shaping the diurnal and seasonal variability of CBH across the Namib Desert region.
3.2 Fog Life Cycle
In this section, CBH patterns are analyzed across the fog life cycle, encompassing the stages of initial occurrence, maturity, and dissipation. Figure 5 presents observational evidence of these stages during a fog event at Coastal Met (31 January 2018). The Fig. 5a presents a time-height cross-section of backscatter intensity (measured in sr−1 m−1) with overlying CBH markers (black), visualizing the vertical position of the cloud layer over time. At the onset of the event, a stratiform cloud layer is detected at approximately 300 m altitude (AGL) and begins descending after sunset, exhibiting intermittent lifting and lowering but then settling in at a CBH of less than 100 m AGL. High backscatter intensity was detected already at 40 m AGL (the detection limit of the CL31) indicating reduced visibility below the detected cloud base. During this phase, RH exceeded 95 %, and fog precipitation (blue dots) was recorded, as shown in Fig. 5c. These conditions persisted until a few hours after sunrise, when the dissipation phase began, characterized by a rapid rise in CBH.
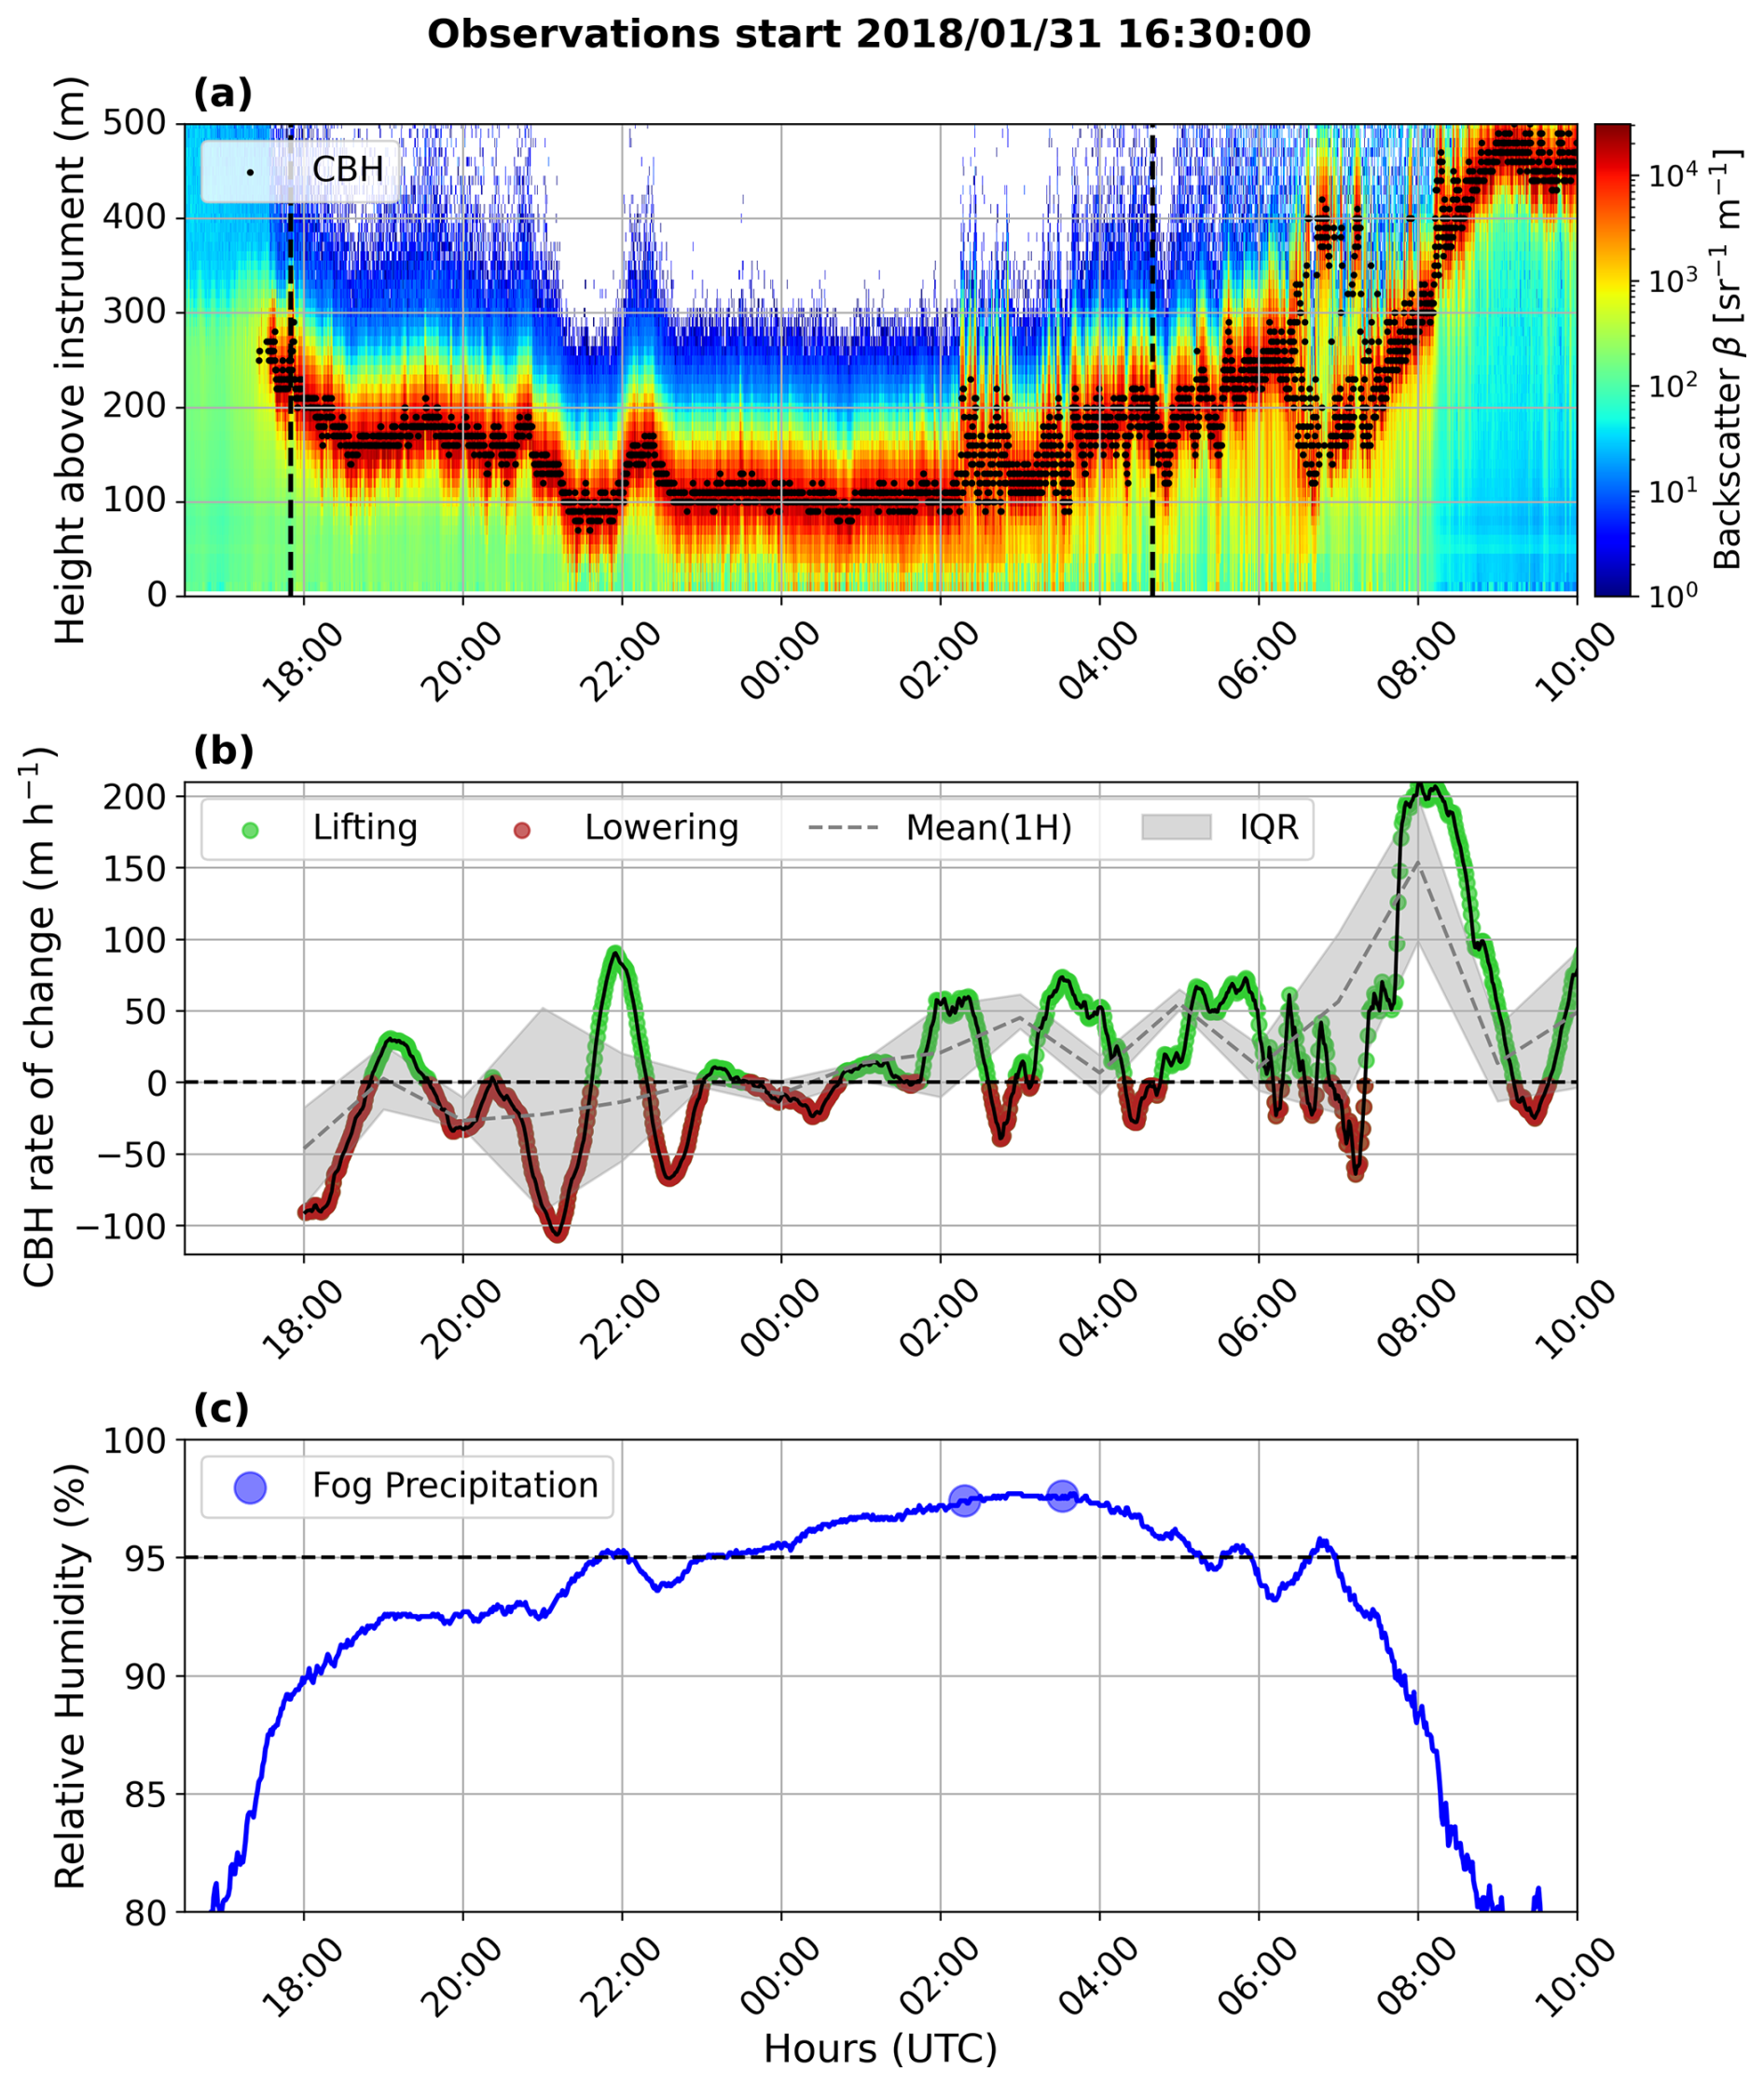
Figure 5Time series analysis of the fog life cycle at the Coastal Met station on 31 January 2018. (a) Backscatter intensity (sr−1 m−1) with CBH markers, illustrating fog evolution. Dashed lines indicate the times of sunrise and sunset. (b) CBH rates of change (m h−1) with lifting (green) and lowering (red), alongside the hourly mean (dashed) and interquartile range (shaded). (c) RH (%) with fog precipitation indicated by blue markers. The figure captures key phases of fog occurrence, development, and dissipation.
To investigate CBH vertical dynamics, the rate of CBH change was computed using a rolling 1 h regression slope method (detailed in Sect. 2.5), as shown in the middle panel of Fig. 5b. Positive values (green) indicate CBH lifting, while negative values (red) correspond to CBH lowering. The grey-shaded background represents the hourly mean with the interquartile range, providing a smoothed depiction of CBH variations by filtering short-term fluctuations. In the early hours after sunset, consistent negative values reflect a gradual descent of the advected cloud layer. This transition is followed by large positive values after sunrise, indicative of rapid lifting. This case illustrates that the vertical evolution of Namib fog during its life cycle can feature considerable fluctuations and that this variability can be captured well by the estimated CBH change rates.
3.2.1 Diurnal Evolution
To assess whether the CBH dynamics observed in the case study (Fig. 5) are representative of broader FLC patterns, the rate of change in CBH was computed for all observed FLC events. The diurnal variations in CBH rates across all three stations and different seasons are presented in Fig. 6. The sample size displayed for each hour and station provides insight into the frequency of FLC events as well as the robustness of the statistics presented. CBH statistics are reported only for hours where the sample size exceeds five, ensuring that the results are representative of the prevailing conditions. During both seasons, FLCs exhibit a similar diurnal pattern of constant CBH or moderate lowering (up to −50 m h−1 in some cases) during the evening and early night, transitioning to near-zero or slightly fluctuating values during the night that signify a gradual lowering of CBH followed by a constant cloud base altitude. However, after sunrise, a pronounced increase in the CBH rate of change (up to +150 m h−1) is observed, with the most rapid CBH lifting occurring between 08:00 and 10:00 UTC. The diurnal CBH variations are stronger during the austral summer when CBH is typically higher. This suggests that the lowering and lifting of advected stratus clouds may be common mechanisms for fog formation and dissipation, respectively, and points to the influence of stronger solar forcing during the austral summer to a faster lifting of FLCs in the morning. One should note that already in the hours before sunrise, FLCs experience a moderate lifting that is mostly below 10 m h−1. The CBH diurnal cycle is shown to be strongly dependent on coastal proximity, as in Swakopmund CBH is nearly constant throughout the day (only moderately lifting after sunrise during austral summer). In contrast, CBH lifting rates are between 50 and 100 m h−1 in Coastal Met, and even more pronounced in Gobabeb where lifting rates exceed 100 m h−1 during austral summer. These findings suggest that the distance from the coast significantly influences fog dissipation dynamics. The computed CBH change rates in this study are consistent with previously documented CBH lowering rates associated with fog formation ∼ 40–60 m h−1 (Dupont et al., 2016; Fathalli et al., 2022; Singh et al., 2024), and CBH lifting during fog dissipation (Wærsted et al., 2019; Toledo et al., 2021; Dione et al., 2023).

Figure 6Hourly variation in the CBH rate of change (m h−1) for three stations (GB, CM, SM) during (a) the Low-FLC season (April–July) and (b) the High-FLC season (August–March). Solid lines indicate the median, while shaded regions represent the interquartile range (IQR). Positive values correspond to CBH lifting, whereas negative values indicate lowering. Sample sizes for each station and hour are indicated by numbers; however, the CBH rate of change is only displayed for hours with a sample size greater than five.
3.2.2 Possible Processes
To date, no study has specifically observed stratus base lowering and lifting in the Namib or examined the processes governing them. However, research from other regions provides important insights. The diurnal evolution of stratus base in our study can be understood as the outcome of multiple interacting mechanisms. These include microphysical and radiative controls, turbulent and boundary-layer dynamics, and, as we propose here, additional modifiers linked to cloud geometry. While the first two categories are well established in the fog literature, the latter represents interpretations emerging from our observations in the Namib. The schematic in Fig. 7 summarizes dominant processes for different stages in the fog life cycle. In Fig. 7b, d, these established processes (P1) are shown alongside our proposed modifiers (P2), together illustrating the mechanisms of cloud base lowering and lifting throughout the fog life cycle. It is important to note that Fig. 7 represents a simplified conceptualization of stratus onshore advection from the west, though advection from the northwest or north in this region can also occur without altering the relevance of the processes and drivers illustrated.
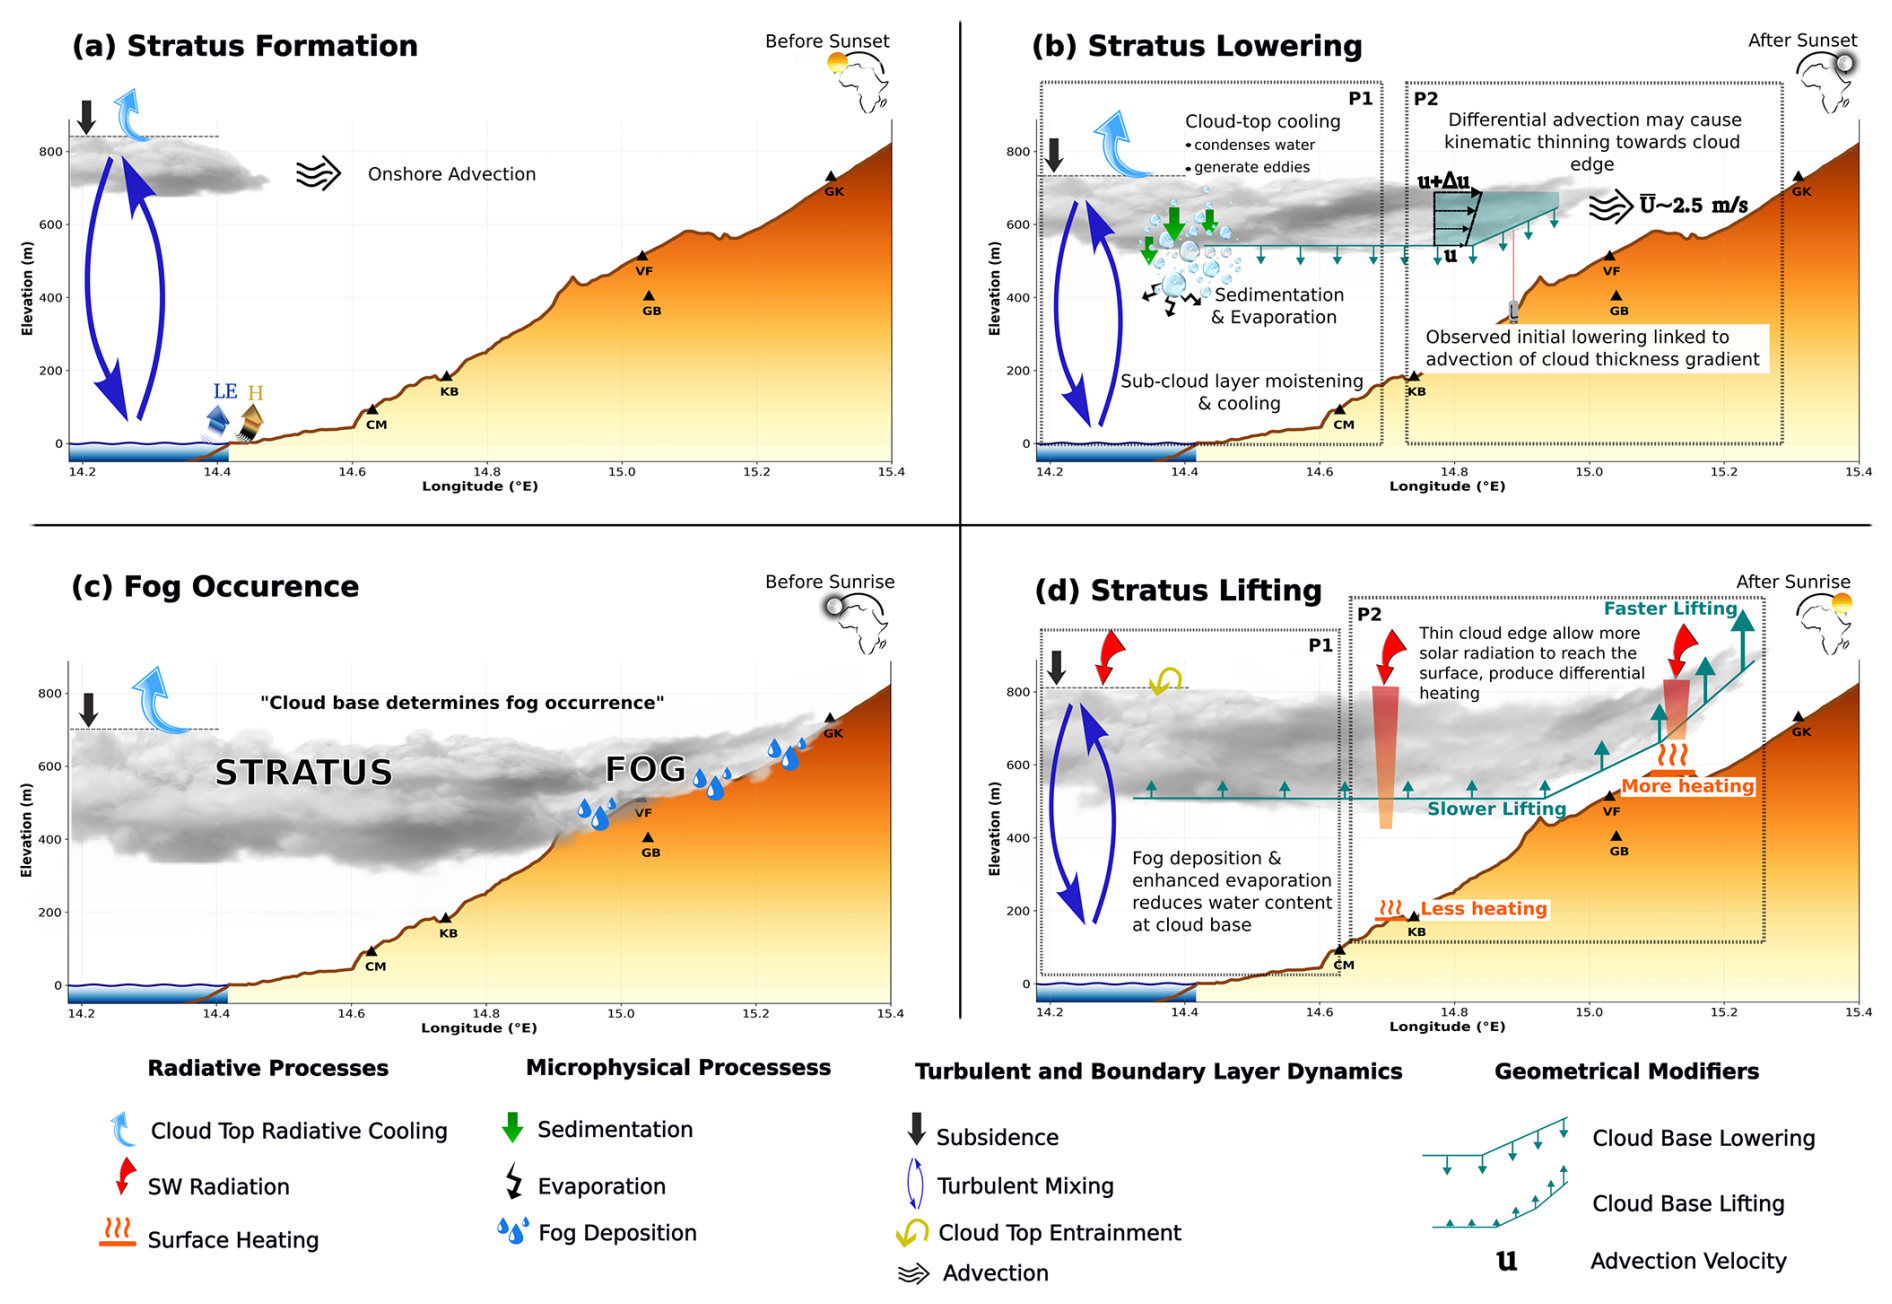
Figure 7Conceptual diagram of the nocturnal evolution of fog and stratus in the Namib and the associated dominant processes. (a) Stage before sunset, (b) stratus lowering after sunset, (c) fog occurrence during the night and early morning, and (d) fog dissipation after sunrise. Here, P1 are the known processes established in literature and P2 are the findings interpreted in this study.
Stratus lowering is primarily driven by the redistribution of moisture within the boundary layer, with subsequent evaporation of cloud droplets below the cloud base, which cools and moistens the sub-cloud layer. This process can occur either through turbulent mixing where droplets are transported downward by eddies generated by strong cloud-top cooling (Pilié et al., 1979; Dupont et al., 2012; Wagh et al., 2021; Fathalli et al., 2022; Singh et al., 2024), or through gravitational settling when droplets grow large enough to fall out of the cloud (Dupont et al., 2012; Pope and Igel, 2025). Stratus lifting, on the other hand, typically occurs after sunrise and is associated with surface heating and wind shear increasing turbulent kinetic energy, deepening the boundary layer and entraining drier air into the cloud. This enhances droplet evaporation and reduces liquid water content at cloud base, progressively decoupling the cloud layer from the surface (Dupont et al., 2012; Singh et al., 2024). This results in a rapid lifting of the cloud base and, ultimately, fog dissipation.
Beyond these established mechanisms, our analysis points to geometrical modifiers of the advected cloud deck. Unlike regions such as Central Europe, where stratus lowering frequently occurs under quasi-stationary cloud conditions (Dupont et al., 2012), the Namibian stratus is subject to pronounced advection (Andersen et al., 2019; Spirig et al., 2019), raising the possibility that the observed CBH lowering and lifting in the Namib is also influenced by the geometry of the advected stratus. One potential factor is the presence of horizontal gradients in cloud thickness, especially near cloud edges, arising from e.g. relative displacement or kinematic thinning caused by differential advection speeds of the cloud top versus the base (e.g. 2 m s−1 near the surface and 4 m s−1 at stratus top as documented by Spirig et al., 2019). Such gradients may give the impression of CBH lowering in ceilometer observations, as the passage of a sloping cloud base over the measuring instrument can mimic vertical motion even if only horizontal advection occurs. The delay observed in the onset and peak of the lowering phase at Coastal Met and Gobabeb in Fig. 6b may therefore reflect the timing of cloud edge passage over these stations, which broadly coincides with the typical start of the FLC life cycle at these locations (Andersen and Cermak, 2018; Andersen et al., 2019). Considering the distance between these locations would yield an estimated average advection speed of ≈ 2.5 m s−1. The stronger lifting rates observed at inland stations in Fig. 6 likely result from thinner cloud and interconnected processes: inland sites such as Gobabeb and Garnet Kopie are likely to be frequently embedded within the cloud layer and thus closer to the cloud top, where thinner stratus overhead allows more solar radiation to reach the surface, enhancing surface heating, boundary-layer deepening, and cloud lifting. Figure 8 supports this mechanism by comparing cumulative net radiation and CBH evolution at Gobabeb and Coastal Met (October–December 2017), consistently showing higher early-morning radiation and more rapid CBH increase at Gobabeb. When the inversion is weak, shear can further generate turbulence and entrainment that thin the cloud and accelerate lifting, while intrusions of near-surface easterly dry and warm winds during early morning hours (Spirig et al., 2019) may additionally enhance droplet evaporation and cloud-base rise. We therefore propose this as an interpretation of our findings: spatial cloud geometry and differential insolation modify the fog life cycle in the Namib. Additionally, it should also be noted that right at the coast (and over the ocean), the marine influence tends to dampen the development of the planetary boundary layer. Overall, the results presented and the accompanying discussion underscore the significance of these findings for understanding fog dynamics in this unique coastal environment. However, a detailed attribution of the processes driving the observed CBH changes remains beyond the scope of this study.
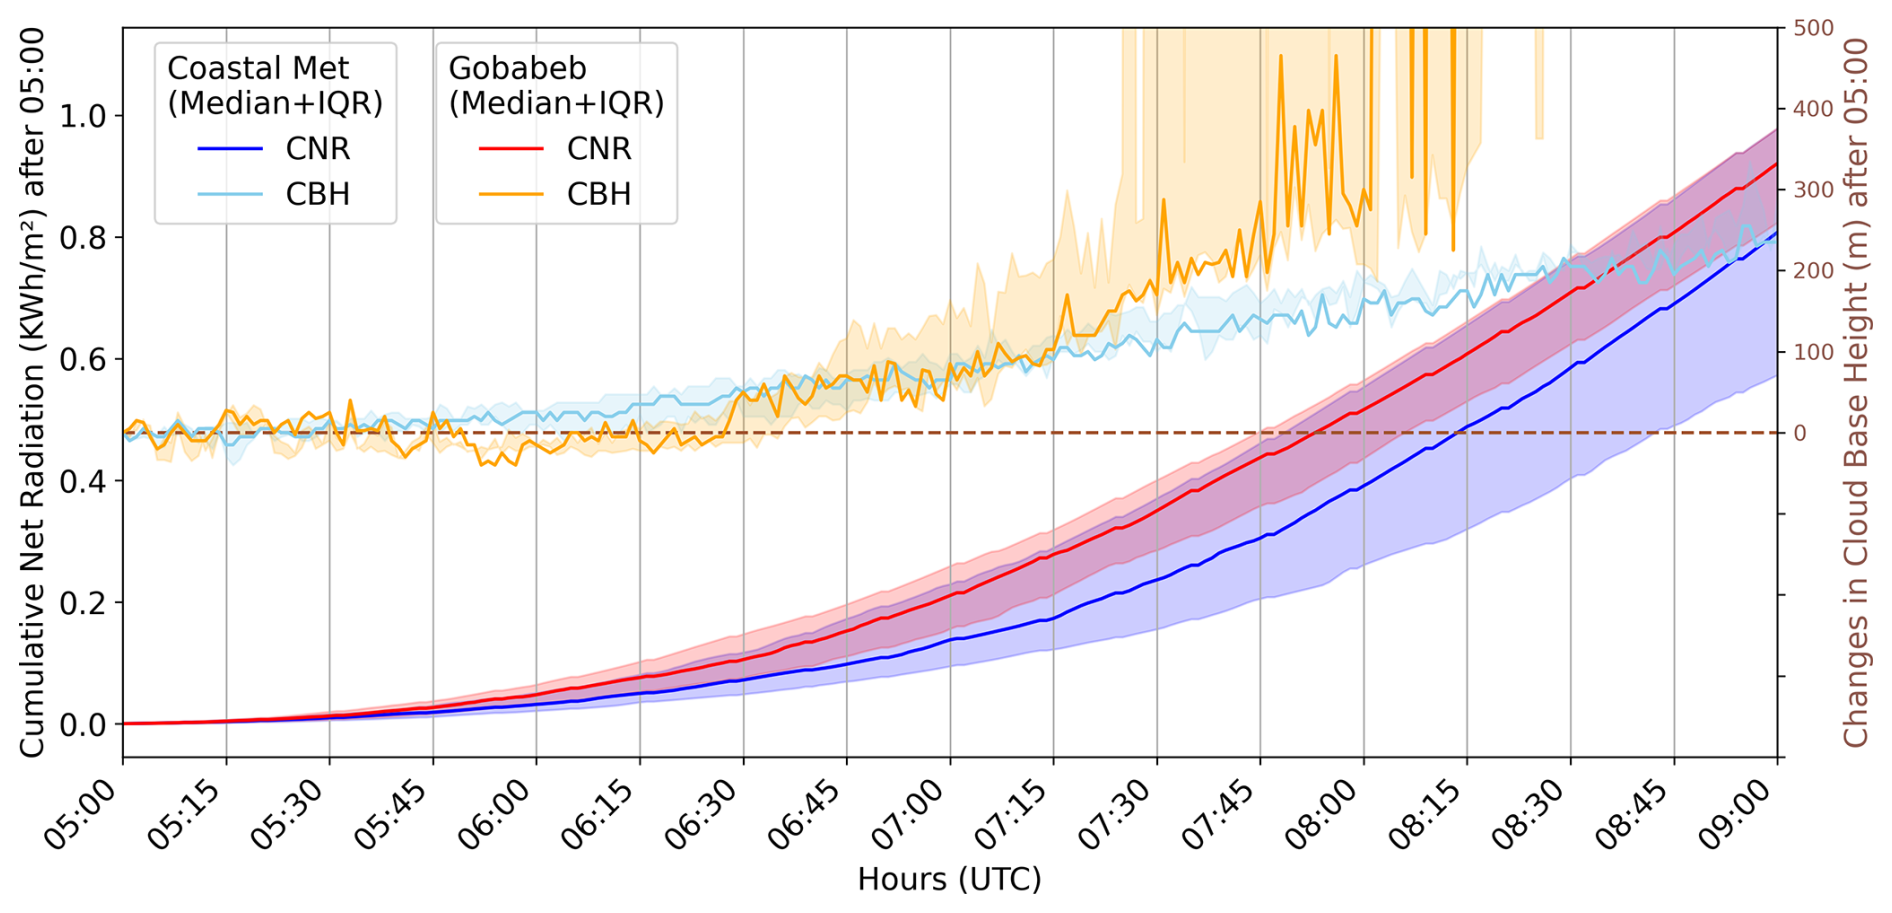
Figure 8Early morning evolution of cumulative net radiation (CNR) and cloud base height (CBH) from 05:00 to 09:00 during September to December 2017, for cases with cloud presence at both Gobabeb (GB) and Coastal Met (CM). CBH values are reduced to 0 m at 05:00 to highlight relative changes. Shading denotes the interquartile range (IQR) around the median.
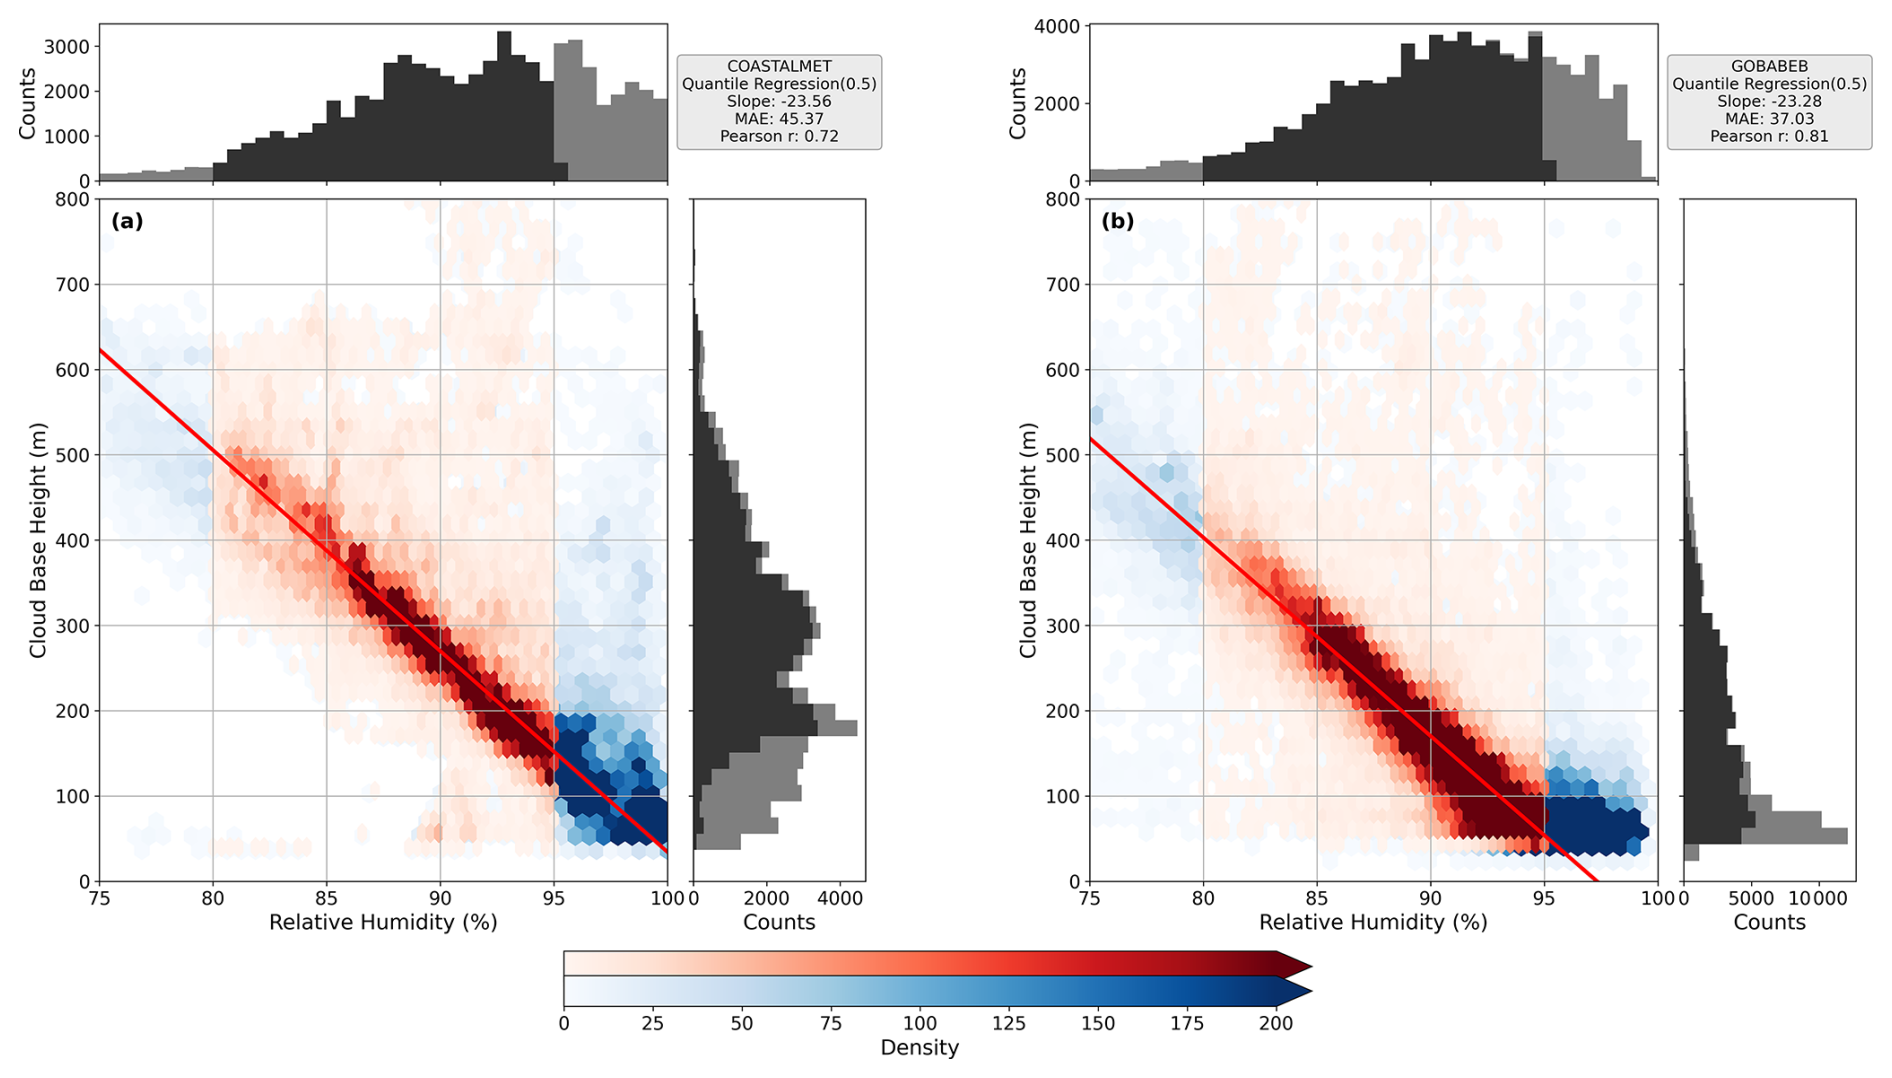
Figure 9Density scatter plots showing the relationship between CBH and RH during the night hours (22:00–07:00) for two stations: (a) Coastal Met and (b) Gobabeb. Red shades highlight the RH range between 80 % and 95 %, which is used for the 0.5 quantile regression fit, shown as a solid red line. Marginal histograms along the top and right axes show the distribution of RH and CBH, respectively, the black shade correspond to data within the 80 % RH–95 % RH range and their associated CBH values.
3.3 Estimated CBH
CBH is a critical parameter for the spatial occurrence of fog, and a necessary observable for its spatial mapping. However, due to the sparsity of the direct measurements of CBH (Fig. 2), climatological fog mapping is not possible using ceilometer data alone. This is the motivation to test with what accuracy CBH can be estimated from meteorological measurements (RH) that are available for a longer time period and at more locations. Figure 9 presents density scatter plots illustrating the relationship between CBH and surface RH at two representative stations: Coastal Met (Fig. 9a) and Gobabeb (Fig. 9b) for nighttime (22:00–07:00 UTC). Both sites exhibit a clear inverse relationship, where higher RH corresponds to lower CBH. This behavior is physically expected, as elevated RH reduces the lifting condensation level, facilitating fog or low cloud formation within a well-mixed boundary layer (Bolton, 1980; Wood and Bretherton, 2004; Lawrence, 2005). Quantile regression of the median (0.5 quantile) is then applied within a restricted RH range (80 %–95 %, marked in red color), where RH is less affected by instrumental biases at higher humidity, and where the distribution of CBH residuals is possible above and below the fitted line. The regression is also performed separately for nighttime (22:00–07:00 UTC) and morning (07:00–11:00 UTC) to examine how the CBH–RH relationship varies under different boundary-layer conditions. In particular, a weakening of this relationship is expected during morning hours due to a transient separation between the surface-heated convective layer and the cloud–subcloud turbulent layer aloft, as described in fog–stratus transition and coastal stratocumulus regimes (Nicholls, 1984; Turton and Nicholls, 1987; Koračin et al., 2001; Yang et al., 2021). At Coastal Met (Fig. 9a), the quantile regression yields a strong negative correlation (Pearson r=0.72) and a slope of −23.5 m %−1, meaning that for every 1 % increase in near-surface RH, the predicted median CBH decreases by approximately 23 m. This slope is nearly identical to the theoretical lifting condensation level estimate of ≈ 23 m per 1 % RH at 25 °C (Bolton, 1980; Lawrence, 2005). The corresponding mean absolute error and mean absolute percentage error are 45 m and 19 %, respectively, both calculated by comparing the estimated CBH with ceilometer observations at the Coastal Met station. This close agreement confirms that advected stratus clouds in the Namib follow the well-mixed boundary layer assumption (i.e., a coupled layer) and demonstrates that RH can provide a reliable proxy for CBH estimation during night hours. In contrast, the weaker CBH–RH relationship during daytime (Fig. A2 in the Appendix) and the positive bias between observed CBH and CBHe (Fig. A3) indicate that the well-mixed assumption breaks down after sunrise. The divergence likely reflects transient decoupling between the surface-heated layer and the cloud-driven turbulent layer aloft, influenced by both surface heating and entrainment drying at the cloud top. In the absence of vertical thermodynamic profiles, the relative contributions of these processes cannot be quantified; therefore, we interpret this daytime divergence as a signature of transient morning decoupling between the surface and cloud layers, in agreement with established findings in the literature (Nicholls, 1984; Turton and Nicholls, 1987; Koracin et al., 2001; Yang et al., 2021). Examining the Coastal Met CBH histogram, a bimodal distribution is apparent, with peaks around 310 and 170 m, which may reflect CBH seasonality, corresponding to the High-FLC and Low-FLC seasons, respectively. Notably, the CL31 ceilometer has a detection limit of CBH at 40 m and detects the cloud base within the cloud rather than the exact cloud base (Wagner et al., 2024). This aligns with the quantile regression estimate of 44.3 m at 100 % RH and suggests a systematic ceilometer bias, with CBH likely being overestimated by about 44 m. At Gobabeb, the relationship between CBH and RH closely resembles that observed at Coastal Met, as evidenced by the Pearson correlation coefficient of 0.81, a mean absolute error of 37 m, and a quantile regression slope of −23.3 m %−1. This shows that the RH-CBH relationship during the night hours is qualitatively and quantitatively consistent at a regional scale. However, two aspects are different between these two locations: (1) the point cloud and regression fit are notably shifted (i.e. in Gobabeb the same CBH occurs at lower RH than in CM), and (2) the RH-CBH relationship is not linear at humidities exceeding ∼ 95 %. As shown in the RH histogram, in Gobabeb humidity rarely reaches values close to 100 %, even in situations where the stratus is directly at the surface. The quantile regression predicts a CBH of 0 m at RH of 97.5 %. It is therefore likely that these discrepancies can be largely attributed to measurement uncertainties at high humidities and a possible dry bias of the RH measurements. The CS215 sensor that measures RH in Gobabeb is observed to feature a drift over time towards measuring decreasing RH values during fog events (see Fig. A1). Despite these measurement uncertainties, the consistency in the CBH-RH relationship at Gobabeb (particularly within the 80 % RH–95 % RH range) indicates that the underlying CBH-RH physical relationship remains consistent with that at Coastal Met.
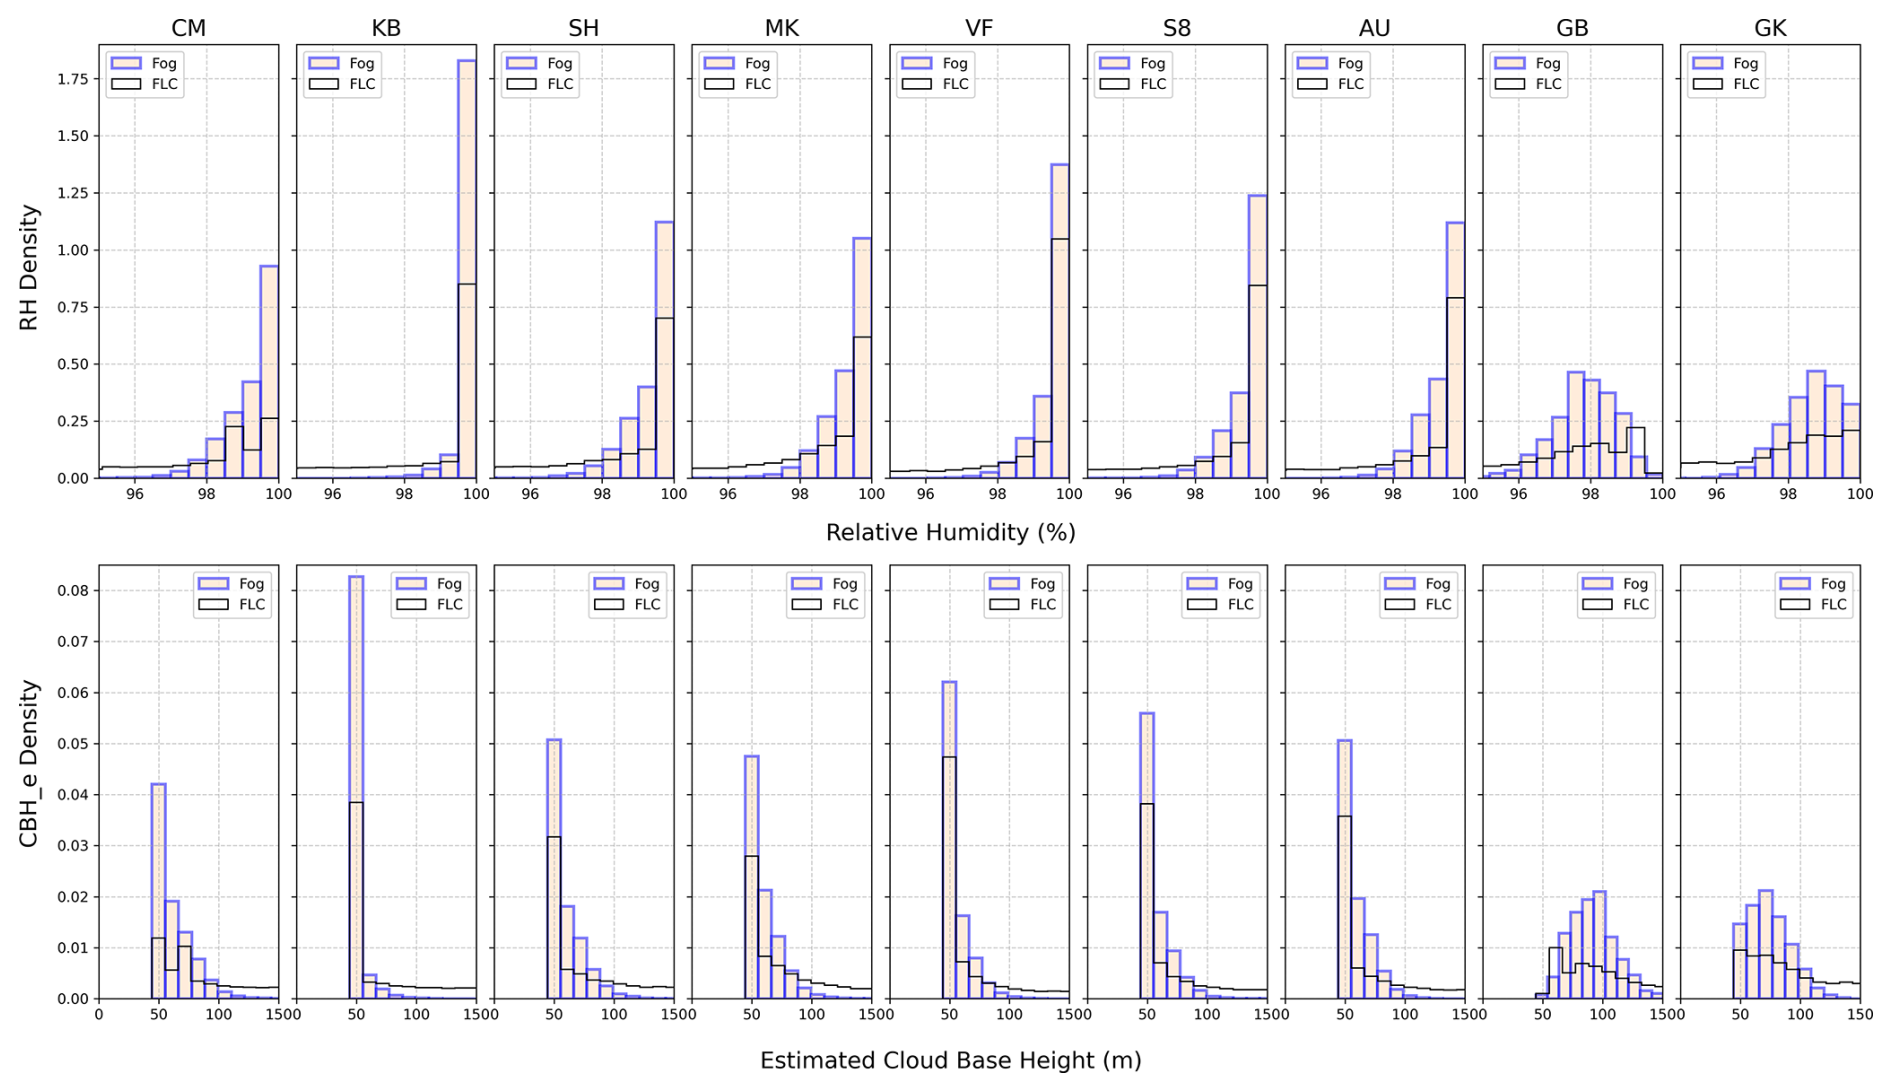
Figure 10Density histograms of RH (upper panel) and (CBHe) (bottom panel) during fog event and satellite derived fog and low cloud (FLC) occurrences across different FogNet stations from 1 July 2014 to 31 December 2023.
3.3.1 Regional Applicability
The quantile regression trained on Coastal Met data was applied to estimate cloud base height (CBHe) using the entire RH time series (nearly 10 years) from all FogNet stations. Figure 10 shows the decadal density distributions of RH and CBHe during satellite observed FLC events and during fog events observed through FogNet measurements. Across all stations except Gobabeb (GB) and Garnet Koppie (GK), nearly all fog events exhibit an RH > 98 %, and peaking near 100 %, and corresponding to low CBHe values of around 50–70 m AGL (after accounting for the 44.3 m bias), which is expected during fog. At Garnet Koppie and even more pronounced at Gobabeb, however, RH during fog is lower, peaking at 97.5 % in Gobabeb. CBHe therefore also peaks at 70 or 100 m, respectively. This systematic shift can be attributed to a dry bias likely caused by sensor drift or degradation at these sites (see Fig. A1). The CBHe distribution during satellite-derived FLC occurrences follows a similar pattern but includes lower RH values and exhibits a broader spread toward higher CBHe values, as it also includes situations where the stratus is lifted from the ground. In other words, this means that fog, as measured at the ground, is associated with very high RH and thus very low CBHe, whereas satellite-observed FLC includes both fog and low stratus clouds that may be elevated above the surface, resulting in broader distributions of RH and CBHe.
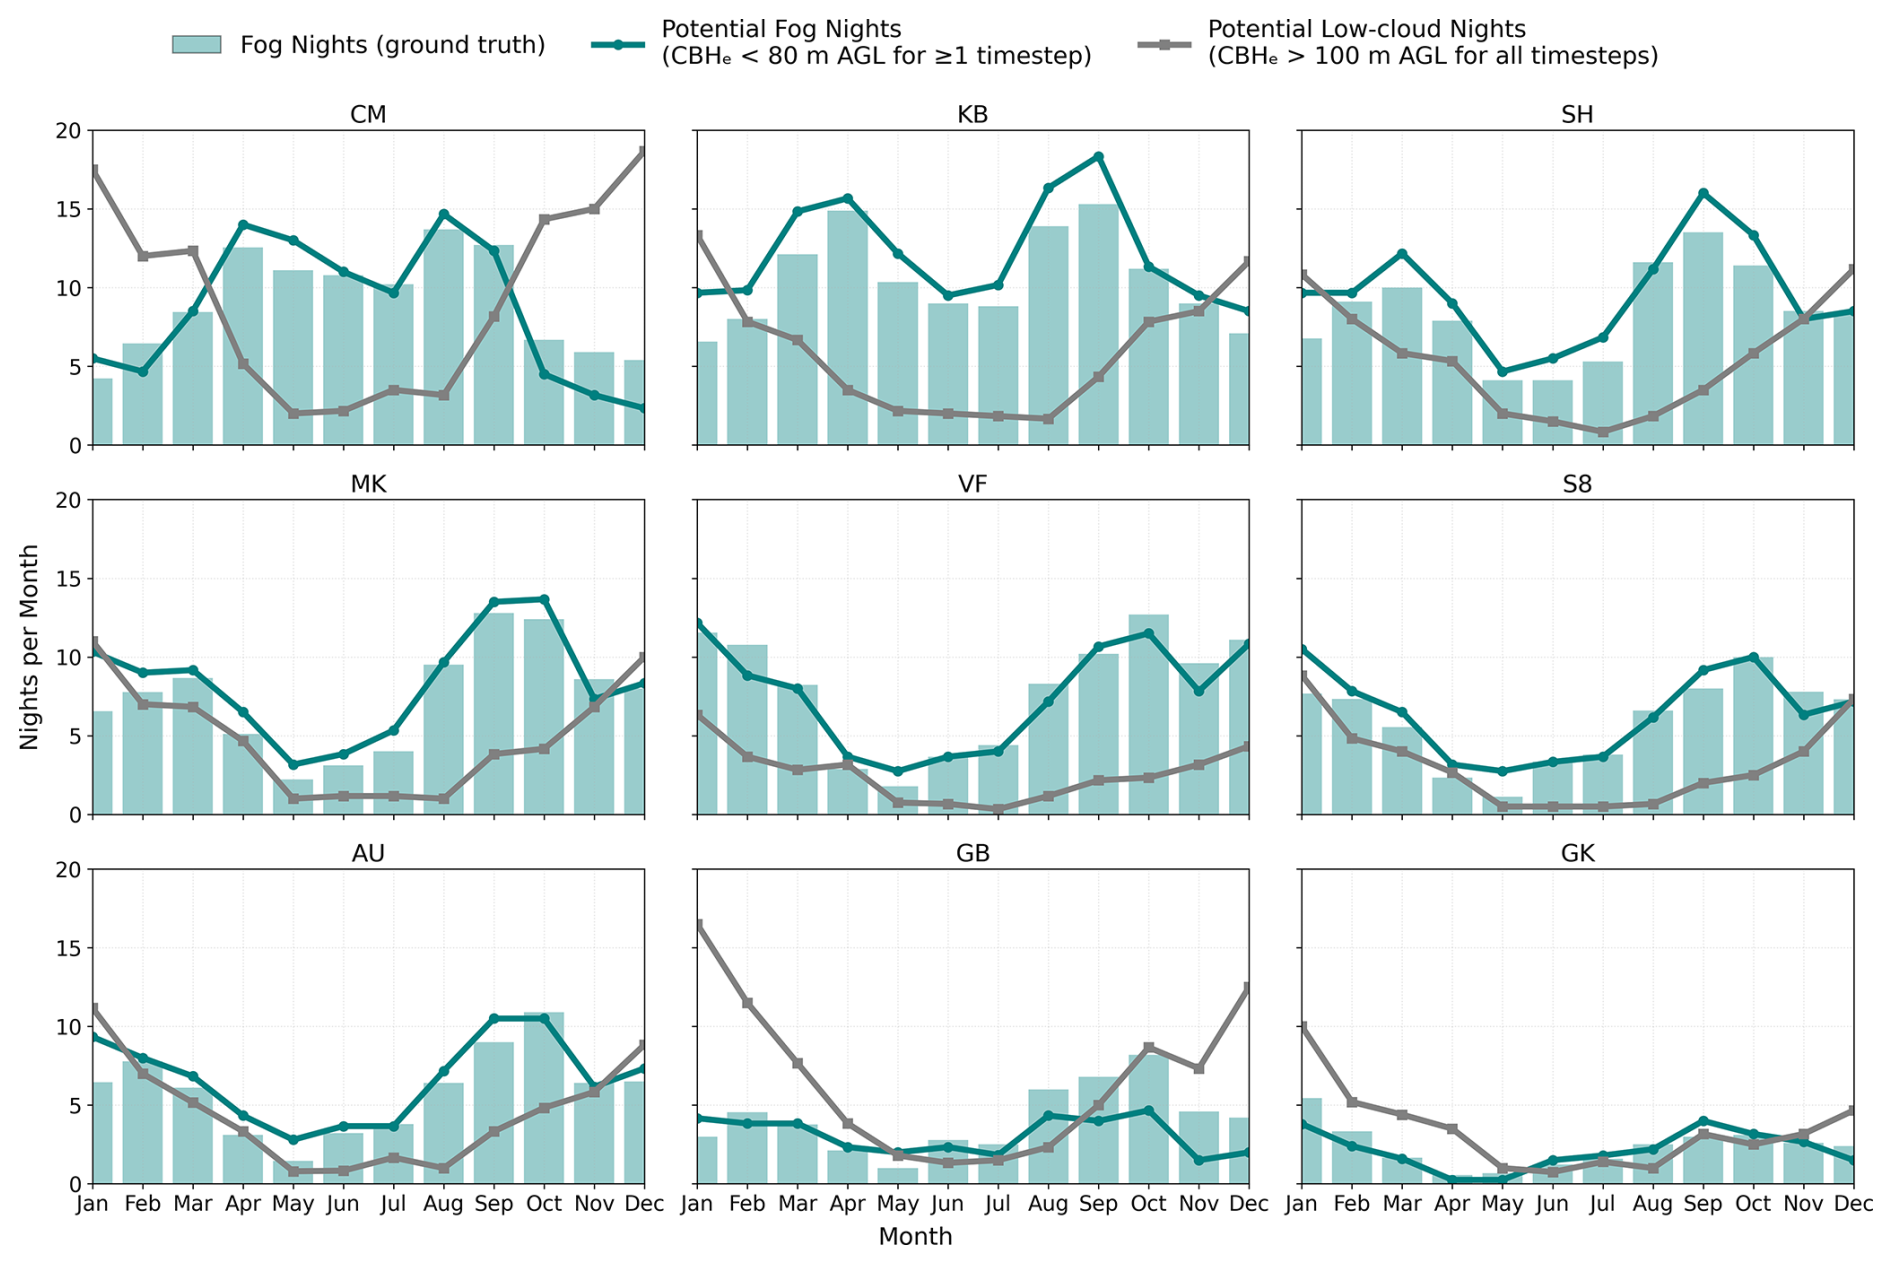
Figure 11Monthly mean number of observed fog nights and potential fog nights at FogNet stations from July 2014 to December 2023. Observed fog nights (ground truth) are shown as green bars. The green line represents potential fog nights derived from FLC retrievals where CBHe < 80 m AGL for at least one timestep during a night, and the grey line represents potential low-cloud nights where CBHe > 100 m AGL for all timesteps of a night.
Furthermore, to assess the regional applicability of the CBH–RH relationship for distinguishing fog from low clouds using CBHe in the satellite-derived FLC product, a monthly climatology of observed fog nights and potential fog nights was constructed for all FogNet stations over the period from July 2014 to December 2023 (Fig. 11). In Fig. 11, the comparison between ground-observed fog nights (green bars) and potential fog nights derived from CBHe (green line) shows strong agreement in both seasonal and spatial patterns over the decade, underscoring the applicability of the CBHe-based approach, despite minor deviations. In contrast, the potential low-cloud night pattern (grey line) displays a distinct seasonal phase shift and higher values during months of reduced fog occurrence, indicating periods when stratus clouds remain elevated above the surface rather than forming ground-level fog. In this framework, a night was classified as potential fog in the FLC retrieval when CBHe dropped below 80 m AGL for at least one timestep, corresponding to conditions where the cloud base effectively reaches the surface. Conversely, potential low-cloud nights were identified when CBHe remained above 100 m AGL throughout the night, ensuring that only elevated stratus events were included. These thresholds are consistent with the RH–CBHe distributions shown in Fig. 10, where observed fog typically coincides with RH > 97 % and CBHe between 50–100 m AGL Overall, this analysis highlights that the quantile regression-based relationship between CBH and RH can be effectively used to estimate CBHe and thereby separate fog from low stratus clouds across the FogNet network. This finding reinforces the central premise of this study that cloud base height determines fog occurrence patterns in the Namib Desert. The applicability of this approach is further demonstrated and validated through a case study in the following section.
3.3.2 A Case Study
Figure 12 provides an overview of the temporal evolution of CBHe at a subset of FogNet stations during a representative fog event during the night of 27–28 September 2017, also studied in Spirig et al. (2019). In the figure, CBHe is shown as above-ground level (AGL) (panel a) and above mean sea level (AMSL) (panel b). In the figure, CBHe is shown as a dashed line whenever the satellite suggests clear sky, and a solid line when the satellite has detected FLCs. Grey shade indicates whenever in-situ station measurements suggest fog occurrence. During the event, CBHe values at Coastal Met show a lifted stratus between 200 and 300 m AGL (94 m at CM, top panel), closely aligning with ceilometer observations (dashdot magenta line). Notably, at Coastal Met, the ceilometer shows minimal lifting of the observed CBH relative to the CBHe after 07:00 UTC during the event, reflecting a decoupling between the surface and cloud base layer. At inland stations (e.g. VF, AU, GB and GK), the stratus is advected close to the surface, with CBHe values indicating a slight lowering at the start of the event. When stations suggest that the stratus touches the ground, CBHe is constant at around 40 m for all stations but Gobabeb and Garnet Koppie, where RH (and therefore CBHe) converges slowly to its minimum. The panel (b) showing CBHe AMSL provides further insight into the altitudinal distribution of CBHe across stations relative to mean sea level. At near-coastal locations where the stratus remains lifted from the ground (CM), CBHe is consistently around 400 m AMSL, corresponding to the typical stratus deck height observed in the region during this time of year (Andersen et al., 2019). In contrast, at stations further inland where the stratus reaches the surface, CBHe varies between 450 and 850 m AMSL during fog. The stratus is therefore at least 400 m thick (annotated as Minimum Cloud Thickness in Fig. 12b, suggesting that the CBHe at Garnet Koppie is likely within the stratus, potentially near its upper boundary. It should be noted that prior to the fog event in Garnet Koppie and shortly after it, the CBHe of > 1000 m indicates dry conditions (RH of around 50 %), underscoring that the advected stratus is a completely different air mass that replaces the dry continental air masses that are present before the fog event and leads to an RH jump of 40 %–50 % in the matter of minutes. At the end of the fog event, the development of CBHe suggests a lifting of the FLC layer that is more rapid at inland locations than close to the coast, agreeing with the ceilometer observations and lifting rates presented in Sect. 3.2. The results show that CBHe can accurately capture the spatial patterns of vertical FLC evolution, and can be used in the future to separate fog from lifted stratus in satellite-based FLC products.
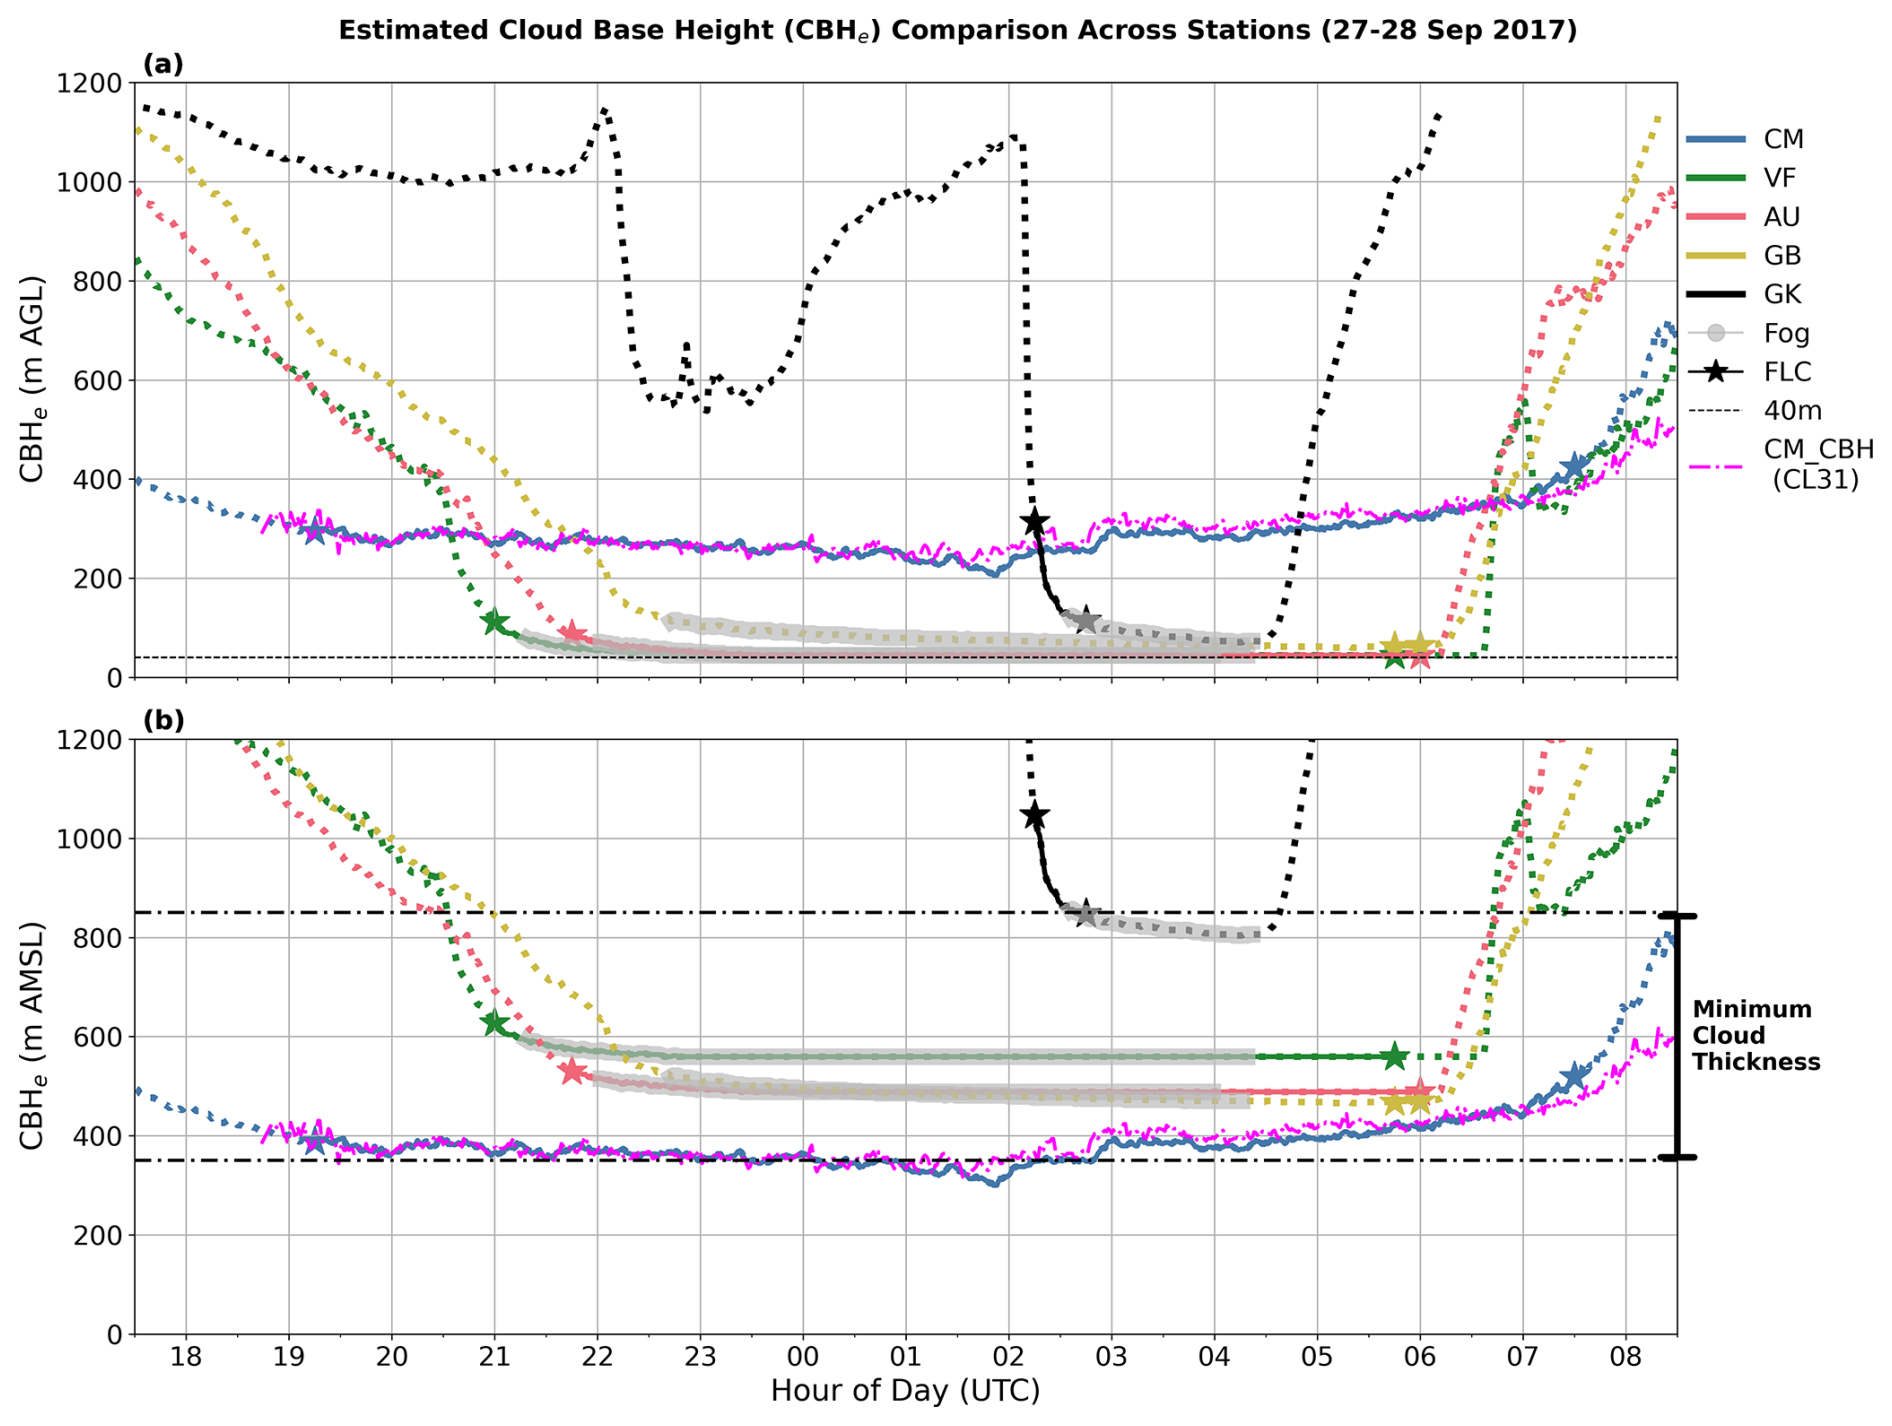
Figure 12CBHe at five selected FogNet stations during a representative fog event on 27–28 September 2017 (stations selected for regional representativeness and figure clarity). Each curve (color-coded) corresponds to one station, with dashed and solid line styles indicating satellite-derived clear-sky and FLC conditions, respectively. Star markers denote the start and end times of satellite-detected FLC, while grey markers indicate ground-observed fog occurrences. The vertical bar in (b) illustrates the potential cloud thickness during the event.
This study addresses key knowledge gaps in understanding the vertical structure of advected stratus in the Central Namib. Using ceilometer observations, it provides a comprehensive analysis of the patterns and variability of the fog/stratus base altitude at coastal and inland locations in the Central Namib Desert, and a verified approach to estimate CBH from near-surface relative humidity measurements. The findings support the study's objectives by offering new insights into fog life cycle processes and enabling region-wide CBH estimation across the FogNet network. The main findings are:
-
The study confirms a distinct seasonal cycle of CBH, with lower cloud bases during peak fog seasons at both coastal and inland sites, consistent with earlier work by (Andersen et al., 2019). Superimposed on this seasonal pattern is a pronounced diurnal cycle of CBH, particularly at inland locations. While the CBH at the coastal site of Swakopmund exhibits only a weak diurnal cycle, sites further inland such as Coastal Met (17 km from the coast) and Gobabeb (56 km inland) show a pattern of nighttime CBH lowering and lifting after sunrise. These diurnal patterns of CBH have implications for the spatial distribution of fog during its life cycle.
-
A quantitative measure of CBH lowering/lifting rates is developed on the basis of a rolling window regression of the CBH time series. The nighttime CBH lowering is shown to be moderate at rates of 10–50 m h−1, while the lifting is more rapid at 30–150 m h−1, with stronger lifting observed inland at Gobabeb. A delay of CBH lowering is observed at inland sites and is indicative of the inland progression of a stratus layer that features a gradient in thickness near the cloud edge. The more rapid lifting at inland sites may be caused by a thinner inland stratus enabling faster dissipation via enhanced surface heating. A quantitative measure of CBH lowering/lifting rates has been missing in the literature where stratus lowering and lifting is only described anecdotally (Dupont et al., 2016; Wærsted et al., 2019; Toledo et al., 2021; Fathalli et al., 2022; Dione et al., 2023; Singh et al., 2024).
-
An expected strong negative linear relationship is observed at both Coastal Met and Gobabeb, with the Pearson's correlation coefficients of −0.72 and −0.81, respectively. This relationship validates that the stratus clouds form within a well-mixed marine boundary layer and are advected inland, where they can manifest as fog upon interaction with local topography. A quantile regression model trained on RH successfully estimates CBH with a mean absolute error of ∼45 m. Measurement uncertainties, including RH sensor drift and ceilometer detection thresholds, are likely the main cause of CBH estimation uncertainties. The model also assumes linearity in the RH–CBH relationship, which may not hold in all situations.
-
The quantile regression model enables estimation of cloud base height across the FogNet network, extending CBH information beyond the ceilometer sites and allowing the separation of fog from low clouds in satellite-derived FLC retrievals. In a representative case study, the CBHe can accurately capture the spatial patterns of vertical FLC evolution providing an estimate of the regional cloud field. The increase in CBHe with distance inland reflects the thinning of the stratus layer toward its edge.
Future research can leverage this new decade-long CBHe dataset from the FogNet network, together with existing satellite products, to enable CBH-based separation of fog from lifted stratus clouds in satellite-derived FLC products (e.g., Andersen and Cermak, 2018). This will facilitate the development of the first spatially coherent fog maps for the Central Namib and lay the groundwork for long-term fog climatologies. The new measure of CBH lowering/lifting rates enables analyses of the processes driving vertical development of stratus bases. Taken together, our findings have important implications for enhancing our understanding of fog life cycle mechanisms, and for quantifying fog-related deposition of water, nutrients, and pollutants, as well as their impacts on the regional desert ecosystem.
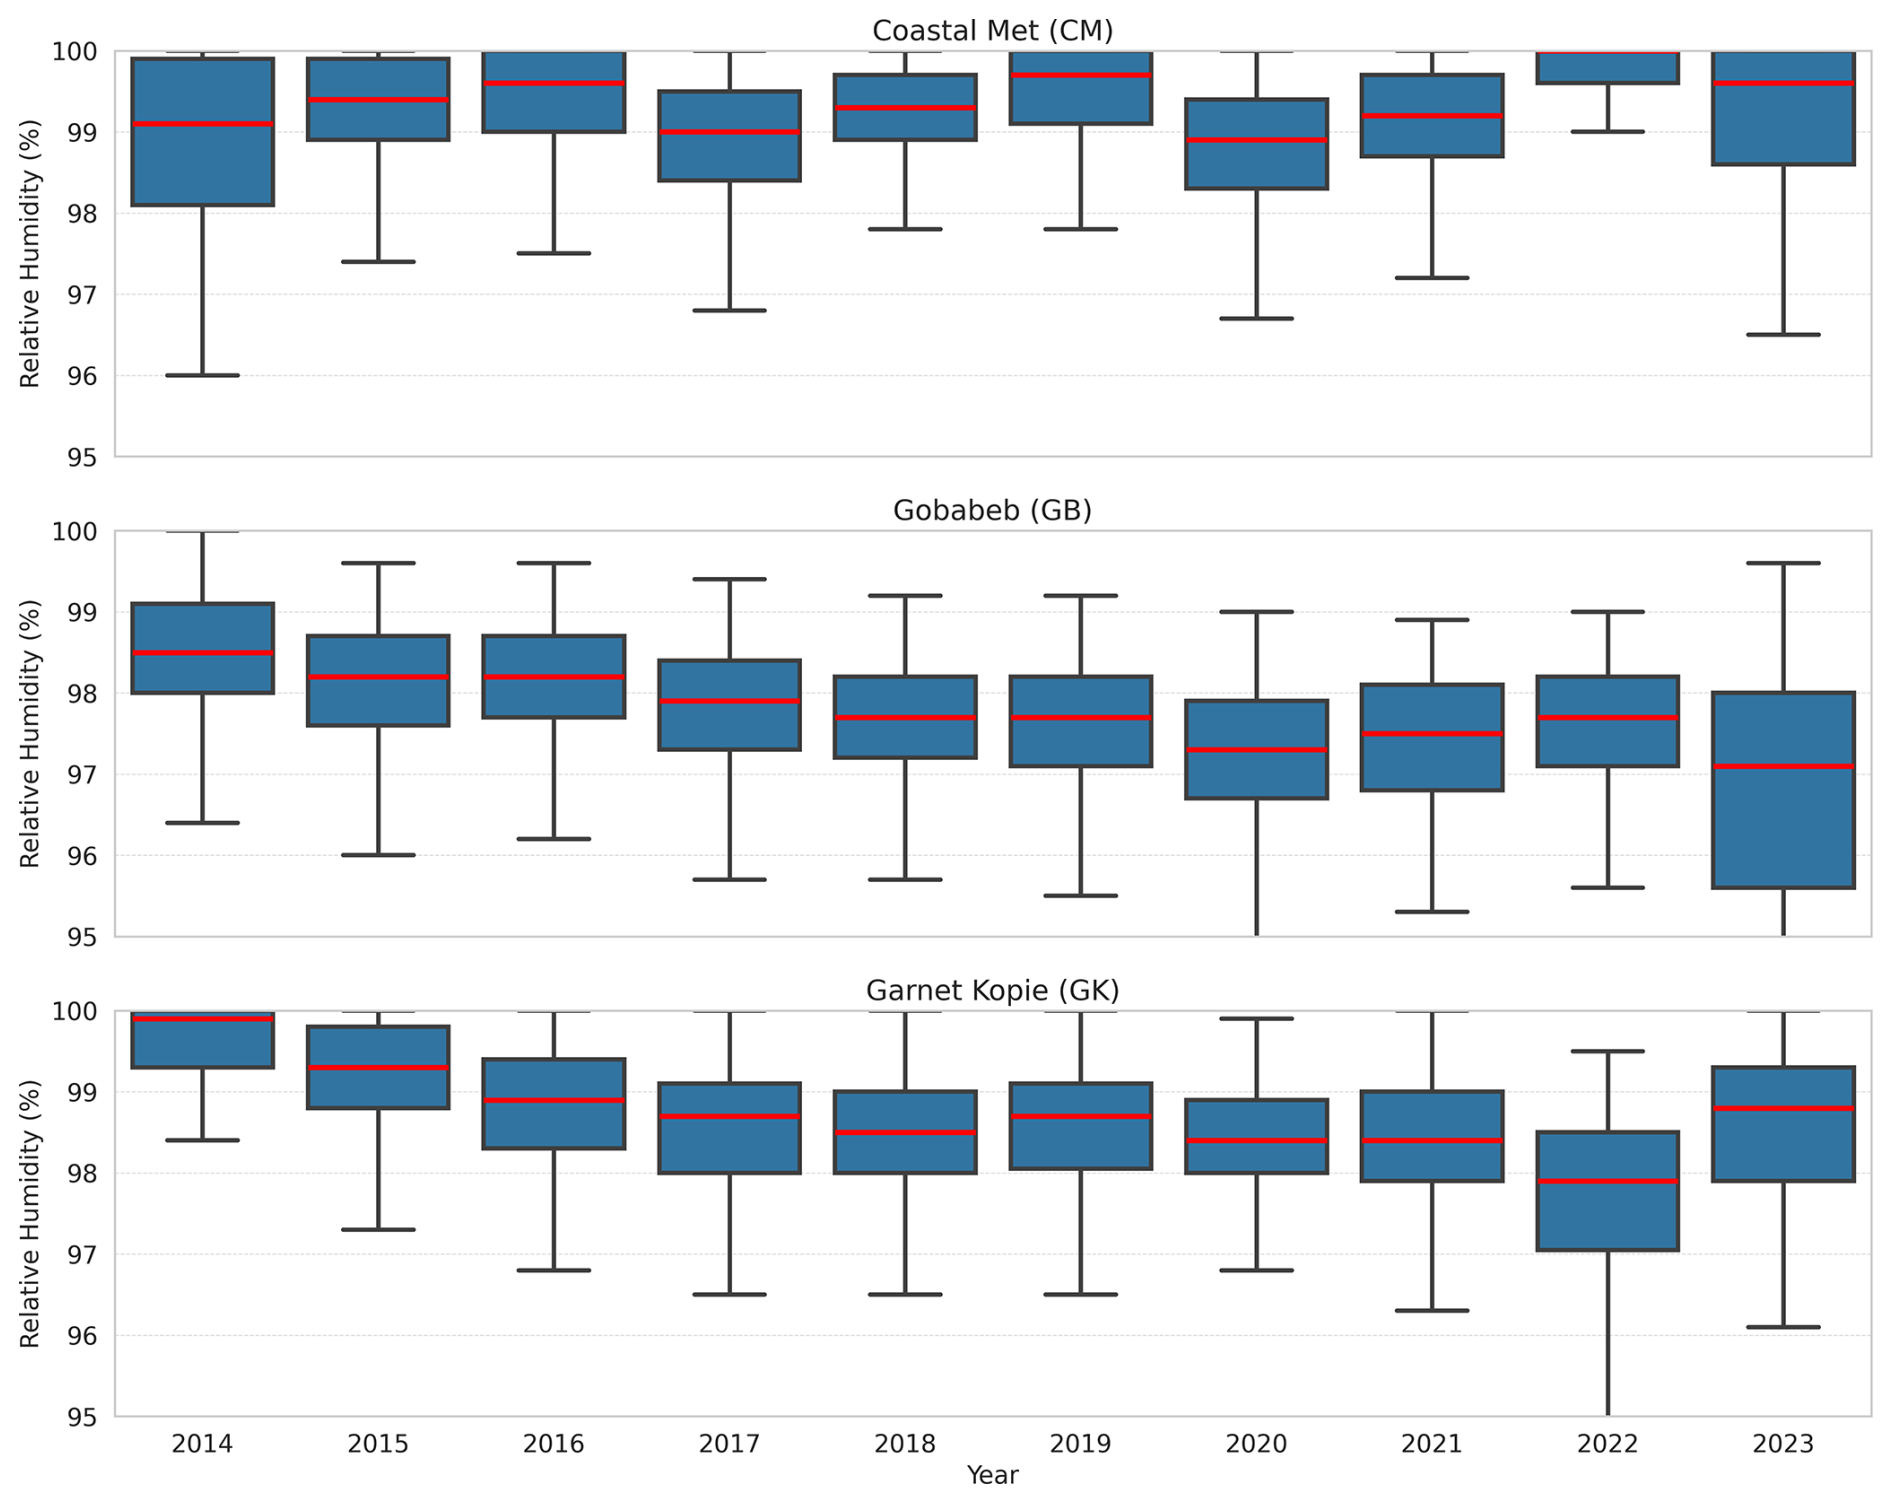
Figure A1Yearly distribution of Relative Humidity (RH) during fog events at Coastal Met (top), Gobabeb (middle) and Garnet Kopie (bottom) from 2014 to 2023. Boxplots represent the inter-quartile range (IQR), with whiskers extending to 1.5× IQR, and red lines indicating the median.
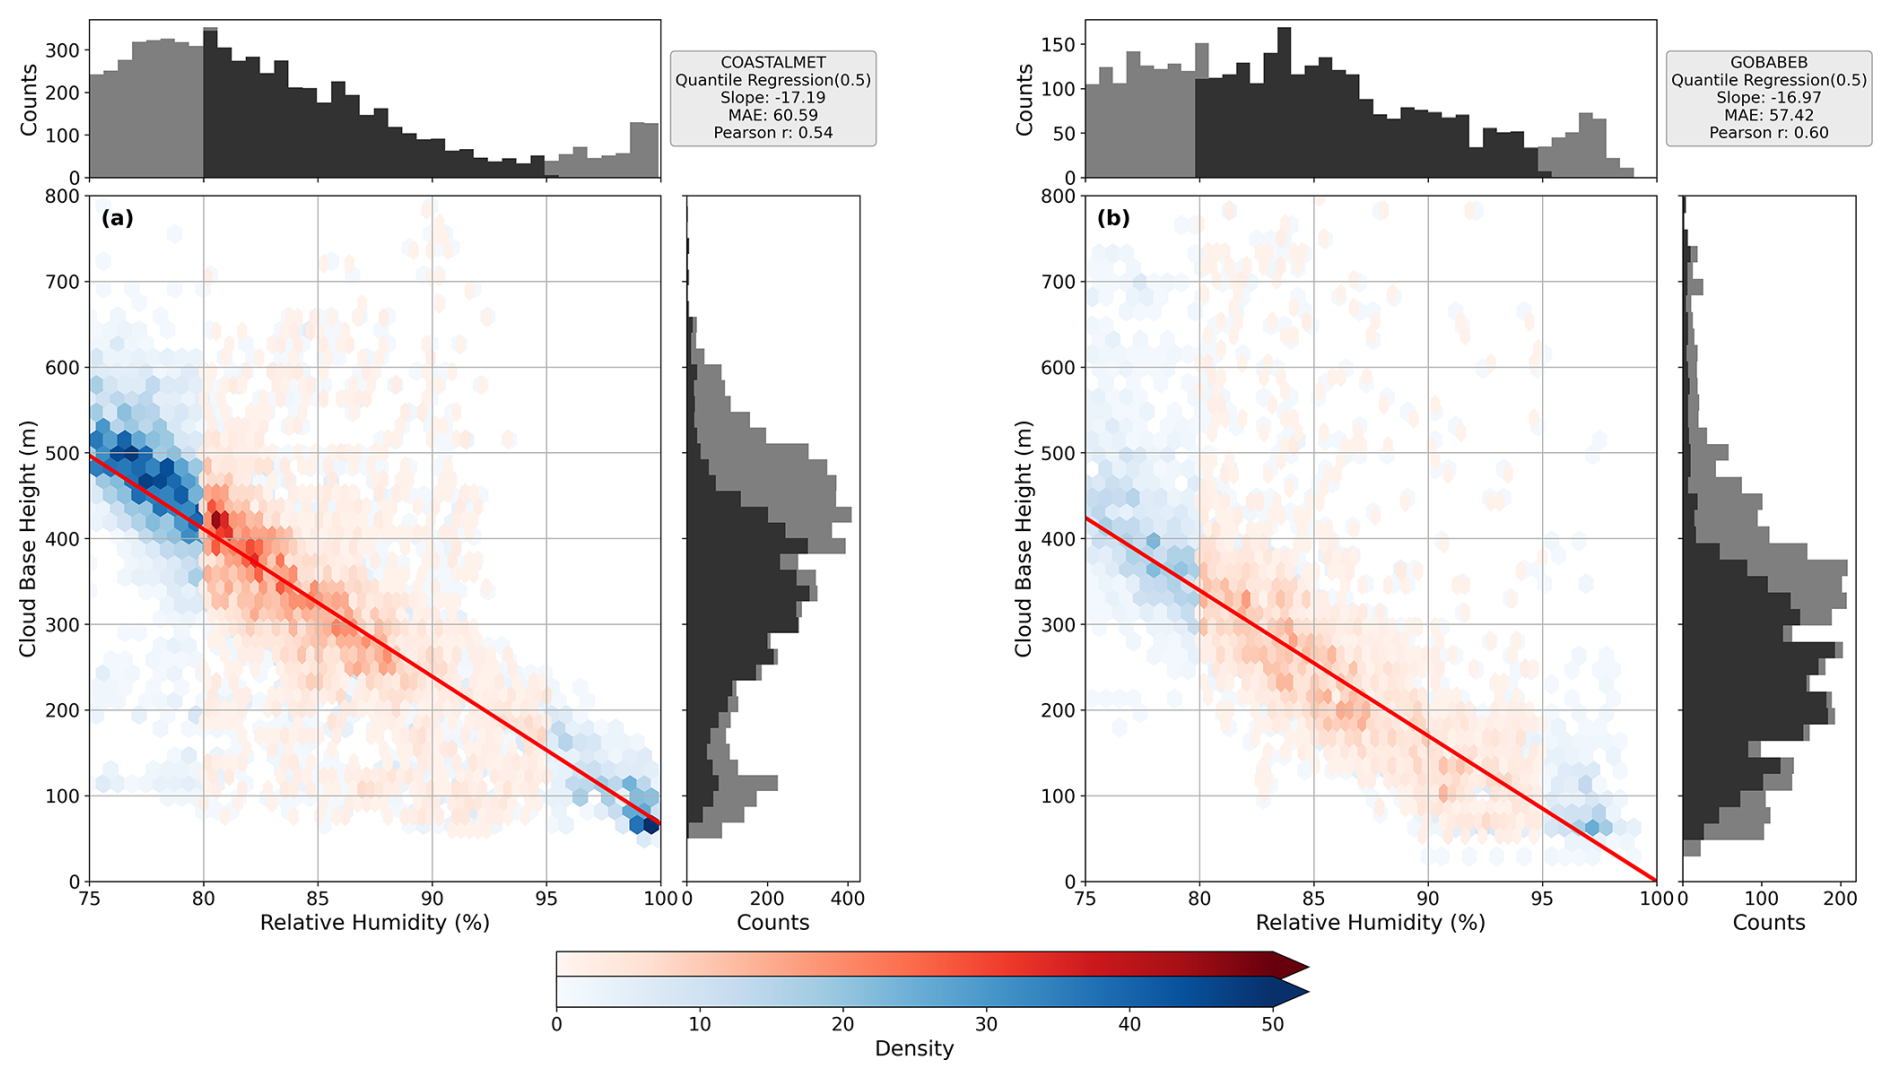
Figure A2Density scatter plots showing the relationship between CBH and RH during the morning hours (07:00–11:00) for two stations: (a) Coastal Met and (b) Gobabeb. The plots indicate a low correlation and a disagreement of slope with the theoretical expectation (−23 m %−1), highlighting the decoupling of the cloud layer from the surface after sunrise. Red shades mark the RH range between 80 % and 95 %, which is used for the 0.5 quantile regression fit (solid red line). Marginal histograms along the top and right axes show the distributions of RH and CBH, respectively, where the black shading corresponds to data within the 80 % RH–95 % RH range and their associated CBH values.
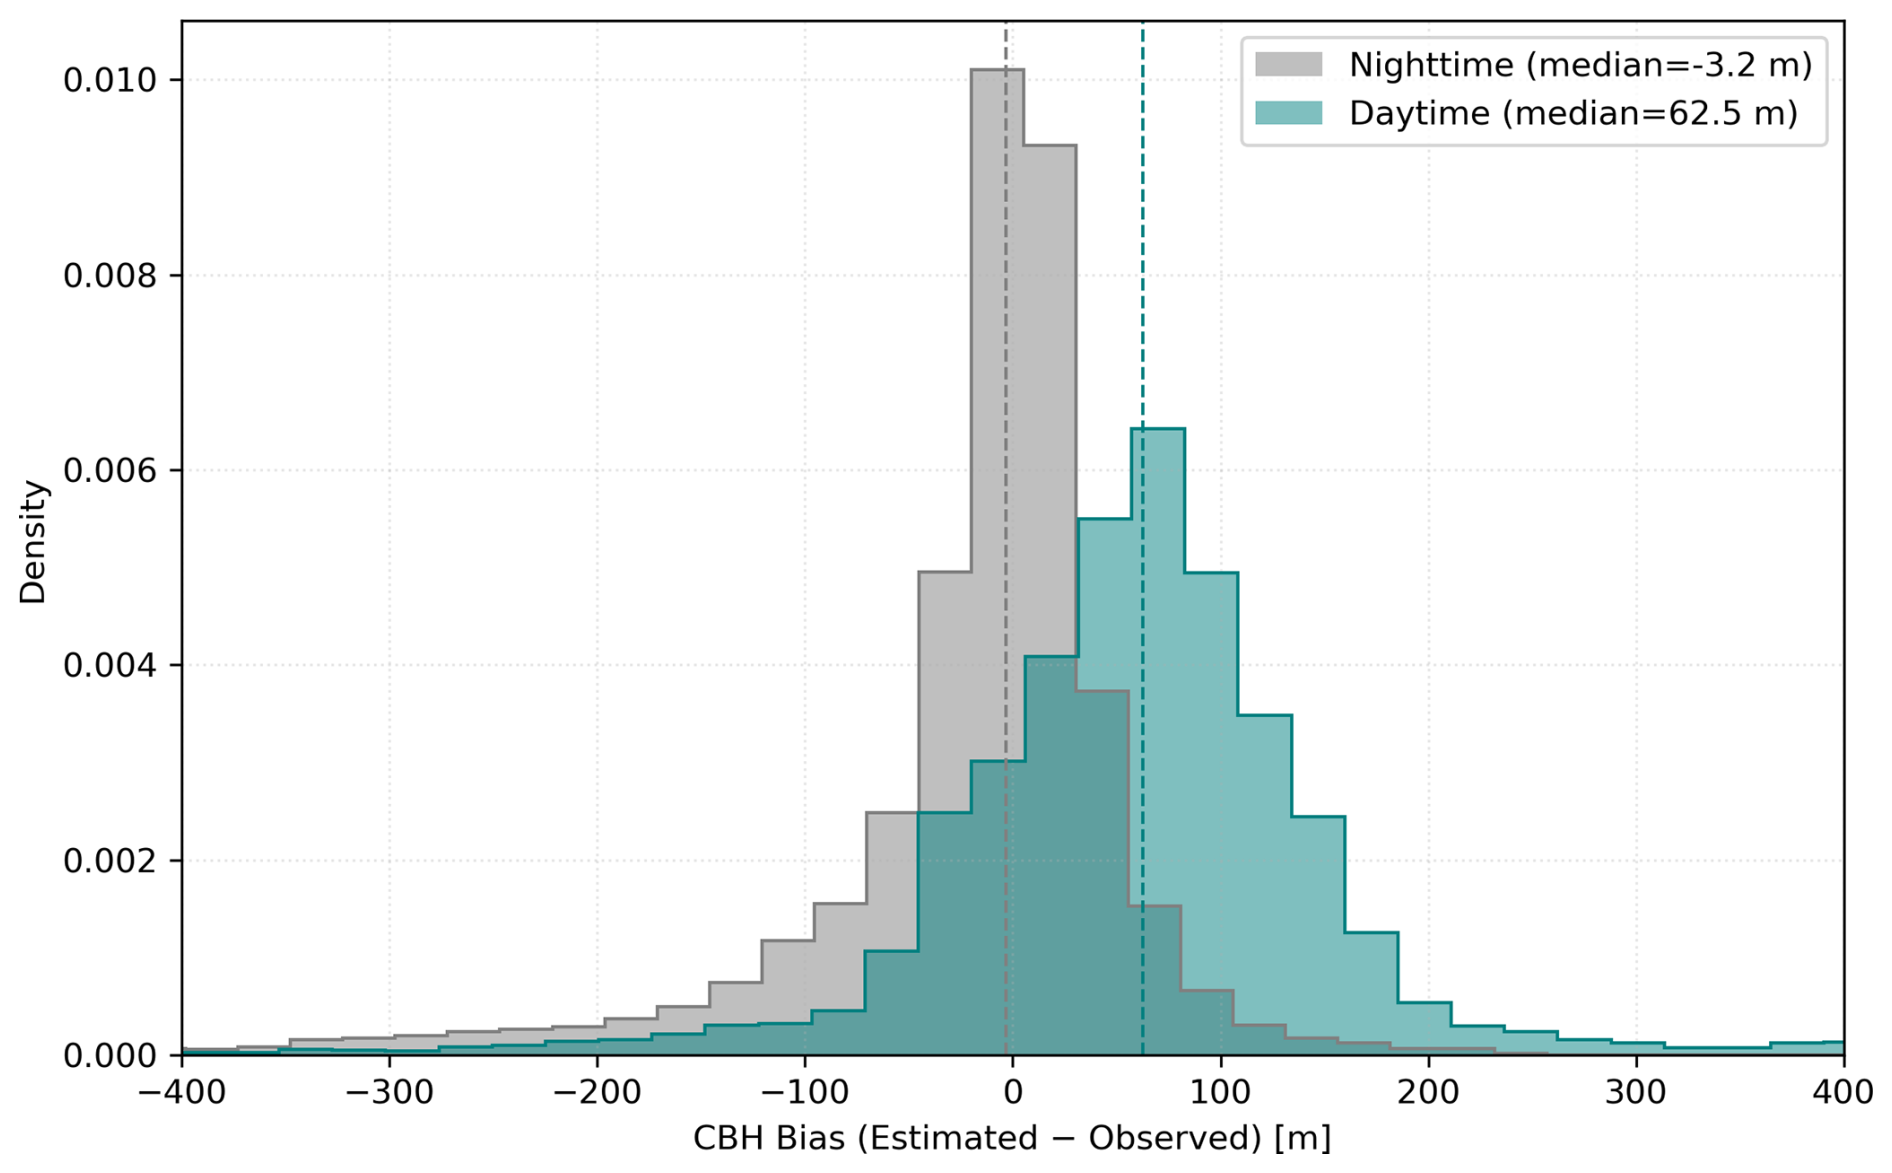
Figure A3Distribution of CBH bias (estimated minus observed) during nighttime (22:00–07:00 UTC, grey) and daytime (07:00–11:00 UTC, teal green) periods for Coastal Met. The nighttime distribution is centered near zero (median = −3.2 m), indicating good agreement between estimated and observed CBH during nocturnal well mixed boundary layer conditions. In contrast, the daytime distribution shows a rightward shift (median = 62.5 m), reflecting a positive bias in estimated CBHe. This shift can be attributed to the transient decoupling between the surface-heated convective layer and the cloud–subcloud layer aloft that remains mixed primarily by cloud-top radiative cooling after sunrise.
The Ceilometer and FogNet datasets used in this study are observational measurements collected at multiple sites. The satellite-based Fog and Low Cloud (FLC) dataset is available from Andersen and Cermak (2018, https://doi.org/10.5194/amt-11-5461-2018). All code and processed data used in the analysis are openly accessible on Zenodo (Malik and Andersen, 2025, https://doi.org/10.5281/zenodo.17709909). For additional details or specific inquiries, readers are encouraged to contact the corresponding authors.
DM, HA, and JC conceived the idea for the analysis. DM carried out the data collection, analysis, and drafted the manuscript. HA contributed to the development of the methodology. RV supported the data collection. HA, JC, RV, and BA assisted in manuscript preparation and contributed to interpreting the results.
The contact author has declared that none of the authors has any competing interests.
Publisher's note: Copernicus Publications remains neutral with regard to jurisdictional claims made in the text, published maps, institutional affiliations, or any other geographical representation in this paper. While Copernicus Publications makes every effort to include appropriate place names, the final responsibility lies with the authors. Views expressed in the text are those of the authors and do not necessarily reflect the views of the publisher.
This article is part of the special issue “Aerosol, fog, climate, and biogeochemistry in southern Africa (ACP/AMT/AR/ESSD inter-journal SI)”. It is not associated with a conference.
Funding for this study was provided by Deutsche Forschungsgemeinschaft (DFG) in the project Aerosols and fog in southern Africa: processes and impact on biogeochemistry (AeroFog). The authors would like to thank the entire AeroFog team, for their assistance during the field campaign in 2024. We thank Anja v.d. Plas and her colleagues from the Ministry of Fisheries and Marine Resources (Swakopmund, Namibia), Mary Seely, and Werner Petrick for the support and for hosting the CL31 instrument. The authors also thank Frank Göttsche and Axel Göbel for the maintenance of the CL31 instrument and the support in data aquisition. The statements, findings, conclusions, and recommendations are those of the authors and do not necessarily reflect the views of NOAA or the U.S. Department of Commerce.
This research has been supported by the Deutsche Forschungsgemeinschaft (DFG, grant no. CE 163/14-1, project no. 505800970) and the Agence Nationale de la Recherche (ANR, grant no. ANR-22-CE92-0051) within the project Aerosols and fog in southern Africa: processes and impact on biogeochemistry (AeroFog). The contribution of co-author Bianca Adler was supported by NOAA cooperative agreement NA22OAR4320151, for the Cooperative Institute for Earth System Research and Data Science (CIESRDS).
The article processing charges for this open-access publication were covered by the Karlsruhe Institute of Technology (KIT).
This paper was edited by Paul Zieger and reviewed by two anonymous referees.
Andersen, H. and Cermak, J.: First fully diurnal fog and low cloud satellite detection reveals life cycle in the Namib, Atmospheric Measurement Techniques, 11, 5461–5470, https://doi.org/10.5194/amt-11-5461-2018, 2018. a, b, c, d, e
Andersen, H., Cermak, J., Solodovnik, I., Lelli, L., and Vogt, R.: Spatiotemporal dynamics of fog and low clouds in the Namib unveiled with ground- and space-based observations, Atmospheric Chemistry and Physics, 19, 4383–4392, https://doi.org/10.5194/acp-19-4383-2019, 2019. a, b, c, d, e, f, g, h, i, j, k, l, m, n, o
Andersen, H., Cermak, J., Fuchs, J., Knippertz, P., Gaetani, M., Quinting, J., Sippel, S., and Vogt, R.: Synoptic-scale controls of fog and low-cloud variability in the Namib Desert, Atmospheric Chemistry and Physics, 20, 3415–3438, https://doi.org/10.5194/acp-20-3415-2020, 2020. a, b
Andrews, W. and Hutchings, L.: Upwelling in the southern Benguela Current, Progress in Oceanography, 9, 1–81, 1980. a
Azúa-Bustos, A., González-Silva, C., Mancilla, R. A., Salas, L., Gómez-Silva, B., McKay, C. P., and Vicuña, R.: Hypolithic cyanobacteria supported mainly by fog in the coastal range of the Atacama Desert, Microbial Ecology, 61, 568–581, 2011. a
Barbato, G., Zollo, A. L., and Mercogliano, P.: Analysis of the planetary boundary layer using CS135 ceilometer, in: 2016 IEEE Metrology for Aerospace (MetroAeroSpace), 124–129, IEEE, https://doi.org/10.1109/MetroAeroSpace.2016.7573198, 2016. a
Bolton, D.: The computation of equivalent potential temperature, Monthly Weather Review, 108, 1046–1053, 1980. a, b
CampbellScientific: Loggernet user manual, Campbell Scientific, https://s.campbellsci.com/documents/au/manuals/loggernet2-1.pdf (last access: 10 December 2025), 2007. a
CampbellScientific: wind monitor: user manual, Campbell Scientific, https://s.campbellsci.com/documents/us/miscellaneous/old-manuals/05103, 05103-45, 05106, 05108, 05108-45, and 05305 Wind Monitors.pdf, 2013a. a
CampbellScientific: CS215 temp and rh probe: user manual, Campbell Scientific, https://s.campbellsci.com/documents/ca/manuals/cs215_man.pdf (last access: 10 December 2025), 2013b. a
CampbellScientific: CNR4 net radiometer: user manual, Campbell Scientific, https://s.campbellsci.com/documents/ca/manuals/cnr4_man.pdf (last access: 10 December 2025), 2017. a
CampbellScientific: CS135 Ceilometer: user manual, Campbell Scientific, https://s.campbellsci.com/documents/eu/manuals/cs135.pdf (last access: 10 December 2025), 2018. a
Cermak, J.: Low clouds and fog along the South-Western African coast—Satellite-based retrieval and spatial patterns, Atmospheric Research, 116, 15–21, 2012. a
Cermak, J.: Fog and low cloud frequency and properties from active-sensor satellite data, Remote Sensing, 10, 1209, https://doi.org/10.3390/rs10081209, 2018. a
Cermak, J. and Bendix, J.: Detecting ground fog from space – a microphysics-based approach, International Journal of Remote Sensing, 32, 3345–3371, 2011. a
Craven, J. P., Jewell, R. E., and Brooks, H. E.: Comparison between observed convective cloud-base heights and lifting condensation level for two different lifted parcels, Weather and Forecasting, 17, 885–890, 2002. a
Del Río, C., Lobos, F., Siegmund, A., Tejos, C., Osses, P., Huaman, Z., Meneses, J. P., and García, J.-L.: GOFOS, ground optical fog observation system for monitoring the vertical stratocumulus-fog cloud distribution in the coast of the Atacama Desert, Chile, Journal of Hydrology, 597, 126190, https://doi.org/10.1016/j.jhydrol.2021.126190, 2021. a
Dione, C., Haeffelin, M., Burnet, F., Lac, C., Canut, G., Delanoë, J., Dupont, J.-C., Jorquera, S., Martinet, P., Ribaud, J.-F., and Toledo, F.: Role of thermodynamic and turbulence processes on the fog life cycle during SOFOG3D experiment, Atmospheric Chemistry and Physics, 23, 15711–15731, https://doi.org/10.5194/acp-23-15711-2023, 2023. a, b
Dupont, J., Haeffelin, M., Stolaki, S., and Elias, T.: Analysis of dynamical and thermal processes driving fog and quasi-fog life cycles using the 2010–2013 ParisFog dataset, Pure and Applied Geophysics, 173, 1337–1358, 2016. a, b
Dupont, J.-C., Haeffelin, M., Protat, A., Bouniol, D., Boyouk, N., and Morille, Y.: Stratus–fog formation and dissipation: a 6-day case study, Boundary-Layer Meteorology, 143, 207–225, 2012. a, b, c, d
Ebner, M., Miranda, T., and Roth-Nebelsick, A.: Efficient fog harvesting by Stipagrostis sabulicola (Namib dune bushman grass), Journal of Arid Environments, 75, 524–531, 2011. a
Eckardt, F., Soderberg, K., Coop, L., Muller, A., Vickery, K., Grandin, R., Jack, C., Kapalanga, T., and Henschel, J.: The nature of moisture at Gobabeb, in the central Namib Desert, Journal of Arid Environments, 93, 7–19, 2013. a
Egli, S., Thies, B., and Bendix, J.: A hybrid approach for fog retrieval based on a combination of satellite and ground truth data, Remote Sensing, 10, 628, https://doi.org/10.3390/rs10040628 2018. a
Fathalli, M., Lac, C., Burnet, F., and Vié, B.: Formation of fog due to stratus lowering: An observational and modelling case study, Quarterly Journal of the Royal Meteorological Society, 148, 2299–2324, 2022. a, b, c
Formenti, P., D'Anna, B., Flamant, C., Mallet, M., Piketh, S. J., Schepanski, K., Waquet, F., Auriol, F., Brogniez, G., Burnet, F., Chaboureau, J.-P., Chauvigné, A., Chazette, P., Denjean, C., Desboeufs, K., Doussin, J.-F., Elguindi, N., Feuerstein, S., Gaetani, M., Giorio, C., Klopper, D., Mallet, M. D., Nabat, P., Monod, A., Solmon, F., Namwoonde, A., Chikwililwa, C., Mushi, R., Welton, E. J., and Holben, B.: The aerosols, radiation and clouds in southern Africa field campaign in Namibia: Overview, illustrative observations, and way forward, Bulletin of the American Meteorological Society, 100, 1277–1298, https://doi.org/10.1175/BAMS-D-17-0278.1, 2019. a
Gan, H. Y., Hohberg, K., Schneider, C., Ebner, M., Marais, E., Miranda, T., Lehmitz, R., Maggs-Kölling, G., and Bocherens, H.: The hidden oases: unveiling trophic dynamics in Namib's fog plant ecosystem, Scientific Reports, 14, 13334, https://doi.org/10.1038/s41598-024-61796-8, 2024. a
Gottlieb, T. R., Eckardt, F. D., Venter, Z. S., and Cramer, M. D.: The contribution of fog to water and nutrient supply to Arthraerua leubnitziae in the central Namib Desert, Namibia, Journal of Arid Environments, 161, 35–46, 2019. a
Juvik, J. O. and Nullet, D.: Comments on “A Proposed Standard Fog Collector for Use in High-Elevation Regions”, Journal of Applied Meteorology, 34, 2108–2110, 1995. a
Kaspar, F., Helmschrot, J., Mhanda, A., Butale, M., de Clercq, W., Kanyanga, J. K., Neto, F. O. S., Kruger, S., Castro Matsheka, M., Muche, G., Hillmann, T., Josenhans, K., Posada, R., Riede, J., Seely, M., Ribeiro, C., Kenabatho, P., Vogt, R., and Jürgens, N.: The SASSCAL contribution to climate observation, climate data management and data rescue in Southern Africa, Advances in Science and Research, 12, 171–177, https://doi.org/10.5194/asr-12-171-2015, 2015. a, b
Koenker, R. and Hallock, K. F.: Quantile regression, Journal of Economic Perspectives, 15, 143–156, 2001. a
Koračin, D., Lewis, J., Thompson, W. T., Dorman, C. E., and Businger, J. A.: Transition of stratus into fog along the California coast: Observations and modeling, Journal of the Atmospheric Sciences, 58, 1714–1731, 2001. a
Kutta, E. and Hubbart, J. A.: Seasonal lifting condensation level trends: implications of warming and reforestation in Appalachia's deciduous forest, Atmosphere, 14, 98, https://doi.org/10.3390/atmos14010098, 2023. a
Lancaster, J., Lancaster, N., and Seely, M.: Climate of the Central Namib Desert, Madoqua, 14, 5–61, 1984. a, b
Lawrence, M. G.: The relationship between relative humidity and the dewpoint temperature in moist air: A simple conversion and applications, Bulletin of the American Meteorological Society, 86, 225–234, 2005. a, b
Lobos-Roco, F., Vilà-Guerau de Arellano, J., and del Río, C.: Observation-driven model for calculating water-harvesting potential from advective fog in (semi-)arid coastal regions, Hydrology and Earth System Sciences, 29, 109–125, https://doi.org/10.5194/hess-29-109-2025, 2025. a
Malik, D. and Andersen, H.: Data and Code of Malik et al. (2025) “Cloud Base Height Determines Fog Occurrence Patterns in the Namib Desert” (ACP), Zenodo [code, data set], https://doi.org/10.5281/zenodo.17709909, 2025. a
Mass, A., Andersen, H., Cermak, J., Formenti, P., Pauli, E., and Quinting, J.: A satellite-based analysis of semi-direct effects of biomass burning aerosols on fog and low-cloud dissipation in the Namib Desert, Atmospheric Chemistry and Physics, 25, 491–510, https://doi.org/10.5194/acp-25-491-2025, 2025. a
Maúre, G., Pinto, I., Ndebele-Murisa, M., Muthige, M., Lennard, C., Nikulin, G., Dosio, A., and Meque, A.: The southern African climate under 1.5 °C and 2 °C of global warming as simulated by CORDEX regional climate models, Environmental Research Letters, 13, 065002, https://doi.org/10.1088/1748-9326/aab190, 2018. a
McHugh, T. A., Morrissey, E. M., Reed, S. C., Hungate, B. A., and Schwartz, E.: Water from air: an overlooked source of moisture in arid and semiarid regions, Scientific Reports, 5, 13767, https://doi.org/10.1038/srep13767, 2015. a
Nagel, J.: Fog precipitation at Swakopmund, Weather Bureau Newsletter, 125, 1–9, 1959. a, b
Nicholls, S.: The dynamics of stratocumulus: Aircraft observations and comparisons with a mixed layer model, Quarterly Journal of the Royal Meteorological Society, 110, 783–820, 1984. a
Olivier, J.: Some spatial and temporal aspects of fog in the Namib, South African Geographer, 19, 106–126, http://hdl.handle.net/10019.1/11741 (last access: 8 January 2026), 1992. a, b
Olivier, J.: Spatial distribution of fog in the Namib, Journal of Arid Environments, 29, 129–138, https://doi.org/10.1016/S0140-1963(05)80084-9, 1995. a
Olivier, J. and Stockton, P. L.: The influence of upwelling extent upon fog incidence at Lüderitz, southern Africa, International Journal of Climatology, 9, 69–75, https://doi.org/10.1002/joc.3370090106, 1989. a
Pilié, R., Mack, E., Rogers, C., Katz, U., and Kocmond, W.: The formation of marine fog and the development of fog-stratus systems along the California coast, Journal of Applied Meteorology, 1275–1286, 1979. a
Pope, N. H. and Igel, A. L.: Counteracting influences of gravitational settling modulate aerosol impacts on cloud-base-lowering fog characteristics, Atmospheric Chemistry and Physics, 25, 5433–5444, https://doi.org/10.5194/acp-25-5433-2025, 2025. a
Qiao, N., Wang, L., Marais, E., and Li, F.: Fog detection and estimation using CALIPSO lidar observations, Geophysical Research Letters, 49, e2022GL101375, https://doi.org/10.1029/2022GL101375, 2022. a
Roth-Nebelsick, A., Ebner, M., Miranda, T., Gottschalk, V., Voigt, D., Gorb, S., Stegmaier, T., Sarsour, J., Linke, M., and Konrad, W.: Leaf surface structures enable the endemic Namib desert grass Stipagrostis sabulicola to irrigate itself with fog water, Journal of the Royal Society interface, 9, 1965–1974, 2012. a
Seely, M. and Henschel, J.: The climatology of Namib fog, in: Proceedings of the First International Conference on Fog and Fog Collection, 19–24, Vancouver, https://fogquest.org/wp-content/uploads/2015/08/Conf_1998_Seely_Climat.pdf (last access: 8 January 2026), 1998. a, b, c
Shanyengana, E., Henschel, J., Seely, M., and Sanderson, R.: Exploring fog as a supplementary water source in Namibia, Atmospheric Research, 64, 251–259, 2002. a
Singh, D. K., Hoch, S. W., Gultepe, I., and Pardyjak, E. R.: A case study of the life cycle of a stratus-lowering coastal-fog event in Newfoundland, Canada, Quarterly Journal of the Royal Meteorological Society, 150, 641–662, 2024. a, b, c, d
Spirig, R., Vogt, R., Larsen, J. A., Feigenwinter, C., Wicki, A., Franceschi, J., Parlow, E., Adler, B., Kalthoff, N., Cermak, J., Andersen, H., Fuchs, J., Bott, A., Hacker, M., Wagner, N., Maggs-Kolling, G., Wassenaar, T., and Seely, M.: Probing the fog life cycles in the Namib Desert, Bulletin of the American Meteorological Society, 100, 2491–2507, https://doi.org/10.1175/BAMS-D-18-0142.1, 2019. a, b, c, d, e, f, g, h
Toledo, F., Haeffelin, M., Wærsted, E., and Dupont, J.-C.: A new conceptual model for adiabatic fog, Atmospheric Chemistry and Physics, 21, 13099–13117, https://doi.org/10.5194/acp-21-13099-2021, 2021. a, b
Turton, J. and Nicholls, S.: A study of the diurnal variation of stratocumulus using a multiple mixed layer model, Quarterly Journal of the Royal Meteorological Society, 113, 969–1009, 1987. a
Vaisala: CL31 Ceilometer: user manual, Vaisala, https://docs.vaisala.com/r/M210482EN-L/en-US (last access: 10 December 2025), 2024. a
Vogelmann, A. M., Fridlind, A. M., Toto, T., Endo, S., Lin, W., Wang, J., Feng, S., Zhang, Y., Turner, D. D., Liu, Y., Li, Z., Xie, S., Ackerman, A. S., Zhang, M., and Khairoutdinov, M.: RACORO continental boundary layer cloud investigations: 1. Case study development and ensemble large-scale forcings, Journal of Geophysical Research: Atmospheres, 120, 5962–5992, https://doi.org/10.1002/2014JD022713, 2015. a
Wærsted, E. G., Haeffelin, M., Steeneveld, G.-J., and Dupont, J.-C.: Understanding the dissipation of continental fog by analysing the LWP budget using idealized LES and in situ observations, Quarterly Journal of the Royal Meteorological Society, 145, 784–804, 2019. a, b
Wagh, S., Krishnamurthy, R., Wainwright, C., Wang, S., Dorman, C. E., Fernando, H. J., and Gultepe, I.: Study of stratus-lowering marine-fog events observed during C-FOG, Boundary-Layer Meteorology, 181, 317–344, 2021. a
Wagner, F., Geiss, A., Barnaba, F., Belegante, L., Bellini, A., Buxmann, J., Diémoz, H., Fenner, D., Kotthaus, S., Osborne, M., Ruefenacht, R., Ruiz de Morales Céspedes, J., and Van Hove, M.: JND European networks observing the atmospheric boundary layer: Overview, access and impacts – Chapter 2a: Automatic low-power Lidar and Ceilometer (ALC), Zenodo, https://doi.org/10.5281/zenodo.11211873, 2024. a, b, c
Warren-Rhodes, K. A., McKay, C. P., Boyle, L. N., Wing, M. R., Kiekebusch, E. M., Cowan, D. A., Stomeo, F., Pointing, S. B., Kaseke, K. F., Eckardt, F., Henschel, J. R., Anisfeld, A., Seely, M., and Rhodes, K. L.: Physical ecology of hypolithic communities in the central Namib Desert: the role of fog, rain, rock habitat, and light, Journal of Geophysical Research: Biogeosciences, 118, 1451–1460, https://doi.org/10.1002/jgrg.20117, 2013. a
Weathers, K. C., Ponette-González, A. G., and Dawson, T. E.: Medium, vector, and connector: Fog and the maintenance of ecosystems, Ecosystems, 23, 217–229, 2020. a
Wiegner, M., Mattis, I., Pattantyús-Ábrahám, M., Bravo-Aranda, J. A., Poltera, Y., Haefele, A., Hervo, M., Görsdorf, U., Leinweber, R., Gasteiger, J., Haeffelin, M., Wagner, F., Cermak, J., Komínková, K., Brettle, M., Münkel, C., and Pönitz, K.: Aerosol backscatter profiles from ceilometers: validation of water vapor correction in the framework of CeiLinEx2015, Atmospheric Measurement Techniques, 12, 471–490, https://doi.org/10.5194/amt-12-471-2019, 2019. a, b
Wood, R. and Bretherton, C. S.: Boundary layer depth, entrainment, and decoupling in the cloud-capped subtropical and tropical marine boundary layer, Journal of Climate, 17, 3576–3588, 2004. a, b
Yang, L., Liu, J.-W., Xie, S.-P., and Shen, S. S.: Transition from fog to stratus over the northwest Pacific Ocean: Large-eddy simulation, Monthly Weather Review, 149, 2913–2925, 2021. a
Zivot, E. and Wang, J.: Rolling Analysis of Time Series, 299–346, Springer New York, New York, NY, ISBN 978-0-387-21763-5, https://doi.org/10.1007/978-0-387-21763-5_9, 2003. a