the Creative Commons Attribution 4.0 License.
the Creative Commons Attribution 4.0 License.
 | 15 May 2026
Ventilation and low pollution enhancing new particle formation in Milan, Italy
Manuel Bettineschi
Silvia Melina
Diego Aliaga
Andrea Bergomi
Beatrice Biffi
Alessandro Bigi
Giancarlo Ciarelli
Cristina Colombi
Paola Fermo
Ivan Grigioni
Veli-Matti Kerminen
Markku Kulmala
Janne Lampilahti
Angela Marinoni
Celestine Oliewo
Juha Sulo
Gianluigi Valli
Roberta Vecchi
Tuukka Petäjä
Katrianne Lehtipalo
Federico Bianchi
New particle formation (NPF) is a crucial process that significantly affects the number of atmospheric particles, forming a substantial portion of the total aerosol population. Therefore, it has important implications for both human health and climate. While extensive research has been conducted in rural areas of the Po Valley, Italy, there is a substantial lack of continuous measurements with state-of-the-art instruments in Milan, one of the most industrialized and densely populated cities in the region. This study aims to address this gap by analysing one year of detailed particle number size distribution measurements between 1.2 and 480 nm at an urban background site in Milan. These data were used to examine the occurrence and characteristics of NPF and to identify how the meteorological and air pollution conditions affect it. We show that a cleaner atmosphere, meaning lower concentrations of air pollutants and lower condensation sink, and a higher ventilation promote NPF. Detailed modelling of the air masses history further revealed that a longer residence time in the Po Valley and a greater exposure to anthropogenic emissions inhibit NPF. Furthermore, we show that strong winds, particularly from the northwest sector (e.g., Foehn winds), facilitate NPF, likely by reducing the condensation sink for precursor vapours. This locates Milan among the urban sites where atmospheric cleaning enhances NPF, providing insights for urban air quality management.
- Article
(5406 KB) - Full-text XML
-
Supplement
(1502 KB) - BibTeX
- EndNote


New particle formation (NPF) is a critical process happening in the atmosphere, consisting of the formation of molecular clusters and their growth through the condensation of precursor vapors (Kulmala et al., 2013). These newly formed particles play a vital role in influencing air quality (Kulmala et al., 2021). Ultrafine particles (UFP), i.e., particles smaller than 100 nm in diameter, can reach the lungs, blood system, and brain, threatening human health (Schraufnagel, 2020; Vallabani et al., 2023). Moreover, when newly formed particles grow in size, they can interact directly with the solar radiation or be activated as cloud condensation nuclei (Gordon et al., 2017; Merikanto et al., 2009; Spracklen et al., 2008; Zhao et al., 2024), affecting the radiative balance of the Earth and, therefore, the climate. WHO recommended the monitoring of UFP in 2021 (WHO, 2021), and, to comply with such recommendation, the European Union enforces their measurements on the member states with the Ambient Air Quality Directive 2024/2881. European countries must monitor UFP at both urban and rural supersites, as well as at UFP hotspots. Specifically, particle number concentration must be measured for particles larger than 10 nm, with no limitation on the maximum size.
The Po Valley, in northern Italy, is a region of particular interest for studying NPF due to its unique geographical and environmental characteristics. It is one of the most polluted areas in Europe (EEA, 2019), not only due to the intense and diverse emissions (Kuenen et al., 2022), but also due to its enclosed position between the Alps and the Apennines, which favors the accumulation of air pollutants due to the formation of a shallow boundary layer (Vecchi et al., 2004). Previous research in this area has consistently highlighted the relevance of NPF events. The study by Rodríguez et al. (2005), including data between June 1999 and December 2000, explored the relation between aerosol size distributions and air quality in Ispra, a rural site in the Northern Po Valley, emphasizing the role of NPF in UFP number concentration. Their findings showed a negative correlation between UFP number concentration and aerosol mass, underlining the weakness of the traditional air quality metrics, like PM2.5 and PM10, which do not effectively capture UFP pollution. According to Rodríguez et al. (2005), NPF events predominantly occurred under clean air conditions, often triggered by Foehn wind coming from the north, which reduced the number of pre-existing particles and created favorable conditions for the new particles to grow. In contrast, polluted conditions promoted the condensation of vapors on pre-existing particles. A study by Hamed et al. (2007) conducted over three years at the rural site of San Pietro Capofiume, Po Valley, found that nucleation events occurred on 36 % of the days, with the highest frequency in spring and summer (peaking to ∼70 % in May and July) and the lowest in winter and autumn. Favorable conditions for nucleation included higher temperature, wind speed, solar radiation, and SO2 and O3 concentrations, while relative humidity and NO2 levels were lower during event days. The back trajectory analysis indicated that air masses primarily originated from the north and east during nucleation events, highlighting the significant impact of atmospheric circulation on NPF. Supporting the NPF relevance in the area, Kontkanen et al. (2016) reported frequent NPF (86 % of days) during a 1-month summer campaign at the same site. Focusing on sub-3 nm clusters, this study indicated high cluster concentrations also during high condensation sink (CS) episodes and non-NPF events, hinting at a continuous formation of the smallest particles. During NPF days, cluster formation peaked with the decrease of CS and relative humidity and the increase in boundary layer height (BLH), highlighting the role of atmospheric dynamics in the process. Sulfuric acid was identified as a potentially relevant precursor to the NPF process. More recent findings by Cai et al. (2024), including direct measurements of the NPF precursor vapors, supported these observations, showing that NPF events occurred on approximately 66% of days during a two-month spring campaign in San Pietro Capofiume, confirming favorable conditions for NPF in this region. During these events, high concentrations of sulfuric acid (“8.5×106 cm−3”) were detected, underlining its crucial role in NPF, alongside ammonia and amines. These studies collectively suggest that NPF substantially contributes to the UFP number concentration and overall pollution levels in this area, underscoring its importance for both regional air quality and climate. All the previously cited studies, though, refer to rural areas, while none provide a detailed study of NPF in urban areas of the Po Valley.
Several factors differentiate rural and urban environments in regard to NPF. The higher CS in urban areas (Bae et al., 2010; Cai et al., 2024) can suppress NPF, as the available precursor vapors tend to condense onto existing particles rather than forming new ones (Seinfeld and Pandis, 2016). The availability, chemical composition, and temporal variation of precursor vapors are also different in rural and urban areas, as they are affected by human activities and local sources, such as traffic. The work by Nieminen et al. (2018), for example, showed that formation rates generally increase with an increasing anthropogenic influence in the atmospheric composition, highlighting the importance of anthropogenic vapors in the NPF process. Urban environments are characterized by various emission sources that release both potential precursor vapors and particles across a wide size range, largely complicating the observation of NPF. Thus, in such settings, distinguishing between primary and secondary particles is challenging. Therefore, studying NPF in urban areas requires a comprehensive approach that accounts for the complex interplay of various processes, including emissions, atmospheric chemistry, and meteorological conditions. Understanding these interactions is essential for accurately characterizing the NPF mechanism in such environments. Several studies have already been conducted in urban sites across the world, such as the Chinese megacities (Dai et al., 2023; Guo et al., 2014; Yao et al., 2018) and European cities (Brean et al., 2020; Salma et al., 2011), which are discussed in Sect. 3.2. Within this context, the city of Milan provides a particularly complex environment for investigating NPF. As a major metropolitan area within the Po Valley, Milan is characterized by high population density, intense traffic, and significant industrial activities. Its geographical location further aggravates air quality challenges, as atmospheric stagnation often leads to the accumulation of pollutants (Vecchi et al., 2004). This combination of factors makes Milan an important hotspot for studying air quality and the processes driving NPF in urban settings.
In this study, we present a one-year measurement campaign conducted at an urban background site in Milan between the end of March 2023 and the end of March 2024, as ancillary measurements to the activities foreseen by the European project Ri-Urbans (https://riurbans.eu/, last access: 23 April 2026). The main objective was to quantify the intensity, characteristics, and driving mechanisms of NPF. By integrating measurements of particle number size distributions, air pollutant concentrations, and meteorological conditions, along with outputs from the FLEXible PARTicle dispersion model (FLEXPART), we investigated the key factors governing NPF. By presenting a dataset of particle number size distributions extending down to 1.2 nm, we also show the importance of extending size distribution measurements below 10 nm, especially in relation to the European air quality directive 2024/2881.
2.1 Location description
Milan is located in the Po Valley (Fig. 1a) at the coordinates 45.47° N, 9.19° E, at an altitude of 120 m a.s.l. It is the most populated city of the Po Valley with a population of ∼1.4 million, reaching ∼3.2 million when considering the entire metropolitan area (ISTAT, 2024). Our measurements were taken in an urban background area, referred to as the Pascal area (Fig. 1b) due to the presence of the Pascal air quality monitoring station of the regional environmental agency (ARPA Lombardia). The area is located in the eastern part of the city of Milan, and the instruments were installed at the Physics (45.4764° N, 9.2317° E) and Chemistry (45.4754° N, 9.2329° E) Departments of the University of Milan (UNIMI). This is an urban background area, which is affected by several sources of pollution, such as traffic, domestic heating, and transported industrial and agricultural emissions (Colombi et al., 2023).
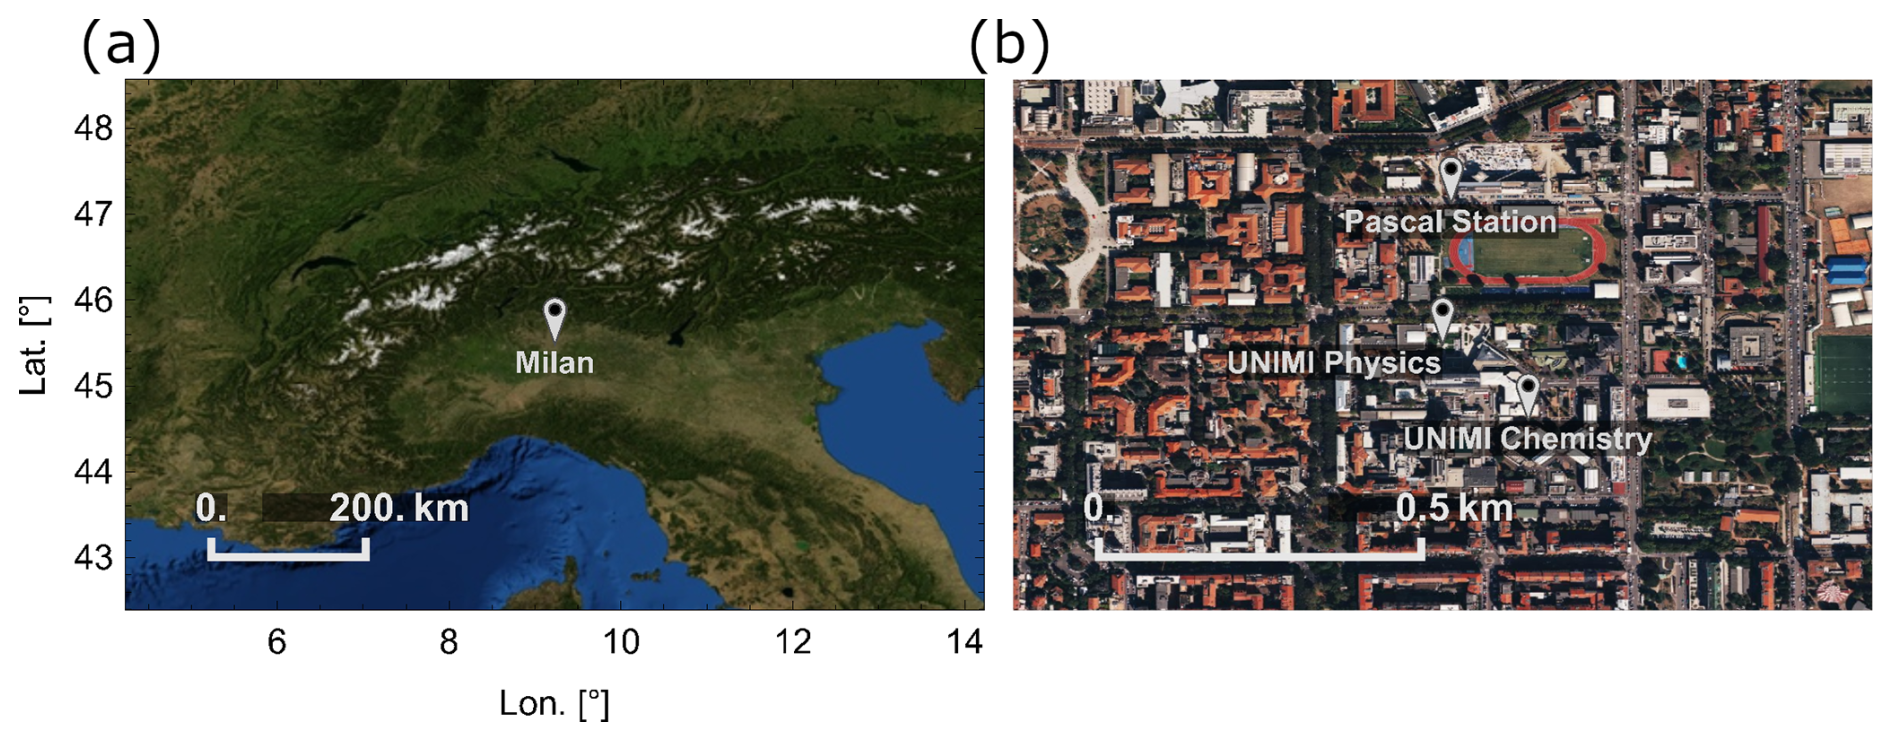
Figure 1(a) Location of the Po Valley and specifically Milan, in white pin; (b) focus on the Pascal area, where the measurement sites (ARPA Lombardia Pascal station, Physics Department of UNIMI, and Chemistry Department of UNIMI) are located. The satellite maps were generated using Mathematica 14.1 (Wolfram Research, 2025) with imagery from Bing Maps (Microsoft, last access: 17 April 2025). Imagery © Microsoft Corporation, Bing Maps.
2.2 Size distribution data
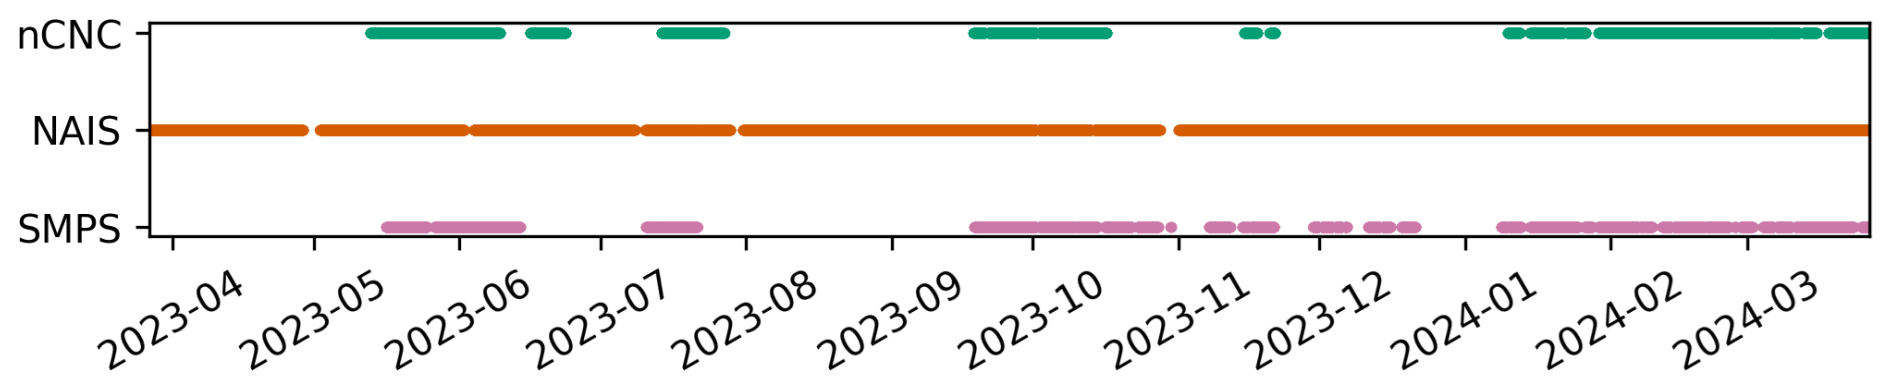
Our size distribution measurements were performed with a set of three instruments: a TSI Scanning Mobility Particle Sizer (SMPS), an Airel Neutral cluster and Air Ion Spectrometer (NAIS), and an Airmodus A11 nano-Condensation Nucleus Counter (nCNC) system, combining an Airmodus A10 Particle Size Magnifier (PSM) and an Airmodus A20 Condensation Particle Counter (CPC). The nCNC and the SMPS were located on the second floor of the Chemistry Department of UNIMI and measured particle number size distributions between 1.2 and 3 nm (Lehtipalo et al., 2022) and between 11 and 480 nm, respectively. The NAIS measured number size distributions of particles with a diameter between 2.5 and 40 nm and of positive and negative ions with a diameter between 0.8 and 40 nm (Manninen et al., 2016; Mirme and Mirme, 2013). The instrument was located on the first floor of the Physics Department of UNIMI, at a distance of about 160 m from the nCNC and SMPS measurements. While the difference in location between the NAIS and the other instruments may have introduced some uncertainty, all inlets faced the interior of the University's yard, which is not constantly affected by one specific source (for example, traffic), and can, therefore, be considered representative of Milan urban background. For this reason, the combination of the data by these instruments was considered reasonable regardless of their different location. The NAIS measurements began in March 2023 and ended in February 2025, while those of the nCNC and the SMPS started in May 2023 and ended in March 2024. The particle number size distribution data between 27 March 2023, and 26 March 2024 were used for this study.
Considering the high number concentration of sub-3nm particles in the city, the nCNC was equipped with an Airmodus Nanoparticle Diluter (AND; Lampimäki et al., 2023) running with a dilution factor of 5 and measuring instrumental background automatically three times a day for 8 min. The system was run with a core sampling inlet, as integrated into the AND design. Using a dry flow for the dilution, the AND also acted as a dryer. The AND inlet consisted of a 40 cm stainless steel tube sampling ambient air at a flow rate of about 6 L min−1, while the PSM, connected to the AND through a conductive tube, worked with a flow rate of 2.5 L min−1. The nCNC measured in scanning mode with saturator flow scanning between 0.1 and 1.3 L min−1. Each scan lasted 4 min. To guarantee the correct functioning of the instrument, several checks and cleaning procedures were applied. Every week, both the PSM and the CPC were drained, and their connection was cleaned with isopropanol and compressed air. The involved flows and the background were also manually checked. Flushing of the PSM was performed once every two weeks, while the inlet line was cleaned once a month. The overall status of the instrument was checked almost every day. The data from the nCNC were inverted using the kernel inversion method and applying the corrections for the background, the detection efficiency, the dilution factor, and the inlet losses, estimated to be between 20 % and 9.3 %, depending on the particle size (Lehtipalo et al., 2022).
The SMPS (Wang and Flagan, 1990), consisting of a 3080 TSI classifier, a 3081 TSI DMA, and a 3772 TSI CPC, was equipped with a stainless steel inlet drawing 1 L min−1 of ambient air, a 4.9 kV X-ray tube to provide particles with a known charge distribution, and with a silica gel dryer to reduce the relative humidity of the air sample. The DMA scanned between ∼10 and ∼9700 V during a cycle of 3 min, producing size distributions between 11 and 480 nm. Weekly checks of the performance of the instrument included CPC draining and flow checks. The inlet line was cleaned once a month with isopropanol and the silica gel was regenerated when needed. The data were inverted using the TSI Aerosol Instrument Manager program. The data were corrected for counting errors due to multiple charging. For both the nCNC and the SMPS, no clear step changes associated with cleaning were identified and any observed variations did not indicate clear effects of the cleaning procedures.
The NAIS was equipped with a 50 cm copper inlet followed by a downward bend to prevent rain from entering the instrument, resulting in a total inlet length of approximately 60 cm. Ambient air was sampled at a flow rate of 54 L min−1. The instrument measured in particle, ion, and offset mode, changing mode every 90 s. Considering the high inlet flow rate of the NAIS, drying the sample flow was not possible. Instrument cleaning was performed when needed. Concentration increases in specific size bins were used as indicators of electrometer noise and to identify the need for cleaning. These artificially high concentrations were manually excluded from the analysis, and no clear systematic step changes associated with cleaning were observed. The measured data were inverted automatically by the Spectop software following the procedure described by Mirme and Mirme (2013). The data were then corrected for inlet losses (between 15 % and 0.1 %, depending on the particle size; Gormley and Kennedy, 1948) and ion calibration (Wagner et al., 2016). The final particle number size distributions were obtained by averaging those from the positive and negative columns.
Figure 2 illustrates the data availability throughout the campaign. Of all the instruments, the NAIS provided the most comprehensive data coverage, recording data on approximately 95 % of the time. On the other hand, the nCNC and SMPS recorded data for about 40 % and 42 % of the time, respectively. Measurement gaps mostly resulted from technical challenges, including high summer temperatures, power outages, CPC flooding, and delays in equipment shipments.
The total size distributions were obtained by combining the nCNC, NAIS, and SMPS data. First of all, all the data were resampled to a 15-minute time resolution and rebinned to a diameter resolution of 0.05 in log10 scale. Then, the median size distributions of the three instruments were compared for the periods when all three instruments were operating simultaneously (Fig. 3). A scaling factor of 3.8 was applied to the NAIS data, following the approach proposed by Dada et al. (2023). The scaling factor was obtained by comparing the NAIS and SMPS data in the overlapping size region. Then, the number size distributions from the three instruments were combined using the concentrations measured by the nCNC for the particles smaller than 2.2 nm, by the NAIS for the particles in the 2.2–25 nm size range, and by the SMPS for the particles larger than 25 nm. Using the SMPS as a reference instrument, an artifact at the connection between the nCNC and the NAIS data was created.
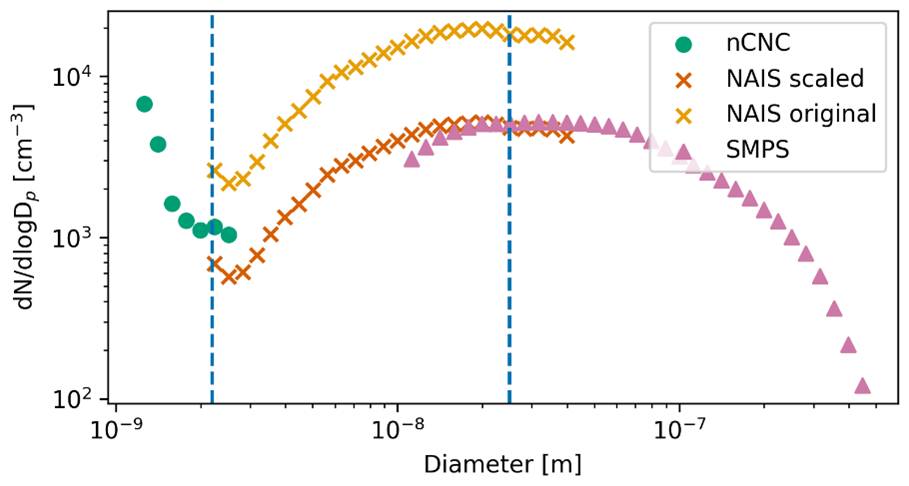
Figure 3Median particle number size distributions measured by the nCNC, the NAIS (original and scaled), and the SMPS. The medians were calculated using only the periods when all the instruments were measuring simultaneously. The blue vertical lines mark the diameters at which the size distributions were combined.
The relevance of UFP has led the European Union to enforce the measurement of their number concentration. As reported in Sect. 1, a 10 nm cut-off was chosen to define UFP. In Fig. 4, the total particle number concentration for different cut-off sizes was calculated by integrating the size distribution from different lower limits (2, 5, and 10 nm) to the upper limit of 480 nm. In our dataset, lowering the threshold from 10 to 5 nm would result in an average increase of 14 %, whereas adopting a 2 nm cut-off would lead to a 19 % increase (Fig. 4a). Figure 4b shows the variability of the ratio between the concentration for a certain cut-off size (2, 5, 10 nm) and the total particle number concentration. These considerations highlight the potential impact of measurement thresholds on reported UFP number concentrations and emphasize the importance of detailed measurements of sub-10 nm particles. While the availability and complexity of the instrumentation pose significant challenges to measuring sub-10 nm particles, the dataset presented in this work demonstrates the value of extending the measurements below 10 nm.
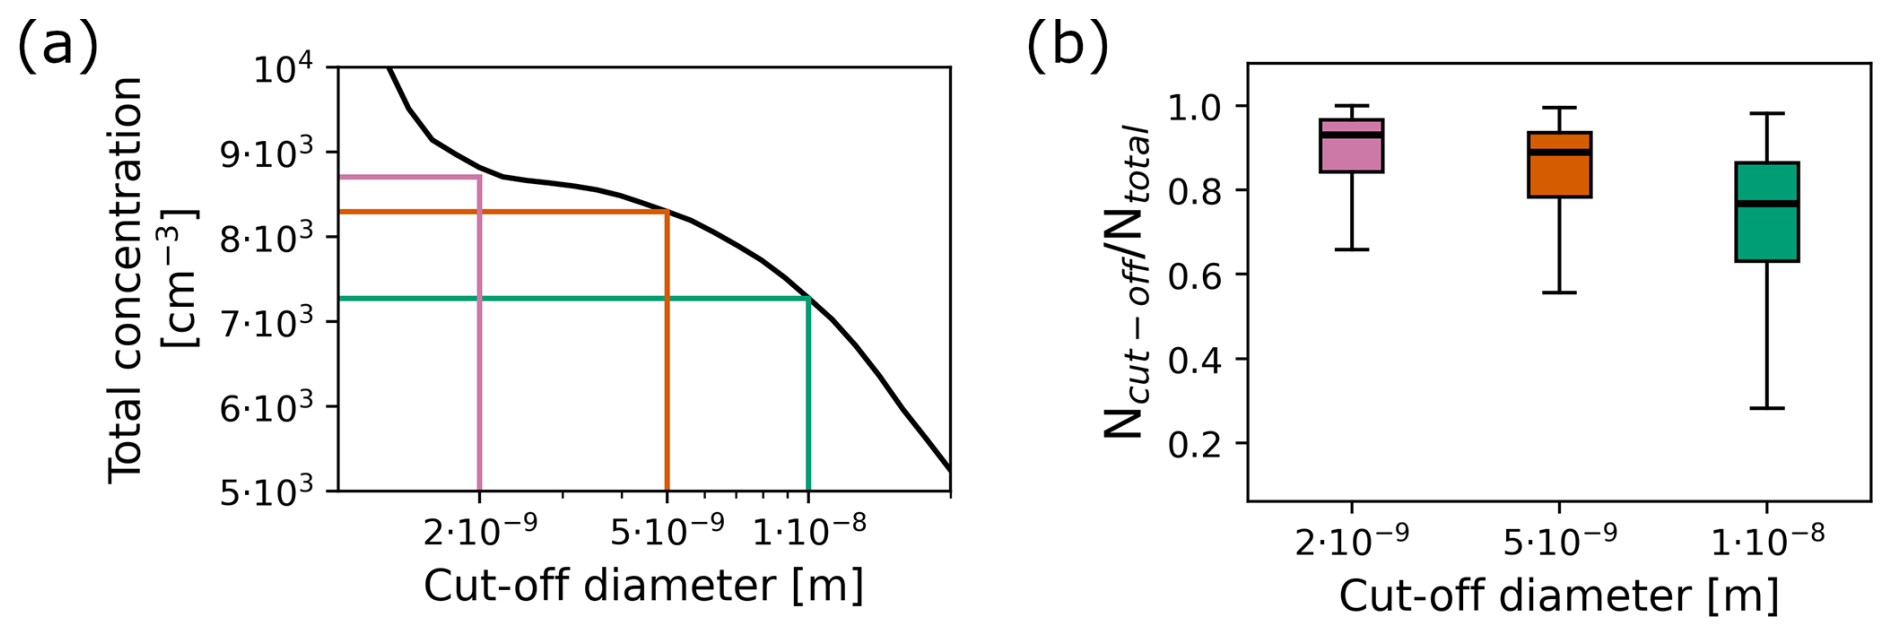
Figure 4(a) Total particle number concentration for different cut-off sizes, averaged over the entire campaign time. The green line marks the cut-off diameter of 10 nm, the orange one of 5 nm, and the pink one of 2 nm; (b) boxplots representing the ratio between the concentration for different cut-off diameters (Ncut-off) and the total particle number concentration (Ntotal). In each boxplot, the box represents the interquartile range, between the 25th and the 75th percentile, and the median (50th percentile) is shown as a horizontal line inside the box. The whiskers of the boxplot extend from the edges of the box to the smallest and largest values within 1.5 times the interquartile range. Outliers are not shown in this figure.
2.3 Complementary data
The study used meteorological and air pollutant concentration data provided by ARPA Lombardia, the regional environmental agency responsible for managing multiple monitoring stations across the area. For the analysis, data from the Pascal station, situated approximately 250 m from the UNIMI buildings, were utilized. The meteorological dataset included variables such as atmospheric temperature, wind speed and direction, radiation, and relative humidity. The pollutant concentrations included PM10, PM2.5, NO2, SO2, O3, NOx, ammonia, and equivalent black carbon (eBC, Savadkoohi et al., 2024).
ARPA Lombardia also provided BLH data from the nearby station of Milano Parco Nord. The BLH was estimated using the Gryning-Batchvarova model for the daytime convective boundary layer (Batchvarova and Gryning, 1991) and the Zilitinkevich model for the nocturnal stable boundary layer (Zilitinkevich and Baklanov, 2002). Both models used turbulence variables that were measured by ARPA Lombardia with a triaxial ultrasonic anemometer at the Milano Parco Nord station. The choice of the appropriate model was based on the assessment of the boundary layer stability, determined from the sensible heat flux, also measured by the ultrasonic anemometer at the same site. Briefly, the Gryning-Batchvarova model describes the daytime convective boundary layer using a simplified analytical approach. The profiles of the main variables are schematized considering that, throughout the boundary layer, each variable assumes a constant value equal to its vertical mean, the entrainment layer is considered to be of infinitesimal thickness, and that, at the entrainment layer, there is a characteristic discontinuity for each variable. For the assessment of the stable boundary layer, Zilitinkevich et al. (2007) developed theoretical models considering simple equilibrium regimes in a step-by-step approach. They applied Large Eddy Simulation to validate their theoretical multi-limit BLH formulation, which reduces to known asymptotic limits in the neutral and nocturnal stable regime. Indeed, the stable and neutral BLH evolution is controlled by factors (e.g., baroclinic shear, large-scale vertical velocity at the top of the boundary layer, non-stationarity of the boundary layer and its horizontal heterogeneity) that are difficult to measure and to use for the validation of the theory.
All data were provided with an hourly time resolution. Using these datasets, we calculated the daily ventilation index (VI), which reflects the potential of pollutants to disperse efficiently through proper ventilation. For each day, this index is defined as:
where ws is the wind speed, and BLH is the boundary layer height during that day. In line with ARPA Lombardia guidelines, a VI value of 400 m2 s−1 was used as threshold to identify stagnant days.
2.4 Tools and parameters
2.4.1 Nanoparticle ranking
The NPF occurrence was assessed through the nanoparticle ranking analysis (Aliaga et al., 2023). This method provides an automated, continuous, and objective way of analyzing NPF compared to the manual NPF classification based on the visual inspection of the data and on the identification of a few discrete classes (Dal Maso et al., 2005). The method consists in assessing the intensity and probability of NPF using the change in the concentration of 2.5–5 nm particles during each day. The total concentration of 2.5–5 nm particles from the NAIS, N2.5−5, was used to identify the NPF active and background time windows as described by Aliaga et al. (2023), paying particular attention to minimize the impact of traffic rush hours from the active time period, considering that Milan is an urban site. The active region was defined as between 10 and 16 Central European Time (UTC+1), and the background between 23 and 5 Central European Time (UTC+1). The ranking value (ΔN2.5−5) for day i was, then, calculated as follows:
The ranking values were then ordered according to their magnitude to determine the percentile rank of each day. The percentile rank of each day indicates the proportion of days with lower ΔN2.5−5 than the value of such day. Therefore, the days with a lower percentile rank have lower ΔN2.5−5, indicating weaker NPF than those with higher percentile rank.
2.4.2 Model simulation
The Weather Research and Forecasting (WRF) model (v3.71), a regional meteorological model, was employed in this study. The model was driven by data from the National Centers for Environmental Prediction (NCEP) Climate Forecast System (CFSv2), with a temporal resolution of 6 h and a horizontal resolution of 1°. For the simulation, the WRF model was configured over a domain with a spatial resolution of 18×18 km2 (Fig. S1 in the Supplement) centered on Milan and roughly covering Europe. WRF simulations were performed using the Rapid Radiative Transfer Model radiation scheme (Mlawer et al., 1997), the Thompson aerosol-aware microphysics scheme (Hong et al., 2004), the Monin-Obukhov surface-layer scheme (Janjic, 2003), and the NOAA Land Surface Model scheme (Chen and Dudhia, 2001). The Mellor-Yamada-Janjic turbulent kinetic energy (TKE) scheme (Janjic, 1994) was chosen to assess the boundary layer. WRF simulations were performed on 33 vertical sigma layers. Annual anthropogenic emission fluxes for SO2 and NOx (see for example, the map of NOx emissions in Fig. S2) were retrieved from the CAMS datasets at 0.1×0.1° (around 10 km) horizontal resolution and distributed hourly over the investigated period, with temporal profiles based on the EMEP MSC-W model (Simpson et al., 2012). The FLEXPART (FLEXible PARTicle dispersion) model, a Lagrangian particle dispersion model, was used to simulate particle transport in the backward direction. In this study, we utilized version 3.3.2 of FLEXPART (Brioude et al., 2013) for backward dispersion to identify the source regions of the air masses reaching Milan. The model was driven by the meteorological data generated from the WRF simulation, with input provided at a temporal resolution of 15 min. The FLEXPART domain was aligned with the resolution and extent of the WRF domain. The vertical structure of the domain included 12 levels, spanning from ground level to an altitude of 9000 m. To conduct the simulation, 10 000 particles were released every hour from Milan over the period between 1 April 2023, and 31 March 2024. These particles, treated as passive tracers, were emitted from an altitude between 0 to 100 m above ground level within an 18×18 km2 area centered on the city. Their trajectories were traced backward in time for up to 72 h. The backward-mode output from FLEXPART provided the source-receptor relationship (SRR), expressed in units of s, which represents the relative residence time of the particles within each grid cell, offering insights into the contribution of specific regions to the air masses arriving in Milan.
2.4.3 Condensation sink
The condensation sink (CS) refers to the rate at which vapors condense onto pre-existing particles in the atmosphere. The CS is influenced by the diffusivity of the condensing molecules, the size distribution of the particles, and the environmental conditions (Kulmala et al., 2012). It is estimated as:
where D is the diffusion coefficient of the condensing vapor in the air (sulfuric acid was assumed), dp′ the particle diameter, and the concentration of particles with diameter dp′. βm was calculated using the Fuchs-Sutugin approximation (Fuchs and Sutugin, 1971). The CS was calculated only when both NAIS and SMPS data were available, using the original data without making assumptions about water. This introduces some uncertainty in the CS values as the NAIS measured a wet flow while the SMPS one was dried.
2.4.4 Formation rate
The formation rate (J) refers to the rate at which new particles appear in a given size range due to nucleation, growth into that size range, or emissions. If the selected size is small enough, it can be assumed that NPF is the main process forming new particles, although the contribution of traffic emissions cannot be excluded in urban environments (Rönkkö et al., 2017). J1.5, J3, and J7 were calculated according to the following definition (Kulmala et al., 2012) for the days with a complete size distribution:
where is the coagulation sink at size dp, GR is the growth rate and is the particle number concentration at size dp. Particle number concentrations in the 1.5–3, 3–7, and 7–20 nm size ranges were used to calculate J1.5, J3, and J7, respectively.
The coagulation sink is the rate at which particles are lost due to coagulation with pre-existing particles (Kulmala et al., 2012):
where is the coagulation coefficient between particles of diameter dp and .
The growth rate (GR) indicates the rate at which particles increase in size over time. Considering the limited variability of its values (Kulmala et al., 2022), the GR was estimated using the daily median size distribution surface plot calculated over all days with NPF rank above the 80th percentile. The GR was computed for the size ranges of 3–7, 7–20, and 20–100 nm with the maximum concentration method (Kulmala et al., 2012) to evaluate J1.5, J3, and J7, respectively (Kerminen et al., 2018). The GR values were calculated using a size interval around the upper limit of the one used for the J calculation, in order to estimate the growth out of the size bin.
The uncertainty associated with this method for the estimation of GR and J is discussed in the Supplement.
2.4.5 Sulfuric acid proxy calculation
A proxy for sulfuric acid concentration was calculated using the approach described by Dada et al. (2020). The equation for the concentration of sulfuric acid in an urban site was used (Dada et al., 2020):
where [SO2] is the SO2 concentration, GlobRad is the global radiation, and CS is the condensation sink.
2.4.6 Air mass exposure
To investigate the impact of the air masses on NPF, we adapted the air mass exposure (AME) methodology originally proposed by Hakala et al. (2022). In their method, AME calculations combined FLEXPART output with static two-dimensional fields to identify when air masses were exposed to different pollutant emissions.
In this study, we modified the AME calculation by incorporating FLEXPART output with three-dimensional emissions (calculated as mentioned in Sect. 2.4.2), including temporal variations, following the approach used by Bettineschi et al. (2025). For each particle release event, we computed the AME for a specific pollutant or substance x (denoted as AMEx) using emission data for that substance derived from the emission model (emiSURF) output. This approach allowed us to account for the temporal variability of emissions within air masses, enabling a more precise evaluation of the exposure of air masses to pollutant emissions. Given a domain Ω, containing time (t), height (h), longitude (x) and latitude (y) as coordinates, and a release time (τ), the AMEx for a specific τ is calculated according to the following equation:
2.4.7 Air mass trajectories description
To clearly visualize the origin of the air masses, the trajectory density was defined as the absolute difference between the percentage of trajectories passing over each grid cell, regardless of their height, and arriving in Milan on days with NPF rank above the 80th percentile, and the percentage of all trajectories passing over the same area:
Specifically,
where T80 is the set of releases arriving when the percentile rank is larger than 80, N80 is the total number of these releases, Ntot is the total number of releases and, assumes 1 or 0 values as follows:
This means that if, for a given release, at least one of the 10 000 released particles passed through the point (x,y) during the previous 72 h.
3.1 Size distributions characterization
The particle number size distributions in Milan exhibited a clear seasonal cycle, which is illustrated in Fig. 5a and b through the daily median size distribution surface plot per season and the median size distribution per season, respectively. The months of December, January, and February were included in winter; March, April, and May in spring; June, July, and August in summer; September, October, and November in autumn.
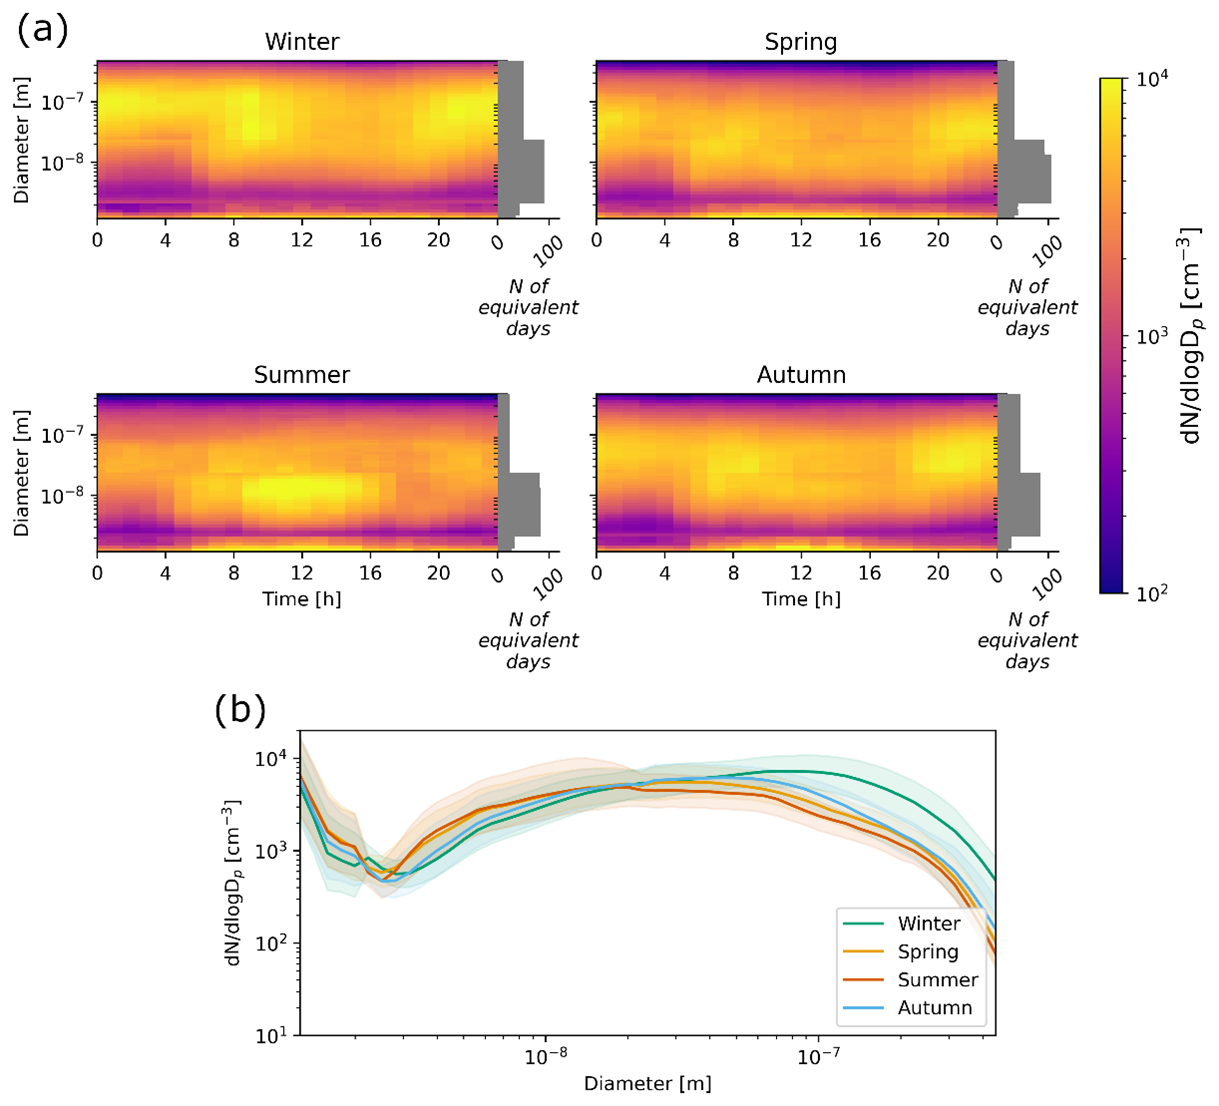
Figure 5(a) Daily median particle number size distribution surface plot per season. The bar plots report the number of equivalent days used to calculate the medians, computed as the total number of 15-minute data points divided by 96 (the number of 15-minute intervals in one day). Times are in Central European Time, UTC+1; (b) median particle number size distribution per season. The shaded areas represent the interquartile ranges.
During winter, the highest concentrations of particles larger than 50 nm were observed (Fig. 5b). This increase was probably the result of both a decrease in the BLH and an increase in biomass burning emissions (Colombi et al., 2023). Moreover, the typical traffic-related pattern was evident, with marked increases across all particle size ranges starting from 05:00 and 17:00 Central European Time, UTC+1 (Fig. 5a), coinciding with the morning and evening rush hours.
In spring, and particularly in summer, these traffic-related peaks became less pronounced, suggesting an increase in the atmospheric mixing. Additionally, the data revealed a clear midday increase in sub-10 nm particles (Fig. 5a), which was most likely associated with NPF events. This phenomenon, which became more pronounced in the warmer months, was driven by photochemical reactions, enhanced by higher solar radiation and it was, therefore, mostly observed during spring and summer. During summer, we observed the most significant increase in sub-10 nm particle number concentrations, alongside the lowest levels of particles larger than 100 nm (Fig. 5b).
In autumn, the traffic-related peaks reappeared (Fig. 5a) due to the combined effect of the increase in traffic emissions (Colombi et al., 2023) and the decrease in atmospheric dispersion and BLH, becoming again a more dominant factor influencing particle number concentrations. However, the median concentrations across all particle sizes during autumn remained similar to those observed in spring, indicating a seasonal transition towards winter. Overall, though, considering the discontinuities in the data collection (Fig. 2) and the definition of each season, these conclusions may not be representative of each entire season and their comparison has intrinsic uncertainties.
The shape and values of the median size distributions in Fig. 5b are in agreement with those reported for other urban background sites of southern, central, and eastern Europe (Trechera et al., 2023). The comparison between the characteristics of the size distribution surface plots per season (Fig. 5a) in Milan and other urban background sites (Trechera et al., 2023) also does not point out any anomaly. As observed in Milan, several other urban background sites across Europe showed a more pronounced increase in sub-25 nm particles at midday during the warmer months. Higher concentrations in the same size range due to traffic rush hours were also recorded in all urban background sites (Trechera et al., 2023).
Other than this qualitative comparison, a quantitative one was also performed, and the concentrations in the nucleation, Aitken, and accumulation modes measured in Milan were compared with the values reported for other European cities. The average number concentrations for particles in the 10–25, 25–100, and 100–480 nm size ranges were 2642, 4080, and 1819 cm−3, respectively. Regarding the accumulation mode, Milan fell within the typical southern European cities, characterized by high concentrations of particles in this size range. The Aitken mode in Milan exhibited a lower average concentration compared to other southern European cities (4800–5900 cm−3), but lay at the upper end of the range reported for central European cities, characterized by intermediate concentrations in this mode. Finally, intermediate concentration values were recorded in the nucleation mode in Milan. This comparison, though, should be interpreted with caution as it may be affected by several uncertainties. In fact, while the data presented by Trechera et al. (2023) refer to the years 2017–2019, the data presented in this study cover a single year (2023–2024), characterized by several gaps in the data availability, affecting especially the calculations in the Aitken and accumulation modes. Moreover, differences in the instruments cut-off diameters may further bias this comparison.
The ratio between the average particle number concentration in the nucleation mode (N10−25) and eBC was used to qualitatively assess the relative contributions of primary and secondary emissions in Milan compared to other European urban background sites. Milan exhibited an intermediate-low N ratio (∼1444 cm−3 µg−1 m3), within the approximate range of 900–4500 calculated for other cities (Trechera et al., 2023). This suggests that primary emissions (traffic) dominated the nucleation mode particles in Milan, whereas in other European sites, photochemistry played a more significant role.
3.2 NPF analysis
The nanoparticle ranking analysis was applied to characterize NPF. At higher percentile ranks, a midday increase in particle number concentration across all size ranges became clear, indicating NPF (Fig. 6). The process was marked by an initial rise in 1.2 nm particle number concentration, followed by an increase in the concentration of larger particles. This pattern indicates that NPF occurred over a wide area, including Milan itself. At lower percentile ranks, higher concentrations associated with traffic rush hours were evident, but they gradually faded at higher percentile ranks (Fig. 6, panels a to e). This pattern aligned with the seasonal variations in particle size distributions and NPF (Figs. S4, 5a). In fact, lower ranking values ΔN2.5−5, corresponding to weaker NPF, were more frequent during winter (December to February, Fig. S4), when traffic peaks were also more evident (Fig. 5a). Conversely, the strongest NPF events were observed in April and mid-to-high rank values (percentile ranks between 60 and 80) occurred predominantly between June and August (Fig. S4), when stronger atmospheric dispersion minimized the concentration of traffic-related peaks (Fig. 5a).
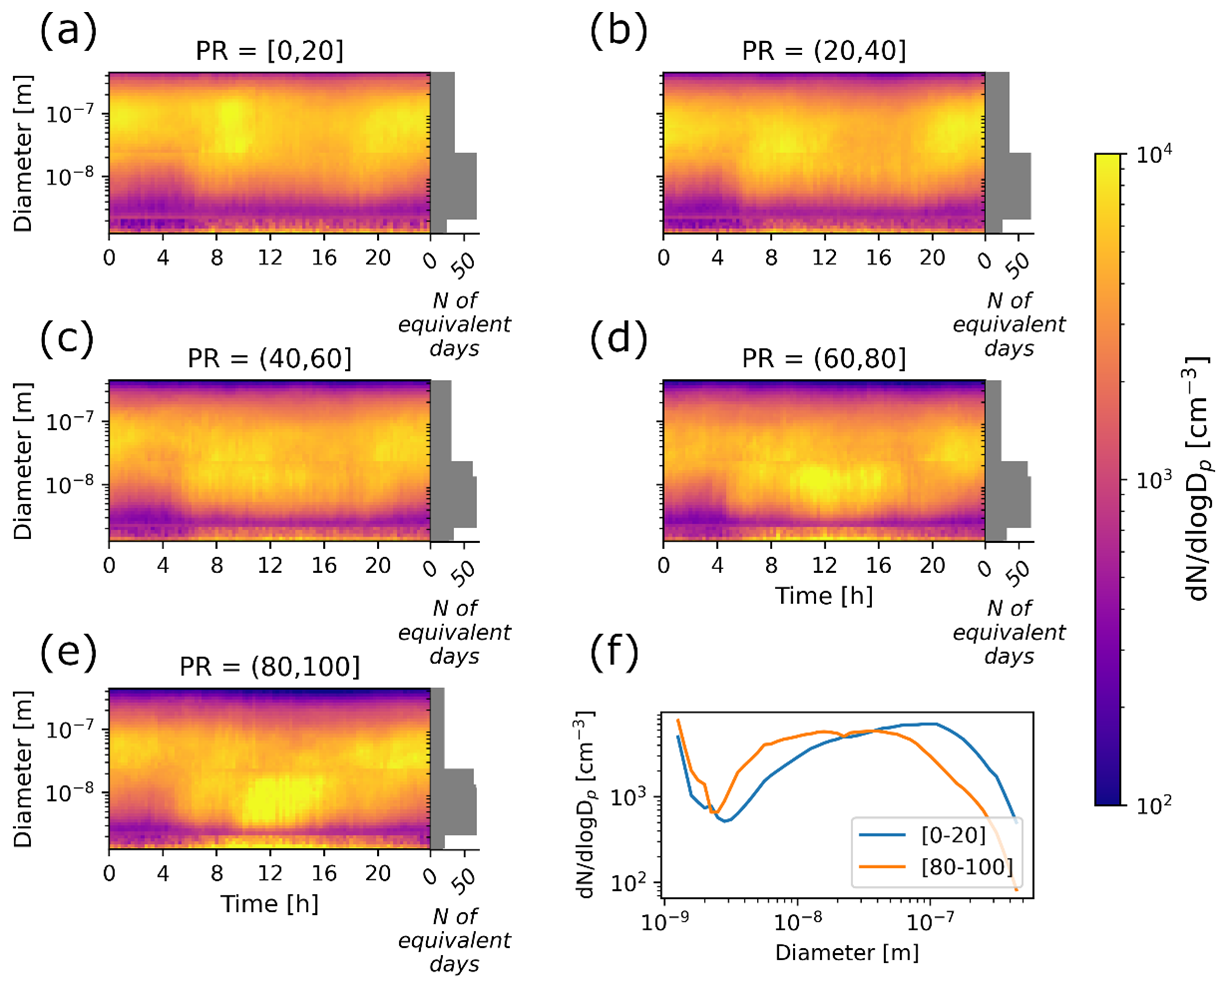
Figure 6Daily median particle number size distribution surface plots, grouped into 20-percentile intervals of NPF rank (PR; panels a–e). The bar plots indicate the number of equivalent days used to calculate the medians. For the definition of equivalent days, see Fig. 5. Times are in Central European Time, UTC+ 1. Panel (f) shows the median size distributions for days with NPF rank below the 20th percentile and above the 80th percentile.
Our analysis demonstrates that NPF significantly contributed to the UFP number concentration through a growth process that lasted for several hours. As shown in Fig. 7, the concentration of sub-2.5 nm particles increased first around 07:00, followed sequentially by that of 2.5–5, 5–10, and 10–25 nm particles, reflecting a well-defined growth pattern in increasing size order. Accurately distinguishing the contribution of NPF from that of primary emissions is crucial for a proper interpretation of these patterns.
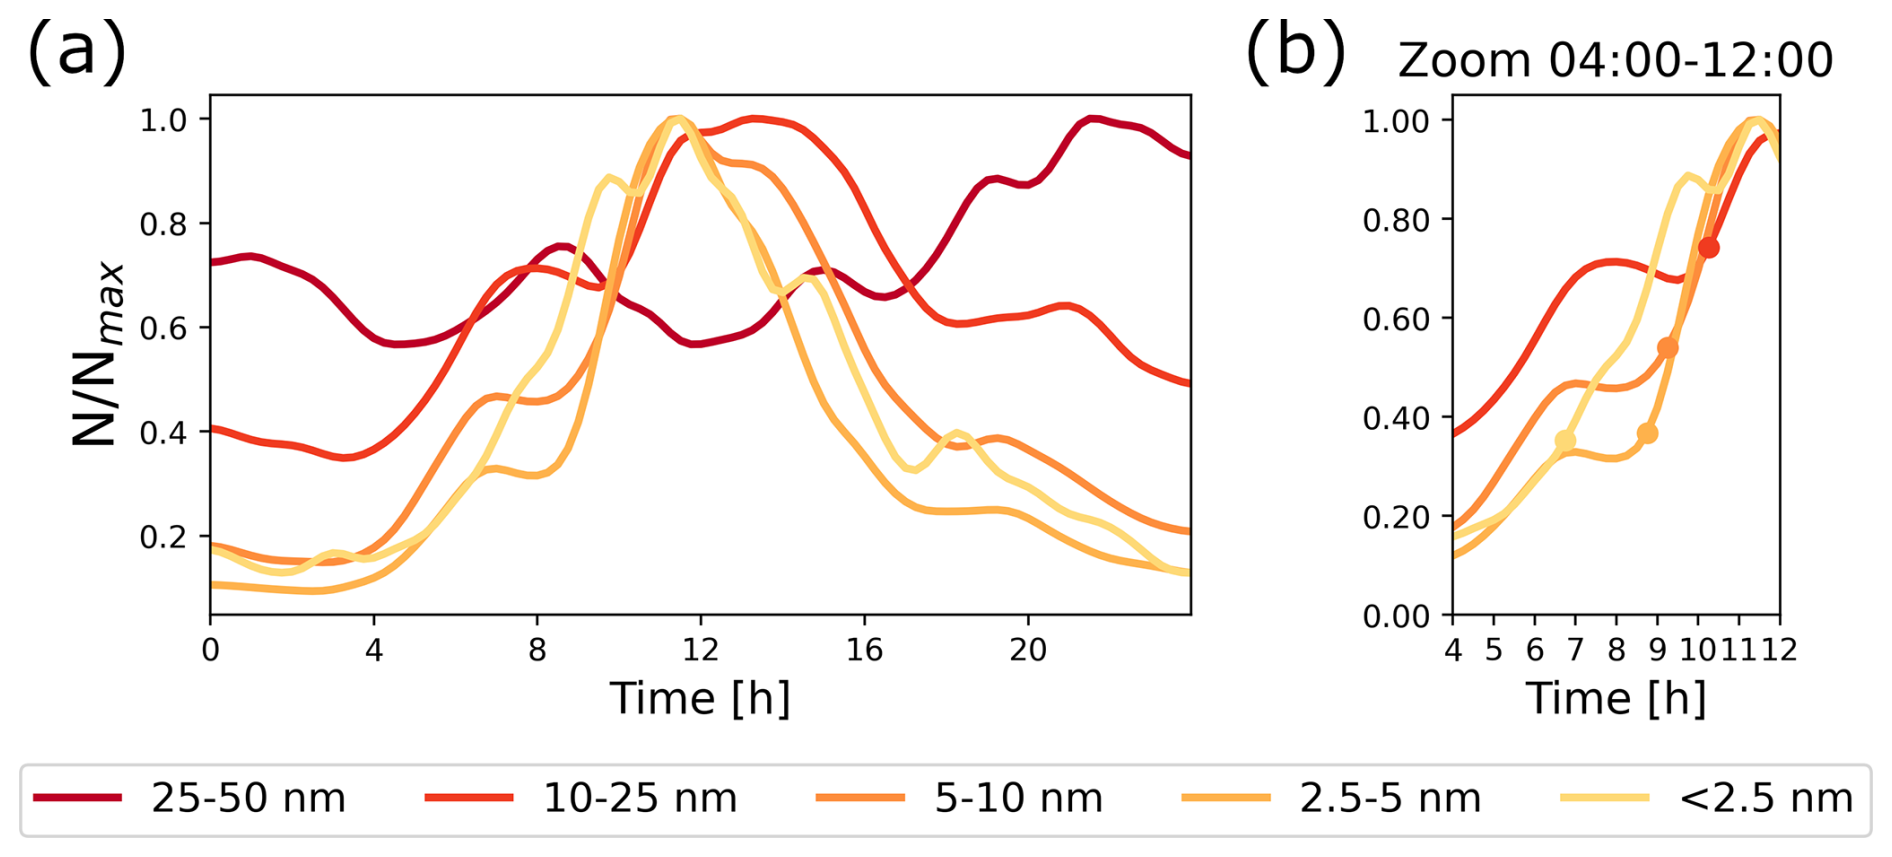
Figure 7(a) The lines represent the median total concentration of particles in different size bins (<2.5, 2.5–5, 5–10, 10–25, 25–50 nm), calculated including the days above the 80th percentile of NPF rank. Each line is normalized to its own maximum value and smoothed through a one-dimensional Gaussian filter with a standard deviation of σ=2 samples; (b) zoom of the time interval between 4 and 12. The dots represent the first point where the derivative of the curve was larger than 0.03 and they mark the beginning of the growth for each curve. The value 0.03 was chosen empirically.
GR were calculated as described in Sect. 2.4.4. The values of 1.8, 2.9, and 9.7 nm h−1 were found for the GR in the size ranges of 3–7, 7–20, and 20–100 nm, respectively. The formation rates J1.5, J3, and J7 are presented in Fig. 8. While J3 correlated with percentile ranks – indicating higher production of 3 nm particles (higher J3) during stronger NPF days (higher percentile rank) – J1.5 remained relatively constant across most ranks. This suggests that clustering, which formed 1.5 nm particles, occurred at the site, but only under certain conditions the particle growth was observed (Kulmala et al., 2013). J1.5 reached higher values only in the 80–100 rank bin, suggesting that clustering was more efficient during strong NPF days. Lastly, J7 did not show a clear increasing trend and was often higher than J3, likely due to the influence of traffic in this size range. This is supported by Fig. 5a, where morning traffic peaks are clearly visible in the 5–10 nm size range. The ratio between J7 and J3 suggests that, for days with rank below the 80th percentile, traffic was a stronger source of particles larger than 7 nm than NPF. During high-rank days (80–100th percentile), when NPF events were stronger, a marked increase in J7 would have been expected as result of a dominant contribution from NPF. However, such an increase was not clearly observed, implying that traffic may have remained the dominant contributor to particles larger than 7 nm even during the most intense NPF days. This result agrees with the discussion in Sect. 3.1 about the relevant role of traffic compared to photochemistry in Milan in the 10–25 nm size range. As mentioned in Sect. 2.4.4, formation rates were calculated only for the days when all the instruments were measuring simultaneously and, therefore, the data availability shown in Fig. 2 should be taken into account when interpreting Fig. 8.
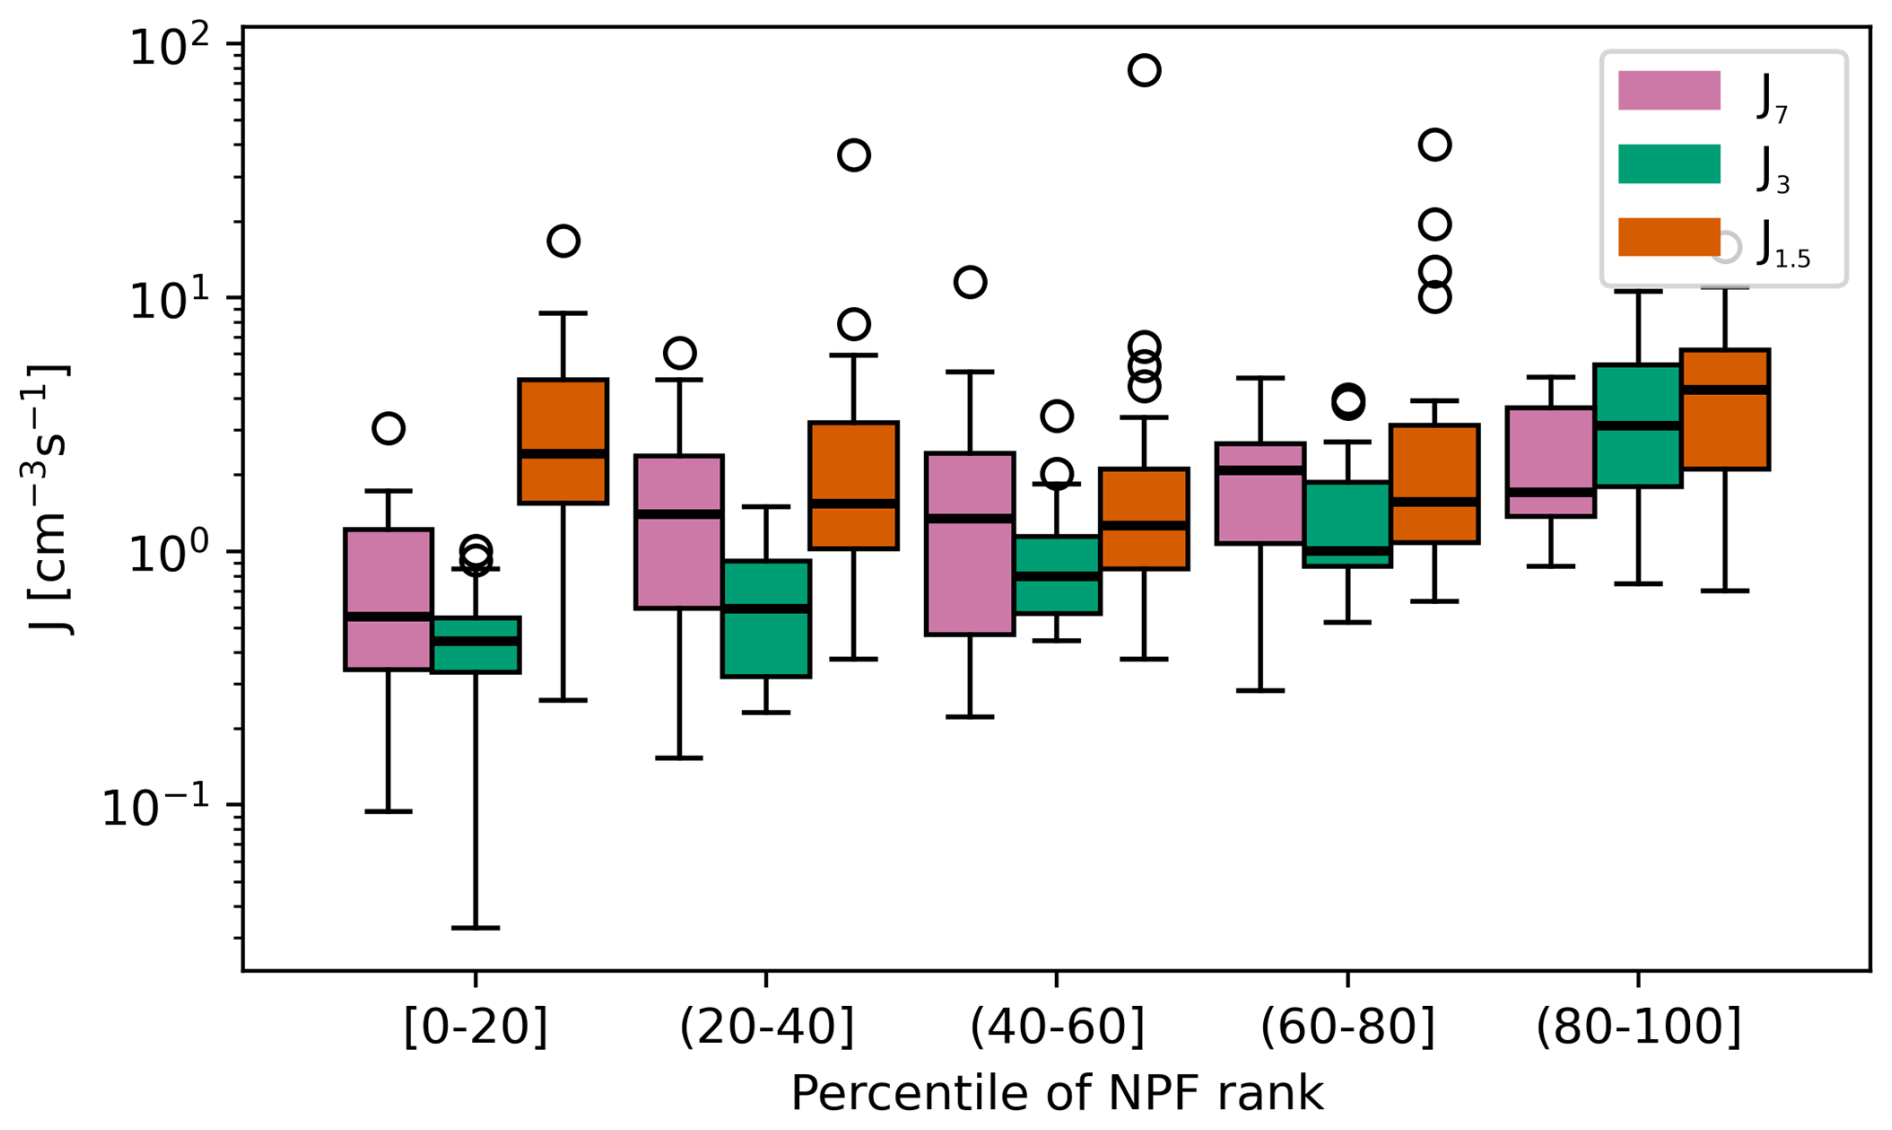
Figure 8Maximum J1.5, J3, and J7 during the active window, per rank class. For the boxplot description, refer to Fig. 4b.
The nanoparticle ranking method allows a continuous analysis of the NPF process in relation to meteorological and dispersion variables and pollutant concentrations. To understand which parameters affected the process, the atmospheric conditions within each bin of 20-percentile of NPF rank were compared. Figure 9 illustrates the relations between CS and ventilation index VI, defined in Eq. (1), and rank as an example. Higher CS corresponded to low-rank days, while a high VI corresponded to high-rank days. NO2, NOx, eBC, SO2, PM10, and PM2.5 concentrations reported the same trend as CS, while BLH behaved as the ventilation index (Figs. S5, S6, and S7). Therefore, enhanced NPF was, on average, associated with cleaner air conditions and stronger atmospheric mixing. In particular, intermediate-strong NPF (percentile rank >60) happened mostly during non-stagnant days and when the CS was relatively low (<0.007 s−1 on average). As reported in Sect. 2.4.3, the CS was calculated only for the days when both the SMPS and NAIS provided good data availability. As a result, the CS time series contains several gaps (Fig. 2), which affect Fig. 9a.
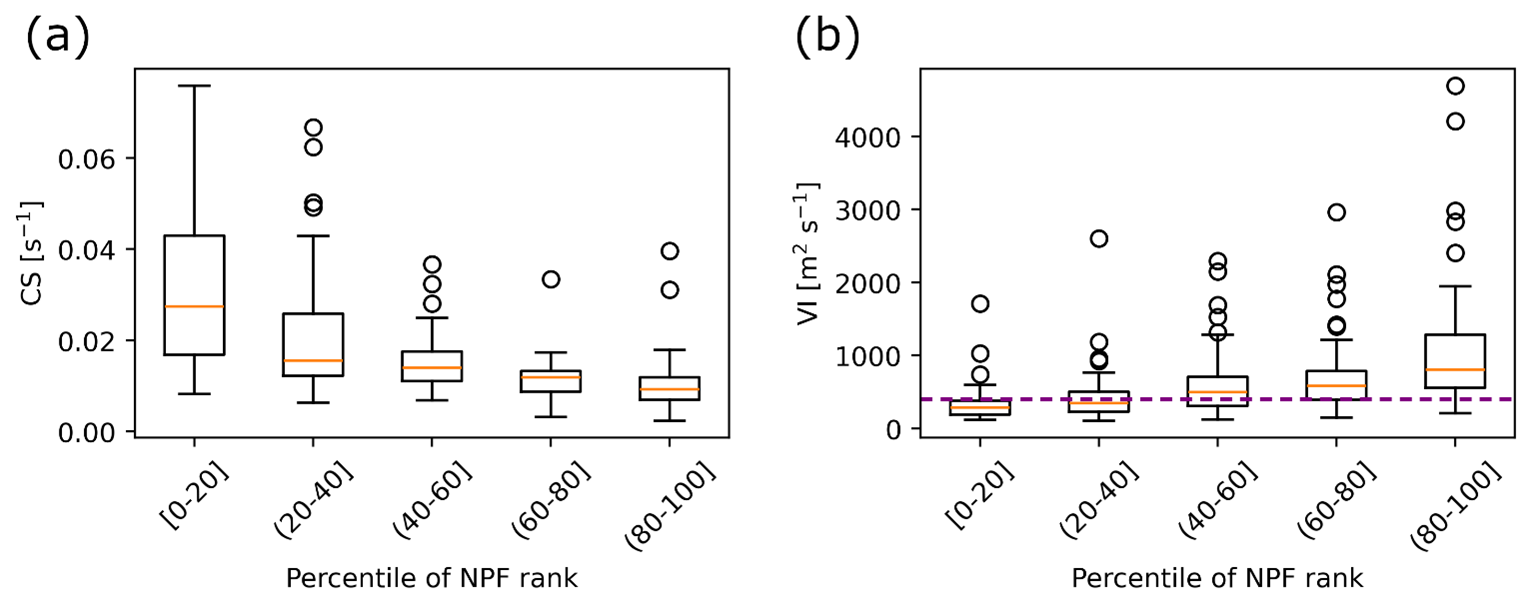
Figure 9(a) Median CS calculated over the active time window of each day and (b) daily ventilation index (VI) per rank class. The purple dotted line represents the threshold of VI = 400 m2 s−1 for stagnant days. For the explanation of the boxplots, refer to Fig. 4b.
Our data allowed a comparison between the environmental conditions and NPF in Milan and in other urban locations. In Milan, the CS varied between 0.01 s−1 (during strong NPF events, Fig. 9a) and 0.03 s−1 (during weak NPF events, Fig. 9a), which is comparable to the values observed in Shanghai (CS between 0.01 and 0.02 s−1 on average; Yao et al., 2018). However, while the particle formation rate at 1.5 nm (J1.5) in Milan remained below 102 cm−3 s−1 (averaging around 101 cm−3 s−1), it reached up to 103 cm−3 s−1 in Shanghai (Yao et al., 2018). This is likely due to differences in the precursor vapor concentrations and atmospheric conditions. However, without precursor vapor measurements in Milan, this hypothesis remains uncertain. GR also differed between the two cities. In Shanghai, the GR was approximately 6 nm h−1 for 3–7 nm particles and 9 nm h−1 for 7–25 nm particles (Yao et al., 2018), whereas in Milan, the values were significantly lower, specifically, 1.8 and 2.9 nm h−1 for 3–7 and 7–20 nm particles, respectively. A similar relation was observed in Nanjing, where both recorded GR and J were higher than in Milan. For example, the average J3 in Nanjing ranged between 7.4 and 13.9 cm−3 s−1, while the GR of 10 nm particles was between 13.4 and 14.5 nm h−1, depending on the type of event (Dai et al., 2023).
NPF has also been extensively studied in European cities. In Barcelona, for instance, Brean et al. (2020) reported an average GR of 4.69 and 4.36 nm h−1 for 4.5 and 1.9 nm particles, respectively. The CS in Barcelona was lower during NPF event days compared to non-event days, but it remained below 0.02 s−1 in both cases, slightly lower than the values recorded in Milan. When comparing formation rates, Milan exhibited weaker NPF. While J1.9 in Barcelona frequently fell between 10 and 103 cm−3 s−1 (Brean et al., 2020), J1.5 in Milan was mostly limited to the range of 1 to 10 cm−3 s−1, indicating a lower particle formation intensity. In Budapest, the GR of 6 nm particles was 7.7 nm h−1 on average, while J6 was 4.2 cm−3 s−1, higher than what was observed in Milan in both cases. The CS in Budapest was lower than in Milan during non-event days but in line with Milan values during NPF event days (Salma et al., 2011). Finally, the study by Bousiotis et al. (2021) compared size distributions and NPF characteristics in several urban sites across Europe (Denmark, Germany, Spain, Finland, and Greece), distinguishing urban background and roadside sites. Reported J10 were higher in roadside sites, but overall lower than what was observed in Milan. On average, they remained below 0.1 cm−3 s−1 in all sites, except for German roadside sites, where the average J10 was higher but still below 0.2 cm−3 s−1. The reasons for these differences may partially reside in the differences across sites, but they are not clear. GR for 10 nm particles was, on average, between 2 and 5 nm h−1, in line with the value found in Milan for that of 7 nm particles (2.9 nm h−1).
If we compare our results to previous studies in the rural areas of the Po Valley, it is clear that lower J1.5 were observed in Milan. Cai et al. (2024) observed an average J1.7 of 102 cm−3 s−1 in San Pietro Capofiume during NPF days, which was significantly higher than what was found in Milano (J1.5 was about 3 cm−3 s−1). However, the values for J3 and J7 were more similar. GR were also higher than in Milan (around 4 nm h−1 for 3–7 nm particles and around 5 nm h−1 for 7–15 nm particles). The recorded CS was below 0.01 s−1 during both NPF and non-NPF and therefore lower than in Milan, where NPF is possibly more suppressed than in the rural areas.
When comparing all the results, though, it is critical to take into consideration the possible differences in the methodologies for estimating the formation and growth rates, including the slightly different size ranges used in different studies, which contribute to the uncertainty of the comparisons.
3.3 Air mass analysis in relation to NPF
The analysis of NPF in relation to the meteorological conditions pointed out that strong wind from northwest was a favorable condition for NPF at this site (Fig. 10). In order to explore further such relation and the characteristics of the air masses that favor the formation of new particles, the Lagrangian particle dispersion model FLEXPART, driven by the meteorological output from WRF simulations, was applied to identify the eventual preferential air mass direction for NPF and its characteristics.
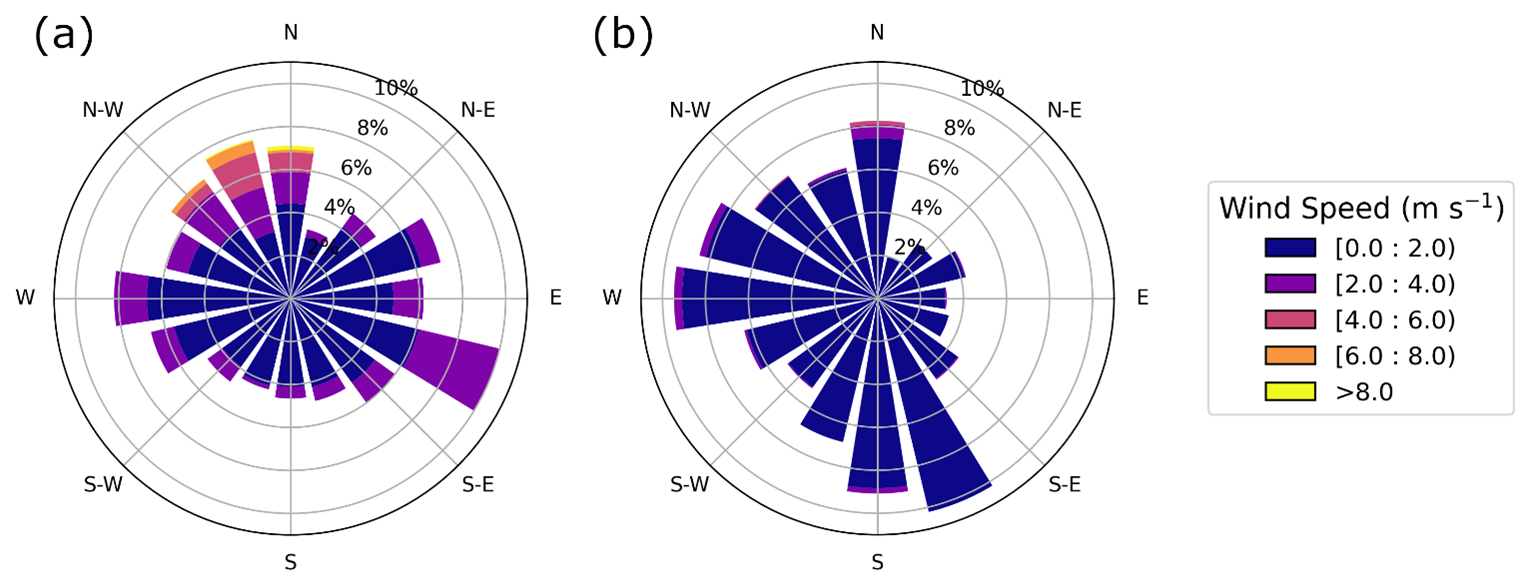
Figure 10Wind rose for (a) strong NPF days (percentile rank >80) and for (b) weak NPF days (percentile rank <20).
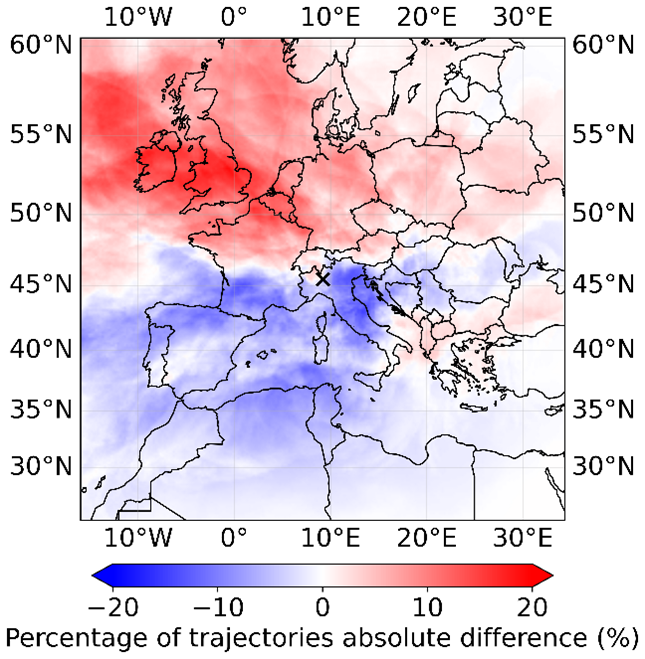
Figure 11Air masses reaching the measurement site. The color scale represents the difference between the percentage of trajectories passing over a given area and reaching Milan during a day with a percentile rank >80 and the percentage of the total trajectories passing over a given area. The details of the metric are reported in Sect. 2.4.7. An x marks the location of Milan on the map.
The air mass trajectory density, calculated as described in Eq. (8), emphasizes that north, particularly northwest, was the preferred direction for NPF (Fig. 11). An east-west axis distinctly separated the north and south sectors: air masses arriving in Milan from the north promoted NPF, while those from the south hindered it.
Focusing on the Po Valley only (Fig. 12), it is clear that a lower air mass residence time in the area produced stronger NPF. This agrees with both the anticorrelation between NPF rank and wind speed and with the anticorrelation between NPF rank and pollutant concentrations, as the Po Valley is rich in emission sources. Lower exposure to anthropogenic emissions enhanced NPF in this location, as shown in Fig. 13. Lower air mass exposure to NOx and SO2 emissions was associated with higher concentration of small (sub-2.5 nm) particles, to a broader cluster band, extending to 2.5 nm, and to a smaller accumulation mode. On the other hand, at higher NOx and SO2 air mass exposure, the cluster particles remained smaller (up to ∼1.5 nm) and had lower concentrations. Furthermore, the accumulation mode reached larger sizes. Overall, these observations indicate that lower air mass exposure to anthropogenic emissions favored the formation of new particles. The air mass exposure to both NOx and SO2 emissions anticorrelated with the median ventilation index, which decreased at increasing air mass exposure, supporting the role of atmospheric ventilation (Fig. 13). Considering the data availability described in Fig. 2, the number of data points used in the calculation of the average concentrations shown in Fig. 13 may vary depending on the diameter.
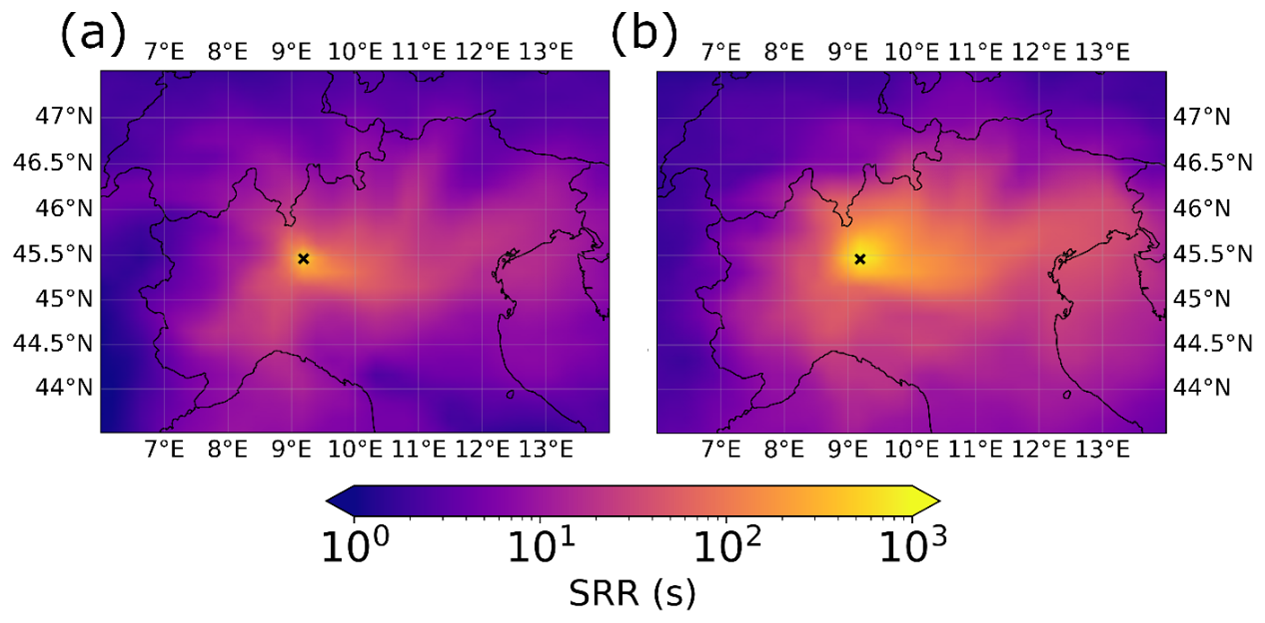
Figure 12Source-receptor relationship (SRR) below 500 m during (a) strong NPF days (percentile rank >80) and during (b) weak NPF days (percentile rank <20). The x marks indicate the study site.
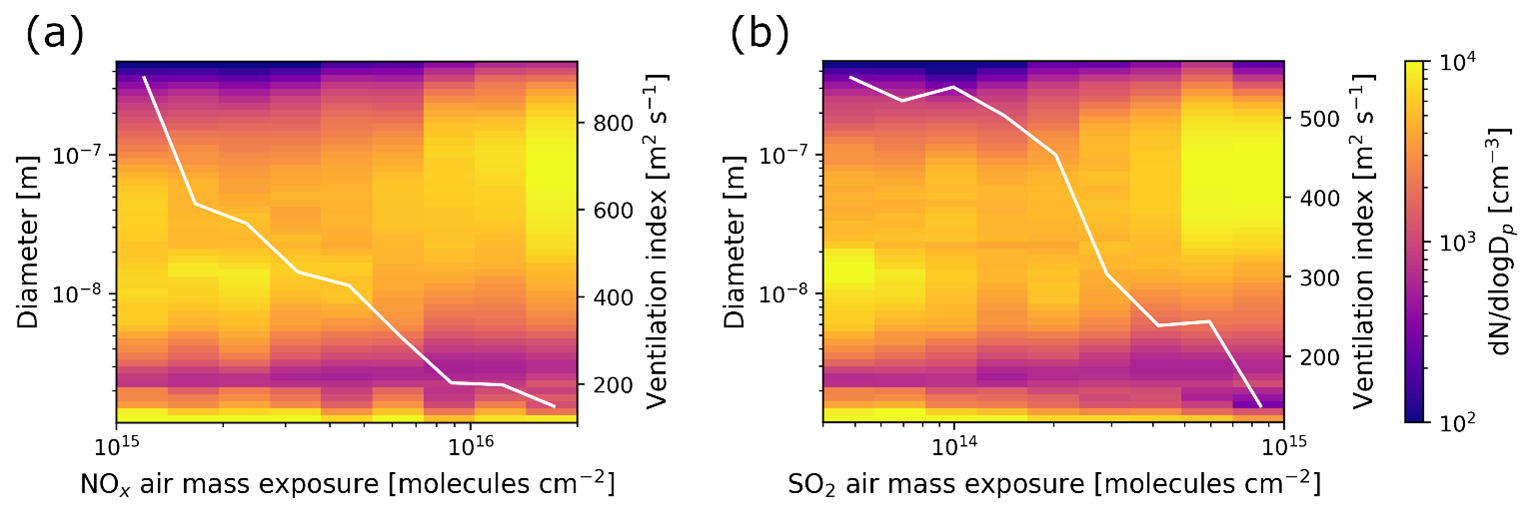
Figure 13Relation between (a) air mass exposure to NOx emissions and particle number size distribution and (b) air mass exposure to SO2 emissions and particle number size distribution. The white lines represent the median ventilation index.
3.4 Sulfuric acid proxy analysis
The role of sulfuric acid, which has been identified in previous studies as a critical precursor vapor in the Po Valley (Cai et al., 2024), was investigated through its proxy, calculated as described in Sect. 2.4.5. The sulfuric acid proxy exhibited an increasing trend with the percentile of NPF rank (Fig. 14a), suggesting its potential contribution to the NPF process. No clear correlation between sulfuric acid and SO2 concentrations was observed (Fig. 14b), indicating that SO2 was not a limiting factor for sulfuric acid formation in Milan. On the other hand, sulfuric acid showed a clear increase with radiation (Fig. 14b and more clearly, Fig. S8), hinting at the role of photochemical processes for its formation rather than SO2 availability or a sink effect. Indeed, while on average, a higher sulfuric acid proxy was recorded in correspondence with lower CS (Fig. S8), several cases with low CS and low sulfuric acid were observed and were linked to low radiation. The relative roles of CS and sulfuric acid in NPF were then investigated using the concentration of 2.5–5 nm particles as a proxy for NPF intensity (Sect. 2.4.1). Figure 14c clearly presents an inverse correlation between N2.5−5 and CS, indicating the relevant role of the CS in inhibiting the NPF mechanism. On average, higher concentrations of sulfuric acid proxy were associated with stronger NPF (Fig. 14a and c). However, given the large variability in the trend, its role is less clear. The gaps in the CS time series due to the limited SMPS data coverage are reflected into the SA proxy time series and may affect Fig. 14.
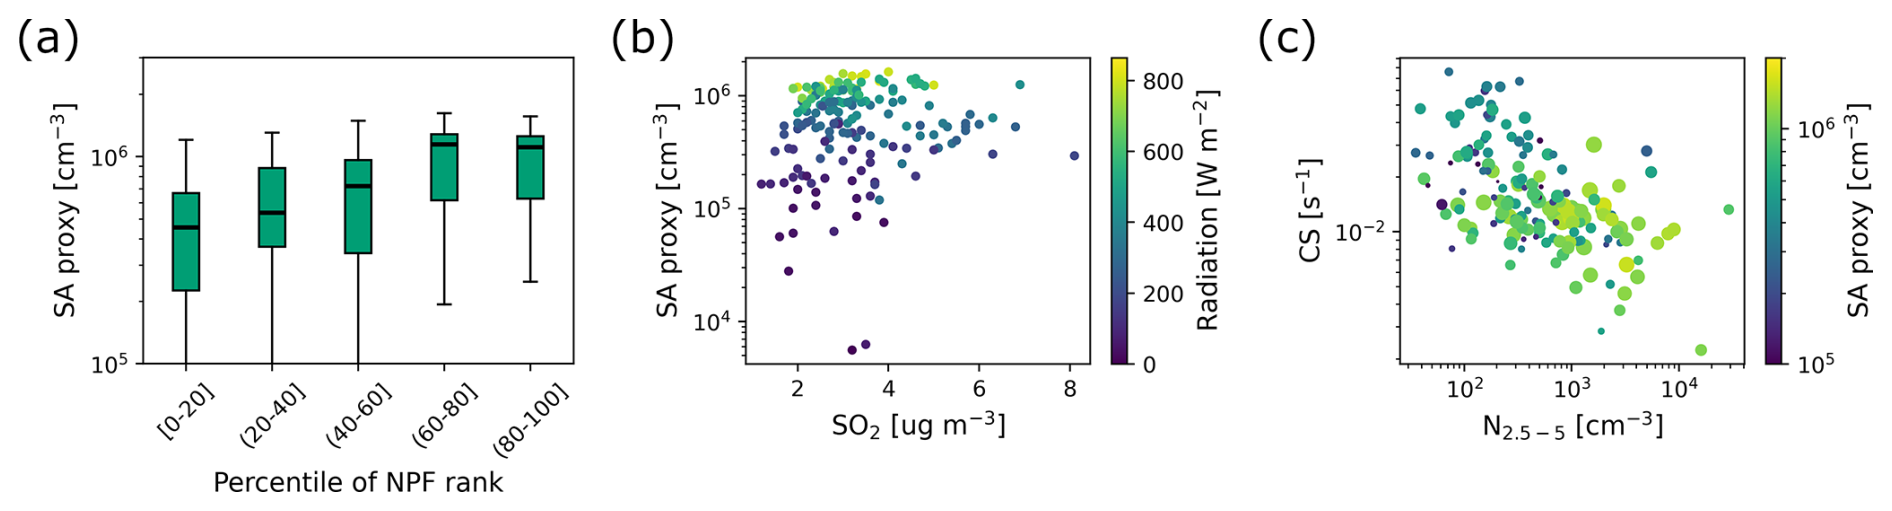
Figure 14(a) Sulfuric acid (SA) proxy daily median calculated over the active time window per rank class. For the description of the boxplots, refer to Fig. 4b; (b) relation between sulfuric acid (SA) proxy, SO2 concentration, and radiation; (c) relation between CS, sulfuric acid (SA) proxy, and N2.5−5, representing NPF intensity as explained in Sect. 2.4.1. The size of the dots represents the radiation. For both panels (b) and (c), each point is the daily median calculated over the active time window.
3.5 NPF drivers in different atmospheric regimes
The results described so far were obtained using the entire dataset regardless of the environmental conditions. However, treating different atmospheric regimes, such as ventilated and stagnant conditions or different seasons together may create biases in the interpretation of the drivers of NPF and hide potentially relevant patterns. To evaluate the robustness of our conclusions in different regimes, we performed an additional stratified analysis separating stagnant and non-stagnant conditions and different seasons (see Supplement) and applying the nanoparticle ranking analysis on each subset. The two analyses (seasons and stagnant/non-stagnant) were performed separately, and the stratifications were not combined due to the limited amount of data.
Despite the differences in background conditions, the main conclusions did not change when analyzing separately stagnant and non-stagnant periods. CS values were generally higher under stagnant conditions compared to non-stagnant ones; however, in both regimes, the CS decreased with increasing NPF rank, indicating that stronger NPF preferentially occurred under lower CS conditions, independently of the level of stagnation (Fig. S9a). SO2 concentrations showed a less clear behavior and did not appear to limit NPF both under stagnant and non-stagnant conditions (Fig. S9b). Sulfuric acid proxy and J3 increased with NPF rank in both regimes (Fig. S9c, d).
Considering that seasonality may have still introduced some bias in the interpretation of these results (Table S1), a separate study for each season was performed. Seasonal stratification revealed higher CS values in winter compared to the other seasons. In winter and autumn, the CS clearly decreased with increasing NPF rank, while this relation was weaker in spring and summer (Fig. S11a). J3 was more difficult to interpret on a seasonal basis, particularly in summer, due to the limited data availability. Nevertheless, J3 generally increased with NPF rank in all seasons, consistently with the results from the non-stratified dataset (Fig. S11e). SO2 concentrations were generally higher in winter than in the other seasons due to the enhanced emissions and the weaker dispersion conditions. In winter, SO2 showed a decreasing trend with increasing NPF rank (Fig. S11c), in agreement with the opposite relation between NPF rank and SO2 observed in the non-stratified analysis. In spring, summer, and autumn, SO2 concentrations were lower and did not exhibit a clear trend with NPF rank. Similar SO2 levels associated with both weak and strong NPF events suggest that SO2 availability was not a limiting factor for NPF intensity during these seasons. The sulfuric acid proxy did not show a clear relation with NPF rank in most seasons, except for autumn, when an increasing trend was observed (Fig. S11d).
The analysis of NPF after stratifying different atmospheric conditions does not contradict the results obtained with the entire dataset. However, drawing conclusions may be misleading. In fact, the stratification led to a low amount of data per class, reducing the reliability of the results. Furthermore, the NPF intensities in the different groups (seasons, stagnant and non-stagnant) may not be comparable, considering that the nanoparticle ranking was applied separately on each subset (Fig. S10). To assess this, the concentration of 2.5–5 nm particles was also used as proxy for NPF intensity other than the percentile rank (Fig. S11f, g). A larger dataset would allow a more in-depth analysis of how different regimes may affect NPF and of the main drivers of this process in various atmospheric conditions.
3.6 Case study
In this section, we present an example of NPF day, featuring the characteristics discussed so far (lower CS and eBC concentration, higher BLH, and lower exposure to anthropogenic emissions). Specifically, we focus on 17 November 2023, a day that fell within the 80–100 class of percentile rank (Fig. 15). On this day, local clustering led to an increase in the concentration of sub-3 nm particles starting at 8 am (UTC+1), followed by a subsequent rise in the concentration of particles up to 100 nm in diameter (Fig. 15a), indicating condensational growth. These phenomena were observed in correspondence with a decrease in CS, in eBC concentration, and in air mass exposure to NOx emissions, as well as an increase in wind speed and BLH (Fig. 15a), suggesting strong atmospheric mixing. Additionally, the air mass trajectory analysis revealed a dominant flow from northwest (Fig. 15b). Oppositely to the average results, SO2 concentration showed a sharp increase as the event began.
On this day, the phenomenon driving the free tropospheric air masses advection and atmospheric clearing was the Foehn wind, a warm, dry wind descending from the Alps, which brings clear skies and higher temperatures compared to seasonal averages, together with exceptionally low pollutant concentrations in the Po Valley. Specifically, on 17 November 2023, the Foehn wind was identified by the decrease in relative humidity, the daytime median temperature of 17.2 °C (above the daily monthly average of 11.8 °C), and the smooth radiation trend, indicating the absence of cloud cover. The air mass trajectory also confirmed the presence of this wind pattern. The increase in SO2, the source of which still needs to be confirmed, may have further enhanced the formation of new particles, together with the decrease in CS.
Similar cases have been observed during the campaign but a detailed classification of Foehn wind event days would be needed to further characterize them in relation to NPF. This case study is consistent with the earlier observations that Foehn wind can create favorable conditions for NPF in the Po Valley (Rodríguez et al., 2005) and that it is a significant source of UFP even in urban Milan.
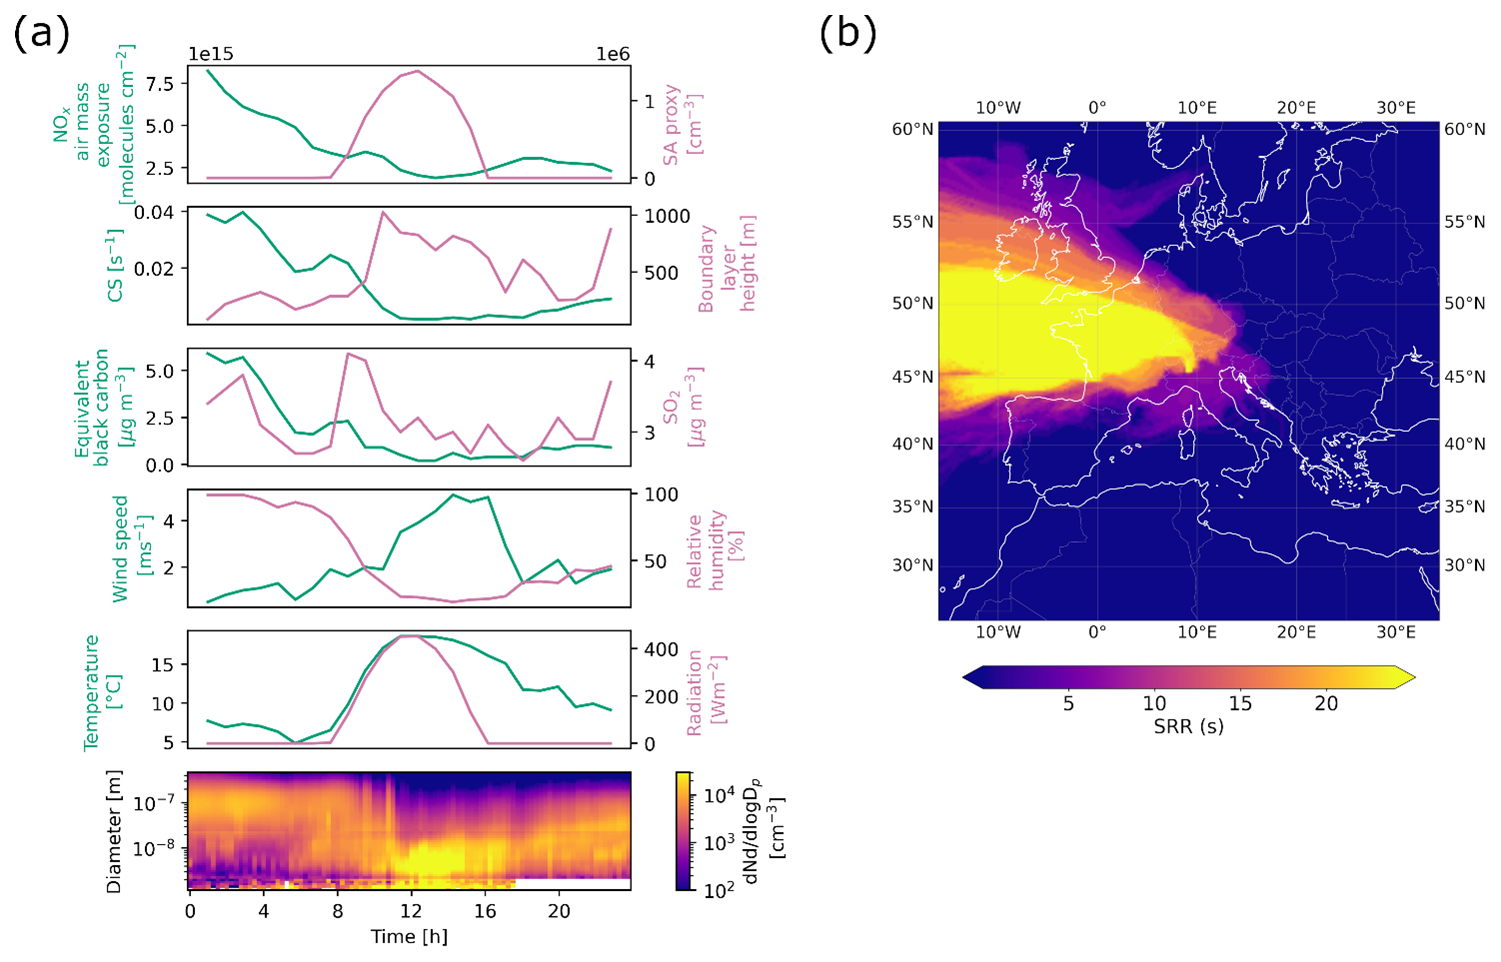
Figure 15(a) NOx air mass exposure, sulfuric acid (SA) concentration proxy, CS, BLH, eBC and SO2 concentrations, wind speed, relative humidity, temperature, and radiation time series and particle number size distribution surface plot during 17 November 2023; (b) source-receptor relationship (SRR) for all the trajectories arriving during 17 November 2023.
This study examines NPF in Milan over one year, revealing that NPF was more intense during spring and summer, resulting in higher concentrations of sub-10 nm particles. In contrast, winter saw higher levels of particles larger than 50 nm, mostly due to the reduced BLH and increased emissions from heating sources. Traffic-related peaks during rush hours were more evident in winter and autumn, but they diminished in spring and summer as atmospheric mixing increased. Our analysis shows that cleaner, well-mixed conditions, particularly with strong northwesterly winds, enhanced NPF by reducing the CS, possibly allowing precursor vapors to participate in the formation of new particles. Reduced air mass exposure to anthropogenic emissions and shorter residence time in the Po Valley further supported stronger NPF.
The driving mechanisms of NPF vary by location and environmental conditions. Similar patterns have been observed in other urban areas, such as Beijing, China, where Guo et al. (2014) found a higher frequency of NPF events during cleaner periods characterized by lower particle number concentrations. During these periods, the reduced CS allowed nucleating vapors to accumulate, facilitating NPF. Conversely, in polluted conditions with high aerosol loading, NPF was suppressed due to the high CS and the abundant pre-existing particles, which provided surfaces that scavenged vapors, inhibiting the NPF process. Also, in Beijing, the occurrence of both clean and polluted periods depended on the meteorology as strong winds descending from the mountains in the north contributed to the cleaning of the atmosphere, while the slower winds from the south favored the accumulation of pollutants (Guo et al., 2014). Our findings suggest that a similar mechanism may be happening in Milan. While the absence of direct precursor vapor measurements precludes us from entirely dismissing the influence of transported chemical precursors, the geographical and environmental context of Milan supports a more plausible explanation. Located in a heavily industrialized, densely populated region with significant agricultural activities, it is reasonable to believe that the reduction of the CS played a more prominent role in initiating NPF, rather than an eventual influx of precursors from the Alps.
The relation between wind speed and NPF is not uniform across all urban sites. For instance, Pushpawela et al. (2019) explored this relation in Brisbane, Australia, and observed that NPF was more likely to happen on days with lower wind speed, a finding opposite to that in Milan and other highly polluted environments. Their comparative analysis suggested that the impact of wind speed on NPF depends on the level of pollution and the distribution of precursor vapors. In relatively cleaner urban areas like Brisbane, where the accumulation of precursors can enhance NPF, a lower wind speed facilitates this process. In contrast, in highly polluted cities like Beijing, a low wind speed increases the CS, suppressing NPF. At higher wind speed, the reduction in CS can promote NPF in polluted areas by clearing pre-existing particles, whereas in cleaner cities, the removal of precursor vapors can inhibit NPF. Our study locates Milan within this framework as a highly polluted city where the interplay between wind speed, CS, and precursor vapor concentrations played a critical role in the NPF dynamics.
The findings hint at potential implications for air quality in Milan. Long-term reductions in PM10 and PM2.5 concentrations, potentially driven by regulatory measures, could lead to stronger NPF, increasing the concentrations of UFP. This highlights the need for detailed studies on precursor vapors and on the chemical pathways leading to NPF to fully understand their role in the NPF process, especially in relation to low CS episodes. Future research should focus on the direct measurements of these precursors to clarify their contributions, whether local or transported. Comparative studies in other polluted urban environments are also crucial to understand regional differences in NPF dynamics. Long-term monitoring of aerosol concentrations in all size ranges and of NPF events, in relation to urban development and pollution control, would provide valuable insights into the effectiveness and results of air quality strategies.
The size distribution data from the nCNC, NAIS, and SMPS presented in this work are publicly available at https://doi.org/10.5281/zenodo.18130252 (Agrò, 2026).
The supplement related to this article is available online at https://doi.org/10.5194/acp-26-6521-2026-supplement.
The study was designed by FB and TP. MA, SM, IG, PF, AB, CO, AB, JS participated in the installation and the operation of the instruments. MA analysed the data. MB and GC performed the model simulations and analysis. MA prepared the manuscript. All the coauthors contributed to the discussion and interpretation of the results and the revision of the article.
At least one of the (co-)authors is a member of the editorial board of Atmospheric Chemistry and Physics. The peer-review process was guided by an independent editor, and the authors also have no other competing interests to declare.
Publisher's note: Copernicus Publications remains neutral with regard to jurisdictional claims made in the text, published maps, institutional affiliations, or any other geographical representation in this paper. The authors bear the ultimate responsibility for providing appropriate place names. Views expressed in the text are those of the authors and do not necessarily reflect the views of the publisher.
We acknowledge the use of the Matlab package psm-dataflow-tools by Lauri Ahonen for the inversion of the nCNC data. We thank the Department of Direzione tecnica monitoraggi e prevenzione del rischio naturale of the Regional Agency for Environmental Protection of Lombardy for providing the boundary layer height data. Model simulations were performed on the Mahti supercomputer of the Finnish IT Center for Science (CSC).
This project received funding from the European Union's Horizon 2020 research and innovation programme under grant agreement No 101036245 (RI-URBANS). We thank the ACCC Flagship, funded by the Academy of Finland grant numbers 337549 (UH) and 337552 (FMI).
Open-access funding was provided by the Helsinki University Library.
This paper was edited by Imre Salma and reviewed by three anonymous referees.
Agrò, M.: Data of “Ventilation and low pollution enhancing new particle formation in Milan, Italy”, Zenodo, https://doi.org/10.5281/zenodo.18130252, 2026.
Aliaga, D., Tuovinen, S., Zhang, T., Lampilahti, J., Li, X., Ahonen, L., Kokkonen, T., Nieminen, T., Hakala, S., Paasonen, P., Bianchi, F., Worsnop, D., Kerminen, V.-M., and Kulmala, M.: Nanoparticle ranking analysis: determining new particle formation (NPF) event occurrence and intensity based on the concentration spectrum of formed (sub-5 nm) particles, Aerosol Res., 1, 81–92, https://doi.org/10.5194/ar-1-81-2023, 2023.
Bae, M.-S., Schwab, J. J., Hogrefe, O., Frank, B. P., Lala, G. G., and Demerjian, K. L.: Characteristics of size distributions at urban and rural locations in New York, Atmos. Chem. Phys., 10, 4521–4535, https://doi.org/10.5194/acp-10-4521-2010, 2010.
Batchvarova, E. and Gryning, S.-E.: Applied model for the growth of the daytime mixed layer, Bound.-Layer Meteorol., 56, 261–274, https://doi.org/10.1007/BF00120423, 1991.
Bettineschi, M., Vitali, B., Cholakian, A., Zardi, D., Bianchi, F., Sinclair, V., Mikkola, J., Cristofanelli, P., Marinoni, A., Mazzini, M., Heikkinen, L., Aurela, M., Paglione, M., Bessagnet, B., Tuccella, P., and Ciarelli, G.: Across land, sea, and mountains: sulphate aerosol sources and transport dynamics over the northern Apennines, Environ. Sci. Atmos., 5, 1023–1034, https://doi.org/10.1039/D5EA00035A, 2025.
Bousiotis, D., Pope, F. D., Beddows, D. C. S., Dall'Osto, M., Massling, A., Nøjgaard, J. K., Nordstrøm, C., Niemi, J. V., Portin, H., Petäjä, T., Perez, N., Alastuey, A., Querol, X., Kouvarakis, G., Mihalopoulos, N., Vratolis, S., Eleftheriadis, K., Wiedensohler, A., Weinhold, K., Merkel, M., Tuch, T., and Harrison, R. M.: A phenomenology of new particle formation (NPF) at 13 European sites, Atmos. Chem. Phys., 21, 11905–11925, https://doi.org/10.5194/acp-21-11905-2021, 2021.
Brean, J., Beddows, D. C. S., Shi, Z., Temime-Roussel, B., Marchand, N., Querol, X., Alastuey, A., Minguillón, M. C., and Harrison, R. M.: Molecular insights into new particle formation in Barcelona, Spain, Atmos. Chem. Phys., 20, 10029–10045, https://doi.org/10.5194/acp-20-10029-2020, 2020.
Brioude, J., Arnold, D., Stohl, A., Cassiani, M., Morton, D., Seibert, P., Angevine, W., Evan, S., Dingwell, A., Fast, J. D., Easter, R. C., Pisso, I., Burkhart, J., and Wotawa, G.: The Lagrangian particle dispersion model FLEXPART-WRF version 3.1, Geosci. Model Dev., 6, 1889–1904, https://doi.org/10.5194/gmd-6-1889-2013, 2013.
Cai, J., Sulo, J., Gu, Y., Holm, S., Cai, R., Thomas, S., Neuberger, A., Mattsson, F., Paglione, M., Decesari, S., Rinaldi, M., Yin, R., Aliaga, D., Huang, W., Li, Y., Gramlich, Y., Ciarelli, G., Quéléver, L., Sarnela, N., Lehtipalo, K., Zannoni, N., Wu, C., Nie, W., Kangasluoma, J., Mohr, C., Kulmala, M., Zha, Q., Stolzenburg, D., and Bianchi, F.: Elucidating the mechanisms of atmospheric new particle formation in the highly polluted Po Valley, Italy, Atmos. Chem. Phys., 24, 2423–2441, https://doi.org/10.5194/acp-24-2423-2024, 2024.
Chen, F. and Dudhia, J.: Coupling an Advanced Land Surface–Hydrology Model with the Penn State–NCAR MM5 Modeling System. Part I: Model Implementation and Sensitivity, https://doi.org/10.1175/1520-0493(2001)129<0569:CAALSH>2.0.CO;2, 2001.
Colombi, C., Cuccia, E., Dal Santo, U., Franciosa, M., Lanzani, G., Petrosino, F., Vincenzi, D., Bacco, D., Poluzzi, V., Scotto, F., Trentini, A., Bardi, L., Bruno, A., De Maria, R., Sacco, M., Pistollato, S., Zagolin, L., Magri, T., and Diémoz, H.: Monitoring the environmental effects of pollutant reduction measures implemented by air quality improvement plans – Report on source apportionment, https://drive.google.com/file/d/1Zk89jnybkdZxVnDFppJHQyfq-RY-_gph/view (last access: 23 April 2026), 2023.
Dal Maso, M., Kulmala, M., Riipinen, I., Wagner, R., Hussein, T., Aalto, P. P., and Lehtinen, K. E. J.: Formation and growth of fresh atmospheric aerosols: eight years of aerosol size distribution data from SMEAR II, Hyytiälä, Finland, https://doi.org/10.60910/yq6q-vj10, 2005.
Dada, L., Ylivinkka, I., Baalbaki, R., Li, C., Guo, Y., Yan, C., Yao, L., Sarnela, N., Jokinen, T., Daellenbach, K. R., Yin, R., Deng, C., Chu, B., Nieminen, T., Wang, Y., Lin, Z., Thakur, R. C., Kontkanen, J., Stolzenburg, D., Sipilä, M., Hussein, T., Paasonen, P., Bianchi, F., Salma, I., Weidinger, T., Pikridas, M., Sciare, J., Jiang, J., Liu, Y., Petäjä, T., Kerminen, V.-M., and Kulmala, M.: Sources and sinks driving sulfuric acid concentrations in contrasting environments: implications on proxy calculations, Atmos. Chem. Phys., 20, 11747–11766, https://doi.org/10.5194/acp-20-11747-2020, 2020.
Dada, L., Okuljar, M., Shen, J., Olin, M., Wu, Y., Heimsch, L., Herlin, I., Kankaanrinta, S., Lampimäki, M., Kalliokoski, J., Baalbaki, R., Lohila, A., Petäjä, T., Dal Maso, M., Duplissy, J., Kerminen, V.-M., and Kulmala, M.: The synergistic role of sulfuric acid, ammonia and organics in particle formation over an agricultural land, Environ. Sci. Atmospheres, 3, 1195–1211, https://doi.org/10.1039/D3EA00065F, 2023.
Dai, L., Zhao, Y., Zhang, L., Chen, D., and Wu, R.: Particle number size distributions and formation and growth rates of different new particle formation types of a megacity in China, J. Environ. Sci., 131, 11–25, https://doi.org/10.1016/j.jes.2022.07.029, 2023.
European Environment Agency (EEA): Air quality in Europe – 2019 report, https://www.eea.europa.eu/en/analysis/publications/air-quality-in-europe-2019 (last access: 23 April 2026), 2019.
Fuchs, N. A. and Sutugin, A. G.: HIGH-DISPERSED AEROSOLS, in: Topics in Current Aerosol Research, edited by: Hidy, G. M. and Brock, J. R., Pergamon, 1, https://doi.org/10.1016/B978-0-08-016674-2.50006-6, 1971.
Gordon, H., Kirkby, J., Baltensperger, U., Bianchi, F., Breitenlechner, M., Curtius, J., Dias, A., Dommen, J., Donahue, N. M., Dunne, E. M., Duplissy, J., Ehrhart, S., Flagan, R. C., Frege, C., Fuchs, C., Hansel, A., Hoyle, C. R., Kulmala, M., Kurten, A., Lehtipalo, K., Makhmutov, V., Molteni, U., Rissanen, M. P., Stozkhov, Y., Trostl, J., Tsagkogeorgas, G., Wagner, R., Williamson, C., Wimmer, D., Winkler, P. M., Yan, C., and Carslaw, K. S.: Causes and importance of new particle formation in the present-day and preindustrial atmospheres, J. Geophys. Res.-Atmos., 122, 8739–8760, https://doi.org/10.1002/2017JD026844, 2017.
Gormley, P. G. and Kennedy, M.: Diffusion from a Stream Flowing through a Cylindrical Tube, Proc. R. Ir. Acad. Sect. Math. Phys. Sci., 52, 163–169, https://www.jstor.org/stable/20488498 (last access: 24 April 2026), 1948.
Guo, S., Hu, M., Zamora, M. L., Peng, J., Shang, D., Zheng, J., Du, Z., Wu, Z., Shao, M., Zeng, L., Molina, M. J., and Zhang, R.: Elucidating severe urban haze formation in China, Proc. Natl. Acad. Sci. USA, 111, 17373–17378, https://doi.org/10.1073/pnas.1419604111, 2014.
Hakala, S., Vakkari, V., Bianchi, F., Dada, L., Deng, C., Dällenbach, K. R., Fu, Y., Jiang, J., Kangasluoma, J., Kujansuu, J., Liu, Y., Petäjä, T., Wang, L., Yan, C., Kulmala, M., and Paasonen, P.: Observed coupling between air mass history, secondary growth of nucleation mode particles and aerosol pollution levels in Beijing, Environ. Sci. Atmospheres, 2, 146–164, https://doi.org/10.1039/D1EA00089F, 2022.
Hamed, A., Joutsensaari, J., Mikkonen, S., Sogacheva, L., Dal Maso, M., Kulmala, M., Cavalli, F., Fuzzi, S., Facchini, M. C., Decesari, S., Mircea, M., Lehtinen, K. E. J., and Laaksonen, A.: Nucleation and growth of new particles in Po Valley, Italy, Atmos. Chem. Phys., 7, 355–376, https://doi.org/10.5194/acp-7-355-2007, 2007.
Hong, S.-Y., Dudhia, J., and Chen, S.-H.: A Revised Approach to Ice Microphysical Processes for the Bulk Parameterization of Clouds and Precipitation, https://doi.org/10.1175/1520-0493(2004)132<0103:ARATIM>2.0.CO;2, 2004.
Italian National Institute of Statistics (ISTAT): 2024 Annual Report – The state of a Nation, https://www.istat.it/en/publication/2024-annual-report-the-state-of-a-nation/ (last access: 23 April 2026), 2024.
Janjic, Z. I.: The Step-Mountain Eta Coordinate Model: Further Developments of the Convection, Viscous Sublayer, and Turbulence Closure Schemes, Mon. Weather Rev., 122, 927–945, 1994.
Janjic, Z. I.: A nonhydrostatic model based on a new approach, Meteorol. Atmos. Phys., 82, 271–285, https://doi.org/10.1007/s00703-001-0587-6, 2003.
Kerminen, V.-M., Chen, X., Vakkari, V., Petäjä, T., Kulmala, M., and Bianchi, F.: Atmospheric new particle formation and growth: review of field observations, Environ. Res. Lett., 13, 103003, https://doi.org/10.1088/1748-9326/aadf3c, 2018.
Kontkanen, J., Järvinen, E., Manninen, H. E., Lehtipalo, K., Kangasluoma, J., Decesari, S., Gobbi, G. P., Laaksonen, A., Petäjä, T., and Kulmala, M.: High concentrations of sub-3nm clusters and frequent new particle formation observed in the Po Valley, Italy, during the PEGASOS 2012 campaign, Atmos. Chem. Phys., 16, 1919–1935, https://doi.org/10.5194/acp-16-1919-2016, 2016.
Kuenen, J., Dellaert, S., Visschedijk, A., Jalkanen, J.-P., Super, I., and Denier van der Gon, H.: CAMS-REG-v4: a state-of-the-art high-resolution European emission inventory for air quality modelling, Earth Syst. Sci. Data, 14, 491–515, https://doi.org/10.5194/essd-14-491-2022, 2022.
Kulmala, M., Petäjä, T., Nieminen, T., Sipilä, M., Manninen, H. E., Lehtipalo, K., Dal Maso, M., Aalto, P. P., Junninen, H., Paasonen, P., Riipinen, I., Lehtinen, K. E. J., Laaksonen, A., and Kerminen, V.-M.: Measurement of the nucleation of atmospheric aerosol particles, Nat. Protoc., 7, 1651–1667, https://doi.org/10.1038/nprot.2012.091, 2012.
Kulmala, M., Kontkanen, J., Junninen, H., Lehtipalo, K., Manninen, H. E., Nieminen, T., Petäjä, T., Sipilä, M., Schobesberger, S., Rantala, P., Franchin, A., Jokinen, T., Järvinen, E., Äijälä, M., Kangasluoma, J., Hakala, J., Aalto, P. P., Paasonen, P., Mikkilä, J., Vanhanen, J., Aalto, J., Hakola, H., Makkonen, U., Ruuskanen, T., Mauldin, R. L., Duplissy, J., Vehkamäki, H., Bäck, J., Kortelainen, A., Riipinen, I., Kurtén, T., Johnston, M. V., Smith, J. N., Ehn, M., Mentel, T. F., Lehtinen, K. E. J., Laaksonen, A., Kerminen, V.-M., and Worsnop, D. R.: Direct observations of atmospheric aerosol nucleation, Science, 339, 943–946, https://doi.org/10.1126/science.1227385, 2013.
Kulmala, M., Dada, L., Daellenbach, K. R., Yan, C., Stolzenburg, D., Kontkanen, J., Ezhova, E., Hakala, S., Tuovinen, S., Kokkonen, T. V., Kurppa, M., Cai, R., Zhou, Y., Yin, R., Baalbaki, R., Chan, T., Chu, B., Deng, C., Fu, Y., Ge, M., He, H., Heikkinen, L., Junninen, H., Liu, Y., Lu, Y., Nie, W., Rusanen, A., Vakkari, V., Wang, Y., Yang, G., Yao, L., Zheng, J., Kujansuu, J., Kangasluoma, J., Petäjä, T., Paasonen, P., Järvi, L., Worsnop, D., Ding, A., Liu, Y., Wang, L., Jiang, J., Bianchi, F., and Kerminen, V.-M.: Is reducing new particle formation a plausible solution to mitigate particulate air pollution in Beijing and other Chinese megacities?, Faraday Discuss., 226, 334–347, https://doi.org/10.1039/D0FD00078G, 2021.
Kulmala, M., Cai, R., Stolzenburg, D., Zhou, Y., Dada, L., Guo, Y., Yan, C., Petäjä, T., Jiang, J., and Kerminen, V.-M.: The Contribution of New Particle Formation and Subsequent Growth to Haze Formation, Environ. Sci. Atmos. 2, 352–361, https://doi.org/10.1039/D1EA00096A, 2022.
Lampimäki, M., Baalbaki, R., Ahonen, L., Korhonen, F., Cai, R., Chan, T., Stolzenburg, D., Petäjä, T., Kangasluoma, J., Vanhanen, J., and Lehtipalo, K.: Novel aerosol diluter – Size dependent characterization down to 1 nm particle size, J. Aerosol Sci., 172, 106180, https://doi.org/10.1016/j.jaerosci.2023.106180, 2023.
Lehtipalo, K., Ahonen, L. R., Baalbaki, R., Sulo, J., Chan, T., Laurila, T., Dada, L., Duplissy, J., Miettinen, E., Vanhanen, J., Kangasluoma, J., Kulmala, M., Petäjä, T., and Jokinen, T.: The standard operating procedure for Airmodus Particle Size Magnifier and nano-Condensation Nucleus Counter, J. Aerosol Sci., 159, 105896, https://doi.org/10.1016/j.jaerosci.2021.105896, 2022.
Manninen, H. E., Mirme, S., Mirme, A., Petäjä, T., and Kulmala, M.: How to reliably detect molecular clusters and nucleation mode particles with Neutral cluster and Air Ion Spectrometer (NAIS), Atmos. Meas. Tech., 9, 3577–3605, https://doi.org/10.5194/amt-9-3577-2016, 2016.
Merikanto, J., Spracklen, D. V., Mann, G. W., Pickering, S. J., and Carslaw, K. S.: Impact of nucleation on global CCN, Atmos. Chem. Phys., 9, 8601–8616, https://doi.org/10.5194/acp-9-8601-2009, 2009.
Microsoft: Bing Maps, https://www.bing.com/maps (last access: 17 April 2025), 2025.
Mirme, S. and Mirme, A.: The mathematical principles and design of the NAIS – a spectrometer for the measurement of cluster ion and nanometer aerosol size distributions, Atmos. Meas. Tech., 6, 1061–1071, https://doi.org/10.5194/amt-6-1061-2013, 2013.
Mlawer, E. J., Taubman, S. J., Brown, P. D., Iacono, M. J., and Clough, S. A.: Radiative transfer for inhomogeneous atmospheres: RRTM, a validated correlated-k model for the longwave, J. Geophys. Res.-Atmos., 102, 16663–16682, https://doi.org/10.1029/97JD00237, 1997.
Nieminen, T., Kerminen, V.-M., Petäjä, T., Aalto, P. P., Arshinov, M., Asmi, E., Baltensperger, U., Beddows, D. C. S., Beukes, J. P., Collins, D., Ding, A., Harrison, R. M., Henzing, B., Hooda, R., Hu, M., Hõrrak, U., Kivekäs, N., Komsaare, K., Krejci, R., Kristensson, A., Laakso, L., Laaksonen, A., Leaitch, W. R., Lihavainen, H., Mihalopoulos, N., Németh, Z., Nie, W., O'Dowd, C., Salma, I., Sellegri, K., Svenningsson, B., Swietlicki, E., Tunved, P., Ulevicius, V., Vakkari, V., Vana, M., Wiedensohler, A., Wu, Z., Virtanen, A., and Kulmala, M.: Global analysis of continental boundary layer new particle formation based on long-term measurements, Atmos. Chem. Phys., 18, 14737–14756, https://doi.org/10.5194/acp-18-14737-2018, 2018.
Pushpawela, B., Jayaratne, R., and Morawska, L.: The influence of wind speed on new particle formation events in an urban environment, Atmos. Res., 215, 37–41, https://doi.org/10.1016/j.atmosres.2018.08.023, 2019.
Rodríguez, S., Van Dingenen, R., Putaud, J.-P., Martins-Dos Santos, S., and Roselli, D.: Nucleation and growth of new particles in the rural atmosphere of Northern Italy – relationship to air quality monitoring, Atmos. Environ., 39, 6734–6746, https://doi.org/10.1016/j.atmosenv.2005.07.036, 2005.
Rönkkö, T., Kuuluvainen, H., Karjalainen, P., Keskinen, J., Hillamo, R., Niemi, J. V., Pirjola, L., Timonen, H. J., Saarikoski, S., Saukko, E., Järvinen, A., Silvennoinen, H., Rostedt, A., Olin, M., Yli-Ojanperä, J., Nousiainen, P., Kousa, A., and Dal Maso, M.: Traffic is a major source of atmospheric nanocluster aerosol, P. Natl. Acad. Sci. USA, 114, 7549–7554, https://doi.org/10.1073/pnas.1700830114, 2017.
Salma, I., Borsós, T., Weidinger, T., Aalto, P., Hussein, T., Dal Maso, M., and Kulmala, M.: Production, growth and properties of ultrafine atmospheric aerosol particles in an urban environment, Atmos. Chem. Phys., 11, 1339–1353, https://doi.org/10.5194/acp-11-1339-2011, 2011.
Savadkoohi, M., Pandolfi, M., Favez, O., Putaud, J.-P., Eleftheriadis, K., Fiebig, M., Hopke, P. K., Laj, P., Wiedensohler, A., Alados-Arboledas, L., Bastian, S., Chazeau, B., María, Á. C., Colombi, C., Costabile, F., Green, D. C., Hueglin, C., Liakakou, E., Luoma, K., Listrani, S., Mihalopoulos, N., Marchand, N., Močnik, G., Niemi, J. V., Ondráček, J., Petit, J.-E., Rattigan, O. V., Reche, C., Timonen, H., Titos, G., Tremper, A. H., Vratolis, S., Vodička, P., Funes, E. Y., Zíková, N., Harrison, R. M., Petäjä, T., Alastuey, A., and Querol, X.: Recommendations for reporting equivalent black carbon (eBC) mass concentrations based on long-term pan-European in-situ observations, Environ. Int., 185, 108553, https://doi.org/10.1016/j.envint.2024.108553, 2024.
Schraufnagel, D. E.: The health effects of ultrafine particles, Exp. Mol. Med., 52, 311–317, https://doi.org/10.1038/s12276-020-0403-3, 2020.
Seinfeld, J. H. and Pandis, S. N.: Atmospheric Chemistry and Physics: From Air Pollution to Climate Change, John Wiley & Sons, 2016.
Simpson, D., Benedictow, A., Berge, H., Bergström, R., Emberson, L. D., Fagerli, H., Flechard, C. R., Hayman, G. D., Gauss, M., Jonson, J. E., Jenkin, M. E., Nyíri, A., Richter, C., Semeena, V. S., Tsyro, S., Tuovinen, J.-P., Valdebenito, Á., and Wind, P.: The EMEP MSC-W chemical transport model – technical description, Atmos. Chem. Phys., 12, 7825–7865, https://doi.org/10.5194/acp-12-7825-2012, 2012.
Spracklen, D. V., Carslaw, K. S., Kulmala, M., Kerminen, V.-M., Sihto, S.-L., Riipinen, I., Merikanto, J., Mann, G. W., Chipperfield, M. P., Wiedensohler, A., Birmili, W., and Lihavainen, H.: Contribution of particle formation to global cloud condensation nuclei concentrations, Geophys. Res. Lett., 35, https://doi.org/10.1029/2007GL033038, 2008.
Trechera, P., Garcia-Marlès, M., Liu, X., Reche, C., Pérez, N., Savadkoohi, M., Beddows, D., Salma, I., Vörösmarty, M., Casans, A., Casquero-Vera, J. A., Hueglin, C., Marchand, N., Chazeau, B., Gille, G., Kalkavouras, P., Mihalopoulos, N., Ondracek, J., Zikova, N., Niemi, J. V., Manninen, H. E., Green, D. C., Tremper, A. H., Norman, M., Vratolis, S., Eleftheriadis, K., Gómez-Moreno, F. J., Alonso-Blanco, E., Gerwig, H., Wiedensohler, A., Weinhold, K., Merkel, M., Bastian, S., Petit, J.-E., Favez, O., Crumeyrolle, S., Ferlay, N., Martins Dos Santos, S., Putaud, J.-P., Timonen, H., Lampilahti, J., Asbach, C., Wolf, C., Kaminski, H., Altug, H., Hoffmann, B., Rich, D. Q., Pandolfi, M., Harrison, R. M., Hopke, P. K., Petäjä, T., Alastuey, A., and Querol, X.: Phenomenology of ultrafine particle concentrations and size distribution across urban Europe, Environ. Int., 172, 107744, https://doi.org/10.1016/j.envint.2023.107744, 2023.
Vallabani, N. V. S., Gruzieva, O., Elihn, K., Juárez-Facio, A. T., Steimer, S. S., Kuhn, J., Silvergren, S., Portugal, J., Piña, B., Olofsson, U., Johansson, C., and Karlsson, H. L.: Toxicity and health effects of ultrafine particles: Towards an understanding of the relative impacts of different transport modes, Environ. Res., 231, 116186, https://doi.org/10.1016/j.envres.2023.116186, 2023.
Vecchi, R., Marcazzan, G., Valli, G., Ceriani, M., and Antoniazzi, C.: The role of atmospheric dispersion in the seasonal variation of PM1 and PM2.5 concentration and composition in the urban area of Milan (Italy), Atmos. Environ., 38, 4437–4446, https://doi.org/10.1016/j.atmosenv.2004.05.029, 2004.
Wagner, R., Manninen, H. E., Franchin, A., Lehtipalo, K., Mirme, S., Steiner, G., Petäjä, T., and Kulmala, M.: On the accuracy of ion measurements using a Neutral cluster and Air Ion Spectrometer, https://doi.org/10.60910/xr8j-5a1a, 2016.
Wang, S. C. and Flagan, R. C.: Scanning Electrical Mobility Spectrometer, Aerosol Sci. Technol., 13, 230–240, https://doi.org/10.1080/02786829008959441, 1990.
Wolfram Research: Mathematica, Version 14.1, 2025.
World Health Organization (WHO): WHO global air quality guidelines: particulate matter (PM2.5 and PM10), ozone, nitrogen dioxide, sulfur dioxide and carbon monoxide, https://www.who.int/publications/i/item/9789240034228 (last access: 23 April 2026), 2021.
Yao, L., Garmash, O., Bianchi, F., Zheng, J., Yan, C., Kontkanen, J., Junninen, H., Mazon, S. B., Ehn, M., Paasonen, P., Sipilä, M., Wang, M., Wang, X., Xiao, S., Chen, H., Lu, Y., Zhang, B., Wang, D., Fu, Q., Geng, F., Li, L., Wang, H., Qiao, L., Yang, X., Chen, J., Kerminen, V.-M., Petäjä, T., Worsnop, D. R., Kulmala, M., and Wang, L.: Atmospheric new particle formation from sulfuric acid and amines in a Chinese megacity, Science, 361, 278–281, https://doi.org/10.1126/science.aao4839, 2018.
Zhao, B., Donahue, N. M., Zhang, K., Mao, L., Shrivastava, M., Ma, P.-L., Shen, J., Wang, S., Sun, J., Gordon, H., Tang, S., Fast, J., Wang, M., Gao, Y., Yan, C., Singh, B., Li, Z., Huang, L., Lou, S., Lin, G., Wang, H., Jiang, J., Ding, A., Nie, W., Qi, X., Chi, X., and Wang, L.: Global variability in atmospheric new particle formation mechanisms, Nature, 631, 98–105, https://doi.org/10.1038/s41586-024-07547-1, 2024.
Zilitinkevich, S. and Baklanov, A.: Calculation Of The Height Of The Stable Boundary Layer In Practical Applications, Bound.-Layer Meteorol., 105, 389–409, https://doi.org/10.1023/A:1020376832738, 2002.
Zilitinkevich, S., Esau, I., and Baklanov, A.: Further comments on the equilibrium height of neutral and stable planetary boundary layers, Q. J. Roy. Meteorol. Soc., 133, 265–271, https://doi.org/10.1002/qj.27, 2007.