the Creative Commons Attribution 4.0 License.
the Creative Commons Attribution 4.0 License.
 | 13 May 2026
Measurement report: Chemical characterization of cloud water at Monte Cimone (Italy) – impact of air mass origin and assessment of atmospheric processes
Pauline Nibert
Yi Wu
Muriel Joly
Pierre Amato
Paolo Cristofanelli
Francescopiero Calzolari
Jean-Luc Piro
Davide Putero
Simonetta Montaguti
Laura Renzi
Franziska Vogel
Marco Rapuano
Marcello Brigante
Christophe Verhaege
Jean-Luc Baray
Laurent Deguillaume
Angela Marinoni
In this article, we present the results of the chemical and microbiological characterization of clouds water collected at Monte Cimone (CMN) in Italy at 2165 m a.s.l. during the MC3 (Molecular Composition of Clouds at mt. Cimone) campaign, which took place in October 2024. Twenty-six cloud samples are analyzed. Chemical analyses, including ions, oxidants, trace metals, and microbiological analyses with cell counting, are performed. The chemical characterization and back-trajectories analysis reveal that Mt. Cimone is a site under the influence of marine air masses, coming mainly from southern Europe and from the Mediterranean region. During the measurement campaign, 3 sampling periods are identified: period (1) 7–10 October, with air masses mainly originating from Spain and Atlantic Ocean with a majority of Cl− and Na+ that are characteristics of marine origin; period (2) 16–18 October with air masses originating from North of Africa, impacted by a Saharan dust event with a high concentration in Ca2+; period (3) 22–23 October marked by air masses originated from southern Italy under polluted influence with a high concentration in NO. Across the campaign, DOC ranged from 1.6 to 4.3 mgC L−1, while H2O2 reached its maximum during period 3 (71.8±35.4 µmol L−1), highlighting enhanced oxidant levels under polluted conditions. This study paves the way to further scientific campaigns intended to better comprehend cloud water composition at Mt. Cimone.
- Article
(2676 KB) - Full-text XML
-
Supplement
(5261 KB) - BibTeX
- EndNote


The chemical composition of the atmosphere is modulated by complex reactions and has a direct impact on the global climate, air pollution, and thus human health (Pöschl, 2005). The effect of clouds on atmospheric chemical composition is poorly understood. Clouds cover almost 70 % of the Earth's surface and are one of the greatest sources of uncertainty in climate models (Ceppi et al., 2017). Due to their multiphasic nature, clouds are characterized as a complex, dynamic, and transformative medium (Herrmann et al., 2015).
Inorganic and organic compounds from anthropogenic or natural sources are abundant in the atmosphere as gases and aerosol particles. Once emitted in the atmosphere, these compounds undergo multiple transformations, including photochemical reactions and gas to particle conversion (Herrmann et al., 2015). Soluble gaseous compounds dissolve in cloud droplets, and soluble aerosol particles act as cloud condensation nuclei (CCN), contributing to cloud droplet composition. This medium therefore participates to the atmospheric transport of compounds emitted on the Earth's surface depending on their solubility and lifetime. In addition, the multiphase nature of cloud can favor chemical reactions that would not take place in the gas phase, unless the time scale is sufficiently long (Herrmann, 2003). The transformations in cloud can lead to the modification of chemical and physical properties of aerosols such as oxidation state and hygroscopicity (Dominutti et al., 2022; Herrmann et al., 2005, 2015). Due to their high reactivity, they can be a source of secondary organic aerosol (“aqSOA”) and inorganic compounds (Ervens, 2015).
Similarly, in addition to the chemical reactions that occur naturally in clouds, microbiological processes also can impact its composition (Deguillaume et al., 2008). Cloud droplets contain biological matter such as dead cells, cell fragments, but also living microorganisms such as fungi and yeast (Amato et al., 2005; Bauer et al., 2002; Liu et al., 2023). These living microorganisms come from different environments, mainly natural sources such as soil, plants, and sea surfaces (Möhler et al., 2007), and are suspended in the air by aerosolization. Once in the atmosphere, they may interact with clouds as ice nucleating particles (Joly et al., 2015), contributing to the formation and lifetime of clouds, through their potential role in triggering precipitation.
Although previous studies have been carried out to investigate the chemical composition of cloud water, the cloud chemistry knowledge is limited by the event-driven nature of cloud. In particular, dissolved organic matter (DOM) concentration and composition in cloud water represent a matter of interest in the frame of a changing atmosphere. Efforts to understand the chemical composition and reactivity of cloud water DOM have been made since the late 1980s (Weathers et al., 1988), with studies carried out on different continents such as Europe (Brege et al., 2018; Brüggemann et al., 2005; Deguillaume et al., 2014; Herckes et al., 2013; Renard et al., 2020; Van Pinxteren et al., 2005; van Pinxteren et al., 2016), Asia (Li et al., 2017, 2020; Xu et al., 2019) and America (Collett et al., 2008; Desyaterik et al., 2013). Based on long term database, efforts have been made to classify clouds into different categories such as polluted, continental or marine (Deguillaume et al., 2014; Renard et al., 2020), using in particular content of inorganic ions. The recent work from Lawrence et al. (2023) highlighted that sulphate is no longer the driving factor for cloud water chemistry, which is now dominated by base cations, reactive nitrogen species, and organic compounds. To date, there are very few infrastructures dedicated to the long term study of bio-physico-chemical processes. In this frame, the puy de Dôme observatory (PUY) in the Auvergne region of France is one of the rare such site in Europe (Baray et al., 2020). A few others exist worldwide, including the Schmücke Mountain in Germany (van Pinxteren et al., 2005, 2016), Whiteface Mountain in New York (Lance et al., 2020; Lawrence et al., 2023) and Mt Tai in China (Guo et al., 2012; Shen et al., 2012).
The present study focuses on the aqueous phase of clouds collected during the MC3 campaign at Monte Cimone (CMN) in Italy. This is the first cloud collection campaign ever conducted at this site, with the aim of investigating how the origin of air masses influences both the chemical composition of clouds and the microbial biomass present in cloud water.
2.1 Monte Cimone site description
The MC3 (Molecular Composition of Clouds at Mt. Cimone) field campaign was performed from 7 to 23 October at the Italian Climate Observatory “Ottavio Vittori”, located at Monte Cimone, (44.19° N, 10.69° E, 2165 m a.s.l.). Due to its location and high altitude, CMN is representative of Southern European Mediterranean free troposphere. It is strongly influenced by the long-range transport of air masses including Saharan dust events (Duchi et al., 2016; Vogel et al., 2025b), but it is also influenced by local and regional processes, such as vertical transport of Po valley pollution during summer months (Cristofanelli and Trisolino, 2021; Giulianelli et al., 2014; Unsworth and Fowler, 1988) and frequent new particle formation events (Mazzini et al., 2025). It is the only high mountain station for atmospheric research both South of the Alps and the Po basin (https://www.isac.cnr.it/cimone, last access: 5 March 2026). In collaboration with the Italian Air Force (CAMM), this observatory is managed by the Institute of Atmospheric Sciences and Climate of the National Research Council (CNR-ISAC). It is a global station of the Global Atmospheric Watch (GAW) program by the World Meteorological Organization (WMO) as well as part of ACTRIS (Aerosols, Clouds, and Traces gases Research Infrastructure) and ICOS (Integrated Carbon Observation System) Research Infrastructures.
2.2 Cloud water sampling procedures
Each sample is labelled with the date in the format dd/mm and a letter to indicate the sequential sample. Details are reported in Table S1 in the Supplement. Clouds are formed at the summit of the site during the advection of frontal systems or by orographic uplift of moist air. Sampling is restricted to non-precipitating clouds (except for sample 23/10 A – rain), under warm cloud condition, with temperature always above 2.2 °C. Two cloud impactors BOOGIE (Vaitilingom et al., 2025) are used: one for the physico-chemical characterization and the other for microbiological analysis. Before each sampling both collectors are cleaned using ethanol 70 % and then rinsed with MilliQ water. The cloud collector dedicated to microbial measurements is sterilized by high pressure and temperature. During the campaign, a blank is collected on 15/10 by spreading MilliQ water on the clean cloud collector in sunny conditions, to determine possible contamination already present on the surface of the impactor. After collection, cloud water from the non-sterilized impactor is directly filtered using a 0.22 µm H-PTFE filter (Whatman) to remove particles and microorganisms, and then split into different aliquots and stored in the fridge (4 °C) or freezer (−25 °C). pH is also measured immediately after collection and checked with a Hanna pH meter after the campaign. These collection procedures are similar to previously conducted, validated and published measurement campaigns (Deguillaume et al., 2014; Dominutti et al., 2022).
2.3 Physico-chemical analyses
The concentrations of the major organic (formic, acetic, and oxalic acids) and inorganic ions (Ca2+, K+, Mg2+, Na+, NH, Cl−, SO and NO) are measured by ion chromatography, using a Thermo ICS5000+ instrument, more details are available in Sect. S1 in the Supplement. Dissolved organic carbon is measured with a Shimadzu TOC-VCPH/CPN analyzer without dilution. TOC measurements are obtained by calculating the difference between total carbon (TC) and inorganic carbon (IC) measurements. As the samples are filtered prior to analysis, the particulate organic carbon fraction is removed; consequently, the total organic carbon (TOC) is equivalent to the dissolved organic carbon (DOC). The hydrogen peroxide concentration is measured with the spectrofluorimetric method based on the reactivity of p-hydroxyphenylacetic acid with horseradish peroxidase (Bader et al., 1988). Trace metals analysis is conducted using Inductively Coupled Plasma Mass Spectrometry instrument (ICP-MS, Agilent 7500). As the cloud impactor is made in aluminum, this element is not quantified in the samples. The analyzed trace metals are Ag, As, Be, Bi, Cd, Co, Cr, Cu, Fe, Ga, Li, Mg, Mn, Mo, Ni, Pb, Pd, Rb, Sb, Sn, Sr, Tl, U, V, W, and Zn. The result in Sect. 3.5 presents the comparison between blank and cloud water samples: as some samples had values below the blank, the blank was not subtracted. As the blank is prepared in clear sky conditions, atmospheric particles, with concentration of 766.6±24.0 particles cm−3, may dissolve into MilliQ water, thereby increasing the concentrations of certain trace metals. More details about the physico-chemical analysis can be found in Sect. S1.
2.4 Complementary atmospheric observations
A set of complementary atmospheric observations is implemented in the data analysis to characterize, comprehensively, the cloud events. These observations include meteorological parameters, trace gases (O3, CO, SO2, NOx), and aerosol particles concentration (Cristofanelli and Montaguti, 2025; Cristofanelli and Trisolino, 2021). The data, measured at a time resolution of 1 min are averaged according to the duration of the cloud events. The corresponding measurements are reported in Fig. S1 in the Supplement.
2.4.1 Trace gases and meteorology
An UV-absorption analyzer (49i, Thermo Scientific) is used to measure in-situ atmosphere mole fraction of surface O3. The UV analyzer is regularly calibrated (roughly every 3 months) with a laboratory transfer standard (Tei 49i-PS, Thermo Scientific) referred to the WMO calibration scale SRP#2 and the standard uncertainty of unbiased measurements is usually below ±1 nmol mol−1.
Atmospheric nitric oxide (NO), nitrogen dioxide (NO2), and NOx (defined as NO + NO2), are measured by a chemiluminescence analyzer (Teledyne T200UP) equipped with a photolytic converter (Blue Light Converter) with a detection limit of 0.01 nmol mol−1 for both NO and NO2. Roughly every 7 d, zero and span calibrations are carried out for NO by using an external zero air source and dilution of NO mixture in N2 (5.0 ppm ±3.5 %). To determine the efficiency of the NO2 converter, a gas phase titration (GPT) module is used after NO calibration.
Atmospheric CO measurements (Cristofanelli and Montaguti, 2025) are carried out in the framework of ICOS by using a Cavity Ring Down Spectrometer analyzer (G5310, Picarro). Within ICOS, atmospheric observations of CO are carried out in a standardized way for measurement set-up, used materials, quality assurance strategy and data creation workflow (see Hazan et al., 2016). As deduced by the calculation of measurement bias, long-term and continuous repeatability, the CO measurement uncertainty is below ±1 nmol mol−1.
At CMN, standard meteorological variables (Cristofanelli and Trisolino, 2021) are observed by an ultrasonic anemometer (WMT-702, Vaisala), air-temperature and relative humidity by a sensor HMP-155 (Vaisala) and atmospheric pressure by a barometer PTB-210 (Vaisala).
2.4.2 Dust transport identification with an optical particle counter
The aerosol sampling is performed through a heated whole air inlet (WAI) in stainless steel, which ensures efficient sampling of aerosol below 20 µm. The optical particle counter (OPC, Grimm® model 1.108) is used to measure the particle size distribution in the optical diameter range of 0.3–20 µm with a time resolution of 1 min. The resulting size distribution is divided into fine (diameter <1 µm) and coarse (diameter >1 µm) particles. Starting from 24 h averages of the coarse particle number concentration, the dust transport days are identified following the methodology presented in Duchi et al. (2016) and Vogel et al. (2025b). From the number size distribution of coarse particles, we calculated the mass concentration of coarse particles (PMCOAR) with 1 min time resolution assuming a size dependent particle density (Wittmaack, 2002).
2.4.3 Aerosol chemical composition
Measurements of non-refractory (NR) PM1 chemical components (i.e. organics, SO, NO, NH, Cl−) are continuously performed by a Time-of-Flight Aerosol Chemical Speciation Monitor (ToF-ACSM) (Aerodyne Research Inc.) (Fröhlich et al., 2013), operating at 6 min time resolution and equipped with a PM1 lens cut-off. The inlet used is the same described in Sect. 2.4.2. In brief, PM1 enters the instrument passing through a three-way valve system (switching between sampling and background signal), a 120 µm critical orifice and aerodynamic lenses which beam the PM1 to the vaporizer (∼ 600 °C), placed at the end of the vacuum chamber. Here the NR-PM1 components vaporize and are then impacted by a 70 eV electron beam which generates ion fragments, detected by the Time-of-Flight mass analyzer (Tofwerk ETOF) depending on their mass-to-charge ratio. Compensation of particle losses due to bouncing after impacting onto vaporizer is performed by correcting the ACSM data for the composition-dependent collection efficiency (CDCE) (Middlebrook et al., 2012). Ionization efficiency of nitrate in ions pg−1 and relative ionization efficiencies (RIEs) for sulphate and ammonium are obtained by calibrations; the final mean values are 44.6, 0.615 and 3.65 ions pg−1, respectively. In this work, the ACSM is used to quantify the aerosol particle mass concentration in the sub micrometric range (PM1). To easily differentiate the aerosol phase from the ions liquid concentration, the contribution of the various ions to PM1 are called: OrgPM for organics, for sulphate, for nitrate, for ammonium and Cl for chloride. The total particle concentration (PMTOT) is then calculated as the sum of PM1, measured by the ACSM, and PMCOAR derived with the OPC. Similarly in the aqueous phase, they are called: for sulphate, for nitrate, for ammonium and Cl for chloride, where “CW” means cloud water. The mass concentration of equivalent black carbon (eBC) is derived from the aerosol absorption coefficient measured with a Multi-Angle Absorption Photometer (MAAP, model 5012, Thermo Scientific) using a fixed mass absorption cross-section (10 m2 g−1; Zanatta et al., 2016). While the operating principle of the MAAP and its limitations are provided by Petzold and Schönlinner (2004) and Petzold et al. (2005), its use and corrections at CMN is described by Renzi et al. (2026).
2.5 Air masses back-trajectory analysis
CAT (Computing Atmospheric Trajectory Tool) is a 3D model which simulates the trajectories of air masses (forward/backward) using as input wind fields from ECMWF ERA-5 (European Centre for Medium-Range Weather Forecast) reanalysis (Baray et al., 2020). For this work, wind fields are extracted every 3 h with a spatial resolution of 0.25° in latitude (70° N, −20° S) and longitude (60° E, −60° W), on 23 vertical pressure levels between 200 and 1000 hPa. CAT integrates a topography matrix at a spatial resolution of around 10 km. Clusters of 216 back-trajectories are calculated every hour during the cloud sampling using starting points distributed within ±0.2° in latitude and longitude around the measurement site. The vertical starting altitude of the back-trajectories is deduced from the pressure measured at CMN summit considering the hydrostatic equilibrium. In the present work, the temporal resolution of back-trajectory clusters is 15 min and their total duration is 72 h.
2.6 Statistical analyses: Principal Component Analysis
A principal component analysis (PCA) is performed using 28 cloud samples (including blank and 23/10 rain) collected at the Monte-Cimone site. The PCA matrix is centered and standardized using mean and standard deviation. The correlation matrix is calculated directly on R-studio software (Lê et al., 2008) using the function res.pca < - PCA(Data,scale.unit=TRUE), where Data is our dataset. The option scale.unit=TRUE centres and scales the variables, which means that PCA is performed on the correlation matrix. The software used is R-studio with the programming language R. Concentrations of SO, Cl−, NO, Na+, NH, Mg2+, and Ca2+ presented in Table S2 are treated manually to obtain categories (polluted, marine, continental clouds) based on ion concentration dissimilarities.
2.7 Microbial analysis
Total microbial concentration is determined using flow cytometry. Immediately after sampling, 5 % glutaraldehyde (final concentration: 0.5 %) is added to cloud water. Triplicate subsamples are stored at 4 °C (<15 d) before “SYBR green I” staining and analysis with a LSR FORTESSA X-20 cytometer (BD Biosciences).
Culturable microbial cells are investigated spreading 100 µL of cloud water on Petri dishes containing R2A medium (3 replicates per sampling). Petri dishes are incubated at 20 °C during 4 d under aerobic conditions, in the dark. Colony forming units (CFUs) are then counted differentiating bacteria-like CFUs (yeast or bacteria) from mycelial fungi.
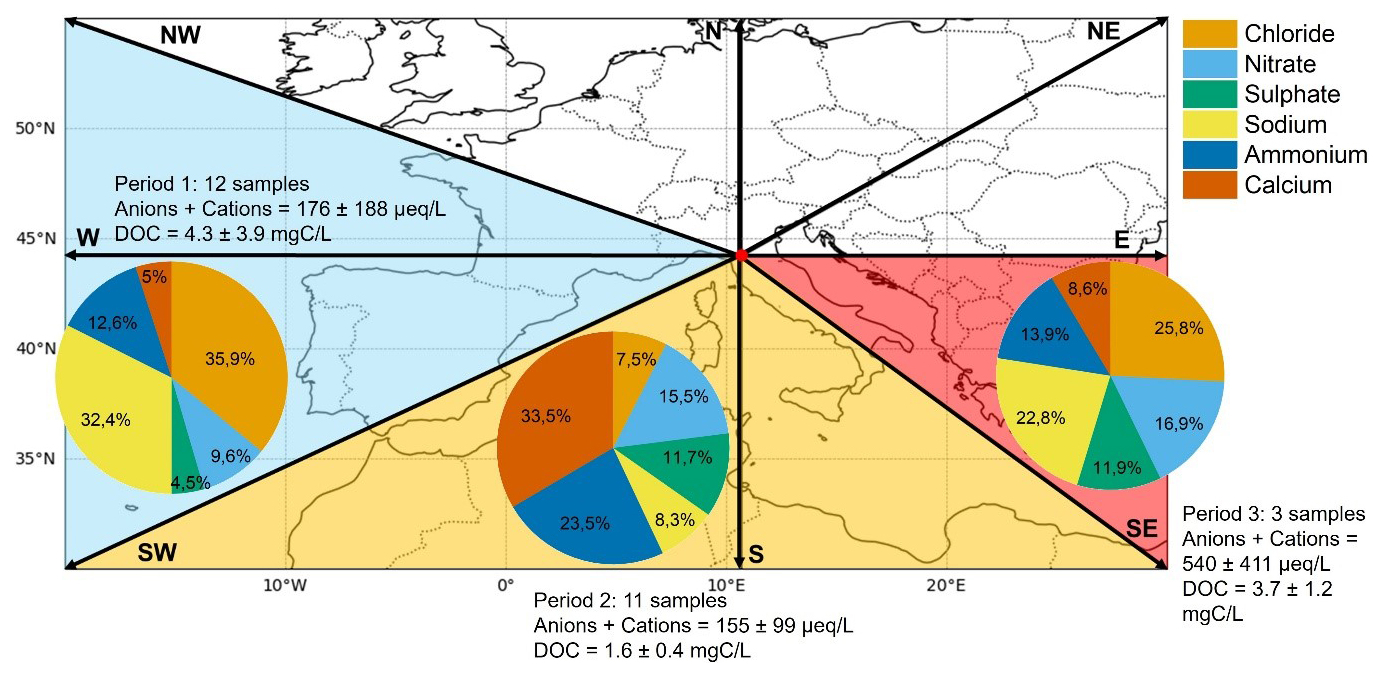
Figure 1Sectors of air masses reaching the CMN observatory. Black lines depict the compass directions; the blue area shows the origin of air masses for Period 1, the yellow area for Period 2, and the red area for Period 3. The pie plots indicate for each period the relative contributions of main inorganic ions and cations. The number of samples collected, the ionic concentration (in µeq. L−1) and the dissolved organic carbon (DOC) (in mgC L−1)are reported for each period.
3.1 Characterization of cloud samples: air mass history and chemical composition
The study of cloud composition, coupled with dynamical analyses, such as air masses back-trajectory, gives useful information on the possible contribution of anthropogenic and biogenic sources. During the campaign, the air masses arrived at CMN from three main different sectors, namely West (W), South (S) and South-East (S–E). This enables the definition of three periods: (1) Period 1, from 07 to 10/10, with air masses mainly coming from Spain and the Atlantic Ocean, crossing the Iberian peninsula; (2) Period 2, from 16 to 18/10, with air masses coming from North Africa, strongly impacted by Saharan dust; (3) Period 3, from 22 to 23/10, marked by air masses coming from Ionian and Levantine basin and travelling above the Italian peninsula (Figs. 1 and S2).
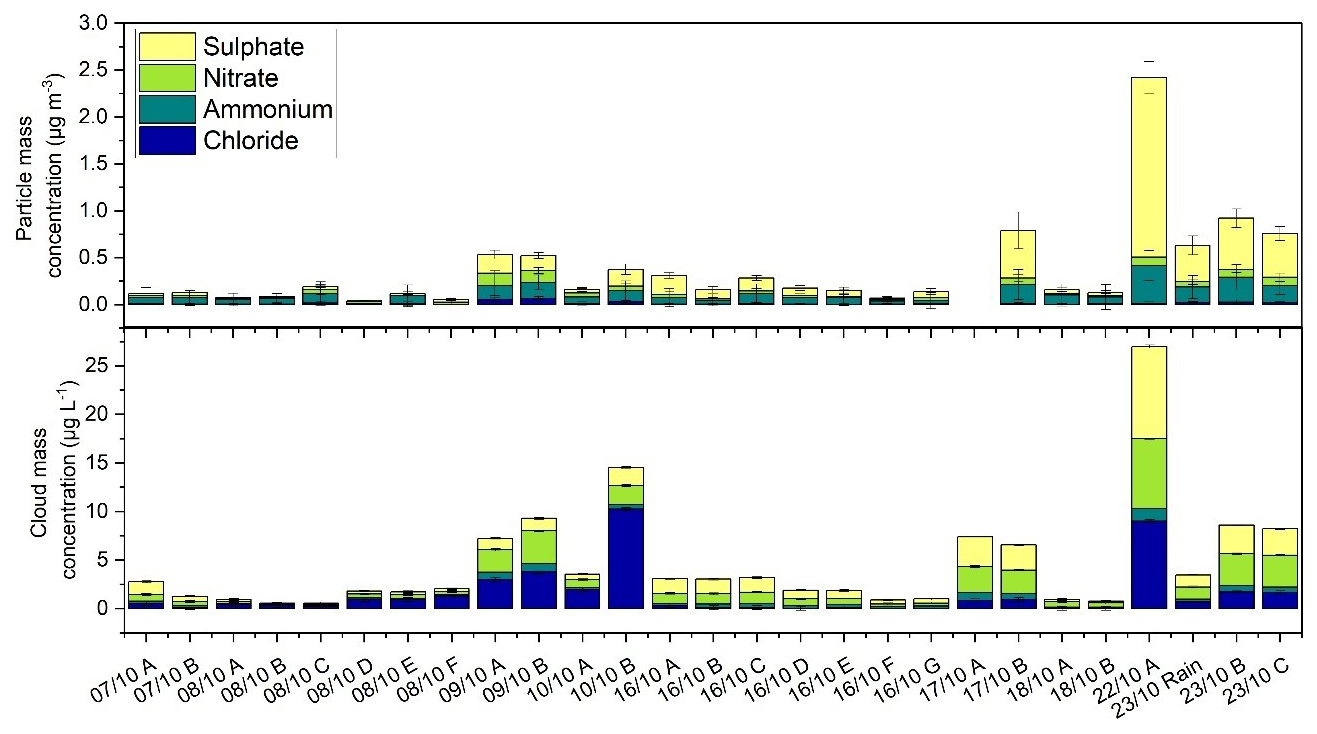
Figure 2Mass concentration of main inorganic ions (chloride, nitrate, sulphate and ammonium) in aerosol (upper panel) and in cloud (lower panel) phases.
3.1.1 Period 1: marine influence from the Atlantic sector
Combining back trajectory analysis with the chemical composition of cloud water, a clear marine influence is evident. During Period 1, concentrations of chloride (Cl) and sodium (Na), which are indicators of marine influence, were 56.0±80.3 and 50.6±67.8 µmol L−1, respectively (Fig. S5, Table S2). These values are comparable to those observed in marine clouds at PUY, (Renard et al., 2020) and lower than those reported for other marine and continental sites (Dominutti et al., 2022; Li et al., 2017; Reyes-Rodríguez et al., 2009; Triesch et al., 2021). The marine influence is even more pronounced in single cloud samples. For example, samples 09/10 B and 10/10 B show Cl and Na concentrations similar to highly marine clouds collected at PUY (range of 12.2–394.0 µmol L−1 for Cl and 18.5 to 678.6 µmol L−1 for Na), as well as to those collected in Puerto Rico (range of 151.0–841.0 µmol L−1 for Cl and 158.0 to 738.0 µmol L−1 for Na) (Reyes-Rodríguez et al., 2009) or at the Reunion Island (Dominutti et al., 2022). When focusing on the TIC (total ion content), defined as the calculated sum of the major anions (inorganic and organic) and cations present in clouds, the average for Period 1 is around 176±188 µeq. L−1. This value is similar to the TIC reported in (Deguillaume et al., 2014) for clouds collected in PUY with a marine origin. The marine influence is also confirmed by the sea-salt sulphate [ssSO] fraction in cloud water, which averaged around 40 % and reached up to 70 % in individual samples during Period 1. This is remarkably higher than in the other periods, where the average contribution remained below 10 %, as shown in Fig. S3. The reliability of the sea salt sulphate calculation (Keene et al., 1986) is confirmed by the high correlation with the Cl− concentration in the aqueous phase. Complementary atmospheric observations such as low concentration of eBC, CO, NO and NO2 support the occurrence of “clean” marine air masses at the measurement site (Fig. 2). The distribution of inorganic ions (Cl−, NH, NO, and SO) in cloud water (CW) is similar in proportions to those observed in particulate matter (PM). We observed a depletion of Cl and , in the aerosol phase compared to the cloud aqueous phase, particularly visible for samples 09/10 A and B, 10/10 A and B, 17/10 B, 22/10 and 23/10 B and C. The air masses corresponding to these samples are characterized by a strong marine influence, with Cl and mainly present as inorganic ions (NaCl and NaNO3), which are not detected by ACSM, since the temperature of the ionization source (600 °C) is below the temperature of volatilization of these inorganic salts (Ng et al., 2011).
3.1.2 Period 2: Saharan dust influence from north Africa
Intense dust events are not unusual at CMN in October (Vogel et al., 2025b), providing a valuable opportunity to study the impact of Saharan dust on cloud water composition, which remains poorly documented (Shen et al., 2024; Valle-Díaz et al., 2016).
Saharan dust events observed in the Mediterranean are characterized by a large fraction of super micrometric particles (Denjean et al., 2016) and contains a large amount of Calcium (Pérez-Martínez et al., 2020). The aerosol observations allowed identifying Saharan dust event on 16 and 17 October (Fig. S2e), when the concentration of coarse particles represented the major component of the particulate matter mass with the highest concentration of all periods (3.28 µg m−3). Air mass transport from northern Africa is confirmed by low O3 and CO values (38.9 nmol mol−1 and 98.5 ppb, respectively; see Fig. S6), typical of dust-rich air masses with low contributions from combustion sources (e.g., Duchi et al., 2016). Cloud samples collected during this period present high concentrations of Ca, up to 62.3 µmol L−1, and low concentrations of DOC, with an average of 1.6±0.4 mgC L−1. Notably, the concentration of Ca is likely underestimated, as some Ca2+ may be present as insoluble mineral aerosols and thus remain on the filter. The concentration of Ca is higher than those observed for polluted clouds collected in Poland (Błaś et al., 2008) or in China (Li et al., 2017). All ion concentrations of Period 2 in cloud water are low, confirming that other sources are negligible, besides Saharan dust, for these samples.
On 16 October, the first day of the Saharan event, all ion concentrations decreased over the day. The maximum concentration of Ca is 62.3 µmol L−1 for sample 16/10 A and decreased to 12.7 µmol L−1 for the last sample 16/10 G (around 5 h later). A decrease of and concentrations is also observed, passing from 16.6 to 4.5 µmol L−1 for and from 15.6 to 4.2 µmol L−1 for . Studying a cloud sample influenced by a Saharan event over time provides new insights into the impact of such events on cloud water chemistry, as these analyses remain limited.
The Saharan origin of Ca is confirmed by its high correlation with the concentration of coarse particles, which is enriched during Saharan dust events (Vogel et al., 2025b) (Fig. S7). Notably, the x intercept is not zero, suggesting that a consistent fraction of calcium may remain in the fine fraction mass. The samples G and F have very low concentrations in both the PM1 and PMCOAR modes.
After a clear sky period of 6 h, on 17 October, two cloud water samples are collected consecutively in the morning. The concentration of Ca increases, compared to samples 16/10 F and 16/10 G, with an average of 49.1±5.5 µmol L−1.
The analysis of the images on the webcam from CMN shows the absence of clouds between 02:31:00 to 08:22:00 UTC on 17 October (Fig. S8). The trace gases, ACSM and OPC data strengthen the fact that clouds collected on 16/10 and on 17/10 belong to two different events, both from Saharan air masses, but with a different intensity: the concentration of supermicron particles measured on 17/10 (3 µg m−3) is less than a quarter of the peak concentration on 16/10 (13 µg m−3) (Fig. S4). There is a slight variation of the back-trajectory of the air mass between the two events: in the back-trajectory corresponding to samples 17/10 A and B, the air masses travelled through Tunisia at low altitude, in the boundary layer, before crossing the Tyrrhenian Sea to reach the CMN. As also testified by the higher atmospheric CO, NO2 and O3, this can result in a continental/polluted influence and lead to higher concentrations of NO, SO, and NH, comparable to those observed for continental samples in PUY (Deguillaume et al., 2014).
The Saharan dust episode ended on 18 October, and the concentration of the different ions returned to lower values, with average concentrations of 10.6±4.6 µmol L−1 for Ca, 8.2±1.7 µmol L−1 for , 2.1±0.4 µmol L−1 for and 8.2±0.4 µmol L−1 for . This fast decrease after a Saharan dust event is also observed in a study of rainwater collected in Spain (Oduber et al., 2020), reaching a concentration of Ca of around 180.0 µmol L−1 in rainwater collected during the Saharan dust event, and below 40.0 µmol L−1 the day later. However, cloud and rain samples are not equivalent, as they may be influenced by different accumulation mechanisms and/or washout processes. The aerosol particles measurements mirror the results obtained for cloud water: the concentrations of sub and super micrometric aerosol particles decrease drastically on 18/10 compared to the previous days. Also the atmospheric gases consistently traced a change in the features of the collected air masses, with a marked increase of O3 and NO2.
3.1.3 Period 3: mixed anthropogenic influence from the Western mediteranean
Finally, the cloud and aerosol particles concentrations in Period 3 showed a completely different behavior. This period is represented by only three cloud samples and two events: 22 and 23 October, presenting different back-trajectories. The air masses are mainly coming from S–E sector, with origin in the Ionian Sea at low altitudes and crossing the Italian Peninsula from S–E to N–W at higher altitudes, but in the boundary layer.
This is confirmed by an average concentration of of 60.5±39.9 µmol L−1 and of 42.7±38.4 µmol L−1. The average concentration of is also higher than the first two periods: 49.8±30.2 µmol L−1. Also, the submicrometric aerosol concentration showed the highest campaign values with the PM1 (1.67 µg m−3), eBC (0.07 µg m−3) and organic carbon (0.42 µg m−3) concentration being roughly four times higher than period 1 and 2.
Looking deeper into the different samples, the average concentration is clearly driven by 22/10. This sample presents concentrations of Cl and Na of 254.7 and 224.7 µmol L−1, respectively, but also high concentrations of , , and , reaching 115.7, 99.1 and 91.6 µmol L−1, respectively.
This is supported by the back-trajectory of 22/10, as the air masses come firstly from lower altitude of the Mediterranean Sea, before crossing the S–E of Italy at low altitude and being enriched by ions resulting from anthropogenic activities such as NO, SO and NH. The aerosol particles and trace gases measurements agree with these results. Similarly, particulate matter concentration in 22/10 is the highest in the entire sample series, with a remarkable example of value of 1.91 µg m−3, confirming a strong anthropogenic influence. The low NO NO2 ratio (Fig. S6) and average concentrations (0.08±0.01 µg m−3, the highest of the campaign) would suggest the occurrence of relatively aged anthropogenic emissions.
In the past, pH was a determinant criterion to classify the air masses, being more acidic for more polluted clouds (Herckes et al., 2013). However, this criterion has changed in the past few years, as pH has become more homogeneous in the cloud water samples with less variability (Pye et al., 2020). In cloud water samples from CMN, the average pH is 6.1±0.8, and quite homogeneous between the samples. However, it decreases to 4.1 on 22/10, coinciding with peak and a low neutralization degree, which confirms that this sample is under continental influence with anthropogenic input.
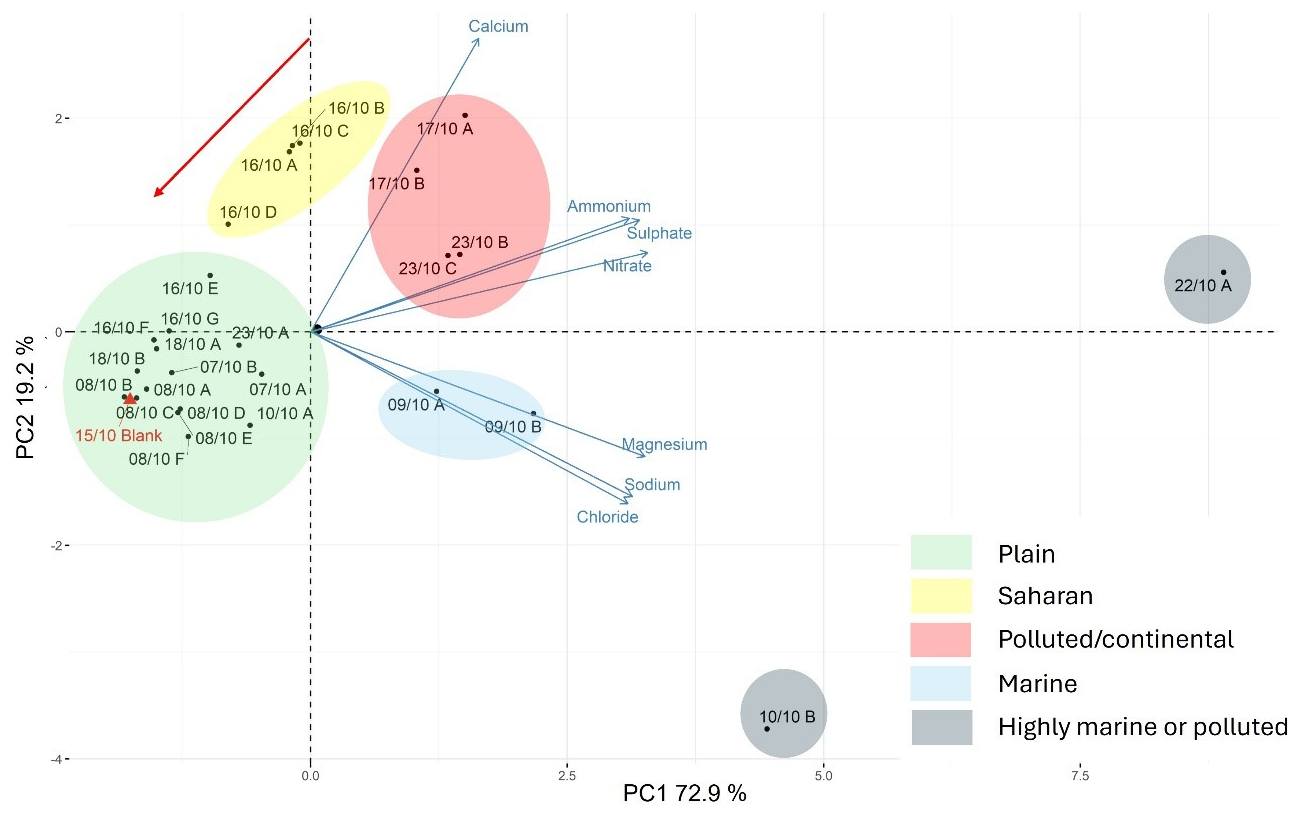
Figure 3Biplot of the principal component analysis (PCA) performed on cloud samples collected at CMN. Loadings represent the ions, scores represent the samples. Colored areas depict the different classes of samples: plain, Saharan, polluted/continental, highly marine, and, highly marine or polluted. The blank sample is reported in red. The red arrow highlights the depletion of Ca2+ during the cloud event 16/10.
3.2 Statistical analysis
Principal component analysis (PCA) is used to explore patterns and relationships among cloud water constituents (variables) and samples (objects) collected at CMN, by identifying combinations of variables (loadings) that explain the largest variance in the dataset (Fig. 3). In this PCA the first two factors represent 92.1 % of the variability of the dataset. PC1, which represents 72.9 % of the information, is driven by the concentration of Mg, Cl, Na, , and , while PC2, which represents 19.5 % of the information, is mainly driven by the concentration of Ca. The analysis of the hierarchical clustering combined to the PCA, reveals 5 main categories of samples statistically different described as follows: (1) samples classified as “plain” with a low ions content, (2) samples classified as “Saharan event”, (3) samples classified as “polluted/continental”, (4) samples classified as “highly marine” and; (5) samples classified as “highly marine/polluted” (Fig. 3).
The total ion concentration of the various samples in the first group (in green) is comparable to the blank's ion concentration. Sample 23/10 A falls within this category: it is the only sample obtained during rainy conditions, which affected the total ion concentration through dilution processes. Samples 23/10 B and C, which are collected during the same cloud event without rain, are categorized as polluted/continental, do not exhibit dilution, and present higher concentrations of , , and . Moving to the second category (in yellow), samples from 16/10 A to E are driven by the Ca concentration. As the concentration of Ca decreases over time through dilution, it is possible to plainly observe a moving tendency (red arrow) from the second category to the first category, which contains samples 16/10 F and G. In the third category, samples 17/10 A and B are grouped with samples 23/10 B and C. According with the back-trajectories corresponding to these four samples (4 events), they both travel above the Italian peninsula before reaching CMN. However, on the PCA, samples 17/10 A and B are driven by Ca concentration. This is consistent with the associated back-trajectories, which both start from northern Africa, bringing dust to CMN (Fig. S2f). Samples 23/10 B and C, on the other hand, do not have the same origin and, thus, they are not directly correlated to Ca concentration. Finally, the last two categories include samples 09/10 A and B, which are under marine influence and mainly driven by Mg, Na, and Cl concentrations. Two isolated samples completed the dataset: sample 10/10 B, which has back-trajectory that is comparable but not identical to 09/10, and mainly driven by Na and Cl concentrations, attesting a strong marine influence. Sample 22/10 has similar concentrations of Cl, Na, and Mg, but higher concentrations of , , and , which can be explained by the back-trajectory of the air mass, coming from S–E and travelling above Italy in the boundary layer.
3.3 Oxidants in cloud water
Radicals or other oxidant species induce the transformation of organics in the cloud aqueous phase. Ionic radicals, such as SO (sulphate radical anion) are produced only in the aqueous phase, while neutral radicals, like HO• (hydroxyl radical), NO (nitrate radical) and HO, can be produced in the aqueous phase or transferred from the gas phase into the aqueous phase. The redox potential increases following the order NO SO < HO• (Bianco et al., 2020). Although radicals are not measured in samples collected at CMN, some of their precursors, such as hydrogen peroxide (H2O2), NO and Fe2+/Fe3+ are quantified. The concentration of total iron is below 0.3 µmol L−1, as confirmed by ICP-MS measurements (Sect. 3.4, Table S4), and is too low for an efficient photochemical activity and HO• production through Fenton and photo-Fenton reactions. The average concentration of H2O2 is 37.8±29.0 µmol L−1, higher than the average concentrations measured at other mountain sites in Europe (11–13 µmol L−1 – Marinoni et al., 2011; Bianco et al., 2015; Valverde-Canossa et al., 2005) and at other non-European sites (23–24 µmol L−1 – Mohnen and Kadlecek, 1989; Li et al., 2017; Benedict et al., 2012).
The relatively low concentration of SO2 could explain the high concentration of H2O2 in cloud water. Besides, the photochemical depletion of H2O2 is inhibited during autumn and winter and could be responsible of higher concentrations (Bianco et al., 2020). The highest concentration of H2O2, measured for sample 22/10 (104.1 µmol L−1), could be possibly linked to the direct emissions from an industry plant in Rosignano Solvay (LV), producing 50 000 t yr−1 of H2O2. The industry is located less than 150 km away from CMN, and the air mass back-trajectory is in agreement with an input from this potential source.
Although no measurements are performed in the gas phase, if we assume that H2O2 follows the Henry's equilibrium in cloud droplets, an average pseudo gas phase concentration can be estimated from the partial pressure of H2O2 using Eqs. (1) and (2)
Considering that KH of H2O2 at 278 K is 4.98×10⁵ mol L−1 atm−1 (O'Sullivan et al., 1996), and pTOT=0.77 atm at CMN during the campaign, the resulting gaseous phase concentration is 99±76 ppt, in agreement with the values reported by Laj et al. (2001) and Vione et al. (2003).
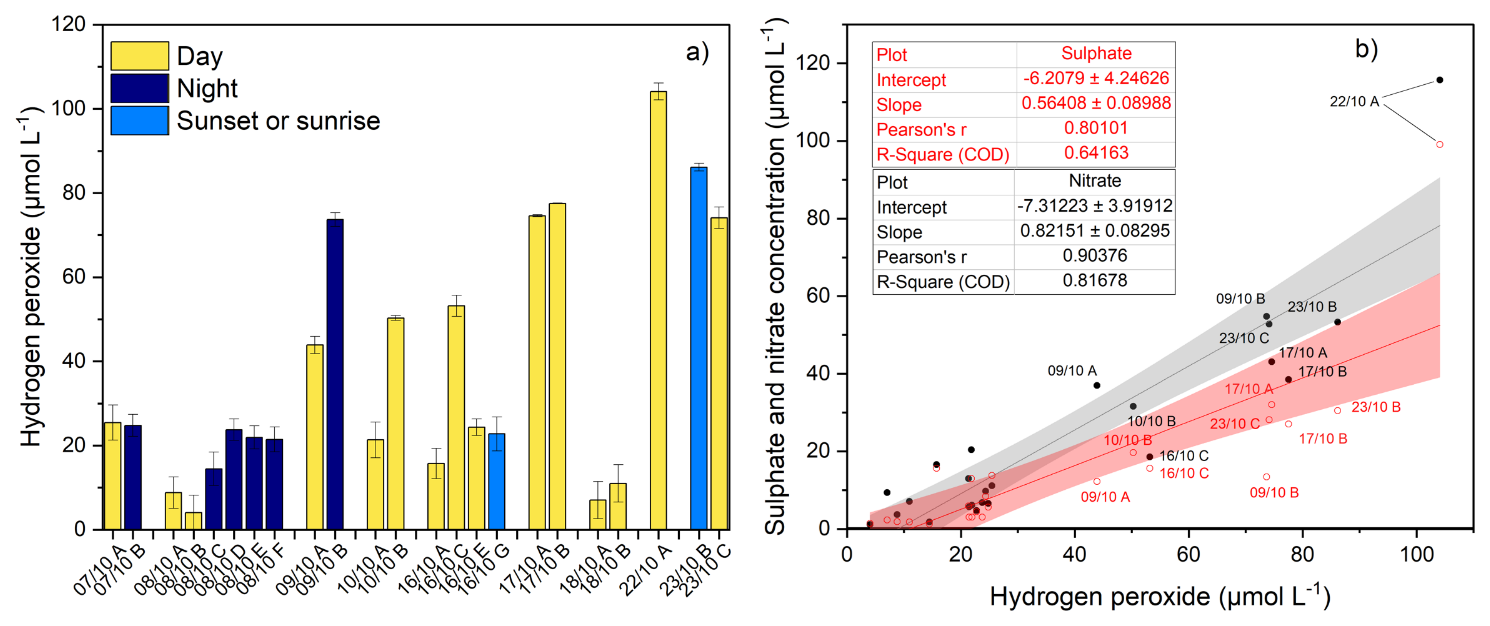
Figure 4(a) Boxplot of hydrogen peroxide concentration in cloud water. (b) Correlation between nitrate concentration (left y-axis, black dots) or sulphate concentration (right y-axis, red circles) and hydrogen peroxide in cloud water. The linear correlation is reported in grey for nitrate and in red for sulphate, with 95 % confidence intervals. Equations and coefficient of determinations are reported in the inset tables.
The main source of H2O2 in the aqueous phase is the mass transfer from the gas phase (Bianco et al., 2020), followed by the photochemical production in the aqueous phase. Samples collected during MC3 show a high variability of H2O2 concentrations within a single cloud event, especially concerning day/night sampling times. Figure 4a reports in yellow the concentration in day-time samples and in blue in night-time. The concentrations in night-time samples are generally higher than in day-time samples, except for sample 16/10 G, collected at sunset. This result is in agreement with Marinoni et al. (2011), which highlights the importance of photochemical depletion of H2O2 during the day.
Figure 4b reveals a linear correlation between the concentrations of NO and H2O2, with a coefficient of determination (R2=0.82). The correlation with sulphate is also not negligible (R2=0.64). This result is in contrast with the measurements presented by Marinoni et al. (2011) which highlights that H2O2 concentration is higher in air masses with anthropogenic influences compared to those from remote areas.
3.4 Dissolved organic carbon
The average concentration of dissolved organic carbon (DOC) is 2.9±2.7 mgC L−1, similar to values measured in clouds collected under free tropospheric conditions (Arakaki et al., 2013; Deguillaume et al., 2014; Lawrence et al., 2024; Löflund et al., 2002; Reyes-Rodríguez et al., 2009). The low concentration observed is probably correlated to the high LWC of the cloud sampled. Although the LWC is not measured during the campaign, the LWC for the last samples, collected on 23/10, is 0.36±0.17 g m−3. After the campaign, a Gerber PVM-100 measured the LWC for three weeks, corresponding to three cloud events. The average value is 0.35±0.1 g m−3, corresponding to stratus or cumulus clouds in the lower free troposphere. Herckes et al. (2013) reported that the DOC concentrations at LWC higher than 0.25 g m−3 are scarce, but always below 5 mgC L−1, which is consistent with the measurements at CMN. The DOC concentrations during the three periods identified in the previous discussion are 4.3±3.9, 1.6±0.4 and 3.7±1.2 mgC L−1, respectively. Although Periods 1 and 3 show similar values, the concentrations in Period 2, corresponding to the Saharan dust event, are significantly lower. Looking at the ACSM measurements, the concentration of organic matter in Period 2 is, in average, slightly higher than in Period 1, simultaneous with a remarkable increase of coarse particle. Considering that organic matter may be efficiently internally mixed with Saharan dust particles (Dall'Osto et al., 2010), the insoluble internally mixed organic matter may be filtered immediately after sampling. Hence, only a small fraction of organic matter dissolves in cloud water, leading to a lower concentration of DOC for cloud samples collected in Period 2. Unfortunately, no measurements of the unfiltered samples (total organic carbon) are performed during the MC3 campaign.
Short-chain carboxylic acids such as formic, acetic and oxalic acids, and carbonyls such as formaldehyde, acetaldehyde and acrolein (aldehydes) and acetone (ketone) are measured in the samples, as reported in Table S1. The concentrations of all the compounds are homogeneous in all the samples, apart from formic acid, which is significantly lower than the average in Period 2 and significantly higher in Period 3. Likewise, oxalic acid is significantly higher in Period 1 of the campaign and significantly lower in Period 2. Acetic and formic acid dissolve from the gas phase and their concentrations are the result of the equilibrium, controlled by Henry's law (Aiyuk et al., 2025). Oxalic acid can be produced in the aqueous phase by oxidation of its precursors (acetic, pyruvic, glyoxylic and malonic acids) and it is considered to be a proxy of aqueous phase processing, in-cloud or in wet particles (Carlton et al., 2007; Ervens et al., 2004; Lin et al., 2020), leading to the conclusion that the air masses corresponding to Period 1 are more aged than the other two. A recent article highlights that oxalic acid concentration is lower during dust episodes for PM2.5 (Yang et al., 2022); interestingly, the concentration of oxalic acid is lower during Period 2, corresponding to dust events. The concentration of carbonyls is homogeneous for all the samples, with values of 3.3±0.9, 1.6±0.4, 1.8±0.5 and 0.3±0.1 µmol L−1 for formaldehyde, acetaldehyde, acetone and acrolein, respectively. These values are in the range of concentrations measured on other sites (Deguillaume et al., 2014; Ervens et al., 2013; van Pinxteren et al., 2005).
The sum of the concentrations, in mgC L−1, of carboxylic acids and carbonyl compounds represents in average 22±12 % of the DOC, as reported in Fig. 5. This percentage is comparable to values reported in other studies on organic matter (Dominutti et al., 2022; Wang et al., 2020), which show that these VOCs (acids and carbonyls), although representing a non-negligible fraction, still constitute only a small part of the overall picture. This highlights the need for further investigations into the true diversity and complexity of organic matter.
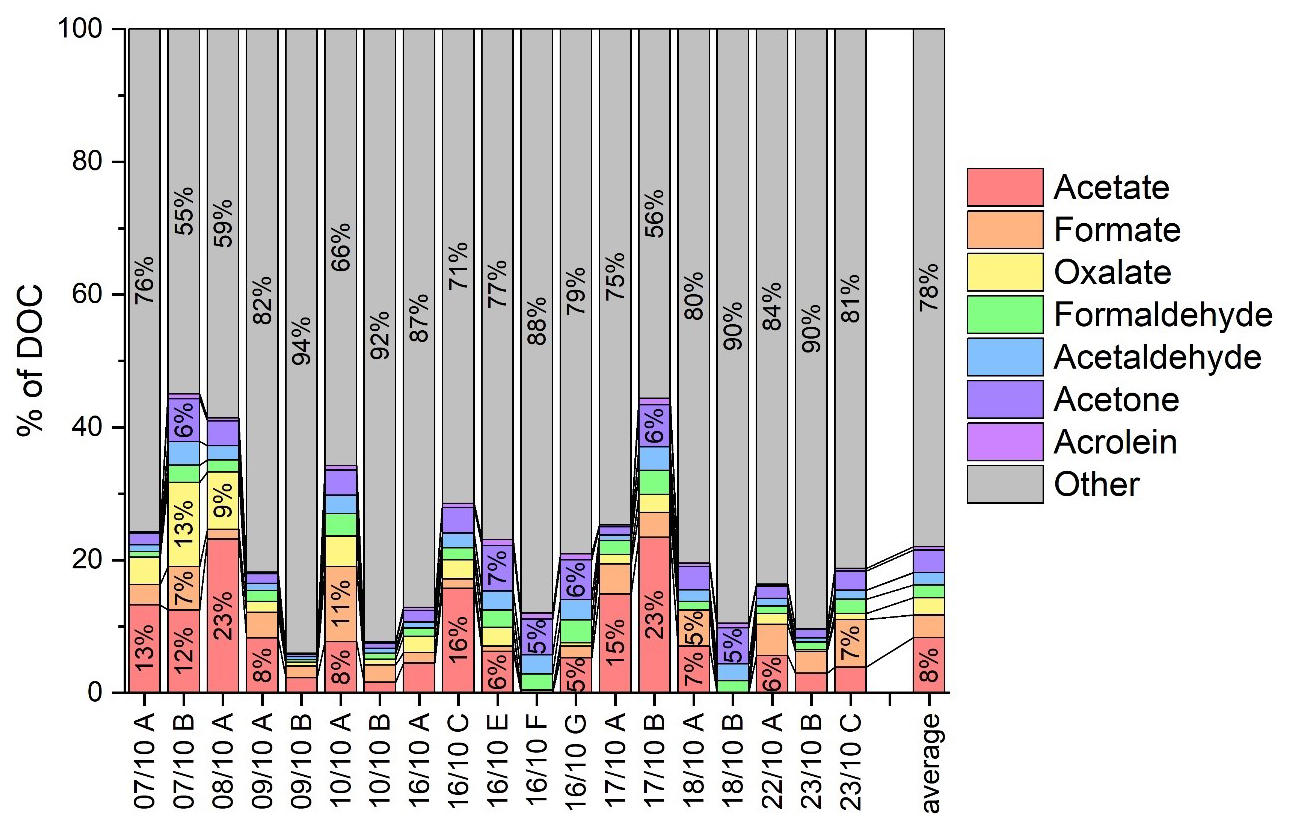
Figure 5Contributions of main carboxylic (acetic, formic, and oxalic acids) and carbonyl (formaldehyde, acetaldehyde, acetone and acrolein) compounds to the DOC concentration. The last bar on the right depicts the average for all the samples analyzed.
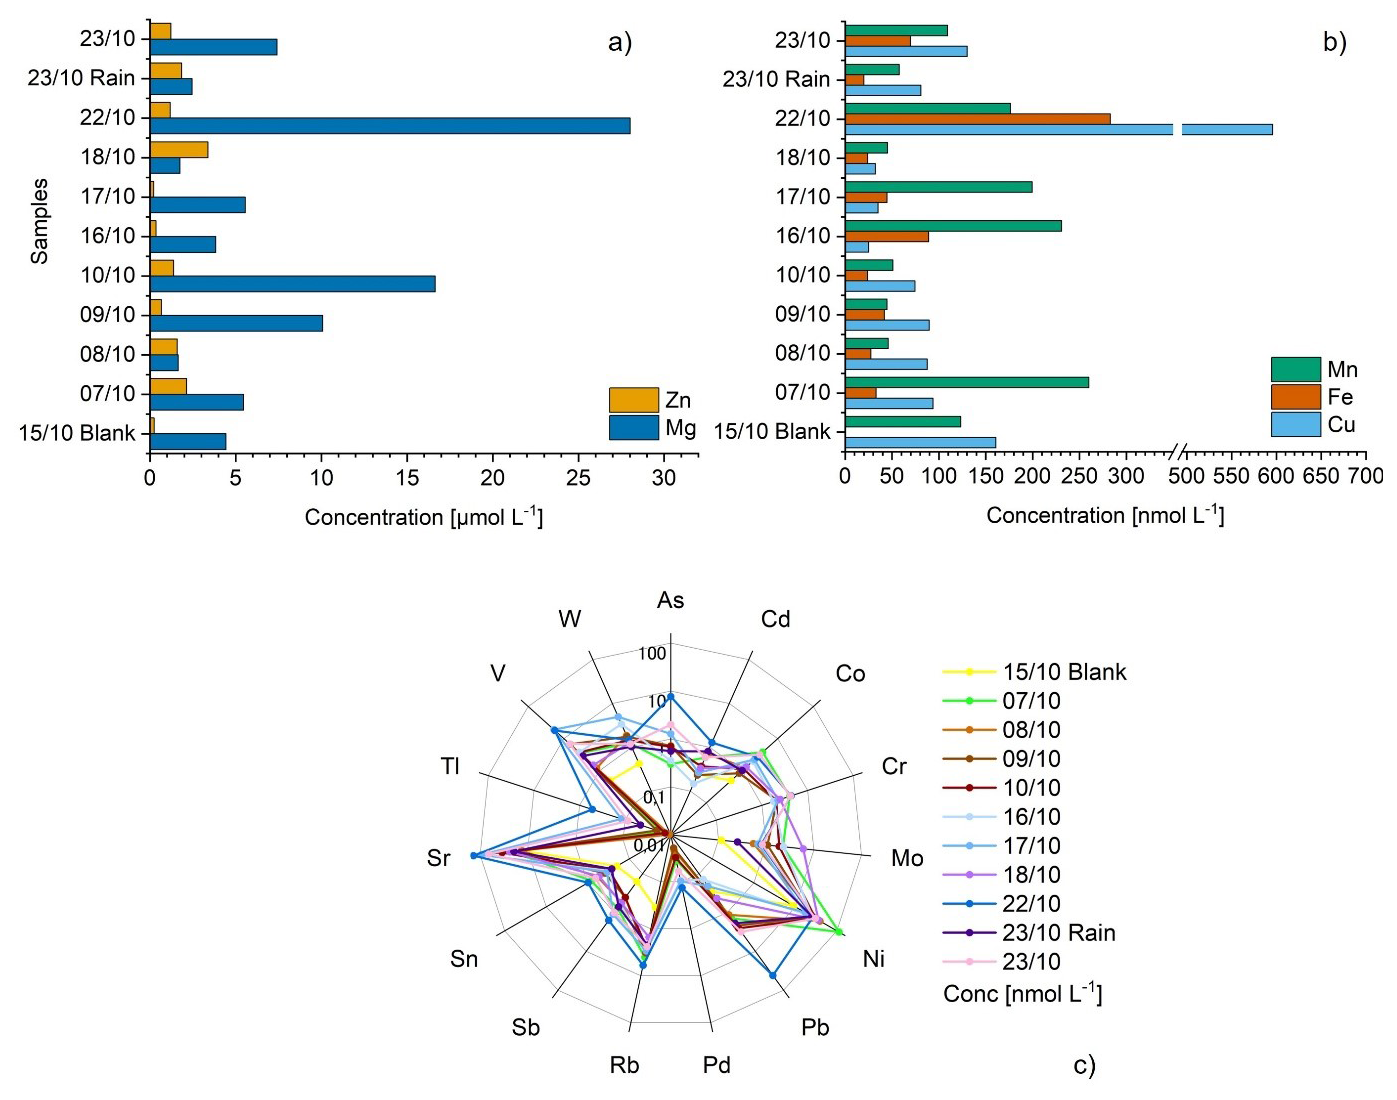
Figure 6(a) Bar plot showing the concentrations in µmol L−1 of Zn and Mg in each sample; (b) Bar plots showing the concentrations in nmol L−1 of Mn, Fe and Cu in each sample; (c) radar plot showing the concentrations of 15 different trace metals in nmol L−1 in each sample. The y-axis is reported in logarithmic scale.
3.5 Metals in cloud water
Twenty-six trace metals are analyzed in cloud water samples. Among them, 6 are under the detection limit: Ag, Be, Bi, Ga, Li and U (Table S4). The most concentrated element is Mg, coming mainly from biogenic sources, such as soil dust or sea salt (Bianco et al., 2017) and ranging from 1.7 to 28 µmol L−1. These concentrations are higher than those measured for dissolved Mg2+ by ion chromatography, confirming that Mg is contained in particles with diameter smaller than 0.2 µm, which is the pore size of the filter. Interestingly, the highest concentrations are measured for Periods 1 and 3, leading to the conclusion that Mg in Saharan dust is in the mineral form on coarse particles (Fig. 6a). The second highest element is Zn, with concentrations of 1.4±0.9 µmol L−1. This element is mainly emitted by biogenic sources and shows no trend during the campaign. Fe and Cu are also present in the samples, with concentrations ranging from 17.3 to 283 nmol L−1 for Fe, and from 25.3 to 596 nmol L−1 for Cu. The highest concentration of Fe, 0.28 µmol L−1, is in the range of measurements reported by (Bianco et al., 2017) in France and (Fomba et al., 2013) in Germany, whereas Cu highest concentration, 0.6 µmol L−1, is closer to those observed in the work of (Hutchings et al., 2009) in Arizona or (Cini et al., 2002) in Italy (Fig. 6b). These two compounds can influence the hydroxyl radical budget through their reactions with hydrogen peroxide (H2O2) and peroxyl radicals (Deguillaume et al., 2005). Ni is also present in most of the samples. It reaches its highest concentration (176.7 nmol L−1) on 07/10 A, a sample that comes mainly from S–E of Spain and that crosses the Mediterranean Sea. Nickel can be emitted by numerous sources, such as combustion of fossil fuel in trafic and industry (Shaltout et al., 2025), but it is also a good tracer of marine influence as this element is present in trace elements for aquatic organisms such as phytoplankton (John et al., 2024).
Other trace metals are also detected: As, Cd, Co, Cr, Mo, Pb, Pd, Rb, Sb, Sn, Sr, Tl, V, and W. Sample 22/10 showed the highest concentration in Sr, As, and Pb: 137.8, 7.7 and 42.1 nmol L−1, respectively (Fig. 6c). Those values are in the same range of samples analyzed at Mt. Brocken in Germany (Plessow et al., 2001) and slightly higher than in PUY (Bianco et al., 2017). These compounds mainly originated from anthropogenic sources such as fuel combustion, pesticides incineration or wood combustion. This result corroborates the hypothesis of a polluted influence on this sample.
Sb, Cd and Cr present maximum concentrations of 1.6, 1.3 and 5.5 nmol L−1, respectively. These compounds are all released into the atmosphere by anthropogenic sources, such as industries or automobile exhausts. Nevertheless, the concentrations measured are very low compared to measurements reported on other sites, such as Mt. Brocken (Plessow et al., 2001), which is probably explained by the overall atmospheric circulation during the campaign that is mainly from marine origin and thus not strongly affected by pollution emission from anthropogenic sources.
Finally, the Zn Sb ratio can indicate whether the air masses are more influenced by marine source, or by pollution. Wilkinson et al. (1997) define a threshold value for the Zn Sb ratio: air masses with a ratio higher than 80 are more influenced by marine sources, whereas those with a ratio lower than 80 are more influenced by pollution. Considering this ratio across the 14 cloud water samples, the Zn/Sb ratio is always higher than 80 indicating that all of air masses are under marine influence. This is consistent with the cloud back-trajectories, all of them always crossed the Mediterranean Sea, strongly impacting the samples.
3.6 Microbiological analysis
Living microorganisms are ubiquitous in the atmosphere. Most of them originate from vegetation, soil and sea and can travel long distances (Griffin et al., 2001). It is thus particularly important to better understand their impact on cloud water, as they may modify cloud composition and reactivity (Delort et al., 2017). As reported in the Sect. 2.7, cloud samples dedicated to microbiological analysis are collected in sterile conditions. The two collectors deployed are operated almost at the same time. Nevertheless, some time differences are unavoidable, mainly due to the mounting and dismounting of the collectors. The precise sampling times are reported in Table S1. Tables S5 and S6 details the concentrations of culturable bacteria-like CFUs and mycelial fungi, and total cells for each cloud sample in which a microbiological analyses are carried out.
Cell concentrations are highest during 16 and 17 October sampling events (samples A and B), ranging from to cells mL−1. This peak is likely explained by a Saharan dust event occurring on those dates, which transports large quantities of particles and likely increase the number of particle-attached microorganisms. Interestingly, culturable cell concentration do not follow this trend, with only 470 culturable cells mL−1 (including both mycelium and colony-forming units), a value very close to the median culturable concentration for the entire campaign (median =470 cells mL−1; range = 400–563 cells mL−1). This sample is also one of only two in which bacteria-like CFUs outnumber mycelium-forming units, the other being collected on 07/10. However, this pattern does not appear to be related to air mass origin, as the two samples are under Saharan and marine influence, respectively. Samples influenced by marine air masses contained 8.0×10³ to 4.1×10⁴ cells mL−1, approximately one order of magnitude lower than in Saharan-influenced clouds. These concentration differences are associated with the altitude of air mass transport over the Mediterranean Sea. In comparison, polluted clouds contain between 3.1×10⁴ and 1.4×10⁵ cells mL−1. These values are within the range typically observed in cloud water at puy de Dôme 1465 m, Central France, a site exposed to air masses from oceanic and continental influences), between to cells mL−1. Typically, the abundance of airborne microbes increases with the influence of terrestrial sources (Mayol et al., 2017), and is higher in urban compared to continental and coastal environments (Shaffer and Lighthart, 1997). Values as low as <103 bacteria cells m−3 of air are reported near the surface over oceans (Mayol et al., 2017; Rossi et al., 2025). Consecutive sampling on 17/10 (2 h interval, same cloud event) reveals marked differences in culturable microbial concentrations (20 vs 63 bacteria-like CFUs mL−1, and 427 vs 163 mycelium-forming units for samples A and B, respectively), despite no significant variation in total cell concentrations (2.4×10⁵ vs 2.9×10⁶ cells mL−1). This illustrates the dynamic nature of clouds, even on short timescales: while total microbial abundance may remain relatively stable, community viability and culturability can fluctuate rapidly, likely due to environmental change or microphysical processes within the cloud. Consistently with our observations, it is typically reported that less than 1 % of the total bacteria in clouds can be recovered by culture under classical conditions, while fungi often maintain higher cultivability rate (e.g., Vaitilingom et al., 2012). The ability of microbial cells to form colonies (i.e. grow on a culture medium) can be influenced by multiple factors including viability, culture conditions, and others less well-understood mechanisms leading to a viable-but-non-culturable (VBNC) state (Pinto et al., 2015). This VBNC state is often recognized in bacteria as a strategy to tolerate stressful environmental conditions (Dong et al., 2020).
Overall, cell concentrations measured at Monte Cimone are consistent with those reported at other cloud sampling sites (∼103 to 105 cells mL−1) (Amato et al., 2005; Bauer et al., 2002; Sattler et al., 2001). On average, cultivable cells represent only 0.5 %–6 % of the total community, a proportion commonly observed in atmospheric samples (Amato et al., 2007). Although they represent a small fraction of the total microorganisms present in samples, cultivable organisms remain essential for downstream applications such as laboratory experiments (e.g. Vaïtilingom et al., 2013) or cloud simulation chamber studies (e.g. Amato et al., 2015).
We present here the characterization of 26 cloud water samples collected for the first time at CMN during the MC3 campaign. This study shows that samples with similar ionic content may have distinct atmospheric origins. Consequently, a combined approach integrating both back-trajectory analysis and measurements of ion concentrations in water and aerosol particles was essential for an accurate and representative classification of cloud water samples being influenced by marine, Saharan and anthropogenic air masses.
The analysis of oxidants reveals a relationship between H2O2 concentrations with both NO and SO, showing that its concentration is higher in anthropogenic-influenced air masses than in remote ones. Moreover this work confirms that the photochemical depletion of H2O2 is larger throughout the day, as reported by other cloud water studies.
The dissolved organic carbon (DOC) is measured for most of the samples and we found concentrations and variability similar to those presented for clouds collected in free tropospheric conditions. Short chain carboxylic acids, aldehydes and ketons represent 20 % in average of the DOC concentration. An average of 78 % remains unknown, strengthening the idea that more research is needed to characterize the organic matter in clouds to understand the chemical processing in the aqueous phase.
During the campaign we measured also the cloud water microbial content, providing cell concentrations and speciation into fungi and bacteria for cultivable microorganisms. The DNA analysis is also performed and will be presented in a future work, providing an additional characterisation of the atmospheric microbiota in the free troposphere.
Overall, the MC3 campaign provides a unique insight into cloud composition in the Mediterranean basin, a region where in situ observations remain scarce, thereby limiting a comprehensive understanding of cloud chemistry and aerosol–cloud interactions.
CO and meteorological variables at CMN are available through the ICOS Carbon Portal (https://data.icos-cp.eu/, last access: 5 March 2026). The ozone and NOx data can be retrieved from the WMO/GAW World Data Center for Reactive Gases (WDCRG) hosted by NILU (https://ebas.nilu.no/, last access: 24 October 2022). Dust products are available at DOI: https://doi.org/10.71763/XDZA-FA77 (Vogel et al., 2025a), while eBC product at DOI: https://doi.org/10.71763/itineris-hub/nfy7-yz86 (Zanatta et al., 2025). Aerosol chemical composition is available on EBAS database https://ebas-data.nilu.no/Pages/DataSetList.aspx?key=FA24E18FDDA640B4A3E2699777225D05 (last access: 5 March 2026).
Meteorological data are available at PID https://hdl.handle.net/11676/-23mwxRlF7b_gqqmw3KyhAfi (Cristofanelli et al., 2025), and CO at PID: https://hdl.handle.net/11676/-23mwxRlF7b_gqqmw3KyhAfi.
The supplement related to this article is available online at https://doi.org/10.5194/acp-26-6489-2026-supplement.
Conceptualization: AB, AM, MZ Methodology: AB, PN, YW, MZ, MJ, JLP, AM, JLB Investigation: PN, AB, PC, DP, MZ, FV Resources: PN, YW, CV, PC, MJ, FC, SM, LR, AM Software: CV, JLB Visualization: PN, AB, PC Funding acquisition: PC, AB, AM, MZ Project administration: PC, AB, AM, MZ Supervision: AB, MB, LD, MZ Writing – original draft: PN, MZ, AB Writing – review & editing: AB, PN, YW, MJ, PA, PC, DP, LR, MR, MB, JLB, LD, AM, MZ.
The contact author has declared that none of the authors has any competing interests.
Publisher's note: Copernicus Publications remains neutral with regard to jurisdictional claims made in the text, published maps, institutional affiliations, or any other geographical representation in this paper. The authors bear the ultimate responsibility for providing appropriate place names. Views expressed in the text are those of the authors and do not necessarily reflect the views of the publisher.
CNR-ISAC is grateful to the Italian Air Force (CAMM Monte Cimone) for the logistic support and the hospitality. AB and PN deeply thank Uwe Käfer, Dominik van Pinxteren and Stephan Mertes for lending the PVM.
The BOOGIE collectors are developed within the framework of COPDD and OPGC (funded by “action incitatives”, among others).
The Ministry for University and Research supports CO and meteorological observations at CMN through the Joint Research Unit ICOS-Italy. The MC3 campaign is part of a Transnational access project that is supported by the European Commission under the Horizon 2020 – Research and Innovation Framework Programme, H2020-INFRAIA-2020-1, ATMO-ACCESS Grant Agreement number: 101008004. Agence Nationale de la Recherche, grant ANR-23-CE01-0015-01.
This paper was edited by Imre Salma and reviewed by four anonymous referees.
Aiyuk, M. B. E., Tilgner, A., Hoffmann, E. H., van Pinxteren, D., Wolke, R., and Herrmann, H.: Bulk-Interface Partitioning Explains the Enrichment of Organic Compounds in Cloudwater, ACS ES&T Air, 2, 1640–1647, https://doi.org/10.1021/acsestair.5c00102, 2025.
Amato, P., Joly, M., Schaupp, C., Attard, E., Möhler, O., Morris, C. E., Brunet, Y., and Delort, A.-M.: Survival and ice nucleation activity of bacteria as aerosols in a cloud simulation chamber, Atmos. Chem. Phys., 15, 6455–6465, https://doi.org/10.5194/acp-15-6455-2015, 2015.
Amato, P., Ménager, M., Sancelme, M., Laj, P., Mailhot, G., and Delort, A.-M.: Microbial population in cloud water at the Puy de Dôme: Implications for the chemistry of clouds, Atmos. Environ., 39, 4143–4153, https://doi.org/10.1016/j.atmosenv.2005.04.002, 2005.
Amato, P., Parazols, M., Sancelme, M., Laj, P., Mailhot, G., and Delort, A.-M.: Microorganisms isolated from the water phase of tropospheric clouds at the Puy de Dôme: Major groups and growth abilities at low temperatures, FEMS Microbiol. Ecol., 59, 242–254, https://doi.org/10.1111/j.1574-6941.2006.00199.x, 2007.
Arakaki, T., Anastasio, C., Kuroki, Y., Nakajima, H., Okada, K., Kotani, Y., Handa, D., Azechi, S., Kimura, T., Tsuhako, A., and Miyagi, Y.: A General Scavenging Rate Constant for Reaction of Hydroxyl Radical with Organic Carbon in Atmospheric Waters, Environ. Sci. Technol., 47, https://doi.org/10.1021/es401927b, 2013.
Bader, H., Sturzenegger, V., and Hoigné, J.: Photometric method for the determination of low concentrations of hydrogen peroxide by the peroxidase catalyzed oxidation of N,N-diethyl-p-phenylenediamine (DPD), Water Res., 22, 1109–1115, https://doi.org/10.1016/0043-1354(88)90005-X, 1988.
Baray, J.-L., Deguillaume, L., Colomb, A., Sellegri, K., Freney, E., Rose, C., Van Baelen, J., Pichon, J.-M., Picard, D., Fréville, P., Bouvier, L., Ribeiro, M., Amato, P., Banson, S., Bianco, A., Borbon, A., Bourcier, L., Bras, Y., Brigante, M., Cacault, P., Chauvigné, A., Charbouillot, T., Chaumerliac, N., Delort, A.-M., Delmotte, M., Dupuy, R., Farah, A., Febvre, G., Flossmann, A., Gourbeyre, C., Hervier, C., Hervo, M., Huret, N., Joly, M., Kazan, V., Lopez, M., Mailhot, G., Marinoni, A., Masson, O., Montoux, N., Parazols, M., Peyrin, F., Pointin, Y., Ramonet, M., Rocco, M., Sancelme, M., Sauvage, S., Schmidt, M., Tison, E., Vaïtilingom, M., Villani, P., Wang, M., Yver-Kwok, C., and Laj, P.: Cézeaux-Aulnat-Opme-Puy De Dôme: a multi-site for the long-term survey of the tropospheric composition and climate change, Atmos. Meas. Tech., 13, 3413–3445, https://doi.org/10.5194/amt-13-3413-2020, 2020.
Bauer, H., Kasper-Giebl, A., Löflund, M., Giebl, H., Hitzenberger, R., Zibuschka, F., and Puxbaum, H.: The contribution of bacteria and fungal spores to the organic carbon content of cloud water, precipitation and aerosols, Atmos. Res., 64, 109–119, https://doi.org/10.1016/S0169-8095(02)00084-4, 2002.
Benedict, K. B., Lee, T., and Collett, J. L.: Cloud water composition over the southeastern Pacific Ocean during the VOCALS regional experiment, Atmos. Environ., 46, 104–114, https://doi.org/10.1016/j.atmosenv.2011.10.029, 2012.
Bianco, A., Passananti, M., Brigante, M., and Mailhot, G.: Photochemistry of the Cloud Aqueous Phase: A Review, Molecules, 25, https://doi.org/10.3390/molecules25020423, 2020.
Bianco, A., Passananti, M., Perroux, H., Voyard, G., Mouchel-Vallon, C., Chaumerliac, N., Mailhot, G., Deguillaume, L., and Brigante, M.: A better understanding of hydroxyl radical photochemical sources in cloud waters collected at the puy de Dôme station – experimental versus modelled formation rates, Atmos. Chem. Phys., 15, 9191–9202, https://doi.org/10.5194/acp-15-9191-2015, 2015.
Bianco, A., Vaïtilingom, M., Bridoux, M., Chaumerliac, N., Pichon, J.-M., Piro, J.-L., and Deguillaume, L.: Trace Metals in Cloud Water Sampled at the Puy De Dôme Station, Atmosphere, 8, 225, https://doi.org/10.3390/atmos8110225, 2017.
Błaś, M., Sobik, M., and Twarowski, R.: Changes of cloud water chemical composition in the Western Sudety Mountains, Poland, Atmos. Res., 87, 224–231, https://doi.org/10.1016/j.atmosres.2007.11.004, 2008.
Brege, M., Paglione, M., Gilardoni, S., Decesari, S., Facchini, M. C., and Mazzoleni, L. R.: Molecular insights on aging and aqueous-phase processing from ambient biomass burning emissions-influenced Po Valley fog and aerosol, Atmos. Chem. Phys., 18, 13197–13214, https://doi.org/10.5194/acp-18-13197-2018, 2018.
Brüggemann, E., Gnauk, T., Mertes, S., Acker, K., Auel, R., Wieprecht, W., Möller, D., Collett, J. L., Chang, H., Galgon, D., Chemnitzer, R., Rüd, C., Junek, R., Wiedensohler, W., and Herrmann, H.: Schmücke hill cap cloud and valley stations aerosol characterisation during FEBUKO (I): Particle size distribution, mass, and main components, Atmos. Environ., 39, 4291–4303, https://doi.org/10.1016/j.atmosenv.2005.02.013, 2005.
Carlton, A. G., Turpin, B. J., Altieri, K. E., Seitzinger, S., Reff, A., Lim, H.-J., and Ervens, B.: Atmospheric oxalic acid and SOA production from glyoxal: Results of aqueous photooxidation experiments, Atmos. Environ., 41, https://doi.org/10.1016/j.atmosenv.2007.05.035, 2007.
Ceppi, P., Brient, F., Zelinka, M. D., and Hartmann, D. L.: Cloud feedback mechanisms and their representation in global climate models, WIREs Clim. Change, 8, e465, https://doi.org/10.1002/wcc.465, 2017.
Cini, R., Prodi, F., Santachiara, G., Porcù, F., Bellandi, S., Stortini, A. M., Oppo, C., Udisti, R., and Pantani, F.: Chemical characterization of cloud episodes at a ridge site in Tuscan Appennines, Italy, Atmos. Res., 61, 311–334, https://doi.org/10.1016/S0169-8095(01)00139-9, 2002.
Collett, J. L., Herckes, P., Youngster, S., and Lee, T.: Processing of atmospheric organic matter by California radiation fogs, Atmos. Res., 87, 3–4, https://doi.org/10.1016/j.atmosres.2007.11.005, 2008.
Cristofanelli, P. and Montaguti, S.: ICOS ATC NRT N2O growing time series from Monte Cimone (8.0 m), 2024-06-04–2025-06-20, Atmosphere Thematic Centre [data set], https://hdl.handle.net/11676/UE738GMjzM8vkKUqzr1qQHh1, 2025.
Cristofanelli, P., Montaguti, S., and Trisolino, P.: ICOS ATC Meteo Release from Monte Cimone (8.0 m), 2018-05-01–2025-03-31, ICOS RI [data set], https://hdl.handle.net/11676/-23mwxRlF7b_gqqmw3KyhAfi, 2025.
Cristofanelli, P. and Trisolino, P.: ICOS ATC NRT Meteo growing time series from Monte Cimone (8.0 m), 2020-06-01–2021-05-24, Atmosphere Thematic Centre [data set], https://hdl.handle.net/11676/0hIvxLWcme_p4OGXhQTkF6ab, 2021.
Dall'Osto, M., Harrison, R. M., Highwood, E. J., O'Dowd, C., Ceburnis, D., Querol, X., and Achterberg, E. P.: Variation of the mixing state of Saharan dust particles with atmospheric transport, Atmos. Environ., 44, 3135–3146, https://doi.org/10.1016/j.atmosenv.2010.05.030, 2010.
Deguillaume, L., Charbouillot, T., Joly, M., Vaïtilingom, M., Parazols, M., Marinoni, A., Amato, P., Delort, A.-M., Vinatier, V., Flossmann, A., Chaumerliac, N., Pichon, J. M., Houdier, S., Laj, P., Sellegri, K., Colomb, A., Brigante, M., and Mailhot, G.: Classification of clouds sampled at the puy de Dôme (France) based on 10 yr of monitoring of their physicochemical properties, Atmos. Chem. Phys., 14, 1485–1506, https://doi.org/10.5194/acp-14-1485-2014, 2014.
Deguillaume, L., Leriche, M., Amato, P., Ariya, P. A., Delort, A.-M., Pöschl, U., Chaumerliac, N., Bauer, H., Flossmann, A. I., and Morris, C. E.: Microbiology and atmospheric processes: chemical interactions of primary biological aerosols, Biogeosciences, 5, 1073–1084, https://doi.org/10.5194/bg-5-1073-2008, 2008.
Deguillaume, L., Leriche, M., Desboeufs, K., Mailhot, G., George, C., and Chaumerliac, N.: Transition Metals in Atmospheric Liquid Phases: Sources, Reactivity, and Sensitive Parameters, Chem. Rev., 105, https://doi.org/10.1021/cr040649c, 2005.
Delort, A.-M., Deguillaume, L., Renard, P., Vinatier, V., Canet, I., Vaïtilingom, M., and Chaumerliac, N.: Impacts on Cloud Chemistry, in: Microbiology of Aerosols, John Wiley & Sons, Ltd., 221–248, https://doi.org/10.1002/9781119132318.ch3b, 2017.
Denjean, C., Cassola, F., Mazzino, A., Triquet, S., Chevaillier, S., Grand, N., Bourrianne, T., Momboisse, G., Sellegri, K., Schwarzenbock, A., Freney, E., Mallet, M., and Formenti, P.: Size distribution and optical properties of mineral dust aerosols transported in the western Mediterranean, Atmos. Chem. Phys., 16, 1081–1104, https://doi.org/10.5194/acp-16-1081-2016, 2016.
Desyaterik, Y., Sun, Y., Shen, X., Lee, T., Wang, X., Wang, T., and Collett, J. L.: Speciation of “brown” carbon in cloud water impacted by agricultural biomass burning in eastern China: “brown” carbon speciation in cloud water, J. Geophys. Res.-Atmos., 118, 7389–7399, https://doi.org/10.1002/jgrd.50561, 2013.
Dominutti, P. A., Renard, P., Vaïtilingom, M., Bianco, A., Baray, J.-L., Borbon, A., Bourianne, T., Burnet, F., Colomb, A., Delort, A.-M., Duflot, V., Houdier, S., Jaffrezo, J.-L., Joly, M., Leremboure, M., Metzger, J.-M., Pichon, J.-M., Ribeiro, M., Rocco, M., Tulet, P., Vella, A., Leriche, M., and Deguillaume, L.: Insights into tropical cloud chemistry in Réunion (Indian Ocean): results from the BIO-MAÏDO campaign, Atmos. Chem. Phys., 22, 505–533, https://doi.org/10.5194/acp-22-505-2022, 2022.
Dong, K., Pan, H., Yang, D., Rao, L., Zhao, L., Wang, Y., and Liao, X.: Induction, detection, formation, and resuscitation of viable but non-culturable state microorganisms, Compr. Rev. Food Sci. Food Saf., 19, 149–183, https://doi.org/10.1111/1541-4337.12513, 2020.
Duchi, R., Cristofanelli, P., Landi, T. C., Arduini, J., Bonafé, U., Bourcier, L., Busetto, M., Calzolari, F., Marinoni, A., Putero, D., and Bonasoni, P.: Long-term (2002–2012) investigation of Saharan dust transport events at Mt. Cimone GAW global station, Italy (2165 m a.s.l.), Elementa: Sci. Anthropocene, 4, 000085, https://doi.org/10.12952/journal.elementa.000085, 2016.
Ervens, B.: Modeling the Processing of Aerosol and Trace Gases in Clouds and Fogs, Chem. Rev., 115, https://doi.org/10.1021/cr5005887, 2015.
Ervens, B., Feingold, G., Frost, G. J., and Kreidenweis, S. M.: A modeling study of aqueous production of dicarboxylic acids: 1. Chemical pathways and speciated organic mass production, J. Geophys. Res.-Atmos., 109, https://doi.org/10.1029/2003JD004387, 2004.
Ervens, B., Wang, Y., Eagar, J., Leaitch, W. R., Macdonald, A. M., Valsaraj, K. T., and Herckes, P.: Dissolved organic carbon (DOC) and select aldehydes in cloud and fog water: the role of the aqueous phase in impacting trace gas budgets, Atmos. Chem. Phys., 13, 5117–5135, https://doi.org/10.5194/acp-13-5117-2013, 2013.
Fomba, K. W., Müller, K., van Pinxteren, D., and Herrmann, H.: Aerosol size-resolved trace metal composition in remote northern tropical Atlantic marine environment: case study Cape Verde islands, Atmos. Chem. Phys., 13, 4801–4814, https://doi.org/10.5194/acp-13-4801-2013, 2013.
Fröhlich, R., Cubison, M. J., Slowik, J. G., Bukowiecki, N., Prévôt, A. S. H., Baltensperger, U., Schneider, J., Kimmel, J. R., Gonin, M., Rohner, U., Worsnop, D. R., and Jayne, J. T.: The ToF-ACSM: a portable aerosol chemical speciation monitor with TOFMS detection, Atmos. Meas. Tech., 6, 3225–3241, https://doi.org/10.5194/amt-6-3225-2013, 2013.
Giulianelli, L., Gilardoni, S., Tarozzi, L., Rinaldi, M., Decesari, S., Carbone, C., Facchini, M. C., and Fuzzi, S.: Fog occurrence and chemical composition in the Po valley over the last twenty years, Atmos. Environ., 98, 394–401, https://doi.org/10.1016/j.atmosenv.2014.08.080, 2014.
Griffin, D. W., Garrison, V. H., Herman, J. R., and Shinn, E. A.: African desert dust in the Caribbean atmosphere: Microbiology and public health, Aerobiologia, 17, 203–213, https://doi.org/10.1023/A:1011868218901, 2001.
Guo, J., Wang, Y., Shen, X., Wang, Z., Lee, T., Wang, X., Li, P., Sun, M., Collett, J. L., Wang, W., and Wang, T.: Characterization of cloud water chemistry at Mount Tai, China: Seasonal variation, anthropogenic impact, and cloud processing, Atmos. Environ., 60, 467–476, https://doi.org/10.1016/j.atmosenv.2012.07.016, 2012.
Hazan, L., Tarniewicz, J., Ramonet, M., Laurent, O., and Abbaris, A.: Automatic processing of atmospheric CO2 and CH4 mole fractions at the ICOS Atmosphere Thematic Centre, Atmos. Meas. Tech., 9, 4719–4736, https://doi.org/10.5194/amt-9-4719-2016, 2016.
Herckes, P., Valsaraj, K. T., and Collett, J. L.: A review of observations of organic matter in fogs and clouds: Origin, processing and fate, Atmos. Res., 132–133, 434–449, https://doi.org/10.1016/j.atmosres.2013.06.005, 2013.
Herrmann, H.: Kinetics of Aqueous Phase Reactions Relevant for Atmospheric Chemistry, Chem. Rev., 103, 4691–4716, https://doi.org/10.1021/cr020658q, 2003.
Herrmann, H., Schaefer, T., Tilgner, A., Styler, S. A., Weller, C., Teich, M., and Otto, T.: Tropospheric Aqueous-Phase Chemistry: Kinetics, Mechanisms, and Its Coupling to a Changing Gas Phase, Chem. Rev., 115, 4259–4334, https://doi.org/10.1021/cr500447k, 2015.
Herrmann, H., Wolke, R., Müller, K., Brüggemann, E., Gnauk, T., Barzaghi, P., Mertes, S., Lehmann, K., Massling, A., Birmili, W., Wiedensohler, A., Wieprecht, W., Acker, K., Jaeschke, W., Kramberger, H., Svrcina, B., Bächmann, K., Collett, J. L., Galgon, D., Schwirn, K., Nowak, A., van Pinxteren, D., Plewka, A., Chemnitzer, R., Rüd, C., Hofmann, D., Tilgner, A., Diehl, K., Heinold, B., Hinneburg, D., Knoth, O., Sehili, A. M., Simmel, M., Wurzler, S., Majdik, Z., Mauersberger, G., and Müller, F.: FEBUKO and MODMEP: Field measurements and modelling of aerosol and cloud multiphase processes, Atmos. Environ., 39, 4169–4183, https://doi.org/10.1016/j.atmosenv.2005.02.004, 2005.
Hutchings, J. W., Robinson, M. S., McIlwraith, H., Triplett Kingston, J., and Herckes, P.: The Chemistry of Intercepted Clouds in Northern Arizona during the North American Monsoon Season, Water Air Soil Pollut., 199, 191–202, https://doi.org/10.1007/s11270-008-9871-0, 2009.
John, S. G., Liang, H., Pasquier, B., Holzer, M., and Silva, S.: Biogeochemical Fluxes of Nickel in the Global Oceans Inferred From a Diagnostic Model, Global Biogeochem. Cy., 38, e2023GB008018, https://doi.org/10.1029/2023GB008018, 2024.
Joly, M., Amato, P., Sancelme, M., Vinatier, V., Abrantes, M., Deguillaume, L., and Delort, A.-M.: Survival of microbial isolates from clouds toward simulated atmospheric stress factors, Atmos. Environ., 117, 92–98, https://doi.org/10.1016/j.atmosenv.2015.07.009, 2015.
Keene, W. C., Pszenny, A. A. P., Galloway, J. N., and Hawley, M. E.: Sea-salt corrections and interpretation of constituent ratios in marine precipitation, J. Geophys. Res.-Atmos., 91, 6647–6658, https://doi.org/10.1029/JD091iD06p06647, 1986.
Laj, P., Flossmann, A. I., Wobrock, W., Fuzzi, S., Orsi, G., Ricci, L., Mertes, S., Schwarzenböck, A., Heintzenberg, J., and Ten Brink, H.: Behaviour of H2O2, NH3, and black carbon in mixed-phase clouds during CIME, Atmos. Res., 58, 315–336, https://doi.org/10.1016/S0169-8095(01)00097-7, 2001.
Lance, S., Zhang, J., Schwab, J. J., Casson, P., Brandt, R. E., Fitzjarrald, D. R., Schwab, M. J., Sicker, J., Lu, C.-H., Chen, S.-P., Yun, J., Freedman, J. M., Shrestha, B., Min, Q., Beauharnois, M., Crandall, B., Joseph, E., Brewer, M. J., Minder, J. R., Orlowski, D., Christiansen, A., Carlton, A. G., and Barth, M. C.: Overview of the CPOC Pilot Study at Whiteface Mountain, NY: Cloud Processing of Organics within Clouds (CPOC), B. Am. Meteor. Soc., 101, E1820–E1841, https://doi.org/10.1175/BAMS-D-19-0022.1, 2020.
Lawrence, C., Barth, M., Orlando, J., Casson, P., Brandt, R., Kelting, D., Yerger, E., and Lance, S.: Process analysis of elevated concentrations of organic acids at Whiteface Mountain, New York, Atmos. Chem. Phys., 24, 13693–13713, https://doi.org/10.5194/acp-24-13693-2024, 2024.
Lawrence, C. E., Casson, P., Brandt, R., Schwab, J. J., Dukett, J. E., Snyder, P., Yerger, E., Kelting, D., VandenBoer, T. C., and Lance, S.: Long-term monitoring of cloud water chemistry at Whiteface Mountain: the emergence of a new chemical regime, Atmos. Chem. Phys., 23, 1619–1639, https://doi.org/10.5194/acp-23-1619-2023, 2023.
Lê, S., Josse, J., and Husson, F.: FactoMineR: An R Package for Multivariate Analysis, J. Stat. Softw., 25, https://doi.org/10.18637/jss.v025.i01, 2008.
Li, J., Wang, X., Chen, J., Zhu, C., Li, W., Li, C., Liu, L., Xu, C., Wen, L., Xue, L., Wang, W., Ding, A., and Herrmann, H.: Chemical composition and droplet size distribution of cloud at the summit of Mount Tai, China, Atmos. Chem. Phys., 17, 9885–9896, https://doi.org/10.5194/acp-17-9885-2017, 2017.
Li, T., Wang, Z., Wang, Y., Wu, C., Liang, Y., Xia, M., Yu, C., Yun, H., Wang, W., Wang, Y., Guo, J., Herrmann, H., and Wang, T.: Chemical characteristics of cloud water and the impacts on aerosol properties at a subtropical mountain site in Hong Kong SAR, Atmos. Chem. Phys., 20, 391–407, https://doi.org/10.5194/acp-20-391-2020, 2020.
Lin, Q., Yang, Y., Fu, Y., Jiang, F., Zhang, G., Peng, L., Lian, X., Bi, X., Li, L., Chen, D., Ou, J., Tang, M., Wang, X., Peng, P., and Sheng, G.: The reductions of oxalate and its precursors in cloud droplets relative to wet particles, Atmos. Environ., 235, 117632, https://doi.org/10.1016/j.atmosenv.2020.117632, 2020.
Liu, Y., Lim, C. K., Shen, Z., Lee, P. K. H., and Nah, T.: Effects of pH and light exposure on the survival of bacteria and their ability to biodegrade organic compounds in clouds: implications for microbial activity in acidic cloud water, Atmos. Chem. Phys., 23, 1731–1747, https://doi.org/10.5194/acp-23-1731-2023, 2023.
Löflund, M., Kasper-Giebl, A., Schuster, B., Giebl, H., Hitzenberger, R., and Puxbaum, H.: Formic, acetic, oxalic, malonic and succinic acid concentrations and their contribution to organic carbon in cloud water, Atmos. Environ., 36, https://doi.org/10.1016/S1352-2310(01)00573-8, 2002.
Marinoni, A., Parazols, M., Brigante, M., Deguillaume, L., Amato, P., Delort, A.-M., Laj, P., and Mailhot, G.: Hydrogen peroxide in natural cloud water: Sources and photoreactivity, Atmos. Res., 101, 256–263, https://doi.org/10.1016/j.atmosres.2011.02.013, 2011.
Mayol, E., Arrieta, J. M., Jiménez, M. A., Martínez-Asensio, A., Garcias-Bonet, N., Dachs, J., González-Gaya, B., Royer, S.-J., Benítez-Barrios, V. M., Fraile-Nuez, E., and Duarte, C. M.: Long-range transport of airborne microbes over the global tropical and subtropical ocean, Nat. Commun., 8, 201, https://doi.org/10.1038/s41467-017-00110-9, 2017.
Mazzini, M., Aliaga, D., Lamphilati, J., Gysel-Beer, M., Brem, B. T., Modini, R. L., Heslin-Rees, D., Hussein, T., Zanatta, M., Cristofanelli, P., Bianchi, F., Kulmala, M., and Marinoni, A.: Aerosol Size Distribution and New Particle Formation in High Mountain Environments: A Comparative Study at Monte Cimone and Jungfraujoch GAW Stations, EGUsphere [preprint], https://doi.org/10.5194/egusphere-2025-3842, 2025.
Middlebrook, A. M., Bahreini, R., Jimenez, J. L., and Canagaratna, M. R.: Evaluation of composition-dependent collection efficiencies for the Aerodyne Aerosol Mass Spectrometer using field data, Aerosol Sci. Technol., 46, 258–271, https://doi.org/10.1080/02786826.2011.620041, 2012.
Möhler, O., DeMott, P. J., Vali, G., and Levin, Z.: Microbiology and atmospheric processes: the role of biological particles in cloud physics, Biogeosciences, 4, 1059–1071, https://doi.org/10.5194/bg-4-1059-2007, 2007.
Mohnen, V. A. and Kadlecek, J. A.: Cloud chemistry research at Whiteface Mountain, Tellus B, 41, 79–91, https://doi.org/10.3402/tellusb.v41i1.15052, 1989.
Ng, N. L., Canagaratna, M. R., Jimenez, J. L., Zhang, Q., Ulbrich, I. M., and Worsnop, D. R.: Real-time methods for estimating organic component mass concentrations from aerosol mass spectrometer data, Environ. Sci. Technol., 45, 910–916, https://doi.org/10.1021/es102951k, 2011.
Oduber, F., Calvo, A. I., Castro, A., Blanco-Alegre, C., Alves, C., Barata, J., Nunes, T., Lucarelli, F., Nava, S., Calzolai, G., Cerqueira, M., Martín-Villacorta, J., Esteves, V., and Fraile, R.: Chemical composition of rainwater under two events of aerosol transport: A Saharan dust outbreak and wildfires, Sci. Total Environ., 734, 139202, https://doi.org/10.1016/j.scitotenv.2020.139202, 2020.
O'Sullivan, D. W., Lee, M., Noone, B. C., and Heikes, B. G.: Henry's Law Constant Determinations for Hydrogen Peroxide, Methyl Hydroperoxide, Hydroxymethyl Hydroperoxide, Ethyl Hydroperoxide, and Peroxyacetic Acid, J. Phys. Chem., 100, 3241–3247, https://doi.org/10.1021/jp951168n, 1996.
Pérez-Martínez, C., Rühland, K. M., Smol, J. P., Jones, V. J., and Conde-Porcuna, J. M.: Long-term ecological changes in Mediterranean mountain lakes linked to recent climate change and Saharan dust deposition revealed by diatom analyses, Sci. Total Environ., 727, 138519, https://doi.org/10.1016/j.scitotenv.2020.138519, 2020.
Petzold, A. and Schönlinner, M.: Multi-angle absorption photometry – a new method for the measurement of aerosol light absorption and atmospheric black carbon, J. Aerosol Sci., 35, 421–441, https://doi.org/10.1016/j.jaerosci.2003.09.005, 2004.
Petzold, A., Gysel, M., Vancassel, X., Hitzenberger, R., Puxbaum, H., Vrochticky, S., Weingartner, E., Baltensperger, U., and Mirabel, P.: On the effects of organic matter and sulphur-containing compounds on the CCN activation of combustion particles, Atmos. Chem. Phys., 5, 3187–3203, https://doi.org/10.5194/acp-5-3187-2005, 2005.
Plessow, K., Acker, K., Heinrichs, H., and Möller, D.: Time study of trace elements and major ions during two cloud events at the Mt. Brocken, Atmos. Environ., 35, 367–378, https://doi.org/10.1016/S1352-2310(00)00134-5, 2001.
Pinto, D., Santos, M. A., and Chambel, L.: Thirty years of viable but nonculturable state research: Unsolved molecular mechanisms, Crit. Rev. Microbiol., 41, 61–76, https://doi.org/10.3109/1040841X.2013.794127, 2015.
Pöschl, U.: Atmospheric Aerosols: Composition, Transformation, Climate and Health Effects, Angew. Chem. Int. Ed., 44, 7520–7540, https://doi.org/10.1002/anie.200501122, 2005.
Pye, H. O. T., Nenes, A., Alexander, B., Ault, A. P., Barth, M. C., Clegg, S. L., Collett Jr., J. L., Fahey, K. M., Hennigan, C. J., Herrmann, H., Kanakidou, M., Kelly, J. T., Ku, I.-T., McNeill, V. F., Riemer, N., Schaefer, T., Shi, G., Tilgner, A., Walker, J. T., Wang, T., Weber, R., Xing, J., Zaveri, R. A., and Zuend, A.: The acidity of atmospheric particles and clouds, Atmos. Chem. Phys., 20, 4809–4888, https://doi.org/10.5194/acp-20-4809-2020, 2020.
Renard, P., Bianco, A., Baray, J.-L., Bridoux, M., Delort, A.-M., and Deguillaume, L.: Classification of clouds sampled at the Puy de Dôme station (France) based on chemical measurements and air mass history matrices, Atmosphere, 11, 732, https://doi.org/10.3390/atmos11070732, 2020.
Renzi, L., Di Biagio, C., Heuser, J., Zanatta, M., Cazaunau, M., Bergé, A., Pangui, E., Yon, J., Isolabella, T., Massabò, D., Vernocchi, V., Mazzini, M., Vogel, F., Yu, C., Formenti, P., Picquet-Varrault, B., Doussin, J.-F., and Marinoni, A.: The role of size in the multiple scattering correction C for dual-spot aethalometer: a field and laboratory investigation, Atmos. Meas. Tech., 19, 1365–1383, https://doi.org/10.5194/amt-19-1365-2026, 2026.
Reyes-Rodríguez, G. J., Gioda, A., Mayol-Bracero, O. L., and Collett, J.: Organic carbon, total nitrogen, and water-soluble ions in clouds from a tropical montane cloud forest in Puerto Rico, Atmos. Environ., 43, 4171–4177, https://doi.org/10.1016/j.atmosenv.2009.05.049, 2009.
Rossi, F., Duchaine, C., Le Bras, E., Dumais, C., Turgeon, N., Veillette, M., Baray, J.-L., and Amato, P.: Antimicrobial resistance genes (ARGs) in sea surface aerosols over the Atlantic Ocean, Sci. Total Environ., 1003, 180726, https://doi.org/10.1016/j.scitotenv.2025.180726, 2025.
Sattler, B., Puxbaum, H., and Psenner, R.: Bacterial growth in supercooled cloud droplets, Geophys. Res. Lett., 28, 239–242, https://doi.org/10.1029/2000GL011684, 2001.
Shaffer, B. T. and Lighthart, B.: Survey of Culturable Airborne Bacteria at Four Diverse Locations in Oregon: Urban, Rural, Forest, and Coastal, Microb. Ecol., 34, 167–177, https://doi.org/10.1007/s002489900046, 1997.
Shaltout, A. A., Harfouche, M., Abd-Elkader, O. H., and Eichert, D.: The occurrence and sources of Ni in ambient air particulates using synchrotron radiation based X-ray fluorescence and X-ray absorption near edge structure, J. Anal. Atom. Spectrom., 40, 1297–1308, https://doi.org/10.1039/D5JA00043B, 2025.
Shen, M., Li, J., Liu, Y., Dai, W., Wang, G., Qi, W., Chen, Y., Guo, X., Zhang, Y., Li, L., Cao, Y., Feng, Q., Su, H., and Cao, J.: Comparison of acidity and chemical composition of summertime cloud water and aerosol at an alpine site in Northwest China: Implications for the neutral property of clouds in the free troposphere, Sci. Total Environ., 925, 171775, https://doi.org/10.1016/j.scitotenv.2024.171775, 2024.
Shen, X., Lee, T., Guo, J., Wang, X., Li, P., Xu, P., Wang, Y., Ren, Y., Wang, W., Wang, T., Li, Y., Carn, S. A., and Collett, J. L.: Aqueous phase sulfate production in clouds in eastern China, Atmos. Environ., 62, 502–511, https://doi.org/10.1016/j.atmosenv.2012.07.079, 2012.
Triesch, N., van Pinxteren, M., Engel, A., and Herrmann, H.: Concerted measurements of free amino acids at the Cabo Verde islands: high enrichments in submicron sea spray aerosol particles and cloud droplets, Atmos. Chem. Phys., 21, 163–181, https://doi.org/10.5194/acp-21-163-2021, 2021.
Unsworth, M. H. and Fowler, D. (Eds.): Acid Deposition at High Elevation Sites, Springer Netherlands, https://doi.org/10.1007/978-94-009-3079-7, 1988.
Vaitilingom, M., Attard, E., Gaiani, N., Sancelme, M., Deguillaume, L., Flossmann, A., Amato, P., and Delort, A.-M.: Long-term features of cloud microbiology at the puy de Dôme (France), Atmos. Environ., 56, 88–100, https://doi.org/10.1016/j.atmosenv.2012.03.072, 2012.
Vaitilingom, M., Bernard, C., Ribeiro, M., Verhaege, C., Gourbeyre, C., Berthod, C., Bianco, A., and Deguillaume, L.: Design and evaluation of BOOGIE: a collector for the analysis of cloud composition and processes, Atmos. Meas. Tech., 18, 1073–1090, https://doi.org/10.5194/amt-18-1073-2025, 2025.
Vaïtilingom, M., Deguillaume, L., Vinatier, V., Sancelme, M., Amato, P., Chaumerliac, N., and Delort, A.-M.: Potential impact of microbial activity on the oxidant capacity and organic carbon budget in clouds, P. Natl. Acad. Sci. USA, 110, 559–564, https://doi.org/10.1073/pnas.1205743110, 2013.
Valle-Díaz, C. J., Torres-Delgado, E., Colón-Santos, S. M., Lee, T., Collett Jr., J. L., McDowell, W. H., and Mayol-Bracero, O. L.: Impact of Long-Range Transported African Dust on Cloud Water Chemistry at a Tropical Montane Cloud Forest in Northeastern Puerto Rico, Aerosol Air Qual. Res., 16, 653–664, https://doi.org/10.4209/aaqr.2015.05.0320, 2016.
Valverde-Canossa, J., Wieprecht, W., Acker, K., and Moortgat, G. K.: H2O2 and organic peroxide measurements in an orographic cloud: The FEBUKO experiment, Atmos. Environ., 39, 4279–4290, https://doi.org/10.1016/j.atmosenv.2005.02.040, 2005.
van Pinxteren, D., Plewka, A., Hofmann, D., Müller, K., Kramberger, H., Svrcina, B., Bächmann, K., Jaeschke, W., Mertes, S., Collett, J. L., and Herrmann, H.: Schmücke hill cap cloud and valley stations aerosol characterisation during FEBUKO (II): Organic compounds, Atmos. Environ., 39, 4305–4320, https://doi.org/10.1016/j.atmosenv.2005.02.014, 2005.
van Pinxteren, D., Fomba, K. W., Mertes, S., Müller, K., Spindler, G., Schneider, J., Lee, T., Collett, J. L., and Herrmann, H.: Cloud water composition during HCCT-2010: Scavenging efficiencies, solute concentrations, and droplet size dependence of inorganic ions and dissolved organic carbon, Atmos. Chem. Phys., 16, 3185–3205, https://doi.org/10.5194/acp-16-3185-2016, 2016.
Vione, D., Maurino, V., Minero, C., and Pelizzetti, E.: The atmospheric chemistry of hydrogen peroxide: A review, Ann. Chim., 93, 477, 12817649, 2003.
Vogel, F., Marinoni, A., Putero, D., Mona, L., Ripepi, E., and Volini, M.: Dust event identification product dataset collection over Monte Cimone, Italy 2003–2023, Version 1, ITINERIS HUB [data set], https://doi.org/10.71763/XDZA-FA77, 2025a.
Vogel, F., Putero, D., Bonasoni, P., Cristofanelli, P., Zanatta, M., and Marinoni, A.: Saharan dust transport event characterization in the Mediterranean atmosphere using 21 years of in-situ observations, Atmos. Chem. Phys., 25, 15453–15468, https://doi.org/10.5194/acp-25-15453-2025, 2025b.
Wang, M., Perroux, H., Fleuret, J., Bianco, A., Bouvier, L., Colomb, A., Borbon, A., and Deguillaume, L.: Anthropogenic and biogenic hydrophobic VOCs detected in clouds at the puy de Dôme station using Stir Bar Sorptive Extraction: Deviation from the Henry's law prediction, Atmos. Res., 237, 104844, https://doi.org/10.1016/j.atmosres.2020.104844, 2020.
Weathers, K. C., Likens, G. E., Bormann, F. H., Bicknell, S. H., Bormann, B. T., Daube, B. C., Eaton, J. S., Galloway, J. N., Keene, W. C., Kimball, K. D, McDowell, W. H., Siccama, T. G., Smiley, D., and Tarrant, R. A.: Cloudwater chemistry from ten sites in North America, Environ. Sci. Technol., 22, 1018–1026, https://doi.org/10.1021/es00174a004, 1988.
Wilkinson, J., Reynolds, B., Neal, C., Hill, S., Neal, M., and Harrow, M.: Major, minor and trace element composition of cloudwater and rainwater at Plynlimon, Hydrol. Earth Syst. Sci., 1, 557–569, https://doi.org/10.5194/hess-1-557-1997, 1997.
Wittmaack, K.: Advanced evaluation of size-differential distributions of aerosol particles, J. Aerosol Sci., 33, 1009–1025, https://doi.org/10.1016/S0021-8502(02)00052-6, 2002.
Xu, Y., Wu, D., Xiao, H., and Zhou, J.: Dissolved hydrolyzed amino acids in precipitation in suburban Guiyang, southwestern China: Seasonal variations and potential atmospheric processes, Atmos. Environ., 211, 247–255, https://doi.org/10.1016/j.atmosenv.2019.05.011, 2019.
Yang, C., Zhou, S., Zhang, C., Yu, M., Cao, F., and Zhang, Y.: Atmospheric chemistry of oxalate: Insight into the role of relative humidity and aerosol acidity from high-resolution observation, J. Geophys. Res.-Atmos., 127, e2021JD035364, https://doi.org/10.1029/2021JD035364, 2022.
Zanatta, M., Gysel, M., Bukowiecki, N., Müller, T., Weingartner, E., Areskoug, H., Fiebig, M., Yttri, K. E., Mihalopoulos, N., Kouvarakis, G., Beddows, D., Harrison, R. M., Cavalli, F., Putaud, J. P., Spindler, G., Wiedensohler, A., Alastuey, A., Pandolfi, M., Sellegri, K., Swietlicki, E., Jaffrezo, J. L., Baltensperger, U., and Laj, P.: A European aerosol phenomenology-5: Climatology of black carbon optical properties at 9 regional background sites across Europe, Atmos. Environ., 145, 346–364, https://doi.org/10.1016/j.atmosenv.2016.09.035, 2016.
Zanatta, M., Marinoni, A., Putero, D., Mona, L., Ripepi, E., and Volini, M.: Equivalent black carbon product dataset collection over Monte Cimone, Italy 2007–2024 (Version 1), ITINERIS-HUB [data set], https://doi.org/10.71763/ITINERIS-HUB/NFY7-YZ86, 2025.