the Creative Commons Attribution 4.0 License.
the Creative Commons Attribution 4.0 License.
 | 13 May 2026
Interpretable machine learning quantifies composition and size influences on aerosol spectral absorption
Wenfang Wang
Shuhua Zeng
Yifei Zhang
Zeren Yu
Chen Cui
Yunfei Wu
Min Chen
Lei Zhang
The spectral dependence of aerosol absorption, characterized by the absorption Ångström exponent (AAE), strongly influences radiative effects, yet the relative importance of controlling factors remains poorly quantified. We integrate multisource observations with an interpretable machine-learning framework (Shapley Additive Explanations, SHAP) to disentangle the roles of chemical composition and particle size in predicting AAE and to evaluate radiative impacts. Field observation in Beijing reveal that near-surface AAE is predominantly influenced by higher fine mineral dust and water-soluble inorganic ions fractions. Multi-year columnar data identify dust loading as the dominant predictor, followed by carbonaceous aerosols. The fine-mode radius accounts for 29 % of size parameters cumulative importance and ranks closely with black carbon. SHAP diagnostics highlight that columnar AAE contributes to radiative forcing at the top of the atmosphere (TOA) comparably to single scattering albedo (SSA), while its impact is clearly weaker at the bottom of the atmosphere and in the atmosphere. These findings help clarify AAE determinants and reduce uncertainties in aerosol radiative effect assessments.
- Article
(5028 KB) - Full-text XML
-
Supplement
(2247 KB) - BibTeX
- EndNote


Light-absorbing aerosols (LAAs), primarily black carbon (BC), brown carbon (BrC), and mineral dust, significantly influence regional and global climate by absorbing solar radiation (Bahadur et al., 2012; Cappa et al., 2016; Kok et al., 2017; Nishant et al., 2019). For instance, BC contributed a net positive effective radiative forcing of 0.11 W m−2 during 1750–2019, with a wide uncertainty range from −0.20 to +0.42 W m−2 (Intergovernmental Panel on Climate Change (IPCC), 2023), reflecting limited observational constraints on aerosol optical/microphysical properties and their inaccurate representation in models (Gliß et al., 2021; Lee et al., 2016). A practical diagnostic for the spectral shape of absorption is the Absorption Ångström Exponent (AAE) (Ångström, 1929; Lewis et al., 2008). For pure BC, AAE is theoretically close to 1.0, but observations show a range of 0.6–1.6 (Kirchstetter et al., 2004; Lack and Cappa, 2010; Gyawali et al., 2012; Chakrabarty et al., 2013; Wang et al., 2021). BrC and mineral dust exhibit relatively stronger absorption in the ultraviolet and visible spectral wavelengths, typically yielding AAE values greater than 2.0 (Russell et al., 2010; Park et al., 2018; Zhang et al., 2020; Cuesta-Mosquera et al., 2024). For example, BrC AAE is frequently reported to be ∼ 2–6 depending on source and aging, whereas dust AAE is typically ∼ 2–4 owing to shortwave absorption by iron oxides (Bergstrom et al., 2007). Because AAE encodes source and process information that governs aerosol absorption from ultraviolet to the near-infrared wavelength range, tighter constraints on AAE can help reduce uncertainties in aerosol radiative effects (Cazorla et al., 2013; Lack and Langridge, 2013; Sand et al., 2021).
AAE has been characterized using multiple observational approaches, including in situ multi-wavelength absorption measurements and surface-based remote sensing retrievals (Li et al., 2022). In situ observations provide high-precision, process-resolving constraints on aerosol absorption spectra near the surface and therefore serve as an important benchmark for evaluating remote sensing products and model simulations (Gliß et al., 2021). In contrast, surface-based remote sensing can retrieve aerosol properties integrated over the entire atmospheric column, such as Aerosol Robotic Network (AERONET), enabling a broader view of aerosol spectral absorption and its radiative properties (Dubovik and King, 2000). Combining in situ and column retrievals is particularly valuable because they constrain complementary aspects of aerosol spectral absorption. In situ measurements are sensitive to near-surface processes (emissions, hygroscopic growth and aging) but have limited spatial and vertical representativeness, whereas AERONET provides column-averaged constraints that are directly connected to radiative impacts but can be influenced by vertical layering and retrieval assumptions (Li et al., 2022). Therefore, integrating near-surface with columnar AAE enables us to provide improved observational guidance for models, and better constrain column characteristics relevant to radiative forcing.
Both near-surface and columnar AAE vary with particle size distribution, chemical composition, and mixing state (Russell et al., 2010; Scarnato et al., 2013; Li et al., 2016; Schuster et al., 2016a; Sotiropoulou et al., 2025). For instance, near-surface BC AAE may decrease as BC cores grow or as aggregates become more compact during aging processes (Liu et al., 2018). Recent numerical simulation further indicates that secondary organic coatings can increase near-surface AAE, with sensitivity to coating thickness (Zhang et al., 2025). In contrast, photochemical bleaching lowers BrC ultraviolet absorption and near-surface AAE (Wang et al., 2019). Russell et al. (2010) showed that columnar AAE values are strongly correlated with aerosol composition or type. Heterogeneous aging of long-range-transported dust may enhance absorption, also affecting columnar AAE (Tian et al., 2018). The magnitudes and signs of these effects depend on location, season, and processing history, complicating both measurements and modeling and propagating to radiative forcing uncertainty (Sand et al., 2021; Li et al., 2022; Ponczek et al., 2022).
Studying the impact of individual factors on AAE is relatively straightforward. Previous studies have already examined the effects of particle size, chemical composition, and mixing state on AAE in isolation (Wu et al., 2015; Schuster et al., 2016b; Li et al., 2024). However, quantitatively attributing the relative contributions of particle size and chemical composition to AAE remains a challenging task due to nonlinearity and collinearity among predictors. For example, observations show that composition appears dominant when the shape of size distribution is quasi-stationary (Utry et al., 2014), whereas Mie-theory studies highlight the role of the imaginary refractive index of organics over size in explaining absorption changes (Yang et al., 2025). Although these studies effectively highlight the roles of particle size and chemical composition, they lack quantitative assessments of their relative importance.
The Shapley Additive exPlanations (SHAP) method offers a principled framework for feature attribution in machine learning predictions and has been widely adopted in atmospheric sciences, such as boundary-layer height inversion, ozone formation and cloud-condensation-nuclei studies (Peng et al., 2023; Tao et al., 2024; Wang et al., 2025a). SHAP analysis has also been applied to aerosol absorption studies to precisely quantify the relative contribution of various chromophores to BrC absorption, providing a mechanistic understanding of its key drivers (Wang et al., 2024). Its potential to predict AAE and quantify the relative contributions of individual factors remains unexplored. Addressing this gap would offer an interpretable, data-driven perspective on aerosol spectral absorption.
This study aims to quantify the relative importance of chemical composition and particle size influencing AAE using surface observations together with long-term AERONET column retrievals over Beijing. We apply multiple linear regression to identify their influence on near-surface AAE. Subsequently, we train an ensemble of machine-learning models to predict columnar AAE. The best-performing model (CatBoost) is selected for the final prediction, as described later in Sect. 2.4. Then SHAP is used for interpretative analysis to quantify the contributions of different columnar aerosol physical and chemical parameters. Finally, we also evaluate the diagnostic power of columnar AAE for radiative effects, including aerosol direct radiative forcing (ADRF) and radiative forcing efficiency (ARFE) using interpretable machine-learning framework.
2.1 Field Campaign and Data Processing
An intensive observation campaign focusing on aerosol properties was conducted in urban Beijing, China, from 16 December 2023 to 15 January 2024. Online and offline instruments were deployed on the rooftop of the Institute of Atmospheric Physics, Chinese Academy of Sciences (Building no. 3; 39.98° N, 116.39° E), approximately 45 m above ground level. All online instruments were housed in a temperature-controlled room maintained at ∼ 20 °C to ensure measurement stability, and sampling lines were equipped with Nafion dryers to minimize the influence of ambient humidity.
2.1.1 In Situ Online Aerosol Observations
Aerosol absorption coefficients (babs,λ) at 375, 532, and 870 nm were measured using photoacoustic extinctiometers (PAX, DMT Inc., USA). The PAX measures aerosol light absorption using the photoacoustic technique, in which absorbed laser energy is converted into periodic heating of the surrounding gas, generating an acoustic pressure wave in an acoustic resonator that is detected by a sensitive microphone (Truex and Anderson, 1979). The light absorption (babs, pax) can be calculated as:
where Pmic and PL are the pressure of the microphone and the laser power, respectively; Ares, fres and Q indicate the cross-sectional area, resonance frequency, and quality factor of the resonator; γ is the isobaric and isosteric specific heat ratio. Then the babs,λ is obtained by subtracting the background absorption measured with particle-free air from babs, pax. In addition, the PAX measures aerosol scattering with an integrated wide-angle reciprocal nephelometer.
Prior to deployment, each PAX was calibrated following the procedure described in Wu et al. (2015): (i) the scattering channel was calibrated using high-concentration ammonium sulfate aerosol by regressing the extinction coefficient (bext) derived from laser power attenuation against the instrument-recorded scattering coefficient (bsca). The scattering calibration factor was then adjusted by applying the regression slope as a multiplicative correction; (ii) the absorption channel was calibrated using high-concentration Aquadag aerosol by regressing (bext−bsca) against the instrument-recorded photoacoustic absorption. The absorption calibration factor was then updated by dividing it by the regression slope.
The near-surface aerosol absorption Ångström exponent (AAEsfc) was calculated as:
where λ1=375 nm, λ2 =870 nm. Hourly PM2.5 (particle matters with an aerodynamic diameter ≤ 2.5 µm) mass concentrations were obtained from the China National Environmental Monitoring Network for the Beijing urban site. These datasets were used to calculate mass absorption efficiency (MAE) of PM2.5:
Size distributions were measured with a scanning mobility particle sizer (SMPS, Model 3082, TSI Inc., 8.8–310.6 nm, Stokes diameter) and an aerodynamic particle sizer (APS, Model 3321, TSI Inc., 0.54–19.8 µm, aerodynamic diameter), with SMPS data converted to aerodynamic diameter (Sect. S1 in the Supplement) (Shang et al., 2018). To ensure measurement accuracy, the flow systems of the SMPS and APS were periodically checked and calibrated by the manufacturer (TSI Inc.) through regular return-service calibration. In addition, hourly meteorological parameters (wind speed and direction, temperature, and relative humidity) were obtained from the 47 m meteorological tower at the Institute of Atmospheric Physics.
2.1.2 Offline Aerosol Sampling
Offline PM2.5 samples were collected on quartz-fiber filters (90 mm diameter; Whatman 1855-090). Prior to sampling, quartz-fiber filters were pre-cleaned to minimize filter background. Briefly, filter cassettes were rinsed with absolute ethanol and air-dried, and aluminum-foil liners cut to the filter size were pre-baked at 550 °C for 3 h to remove residual carbon. The quartz filters were sequentially soaked in ultrapure water (5 min × 3 cycles, followed by 2 h × 2 cycles), oven-dried at 150 °C for 1 h, and then prebaked at 550 ° C for 5 h to reduce the influence of adsorbed organic and inorganic materials. After cooling, the filters were wrapped in prebaked aluminum foil and conditioned for 48 h in a constant temperature and humidity environment prior to gravimetric determination. Then the pre-sampling filter mass was measured using an electronic microbalance (BSA124S-CW, Sartorius; readability ± 0.1 mg). Sampling was conducted using a medium-volume air sampler (Model 2030, Laoshan Electronic Instrument Co., Ltd.) operated at 100 L min−1 and equipped with a PM2.5 inlet. The inlet was installed at approximately 2 m above ground level. Daytime samples were collected from 09:00 to 20:30 LT, and nighttime samples from 21:00 to 08:30 LT the following day.
After sampling, all filters were analyzed for major chemical compositions, including water-soluble inorganic ions (Na+, K+, NH, Ca2+, Mg2+, Cl−, NO, and SO) measured by ion chromatography (881 Compact IC Pro, Metrohm; and ICS-1500, Dionex Inc.), metallic elements (Al, Ca, Mg, Fe, and Ti) determined by inductively coupled plasma–atomic emission spectrometry (ICP-AES; iCAP 7400, Thermo), and organic carbon (OC), and elemental carbon (EC) quantified using the thermal/optical carbon analyzer (DRI Model 2015, USA) based on the thermal/optical reflectance (TOR) method (Chow et al., 2007). The chemical analysis process is described in detail in Sect. S2 in the Supplement.
PM2.5 was reconstructed as the sum of organic matter (OM = 1.6× OC) (Guinot et al., 2007), EC, non-dust water-soluble ions (nd-WSII), and fine mineral dust (FMD) derived from crustal elements (Malm et al., 1994; Tian et al., 2023), showing good agreement with measured PM2.5 (r=0.82). Here, nd-WSII was defined as the sum of K+, NH, NO, and SO, while Na+, Ca2+, Mg2+, and Cl− were excluded. Ca2+ and Mg2+ were treated as dust-related species, Na+ was excluded due to generally elevated blanks associated with quartz-fiber filters and glassware, and Cl− was excluded given its strong association with Mg2+ (r=0.77, Table S1). The FMD was defined as follows:
where [Si] = 1.5 [Al].
2.2 Multiple Linear Regression
The influence of particle size and chemical composition on AAEsfc was assessed using a standardized multiple linear regression:
where denotes the standardized AAEsfc; a represents the intercept term, any remaining influence not parameterized by the selected predictors is captured by the intercept term; b, c, d, and e are regression coefficients; , , , and are standardized variables of FMD fraction, nd-WSII fraction, and mean diameters from SMPS and APS, respectively. To ensure consistent temporal support between offline chemistry and online optical measurements, we aggregate AAEsfc (and size-related parameters) over the same sampling windows and use these window-mean values. We note that AAEsfc can vary within a given sampling period; however, such within-period variability is not resolvable by the integrated filter chemistry and therefore cannot be explicitly attributed at finer temporal resolution. To transparently characterize the associated representativeness uncertainty, we quantify the within-window dispersion of AAEsfc using the standard deviation across all sampling windows and provide its frequency and cumulative distributions (Fig. S2). In particular, ∼ 90 % of the sampling periods show a standard deviation no greater than 0.35. This result indicates that window-mean AAEsfc provides a reasonable representative value at the filter timescale. Due to power outage on 27 December 2023 and 3 January 2024, daytime data for 27 December and both daytime and nighttime data for 3 January were unavailable. In future studies, higher-time-resolution measurements of aerosol chemical composition would be valuable for more directly linking short-timescale composition variability with AAE.
Notably, to further evaluate the robustness of the regression coefficients, we conducted a nonparametric bootstrap analysis with 1000 resamples. We also tested an extended model including EC and OM fractions as additional predictors. However, the extended model yielded highly unstable coefficient estimates under bootstrap resampling, with strong dispersion and frequent sign changes (Table S1 in the Supplement). In contrast, the reduced model provides stable and physically interpretable coefficients for the key predictors and demonstrates good predictive skill for AAEsfc (the coefficient of determination (R2) = 0.75, root mean square error (RMSE) = 0.13, mean absolute error (MAE) = 0.10; Table S2). Consistent with these robustness results, our correlation analysis further indicates that EC and OM fractions are not significantly associated with AAEsfc during this campaign (Sect. 3.2). Therefore, we retained the parsimonious formulation without EC and OM fractions for subsequent analyses (Eq. 5).
2.3 AERONET Data
We used data from the Beijing Aerosol Robotic Network (AERONET) site (39.98° N, 116.38° E). Level 2.0 quality-assured Version 3 inversion products were selected. Key parameters include aerosol absorption optical depth (AAOD) at 440, 675, 870, and 1020 nm to calculate columnar AAE (AAEcol):
where k is a constant. In addition, aerosol size-related parameters were obtained, including volume size distributions for radii in the 0.05–15.00 µm range, mean radii of fine-mode and coarse-mode particles (Rfine, Rcoarse), as well as volume concentrations of fine-mode (0.05–0.60 µm, volfine) (Dubovik et al., 2002) and total particles (voltotal). The fine-mode fraction (FMF) was then calculated as:
To investigate the influence of chemical composition on AAEcol, we used the chemical composition dataset derived from AERONET inversions (Zhang et al., 2024), including black carbon (BC), brown carbon (BrC), coarse-mode absorbing insoluble matter (CAI, representing coarse absorbing dust), coarse-mode non-absorbing insoluble matter (CNAI, representing coarse non-absorbing dust and aged carbonaceous aerosols), and fine-mode non-absorbing insoluble matter (FNAI, representing fine non-absorbing dust and organic carbon) (Li et al., 2019; Zhang et al., 2024).
Notably, the column chemical components (BC, BrC, CAI, CNAI, and FNAI) used here are retrieval-based and should not be interpreted as directly measured chemical mass. They are inferred from spectral Sun–sky photometer observations through the AERONET inversion (which retrieves column-integrated size distribution and complex refractive index from AOD and sky radiances) and a subsequent component-mixing framework (GRASP/Component) that maps the retrieved optical constraints to optically equivalent component fractions (Dubovik and King, 2000; Sinyuk et al., 2020; Li et al., 2019). In doing so, the component retrieval necessarily relies on prescribed assumptions, notably fixed complex refractive indices for the dry components, an internal-mixing rule (commonly Maxwell–Garnett effective medium approximation) to compute effective optical properties, and constraints on how absorbing components are partitioned between fine and coarse modes (Li et al., 2019). For dust, non-sphericity is treated using spheroid-based scattering models rather than purely spherical Mie theory (Dubovik et al., 2006).
These assumptions introduce additional uncertainty beyond the base AERONET inversion. As background, absorption-related AERONET inversion products (e.g., SSA/AAOD) are substantially less stable at low aerosol loading; under favorable loading conditions, SSA uncertainty is typically on the order of ∼ 0.03, while it increases rapidly as AOD decreases (Dubovik and King, 2000; Sinyuk et al., 2020). Component volume fractions inherit this sensitivity and, in addition, respond to uncertainties in prescribed component optics and mixing rules. Sensitivity tests in the GRASP/Component literature indicate that, for AOD440≥0.4 and sufficiently non-negligible component fractions, the uncertainty in retrieved BC, CAI, FNAI, and CNAI volume fractions is commonly within ∼ 50 %, whereas BrC generally remains more uncertain at low BrC fractions but can approach the ∼ 50 % level when BrC becomes a substantial contributor (Li et al., 2019). Nevertheless, this approach has been applied by Zhang et al. (2022, 2024), who obtained reliable aerosol chemical-component information from remote-sensing measurements. To reduce the low-loading regime where absorption and component retrievals are most uncertain, we restricted our analysis to AOD440>0.4.
To further assess the radiative impacts of aerosols, we also employed AERONET shortwave instantaneous aerosol direct radiative forcing (ADRF) and aerosol radiative forcing efficiency (ARFE) data, where ARFE is defined as ADRF per unit aerosol optical depth (AOD) at 550 nm, reported at the top of the atmosphere (TOA), bottom of the atmosphere (BOA), and in the atmosphere (ATM) (Holben et al., 1998). These radiative quantities are computed within the AERONET inversion radiative-transfer module under cloud-free conditions, using AERONET-retrieved aerosol optical properties and surface albedo as inputs. ADRF is defined as the difference in broadband shortwave radiative fluxes between aerosol-free and aerosol-laden conditions (García et al., 2008):
where F and F0 denote radiative fluxes with and without aerosols, and arrows indicate upward or downward fluxes. ARFE is defined as radiative forcing per unit aerosol optical depth:
where AOD550 is the AOD at 550 nm. Defined this way, negative ADRF and ARFE indicate shortwave cooling.
2.4 Shapley Additive Explanations (SHAP)
To quantify how particle size and chemical composition control the AAEcol, we trained and compared three ensemble tree–based regressors: Extreme Gradient Boosting (XGBoost), Random Forest (RF), and Categorical Boosting (CatBoost). Each model was trained using seven predictor variables, including five chemical compositions (BrC, BC, CAI, CNAI, and FNAI), and four size parameters (Rfine, Rcoarse, volfine, and volume concentrations of coarse-mode (volcoarse)).
Model performance was evaluated using a consistent training–testing split (80 % of dataset were used for the training set, and 20 % were used for the test set) and quantified by R2, RMSE, and MAE. The RF model achieved an R2 of 0.58, an RMSE of 0.43, and an MAE of 0.30. In comparison, the CatBoost model yielded an R2 of 0.64, an RMSE of 0.40, and an MAE of 0.29, while the XGBoost model showed an R2 of 0.64, an RMSE of 0.40, and an MAE of 0.30 (Fig. S3). The CatBoost model in our case was subsequently adopted for further interpretation. Furthermore, the SHAP analysis was applied to decompose the model output into additive feature contributions, enabling quantitative assessment of the relative contribution and sensitivity of individual aerosol composition and size parameters in predicting.
Similarly, to evaluate aerosol radiative impacts, XGBoost, RF, and CatBoost models also were trained using distinct predictor sets for different radiative metrics. The AERONET ADRF and ARFE products are generated by a radiative-transfer calculation (Sect. 2.4); therefore, our goal is not to replace radiative transfer. Here machine-learning model is used to quantify the relative importance of AAEcol as a predictor of ADRF and ARFE variability, rather than implying a causal pathway where AAEcol independently drives ADRF and ARFE.
For ADRF, five optical properties (AOD, single scattering albedo (SSA), asymmetry parameter (g), surface albedo (SA), and AAEcol) were used as inputs. For ARFE, the target definition (ARFE = ADRF AOD) was kept unchanged; however, AOD was included during model fitting together with SSA, g, SA, and AAEcol so that the models could learn any residual nonlinearity and interactions involving AOD. Performance was again evaluated using a consistent training–testing split, with 80 % of the dataset used for training and the remaining 20 % for testing. The evaluation was quantified by R2, RMSE, and MAE. The performance metrics for the three models are summarized in Figs. S4–S5. CatBoost in our case was retained as the best-performing model across TOA, BOA, and ATM, as it showed the highest or near-highest R2 together with the lowest or near-lowest RMSE and MAE among the tested models. R2, RMSE, and MAE are defined as follows:
where n represents the number of input samples. yi and are the observed and predicted values, respectively; refers to the mean of the target values predicted by the model. In this study, y corresponds to the target variable, including AAEsfc (Sect. 2.2), AAEcol, ADRF, and ARFE in this section.
To attribute ARFE variations while controlling for AOD, we employed SHAP with a scenario-based conditioning approach. Specifically, we recomputed SHAP values on the held-out test set after fixing AOD to four levels (25th, 50th, 75th percentiles, and mean), computed from the training set to avoid information leakage, while leaving all other predictors unchanged. This yields SHAP attributions for SSA, g, SA, and AAEcol conditional on AOD at representative states. (The 50th percentile case is shown in the main text, others in the Supplement). For ADRF, SHAP was computed in the standard manner using all five predictors (AOD, SSA, g, SA, AAE) without conditioning.
3.1 Aerosol Characteristics During the Field Campaign
Figure 1 provides the near-surface AAE (AAEsfc) variability and its co-variation with PM2.5 composition and particle size during the Beijing campaign. In Fig. 1a, the stacked bars show the window-resolved PM2.5 mass fractions of non-dust water-soluble ions (nd-WSII), fine mineral dust (FMD), organic matter (OM), and elemental carbon (EC), overlaid with AAEsfc and the mean particle diameters derived from the fine-mode (SMPS) and coarse-mode (APS) measurements. Notably, periods with elevated FMD fractions generally coincide with higher AAEsfc, whereas intervals dominated by nd-WSII tend to correspond to lower AAEsfc, consistent with dust-related enhancement of short-wavelength absorption. These co-variations motivate the quantitative attribution in Sect. 3.2, where we assess how the fractions of FMD and nd-WSII relate to the observed spectral absorption dependence.
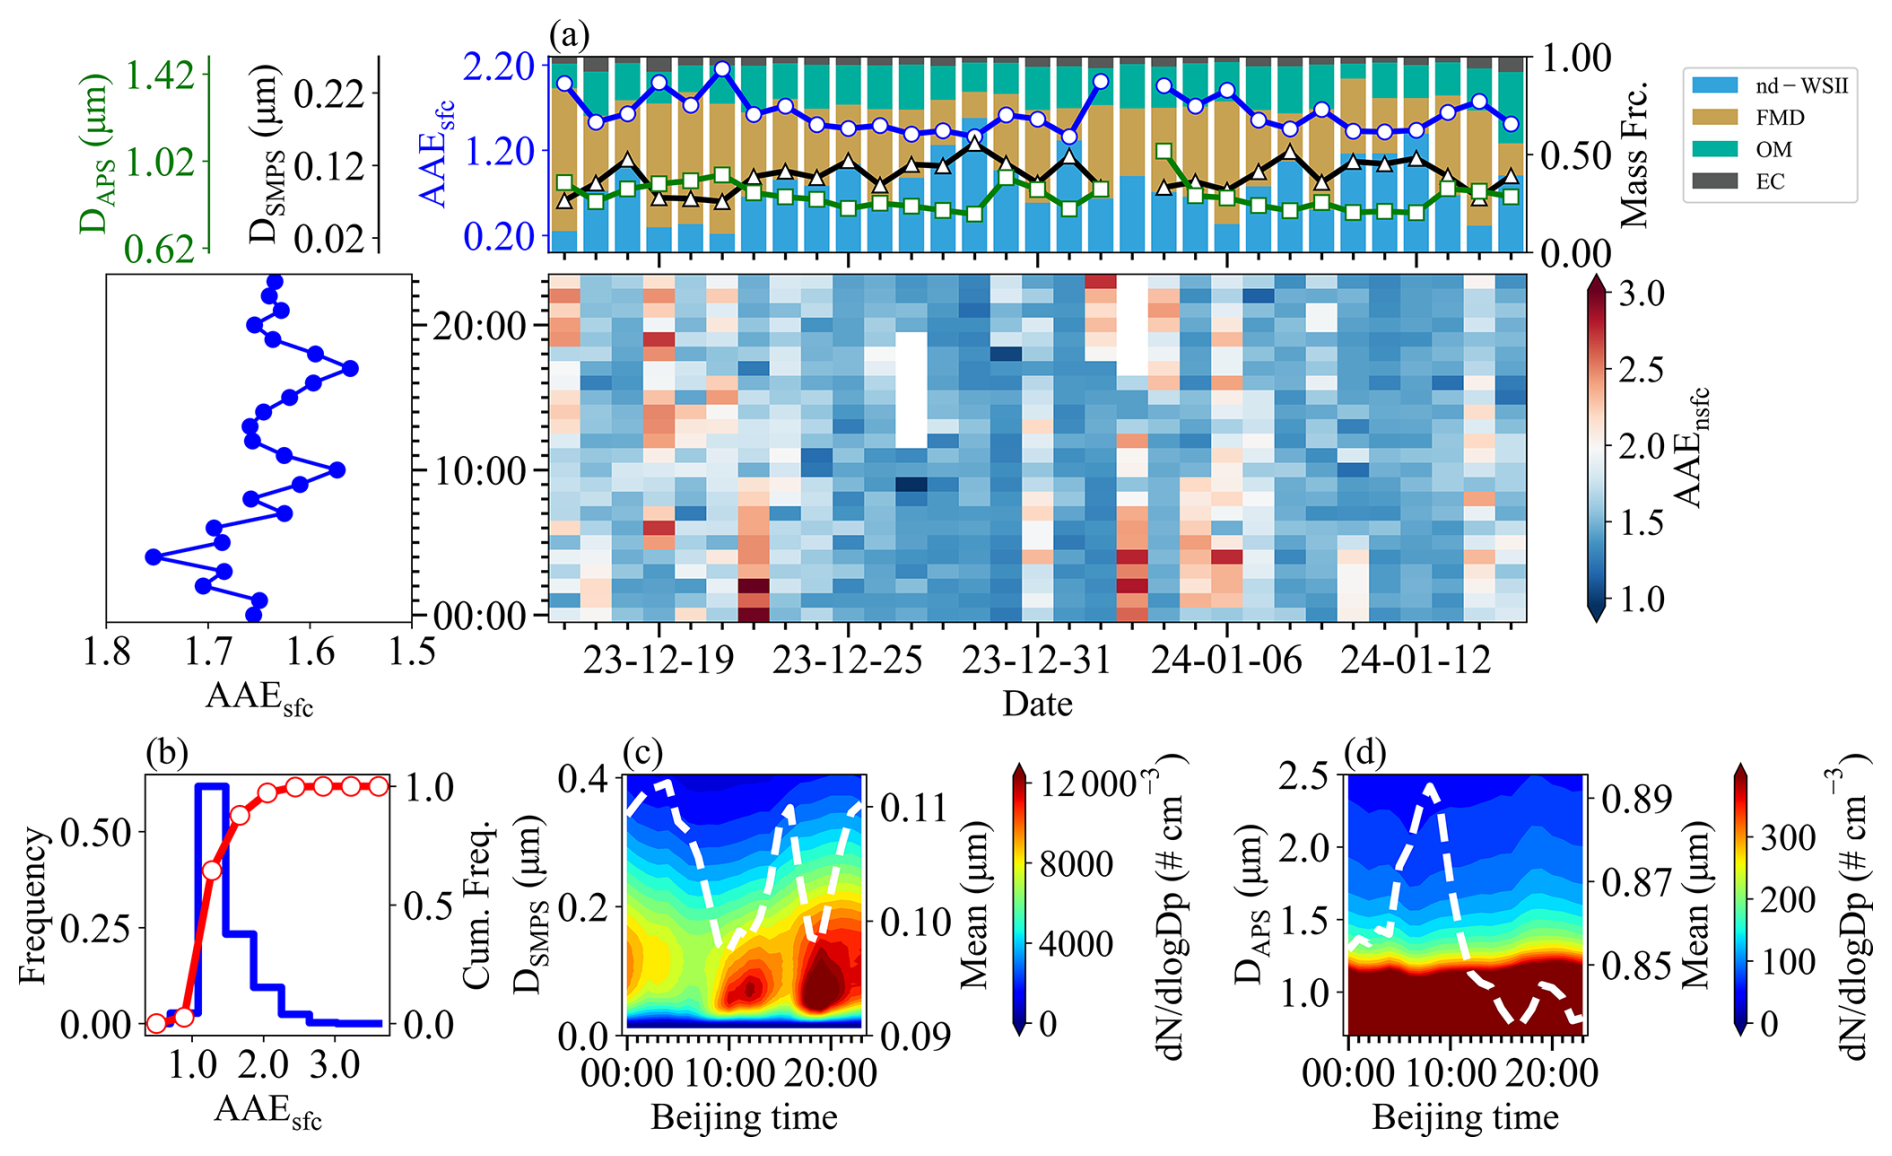
Figure 1Aerosol absorption characteristics during the campaign. (a) Time series of mean particle diameters derived from SMPS and APS, mass fractions of organic matter (OM), elemental carbon (EC), non-dust water-soluble inorganic ions (nd-WSII), and fine mineral dust (FMD), together with daily averaged near-surface AAE (AAEsfc). (b) Frequency distribution of AAEsfc. (c–d) Diurnal variations of aerosol particle number size distributions from SMPS (c) and APS (d).
The overall distribution of AAEsfc is summarized in Fig. 1b. AAEsfc ranges from 0.90 to 3.0 and occurs most frequently between 1.10–2.0, with a mean value of 1.64 ± 0.32. A pronounced high-AAEsfc tail (values above 2.0) occurs episodically (Fig. 1b), suggesting intermittent enhancement of short-wavelength absorption. Such elevated values likely resulted from winter heating emissions (Tian et al., 2019; Yan et al., 2017) and mineral dust contributions (Fig. 1a), both known to raise AAE (Liu et al., 2018).
The heat map in Fig. 1a further illustrates the time-of-day evolution of AAEsfc across the campaign, and the accompanying diurnal profile highlights a clear nighttime enhancement relative to daytime. AAEsfc showed a clear night-high and day-low pattern (Fig. 1a), consistent with the evolution of particle size distributions. Fine-mode number concentrations derived from SMPS increased during the morning rush hours and nighttime residential activity (Fig. 1c). By contrast, coarse-mode diameters from APS were larger in the early morning and decreased during the day (Fig. 1d). These results demonstrate that AAEsfc was co-regulated by both composition and size, providing the observational evidence for the subsequent machine-learning analysis to quantify their relative contributions and radiative implications.
Figure S6 further shows the multi-wavelength absorption coefficients and their diurnal behavior. Aerosol absorption coefficients exhibit a clear spectral decrease from the near-UV to the near-IR, with mean values of 13.19 ± 9.91, 6.80 ± 6.15, and 3.77 ± 3.27 Mm−1 at 375, 532, and 870 nm, respectively (mean ± one standard deviation) (Fig. S6). The corresponding mass absorption efficiencies are relatively low (0.49 ± 0.24, 0.21 ± 0.08, and 0.12 ± 0.04 m2 g−1), reflecting the dominance of nd-WSII, which accounted for 42.9 % of PM2.5 mass (Fig. 1a). Absorption coefficients at three wavelengths are consistently higher absorption at night and a peak around 23:00 (Fig. S6), driven by reduced tropospheric boundary layer height, lower afternoon temperatures and wind speeds (Fig. S7), and enhanced emissions from nighttime traffic and heating (Guo et al., 2016; Zhao et al., 2019).
3.2 Influence of Composition and Size on Near-surface AAE
The EC mass fraction shows no correlation with AAEsfc (; Fig. 2a). This is plausible because EC is an operational thermal fraction and does not directly represent the optically effective BC absorption, which can be substantially modified by mixing state and coating (Petzold et al., 2013). Similarly, the OM mass fraction is not significantly correlated with AAEsfc (, p=0.40; Fig. 2a). In contrast to study dominated by biomass burning, where light-absorbing organic carbon can account for > 50 % of the mass fraction and strongly enhance AAE (Wang et al., 2021). During the Beijing campaign, however, OM contributes only ∼ 19 % of total PM2.5 mass and BrC fractions therefore are relatively low. Although BrC exhibits intrinsically high AAE values (Laskin et al., 2015; Moosmüller et al., 2011), its impact is diminished in the mixed aerosol matrix due to the influence of other dominant compositions.
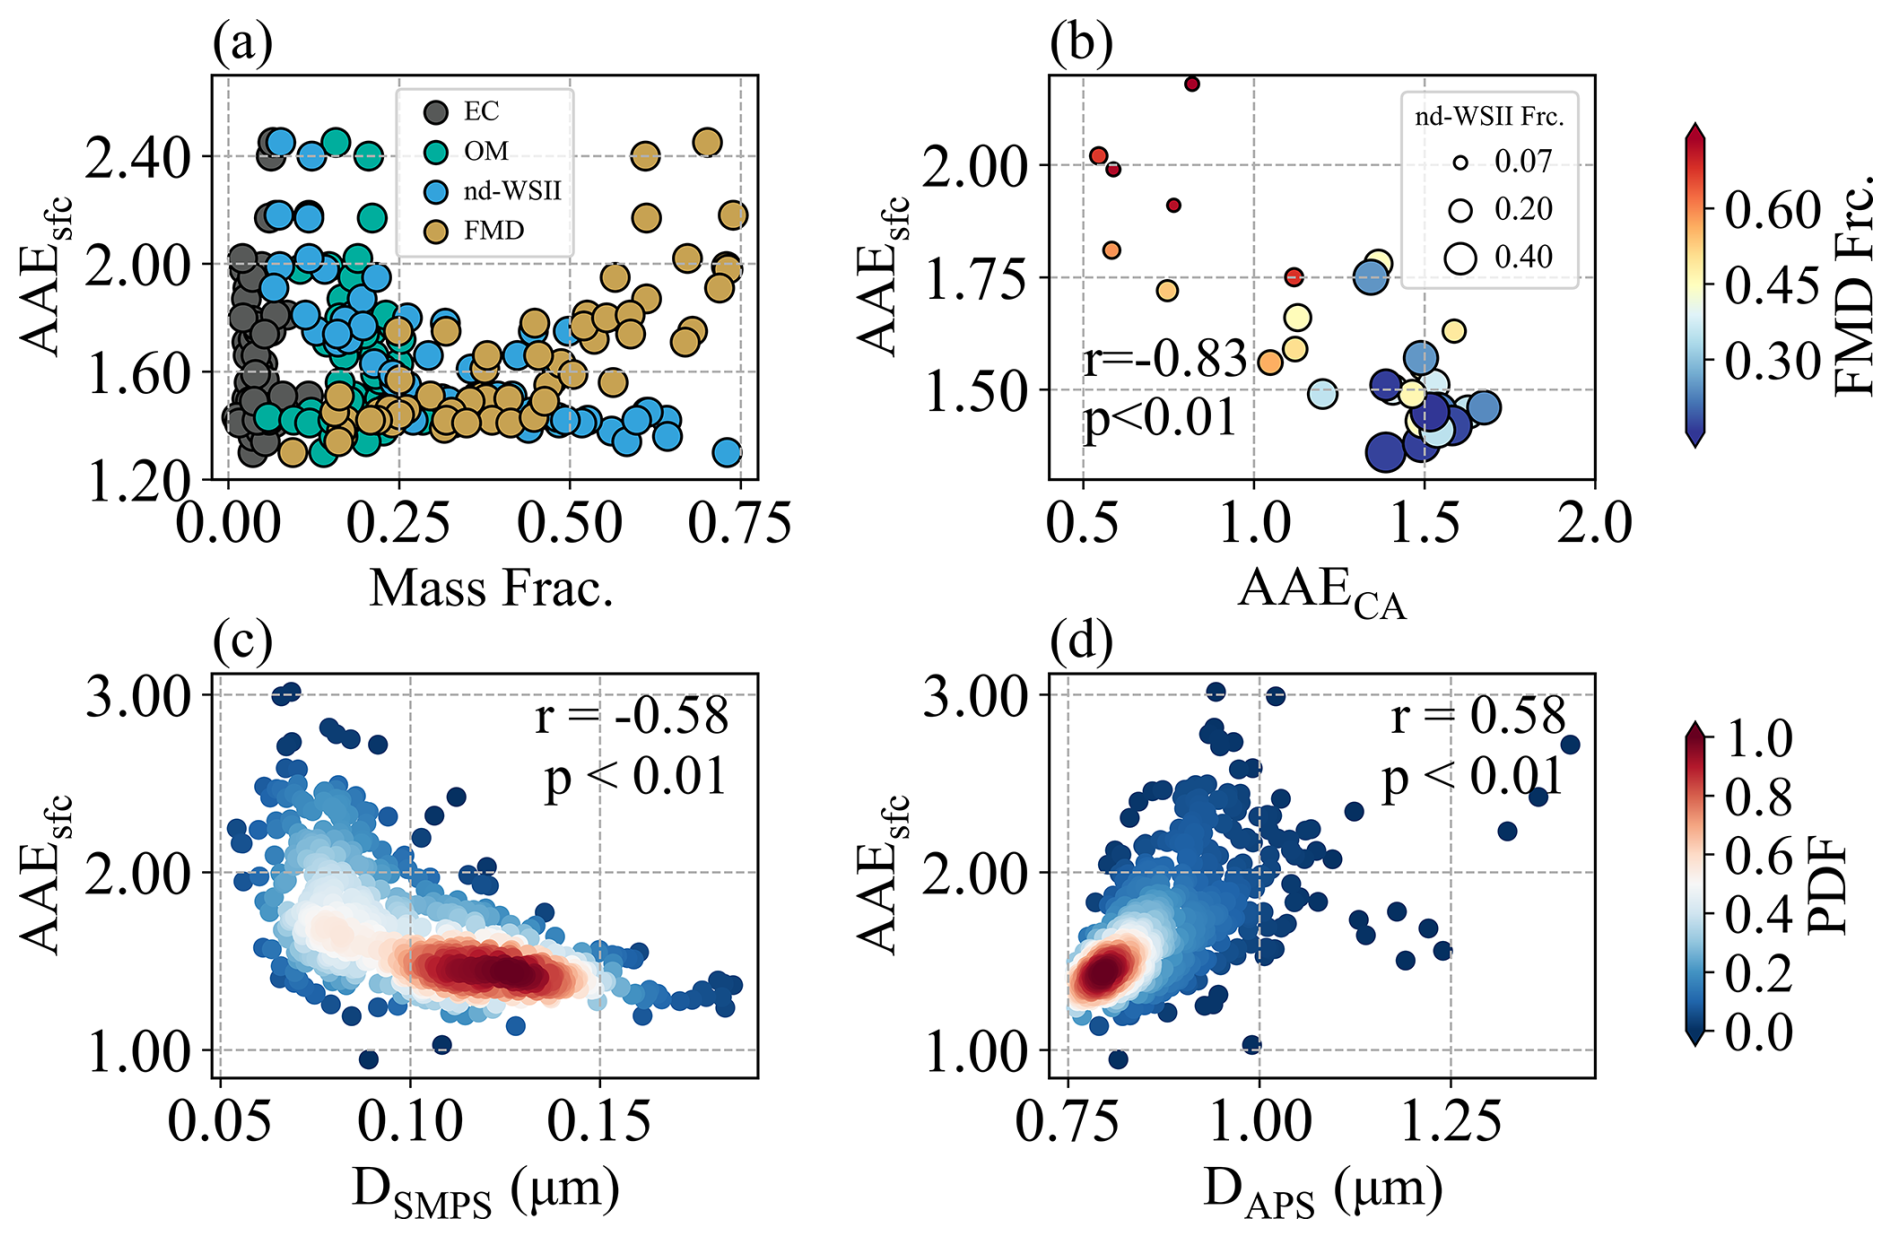
Figure 2Relationships of near-surface absorption Ångström exponent (AAEsfc) with chemical composition and particle size. (a) Scatter plots of chemical mass concentration fraction and total aerosol AAEsfc. (b) Relationship between AAEsfc and carbonaceous aerosol AAE (AAECA), with symbol size representing the non-dust water-soluble ions (nd-WSII) fraction and color denoting the fine mineral dust (FMD) fraction. (c–d) Correlations of AAEsfc with mean particle diameters derived from SMPS (c) and APS (d), respectively. Shaded colors indicate probability density.
We observed a statistically significant negative correlation between AAEsfc and carbonaceous aerosol AAE (AAECA) (Fig. 2b), indicating that the non-carbonaceous aerosol had a significantly stronger role in shaping the absorption spectral dependence under complex pollution conditions. Due to nitrogen dioxide (NO2) concentrations were elevated at night (Fig. S8), which can interfere with PAX instruments, particularly at shorter wavelengths (Arnott et al., 2000; Gyawali et al., 2012). Therefore, we restrict the analysis here to daytime data (Fig. S9). This pattern therefore cannot be ascribed simply to inter-instrument discrepancies.
AAEsfc exhibits a significant positive correlation with the mass fraction of FMD (r=0.79, p<0.01) and a negative correlation with nd-WSII (, p<0.01) (Fig. 2a). The AAEsfc enhancement associated with FMD can be attributed to metal oxides such as hematite and goethite, which strongly absorb in the UV wavelengths and steepen the spectral dependence (Bi et al., 2016). By contrast, nd-WSII (mostly sulfates, nitrates, and ammonium particles) primarily behaves as a weakly absorbing (nearly scattering-only) component in the visible–near-infrared (Seinfeld and Pandis, 2016), and an increase in its mass fraction therefore tends to dilute the contribution of absorbing species to total PM2.5 absorption. In our surface dataset, this dilution effect is expected to reduce the relative importance of short-wavelength absorbers and, in turn, weaken the apparent wavelength dependence of bulk absorption, leading to lower AAEsfc when nd-WSII dominates. We note that a “lensing effect” associated with non-absorbing coatings has been reported to enhance AAECA (Cappa et al., 2012; Zhang et al., 2025). However, the carbonaceous components contributed only a small fraction of PM2.5 mass during our campaign. Consequently, any potential lensing-related enhancement was likely too small relative to the total aerosol and variability to yield a detectable positive correlation between AAEsfc and the nd-WSII mass fraction. In this regime, nd-WSII is better interpreted as a marker of secondary inorganic aerosol loading that mainly increases scattering and dilutes absorber fractions.
Particle size also plays a critical role. AAEsfc is negatively associated with the fine-mode mean diameter from SMPS (DSMPS, ; Fig. 2c) and positively associated with the coarse-mode mean diameter from APS (DAPS, r=0.58; Fig. 2d). Here, the correlation analysis is used as an exploratory step to describe these first-order relationships, whereas the standardized multiple linear regression (MLR) estimates the multivariate associations after accounting for predictor covariation. Consistent with the bivariate results, the MLR yields a negative standardized coefficient for DSMPS (−0.02) and a positive coefficient for DAPS (0.44), confirming that the coarse-mode size metric provides the stronger size-related contribution in the multivariate setting.
The composition terms show a similarly coherent pattern across the two analyses. FMD is positively associated with AAEsfc in the bivariate correlations and remains positive in the MLR (0.35), whereas nd-WSII shows a negative association and remains negative in the MLR (−0.16). Importantly, particle size and composition are not independent in this winter dataset. Periods with larger coarse-mode diameters tend to coincide with enhanced fine mineral dust fraction (r=0.64; Fig. S10), consistent with stronger dust influence. Conversely, periods characterized by smaller fine-mode diameters are associated with elevated nd-WSII fraction (r=0.89; Fig. S10), consistent with secondary inorganic build-up and hygroscopic growth that increase scattering and dilute the relative contribution of absorbing components. Together, these results indicate that higher AAEsfc is associated with a regime of larger particles and stronger dust contribution, whereas lower AAEsfc occurs when secondary inorganic matter is more influential and dust contributions are reduced. Overall, AAEsfc is influenced not only by carbonaceous aerosols, but also strongly by other chemical components, particularly mineral dust-related particles, non-dust water-soluble inorganic ions, and particle-size distributions.
3.3 Quantitative Contributions of Composition and Size to Columnar AAE
The relationships between mass fractions of chemical composition and AAEcol were studied using AERONET data (Fig. 3). The CNAI and FNAI mass fractions varied little and exhibited no significant correlations with AAEcol ( and 0.03, p>0.1), indicating a negligible role in setting the absorption spectral dependence. In contrast, BC, BrC, and CAI displayed clear associations. Higher AAEcol (>1.5) were associated with marked increases in BrC and CAI, whereas lower AAEcol (<1.5) corresponded to relatively higher BC contributions. Correlation analysis is consistent with these patterns: AAEcol was negatively correlated with BC (, p<0.01), in line with its weak wavelength dependence, but positively correlated with BrC (r=0.19, p<0.01) and CAI (r=0.31, p<0.01), underscoring the strong wavelength dependence of BrC and dust. These findings were similarly to our surface campaign, particularly regarding dust's amplifying effect on AAEcol.
The impacts of aerosol size distribution on AAEcol were clearly reflected (Fig. 4). With AAEcol increasing, the peaks of both fine and coarse modes shifted to smaller sizes (Fig. 4a), indicating an overall refinement of the size distribution. The Rfine and Rcoarse were both negatively correlated with AAEcol ( and −0.26, p<0.01; Fig. 4c, d), demonstrating that reductions in particle size in both modes enhanced the spectral dependence. Interestingly, FMF decreased with increasing AAEcol (Fig. 4b), suggesting that coarse-mode particles retained a substantial volumetric contribution even under high AAEcol conditions.
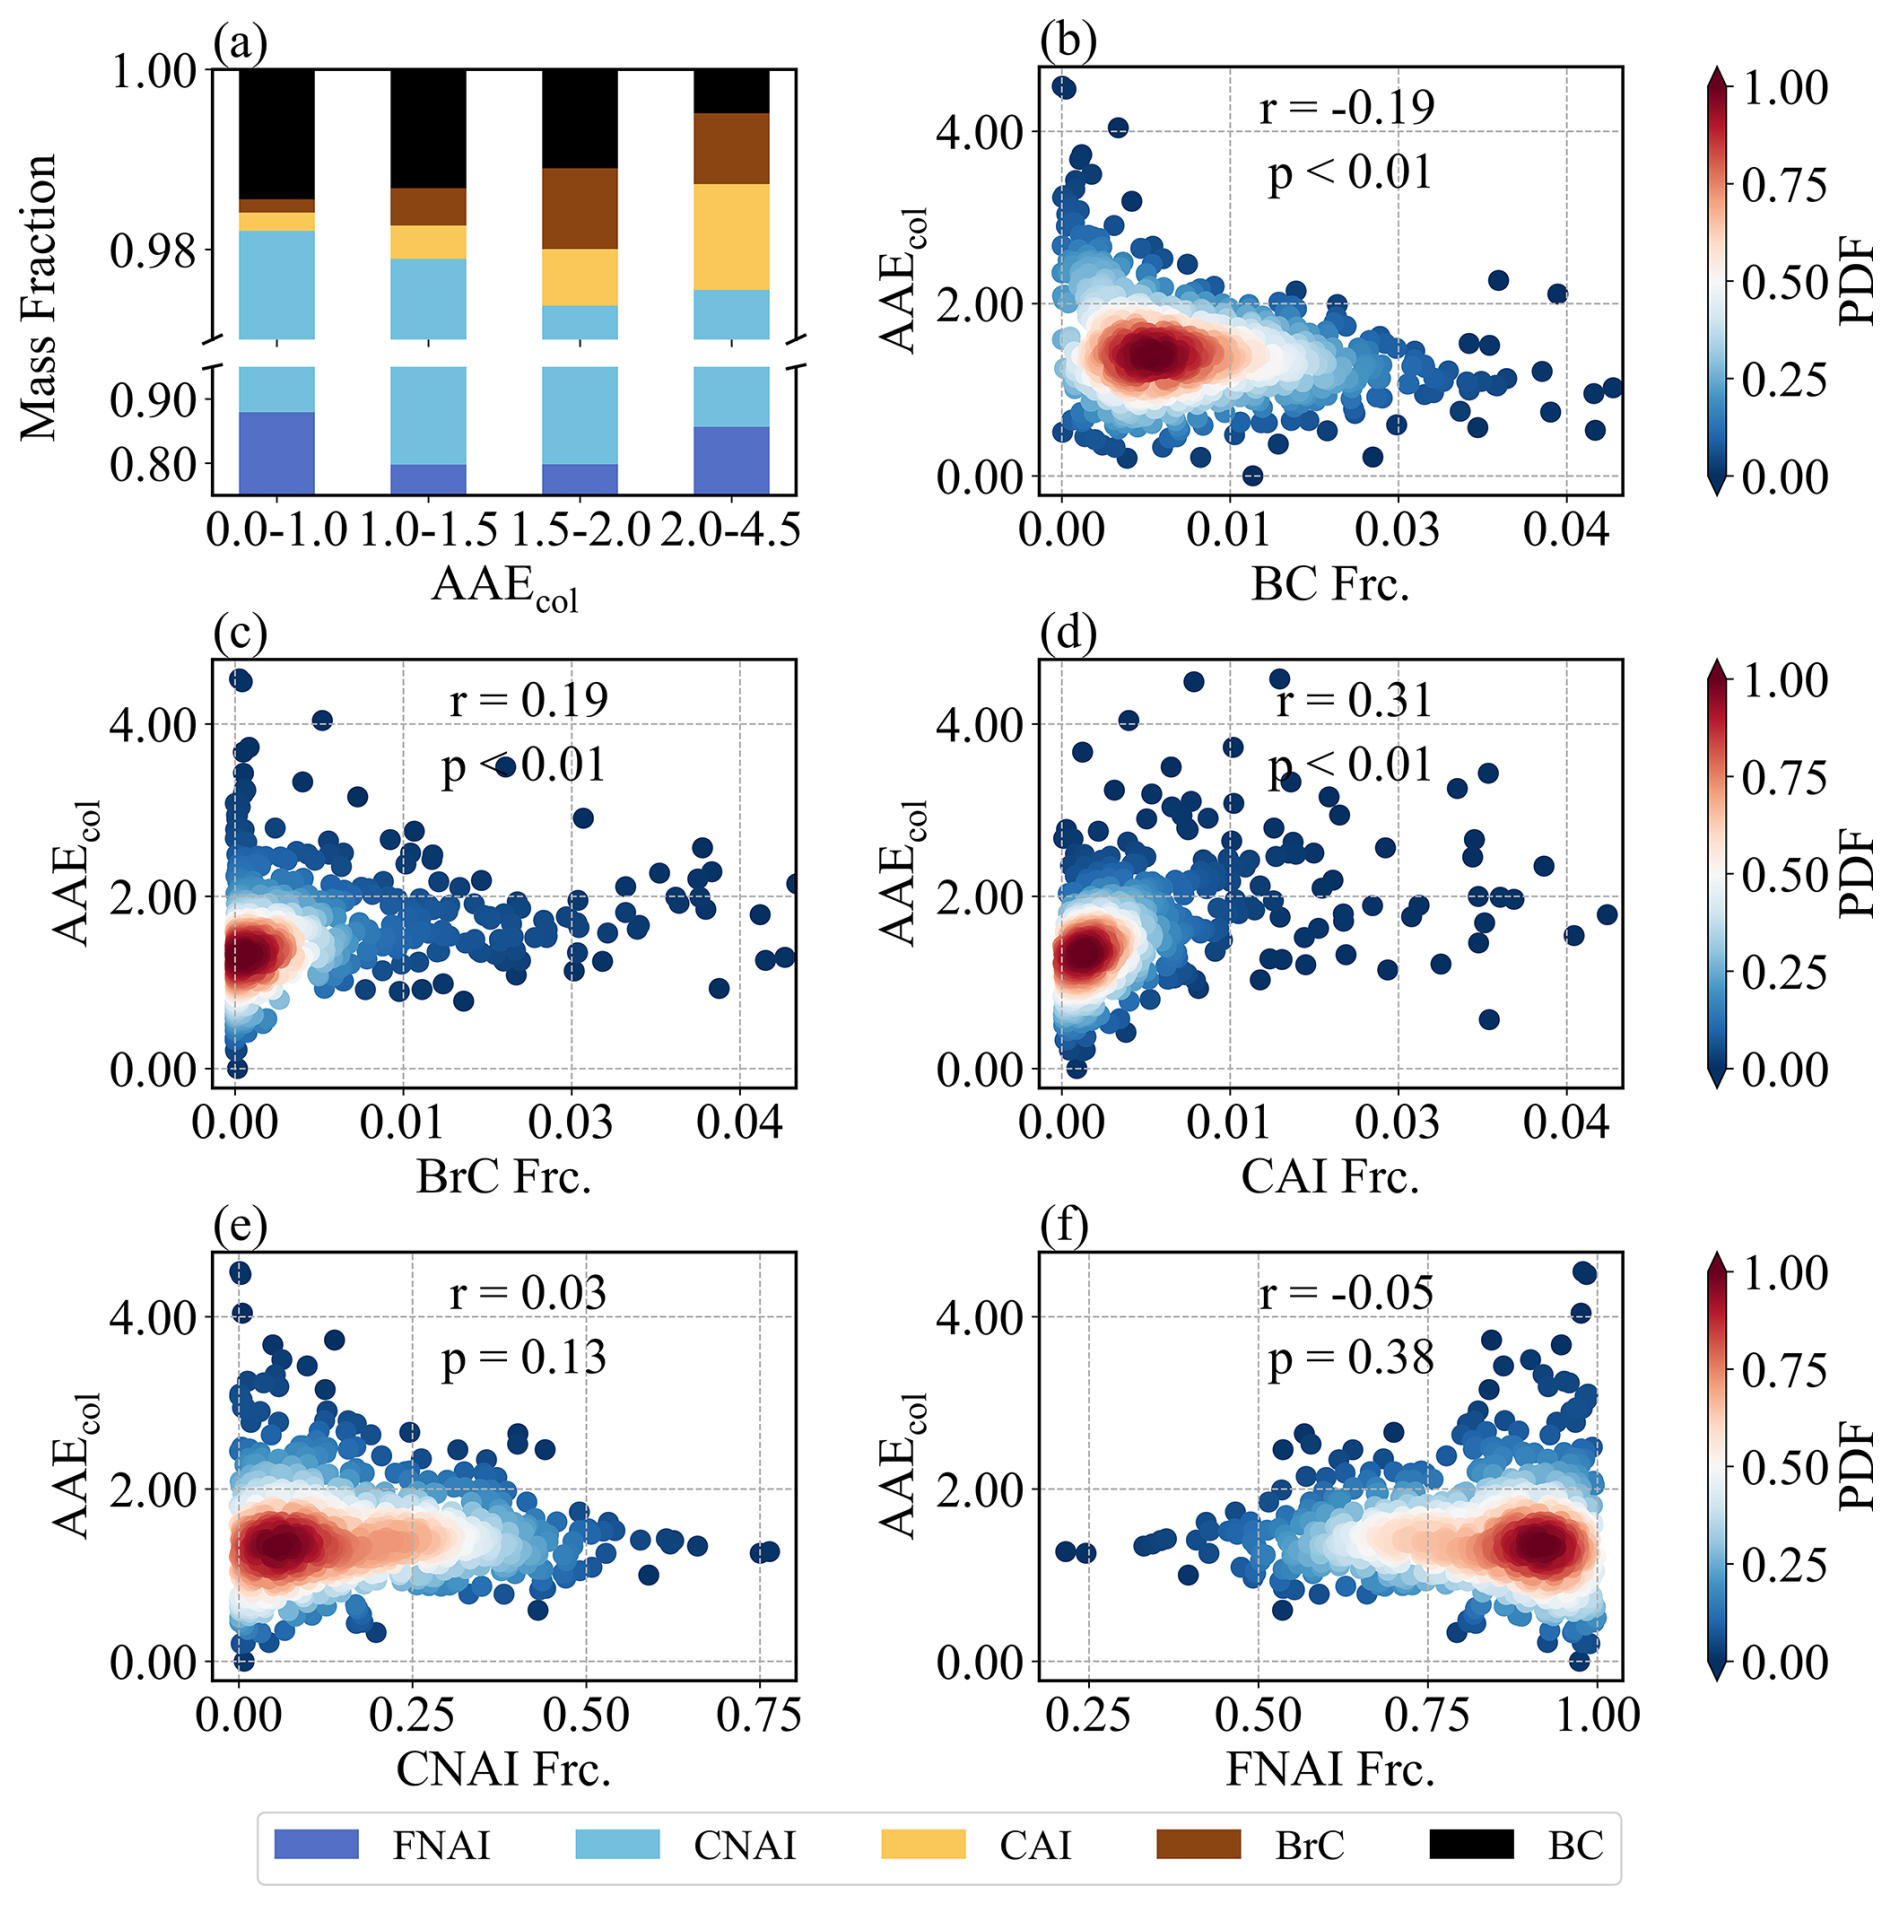
Figure 3Relationships between columnar absorption Ångström exponent (AAEcol) and major aerosol chemical compositions. (a) Mass fractions of fine-mode non-absorbing soluble matter (FNAI), coarse-mode non-absorbing soluble matter (CNAI), coarse-mode absorbing soluble matter (CAI, representing dust), brown carbon (BrC), and black carbon (BC) across different AAEcol bins. (b–f) Correlations between AAEcol and the mass fractions of BC, BrC, CAI, CNAI, and FNAI, respectively; shaded colors denote probability density.
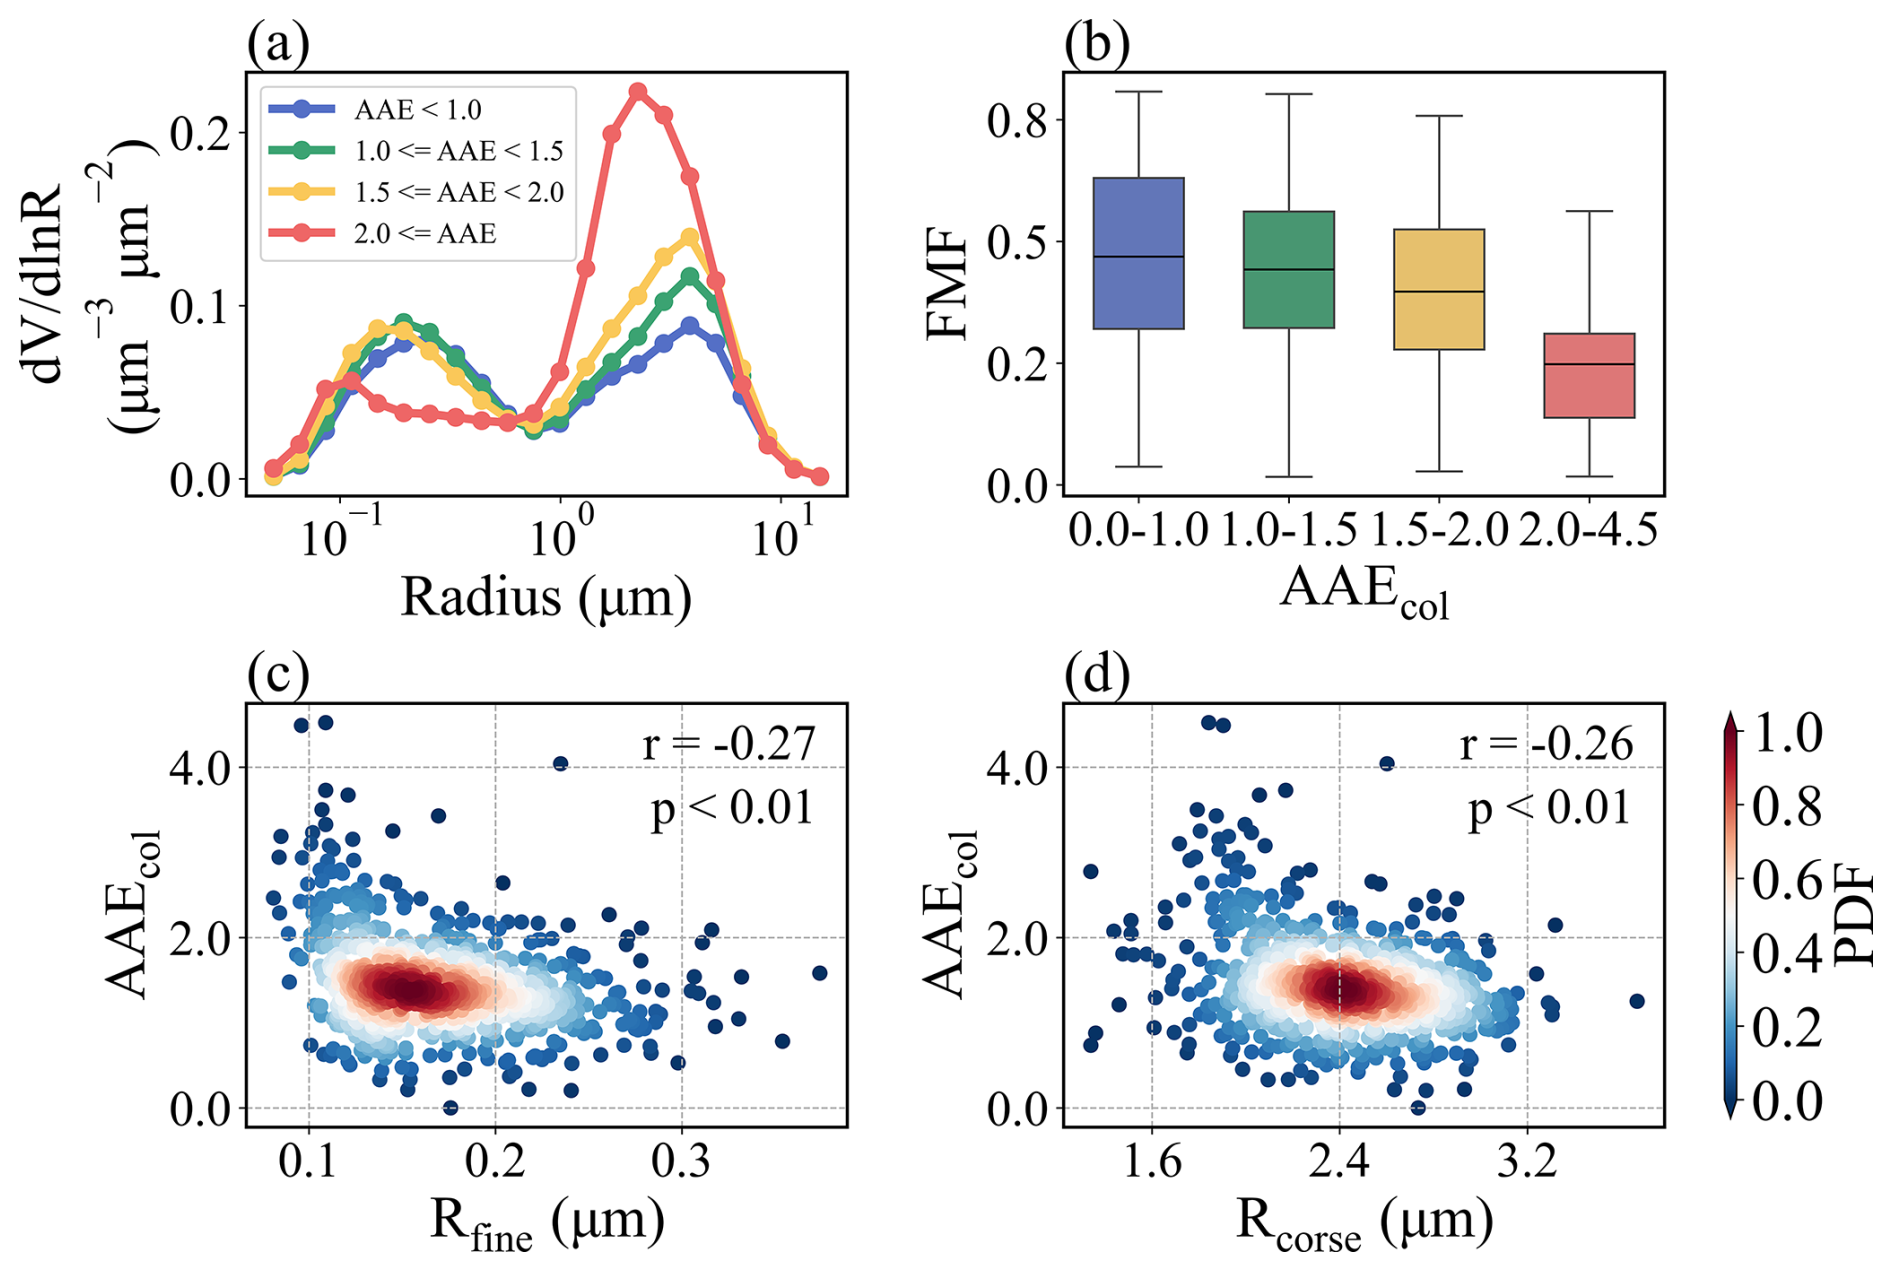
Figure 4Relationships between columnar absorption Ångström exponent (AAEcol) and aerosol size distribution characteristics. (a) Volume size distributions grouped by AAEcol bins. (b) Fine-mode fraction (FMF) by AAEcol bins, with horizontal lines indicating means. (c–d) Correlations of AAEcol with effective radius of fine-mode (Rfine) and coarse-mode (Rcoarse) particles, respectively.
Machine learning analysis further quantified relative contributions, as illustrated in Fig. 5a. It is found that CAI had the strongest explanatory power, accounting for ∼ 19 % of the model's predictive power, confirming the dominant role of dust in amplifying spectral absorption. BrC was second (18.5 %) and BC was third (13.9 %), together with CAI explaining ∼ 50 % of model's predictive power (as measured by mean absolute SHAP value). Among the size-related predictors, Rfine alone accounted for about one quarter (∼ 29 %) of the cumulative importance of all size metrics, making it the most influential size parameter. In addition, its importance was also clearly higher than CNAI and FNAI (Fig. 5a). During the prediction process, it is observed that higher values of BrC, CAI, and volume concentrations of coarse-mode (volcoarse) corresponded to higher SHAP values and higher values of other predictors corresponded to smaller SHAP values (Fig. 5a). These responses are fully consistent with the correlations between AAEcol and these parameters (Figs. 3b–d, 4c–d).
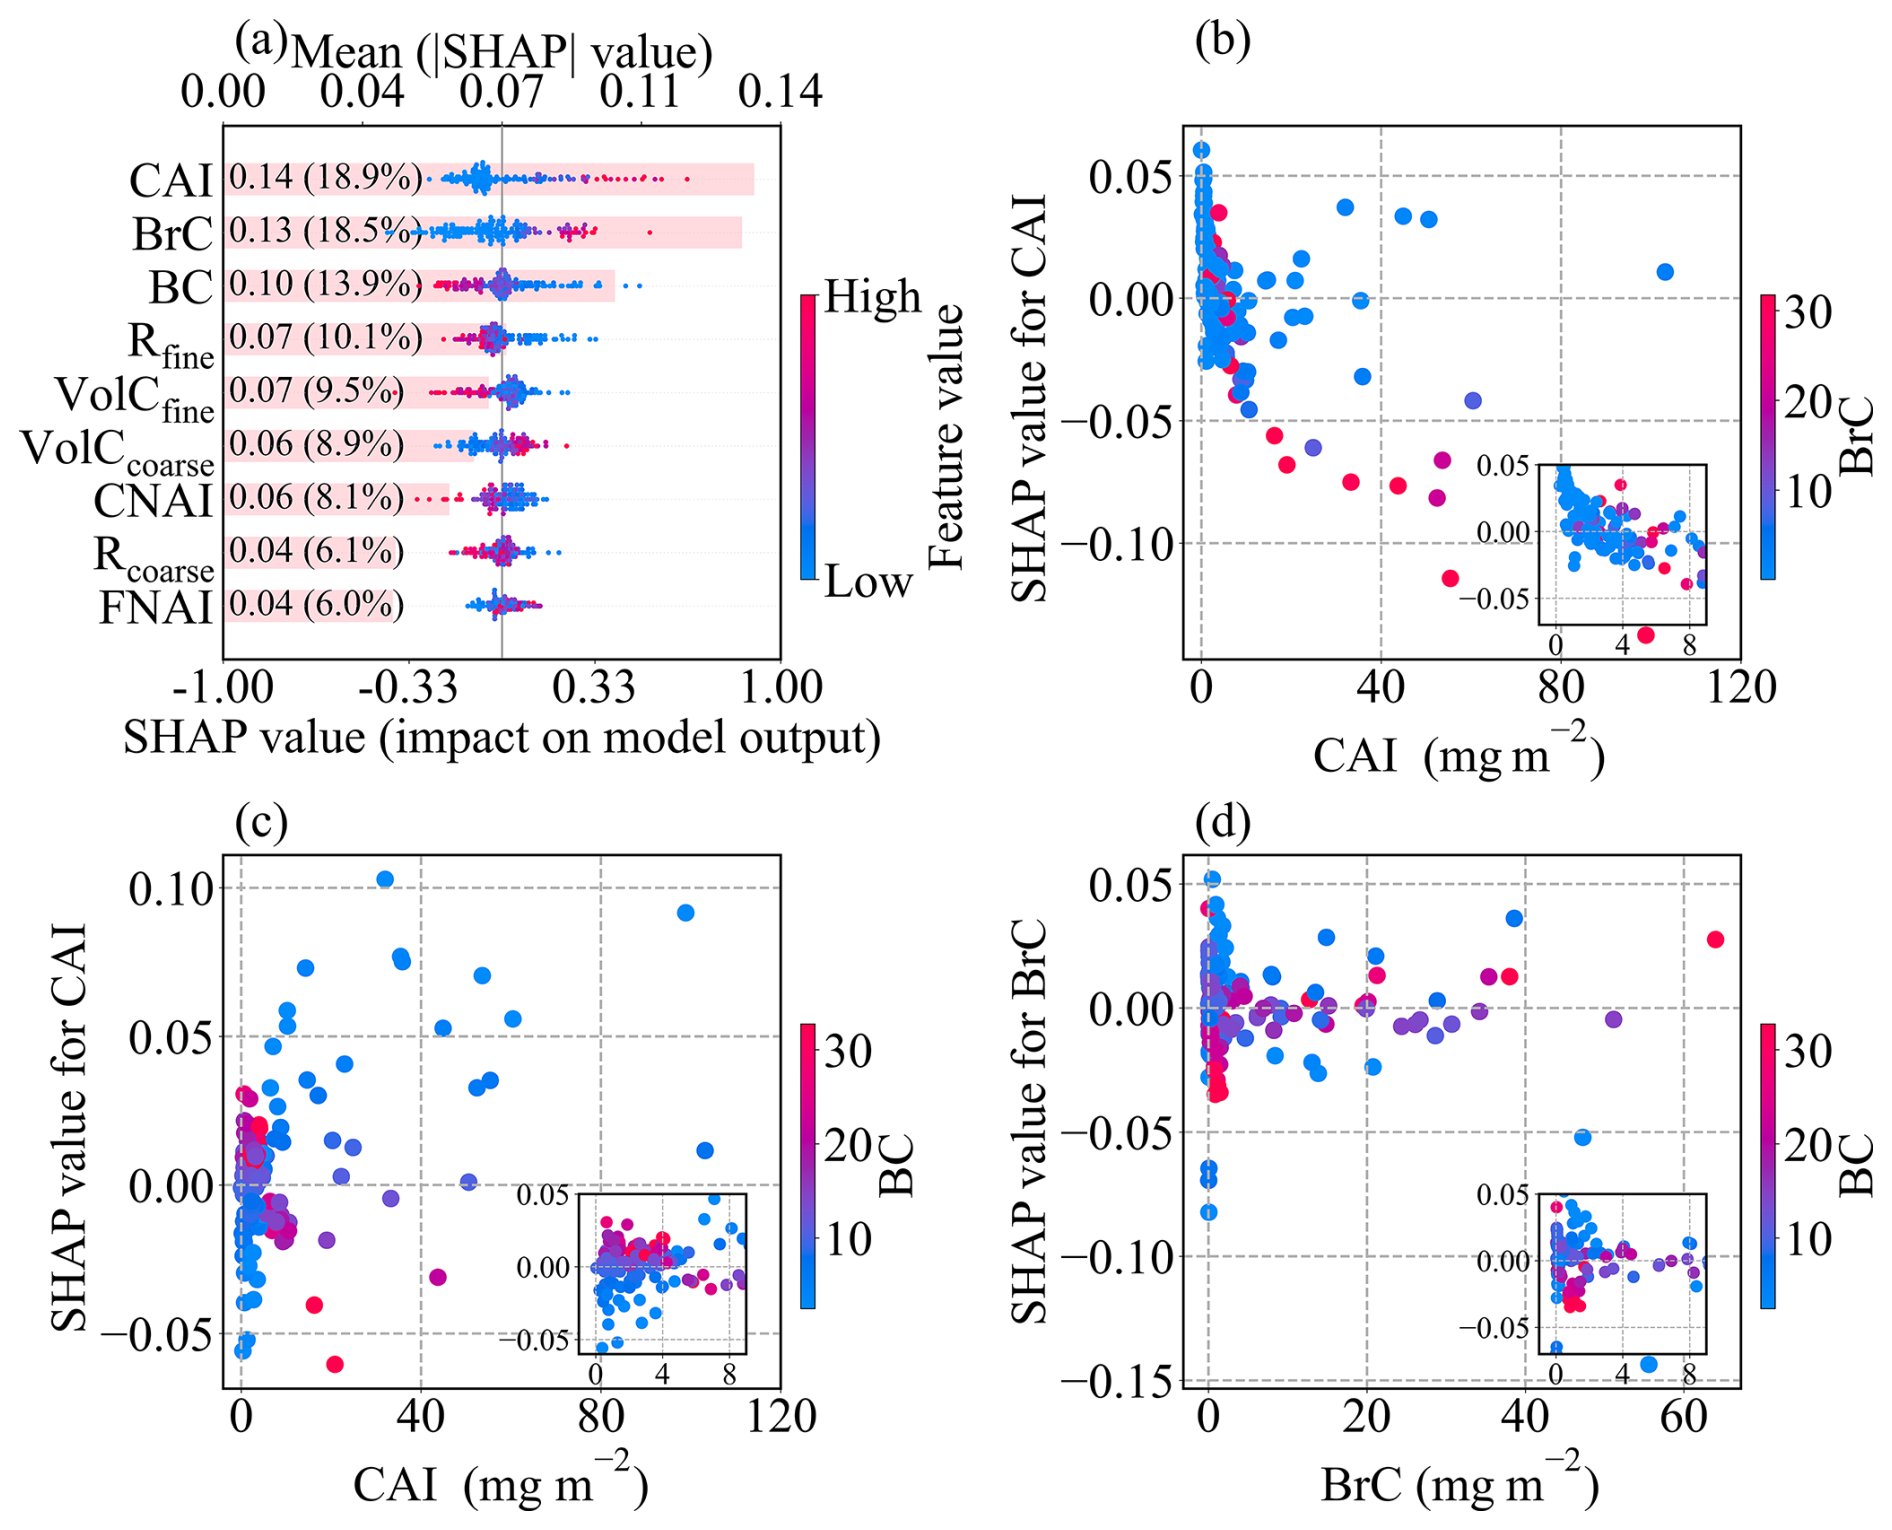
Figure 5SHAP interpretation of the machine-learning model for columnar AAE. (a) Attribution of chemical compositions and particle size parameters to columnar AAE. Each horizontal bar represents the mean absolute SHAP value of a feature, indicating its overall impact on the model output; the color gradient shows the effect of feature values on columnar AAE, with red indicating a positive influence and blue indicating a negative influence. Features are ranked by importance. (b–c) SHAP dependence plots corresponding to CAI. (d) SHAP dependence plots corresponding to BrC.
To connect these statistical attributions to physically plausible behavior, we performed a simple Mie-theory sensitivity analysis (Sect. S3 in the Supplement; Fig. S11). First, we varied the imaginary part of the refractive index at 440 nm (k440) while keeping the size distribution fixed. Second, keeping refractive index fixed and shifting the fine- and coarse-mode radii to 80 %, 90 %, 100 %, 110 %, and 120 % of their baseline values (with mode-integrated volume conserved).
Varying k440 produces a substantially larger change in the modeled AAEcol than the size-shift experiments (Fig. S12), indicating that changes in short-wavelength absorptivity exert stronger leverage on AAE than variations in modal radii. Because we altered k440 while keeping k870 unchanged, this experiment specifically isolates enhanced absorption in the short wavelengths which is consistent with increased contributions from aerosols that preferentially absorb at shorter wavelengths, such as absorbing mineral dust and brown carbon (Russell et al., 2010). Spectral refractive indices retrieved by AERONET are known to vary systematically across aerosol types and can be used to infer absorbing components, supporting the interpretation of k as a proxy for composition-related absorption variability (Dubovik et al., 2002; Wang et al., 2013). Fine-mode shifts produce a clearer change in the AAEcol than coarse-mode shifts (Fig. S12b, c), consistent with Rfine being the leading size predictor in Fig. 5a. Taken together, the SHAP results and the Mie sensitivity tests support a consistent interpretation that AAEcol is not influenced by BC or BrC alone; it is primarily associated with dust and secondarily by particle-size structure (size metrics together ∼ 35 %) (Fig. 5a), underscoring the need to account for both composition and size when evaluating spectral absorption.
To further investigate the interaction effects of major parameters on AAEcol prediction, we selected CAI, BrC, and BC, the three most influential predictors by SHAP, to analyze their interactions (Fig. 5b–f). When CAI loading was below 10 mg m−2, BrC suppressed the positive impact of CAI loading and progressively drove it toward a negative contribution. When CAI loading exceeded 10 mg m−2, lower BrC is more likely than higher BrC to sustain or enhance the positive marginal effect of CAI, although the magnitude is weaker than in the CAI loading < 10 mg m−2 regime. For CAI loading in the range 0–4, higher BC yielded a positive marginal effect of CAI on AAEcol, whereas lowed BC yielded a negative one. Once CAI loading is greater than 4 mg m−2, this relationship reverses, with higher BC more likely to make further increases in CAI contribute negatively to AAEcol. As BrC increases, BC progressively reduces the positive and negative contributions of BrC to AAEcol. These interactions indicate that models of aerosol spectral absorption should explicitly represent the mutual constraints among CAI, BrC, and BC to better identify and quantify AAE drivers.
3.4 The comparison between surface and columnar AAE
Section 3.2 and 3.3 provide two complementary perspectives on AAE. The near-surface campaign (December 2023–January 2024) represents a specific winter pollution regime, whereas the AERONET analysis provides a longer-term perspective (2001–2019). Despite these differences, the two analyses converge on a consistent mechanistic interpretation. AAE increases when short-wavelength absorption becomes relatively stronger, and dust-related absorption plays a central role in influencing this spectral dependence. In the surface analysis, the fine mineral dust fraction within PM2.5 is significantly associated with elevated AAEsfc (Fig. 2a). In the column analysis, the absorbing dust component (CAI), which includes substantial coarse-mode contributions (radius about 0.6–15 µm), likewise ranks among the most informative predictors for AAEcol (Fig. 5a). Despite the different size ranges and vertical weighting, both indicators consistently support the interpretation that dust-related enhancement of short-wavelength absorption, and is linked to higher AAE.
It is also worth noting that the AAEcol (1.47 ± 0.56) was found to be lower than that derived from the surface field campaign (Fig. 1), but this difference should not be interpreted as a comparison between column and surface values. The two quantities differ in both temporal representativeness (multi-year climatology versus a one-month winter campaign) and measurement definition (AAOD-based column integration versus near-surface absorption coefficients), so their absolute magnitudes are expected to vary with aerosol regime, meteorology, and the contribution of elevated layers. Therefore, our emphasis is on the consistency of predicting factors and mechanisms, rather than a direct comparison of mean values.
Finally, the two datasets complement each other in terms of strengths and limitations. The surface measurements provide chemically explicit constraints but are restricted to PM2.5, thereby under-representing coarse-mode dust and any elevated-layer contributions. The AERONET analysis offers direct links to radiative quantities, but its component variables are retrieval-based optical constructs that depend on prescribed optics and mixing assumptions (Dubovik and King, 2000; Sinyuk et al., 2020; Li et al., 2019). As a result, several categories are not directly interchangeable (e.g., surface nd-WSII versus retrieved non-absorbing components, surface OM versus optically defined BrC, and thermal EC versus optically defined BC). Taken together, the surface campaign provides process-level chemical context for short-term variability, while the AERONET record generalizes the interpretation across regimes and links AAE to column radiative effects with dust-related absorption emerging as the clearest cross-scale consistency.
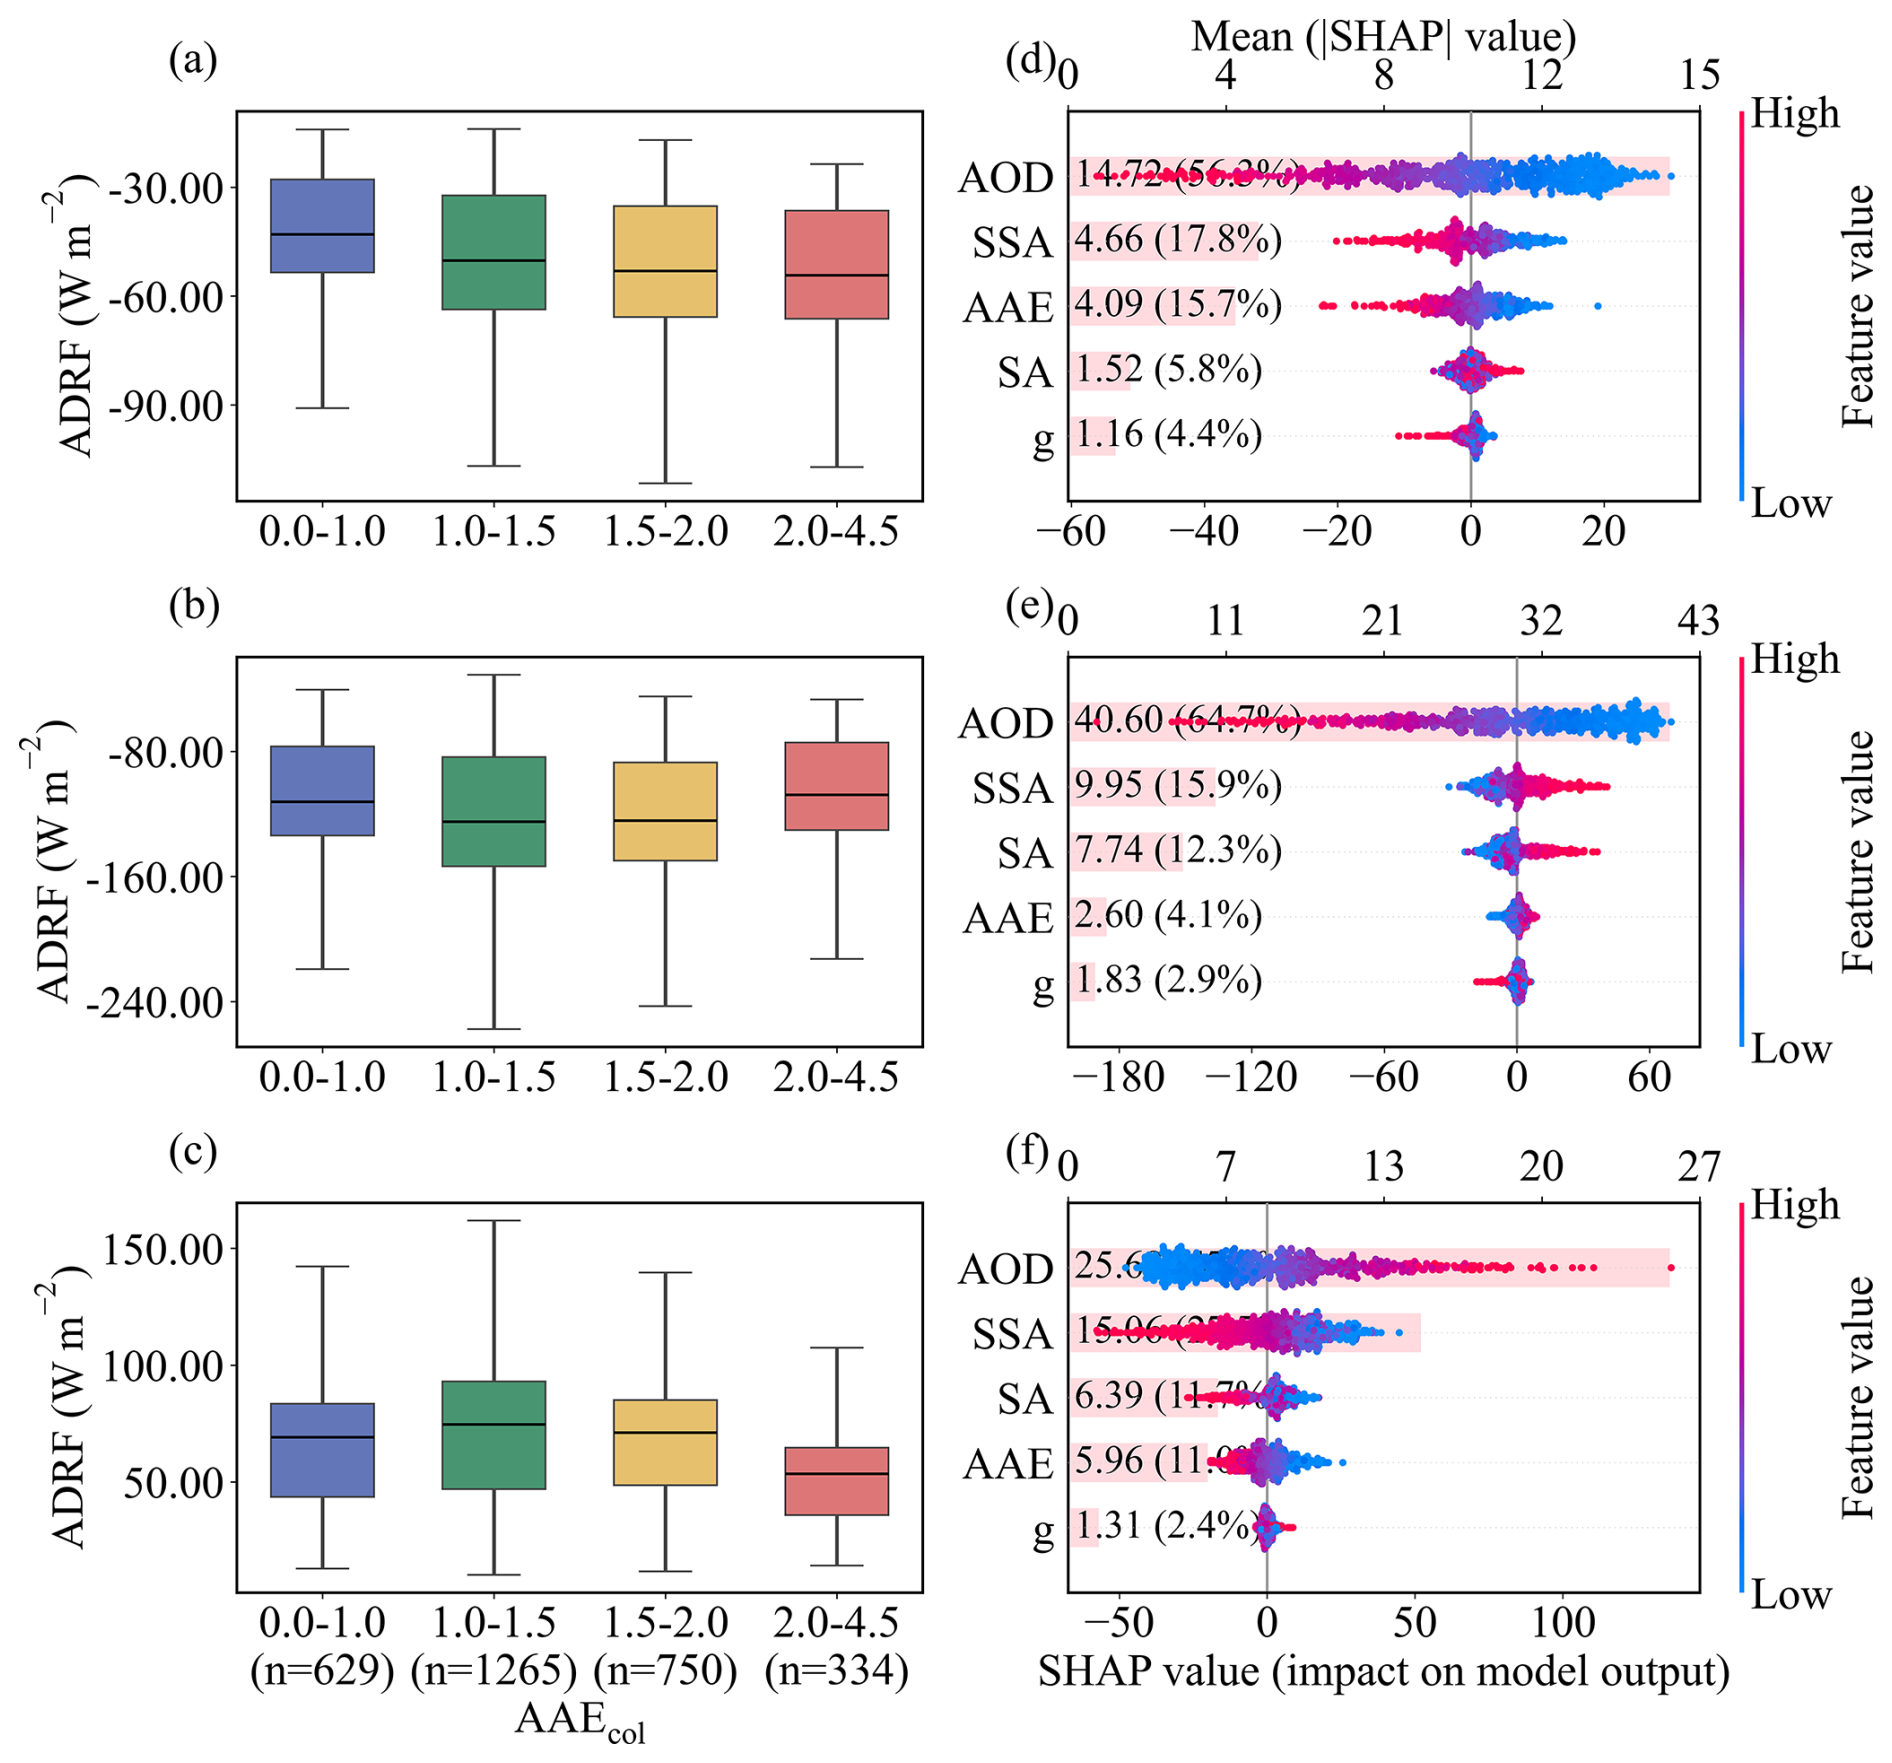
Figure 6The relationship between columnar AAE (AAEcol) and aerosol direct radiative forcing (ADRF). (a–c) Box plots of ADRF at the top of the atmosphere (a), bottom (b), and in the atmosphere (c) as a function of AAEcol. The sample sizes for the AAEcol bins 0.0–1.0, 1.0–1.5, 1.5–2.0, and 2.0–4.5 are n=629, 1265, 750, and 334, respectively, and are identical for panels (a)–(c). (d–f) SHAP analysis quantifies the relative contributions of aerosol optical depth (AOD), single scattering albedo (SSA), asymmetry parameter (g), surface albedo (SA) and AAEcol in predicting ADRF variations at the top of the atmosphere (d), at the bottom of the atmosphere (e), and in the atmosphere (f). The mean absolute SHAP values (numbers in parentheses) indicate the relative contribution of each predictor to the model output.
3.5 The Diagnostic Power of Columnar AAE for Radiative Forcing and Efficiency in Beijing
Joint analysis of the boxplots and SHAP diagnostics revealed a robust, layer-dependent correlation between the AAEcol and ADRF. As AAEcol increases from 0–1 to 2–4.5, cooling at the TOA intensifies, atmospheric heating weakens, and cooling at the BOA is alleviated (Fig. 6a–c). This pattern is consistent with a shift from more BC-like absorption toward regimes with stronger short-wavelength absorption signatures and higher scattering fractions, commonly associated with mixtures involving BrC and mineral dust. SHAP method confirms that AAEcol is the third strongest predictor (∼ 16 %) after AOD (∼ 56 %), and comparably to SSA (∼ 18 %) at TOA and consistently shifts ADRF toward more negative values (Fig. 6d). At BOA, AAEcol explains only ∼ 4 % of the model importance. BOA cooling is primarily explained by AOD (∼ 65.0 %) and SSA (∼ 16 %) (Fig. 6e). In the ATM, AOD and SSA remain the leading predictors, while AAEcol still shows importance comparable to surface albedo (SA) (both ∼ 12 %) (Fig. 6f). Mechanistically, higher AAEcol is commonly associated with BrC and dust, which exhibit higher SSA but lower mass absorption efficiencies (MAE), thereby enhancing backscattering and solar escape (more negative TOA forcing), reducing absorption (weaker atmospheric heating), and producing a net transmission effect that mitigates BOA cooling.
To better show columnar AAE's impact on ADRF, we introduce the ARFE, which removes the scaling by aerosol loading and highlights intrinsic optical controls. At TOA, AAEcol serves as a key diagnostic of cooling efficiency in the model, with mean reaching ∼ 40.0 %, exceeding the asymmetry factor (g), SSA, and SA even when AOD was conditioned at 25th (Fig. S12), 50th (Fig. 7), 75th percentiles (Fig. S13), or mean (Fig. S14). Larger AAEcol is associated with more negative TOA ARFE (Fig. 7d), indicating that, for comparable loading, regimes with steeper absorption spectra tend to exhibit stronger TOA cooling efficiency.
At BOA, ARFE is predicted primarily by SSA (∼ 50 %), followed by g and SA, with AAEcol predicting more modestly (∼ 8 %) (Fig. 7e). In this layer, higher SSA and larger g tend to make ARFE less negative, consistent with reduced absorption and more forward-directed scattering leading to greater transmittance for a fixed AOD. In the ATM, SSA is the dominant predictor of the heating-efficiency (> 50 %), with AAEcol and SA providing secondary information (both ∼ 17 %), while g plays a minor role (Fig. 7f).
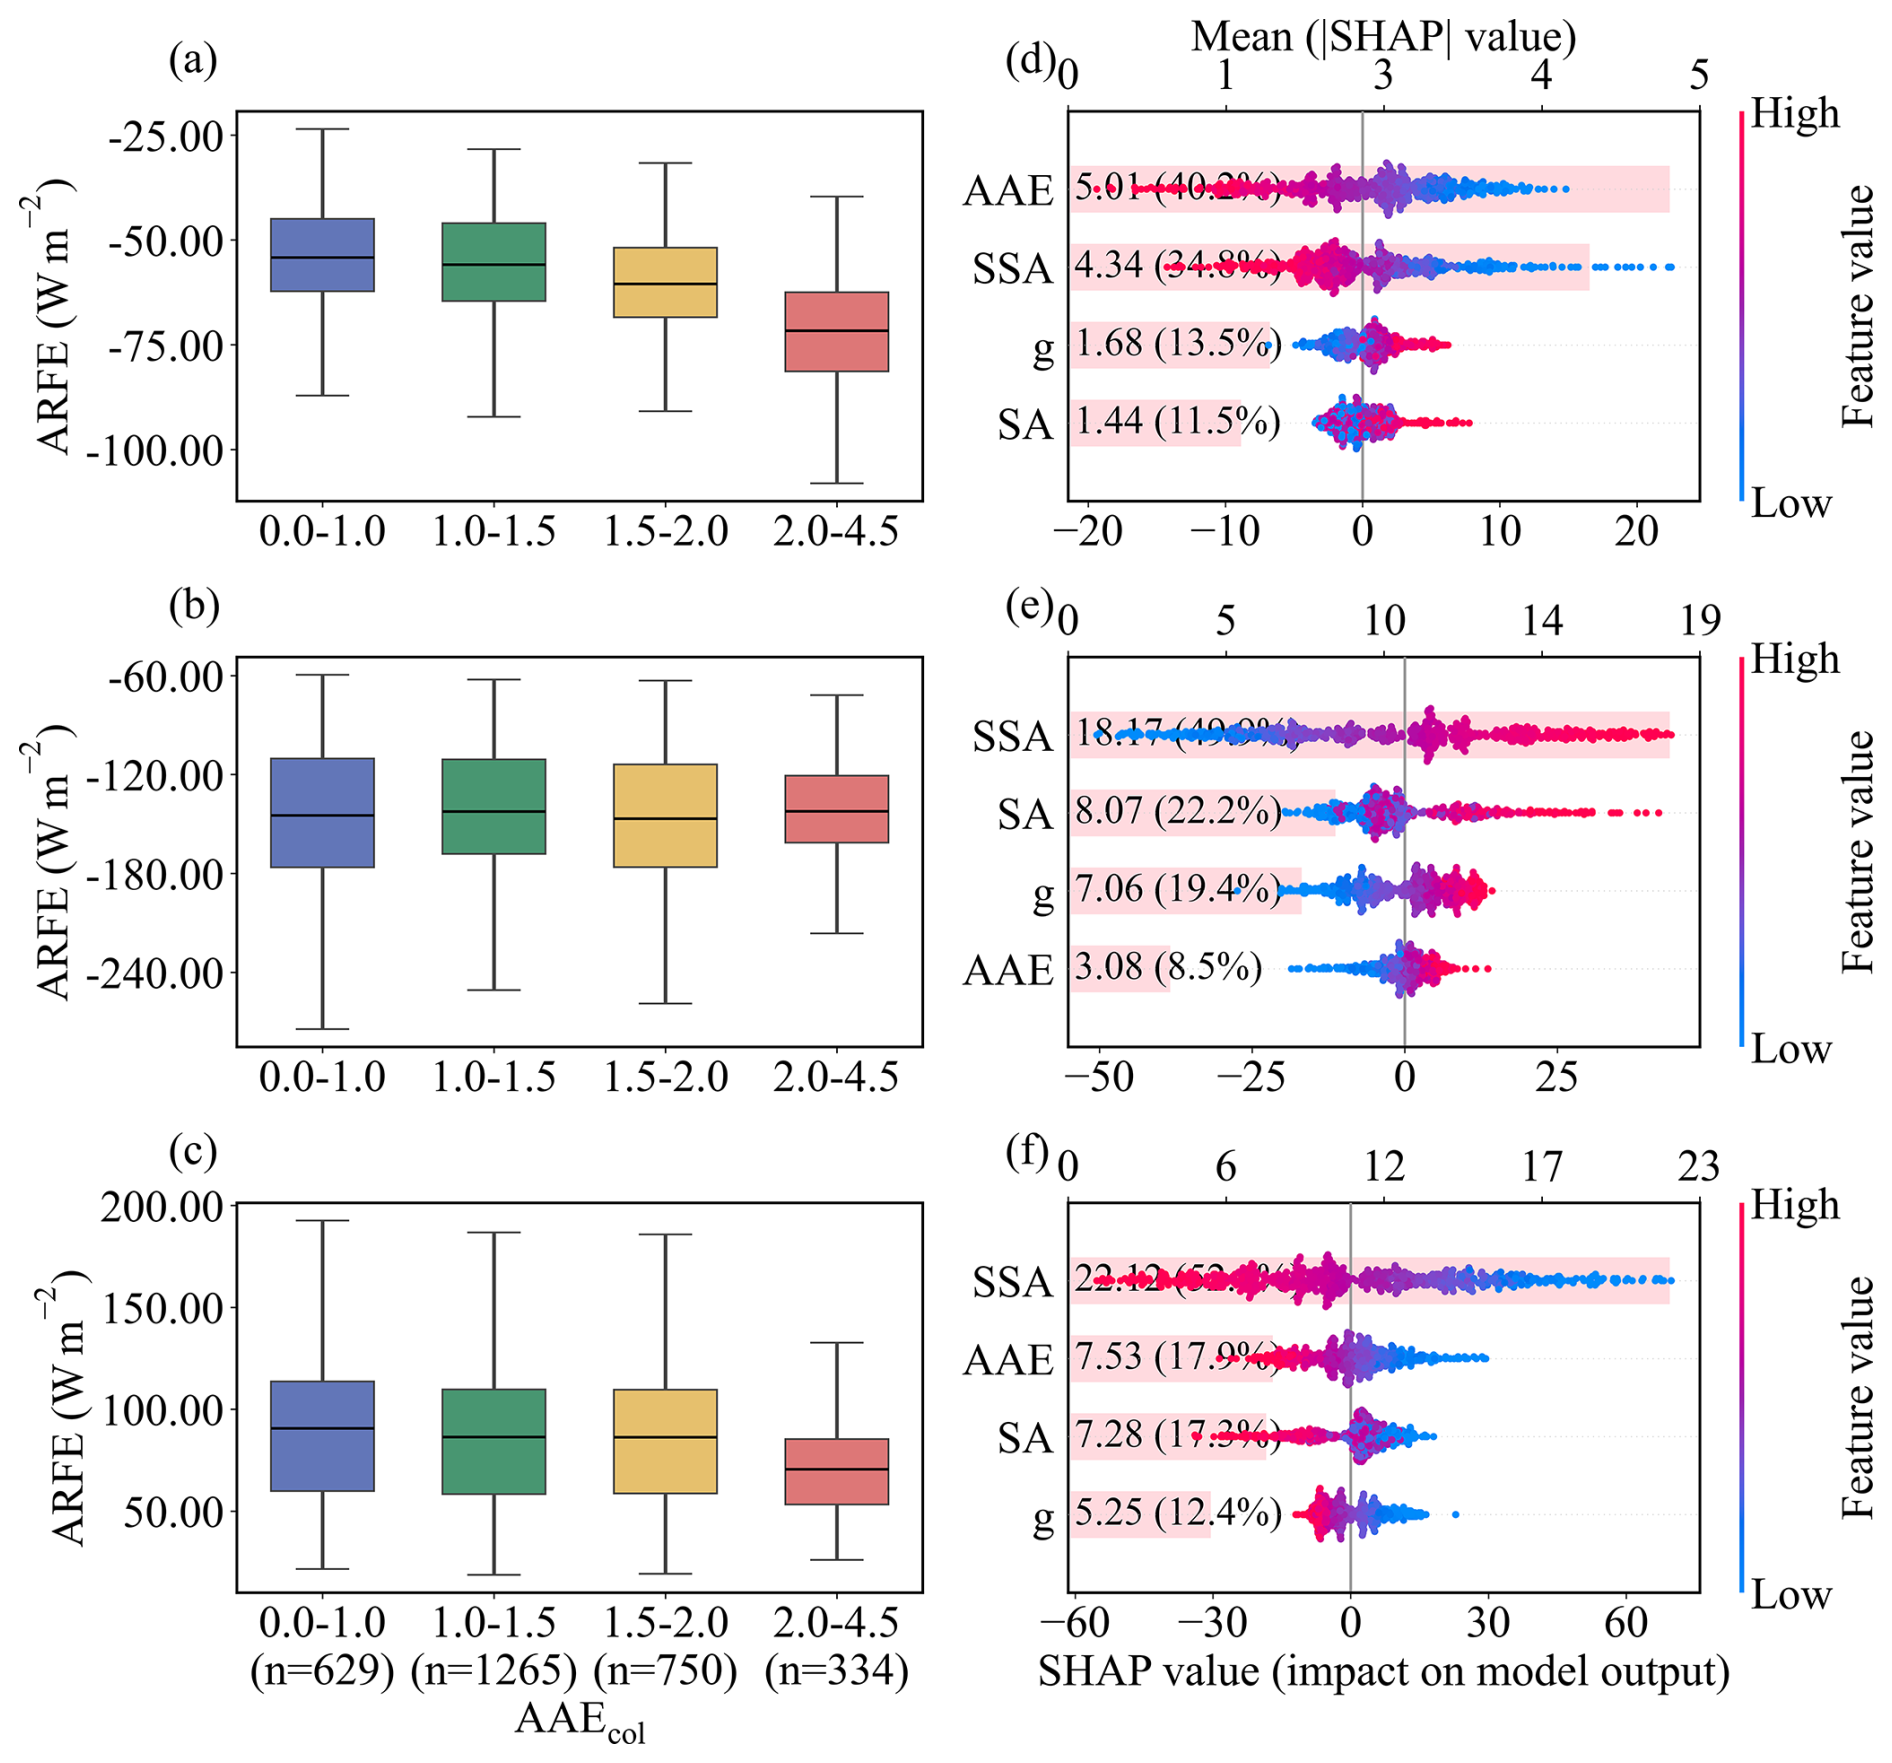
Figure 7The relationship between columnar AAE (AAEcol) and aerosol radiative forcing efficiency (ARFE). (a–c) Box plots of ARFE at the top of the atmosphere (a), bottom (b), and in the atmosphere (c) as a function of AAEcol. The sample sizes for the AAEcol bins 0.0–1.0, 1.0–1.5, 1.5–2.0, and 2.0–4.5 are n=629, 1265, 750, and 334, respectively, and are identical for panels (a)–(c). (d–f) SHAP analysis with AOD fixed at its median (50th percentile) quantifies the relative contributions of single scattering albedo (SSA), asymmetry parameter (g), surface albedo (SA) and AAEcol in predicting ARFE variations at the top of the atmosphere (d), bottom (e), and in the atmosphere (f). The mean absolute SHAP values (numbers in parentheses) indicate the relative contribution of each predictor to the model output.
Higher AAEcol is linked to lower atmospheric heating efficiency, reflecting a shift toward aerosol types with weaker mass absorption than BC, and higher SSA further suppresses in-column absorption. Overall, these results do not imply that AAEcol is a causal driver of radiative forcing and radiative forcing efficiency; rather, AAEcol acts as a compact descriptor of absorption spectral shape that co-varies with underlying composition and size regimes. The strong association between radiative forcing and ARFE therefore suggests that constraining AAE can meaningfully improve estimates of forcing efficiency in radiative assessments.
LAAs exert a strong influence on the Earth's radiation budget, yet the spectral dependence of their absorption, commonly summarized by the AAE, remains poorly constrained in urban regions. Here we combined a winter in situ observation in Beijing with a long-term AERONET column data (2001–2019) and an interpretable machine-learning framework to quantify how composition and particle size influence AAE and to evaluate what AAE implies for radiative effects.
Near the surface in wintertime Beijing, AAE variability co-varied primarily with enhanced fractions of fine mineral dust and water-soluble inorganic ions, underscoring that non-carbonaceous species can substantially modulate local absorption spectra in addition to BC and BrC. At the column level, SHAP diagnostics identified CAI is the most informative predictor of columnar AAE, followed by BrC and BC. Among particle size metrics, the fine-mode effective radius is the leading size-related predictor and accounts for about 29 % of the cumulative importance of all size parameters, whereas non-absorbing composition (coarse and fine non-absorbing dust and non-absorbing carbonaceous aerosols) played only a minor role. Because this study is based on Beijing observations, the identified predictor importance reflects a polluted urban environment influenced by both anthropogenic aerosol and episodic dust. In cleaner regions the relationships may weaken due to lower absorption signal, whereas in more dust-influenced regions the role of dust-related predictors would likely become even stronger. Although this study demonstrates the importance of bulk composition and size-distribution parameters in controlling AAE, the optical properties of light-absorbing aerosols can also be modulated by particle-level microphysical characteristics. For example, BC morphology, from fractal to compact aggregates, and mixing state, including coating thickness, coating uniformity, and the spatial distribution of inclusions, may influence AAE and subsequent radiative forcing estimates (Luo et al., 2023, 2024, 2025). These effects are not fully captured by bulk properties alone and may contribute to the remaining uncertainty.
For radiative impacts, our results highlight the diagnostic value of columnar AAE rather than implying a causal control. In the model trained on AERONET radiative products, columnar AAE is among the most informative predictors for TOA ADRF (∼ 16 %, comparable to SSA) and becomes the leading predictor for TOA ARFE (∼ 40 %), with higher columnar AAE associated with more efficient TOA cooling under loading-controlled conditions. By contrast, columnar AAE contributes much less to the prediction of ATM and BOA ADRF and ARFE, where AOD and SSA remain the primary predictors.
Overall, the findings of our study demonstrate the multifactorial influences of AAE by composition and size and highlight its strong correlation with the vertical partitioning of radiative forcing, especially at the TOA. Consequently, accurately constraining AAE is essential for a realistic representation of aerosol radiation interactions in regional and global models.
The data that support the findings of this study are available in the Zenodo data repository (https://doi.org/10.5281/zenodo.17852818, Wang et al., 2025b). The AERONET data is freely available on the AERONET website (https://aeronet.gsfc.nasa.gov/new_web/webtool_inv_v3.html, last access: 12 May 2026). The aerosol chemical composition derived from AERONET inversion data is available from Zhang et al. (2024). The code scripts are also available in the Zenodo data repository (https://doi.org/10.5281/zenodo.17852818, Wang et al., 2025b).
The supplement related to this article is available online at https://doi.org/10.5194/acp-26-6471-2026-supplement.
PT designed the study. PT and WW received the funding. WW, PT, SZ, ZY and MC analyzed the data and led the writing. WW, YZ, YW and PT conducted the field campaign. WW, PT, SZ, YZ, ZY, CC, YW, MC and LZ contributed to discussion, review, and edit the manuscript.
The contact author has declared that none of the authors has any competing interests.
Publisher's note: Copernicus Publications remains neutral with regard to jurisdictional claims made in the text, published maps, institutional affiliations, or any other geographical representation in this paper. The authors bear the ultimate responsibility for providing appropriate place names. Views expressed in the text are those of the authors and do not necessarily reflect the views of the publisher.
We thank the AERONET PI at the Beijing site for their efforts in establishing and maintaining the site. We are also grateful to Yunfei Wu for providing access to the experimental facilities at the Institute of Atmospheric Physics, Chinese Academy of Sciences. We also thank the Lanzhou University Supercomputing Center for providing computational support.
This research was supported by the National Natural Science Foundation of China (grant no. 42475080), the Gansu Province Graduate Innovation Funding Project (grant no. 2025CXZX-177) and the Fundamental Research Funds for the Central Universities (grant no. lzujbky-2024-ey04).
This paper was edited by James Allan and reviewed by two anonymous referees.
Ångström, A.: On the Atmospheric Transmission of Sun Radiation and on Dust in the Air, Geograf. Ann., 11, 156–166, https://doi.org/10.1080/20014422.1929.11880498, 1929.
Arnott, W. P., Moosmüller, H., and Walker, J. W.: Nitrogen dioxide and kerosene-flame soot calibration of photoacoustic instruments for measurement of light absorption by aerosols, Rev. Sci. Instrum., 71, 4545–4552, https://doi.org/10.1063/1.1322585, 2000.
Bahadur, R., Praveen, P. S., Xu, Y., and Ramanathan, V.: Solar absorption by elemental and brown carbon determined from spectral observations, P. Natl. Acad. Sci. USA, 109, 17366–17371, https://doi.org/10.1073/pnas.1205910109, 2012.
Bergstrom, R. W., Pilewskie, P., Russell, P. B., Redemann, J., Bond, T. C., Quinn, P. K., and Sierau, B.: Spectral absorption properties of atmospheric aerosols, Atmos. Chem. Phys., 7, 5937–5943, https://doi.org/10.5194/acp-7-5937-2007, 2007.
Bi, J., Huang, J., Holben, B., and Zhang, G.: Comparison of key absorption and optical properties between pure and transported anthropogenic dust over East and Central Asia, Atmos. Chem. Phys., 16, 15501–15516, https://doi.org/10.5194/acp-16-15501-2016, 2016.
Cappa, C., Kotamarthi, R., Selacek, A., Flynn, C., Lewis, E., McComiskey, A., and Riemer, N.: Absorbing Aerosols Workshop Report, 20–21 January 2016, https://doi.org/10.2172/1471231, 2016.
Cappa, C. D., Onasch, T. B., Massoli, P., Worsnop, D. R., Bates, T. S., Cross, E. S., Davidovits, P., Hakala, J., Hayden, K. L., Jobson, B. T., Kolesar, K. R., Lack, D. A., Lerner, B. M., Li, S.-M., Mellon, D., Nuaaman, I., Olfert, J. S., Petäjä, T., Quinn, P. K., Song, C., Subramanian, R., Williams, E. J., and Zaveri, R. A.: Radiative Absorption Enhancements Due to the Mixing State of Atmospheric Black Carbon, Science, 337, 1078–1081, https://doi.org/10.1126/science.1223447, 2012.
Cazorla, A., Bahadur, R., Suski, K. J., Cahill, J. F., Chand, D., Schmid, B., Ramanathan, V., and Prather, K. A.: Relating aerosol absorption due to soot, organic carbon, and dust to emission sources determined from in-situ chemical measurements, Atmos. Chem. Phys., 13, 9337–9350, https://doi.org/10.5194/acp-13-9337-2013, 2013.
Chakrabarty, R. K., Arnold, I. J., Francisco, D. M., Hatchett, B., Hosseinpour, F., Loria, M., Pokharel, A., and Woody, B. M.: Black and brown carbon fractal aggregates from combustion of two fuels widely used in Asian rituals, J. Quant. Spectrosc. Ra., 122, 25–30, https://doi.org/10.1016/j.jqsrt.2012.12.011, 2013.
Chow, J. C., Watson, J. G., Chen, L.-W. A., Chang, M. C. O., Robinson, N. F., Trimble, D., and Kohl, S.: The IMPROVE_A Temperature Protocol for Thermal/Optical Carbon Analysis: Maintaining Consistency with a Long-Term Database, J. Air Waste Manage. Assoc., 57, 1014–1023, https://doi.org/10.3155/1047-3289.57.9.1014, 2007.
Cuesta-Mosquera, A., Glojek, K., Močnik, G., Drinovec, L., Gregorič, A., Rigler, M., Ogrin, M., Romshoo, B., Weinhold, K., Merkel, M., van Pinxteren, D., Herrmann, H., Wiedensohler, A., Pöhlker, M., and Müller, T.: Optical properties and simple forcing efficiency of the organic aerosols and black carbon emitted by residential wood burning in rural central Europe, Atmos. Chem. Phys., 24, 2583–2605, https://doi.org/10.5194/acp-24-2583-2024, 2024.
Dubovik, O. and King, M. D.: A flexible inversion algorithm for retrieval of aerosol optical properties from Sun and sky radiance measurements, J. Geophys. Res., 105, 20673–20696, https://doi.org/10.1029/2000JD900282, 2000.
Dubovik, O., Holben, B., Eck, T. F., Smirnov, A., Kaufman, Y. J., King, M. D., Tanré, D., and Slutsker, I.: Variability of Absorption and Optical Properties of Key Aerosol Types Observed in Worldwide Locations, J. Atmos. Sci., 59, 590–608, https://doi.org/10.1175/1520-0469(2002)059<0590:VOAAOP>2.0.CO;2, 2002.
Dubovik, O., Sinyuk, A., Lapyonok, T., Holben, B. N., Mishchenko, M., Yang, P., Eck, T. F., Volten, H., Muñoz, O., Veihelmann, B., Van Der Zande, W. J., Leon, J., Sorokin, M., and Slutsker, I.: Application of spheroid models to account for aerosol particle nonsphericity in remote sensing of desert dust, J. Geophys. Res., 111, 2005JD006619, https://doi.org/10.1029/2005JD006619, 2006.
García, O. E., Díaz, A. M., Expósito, F. J., Díaz, J. P., Dubovik, O., Dubuisson, P., Roger, J. -C., Eck, T. F., Sinyuk, A., Derimian, Y., Dutton, E. G., Schafer, J. S., Holben, B. N., and García, C. A.: Validation of AERONET estimates of atmospheric solar fluxes and aerosol radiative forcing by ground-based broadband measurements, J. Geophys. Res., 113, 2008JD010211, https://doi.org/10.1029/2008JD010211, 2008.
Gliß, J., Mortier, A., Schulz, M., Andrews, E., Balkanski, Y., Bauer, S. E., Benedictow, A. M. K., Bian, H., Checa-Garcia, R., Chin, M., Ginoux, P., Griesfeller, J. J., Heckel, A., Kipling, Z., Kirkevåg, A., Kokkola, H., Laj, P., Le Sager, P., Lund, M. T., Lund Myhre, C., Matsui, H., Myhre, G., Neubauer, D., van Noije, T., North, P., Olivié, D. J. L., Rémy, S., Sogacheva, L., Takemura, T., Tsigaridis, K., and Tsyro, S. G.: AeroCom phase III multi-model evaluation of the aerosol life cycle and optical properties using ground- and space-based remote sensing as well as surface in situ observations, Atmos. Chem. Phys., 21, 87–128, https://doi.org/10.5194/acp-21-87-2021, 2021.
Guinot, B., Cachier, H., and Oikonomou, K.: Geochemical perspectives from a new aerosol chemical mass closure, Atmos. Chem. Phys., 7, 1657–1670, https://doi.org/10.5194/acp-7-1657-2007, 2007.
Guo, J., Miao, Y., Zhang, Y., Liu, H., Li, Z., Zhang, W., He, J., Lou, M., Yan, Y., Bian, L., and Zhai, P.: The climatology of planetary boundary layer height in China derived from radiosonde and reanalysis data, Atmos. Chem. Phys., 16, 13309–13319, https://doi.org/10.5194/acp-16-13309-2016, 2016.
Gyawali, M., Arnott, W. P., Zaveri, R. A., Song, C., Moosmüller, H., Liu, L., Mishchenko, M. I., Chen, L.-W. A., Green, M. C., Watson, J. G., and Chow, J. C.: Photoacoustic optical properties at UV, VIS, and near IR wavelengths for laboratory generated and winter time ambient urban aerosols, Atmos. Chem. Phys., 12, 2587–2601, https://doi.org/10.5194/acp-12-2587-2012, 2012.
Holben, B. N., Eck, T. F., Slutsker, I., Tanré, D., Buis, J. P., Setzer, A., Vermote, E., Reagan, J. A., Kaufman, Y. J., Nakajima, T., Lavenu, F., Jankowiak, I., and Smirnov, A.: AERONET – A Federated Instrument Network and Data Archive for Aerosol Characterization, Remote Sens. Environ., 66, 1–16, https://doi.org/10.1016/S0034-4257(98)00031-5, 1998.
Intergovernmental Panel On Climate Change (IPCC): Climate Change 2021 – The Physical Science Basis: Working Group I Contribution to the Sixth Assessment Report of the Intergovernmental Panel on Climate Change, 1st Edn., Cambridge University Press, https://doi.org/10.1017/9781009157896, 2023.
Kirchstetter, T. W., Novakov, T., and Hobbs, P. V.: Evidence that the spectral dependence of light absorption by aerosols is affected by organic carbon, J. Geophys. Res., 109, 2004JD004999, https://doi.org/10.1029/2004JD004999, 2004.
Kok, J. F., Ridley, D. A., Zhou, Q., Miller, R. L., Zhao, C., Heald, C. L., Ward, D. S., Albani, S., and Haustein, K.: Smaller desert dust cooling effect estimated from analysis of dust size and abundance, Nat. Geosci., 10, 274–278, https://doi.org/10.1038/ngeo2912, 2017.
Lack, D. A. and Cappa, C. D.: Impact of brown and clear carbon on light absorption enhancement, single scatter albedo and absorption wavelength dependence of black carbon, Atmos. Chem. Phys., 10, 4207–4220, https://doi.org/10.5194/acp-10-4207-2010, 2010.
Lack, D. A. and Langridge, J. M.: On the attribution of black and brown carbon light absorption using the Ångström exponent, Atmos. Chem. Phys., 13, 10535–10543, https://doi.org/10.5194/acp-13-10535-2013, 2013.
Laskin, A., Laskin, J., and Nizkorodov, S. A.: Chemistry of Atmospheric Brown Carbon, Chem. Rev., 115, 4335–4382, https://doi.org/10.1021/cr5006167, 2015.
Lee, L. A., Reddington, C. L., and Carslaw, K. S.: On the relationship between aerosol model uncertainty and radiative forcing uncertainty, P. Natl. Acad. Sci. USA, 113, 5820–5827, https://doi.org/10.1073/pnas.1507050113, 2016.
Lewis, K., Arnott, W. P., Moosmüller, H., and Wold, C. E.: Strong spectral variation of biomass smoke light absorption and single scattering albedo observed with a novel dual-wavelength photoacoustic instrument, J. Geophys. Res., 113, 2007JD009699, https://doi.org/10.1029/2007JD009699, 2008.
Li, J., Liu, C., Yin, Y., and Kumar, K. R.: Numerical investigation on the Ångström exponent of black carbon aerosol, J. Geophys. Res., 121, 3506–3518, https://doi.org/10.1002/2015JD024718, 2016.
Li, J., Carlson, B. E., Yung, Y. L., Lv, D., Hansen, J., Penner, J. E., Liao, H., Ramaswamy, V., Kahn, R. A., Zhang, P., Dubovik, O., Ding, A., Lacis, A. A., Zhang, L., and Dong, Y.: Scattering and absorbing aerosols in the climate system, Nat. Rev. Earth Environ., 3, 363–379, https://doi.org/10.1038/s43017-022-00296-7, 2022.
Li, L., Dubovik, O., Derimian, Y., Schuster, G. L., Lapyonok, T., Litvinov, P., Ducos, F., Fuertes, D., Chen, C., Li, Z., Lopatin, A., Torres, B., and Che, H.: Retrieval of aerosol components directly from satellite and ground-based measurements, Atmos. Chem. Phys., 19, 13409–13443, https://doi.org/10.5194/acp-19-13409-2019, 2019.
Li, W., Riemer, N., Xu, L., Wang, Y., Adachi, K., Shi, Z., Zhang, D., Zheng, Z., and Laskin, A.: Microphysical properties of atmospheric soot and organic particles: measurements, modeling, and impacts, npj Clim. Atmos Sci., 7, 65, https://doi.org/10.1038/s41612-024-00610-8, 2024.
Liu, C., Chung, C. E., Yin, Y., and Schnaiter, M.: The absorption Ångström exponent of black carbon: from numerical aspects, Atmos. Chem. Phys., 18, 6259–6273, https://doi.org/10.5194/acp-18-6259-2018, 2018.
Luo, J., Li, Z., Qiu, J., Zhang, Y., Fan, C., Li, L., Wu, H., Zhou, P., Li, K., and Zhang, Q.: The simulated source apportionment of light absorbing aerosols: Effects of microphysical properties of partially-coated black carbon, J. Geophys. Res., 128, e2022JD037291, https://doi.org/10.1029/2022JD037291, 2023.
Luo, J., Li, D., Wang, Y., Sun, D., Hou, W., Ren, J., Wu, H., Zhou, P., and Qiu, J.: Quantifying the effects of the microphysical properties of black carbon on the determination of brown carbon using measurements at multiple wavelengths, Atmos. Chem. Phys., 24, 427–448, https://doi.org/10.5194/acp-24-427-2024, 2024.
Luo, J., Wang, W., Qiu, J., Zhang, Q., Li, C., Hou, W., Dong, X., and Hu, M.: Both non-uniform mixing states and coating structures are important for absorption enhancement and radiative effect of black carbon, Opt. Express, 33, 21719–21735, https://doi.org/10.1364/OE.552013, 2025.
Malm, W. C., Sisler, J. F., Huffman, D., Eldred, R. A., and Cahill, T. A.: Spatial and seasonal trends in particle concentration and optical extinction in the United States, J. Geophys. Res., 99, 1347–1370, https://doi.org/10.1029/93JD02916, 1994.
Moosmüller, H., Chakrabarty, R. K., Ehlers, K. M., and Arnott, W. P.: Absorption Ångström coefficient, brown carbon, and aerosols: basic concepts, bulk matter, and spherical particles, Atmos. Chem. Phys., 11, 1217–1225, https://doi.org/10.5194/acp-11-1217-2011, 2011.
Nishant, N., Sherwood, S. C., and Geoffroy, O.: Aerosol-induced modification of organised convection and top-of-atmosphere radiation, npj Clim. Atmos. Sci., 2, 33, https://doi.org/10.1038/s41612-019-0089-1, 2019.
Park, S., Son, S.-C., and Lee, S.: Characterization, sources, and light absorption of fine organic aerosols during summer and winter at an urban site, Atmos. Res., 213, 370–380, https://doi.org/10.1016/j.atmosres.2018.06.017, 2018.
Peng, K., Xin, J., Zhu, X., Wang, X., Cao, X., Ma, Y., Ren, X., Zhao, D., Cao, J., and Wang, Z.: Machine learning model to accurately estimate the planetary boundary layer height of Beijing urban area with ERA5 data, Atmos. Res., 293, 106925, https://doi.org/10.1016/j.atmosres.2023.106925, 2023.
Petzold, A., Ogren, J. A., Fiebig, M., Laj, P., Li, S.-M., Baltensperger, U., Holzer-Popp, T., Kinne, S., Pappalardo, G., Sugimoto, N., Wehrli, C., Wiedensohler, A., and Zhang, X.-Y.: Recommendations for reporting “black carbon” measurements, Atmos. Chem. Phys., 13, 8365–8379, https://doi.org/10.5194/acp-13-8365-2013, 2013.
Ponczek, M., Franco, M. A., Carbone, S., Rizzo, L. V., Monteiro Dos Santos, D., Morais, F. G., Duarte, A., Barbosa, H. M. J., and Artaxo, P.: Linking the chemical composition and optical properties of biomass burning aerosols in Amazonia, Environ. Sci. Atmos., 2, 252–269, https://doi.org/10.1039/D1EA00055A, 2022.
Russell, P. B., Bergstrom, R. W., Shinozuka, Y., Clarke, A. D., DeCarlo, P. F., Jimenez, J. L., Livingston, J. M., Redemann, J., Dubovik, O., and Strawa, A.: Absorption Angstrom Exponent in AERONET and related data as an indicator of aerosol composition, Atmos. Chem. Phys., 10, 1155–1169, https://doi.org/10.5194/acp-10-1155-2010, 2010.
Sand, M., Samset, B. H., Myhre, G., Gliß, J., Bauer, S. E., Bian, H., Chin, M., Checa-Garcia, R., Ginoux, P., Kipling, Z., Kirkevåg, A., Kokkola, H., Le Sager, P., Lund, M. T., Matsui, H., van Noije, T., Olivié, D. J. L., Remy, S., Schulz, M., Stier, P., Stjern, C. W., Takemura, T., Tsigaridis, K., Tsyro, S. G., and Watson-Parris, D.: Aerosol absorption in global models from AeroCom phase III, Atmos. Chem. Phys., 21, 15929–15947, https://doi.org/10.5194/acp-21-15929-2021, 2021.
Scarnato, B. V., Vahidinia, S., Richard, D. T., and Kirchstetter, T. W.: Effects of internal mixing and aggregate morphology on optical properties of black carbon using a discrete dipole approximation model, Atmos. Chem. Phys., 13, 5089–5101, https://doi.org/10.5194/acp-13-5089-2013, 2013.
Schuster, G. L., Dubovik, O., and Arola, A.: Remote sensing of soot carbon – Part 1: Distinguishing different absorbing aerosol species, Atmos. Chem. Phys., 16, 1565–1585, https://doi.org/10.5194/acp-16-1565-2016, 2016a.
Schuster, G. L., Dubovik, O., Arola, A., Eck, T. F., and Holben, B. N.: Remote sensing of soot carbon – Part 2: Understanding the absorption Ångström exponent, Atmos. Chem. Phys., 16, 1587–1602, https://doi.org/10.5194/acp-16-1587-2016, 2016b.
Seinfeld, J. H. and Pandis, S. N.: Atmospheric Chemistry and Physics: From Air Pollution to Climate Change, Wiley, ISBN 978-1-119-22117-3, 2016.
Shang, D., Hu, M., Zheng, J., Qin, Y., Du, Z., Li, M., Fang, J., Peng, J., Wu, Y., Lu, S., and Guo, S.: Particle number size distribution and new particle formation under the influence of biomass burning at a high altitude background site at Mt. Yulong (3410 m), China, Atmos. Chem. Phys., 18, 15687–15703, https://doi.org/10.5194/acp-18-15687-2018, 2018.
Sinyuk, A., Holben, B. N., Eck, T. F., Giles, D. M., Slutsker, I., Korkin, S., Schafer, J. S., Smirnov, A., Sorokin, M., and Lyapustin, A.: The AERONET Version 3 aerosol retrieval algorithm, associated uncertainties and comparisons to Version 2, Atmos. Meas. Tech., 13, 3375–3411, https://doi.org/10.5194/amt-13-3375-2020, 2020.
Sotiropoulou, R. E. P., Kaskaoutis, D. G., Kalkavouras, P., Grivas, G., Petrinoli, K., Garas, S. K., Liakakou, E., Tagaris, E., and Mihalopoulos, N.: Spatial variability of carbonaceous aerosols and absorption characteristics between urban background and residential sites during wintertime at a major Mediterranean city (Athens; Greece), Atmos. Res., 323, 108163, https://doi.org/10.1016/j.atmosres.2025.108163, 2025.
Tao, C., Peng, Y., Zhang, Q., Zhang, Y., Gong, B., Wang, Q., and Wang, W.: Diagnosing ozone–NOx–VOC–aerosol sensitivity and uncovering causes of urban–nonurban discrepancies in Shandong, China, using transformer-based estimations, Atmos. Chem. Phys., 24, 4177–4192, https://doi.org/10.5194/acp-24-4177-2024, 2024.
Tian, J., Wang, Q., Ni, H., Wang, M., Zhou, Y., Han, Y., Shen, Z., Pongpiachan, S., Zhang, N., Zhao, Z., Zhang, Q., Zhang, Y., Long, X., and Cao, J.: Emission Characteristics of Primary Brown Carbon Absorption From Biomass and Coal Burning: Development of an Optical Emission Inventory for China, J. Geophys. Res.-Atmos., 124, 1879–1893, https://doi.org/10.1029/2018JD029352, 2019.
Tian, P., Zhang, L., Ma, J., Tang, K., Xu, L., Wang, Y., Cao, X., Liang, J., Ji, Y., Jiang, J. H., Yung, Y. L., and Zhang, R.: Radiative absorption enhancement of dust mixed with anthropogenic pollution over East Asia, Atmos. Chem. Phys., 18, 7815–7825, https://doi.org/10.5194/acp-18-7815-2018, 2018.
Tian, P., Zhang, N., Li, J., Fan, X., Guan, X., Lu, Y., Shi, J., Chang, Y., and Zhang, L.: Potential influence of fine aerosol chemistry on the optical properties in a semi-arid region, Environ. Res., 216, 114678, https://doi.org/10.1016/j.envres.2022.114678, 2023.
Truex, T. J. and Anderson, J. E.: Mass monitoring of carbonaceous aerosols with a spectrophone, Atmos. Environ., 13, 507–509, https://doi.org/10.1016/0004-6981(79)90143-4, 1979.
Utry, N., Ajtai, T., Filep, Á., Pintér, M., Török, Zs., Bozóki, Z., and Szabó, G.: Correlations between absorption Angström exponent (AAE) of wintertime ambient urban aerosol and its physical and chemical properties, Atmos. Environ., 91, 52–59, https://doi.org/10.1016/j.atmosenv.2014.03.047, 2014.
Wang, L., Li, Z., Tian, Q., Ma, Y., Zhang, F., Zhang, Y., Li, D., Li, K., and Li, L.: Estimate of aerosol absorbing components of black carbon, brown carbon, and dust from ground-based remote sensing data of sun-sky radiometers, J. Geophys. Res.-Atmos., 118, 6534–6543, https://doi.org/10.1002/jgrd.50356, 2013.
Wang, N., Wang, Y., Lu, C., Zhu, B., Yan, X., Sun, Y., Xu, J., Zhang, J., and Shen, Z.: Interpretable ensemble learning unveils main aerosol optical properties in predicting cloud condensation nuclei number concentration, npj Clim. Atmos. Sci., 8, 302, https://doi.org/10.1038/s41612-025-01181-y, 2025a.
Wang, Q., Ye, J., Wang, Y., Zhang, T., Ran, W., Wu, Y., Tian, J., Li, L., Zhou, Y., Hang Ho, S. S., Dang, B., Zhang, Q., Zhang, R., Chen, Y., Zhu, C., and Cao, J.: Wintertime Optical Properties of Primary and Secondary Brown Carbon at a Regional Site in the North China Plain, Environ. Sci. Technol., 53, 12389–12397, https://doi.org/10.1021/acs.est.9b03406, 2019.
Wang, Q., Liu, H., Ye, J., Tian, J., Zhang, T., Zhang, Y., Liu, S., and Cao, J.: Estimating Absorption Ångström Exponent of Black Carbon Aerosol by Coupling Multiwavelength Absorption with Chemical Composition, Environ. Sci. Tech. Lett., 8, 121–127, https://doi.org/10.1021/acs.estlett.0c00829, 2021.
Wang, W., Tian, P., and Wu, Y.: Interpretable Machine Learning Quantifies Composition and Size Controls on Aerosol Spectral Absorption, Zenodo [code and data set], https://doi.org/10.5281/ZENODO.17852818, 2025b.
Wang, Y., Huang, R.-J., Zhong, H., Wang, T., Yang, L., Yuan, W., Xu, W., and An, Z.: Predictions of the Optical Properties of Brown Carbon Aerosol by Machine Learning with Typical Chromophores, Environ. Sci. Technol., 58, 20588–20597, https://doi.org/10.1021/acs.est.4c09031, 2024.
Wu, Y., Yan, P., Tian, P., Tao, J., Li, L., Chen, J., Zhang, Y., Cao, N., Chen, C., and Zhang, R.: Spectral Light Absorption of Ambient Aerosols in Urban Beijing during Summer: An Intercomparison of Measurements from a Range of Instruments, Aerosol Air Qual. Res., 15, 1178–1187, https://doi.org/10.4209/aaqr.2014.09.0224, 2015.
Yan, C., Zheng, M., Bosch, C., Andersson, A., Desyaterik, Y., Sullivan, A. P., Collett, J. L., Zhao, B., Wang, S., He, K., and Gustafsson, Ö.: Important fossil source contribution to brown carbon in Beijing during winter, Sci. Rep., 7, 43182, https://doi.org/10.1038/srep43182, 2017.
Yang, Z., Wang, Q., Wang, Q., Ma, N., Tian, J., Zhou, Y., Xu, G., Gao, M., Zhou, X., Zhang, Y., Ran, W., Yang, N., Tao, J., Hong, J., Wu, Y., Cao, J., Su, H., and Cheng, Y.: Laboratory studies on the optical, physical, and chemical properties of fresh and aged biomass burning aerosols, Atmos. Chem. Phys., 25, 11051–11065, https://doi.org/10.5194/acp-25-11051-2025, 2025.
Zhang, X., Li, L., Chen, C., Zheng, Y., Dubovik, O., Derimian, Y., Lopatin, A., Gui, K., Wang, Y., Zhao, H., Liang, Y., Holben, B., Che, H., and Zhang, X.: Extensive characterization of aerosol optical properties and chemical component concentrations: Application of the GRASP/Component approach to long-term AERONET measurements, Sci. Total Environ., 812, 152553, https://doi.org/10.1016/j.scitotenv.2021.152553, 2022.
Zhang, X., Mao, M., Yin, Y., and Tang, S.: The absorption Ångstrom exponent of black carbon with brown coatings: effects of aerosol microphysics and parameterization, Atmos. Chem. Phys., 20, 9701–9711, https://doi.org/10.5194/acp-20-9701-2020, 2020.
Zhang, X., Li, L., Che, H., Dubovik, O., Derimian, Y., Holben, B., Gupta, P., Eck, T. F., Lind, E. S., Toledano, C., Xia, X., Zheng, Y., Gui, K., and Zhang, X.: Aerosol Components Derived from Global AERONET Measurements by GRASP: A New Value-Added Aerosol Component Global Dataset and Its Application, B. Am. Meteorol. Soc., 105, E1822–E1848, https://doi.org/10.1175/BAMS-D-23-0260.1, 2024.
Zhang, Z., Wang, Y., Chen, X., Xu, L., Zheng, Z., Ching, J., Zhu, S., Liu, D., and Li, W.: Absorption enhancement and shielding effect of brown organic coating on black carbon aerosols, npj Clim. Atmos. Sci., 8, 102, https://doi.org/10.1038/s41612-025-00989-y, 2025.
Zhao, S., Hu, B., Du, C., Tang, L., Ma, Y., Liu, H., Zou, J., Liu, Z., Wei, J., and Wang, Y.: Aerosol optical characteristics and radiative forcing in urban Beijing, Atmos. Environ., 212, 41–53, https://doi.org/10.1016/j.atmosenv.2019.05.034, 2019.