the Creative Commons Attribution 4.0 License.
the Creative Commons Attribution 4.0 License.
 | 04 May 2026
Dissimilar roles of aerosols, nitrogen deposition and ozone on the terrestrial carbon sink in China during 2010–2020
Nanhong Xie
Tijian Wang
Shu Li
Bingliang Zhuang
Mengmeng Li
Qian Zhang
Danyang Ma
Jing M. Chen
Zhaozhong Feng
Dimitrios Melas
Kostas Karatzas
China's Clean Air Action (CAA) plan implemented since 2013 has significantly altered atmospheric composition, and yet its impact on the terrestrial carbon sink remains unclear. This study employed the Regional Earth System Model (RegESM), an online-coupled climate–chemistry–ecosystem modeling framework, to quantify the impacts of aerosols, surface ozone (O3), and nitrogen deposition on China's net ecosystem productivity (NEP) from 2010 to 2020. The results show that aerosols enhanced China's NEP by 17.93 TgC yr−1 (4.49 % of the total NEP), primarily by increasing diffuse radiation, with the most pronounced effects in Southern and Eastern China. Nitrogen deposition further increased NEP by 37.98 TgC yr−1 (9.52 %), concentrated in Central and Southern regions. In contrast, O3 pollution reduced NEP by 51.33 TgC yr−1 (12.90 %), particularly in the forest-dominated Southeast. The positive impacts of aerosols and nitrogen deposition on the carbon sink weakened over time, whereas the negative influence of O3 was increasing. The combined effects indicate that CAA-induced atmospheric chemistry changes led to a shift in the dominant atmospheric drivers of China's terrestrial carbon sink, from enhancement by aerosols and nitrogen deposition to suppression by ozone. Our findings highlight the need for stronger O3 pollution control to achieve co-benefits between air-quality improvement and carbon neutrality.
- Article
(12187 KB) - Full-text XML
-
Supplement
(1823 KB) - BibTeX
- EndNote


Terrestrial ecosystems act as major carbon sinks, sequestering atmospheric carbon dioxide (CO2) through plant photosynthesis, and constitute a fundamental natural process for mitigating global climate change (Friedlingstein et al., 2023; Piao et al., 2013; Yuan et al., 2025). Under ongoing global warming, the dynamics of carbon sinks are regulated not only by climatic factors such as temperature and precipitation (Cao et al., 2023; Post et al., 2018; Ren et al., 2020), but also by variations in atmospheric composition (Zhou et al., 2021). Among these, aerosols, O3, and atmospheric nitrogen deposition have been identified as key atmospheric pollutants affecting terrestrial carbon sequestration (Liu et al., 2022; Zhou et al., 2024). As a crucial component of the global carbon cycle, terrestrial ecosystems in China sequester approximately 0.20–0.25 PgC yr−1, playing an essential role in supporting the achievement of the national carbon neutrality target (Piao et al., 2022; Xia et al., 2025; Yue et al., 2021). Therefore, assessing the responses of carbon sinks to multiple atmospheric composition changes is of great scientific significance for understanding both the global carbon cycle and climate feedback mechanisms.
Aerosols influence vegetation photosynthesis and carbon sequestration primarily through radiative forcing (Shu et al., 2022; Zhou et al., 2022). Aerosol scattering and absorption reduce surface solar radiation and can suppress vegetation photosynthesis (Doughty et al., 2010; Kuniyal and Guleria, 2019). In the meantime, enhanced diffuse radiation increases light use efficiency of plants, leading to the diffuse fertilization effect (Gu et al., 2003; Mercado et al., 2009). Aerosols also influence cloud microphysics by modifying droplet formation and lifetime, which further affects regional precipitation and water availability for vegetation (Li et al., 2020; Unger et al., 2017). Consequently, the net effect of aerosols on photosynthesis exhibits marked spatial heterogeneity, with both enhancement and suppression reported in highly polluted regions such as eastern China (Strada and Unger, 2016; Wang et al., 2018; Xie et al., 2020).
In addition, near-surface O3 impairs plant carbon uptake through direct physiological damage (Lei et al., 2022; Unger et al., 2020). O3 enters leaves through stomata and induces reactive oxygen species at the cellular level, leading to degradation of photosynthetic pigments, suppressed Rubisco activity, premature leaf senescence, and defoliation, all of which inhibit photosynthetic carbon assimilation (Wittig et al., 2007). Evidence from O3-FACE (free-air O3 concentration enrichment) experiments shows that a 10 ppb increase in O3 concentration can lower crop productivity by 5 %–15 % (Feng et al., 2015). In China, summertime O3 peaks often coincide with the peak growing season of vegetation, particularly in the North China Plain and the Yangtze River Delta, posing a notable threat to regional carbon sequestration (Lei et al., 2022; Li et al., 2024; Yue et al., 2017).
Furthermore, atmospheric nitrogen deposition is a major external nitrogen source for terrestrial ecosystems and exerts both positive and negative effects on carbon sinks (Chen et al., 2015; Lu et al., 2021). In nitrogen-limited systems, such as temperate forests and grasslands, moderate deposition can enhance photosynthesis and biomass accumulation, thereby increasing carbon sequestration (Cen et al., 2025; Lu et al., 2016; Peng et al., 2025). When inputs become excessive, however, they can induce soil acidification, biodiversity loss, and broader ecosystem degradation, a condition known as nitrogen saturation (Chen et al., 2015; Yue et al., 2016). China receives some of the highest nitrogen deposition levels globally, with annual averages of 15–20 kg N ha−1 yr−1 and hotspots surpassing 30 kg N ha−1 yr−1, raising increasing concerns about long-term ecological impacts (Liu et al., 2022, 2013; Yu et al., 2019).
China has long faced the dual pressures of severe air pollution and growing greenhouse gas emissions (Tu et al., 2019; Wang et al., 2024). Rapid economic expansion in the early 2010s was accompanied by persistent increases in fine particulate matter (PM2.5) concentrations (Hao et al., 2020). Since 2013, successive Clean Air Action Plans have led to a substantial decline in PM2.5 levels (Xue et al., 2019; Yue et al., 2020; Zheng et al., 2018). At the same time, near-surface summertime O3 has risen sharply (Liu et al., 2018; Zhou et al., 2024), while nitrogen deposition has slowed in growth but remains at a high level (Liu et al., 2024). These changes not only reflect the outcomes of emission control policies but also reshape the regional atmospheric chemical environment, potentially exerting complex and combined effects on carbon sinks (Liu et al., 2022; Zhou et al., 2024). The rapid transition in atmospheric composition during 2010–2020 provides an unprecedented large-scale natural experiment for disentangling the relative roles of aerosols, O3, and nitrogen deposition in altering China's carbon sink. However, most existing studies have examined these drivers in isolation, relied on offline or statistical frameworks that cannot capture dynamic climate–chemistry–ecosystem feedbacks, and rarely compared responses across ecological regions (Unger et al., 2020; Yue et al., 2017; Zhou et al., 2024).
Here, we employ an improved regional climate–chemistry–ecosystem online-coupling model, RegESM (Xie et al., 2024; Zhang et al., 2025), to quantify the impacts of aerosols, O3, and nitrogen deposition on China's terrestrial carbon sinks during 2010–2020. RegESM incorporates two-way interactions among climate, atmospheric chemistry, and biogeochemical processes and has been extensively evaluated over East Asia (Ma et al., 2023; Xie et al., 2024, 2020; Zhang et al., 2025). Our objective is to isolate the contributions of individual atmospheric components to changes in China's carbon sinks based on RegESM after its assessment using multiple observational datasets. These results offer new insight into the ecological consequences of rapid atmospheric composition changes and provide a scientific foundation for coordinated multi-pollutant control and ecosystem management under China's carbon-neutrality goals.
2.1 The RegESM model
In this study, we employed the RegESM, an improved extension of the RegCM-Chem-YIBs regional climate–chemistry–ecosystem modeling framework (Xie et al., 2024, 2019; Zhang et al., 2025). The original RegCM-Chem-YIBs couples the RegCM4 regional climate model (Giorgi et al., 2012), the radiative interactive gas-phase chemistry module Chem (Shalaby et al., 2012), and the YIBs terrestrial ecosystem model (Yue and Unger, 2015) to represent interactive processes among atmospheric dynamics, chemistry, and terrestrial carbon cycles (Xie et al., 2024). Building upon this foundation, RegESM strengthens two-way feedback among the atmosphere, atmospheric chemistry, and land surface processes, enabling a more realistic simulation of biogeochemical cycles (Zhang et al., 2025). The enhanced coupling allows land surface changes, such as vegetation dynamics and soil moisture variations, to more directly influence atmospheric composition, radiation, and meteorology, while atmospheric and chemical variations simultaneously affect ecosystem processes (Xie et al., 2024; Zhang et al., 2025). This bidirectional integration improves the model's capability to capture transient and spatially heterogeneous climate–ecosystem–chemistry interactions, which are crucial for regional climate change and carbon budget assessments (Zhang et al., 2025).
The RegESM framework used in this study integrates RegCM4 as the dynamical core for simulating regional climate processes at a high resolution, the Chem module for interactive gas-phase and aerosol chemistry coupled with radiation and meteorology, and the YIBs land surface model for calculating biophysical processes such as photosynthesis, transpiration, and energy balance, along with biogeochemical cycles of carbon and nitrogen (Giorgi et al., 2012; Shalaby et al., 2012; Xie et al., 2024; Yue and Unger, 2015). In RegESM, the influence of atmospheric nitrogen deposition on terrestrial carbon fluxes is represented through the online coupling between the chemistry and land components. Atmospheric nitrogen deposition is calculated online by the chemistry component as dry and wet deposition fluxes of reduced and oxidized nitrogen (NHx and NOy), which are then passed to the land component as external nitrogen inputs. These inputs affect soil inorganic nitrogen availability and subsequently influence plant productivity, ecosystem respiration, and net ecosystem productivity. Therefore, the effect of nitrogen deposition on carbon fluxes is represented as the integrated result of nitrogen input and land biogeochemical processes, rather than as a simple linear fertilization effect. These components are linked through an improved coupling mechanism that ensures the consistent exchange of meteorological, chemical, and biogeophysical variables at each model timestep, enabling fully interactive simulations in which land, atmosphere, and chemistry evolve in a physically coherent manner (Xie et al., 2024; Zhang et al., 2025). This model has been widely applied in East Asia (Xie et al., 2025, 2019; Zhang et al., 2025, 2024).
We used net ecosystem productivity (NEP) as an indicator for characterizing carbon sources and sinks (NEP > 0 suggests a carbon sink). NEP was calculated as the difference between gross primary production (GPP) and the sum of autotrophic respiration (Ra) and heterotrophic respiration (Rh) (Xie et al., 2025; Yue et al., 2021). It is noteworthy that the NEP estimated in this study does not account for lateral carbon transfers.
2.2 Ozone Damage Scheme
Once surface O3 enters plants through the stomata, it directly damages plant cellular structures and suppresses the photosynthetic rate, thereby reducing vegetation productivity. In the YIBs vegetation module of the RegESM model, a semi-mechanistic parameterization scheme is employed to represent the impacts of O3 on plants (Sitch et al., 2007; Yue and Unger, 2015):
where B denotes the photosynthetic rate under O3 exposure, Btot represents the total leaf photosynthetic rate, and K is the remaining proportion of photosynthetic capacity after O3 stress. This proportion is determined by the stomatal O3 flux that exceeds a specified threshold:
where b denotes the vegetation sensitivity parameter to O3 derived from observational data. Kozncrit represents the threshold of O3-induced damage to vegetation, and Kozn denotes the O3 flux entering the leaf through stomata:
where [O3] denotes the O3 concentration at the canopy top, rb is the boundary layer resistance, is the ratio of O3 leaf resistance to water vapor blade resistance, and rs is the stomatal resistance accounting for the effects of O3:
gs denotes the leaf conductance unaffected by O3 exposure. By simultaneously solving Eqs. (2), (3), and (4), a quadratic term with respect to K is obtained, which can be solved analytically.
2.3 Experimental design and input data
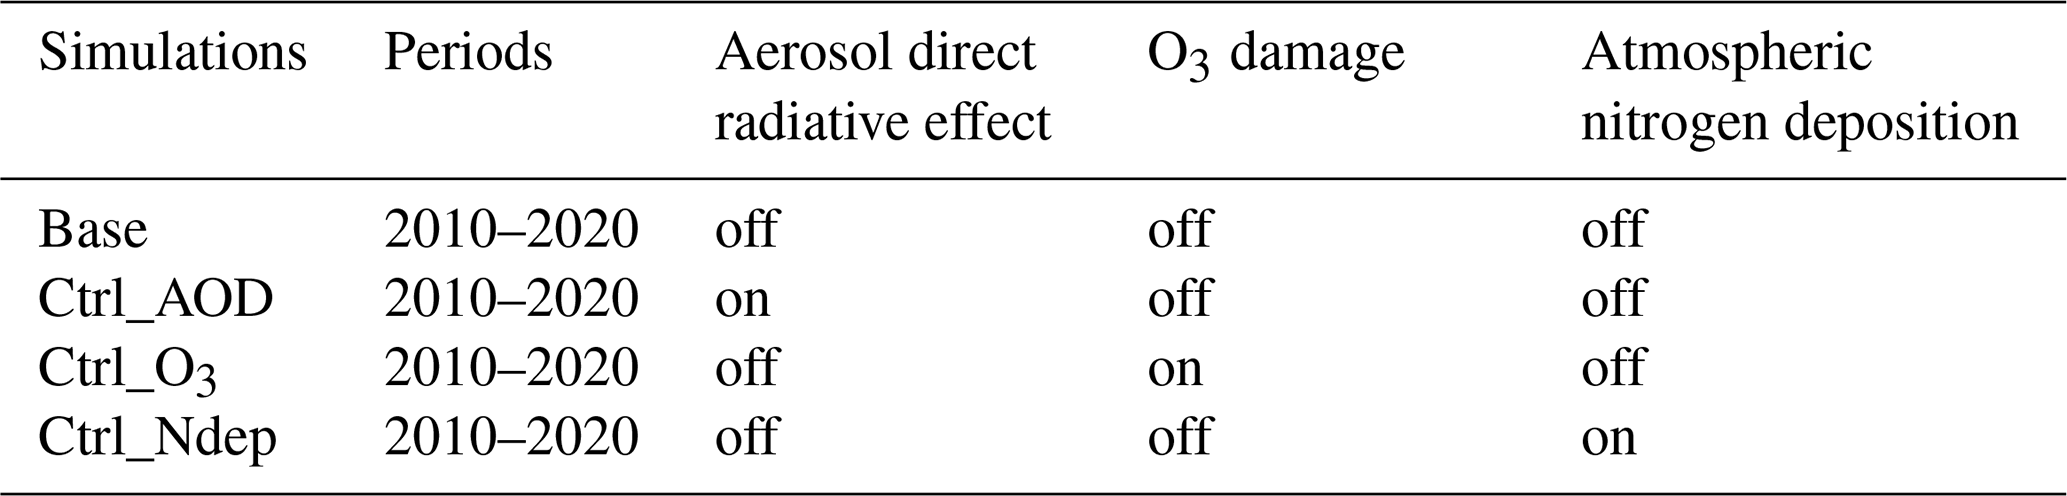
The simulation domain covers most of East Asia (Fig. S1 in the Supplement), centered at 36° N and 107° E. The horizontal resolution is 30 km, with 18 vertical layers. To quantify the independent contributions of aerosol, O3 damage, and atmospheric nitrogen deposition to China's terrestrial carbon sink during 2010–2020, four sensitivity experiments were conducted (Table 1): a baseline simulation without these effects (Base), and three single-factor cases that enabled only aerosol (Ctrl_AOD), O3-induced vegetation damage (Ctrl_O3), and nitrogen deposition impacts (Ctrl_Ndep). In the Ctrl_AOD experiment, aerosols were fully coupled to meteorology, so that the direct aerosol radiative effect and the associated meteorological responses were represented in the simulations, while aerosol indirect effects through cloud processes were not included. The difference between each sensitivity case and the Base run represents the corresponding individual effect. All simulations were preceded by a one-year spin-up to reduce the influence of initial conditions. To further assess regional responses, China was divided into six representative subregions (Fig. S2), and statistical analyses were performed for each.
The initial and boundary meteorological fields were taken from the ECMWF (European Centre for Medium-Range Weather Forecasts) ERA-Interim reanalysis with a temporal resolution of 6 h and a horizontal resolution of 1.5° × 1.5° (Dee et al., 2011a; Hersbach et al., 2020). Aerosol initial and boundary conditions were provided by the global chemical transport model (MOZART) (Emmons et al., 2010; Horowitz et al., 2003). Background CO2 fields were constrained by three-dimensional concentrations from NOAA CarbonTracker (CT) reanalysis (Peters et al., 2007). The initial parameters for the YIBs model were derived from soil carbon stocks based on equilibrium tree height and a 30-year harvest cycle (Yue and Unger, 2015). Vegetation cover was prescribed from MODIS and AVHRR (Advanced Very High Resolution Radiometer) datasets (Lawrence and Chase, 2007). Anthropogenic emissions in China were taken from the Multi-resolution Emission Inventory for China (MEIC) (Geng et al., 2024; Li et al., 2017; Zheng et al., 2018).
2.4 Validation data
We employed monthly mean aerosol optical depth (AOD) data from the MODIS sensor onboard NASA's Terra satellite (MOD08_M3.061). The data have a spatial resolution of 1° × 1° and are retrieved using three algorithms: the Dark Target, Deep Blue, and combined approaches (Levy et al., 2013). Ground-level O3 observations were obtained from 366 monitoring stations operated by the China National Environmental Monitoring Center (CNEMC). To evaluate the model's capability in simulating atmospheric nitrogen deposition, we employed publicly available datasets (Liu et al., 2024; Zhu et al., 2025). These datasets integrate observations with model outputs to provide nitrogen deposition estimates at both global and regional scales over China. To assess the reliability of simulated CO2, we used observations from the World Data Centre for Greenhouse Gases (WDCGG). This dataset provides measured surface atmospheric CO2 concentrations and was used to evaluate the model's ability to reproduce observed CO2 levels. For the spatial distribution of CO2, we additionally used CO2 concentration fields from CT (Peters et al., 2007). For GPP and net primary production (NPP) validation, we used the global MODIS products MOD17A2H and MOD17A3H (Collection 6). The GPP data, at 8 d resolution, were derived using the radiation use efficiency algorithm, while NPP (NPP = GPP − Ra) data were produced by annually accumulating GPP values, with a spatial resolution of 500 m (He et al., 2018; Madani et al., 2014).
2.5 Analytical Approach
Aerosol-induced meteorological changes are highly interdependent, making it challenging to isolate their individual effects on terrestrial carbon cycling. To quantify the relative contributions of these meteorological responses to vegetation carbon fluxes, we applied a multiple linear regression framework. Standardized regression coefficients were used to assess the relative influence of each climate variable. This approach has been widely demonstrated as effective for disentangling the impacts of multiple environmental drivers on ecosystem processes (Jung et al., 2017; Xie et al., 2025; Zhang et al., 2024).
The regression model is expressed as follows:
where ΔY denotes the difference in terrestrial carbon flux between the simulations Base and Ctrl_AOD, respectively. ,, , and denote the differences in direct radiation, diffuse radiation, temperature, precipitation, and vapor pressure deficit (VPD) between the simulations Base and Ctrl_AOD, respectively. Ai represents the partial regression coefficient for different meteorological factors, indicating the sensitivity of carbon flux to variations in these factors. ε is the residual term of the regression model. We use the following equation to calculate the standardized regression coefficient Bi for comparing the relative impacts of different meteorological factors:
where SD(ΔXi) and SD(ΔY) represent the standard deviations of the changes in each meteorological factor and carbon flux, respectively. Bi quantifies the relative contribution of different meteorological factors to variations in carbon flux. This approach enables a quantitative assessment of the individual impacts of changes in each meteorological factor induced by aerosol radiative effects on terrestrial carbon flux.
3.1 Model validations
3.1.1 Aerosols, surface ozone, and atmospheric nitrogen deposition
We assessed the RegESM performance by comparing the 2010–2020 simulations with multi-source observations. Simulated AOD showed good agreement with MODIS products in both spatial distribution and magnitude (Fig. 1a, b). High AOD values are located over the North China Plain and the Sichuan Basin, consistent with dense anthropogenic emissions in these regions (Luo et al., 2014). The observations indicate that the national mean AOD decreased from 0.36 in 2010 to 0.28 in 2020, driven by air quality improvement policies. We calculated statistical metrics, including the correlation coefficient (R), mean bias (MB), and root mean square error (RMSE), to evaluate the model performance (Fig. S3). The RegESM captures this trend with a correlation coefficient (R) of 0.71. However, compared with monthly MODIS AOD, the model shows a minor underestimation (MB = −0.02), which can be attributed primarily to uncertainties in the anthropogenic emission inventories (Xie et al., 2020). Surface O3 simulations reproduce both spatial patterns (Fig. 1c, d). The correlation with site observations reaches 0.72 (Fig. S4). High concentrations in the North China Plain, the Yangtze River Delta, and the Sichuan Basin are captured well, highlighting the model's skill in simulating O3 fields. The simulated annual mean atmospheric nitrogen deposition flux ranges from 20 to 40 kg N ha−1 yr−1 in eastern agricultural and urban areas, consistent with reported values of 25–35 kg N ha−1 yr−1 (Fig. 1e, f). The simulated national mean of 15.09 kg N ha−1 yr−1 is close to the dataset range of 13.45–15.39 kg N ha−1 yr−1. The model also reproduces the observed decline after the implementation of air pollution control policies in 2013, with a gradual decrease after 2015 (Fig. S5). These evaluations indicate that RegESM reliably simulates AOD, O3, and nitrogen deposition fields across China.
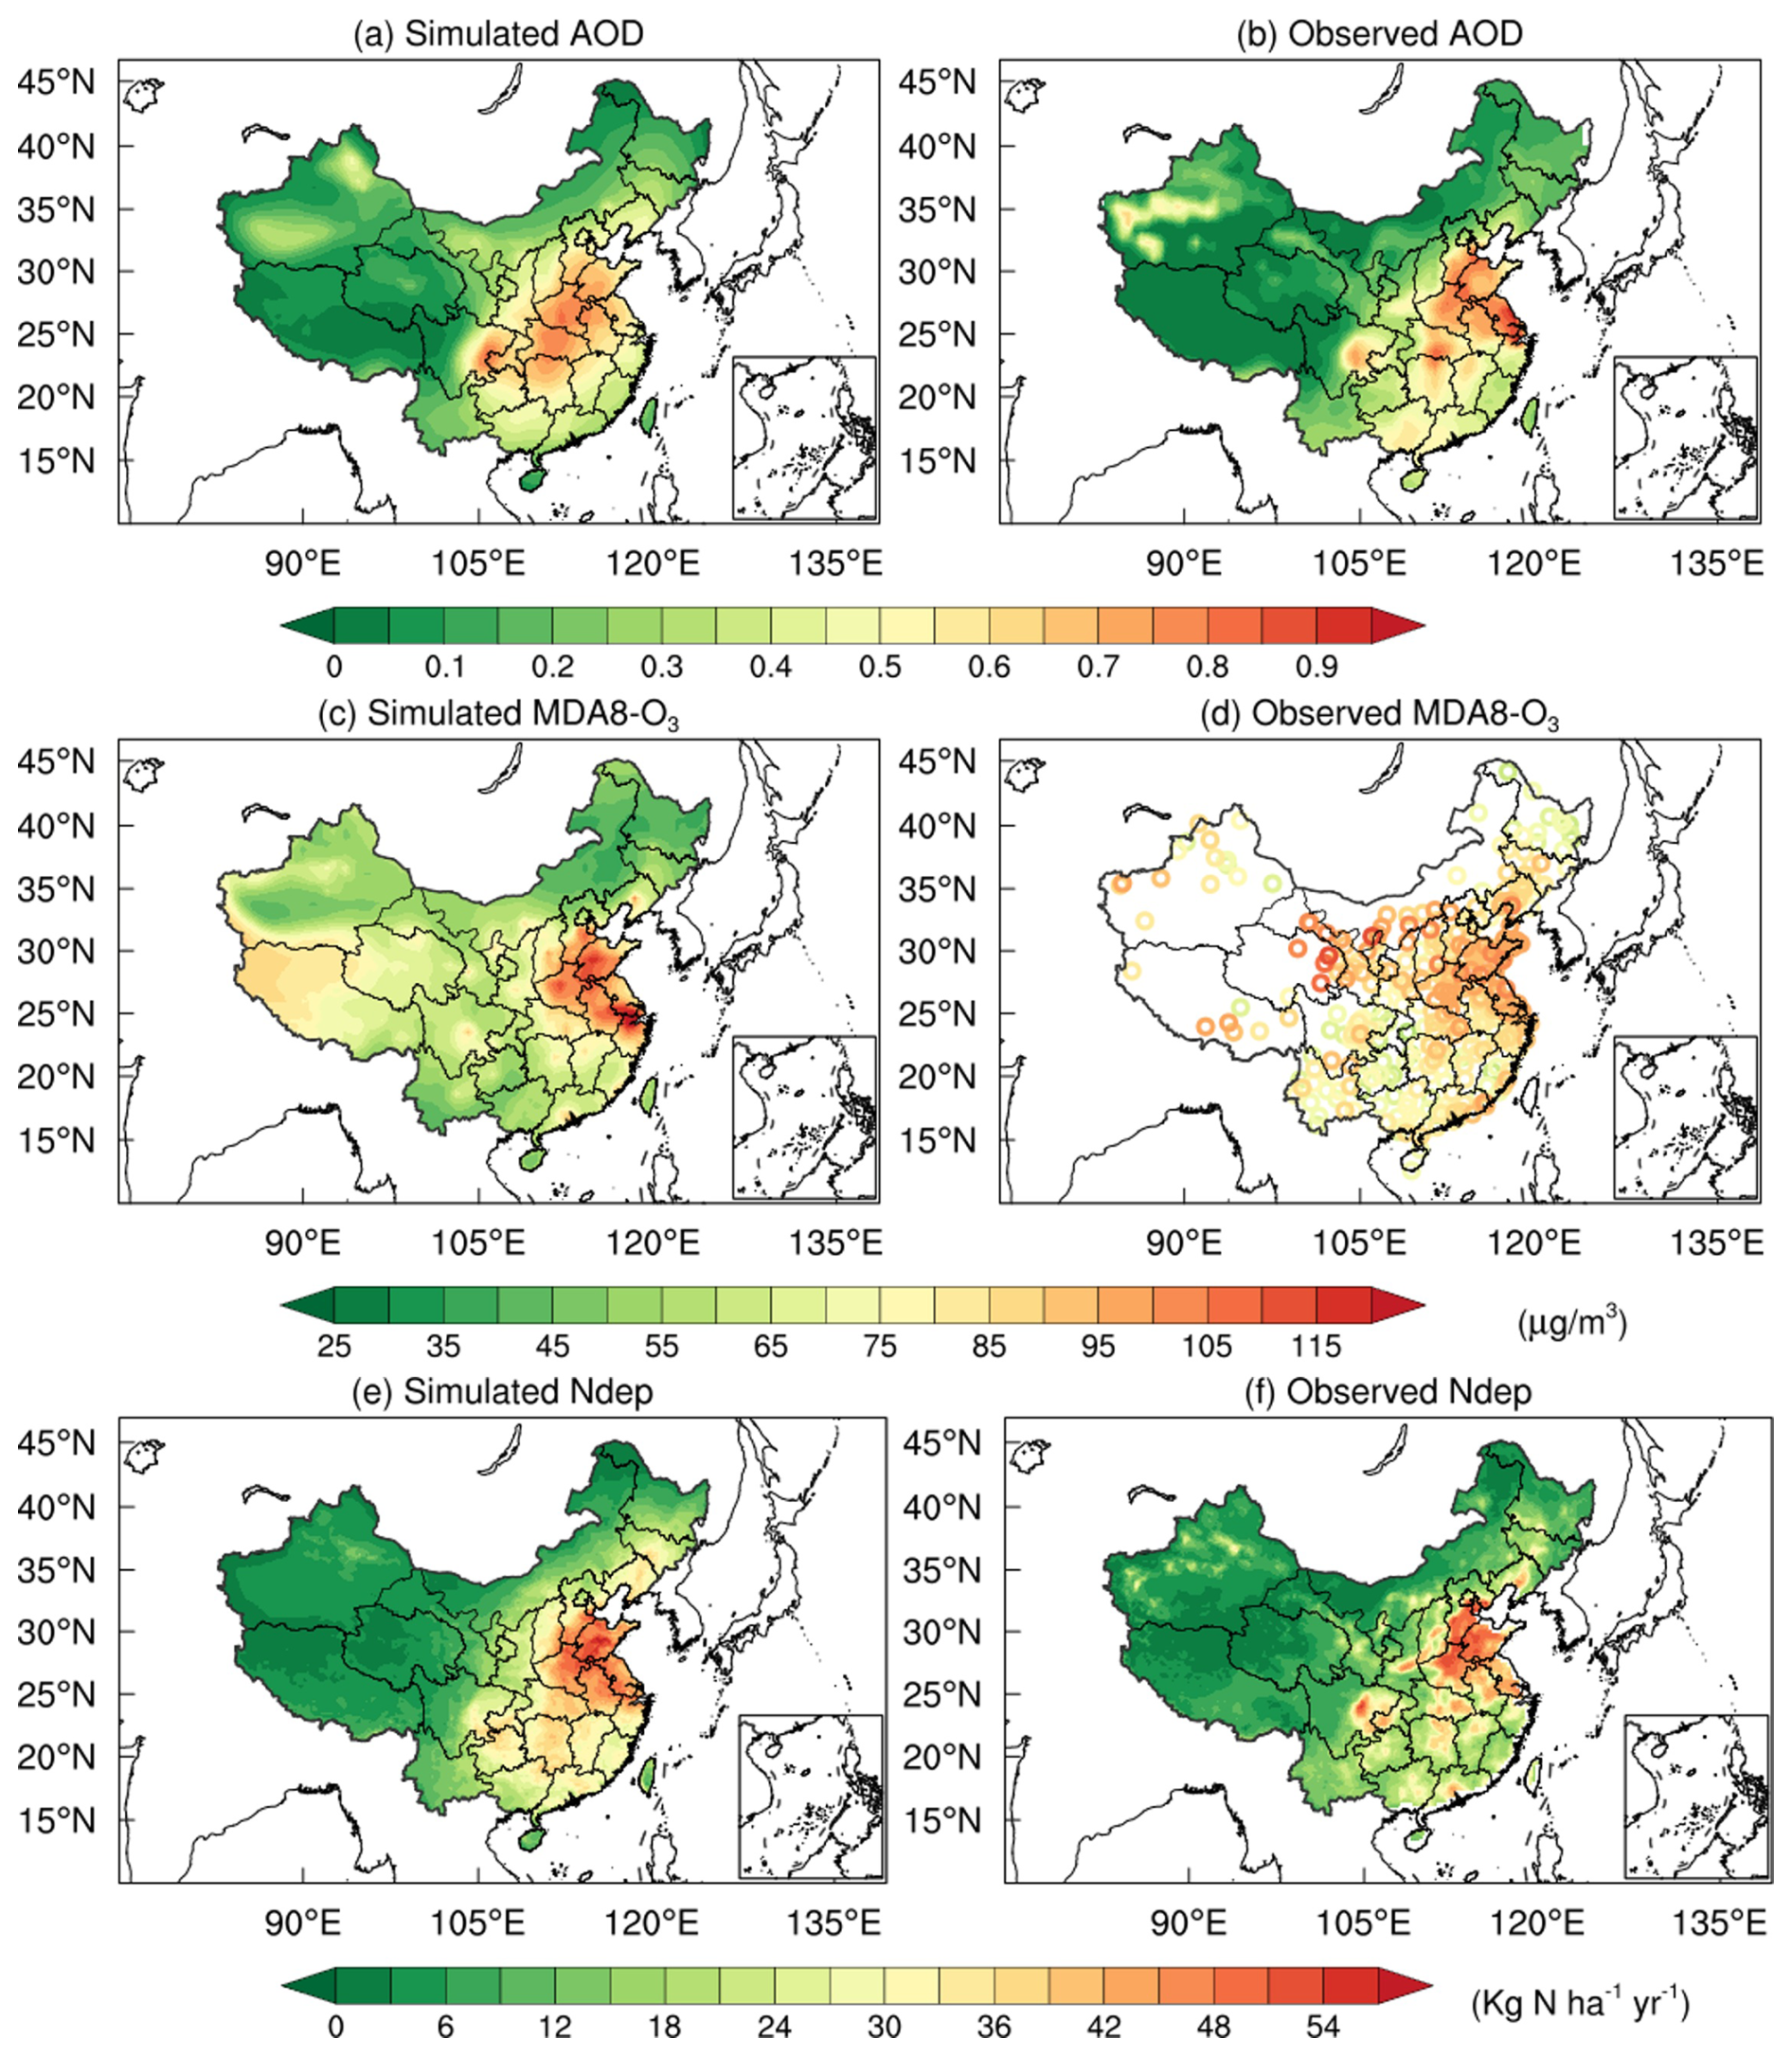
Figure 1Annual mean AOD (a, b), maximum daily 8 h average (MDA8) O3 (c, d), and Atmospheric nitrogen deposition (e, f) from model simulation (a, c, e) and observations (b, d, f).
3.1.2 Atmospheric CO2 concentrations, GPP, and NPP
Simulated CO2 concentrations were compared with six stations from the WDCGG. The correlation coefficients range from 0.83 to 0.96 (Table S1 in the Supplement). The YON site shows the best agreement (R=0.96, MB = −1.10 ppm), likely due to minimal influence from terrestrial emissions. In contrast, HKG and HKO show larger biases, with overestimates of 3.1 ppm (R=0.83) and 3.3 ppm (R=0.84), probably linked to unaccounted variability in urban sources in monthly inventories. Nevertheless, the seasonal cycle is reproduced well at all sites (Fig. S6).
We further compared simulated CO2 with the CarbonTracker CT2022 assimilation dataset (Peters et al., 2007). The spatial correlation coefficient reaches 0.72 (Fig. 2a, b). High CO2 concentrations appear over the Beijing–Tianjin–Hebei region, the Yangtze River Delta, the Pearl River Delta, and the Sichuan Basin, consistent with intense industrial emissions. The model slightly overestimates values in the Pearl River Delta, likely due to underrepresented local sources and complex topography. Overall, RegESM effectively captures the spatial distribution of CO2 concentrations.
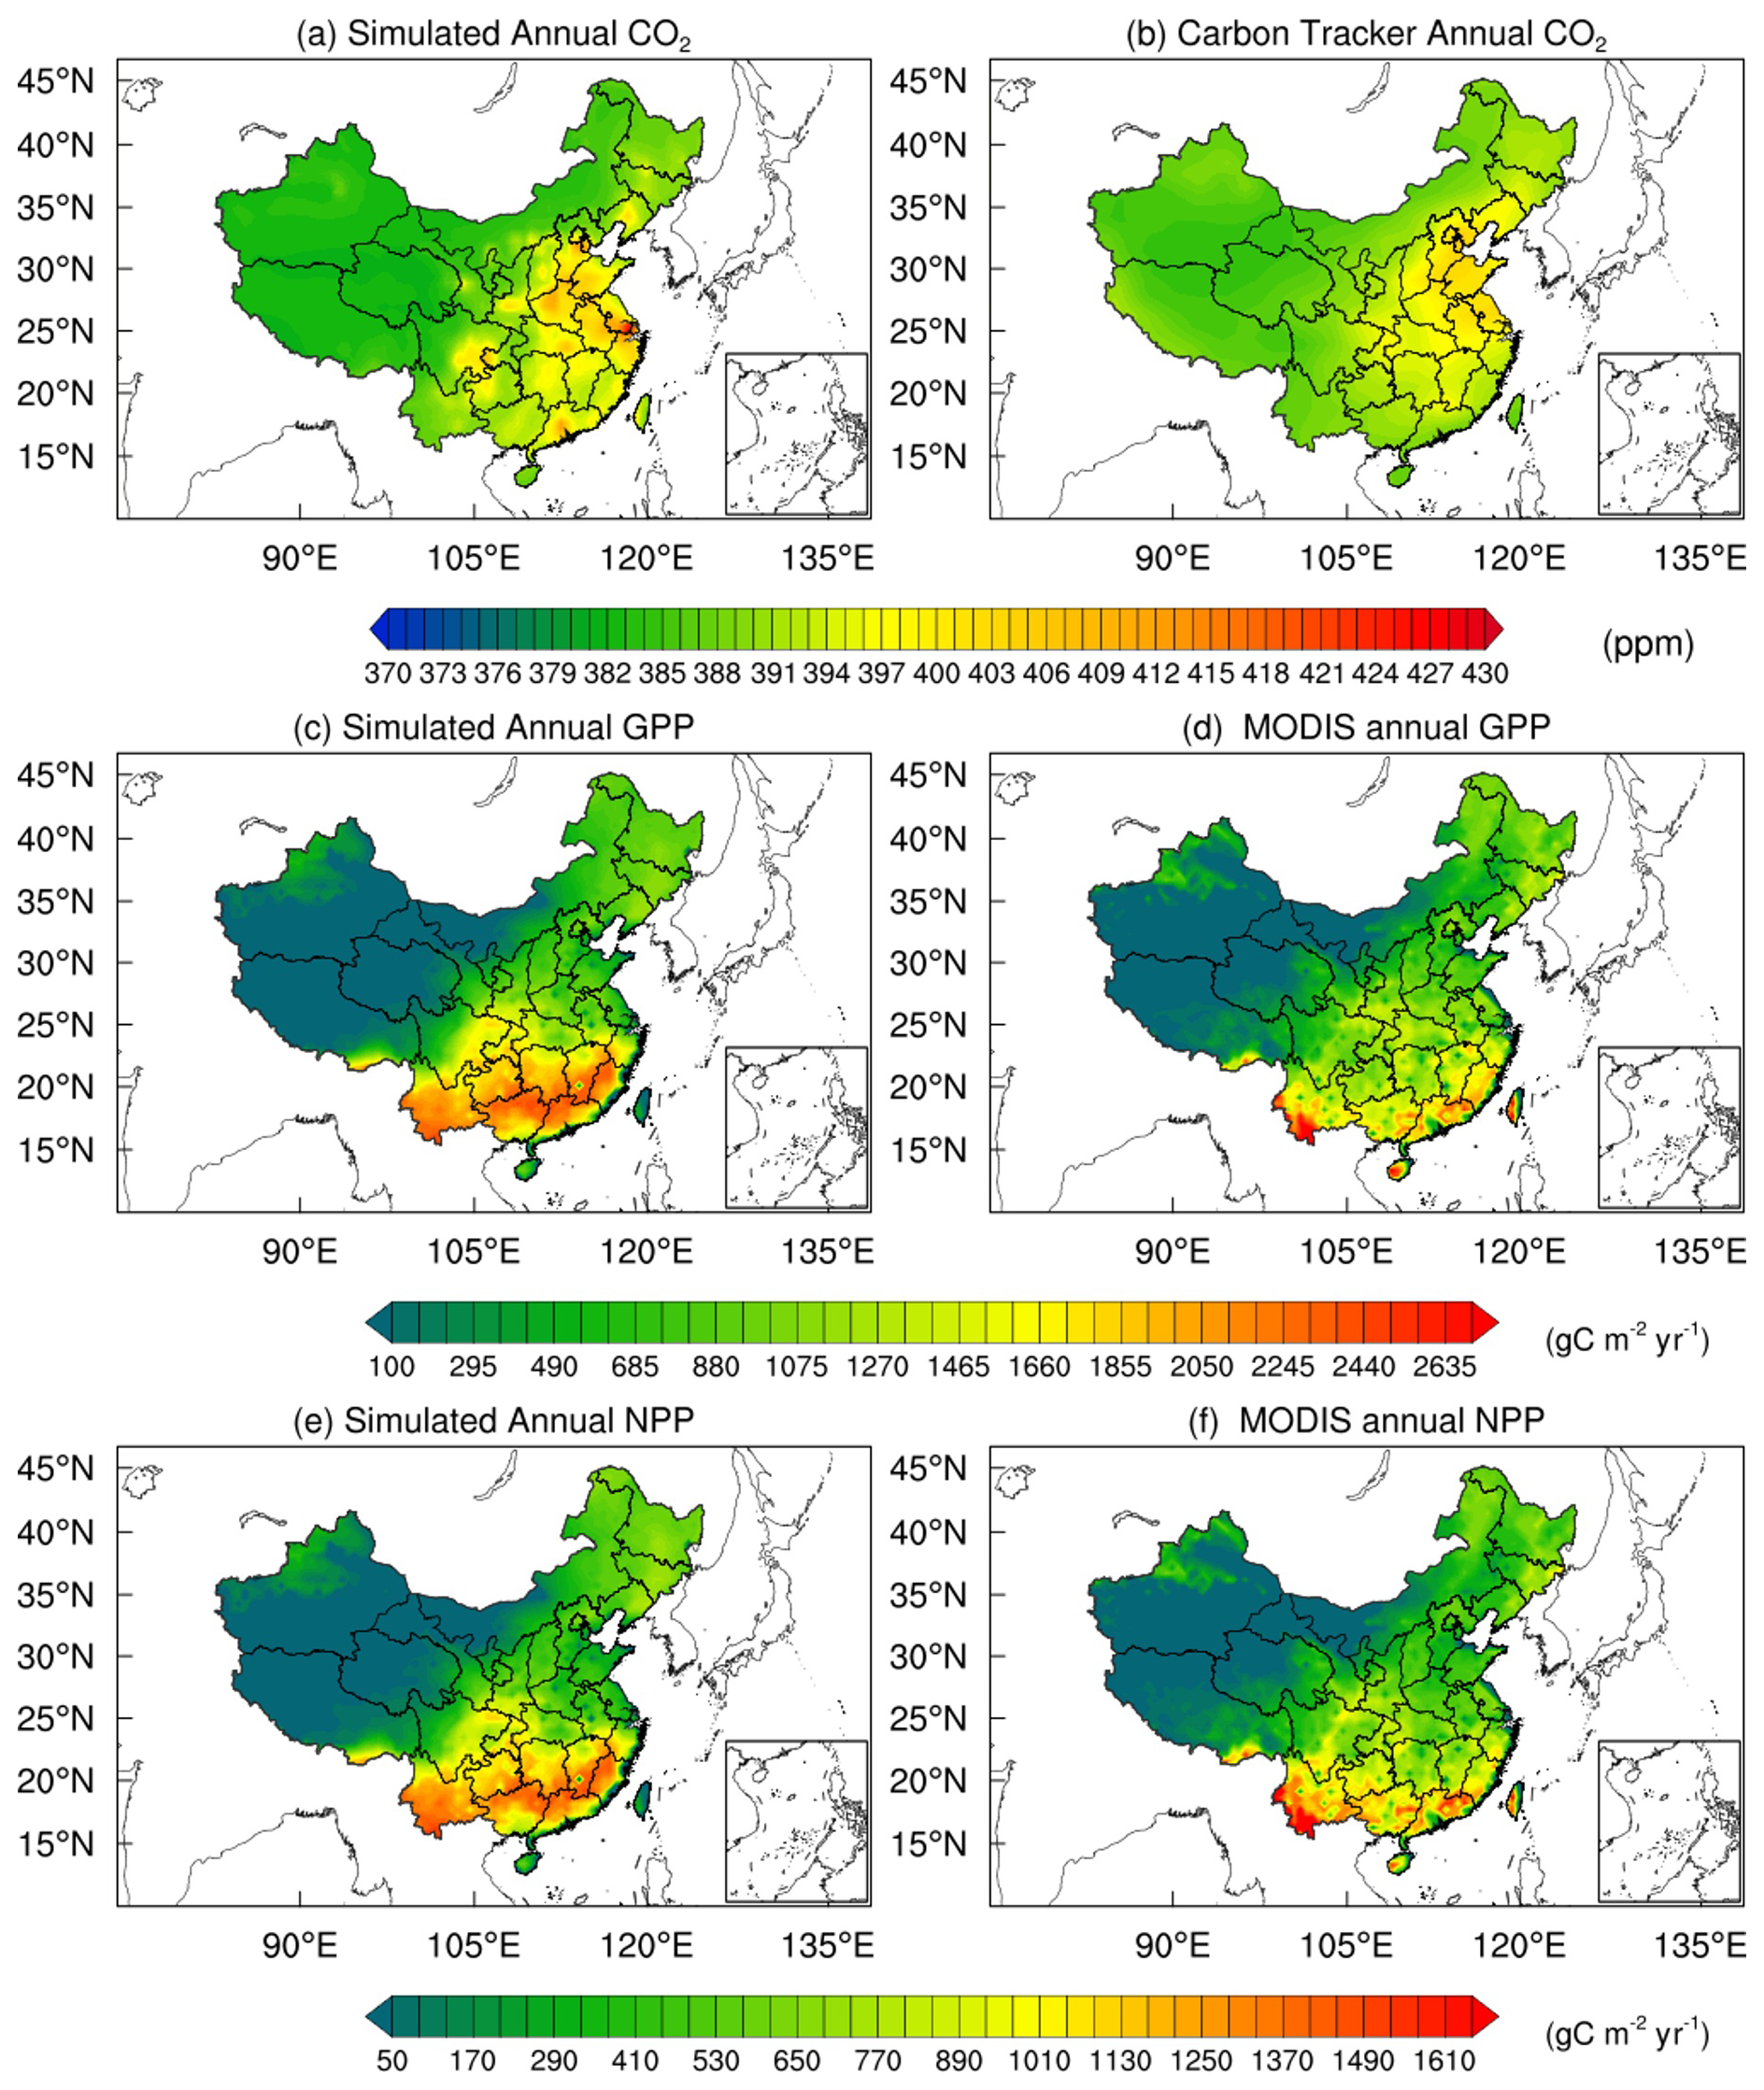
Figure 2Annual mean CO2 (a, b), GPP (c, d), and NPP (e, f) from model simulation (a, c, e) and observations (b, d, f).
Simulated GPP agrees well with MODIS in spatial distribution (Fig. 2c, d), with a spatial correlation of 0.89. However, GPP from this study is larger than MODIS GPP by 7.4 %, with largest differences in Central (11.6 %) and Southeast China (5.7 %). Other studies also found that MODIS GPP was underestimated at high values (Xie et al., 2019; Zhang et al., 2012). The southeast-to-northwest decreasing gradient is reproduced, with high values over regions dominated by forest ecosystems. The seasonal cycle of GPP is also captured (Fig. S7). The simulated NPP exhibits a spatial distribution consistent with the MODIS (Fig. 2e, f), with a spatial correlation coefficient of 0.86. Similar to GPP, the model overestimates NPP by 8.4 %, mainly due to the overestimation in Central (14.3 %) and Northeastern (6.2 %) China. These results confirm the model's ability to represent terrestrial carbon fluxes.
3.2 Impacts of Aerosols on Meteorology and Carbon Sinks
3.2.1 Impacts of Aerosols on Meteorological Factors
During 2010–2020, the aerosol exerted a substantial influence on China's surface radiation and near-surface climate (Fig. 3). Nationally, aerosol scattering reduced downward direct solar radiation by 8.81 W m−2 and increased its diffuse component by 3.04 W m−2, resulting in a net decrease of 5.77 W m−2 in total downward shortwave radiation at the surface. Spatially, these radiative changes were most pronounced over major urban agglomerations such as the North China Plain, the Yangtze River Delta, and the Sichuan Basin, coinciding with regions of high AOD associated with intensive anthropogenic emissions. These results are consistent with previous modeling and satellite-based analyses (Wang et al., 2017; Xie et al., 2020), confirming the robustness of the simulated radiative forcing patterns.
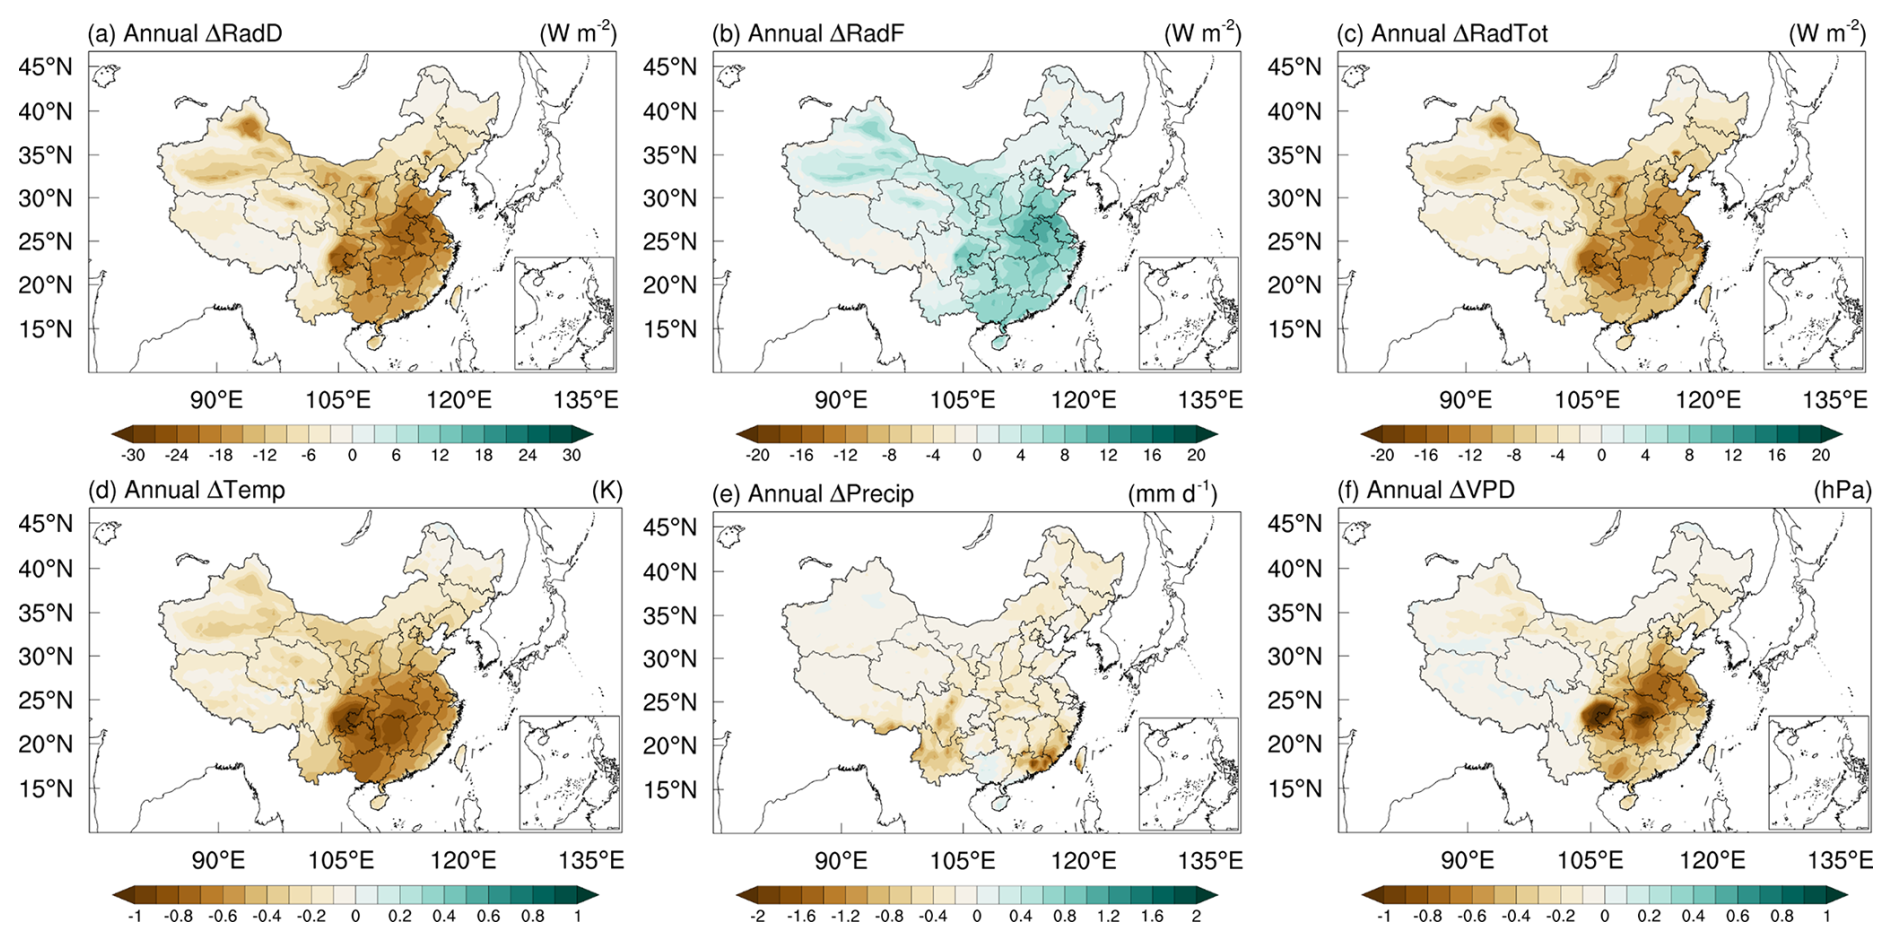
Figure 3Annual mean changes in meteorological variables due to aerosol direct radiative effect during 2010–2020. (a) RadD, direct radiation; (b) RadF, diffuse radiation; (c) RadTot, total radiation; (d) Temp, air temperature; (e) Precip, precipitation; (f) VPD, vapor pressure deficit.
The reduction in surface solar radiation directly perturbed the regional energy balance and atmospheric thermodynamics, resulting in a cooling effect over most of eastern and central China. As shown in Fig. 3d, surface air temperature decreased significantly in the Sichuan Basin and coastal regions, with local maxima reaching −1.10 °C. In contrast, western and northeastern China experienced weaker changes, consistent with lower AOD levels. The simulated national mean temperature decline of 0.32 °C agrees well with previous RegCM-based studies (Wang et al., 2015; Xie et al., 2020). This widespread cooling is primarily attributed to aerosol-induced dimming, which suppresses surface shortwave absorption and weakens boundary-layer turbulence, thereby inhibiting vertical heat exchange and reducing near-surface temperatures.
Aerosol also exerted a marked influence on regional hydrological processes. Precipitation decreased across much of southern and southwestern China, with notable reductions in Guangdong, Fujian, Yunnan, and Sichuan provinces, where daily rainfall decreased by up to 2 mm d−1 (Fig. 3e). On average, national precipitation declined by 0.23 mm d−1. The reduction in rainfall reflects the combined effects of radiative cooling and weakened convective activity. Specifically, aerosol-induced surface dimming stabilizes the lower atmosphere and suppresses the upward transport of moisture, while reduced latent heating further limits convective cloud formation. These mechanisms together explain the widespread drying observed in the simulations.
The VPD, a key indicator of plant water stress, also responded sensitively to aerosol forcing. As shown in Fig. 3f, aerosols significantly reduced VPD over central and southeastern China, with decreases of −0.30 to −0.60 hPa, and locally up to −1.20 hPa in Sichuan, Hebei, and Jiangsu. The national mean reduction was −0.11 hPa. Lower VPD values imply a moister near-surface environment and weaker atmospheric demand for evapotranspiration. Ecologically, this alleviation of plant water stress can enhance stomatal conductance and facilitate photosynthetic carbon uptake, thereby partially compensating for the productivity loss caused by reduced solar radiation. Thus, the aerosol-induced decline in VPD represents an important indirect pathway through which aerosols modulate the terrestrial carbon cycle, linking atmospheric radiative forcing to ecosystem function.
3.2.2 Effects of Aerosols on the Terrestrial Carbon Sink
During 2010–2020, the aerosol overall enhanced the productivity of China's terrestrial ecosystems, increasing GPP and NEP by 293.28 and 17.93 TgC yr−1, accounting for 3.98 % and 4.49 % of the national totals, respectively. Aerosols also increased Rh by 182.44 TgC yr−1 over China, indicating that part of the aerosol-induced carbon sink enhancement was offset by enhanced soil carbon decomposition. Spatially, the responses of GPP and NEP to the aerosol radiative effect displayed significant heterogeneity, with the most pronounced enhancements occurring in South Central and East (Fig. 4a, b), where GPP increased by 0.32 and 0.31 gC m−2 d−1, respectively. These regions are characterized by dense forests and cropland ecosystems with high leaf area index, enabling them to fully exploit the additional diffuse radiation induced by aerosols. Meanwhile, the high aerosol loading in these regions ensured sufficient radiative perturbation, amplifying the improvement in canopy light-use efficiency. The spatial pattern of aerosol-induced Rh (Fig. S10a) further shows notable increases in southern China, broadly consistent with the regions of enhanced ecosystem productivity, suggesting that greater carbon input to soils likely stimulated microbial decomposition and partially counteracted the NEP gain. In the Southwest, the response was more complex. Although the mean GPP increased by 0.20 gC m−2 d−1, parts of Yunnan showed a negative effect. This reduction likely results from excessive attenuation of solar radiation under the region's unique topographic and climatic conditions, which constrained photosynthetic activity. Nevertheless, NEP in this region remained positive (approximately 0.01 gC m−2 d−1), suggesting that the cooling effect of aerosols substantially suppressed ecosystem respiration, thereby compensating for the reduced photosynthesis. In contrast, the North and Northwest exhibited weak positive responses (<0.07 gC m−2 d−1), while the Northeast showed slight inhibition (−0.04 gC m−2 d−1), probably due to aerosol-induced cooling delaying the onset of the growing season. Overall, the spatial patterns of GPP and NEP responses to the aerosol radiative effect show a clear latitudinal gradient: the humid, high-biomass ecosystems in southern and eastern China are most sensitive to diffuse radiation enhancement, whereas the high-latitude and arid regions experience limited or even negative responses due to temperature and radiation constraints.
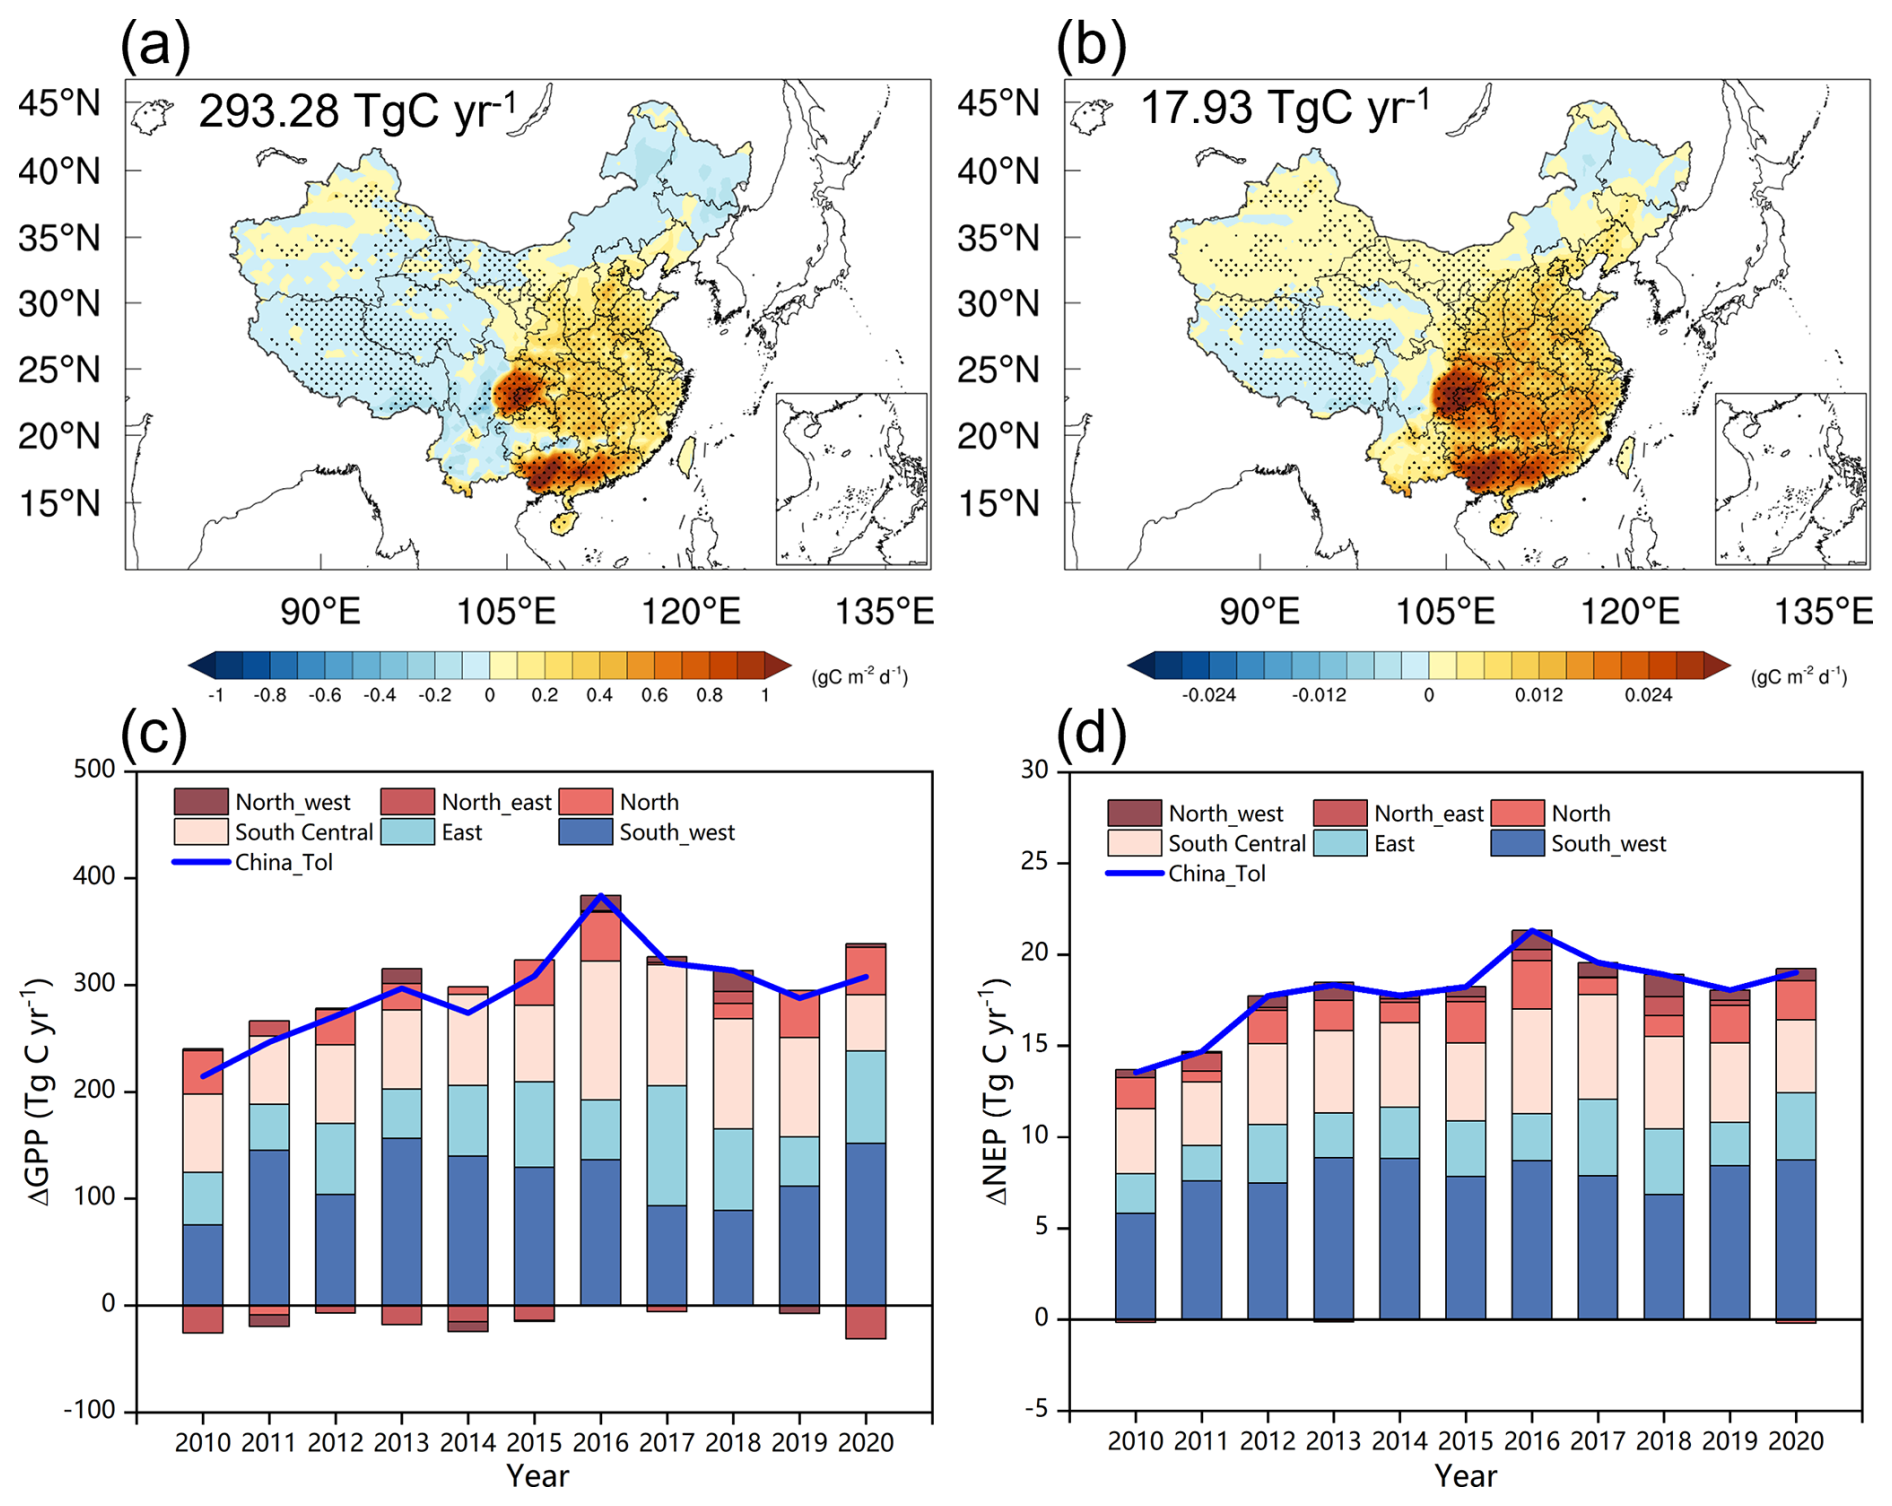
Figure 4Spatiotemporal variations in carbon flux changes caused by the aerosol radiative effect during 2010–2020. (a–b) Multi-year mean spatial patterns of GPP and NEP changes caused by the aerosol radiative effect. National totals are shown in each panel. Black dots denote significant changes (p<0.01). (c–d) Interannual variations of GPP and NEP changes caused by the aerosol radiative effect.
From 2010 to 2020, the influence of aerosols on carbon fluxes exhibited distinct interannual variability (Fig. 4c, d). Both GPP and NEP showed an upward trend before 2016, with GPP increasing from 214.66 TgC yr−1 in 2010 to 384.00 TgC yr−1 in 2016, and NEP rising from 13.54 to 21.31 TgC yr−1. The synchronous growth of GPP and NEP indicates that the aerosol radiative effect enhanced terrestrial carbon uptake mainly through photosynthetic activity. The strong enhancement during 2015–2017 coincided with years of high aerosol loading and a greater proportion of diffuse radiation, which improved canopy light-use efficiency under humid and cloudy conditions. After 2018, the positive effect weakened slightly and stabilized at a lower level. This reduction likely reflects the combined influence of cleaner atmospheric conditions and changing meteorological patterns, including increased direct radiation and a reduced diffuse fraction. Year-to-year variations were further modulated by hydroclimatic conditions: higher humidity and cloud cover enhanced aerosol scattering efficiency, while drier or cleaner years favored direct radiation and weakened the diffuse light advantage. Moreover, the smaller NEP fluctuations compared to GPP imply a delayed response of ecosystem respiration, as aerosol-induced cooling moderates' respiration more gradually than photosynthesis. Overall, the interannual variability of GPP and NEP responses to the aerosol radiative effect highlights the coupled influences of aerosol loading, radiation balance, and regional climate variability on China's terrestrial carbon sink dynamics.
The effects of aerosols on GPP and NEP show pronounced seasonal variation (Fig. S8), driven by the dynamic coupling between vegetation phenology and environmental factors. In spring (March–May), aerosols increase GPP by 42.35 TgC (14.4 %) and NEP by 2.82 TgC (15.7 %), making a notable contribution at the start of the growing season as rising temperatures and rapid canopy expansion enhance diffuse radiation benefits, improving light-use efficiency; meanwhile, moderate cooling suppresses respiration without causing thermal stress, further boosting NEP. In summer (June–August), positive effects peak, with GPP rising by 173.62 TgC (59.2 %) and NEP by 10.15 TgC (56.6 %); under high solar radiation and full canopy closure, diffuse light penetration reaches its maximum, while cooling alleviates heat stress and reduces respiration, driving NEP to its annual maximum. In autumn (September–November), aerosols add 88.38 TgC to GPP (30.1 %) and 3.95 TgC to NEP (22.0 %), effectively extending the photosynthetic period as shorter days and reduced total radiation increase the proportion of diffuse light, sustaining carbon storage. In winter (December–February), GPP declines slightly (−11.07 TgC, −3.8 %), but NEP shows a small positive gain (1.01 TgC, 5.6 %) because cooling strongly suppresses respiration, offsetting reduced photosynthesis. Overall, aerosol radiative effects regulate seasonal carbon cycling by modifying radiation and thermal conditions. The net impact depends on the trade-off between the fertilization effect of diffuse radiation and the opposing effects of reduced total radiation and cooling. Summer emerges as the primary driver of the annual net positive effect. Accurately quantifying this seasonal dynamic is crucial for assessing the ecological and climatic consequences of anthropogenic aerosols.
3.2.3 Contributions of Meteorological Factors to Carbon Sink Changes
We quantified the independent contributions of aerosol-induced meteorological changes to carbon fluxes using the multiple linear regression analysis described in Sect. 2.5 (Fig. 5a, b). Overall, aerosol substantially influenced China's terrestrial carbon uptake by altering radiation composition and meteorological conditions. At the national scale, the increase in diffuse radiation emerged as the dominant positive driver, contributing to GPP (325.07 TgC yr−1) and NEP (11.46 TgC yr−1). This highlights the crucial role of the diffuse radiation fertilization effect, particularly in regions with high aerosol loading across eastern and southwestern China, where enhanced diffuse light improves canopy light distribution and photosynthetic efficiency. In contrast, the reduction in direct radiation suppressed GPP (94.78 TgC yr−1) and NEP (2.59 TgC yr−1) due to insufficient illumination, though the impact on NEP was weaker, reflecting partial offset by the reduction in ecosystem respiration under aerosol-induced cooling. Cooling alone reduced GPP by 59.62 TgC yr−1 and NEP by 4.73 TgC yr−1. This decline in NEP occurred because the decrease in GPP (driven by reduced transpiration and stomatal conductance) outweighed the concurrent reduction in ecosystem respiration. Meanwhile, lower VPD enhanced GPP by 114.44 TgC yr−1 and NEP by 8.25 TgC yr−1 by alleviating water stress, reinforcing photosynthetic carbon uptake. Changes in precipitation played only a minor role, slightly reducing GPP (8.17 TgC yr−1) and NEP (0.62 TgC yr−1), with limited influence even in the monsoon regions of southern China. These findings indicate that variations in radiation components, rather than hydrometeorological perturbations, serve as the primary pathway through which aerosols modulate terrestrial carbon sinks.
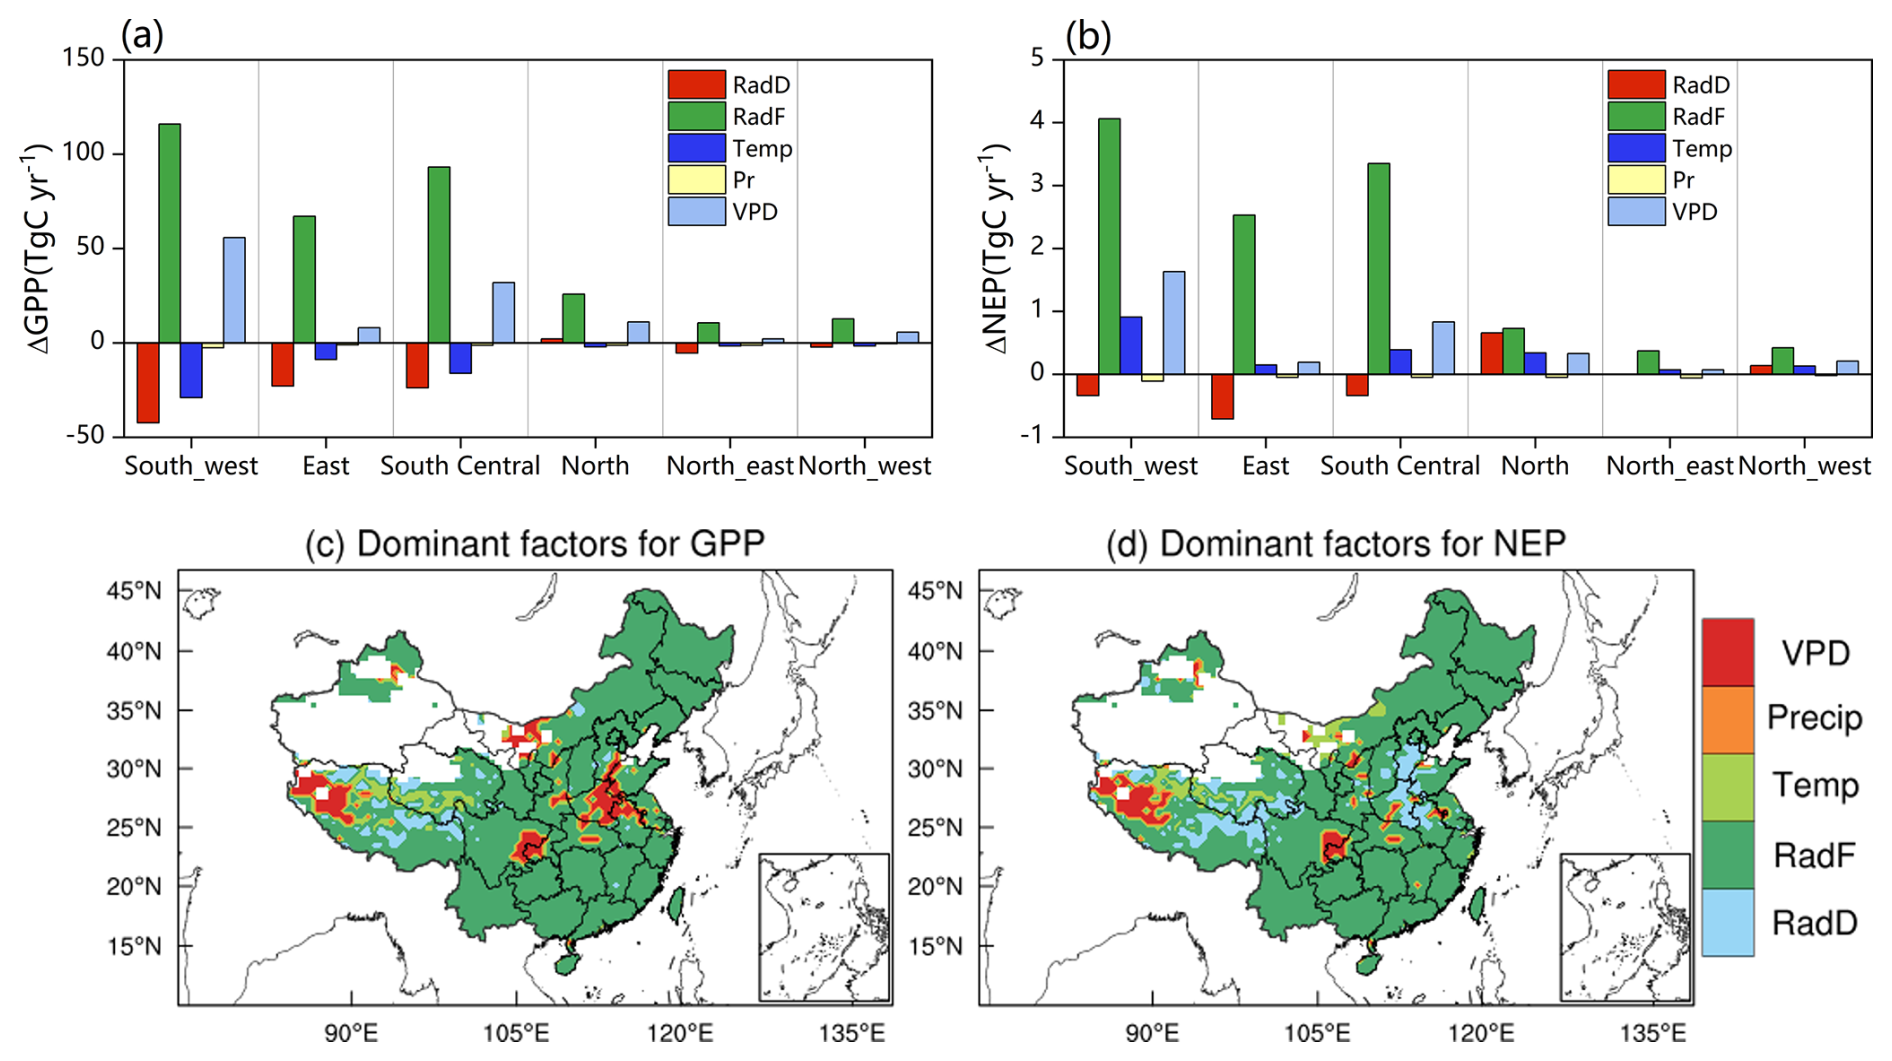
Figure 5Effect of aerosol-induced changes in meteorological factors on GPP and NEP, and spatial patterns of dominant factors. (a) Regional contributions of individual meteorological factors to GPP; (b) Regional contributions of individual meteorological factors to NEP; (c) Spatial distribution of the dominant meteorological factor for GPP; (d) Spatial distribution of the dominant meteorological factor for NEP.
Regionally, among these factors, diffuse radiation exerted the strongest positive influence on GPP across all regions, particularly in the Southwest (115.92 TgC yr−1), East (67.04 TgC yr−1), and South Central (93.08 TgC yr−1) China (Fig. 5a, b). Enhanced diffuse light under elevated aerosol loading improved the vertical distribution of photosynthetically active radiation within the canopy and increased photosynthetic efficiency. In contrast, direct radiation consistently exhibited negative effects, most evident in the southwest (42.32 TgC yr−1) and east (22.92 TgC yr−1), indicating that aerosol-induced solar dimming partly offset the diffuse radiation fertilization benefit. Temperature changes associated with aerosol cooling suppressed GPP nationwide, especially in the Southwest (29.07 TgC yr−1) and South Central (16.19 TgC yr−1), by lowering canopy temperature and reducing evapotranspiration. The contributions of precipitation were minor (1 to 3 TgC yr−1), while VPD exerted a positive effect, particularly in humid Southwest (55.76 TgC yr−1), suggesting that aerosol-induced cooling and moistening alleviated water stress and indirectly promoted carbon uptake. For NEP, diffuse radiation remained the dominant positive driver, with the largest increases in the Southwest (4.06 TgC yr−1) and south-central (3.35 TgC yr−1) China, while direct radiation continued to exert negative effects. The temperature effect was moderate but consistent with GPP, implying that aerosol cooling simultaneously suppressed photosynthesis and respiration, with a net positive outcome for NEP. Taken together, these spatial contrasts highlight the combined effects of aerosol composition, vegetation structure, and regional hydroclimate, emphasizing that radiative forcing dominates in humid, high-biomass ecosystems, whereas climatic constraints prevail in arid zones.
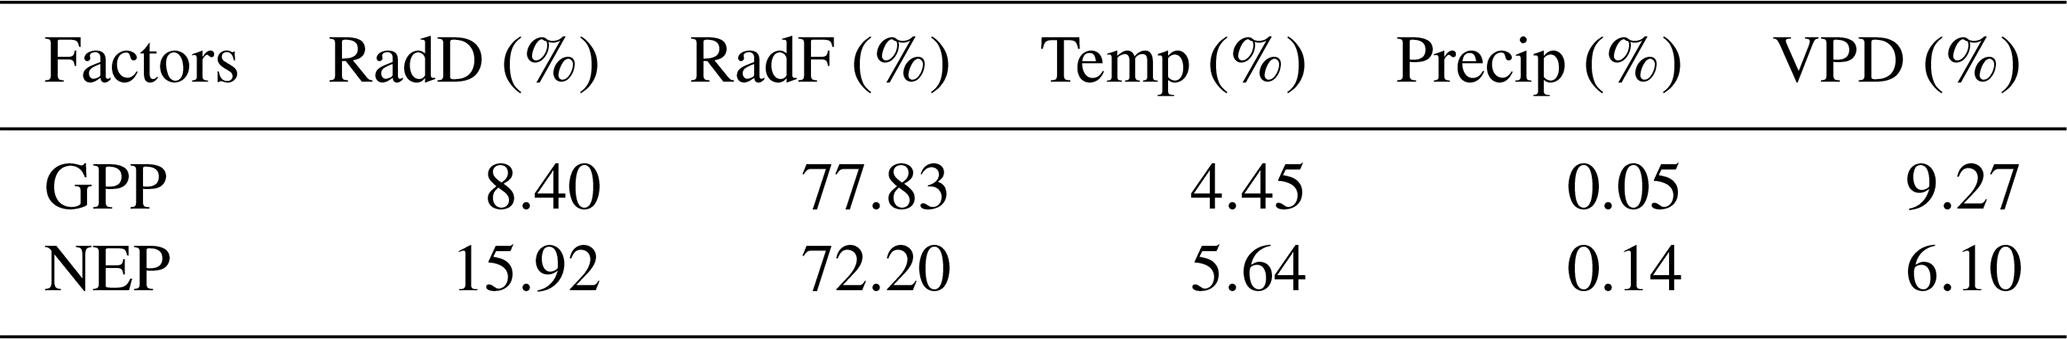
To further clarify the dominant controls of these spatial differences, we identified the primary meteorological drivers of GPP and NEP based on the standardized regression coefficients (Fig. 5c, d, and Table 2). The results indicate that for GPP, diffuse radiation accounts for the largest proportion (77.83 %), followed by vapor pressure deficit (9.27 %) and direct radiation (8.4 %), while the influence of temperature (4.45 %) and precipitation (0.05 %) is relatively small. For NEP, diffuse radiation remains the dominant driver (72.20 %), followed by direct radiation (15.92 %) and temperature (5.64 %). These results highlight that aerosols modify the radiation composition, particularly by enhancing diffuse radiation, which substantially increases photosynthetic efficiency and strengthens the regional carbon sink. In contrast, the effects of temperature and VPD are weaker overall but more pronounced in northern arid and semi-arid regions, where water limitation constrains carbon uptake. Collectively, these findings confirm that radiation composition primarily controls the spatiotemporal dynamics of China's terrestrial carbon sink, while temperature and moisture factors exert region-dependent modulations.
Table 2Proportion of dominant meteorological factors for GPP and NEP across China (Units: %).
3.3 Effects of surface ozone on carbon sinks
During 2010–2020, surface O3 in China increased and imposed a persistent suppression on terrestrial carbon sinks. Simulations show a strong reduction of GPP by 0.4–0.6 gC m−2 d−1 in most regions, with more than 0.8 gC m−2 d−1 in Southeast and Southwest China (Fig. 6a). NEP shows a similar spatial pattern (Fig. 6b). The largest decline occurs in the southeast (Yangtze River basin and South China coast), with NEP reduced by 0.06–0.08 gC m−2 d−1 and locally above 0.1 gC m−2 d−1, consistent with high O3 and evergreen broadleaf forests (Yue et al., 2017). In the southwest (Sichuan Basin and Yunnan–Guizhou Plateau), NEP decreases by 0.03–0.06 gC m−2 d−1, related to complex terrain and dense forests. Impacts are weaker in Northeast and Northwest China, mostly below 0.02 gC m−2 d−1. In Shandong, Henan, and northern Jiangsu, the simulated losses are small, reflecting cropland-dominated land cover. However, earlier studies reported strong O3 effects on crops (Ren et al., 2012), suggesting possible underestimation. This bias may stem from the simplified crop representation in the model (Fig. S2). Nationwide, O3 reduces GPP and NEP by 749.44 and 51.33 TgC yr−1, accounting for 10.17 % and 12.90 % of the totals. O3 also decreased Rh by 288.17 TgC yr−1, with the strongest reductions occurring in eastern and southern China (Fig. S10b). This indicates that the O3-induced suppression of ecosystem carbon uptake was partly offset by a concurrent decline in heterotrophic respiration. This pattern suggests that reduced photosynthesis and carbon allocation under O3 stress decreased litter input and belowground carbon supply, thereby limiting microbial substrate availability and weakening soil carbon decomposition. The suppression is attributed to reduced photosynthesis, altered stomatal conductance, and shifts in carbon allocation, which together weaken ecosystem sinks.
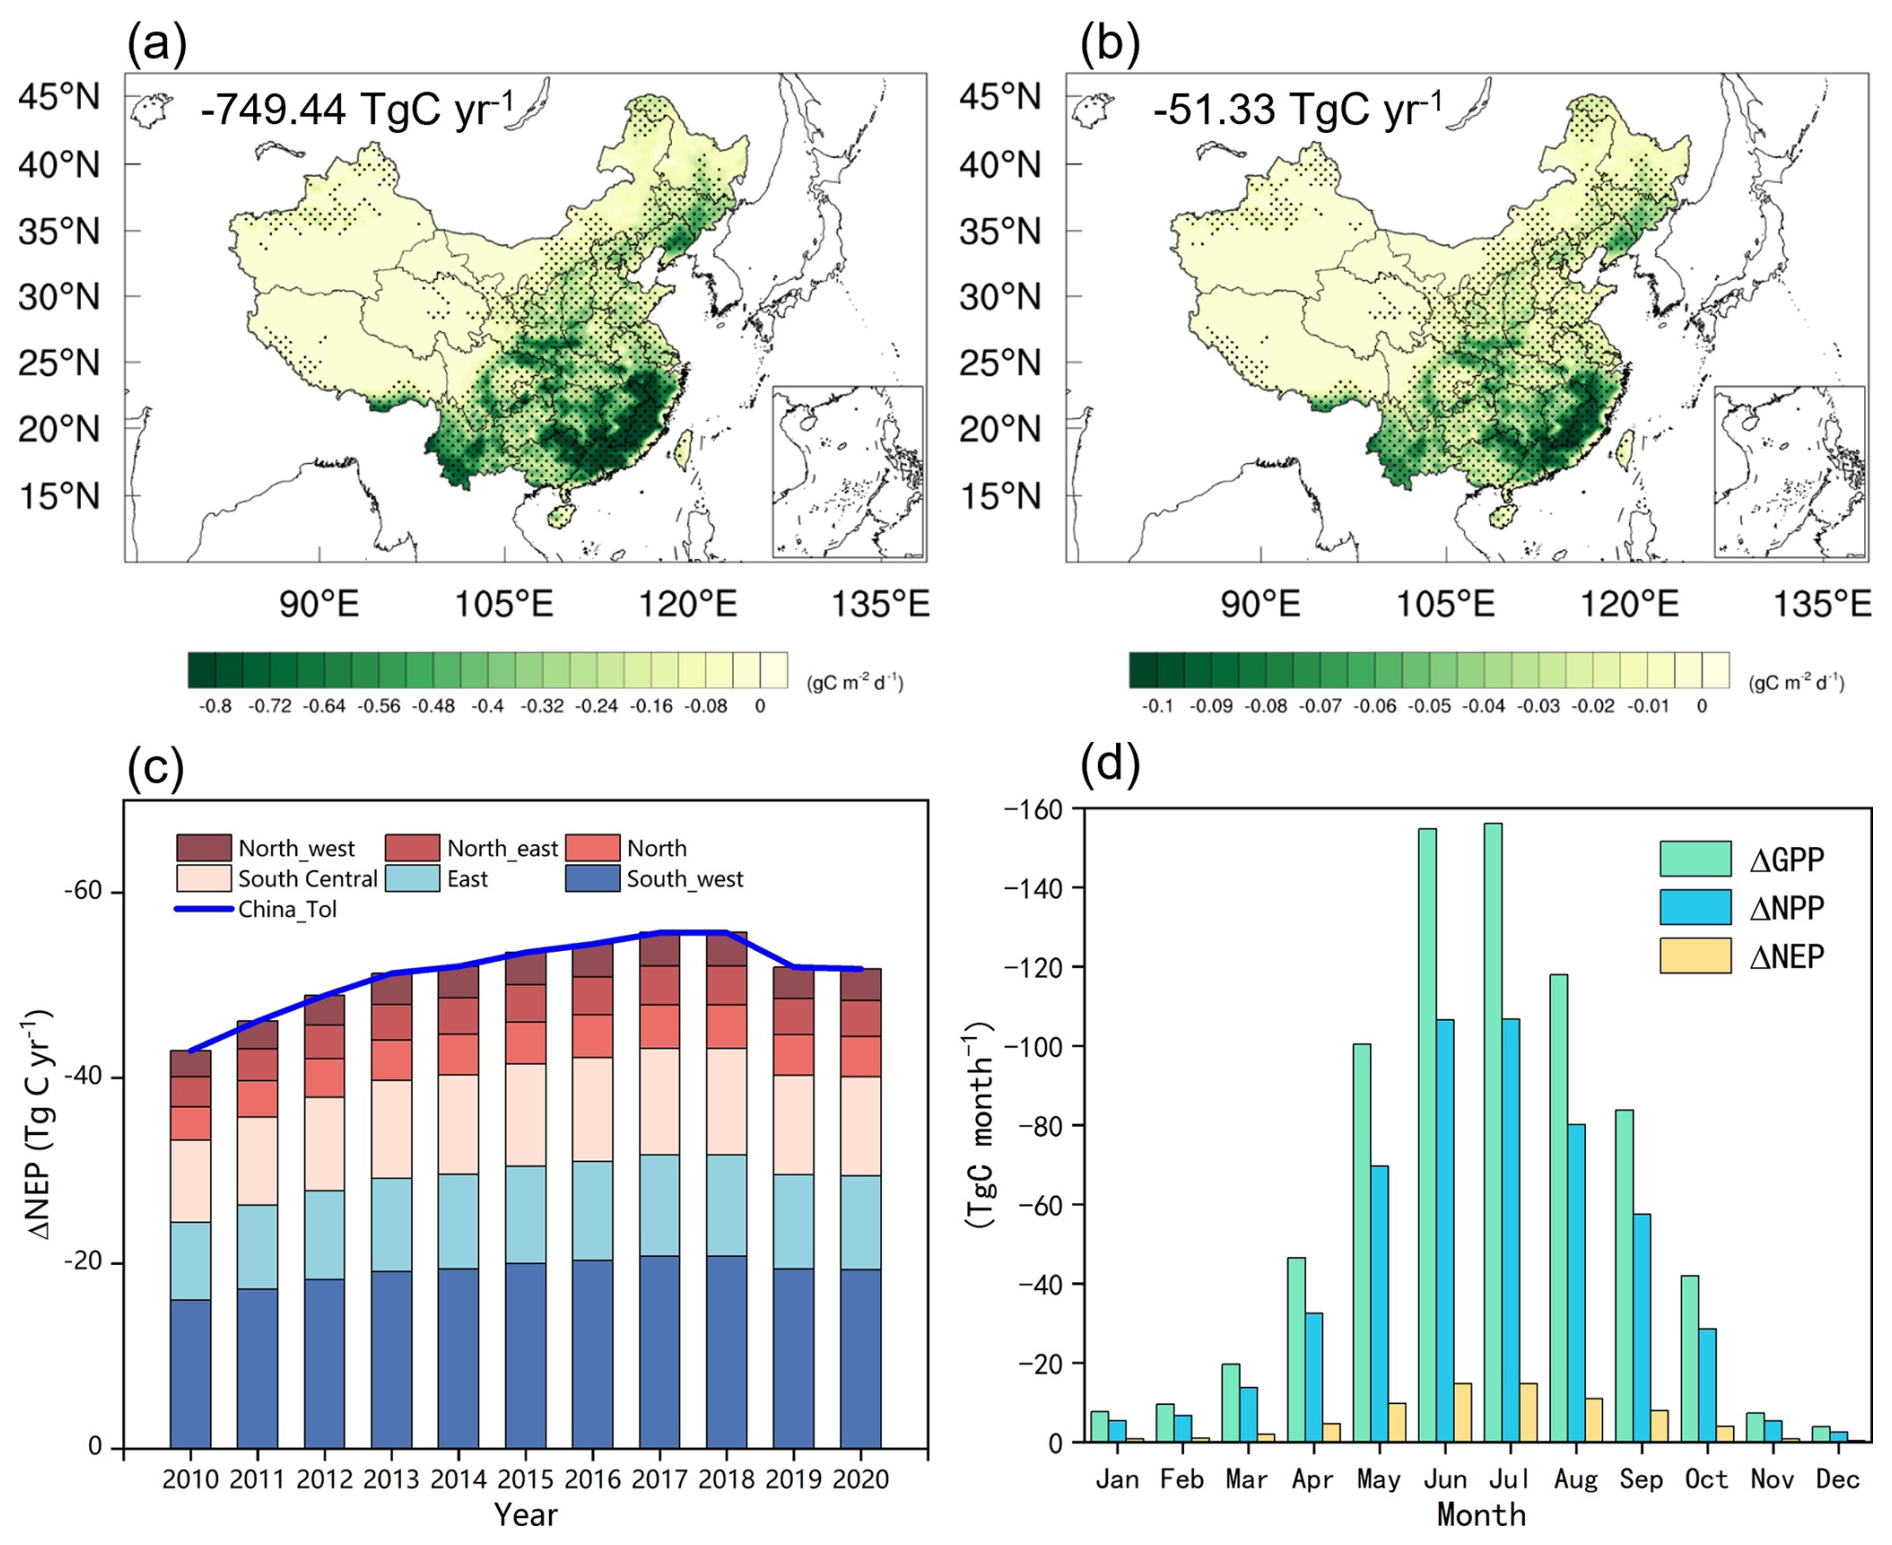
Figure 6Spatiotemporal variations in O3-induced changes in carbon fluxes during 2010–2020. (a–b) Multi-year mean spatial patterns of O3-induced changes in GPP and NEP. National totals are shown in each panel. Black dots denote significant changes (p<0.01). (c) Interannual variation of O3-induced NEP. (d) O3-induced monthly variations in GPP, NPP, and NEP.
The annual effect intensifies until 2018 and then weakens (Fig. 6c). In 2010, O3 reduces NEP by 42.93 TgC yr−1, reaching 55.71 TgC yr−1 in 2018. It then decreases to 51.98 TgC yr−1 in 2019 and 51.77 TgC yr−1 in 2020. These variations reflect air pollution control policies. Between 2013 and 2017, the first Clean Air Action reduced PM2.5 and NOx but left volatile organic compounds (VOCs) largely uncontrolled, thereby enhancing O3 formation, especially in VOCs-limited regions (Lu et al., 2020). Both model and observations show higher O3 during this stage (Fig. S4). After 2018, the second Clean Air Action introduced coordinated control of NOx and VOCs in the Yangtze River Delta and Pearl River Delta, reducing O3 during summer and easing sink suppression in 2019–2020. In contrast, O3 continued to rise in North China, indicating uneven policy outcomes across regions.
Seasonal effects are distinct (Figs. 6d and S9). Summer shows the strongest suppression, with NEP reduced by 29.10 TgC (56.69 % of the annual effect). This results from the overlap of peak O3 and peak photosynthesis, when high temperature and humidity keep stomata open and allow O3 uptake. Spring is second, with NEP reduced by 11.67 TgC (22.74 %). The effect is linked to leaf expansion, rapid growth, and frequent transport events. Autumn and winter show weaker impacts due to lower photosynthesis, unfavorable O3 chemistry, and reduced stomatal conductance. Regional differences are evident: in the south, suppression extends from spring to late autumn, while in the north it is confined to summer. This highlights the role of climate and phenology in modulating the impact of O3 on carbon sinks.
3.4 Effects of atmospheric nitrogen deposition on carbon sinks
The response of China's terrestrial ecosystems to atmospheric nitrogen deposition during 2010–2020 shows pronounced spatial heterogeneity (Fig. 7a, b). At the national scale, nitrogen deposition increased GPP and NEP by 668.88 and 37.98 TgC yr−1, respectively. These increases account for 9.08 % of total GPP and 9.52 % of total NEP. Atmospheric nitrogen deposition also increased Rh by 297.26 TgC yr−1 over China, indicating that the nitrogen-induced enhancement of carbon uptake was accompanied by stronger soil carbon decomposition. The net gains were mainly concentrated in the southeastern, southwestern, and central regions. In these areas, NEP increased by 0.04–0.08 gC m−2 d−1, forming the dominant contribution to the nitrogen-induced carbon sink. Although atmospheric nitrogen deposition is highest in eastern China (Fig. 2e, f), the regional variations in GPP and NEP induced by nitrogen deposition are more pronounced in southern China than in the east. The strong spatial gradient highlights that the ecological effects of nitrogen deposition are not uniform, but tightly linked to anthropogenic nitrogen emissions and ecosystem sensitivity (Shang et al., 2024). High responses were observed in regions with intensive agriculture and industry, where deposition exceeded 15 kg N ha−1 yr−1. Vegetation dominated by subtropical evergreen broadleaf forests, mixed forests, and croplands is generally nitrogen-limited. Additional nitrogen input alleviated nutrient constraints, enhanced photosynthesis and biomass accumulation, and shifted soil microbial processes. The spatial pattern of Rh (Fig. S10c) also shows pronounced positive responses in southern China, consistent with the regions of strong nitrogen-induced carbon uptake. This suggests that enhanced plant production and carbon input to soils stimulated microbial decomposition, so that the final NEP gain reflects the balance between increased NPP and increased Rh rather than a simple linear fertilization effect. When stimulation of GPP and NPP outweighed the increase in ER, NEP rose. Warm and humid climates, together with long growing seasons, further amplified these effects.
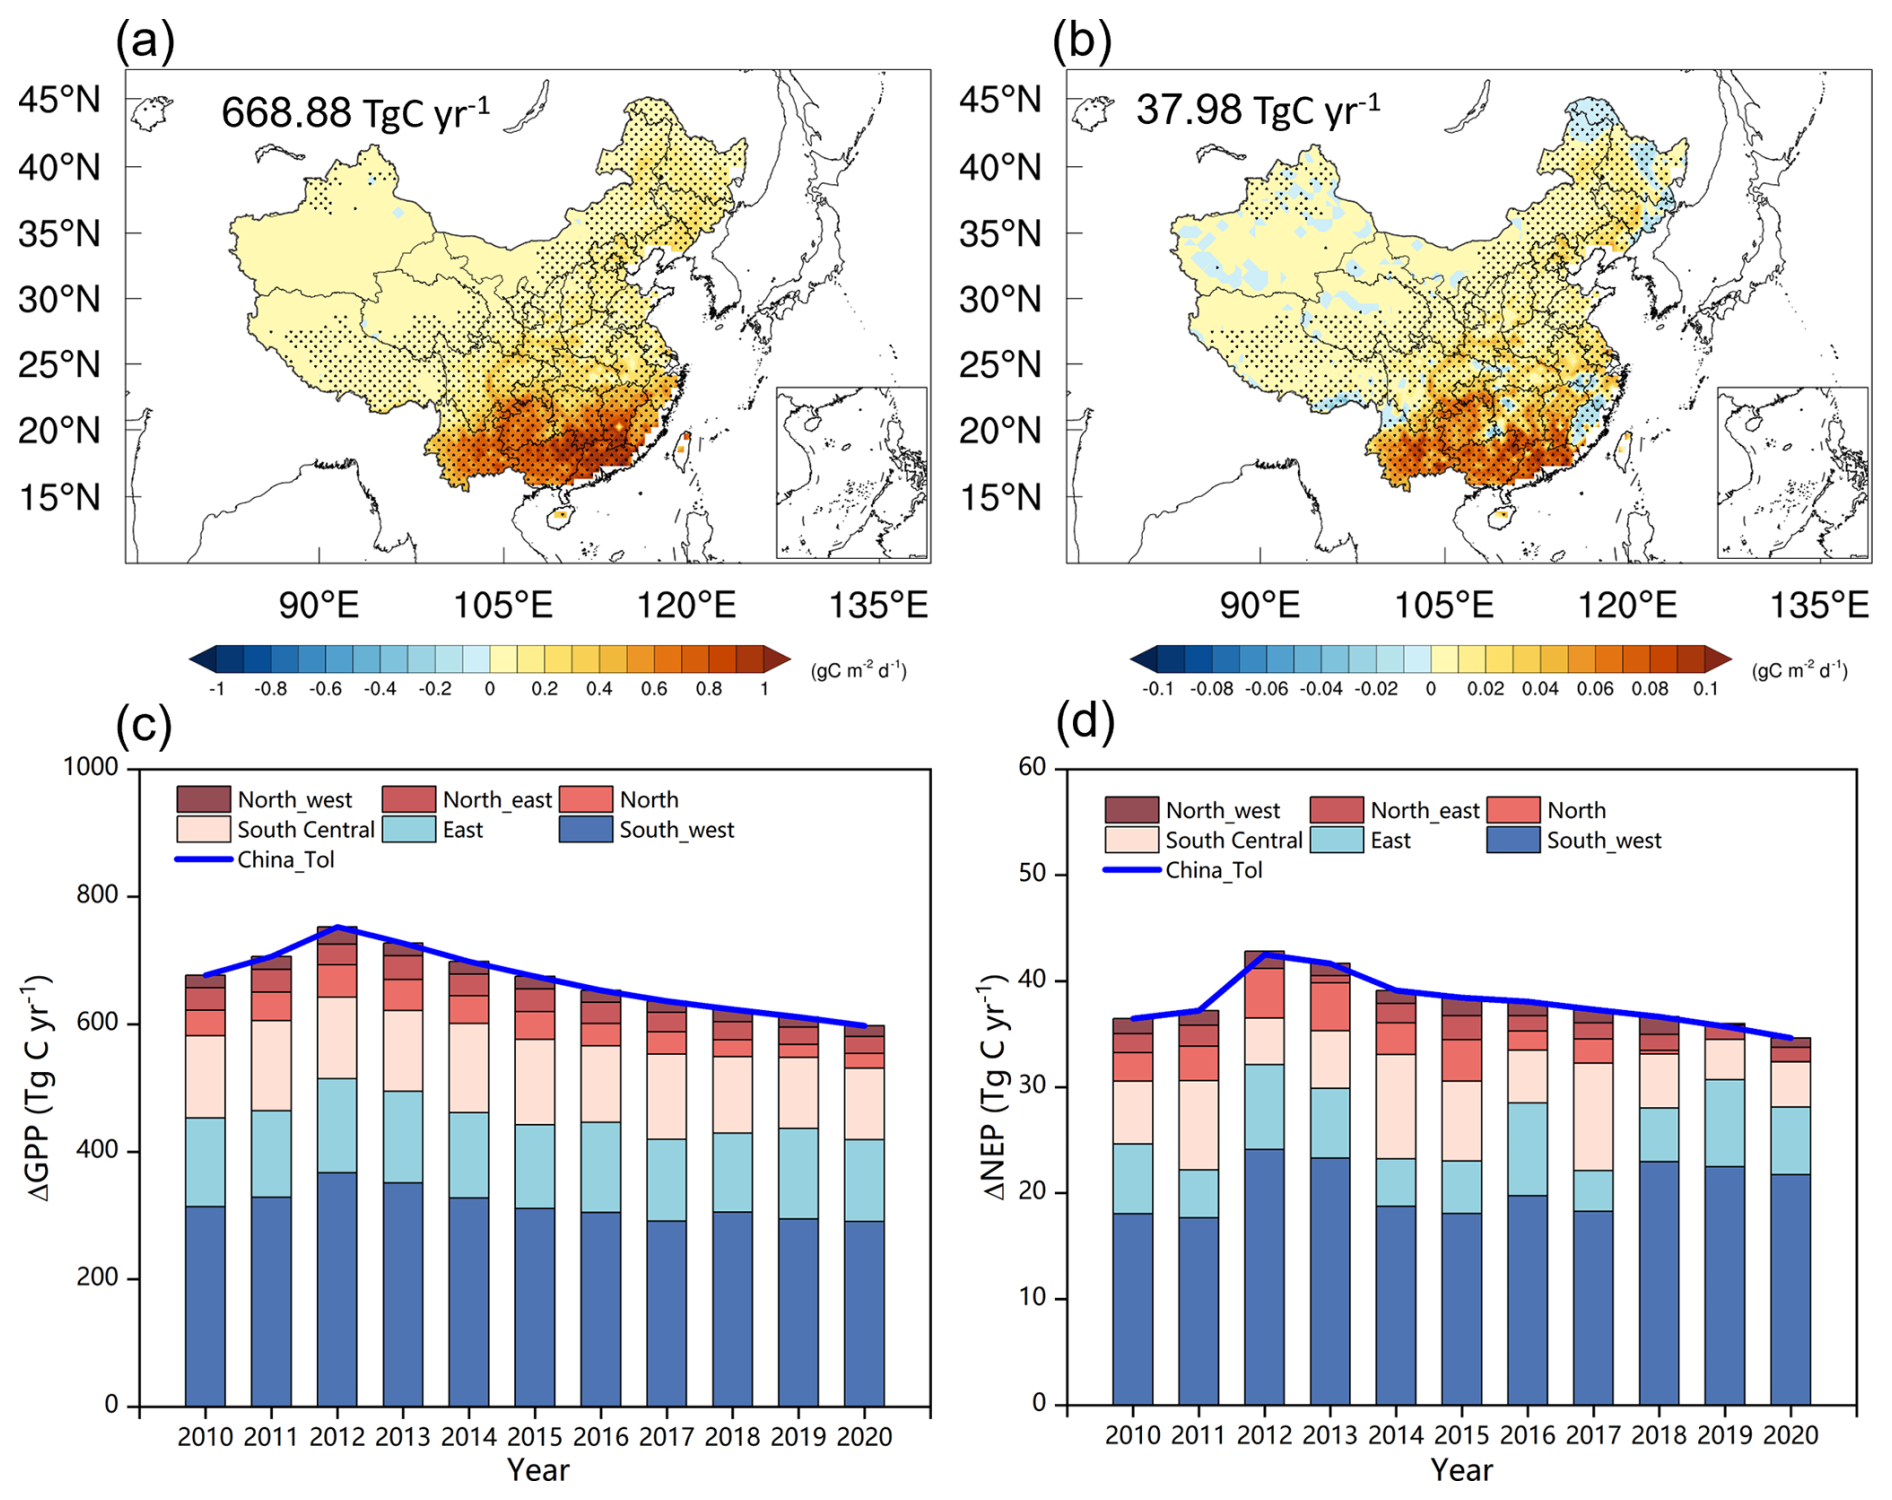
Figure 7Spatiotemporal variations in Ndep-induced changes in carbon fluxes during 2010–2020. (a–b) Multi-year mean spatial patterns of Ndep-induced changes in GPP and NEP. National totals are shown in each panel. Black dots denote significant changes (p<0.01). (c–d) Interannual variation of Ndep-induced in GPP and NEP.
The impacts of nitrogen deposition on GPP and NEP varied strongly over time (Fig. 7c, d). In 2010, deposition enhanced NEP by 36.45 TgC yr−1. The effect increased to a peak of 42.50 TgC yr−1 in 2012, but then declined, reaching 34.65 TgC yr−1 by 2020. This trajectory reflects the influence of China's air pollution control policies on ecosystem carbon dynamics. The temporal trend corresponds to changes in nitrogen deposition fluxes. Between 2010 and 2012, rapid industrialization and agriculture raised deposition from 15.85 to 17.91 kg N ha−1 yr−1 (+13 %). After 2013, emission reduction policies reduced nitrogen deposition, which fell to 13.25 kg N ha−1 yr−1 in 2020 (−26.02 %). Notably, the effect of nitrogen deposition on NEP leveled off after 2015, which can be attributed to the slower decline rate of atmospheric nitrogen deposition since 2015 (Fig. S5). The reduction in NEP (−18.47 %) was smaller than that in nitrogen input. This lagged response suggests that soil nitrogen pools accumulated from long-term deposition continued to supply nitrogen to vegetation, buffering the decline.
The influence of nitrogen deposition on NEP displayed clear seasonality (Fig. 8). Strong positive effects occurred in summer and spring, whereas autumn and winter showed overall suppression at the national scale. Summer accounted for the largest gain, with an NEP increase of 27.16 TgC. Spring followed with 14.12 TgC. In contrast, autumn and winter reduced NEP by 0.20 and 3.10 TgC, respectively. These seasonal differences result from the combined influence of multiple factors. During summer, optimal temperature, light, and water supported vigorous canopy photosynthesis. Plants assimilated nitrogen efficiently, leading to higher GPP and biomass accumulation. Spring growth stages were also nitrogen-sensitive, producing strong positive responses. In autumn and winter, however, plant activity slowed. Nitrogen inputs mainly stimulated heterotrophic respiration, while GPP and NPP remained low. As a result, NEP decreased, and carbon sink strength weakened outside the growing season. However, the negative response in autumn and winter was not spatially uniform. Positive NEP anomalies were still evident in parts of the eastern Qinghai–Tibet Plateau and western Sichuan, especially in autumn (Fig. 8c), whereas in winter this signal became much weaker and more localized (Fig. 8d). This spatial heterogeneity likely reflects the combined effects of persistent nitrogen limitation and weak heterotrophic respiration responses under cold, high-elevation conditions. In these regions, low temperatures constrain soil decomposition more strongly, so the stimulation of heterotrophic respiration by additional nitrogen is limited. Meanwhile, alpine grasslands, shrublands, and montane forests may still maintain some residual photosynthetic activity during the late growing season, allowing deposited nitrogen to support carbon uptake. As a result, nitrogen deposition can still enhance NEP locally in autumn, even though most other regions show seasonal carbon sink weakening.
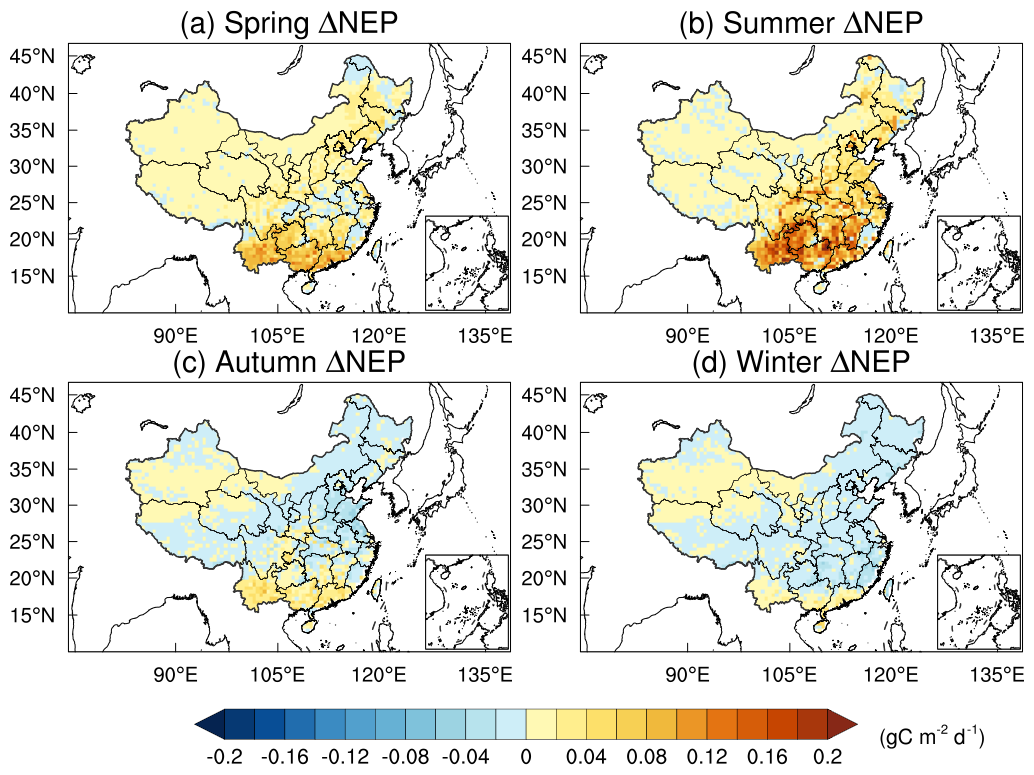
Figure 8Spatial distribution of Ndep-induced seasonal variations in NEP during 2010–2020 (units: gC m−2 d−1). (a) Spring, including March, April, and May. (b) Summer, including June, July, and August. (c) Autumn, including September, October, and November. (d) Winter, including January, February, and December.
3.5 Integrated Impact Analysis
To assess the combined influence of aerosols, O3, and atmospheric nitrogen deposition on China's terrestrial carbon sink, the three independent effects were algebraically summed. During 2010–2020, the co-evolution of these atmospheric factors jointly drove substantial interannual variability and stage-dependent changes in carbon uptake, closely linked to the implementation of the CAA plan. The interannual trend (Fig. 9) shows that although aerosols and nitrogen deposition generally enhanced carbon sequestration, the strong carbon loss caused by O3 largely offset these positive effects. The mean net effect was 4.58 TgC yr−1, exhibiting pronounced fluctuations and a declining trend. Net enhancement was strong in the early years of the decade but weakened steadily and approached neutral levels by 2018–2020, when a slight negative value (−0.14 TgC yr−1) first appeared. These changes indicate a gradual transition from an enhancement-dominated to an inhibition-dominated regime.
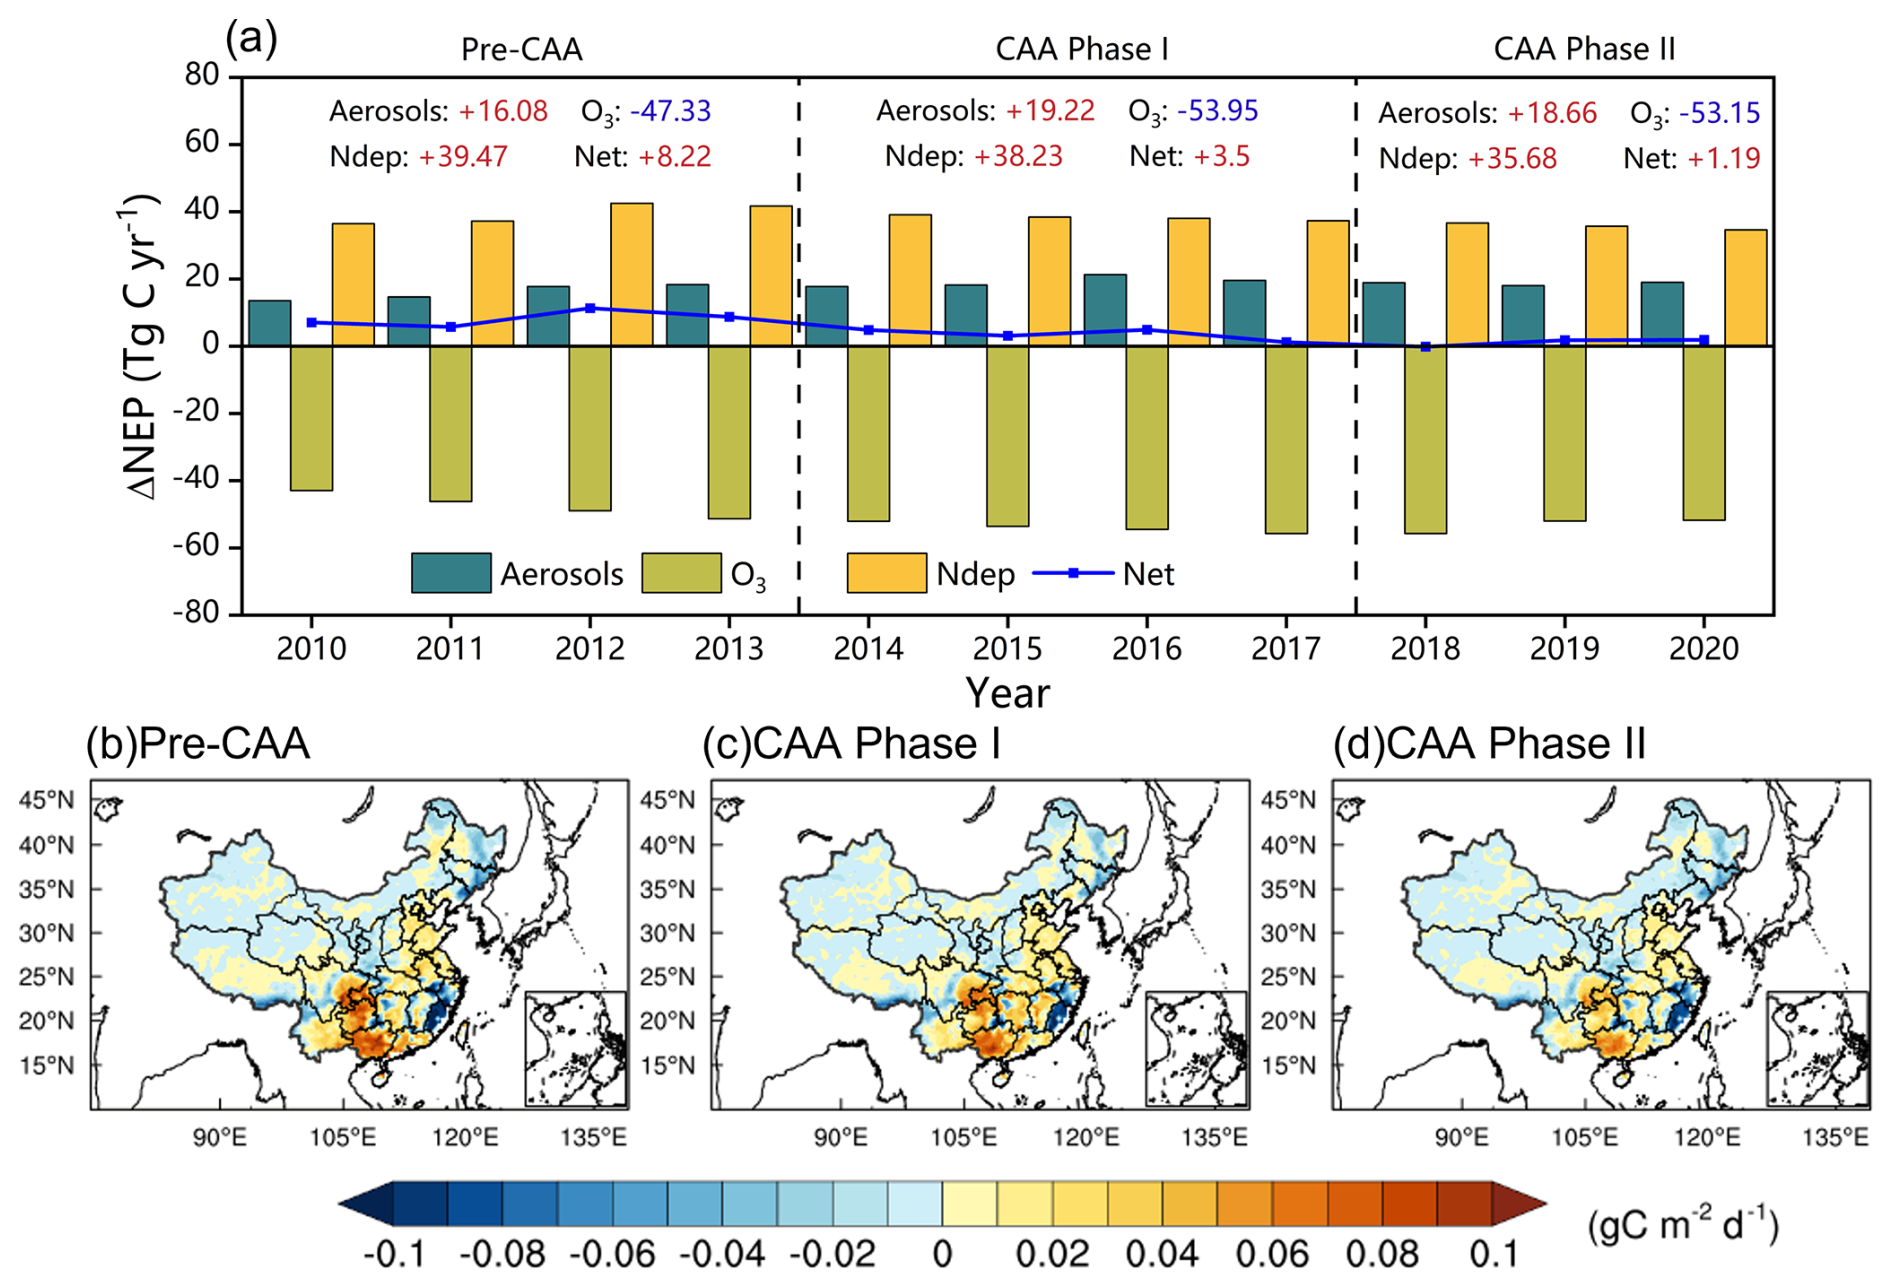
Figure 9The overall impacts of aerosols, O3, and atmospheric nitrogen deposition on the terrestrial carbon sink in China during 2010–2020. (a) Interannual variations of the combined effects. Pre-CAA represents the period before the implementation of the Clean Air Action (2010–2013); CAA Phase I and CAA Phase II represent the first (2014–2017) and second (2018–2020) stages of the CAA, respectively. (b–d) Spatial distributions of the annual means during the Pre-CAA, CAA Phase I, and CAA Phase II periods.
To further interpret this transition, the study period was divided into three phases according to key CAA milestones, and the dominant factors were identified (Fig. 9a). In pre-CAA (2010–2013), the mean annual net effect reached 8.22 TgC yr−1, characterized by nitrogen-deposition-dominated enhancement. Nitrogen deposition provided the largest positive contribution (+39.47 TgC yr−1), while the diffuse-radiation fertilization effect of aerosols offered a secondary gain (+16.08 TgC yr−1). The negative impact of O3 (−47.33 TgC yr−1) was largely compensated by the two positive drivers, resulting in a pronounced increase in carbon sink strength. This stage corresponded to relatively high emissions of aerosol and nitrogen precursors, which maintained elevated aerosol loading and nitrogen deposition, while O3 pollution had not yet reached the stronger suppressive level observed in later years. During CAA Phase I (2014–2017), the mean net effect decreased sharply to 3.50 TgC yr−1, marking a transitional stage with competing influences. The positive effect of aerosols peaked (+19.22 TgC yr−1), likely because aerosol changes during this period were more favorable for diffuse-radiation fertilization, despite the concurrent declines in both scattering and absorbing aerosols. However, this gain was largely offset by intensified O3-induced inhibition (−53.80 TgC yr−1). This phase coincided with strong reductions in emissions of SO2, PM2.5 and NOx under the first Clean Air Action (Fig. S11), which substantially altered atmospheric composition. Although declining aerosol loading weakened the total radiative perturbation, the remaining aerosol conditions still supported a strong diffuse-radiation effect. Meanwhile, insufficient VOCs control favored O3 formation in many regions, thereby amplifying O3-induced suppression of the carbon sink. In CAA Phase II (2018–2020), the mean net effect further declined to 1.19 TgC yr−1, forming an O3-dominated pattern. This stage was associated with further declines in aerosol concentrations and nitrogen deposition under continued emission reductions, which weakened their positive contributions to NEP. At the same time, the coordinated control of NOx and VOCs in key regions partly alleviated O3 pollution, but this improvement was not sufficient to reverse the dominant suppressive role of O3 at the national scale. Overall, the stage-dependent changes in the net carbon sink effect were broadly consistent with the temporal evolution of anthropogenic emissions during 2010–2020 (Fig. S11), highlighting the strong imprint of CAA-related emission controls on the balance among aerosols, O3, and nitrogen deposition. With continued emission control, the aerosol-induced enhancement decreased from its peak (+18.66 TgC yr−1), and the nitrogen-deposition gain weakened (+35.68 TgC yr−1). Although O3 suppression slightly eased (−53.15 TgC yr−1), it still nearly balanced the combined positive contributions, indicating a fundamental shift in atmospheric drivers controlling China's terrestrial carbon sink.
The spatial overlay further supports these findings (Fig. 9b, c, d). In forested and industrialized regions of eastern and southern China, the cancellation between positive and negative effects was most pronounced. These areas, benefiting from nitrogen and aerosol fertilization but suffering from intense O3 pollution, became hotspots of weakened or even reversed net effects. Overall, the CAA plan not only improved air quality but also altered atmospheric composition in ways that substantially affected China's terrestrial carbon sinks. Policy-driven emission changes transformed the system from a nitrogen–aerosol-enhanced regime to an O3-dominated offset pattern. These results suggest that achieving synergistic benefits between air-quality improvement and carbon neutrality requires elevating O3 mitigation to a higher strategic priority.
3.6 Uncertainties
Although the RegESM framework captures the overall spatiotemporal variations of China's terrestrial carbon sink in response to atmospheric composition changes, several uncertainties remain that may influence the quantitative assessment of the individual and combined effects of aerosols, O3, and nitrogen deposition.
First, this study only considered the direct radiative effects of aerosols, while aerosol–cloud interactions were excluded. The first and second indirect effects of aerosols on cloud formation and albedo involve large uncertainties (Haywood and Boucher, 2000) and were therefore not represented in our simulations. However, observations have shown that terrestrial carbon fluxes are highly sensitive to sky conditions and diffuse radiation changes (Oliphant et al., 2011; Yue and Unger, 2017). The omission of aerosol–cloud interactions may affect the magnitude and spatial pattern of aerosol impacts on radiation and photosynthesis, as cloud-mediated diffuse radiation responses remain uncertain. Future work should explicitly include aerosol–cloud–radiation feedbacks to better quantify their effects on ecosystem carbon exchange.
Second, uncertainties remain in evaluating vegetation responses to O3 exposure. Field-based O3 fumigation experiments across China are still limited, making it difficult to comprehensively assess ecosystem-level damage. In this study, the YIBs model applied different O3 damage coefficients for plant functional types, and the parameterization has shown reasonable regional performance in simulating GPP–O3 responses (Yue et al., 2017). Nevertheless, a wider range of site-level observations is required to constrain the O3 damage functions across various vegetation types and climate zones at the national scale.
Third, nonlinear coupling among aerosols, O3, and nitrogen deposition introduces systemic uncertainty in estimating their combined effects. Aerosol reduction alters photolysis rates and thereby affects O3 formation (Tang et al., 2017; Yan et al., 2023; Yang et al., 2022), while O3 and nitrogen jointly regulate stomatal conductance, photosynthetic efficiency, and water-use dynamics (Sitch et al., 2007; Zhang et al., 2018). In addition, the coexisting effects of these three drivers may not be strictly additive. Aerosol effects and O3 damage may be partly antagonistic, as aerosol-induced changes in diffuse radiation, temperature, and vapor pressure deficit can modulate stomatal uptake and the physiological stress caused by O3. Nitrogen deposition may partly offset O3-induced reductions in plant productivity by alleviating nutrient limitation, whereas the interaction between aerosols and nitrogen deposition may vary regionally because nitrogen availability can influence the extent to which vegetation benefits from aerosol-induced radiation changes. These interactions may amplify or offset each other under changing climatic conditions, and the real-world coexisting effects of these atmospheric drivers may therefore differ from the linear sum of their independently quantified contributions. In the present study, the three factors were quantified separately to isolate their first-order effects, while a full assessment of their two-way and three-way interactions would require a dedicated factorial experimental framework. Therefore, although nonlinear interactions may modify the quantitative magnitudes of the simulated responses, the overall conclusion that the positive contributions of aerosols and nitrogen deposition weakened while the suppressive influence of O3 became increasingly important during 2010–2020 is expected to remain qualitatively robust. These limitations further emphasize the need for high-resolution, fully coupled chemistry–ecosystem modeling frameworks to capture the co-evolution of multiple atmospheric processes.
In summary, despite these uncertainties, this study provides robust quantitative evidence that aerosols, O3, and nitrogen deposition jointly modified the magnitude and spatial distribution of China's terrestrial carbon sink during 2010–2020. Future efforts should focus on incorporating aerosol–cloud interactions, expanding field-based O3 response networks, and improving representation of multi-process coupling and nonlinear interactions to further constrain atmospheric–biosphere feedbacks under China's evolving air quality and carbon neutrality goals.
This study employed the RegESM to quantify the effects of aerosol, surface O3, and nitrogen deposition on China's terrestrial carbon sink during 2010–2020. The model effectively reproduced the spatial and temporal variations of aerosol optical depth, O3, nitrogen deposition, and carbon fluxes, providing a solid basis for process-level attribution analysis.
Aerosols exerted a substantial positive influence on China's terrestrial carbon sink. On average, aerosols enhanced GPP and NEP by 293.28 TgC yr−1 (3.98 %) and 17.93 TgC yr−1 (4.49 %), respectively, primarily through the diffuse radiation fertilization effect. The strongest enhancement appeared in southern and eastern China, where high aerosol loading and dense vegetation synergistically improved canopy light-use efficiency. Aerosol-induced surface cooling and reduced VPD further alleviated water stress and stimulated carbon uptake. The enhancement peaked during 2015–2017, coinciding with elevated diffuse radiation fractions, and weakened slightly under cleaner atmospheric conditions after 2018.
In contrast, surface O3 persistently suppressed ecosystem carbon uptake, reducing GPP and NEP by 749.44 TgC yr−1 (10.17 %) and 51.33 TgC yr−1 (12.90 %), respectively. The strongest suppression occurred in southeastern and southwestern China, where dense forest ecosystems coincided with high O3 concentrations. O3-induced damage peaked in 2018, consistent with the exceptionally high O3 levels. Subsequent coordinated NOx–VOCs management under the second Clean Air Action partially mitigated O3 levels and NEP suppression. O3 exerted a strongly seasonal negative impact on NEP, with the strongest suppression occurring in summer.
Atmospheric nitrogen deposition enhanced the terrestrial carbon sink by 9.08 % for GPP and 9.52 % for NEP, with effects concentrated in southern and central China. The enhancement peaked around 2012, declined gradually after 2013 following reduced anthropogenic emissions, and leveled off after 2015, corresponding to a slower decline in deposition and a lagged ecosystem response due to soil nitrogen accumulation. Seasonal variations showed stronger stimulation in summer and spring, while autumn and winter exhibited minor reductions linked to enhanced respiration.
During 2010–2020, the combined effects of aerosols, surface O3, and atmospheric nitrogen deposition on China's terrestrial carbon sink exhibited marked interannual variability and a distinct transition under the Clean Air Action (CAA). The net atmospheric contribution declined from +8.22 Tg C yr−1 during the Pre-CAA period (2010–2013) to +1.19 Tg C yr−1 in Phase II (2018–2020), as the increasing suppression from O3 (−53.15 Tg C yr−1) gradually offset the positive impacts of aerosols and nitrogen deposition. These results indicate that China's air-pollution control not only improved air quality but also altered atmospheric chemical composition in ways that significantly affected ecosystem carbon uptake, with O3 becoming the dominant limiting factor in the later period.
Overall, aerosols, O3, and nitrogen deposition exerted interconnected yet contrasting influences on China's terrestrial carbon sink. Aerosols and nitrogen deposition enhanced carbon uptake through diffuse radiation and nutrient input, whereas O3 caused physiological damage that suppressed it. The evolving interplay among these factors illustrates how emission reductions, atmospheric chemistry, and ecosystem feedbacks jointly impact carbon sink dynamics under China's clean-air policies. These findings suggest that future air-quality management should move beyond single-pollutant control and place greater emphasis on coordinated multi-pollutant strategies, particularly the synergistic reduction of NOx and VOCs, to limit O3-induced carbon sink suppression while sustaining gains in air quality. In addition, ecosystem carbon-sink responses should be incorporated into the evaluation of clean-air policies, especially in ecologically sensitive regions of eastern and southern China, to better achieve co-benefits for air pollution mitigation and carbon neutrality goals.
MODIS data are provided at https://doi.org/10.5067/MODIS/MOD17A2H.006 (Running et al., 2015). AOD data come from the MODIS Level-3 monthly product (MOD08_M3, Collection 6.1) available at https://doi.org/10.5067/MODIS/MOD08_M3.061 (Platnick et al., 2015). WDCGG data are available at https://doi.org/10.15138/wkgj-f215 (Lan, 2023). ERA-Interim data are available at https://doi.org/10.24381/cds.f2f5241d (Dee et al., 2011b). The Carbon Tracker data can be accessed at https://doi.org/10.25925/Z1GJ-3254 (Jacobson et al., 2023). CNEMC data are provided at https://www.cnemc.cn/en (last access: 15 January 2025; Kong et al., 2021).
The supplement related to this article is available online at https://doi.org/10.5194/acp-26-5925-2026-supplement.
TW and NX designed the study. NX performed the analysis, conducted the evaluation, and drafted the manuscript. TW supervised the research and acquired funding. Both authors contributed to the interpretation of results and to reviewing and editing the manuscript.
The contact author has declared that none of the authors has any competing interests.
Publisher's note: Copernicus Publications remains neutral with regard to jurisdictional claims made in the text, published maps, institutional affiliations, or any other geographical representation in this paper. The authors bear the ultimate responsibility for providing appropriate place names. Views expressed in the text are those of the authors and do not necessarily reflect the views of the publisher.
We would like to acknowledge the anthropogenic emission inventory support from Tsinghua University and the observed data from the China National Environmental Monitoring Center. We also gratefully acknowledge a wide range of other institutional partners.
This work was supported by the National Key Basic Research Development Program of China (grant no. 2024YFC3711905) and the National Natural Science Foundation of China (grant no. 42477103).
This paper was edited by Jeffrey Geddes and reviewed by two anonymous referees.
Cao, S., He, Y., Zhang, L., Sun, Q., Zhang, Y., Li, H., Wei, X., and Liu, Y.: Spatiotemporal dynamics of vegetation net ecosystem productivity and its response to drought in Northwest China, GISci. Remote Sens., 60, 2194597, https://doi.org/10.1080/15481603.2023.2194597, 2023.
Cen, X., He, N., Van Sundert, K., Yu, K., Li, M., Xu, L., He, L., and Butterbach-Bahl, K.: Global patterns of nitrogen saturation in forests, One Earth, 8, https://doi.org/10.1016/j.oneear.2024.10.007, 2025.
Chen, H., Li, D., Gurmesa, G. A., Yu, G., Li, L., Zhang, W., Fang, H., and Mo, J.: Effects of nitrogen deposition on carbon cycle in terrestrial ecosystems of China: A meta-analysis, Environ. Pollut., 206, 352–360, https://doi.org/10.1016/j.envpol.2015.07.033, 2015.
Dee, D. P., Uppala, S. M., Simmons, A. J., Berrisford, P., Poli, P., Kobayashi, S., Andrae, U., Balmaseda, M. A., Balsamo, G., Bauer, P., Bechtold, P., Beljaars, A. C. M., van de Berg, L., Bidlot, J., Bormann, N., Delsol, C., Dragani, R., Fuentes, M., Geer, A. J., Haimberger, L., Healy, S. B., Hersbach, H., Hólm, E. V., Isaksen, L., Kållberg, P., Köhler, M., Matricardi, M., McNally, A. P., Monge-Sanz, B. M., Morcrette, J. J., Park, B. K., Peubey, C., de Rosnay, P., Tavolato, C., Thépaut, J. N., and Vitart, F.: The ERA-Interim reanalysis: configuration and performance of the data assimilation system, Q. J. Roy. Meteor. Soc., 137, 553–597, https://doi.org/10.1002/qj.828, 2011a.
Dee, D. P., Uppala, S. M., Simmons, A. J., Berrisford, P., Poli, P., Kobayashi, S., Andrae, U., Balmaseda, M. A., Balsamo, G., Bauer, P., Bechtold, P., Beljaars, A. C. M., van de Berg, L., Bidlot, J., Bormann, N., Delsol, C., Dragani, R., Fuentes, M., Geer, A. J., Haimberger, L., Healy, S. B., Hersbach, H., Hólm, E. V., Isaksen, L., Kållberg, P., Köhler, M., Matricardi, M., McNally, A. P., Monge-Sanz, B. M., Morcrette, J.-J., Park, B.-K., Peubey, C., de Rosnay, P., Tavolato, C., Thépaut, J.-N., and Vitart, F.: ERA-Interim global atmospheric reanalysis, Copernicus Climate Change Service (C3S) Climate Data Store (CDS) [data set], https://doi.org/10.24381/cds.f2f5241d, 2011b.
Doughty, C. E., Flanner, M. G., and Goulden, M. L.: Effect of smoke on subcanopy shaded light, canopy temperature, and carbon dioxide uptake in an Amazon rainforest, Global Biogeochem. Cy., 24, https://doi.org/10.1029/2009gb003670, 2010.
Emmons, L. K., Walters, S., Hess, P. G., Lamarque, J.-F., Pfister, G. G., Fillmore, D., Granier, C., Guenther, A., Kinnison, D., Laepple, T., Orlando, J., Tie, X., Tyndall, G., Wiedinmyer, C., Baughcum, S. L., and Kloster, S.: Description and evaluation of the Model for Ozone and Related chemical Tracers, version 4 (MOZART-4), Geosci. Model Dev., 3, 43–67, https://doi.org/10.5194/gmd-3-43-2010, 2010.
Feng, Z., Hu, E., Wang, X., Jiang, L., and Liu, X.: Ground-level O3 pollution and its impacts on food crops in China: A review, Environ. Pollut., 199, 42–48, https://doi.org/10.1016/j.envpol.2015.01.016, 2015.
Friedlingstein, P., O'Sullivan, M., Jones, M. W., Andrew, R. M., Bakker, D. C. E., Hauck, J., Landschützer, P., Le Quéré, C., Luijkx, I. T., Peters, G. P., Peters, W., Pongratz, J., Schwingshackl, C., Sitch, S., Canadell, J. G., Ciais, P., Jackson, R. B., Alin, S. R., Anthoni, P., Barbero, L., Bates, N. R., Becker, M., Bellouin, N., Decharme, B., Bopp, L., Brasika, I. B. M., Cadule, P., Chamberlain, M. A., Chandra, N., Chau, T.-T.-T., Chevallier, F., Chini, L. P., Cronin, M., Dou, X., Enyo, K., Evans, W., Falk, S., Feely, R. A., Feng, L., Ford, D. J., Gasser, T., Ghattas, J., Gkritzalis, T., Grassi, G., Gregor, L., Gruber, N., Gürses, Ö., Harris, I., Hefner, M., Heinke, J., Houghton, R. A., Hurtt, G. C., Iida, Y., Ilyina, T., Jacobson, A. R., Jain, A., Jarníková, T., Jersild, A., Jiang, F., Jin, Z., Joos, F., Kato, E., Keeling, R. F., Kennedy, D., Klein Goldewijk, K., Knauer, J., Korsbakken, J. I., Körtzinger, A., Lan, X., Lefèvre, N., Li, H., Liu, J., Liu, Z., Ma, L., Marland, G., Mayot, N., McGuire, P. C., McKinley, G. A., Meyer, G., Morgan, E. J., Munro, D. R., Nakaoka, S.-I., Niwa, Y., O'Brien, K. M., Olsen, A., Omar, A. M., Ono, T., Paulsen, M., Pierrot, D., Pocock, K., Poulter, B., Powis, C. M., Rehder, G., Resplandy, L., Robertson, E., Rödenbeck, C., Rosan, T. M., Schwinger, J., Séférian, R., Smallman, T. L., Smith, S. M., Sospedra-Alfonso, R., Sun, Q., Sutton, A. J., Sweeney, C., Takao, S., Tans, P. P., Tian, H., Tilbrook, B., Tsujino, H., Tubiello, F., van der Werf, G. R., van Ooijen, E., Wanninkhof, R., Watanabe, M., Wimart-Rousseau, C., Yang, D., Yang, X., Yuan, W., Yue, X., Zaehle, S., Zeng, J., and Zheng, B.: Global Carbon Budget 2023, Earth Syst. Sci. Data, 15, 5301–5369, https://doi.org/10.5194/essd-15-5301-2023, 2023.
Geng, G. N., Liu, Y. X., Liu, Y., Liu, S. G., Cheng, J., Yan, L., Wu, N. N., Hu, H. W., Tong, D., Zheng, B., Yin, Z. C., He, K. B., and Zhang, Q.: Efficacy of China's clean air actions to tackle PM2.5 pollution between 2013 and 2020, Nat. Geosci., 17, https://doi.org/10.1038/s41561-024-01540-z, 2024.
Giorgi, F., Coppola, E., Solmon, F., Mariotti, L., Sylla, M. B., Bi, X., Elguindi, N., Diro, G. T., Nair, V., Giuliani, G., Turuncoglu, U. U., Cozzini, S., Guttler, I., O'Brien, T. A., Tawfik, A. B., Shalaby, A., Zakey, A. S., Steiner, A. L., Stordal, F., Sloan, L. C., and Brankovic, C.: RegCM4: model description and preliminary tests over multiple CORDEX domains, Clim. Res., 52, 7–29, https://doi.org/10.3354/cr01018, 2012.
Gu, L. H., Baldocchi, D. D., Wofsy, S. C., Munger, J. W., Michalsky, J. J., Urbanski, S. P., and Boden, T. A.: Response of a deciduous forest to the Mount Pinatubo eruption: Enhanced photosynthesis, Science, 299, 2035–2038, https://doi.org/10.1126/science.1078366, 2003.
Hao, Y., Meng, X., Yu, X., Lei, M., Li, W., Yang, W., Shi, F., and Xie, S.: Quantification of primary and secondary sources to PM2.5 using an improved source regional apportionment method in an industrial city, China, Sci. Total Environ., 706, https://doi.org/10.1016/j.scitotenv.2019.135715, 2020.
Haywood, J. and Boucher, O.: Estimates of the direct and indirect radiative forcing due to tropospheric aerosols: A review, Rev. Geophys., 38, 513–543, https://doi.org/10.1029/1999rg000078, 2000.
He, M. Z., Kimball, J. S., Maneta, M. P., Maxwell, B. D., Moreno, A., Begueria, S., and Wu, X. C.: Regional Crop Gross Primary Productivity and Yield Estimation Using Fused Landsat-MODIS Data, Remote Sens., 10, 372, https://doi.org/10.3390/rs10030372, 2018.
Hersbach, H., Bell, B., Berrisford, P., Hirahara, S., Horányi, A., Muñoz-Sabater, J., Nicolas, J., Peubey, C., Radu, R., Schepers, D., Simmons, A., Soci, C., Abdalla, S., Abellan, X., Balsamo, G., Bechtold, P., Biavati, G., Bidlot, J., Bonavita, M., De Chiara, G., Dahlgren, P., Dee, D., Diamantakis, M., Dragani, R., Flemming, J., Forbes, R., Fuentes, M., Geer, A., Haimberger, L., Healy, S., Hogan, R. J., Hólm, E., Janisková, M., Keeley, S., Laloyaux, P., Lopez, P., Lupu, C., Radnoti, G., de Rosnay, P., Rozum, I., Vamborg, F., Villaume, S., and Thépaut, J. N.: The ERA5 global reanalysis, Q. J. Roy. Meteor. Soc., 146, 1999–2049, https://doi.org/10.1002/qj.3803, 2020.
Horowitz, L. W., Walters, S., Mauzerall, D. L., Emmons, L. K., Rasch, P. J., Granier, C., Tie, X. X., Lamarque, J. F., Schultz, M. G., Tyndall, G. S., Orlando, J. J., and Brasseur, G. P.: A global simulation of tropospheric ozone and related tracers: Description and evaluation of MOZART, version 2, J. Geophys. Res.-Atmos., 108, 4784, https://doi.org/10.1029/2002jd002853, 2003.
Jacobson, A. R., Schuldt, K. N., Tans, P., Andrews, A., Miller, J. B., Oda, T., Basu, S., Mund, J., Weir, B., Ott, L., Aalto, T., Abshire, J. B., Aikin, K., Aoki, S., Apadula, F., Arnold, S., Baier, B., Bartyzel, J., Beyersdorf, A., Biermann, T., Biraud, S. C., Boenisch, H., Brailsford, G., Brand, W. A., Chen, G., Chen, H., Chmura, L., Clark, S., Colomb, A., Commane, R., Conil, S., Couret, C., Cox, A., Cristofanelli, P., Cuevas, E., Curcoll, R., Daube, B., Davis, K. J., De Wekker, S., Della Coletta, J., Delmotte, M., DiGangi, E., DiGangi, J. P., di Sarra, A. G., Dlugokencky, E., Elkins, J. W., Emmenegger, L., Fang, S., Fischer, M. L., Forster, G., Frumau, A., Galkowski, M., Gatti, L. V., Gehrlein, T., Gerbig, C., Gheusi, F., Gloor, E., Gomez-Trueba, V., Goto, D., Griffis, T., Hammer, S., Hanson, C., Haszpra, L., Hatakka, J., Heimann, M., Heliasz, M., Hensen, A., Hermansen, O., Hintsa, E., Holst, J., Ivakhov, V., Jaffe, D. A., Jordan, A., Joubert, W., Karion, A., Kawa, S. R., Kazan, V., Keeling, R. F., Keronen, P., Kneuer, T., Kolari, P., Komínková, K., Kort, E., Kozlova, E., Krummel, P., Kubistin, D., Labuschagne, C., Lam, D. H. Y., Lan, X., Langenfelds, R. L., Laurent, O., Laurila, T., Lauvaux, T., Lavric, J., Law, B. E., Lee, J., Lee, O. S. M., Lehner, I., Lehtinen, K., Leppert, R., Leskinen, A., Leuenberger, M., Levin, I., Levula, J., Lin, J., Lindauer, M., Loh, Z., Lopez, M., Luijkx, I. T., Lunder, C. R., Machida, T., Mammarella, I., Manca, G., Manning, A., Manning, A., Marek, M. V., Martin, M. Y., Matsueda, H., McKain, K., Meijer, H., Meinhardt, F., Merchant, L., Mihalopoulos, N., Miles, N. L., Miller, C. E., Mitchell, L., Mölder, M., Montzka, S., Moore, F., Moossen, H., Morgan, E., Morgui, J. A., Morimoto, S., Müller-Williams, J., Munger, J. W., Munro, D., Myhre, C. L., Nakaoka, S. I., Necki, J., Newman, S., Nichol, S., Niwa, Y., Obersteiner, F., O'Doherty, S., Paplawsky, B., Peischl, J., Peltola, O., Piacentino, S., Pichon, J. M., Pickers, P., Piper, S., Pitt, J., Plass-Dülmer, C., Platt, S. M., Prinzivalli, S., Ramonet, M., Ramos, R., Reyes-Sanchez, E., Richardson, S. J., Riris, H., Rivas, P. P., Ryerson, T., Saito, K., Sargent, M., Sasakawa, M., Scheeren, B., Schuck, T., Schumacher, M., Seifert, T., Sha, M. K., Shepson, P., Shook, M., Sloop, C. D., Smith, P., Stanley, K., Steinbacher, M., Stephens, B., Sweeney, C., Thoning, K., Timas, H., Torn, M., Tørseth, K., Trisolino, P., Turnbull, J., van den Bulk, P., van Dinther, D., Vermeulen, A., Viner, B., Vitkova, G., Walker, S., Watson, A., Wofsy, S. C., Worsey, J., Worthy, D., Young, D., Zaehle, S., Zahn, A., and Zimnoch, M.: CarbonTracker CT2022, NOAA Global Monitoring Laboratory [data set], https://doi.org/10.25925/Z1GJ-3254, 2023.
Jung, M., Reichstein, M., Schwalm, C. R., Huntingford, C., Sitch, S., Ahlstrom, A., Arneth, A., Camps-Valls, G., Ciais, P., Friedlingstein, P., Gans, F., Ichii, K., Ain, A. K. J., Kato, E., Papale, D., Poulter, B., Raduly, B., Rodenbeck, C., Tramontana, G., Viovy, N., Wang, Y.-P., Weber, U., Zaehle, S., and Zeng, N.: Compensatory water effects link yearly global land CO2 sink changes to temperature, Nature, 541, 516–520, https://doi.org/10.1038/nature20780, 2017.
Kong, L., Tang, X., Zhu, J., Wang, Z., Li, J., Wu, H., Wu, Q., Chen, H., Zhu, L., Wang, W., Liu, B., Wang, Q., Chen, D., Pan, Y., Song, T., Li, F., Zheng, H., Jia, G., Lu, M., Wu, L., and Carmichael, G. R.: A 6-year-long (2013–2018) high-resolution air quality reanalysis dataset in China based on the assimilation of surface observations from CNEMC, Earth Syst. Sci. Data, 13, 529–570, https://doi.org/10.5194/essd-13-529-2021, 2021.
Kuniyal, J. C. and Guleria, R. P.: The current state of aerosol-radiation interactions: A mini review, J. Aerosol Sci., 130, 45–54, https://doi.org/10.1016/j.jaerosci.2018.12.010, 2019.
Lan, X.: Atmospheric Carbon Dioxide Dry Air Mole Fractions from the NOAA GML Carbon Cycle Cooperative Global Air Sampling Network, 1968–2022, Version: 2023-08-28, NOAA Global Monitoring Laboratory [data set], https://doi.org/10.15138/wkgj-f215, 2023.
Lawrence, P. J. and Chase, T. N.: Representing a new MODIS consistent land surface in the Community Land Model (CLM 3.0), J. Geophys. Res.-Biogeo., 112, G01023, https://doi.org/10.1029/2006jg000168, 2007.
Lei, Y., Yue, X., Wang, Z., Liao, H., Zhang, L., Tian, C., Zhou, H., Zhong, J., Guo, L., Che, H., and Zhang, X.: Mitigating ozone damage to ecosystem productivity through sectoral and regional emission controls: a case study in the Yangtze River Delta, China, Environ. Res. Lett., 17, https://doi.org/10.1088/1748-9326/ac6ff7, 2022.
Levy, R. C., Mattoo, S., Munchak, L. A., Remer, L. A., Sayer, A. M., Patadia, F., and Hsu, N. C.: The Collection 6 MODIS aerosol products over land and ocean, Atmos. Meas. Tech., 6, 2989–3034, https://doi.org/10.5194/amt-6-2989-2013, 2013.
Li, M., Huang, X., Yan, D., Lai, S., Zhang, Z., Zhu, L., Lu, Y., Jiang, X., Wang, N., Wang, T., Song, Y., and Ding, A.: Coping with the concurrent heatwaves and ozone extremes in China under a warming climate, Sci. Bull., 69, 2938–2947, https://doi.org/10.1016/j.scib.2024.05.034, 2024.
Li, M., Liu, H., Geng, G. N., Hong, C. P., Liu, F., Song, Y., Tong, D., Zheng, B., Cui, H. Y., Man, H. Y., Zhang, Q., and He, K. B.: Anthropogenic emission inventories in China: a review, Natl. Sci. Rev., 4, 834–866, https://doi.org/10.1093/nsr/nwx150, 2017.
Li, X., Liang, H., and Cheng, W.: Spatio-Temporal Variation in AOD and Correlation Analysis with PAR and NPP in China from 2001 to 2017, Remote Sens., 12, https://doi.org/10.3390/rs12060976, 2020.
Liu, H., Liu, S., Xue, B., Lv, Z., Meng, Z., Yang, X., Xue, T., Yu, Q., and He, K.: Ground-level ozone pollution and its health impacts in China, Atmos. Environ., 173, 223–230, https://doi.org/10.1016/j.atmosenv.2017.11.014, 2018.
Liu, L., Wen, Z., Liu, S., Zhang, X., and Liu, X.: Decline in atmospheric nitrogen deposition in China between 2010 and 2020, Nat. Geosci., 17, https://doi.org/10.1038/s41561-024-01484-4, 2024.
Liu, M., Shang, F., Lu, X., Huang, X., Song, Y., Liu, B., Zhang, Q., Liu, X., Cao, J., Xu, T., Wang, T., Xu, Z., Xu, W., Liao, W., Kang, L., Cai, X., Zhang, H., Dai, Y., and Zhu, T.: Unexpected response of nitrogen deposition to nitrogen oxide controls and implications for land carbon sink, Nat. Commun., 13, https://doi.org/10.1038/s41467-022-30854-y, 2022.
Liu, X., Zhang, Y., Han, W., Tang, A., Shen, J., Cui, Z., Vitousek, P., Erisman, J. W., Goulding, K., Christie, P., Fangmeier, A., and Zhang, F.: Enhanced nitrogen deposition over China, Nature, 494, 459–462, https://doi.org/10.1038/nature11917, 2013.
Lu, X., Jiang, H., Liu, J., Zhang, X., Jin, J., Zhu, Q., Zhang, Z., and Peng, C.: Simulated effects of nitrogen saturation on the global carbon budget using the IBIS model, Sci. Rep., 6, https://doi.org/10.1038/srep39173, 2016.
Lu, X., Zhang, L., Wang, X. L., Gao, M., Li, K., Zhang, Y. Z., Yue, X., and Zhang, Y. H.: Rapid Increases in Warm-Season Surface Ozone and Resulting Health Impact in China Since 2013, Environ. Sci. Tech. Let., 7, 240–247, https://doi.org/10.1021/acs.estlett.0c00171, 2020.
Lu, X., Hou, E., Guo, J., Gilliam, F. S., Li, J., Tang, S., and Kuang, Y.: Nitrogen addition stimulates soil aggregation and enhances carbon storage in terrestrial ecosystems of China: A meta-analysis, Glob. Change Biol., 27, 2780–2792, https://doi.org/10.1111/gcb.15604, 2021.
Luo, Y. X., Zheng, X. B., Zhao, T. L., and Chen, J.: A climatology of aerosol optical depth over China from recent 10 years of MODIS remote sensing data, Int. J. Climatol., 34, 863–870, https://doi.org/10.1002/joc.3728, 2014.
Ma, D., Wang, T., Wu, H., Qu, Y., Liu, J., Liu, J., Li, S., Zhuang, B., Li, M., and Xie, M.: The effect of anthropogenic emission, meteorological factors, and carbon dioxide on the surface ozone increase in China from 2008 to 2018 during the East Asia summer monsoon season, Atmos. Chem. Phys., 23, 6525–6544, https://doi.org/10.5194/acp-23-6525-2023, 2023.
Madani, N., Kimball, J. S., Affleck, D. L. R., Kattge, J., Graham, J., van Bodegom, P. M., Reich, P. B., and Running, S. W.: Improving ecosystem productivity modeling through spatially explicit estimation of optimal light use efficiency, J. Geophys. Res.-Biogeosci., 119, 1755–1769, https://doi.org/10.1002/2014jg002709, 2014.
Mercado, L. M., Bellouin, N., Sitch, S., Boucher, O., Huntingford, C., Wild, M., and Cox, P. M.: Impact of changes in diffuse radiation on the global land carbon sink, Nature, 458, 1014–1087, https://doi.org/10.1038/nature07949, 2009.
Oliphant, A. J., Dragoni, D., Deng, B., Grimmond, C. S. B., Schmid, H. P., and Scott, S. L.: The role of sky conditions on gross primary production in a mixed deciduous forest, Agr. Forest Meteorol., 151, 781–791, https://doi.org/10.1016/j.agrformet.2011.01.005, 2011.
Peng, X., Wei, W., Niu, S., Huang, Y., and Chen, L.: Divergent impact of long-term anthropogenic nitrogen inputs on global particulate and mineral-associated organic carbon, Ecol. Process., 14, https://doi.org/10.1186/s13717-025-00624-x, 2025.
Peters, W., Jacobson, A. R., Sweeney, C., Andrews, A. E., Conway, T. J., Masarie, K., Miller, J. B., Bruhwiler, L. M. P., Petron, G., Hirsch, A. I., Worthy, D. E. J., van der Werf, G. R., Randerson, J. T., Wennberg, P. O., Krol, M. C., and Tans, P. P.: An atmospheric perspective on North American carbon dioxide exchange: CarbonTracker, P. Natl. Acad. Sci. USA, 104, 18925–18930, https://doi.org/10.1073/pnas.0708986104, 2007.
Piao, S., Sitch, S., Ciais, P., Friedlingstein, P., Peylin, P., Wang, X., Ahlstrom, A., Anav, A., Canadell, J. G., Cong, N., Huntingford, C., Jung, M., Levis, S., Levy, P. E., Li, J., Lin, X., Lomas, M. R., Lu, M., Luo, Y., Ma, Y., Myneni, R. B., Poulter, B., Sun, Z., Wang, T., Viovy, N., Zaehle, S., and Zeng, N.: Evaluation of terrestrial carbon cycle models for their response to climate variability and to CO2 trends, Glob. Change Biol., 19, 2117–2132, https://doi.org/10.1111/gcb.12187, 2013.
Piao, S., He, Y., Wang, X., and Chen, F.: Estimation of China's terrestrial ecosystem carbon sink: Methods, progress and prospects, Sci. China Earth Sci., 65, 641–651, https://doi.org/10.1007/s11430-021-9892-6, 2022.
Platnick, S., King, M., and Hubanks, P.: MOD08_M3 – MODIS/Terra Aerosol Cloud Water Vapor Ozone Monthly L3 Global 1Deg CMG, NASA MODIS Adaptive Processing System, Goddard Space Flight Center, USA [data set], https://doi.org/10.5067/MODIS/MOD08_M3.061, 2015.
Post, E., Steinman, B. A., and Mann, M. E.: Acceleration of phenological advance and warming with latitude over the past century, Sci. Rep., 8, 3927, https://doi.org/10.1038/s41598-018-22258-0, 2018.
Ren, W., Tian, H. Q., Tao, B., Huang, Y., and Pan, S. F.: China's crop productivity and soil carbon storage as influenced by multifactor global change, Glob. Change Biol., 18, 2945–2957, https://doi.org/10.1111/j.1365-2486.2012.02741.x, 2012.
Ren, W., Banger, K., Tao, B., Yang, J., Huang, Y., and Tian, H.: Global pattern and change of cropland soil organic carbon during 1901–2010: Roles of climate, atmospheric chemistry, land use and management, Geography and Sustainability, 1, 59-69, https://doi.org/10.1016/j.geosus.2020.03.001, 2020.
Running, S., Mu, Q., and Zhao, M.: MOD17A2H MODIS/Terra Gross Primary Productivity 8-Day L4 Global 500m SIN Grid V006, NASA EOSDIS Land Processes Distributed Active Archive Center [data set], https://doi.org/10.5067/MODIS/MOD17A2H.006, 2015.
Shalaby, A., Zakey, A. S., Tawfik, A. B., Solmon, F., Giorgi, F., Stordal, F., Sillman, S., Zaveri, R. A., and Steiner, A. L.: Implementation and evaluation of online gas-phase chemistry within a regional climate model (RegCM-CHEM4), Geosci. Model Dev., 5, 741–760, https://doi.org/10.5194/gmd-5-741-2012, 2012.
Shang, F., Liu, M. X., Song, Y., Lu, X. J., Zhang, Q., Matsui, H., Liu, L. L., Ding, A. J., Huang, X., Liu, X. J., Cao, J. J., Wang, Z. F., Dai, Y. J., Kang, L., Cai, X. H., Zhang, H. S., and Zhu, T.: Substantial nitrogen abatement accompanying decarbonization suppresses terrestrial carbon sinks in China, Nat. Commun., 15, https://doi.org/10.1038/s41467-024-52152-5, 2024.
Shu, Y., Liu, S., Wang, Z., Xiao, J., Shi, Y., Peng, X., Gao, H., Wang, Y., Yuan, W., Yan, W., Ning, Y., and Li, Q.: Effects of Aerosols on Gross Primary Production from Ecosystems to the Globe, Remote Sens., 14, https://doi.org/10.3390/rs14122759, 2022.
Sitch, S., Cox, P. M., Collins, W. J., and Huntingford, C.: Indirect radiative forcing of climate change through ozone effects on the land-carbon sink, Nature, 448, 791–794, https://doi.org/10.1038/nature06059, 2007.
Strada, S. and Unger, N.: Potential sensitivity of photosynthesis and isoprene emission to direct radiative effects of atmospheric aerosol pollution, Atmos. Chem. Phys., 16, 4213–4234, https://doi.org/10.5194/acp-16-4213-2016, 2016.
Tang, M., Huang, X., Lu, K., Ge, M., Li, Y., Cheng, P., Zhu, T., Ding, A., Zhang, Y., Gligorovski, S., Song, W., Ding, X., Bi, X., and Wang, X.: Heterogeneous reactions of mineral dust aerosol: implications for tropospheric oxidation capacity, Atmos. Chem. Phys., 17, 11727–11777, https://doi.org/10.5194/acp-17-11727-2017, 2017.
Tu, M., Liu, Z., He, C., Fang, Z., and Lu, W.: The relationships between urban landscape patterns and fine particulate pollution in China: A multiscale investigation using a geographically weighted regression model, J. Clean. Prod., 237, https://doi.org/10.1016/j.jclepro.2019.117744, 2019.
Unger, N., Yue, X., and Harper, K. L.: Aerosol climate change effects on land ecosystem services, Faraday Discuss., 200, 121–142, https://doi.org/10.1039/c7fd00033b, 2017.
Unger, N., Zheng, Y., Yue, X., and Harper, K. L.: Mitigation of ozone damage to the world's land ecosystems by source sector, Nat. Clim. Change, 10, 134–137, https://doi.org/10.1038/s41558-019-0678-3, 2020.
Wang, J., Dong, J., Yi, Y., Lu, G., Oyler, J., Smith, W. K., Zhao, M., Liu, J., and Running, S.: Decreasing net primary production due to drought and slight decreases in solar radiation in China from 2000 to 2012, J. Geophys. Res.-Biogeosci., 122, 261–278, https://doi.org/10.1002/2016jg003417, 2017.
Wang, K., Zhang, Y., Yahya, K., Wu, S. Y., and Grell, G.: Implementation and initial application of new chemistry-aerosol options in WRF/Chem for simulating secondary organic aerosols and aerosol indirect effects for regional air quality, Atmos. Environ., 115, 716–732, https://doi.org/10.1016/j.atmosenv.2014.12.007, 2015.
Wang, X., Wu, J., Chen, M., Xu, X., Wang, Z., Wang, B., Wang, C., Piao, S., Lin, W., Miao, G., Deng, M., Qiao, C., Wang, J., Xu, S., and Liu, L.: Field evidences for the positive effects of aerosols on tree growth, Glob. Change Biol., 24, 4983–4992, https://doi.org/10.1111/gcb.14339, 2018.
Wang, Y., Ni, J., Xu, K., Zhang, H., Gong, X., and He, C.: Intricate synergistic effects between air pollution and carbon emission: An emerging evidence from China, Environ. Pollut., 349, https://doi.org/10.1016/j.envpol.2024.123851, 2024.
Wittig, V. E., Ainsworth, E. A., and Long, S. P.: To what extent do current and projected increases in surface ozone affect photosynthesis and stomatal conductance of trees? A meta-analytic review of the last 3 decades of experiments, Plant Cell Environ., 30, 1150–1162, https://doi.org/10.1111/j.1365-3040.2007.01717.x, 2007.
Xia, J., Xia, X., Wang, X., Ju, W., Lin, Z., Qin, Z., Sang, Y., Yan, Y., Yuan, W., Yue, X., Zhang, H., Zhou, H., and Zhu, Q.: China Land Carbon Budget (CLCB1.0): a comprehensive estimate of the land carbon budget in China, Natl. Sci. Rev., 12, https://doi.org/10.1093/nsr/nwaf052, 2025.
Xie, N., Wang, T., Xie, X., Yue, X., Giorgi, F., Zhang, Q., Ma, D., Song, R., Xu, B., Li, S., Zhuang, B., Li, M., Xie, M., Andreeva Kilifarska, N., Gadzhev, G., and Dimitrova, R.: The regional climate–chemistry–ecology coupling model RegCM-Chem (v4.6)–YIBs (v1.0): development and application, Geosci. Model Dev., 17, 3259–3277, https://doi.org/10.5194/gmd-17-3259-2024, 2024.
Xie, N. H., Wang, T. J., Xie, M., Ma, D. Y., Zhang, Q., Li, M. M., Li, S., Zhuang, B. L., Kalsoom, U., Kilifarska, N. A., Gadzhev, G., Dimitrova, R., Melas, D., and Karatzas, K.: Carbon Sink of Terrestrial Ecosystems in China During 2010–2020: Spatiotemporal Variability and Climate Impact, J. Geophys. Res.-Atmos., 130, https://doi.org/10.1029/2025jd043405, 2025.
Xie, X., Wang, T., Yue, X., Li, S., Zhuang, B., and Wang, M.: Effects of atmospheric aerosols on terrestrial carbon fluxes and CO2 concentrations in China, Atmos. Res., 237, https://doi.org/10.1016/j.atmosres.2020.104859, 2020.
Xie, X. D., Wang, T. J., Yue, X., Li, S., Zhuang, B. L., Wang, M. H., and Yang, X. Q.: Numerical modeling of ozone damage to plants and its effects on atmospheric CO2 in China, Atmos. Environ., 217, 116970, https://doi.org/10.1016/j.atmosenv.2019.116970, 2019.
Xue, T., Liu, J., Zhang, Q., Geng, G., Zheng, Y., Tong, D., Liu, Z., Guan, D., Bo, Y., Zhu, T., He, K., and Hao, J.: Rapid improvement of PM2.5 pollution and associated health benefits in China during 2013–2017, Sci. China-Earth Sci., 62, 1847–1856, https://doi.org/10.1007/s11430-018-9348-2, 2019.
Yan, S., Zhu, B., Shi, S., Lu, W., Gao, J., Kang, H., and Liu, D.: Impact of aerosol optics on vertical distribution of ozone in autumn over Yangtze River Delta, Atmos. Chem. Phys., 23, 5177–5190, https://doi.org/10.5194/acp-23-5177-2023, 2023.
Yang, H., Chen, L., Liao, H., Zhu, J., Wang, W., and Li, X.: Impacts of aerosol–photolysis interaction and aerosol–radiation feedback on surface-layer ozone in North China during multi-pollutant air pollution episodes, Atmos. Chem. Phys., 22, 4101–4116, https://doi.org/10.5194/acp-22-4101-2022, 2022.
Yu, G., Jia, Y., He, N., Zhu, J., Chen, Z., Wang, Q., Piao, S., Liu, X., He, H., Guo, X., Wen, Z., Li, P., Ding, G., and Goulding, K.: Stabilization of atmospheric nitrogen deposition in China over the past decade, Nat. Geosci. 12, 424–429, https://doi.org/10.1038/s41561-019-0352-4, 2019.
Yuan, X., Chen, X., Ochege, F. U., Hamdi, R., Tabari, H., Li, B., He, B., Zhang, C., De Maeyer, P., and Luo, G.: Weakening of global terrestrial carbon sequestration capacity under increasing intensity of warm extremes, Nat. Ecol. Evol., 9, https://doi.org/10.1038/s41559-024-02576-5, 2025.
Yue, H., He, C., Huang, Q., Yin, D., and Bryan, B. A.: Stronger policy required to substantially reduce deaths from PM2.5 pollution in China, Nat. Commun., 11, https://doi.org/10.1038/s41467-020-15319-4, 2020.
Yue, K., Peng, Y., Peng, C., Yang, W., Peng, X., and Wu, F.: Stimulation of terrestrial ecosystem carbon storage by nitrogen addition: a meta-analysis, Sci. Rep., 6, https://doi.org/10.1038/srep19895, 2016.
Yue, X. and Unger, N.: The Yale Interactive terrestrial Biosphere model version 1.0: description, evaluation and implementation into NASA GISS ModelE2, Geosci. Model Dev., 8, 2399–2417, https://doi.org/10.5194/gmd-8-2399-2015, 2015.
Yue, X. and Unger, N.: Aerosol optical depth thresholds as a tool to assess diffuse radiation fertilization of the land carbon uptake in China, Atmos. Chem. Phys., 17, 1329–1342, https://doi.org/10.5194/acp-17-1329-2017, 2017.
Yue, X., Unger, N., Harper, K., Xia, X., Liao, H., Zhu, T., Xiao, J., Feng, Z., and Li, J.: Ozone and haze pollution weakens net primary productivity in China, Atmos. Chem. Phys., 17, 6073–6089, https://doi.org/10.5194/acp-17-6073-2017, 2017.
Yue, X., Zhang, T., and Shao, C.: Afforestation increases ecosystem productivity and carbon storage in China during the 2000s, Agr. Forest Meteorol., 296, 108227, https://doi.org/10.1016/j.agrformet.2020.108227, 2021.
Zhang, F. M., Chen, J. M., Chen, J. Q., Gough, C. M., Martin, T. A., and Dragoni, D.: Evaluating spatial and temporal patterns of MODIS GPP over the conterminous US against flux measurements and a process model, Remote Sens. Environ., 124, 717–729, https://doi.org/10.1016/j.rse.2012.06.023, 2012.
Zhang, Q., Wang, T. J., Wu, H., Qu, Y. W., Xie, M., Li, S., Zhuang, B. L., Li, M. M., and Kilifarska, N. A.: Radiative and Chemical Effects of Non-Homogeneous Methane on Terrestrial Carbon Fluxes in Asia, J. Geophys. Res.-Atmos., 129, https://doi.org/10.1029/2023jd040204, 2024.
Zhang, Q., Wang, T., Zhang, Z., Xu, X., Xie, N., Zhuang, B., Li, S., Gao, L., Li, M., and Xie, M.: Methane Emissions in Asian Wetlands During 2010–2020: Insights From an Online-Coupled Microbial Functional-Group-Based Model, Earth's Future, 13, https://doi.org/10.1029/2025ef005991, 2025.
Zhang, W. W., Wang, M., Wang, A. Y., Yin, X. H., Feng, Z. Z., and Hao, G. Y.: Elevated ozone concentration decreases whole-plant hydraulic conductance and disturbs water use regulation in soybean plants, Physiol. Plantarum, 163, 183–195, https://doi.org/10.1111/ppl.12673, 2018.
Zheng, B., Tong, D., Li, M., Liu, F., Hong, C., Geng, G., Li, H., Li, X., Peng, L., Qi, J., Yan, L., Zhang, Y., Zhao, H., Zheng, Y., He, K., and Zhang, Q.: Trends in China's anthropogenic emissions since 2010 as the consequence of clean air actions, Atmos. Chem. Phys., 18, 14095–14111, https://doi.org/10.5194/acp-18-14095-2018, 2018.
Zhou, H., Yue, X., Lei, Y., Tian, C., Ma, Y., and Cao, Y.: Aerosol radiative and climatic effects on ecosystem productivity and evapotranspiration, Current Opinion in Environmental Science & Health, 19, https://doi.org/10.1016/j.coesh.2020.10.006, 2021.
Zhou, H., Yue, X., Lei, Y., Tian, C., Zhu, J., Ma, Y., Cao, Y., Yin, X., and Zhang, Z.: Distinguishing the impacts of natural and anthropogenic aerosols on global gross primary productivity through diffuse fertilization effect, Atmos. Chem. Phys., 22, 693–709, https://doi.org/10.5194/acp-22-693-2022, 2022.
Zhou, H., Yue, X., Dai, H., Geng, G., Yuan, W., Chen, J., Shen, G., Zhang, T., Zhu, J., and Liao, H.: Recovery of ecosystem productivity in China due to the Clean Air Action plan, Nat. Geosci., 17, https://doi.org/10.1038/s41561-024-01586-z, 2024.
Zhu, J. X., Jia, Y. L., Yu, G. R., Wang, Q. F., He, N. P., Chen, Z., He, H. L., Zhu, X. J., Li, P., Zhang, F. S., Liu, X. J., Goulding, K., Fowler, D., and Vitousek, P.: Changing patterns of global nitrogen deposition driven by socio-economic development, Nat. Commun., 16, https://doi.org/10.1038/s41467-024-55606-y, 2025.