the Creative Commons Attribution 4.0 License.
the Creative Commons Attribution 4.0 License.
 | 30 Apr 2026
A dipole pattern of orbital-scale precipitation oxygen isotope variation in North African monsoon region and the driving mechanism
Chengwei Ji
Zhengyu Liu
Deliang Chen
Liang Ning
Qiuzhen Yin
On orbital timescales, the North African (NAF) monsoon variability is featured by dramatic fluctuations between wet and dry periods, which have played a significant role in early human migration and the development of agricultural civilizations. However, the spatial patterns of hydroclimate response, particularly changes in rainfall and precipitation oxygen isotopes (δ18Op) remain poorly constrained due to the scarcity of proxy records. Here, we use the isotope-enabled Community Earth System Model (iCESM) to investigate the spatial-temporal variations of both rainfall and δ18Op across the NAF region (15° W–35° E, 8° N–25° N) on orbital timescales. Our analysis shows that both δ18Op and rainfall exhibit a clear precessional signal. Enhanced Northern Hemisphere summer insolation (NHSI) intensifies land-sea thermal contrast, thereby strengthening monsoon circulation and leading to widespread increases in monsoon rainfall. In contrast, δ18Op presents a spatially dipole pattern, with depletion in the southern NAF (15° W–35° E, 8° N–17° N) and enrichment in the northern part (15° W–35° E, 17° N–25° N). Tagging experiments further reveal that the depletion in the south is primarily driven by en route depletion resulting from rainout process along air mass trajectories over the African continent, whereas enrichment in the north results from shifts in moisture sources, with a reduced contribution from distant sources and an increased influence of local sources. This work advances our understanding of past hydroclimate variability in the NAF region, while also highlighting the challenges associated with reconstructing past variations in the distribution of δ18Op based on discrete site data.
- Article
(9665 KB) - Full-text XML
- BibTeX
- EndNote


The North African (NAF) monsoon region (15° W–35° E, 8° N–25° N) is one of the most vulnerable hotspots under climate change (Lézine et al., 2011). Monsoon variability in this region exerts substantial environmental and socioeconomic effects, particularly across Sahelian countries where economies rely heavily on rainfed agriculture (Sultan et al., 2005; Sultan and Gaetani, 2016). On orbital timescales, the NAF region is highly sensitive to orbital forcing and has experienced dramatic fluctuations between wet and dry periods (deMenocal, 2004; deMenocal and Tierney, 2012; Ehrmann et al., 2017; Kutzbach et al., 2020). These changes not only drive the early human migration to the Nile Basin and the rise of agricultural civilization (McDougall et al., 2005; Vaks et al., 2007; Kutzbach et al., 2020), but also have profound impacts on Asian monsoon, ENSO activity, and even the polar ice sheets through atmospheric teleconnections (Muschitiello et al., 2015; Pausata et al., 2020). Given the important role of NAF monsoon in the global climate change, a clear understanding of its past evolution is critical for improving predictions of its future behavior.
Numerous modeling studies have been conducted extensively to investigate the NAF monsoon variability on orbital timescales. For example, Kutzbach and Liu (1997) conducted Mid-Holocene (6 ka BP) simulations with a general circulation model that asynchronously couples the atmosphere and the ocean. Their simulations show that increased insolation induces an intensified land-sea thermal contrast and enhanced summer monsoon rainfall. Similarly, Tuenter et al. (2003) used an Earth system model of intermediate complexity (ECBilt) to analyze orbital-scale signals over Africa. They demonstrated that a stronger and more northward monsoon over NAF occurs at times of minimum precession or maximum obliquity, when boreal summer insolation is high. This rainfall enhancement was attributed to a stronger land-sea thermal contrast, intensified low-level monsoonal circulation, and increased moisture transport. Similar results were also found in Bosmans et al. (2015) using the EC-Earth model. To further explore the evolution of the NAF monsoon, Kutzbach et al. (2020) performed transient simulations covering the past 140 000 years using a dynamic atmosphere-ocean general circulation model with higher resolution. Their simulations showed that orbital precession causes high seasonality in Northern Hemisphere (NH) insolation, with stronger and northward extended summer monsoon rainfall and increased winter rains in the Mediterranean Basin. These combined effects increased vegetation and narrowed the width of the Saharan-Arabian desert. Overall, the NAF monsoon rainfall has been extensively studied.
In contrast, the precipitation oxygen isotope (δ18Op) has received comparatively less attention, largely because earlier models lacked coupled water isotope modules. Given that most proxy reconstructions are made using measurements of isotopic ratios in natural archives such as ice cores, speleothems and corals (Wang et al., 2001; Bar-Matthews et al., 2003; Cruz et al., 2005; Cheng et al., 2013), a more comprehensive understanding of the controls on isotope ratios is critical in paleoclimate research. In the context of North Africa, past hydrological variations have been inferred from δ18O signal of speleothem calcite (δ18Oc) from caves in Israel (Bar-Matthews et al., 2003). The δ18Oc in Israel serves as an indicator of past NAF monsoon variability, as wet or dry conditions in the NAF region are propagated to the Mediterranean Sea through Nile River and subsequently influence the isotopic composition of cave carbonates in Israel. This δ18Oc shows a strong precessional signal, with the enhanced Northern Hemisphere summer insolation (NHSI) corresponding to a depleted δ18O value, indicating an enhanced NAF rainfall (Bar-Matthews et al., 2003; Brahim et al., 2023). This is consistent with other moisture-related proxies from lakes (Kohfeld and Harrison, 2000; Armitage et al., 2015), terrigenous sediment (deMenocal et al., 2000; Revel et al., 2010; Ehrmann et al., 2016; Skonieczny et al., 2019; Blanchet et al., 2021), and pollen (Lézine et al., 2005; Fersi et al., 2016), showing that a higher NHSI corresponds to stronger NAF rainfall. Therefore, a major feature of the isotopic composition of precipitation in NAF region is the anticorrelation between the amount of precipitation and the proportion of heavier isotopes in the precipitation, called the “amount effect” (Dansgaard, 1964).
However, it is still unclear whether the NAF δ18Oc signal responds primarily to changes in local rainfall or is controlled by other factors. This question arises because a growing number of studies have shown that many factors other than local rainfall amount can affect δ18Op, including changes in the relative contribution of moisture sources (Cole et al., 1999; Vuille et al., 2003), isotope composition during convective activity such as sub-cloud evaporation and diffusive exchanges between raindrops and the surrounding vapor (Lee and Fung, 2007; Risi et al., 2008; Kurita, 2013; Moore et al., 2014), and upstream rainfall effects (Lee et al., 2009; Pausata et al., 2011; Liu et al., 2014; Shi et al., 2025). These factors may contribute to isotope variations, thereby complicating the interpretation of isotope data in paleoclimate.
Over the past few decades, isotope-enabled models have evolved as valuable and well-established tools for improving our understanding of the relationship between water isotopes and climate variables. However, there are still controversies regarding the spatial patterns of δ18Op and its forcing mechanisms over the NAF region. Herold and Lohmann (2009), using an isotope-enabled General Circulation Model (ECHAM4), identified a dipole pattern in δ18Op across NAF, characterized by enrichment in the west and depletion in the east. They attributed western enrichment to reduced upstream rainfall depletion from Atlantic, and eastern depletion to increased local rainfall and enhanced moisture transport from the Atlantic. A similar dipole structure was later reported by Battisti et al. (2014) using the same model. Nonetheless, this west-east dipole structure has been challenged by subsequent studies showing a spatially coherent depletion pattern across the NAF region. For example, Cauquoin et al. (2019) have demonstrated a clear “amount effect” across the NAF monsoon region, with significant δ18Op depletion coinciding with increased monsoon rainfall. This finding is further supported by Shi et al. (2023). More recently, Shi et al. (2025) examined both spatial and temporal variations in rainfall and δ18Op based on 24 time-slice experiments spanning a full precession cycle. Their results reveal widespread δ18Op depletion throughout North Africa, but also identify a positive temporal δ18Op-rainfall relationship in certain inland areas, contrast to the classical “amount effect”. In these regions, the authors propose that δ18Op variability is influenced mainly by rainfall changes in upstream areas rather than local rainfall. Therefore, despite growing efforts to simulate δ18Op, spatial distribution and interpretations remain inconsistent across different modeling studies.
In this study, we use the isotope-enabled fully coupled Community Earth System Model (iCESM; Brady et al., 2019) developed by the National Center for Atmospheric Research (NCAR) to perform transient simulations for the past 150 000 years. In addition, we perform moisture tagging experiments to track moisture sources for precipitation and to investigate the corresponding δ18Op response. We aim to answer the following central questions: How do monsoon rainfall and δ18Op respond to insolation on orbital timescales in NAF region? Do they exhibit spatially coherent patterns? And what is the climatic significance of δ18Op in NAF region? The paper is arranged as follows. Section 2 describes the Data and methods; Sect. 3 presents the Data-model comparison; Sects. 4 and 5 discuss the mechanisms underlying rainfall and δ18Op changes, respectively; and Sect. 6 provides the Conclusions.
2.1 The 150 000-year simulation
In this study, the isotope-enabled Community Earth System Model (iCESM) is employed, which has active atmosphere, land, ocean, river transport, and sea ice component models linked through a coupler (Brady et al., 2019). We use the version 1.3 of iCESM, with a resolution of f19_g16. The atmosphere component model is the CAM5.3, which has a horizontal resolution of 1.9° × 2.5° (latitude × longitude) and 30 hybrid vertical levels (Neale et al., 2010). The land component is the CLM4, which shares the same horizontal grid as the atmosphere model (Oleson et al., 2010). The ocean and sea ice components are the POP2 and CICE4. POP2 and CICE4 here use a common grid of 320 × 384, a displaced-pole grid with poles in Greenland and Antarctica, and a nominal 1° resolution with enhancement near the equator and in the North Atlantic. The POP2 has 60 vertical layers (Smith et al., 2010; Hunke, 2010). Water isotope ratios, and the associated fluxes and isotopic fractionations, are tracked in all of the components of the hydrologic cycle: atmospheric water vapor and clouds, soil moisture and other land surface water pools, oceans, and sea ice. The iCESM has been successfully applied in multi-scale climate studies to investigate mechanisms linking the hydrological cycle and isotopic signals (Tabor et al., 2018; Hu et al., 2019; He et al., 2021; Bao et al., 2023; Wen et al., 2024). It has been shown to adequately capture key features of δ18Op, albeit with a weaker amplitude compared to observations (Brady et al., 2019; Nusbaumer et al., 2017; Wen et al., 2024).
We conduct a 150 000-year transient simulation that is driven solely by variations in Earth's orbital parameters (i.e., precession, obliquity, and eccentricity; Berger, 1978). All other boundary conditions, such as greenhouse gas concentrations, ice sheet extent, and vegetation distribution, are held constant at pre-industrial levels (Wen et al., 2024). Although the ignorance of vegetation and dust feedbacks over the NAF region tends to suppress the magnitude of changes in rainfall and δ18Op values (Waldmann et al., 2010; Pausata et al., 2016; Tierney et al., 2017a; Messori et al., 2019; Tabor et al., 2020), the orbital-forcing experiment still captures the dominant precessional signal and the overall phase of regional climate change (Pokras and Mix, 1987; Patricola and Cook, 2007; Weber and Tuenter, 2011; Roe et al., 2016; Cheng et al., 2020). This is sufficient for the purpose of this study.
The experiment starts 170 000 years ago with the last 150 000 years used for analysis. Due to the limitation of computational resources, the experiment is accelerated by 100-time to improve efficiency. That is, at the end of each year's simulation, we advance the orbital parameters by 100 years, so the actual length of our simulation is 1500 years. This acceleration scheme is suitable for the monsoon analysis, given that the response time of the atmosphere-upper ocean system is much faster than the shortest orbital cycle (Kutzbach et al., 2008; Wen et al., 2024). The previous analysis shows that the acceleration method leads to a delayed response only in the deep-ocean temperature, but has little impact on the near-surface quantities like temperature and precipitation (Lorenz and Lohmann, 2004; Timm and Timmermann, 2007; Yin and Berger, 2015). Since this study focuses on surface ocean-atmospheric conditions, the 100-factor acceleration scheme would not affect the conclusions regarding the NAF region.
2.2 Calculation of water isotopes from iCESM simulation
Since the observed speleothem isotope records reflect the combined influence of moisture from all seasons, the annual δ18Op are calculated using the precipitation-weighted δ18O from 12 months following the previous works (Tabor et al., 2018; He et al., 2021):
where m denotes the calendar month, Pm and δ18Om represent the precipitation and δ18O in precipitation from the mth month output by the model, respectively. P is the annual total precipitation.
In order to directly compare our simulations with the observed calcite speleothem records of δ18Oc, we need to get simulated δ18Oc from the simulated δ18Op. First, we need to convert the simulated δ18Op from the V-SMOW scale (Vienna-Standard Mean Ocean Water; δ18Op−SMOW) to the PDB scale (Pee Dee Belemnite; δ18Op−PDB) following Coplen et al. (1983):
Then, we get the simulated δ18Oc following O'Neil et al. (1969):
where T represents the absolute cave temperature. Since this temperature approximately equals the annual mean surface air temperature at the cave site (Fairchild et al., 2012), the model annual mean surface air temperature from the corresponding model grid is used for calculation.
2.3 Tagging experiments
In order to quantify the changes in moisture sources of δ18Op in the NAF monsoon region between high and low NHSI periods, two water tagging experiments are carried out at the times of 127 ka (high NHSI periods) and 116 ka (low NHSI periods) using the atmospheric model iCAM5.3. These two time slices correspond to the period of greatest changes in solar insolation across the past 150 000 years. The external forcing in both tagging experiments is based on the orbital parameters specific to their respective periods. The boundary conditions and sea surface isotope ratios are derived from 1000-year climatological mean states corresponding to each period, from the coupled iCESM simulation. The experiments can track water vapor evaporating from the source regions until they follow the hydrological processes in the model to the region where they rain out (sink region). Following Wen et al. (2024), the global source regions have been divided into 25 subregions, with 13 covering the ocean and the rest covering the land (see Fig. A1 in the Appendix). Each tagging experiment is run for 40 years, with the last 20 years used for analysis.
Here, the original 25 source regions are grouped into five broader regions for simplicity (Fig. A1): the African continent (AFR), the South Atlantic Ocean (EQA+SSA), the Indian Ocean (EQI+SSI), the North Atlantic Ocean (NNA+SNA), and the rest of the globe. This regrouping is based on their proximity to the NAF region and their relevance as primary contributors to precipitation patterns over NAF region. For the mean climate state, the African continent, the South Atlantic, the Indian Ocean, and the North Atlantic contribute approximately 39.5 %, 22.5 %, 16 %, and 15 % to NAF rainfall, respectively (Table A1). Collectively, these four regions account for 93 % of the total NAF rainfall. Thus, the rainfall and δ18Op at a grid point are the sums from all five source regions:
where Pi and δ18Oi represent the rainfall and δ18Op from the ith tagging source region, respectively.
2.4 Decomposition of δ18Op
The response of δ18Op between high and low NHSI periods, Δδ18Op=Δδ18Op_high − Δδ18Op_low, can be decomposed in two steps. In the first step, Δδ18Op is decomposed into two terms: the response induced by the changes in precipitation weight and the response induced by the changes in isotope ratio Δδ18Opi:
The term in left-hand side is plotted in Fig. 7b, and two terms in right-hand side of Eq. (5) are plotted in Fig. 8a and d.
In the second step, the Δδ18Opi can be further decomposed into three terms following Tabor et al. (2018) in Eq. (6). The first term denotes the changes in vapor δ18Oi in the source region, which is produced by the net effect of local rainfall and evaporation at the source region. The second term denotes the changes in en route depletion of vapor δ18Oi due to rainout along its trajectory from the source region to the sink region. The third term denotes the changes in local condensation enrichment due to the transition from vapor to rainfall in the sink region, along with any post-condensation processes such as rain evaporation. These terms are written as follows:
The three processes are displayed in Fig. 8e–g.
2.5 Moist static energy budget
The column-integrated moist static energy (MSE) budget is used to accurately calculate the energy changes in the atmosphere column and to better understand the mechanisms of rainfall changes in the monsoon region. The MSE balance equation is referenced from Hill et al. (2017) and Wen et al. (2022).
where denotes the column integration from the surface Ps to the top of the atmosphere. h represents the MSE: . Fnet is the net energy flux into the atmosphere column, which is calculated as the net radiation flux at the top of atmosphere (TOA) minus the net radiation flux at the surface. The net radiation flux at TOA = net shortwave − net longwave. The net radiation flux at the surface = net shortwave − net longwave − sensible heat − latent heat. Overbars are the monthly mean and primes are the transient eddy. Based on this equation, the vertical advection of MSE () can be inferred from the sum of the net energy flux into the atmosphere column (Fnet), horizontal advection (, and transient eddy activity (). Note that the is very small in the equilibrium state, so we neglect it in the following analysis. The transient eddy term is calculated as a residual from the atmospheric energy budget. The vertical integral of MSE stratification in the troposphere () is mostly negative in pressure coordinate. Therefore, the inferred positive vertical MSE advection () corresponds to ascending vertical motion () and thus the intense precipitation, and vice versa (Chen and Bordoni, 2014).
The iCESM effectively captures the key features of modern NAF climate and δ18Op (Fig. 1). Specifically, a low-level southwesterly flow transports humid air from the equatorial Atlantic to the African continent and converges with dry air from the Sahara, leading to heavy rainfall in the Sahel and its southern areas (Fig. 1a) (Sultan and Janicot, 2003; Rose et al., 2016; Selami et al., 2021; Datti et al., 2025). These features generally align with modern observations (Fig. 1b) and other model simulations (Cook and Vizy, 2019; Shi et al., 2024). The simulated NAF δ18Op shows a more enriched values in the Sahel regions due to their proximity to the moisture source region over the tropical Atlantic Ocean, and more depleted values farther inland, as the air masses undergo repeated condensation and rainfall cycles during their movement toward the continental interior (shading in Fig. 1c) (Shi et al., 2023). This simulated pattern generally agrees with observations from the Global Network of Isotopes in Precipitation (GNIP) (circles in Fig. 1c) and other climate models (Cauquoin et al., 2019; Shi et al., 2023, 2025), although the model exhibits more negative values compared to the GNIP data (Fig. 1d).
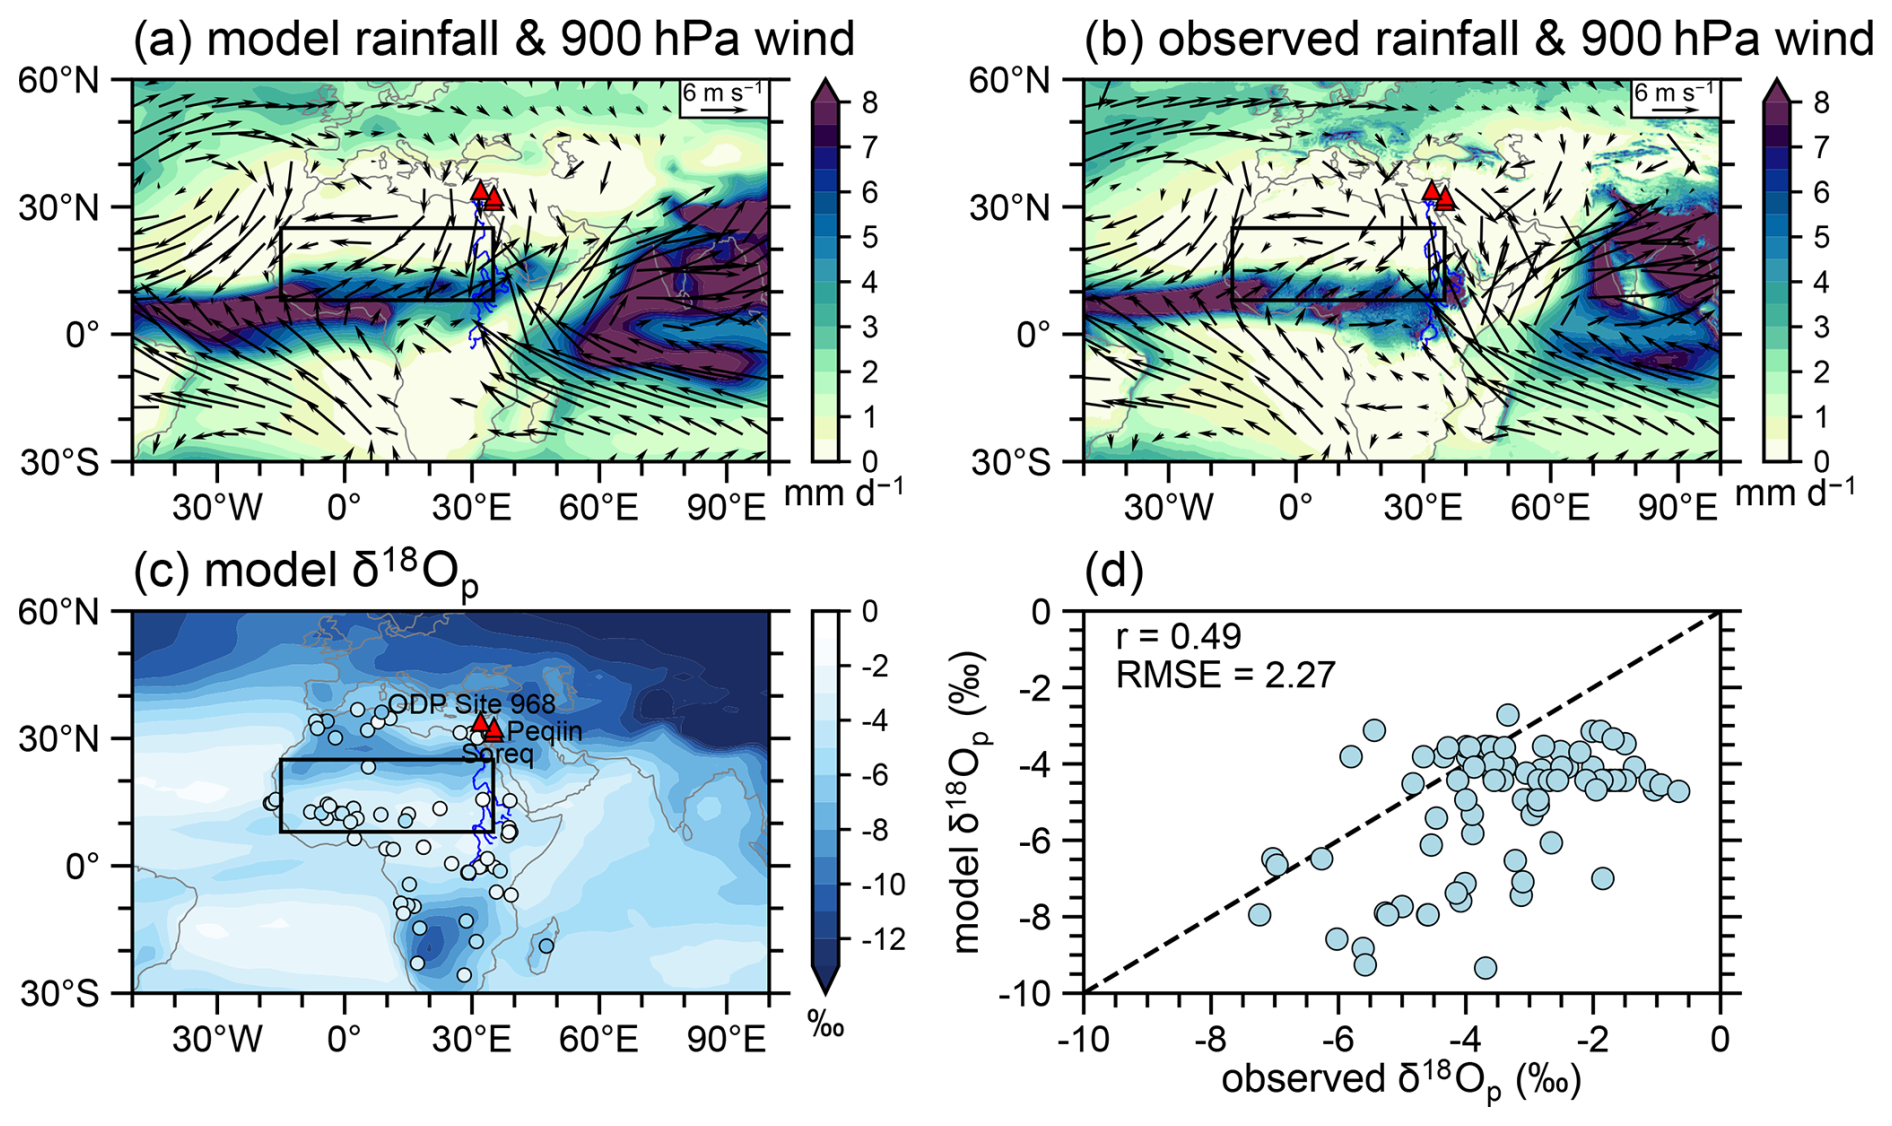
Figure 1Modern climatology of the North Africa (NAF) summer monsoon and δ18Op. (a) Simulated boreal summer (JJA) rainfall (shading; mm d−1) and 900 hPa wind (vector; m s−1). (b) Same as (a) but for observation during 1940–2024 from ERA5 (https://cds.climate.copernicus.eu/, last access: October 2025). (c) Simulated annual precipitation-weighted δ18Op (shading; ‰) and observed δ18Op from GNIP (https://nucleus.iaea.org/wiser/explore/, last access: October 2025) (circle; ‰). (d) Point-to-point scatter plot of observed GNIP δ18Op versus model-simulated δ18Op. The simulated data is averaged over the last 1000 years (1 ka-0) of the transient simulation. In (a)–(c), the black rectangle region (15° W–35° E, 8° N–25° N) is the study area of the NAF monsoon and is used for subsequent regional averaging. The blue curve plots the African Nile River. The red triangles mark the locations of the proxy sites in Fig. 2.
Moreover, our simulations can well reproduce the NAF monsoon evolution during the past 150 000 years (Fig. 2). In this work, the NAF monsoon region is defined as 8° N to 25° N and 15° W to 35° E, which is denoted as black box in Fig. 1 following Wen et al. (2022). The simulated δ18Oc varies in phase with NHSI, exhibiting strong precessional signal (orange line in Fig. 2b). Specifically, higher NHSI corresponds to more depleted δ18Oc values. This is in agreement with observed δ18Oc records from Soreq and Peqiin caves (black and grey lines in Fig. 2b), although the simulated amplitude is smaller than that in the reconstructions. It should be noted that although the Soreq and Peqiin caves are located outside the defined NAF monsoon region, their δ18Oc records primarily reflect hydroclimate changes over the NAF monsoon region. This is because the hydroclimate signal from the NAF monsoon region can be transmited to the Eastern Mediterranean Sea through Nile River discharge, where it is recorded in both seawater δ18O and speleothem δ18Oc (Ayalon et al., 2002; Bar-Matthews et al., 2003; Rohling et al., 2015).
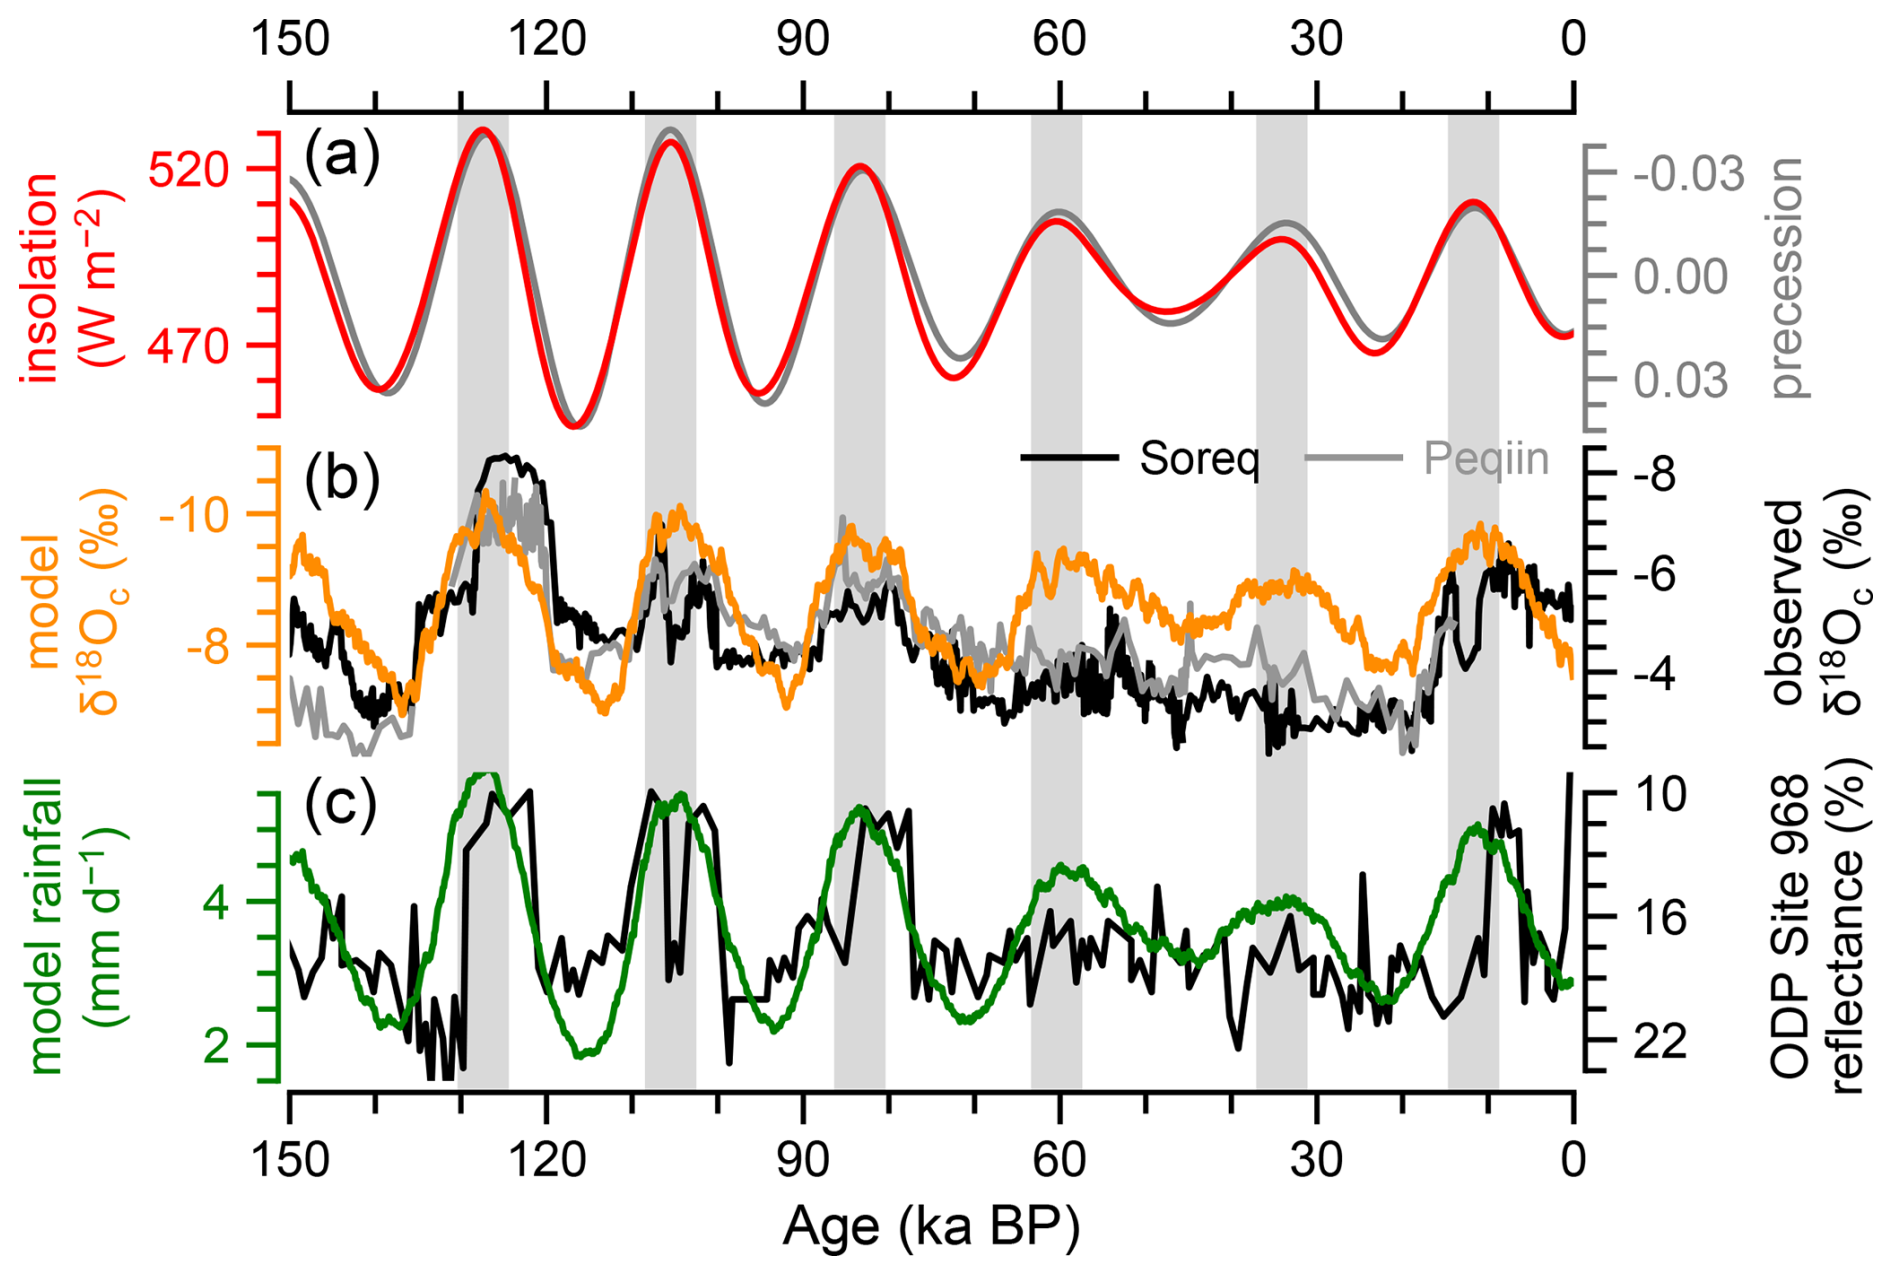
Figure 2Data-model comparison. (a) Northern Hemisphere summer insolation (NHSI) at 30° N (red; W m−2) and Precession parameter (grey; Berger, 1978). (b) Simulated-δ18Oc derived from simulated-δ18Op (see Sect. 2.2 for details) in the NAF region (orange; ‰) and observed δ18Oc records from Soreq Cave (black; ‰) and Peqiin Cave (grey; ‰), Israel (Bar-Matthews et al., 2003). (c) Simulated NAF rainfall (green; mm d−1) and color reflectance (black; %) at 540 nm from ODP Site 968, Mediterranean (Ziegler et al., 2010). The correlation coefficient calculated for simulated-δ18Oc and simulated rainfall is −0.82.
Additionally, our simulations show an increased rainfall when NHSI is high (green line in Fig. 2c), which is consistent with rainfall records from ODP Site 968 (organic-rich layers, i.e., 540 nm reflectance in Fig. 2d; Ziegler et al., 2010). The sapropel layers in this sediment core reflect deep-water anoxia and increased primary productivity, which is mainly related to the increased run-off inputs into the eastern Mediterranean driven by the NAF monsoon-induced continental rainfall (Ziegler et al., 2010; deMenocal and Tierney, 2012; Grant et al., 2016, 2017). The appearance of the sapropel layers corresponds to the intensification of the NAF monsoon rainfall.
Therefore, the high NHSI corresponds to regional averaged lower δ18Oc values and higher rainfall, exhibiting a strong negative correlation between the two variables (; Fig. 2). This relationship is consistent with the “amount effect” in terms of the statistical relationship. Notably, a strong precession cycle is evident in summer insolation at 30° N (Berger and Pestiaux, 1984; Berger et al., 1993), as well as in both rainfall and δ18Oc. These findings point out that the δ18Oc and rainfall variations are highly sensitive to precession-driven insolation changes, emphasizing the importance of precessional forcing in shaping low-latitude climate dynamics.
We further examine the coherent spatial-temporal response of rainfall and water isotope by conducting Multivariate Empirical Orthogonal Function (MVEOF) analysis. Previous studies have shown that the δ18Op plays a dominant role in determining the speleothem δ18Oc (Cheng et al., 2012, 2016; Liu and Battisti, 2015). Therefore, for simplicity, we subsequently use δ18Op for further analyses. The results show that the explained variance of the first MVEOF mode accounts for 35 % of the total variance, with the time coefficient following NHSI and exhibiting a strong precessional signal (Fig. 3a).
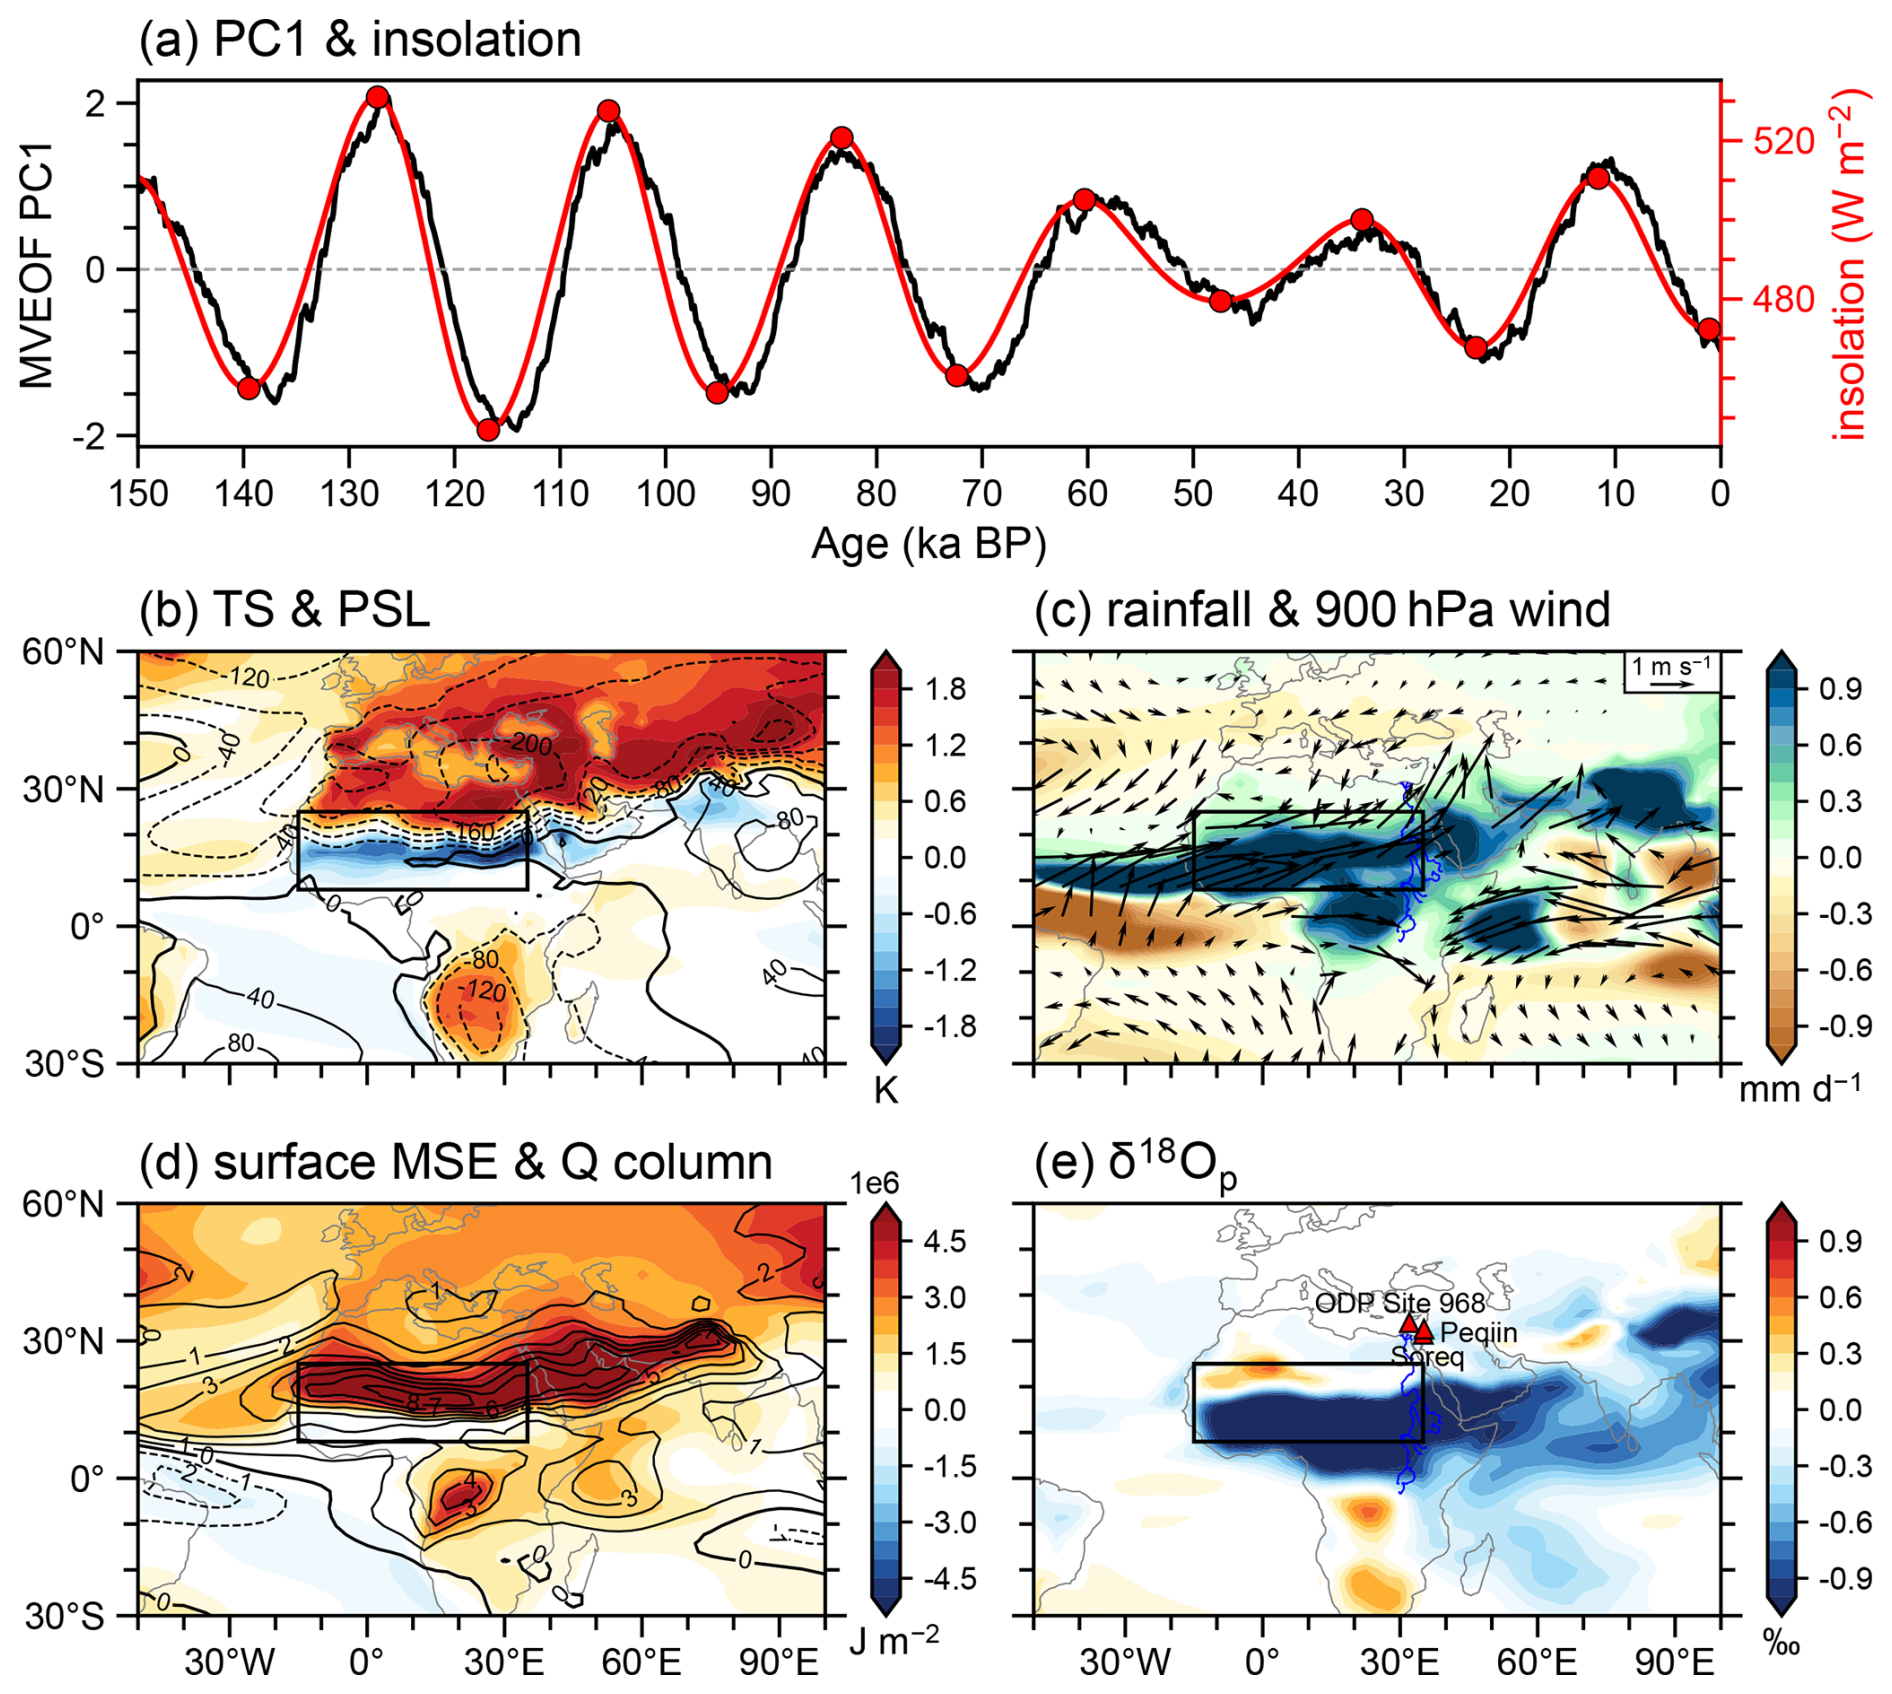
Figure 3The general pattern of δ18Op and NAF summer climate change during the past 150 000 years. (a) Normalized principal component time series (black) of the first MVEOF mode (PC1; explained 35.6 % of the total variance) between summer rainfall and δ18Op and NHSI (red; W m−2). The red circles represent the high and low NHSI periods used in the following composite analysis in Fig. 4 and 5. (b) Surface temperature (shading; K) and sea level pressure (contour; Pa) regressed on the normalized time coefficient of PC1 [black in (a)]. The solid (dashed) contours denote positive (negative) values. (c) As in (b) but for rainfall (shading; mm d−1) and 900 hPa wind (vector; m s−1). (d) As in (b) but for surface moist static energy (MSE) (shading; J m−2) and atmospheric precipitable water (contour; kg m−2). (e) As in (b) but for precipitation-weighted δ18Op (shading; ‰). The black rectangle is the NAF monsoon region.
Spatial analysis reveals that NHSI induces a spatially homogeneous rainfall response across the NAF region (Fig. 3c). Physically, when the NHSI is high, there is a dramatic warming over the Eurasian continent, which triggers the anomalous low-pressure over the continent and enhances the land-sea thermal contrast (Fig. 3b). This strengthens southwesterly winds that transport moisture from the equatorial Atlantic into Africa, resulting in pronounced vapor convergence over the Sahara-Sahel region (Fig. 3c, d). Concurrently, increased surface MSE destabilizes the atmospheric column, promoting upward vertical motion (Patricola and Cook, 2007; Roe et al., 2016). Together, these processes enhance deep convection and significantly increase rainfall across the NAF monsoon region (Fig. 3c). Additionally, the increased cloud formation and rainfall cause a pronounced cooling between 10° N and 20° N, consistent with previous findings (Patricola and Cook, 2007; Herold and Lohmann, 2009; Marzocchi et al., 2015; Wen et al., 2022). Despite this cooling, Patricola and Cook (2007) suggest that elevated low-level moisture content dominates the MSE change, further destabilizing the atmospheric column and reinforcing convection. Thus, although surface temperatures decrease in this latitudinal band (Fig. 3b), MSE continues to rise due to increased humidity, which is sufficient to sustain deep convection (Fig. 3d). A strengthened NAF monsoon also weakens the northeasterly winds over the Sahara (Fig. 3c). This is consistent with the dust records observed in Atlantic sediment cores located offshore at the NAF continent (Skonieczny et al., 2019; O'Mara et al., 2022; Crocker et al., 2022). Furthermore, orbitally forced land warming amplifies the interhemispheric temperature gradient, shifting the ITCZ northward (Schneider et al., 2014; Fig. 4). This shift extends monsoon rainfall farther north and contracts the Saharan arid belt (Fig. 3c).
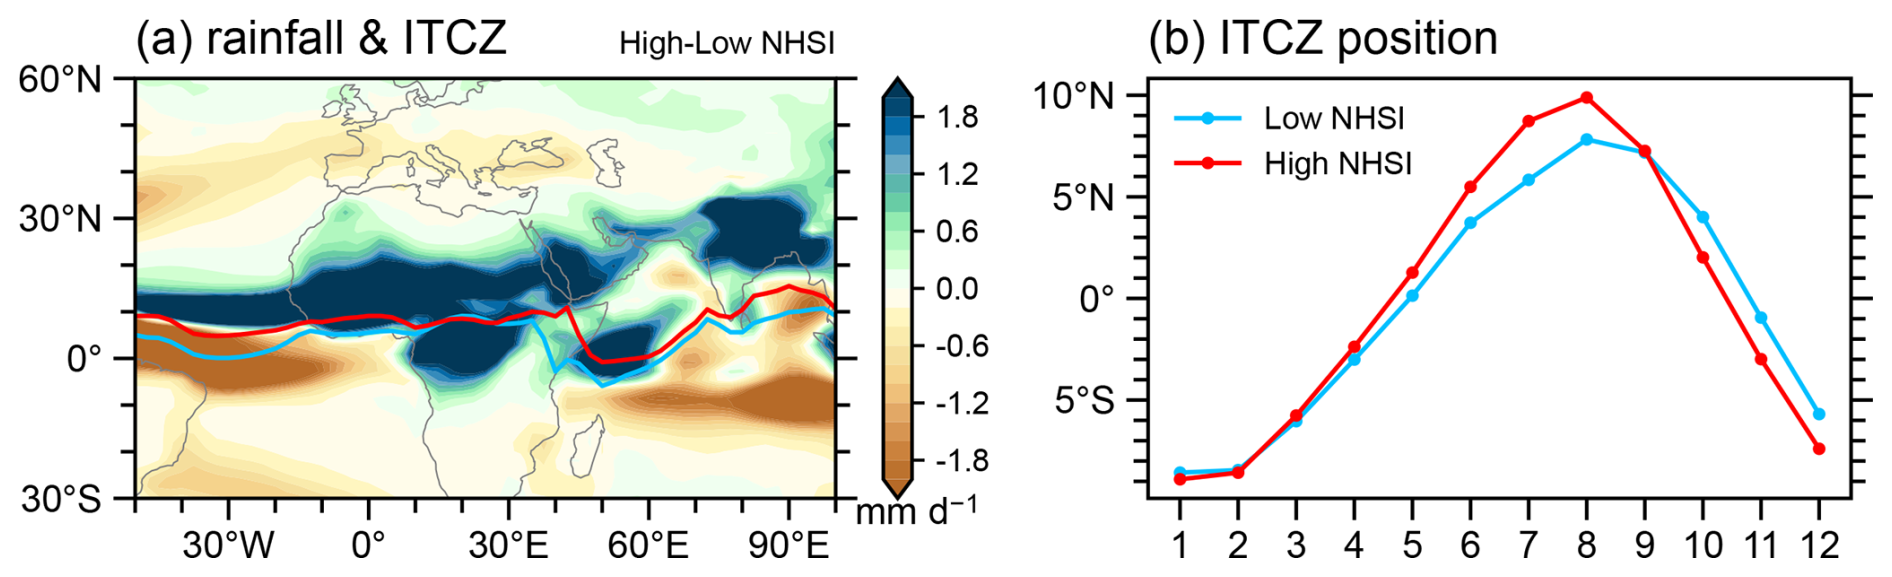
Figure 4Changes in model rainfall and ITCZ position during boreal summer between high and low NHSI periods. (a) Changes in summer rainfall (shading; mm d−1). The contours denote the ITCZ position, which is defined as the latitude of the precipitation centroid between 30° N and 30° S following Voigt et al. (2016). The red contour is for high NHSI periods, and the blue contour is for low NHSI periods. (b) Seasonal latitudinal shifts of the area-averaged ITCZ position over the longitude range of 15° W–35° E. Compared to the low NHSI periods, the ITCZ shifts northward by an average of 2.3° during the high NHSI periods.
Since the observed δ18Oc records evolves coherently with the NAF monsoon rainfall as in “amount effect” (Fig. 2b, c), one may expect a spatially uniformly distributed δ18Op response to insolation forcing similar to rainfall response (Fig. 3c). However, the simulated δ18Op exhibits a dipole response with increasing in the northern NAF but decreasing in the southern part (Fig. 3e). This pattern shows a positive correlation with rainfall in the north but a negative correlation in the south. This implies the complex regional response of δ18Op to external forcing.
Here, we employ the MSE budget to elucidate the physical mechanisms behind monsoon rainfall responses. In the climatology of low NHSI periods, the mean state exhibits intense rainfall over the Sahel and its southern regions (Fig. 1a, b), accompanied by positive vertical MSE advection (Fig. 5a). This rainfall is initiated by strong energy input into the atmospheric column (Fig. 5b), which drives vertical MSE advection in the tropics (Fig. 5a) and, consequently, sustains deep convective rainfall in these areas (Fig. 1a). These findings align with previous studies indicating that the vertical MSE advection is primarily balanced by the net energy flux (Chen and Bordoni, 2014; Hill et al., 2017). To the north of the rainfall band, pronounced subsidence is observed, manifested by negative vertical MSE advection (Fig. 5a), consistent with the low rainfall amounts and the presence of the Sahara Desert in this region (Fig. 1a). This suppressed convection is caused by negative horizontal MSE advection (Fig. 5c), in line with anticyclonic circulation and divergent sinking flow (Fig. 1a). The transient eddy term, which reflects northward moisture transport associated with African easterly waves (Hill et al., 2017), exhibits a meridional dipolar structure (Fig. 5d) that is opposite to the rainfall distribution.
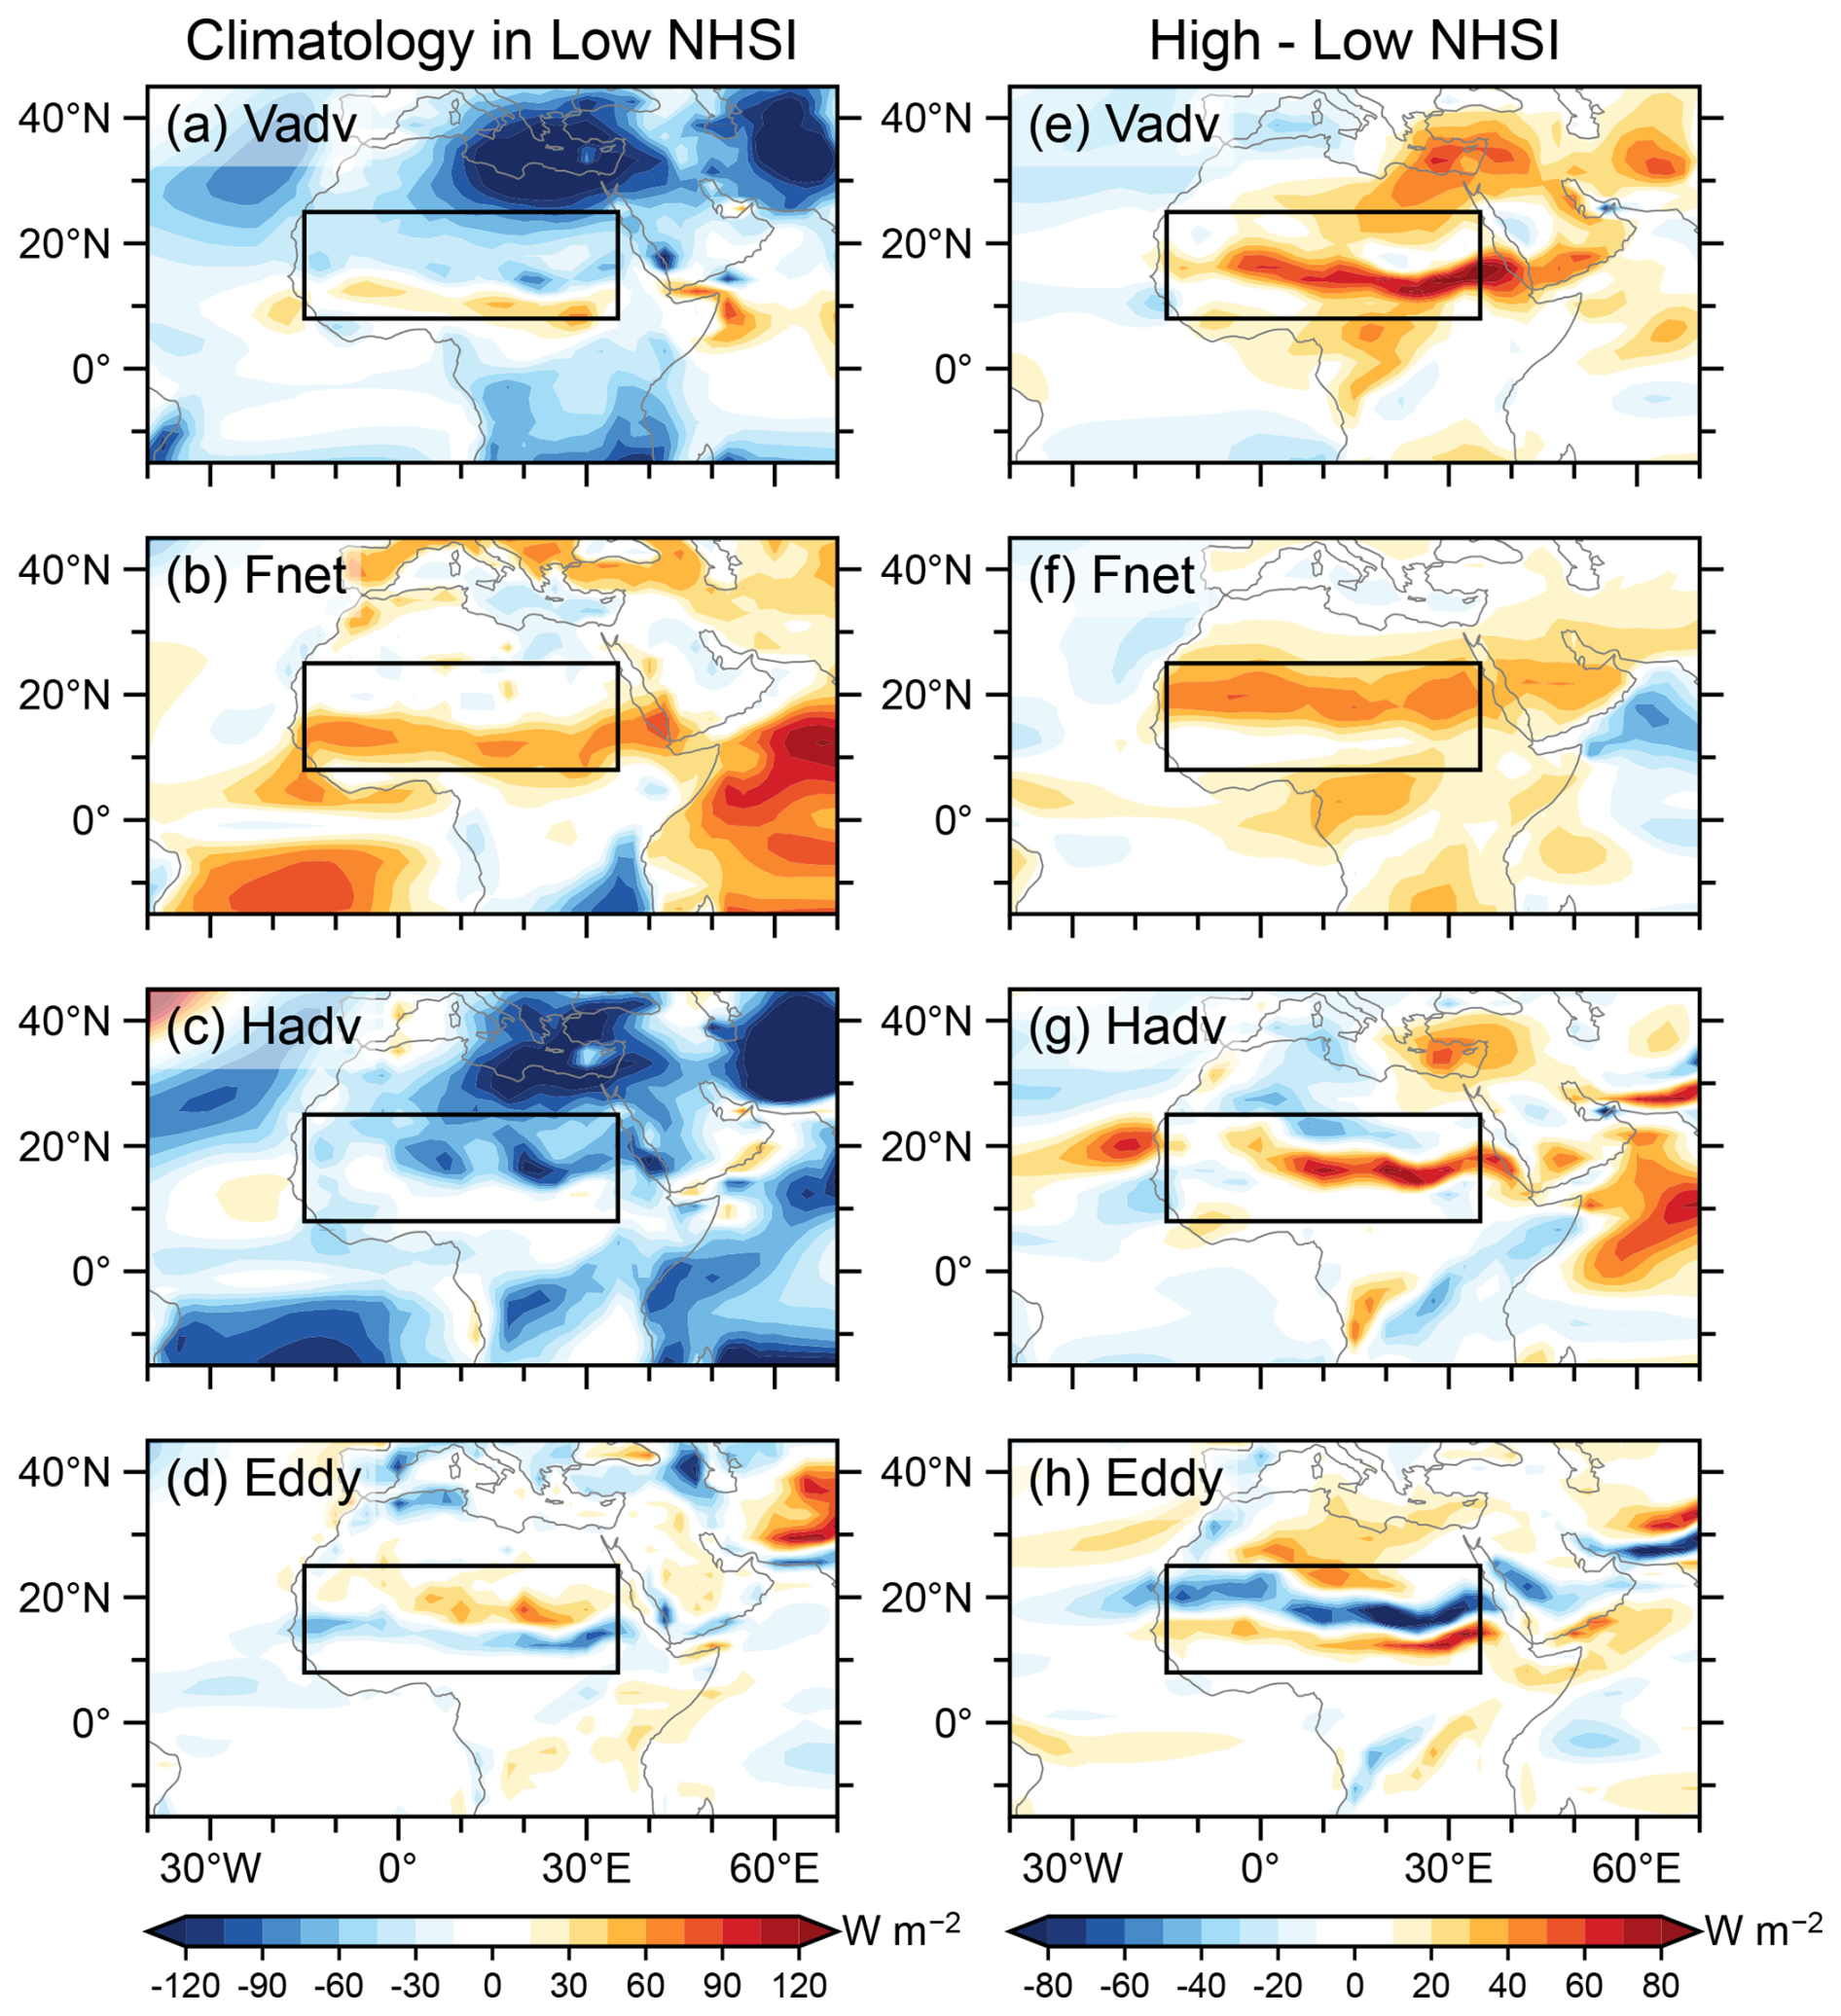
Figure 5Composite analysis of summer MSE budget. (a–d) Vertical MSE advection term (), net radiation term (), horizontal MSE advection term (), and transient eddy term ( during low NHSI periods. (e–h) Same as (a–d), but for the difference between high NHSI and low NHSI periods. The black rectangle is the NAF monsoon region.
Comparing high with low NHSI periods, the Sahara-Sahel region experiences increased energy input into the atmospheric column (Fig. 5f). This enhanced net energy forcing primarily stems from two factors (Fig. 6): First, greater shortwave radiation absorption in the atmosphere; and second, increased surface latent heat flux emission to the atmosphere resulting from higher rainfall and evaporation. The increased net energy in the Sahara-Sahel region directly intensifies upward motion (Fig. 5e), which intensifies the NAF monsoon and leads to increased rainfall (Fig. 3c). Concurrently, strengthened southwesterly winds contribute to positive horizontal MSE advection (Fig. 5g), indicating energy transport from adjacent tropical high-MSE regions into the Sahara-Sahel. This horizontal energy flux further sustains the increased rainfall and expands the influence of the monsoon system. The transient eddy term exhibits a north-south dipole pattern (Fig. 5h), but it contributes little to the area-averaged vertical MSE advection.
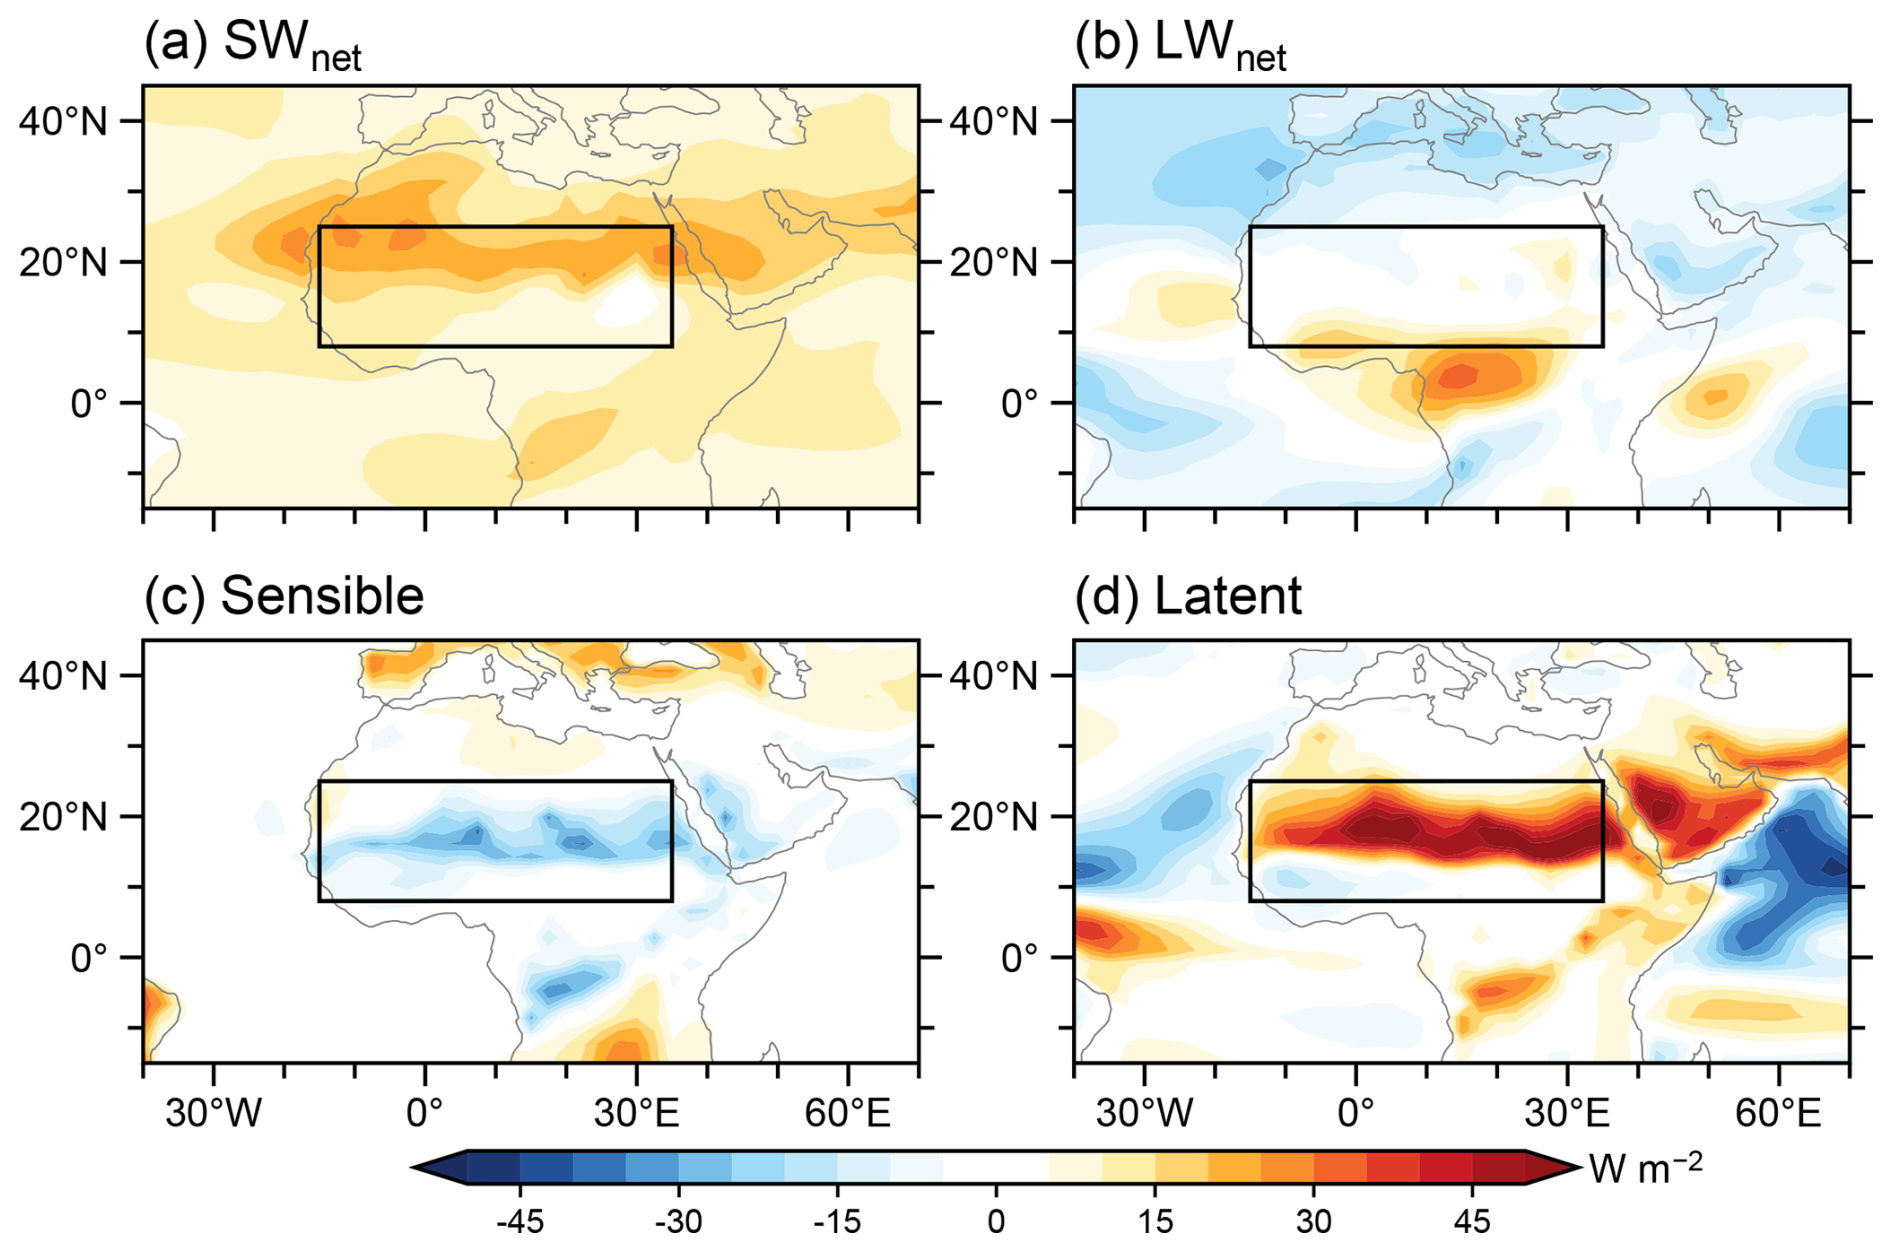
Figure 6Changes in energy entering the atmosphere during boreal summer between high and low NHSI periods. (a) Difference in downward shortwave radiation between the top of atmosphere and the surface, denote the net shortwave radiation into atmosphere. (b) Same as (a) but for the net longwave radiation change. (c) Surface sensible heat flux. (d) Surface latent heat flux.
Additionally, we employ moisture tagging experiments to quantify the contributions of different moisture sources to the NAF monsoon rainfall response (Fig. 7a). Although the mean state rainfall in the NAF region is primarily supplied by the African continent (about 46 %), the rainfall increase from low NHSI periods to high NHSI periods is additionally contributed from the Atlantic Ocean (Fig. 7a). Quantitatively, the North Atlantic Ocean, South Atlantic Ocean, and African continent contributes 18 %, 38 %, and 28 % of rainfall increase. These moisture contributions align with the dynamical framework in which intensified southwesterly monsoon winds enhance moisture transport from the Atlantic Ocean.
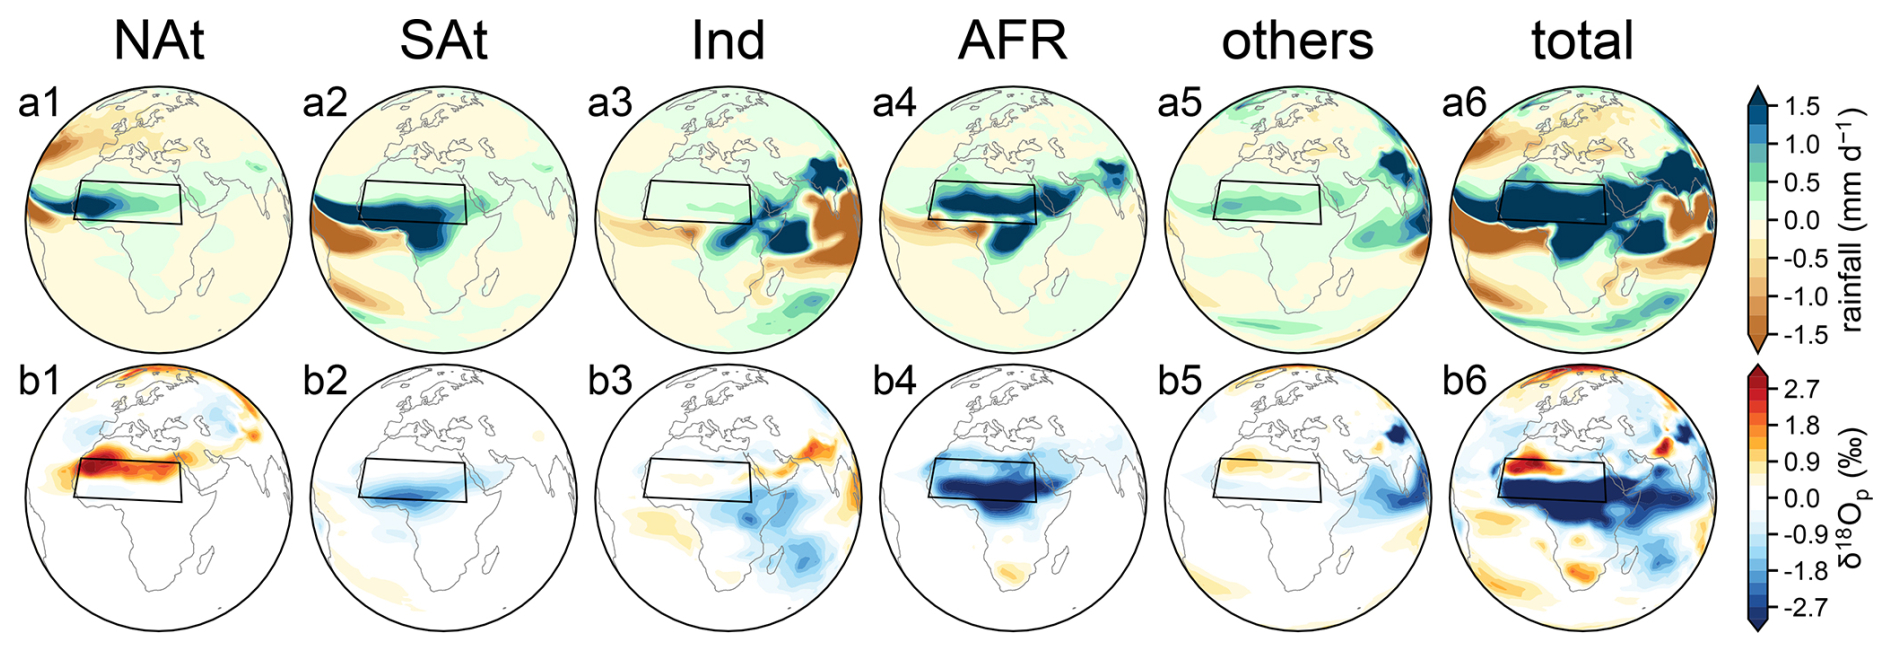
Figure 7Tracking 16O and δ18Op from source regions (high-low NHSI in tagging experiments). Summer rainfall difference (mm d−1) between high and low NHSI periods originating from moisture source regions (a1) North Atlantic Ocean (NAt), (a2) South Atlantic Ocean (SAt), (a3) Indian Ocean (Ind), (a4) African continent (AFR), (a5) other regions and (a6) the global total of 25 sub regions. (b1)–(b6) Same as (a1)–(a6) but for the difference of δ18Op between high and low NHSI periods. The black rectangles mark the NAF monsoon region.
As illustrated above, δ18Op exhibits a dipole response with enrichment in the north but depletion in the south in response to high NHSI (Fig. 3e). Given the overall increase in rainfall across the NAF region, the change in δ18Op indicates a positive rainfall-δ18Op relationship in the north and negative relationship in the south. This contrast highlights the complexity of regional δ18Op responses to external forcing and raises a critical question: Which hydrological processes are truly reflected by these δ18Op variations? To explore the mechanisms behind this pattern, we analyze the results from the aforementioned moisture tagging experiments.
Moisture tagging experiments perfectly reproduce meridional dipole pattern in δ18Op between high and low NHSI periods (Fig. 7b6 vs. Fig. 3e). In light of this dipole response, we divide the monsoon region into two subregions for further analysis: a northern region (15° W–35° E, 17° N–25° N) and a southern region (15° W–35° E, 8° N–17° N). The tagging experiments indicate that the dipole response of δ18Op in the NAF region are primarily influenced by moisture originating from the Atlantic Ocean and the African continent (Fig. 7b), which is largely consistent with the moisture contribution to rainfall changes discussed earlier. Specifically, the δ18Op enrichment in the northern region is mainly attributed to moisture from the North Atlantic, whereas depletion in the southern region is predominantly contributed by the African continent and South Atlantic.
To further understand the mechanism behind the dipole response of δ18Op, we first separate the changes in δ18Op into two terms: the contribution from changes in precipitation weight δ18O (Fig. 8a) and that from changes in the isotope ratio Opi (Fig. 8d) based on the Eq. (5). The decomposition suggests that dipole δ18Op responses in the northern and southern NAF regions are governed by distinct hydrological processes. The δ18Op enrichment in the northern NAF region is almost entirely attributable to changes in precipitation weight from North Atlantic (Fig. 8a), whereas the δ18Op depletion in the southern NAF region is mainly controlled by change in the value of isotope ratio from the African continent, as well as South Atlantic and Indian Ocean (Fig. 8d). In the following sections, we discuss the mechanisms driving δ18Op variability in the northern and southern NAF regions separately.
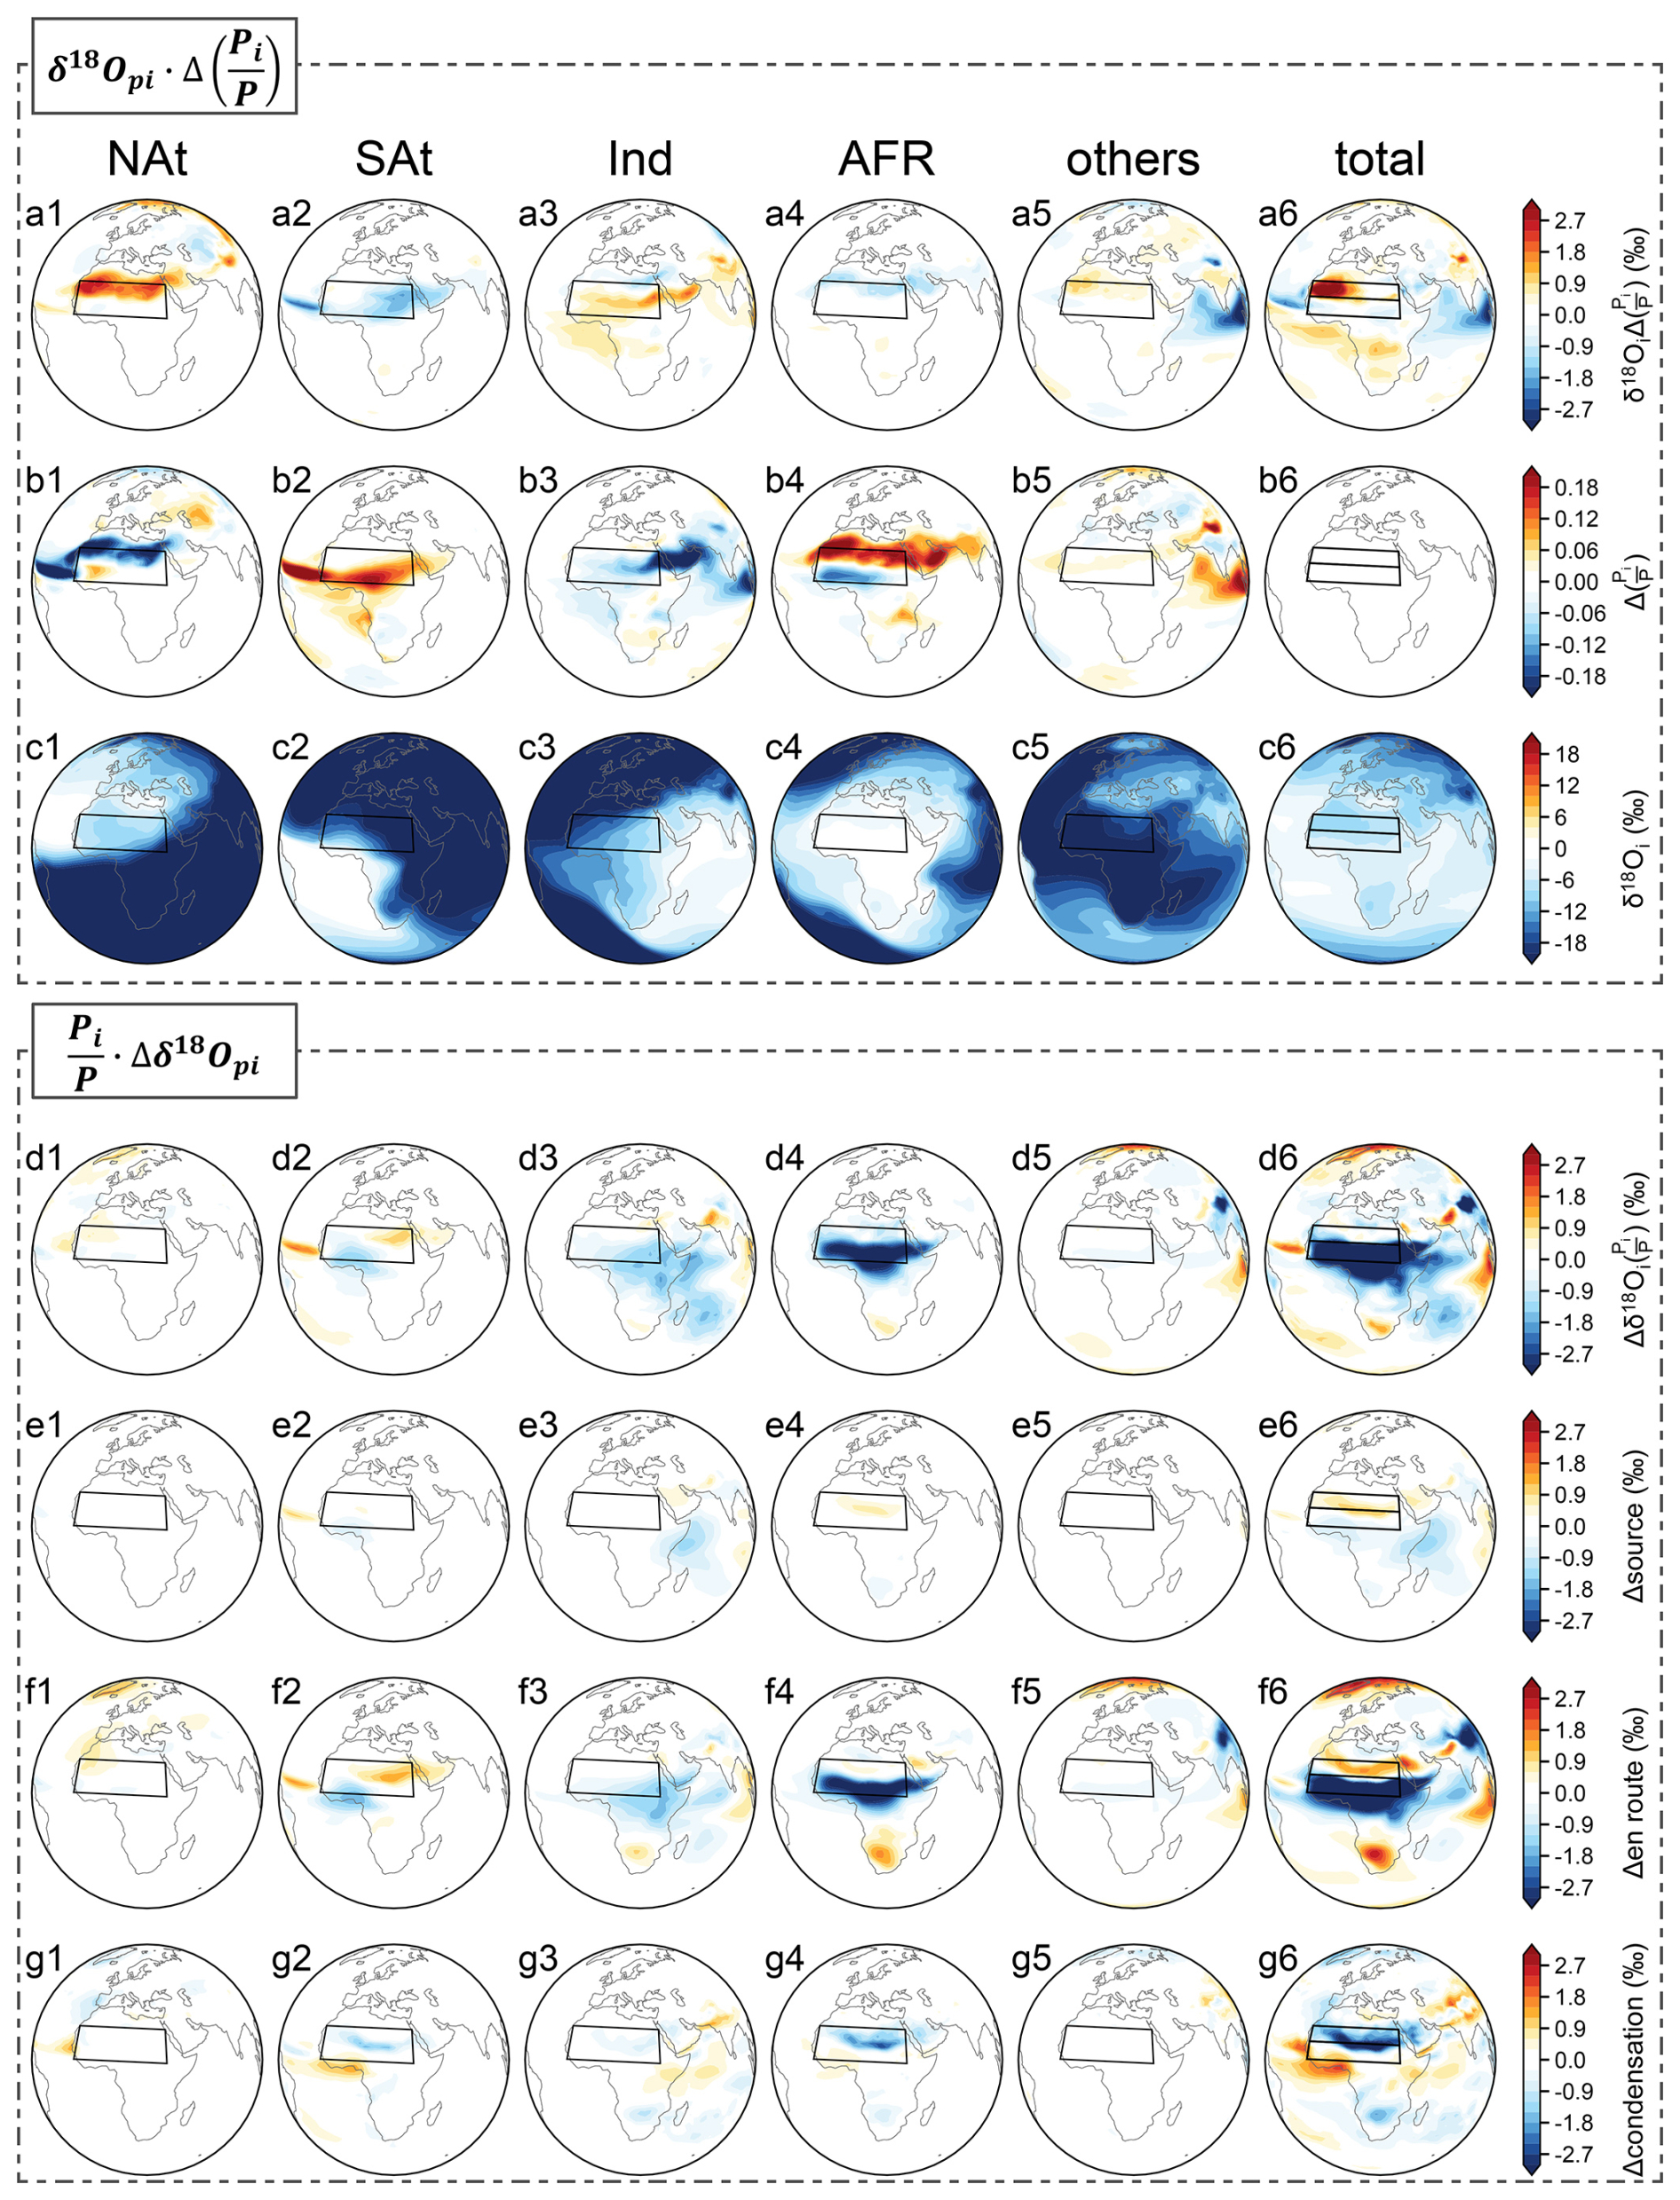
Figure 8Decomposition of δ18Op response. (a1–a6) δ18Op response due to changes in precipitation weight . (b1–b6) Changes in precipitation weight from each source region. (c1–c6) Climatological δ18O value from each source region. (d1–d6) δ18Op response due to changes in δ18Op value , which are further decomposed into the change due to (e1–e6) source δ18Ov, (f1–f6) en route depletion and (g1–g6) condensation enrichment. In addition to marking the NAF monsoon region with a black rectangle, a north-south division of the NAF region is also marked in the sixth column of subplots.
In the northern NAF region, as we illustrated above, the δ18Op enrichment is almost entirely attributable to contributions related to precipitation weight from North Atlantic (Fig. 8a). To further explore this, we plot the changes in precipitation weight along with climatological mean isotopic value δ18O in Fig. 8b and c. It shows that in the northern NAF region, the δ18Op enrichment is almost entirely attributable to changes in precipitation weight from North Atlantic. Here, we examine how changes in precipitation weight leads to δ18Op enrichment in the region. Climatologically, rainfall in the northern NAF region is primarily supplied by two moisture sources: the remote North Atlantic (∼ 28 %) and the local African continent (∼ 41 %) (Table A2). From low to high NHSI periods, the precipitation weight from the remote North Atlantic source decreases (Fig. 8b1), whereas that from the local African source increases (Fig. 8b4). As a result, the reduction in the North Atlantic contribution (∼ −11 %) is nearly offset by the increase from the African source (∼ 13 %) (Table A2). However, the δ18O values of these sources differ markedly: moisture originating from the North Atlantic is significantly more depleted (δ18O ≈ ∼ −8 ‰) compared to that from the African continent (δ18O ≈ ∼ −2 ‰) (Fig. 8c1 vs, c4). Therefore, despite the comparable magnitude of changes in precipitation weight, the contrast in isotopic values between the two sources results in a net enrichment of δ18Op. In other words, from low to high NHSI periods, the reduced contribution of distal, isotopically depleted moisture source and an increased contribution of nearby, isotopically enriched moisture source, ultimately driving the positive δ18Op anomaly in the northern NAF region.
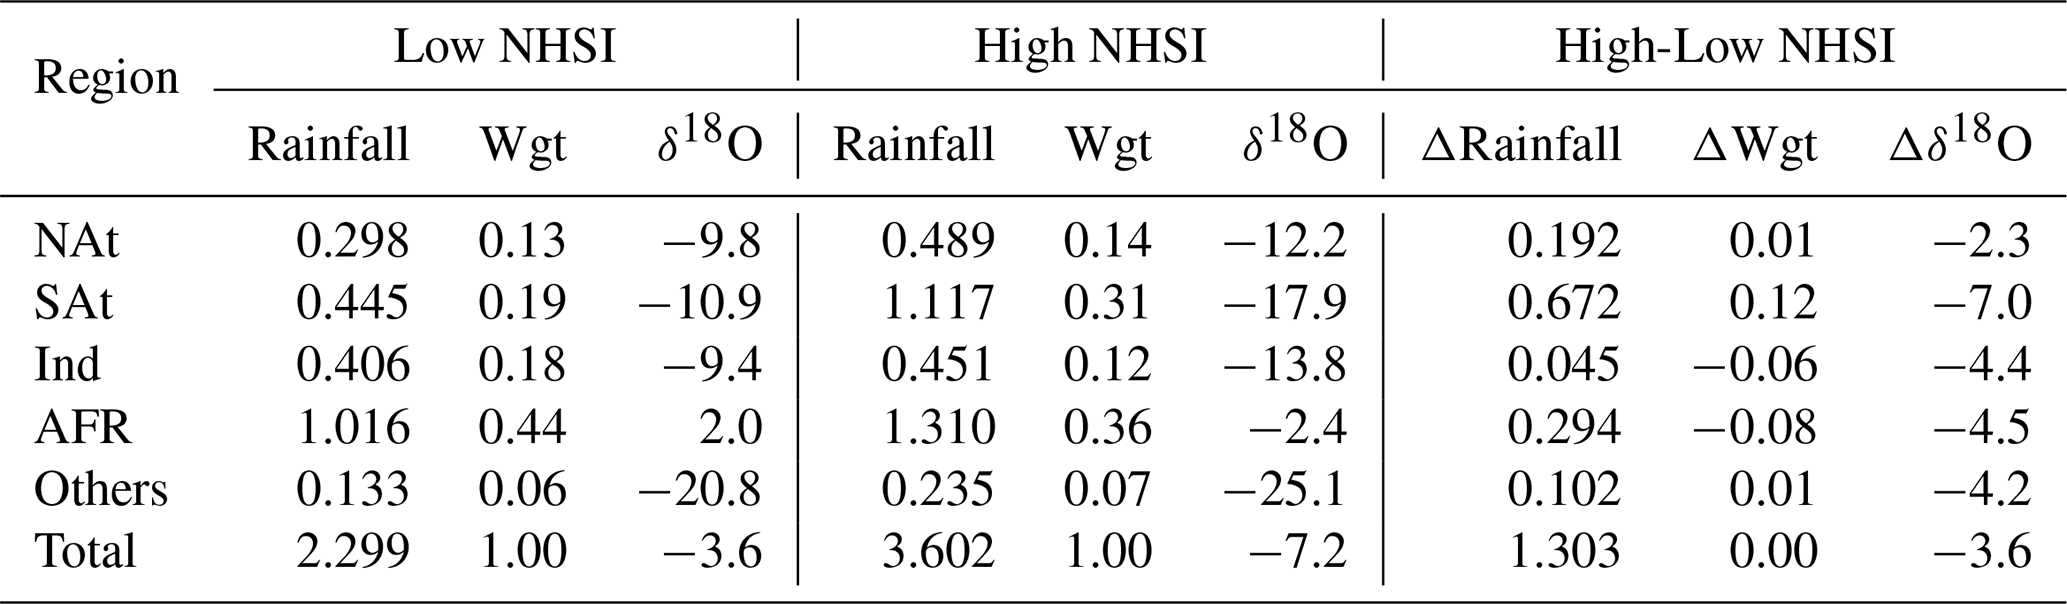
In the southern NAF region, the δ18Op depletion is mainly controlled by change in the value of isotope ratio from the African continent. Our decomposition analysis (based on Eq. 6) shows that rainfall depletion from African continent (Fig. 8f4) determines the δ18Op depletion in the southern NAF region. This occurs because the southwesterly winds are enhanced over the NAF regions, which migrates the ITCZ northward by 2.3° (Fig. 4) and extending rainfall eastward into the Horn of Africa (Fig. 3c). This notable expansion of the monsoon system is accompanied by the transport of air parcels away from their source locations, during which they experience rainout processes, leading to progressive isotopic depletion. In addition, the en route depletion from South Atlantic and Indian Ocean sources is also responsible for δ18Op decrease in west and east of southern NAF region (Fig. 8f2 and f3), respectively, due to rainout process. In contrast, the other two terms associated with source effect (Fig. 8e) and local condensation (Fig. 8g) have minimal influence on δ18Op changes in the region. Therefore, although the negative correlation between rainfall and δ18Op observed in the southern NAF region appears consistent with the isotopic “amount effect”, our study indicates that changes in NAF δ18Op cannot be simply attributed to local rainfall. Instead, they are significantly influenced by en route depletion processes. This finding suggests that future interpretations of oxygen isotope records in this region should be approached with caution.
In this study, we investigate the spatial-temporal evolutions of both rainfall and δ18Op across the NAF region using transient simulations spanning the past 150 000 years. We find that the NAF hydroclimate is controlled by low-latitude insolation and exhibits a strong precessional signal, with regional average rainfall and δ18Op negatively correlated, seemingly consistent with the sense of “amount effect”. However, rainfall and δ18Op display distinct spatial patterns. During high NHSI periods, rainfall shows a regionally uniform increase, whereas δ18Op exhibits a north-south dipole pattern, characterized by enrichment in the northern part and depletion in the southern part. The widespread increase in rainfall across the NAF region is driven by enhanced solar radiation, which destabilizes the atmospheric column and intensifies monsoon circulation, further sustained by horizontal advection of MSE. In contrast, the north-south dipole response of δ18Op is governed by different hydrological processes. Tagging experiments suggest that δ18Op enrichment in the northern NAF region results from shifts in moisture sources, with a reduced contribution from the distant Atlantic Ocean and an increased contribution from local continental sources. On the other hand, δ18Op depletion in the southern NAF region is primarily attributed to en route rainout processes, as intensified monsoon circulation transports air parcels away from their source regions, during which they undergo progressive isotopic depletion.
The results of our simulations are broadly consistent with previous studies. The simulated rainfall expands poleward, in agreement with lake-level reconstructions (Tierney et al., 2011) and marine sediment records from the western Sahara (Tierney et al., 2017a). In addition, the rainfall extends eastward into the Horn of Africa, driven by strong southwesterly winds, which is supported by marine sediment evidence from the Gulf of Aden (Tierney et al., 2017b). The West African precipitation anomaly penetrates farther north than its East African counterpart, consistent with earlier modeling results (Schurgers et al., 2007). The simulated δ18Op also aligns well with speleothem and seawater δ18O records from the eastern Mediterranean Sea, which reflect hydroclimate conditions over the NAF region via Nile River discharge (Ziegler et al., 2010). Furthermore, the spatial pattern of δ18Op resembles that reported by Shi et al. (2023) with different climate models, with depleted values in the southern NAF region and enriched values in the northwestern part. However, in their simulation, the area of δ18Op enrichment is more spatially confined.
Nonetheless, some discrepancies remain between our simulated δ18Oc and previous studies. For instance, the simulated δ18Oc exhibits a much narrower range of variability, from approximately −7 ‰ to −10 ‰ compared to the observed range of −2 ‰ to −8 ‰ . This mismatch may arise from either model biases or uncertainties in the proxy data. Relative to pollen-based reconstructions (Tierney et al., 2017a; Braconnot et al., 2012), our simulated precipitation anomalies are less pronounced (Bartlein et al., 2011; Shi et al., 2022), which likely results in weaker isotopic signals. In addition, our simulation considers only insolation forcing, whereas in reality, other factors such as lakes, vegetation, and ecosystem dynamics also play important roles. Model resolution is another key factor that can influence the results (Werner et al., 2011). On the other hand, uncertainties also exist in the proxy data themselves. For example, δ18Op signals preserved in speleothems may reflect a complex combination of local environmental processes rather than large-scale climate signals alone (Lachniet, 2009).
Direct spatial comparison between simulated δ18O and proxy observations on orbital timescales is not currently feasible, as no direct δ18O reconstructions are available from the African continent. The north–south dipole pattern of δ18Op simulated in this study differs from the west–east dipole pattern previously using the ECHAM4 model (Herold and Lohmann, 2009). This discrepancy likely stems from differences in model-generated climate responses. In Herold and Lohmann (2009), simulated rainfall decreases over the western Sahara, which contrasts with sediment records indicating increased rainfall in that region (Tierney et al., 2017a). This negative rainfall bias may have led to an underestimation of isotopic depletion processes, resulting in δ18Op enrichment in their simulations. Our simulated north–south dipole pattern also differs from the widespread δ18Op depletion over North Africa simulated by MPI-ESM-wiso (Cauquoin et al., 2019). In that study, the simulated rainfall increase does not extend to the Horn of Africa, contrary to sediment records from the Gulf of Aden (Tierney et al., 2017b). This regional limitation likely underestimates the rainfall increase and, consequently, the moisture contribution from the African continent. The resulting discrepancy in moisture sources may explain the absence of δ18Op enrichment in the northern NAF region in their simulations compared with ours.
Although direct spatial validation of δ18Op against orbital-scale observations remains limited due to the lack of continent-based δ18O proxies, the strong agreement between our simulated rainfall patterns and multiple proxy reconstructions lends confidence to our simulated δ18Op distributions. Furthermore, our tagging experiments enable a quantitative assessment of the processes driving δ18Op variations. In the southern NAF, upstream en route depletion of vapor δ18O accounts for 81 % of the total depletion, while the contribution of the “amount effect” is negligible. This quantitative approach advances beyond previous studies that relied primarily on statistical relationships between δ18Op and rainfall to infer underlying mechanisms (Cauquoin et al., 2019). The dipole pattern of δ18Op simulated here provides a distinct isotopic fingerprint that can be tested against future proxy evidence.
Our results reveal that the forcing mechanisms governing δ18Op across North Africa are complex. While the “amount effect” is widely invoked to interpret δ18Op in tropical monsoon regions, its applicability varies across different subregions of North Africa. In the southern NAF, although δ18Op and rainfall are negatively correlated, that is consistent with the “amount effect” in a statistical sense, the primary control on δ18Op is en route depletion processes rather than local precipitation amount. The interpretation of δ18Op on orbital timescales also differs from that on seasonal timescales. At the seasonal scale, Risi et al. (2008) demonstrated that convective activity is the main control on the isotopic composition of precipitation in North Africa, supporting the “amount effect.” This contrast highlights the complex, scale-dependent relationship between δ18Op and rainfall. On orbital timescales, it is essential to consider changes in rainfall along upstream vapor transport trajectories when interpreting isotopic proxies of past climate change. Although δ18Op cannot be used to directly infer past monsoon rainfall intensity, it remains a robust indicator of monsoon strength. Overall, depleted δ18Op values across North Africa are associated with an intensified NAF monsoon, characterized by enhanced southwesterly winds and increased monsoon rainfall.
There are still caveats in our simulation. We only consider insolation forcing. Other factors such as ice sheet dynamics and vegetation feedbacks may also influence the amplitude of the simulated results. For instance, the simulated northward extension of rainfall in the NAF region is more limited compared to reconstructions, which suggest that the African Humid Period extended as far north as ∼ 31° N (Tierney et al., 2017a). This underestimation of rainfall increase may be due to the absence of dynamic vegetation and dust emission feedbacks in our model (Pausata et al., 2016), and could also constrain the simulated range of δ18Oc. Furthermore, recent studies indicate that polar ice sheets can influence tropical monsoon systems by altering the interhemispheric pressure gradient (An et al., 2024). The lack of ice sheet forcing in our simulation may therefore contribute to an underestimation of rainfall over North Africa, potentially affecting the amplitude and variability of the simulated δ18Oc as well.
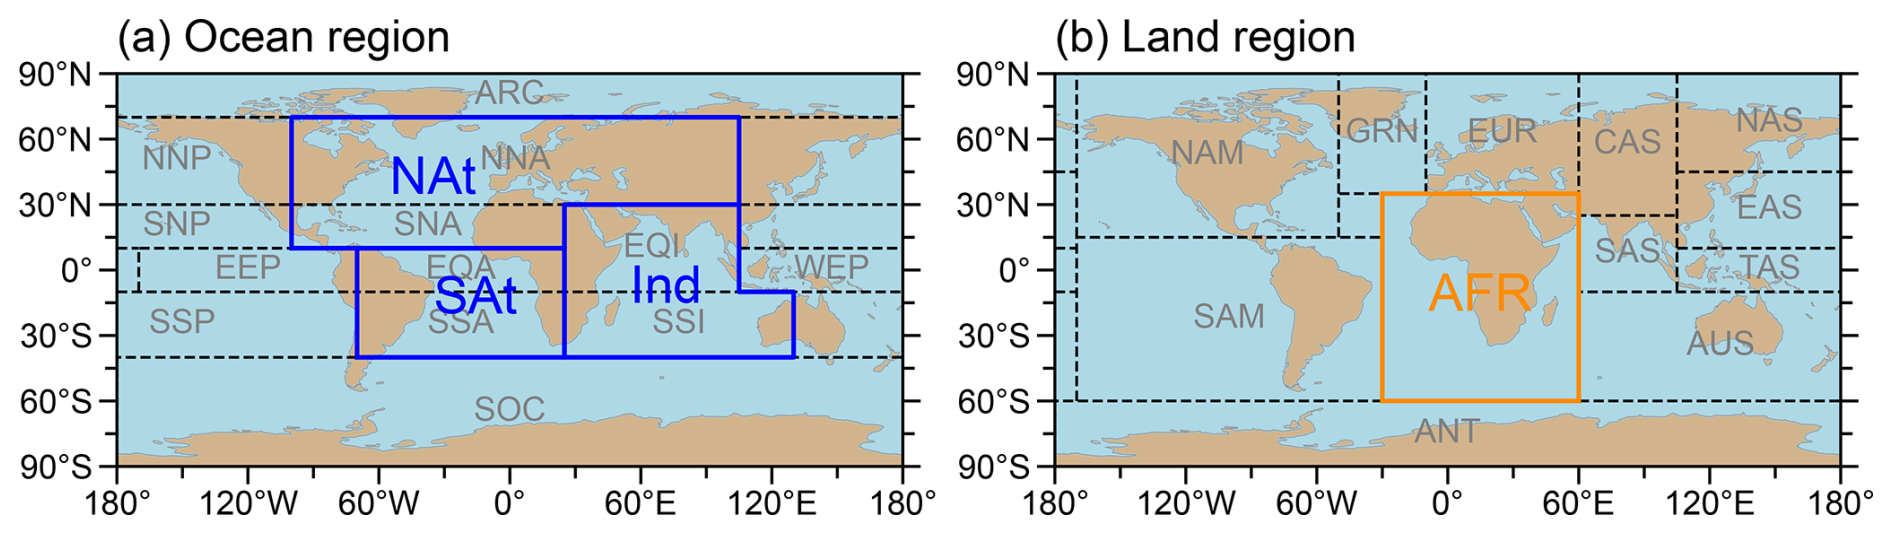
Figure A1Source region delineation in the tagging experiments and regrouping for analysis. (a) Regional delineation of the global ocean. The black dashed boxes mark the ocean sub regions used for the experiments. The blue polygons mark the regrouped ocean regions used for the analysis. (b) Similar to (a) but for regional delineation of the global land.
Table A1Regional average of annual mean rainfall (Rainfall; mm d−1), precipitation weight (Wgt; proportion of total precipitation) and annual mean δ18O in precipitation (‰) in the NAF monsoon region (15° W–35° E, 8° N–25° N).
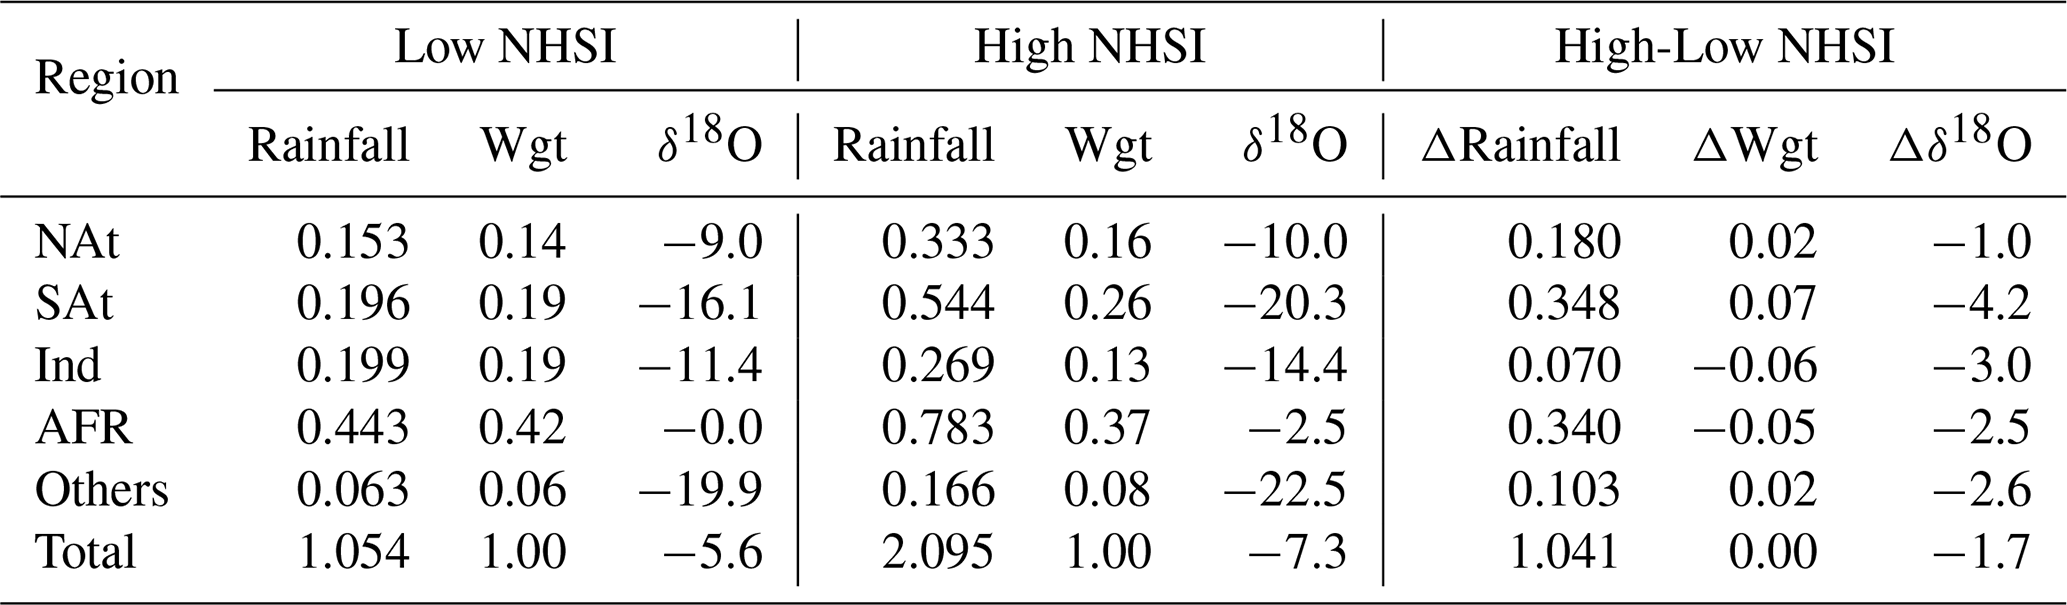
Table A2Same as Table A1, but for the northern NAF monsoon region (15° W-35° E, 17° N-25° N).
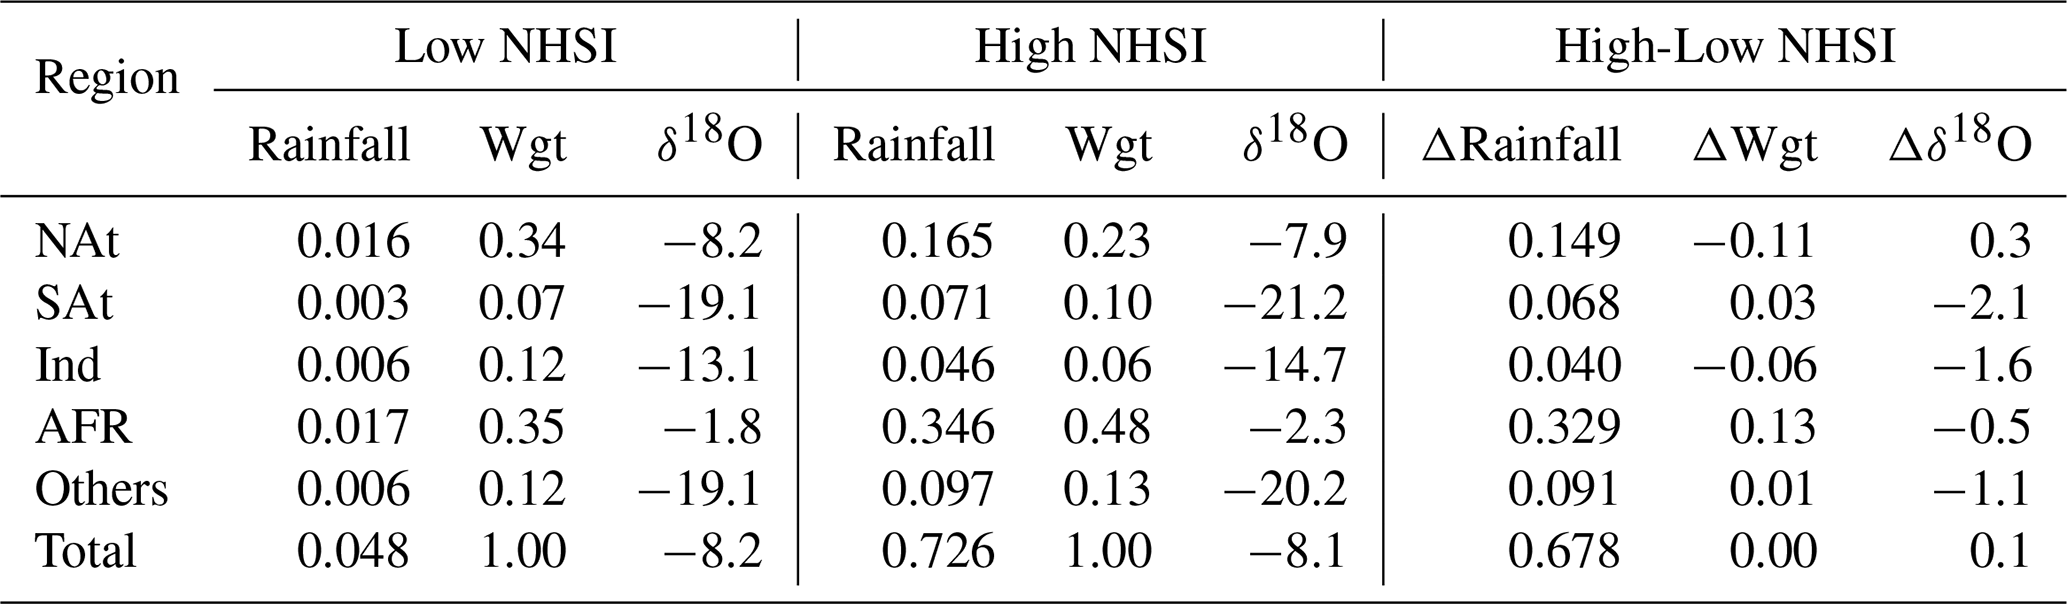
Table A3Same as Table A1, but for the southern NAF monsoon region (15° W-35° E, 8° N-17° N).
The ERA5 reanalysis data are publicly available from the Copernicus Climate Change Service (https://cds.climate.copernicus.eu/, last access: October 2025). The GNIP data can be obtained from the IAEA website (https://nucleus.iaea.org/wiser/explore/, last access: October 2025). Paleoclimate proxy data could be found from NOAA (https://www.ncei.noaa.gov/products/paleoclimatology, last access: October 2025). The iCESM modeling data and mapping code related to this article is available online at https://doi.org/10.5281/zenodo.17659273 (Ji et al., 2025).
QW designed the experiments and carried them out. CJ performed the analysis, made the figures, and wrote the manuscript draft. QW worked on revising the manuscript. All authors were involved in helpful discussion and contributed to the manuscript.
The contact author has declared that none of the authors has any competing interests.
Publisher's note: Copernicus Publications remains neutral with regard to jurisdictional claims made in the text, published maps, institutional affiliations, or any other geographical representation in this paper. The authors bear the ultimate responsibility for providing appropriate place names. Views expressed in the text are those of the authors and do not necessarily reflect the views of the publisher.
We thank Zhengyu Liu, Jian Liu, Deliang Chen, Liang Ning and Mi Yan for helpful discussions and Qiuzhen Yin for providing constructive reviews that improved the manuscript.
This work is supported by the National Natural Science Foundation (NSF) of China (grant nos. 42575051, 42130604, 42575050), National Key Research and Development Program of China (grant no. 2023YFF0804700), Science and Technology Innovation Project of Laoshan Laboratory (grant no. LSKJ202203303), and the State Key Laboratory of Loess and Quaternary Geology (grant no. SKLLQG2202).
This paper was edited by Patrick Jöckel and reviewed by two anonymous referees.
An, Z., Zhou, W., Zhang, Z., Zhang, X., Liu, Z., Sun, Y., Clemens, S. C., Wu, L., Zhao, J., Shi, Z., Ma, X., Yan, H., Li, G., Cai, Y., Yu, J., Sun, Y., Li, S., Zhang, Y., Stepanek, C., Lohmann, G., Dong, G., Cheng, H., Liu, Y., Jin, Z., Li, T., Hao, Y., Lei, J., and Cai, W.: Mid-Pleistocene climate transition triggered by Antarctic Ice Sheet growth, Science, 385, 560–565, https://doi.org/10.1126/science.abn4861, 2024.
Armitage, S. J., Bristow, C. S., and Drake, N. A.: West African monsoon dynamics inferred from abrupt fluctuations of Lake Mega-Chad, Proc. Natl. Acad. Sci., 112, 8543–8548, https://doi.org/10.1073/pnas.1417655112, 2015.
Ayalon, A., Bar-Matthews, M., and Kaufman, A.: Climatic conditions during marine oxygen isotope stage 6 in the eastern Mediterranean region from the isotopic composition of speleothems of Soreq Cave, Israel, Geology, 30, 303–306, https://doi.org/10.1130/0091-7613(2002)030<0303:CCDMOI>2.0.CO;2, 2002.
Bao, Y., Liu, Z., and He, C.: Dipole Response of Millennial Variability in Tropical South American Precipitation and δ18Op during the Last Deglaciation. Part II: δ18Op Response, J. Clim., 36, 4709–4721, https://doi.org/10.1175/JCLI-D-22-0289.1, 2023.
Bar-Matthews, M., Ayalon, A., Gilmour, M., Matthews, A., and Hawkesworth, C. J.: Sea–land oxygen isotopic relationships from planktonic foraminifera and speleothems in the Eastern Mediterranean region and their implication for paleorainfall during interglacial intervals, Geochim. Cosmochim. Acta, 67, 3181–3199, https://doi.org/10.1016/S0016-7037(02)01031-1, 2003.
Bartlein, P. J., Harrison, S. P., Brewer, S., Connor, S., Davis, B. A. S., Gajewski, K., Guiot, J., Harrison-Prentice, T. I., Henderson, A., Peyron, O., Prentice, I. C., Scholze, M., Seppä, H., Shuman, B., Sugita, S., Thompson, R. S., Viau, A. E., Williams, J., and Wu, H.: Pollen-based continental climate reconstructions at 6 and 21 ka: a global synthesis, Clim. Dyn., 37, 775–802, https://doi.org/10.1007/s00382-010-0904-1, 2011.
Battisti, D. S., Ding, Q., and Roe, G. H.: Coherent pan-Asian climatic and isotopic response to orbital forcing of tropical insolation, J. Geophys. Res. Atmos., 119, 11997–12020, https://doi.org/10.1002/2014JD021960, 2014.
Berger, A.: Long-term variations of caloric insolation resulting from the earth's orbital elements, Quat. Res., 9, 139–167, https://doi.org/10.1016/0033-5894(78)90064-9, 1978.
Berger, A. and Pestiaux, P.: Accuracy and stability of the Quaternary terrestrial insolation, Milankovitch and Climate, 83–112, https://ui.adsabs.harvard.edu/abs/1984mcur.conf...83B (last access: April 2026), 1984.
Berger, A., Loutre, M., and Tricot, C.: Insolation and Earth's orbital periods, J. Geophys. Res., 98, 10341–10362, https://doi.org/10.1029/93JD00222, 1993.
Blanchet, C. L., Osborne, A. H., Tjallingii, R., Ehrmann, W., Friedrich, T., Timmermann, A., Brückmann, W., and Frank, M.: Drivers of river reactivation in North Africa during the last glacial cycle, Nat. Geosci., 14, 97–103, https://doi.org/10.1038/s41561-020-00671-3, 2021.
Bosmans, J. H. C., Drijfhout, S. S., Tuenter, E., Hilgen, F. J., and Lourens, L. J.: Response of the North African summer monsoon to precession and obliquity forcings in the EC-Earth GCM, Clim. Dyn., 44, 279–297, https://doi.org/10.1007/s00382-014-2260-z, 2015.
Braconnot, P., Harrison, S. P., Kageyama, M., Bartlein, P. J., Masson-Delmotte, V., Abe-Ouchi, A., Otto-Bliesner, B., and Zhao, Y.: Evaluation of climate models using palaeoclimatic data, Nat. Clim. Chang., 2, 417–424, https://doi.org/10.1038/nclimate1456, 2012.
Brady, E., Stevenson, S., Bailey, D., Liu, Z., Noone, D., Nusbaumer, J., Otto-Bliesner, B. L., Tabor, C., Tomas, R., Wong, T., Zhang, J., and Zhu, J.: The Connected Isotopic Water Cycle in the Community Earth System Model Version 1, J. Adv. Model. Earth Syst., 11, 2547–2566, https://doi.org/10.1029/2019MS001663, 2019.
Brahim, Y. A., Sha, L., Wassenburg, J. A., Azennoud, K., Cheng, H., Cruz, F. W., and Bouchaou, L.: The spatiotemporal extent of the Green Sahara during the last glacial period, iScience, 26, 107018, https://doi.org/10.1016/j.isci.2023.107018, 2023.
Cauquoin, A., Werner, M., and Lohmann, G.: Water isotopes – climate relationships for the mid-Holocene and preindustrial period simulated with an isotope-enabled version of MPI-ESM, Clim. Past, 15, 1913–1937, https://doi.org/10.5194/cp-15-1913-2019, 2019.
Chen, J. and Bordoni, S.: Orographic Effects of the Tibetan Plateau on the East Asian Summer Monsoon: An Energetic Perspective, J. Clim., 27, 3052–3072, https://doi.org/10.1175/JCLI-D-13-00479.1, 2014.
Cheng, H., Sinha, A., Wang, X., Cruz, F. W., and Edwards, R. L.: The Global Paleomonsoon as seen through speleothem records from Asia and the Americas, Clim. Dyn., 39, 1045–1062, https://doi.org/10.1007/s00382-012-1363-7, 2012.
Cheng, H., Sinha, A., Cruz, F. W., Wang, X., Edwards, R. L., d'Horta, F. M., Ribas, C. C., Vuille, M., Stott, L. D., and Auler, A. S.: Climate change patterns in Amazonia and biodiversity, Nat. Commun., 4, 1411–1416, https://doi.org/10.1038/ncomms2415, 2013.
Cheng, H., Edwards, R. L., Sinha, A., Spötl, C., Yi, L., Chen, S., Kelly, M., Kathayat, G., Wang, X., Li, X., Kong, X., Wang, Y., Ning, Y., and Zhang, H.: The Asian monsoon over the past 640 000 years and ice age terminations, Nature, 534, 640–646, https://doi.org/10.1038/nature18591, 2016.
Cheng, H., Li, H., Zhang, X., Zhang, H., Yi, L., Cai, Y., Hu, Y., Shi, Z., Peng, Y., Zhao, J., Gayatri, K., and Ashish, S.: European-Asian-African continent: An early form of supercontinent and supermonsoon, Quat. Sci., 40, 1381–1396, https://doi.org/10.11928/j.issn.1001-7410.2020.06.01, 2020.
Cole, J. E., Rind, D., Webb, R. S., Jouzel, J., and Healy, R.: Climatic controls on interannual variability of precipitation δ18O: Simulated influence of temperature, precipitation amount, and vapor source region, J. Geophys. Res. Atmos., 104, 14223–14235, https://doi.org/10.1029/1999JD900182, 1999.
Cook, K. H. and Vizy, E. K.: Contemporary Climate Change of the African Monsoon Systems, Curr. Clim. Change Rep., 5, 145–159, https://doi.org/10.1007/s40641-019-00130-1, 2019.
Coplen, T. B., Kendall, C., and Hopple, J.: Comparison of stable isotope reference samples, Nature, 302, 236–238, https://doi.org/10.1038/302236a0, 1983.
Crocker, A. J., Naafs, B. D. A., Westerhold, T., James, R. H., Cooper, M. J., Röhl, U., Pancost, R. D., Xuan, C., Osborne, C. P., Beerling, D. J., and Wilson, P. A.: Astronomically controlled aridity in the Sahara since at least 11 million years ago, Nat. Geosci., 15, 671–676, https://doi.org/10.1038/s41561-022-00990-7, 2022.
Cruz, F. W., Burns, S. J., Karmann, I., Sharp, W. D., Vuille, M., Cardoso, A. O., Ferrari, J. A., Silva Dias, P. L., and Viana, O.: Insolation-driven changes in atmospheric circulation over the past 116 000 years in subtropical Brazil, Nature, 434, 63–66, https://doi.org/10.1038/nature03365, 2005.
Dansgaard, W.: Stable isotopes in precipitation, Tellus, 16, 436–468, https://doi.org/10.3402/tellusa.v16i4.8993, 1964.
Datti, A. D., Zeng, G., Monerie, P.-A., Oo, K. T., and Chen, C.: A Review of the arctic-West African monsoon nexus: How arctic sea ice decline influences monsoon system, Theor. Appl. Climatol., 156, 9–29, https://doi.org/10.1007/s00704-024-05255-4, 2025.
deMenocal, P., Ortiz, J., Guilderson, T., and Sarnthein, M.: Coherent High- and Low-Latitude Climate Variability During the Holocene Warm Period, Science, 288, 2198–2202, https://doi.org/10.1126/science.288.5474.2198, 2000.
deMenocal, P. B.: African climate change and faunal evolution during the Pliocene–Pleistocene, Earth Planet. Sci. Lett., 220, 3–24, https://doi.org/10.1016/S0012-821X(04)00003-2, 2004.
deMenocal, P. B. and Tierney, J. E.: Green Sahara: African Humid Periods paces by Earth's orbital changes, Nat. Educ. Knowl., 3, 12–17, 2012.
Ehrmann, W., Schmiedl, G., Seidel, M., Krüger, S., and Schulz, H.: A distal 140 kyr sediment record of Nile discharge and East African monsoon variability, Clim. Past, 12, 713–727, https://doi.org/10.5194/cp-12-713-2016, 2016.
Ehrmann, W., Schmiedl, G., Beuscher, S., and Krüger, S.: Intensity of African Humid Periods Estimated from Saharan Dust Fluxes, PloS One, 12, e0170989, https://doi.org/10.1371/journal.pone.0170989, 2017.
Fairchild, I. J., Baker, A., and Bradley, R.(Eds.): Speleothem Science: From Process to Past Environments, John Wiley & Sons, 432 pp., https://doi.org/10.1002/9781444361094, 2012.
Fersi, W., Lézine, A.-M., and Bassinot, F.: Hydro-climate changes over southwestern Arabia and the Horn of Africa during the last glacial–interglacial transition: A pollen record from the Gulf of Aden, Rev. Palaeobot. Palynol., 233, 176–185, https://doi.org/10.1016/j.revpalbo.2016.04.002, 2016.
Grant, K. M., Grimm, R., Mikolajewicz, U., Marino, G., Ziegler, M., and Rohling, E. J.: The timing of Mediterranean sapropel deposition relative to insolation, sea-level and African monsoon changes, Quat. Sci. Rev., 140, 125–141, https://doi.org/10.1016/j.quascirev.2016.03.026, 2016.
Grant, K. M., Rohling, E. J., Westerhold, T., Zabel, M., Heslop, D., Konijnendijk, T., and Lourens, L.: A 3 million year index for North African humidity/aridity and the implication of potential pan-African Humid periods, Quat. Sci. Rev., 171, 100–118, https://doi.org/10.1016/j.quascirev.2017.07.005, 2017.
He, C., Liu, Z., Otto-Bliesner, B. L., Brady, E. C., Zhu, C., Tomas, R., Clark, P. U., Zhu, J., Jahn, A., Gu, S., Zhang, J., Nusbaumer, J., Noone, D., Cheng, H., Wang, Y., Yan, M., and Bao, Y.: Hydroclimate footprint of pan-Asian monsoon water isotope during the last deglaciation, Sci. Adv., 7, https://doi.org/10.1126/sciadv.abe2611, 2021.
Herold, M. and Lohmann, G.: Eemian tropical and subtropical African moisture transport: an isotope modelling study, Clim. Dyn., 33, 1075–1088, https://doi.org/10.1007/s00382-008-0515-2, 2009.
Hill, S. A., Ming, Y., Held, I. M., and Zhao, M.: A Moist Static Energy Budget–Based Analysis of the Sahel Rainfall Response to Uniform Oceanic Warming, J. Clim., 30, 5637–5660, https://doi.org/10.1175/JCLI-D-16-0785.1, 2017.
Hu, J., Emile-Geay, J., Tabor, C., Nusbaumer, J., and Partin, J.: Deciphering Oxygen Isotope Records From Chinese Speleothems With an Isotope-Enabled Climate Model, Paleoceanogr. Paleoclimatol., 34, 2098–2112, https://doi.org/10.1029/2019PA003741, 2019.
Hunke, E. C.: Thickness sensitivities in the CICE sea ice model, Ocean Model., 34, 137–149, https://doi.org/10.1016/j.ocemod.2010.05.004, 2010.
Ji, C., Wen, Q., Liu, Z., Liu, J., Chen, D., Ning, L., Yan, M., and Yin, Q.: A dipole pattern of orbital-scale precipitation oxygen isotope variation in North African monsoon region and the driving mechanism, Zenodo [data set], https://doi.org/10.5281/zenodo.17659273, 2025.
Kohfeld, K. E. and Harrison, S. P.: How well can we simulate past climates? Evaluating the models using global palaeoenvironmental datasets, Quat. Sci. Rev., 19, 321–346, https://doi.org/10.1016/S0277-3791(99)00068-2, 2000.
Kurita, N.: Water isotopic variability in response to mesoscale convective system over the tropical ocean, J. Geophys. Res. Atmos., 118, 10376–10390, https://doi.org/10.1002/jgrd.50754, 2013.
Kutzbach, J. E. and Liu, Z.: Response of the African Monsoon to Orbital Forcing and Ocean Feedbacks in the Middle Holocene, Science, 278, 440–443, https://doi.org/10.1126/science.278.5337.440, 1997.
Kutzbach, J. E., Liu, X., Liu, Z., and Chen, G.: Simulation of the evolutionary response of global summer monsoons to orbital forcing over the past 280 000 years, Clim. Dyn., 30, 567–579, https://doi.org/10.1007/s00382-007-0308-z, 2008.
Kutzbach, J. E., Guan, J., He, F., Cohen, A. S., Orland, I. J., and Chen, G.: African climate response to orbital and glacial forcing in 140 000-y simulation with implications for early modern human environments, PNAS, 117, 2255–2264, https://doi.org/10.1073/pnas.1917673117, 2020.
Lachniet, M. S.: Climatic and environmental controls on speleothem oxygen-isotope values, Quat. Sci. Rev., 28, 412–432, https://doi.org/10.1016/j.quascirev.2008.10.021, 2009.
Lee, J.-E. and Fung, I.: “Amount effect” of water isotopes and quantitative analysis of post-condensation processes, Hydrol. Process., 22, 1–8, https://doi.org/10.1002/hyp.6637, 2007.
Lee, J.-E., Johnson, K., and Fung, I.: Precipitation over South America during the Last Glacial Maximum: An analysis of the “amount effect” with a water isotope-enabled general circulation model, Geophys. Res. Lett., 36, https://doi.org/10.1029/2009GL039265, 2009.
Lézine, A.-M., Duplessy, J.-C., and Cazet, J.-P.: West African monsoon variability during the last deglaciation and the Holocene: Evidence from fresh water algae, pollen and isotope data from core KW31, Gulf of Guinea, Palaeogeogr. Palaeocl., 219, 225–237, https://doi.org/10.1016/j.palaeo.2004.12.027, 2005.
Lézine, A.-M., Hély, C., Grenier, C., Braconnot, P., and Krinner, G.: Sahara and Sahel vulnerability to climate changes, lessons from Holocene hydrological data, Quat. Sci. Rev., 30, 3001–3012, https://doi.org/10.1016/j.quascirev.2011.07.006, 2011.
Liu, X. and Battisti, D. S.: The Influence of Orbital Forcing of Tropical Insolation on the Climate and Isotopic Composition of Precipitation in South America, J. Clim., 28, 4841–4862, https://doi.org/10.1175/JCLI-D-14-00639.1, 2015.
Liu, Z., Wen, X., Brady, E. C., Otto-Bliesner, B., Yu, G., Lu, H., Cheng, H., Wang, Y., Zheng, W., Ding, Y., Edwards, R. L., Cheng, J., Liu, W., and Yang, H.: Chinese cave records and the East Asia Summer Monsoon, Quat. Sci. Rev., 83, 115–128, https://doi.org/10.1016/j.quascirev.2013.10.021, 2014.
Lorenz, S. J. and Lohmann, G.: Acceleration technique for Milankovitch type forcing in a coupled atmosphere-ocean circulation model: method and application for the Holocene, Clim. Dyn., 23, 727–743, https://doi.org/10.1007/s00382-004-0469-y, 2004.
Marzocchi, A., Lunt, D. J., Flecker, R., Bradshaw, C. D., Farnsworth, A., and Hilgen, F. J.: Orbital control on late Miocene climate and the North African monsoon: insight from an ensemble of sub-precessional simulations, Clim. Past, 11, 1271–1295, https://doi.org/10.5194/cp-11-1271-2015, 2015.
McDougall, I., Brown, F. H., and Fleagle, J. G.: Stratigraphic placement and age of modern humans from Kibish, Ethiopia, Nature, 433, 733–736, https://doi.org/10.1038/nature03258, 2005.
Messori, G., Gaetani, M., Zhang, Q., Zhang, Q., and Pausata, F. S. R.: The water cycle of the mid-Holocene West African monsoon: The role of vegetation and dust emission changes, Int. J. Climatol., 39, 1927–1939, https://doi.org/10.1002/joc.5924, 2019.
Moore, M., Kuang, Z., and Blossey, P. N.: A moisture budget perspective of the amount effect, Geophys. Res. Lett., 41, 1329–1335, https://doi.org/10.1002/2013GL058302, 2014.
Muschitiello, F., Zhang, Q., Sundqvist, H. S., Davies, F. J., and Renssen, H.: Arctic climate response to the termination of the African Humid Period, Quat. Sci. Rev., 125, 91–97, https://doi.org/10.1016/j.quascirev.2015.08.012, 2015.
Neale, R. B., Chen, C.-C., Gettelman, A., Lauritzen, P. H., Park, S., Williamson, D. L., Conley, A. J., Garcia, R., Kinnison, D., Lamarque, J.-F., Marsh, D., Mills, M., Smith, A. K., Tilmes, S., Vitt, F., Morrison, H., Cameron-Smith, P., Collins, W. D., Iacono, M. J., Easter, R. C., Ghan, S. J., Liu, X., Rasch, P. J., and Taylor, M. A.: Description of the NCAR community atmosphere model (CAM 5.0), NCAR Tech Note NCARTN-486 STR, 1, 1–12, https://opensky.ucar.edu/system/files/2024-08/technotes_594.pdf (last access: April 2026), 2010.
Nusbaumer, J., Wong, T. E., Bardeen, C., and Noone, D.: Evaluating hydrological processes in the Community Atmosphere Model Version 5 (CAM5) using stable isotope ratios of water, J. Adv. Model. Earth Syst., 9, 949–977, https://doi.org/10.1002/2016MS000839, 2017.
Oleson, K. W., Lawrence, D. M., Flanner, M. G., Kluzek, E., Levis, S., Swenson, S. C., Thornton, E., Dai, A., Decker, M., Dickinson, R., Feddema, J., Heald, C. L., Lamarque, J.-F., Niu, G.-Y., Qian, T., Running, S., Sakaguchi, K., Slater, A., Stöckli, R., Wang, A., Yang, L., Zeng, X., and Zeng, X.: Technical Description of version 4.0 of the Community Land Model (CLM), NCAR Tech Note NCARTN-4781STR, 257, https://doi.org/10.5065/D6FB50WZ, 2010.
O'Mara, N. A., Skonieczny, C., McGee, D., Winckler, G., Bory, A. J.-M., Bradtmiller, L. I., Malaizé, B., and Polissar, P. J.: Pleistocene drivers of Northwest African hydroclimate and vegetation, Nat. Commun., 13, 3552, https://doi.org/10.1038/s41467-022-31120-x, 2022.
O'Neil, J. R., Clayton, R. N., and Mayeda, T. K.: Oxygen Isotope Fractionation in Divalent Metal Carbonates, J. Chem. Phys., 51, 5547–5558, https://doi.org/10.1063/1.1671982, 1969.
Patricola, C. M. and Cook, K. H.: Dynamics of the West African Monsoon under Mid-Holocene Precessional Forcing: Regional Climate Model Simulations, J. Clim., 20, 694–716, https://doi.org/10.1175/JCLI4013.1, 2007.
Pausata, F. S. R., Battisti, D. S., Nisancioglu, K. H., and Bitz, C. M.: Chinese stalagmite δ18O controlled by changes in the Indian monsoon during a simulated Heinrich event, Nat. Geosci., 4, 474–480, https://doi.org/10.1038/ngeo1169, 2011.
Pausata, F. S. R., Messori, G., and Zhang, Q.: Impacts of dust reduction on the northward expansion of the African monsoon during the Green Sahara period, Earth Planet. Sci. Lett., 434, 298–307, https://doi.org/10.1016/j.epsl.2015.11.049, 2016.
Pausata, F. S. R., Gaetani, M., Messori, G., Berg, A., Maia De Souza, D., Sage, R. F., and deMenocal, P. B.: The Greening of the Sahara: Past Changes and Future Implications, One Earth, 2, 235–250, https://doi.org/10.1016/j.oneear.2020.03.002, 2020.
Pokras, E. M. and Mix, A. C.: Earth's precession cycle and Quaternary climatic change in tropical Africa, Nature, 326, 486–487, https://doi.org/10.1038/326486a0, 1987.
Revel, M., Ducassou, E., Grousset, F. E., Bernasconi, S. M., Migeon, S., Revillon, S., Mascle, J., Murat, A., Zaragosi, S., and Bosch, D.: 100 000 Years of African monsoon variability recorded in sediments of the Nile margin, Quat. Sci. Rev., 29, 1342–1362, https://doi.org/10.1016/j.quascirev.2010.02.006, 2010.
Risi, C., Bony, S., and Vimeux, F.: Influence of convective processes on the isotopic composition (δ18O and δD) of precipitation and water vapor in the tropics: 2. Physical interpretation of the amount effect, J. Geophys. Res. Atmos., 113, 306, https://doi.org/10.1029/2008JD009943, 2008.
Roe, G. H., Ding, Q., Battisti, D. S., Molnar, P., Clark, M. K., and Garzione, C. N.: A modeling study of the response of Asian summertime climate to the largest geologic forcings of the past 50 Ma, J. Geophys. Res.: Atmos, 121, 5453–5470, https://doi.org/10.1002/2015JD024370, 2016.
Rohling, E. J., Marino, G., and Grant, K. M.: Mediterranean climate and oceanography, and the periodic development of anoxic events (sapropels), Earth Sci. Rev., 143, 62–97, https://doi.org/10.1016/j.earscirev.2015.01.008, 2015.
Rose, C., Polissar, P. J., Tierney, J. E., Filley, T., and deMenocal, P. B.: Changes in northeast African hydrology and vegetation associated with Pliocene–Pleistocene sapropel cycles, Philos. Trans. R. Soc. B, 371, 20150243, https://doi.org/10.1098/rstb.2015.0243, 2016.
Schneider, T., Bischoff, T., and Haug, G. H.: Migrations and dynamics of the intertropical convergence zone, Nature, 513, 45–53, https://doi.org/10.1038/nature13636, 2014.
Schurgers, G., Mikolajewicz, U., Gröger, M., Maier-Reimer, E., Vizcaíno, M., and Winguth, A.: The effect of land surface changes on Eemian climate, Clim. Dyn., 29, 357–373, https://doi.org/10.1007/s00382-007-0237-x, 2007.
Selami, N., Sèze, G., Gaetani, M., Grandpeix, J.-Y., Flamant, C., Cuesta, J., and Benabadji, N.: Cloud Cover over the Sahara during the Summer and Associated Circulation Features, Atmosphere, 12, 428–460, https://doi.org/10.3390/atmos12040428, 2021.
Shi, X., Cauquoin, A., Lohmann, G., Jonkers, L., Wang, Q., Yang, H., Sun, Y., and Werner, M.: Simulated stable water isotopes during the mid-Holocene and pre-industrial periods using AWI-ESM-2.1-wiso, Geosci. Model Dev., 16, 5153–5178, https://doi.org/10.5194/gmd-16-5153-2023, 2023.
Shi, X., Werner, M., Pausata, F. S. R., Yang, H., Liu, J., D'Agostino, R., Ingrosso, R., Yang, C., Gao, Q., and Lohmann, G.: On the length and intensity of the West African summer monsoon during the last interglacial African humid period, Quat. Sci. Rev., 328, 108542, https://doi.org/10.1016/j.quascirev.2024.108542, 2024.
Shi, X., Werner, M., Wang, Q., Yang, H., and Lohmann, G.: Simulated Mid-Holocene and Last Interglacial Climate Using Two Generations of AWI-ESM, J. Clim., 35, 7811–7831, https://doi.org/10.1175/JCLI-D-22-0354.1, 2022.
Shi, X., Werner, M., Yang, H., Gao, Q., Liu, J., and Lohmann, G.: Precession Controls on Climate and Water Isotope Signals in Northern Africa, Paleoceanogr. Paleoclimatol., 40, https://doi.org/10.1029/2024PA004999, 2025.
Skonieczny, C., McGee, D., Winckler, G., Bory, A., Bradtmiller, L. I., Kinsley, C. W., Polissar, P. J., De Pol-Holz, R., Rossignol, L., and Malaizé, B.: Monsoon-driven Saharan dust variability over the past 240,000 years, Sci. Adv., 5, https://doi.org/10.1126/sciadv.aav1887, 2019.
Smith, R., Jones, P., Briegleb, B., Bryan, F., Danabasoglu, G., Dennis, J., Dukowicz, J., Eden, C., Fox-Kemper, B., Gent, P., Hecht, M., Jayne, S., Jochum, M., Large, M., Lindsay, K., Maltrud, M., Norton, N., Peacock, S., Vertenstein, M., and Yeager, S.: The parallel ocean program (POP) reference manual: Ocean component of the community climate system model (CCSM), LAUR-01853, 141, 1–141, https://opensky.ucar.edu/system/files/2024-09/manuscripts_825.pdf (last access: April 2026), 2010.
Sultan, B. and Gaetani, M.: Agriculture in West Africa in the Twenty-First Century: Climate Change and Impacts Scenarios, and Potential for Adaptation, Front. Plant Sci., 7, 1262, https://doi.org/10.3389/fpls.2016.01262, 2016.
Sultan, B. and Janicot, S.: The West African Monsoon Dynamics. Part II: The “Preonset” and “Onset” of the Summer Monsoon, J. Clim., 16, 3407–3427, https://doi.org/10.1175/JCLI-D-22-0289.1, 2003.
Sultan, B., Baron, C., Dingkuhn, M., Sarr, B., and Janicot, S.: Agricultural impacts of large-scale variability of the West African monsoon, Agric. For. Meteorol., 128, 93–110, https://doi.org/10.1016/j.agrformet.2004.08.005, 2005.
Tabor, C. R., Otto-Bliesner, B. L., Brady, E. C., Nusbaumer, J., Zhu, J., Erb, M. P., Wong, T. E., Liu, Z., and Noone, D.: Interpreting Precession-Driven δ18O Variability in the South Asian Monsoon Region, J. Geophys. Res. Atmos., 123, 5927–5946, https://doi.org/10.1029/2018JD028424, 2018.
Tabor, C., Otto-Bliesner, B., and Liu, Z.: Speleothems of South American and Asian Monsoons Influenced by a Green Sahara, Geophys. Res. Lett., 47, https://doi.org/10.1029/2020GL089695, 2020.
Tierney, J. E., Lewis, S. C., Cook, B. I., LeGrande, A. N., and Schmidt, G. A.: Model, proxy and isotopic perspectives on the East African Humid Period, Earth Planet. Sci. Lett., 307, 103–112, https://doi.org/10.1016/j.epsl.2011.04.038, 2011.
Tierney, J. E., Pausata, F. S. R., and deMenocal, P. B.: Rainfall regimes of the Green Sahara, Sci. Adv., 3, https://doi.org/10.1126/sciadv.1601503, 2017a.
Tierney, J. E., deMenocal, P. B., and Zander, P. D.: A climatic context for the out-of-Africa migration, Geology, 45, 1023–1026, https://doi.org/10.1130/G39457.1, 2017b.
Timm, O. and Timmermann, A.: Simulation of the Last 21 000 Years Using Accelerated Transient Boundary Conditions, J. Clim., 20, 4377–4401, https://doi.org/10.1175/JCLI4237.1, 2007.
Tuenter, E., Weber, S. L., Hilgen, F. J., and Lourens, L. J.: The response of the African summer monsoon to remote and local forcing due to precession and obliquity, Glob. Planet. Change, 36, 219–235, https://doi.org/10.1016/S0921-8181(02)00196-0, 2003.
Vaks, A., Bar-Matthews, M., Ayalon, A., Matthews, A., Halicz, L., and Frumkin, A.: Desert speleothems reveal climatic window for African exodus of early modern humans, Geology, 35, 831–834, https://doi.org/10.1130/G23794A.1, 2007.
Voigt, A., Biasutti, M., Scheff, J., Bader, J., Bordoni, S., Codron, F., Dixon, R. D., Jonas, J., Kang, S. M., Klingaman, N. P., Leung, R., Lu, J., Mapes, B., Maroon, E. A., McDermid, S., Park, J., Roehrig, R., Rose, B. E. J., Russell, G. L., Seo, J., Toniazzo, T., Wei, H.-H., Yoshimori, M., and Vargas Zeppetello, L. R.: The tropical rain belts with an annual cycle and a continent model intercomparison project: TRACMIP, J. Adv. Model. Earth Syst., 8, 1868–1891, https://doi.org/10.1002/2016MS000748, 2016.
Vuille, M., Bradley, R. S., Werner, M., Healy, R., and Keimig, F.: Modeling δ18O in precipitation over the tropical Americas: 1. Interannual variability and climatic controls, J. Geophys. Res. Atmos., 108, 4174, https://doi.org/10.1029/2001JD002038, 2003.
Waldmann, N., Torfstein, A., and Stein, M.: Northward intrusions of low- and mid-latitude storms across the Saharo-Arabian belt during past interglacials, Geology, 38, 567–570, https://doi.org/10.1130/G30654.1, 2010.
Wang, Y. J., Cheng, H., Edwards, R. L., An, Z. S., Wu, J. Y., Shen, C.-C., and Dorale, J. A.: A High-Resolution Absolute-Dated Late Pleistocene Monsoon Record from Hulu Cave, China, Science, 294, 2345–2348, https://doi.org/10.1126/science.1064618, 2001.
Weber, S. L. and Tuenter, E.: The impact of varying ice sheets and greenhouse gases on the intensity and timing of boreal summer monsoons, Quat. Sci. Rev., 30, 469–479, https://doi.org/10.1016/j.quascirev.2010.12.009, 2011.
Wen, Q., Liu, Z., Zhu, J., Yan, M., He, C., Han, J., Liu, J., and Liang, Y.: Local Insolation Drives Afro-Asian Monsoon at Orbital-Scale in Holocene, Geophys. Res. Lett., 49, https://doi.org/10.1029/2021GL097661, 2022.
Wen, Q., Liu, Z., Jing, Z., Clemens, S. C., Wang, Y., Yan, M., Ning, L., and Liu, J.: Grand dipole response of Asian summer monsoon to orbital forcing, Npj Clim. Atmo. Sci., 7, 1–11, https://doi.org/10.1038/s41612-024-00749-4, 2024.
Werner, M., Langebroek, P. M., Carlsen, T., Herold, M., and Lohmann, G.: Stable water isotopes in the ECHAM5 general circulation model: Toward high-resolution isotope modeling on a global scale, J. Geophys. Res. Atmos., 116, https://doi.org/10.1029/2011JD015681, 2011.
Yin, Q. and Berger, A.: Interglacial analogues of the Holocene and its natural near future, Quat. Sci. Rev., 120, 28–46, https://doi.org/10.1016/j.quascirev.2015.04.008, 2015.
Ziegler, M., Tuenter, E., and Lourens, L. J.: The precession phase of the boreal summer monsoon as viewed from the eastern Mediterranean (ODP Site 968), Quat. Sci. Rev., 29, 1481–1490, https://doi.org/10.1016/j.quascirev.2010.03.011, 2010.
- Abstract
- Introduction
- Data and methods
- Data-model comparison
- Mechanism of rainfall change
- Mechanism of δ18Op change
- Conclusions
- Appendix A: Additional material
- Code and data availability
- Author contributions
- Competing interests
- Disclaimer
- Acknowledgements
- Financial support
- Review statement
- References