the Creative Commons Attribution 4.0 License.
the Creative Commons Attribution 4.0 License.
 | 28 Apr 2026
Regulation of cloud particle spectra and vertical structure by sub-cloud aerosols: insights from aircraft observations and numerical simulations
Deyu Liu
Yue Chen
Sihan Liu
Honglei Wang
Jingyi Chen
Yang Yang
Zihan Wang
Kun Cui
Tianliang Zhao
Aerosol–cloud interactions are key processes affecting cloud microphysics, precipitation formation, and climate system energy balance. Using aircraft observations from Hebei and parcel model simulations, the spectral characteristics, vertical structures, and response of cloud particles to aerosols are systematically analysed. Observations show that in liquid and mixed-phase clouds, droplet number concentrations exhibit bimodal peaks at diameters of 5–7 µm and 14–15 µm, while ice and mixed-phase clouds display ice crystal peaks near 125 and 1550 µm. Under high aerosol loading, ice crystal number concentrations increase at both small and large sizes but decrease at intermediate sizes. Under high sub-cloud aerosol loading, effective droplet diameters in the lower part (H<0.3, H is normalized cloud height) of liquid and mixed-phase clouds are 2.4 and 2.8 µm larger, respectively, than those in the upper part (H>0.7). The lower cloud layers also exhibit higher droplet number concentrations and broader size distributions. Under low-aerosol loading, the upper part of liquid and mixed-phase clouds contains droplets that are 2.7 and 4.4 µm larger than those in the lower part, respectively. The droplet number concentrations are higher in the upper layers for both cloud types. In ice clouds, high aerosol loading yield decreasing ice crystal number concentrations with height and effective radius that first increase but then decrease. Sensitivity experiments reveal that increasing aerosol concentrations cause a monotonic increase in droplet number concentrations. High aerosol concentrations amplify vapor competition and latent heat release, increasing temperature and reducing supersaturation, reducing the effective radius. These findings provide improved constraints for representing aerosol–cloud interactions in weather and climate models.
- Article
(9303 KB) - Full-text XML
- BibTeX
- EndNote


Atmospheric aerosols, as a key component of the Earth's climate system, play a crucial role in climate studies by influencing cloud microphysics and precipitation characteristics (Calvin et al., 2023). Aerosols can act as cloud condensation nuclei (CCN) and ice nuclei (IN), thereby influencing cloud microphysical properties by affecting the formation of cloud droplets and ice crystals as well as cloud particle number concentrations, size distributions, and liquid and solid water contents (Chen et al., 2019; Sun and Ariya, 2006). In this way, they substantially affect cloud optical properties, lifetime, and precipitation efficiency (Hoffmann et al., 2024; Zhao et al., 2024). Recent observational and modelling studies have further demonstrated that aerosol concentration and size exert complex and significant regulatory effects on the microphysical structures of various cloud types (Christensen et al., 2020; Koren et al., 2014).
Cloud physical processes are highly complex, especially those governing precipitation formation and aerosol–cloud interactions, which notably influence cloud lifetime and size. A major challenge in cloud microphysics research is understanding how small-scale turbulence and mixing processes shape the macroscopic evolution of clouds, particularly droplet size distributions, and how in situ observations can effectively characterize these features (Barrett et al., 2020; Chen et al., 2020; Kumar et al., 2021). Owing to these complexities, clouds remain the greatest source of uncertainty in climate sensitivity estimates (Chalmers et al., 2022; Sherwood et al., 2020).
Clouds are generally classified by phase into liquid, ice, and mixed-phase types. In recent years, anthropogenic emissions in populated regions have substantially increased aerosol concentrations (Tsimpidi et al., 2025), rendering aerosol–cloud interactions key factors influencing cloud formation, evolution, and dissipation. Aerosols affect clouds through direct (Coakley et al., 1983), semi-direct (Wilcox, 2012), and indirect effects (Albrecht, 1989; Twomey, 1977). Among observational methods, aircraft measurements are particularly valuable for investigating cloud and precipitation microphysics (Lawson et al., 2017; Liu et al., 2025; Noh et al., 2013), as they provide direct observations of macroscopic and microscopic cloud properties, including liquid water content (LWC), ice water content (IWC), cloud droplet and ice crystal number concentrations, and aerosols.
In China, aircraft-based cloud observations, which have been conducted since the 1960s, have become fundamental data sources, yielding numerous significant findings (Chang et al., 2019; Feng et al., 2021; Wang et al., 2014; Zhao et al., 2018). For example, in South China's Guangxi region, Liu et al. (2025) analysed nine aircraft flights conducted in 2020 to investigate the diurnal variation of stratocumulus clouds and the impact of aerosols on cloud microphysical properties. They found that aerosol number concentration and cloud droplet effective radius exhibited the typical Twomey effect and highlighted the important influence of boundary-layer height on the microphysical structure. Based on 35 aircraft flights conducted over the North China Plain during 2019–2021, Ke et al. (2025) further investigated the influence of boundary-layer–cloud coupling processes on cloud microphysical variables.
Recent research on aerosol–cloud interactions has advanced substantially. Liu et al. (2024) reported that fine aerosols (FA), acting as CCN, suppress precipitation and reduce the effective radius of cloud droplets, whereas coarse sea spray aerosols (CSA), as giant CCN, increase rainfall and increase droplet size. In convective cloud chamber experiments, Yeom et al. (2025) reported that entrained aerosols increase droplet number concentrations, reduce effective droplet diameters, increase the LWC, narrow droplet size distributions, and brighten clouds. Using machine learning, Zhang et al. (2025) reported that higher aerosol concentrations are associated with lower cloud water content, likely because of the enhanced entrainment of dry free-tropospheric air, which increases cloud evaporation and water loss.
Aerosol–cloud interactions over the North China Plain are critical for regional weather and climate. Aircraft observations have been widely employed to study these effects (Dong et al., 2022; Gultepe and Isaac, 2004). Che et al. (2021) reported that under elevated nighttime relative humidity, ammonium salts promote secondary organic aerosol (SOA) formation and that ice-nucleating particles concentrations correlate strongly with aerosol particles exceeding 0.5 µm in diameter, resulting in morning mixed-phase cloud ice crystal concentrations approximately 30 % higher than those at noon. Wu et al. (2022), who analysed winter ice cloud data from 22 flights over the North China Plain, reported that mixed-phase clouds dominate and observed aggregation and riming processes. Du et al. (2024), on the basis of aircraft measurements, demonstrated substantial secondary ice production within embedded convective cells in midlatitude stratiform clouds, with ice crystal concentrations strongly dependent on proximity to cloud tops, highlighting the importance of the seeder-feeder mechanism in cloud glaciation and precipitation.
Significant progress has also been made in modelling aerosol–cloud interactions. Christensen et al. (2023) compared observed CCN concentrations and airborne/ground measurements with E3SMv1(Energy Exascale Earth System Model) simulations to assess aerosol impacts on cloud properties and radiative forcing in low-level clouds. Via the use of Weather Research and Forecasting (WRF) sensitivity experiments, Li et al. (2024) reported that higher aerosol concentrations promote cloud formation and broaden the droplet spectrum, whereas lower concentrations inhibit cloud development. By employing high-resolution regional atmospheric modelling system (RAMS) simulations, Leung and Van Den Heever (2023)demonstrated that high aerosol concentration gradients can drive an aerosol breeze, influencing mesoscale circulation, cloud characteristics, and precipitation.
The uncertainty arises in their impact on the radiation budget through the effective radiative forcing, or through the co-variability in aerosol- and environmental-impacts on cloud properties which makes the quantification of aerosol effects alone more challenging. Moreover, it remains an open question whether aerosol impacts differ among clouds of different phase states. In this study, we combine extensive aircraft observations from 16 flights over the North China Plain between 2019 and 2021 with results from an adiabatic cloud model to systematically investigate the spectral distributions, vertical structures, and aerosol-induced responses of cloud particles across clouds of different phase states.
2.1 Aircraft observation platform and instruments
The aircraft platforms employed in this study include the modified King Air 350 (K350) and Y-12 aircraft, both of which are operated by the Hebei Weather Modification Office (HBWMO). Each platform was outfitted with an identical suite of observational instruments, comprising a Cloud Droplet Probe (CDP, The CDP measured particle sizes in the range of 2–50 µm.), a Cloud Imaging Probe (CIP), a Passive Cavity Aerosol Spectrometer Probe (PCASP-100), The 20 Hz Atmospheric Integrated Meteorological Measurement System (AIMMS-20) primarily provided basic meteorological parameters, including wind speed, wind direction, temperature, humidity, and air pressure., and a Global Positioning System (GPS) (see Table 1).
The CDP provides detailed measurements of cloud droplet number concentrations, size distributions, and liquid water content (LWC) (Faber et al., 2018). Single-particle light scattering is used to determine the diameter of individual droplets. In this study, the LWC was estimated from CDP data, whose accuracy has been previously validated (Hou et al., 2021). The CIP measures ice particle number concentrations (Ni) over a size range of 25–1550 µm (Baumgardner et al., 2001). To reduce the effects of particle shattering and to avoid ambiguities between cloud droplets and ice crystals, only particles within the 125–1500 µm range were analysed (Heymsfield and Willis, 2014 ). The PCASP measures aerosol particles ranging from 0.1 to 3 µm across 30 size channels (Strapp et al., 1992).
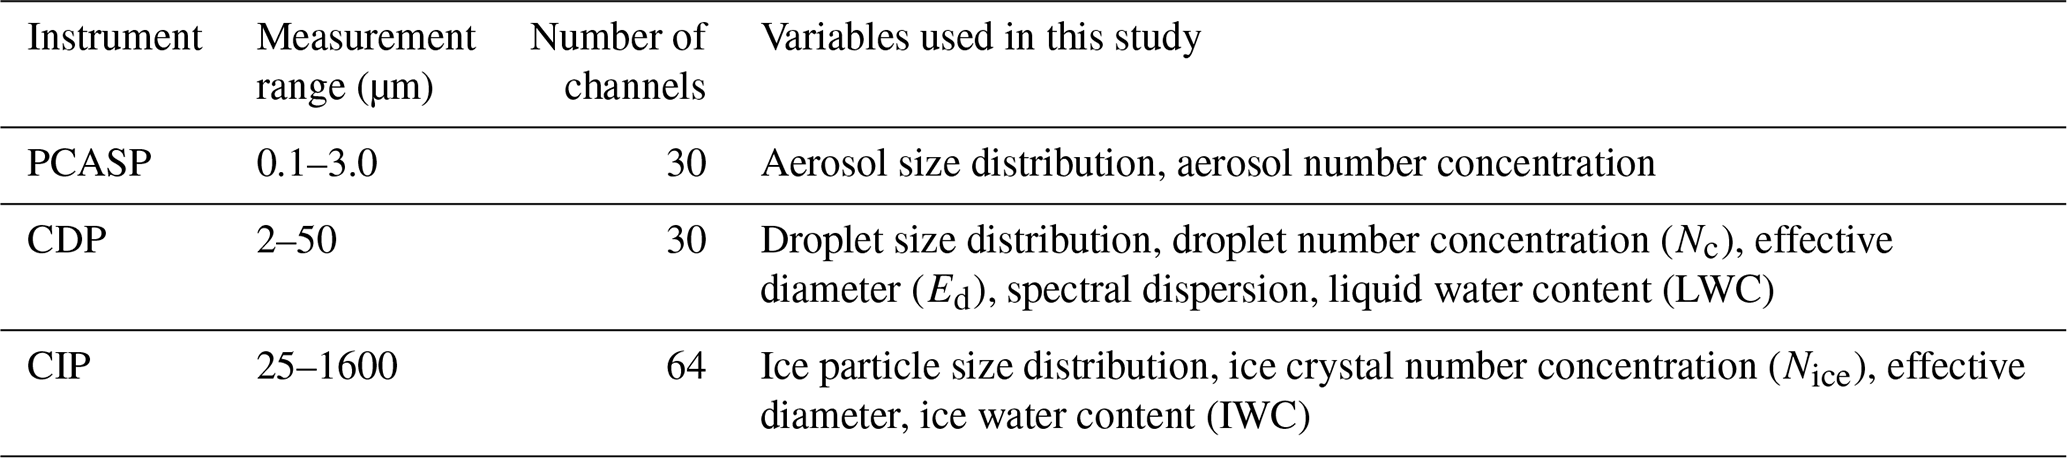
For all the particle probes, the channel centre value was used to represent the particle size. Both the CDP and the CIP were equipped with Korolev anti-shatter tips (Korolev et al., 2013), designed to gently capture particles and thereby minimize shattering due to impact or shear forces.
2.2 Data processing
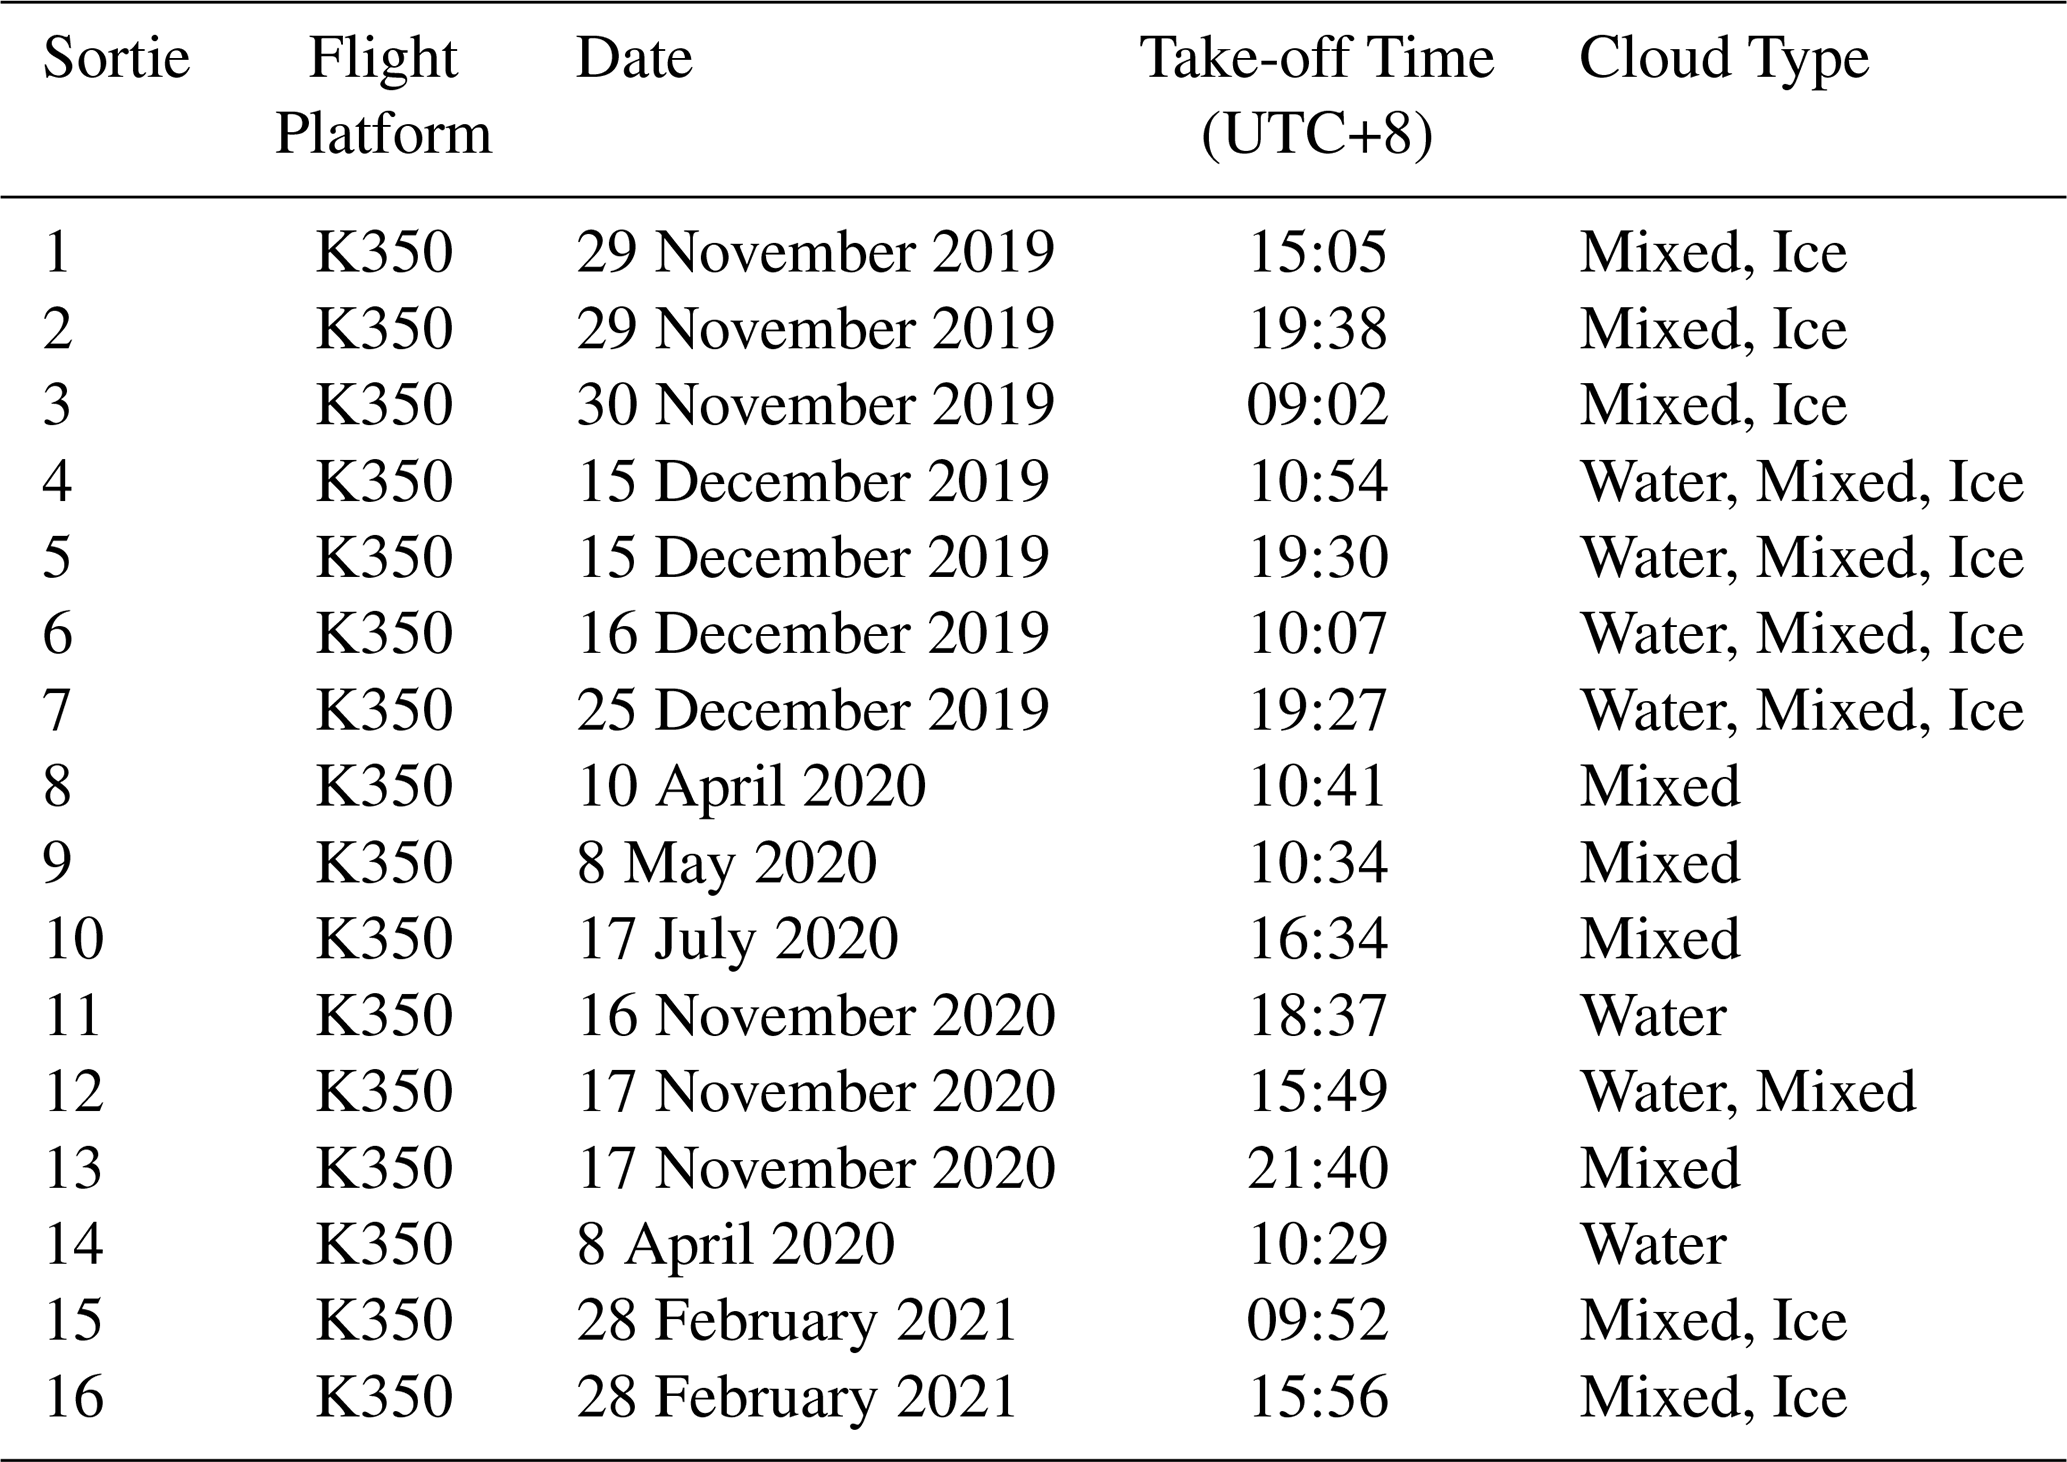
In this study, data from 35 aircraft flights conducted in the North China region between 2019 and 2021 were used. Based on observational objectives and prevailing weather conditions, 14 flights were conducted under clear-sky conditions, while 16 flights were carried out under cloudy conditions. Owing to limited data from some flights that could not represent the full cloud structure, a total of 7 flights for liquid clouds, 14 flights for mixed-phase clouds, and 8 flights for ice clouds were ultimately selected for analysis. Detailed information is provided in Table 2.
Table 2Detailed information on aircraft observation sorties (individual aircraft missions) used in this study.
The aircraft observations were conducted over the North China Plain, with most sampling flights located over Hebei Province, particularly in the region surrounding Shijiazhuang (Fig. 1). This area is characterized by a complex aerosol environment influenced by both urban emissions and regional anthropogenic sources. Major contributors include industrial emissions, traffic-related pollution, and secondary aerosols such as sulfate, nitrate, and organic aerosols. In addition, rural and agricultural activities contribute to regional aerosol loading, and the region is occasionally affected by dust transport from northern China (Huang et al., 2017; Zhang et al., 2019). Therefore, the observed aerosol population represents a mixture of urban pollution aerosols and regional background aerosols.
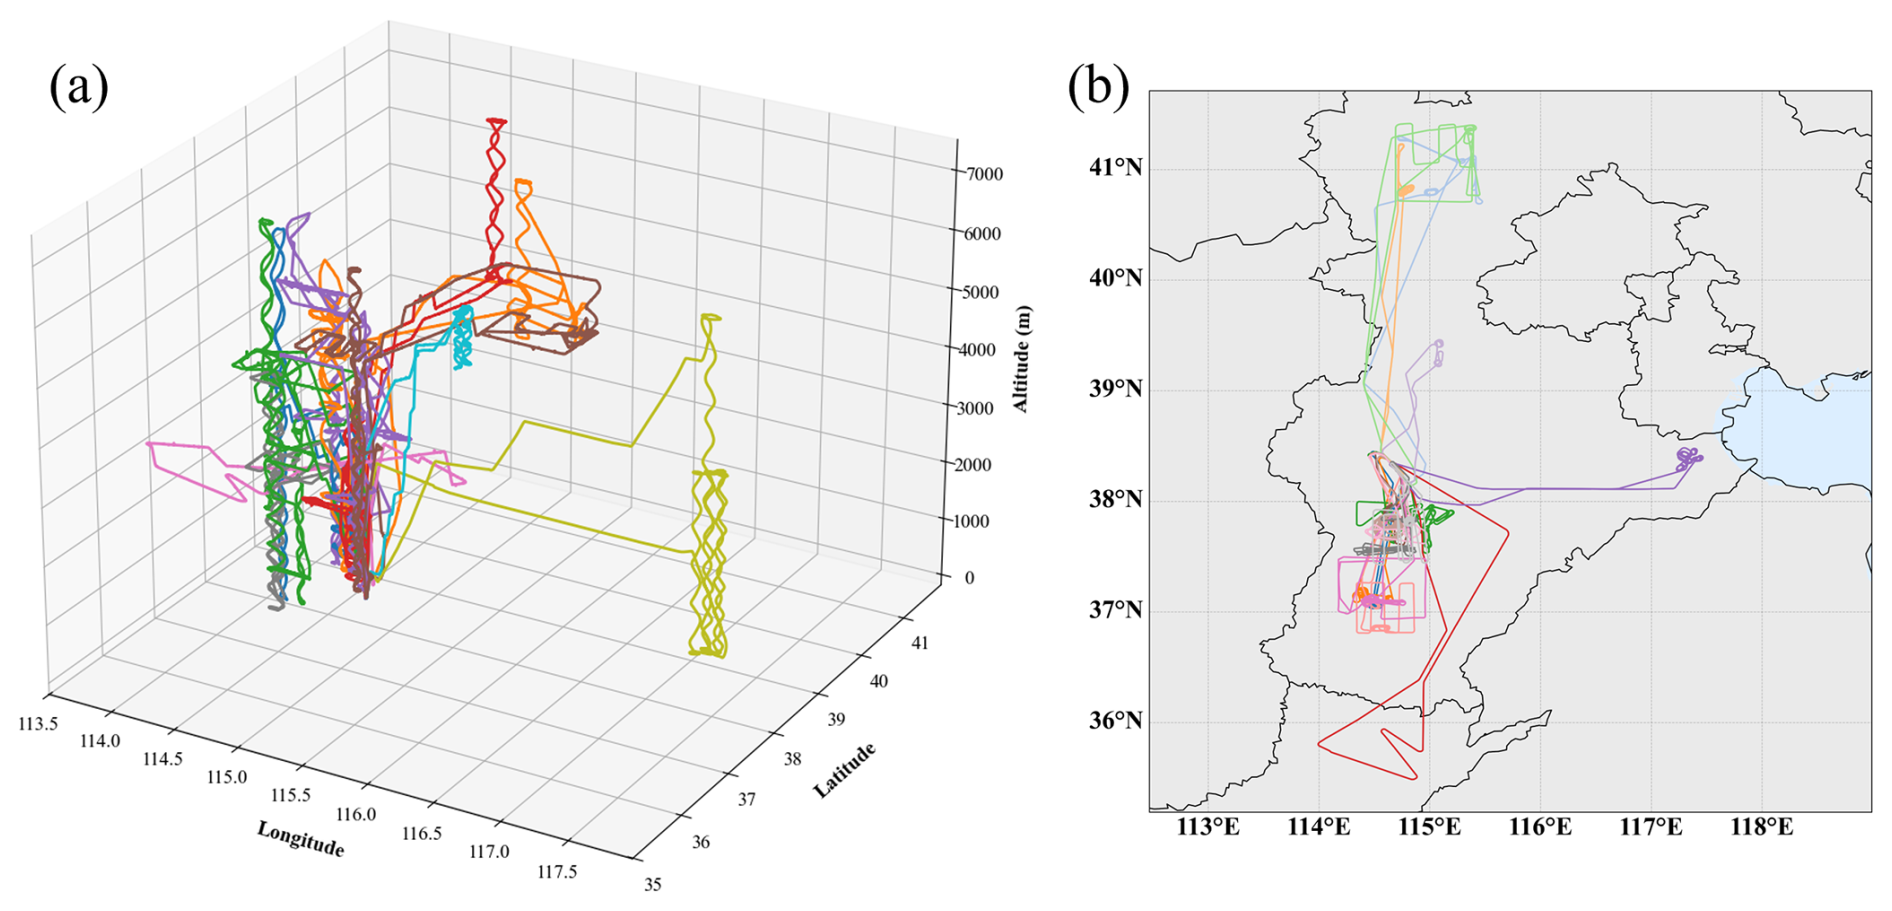
Figure 1Map of the aircraft flight tracks and observation region over the North China Plain.
The number concentration per size interval for each size channel of the CDP, CIP, and PCASP instruments was calculated as follows:
where Ni represents the number concentration distribution of the ith channel for each instrument (), ni is the number of particles in the ith channel, Vi is the sampled volume for the ith channel (L), and Δri is the bin width interval of the ith channel (µm).
The total number concentration (N, cm−3) was obtained by summing the number concentrations across all channels, as follows:
The liquid water content (LWC) was calculated on the basis of the cloud droplet size distribution measured by the CDP. The LWC was obtained by summing the product of the droplet volume and the density of water as follows:
where, ni is the cloud droplet number concentration in the ith channel (cm−3), di is the droplet diameter (µm), ρw is the density of water (g cm−3), and n is the total number of channels.
The ice water content (IWC) was calculated on the basis of the CIP particle size distribution using the mass–dimension relationship proposed by Heymsfield et al. (2007):
where M (mg) represents the mass of a single ice particle, D (mm) represents the ice particle size, m is the total number of channels, Mj represents the mass of a single particle in the jth channel, and nj represents the number concentration in the jth channel, and a and b are parameters a=0.037, b=1.9, with IWC denoting the total ice water content (g m−3). Notably, different estimation methods can still differ by approximately a factor of two (Fleishauer et al., 2002).
The cloud droplet effective diameter (Ed) is defined as the diameter calculated by the droplet volume divided by cross-sectional area and represents the characteristic size of the droplet size distribution in the cloud (Hansen and Travis, 1974):
where, di is the droplet diameter in the ith channel, and ni is the corresponding number concentration.
Cloud droplet spectral dispersion is used to characterize the width of the droplet size distribution, and is calculated as follows:
where D is the cloud droplet mean diameter, di is the droplet diameter in the ith channel, and ni is the corresponding number concentration.
2.3 Cloud phase determination
The determination of the cloud phase was based on the established criteria of Hou et al. (2021) and further refined with guidance from experts at the Hebei Weather Modification Centre. Observations that satisfied the criteria for liquid, ice, or mixed-phase clouds and whose timestamps corresponded to the macroscopic cloud stages recorded in the flight logs were classified as in-cloud observations.
An ice cloud was defined when Nc<10 cm−3, Nice>1 L−1, and the temperature was less than −5 °C; a liquid cloud was defined when Nc≥10 cm−3; and a mixed-phase cloud was defined when Nc≥1 cm−3 and Nice<1 L−1.
2.4 Parcel model
In this study, an adiabatic parcel model based on the Lagrangian approach (Chen et al., 2016, 2018) was employed to simulate the activation of cloud condensation nuclei (CCN) and water vapor condensation processes. In this model, as a parcel ascends and cools, water vapor condenses onto aerosol particles. The diffusion of water vapor is described by the condensational growth equation (Lamb and Verlinde, 2011), whereas aerosol activation and growth are governed by the κ-Köhler model (Pöschl et al., 2010). To simplify computations, the model treats the cloud parcel as a closed system, neglecting mixing, deposition, and collision-coalescence processes.
Notably, in the model, the traditionally assumed lognormal aerosol distribution was replaced with a piecewise spectrum fitted to in situ observations at the cloud base. The aerosol size distribution was divided into small-particle and large-particle ranges, separated by a cutoff diameter of 0.35 µm, which provided the best agreement with the observed spectra. In the small range, the distribution follows a lognormal function, which can be expressed as follows:
where Na is the aerosol number concentration, and r is the aerosol particle radius. The geometric standard deviation (σg) and geometric mean radius (rg) were obtained by fitting a lognormal distribution using the least squares method, with σg=1.43 and rg=0.101 µm. For the large-size range, a Junge distribution was used, expressed as follows:
where r is the aerosol particle radius, and a and b are coefficients. In this study, β was fixed at 5.5, and α was calculated on the basis of the aerosol concentration. This improved aerosol representation showed excellent agreement with the in-situ measurements (R2>0.9). A comparison between the observed aerosol spectrum and the fitted function is shown in Fig. 2.
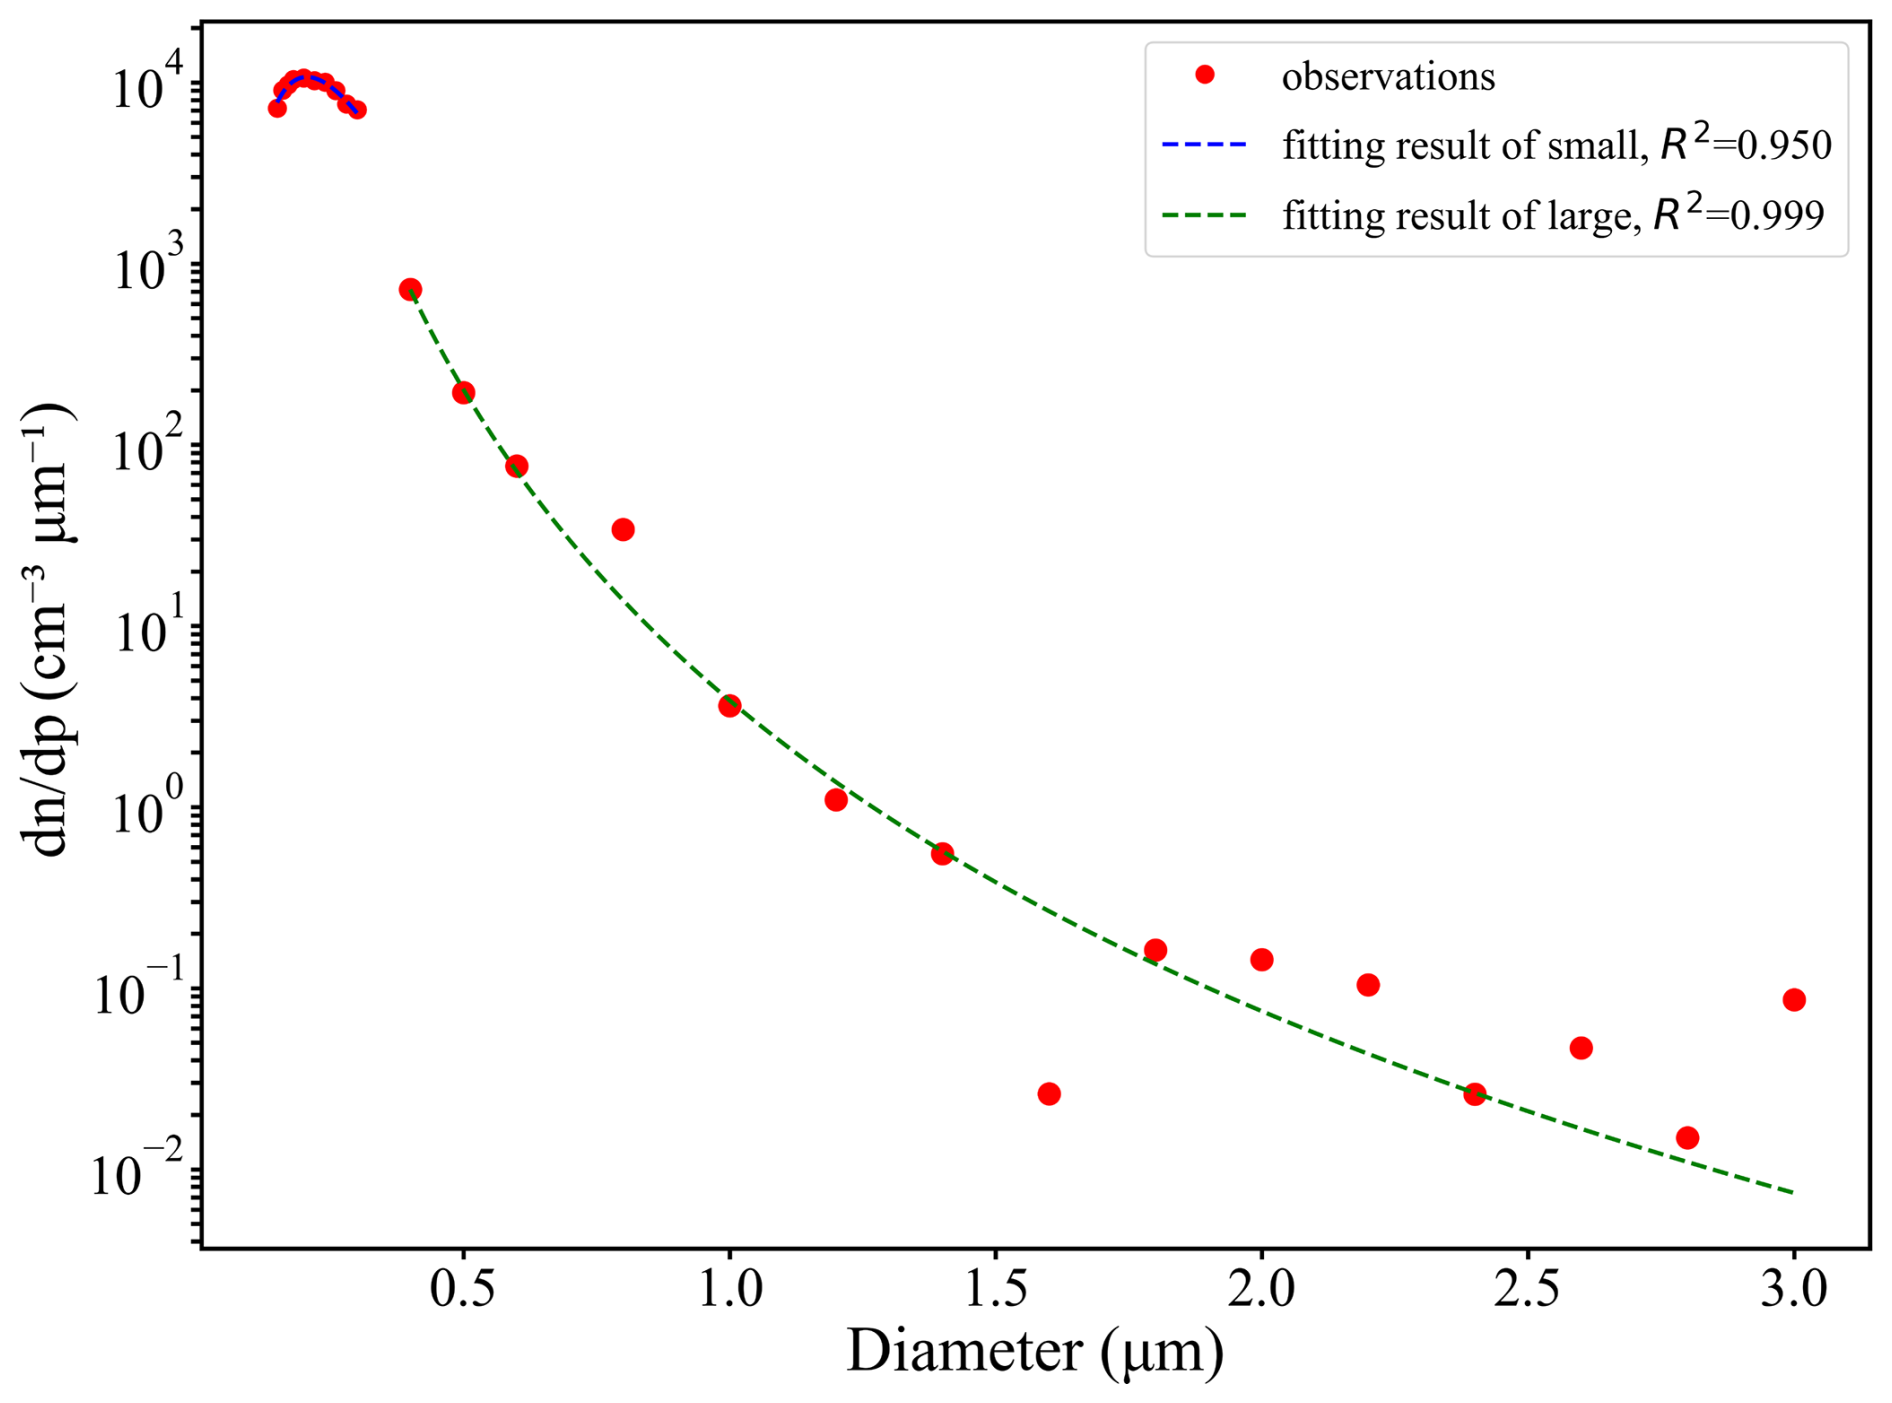
Figure 2Aerosol size distribution at cloud base fitted from in situ observations: red dots represent measured values, dashed lines show the fitted curves, blue indicates small particles, and green indicates large particles.
To examine the sensitivity of cloud microphysical properties to aerosols, a total of 66 experiments were performed. The relative humidity was fixed at 80 %, and the updraft velocity was set to 2 m s−1. Large-sized aerosol particle concentrations (>0.35 µm) were prescribed at 50, 100, 150, 200, 250, and 300 cm−3, whereas small-sized aerosol particle concentrations (<0.35 µm) were set at 100, 200, 400, 600, 800, 1000, 1200, 1400, 1600, 1800, and 2000 cm−3. The cutoff diameter separating small and large aerosols was 0.35 µm, which provided the best fit to the observed data.
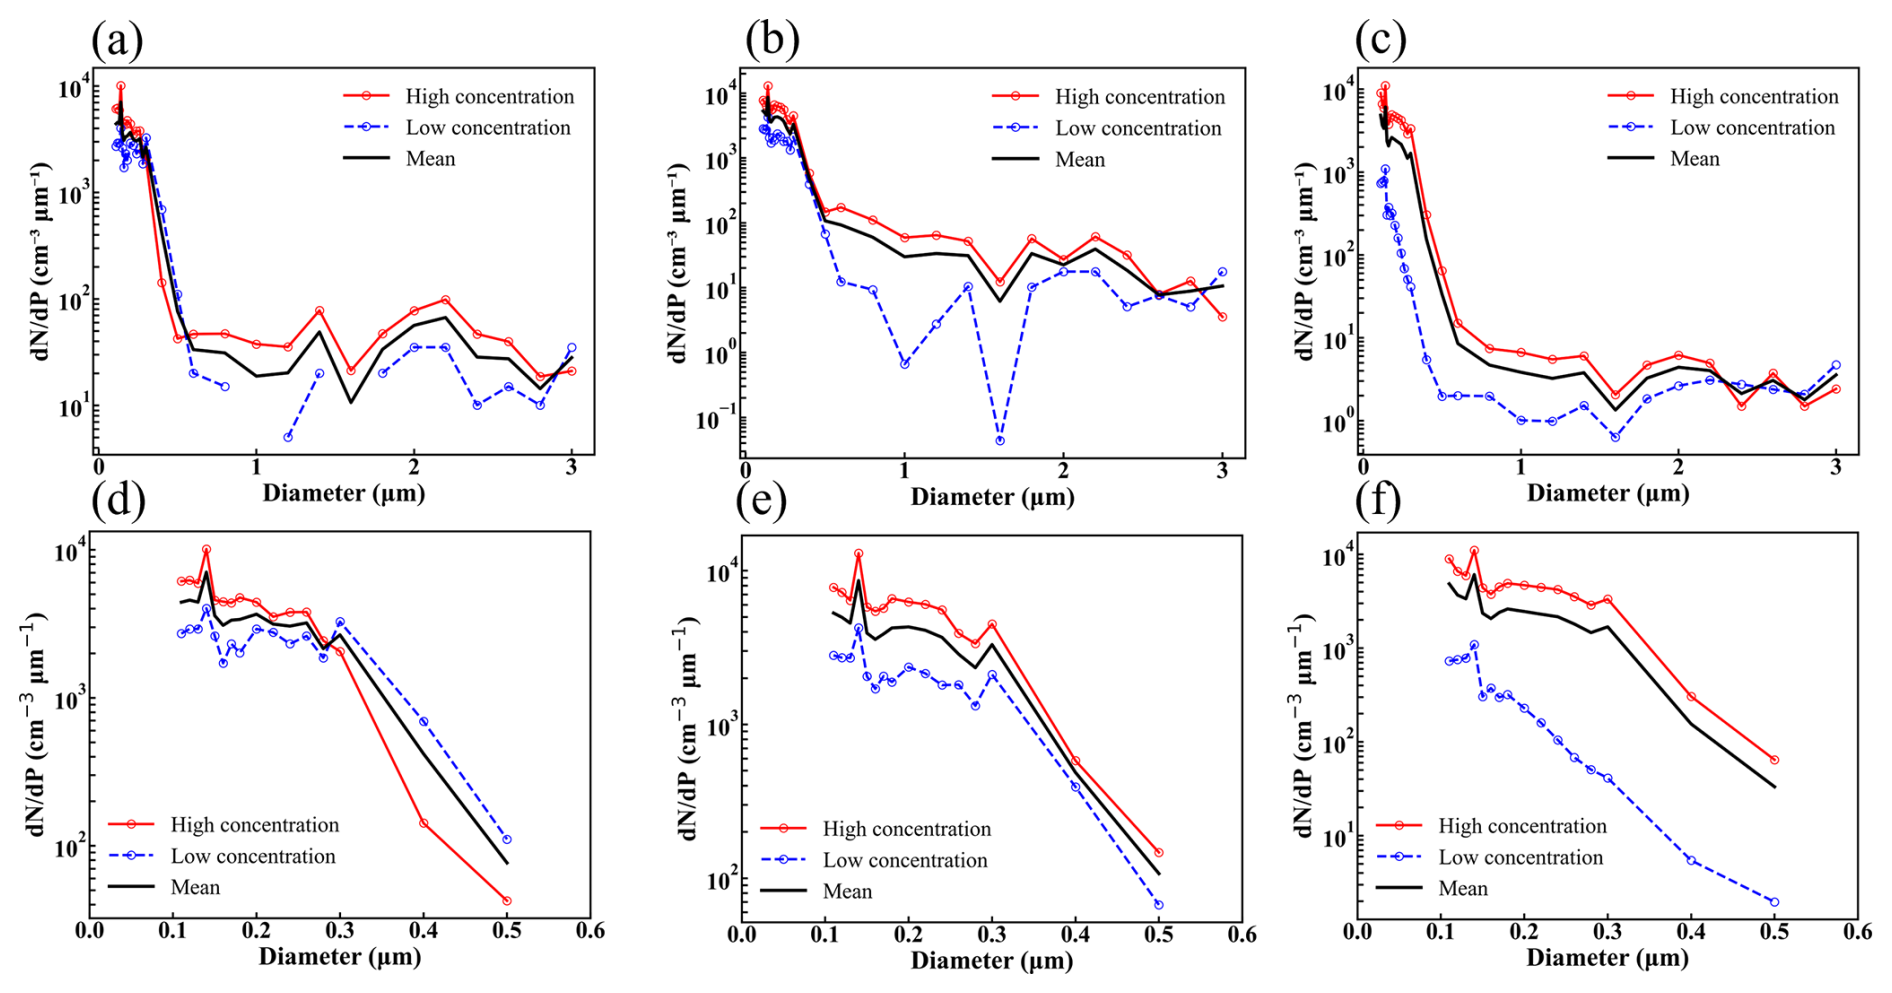
Figure 3Aerosol number size distributions below the observed clouds under different aerosol loading conditions. Panels (a–c) show the aerosol size distributions below warm, mixed-phase, and ice clouds, respectively, under high and low aerosol loading, along with the mean distribution (black line). Panels (d–f) present a zoomed-in view of the small-size range. The red and blue curves represent high- and low-aerosol conditions, respectively.
3.1 Characteristics of cloud particle distributions in different phase states
Environmental conditions at different altitudes influence physical and chemical processes, thereby affecting the formation, growth, and dissipation of cloud particles. In this study, the vertical positions of clouds from different flights were normalized to a dimensionless height parameter H ranging from 0 to 1. Clouds were divided into lower (0–0.3), middle (0.3–0.7), and upper (0.7–1) layers based on normalized height (H), and the particle distributions were analyzed within each layer.
Based on the aerosol number concentrations measured during individual flight legs, the samples are classified into high and low aerosol concentration groups, and mean values are calculated for each group. Under high aerosol conditions, the total aerosol number concentrations associated with liquid, mixed-phase, and ice clouds are 2772, 2693, and 2720 cm−3, respectively. In contrast, under low aerosol conditions, the corresponding values decrease to 622, 665, and 359 cm−3. A particle diameter of 0.35 µm is adopted as the threshold separating small and large aerosol particles. For the high-aerosol group, the number concentrations of large aerosols in liquid, mixed-phase, and ice clouds are 357, 352, and 183 cm−3, respectively, whereas the corresponding concentrations of small aerosols reach 2415, 2341, and 2537 cm−3. By comparison, under low aerosol conditions, the large aerosol number concentrations for the three cloud types are reduced to 143, 176, and 84 cm−3, and the small aerosol number concentrations decrease to 479, 489, and 275 cm−3. These results indicate that the enhanced aerosol loading under high-aerosol scenarios is primarily due to particles in the small size range (Fig. 3).
As shown in Fig. 4, in liquid clouds, the spectral width remains largely uniform across different layers, although the distribution characteristics vary. The droplet size distributions in the upper, middle, and lower layers all exhibit a bimodal pattern, with peaks at 5 and 15 µm. Under high aerosol concentrations at the cloud base (2972 cm−3), the droplet number concentration is higher in the lower layer (222 cm−3) and lower in the upper layer (32 cm−3). Droplets in the upper layer are predominantly small, whereas those in the lower layer are biased toward larger sizes. Conversely, under low aerosol concentrations at the cloud base (622 cm−3), the distribution pattern is reversed: droplets in the upper layer shift toward larger sizes, whereas those in the lower layer shift toward smaller sizes. Under high-aerosol conditions below cloud, the droplet number concentrations for sizes greater than 45 µm increase in the upper layer but remain unchanged in the middle and lower layers. In contrast, under low-aerosol conditions, elevated concentrations of droplets larger than 45 µm are observed throughout all the cloud layers.
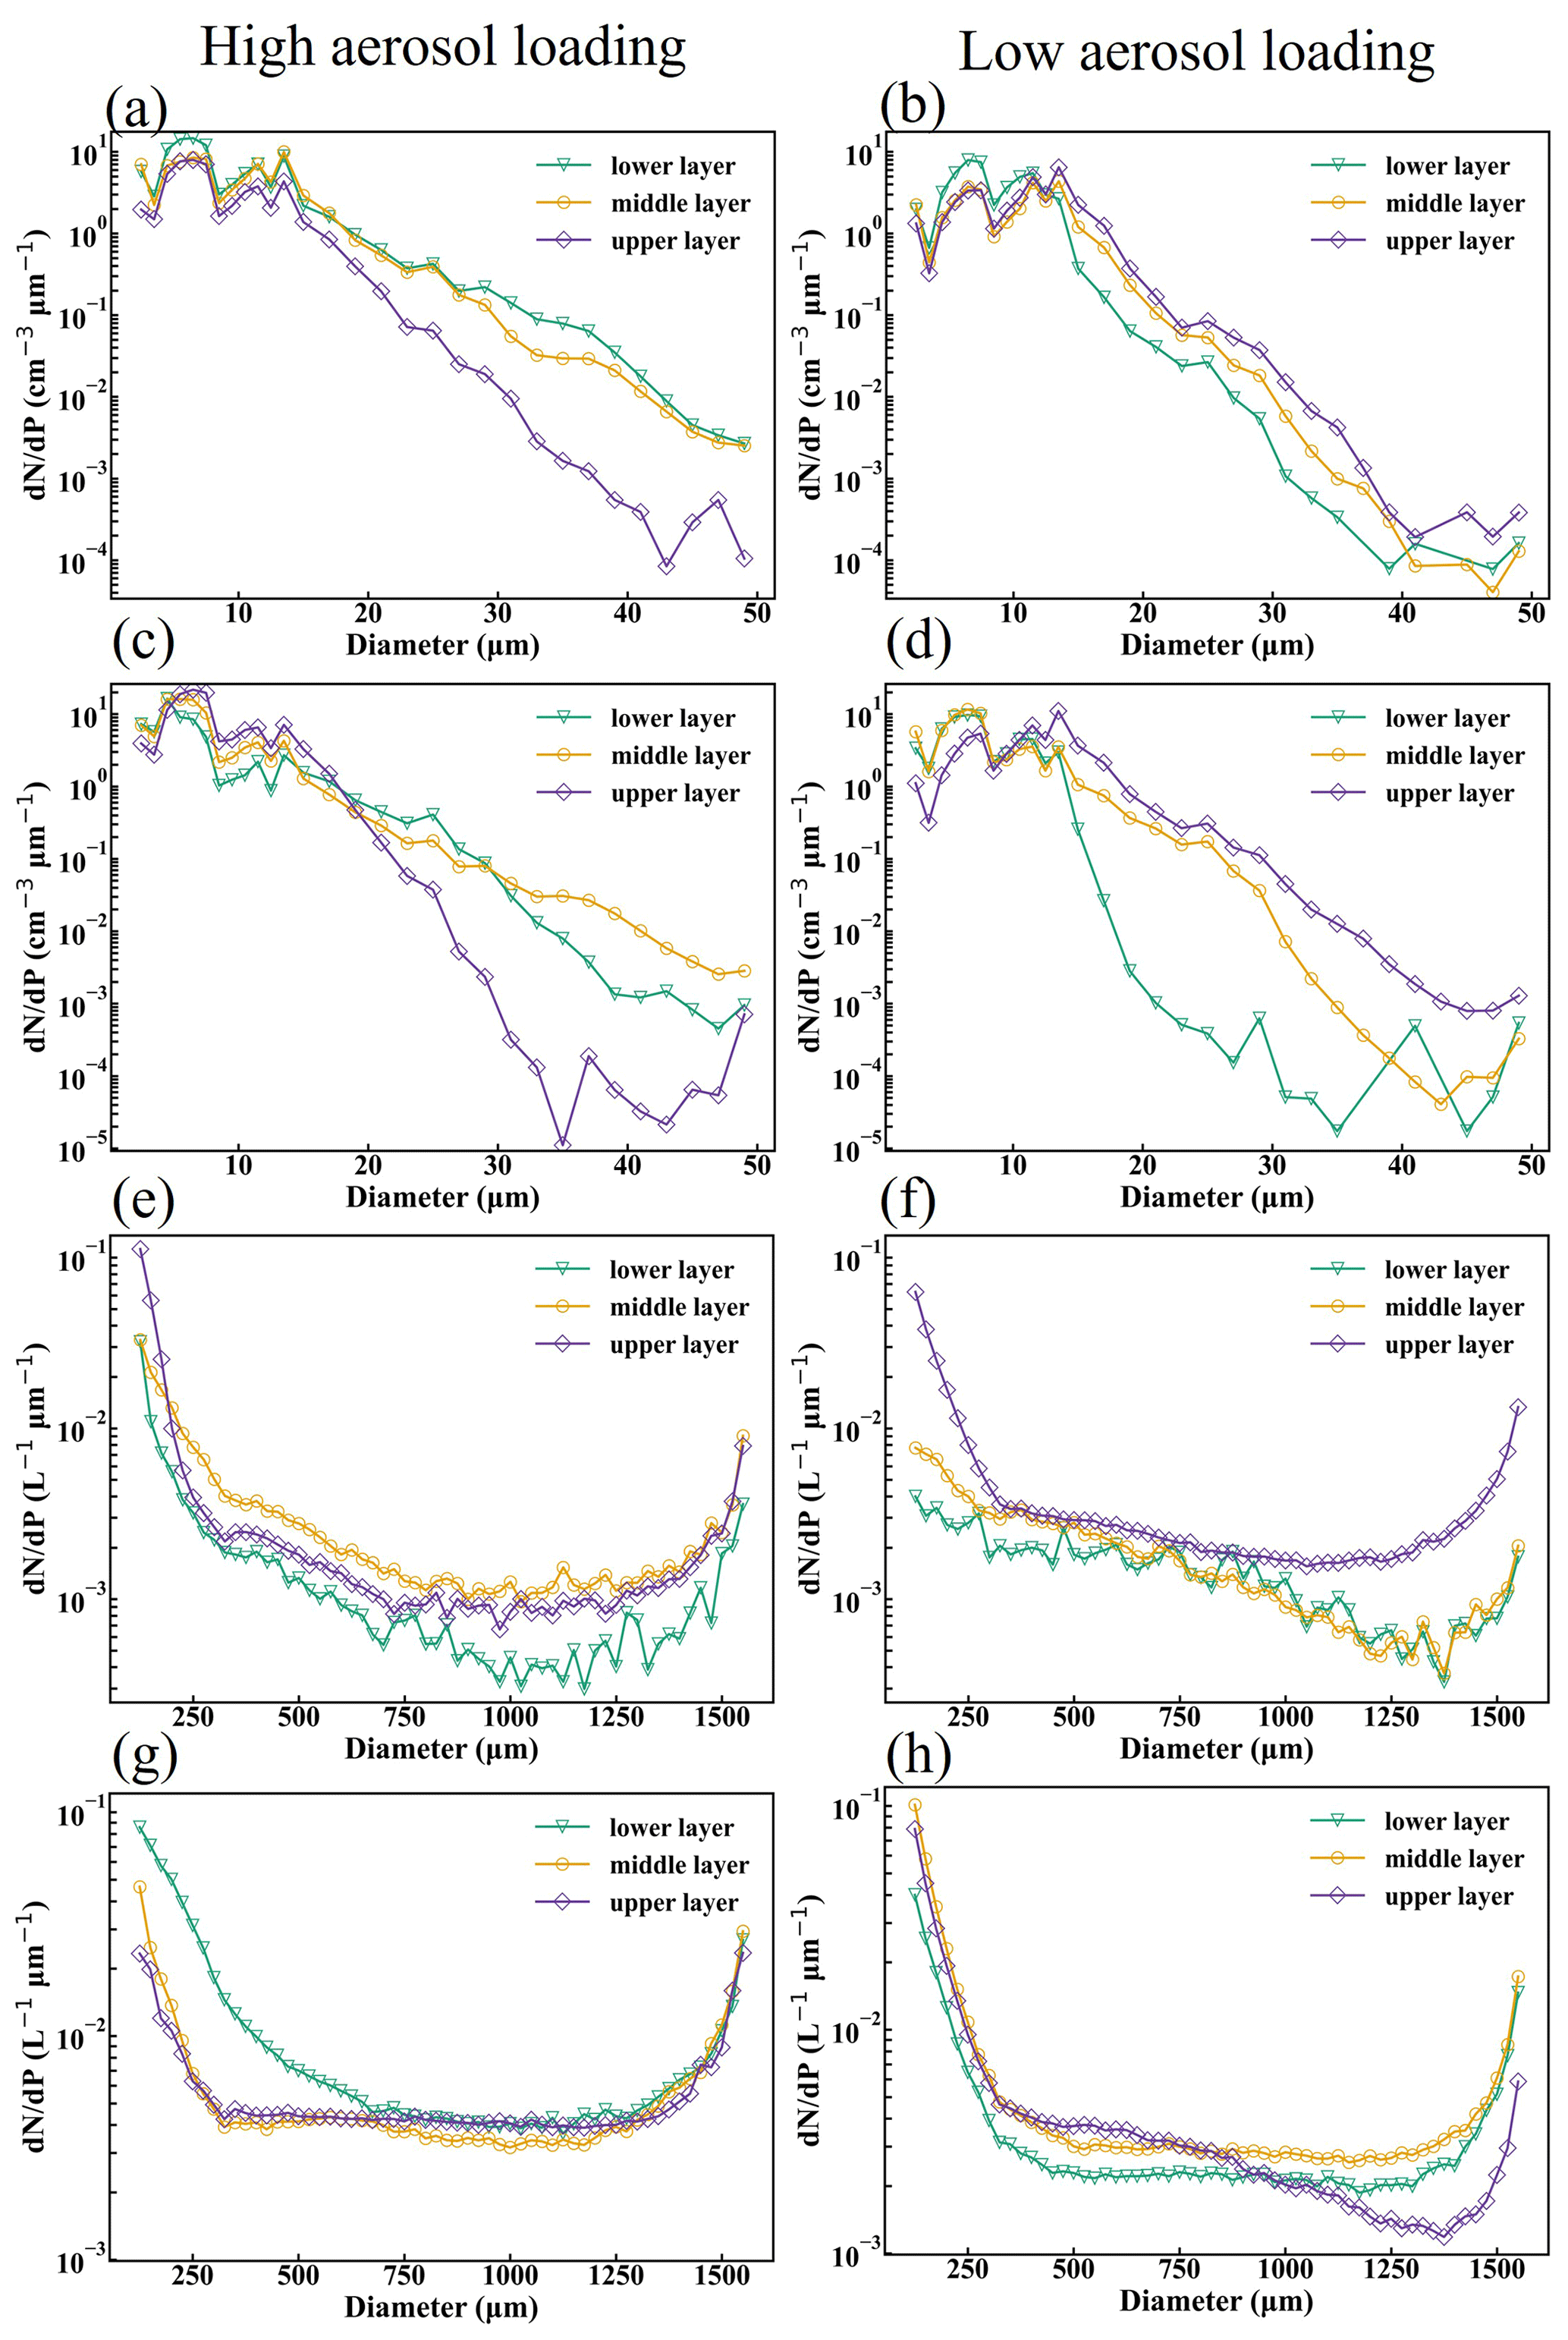
Figure 4Size distributions of cloud particles in different regions of the observed clouds under high and low aerosol loading conditions. The left column (a, c, e, g) corresponds to high aerosol loading, and the right column (b, d, f, h) corresponds to low aerosol loading. Panels (a, b) show cloud droplet spectra in warm clouds; panels (c, d) show cloud droplet spectra in mixed-phase clouds; panels (e, f) show ice crystal spectra in mixed-phase clouds; and panels (g, h) show ice crystal spectra in ice clouds. In each panel, the green, yellow, and purple curves represent the lower, middle, and upper layers of the cloud, respectively.
3.2 Vertical distribution characteristics of cloud particles in different phase states
In liquid and mixed-phase clouds, the droplet size distributions exhibit notable differences across cloud layers under varying aerosol concentrations at cloud base. However, the size distribution alone is insufficient for fully characterizing the cloud microphysical properties. To further elucidate the microphysical structure and regulatory role of aerosols, the vertical profiles of cloud particle number concentration, effective diameter, spectral dispersion, and water content were analyzed based on the dimensionless height parameter H (ranging from 0 to 1) under different cloud-base aerosol concentrations.
An increase in the aerosol concentration generally enhances the availability of cloud condensation nuclei (CCN), promoting the formation of more cloud particles (Khatri et al., 2023; Li et al., 2024). Consequently, the concentrations of both cloud droplets and ice crystals are greater in the lower layer of the cloud under high-aerosol conditions (Fig. 5a, e, i and m). Different aerosol concentrations below the clouds result in distinct vertical distributions of particle number concentrations. For liquid and mixed-phase clouds, droplet concentrations decrease with height under high-aerosol conditions but exhibit the opposite trend under low-aerosol conditions. In mixed-phase clouds, the ice crystal number concentration peaks in the middle layer (11.18 L−1) under high-aerosol conditions, whereas the lower and upper layers have smaller values (1.49 L−1). Under low-aerosol conditions, ice crystal concentrations increase with height, mirroring the droplet distribution. In ice clouds, ice crystal concentrations decrease with height under high-aerosol conditions but remain nearly constant under low-aerosol conditions.
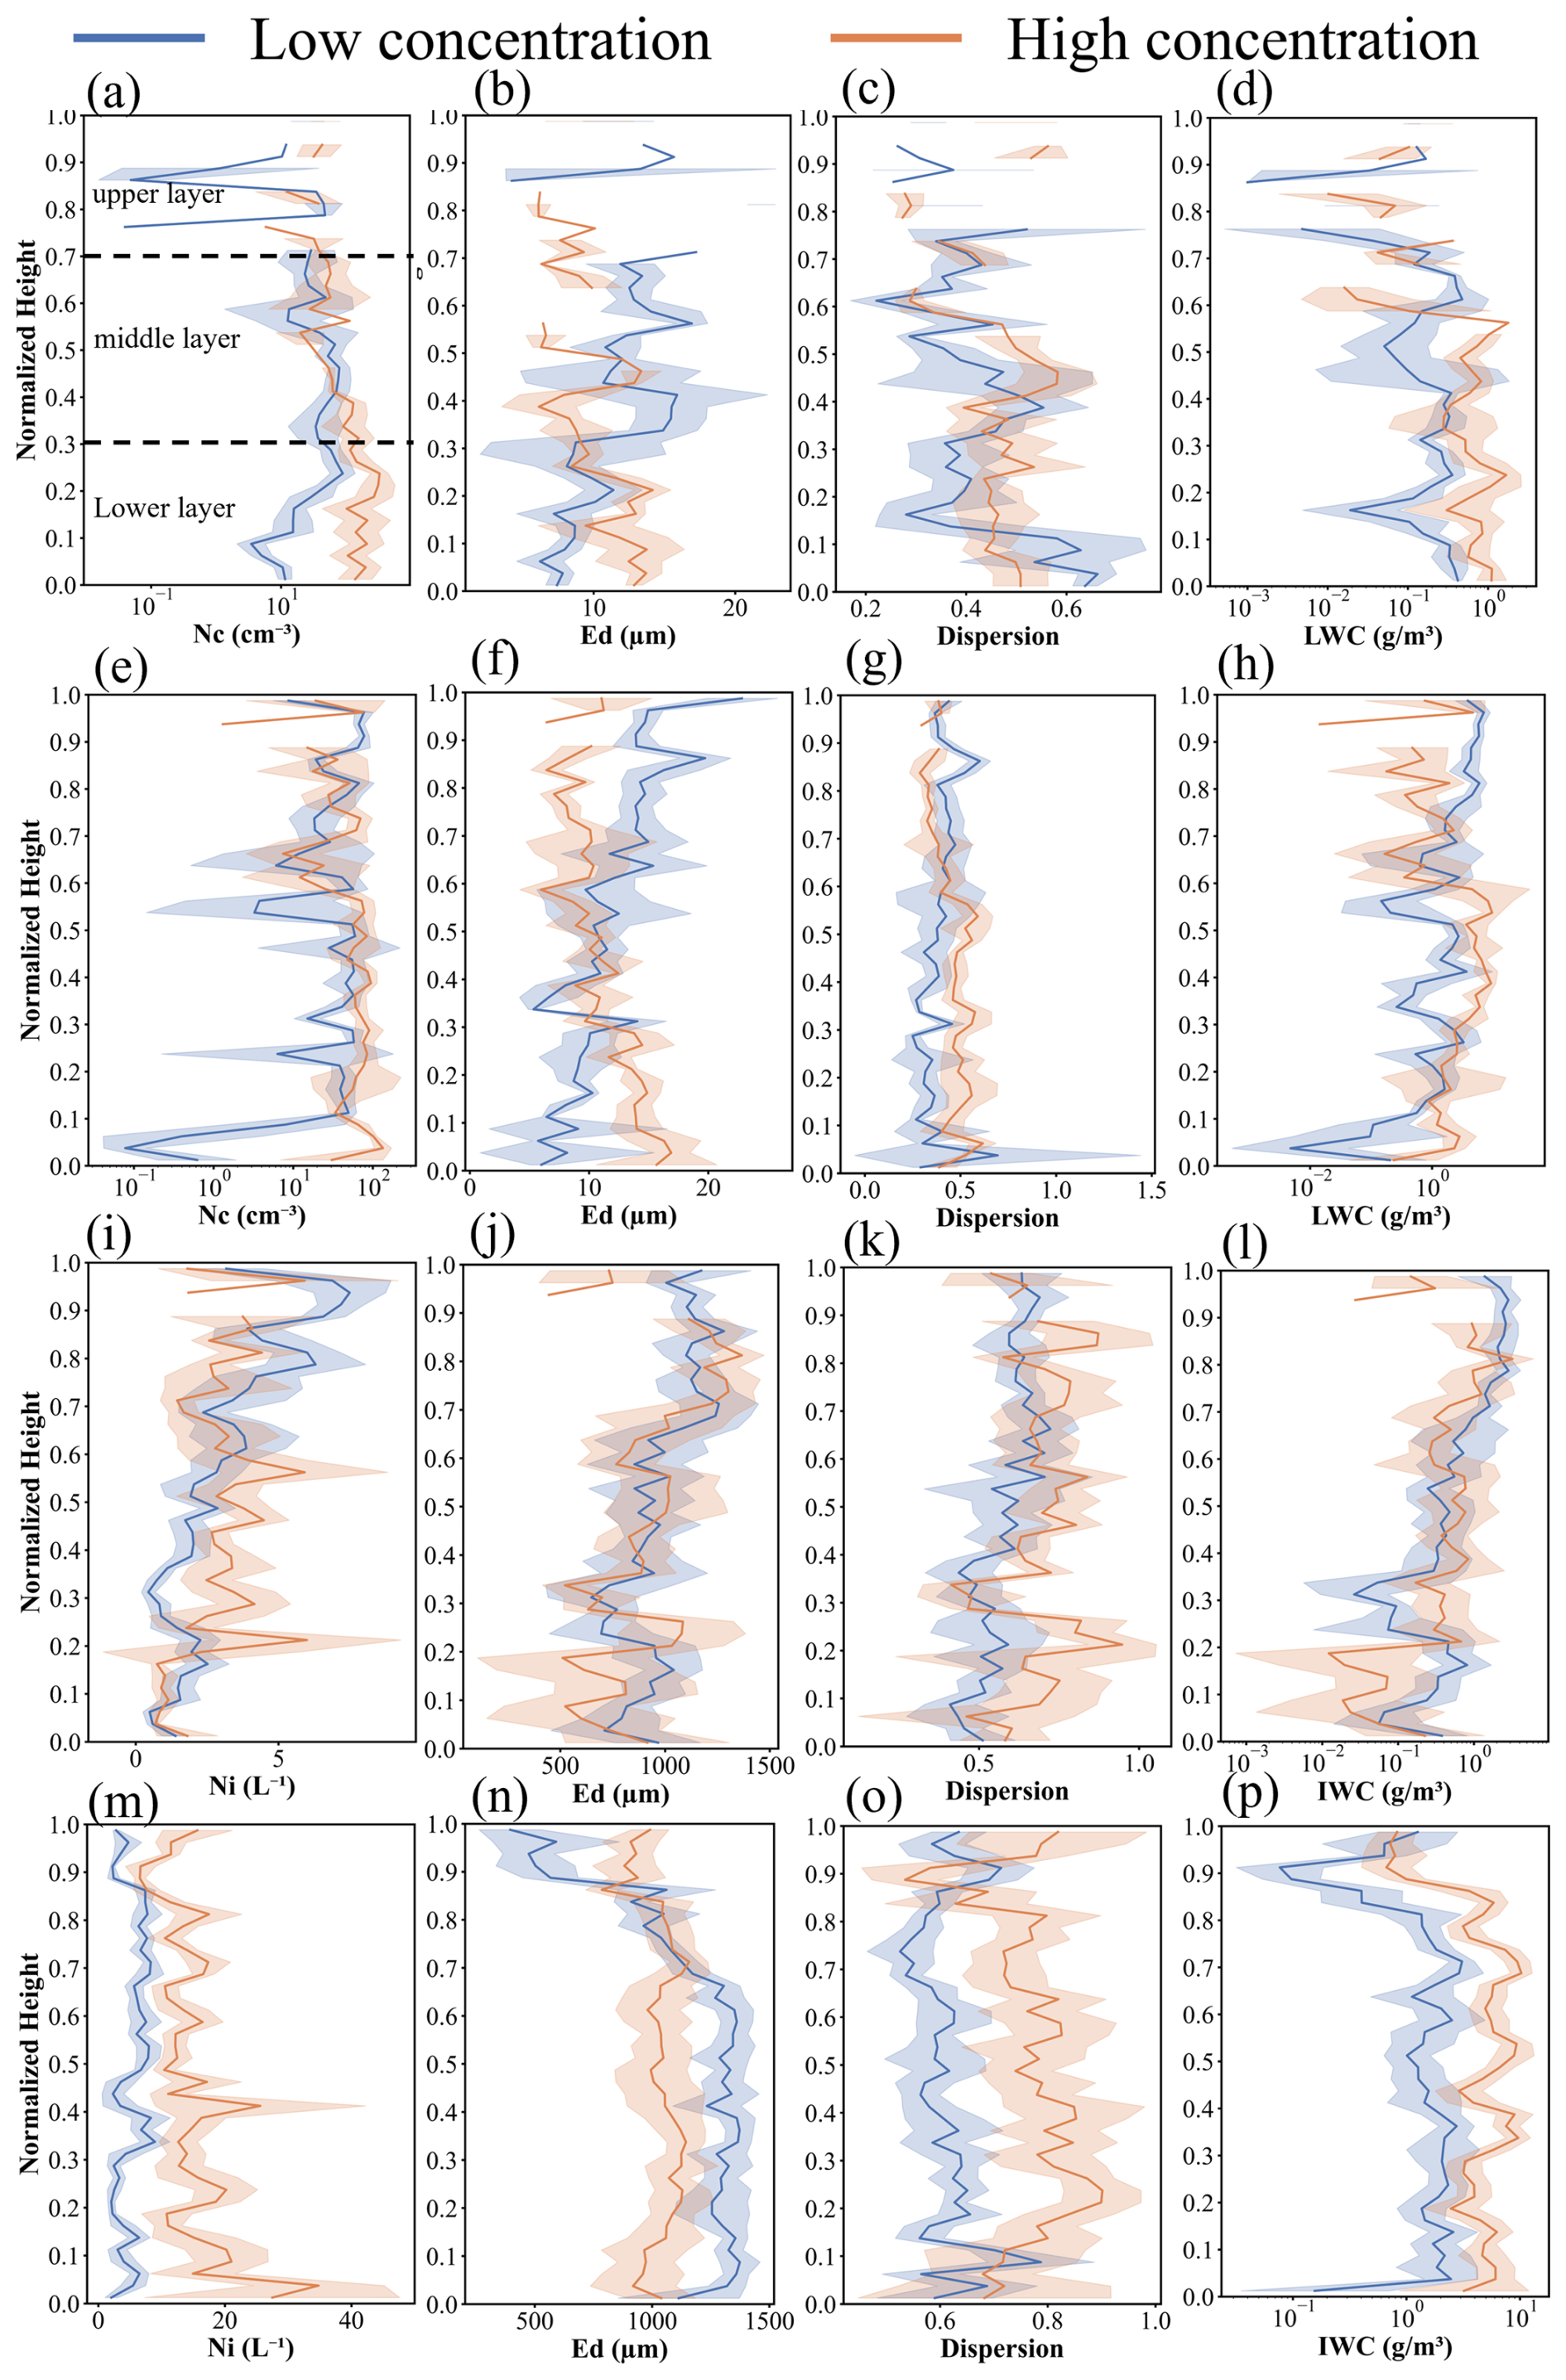
Figure 5Vertical distributions of different cloud particle characteristics. (a–d) Water cloud droplets, (e–h) mixed-phase clouds droplets, (i–l) ice crystals in mixed clouds, (m–p) ice crystals in ice clouds. For each cloud type, the panels from left to right represent number concentration, effective diameter, dispersion, and water content, respectively.
High aerosol concentrations intensify vapor competition among droplets, reducing droplet radius (Calderón et al., 2022) and potentially delaying collision–coalescence processes (Christensen et al., 2020). The data in Fig. 5b and f reveal that under low aerosol concentrations, the effective diameters of the droplets in liquid and mixed-phase clouds increase with height, whereas under high aerosol concentrations, they decrease with height. Under high-aerosol conditions, lower-cloud droplets in liquid and mixed-phase clouds tend to be larger, with effective diameters of 14.22 and 13.59 µm, respectively; under low-aerosol conditions, the effective diameters of lower-cloud droplets decrease to 10.55 and 9.72 µm, respectively. Tang et al. (2014) suggested that the emergence of this reversal of the Twomey effect results from abundant water vapor transported by southerly winds under high-aerosol conditions, which weakens vapor competition and prevents it from constraining droplet growth. The difference in the vertical effective diameter between the upper and lower layers is greater in mixed-phase clouds (2.39 µm) than in liquid clouds (2.81 µm) because of the conversion of upper-level droplets into ice crystals, which reduces both the droplet number concentration and the effective diameter. The vertical variation in the effective diameter of ice crystals differs markedly between mixed-phase and pure ice clouds. In mixed-phase clouds, the effective diameter of ice crystals increases with height regardless of the aerosol concentration. In ice clouds, under low-aerosol conditions, the effective diameter decreases above H>0.75 but remains nearly constant below H<0.75; under high-aerosol conditions, it fluctuates around 1000 µm (Fig. 5j and n).
Spectral dispersion, reflecting the width and uniformity of droplet or ice crystal distributions, serves as another important indicator of cloud microphysical properties. Under high aerosol concentrations, droplet spectral dispersion in liquid and mixed-phase clouds slightly decreases with height, indicating a predominance of small droplets in the upper layers and a more concentrated distribution. Under low-aerosol conditions, the spectral dispersion is greater in the lower part and smaller in the upper part for liquid clouds, whereas in mixed-phase clouds, it increases with height. For the ice crystals in mixed-phase clouds, the spectral dispersion is significantly greater under high-aerosol conditions than under low-aerosol conditions, with a local minimum at H=0.34. In ice clouds, spectral dispersion varies little with height under low-aerosol conditions, whereas under high-aerosol conditions, it increases for H<0.25 and decreases for H>0.75 (Fig. 5c, g, k and o).
In addition to number concentration and effective diameter, the liquid water content (LWC) also exhibits distinct vertical variations under different aerosol conditions (Fig. 5d and h). Under high-aerosol conditions, LWC in the lower layer is higher than that in the upper layer by approximately 0.37 g m−3, which is consistent with the vertical variations in spectral dispersion and effective diameter described above. A similar vertical structure is observed in mixed-phase clouds; however, LWC is further influenced by phase transition processes. Under high-aerosol conditions, LWC in the upper layer is lower than that in the lower layer by approximately 0.26 g m−3.
3.3 Impact of cloud-base aerosol concentrations on cloud particles
To investigate the impact of sub-cloud aerosols on cloud microphysical properties, sensitivity experiments were conducted using an adiabatic cloud model that considered both aerosol concentration and particle size. Experiments were designed by separately fixing the concentrations of large and small particles.
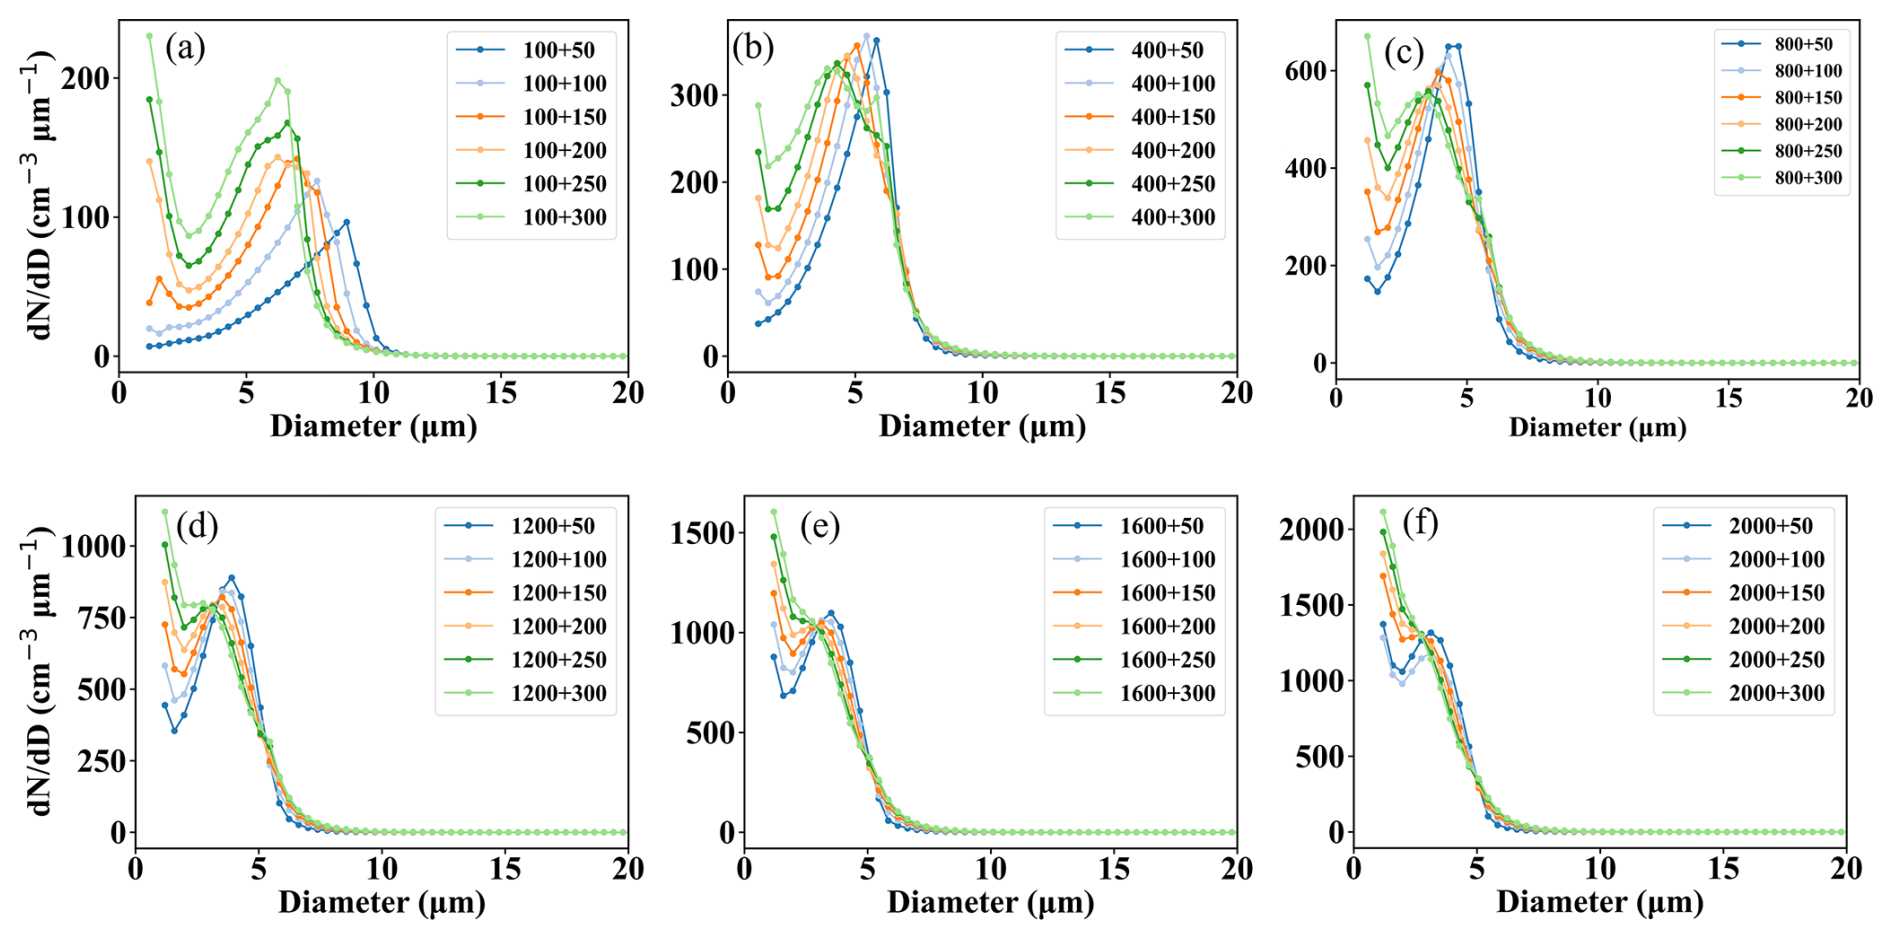
Figure 6Cloud droplet size distributions under varying concentrations of large particles with fixed concentrations of small particles. The concentrations of small particles are (a) 100, (b) 400, (c) 800, (d) 1200, (e) 1600, and (f) 2000 cm−3. In the legend, the notation “x+y” denotes the concentrations of small particles (x) and large particles (y), respectively.
As shown in Fig. 6, when the small particle concentration is low (100 cm−3), increasing the large particle concentration transforms the droplet size distribution from unimodal to bimodal, accompanied by a decrease in the peak radius and an increase in the peak number concentration. At this stage, the CCN concentration is insufficient; adding large particles increases the availability of CCN, leading to the formation of more cloud droplets and a higher peak number concentration. Moreover, the elevated CCN concentration amplifies vapor competition, thereby constraining droplet growth and reducing the peak droplet radius. Conversely, when the concentration of small particles is high (2000 cm−3), the distribution shifts from bimodal to unimodal. Further increasing the large particle concentration under high small-particle conditions still decreases the peak radius, but the peak number concentration decreases, and the effect on the peak radius decreases as the small particle concentration increases. In this scenario, the availability of CCN is sufficient; thus, the addition of large particles primarily enhances vapor competition, restricting droplet growth and favoring smaller droplets. This explains the observed shift from unimodal to bimodal distributions and why the small-droplet peak becomes increasingly prominent at higher aerosol concentrations.
As shown in Fig. 7, when the concentration of large particles is low, increasing the concentration of small particles progressively shifts the droplet distribution from unimodal to bimodal. In contrast, at higher large particle concentrations, the trend reverses, shifting from bimodal to unimodal. When the concentration of large particles is low, the availability of CCN remains limited, as in the low–small-particle case concentrations. Increasing concentrations of small particles provide additional CCN, thus intensifying vapor competition, i.e., more droplets are formed, but their growth into larger sizes is inhibited. As aerosol concentrations continue to increase, enhanced vapor competition further restricts the formation of large droplets, concentrating cloud particles in the small range and resulting in a unimodal distribution.
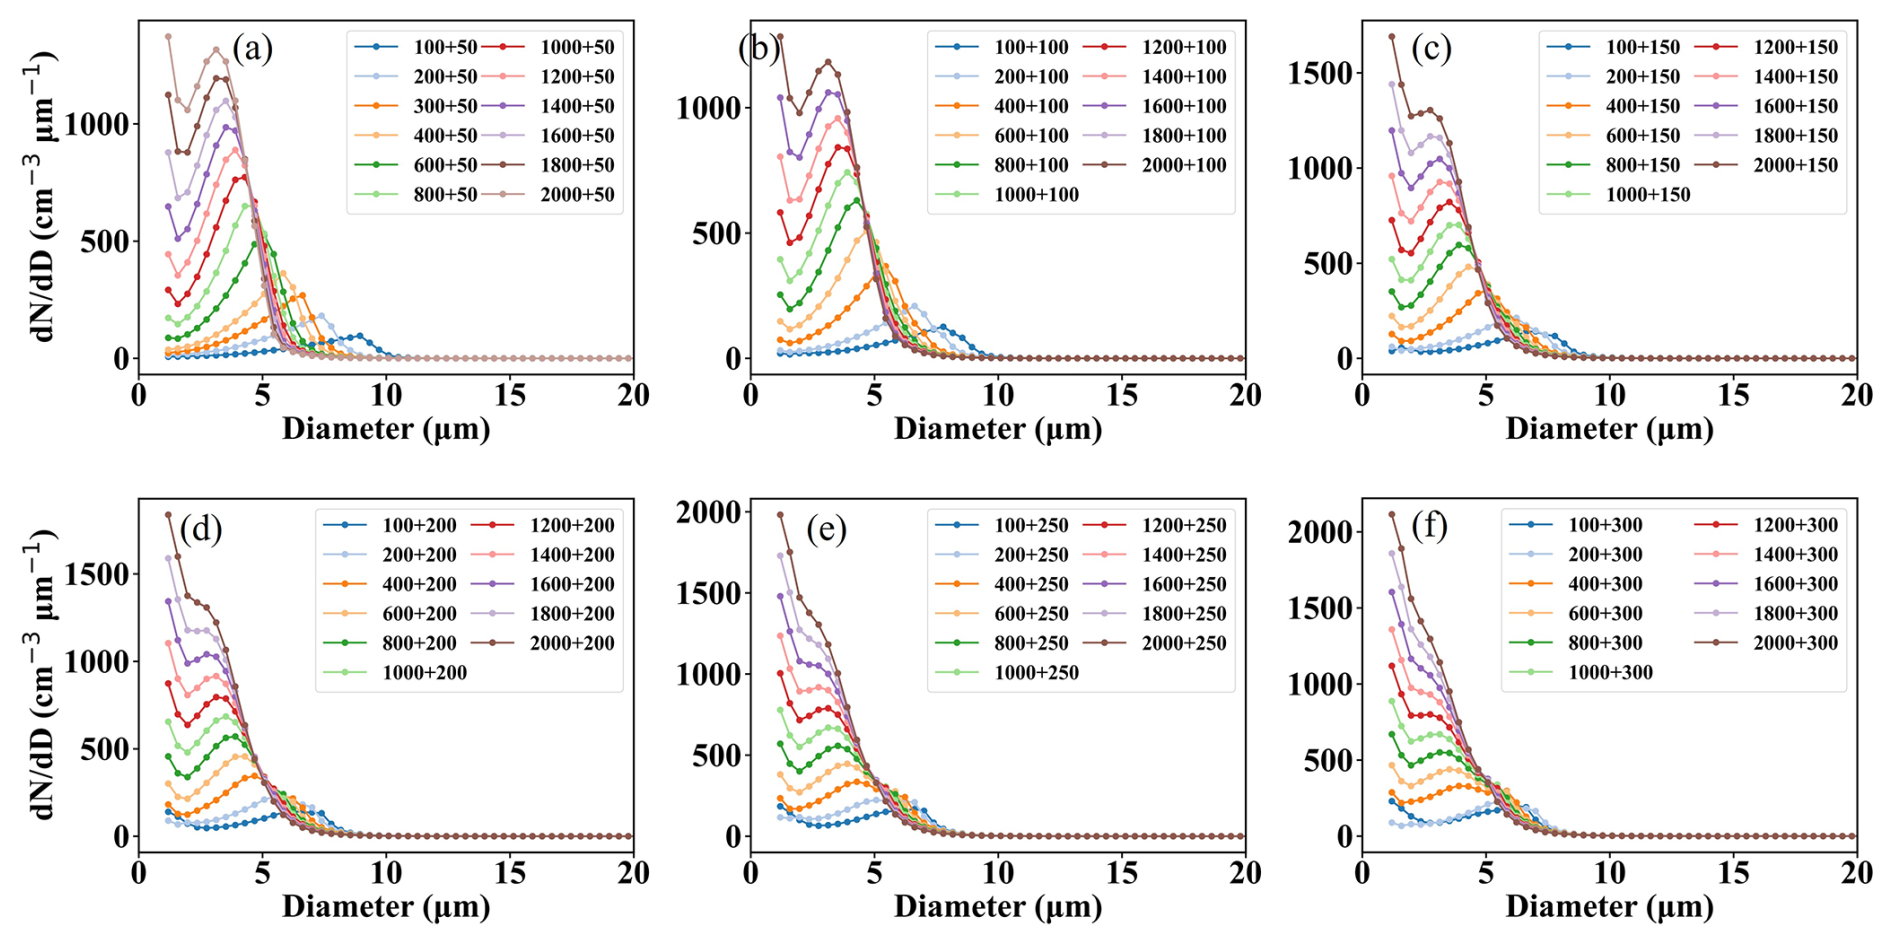
Figure 7Cloud droplet size distributions under varying concentrations of small particles with fixed concentrations of large particles. The concentrations of large particles are (a) 50, (b) 100, (c) 150, (d) 200, (e) 250, and (f) 300 cm−3. In the legend, the notation “x+y” denotes the concentrations of small particles (x) and large particles (y), respectively.
Figure 8 shows the responses of key cloud microphysical parameters simulated by the parcel model to increasing aerosol concentration. The figure is intended to assess how variations in aerosol loading influence droplet number concentration, effective diameter, and spectral dispersion during cloud development.
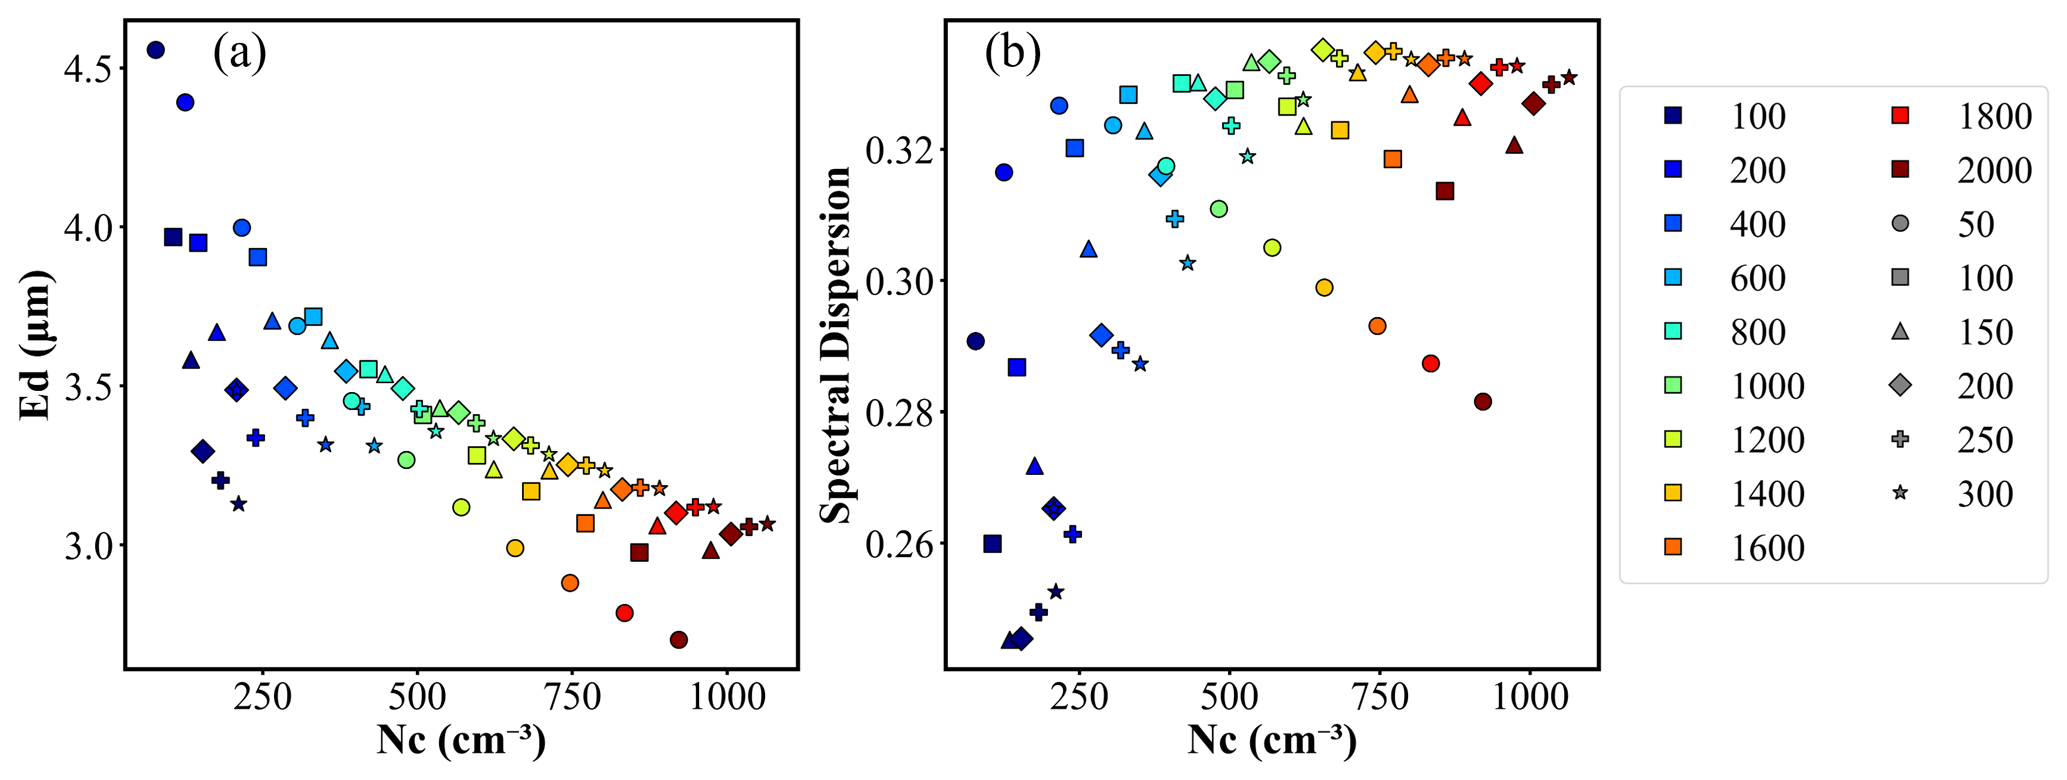
Figure 8Scatter plot of the cloud droplet effective diameter (Ed), droplet spectral dispersion, and droplet number concentration (Nc) at cloud base. The marker color represents the concentration of small particles, and the marker shape represents the concentration of large particles.
As shown in Fig. 8, increasing aerosol concentration monotonically increases the droplet number concentration, whereas the effective diameter first increases but then decreases. Spectral dispersion exhibits a similar pattern. During the early stages of cloud formation, when the droplet concentration is low, the spectral dispersion initially increases with increasing aerosol concentration but subsequently decreases. In the upper cloud or at later stages, higher aerosol concentrations activate more particles of varying sizes into cloud droplets, broadening the spectrum. However, when aerosol concentrations become excessive, droplets compete for limited water vapor, leading to more uniform growth and a reduction in spectral dispersion. (Chen et al., 2025) Compared with small particles, larger particles tend to promote the formation of larger droplets and enhance collision–coalescence, which can broaden the droplet size spectrum and thus influence spectral dispersion (Chen et al., 2025).
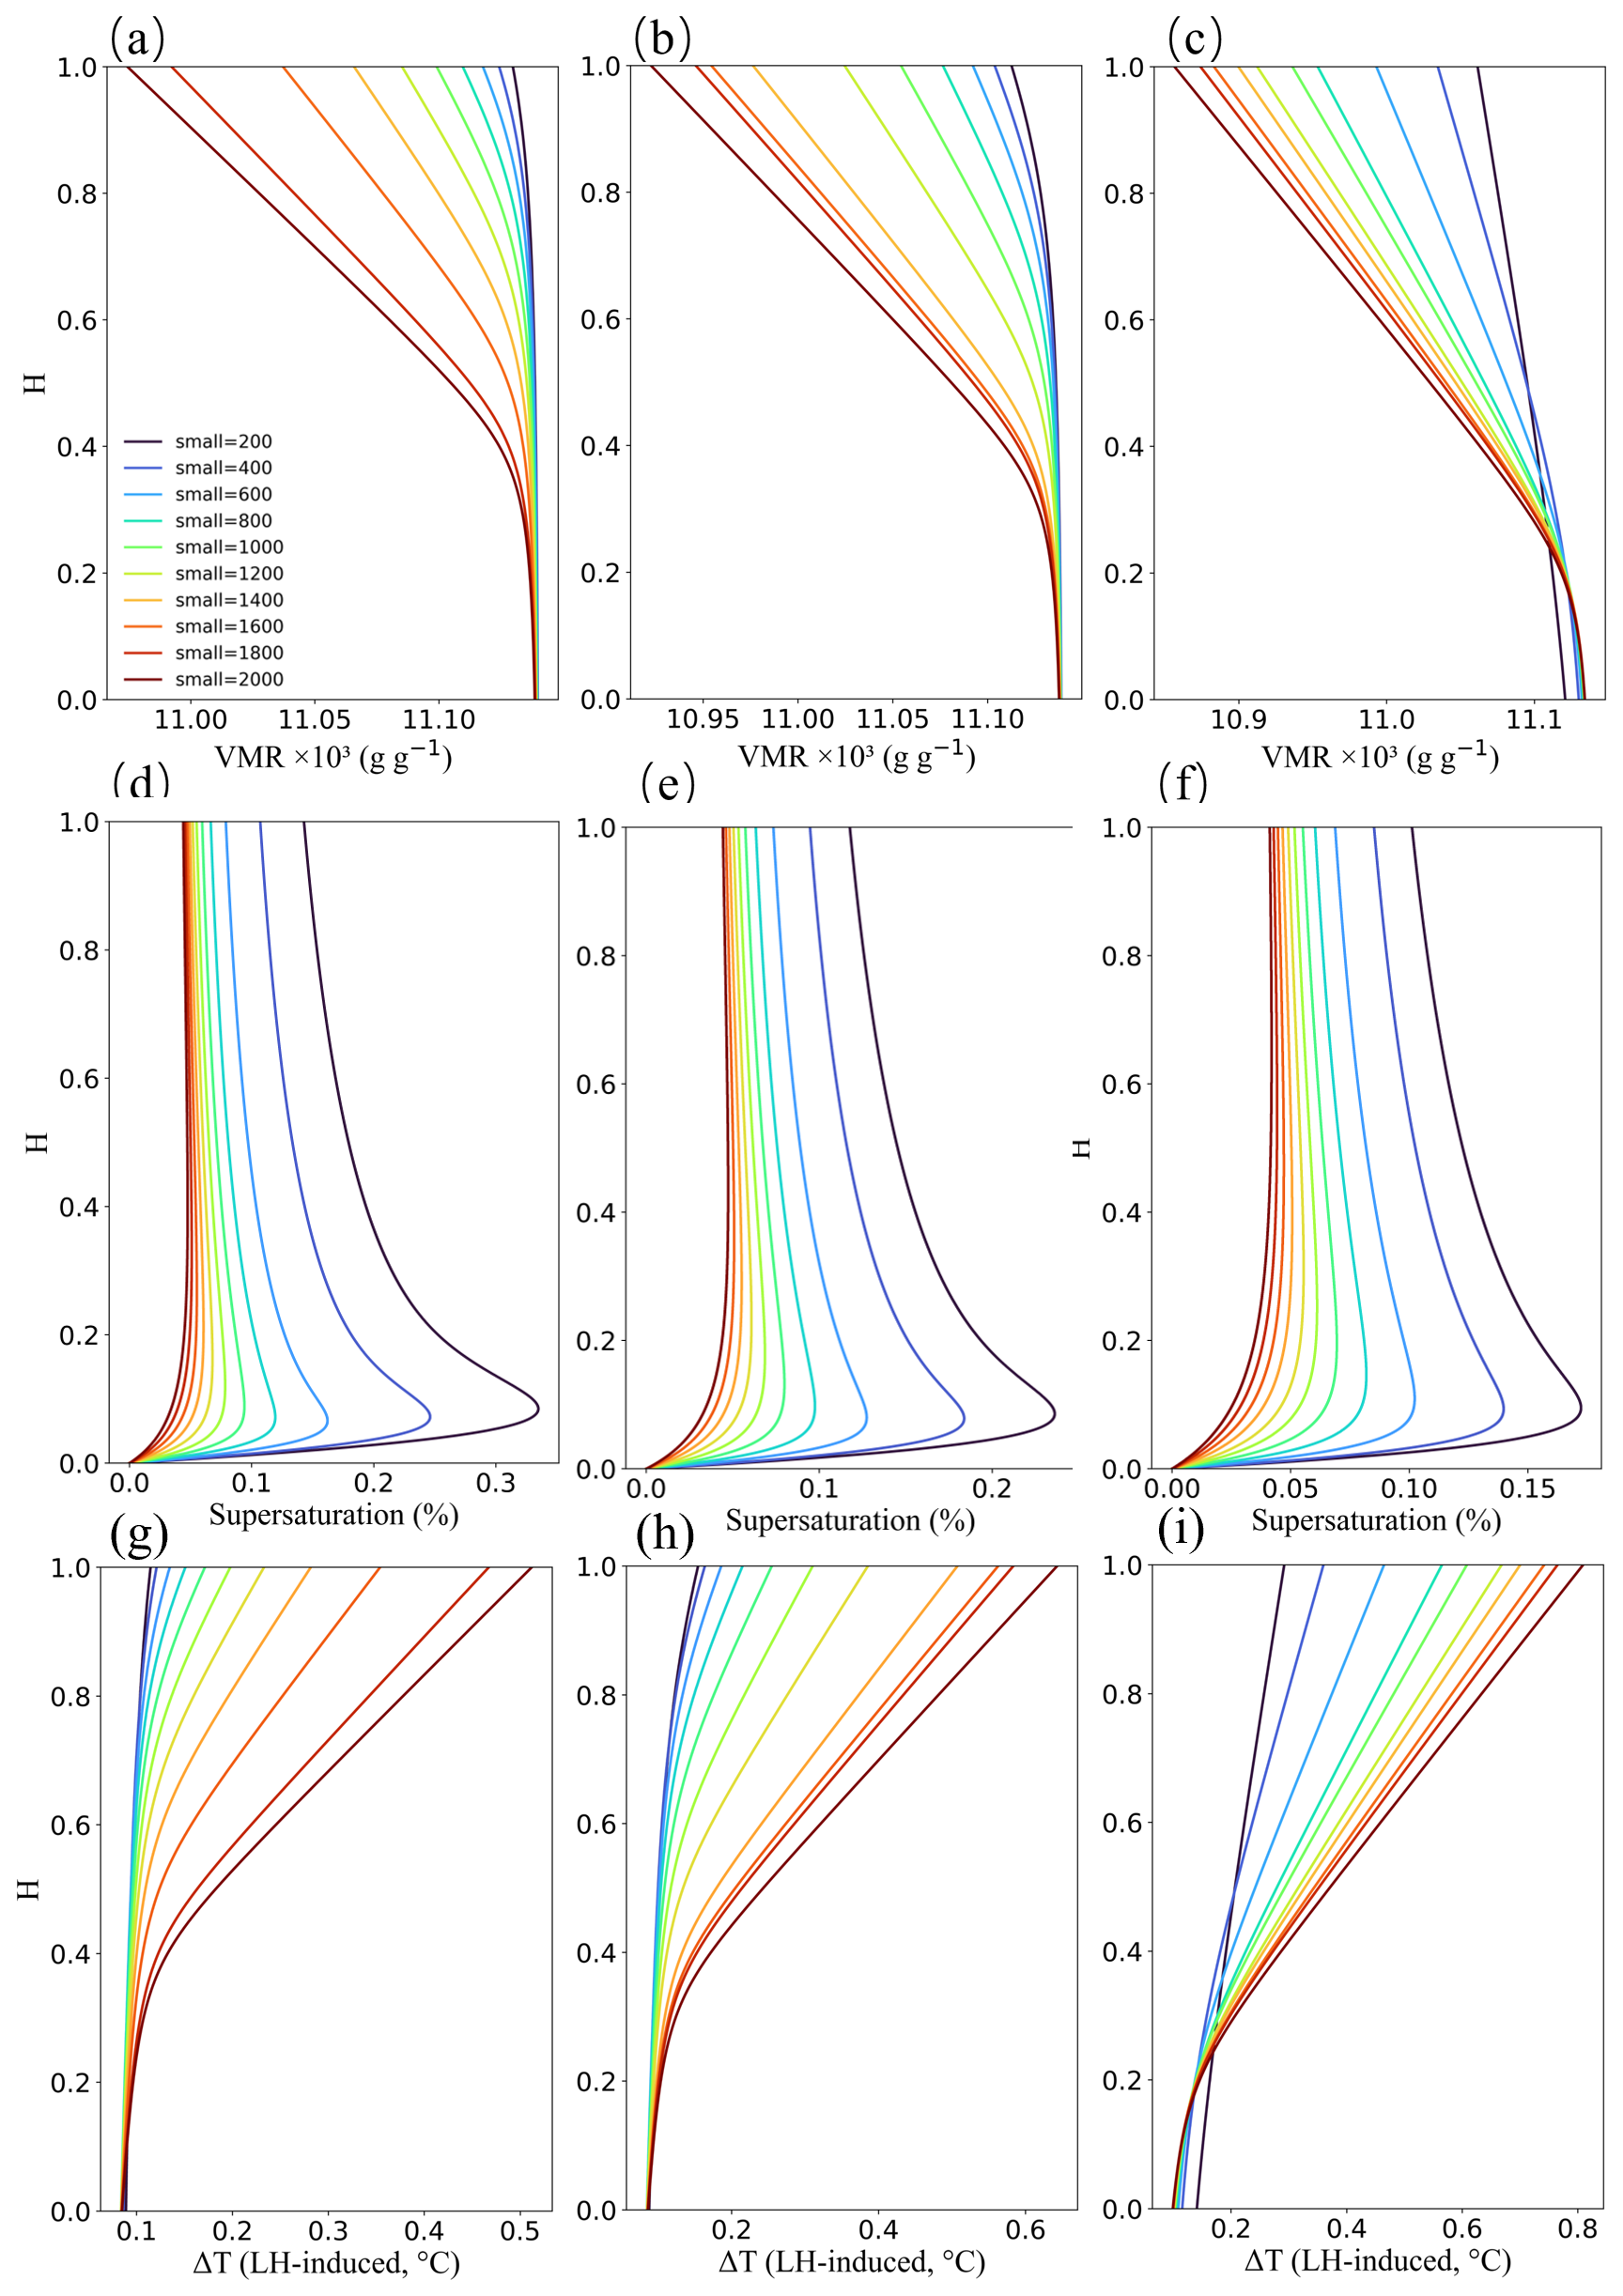
Figure 9Vertical profiles of cloud water vapor mixing ratio (VMR) (a–c), supersaturation (e, f), and condensation-induced environmental warming (g–i) under different aerosol concentrations. Colored curves represent different aerosol concentrations, and the vertical coordinate H denotes the normalized cloud height.
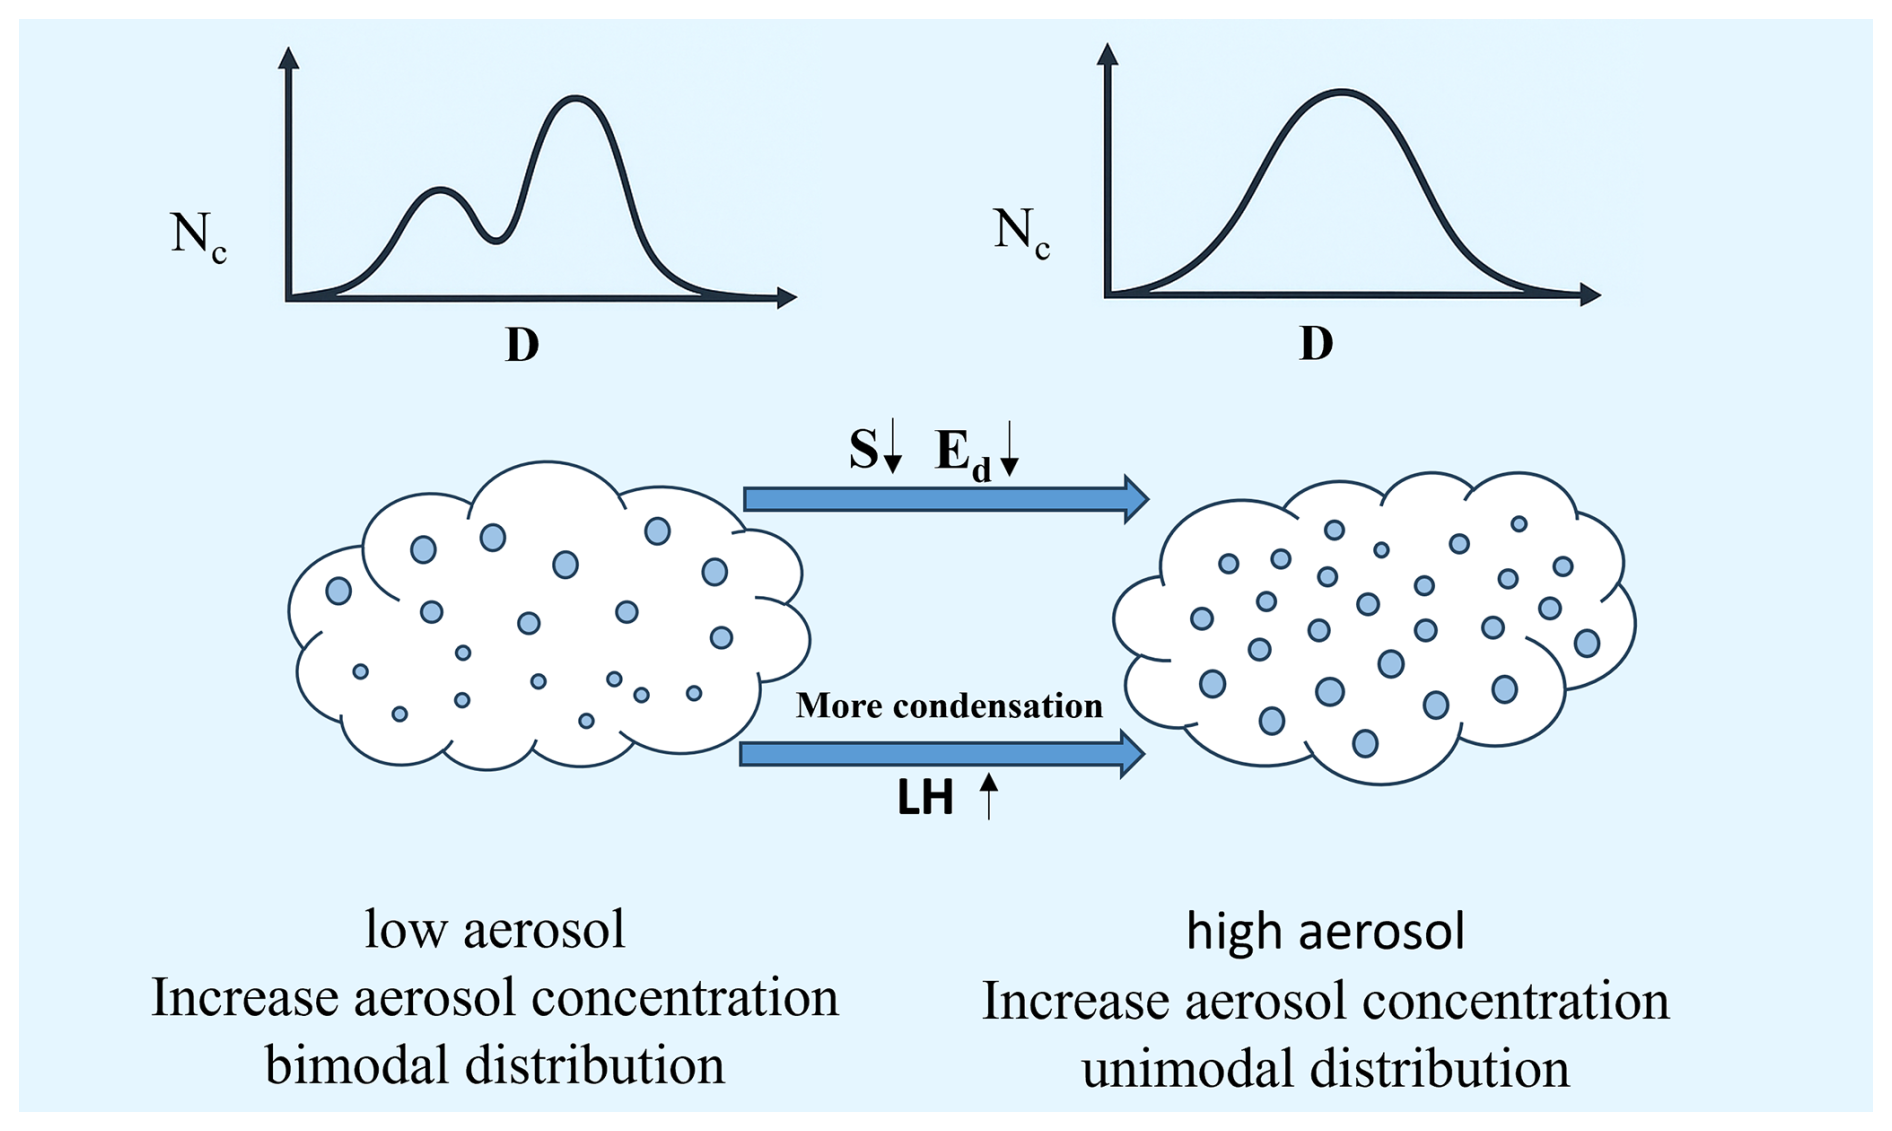
Figure 10Conceptual illustration of the effects of low and high subcloud aerosol concentrations on cloud droplet properties.
The vertical profiles of water vapor and relative humidity within the clouds are shown in Fig. 9. Under high aerosol concentrations, water vapor is depleted more rapidly than under low-aerosol conditions, resulting in markedly lower water vapor content in the upper cloud levels. Greater condensation also releases more latent heat, warming the environment and reducing supersaturation to only 0.05 %, compared with 0.34 % under low-aerosol conditions. Higher droplet number concentrations intensify vapor competition, and in combination with lower supersaturation, droplet growth slows. This explains why, in liquid and mixed-phase clouds under high-aerosol conditions, lower cloud droplets are larger while upper cloud droplets are smaller. In aerosol-rich environments, additional condensation nuclei at the cloud base consume more water vapor and release extra latent heat, enhancing vertical motion and producing larger droplets in the lower cloud. At cloud top, small droplets are concentrated because of limited condensation and insufficient water vapor. Conversely, under low-aerosol conditions, the droplet size distribution exhibits the opposite pattern, with larger droplets dominating the upper cloud and smaller droplets in the lower cloud levels.
Cloud particle spectra generally exhibit bimodal distributions. In liquid and mixed-phase clouds, droplet number concentration peaks occur at 5–7 µm and 14–15 µm, whereas in ice and mixed-phase clouds, ice crystal peaks are observed at 125 and 1550 µm, respectively. Sub-cloud aerosol concentrations exert distinct influences on these spectra. Under high-aerosol conditions at the cloud base (liquid clouds: 2772 cm−3; mixed clouds: 2693 cm−3), the smaller droplet peaks in liquid and mixed-phase clouds exceed the peaks for large particles, whereas under low-aerosol conditions (liquid clouds: 622 cm−3; mixed clouds: 665 cm−3), the opposite pattern emerges. For ice crystals, high-aerosol conditions result in higher concentrations in both the small (<500 µm) and large (>1250 µm) size ranges, whereas concentrations in the intermediate range (500–1250 µm) are lower than those under low-aerosol conditions (mixed clouds: 665 cm−3; ice clouds: 359 cm−3).
Under high-aerosol conditions, lower-cloud droplets in liquid clouds are biased toward larger sizes, with an effective diameter of 14.22 µm, and lower-to-middle droplets in mixed-phase clouds are also larger, with an effective diameter of 13.59 µm. Conversely, upper-cloud droplets in both liquid and mixed clouds are skewed toward smaller sizes, with effective diameters of 11.83 and 10.78 µm, respectively. Under low aerosol concentrations, this pattern is reversed: in liquid clouds, the lower-cloud effective diameter (10.55 µm) is smaller than that of the upper-cloud (13.29 µm), and in mixed-phase clouds, the lower-to-middle region (9.72 µm) is smaller than the upper region (14.18 µm). Ice crystals exhibit different vertical distributions in mixed and ice clouds. In mixed-phase clouds, upper-middle droplets convert to ice crystals regardless of the sub-cloud aerosol concentration, resulting in higher ice crystal number concentrations and effective radii than in lower regions. In ice clouds, high-aerosol conditions result in a decrease in the concentration of ice crystals with increasing height, whereas the effective radius initially increases but then decreases; under low-aerosol conditions, the concentration of ice crystals remains nearly constant with increasing height, and the effective radius decreases in the upper cloud.
The results of sensitivity experiments indicate that increasing aerosol concentration monotonically increases the cloud droplet number concentration. Under low-aerosol conditions, increasing aerosols promote the formation of a bimodal droplet distribution, whereas under high aerosol concentrations, further increases shift the droplet spectrum from bimodal to unimodal, which is consistent with the observed findings. This behaviour occurs because, at very low aerosol concentrations, added aerosols generate more cloud droplets, while sufficient ambient water vapor allows continued droplet growth. At higher aerosol concentrations, additional aerosols primarily produce numerous small droplets, but limited water vapor restricts further growth. Moreover, under high-aerosol conditions, water vapor depletion in lower cloud layers occurs much faster than under low-aerosol conditions, resulting in the release of more latent heat, warming of the environment, and a reduction in supersaturation (0.05 % under high-aerosol conditions versus 0.34 % under low-aerosol conditions), thereby limiting the growth of cloud droplets in the upper layers (Fig. 10).
These findings extend previous studies on aerosol–cloud interactions by demonstrating that sub-cloud aerosol loading not only modulates bulk cloud microphysical properties but also exerts a pronounced influence on the vertical structure and size-resolved characteristics of cloud particle spectra in liquid, mixed-phase, and ice clouds. While earlier work has primarily focused on aerosol effects on droplet number concentrations and effective radii, the present study reveals a clear size- and height-dependent response, highlighting contrasting aerosol influences between lower and upper cloud layers as well as among different cloud phases. The non-monotonic response observed in ice crystal size distributions, in particular, provides new insights into the microphysical pathways through which aerosols regulate cloud development. Nevertheless, several limitations should be acknowledged. The aircraft observations are restricted to specific regions and meteorological conditions, which may limit the generality of the results. In addition, the parcel model sensitivity experiments do not fully represent cloud-scale dynamical processes or the feedbacks among aerosols, clouds, and the environment, both of which can play important roles in cloud evolution under more complex atmospheric conditions. Future studies that integrate long-term observations, cloud-resolving simulations, and a broader range of aerosol and thermodynamic regimes are therefore required to further assess the robustness of the mechanisms identified here. Despite these limitations, the present study offers new perspectives on the characterization of aerosol-induced changes in cloud microphysical properties and has important implications for improving our understanding of cloud radiative effects and precipitation processes.
The observational data and model outputs used in this study are publicly available from Zenodo at https://doi.org/10.5281/zenodo.18185814 (Wang, 2026). The cloud parcel model used in this study is available at https://doi.org/10.5281/zenodo.6148660 (Chen, 2022).
DL carried out the data analysis, performed the model simulations, evaluated the results, and wrote the manuscript. SL and YY contributed to the aircraft observations and data processing. HW designed the study, supervised the research, and revised the manuscript. JC designed the model used in the simulations, guided the research, and revised the manuscript. YC, ZW, KC, and TZ contributed to the scientific interpretation of the results and provided academic advice. All authors read and revised the manuscript and approved the final version.
The contact author has declared that none of the authors has any competing interests.
Publisher's note: Copernicus Publications remains neutral with regard to jurisdictional claims made in the text, published maps, institutional affiliations, or any other geographical representation in this paper. The authors bear the ultimate responsibility for providing appropriate place names. Views expressed in the text are those of the authors and do not necessarily reflect the views of the publisher.
This study was supported by the Science & Technology Fundamental Resources Investigation Program (grant no. 2025FY101504), the National Natural Science Foundation of China (grant no. 42505181), and the Natural Science Foundation of Jiangsu Province (grant no. BK20231300). The authors gratefully acknowledge the Hebei Provincial Weather Modification Office for providing the aircraft observation data used in this study.
This research has been supported by the Science & Technology Fundamental Resources Investigation Program (grant no. 2025FY101504), the National Natural Science Foundation of China (grant no. 42505181), and the Natural Science Foundation of Jiangsu Province (grant no. BK20231300).
This paper was edited by Greg McFarquhar and reviewed by two anonymous referees.
Albrecht, B. A.: Aerosols, cloud microphysics, and fractional cloudiness, Science, 245, 1227–1230, https://doi.org/10.1126/science.245.4923.1227, 1989.
Barrett, P. A., Blyth, A., Brown, P. R. A., and Abel, S. J.: The structure of turbulence and mixed-phase cloud microphysics in a highly supercooled altocumulus cloud, Atmos. Chem. Phys., 20, 1921–1939, https://doi.org/10.5194/acp-20-1921-2020, 2020.
Baumgardner, D., Jonsson, H., Dawson, W., O'Connor, D., and Newton, R.: The cloud, aerosol and precipitation spectrometer: A new instrument for cloud investigations, Atmos. Res., 59–60, 251–264, https://doi.org/10.1016/S0169-8095(01)00119-3, 2001.
Calderón, S. M., Tonttila, J., Buchholz, A., Joutsensaari, J., Komppula, M., Leskinen, A., Hao, L., Moisseev, D., Pullinen, I., Tiitta, P., Xu, J., Virtanen, A., Kokkola, H., and Romakkaniemi, S.: Aerosol–stratocumulus interactions: towards a better process understanding using closures between observations and large eddy simulations, Atmos. Chem. Phys., 22, 12417–12441, https://doi.org/10.5194/acp-22-12417-2022, 2022.
Calvin, K., Dasgupta, D., Krinner, G., Mukherji, A., Thorne, P. W., Trisos, C., Romero, J., Aldunce, P., Barrett, K., Blanco, G., Cheung, W. W. L., Connors, S., Denton, F., Diongue-Niang, A., Dodman, D., Garschagen, M., Geden, O., Hayward, B., Jones, C., Jotzo, F., Krug, T., Lasco, R., Lee, Y.-Y., Masson-Delmotte, V., Meinshausen, M., Mintenbeck, K., Mokssit, A., Otto, F. E. L., Pathak, M., Pirani, A., Poloczanska, E., Pörtner, H.-O., Revi, A., Roberts, D. C., Roy, J., Ruane, A. C., Skea, J., Shukla, P. R., Slade, R., Slangen, A., Sokona, Y., Sörensson, A. A., Tignor, M., Van Vuuren, D., Wei, Y.-M., Winkler, H., Zhai, P., Zommers, Z., Hourcade, J.-C., Johnson, F. X., Pachauri, S., Simpson, N. P., Singh, C., Thomas, A., Totin, E., Arias, P., Bustamante, M., Elgizouli, I., Flato, G., Howden, M., Méndez-Vallejo, C., Pereira, J. J., Pichs-Madruga, R., Rose, S. K., Saheb, Y., Sánchez Rodríguez, R., Ürge-Vorsatz, D., Xiao, C., Yassaa, N., Alegría, A., Armour, K., Bednar-Friedl, B., Blok, K., Cissé, G., Dentener, F., Eriksen, S., Fischer, E., Garner, G., Guivarch, C., Haasnoot, M., Hansen, G., Hauser, M., Hawkins, E., Hermans, T., Kopp, R., Leprince-Ringuet, N., Lewis, J., Ley, D., Ludden, C., Niamir, L., Nicholls, Z., Some, S., Szopa, S., Trewin, B., Van Der Wijst, K.-I., Winter, G., Witting, M., Birt, A., and Ha, M.: Climate change 2023: synthesis report. Contribution of working groups I, II and III to the sixth assessment report of the intergovernmental panel on climate change, edited by: Core Writing Team, Lee, H., and Romero, J., Intergovernmental Panel on Climate Change (IPCC), Geneva, Switzerland, https://doi.org/10.59327/IPCC/AR6-9789291691647, 2023.
Chalmers, J., Kay, J. E., Middlemas, E. A., Maroon, E. A., and DiNezio, P.: Does disabling cloud radiative feedbacks change spatial patterns of surface greenhouse warming and cooling?, J. Climate, 35, 1787–1807, https://doi.org/10.1175/JCLI-D-21-0391.1, 2022.
Chang, Y., Guo, X., Tang, J., and Lu, G.: Aircraft measurement campaign on summer cloud microphysical properties over the tibetan plateau, Sci. Rep.-UK, 9, 4912, https://doi.org/10.1038/s41598-019-41514-5, 2019.
Che, Y., Zhang, J., Zhao, C., Fang, W., Xue, W., Yang, W., Ji, D., Dang, J., Duan, J., Sun, J., Shen, X., and Zhou, X.: A study on the characteristics of ice nucleating particles concentration and aerosols and their relationship in spring in beijing, Atmos. Res., 247, 105196, https://doi.org/10.1016/j.atmosres.2020.105196, 2021.
Chen, F., Yang, Y., Yu, L., Li, Y., Liu, W., Liu, Y., and Lolli, S.: Distinct effects of fine and coarse aerosols on microphysical processes of shallow-precipitation systems in summer over southern China, Atmos. Chem. Phys., 25, 1587–1601, https://doi.org/10.5194/acp-25-1587-2025, 2025.
Chen, J.: Jingyi-chen/cloud_parcel_mode: Cloud parcel model, Zenodo [code], https://doi.org/10.5281/zenodo.6148660, 2022.
Chen, J., Liu, Y., Zhang, M., and Peng, Y.: New understanding and quantification of the regime dependence of aerosol-cloud interaction for studying aerosol indirect effects, Geophys. Res. Lett., 43, 1780–1787, https://doi.org/10.1002/2016GL067683, 2016.
Chen, J., Liu, Y., Zhang, M., and Peng, Y.: Height dependency of aerosol-cloud interaction regimes, J. Geophys. Res.-Atmos., 123, 491–506, https://doi.org/10.1002/2017JD027431, 2018.
Chen, Q., Yin, Y., Jiang, H., Chu, Z., Xue, L., Shi, R., Zhang, X., and Chen, J.: The roles of mineral dust as cloud condensation nuclei and ice nuclei during the evolution of a hail storm, J. Geophys. Res.-Atmos., 124, 14262–14284, https://doi.org/10.1029/2019JD031403, 2019.
Chen, S., Xue, L., and Yau, M.-K.: Impact of aerosols and turbulence on cloud droplet growth: an in-cloud seeding case study using a parcel–DNS (direct numerical simulation) approach, Atmos. Chem. Phys., 20, 10111–10124, https://doi.org/10.5194/acp-20-10111-2020, 2020.
Christensen, M. W., Jones, W. K., and Stier, P.: Aerosols enhance cloud lifetime and brightness along the stratus-to-cumulus transition, P. Natl. Acad. Sci. USA, 117, 17591–17598, https://doi.org/10.1073/pnas.1921231117, 2020.
Christensen, M. W., Ma, P.-L., Wu, P., Varble, A. C., Mülmenstädt, J., and Fast, J. D.: Evaluation of aerosol–cloud interactions in E3SM using a Lagrangian framework, Atmos. Chem. Phys., 23, 2789–2812, https://doi.org/10.5194/acp-23-2789-2023, 2023.
Coakley, J. A., Cess, R. D., and Yurevich, F. B.: The effect of tropospheric aerosols on the earth's radiation budget: A parameterization for climate models, J. Atmos. Sci., 40, 116–138, https://doi.org/10.1175/1520-0469(1983)040<0116:TEOTAO>2.0.CO;2, 1983.
Dong, X., Sun, X., Yan, F., Zhang, J., Wang, S., Peng, M., and Zhu, H.: Aircraft observation of a two-layer cloud and the analysis of cold cloud seeding effect, Front. Environ. Sci., 10, 855813, https://doi.org/10.3389/fenvs.2022.855813, 2022.
Du, Y., Liu, D., Zhao, D., Huang, M., Tian, P., Wen, D., Xiao, W., Zhou, W., He, H., Pan, B., Zuo, D., Liu, X., Jing, Y., Zhang, R., Sheng, J., Wang, F., Huang, Y., Chen, Y., and Ding, D.: Microphysical view of the development and ice production of mid-latitude stratiform clouds with embedded convection during an extratropical cyclone, Atmos. Chem. Phys., 24, 13429–13444, https://doi.org/10.5194/acp-24-13429-2024, 2024.
Faber, S., French, J. R., and Jackson, R.: Laboratory and in-flight evaluation of measurement uncertainties from a commercial Cloud Droplet Probe (CDP), Atmos. Meas. Tech., 11, 3645–3659, https://doi.org/10.5194/amt-11-3645-2018, 2018.
Feng, Q., Niu, S., Hou, T., Yue, Z., and Shen, D.: Aircraft observations of characteristics and growth of ice particles of two different snowfall clouds in shanxi province, China, Atmosphere-Basel, 12, 477, https://doi.org/10.3390/atmos12040477, 2021.
Fleishauer, R. P., Larson, V. E., and Vonder Haar, T. H.: Observed microphysical structure of midlevel, mixed-phase clouds, J. Atmos. Sci., 59, 1779–1804, https://doi.org/10.1175/1520-0469(2002)059<1779:OMSOMM>2.0.CO;2, 2002.
Gultepe, I. and Isaac, G. A.: Aircraft observations of cloud droplet number concentration: Implications for climate studies, Q. J. Roy. Meteor. Soc., 130, 2377–2390, https://doi.org/10.1256/qj.03.120, 2004.
Hansen, J. E. and Travis, L. D.: Light scattering in planetary atmospheres, Space Sci. Rev., 16, 527–610, https://doi.org/10.1007/BF00168069, 1974.
Heymsfield, A. and Willis, P.: Cloud conditions favoring secondary ice particle production in tropical maritime convection, J. Atmos. Sci., 71, 4500–4526, https://doi.org/10.1175/JAS-D-14-0093.1, 2014.
Heymsfield, A. J., Bansemer, A., and Twohy, C. H.: Refinements to ice particle mass dimensional and terminal velocity relationships for ice clouds. Part I: Temperature dependence, J. Atmos. Sci., 64, 1047–1067, https://doi.org/10.1175/JAS3890.1, 2007.
Hoffmann, F., Glassmeier, F., and Feingold, G.: The impact of aerosol on cloud water: a heuristic perspective, Atmos. Chem. Phys., 24, 13403–13412, https://doi.org/10.5194/acp-24-13403-2024, 2024.
Hou, T., Lei, H., He, Y., Yang, J., Zhao, Z., and Hu, Z.: Aircraft measurements of the microphysical properties of stratiform clouds with embedded convection, Adv. Atmos. Sci., 38, 966–982, https://doi.org/10.1007/s00376-021-0287-8, 2021.
Huang, X., Liu, Z., Liu, J., Hu, B., Wen, T., Tang, G., Zhang, J., Wu, F., Ji, D., Wang, L., and Wang, Y.: Chemical characterization and source identification of PM2.5 at multiple sites in the Beijing–Tianjin–Hebei region, China, Atmos. Chem. Phys., 17, 12941–12962, https://doi.org/10.5194/acp-17-12941-2017, 2017.
Ke, Y., Liu, S., Wang, H., Yang, Y., Hu, Y., Li, X., Cui, Y., Wu, Z., Wang, Z., and Zhao, T.: Influence of boundary layer-cloud coupling on cloud microphysics based on aircraft observations in the north China plain, Sci. Total Environ., 1003, 180679, https://doi.org/10.1016/j.scitotenv.2025.180679, 2025.
Khatri, P., Yoshida, K., and Hayasaka, T.: Aerosol effects on water cloud properties in different atmospheric regimes, J. Geophys. Res.-Atmos., 128, e2023JD039729, https://doi.org/10.1029/2023JD039729, 2023.
Koren, I., Dagan, G., and Altaratz, O.: From aerosol-limited to invigoration of warm convective clouds, Science, 344, 1143–1146, https://doi.org/10.1126/science.1252595, 2014.
Korolev, A., Emery, E., and Creelman, K.: Modification and tests of particle probe tips to mitigate effects of ice shattering, J. Atmos. Ocean. Tech., 30, 690–708, https://doi.org/10.1175/JTECH-D-12-00142.1, 2013.
Kumar, B., Ranjan, R., Yau, M.-K., Bera, S., and Rao, S. A.: Impact of high- and low-vorticity turbulence on cloud–environment mixing and cloud microphysics processes, Atmos. Chem. Phys., 21, 12317–12329, https://doi.org/10.5194/acp-21-12317-2021, 2021.
Lamb, D. and Verlinde, J.: Physics and chemistry of clouds, Cambridge University Press, Cambridge, Cambridge University Press, Cambridge, 584 pp., ISBN 978-1-62870-283-5, 2011.
Lawson, P., Gurganus, C., Woods, S., and Bruintjes, R.: Aircraft observations of cumulus microphysics ranging from the tropics to midlatitudes: Implications for a “new” secondary ice process, J. Atmos. Sci., 74, 2899–2920, https://doi.org/10.1175/JAS-D-17-0033.1, 2017.
Leung, G. R. and Van Den Heever, S. C.: Aerosol breezes drive cloud and precipitation increases, Nat. Commun., 14, 2508, https://doi.org/10.1038/s41467-023-37722-3, 2023.
Li, Y., Liu, X., and Cai, H.: Numerical simulation of aerosol concentration effects on cloud droplet size spectrum evolutions of warm stratiform clouds in Jiangxi, China, Atmos. Chem. Phys., 24, 13525–13540, https://doi.org/10.5194/acp-24-13525-2024, 2024.
Liu, F., Rosenfeld, D., Pan, Z., Zang, L., and Mao, F.: Combined effects of fine and coarse marine aerosol on vertical raindrop size distribution, Npj Clim. Atmos. Sci., 7, 182, https://doi.org/10.1038/s41612-024-00730-1, 2024.
Liu, S., Wang, H., Zhao, D., Zhou, W., Du, Y., Zhang, Z., Cheng, P., Zhao, T., Ke, Y., Wu, Z., and Huang, M.: Measurement report: Aircraft observations of aerosol and microphysical quantities of stratocumulus in autumn over Guangxi Province, China – daylight variation, vertical distribution, and aerosol–cloud interactions, Atmos. Chem. Phys., 25, 4151–4165, https://doi.org/10.5194/acp-25-4151-2025, 2025.
Noh, Y.-J., Seaman, C. J., Vonder Haar, T. H., and Liu, G.: In situ aircraft measurements of the vertical distribution of liquid and ice water content in midlatitude mixed-phase clouds, J. Appl. Meteorol. Clim., 52, 269–279, https://doi.org/10.1175/JAMC-D-11-0202.1, 2013.
Pöschl, U., Martin, S. T., Sinha, B., Chen, Q., Gunthe, S. S., Huffman, J. A., Borrmann, S., Farmer, D. K., Garland, R. M., Helas, G., Jimenez, J. L., King, S. M., Manzi, A., Mikhailov, E., Pauliquevis, T., Petters, M. D., Prenni, A. J., Roldin, P., Rose, D., Schneider, J., Su, H., Zorn, S. R., Artaxo, P., and Andreae, M. O.: Rainforest aerosols as biogenic nuclei of clouds and precipitation in the amazon, Science, 329, 1513–1516, https://doi.org/10.1126/science.1191056, 2010.
Sherwood, S. C., Webb, M. J., Annan, J. D., Armour, K. C., Forster, P. M., Hargreaves, J. C., Hegerl, G., Klein, S. A., Marvel, K. D., Rohling, E. J., Watanabe, M., Andrews, T., Braconnot, P., Bretherton, C. S., Foster, G. L., Hausfather, Z., Von Der Heydt, A. S., Knutti, R., Mauritsen, T., Norris, J. R., Proistosescu, C., Rugenstein, M., Schmidt, G. A., Tokarska, K. B., and Zelinka, M. D.: An assessment of earth's climate sensitivity using multiple lines of evidence, Rev. Geophys., 58, e2019RG000678, https://doi.org/10.1029/2019RG000678, 2020.
Strapp, J. W., Leaitch, W. R., and Liu, P. S. K.: Hydrated and dried aerosol-size-distribution measurements from the particle measuring systems FSSP-300 probe and the deiced PCASP-100X probe, J. Atmos. Ocean. Tech., 9, 548–555, https://doi.org/10.1175/1520-0426(1992)009<0548:HADASD>2.0.CO;2, 1992.
Sun, J. and Ariya, P.: Atmospheric organic and bio-aerosols as cloud condensation nuclei (CCN): A review, Atmos. Environ., 40, 795–820, https://doi.org/10.1016/j.atmosenv.2005.05.052, 2006.
Tang, J., Wang, P., Mickley, L. J., Xia, X., Liao, H., Yue, X., Sun, L., and Xia, J.: Positive relationship between liquid cloud droplet effective radius and aerosol optical depth over eastern China from satellite data, Atmos. Environ., 84, 244–253, https://doi.org/10.1016/j.atmosenv.2013.08.024, 2014.
Tsimpidi, A. P., Scholz, S. M. C., Milousis, A., Mihalopoulos, N., and Karydis, V. A.: Aerosol composition trends during 2000–2020: in-depth insights from model predictions and multiple worldwide near-surface observation datasets, Atmos. Chem. Phys., 25, 10183–10213, https://doi.org/10.5194/acp-25-10183-2025, 2025.
Twomey, S.: The influence of pollution on the shortwave albedo of clouds, J. Atmos. Sci., 34, 1149–1152, https://doi.org/10.1175/1520-0469(1977)034<1149:TIOPOT>2.0.CO;2, 1977.
Wang, H.: Data for regulation of cloud particle spectra and vertical structure by sub-cloud aerosols: Insights from aircraft observations and numerical simulations, Zenodo [data set], https://doi.org/10.5281/zenodo.18185814, 2026.
Wang, L., Li, C., Yao, Z., Zhao, Z., Han, Z., and Wei, Q.: Application of aircraft observations over beijing in cloud microphysical property retrievals from CloudSat, Adv. Atmos. Sci., 31, 926–937, https://doi.org/10.1007/s00376-013-3156-2, 2014.
Wilcox, E. M.: Direct and semi-direct radiative forcing of smoke aerosols over clouds, Atmos. Chem. Phys., 12, 139–149, https://doi.org/10.5194/acp-12-139-2012, 2012.
Wu, X., Wang, M., Zhao, D., Rosenfeld, D., Zhu, Y., Du, Y., Zhou, W., Tian, P., Sheng, J., Wang, F., and Ding, D.: The microphysical characteristics of wintertime cold clouds in north China, Adv. Atmos. Sci., 39, 2056–2070, https://doi.org/10.1007/s00376-022-1274-4, 2022.
Yeom, J. M., Fahandezh Sadi, H., Anderson, J. C., Yang, F., Cantrell, W., and Shaw, R. A.: Cloud microphysical response to entrainment of dry air containing aerosols, Npj Clim. Atmos. Sci., 8, 8, https://doi.org/10.1038/s41612-024-00889-7, 2025.
Zhang, H., Cheng, S., Li, J., Yao, S., and Wang, X.: Investigating the aerosol mass and chemical components characteristics and feedback effects on the meteorological factors in the beijing-tianjin-hebei region, China, Environ. Pollut., 244, 495–502, https://doi.org/10.1016/j.envpol.2018.10.087, 2019.
Zhang, H., Zhang, Y., Li, Z., and Zheng, Y.: Aerosol influences on cloud water: Insights from ARM EPCAPE observations with explainable machine learning, Geophys. Res. Lett., 52, e2025GL115163, https://doi.org/10.1029/2025GL115163, 2025.
Zhao, C., Qiu, Y., Dong, X., Wang, Z., Peng, Y., Li, B., Wu, Z., and Wang, Y.: Negative aerosol-cloud re relationship from aircraft observations over hebei, China, Earth Space Sci., 5, 19–29, https://doi.org/10.1002/2017EA000346, 2018.
Zhao, C., Sun, Y., Yang, J., Li, J., Zhou, Y., Yang, Y., Fan, H., and Zhao, X.: Observational evidence and mechanisms of aerosol effects on precipitation, Sci. Bull., 69, 1569–1580, https://doi.org/10.1016/j.scib.2024.03.014, 2024.