the Creative Commons Attribution 4.0 License.
the Creative Commons Attribution 4.0 License.
 | 28 Apr 2026
Seasonality of the Quasi-biennial Oscillation signal in water vapor in the tropical stratosphere
Qian Lu
Chunhua Shi
Chaim I. Garfinkel
Stratospheric water vapor is a powerful greenhouse gas, and it can directly affect the radiative balance and temperature structure of the stratosphere. Although previous studies have investigated the water vapor variability associated with the quasi-biennial oscillation (QBO), the seasonal differences in the water vapor QBO are still not well understood. Using the ERA5 reanalysis and SWOOSH observations, this study compares the stratospheric water vapor distribution in northern winter and summer under different QBO phases. The QBO (represented by the 30 hPa QBO index) exerts the greatest influence on 100 hPa water vapor at a lag of six months. During northern summer, the peak amplitude of 100 hPa water vapor under different QBO phases in tropical regions reaches ±0.12 ppm at a six-month lag, while in winter it reaches ±0.2 ppm. The dehydration effect by cold temperature in the lower stratosphere is also more effective in boreal winter than in summer. The intensity of the QBO-related secondary circulation is stronger in the boreal winter than in summer, which not only influences the cold point tropopause temperature in tropical regions but also drives the transport of stratospheric water vapor. The mean vertical transport term via the QBO-related residual circulation is the leading factor controlling the water vapor distribution in the tropical lower stratosphere. Although the CMIP6 models simulated the lagged effect of the 30 hPa QBO on lower stratospheric water vapor, they tend to underestimate the water vapor amplitude, and the seasonal contrast is underrepresented in most models.
- Article
(10646 KB) - Full-text XML
-
Supplement
(2396 KB) - BibTeX
- EndNote


The stratospheric water vapor has an important effect on global temperature changes (Held and Soden, 2000; Dessler et al., 2013; Solomon et al., 2010), and stratospheric water vapor more specifically affects the radiative balance and temperature structure of the stratosphere (Bi et al., 2011; Xia et al., 2021). It can also further affect the stratospheric circulation through the mutual adjustment relationship between thermodynamic balance and dynamic balance (Banerjee et al., 2019; Charlesworth et al., 2023; de Forster and Shine, 1999). In addition, it also modulates chemical processes in the stratosphere, and the increase in stratospheric water vapor, for example, has a slight impact on ozone depletion (Tian et al., 2009, 2023; Wohltmann et al., 2024).
Water vapor can enter the stratosphere through different channels (Lu et al., 2020; Mote et al., 1996; Randel et al., 2015; Randel and Park, 2019; Tinney and Homeyer, 2023; Yue et al., 2019). The water vapor in the stratosphere mainly comes from the upward transport of tropospheric water vapor in the tropics (Evan et al., 2015; Garfinkel et al., 2013; Mote et al., 2000; Randel and Park, 2019), where cold temperatures at the tropopause determine the tropospheric water vapor content entering the stratosphere (Hardiman et al., 2015; Xia et al., 2019). These cold temperatures freeze and condense most of the water vapor that approaches the tropopause. As a consequence, most of the water vapor that enters the tropopause transition layer falls back to the troposphere, and only a tiny part of the water vapor eventually reaches the stratosphere (Brewer, 1949; Dessler et al., 2013; Holton and Gettelman, 2001; Ueyama et al., 2016; Xia et al., 2019).
As a leading mode of interannual variability in the equatorial stratosphere, the quasi-biennial oscillation (QBO) completes a cycle every 28 months on average (Baldwin et al., 2001; Rao et al., 2020a). During a QBO cycle, alternating easterly and westerly winds propagate downwards from the equatorial upper stratosphere to the tropopause (Baldwin et al., 2001; Cai et al., 2022; Rao et al., 2020b, 2023a, b). The QBO is primarily driven by wave fluctuations of different scales in the tropics. Waves propagating upward carry zonal momentum, and the momentum of westerly or easterly winds is deposited into the stratosphere after wave breaking (Coy et al., 2017; Lindzen and Holton, 1968; Wang et al., 2023). It is observed that the intensity of the QBO easterly phase (30–35 m s−1) is usually stronger than that of the westerly phase (15–20 m s−1), with the QBO amplitude maximized around 20–30 hPa (Anstey et al., 2022; Baldwin et al., 2001). The maintenance and transition of the QBO westerly and easterly phases are related to tropical wave activities, including Kelvin waves, mixed Rossby–gravity waves, and internal gravity waves (Canziani and Holton, 1998; Randel and Wu, 2005; Richter et al., 2014a; Holt et al., 2016; Kang et al., 2020; Bramberger et al., 2022; Garfinkel et al., 2022; Pahlavan et al., 2023). However, it remains a challenge to simulate the QBO in general circulation models (GCMs), with only a few GCMs being able to reproduce it. The waves need to be correctly represented to simulate a realistic QBO. Many GCMs still cannot simulate a realistic spectrum of tropical waves because of their low resolution and their deficiencies in the parameterization of small-scale gravity waves forcing (e.g. Ricciardulli and Garcia, 2000; Lott et al., 2014). Studies have suggested that an adequately fine vertical resolution (vertical grid spacing of ∼ 500–700 m) of the troposphere and lower stratosphere is also necessary to simulate the QBO due to the forcing of some resolved waves with small vertical wavelength and the need to capture the wind shear (Richter et al., 2014b; Geller et al., 2016). In CMIP5, only five models could generate the QBO internally (Butchart et al., 2018). In CMIP6, at least 15 models were able to simulate realistic QBO-like behavior during the historical period (Richter et al., 2020).
The evolution of the tropical stratospheric QBO is accompanied by the downward propagation of temperature anomalies (Baldwin et al., 2001; Rao et al., 2020a), which directly affects the freezing temperature of water vapor entering the stratosphere (Hardiman et al., 2015; Tao et al., 2015). The QBO winds are in balance with an anomalous secondary circulation, which both modulates the BD circulation and affects the distribution of chemical components (e.g., ozone, methane, water vapor) in the stratosphere (Baldwin et al., 2001). This anomalous secondary circulation can also explain the stratospheric temperature anomalies associated with adiabatic motions (Baldwin et al., 2001; Lu et al., 2020; Rao et al., 2019), which in turn affect water vapor entering the stratosphere (Tian et al., 2023; Xia et al., 2021; Ziskin Ziv et al., 2022). Previous work has evaluated the QBO water vapor effect in a subset of CMIP6 models, and found they qualitatively capture but underestimate the QBO effect (Ziskin Ziv et al., 2022). The QBO leads to a change of static stability in the tropical lower stratosphere and tropopause, further adjusts deep convection activities, and affects the upward transport of tropical water vapor (Dong et al., 2020; Tselioudis et al., 2010).
Serva et al. (2022) found that there are seasonal differences in temperature and stratospheric water vapor in tropical regions. In the northern summer, the temperature at 100 hPa and the water vapor at 85 hPa reach their peaks, while in winter, they reach their lowest levels (Serva et al., 2022). The QBO is affected by the Brewer-Dobson (BD) circulation, and it is stronger in northern winter than in summer (Butchart, 2014). Tegtmeier et al. (2020) found that the temperature amplitude of the QBO was 2 K in February in the northern winter and only 0.9 K in September in the summer. Similar questions naturally arise: Does the amplitude of water vapor QBO also undergo a similar change? What are the differences between winter and summer? The relationship between the QBO and tropical stratospheric water vapor has been widely investigated (Chen et al., 2005; Tao et al., 2015; Xia et al., 2021). Some studies based on short-term data have shown the seasonal differences in the impact of QBO on stratospheric water vapor, but have not quantified specific values (Tian et al., 2019; Wang et al., 2020). It still remains unclear the specific differences in the impact of QBO on stratospheric water vapor in northern winters and summers based on long-term reanalysis data. The research on the seasonal differences of water vapor QBO not only deepens the multi-time scale understanding of the stratospheric and tropospheric coupling, but also provides a scientific basis for cross-seasonal climate prediction. This study uses more samples of the QBO signal in stratospheric water vapor based on the long time series and discusses the differences in stratospheric water vapor distribution between different QBO phases and between different seasons. Possible causes of those differences are diagnosed using ERA5 and SWOOSH data, and the performance of climate models in capturing the QBO signal in water vapor is also evaluated using CMIP6 models (Ye et al., 2018; Ziskin Ziv et al., 2022).
The organization of this article is as follows. In Sect. 2, a brief description of datasets and methods is given. Section 3 presents the timeseries of the water vapor QBO. Section 4 compares differences in the distribution of stratospheric water vapor anomalies associated with the QBO between boreal winter and summer. Possible mechanisms responsible for the seasonal difference in the stratospheric water vapor signal are also discussed. Section 5 evaluates the simulation of the stratospheric water vapor QBO by CMIP6 models. Finally, conclusions are provided in Sect. 6.
2.1 Datasets
To investigate the stratospheric water vapor QBO in the tropical stratosphere, the European Centre for Medium-Range Weather Forecasts' fifth generation reanalysis (ERA5) from 1959 to 2019 (Hersbach et al., 2020) was used. The original horizontal resolution of the ERA5 reanalysis is 0.25° (latitude) × 0.25° (longitude), and the model has 137 levels in the vertical direction from 1000 to 0.01 hPa. This reanalysis has been remapped to a horizontal resolution of 1° (latitude) × 1° (longitude) at 37 pressure levels from 1000 to 1 hPa in the vertical direction. The variables used include zonal and meridional wind, specific humidity, and air temperature on pressure levels. Some studies found that the content of stratospheric water vapor in ERA5 was better to that of ERA-Interim (e.g., Wang et al., 2020), although there might still remain some uncertainties in the ERA5 stratospheric water vapor. In the ERA5 reanalysis, water vapor mainly assimilates in-situ humidity observations in the troposphere and satellite radiation observations that are only sensitive to humidity in the troposphere.
The Stratospheric Water and Ozone Satellite Homogenized (SWOOSH) dataset version 2.7 is also used in this paper. We use SWOOSH satellite observations to validate the applicability and uncertainty of ERA5 reanalysis data in stratospheric water vapor. It is a merged record of stratospheric ozone and water vapor measurements taken by a number of limb sounding and solar occultation satellites instruments over the previous ∼40 years (1984 to present). This dataset is a merged observation from the following satellite instruments: SAGE-II/III/ISS, UARS HALOE, UARS MLS, Aura MLS, ACE-FTS, and OMPS-LP (Davis et al., 2016). The gridded SWOOSH data provide monthly averages, standard deviation, number of observations and average uncertainty from each satellite instrument. SWOOSH also includes combined (multi-instrument) products based on the weighted average of available measurement values. A key aspect of the merged product is that the source records are homogenized to account for inter-satellite biases and to minimize artificial jumps in the record, producing a long-term data record. Since the UARS HALOE observation data began on 19 October 1991, we have used SWOOSH data from 1992 onwards.
To understand the possible climatic effects of stratospheric water vapor and its representation in models, this study also evaluates the historical simulations of water vapor QBO from 18 models with internally generating QBO from Phase 6 of the Coupled Model Intercomparison Project (CMIP6) (Eyring et al., 2016; Simpkins, 2017). The water vapor QBO simulated by CMIP6 models is evaluated using the ERA5 reanalysis. These models are ACCESS-CM2, AWI-CM-1-1-MR, BCC-CSM2-MR, CESM2-WACCM-FV2, CESM2-WACCM, CNRM-CM6-1, E3SM-1-0, E3SM-1-1, EC-Earth3-VEG, EC-Earth3, GFDL-ESM4, HadGEM3-GC31-LL, HadGEM3-GC31-MM, IPSL-CM6A-LR, MIROC6, MPI-ESM1-2-HR, MRI-ESM2.0, and UKESM1-0-LL. The historical simulation is a mandatory historical climate experiment from 1850 through 2014 under all observation-based and time-varying forcings (i.e., greenhouse gas concentrations, aerosols, ozone depletion, solar cycles, and land use) (Eyring et al., 2016). We only used the first historical run of the CMIP6 models, and all models provide specific humidity. CMIP6 models are remapped to 2.5° (latitude) × 2.5° (longitude) grids. Previously, some studies found that the CMIP6 models underestimate the water vapor content at the bottom of the tropical stratosphere (Keeble et al., 2021; Ziskin Ziv et al., 2022).
2.2 Methodology
The climatology of a variable is calculated as long-term monthly average over the time period from 1959 to 2019. The anomaly refers to the deviation of the monthly data from the monthly climatology with the trend removed for each calendar month. A Butterworth first-order bandpass filter was used to extract the water vapor variations at the period of 15–60 months, mimicking the water vapor QBO (Krishnamurti et al., 1990; Murakami, 1979).
The QBO index is defined as the stratospheric zonal mean zonal wind anomaly over the equator at 5° S–5° N (Baldwin et al., 2001; Rao et al., 2020a). Since the QBO wind variability is maximized around 30 hPa and for many CMIP models the QBO signal is not present below 30 hPa, the QBO index at 30 hPa is employed. QBO events are selected when the QBO index is greater than 5 (less than −5) m s−1 to build the westerly QBO (easterly QBO) composites, following previous studies (e.g., Rao et al., 2020a, b).
To accurately diagnose the driving factors of the zonal mean distribution of stratospheric water vapor under different QBO conditions, we use the transformed Eulerian-Mean (TEM) tracer continuity equation under spherical z coordinates as follows (Garcia and Solomon, 1983; Monier and Weare, 2011):
where χ is the mixing ratio of water vapor, and are the horizontal and vertical velocities of the transformed Eulerian mean residual circulation. The residual velocities are calculated as follows (Butchart, 2014; Hardiman et al., 2014):
In Eqs. (2) and (3), represents the residual meridional wind component, is the residual vertical wind component, θ denotes potential temperature, a stands for Earth's radius, ϕ signifies latitude, and ρ0 indicates air density. The overbar denotes zonal averaging, and prime denotes zonal deviations. ∇⋅M is the divergence of the eddy flux vector and represents the eddy transport of water vapor (In the case of a non-inert tracer, it doesn't represent the full eddy transport, which is partly already included in the residual term). The components of the eddy flux vector M are defined as follows (Garcia and Solomon, 1983):
The eddy flux vector represents the mass flux of water vapor by eddies. Finally, in Eq. (1) is calculated as the residual of the other terms, which includes the terms of chemical net production of water vapor, evaporation (or condensation), and water vapor eddy transport generated by small-scale disturbances.
3.1 Comparison of stratospheric water vapor in ERA5 and SWOOSH
In contrast to the troposphere, the water vapor content within the stratosphere is extremely low. Compared to the SWOOSH satellite observation data, the ERA5 reanalysis data provide a longer time span, which have more QBO samples for revealing the effect of QBO on stratospheric water vapor. Figure 1 shows the climatological means of the annual mean, summer mean, and winter mean of the water vapor mixing ratio in the stratosphere in SWOOSH and ERA5 during 1992–2019. SWOOSH and ERA5 display consistent distribution of stratospheric water vapor: water vapor concentration in the stratosphere is much less than in the troposphere and thermosphere. The largest difference between two datasets is the wet bias around 0.3 ppm at the tropical lower stratosphere in ERA5 reanalysis compared to SWOOSH (Krüger et al., 2022). The wet bias is located at 70 hPa in the annual mean and summer mean, while the wet bias is located at 100 hPa in the winter mean. Meanwhile, in the tropical upper stratosphere and above, the water vapor increases with altitude more slowly in ERA5 than in SWOOSH. In the upper stratosphere, ERA5 exhibits a dry bias.
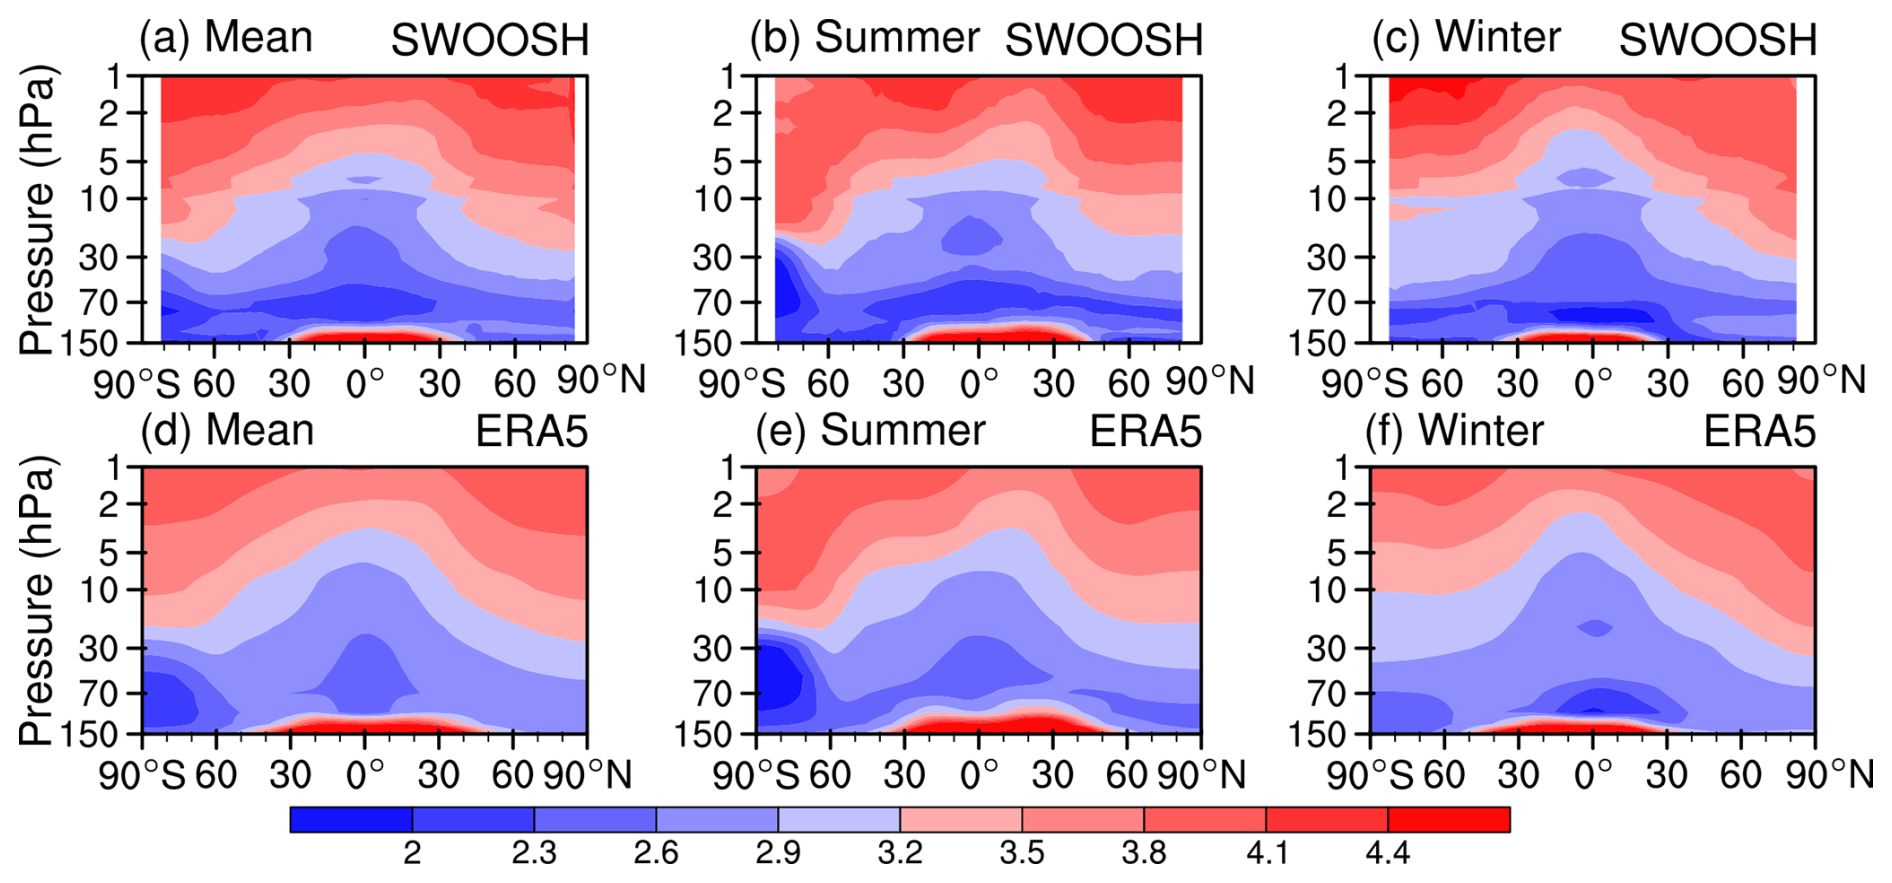
Figure 1Comparison of stratospheric water vapor from SWOOSH satellite observations and ERA5 reanalysis (unit: ppm). Panels (a)–(c) in the first row shows stratospheric water vapor from SWOOSH observations from 1992 to 2019, while panels (d)–(f) in the second row display stratospheric water vapor derived from ERA5 reanalysis from 1992 to 2019. (a, d) Multi-year mean stratospheric water vapor mass mixing ratio. (b, e) Mean stratospheric water vapor mass mixing ratio in northern summer. (c, f) Mean stratospheric water vapor mass mixing ratio in northern winter.
3.2 Comparison of water vapor QBO in ERA5 and SWOOSH
In the previous section, we compared ERA5 reanalysis with SWOOSH satellite observations and found that ERA5 reanalysis data could reproduce the distribution pattern of stratospheric water vapor (Fig. 1). To observe the QBO characteristics of stratospheric water vapor in the tropics, the stratospheric water vapor anomalies in the tropics were filtered for the periodicities of 15–60 months using a Butterworth first-order bandpass filter (Murakami, 1979; Krishnamurti et al., 1990). Figure 2 shows the evolution of stratospheric water vapor anomalies in the tropics over the past 60 years for the ERA5 reanalysis and 30 years for the SWOOSH data. In the ERA5 reanalysis, stratospheric water vapor in the lower tropical stratosphere around 30–100 hPa presents obvious QBO variations, and the maximum amplitude after bandpass filtering can reach ±0.35 ppm. The maximum stratospheric water vapor anomalies in the lower stratosphere subsequently propagate upward to the middle stratosphere, and reach around 10–30 hPa after a year. The amplitude of the water vapor QBO also gradually weakens during the upward propagation, and the maximum amplitude of the water vapor anomalies at 10–30 hPa is only ±0.15 ppm (Fig. 2a). The water vapor QBO from ERA5 is consistent with SWOOSH but the amplitude is too weak above 30 hPa (Fig. 2b). From the correlation between SWOOSH and ERA5 at each pressure level, the largest inconsistency between the two datasets is around 20–30 hPa (Fig. 2c). By comparison, it is found that although there are some differences in the stratospheric water vapor QBO between the SWOOSH satellite data and the ERA5 reanalysis data: the ERA5 reanalysis data reproduce the distribution pattern of water vapor propagation from the lower stratosphere to the middle stratosphere below 30 hPa, but the stratospheric water vapor QBO signal in ERA5 can not be trusted above 30 hPa. Therefore, the long-term data from ERA5 reanalysis can still be used to diagnose the influence and dynamics of water vapor in the middle and lower stratosphere below 30 hPa. Our subsequent analysis mainly uses ERA5 reanalysis data.
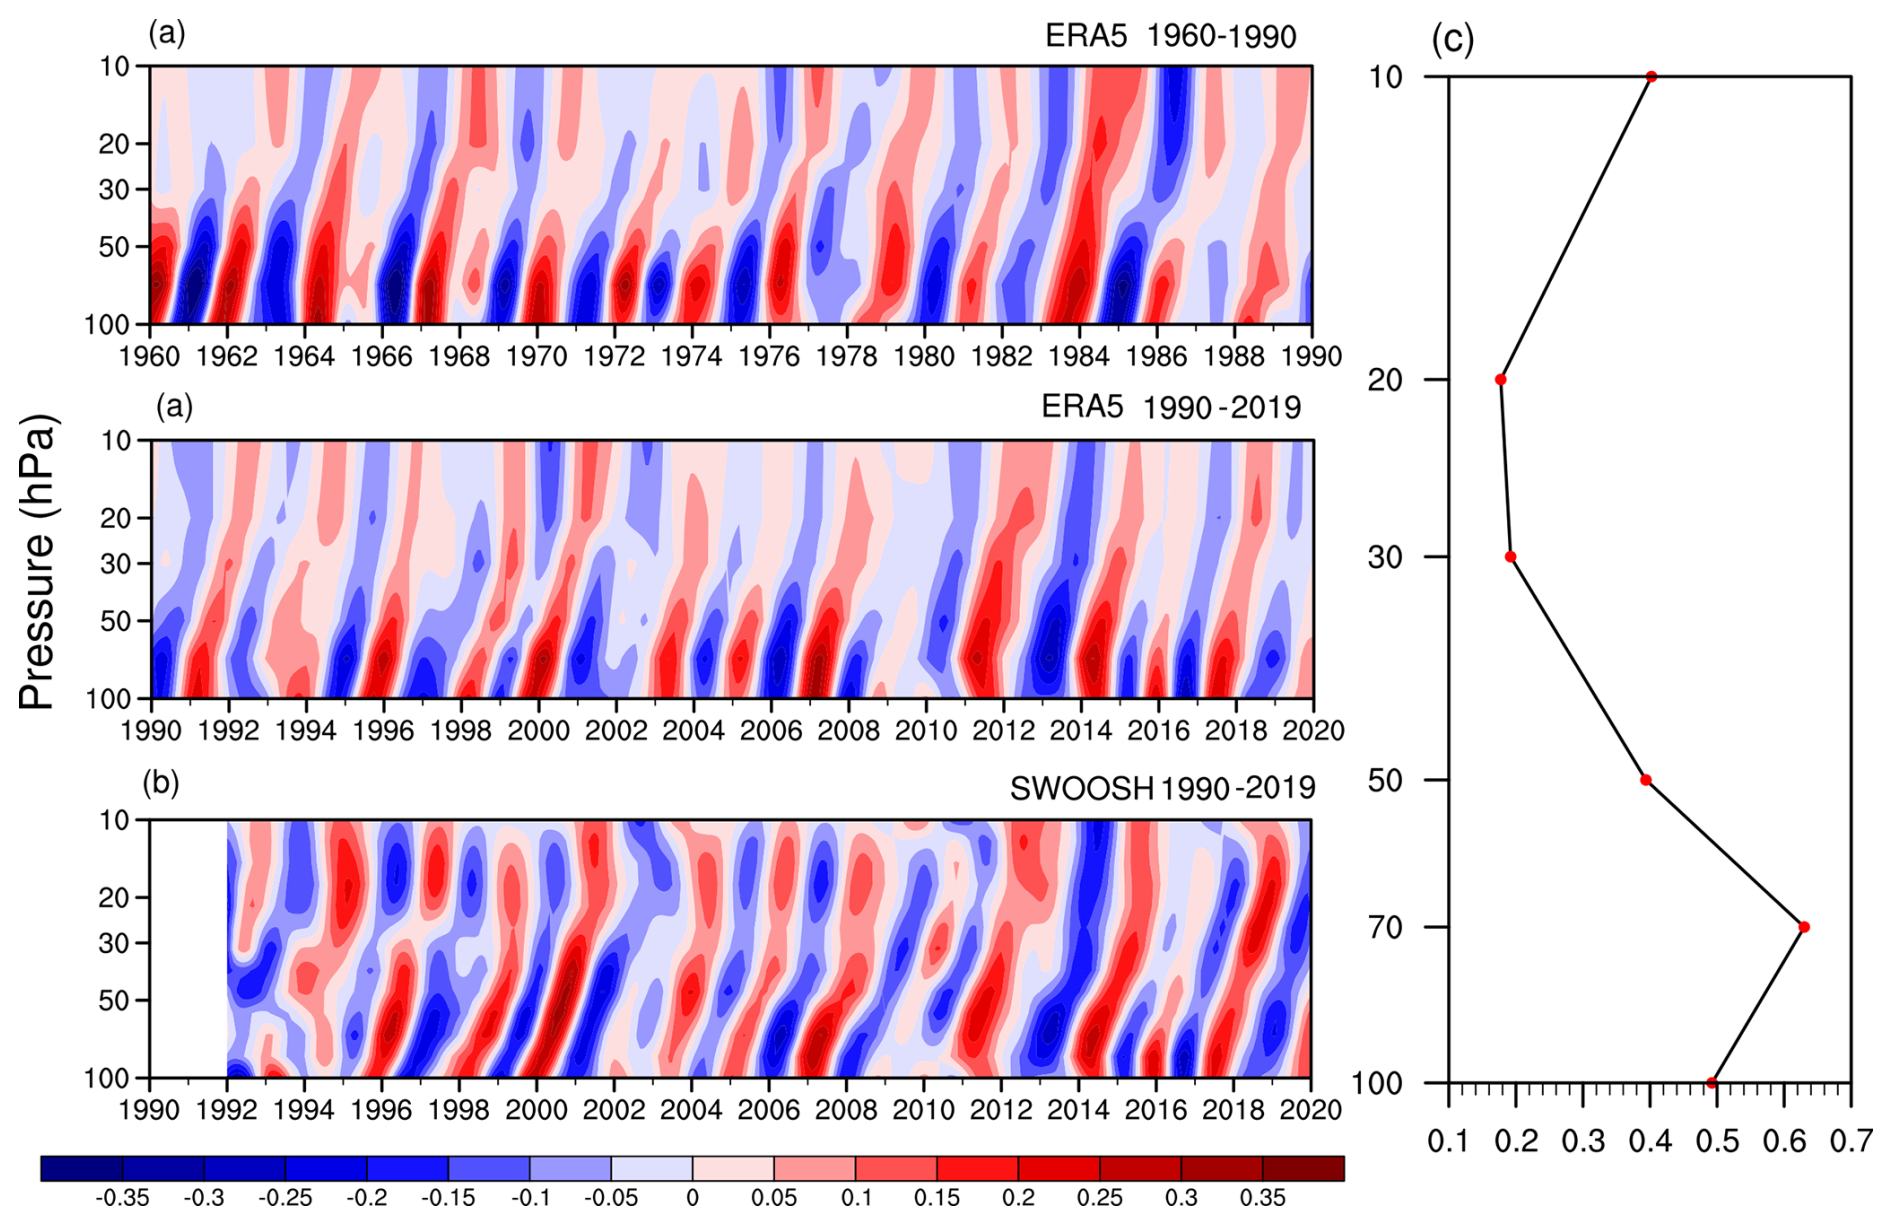
Figure 2(a) Temporal variations of water vapor anomalies averaged over the equator (5° S–5° N) with removed linear trends in the tropical stratosphere from 1960–2019 for ERA5 reanalysis (mass mixing ratio, units: ppm). (b) Water vapor anomalies from 1992–2019 for SWOOSH data (mass mixing ratio, units: ppm). (c) Correlation between SWOOSH and ERA5 at each pressure level. The anomalies are filtered by applying a 15–60-month Butterworth bandpass filter.
Figure 3 shows the zonal mean zonal wind and temperature anomalies in the tropical stratosphere. The zonal mean zonal wind anomalies in the tropical stratosphere show obvious QBO variations and propagate downward from 5 hPa to the lowermost stratosphere. The amplitude of zonal winds is relatively stable above 15 m s−1 at 5–30 hPa, and the maximum central amplitude can exceed 20 m s−1. Zonal mean zonal wind anomalies weaken rapidly from 50–100 hPa. Zonal winds alternate between the easterly and westerly most of the time, except for the disruption of the QBO westerly by the lower stratospheric easterly in 2016 (Coy et al., 2017; Wang et al., 2023).
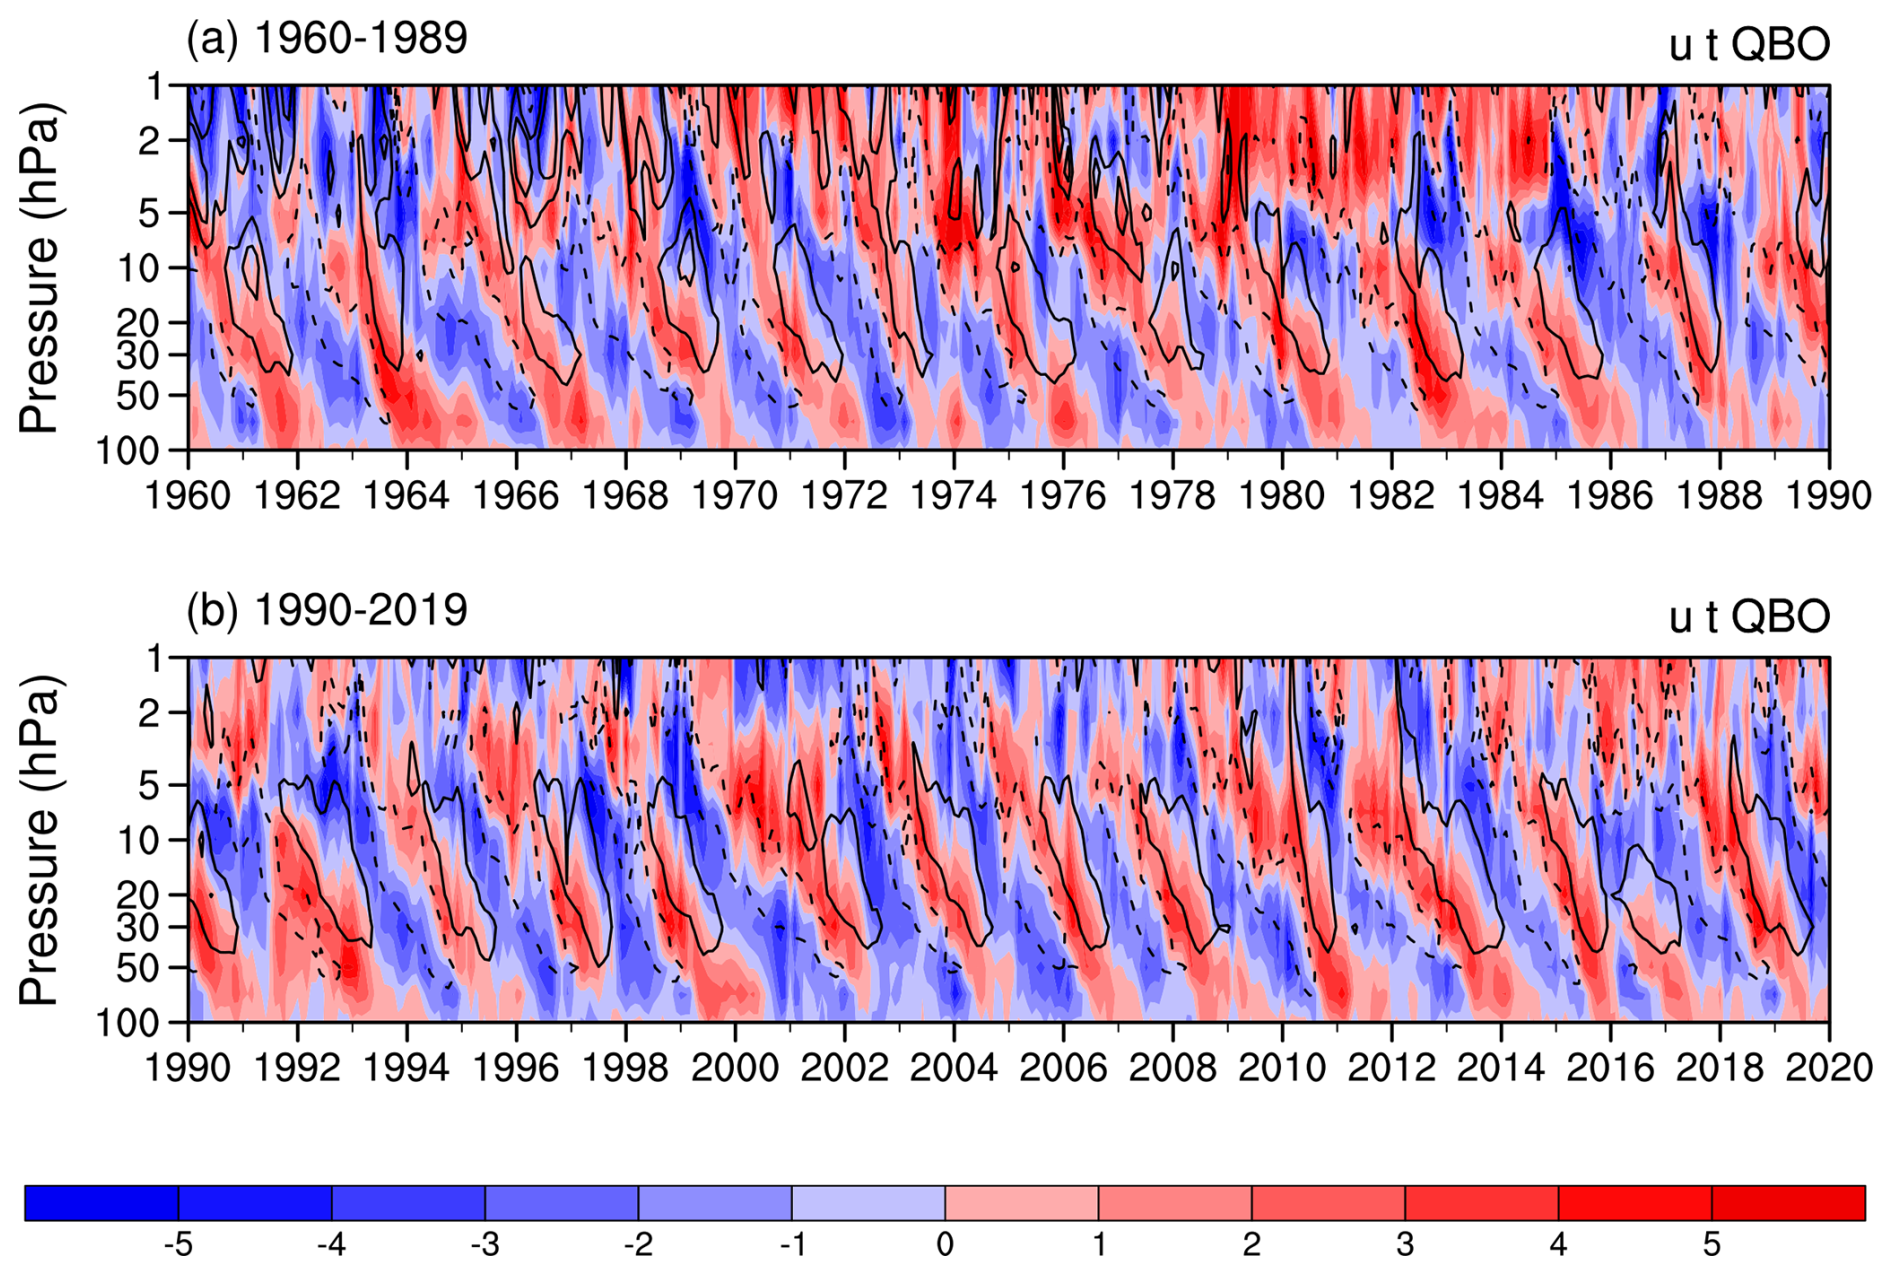
Figure 3Temporal variations of zonal mean zonal wind anomalies (contours; units: m s−1) and temperature anomalies (shadings; units: K) averaged over the equator (5° S–5° N) with removed linear trends in the tropical stratosphere from 1960–2019 for ERA5 reanalysis. The contours are shown at ±15 and ±30 m s−1.
Consistent with the zonal wind anomalies, temperature anomalies in the tropics also exhibit evident QBO variability, which gradually propagates downward to the lower stratosphere from 5 hPa. Thermal wind balance predicts that cold anomalies should lie underneath strong easterly winds and warm anomalies underneath westerly winds, and such an effect is clearly evident with peak temperature anomalies in regions of strongest shear as expected theoretically (Allen and Sherwood, 2008). The temperature anomalies can propagate downward to 100 hPa, and the temperature anomaly amplitude can exceed 3 K.
Figure 4 shows the lagged correlation coefficients between the QBO index at 30 hPa and the water vapor at each level. The amplitude of the water vapor QBO at 100 hPa can exceed 0.2 ppm, and the peak value can reach 0.35 ppm. The amplitude of the water vapor QBO at 100 hPa lags behind the amplitude of the zonal wind QBO at 30 hPa by 5 to 7 months, and the lag correlation coefficient is up to 0.75 (Fig. 4a). The amplitude of the water vapor QBO at 30 hPa is merely 0.1 ppm, and its peak value can reach 0.2 ppm. The amplitude of the water vapor QBO lags behind the amplitude of the zonal wind QBO by 14 to 16 months, and the lag correlation coefficient is maximized around 0.51 (Fig. 4b). According to the lag correlation coefficient between zonal wind on 30 hPa and water vapor at each layer, water vapor on the 100 hPa level was affected in about half a year. In contrast, the water vapor at upper level is affected by QBO at longer lags, and the lag correlation coefficient decreases accordingly (Fig. 4c). Previous studies indicated that the cold point temperature determines the water vapor in the tropical lower stratosphere (Randel and Park, 2019), while the secondary circulation excited by the QBO regulates the water vapor transport in the middle stratosphere (Geller et al., 2016). Therefore, the relationship between the QBO and water vapor is more significant in the lower and middle stratosphere.
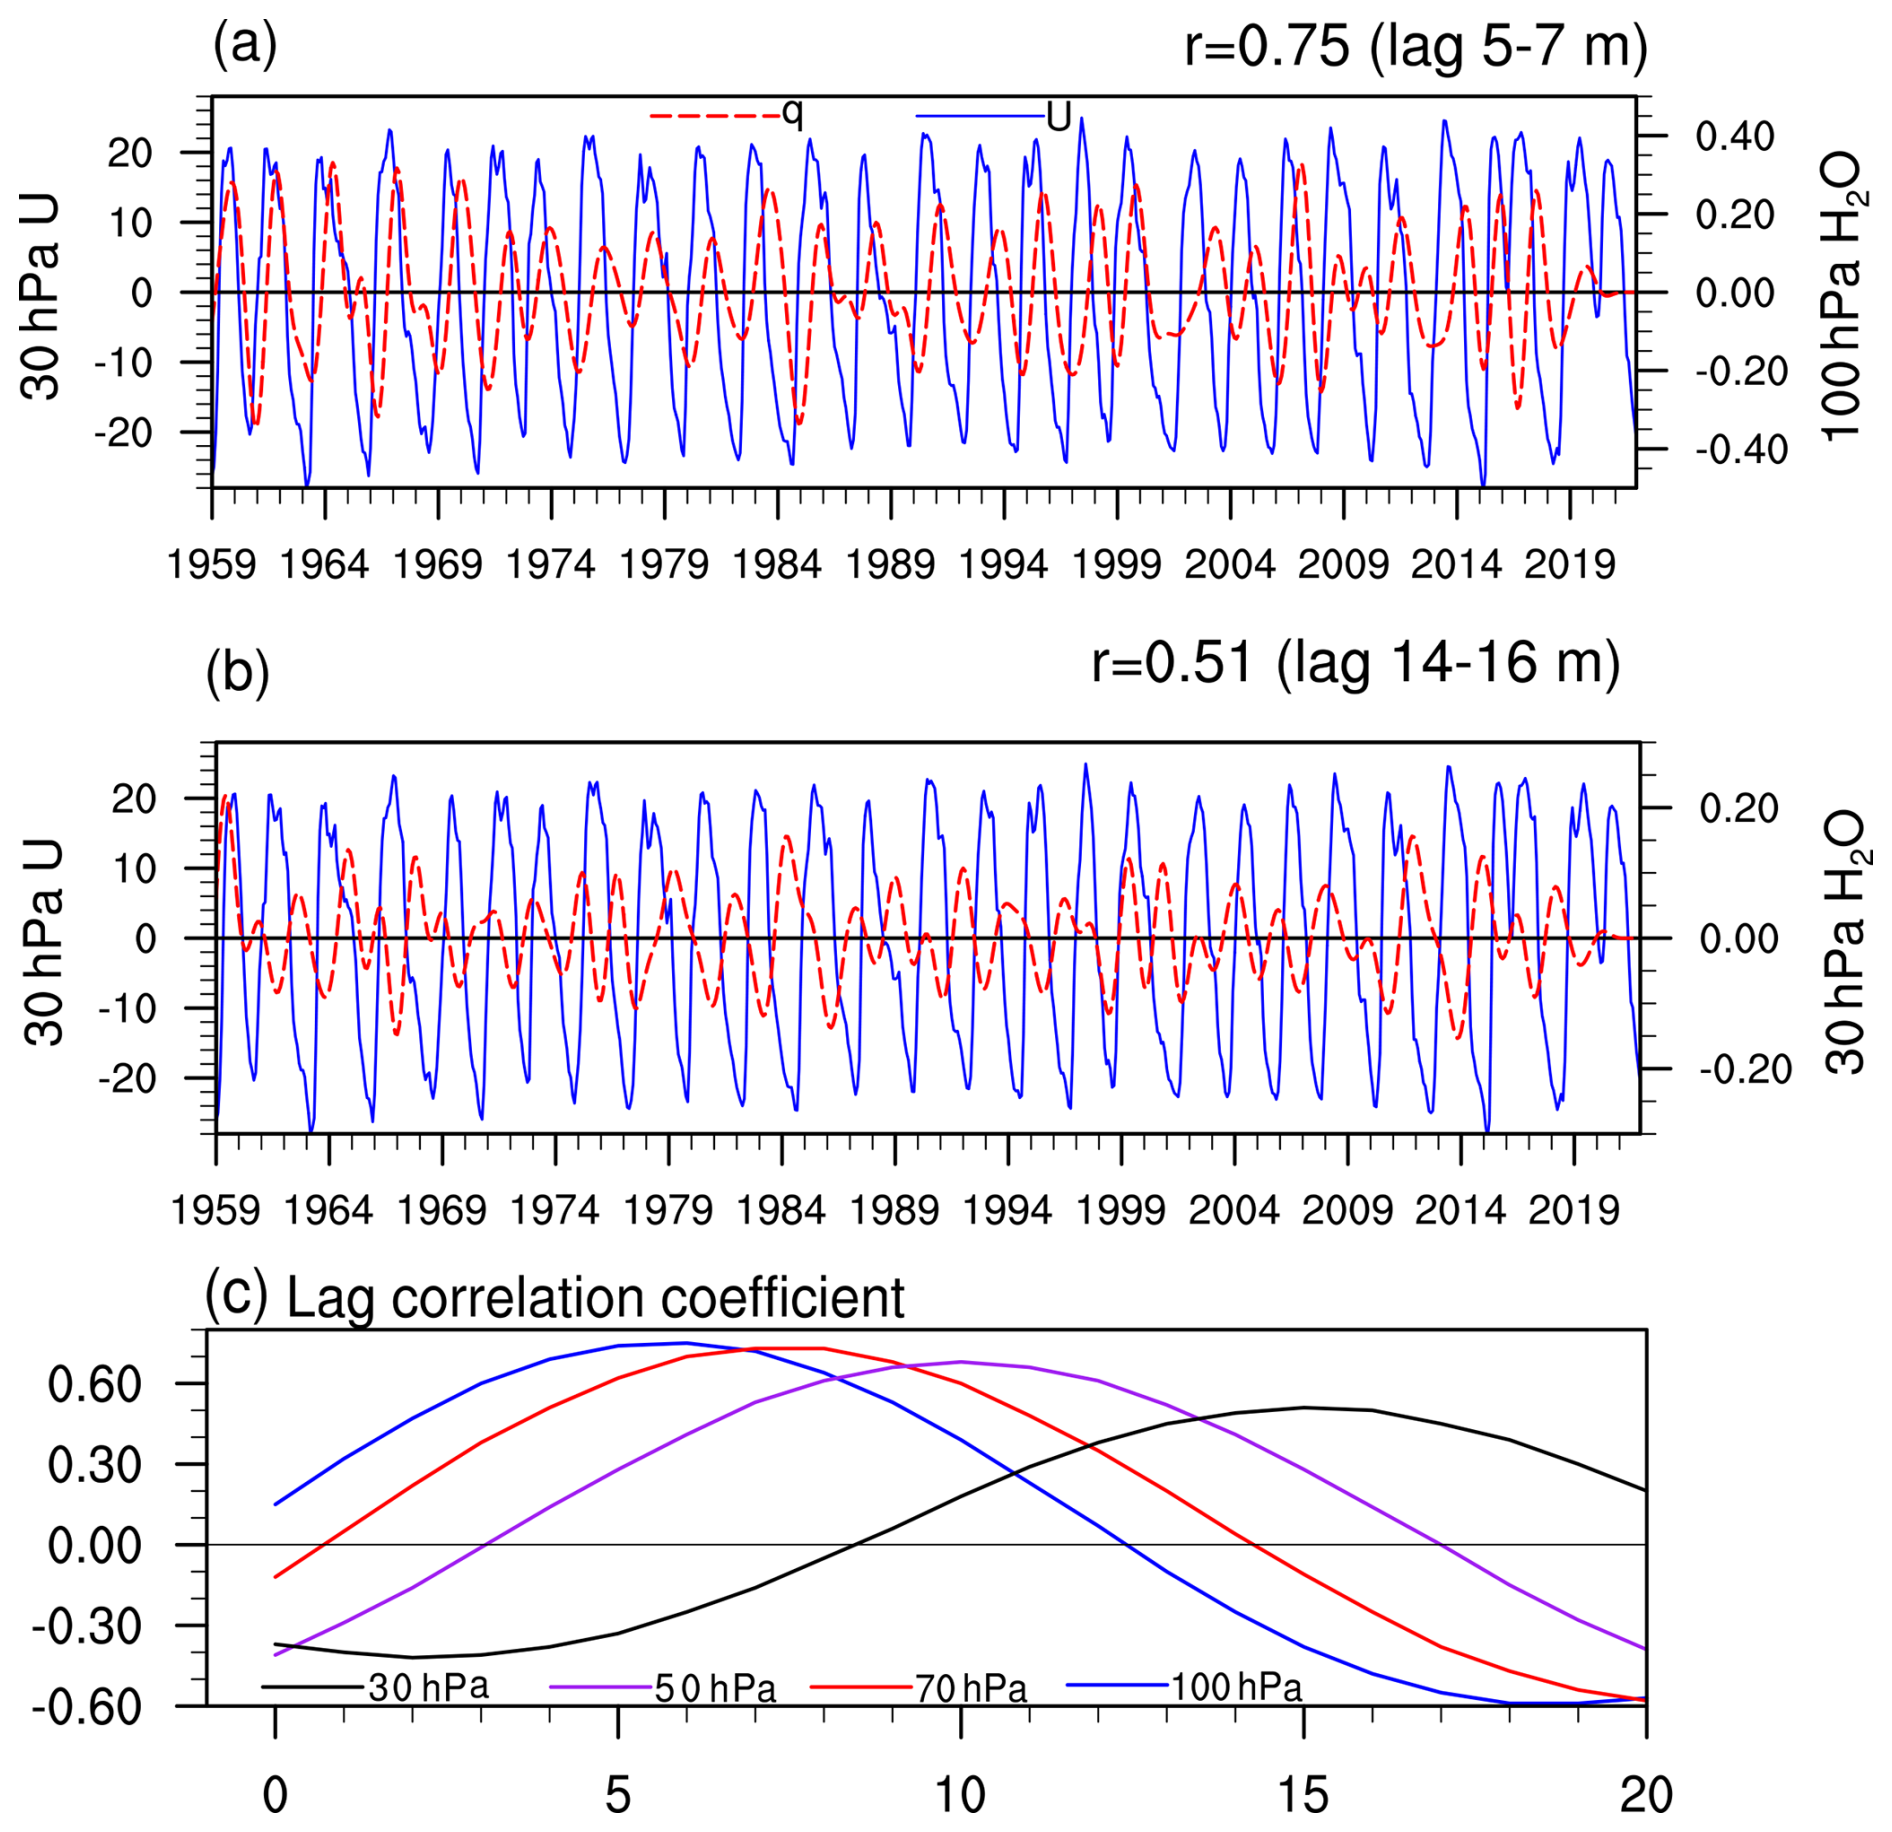
Figure 4Zonal mean zonal wind anomalies at 30 hPa (unit: m s−1) and water vapor anomalies (unit: ppm) in the tropics (5° S–5° N) from 1959–2019 for ERA5 reanalysis at (a) 100 hPa, (b) 30 hPa. (c) The lag correlation coefficient between 30 hPa zonal wind and water vapor lagging by different months. Water vapor anomalies are bandpass filtered to focus on periodicities of 15–60 months, and zonal wind anomalies are linearly detrended.
4.1 Spatial distribution of water vapor QBO
During both winter and summer, the influence of QBO on tropical stratospheric water vapor entry is nearly symmetrical. Under the QBO westerly phase as an example, the distribution of tropical stratospheric water vapor displays a sandwich structure with positive, negative, and positive water vapor anomalies from the lower to upper layers (Fig. S2 in the Supplement). Further, the water vapor anomalies in the lower stratosphere during winter are stronger than during summer (Fig. S3).
The primary source of stratospheric water vapor is tropical tropospheric water vapor entering the stratosphere. Figure 4 shows that the modulation effect of QBO (30 hPa zonal wind) on 100 hPa water vapor reaches its maximum after a lag of half a year. Therefore, Fig. 5 shows the 100 hPa water vapor anomalies lagging by 6 months at different QBO phases in winter and summer. During the QBO westerly phase in the northern summer, water vapor in the tropics with a lag of 6 months increases, and the center of the positive anomaly magnitude exceeds 0.12 ppm in the Indo-Pacific region (Fig. 5a). During the QBO easterly phase in the northern summer, water vapor with a lag of 6 months decreases with the maximum center of 0.16 ppm in the Indo-Pacific region (Fig. 5b). These summer anomalies are smaller than the winter anomalies. Namely, during the QBO westerly phase in the northern winter, tropical water vapor with a lag of 6 months uniformly increases with the largest magnitude around 0.2 ppm in the Atlantic Ocean (Fig. 5c), and the dehydration with a lag of 6 months during the QBO easterly phase in the northern winter also peaks around −0.2 ppm in the Atlantic Ocean (Fig. 5d). The amplitude of the water vapor response with a lag of 6 months at 100 hPa to the QBO forcing in winter is larger than that to the QBO forcing in summer.
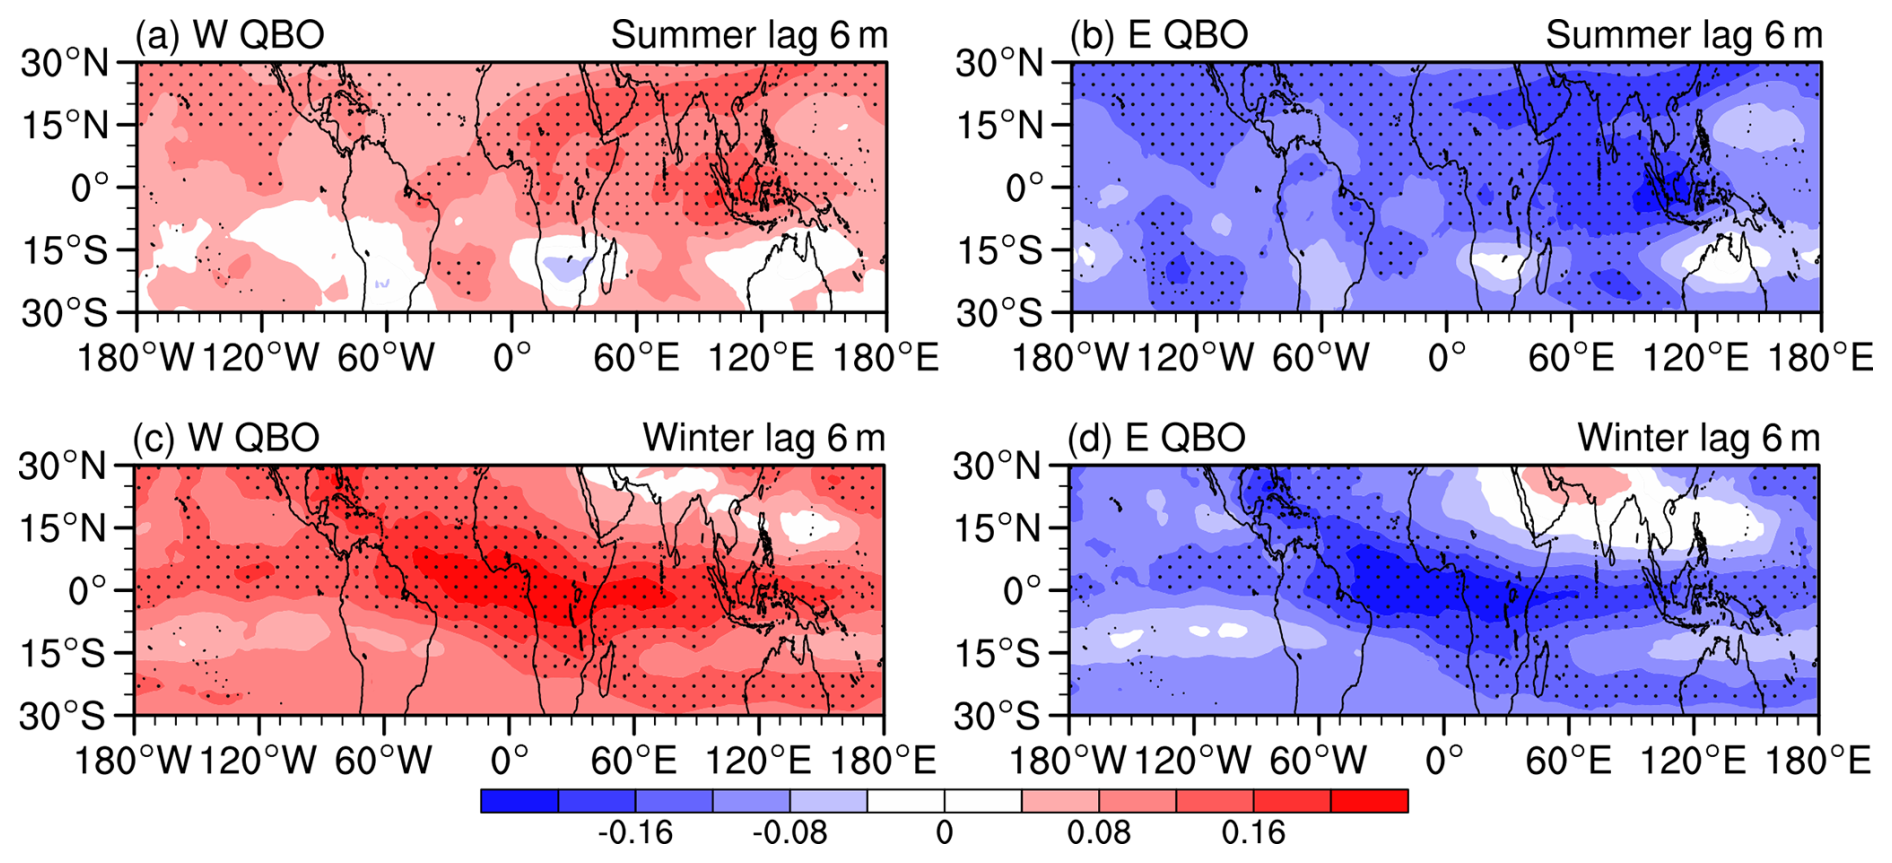
Figure 5Distribution of water vapor anomalies with a lag of 6 months at 100 hPa under different QBO phases in northern winter and summer from 1959–2019 for ERA5 reanalysis (mass mixing ratio, unit: ppm), respectively. (a) Composite of QBO westerly in northern summer. (b) Composite of QBO easterly in northern summer. (c, d) As in (a), (b) but for northern winter. Dots mark the composite anomalies at the 99 % confidence level.
4.2 Factors affecting the water vapor distribution
Since the cold point temperature near the tropopause regulates entry water vapor (see the Introduction), we now consider the temperature response to the QBO. Figure 6 shows the zonal mean temperature anomalies under different QBO phases in boreal summer and winter, respectively. It is found that the temperature anomalies in the tropics and subtropics show a quadrupole pattern in both boreal summer (Fig. 6a, b) and winter (Fig. 6c, d), although the temperature quadrupole is positioned differently.
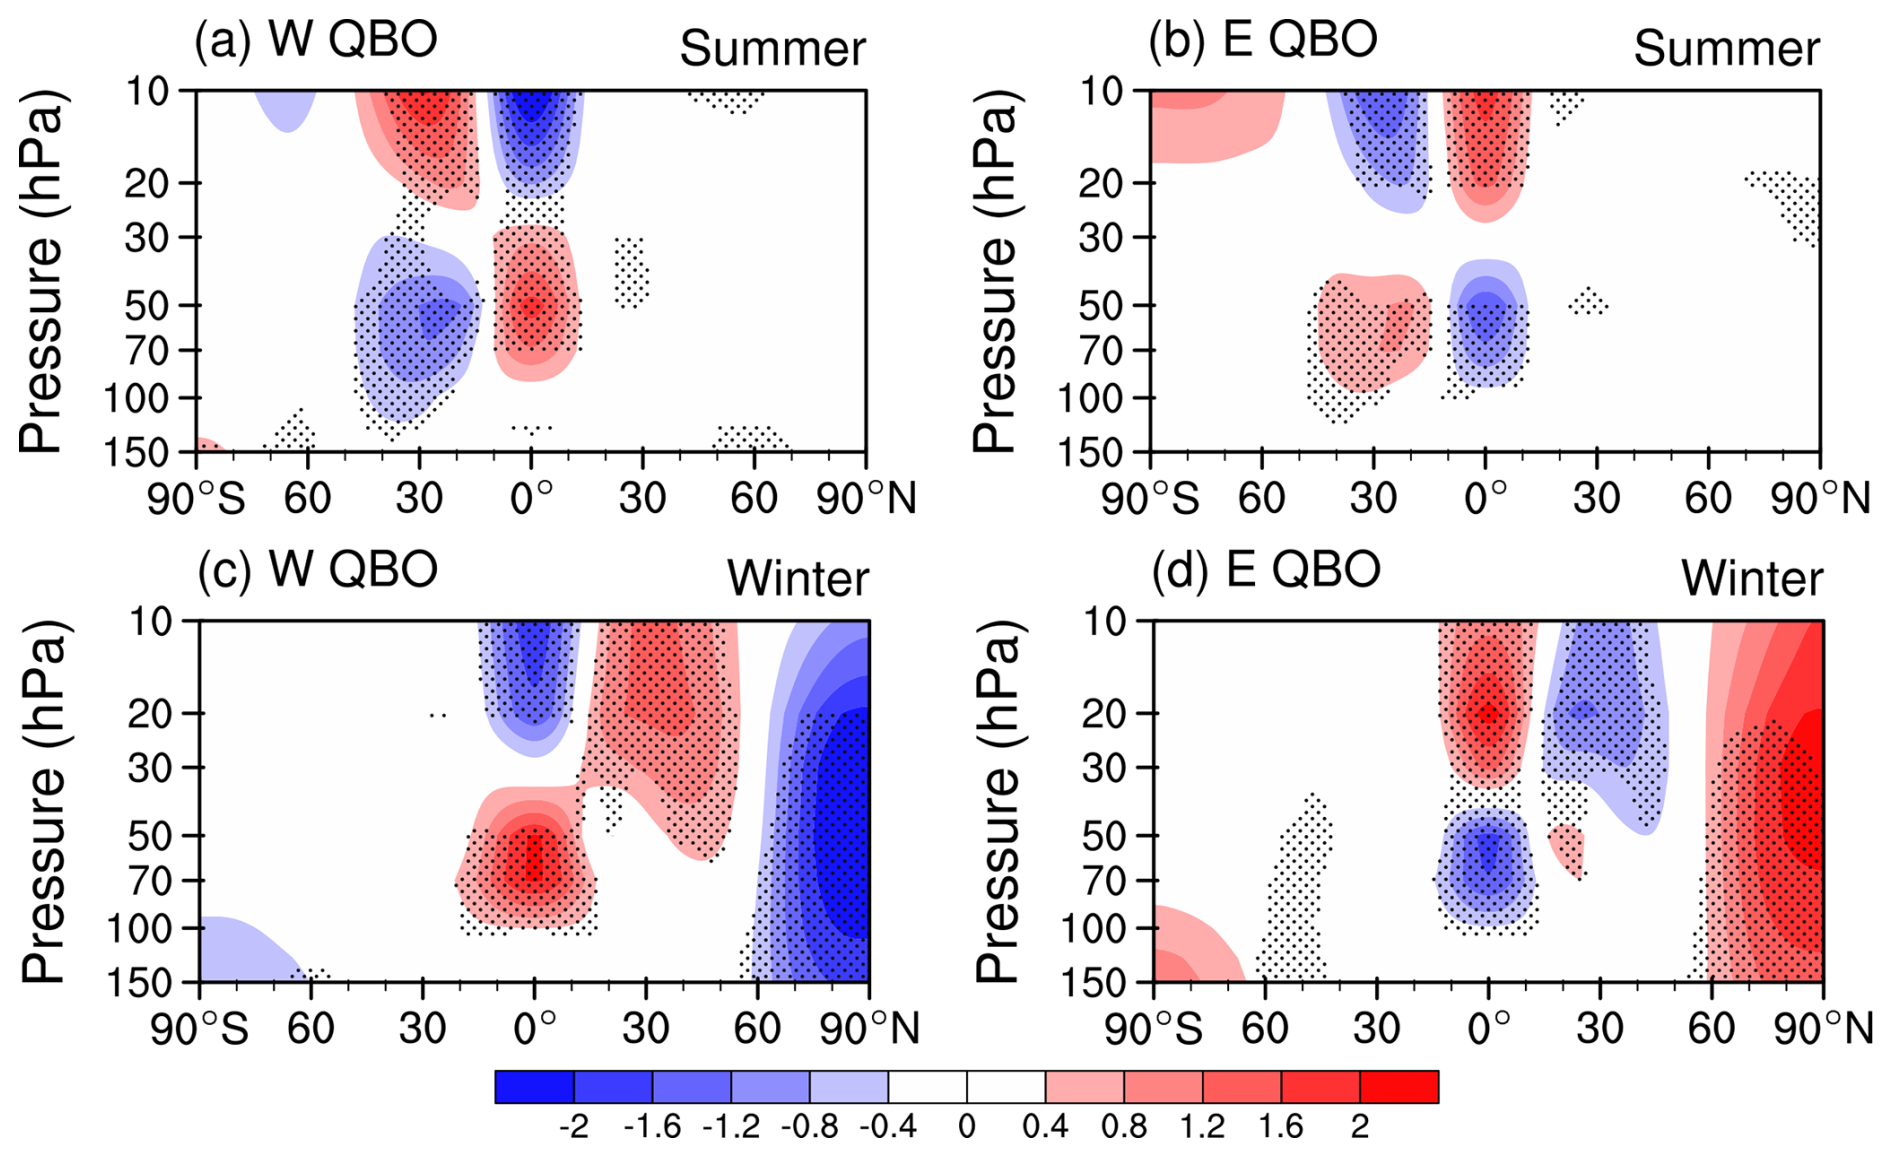
Figure 6Zonal mean temperature anomalies under different QBO phases in northern winter and summer from 1959–2019 for ERA5 reanalysis (unit: K), respectively. (a) Temperature anomalies during the QBO westerly phase in the northern summer. (b) Temperature anomalies during the QBO easterly phase in the northern summer. (c, d) As in (a), (b) but for temperature anomalies for the northern winter. Dots mark the composite anomalies at the 95 % confidence level.
Under the QBO westerly phase in boreal summer, the tropical lower stratosphere around 30–100 hPa warms, as expected from thermal wind balance (Allen and Sherwood, 2008). The temperature anomalies in the southern hemisphere subtropics are nearly opposite to those in the tropics, with cold anomalies in the lower stratosphere (Fig. 6a). Under the QBO easterly phase in boreal summer, the tropical lower stratosphere around 30–100 hPa cools, and the temperature anomalies in the southern hemisphere subtropics are opposite to those in the tropics, with warm anomalies in the lower stratosphere (Fig. 6b). Under the westerly QBO phase in boreal winter, the tropical lower stratosphere around 30–100 hPa is anomalously warm, and the northern hemisphere subtropics are controlled by warm anomalies around 10–70 hPa (Fig. 6c). Under the easterly phase in boreal winter, the lower stratosphere in the tropics is anomalously cold, and the northern subtropics stratosphere around 50 hPa is weakly warm (Fig. 6d).
By analyzing the stratospheric temperature anomalies at different QBO phases, it can be found that only the cold temperature at the bottom of the tropical stratosphere can affect the change of stratospheric water vapor, while the temperature change in the middle stratosphere does not directly alter the water vapor content.
The temperature near the tropopause and in the lower stratosphere significantly affects the distribution of water vapor entering the stratosphere especially in the tropics (Garfinkel et al., 2013, 2021; Ueyama et al., 2016). Comparing the temperature anomaly distribution in boreal winter versus summer, the coverage and amplitude of tropical temperature anomalies are very different: the lower stratospheric temperature variations associated with QBO in the tropics are much stronger in winter than in summer (Fig. S4). This is consistent with the discovery by Tegtmeier et al. (2020) that the QBO temperature amplitude is stronger in winter than in summer. Previous studies have shown that deep convection produces warming in the upper troposphere and cooling near the cold point tropopause (Gettelman and Birner, 2007; Kim et al., 2018; Muhsin et al., 2018). The QBO modulating the temperature signal on the southern side of the South Asian monsoon (i.e., the Indo-Pacific Warm Pool region) in July and August is related to the changes in equatorial clouds, which in turn affect the water vapor distribution in the upper troposphere and lower stratosphere of this region (Peña-Ortiz et al., 2024). In the northern winter, the OLR anomalies add extra warm anomalies during the QBO westerly phase and cold anomalies during the QBO easterly phase, which increases the temperature difference between the easterly and westerly QBO phases, but this effect is relatively weak in the northern summer (Fig. S5).
As the influence of the QBO signal gradually propagates to lower layers, the temperature anomaly with a lag of 6 months at 100 hPa is shown in Fig. 7. Under the QBO westerly phase in the northern summer, warm anomalies are distributed in a band-like pattern in the equatorial region, with the warmest point in the Indo-Pacific Warm Pool reaching 0.45 K (Fig. 7a). Under the QBO easterly phase in the northern summer, the cold anomalies occurred in the equatorial region, and the cold center in the Indo-Pacific Warm Pool was −0.45 K (Fig. 7b). Under the QBO westerly phase in the northern winter, the range of warm anomalies in the equatorial region is wider, with the anomaly amplitude of ∼0.6 K in the Atlantic Ocean and Africa (Fig. 7c). Under the QBO easterly phase in the northern winter, cold anomalies occur with a center of ∼0.45 K in the Atlantic Ocean (Fig. 7d). The QBO at 30 hPa affects the 100 hPa temperature amplitude half a year later, which in turn influences the water vapor entering the stratosphere. The QBO delayed impact in the northern winter is still stronger than that in summer.
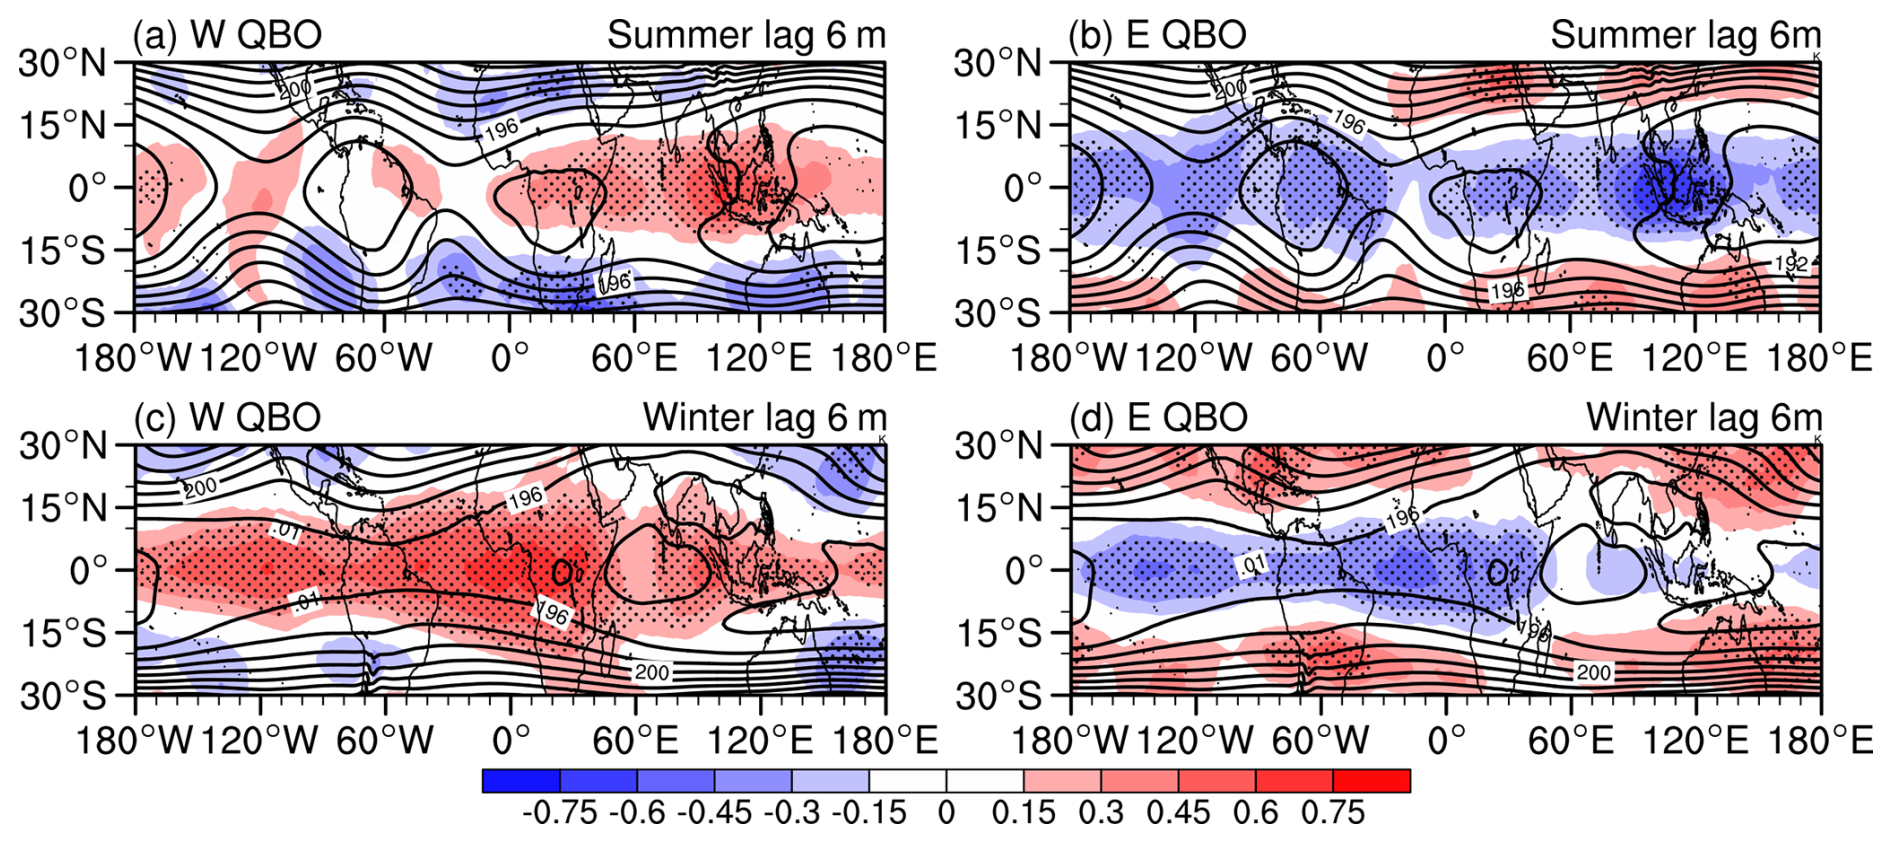
Figure 7Temperature anomalies with a lag of 6 months at 100 hPa under different QBO phases in northern winter and summer from 1959–2019 for ERA5 reanalysis (shadings; unit: K), respectively. (a) Temperature anomalies during the QBO westerly phase in the northern summer. (b) Temperature anomalies during the QBO easterly phase in the northern summer. (c, d) As in (a), (b) but for temperature anomalies following the QBO in the northern winter. Contours show the temperature climatology in winter and summer (contour interval: (2), and dots mark the composite anomalies at the 95 % confidence level.
The Brewer-Dobson (BD) circulation in the stratosphere can directly affect the transport of water vapor from the tropical troposphere to the stratosphere (Holton et al., 1995; Butchart 2014; Keeble et al., 2021). The BD circulation also affects tropopause temperature in the tropics, which in turn affects water vapor entering the stratosphere (Abalos et al., 2021; Butchart, 2014; Hardiman et al., 2014). Figure 8 shows the BD circulation anomalies for different QBO phases in the northern winter and summer. The QBO-related secondary circulation anomalies are only evident in the winter hemisphere (i.e., the southern hemisphere in boreal summer and northern hemisphere in boreal winter), mainly due to enhanced active planetary waves at midlatitudes in the winter hemisphere.
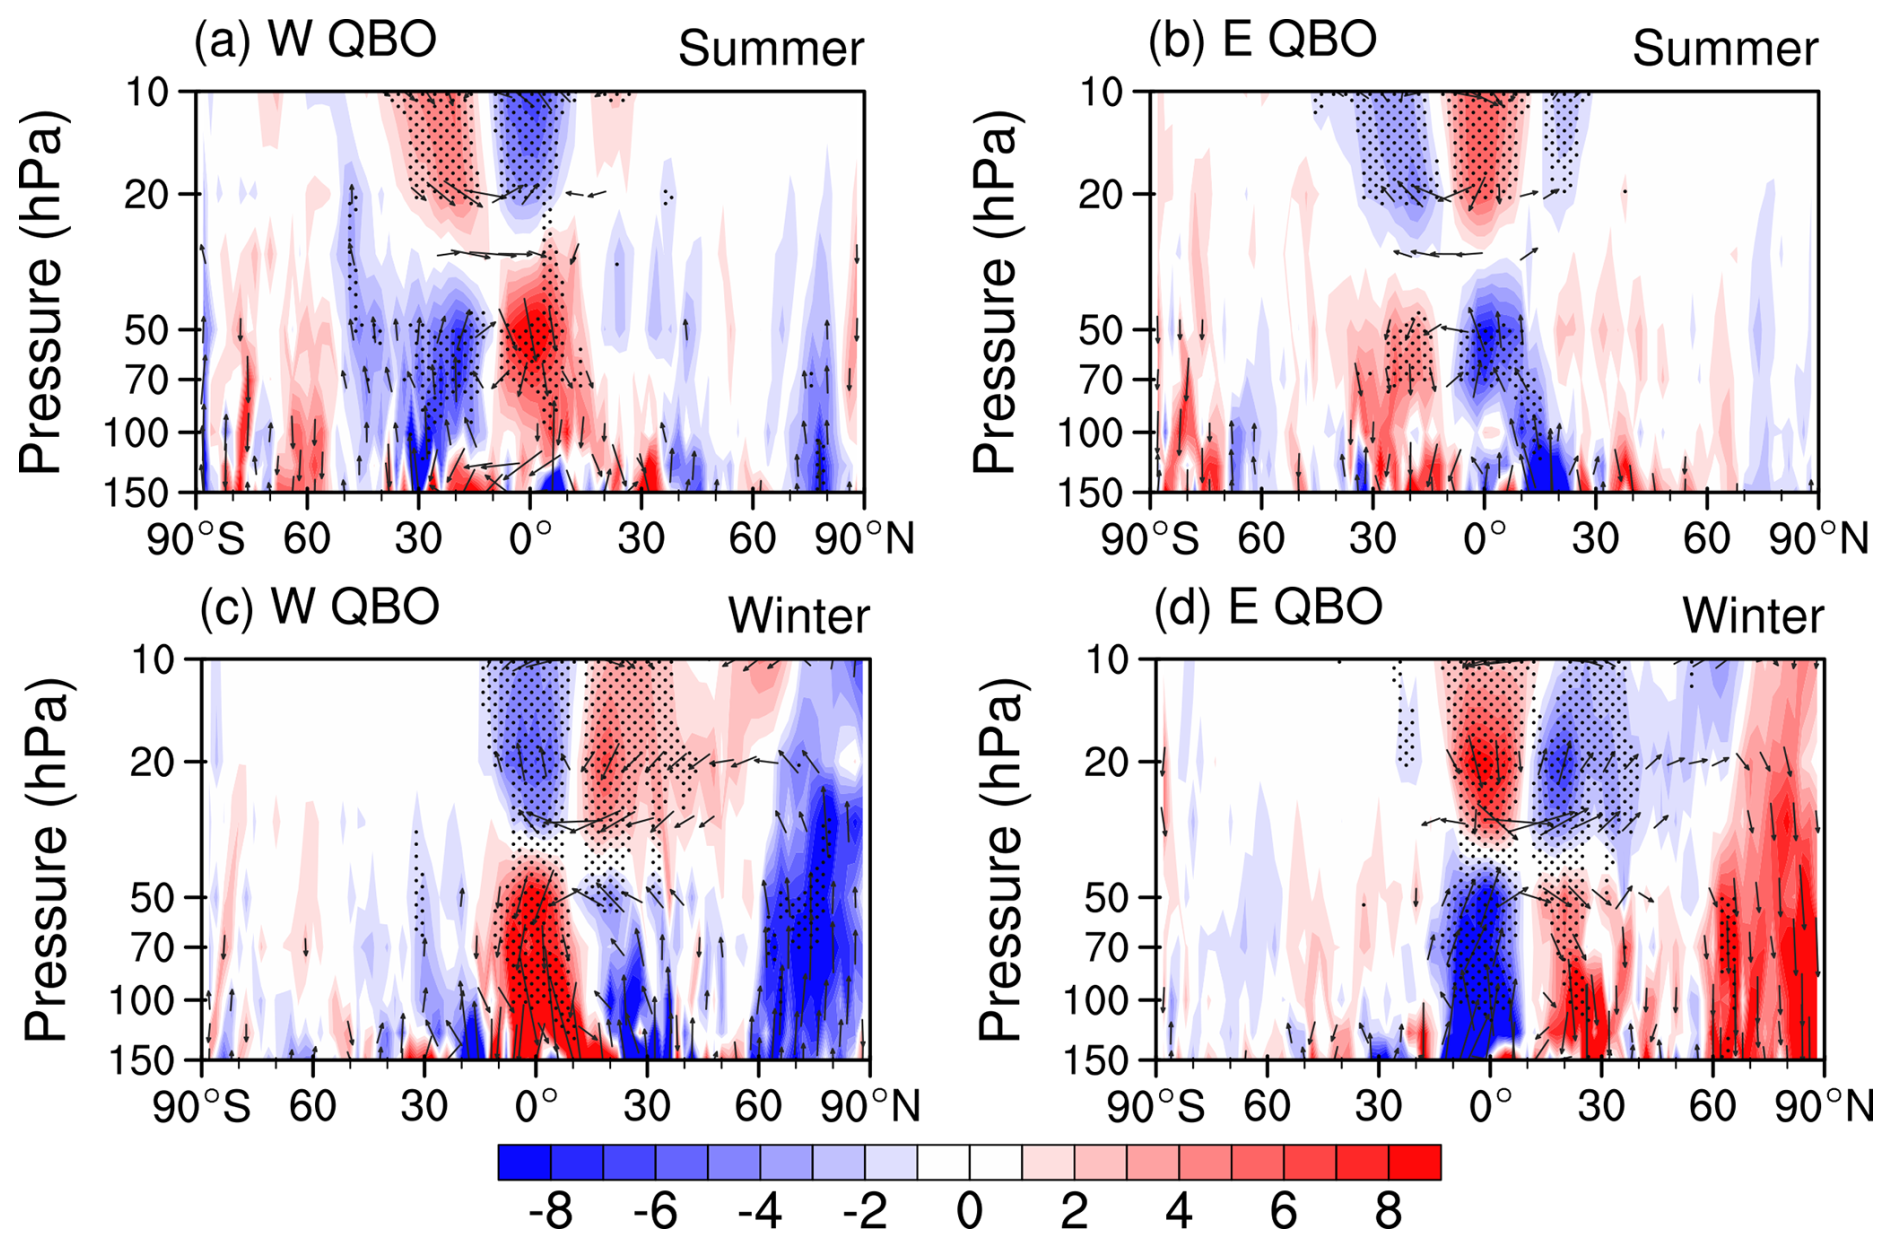
Figure 8(a) Residual circulation anomalies during the QBO westerly phase in the northern summer from 1959–2019 for ERA5 reanalysis (units: 10−5 Pa s−1). (b) Residual circulation anomalies during the QBO easterly phase in the northern summer from 1959–2019 for ERA5 reanalysis (units: 10−5 Pa s−1). (c, d) As in (a), (b) but for residual circulation anomalies for the northern winter (units: 10−5 Pa s−1). Dots mark the composite vertical residual velocity anomalies at the 95 % confidence level. The shading is the vertical component of the residual velocities.
Under the QBO westerly phase in northern summer, anomalous strong upwelling appears in the lower stratosphere over the southern hemisphere subtropics, accompanied by anomalous strong downwelling in the tropics. As a consequence, a clockwise secondary circulation cell appears in the lower stratosphere. The residual circulation anomaly pattern in the middle and upper stratosphere is reversed: anomalous rising motion over the tropics and sinking over the southern hemisphere subtropics region (Fig. 8a). Under the easterly phase in boreal summer, the residual circulation anomalies show ascent in the tropical lower stratosphere and descent in the lower stratosphere of the southern hemisphere subtropics, resulting in a counterclockwise secondary circulation cell in the lower stratosphere. In the middle stratosphere, the residual circulation anomalies show descent in the tropics and ascent in the subtropics, resulting in a clockwise circulation (Fig. 8b).
Under the westerly phase of the QBO in northern winter, the lower stratospheric residual circulation sinks in the tropics and rises in the subtropics. The middle stratospheric residual circulation rises in the tropics and sinks in the northern hemisphere subtropics (Fig. 8c). Under the QBO easterly phase in the northern winter, the lower stratosphere vertical residual velocity anomaly shows upwelling in the tropics and sinking in the northern hemisphere subtropics with the ascending branch in the tropics being stronger. The residual circulation in the middle stratosphere sinks in the tropics and rises in the northern hemisphere subtropics (Fig. 8d).
For all circumstances, the secondary circulation cell is consistent with the distribution of stratospheric temperature anomalies: downwelling leads to warm anomalies and upwelling leads to cold anomalies via adiabatic heating/cooling. Namely, when an air mass descends, it is compressed, its volume decreases, its internal energy increases, and its temperature rises. This phenomenon is called adiabatic heating. Conversely, during ascent, adiabatic cooling occurs. The anomalous secondary circulation not only leads to the advection of water vapor in the tropical stratosphere, but also affects the tropopause cold point temperature.
The transformed Eulerian-Mean (TEM) tracer continuity equation is used to quantify the balance of stratospheric water vapor associated with the QBO. Since the water vapor QBO is stronger in northern winter, the TEM diagnosis for the northern winter is shown in Fig. 9. Under the QBO westerly phase, the tropical water vapor shows a positive tendency between 30–100 hPa (Fig. 9a), explaining the water vapor anomalies. The first two terms on the right side of Eq. (1) are the mean transport of water vapor by the residual circulation (Fig. 9b). The change of mean advection of water vapor is basically consistent with the tendency of water vapor in the tropical region. Positive anomalies are observed at the 30–100 hPa stratosphere. However, in the tropical lower stratosphere, the positive anomaly of the mean advection is smaller than that of the water vapor tendency (Fig. 9b). In the tropics, the meridional and the vertical mean advections together constitute the mean advection term (Fig. S6). Namely, the residual circulation explains partially the water vapor variation in the tropical stratosphere. The transport of water vapor by the eddy advection occurs mainly in the northern hemisphere (Fig. 9c) and is counterbalanced by the residual term (Fig. 9d). It is worth noting that at the bottom of the tropical stratosphere, the residual term generates positive water vapor anomalies, associated with increase in the cold point temperature of the tropical tropopause under the QBO westerly phase (Fig. 9d). The tendency, mean advection and eddy advection of water vapor during the QBO easterly phase in the northern winter (Fig. 9e, f, g) are generally opposite to those during the QBO westerly phase. The residual item, including the net chemical production, the evaporation and sublimation, and the condensation and deposition, also exhibits negative water vapor anomalies in the tropical lower stratosphere (Fig. 9h). Through the above analysis, it can be found that the QBO influences tropical stratospheric water vapor variations primarily through two mechanisms. One is the mean advection term of the residual circulation, and the other is the tropopause cold point temperature that exerts influence on stratospheric water vapor entry.
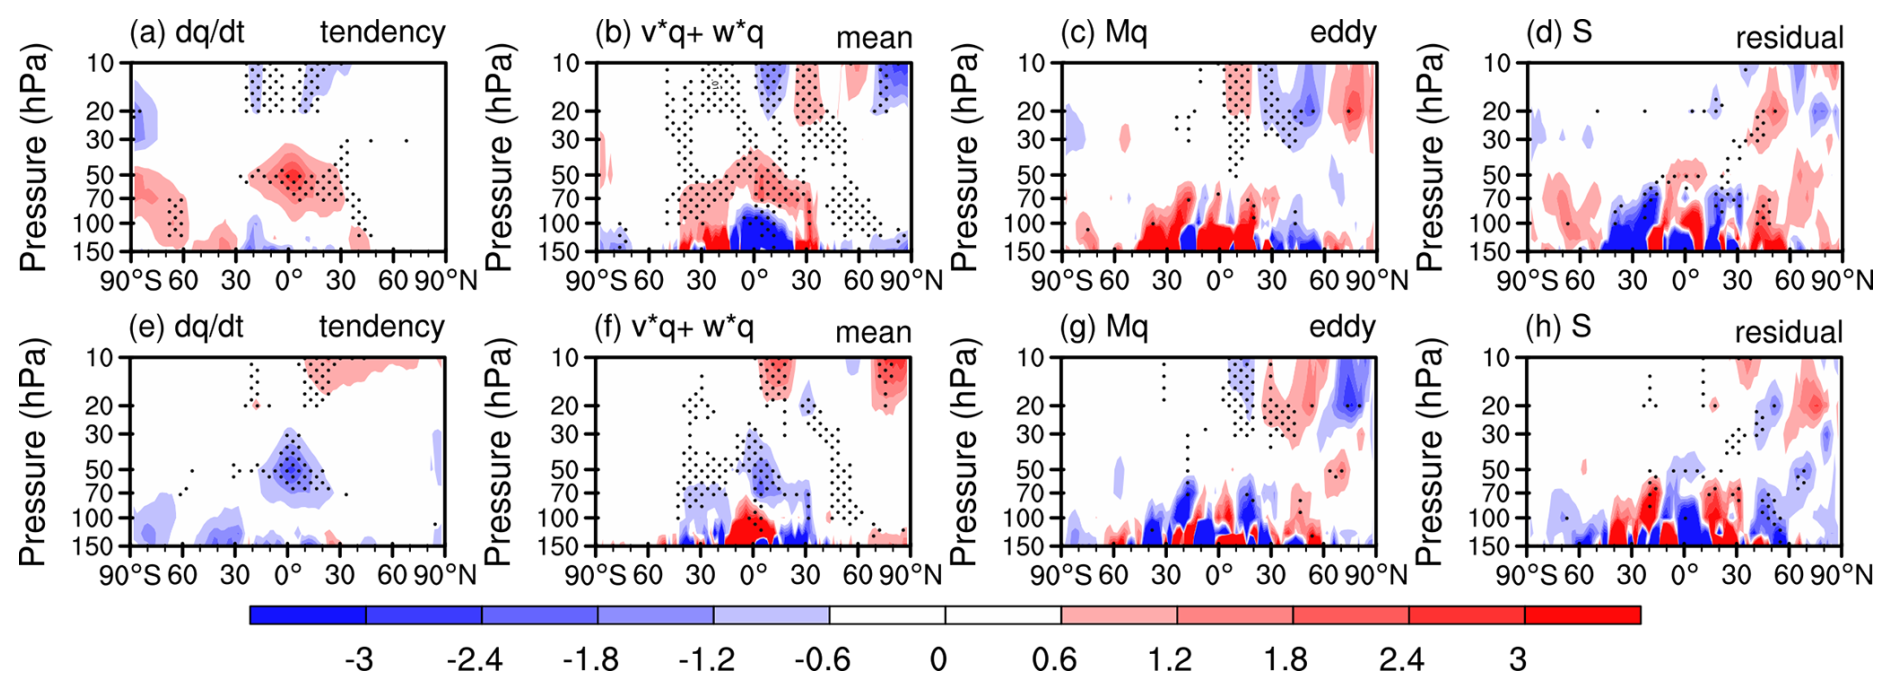
Figure 9Diagnosis of the transformed Eulerian-Mean (TEM) tracer continuity equation in the northern winter from 1959–2019 for ERA5 reanalysis. (a) water vapor tendency during the QBO westerly phase (units: ppb d−1). (b) The mean advection of water vapor during the QBO westerly phase (ppb d−1). (c) The eddy transport of water vapor during the QBO westerly phase (ppb d−1). (d) The residual term of water vapor during the QBO westerly phase (ppb d−1). (e–h) The same as in (a), (d) but for QBO easterly phase.
Since stratospheric water vapor has important climatic effects, evaluation of the simulated water vapor QBO by CMIP6 models is helpful in diagnosing how to improve the performance of the models (Keeble et al., 2021; Ziskin Ziv et al., 2022). Figure 10 shows the simulation of stratospheric water vapor QBO from 18 CMIP6 high-top models. Comparing the simulated water vapor QBO from CMIP6 models with the ERA5 reanalysis data (Figs. 2, S1), 13 models (ACCESS-CM2, AWI-CM-1-1-MR, CESM2-WACCM-FV2, CESM2-WACCM, E3SM-1-0, E3SM-1-1, GFDL-ESM4, HadGEM3-GC31-LL, HadGEM3-GC31-MM, MIROC6, MPI-ESM1-2-HR, MRI-ESM2.0, and UKESM1-0-LL) can effectively simulate the QBO variation of water vapor in the lower stratosphere (30–100 hPa). The water vapor anomalies show continuous upward propagation from the lower to upper stratosphere in these models. The water vapor QBO in E3SM-1-0 and E3SM-1-1 only propagates to 30 hPa, which is relatively shallow compared to the ERA5 reanalysis. Differences in the height coverage of the water vapor QBO prevail among CMIP6 models. By analyzing the amplitude of the water vapor QBO, it is observed that the amplitudes simulated by most CMIP6 models are relatively small, with only those of the CESM2-WACCM-FV2, HadGEM3-GC31-LL, HadGEM3-GC31-MM, MRI-ESM2-0 and UKESM1-0-LL models closely matching the ERA5 reanalysis.
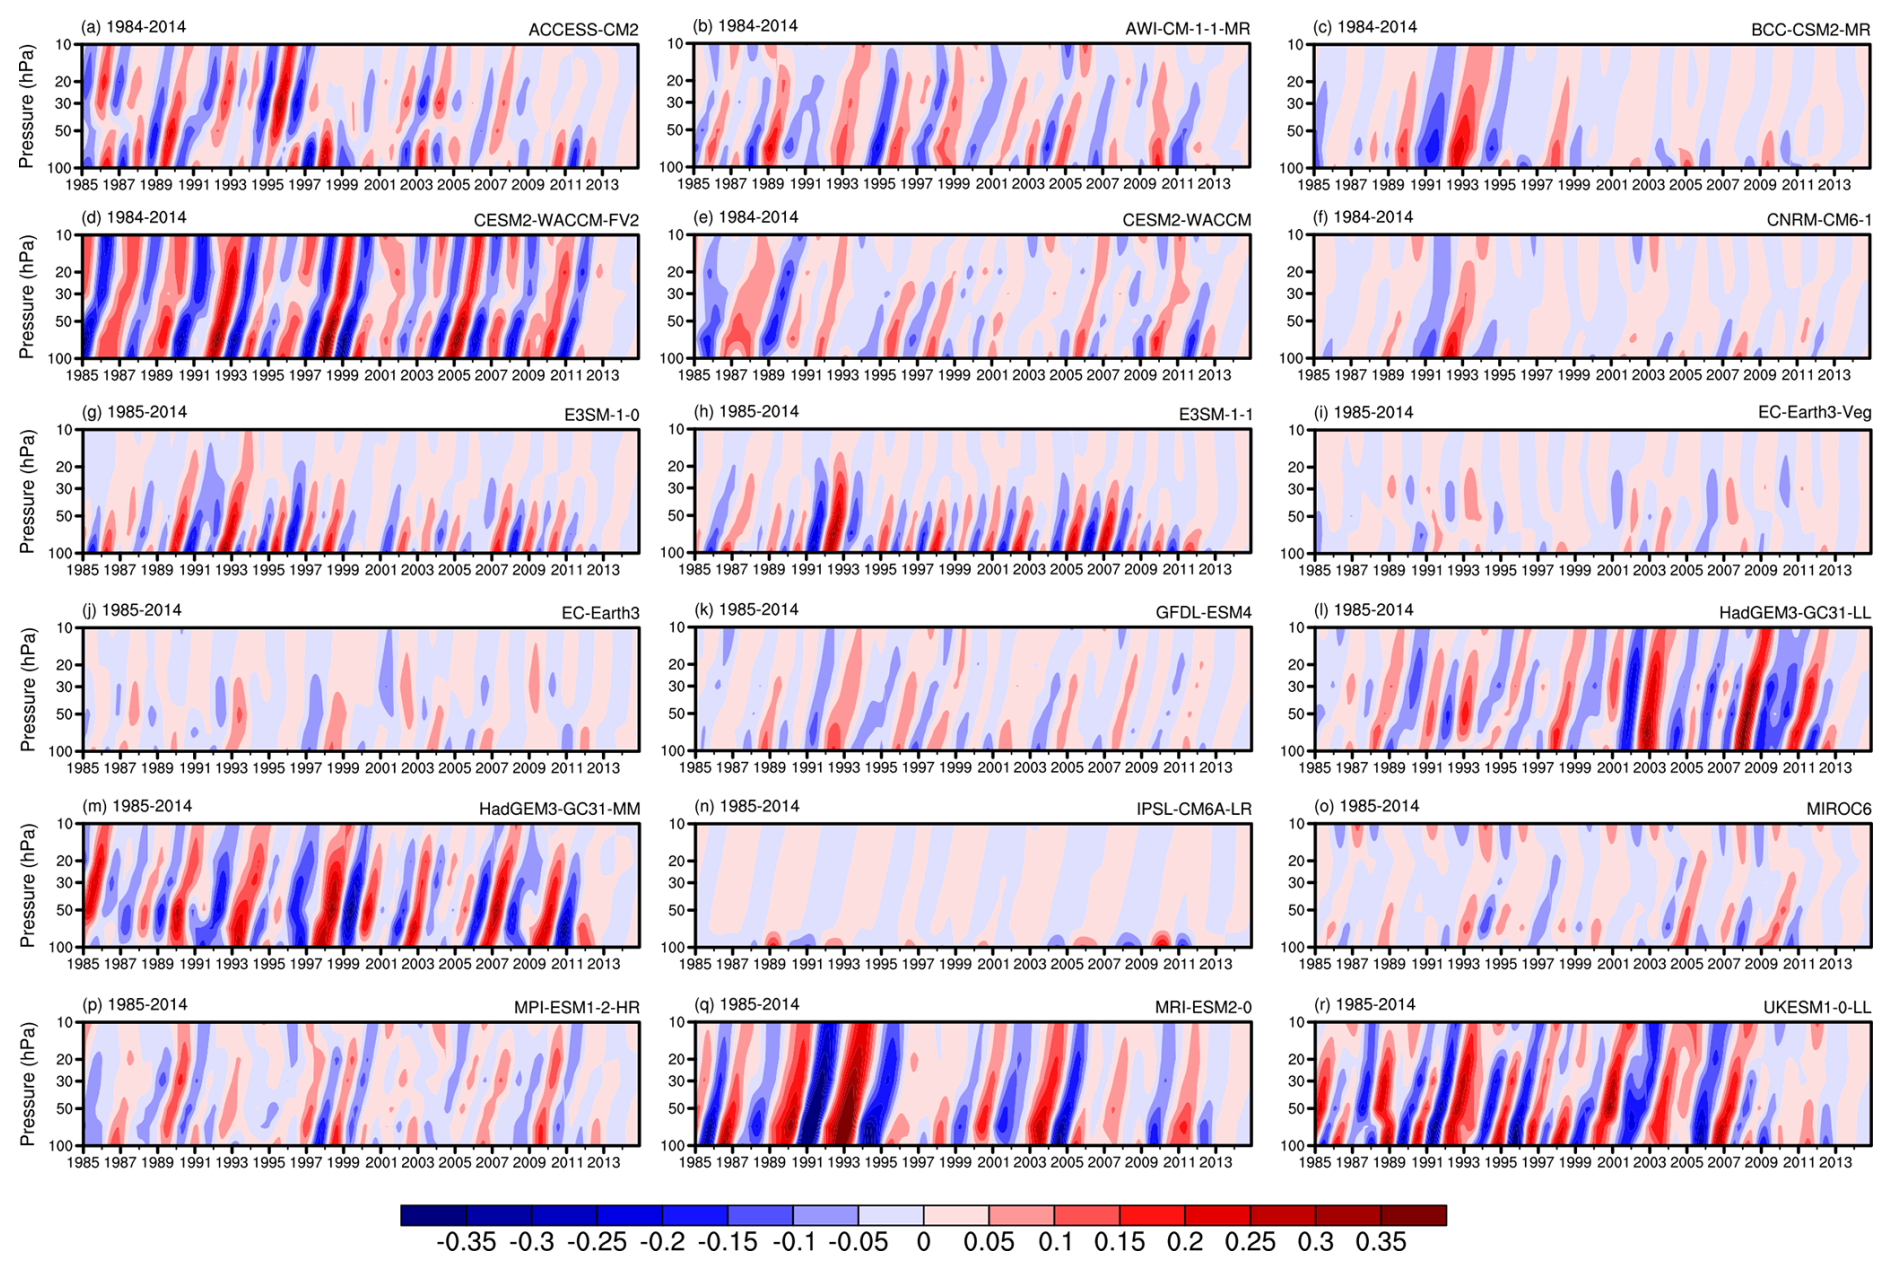
Figure 10Historical simulation of water vapor QBO for (a–r) 18 CMIP6 models. stratospheric water vapor anomalies in the tropics (5° S–5° N) during 1985–2014 have been bandpass filtered to focus on periodicities between 15 and 60 months (mass mixing ratio, units: ppm).
The spatial pattern of the water vapor QBO in northern summer is shown for 18 CMIP6 models (Fig. S8), respectively. In general, models that simulate a tape recorder effect (Fig. 10) also simulate a more realistic latitude-height response (Fig. S8). The relative abilities of each model are quantified in Table 1, which calculates the spatial correlation coefficients of water vapor at 100-30 hPa and 30° S–30° N between ERA5 reanalysis and CMIP6 models. It is shown that the spatial correlation coefficient between five models and ERA5 exceeds 0.5 (AWI-CM-1-1-MR, CESM2-WACCM-FV2, MIROC6-CM2, MPI-ESM1-2-HR, MRI-ESM2-0), and they can simulate negative water vapor anomalies in the tropical lower stratosphere under the QBO westerly phase and positive anomalies under the QBO easterly phase in summer. Among the five high-skill models, the water vapor anomalies in CESM2-WACCM-FV2 are the largest. The water vapor correlation coefficient between models (CESM2-WACCM-FV2 and MIROC6-CM2) and the ERA5 reanalysis exceeds 0.8 (Table 1), but even for those two models the obvious biases relative to ERA5 are visible.
Table 1Pattern correlation between ERA5 reanalysis and CMIP6 models for WQBO minus EQBO water vapor difference at 100–30 hPa and 30° S–30° N.
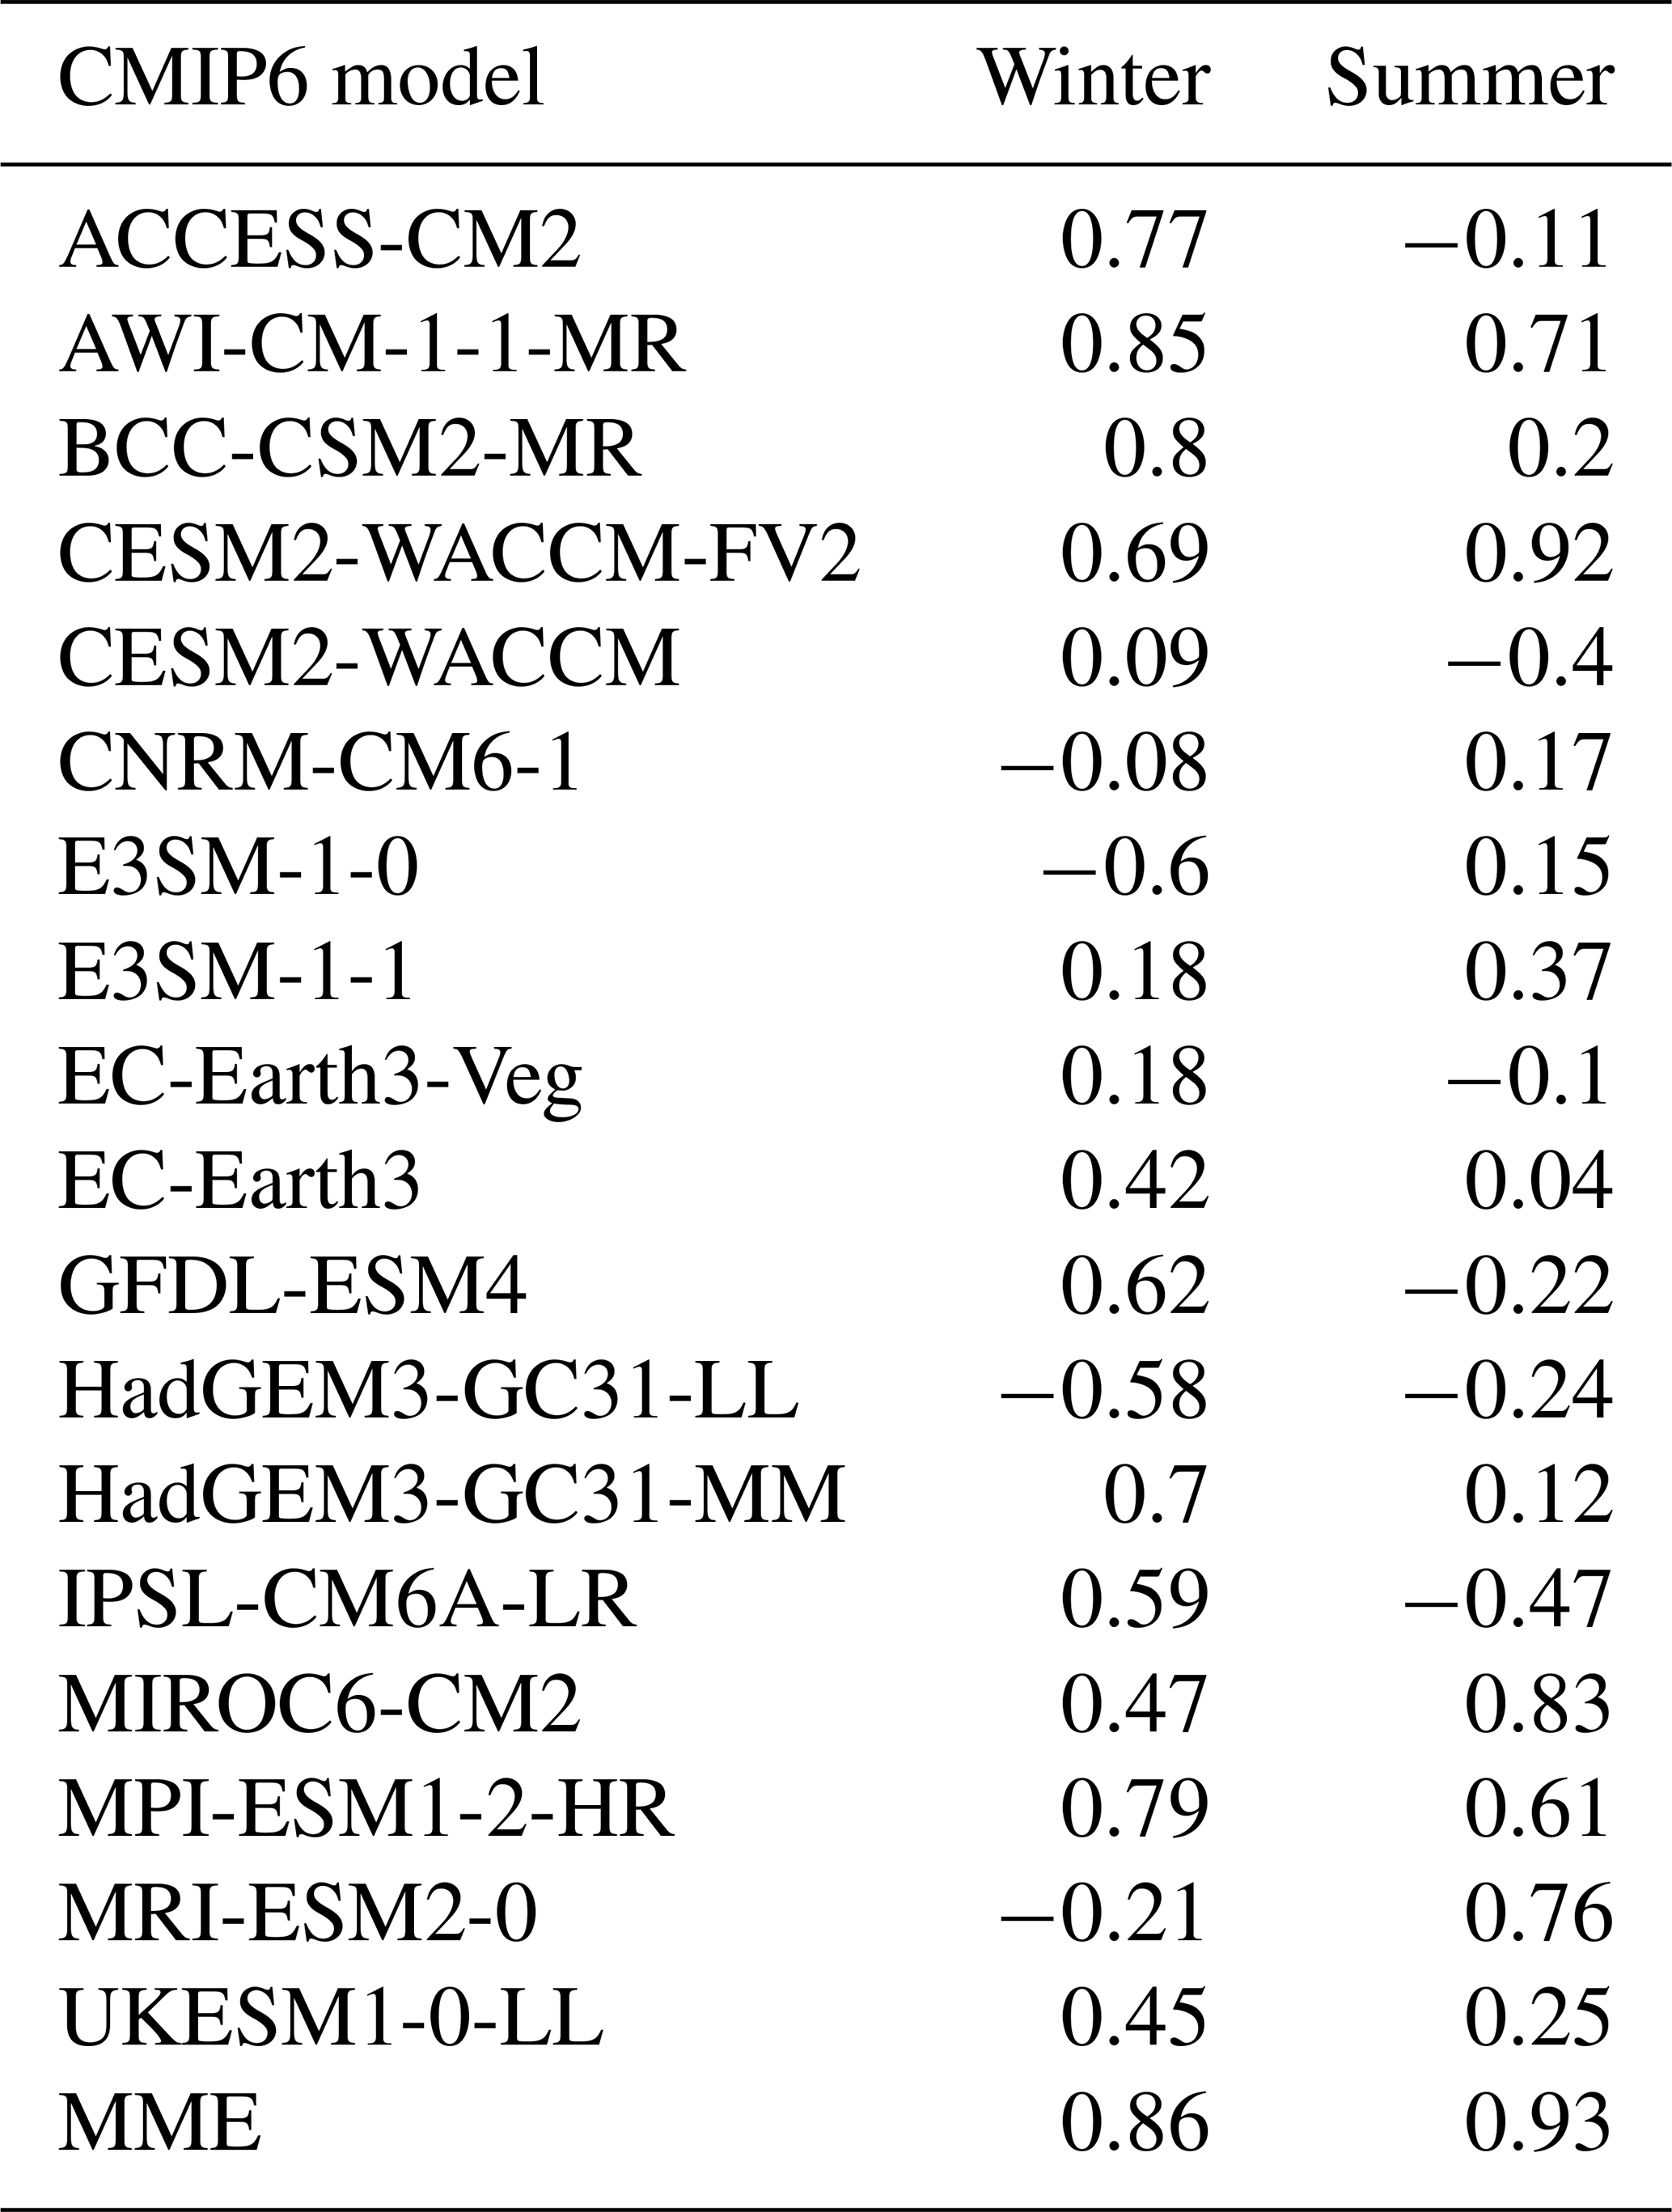
Figure S9 shows the simulation of water vapor anomalies under different QBO phases by 18 CMIP6 high-top models in northern winter. Table 1 also calculates the spatial correlation coefficients of water vapor at 100–30 hPa and 30° S–30° N between ERA5 reanalysis and CMIP6 models. It can be observed that the water vapor QBO in boreal winter is more difficult to reproduce than in summer for most models. In the CMIP6 models, the water vapor anomalies are smaller compared to ERA5. But more models simulate the distribution of water vapor under different QBO phases, eight models (ACCESS-CM2, AWI-CM-1-1-MR, BCC-CSM2-MR, CESM2-WACCM-FV2, GFDL-ESM4, HadGEM3-GC31-MM, IPSL-CM6A-LR, MPI-ESM1-2-HR) can simulate the positive water vapor anomalies in the tropical lower stratosphere under the westerly QBO phase and the negative anomalies under the easterly QBO phase in winter. The spatial correlation coefficient between AWI-CM-1-1-MR and ERA5 reanalysis is the highest in the tropics (0.85).
Most models struggle to simulate the contrast in water vapor between winter and summer. Most models only simulate the winter or summer water vapor QBO, and few models simulate the water vapor QBO pattern in both seasons. Only two models (AWI-CM-1-1-MR, CESM2-WACCM-FV2) can simulate the seasonal contrast in water vapor distribution with the pattern correlation exceeding 0.5, although the general water vapor anomaly patterns show biases from the ERA5 reanalysis (Fig. S2).
Previous work has suggested that models with a stronger QBO in the lower stratosphere are better capable of simulating its effect on entry water vapor (Ziskin Ziv et al., 2022), and we now consider this effect in these 18 models. Figure 11 shows the scatter plots of QBO westerly phase minus easterly phase for the 30 hPa zonal wind index and 70 hPa water vapor anomalies with a lag of 6 months in deep tropics among CMIP6 models. Compared with the CMIP6 models, the 70 hPa water vapor lagging by six months in ERA5 reanalysis is significantly larger. In the northern summer, the CMIP6 high-top models can simulate the positive correlation between the 30 hPa QBO index and water vapor lagging by six months at 70 hPa, with a multi-model correlation reaching 0.68 (p=1). Eight models simulate QBO index differences between easterly and westerly phases exceeding 30 m s−1, which are comparable to the ERA5 QBO indices, but the 70 hPa water vapor in all models are only half that in ERA5 (Fig. 11a). In winter, CMIP6 models also capture the positive correlation between the 30 hPa QBO index and the 70 hPa water vapor lagging by six months, with a multi-model correlation coefficient of 0.54 (p=0.98). Eight models show higher 30 hPa QBO index than that in ERA5, but only six of them exhibited water vapor anomalies around 0.1 ppm, with too-small water vapor amplitudes (Fig. 11b). Simulation performance is better in northern summer than in winter.
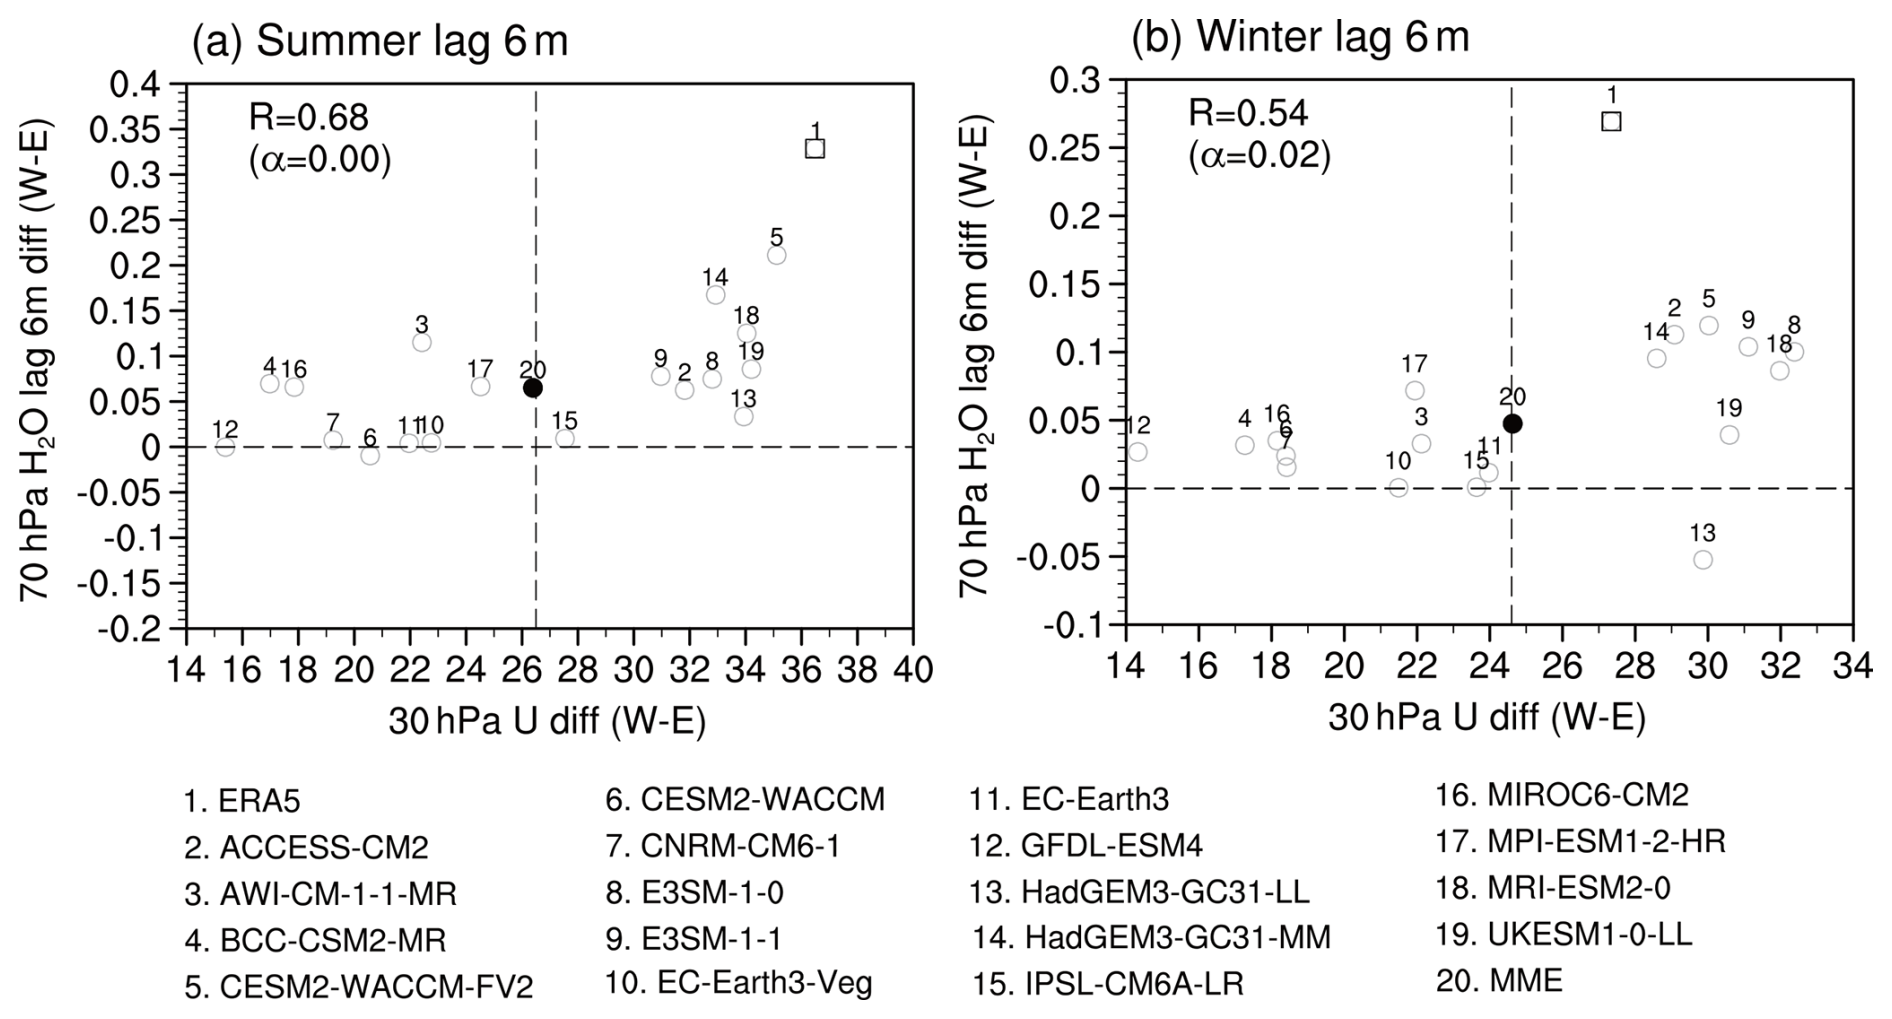
Figure 11Scatter plots of QBO westerly phase minus easterly phase for 30 hPa zonal wind anomalies and 70 hPa water vapor anomalies with a lag of 6 months averaged between 5° S–5° N among 18 CMIP6 models and ERA5 for (a) the northern summer and (b) the northern winter.
The pattern correlation in Table 1 is used as a criterion to select high-skill models. Specifically, the composites of 5 CMIP6 models (AWI-CM-1-1-MR, CESM2-WACCM-FV2, MIROC6-CM2, MPI-ESM1-2-HR, MRI-ESM2-0) for summer QBO signals and 8 CMIP6 models (ACCESS-CM2, AWI-CM-1-1-MR, BCC-CSM2-MR, CESM2-WACCM-FV2, GFDL-ESM4, HadGEM3-GC31-MM, IPSL-CM6A-LR, MPI-ESM1-2-HR) for winter QBO signals are shown in Fig. S10. The spatial correlation coefficient between CMIP6 and ERA5 reanalysis reaches 0.93 for summer QBO signals. The water vapor anomalies under 30 hPa are basically consistent with the ERA5 reanalysis (Fig. S9a, b vs. Fig. S2a, b). The spatial correlation coefficient of water vapor between CMIP6 and ERA5 reanalysis is 0.86 for winter QBO signals. While these models capture the spatial pattern of the water vapor anomalies, they struggle with the magnitude: the composite water vapor anomaly magnitude from CMIP6 models is only a quarter of that in the ERA5 reanalysis.
Based on ERA5 reanalysis and SWOOSH observations, this study investigates the representation of the QBO in the water vapor distribution in the stratosphere. The distribution of the stratospheric water vapor under different QBO phases in northern winter and summer is compared. The possible causes for the water vapor variability associated with the QBO are discussed, including the stratospheric circulation, temperature, and residual circulation variations. Simulations of the stratospheric water vapor QBO are also evaluated for 18 CMIP6 high-top models using the historical run data.
-
Previous studies have used SWOOSH and some climate models to analyze the tropical stratospheric water vapor entry associated with QBO (e.g., Ziskin Ziv et al., 2022). Here we focus on the QBO signals using a 15–60-month bandpass filtering of stratospheric water vapor in the deep tropics (averaged over 5° N–5° S latitude band), the tropical stratospheric water vapor presents obvious QBO variability, and the maximum water vapor QBO signals propagate regularly from the lowermost to middle and lower stratosphere around 10–100 hPa. Compared with SWOOSH, the water vapor QBO amplitude in ERA5 decays rapidly with height until 30 hPa. The QBO (represented by the 30 hPa QBO index) exerts the greatest influence on 100 hPa water vapor at a lag of six months, and previous studies have also discussed the lag effect of the QBO on water vapor in the lower stratosphere (Diallo et al., 2022; Ziskin Ziv et al., 2022). Anomalous moistening typically occurs during the QBO westerly phase, while anomalous drying occurs during the QBO easterly phase. During northern summer, the peak amplitude of 100 hPa water vapor under different QBO phases in tropical regions reaches ±0.12 ppm at a six-month lag, while in winter it reaches ±0.2 ppm. The difference of water vapor distribution in the lower stratosphere between westerly and easterly QBO phases in summer is smaller than in winter. Although this conclusion has been shown previously (Tian et al., 2019; Wang et al., 2020), previous studies considered a much shorter time period for their analyses than that used in this study.
-
The tropopause cold point temperature in the tropics affects the tropospheric water vapor entering the stratosphere (Garfinkel et al., 2013; Randel and Park, 2019). Consistent with previous work (Tegtmeier et al., 2020), the 100 hPa temperature in the tropics shows warm anomalies under the QBO westerly phase and cold anomalies under the easterly QBO phase. However, the intensity and coverage of tropical temperature anomalies in winter are significantly greater and broader than that in summer (Martin et al., 2021), which is consistent with the BD circulation anomalies being significantly stronger in winter than in summer (Abalos et al., 2021; Butchart, 2014). As the QBO signal propagates downward from the upper stratosphere, the QBO (represented by the 30 hPa QBO index) has a significant impact on the 100 hPa temperature after six months, but the lagged temperature amplitude in northern summer is still smaller than that in winter.
-
The difference in the secondary circulation associated with QBO between winter and summer is compared. The secondary circulation related to QBO is opposite in the easterly and westerly phases (Baldwin et al., 2001). The intensity of the QBO-related residual secondary circulation is stronger in the boreal winter than in summer (Abalos et al., 2021; Butchart, 2014), which not only influences the cold point tropopause temperature in tropical regions but also drives the transport of stratospheric water vapor. Diagnosis of the transformed Eulerian-Mean (TEM) tracer continuity equation reveals that the mean advection term by the residual circulation associated with the QBO is the leading factor controlling the water vapor distribution in the tropical lower stratosphere.
-
Among the 18 CMIP6 high-top models that can produce the QBO, 11 models can simulate upward propagation of the water vapor QBO from the lowermost to middle stratosphere around 10–100 hPa, though for all models the signal is too weak. The CMIP6 models can simulate the lagged effect of the QBO (represented by the 30 hPa QBO index) on water vapor in the lower stratosphere. The QBO index amplitude in some models is close to that of ERA5, but the amplitude of water vapor is very small. A model-by-model examination also reveals that the seasonal difference in the water vapor QBO can be reproduced by only a few models, which challenges the model developers to well tune the simulation of the QBO itself and its climate effect.
The change of stratospheric water vapor can be traced back to the change of the cold point temperature at the bottom of the tropical stratosphere (Hardiman et al., 2015; Xia et al., 2019). The cold point temperature variability is a comprehensive effect from the stratospheric (from top to bottom) and tropospheric (from bottom to top) dynamics. In this study, the influence of stratospheric QBO on water vapor is considered, and the bottom-up influence from ENSO and sea surface temperature in the Indo-Pacific oceans is not considered. However, this study reveals the difference in stratospheric water vapor content regulated by QBO between northern winter and summer, and finds that QBO-related cold point temperature anomalies in the tropics affect water vapor distribution in the lower tropical stratosphere with a 6-month lag. QBO-related secondary circulation affects water vapor transport in the middle and lower tropical stratosphere, which provides a new perspective to better understand the stratospheric water vapor QBO signals. As the dominant mode of the tropical stratosphere, a detailed analysis of the QBO modulation on water vapor signals is also a prerequisite to improve the performance of climate models for a better simulation of stratospheric variability and its role in subseasonal to seasonal forecasts.
The data in this study were analyzed and plotted with the NCAR Command Language (NCL) Version 6.6.2 (available at https://www.ncl.ucar.edu/, last access: 23 March 2026, UCAR/NCAR/CISL/TDD, 2019). All relevant codes used in this study are available in the Zenodo repository (https://doi.org/10.5281/zenodo.18072745, Lu, 2025). ECMWF provides the ERA5 reanalysis data (https://cds.climate.copernicus.eu, Hersbach et al., 2020). The SWOOSH dataset version 2.7 is obtained from https://csl.noaa.gov/groups/csl8/swoosh/ (Davis et al., 2016). The CMIP6 data are provided by the WCRP (https://aims2.llnl.gov/search/cmip6, Eyring et al., 2016).
The supplement related to this article is available online at https://doi.org/10.5194/acp-26-5763-2026-supplement.
QL and JR designed the study. QL analyzed the data and wrote the manuscript. CS and CIG contributed to the discussion and revision of the paper.
The contact author has declared that none of the authors has any competing interests.
Publisher's note: Copernicus Publications remains neutral with regard to jurisdictional claims made in the text, published maps, institutional affiliations, or any other geographical representation in this paper. The authors bear the ultimate responsibility for providing appropriate place names. Views expressed in the text are those of the authors and do not necessarily reflect the views of the publisher.
We thank the National Natural Science Foundation of China, Israel Science Foundation, and the Doctoral Research Startup Fund Project of Tangshan University for their financial support. NCAR, ECMWF, NOAA, and WCRP are acknowledged for providing the datasets.
This research has been supported by the National Natural Science Foundation of China (grant nos. 42322503, 42361144843, and 42175069), the Israel Science Foundation (grant no. 3065/23), and the Doctoral Research Startup Fund Project of Tangshan University (BC2025057ZA).
This paper was edited by Gabriele Stiller and reviewed by Simon Chabrillat and three anonymous referees.
Abalos, M., Calvo, N., Benito-Barca, S., Garny, H., Hardiman, S. C., Lin, P., Andrews, M. B., Butchart, N., Garcia, R., Orbe, C., Saint-Martin, D., Watanabe, S., and Yoshida, K.: The Brewer–Dobson circulation in CMIP6, Atmos. Chem. Phys., 21, 13571–13591, https://doi.org/10.5194/acp-21-13571-2021, 2021.
Allen, R. J. and Sherwood, S. C.: Warming maximum in the tropical upper troposphere deduced from thermal winds, Nat. Geosci., 1, 399–403, https://doi.org/10.1038/ngeo208, 2008.
Anstey, J. A., Osprey, S. M., Alexander, J., Baldwin, M. P., Butchart, N., Gray, L., Kawatani, Y., Newman, P. A., and Richter, J. H.: Impacts, processes and projections of the quasi-biennial oscillation, Nat. Rev. Earth Environ., 3, 588–603, https://doi.org/10.1038/s43017-022-00323-7, 2022.
Baldwin, M. P., Gray, L. J., Dunkerton, T. J., Hamilton, K., Haynes, P. H., Holton, J. R., Alexander, M. J., Hirota, I., Horinouchi, T., Jones, D. B. A., Marquardt, C., Sato, K., and Takahashi, M.: The quasi-biennial oscillation, Rev. Geophys., 39, 179–229, 2001.
Banerjee, A., Chiodo, G., Previdi, M., Ponater, M., Conley, A. J., and Polvani, L. M.: Stratospheric water vapor: an important climate feedback, Clim. Dyn., 53, 1697–1710, https://doi.org/10.1007/s00382-019-04721-4, 2019.
Bi, Y., Chen, Y., Zhou, R., Yi, M., and Deng, S.: Simulation of the effect of water-vapor increase on temperature in the stratosphere, Adv. Atmos. Sci., 28, 832–842, https://doi.org/10.1007/s00376-010-0047-7, 2011.
Bramberger, M., Alexander, M. J., Davis, S., Podglajen, A., Hertzog, A., Kalnajs, L., Deshler, T., Goetz, J. D., and Khaykin, S.: First super-pressure Balloon-Borne fine-vertical-scale profiles in the upper TTL: impacts of atmospheric waves on cirrus clouds and the QBO, Geophys. Res. Lett., 49, e2021GL097596, https://doi.org/10.1029/2021GL097596, 2022.
Brewer, A. W.: Evidence for a world circulation provided by the measurements of helium and water vapor distribution in the stratosphere, Q. J. R. Meteorol. Soc., 75, 351–363, https://doi.org/10.1002/qj.49707532603, 1949.
Butchart, N.: The Brewer-Dobson circulation, Rev. Geophys., 52, 157–184, https://doi.org/10.1002/2013RG000448, 2014.
Butchart, N., Anstey, J. A., Hamilton, K., Osprey, S., McLandress, C., Bushell, A. C., Kawatani, Y., Kim, Y.-H., Lott, F., Scinocca, J., Stockdale, T. N., Andrews, M., Bellprat, O., Braesicke, P., Cagnazzo, C., Chen, C.-C., Chun, H.-Y., Dobrynin, M., Garcia, R. R., Garcia-Serrano, J., Gray, L. J., Holt, L., Kerzenmacher, T., Naoe, H., Pohlmann, H., Richter, J. H., Scaife, A. A., Schenzinger, V., Serva, F., Versick, S., Watanabe, S., Yoshida, K., and Yukimoto, S.: Overview of experiment design and comparison of models participating in phase 1 of the SPARC Quasi-Biennial Oscillation initiative (QBOi), Geosci. Model Dev., 11, 1009–1032, https://doi.org/10.5194/gmd-11-1009-2018, 2018.
Cai, Q., Chen, W., Chen, S., Ma, T., and Garfinkel, C. I.: Influence of the quasi-biennial oscillation on the spatial structure of the wintertime Arctic oscillation, J. Geophys. Res. Atmos., 127, https://doi.org/10.1029/2021JD035564, 2022.
Canziani, P. O. and Holton, J. R.: Kelvin Waves and the quasi-biennial oscillation: An observational analysis, J. Geophys. Res. Atmos., 103, 31509–31521, https://doi.org/10.1029/1998JD200021, 1998.
Charlesworth, E., Plöger, F., Birner, T., Baikhadzhaev, R., Abalos, M., Abraham, N. L., Akiyoshi, H., Bekki, S., Dennison, F., Jöckel, P., Keeble, J., Kinnison, D., Morgenstern, O., Plummer, D., Rozanov, E., Strode, S., Zeng, G., Egorova, T., and Riese, M.: Stratospheric water vapor affecting atmospheric circulation, Nat. Commun., 14, 3925, https://doi.org/10.1038/s41467-023-39559-2, 2023.
Chen, Y., Shi, C., and Zheng, B.: HCl quasi-biennial oscillation in the stratosphere and a comparison with ozone QBO, Adv. Atmos. Sci., 22, 751–758, https://doi.org/10.1007/BF02918718, 2005.
Coy, L., Newman, P. A., Pawson, S., and Lait, L. R.: Dynamics of the disrupted 2015/16 quasi-biennial oscillation, J. Clim., 30, 5661–5674, https://doi.org/10.1175/JCLI-D-16-0663.1, 2017.
Davis, S. M., Rosenlof, K. H., Hassler, B., Hurst, D. F., Read, W. G., Vömel, H., Selkirk, H., Fujiwara, M., and Damadeo, R.: The Stratospheric Water and Ozone Satellite Homogenized (SWOOSH) database: a long-term database for climate studies, Earth Syst. Sci. Data, 8, 461–490, https://doi.org/10.5194/essd-8-461-2016, 2016.
Dessler, A. E., Schoeberl, M. R., Wang, T., Davis, S. M., and Rosenlof, K. H.: Stratospheric water vapor feedback, P. Natl. Acad. Sci. USA, 110, 18087–18091, https://doi.org/10.1073/pnas.1310344110, 2013.
Diallo, M. A., Ploeger, F., Hegglin, M. I., Ern, M., Grooß, J.-U., Khaykin, S., and Riese, M.: Stratospheric water vapour and ozone response to the quasi-biennial oscillation disruptions in 2016 and 2020, Atmos. Chem. Phys., 22, 14303–14321, https://doi.org/10.5194/acp-22-14303-2022, 2022.
Dong, W. H., Lin, Y. L., Zhang, M. H., and Huang, X. M.: Footprint of tropical mesoscale convective system variability on stratospheric water vapor, Geophys. Res. Lett., 47, e2019GL086320, https://doi.org/10.1029/2019GL086320, 2020.
Evan, S., Rosenlof, K. H., Thornberry, T., and Khaykin, S.: TTL cooling and drying during the January 2013 stratospheric sudden warming, Q. J. R. Meteorol. Soc., 3030–3039, https://doi.org/10.1002/qj.2587, 2015.
Eyring, V., Bony, S., Meehl, G. A., Senior, C. A., Stevens, B., Stouffer, R. J., and Taylor, K. E.: Overview of the Coupled Model Intercomparison Project Phase 6 (CMIP6) experimental design and organization, Geosci. Model Dev., 9, 1937–1958, https://doi.org/10.5194/gmd-9-1937-2016, 2016.
de Forster, P. M. and Shine, K. P.: Stratospheric water vapor changes as a possible contributor to observed stratospheric cooling, Geophys. Res. Lett., 26, 3309–3312, https://doi.org/10.1029/1999GL010487, 1999.
Garcia, R. R. and Solomon, S.: A numerical model of the zonally averaged dynamical and chemical structure of the middle atmosphere, J. Geophys. Res. Ocean., 88, 1379–1400, https://doi.org/10.1029/JC088iC02p01379, 1983.
Garfinkel, C. I., Waugh, D. W., Oman, L. D., Wang, L., and Hurwitz, M. M.: Temperature trends in the tropical upper troposphere and lower stratosphere: Connections with sea surface temperatures and implications for water vapor and ozone, J. Geophys. Res. Atmos., 118, 9658–9672, https://doi.org/10.1002/jgrd.50772, 2013.
Garfinkel, C. I., Harari, O., Ziskin Ziv, S., Rao, J., Morgenstern, O., Zeng, G., Tilmes, S., Kinnison, D., O'Connor, F. M., Butchart, N., Deushi, M., Jöckel, P., Pozzer, A., and Davis, S.: Influence of the El Niño–Southern Oscillation on entry stratospheric water vapor in coupled chemistry–ocean CCMI and CMIP6 models, Atmos. Chem. Phys., 21, 3725–3740, https://doi.org/10.5194/acp-21-3725-2021, 2021.
Garfinkel, C. I., Gerber, E. P., Shamir, O., Rao, J., Jucker, M., White, I., and Paldor, N.: A QBO cookbook: Sensitivity of the Quasi-Biennial Oscillation to resolution, resolved waves, and parameterized gravity waves, J. Adv. Model. Earth Syst., 14, 1–17, https://doi.org/10.1029/2021MS002568, 2022.
Geller, M. A., Zhou, T., Shindell, D., Ruedy, R., Aleinov, I., Nazarenko, L., Tausnev, N. L., Kelley, M., Sun, S., Cheng, Y., Field, R. D., and Faluvegi, G.: Modeling the QBO – Improvements resulting from higher-model vertical resolution, J. Adv. Model. Earth Syst., 8, 1092–1105, https://doi.org/10.1002/2016MS000699, 2016.
Gettelman, A. and Birner, T.: Insights into tropical tropopause layer processes using global models, J. Geophys. Res. Atmos., 112, 1–15, https://doi.org/10.1029/2007JD008945, 2007.
Hardiman, S. C., Butchart, N., and Calvo, N.: The morphology of the Brewer-Dobson circulation and its response to climate change in CMIP5 simulations, Q. J. R. Meteorol. Soc., 140, 1958–1965, https://doi.org/10.1002/qj.2258, 2014.
Hardiman, S. C., Boutle, I. A., Bushell, A. C., Butchart, N., Cullen, M. J. P., Field, P. R., Furtado, K., Manners, J. C., Milton, S. F., Morcrette, C., O'Connor, F. M., Shipway, B. J., Smith, C., Walters, D. N., Willett, M. R., Williams, K. D., Wood, N., Abraham, N. L., Keeble, J., Maycock, A. C., Thuburn, J., and Woodhouse, M. T.: Processes controlling tropical tropopause temperature and stratospheric water vapor in climate models, J. Clim., 28, 6516–6535, https://doi.org/10.1175/JCLI-D-15-0075.1, 2015.
Held, I. M. and Soden, B. J.: Water vapor feedback and global warming, Annu. Rev. Energy Environ., 25, 441–475, https://doi.org/10.1146/annurev.energy.25.1.441, 2000.
Hersbach, H., Bell, B., Berrisford, P., Hirahara, S., Horányi, A., Muñoz-Sabater, J., Nicolas, J., Peubey, C., Radu, R., Schepers, D., Simmons, A., Soci, C., Abdalla, S., Abellan, X., Balsamo, G., Bechtold, P., Biavati, G., Bidlot, J., Bonavita, M., De Chiara, G., Dahlgren, P., Dee, D., Diamantakis, M., Dragani, R., Flemming, J., Forbes, R., Fuentes, M., Geer, A., Haimberger, L., Healy, S., Hogan, R. J., Hólm, E., Janisková, M., Keeley, S., Laloyaux, P., Lopez, P., Lupu, C., Radnoti, G., de Rosnay, P., Rozum, I., Vamborg, F., Villaume, S., and Thépaut, J. N.: The ERA5 global reanalysis, Q. J. R. Meteorol. Soc., 146, 1999–2049, https://doi.org/10.1002/qj.3803, 2020.
Holt, L. A., Alexander, M. J., Coy, L., Molod, A., Putman, W., and Pawson, S.: Tropical waves and the quasi-biennial oscillation in a 7-km global climate simulation, J. Atmos. Sci., 73, 3771–3783, https://doi.org/10.1175/JAS-D-15-0350.1, 2016.
Holton, J. R. and Gettelman, A.: Horizontal transport and the dehydration of the stratosphere, Geophys. Res. Lett., 28, 2799–2802, https://doi.org/10.1029/2001GL013148, 2001.
Holton, J. R., Haynes, P. H., Mcintyre, M. E., Douglass, A. R., and Rood, B.: Stratonsphere-Troposphere exchange, Rev. Geophys., 33, 403–439, https://doi.org/10.1029/95RG02097, 1995.
Kang, M.-J., Chun, H.-Y., and Garcia, R. R.: Role of equatorial waves and convective gravity waves in the 2015/16 quasi-biennial oscillation disruption, Atmos. Chem. Phys., 20, 14669–14693, https://doi.org/10.5194/acp-20-14669-2020, 2020.
Keeble, J., Hassler, B., Banerjee, A., Checa-Garcia, R., Chiodo, G., Davis, S., Eyring, V., Griffiths, P. T., Morgenstern, O., Nowack, P., Zeng, G., Zhang, J., Bodeker, G., Burrows, S., Cameron-Smith, P., Cugnet, D., Danek, C., Deushi, M., Horowitz, L. W., Kubin, A., Li, L., Lohmann, G., Michou, M., Mills, M. J., Nabat, P., Olivié, D., Park, S., Seland, Ø., Stoll, J., Wieners, K.-H., and Wu, T.: Evaluating stratospheric ozone and water vapour changes in CMIP6 models from 1850 to 2100, Atmos. Chem. Phys., 21, 5015–5061, https://doi.org/10.5194/acp-21-5015-2021, 2021.
Kim, J., Randel, W. J., and Birner, T.: Convectively driven tropopause-level cooling and its influences on stratospheric moisture, J. Geophys. Res. Atmos., 123, 590–606, https://doi.org/10.1002/2017JD027080, 2018.
Krishnamurti, T. N., Subramaniam, M., Oosterhof, D. K., and Daughenbaugh, G.: Predictability of low frequency modes, Meteorol. Atmos. Phys., 44, 63–83, https://doi.org/10.1007/BF01026811, 1990.
Krüger, K., Schäfler, A., Wirth, M., Weissmann, M., and Craig, G. C.: Vertical structure of the lower-stratospheric moist bias in the ERA5 reanalysis and its connection to mixing processes, Atmos. Chem. Phys., 22, 15559–15577, https://doi.org/10.5194/acp-22-15559-2022, 2022.
Lindzen, R. S. and Holton, J. R.: A Theory of the Quasi-Biennial Oscillation, J. Atmos. Sci., 25, 1095–1107, https://doi.org/10.1175/1520-0469(1968)025<1095:ATOTQB>2.0.CO;2, 1968.
Lott, F., Denvil, S., Butchart, N., Cagnazzo, C., Giorgetta, M. A., Hardiman, S. C., Manzini, E., Krismer, T., Duvel J.-P., Maury, P., Scinocca, J. F., Watanabe, S., and Yukimoto, S.: Kelvin and Rossby-gravity wave packets in the lower stratosphere of some high-top CMIP5 models, J. Geophys. Res. Atmos., 119, 2156–2173, https://doi.org/10.1002/2013JD020797, 2014.
Lu, J., Xie, F., Sun, C., Luo, J., Cai, Q., Zhang, J., Li, J., and Tian, H.: Analysis of factors influencing tropical lower stratospheric water vapor during 1980–2017, npj Clim. Atmos. Sci., 3, 35, https://doi.org/10.1038/s41612-020-00138-7, 2020.
Lu, Q.: Codes for Seasonality of the Quasi-biennial Oscillation signal in water vapor in the tropical stratosphere, Zenodo [code], https://doi.org/10.5281/zenodo.18072746, 2025.
Martin, Z., Sobel, A., Butler, A., and Wang, S.: Variability in QBO temperature anomalies on annual and decadal time scales, J. Climate, 34, 589–605, https://doi.org/10.1175/JCLI-D-20-0287.1, 2021.
Monier, E. and Weare, B. C.: Climatology and trends in the forcing of the stratospheric ozone transport, Atmos. Chem. Phys., 11, 6311–6323, https://doi.org/10.5194/acp-11-6311-2011, 2011.
Mote, P. W., Rosenlof, K. H., Mclntyre, M. E., Carr, E. S., Gille, J. C., Holton, J. R., Kinnersley, S., Pumphrey, H. C., Iii, J. M. R., and Vaters, J. W.: An atmospheric tape recorder: The imprint of tropical tropopause temperatures on stratospheric water vapor, J. Geophys. Res., 101, 3989–4006, https://doi.org/10.1029/95JD03422, 1996.
Mote, P. W., Clark, H. L., Dunkerton, T. J., Harwood, R. S., and Pumphrey, H. C.: Intraseasonal variations of water vapor in the tropical upper troposphere and tropopause region, J. Geophys. Res. Atmos., 105, 17457–17470, https://doi.org/10.1029/2000JD900158, 2000.
Muhsin, M., Sunilkumar, S. V, Venkat Ratnam, M., Parameswaran, K., Krishna Murthy, B. V., and Emmanuel, M.: Effect of convection on the thermal structure of the troposphere and lower stratosphere including the tropical tropopause layer in the South Asian monsoon region, J. Atmos. Sol.-Terr. Phy., 169, 52–65, https://doi.org/10.1016/j.jastp.2018.01.016, 2018.
Murakami, M.: Large-scale aspects of deep convective activity over the GATE, Mon. Weather Rev., 107, 994–1013, https://doi.org/10.1175/1520-0493(1979)107<0994:LSAODC>2.0.CO;2, 1979.
Pahlavan, H. A., Wallace, J. M., and Fu, Q.: Characteristics of tropical convective gravity waves resolved by ERA5 reanalysis, J. Atmos. Sci., 80, 777–795, https://doi.org/10.1175/JAS-D-22-0057.1, 2023.
Peña-Ortiz, C., Plaza, N. P., Gallego, D., and Ploeger, F.: Quasi-biennial oscillation modulation of stratospheric water vapour in the Asian monsoon, Atmos. Chem. Phys., 24, 5457–5478, https://doi.org/10.5194/acp-24-5457-2024, 2024.
Randel, W. and Park, M.: Diagnosing observed stratospheric water vapor relationships to the cold point tropical tropopause, J. Geophys. Res. Atmos., 124, 7018–7033, https://doi.org/10.1029/2019JD030648, 2019.
Randel, W. J. and Wu, F.: Kelvin wave variability near the equatorial tropopause observed in GPS radio occultation measurements, J. Geophys. Res., 110, 1–13, https://doi.org/10.1029/2004JD005006, 2005.
Randel, W. J., Zhang, K., and Fu, R.: What controls stratospheric water vapor in the NH summer monsoon regions?, J. Geophys. Res. Atmos., 120, 7988–8001, https://doi.org/10.1002/2015JD023622, 2015.
Rao, J., Yu, Y., Guo, D., Shi, C., Chen, D., and Hu, D.: Evaluating the Brewer–Dobson circulation and its responses to ENSO, QBO, and the solar cycle in different reanalyses, Earth Planet. Phys., 3, 166–181, https://agupubs.onlinelibrary.wiley.com/doi/10.26464/epp2019012, 2019.
Rao, J., Garfinkel, C. I., and White, I. P.: How does the quasi-biennial oscillation affect the boreal winter tropospheric circulation in cmip5/6 models?, J. Clim., 33, 8975–8996, https://doi.org/10.1175/JCLI-D-20-0024.1, 2020a.
Rao, J., Garfinkel, C. I., and White, I. P.: Impact of the quasi-biennial oscillation on the northern winter stratospheric polar vortex in CMIP5/6 models, J. Clim., 33, 4787–4813, https://doi.org/10.1175/JCLI-D-19-0663.1, 2020b.
Rao, J., Garfinkel, C. I., Ren, R., Wu, T., Lu, Y., and Chu, M.: Projected strengthening impact of the quasi-biennial oscillation on the Southern Hemisphere by CMIP5/6 Models, J. Clim., 36, 5461–5476, https://doi.org/10.1175/JCLI-D-22-0801.1, 2023a.
Rao, J., Garfinkel, C. I., Ren, R., Wu, T., and Lu, Y.: Southern Hemisphere response to the quasi-biennial oscillation in the CMIP5/6 models, J. Clim., 36, 2603–2623, https://doi.org/10.1175/JCLI-D-22-0675.1, 2023b.
Ricciardulli, L. and Garcia, R. R.: The Excitation of Equatorial Waves by Deep Convection in the NCAR Community Climate Model (CCM3), J. Atmos. Sci., 57, 3461–3487, https://doi.org/10.1175/1520-0469(2000)057<3461:TEOEWB>2.0.CO;2, 2000.
Richter, J. H., Solomon, A., and Bacmeister, J. T.: Effects of vertical resolution and nonpornographic gravity wave drag on the simulated climate in the Community Atmosphere Model, version 5, J. Adv. Model. Earth Syst., 6, 92–95, https://doi.org/10.1002/2013MS000303, 2014a.
Richter, J. H., Solomon, A., and Bacmeister, J. T.: On the simulation of the quasi-biennial oscillation in the Community Atmosphere Model, version 5, J. Geophys. Res. Atmos., 119, 3045–3062, https://doi.org/10.1002/2013JD021122, 2014b.
Richter, J. H., Anstey, J. A., Butchart, N., Kawatani, Y., Meehl, G. A., Osprey, S., Simpson, I. R.: Progress in simulating the quasi-biennial oscillation in CMIP models, J. Geophys. Res. Atmos., 125, e2019JD032362, https://doi.org/10.1029/2019JD032362, 2020.
Serva, F., Anstey, J. A., Bushell, A. C., Butchart, N., Cagnazzo, C., Gray, L. J., Kawatani, Y., Osprey, S. M., Richter, J. H., and Simpson, I. R.: The impact of the QBO on the region of the tropical tropopause in QBOi models: Present-day simulations, Q. J. R. Meteorol. Soc., 148, 1945–1964, https://doi.org/10.1002/qj.4287, 2022.
Simpkins, G.: Progress in climate modeling, Nat. Clim. Chang., 7, 684–685, https://doi.org/10.1038/nclimate3398, 2017.
Solomon, S., Rosenlof, K. H., Portmann, R. W., Daniel, J. S., Davis, S. M., Sanford, T. J., and Plattner, G. K.: Contributions of stratospheric water vapor to decadal changes in the rate of global warming, Science 80, 327, 1219–1223, https://doi.org/10.1126/science.1182488, 2010.
Tao, M., Konopka, P., Ploeger, F., Riese, M., Müller, R., and Volk, C. M.: Impact of stratospheric major warmings and the quasi-biennial oscillation on the variability of stratospheric water vapor, Geophys. Res. Lett., 42, 4599–4607, https://doi.org/10.1002/2015GL064443, 2015.
Tegtmeier, S., Anstey, J., Davis, S., Ivanciu, I., Jia, Y., McPhee, D., and Pilch Kedzierski, R.: Zonal asymmetry of the qbo temperature signal in the tropical tropopause region, Geophys. Res. Lett., 47, 1–10, https://doi.org/10.1029/2020GL089533, 2020.
Tian, E. W., Su, H., Tian, B., and Jiang, J. H.: Interannual variations of water vapor in the tropical upper troposphere and the lower and middle stratosphere and their connections to ENSO and QBO, Atmos. Chem. Phys., 19, 9913–9926, https://doi.org/10.5194/acp-19-9913-2019, 2019.
Tian, W., Chipperfield, M. P., and Lv, D.: Impact of increasing stratospheric water vapor on ozone depletion and temperature change, Adv. Atmos. Sci., 26, 423–437, https://doi.org/10.1007/s00376-009-0423-3, 2009.
Tian, W., Huang, J., and Zhang, J.: Role of stratospheric processes in climate change: Advances and Challenges, Adv. Atmos. Sci., 40, 1379–1400, https://doi.org/10.1007/s00376-023-2341-1, 2023.
Tinney, E. N. and Homeyer, C. R.: Climatology, sources, and transport characteristics of observed water vapor extrema in the lower stratosphere, Atmos. Chem. Phys., 23, 14375–14392, https://doi.org/10.5194/acp-23-14375-2023, 2023.
Tselioudis, G., Tromeur, E., Rossow, W. B., and Zerefos, C. S.: Decadal changes in tropical convection suggest effects on stratospheric water vapor, Geophys. Res. Lett., 37, L14806, https://doi.org/10.1029/2010GL044092, 2010.
UCAR/NCAR/CISL/TDD: The NCAR Command Language (Version 6.6.2), UCAR/NCAR/CISL/TDD [software], https://doi.org/10.5065/D6WD3XH5, Boulder, Colorado, 2019.
Ueyama, R., Schoeberl, M., Jensen, E., Pfister, L., Park, M., and Ryoo, J.: Convective impact on the global lower stratospheric water vapor budget, J. Geophys. Res. Atmos., 128, e2022JD037135, https://doi.org/10.1029/2022JD037135, 2016.
Wang, T., Zhang, Q., Hannachi, A., Hirooka, T., and Hegglin, M. I.: Tropical water vapor in the lower stratosphere and its relationship to tropical/extratropical dynamical processes in ERA5, Q. J. R. Meteorol. Soc., 146, 2432–2449, https://doi.org/10.1002/qj.3801, 2020.
Wang, Y., Rao, J., Lu, Y., Ju, Z., Yang, J., and Luo, J.: A revisit and comparison of the quasi-biennial oscillation (QBO) disruption events in 2015/16 and 2019/20, Atmos. Res., 294, 106970, https://doi.org/10.1016/j.atmosres.2023.106970, 2023.
Wohltmann, I., Santee, M. L., Manney, G. L., and Millán, L. F.: The chemical effect of increased water vapor from the Hunga Tongaeruption on the Antarctic, Geophys. Res. Lett., 51, e2023GL106980, https://doi.org/10.1029/2023GL106980, 2024.
Xia, Y., Huang, Y., Hu, Y., and Yang, J.: Impacts of tropical tropopause warming on the stratospheric water vapor, Clim. Dyn., 53, 3409–3418, https://doi.org/10.1007/s00382-019-04714-3, 2019.
Xia, Y., Huang, Y., Hu, Y., and Yang, J.: Lower stratospheric water vapor variations diagnosed from satellite observations, reanalysis data, and a chemistry-climate model, J. Meteorol. Res., 35, 701–715, https://doi.org/10.1007/s13351-021-0193-0, 2021.
Ye, H., Dessler, A. E., and Yu, W.: Effects of convective ice evaporation on interannual variability of tropical tropopause layer water vapor, Atmos. Chem. Phys., 18, 4425–4437, https://doi.org/10.5194/acp-18-4425-2018, 2018.
Yue, J., Russell, J., Gan, Q., Wang, T., Rong, P., Garcia, R., and Mlynczak, M.: Increasing water vapor in the stratosphere and mesosphere after 2002, Geophys. Res. Lett., 46, 13452–13460, https://doi.org/10.1029/2019GL084973, 2019.
Ziskin Ziv, S., Garfinkel, C. I., Davis, S., and Banerjee, A.: The roles of the Quasi-Biennial Oscillation and El Niño for entry stratospheric water vapor in observations and coupled chemistry–ocean CCMI and CMIP6 models, Atmos. Chem. Phys., 22, 7523–7538, https://doi.org/10.5194/acp-22-7523-2022, 2022.
- Abstract
- Introduction
- Data and methods
- Stratospheric water vapor QBO behaviour
- Comparison of water vapor QBO between boreal winter and summer
- Water vapor QBO in CMIP6 models
- Summary and discussion
- Code and data availability
- Author contributions
- Competing interests
- Disclaimer
- Acknowledgements
- Financial support
- Review statement
- References
- Supplement