the Creative Commons Attribution 4.0 License.
the Creative Commons Attribution 4.0 License.
Elevational dependence of global forest fires and associated aerosol optical depth: drivers and decoupling
Qiaomin Pei
Xingchuan Yang
Annan Chen
Forest fires have become an escalating environmental and ecological issue worldwide over the past decades. However, a knowledge gap persists in globally assessing how topography modulates wildfire behavior. Here we quantify global spatiotemporal patterns of forest fire activity and associated aerosol optical depth (AOD), together with elevation-dependent controls, using satellite observations from 2012 to 2024. The analysis reveals a slight yet significant increase in fire occurrence, accompanied by a strong positive association with fine-mode AOD (FAOD). In contrast, coarse-mode AOD (CAOD) shows little response, implying that wildfire emissions mainly contribute to the fine aerosol fraction. Forest fire occurrence declines systematically with elevation, with most fires concentrated below 600 m. In contrast, FAOD exhibits elevated mean values and increasing trends at mid-elevations (600–1400 m), revealing a decoupling between fire frequency and aerosol loading. This divergence is consistent with shifts in forest-type composition and topographically modulated smoke transport, including aerosol self-lifting driven by radiative absorption and atmospheric convection. Elevation-stratified multiple linear regression analyses incorporating the Fire Weather Index, leaf area index, temperature, wind speed, and precipitation indicate that fire activity is primarily governed by fuel availability and aridity. Precipitation exerts a consistent suppressive effect across elevations, while wind speed enhances fuel drying and fire spread at mid-elevations. Overall, these results identify elevation as a key organizing factor linking forest fires, aerosol emissions, and their underlying drivers, providing new constraints for wildfire risk assessment and fire–aerosol interactions under a changing climate.
- Article
(7433 KB) - Full-text XML
- BibTeX
- EndNote
Wildfires represent a key component of the Earth system, influencing ecosystems, atmospheric composition, carbon cycling, climate, and public health on a global scale (Bowman et al., 2009; Andela et al., 2017; Qian, 2025; Yang et al., 2022, 2021a). Over the past decade, the societal and environmental consequences of wildfires have attracted increasing scientific and public attention (Abatzoglou et al., 2025). Concurrently, ongoing climate warming has intensified fire-conducive weather, increasing the probability of wildfire occurrence, particularly large and extreme events (Jones et al., 2024; Abatzoglou et al., 2025). Elevated temperatures and prolonged dryness further reduce fuel moisture, raising fire susceptibility in biomass-rich forests (Jones et al., 2024; Jolly et al., 2015).
Forests constitute the most extensive terrestrial biome and serve as a major component of the global carbon budget (Pan et al., 2011). Despite their critical role, these ecosystems are becoming increasingly vulnerable to wildfire disturbances (Keywood et al., 2013). While the total burned area worldwide has shown a declining tendency in recent decades, fire occurring in forested regions have become more frequent and more severe, with average fire size, duration, and intensity increasing by two- to threefold over recent decades (Zheng et al., 2021; Cunningham et al., 2024; Parisien et al., 2023; Canadell et al., 2021). Escalating occurrences of extreme fires threaten forest stability and recovery capacity, potentially undermining essential ecosystem functions and services, including long-term carbon storage (Ward et al., 2020; Gatti et al., 2021). In contrast to grasslands, forest fires release greater amounts of carbon dioxide per unit area, and the reestablishment of carbon sinks after burning is generally slow, which may generate a positive climate-fire feedback (Zheng et al., 2021). These risks are further intensified by climate change, which promotes fuel aridity, extreme fire weather, and longer fire seasons, thereby increasing the probability of large-scale biomass burning (Kirchmeier-Young et al., 2024; Wang et al., 2025). Large and extreme fires are also promoted by human disturbance and land-use change, particularly in tropical forests where frequent human ignitions and ongoing forest degradation strongly drive fire activity (Lapola et al., 2023; Yang et al., 2023). By completely or partially removing aboveground vegetation, wildfires fundamentally alter forest structure and function (Kim et al., 2025), making forest fire activity an increasingly urgent global environmental and ecological concern.
The combustion of biomass in forest fires releases significant quantities of aerosols and trace gases into the atmosphere, leading to pronounced air quality deterioration not only near source regions but also in distant areas affected by long-range smoke transport (Ma et al., 2025; Zhang et al., 2025; Fan et al., 2021; Xu et al., 2025). Smoke-related pollution markedly increases annual mean PM2.5 exposure, contributing to thousands of premature deaths and billions of U.S. dollars in economic losses each year (Ma et al., 2025; Zhang et al., 2025). In addition to these air quality impacts, smoke aerosols influence the Earth's radiation balance and climate system through both direct interactions with solar radiation (scattering and absorption) and indirect effects associated with cloud microphysics (Keywood et al., 2013; Andreae et al., 2004; Blanchard-Wrigglesworth et al., 2025). Wildfire emissions induce contrasting thermal effects, characterized by surface cooling and atmospheric warming, which modify atmospheric stability, vertical transport, circulation patterns, and regional hydrology, ultimately driving significant climatic responses (Menon et al., 2002; Koren et al., 2004; Lau et al., 2006; Blanchard-Wrigglesworth et al., 2025; Pei et al., 2025). Moreover, wildfire-derived aerosols affect atmospheric and oceanic biogeochemistry by modulating nutrient deposition and photosynthetic activity in marine ecosystems (Hamilton et al., 2022; Tang et al., 2021). Consequently, wildfire emissions exert broad effects on air quality, the global radiation balance, and coupled climate–biogeochemical systems.
Substantial studies have elucidated that vegetation cover, fire weather, climate and topography jointly govern the probability and severity of forest fires (Parks et al., 2018; Birch et al., 2015; Whitman et al., 2018; Wang et al., 2022c; Yu et al., 2020). Besides fire weather and climate forcing, vegetation characteristics and topographic controls are critical determinants of fire severity, particularly in mountainous terrain (Birch et al., 2015; Walker et al., 2020). Live fuel availability, represented by vegetation cover, has been shown to strongly regulate wildfire severity. Analyses of 19 forested ecoregions across the western United States for 2002–2015 highlighted it as the dominant control (Parks et al., 2018), with comparable relationships documented in both the northern Rocky Mountains (Birch et al., 2015) and North American boreal forests (Walker et al., 2020; Whitman et al., 2018). Using a machine-learning approach, Jones et al. (2024) categorized global forest ecoregions into 12 pyromes and showed that increases in forest cover and ecosystem productivity substantially enhanced wildfire emissions. Topographic factors – such as elevation, aspect, and slope – have also been shown to exert substantial influence on burn severity across diverse regions, including China and Canada (Huang et al., 2020; Whitman et al., 2018). Notably, investigations from the Canadian Rocky Mountains reported strong associations between elevation and fire activity (Rogeau and Armstrong, 2017). Despite these advances, global-scale assessments of the relationship between topography and fire regimes remain limited relative to the extensive focus on vegetation-related drivers. This gap is notable given that topography can substantially enhance fire spread and promote erratic fire behavior (Sharples et al., 2012).
This work examines the influence of topography on global forest fire activity through a comprehensive analysis of spatial fire patterns. Building on evidence from Canadian forests identifying elevation as a key topographic control (Wang et al., 2025), we focus on elevation as a central organizing factor. This study focuses on three main objectives: (i) describing the global spatial distribution of fire pixel counts and their associations with aerosol optical depth (AOD) over forested regions; (ii) assessing the extent to which elevation shapes the spatial patterns of both fires and AOD; and (iii) determining the key factors that control the elevation–fire relationship. To interpret these patterns, multiple explanatory variables, including fuel load, forest type, and fire weather, are jointly analyzed. By elucidating elevation-dependent fire dynamics, this work provides a scientific basis for adaptive fire management, elevation-informed fuel treatments, post-fire hazard mitigation, and ecologically informed fire use to support biodiversity conservation in the face of persistent climate warming.
2.1 Satellite-based wildfire observations
We utilized active fire observations from the Visible Infrared Imaging Radiometer Suite (VIIRS) sensors carried by the Suomi NPP and NOAA-20 platforms. These measurements capture combustion-related thermal signals at approximately 375 m resolution. To facilitate large-scale analysis, individual fire detections were spatially aggregated onto a 0.1° × 0.1° global grid, and the number of detections within each cell was used as a metric of fire occurrence. Daily wildfire activity was characterized using the combined daytime and nighttime VIIRS observations, accounting for both fire occurrence and intensity. Fire detections were spatially overlaid with a forest land-cover mask to extract events occurring within forested pixels, and only grid cells with more than one active fire detection during 2012–2024 were retained to ensure data robustness. To enhance data reliability, fire pixels flagged as “low confidence” (confidence level “l”) were excluded from the analysis.
2.2 Vegetation types, elevation, and fire weather data
Land cover information was characterized by using the MODIS land cover type dataset at 500 m resolution, available through NASA's Land Processes Distributed Active Archive Center (LP DAAC). Topographic characteristics were represented using the General Bathymetric Chart of the Oceans (GEBCO) 2024 gridded data, which provides global elevation and bathymetry data at 15 arcsec resolution (∼ 500 m) (Harper and Sandwell, 2024). To ensure spatial consistency, land cover and elevation datasets were resampled to match the analysis grid. Forest categories and elevation values at fire locations were then extracted using nearest-neighbor interpolation. Forested regions were grouped into five major types: evergreen needleleaf (ENF), evergreen broadleaf (EBF), deciduous needleleaf (DNF), deciduous broadleaf (DBF), and mixed forest (MF). Elevation was stratified into 20 zones using 100 m intervals below 2000 m. Given the relatively low number of fire detections at higher elevations, all regions above 2000 m were combined into a single category to ensure sufficient sample sizes and enhance the robustness of subsequent trend analyses.
We employed the Canadian Forest Fire Weather Index (FWI) system to characterize weather conditions that favor wildfire development and to assess climate-driven variability in fire danger (Su et al., 2025; Liu et al., 2023; Van Wagner, 1987). The index is calculated from standard meteorological inputs, including near-surface air temperature, wind speed, relative humidity, and accumulated total precipitation over the preceding 24 h (Van Wagner, 1987). Daily FWI data with a resolution of 0.25° × 0.25° from 2012 to 2024 are obtained from the historical fire danger index archives. Supplementary meteorological parameters, such as 2 m air temperature (2mT), 10 m wind speed (10mW), and the max daily total precipitation, were extracted from the ERA5 reanalysis produced by the European Centre for Medium-Range Weather Forecasts (ECMWF). Monthly means of FWI and meteorological variables were calculated for subsequent analyses with forest fire activity.
2.3 Satellite-based FAOD and CAOD retrievals
Size-resolved aerosol optical depths at 500 nm, including the fine (FAOD) and coarse (CAOD) fractions, were estimated using SIDN (Simultaneous FAOD–CAOD Inversion Deep Neural Network) algorithm. The inversion is physically constrained by incorporating interactions between the two aerosol size classes, thereby enhancing retrieval reliability (Luo et al., 2024; Chen et al., 2025). SIDN integrates multi-source satellite observations with meteorological reanalysis data and is trained against high-quality AERONET measurements using a shared representation learning strategy based on the EntityDenseNet architecture. By dynamically balancing FAOD and CAOD contributions during training, SIDN improves retrieval accuracy and internal consistency across diverse aerosol regimes. A comprehensive description of the model architecture, training procedure, and validation is provided in the above references and is not repeated here. Extensive evaluations against independent ground-based observations demonstrate that SIDN outperforms conventional satellite products, yielding reduced uncertainties and improved spatial completeness, particularly under cloudy and complex surface conditions. In addition, the deep-learning framework trained with AERONET observations substantially improves retrieval accuracy and stability across different aerosol regimes, making the dataset particularly suitable for investigating wildfire–aerosol interactions on a global scale. The resulting daily global FAOD and CAOD dataset spans 2012–2024 at a spatial resolution of 0.5°. Because the spatial resolution of the AOD data is coarser than that of the forest fire dataset, a nearest-neighbor approach was used to match the datasets. This method preserves the original aerosol observations without introducing artificial smoothing or interpolation effects and has been widely applied in satellite data matching studies. Although the spatial resolution mismatch may introduce some uncertainties, its impact is expected to be limited for the large-scale analyses conducted in this study.
2.4 Temporal trends analysis
Temporal trends in wildfire activity were assessed using linear regression applied to annual fire pixel counts aggregated at 0.1° × 0.1° resolution. For each grid cell, a linear regression was fitted between the natural logarithm of annual fire pixel counts and time, with statistical significance determined at p<0.05. The regression slope was exponentiated to estimate the annual percentage change in fire occurrence. For the global and forest-type–specific assessments, annual records were further processed with a 3-year centered moving average, which filters out short-term interannual noise. To verify the stability of the detected trends, we employed the Mann–Kendall non-parametric test in combination with the Theil–Sen estimator, which provide outlier-insensitive assessments of trend direction and magnitude. The Theil–Sen slope was then derived for grid cells showing significant changes, expressed as
where SFC denotes the median rate of change, and FCi and FCj represent fire pixel counts at moments i andj, respectively.
Trends in AOD over 2012–2024 were analyzed using the same logarithmic linear regression framework to ensure comparability with fire pixel count trends. AOD values were restricted to the range 0–5 to exclude extreme outliers.
2.5 Correlation and multivariate regression analysis
To quantify the influence of forest fires on aerosol loading, linear regressions of the form AOD = applied separately to FAOD and CAOD. The regression slope (k) represents fire sensitivity, with larger values indicating stronger aerosol responses to fire activity. The log10[fires] was adopted as the explanatory variable, following common practice in wildfire research (Zhao et al., 2024; Abatzoglou and Williams, 2016). We applied linear regressions to individual 1° × 1° grid cells that contained no fewer than 10 fire observations. Where statistically significant associations were identified (p<0.05), both the slope parameter (k) and the corresponding R2 values were mapped to illustrate their spatial variability. Differences in regression slopes among grid cells were evaluated using two-tailed t tests.
For the elevation-based analysis of forest fire activity, all monthly fire, meteorological, vegetation, and topographic variables were spatially resampled to a 1° × 1° grid. For each grid cell, multiple linear regression model was conducted with log10[fires] as the response variable and FWI, leaf area index (LAI), 2mT, 10mW, and daily maximum total precipitation as predictors. Year and month were additionally included to represent long-term trends and seasonal variability. We employed ordinary least squares (OLS) models to obtain baseline relationships, and statistical inference was conducted using heteroskedasticity-robust standard errors (p<0.05). To mitigate multicollinearity among predictors, ridge regression with L2 regularization was additionally applied after standardizing all variables, with the optimal regularization parameter selected via cross-validation. Variance inflation factors (VIFs) were calculated to diagnose collinearity, and partial correlation analysis was applied to isolate the independent effects of each driver after accounting for temporal influences. Regression coefficients and model performance metrics were subsequently summarized within elevation bins to characterize altitude-dependent fire–environment relationships.
3.1 Spatiotemporal patterns of forest fires and AOD
Analysis of satellite-derived fire pixel counts across global forested regions from 2012 to 2024 reveals a modest but statistically significant increasing trend. Spatially, 51.1 % of forest grid cells exhibit positive trends, exceeding the 48.9 % showing negative trends, with a global mean linear increase of 2.89 % yr−1 (p<0.05, Fig. 1A). Our results indicate a growing number of forest fires, in agreement with the previously reported global increase in forest burned area and mean fire pixel counts over last two decades (Zheng et al., 2021; Yu and Ginoux, 2022). Geographically, significant positive trends in fire pixel counts are concentrated in North America, northern South America, and central Africa, whereas predominantly negative trends occur in Southeast Asia, western and central Siberia, and eastern Europe (Fig. 1A). The spatial patterns derived from linear regression are consistent with those identified using the Mann-Kendall test (Fig. 1B). Notably, regions exhibiting increasing trends largely overlap with areas of enhanced burned area and fire-driven carbon emissions in the tropical moist broadleaf forest pyrome identified by Jones et al. (2024) for the period 2001–2023. Increasing fire activity has also been reported in selected extratropical forest ecoregions, including Canada (Wang et al., 2025) and Northeast China (Liu et al., 2023).
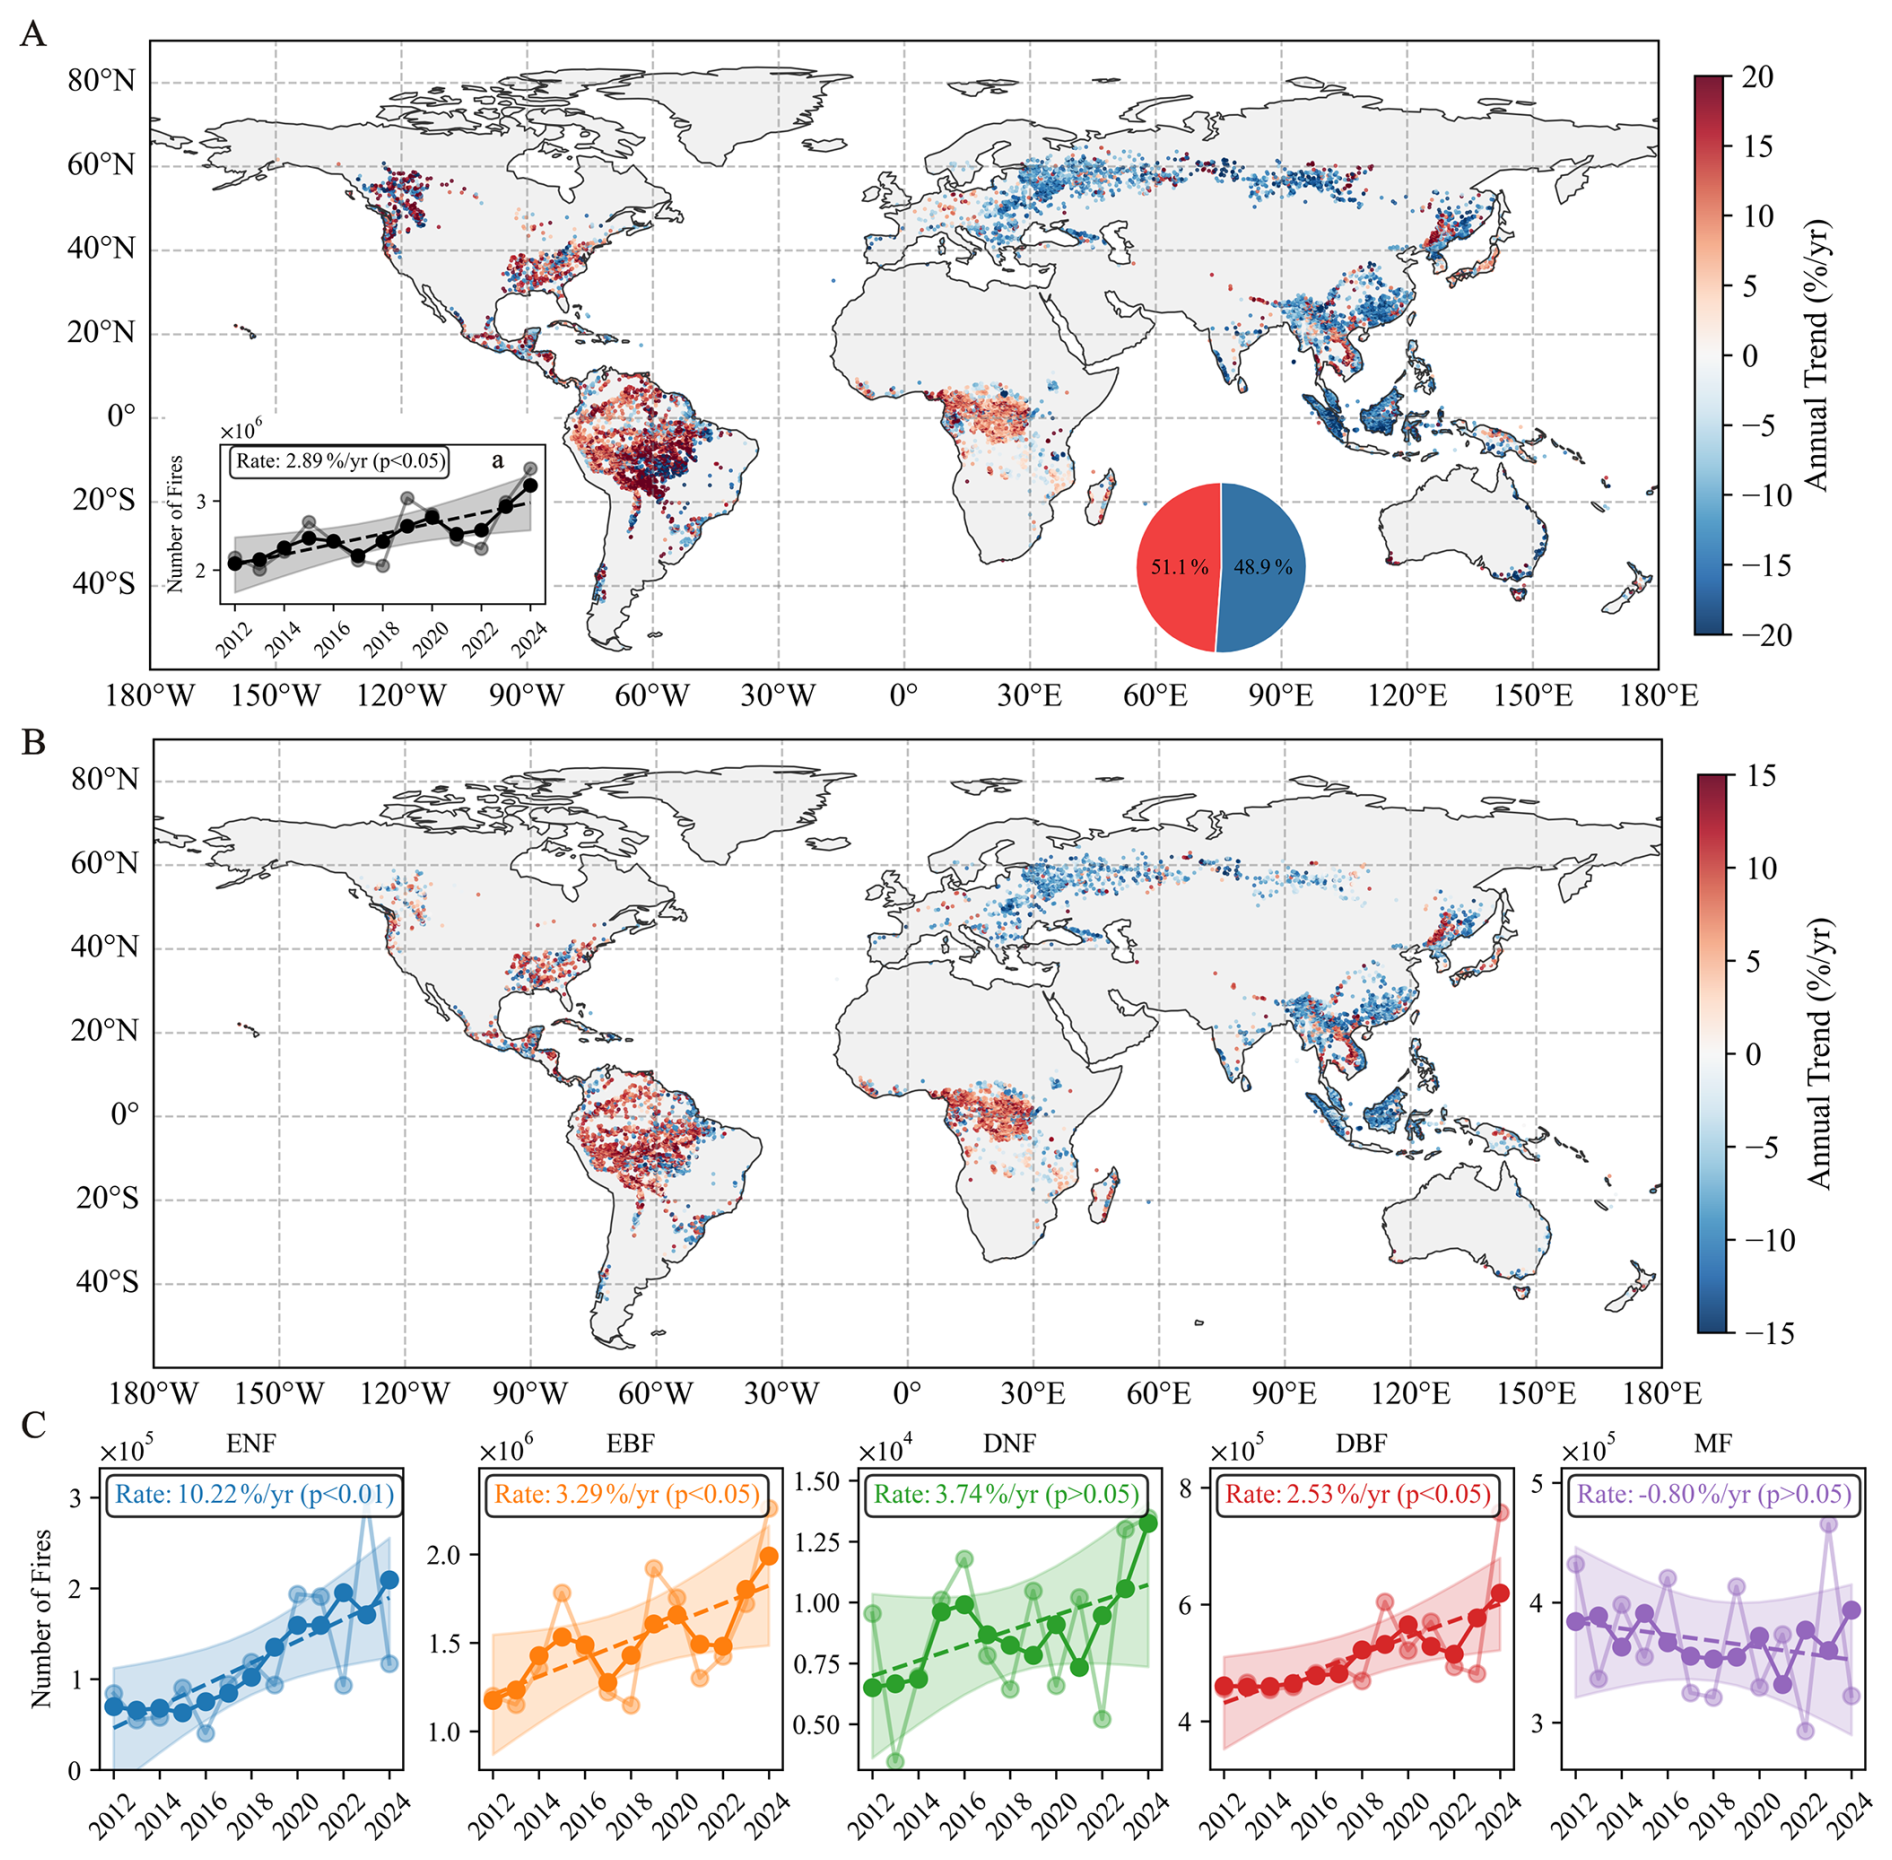
Figure 1Global trends in forest fire occurrence during 2012–2024. (A) Spatial distribution of statistically significant (p<0.05) trends in annual fire pixel counts. The inset (a) shows the corresponding global time series, including annual values (light circles), a 3-year centered moving average (dark circles), and the fitted linear trend with its 95 % confidence interval (dashed line and shaded envelope). The accompanying pie chart summarizes the relative fractions of increasing (red) and decreasing (blue) trends. (B) Significant spatial changes in yearly fire frequency, with significance assessed by the Mann–Kendall test and slope magnitudes estimated using the Theil–Sen method. (C) Distribution of significant interannual trends by dominant forest type, using the same smoothing and trend analysis as in (a). ENF, evergreen needleleaf forest; EBF, evergreen broadleaf forest; DNF, deciduous needleleaf forest; DBF, deciduous broadleaf forest; MF, mixed forest.
Considerable heterogeneity in fire activity is found across forest types. EBF accounts for the largest proportion of fire pixel counts globally, whereas ENF exhibits the strongest positive trend in fire occurrence (Fig. 1C). By comparison, no statistically significant changes are observed for DNF and MF. These forest types are primarily distributed across western and central Siberia (Fig. 2A), regions characterized by declining fire activity (Fig. 1A). Fire occurrence and severity are strongly mediated by vegetation characteristics, including forest type and fuel structure (Wang et al., 2025). High fire frequency and density are commonly associated with evergreen needleleaf forests, such as those dominated by Chir pine (Pinus roxburghii), which are characterized by high-intensity fire regimes (Kumar and Kumar, 2022). This elevated fire susceptibility is attributed to needle-shaped foliage, high resin content, and ladder-like branch architecture, which collectively enhance fuel flammability and vertical fire spread (Alexander and Cruz, 2011; Wang et al., 2025).
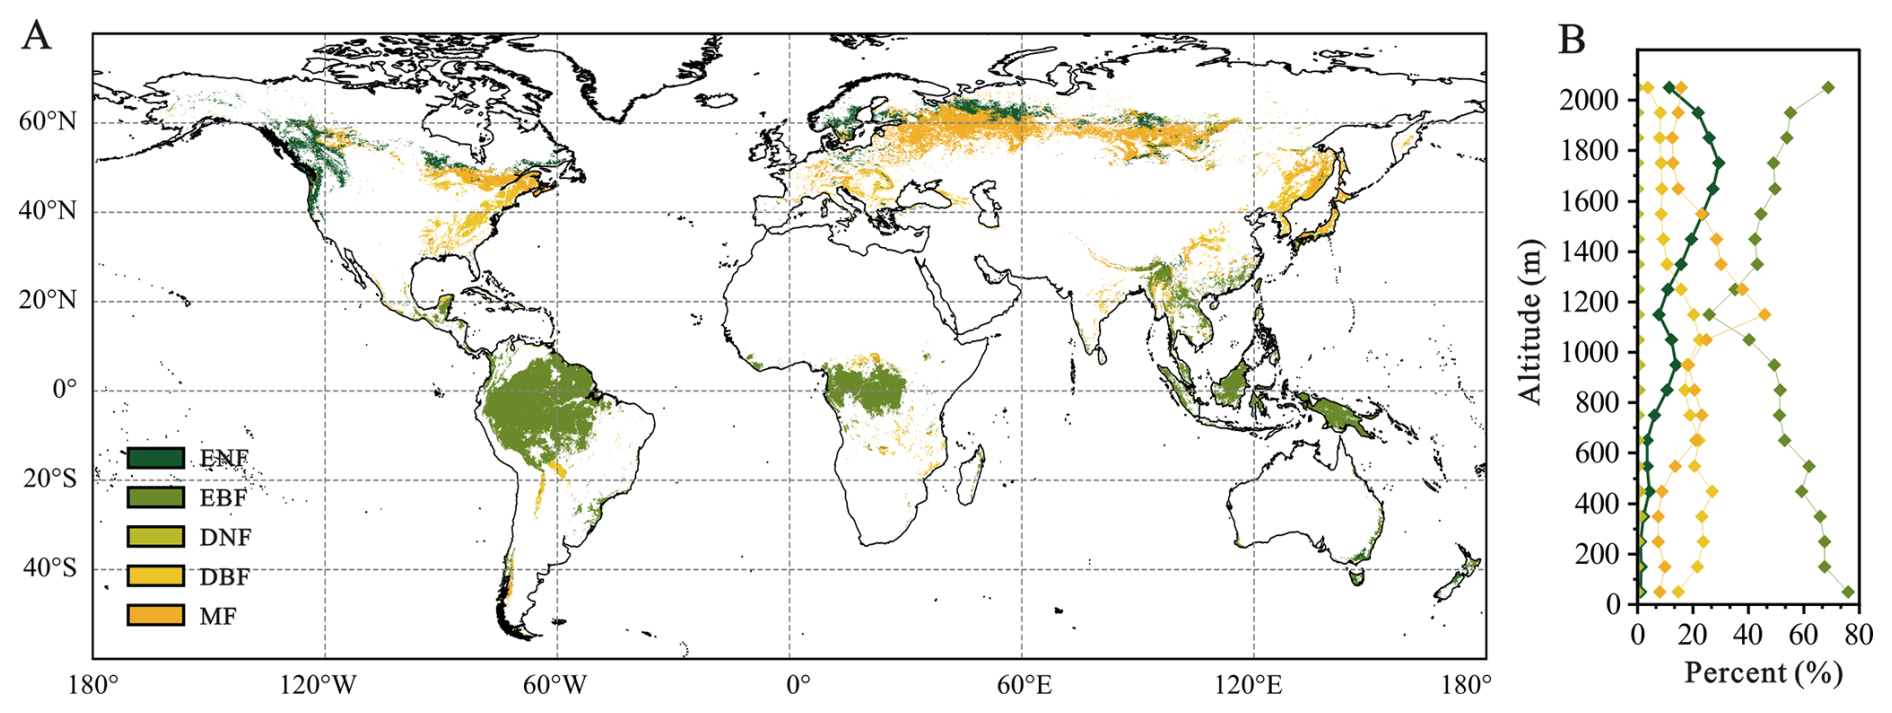
Figure 2Forest classification and its topographic variation. (A) Spatial patterns of the dominant forest categories. (B) Elevation-dependent distribution of forest cover, expressed as the percentage area occupied by each type within individual elevation bands. ENF, evergreen needleleaf forest; EBF, evergreen broadleaf forest; DNF, deciduous needleleaf forest; DBF, deciduous broadleaf forest; MF, mixed forest.
Aerosols influence the atmospheric radiation balance through the scattering and absorption of radiation (Andreae et al., 2004; Blanchard-Wrigglesworth et al., 2025). Owing to their distinct optical properties, different aerosol types exert varying climatic effects (Lin et al., 2021), particularly between fine-mode and coarse-mode particles (Li et al., 2025). To better investigate aerosol responses to forest fire activity, aerosol loading is therefore characterized using FAOD and CAOD. A consistent positive association between FAOD and fire pixel counts is observed across global forest regions from 2012 to 2024, whereas no comparable trend is detected for CAOD (Fig. 3). It should be noted that FAOD and CAOD may also be influenced by aerosol sources unrelated to wildfire emissions; therefore, the comparison with fire activity should be treated as a first-order diagnostic of their potential linkage rather than a strict attribution of aerosol sources. The fire–FAOD relationship was quantified using linear regression of the form (FAOD = ) applied to each 1° × 1° grid cell. Widespread statistically significant positive kF values indicate that fine-mode particles dominate wildfire-related aerosol loading (Fig. 4A), consistent with previous evidence that biomass burning predominantly contributes to the fine-mode portion of the aerosol population (Yan et al., 2024; Yang et al., 2021b; Kaskaoutis et al., 2014; Pei et al., 2025).
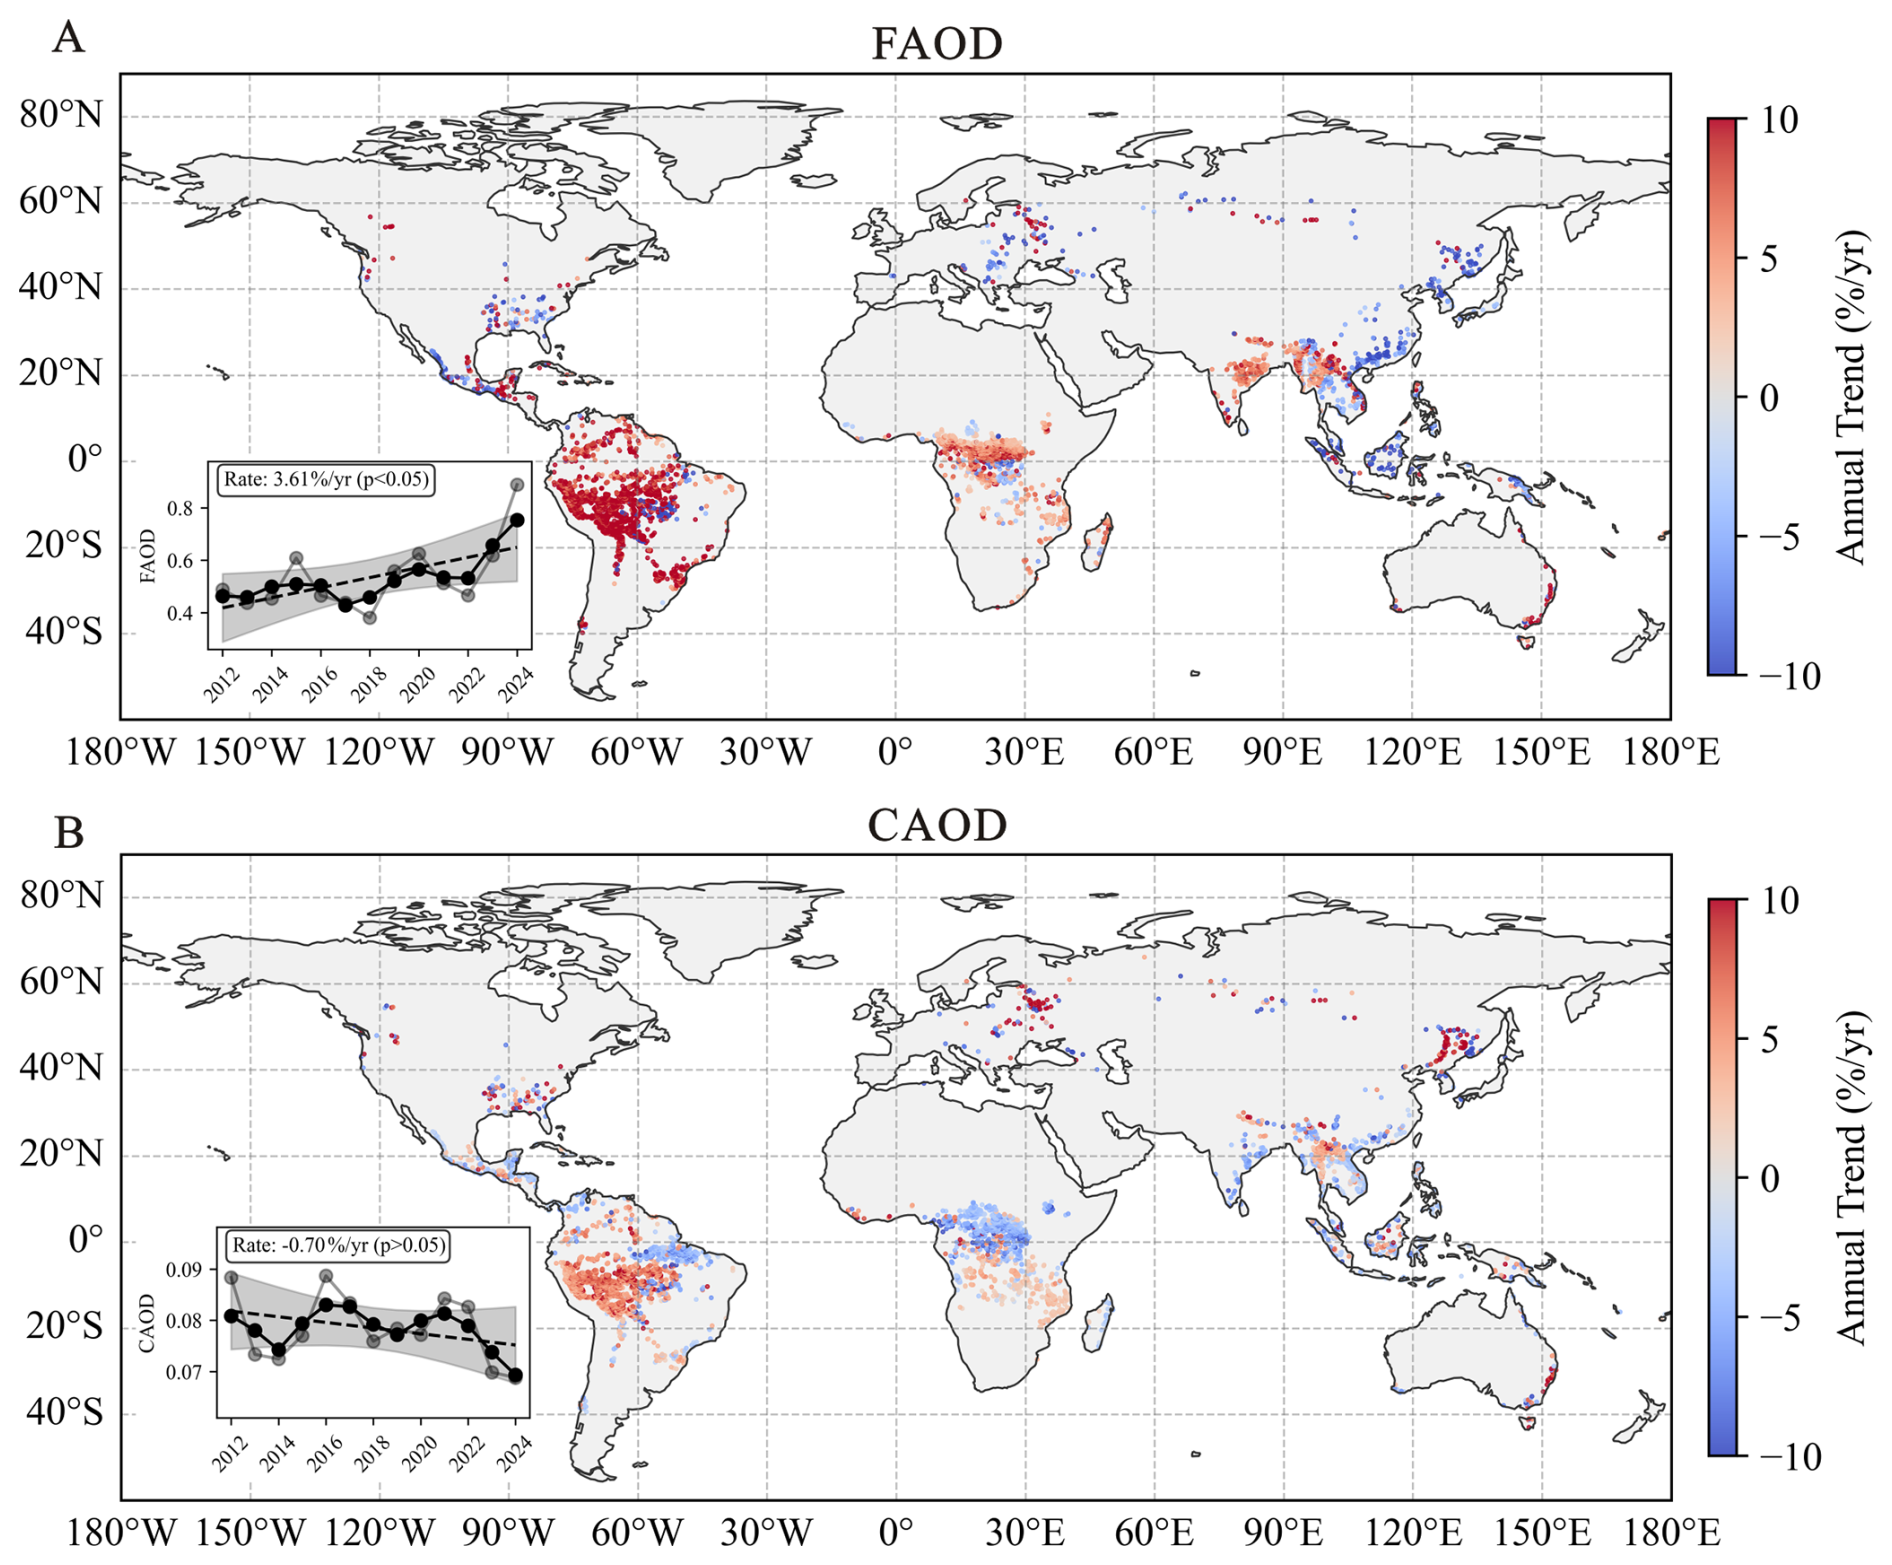
Figure 3Spatiotemporal trends in FAOD and CAOD during 2012–2024. (A) Spatial distribution of statistically significant trends (p<0.05) in FAOD. (B) Corresponding distribution for CAOD. Insets show the annual global time series, including annual values (light circles), a 3-year centered moving average (dark circles), and the linear trend with its 95 % confidence interval (dashed line with shading).
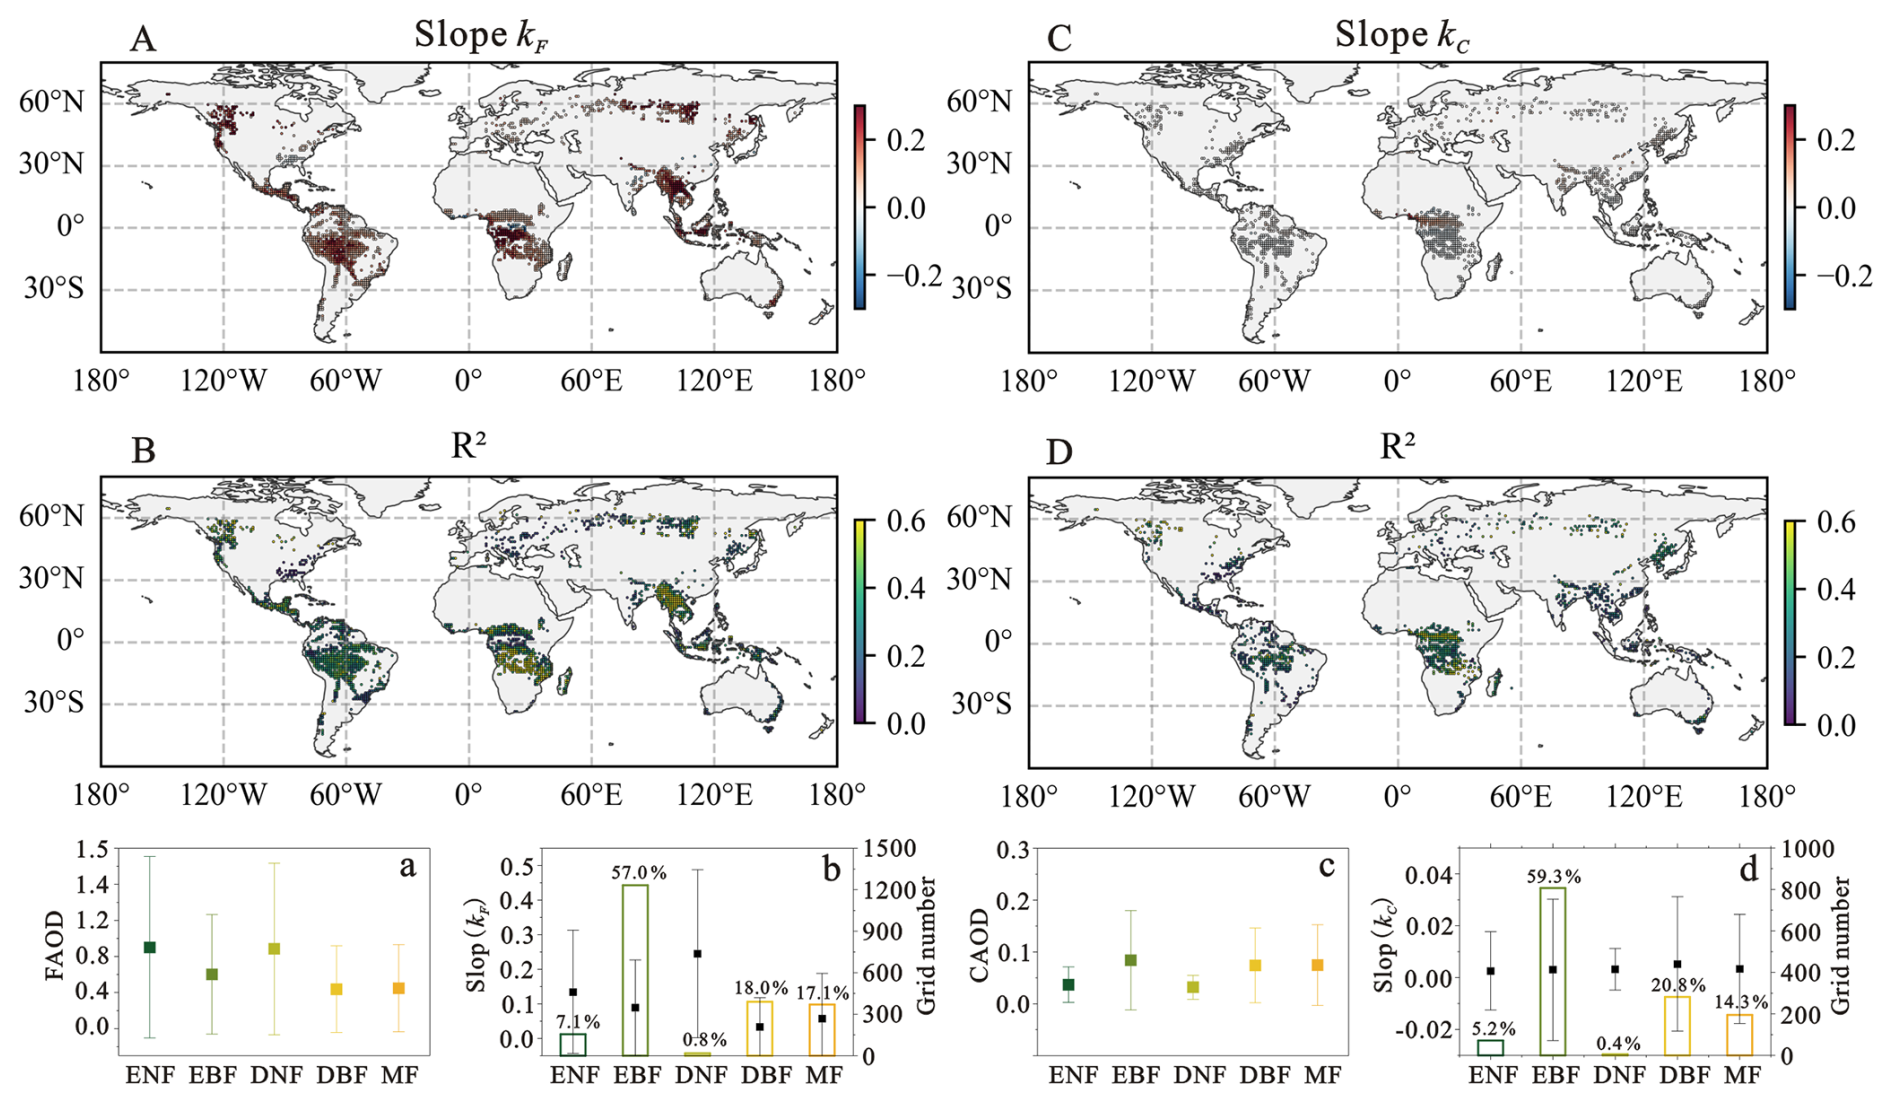
Figure 4Correlation analysis between forest fires and AOD. (A, B) Regression slope kF and R2 for FAOD-fire relationship. (C, D) Slope kC and R2 for CAOD-fire relationship. (a, b) Forest-type averages of FAOD and Slope kF. (c, d) Forest-type averages of CAOD and Slope kC. Maps (A–D) show only locally significant relationships (linear regression, p<0.05). Error bars in (a)–(d) denote standard errors. In (b) and (d), bar height indicates the number of grid cells per forest type, with numbers above bars showing the fractional area contribution of each forest type. ENF, evergreen needleleaf forest; EBF, evergreen broadleaf forest; DNF, deciduous needleleaf forest; DBF, deciduous broadleaf forest; MF, mixed forest.
The kF slope values exhibited variation across forest types, with the highest values magnitude observed in DNF (0.25 ± 0.24), followed by ENF (0.13 ± 0.18), EBF (0.09 ± 0.14), MF (0.06 ± 0.13) and DBF (0.03 ± 0.08) (Fig. 4b). This ranking is consistent with the spatial pattern of average FAOD across these forest types (Fig. 4a). Such differences can be attributed to species-dependent emission strengths, as dominant taxa contribute unevenly to wildfire-derived aerosols. For example, within ENF regions, Pseudotsuga and Picea account for 15 % and 71.1 % of total FAOD contribution from wildfire, respectively; among broadleaf forests, the genus Quercus alone contributes 50.6 % (Chen et al., 2025). These patterns underscore that aerosol emissions from forest fires depend not only on burned areas but also on fuel type and combustion efficiency (Keywood et al., 2013). In contrast, no significant positive kC values are detected for CAOD (Fig. 4C). The average of kC values in different forest types was close to 0 with minimal variation (Fig. 4d), indicating the absence of a systematic forest fire influence on coarse-mode aerosol loading. In contrast to the large aerosol particles associated with large fire events, such as pyroCb emissions (Li et al., 2025) or coarse dust produced by post-fire dust outbreaks caused by reduced vegetation cover and soil moisture (Yu and Ginoux, 2022), the results presented here mainly represent the global mean response within forest fire regions. Although large fire events may generate unusually high aerosol loading or coarse-mode dust, such episodic events are not fully captured in the large-scale averages analyzed in this study.
3.2 Elevation-Dependent Patterns of Forest Fire Occurrence and FAOD
To evaluate how topography shapes forest fire activity globally, we examined the elevational dependence of fire occurrence from 2012 to 2024. A clear and statistically significant decline in mean annual fire pixel counts with increasing elevation was identified (Fig. 5A). Forest fires were predominantly concentrated at low elevations, with 66.6 % of total fire detections occurring below 600 m, followed by 19.2 % between 601 and 1000 m and 13.3 % between 1001 and 2000 m. Only 0.9 % of fires were detected above 2000 m (Fig. 5A). This inverse relationship between elevation and fire activity agrees with previous regional studies conducted in the Canadian Rocky Mountains (Rogeau and Armstrong, 2017) and across forested regions of China (Tian et al., 2013; Ma et al., 2020). Similar elevational dependence is also evident in the interannual trends. Both the multiyear mean fire pixel counts, and the corresponding annual trends exhibit a pronounced decrease from low to high elevations (Fig. 5A, B). However, Xu and You (2022) reported increasing burned areas in global high-mountain regions above 3000 m, primarily focusing on high-mountain ecosystems that include alpine and other non-forest environments. In contrast, the present study examines wildfire activity within global forest regions, where most fires occur at low and mid elevations. Differences in vegetation type, fuel availability, and fire regimes between forested landscapes and alpine environments may partly explain these contrasting patterns.
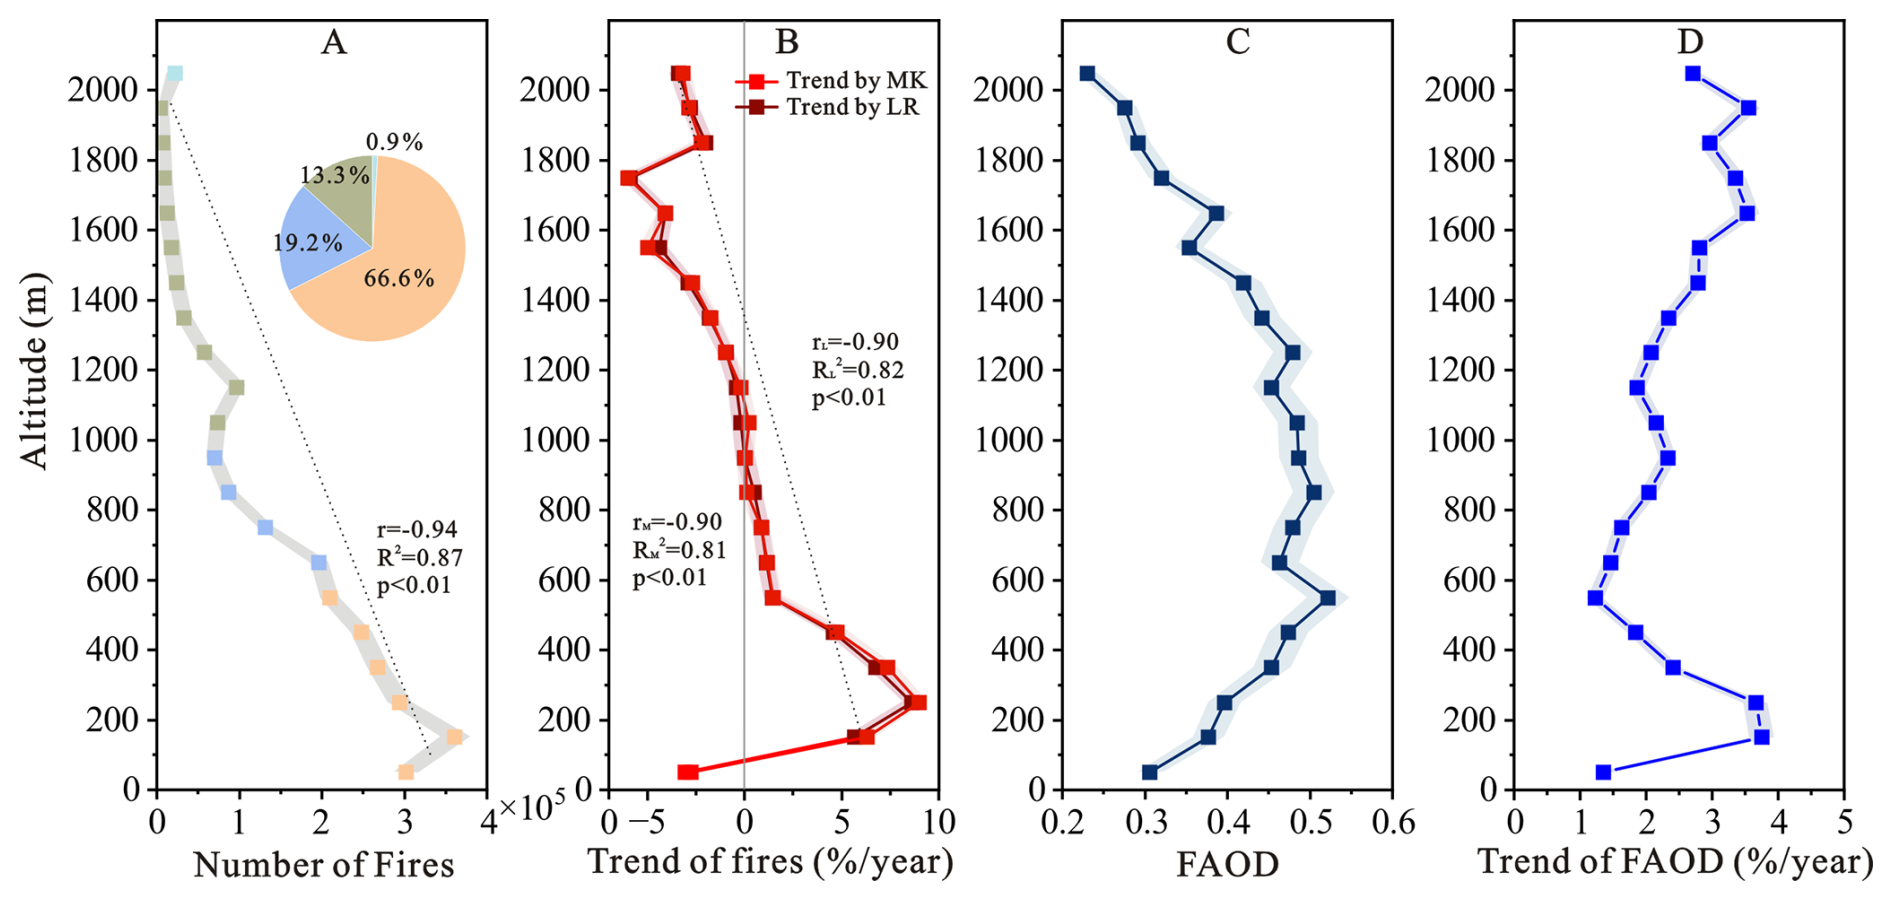
Figure 5Elevational variations in multiyear mean fire pixel counts, FAOD, and their temporal trends. (A, B) Multiyear mean (A) and significant annual trend (B) in fire pixel counts as a function of elevation. (C, D) Corresponding multiyear average (C) and trend (D) in FAOD. Dashed lines indicate overall elevation-dependent tendencies in (A) and (B). Colors denote elevation classes: 0–600 m (light orange), 600–1000 m (light blue), 1000–2000 m (gray-green), and >2000 m (light cyan). Shaded areas represent the 95 % confidence intervals.
Notably, while the largest absolute number of fires were observed between 100 and 200 m, the strongest positive trend in fire activity occurred near ∼ 300 m before declining at higher elevations. This discrepancy suggests that recent fire activity has increasingly concentrated around the ∼ 300 m elevation range, potentially reflecting the combined influence of climate variability and fire management practices. In contrast, a weak negative trend in fire occurrence was observed below 100 m, which may be associated with more effective control of ignition sources in densely managed lowland regions (Wang et al., 2022b).
In contrast to the monotonic decline in fire occurrence, FAOD exhibits a distinct elevational pattern. While FAOD trends below 600 m broadly track those of fire activity, its multiyear mean values peak at mid-elevations (600–1400 m) rather than at low elevations (Fig. 5C, D). This divergence indicates that FAOD is not solely controlled by local fire occurrence but is also influenced by forest composition and topographically modulated by smoke transport processes. Around 600 m elevation, forest composition shifts toward a higher fraction of ENF (Fig. 2B), which exhibits stronger FAOD sensitivity to fire activity () than EBF (). In addition, smoke particles released by low-elevation fires may be carried to higher levels of the atmosphere via aerosol self-lifting processes associated with radiative heating and convective motions (De Laat et al., 2012; Ohneiser et al., 2023; Xu et al., 2025), thus elevating FAOD levels at mid-elevations. Above 600 m, the strengthening FAOD trends with elevation diverge from the concurrent decline in fire occurrence, implying the involvement of additional processes beyond local fire emissions. In addition, with fewer than 50 grid cells above 1500 m exhibiting statistically significant trends, the representativeness and accuracy of the computed global FAOD trend may be compromised. Collectively, these results suggest that mid-elevation regions (600–1400 m) are disproportionately influenced by smoke aerosols from forest fires at a global scale.
3.3 Drivers of Elevational-Dependent Variations in Fire Activity
To explain the contrasting elevational patterns of forest fire occurrence identified in Sect. 3.2, we next examine the meteorological and ecological drivers governing fire activity along with the elevation gradient. Vegetation fire activity is governed by multiple interacting factors, including ignition sources, fuel supply and moisture, fire-conducive weather, and forest management practices (Wang et al., 2022a; Clarke et al., 2025). However, the relative contributions of these drivers change with elevation. Notably, the FWI – often used to characterize the meteorological fire danger – exerts little explanatory power, with regression coefficients near zero at all heights (Fig. 6). Partial correlation coefficients were negative between 300 and 2100 m, indicating a weak association between FWI and fire occurrence after accounting for elevation. The weak agreement observed here aligns with earlier reports (Su et al., 2025; Wang et al., 2025) and arises primarily from mismatches in spatial and temporal resolution. FWI primarily represents short-term surface meteorological conditions conducive to wildfire occurrence, but it does not explicitly account for atmospheric instability, which can play an important role in the development of large fires (Pinto et al., 2020). In addition, our analysis focuses on the influence of topographic effects. The complex regional topography may strongly modulate atmospheric instability (Santos et al., 2023), which is closely associated with lightning activity and has been shown to be an important factor in fire growth at the local scale (Haines, 1988).
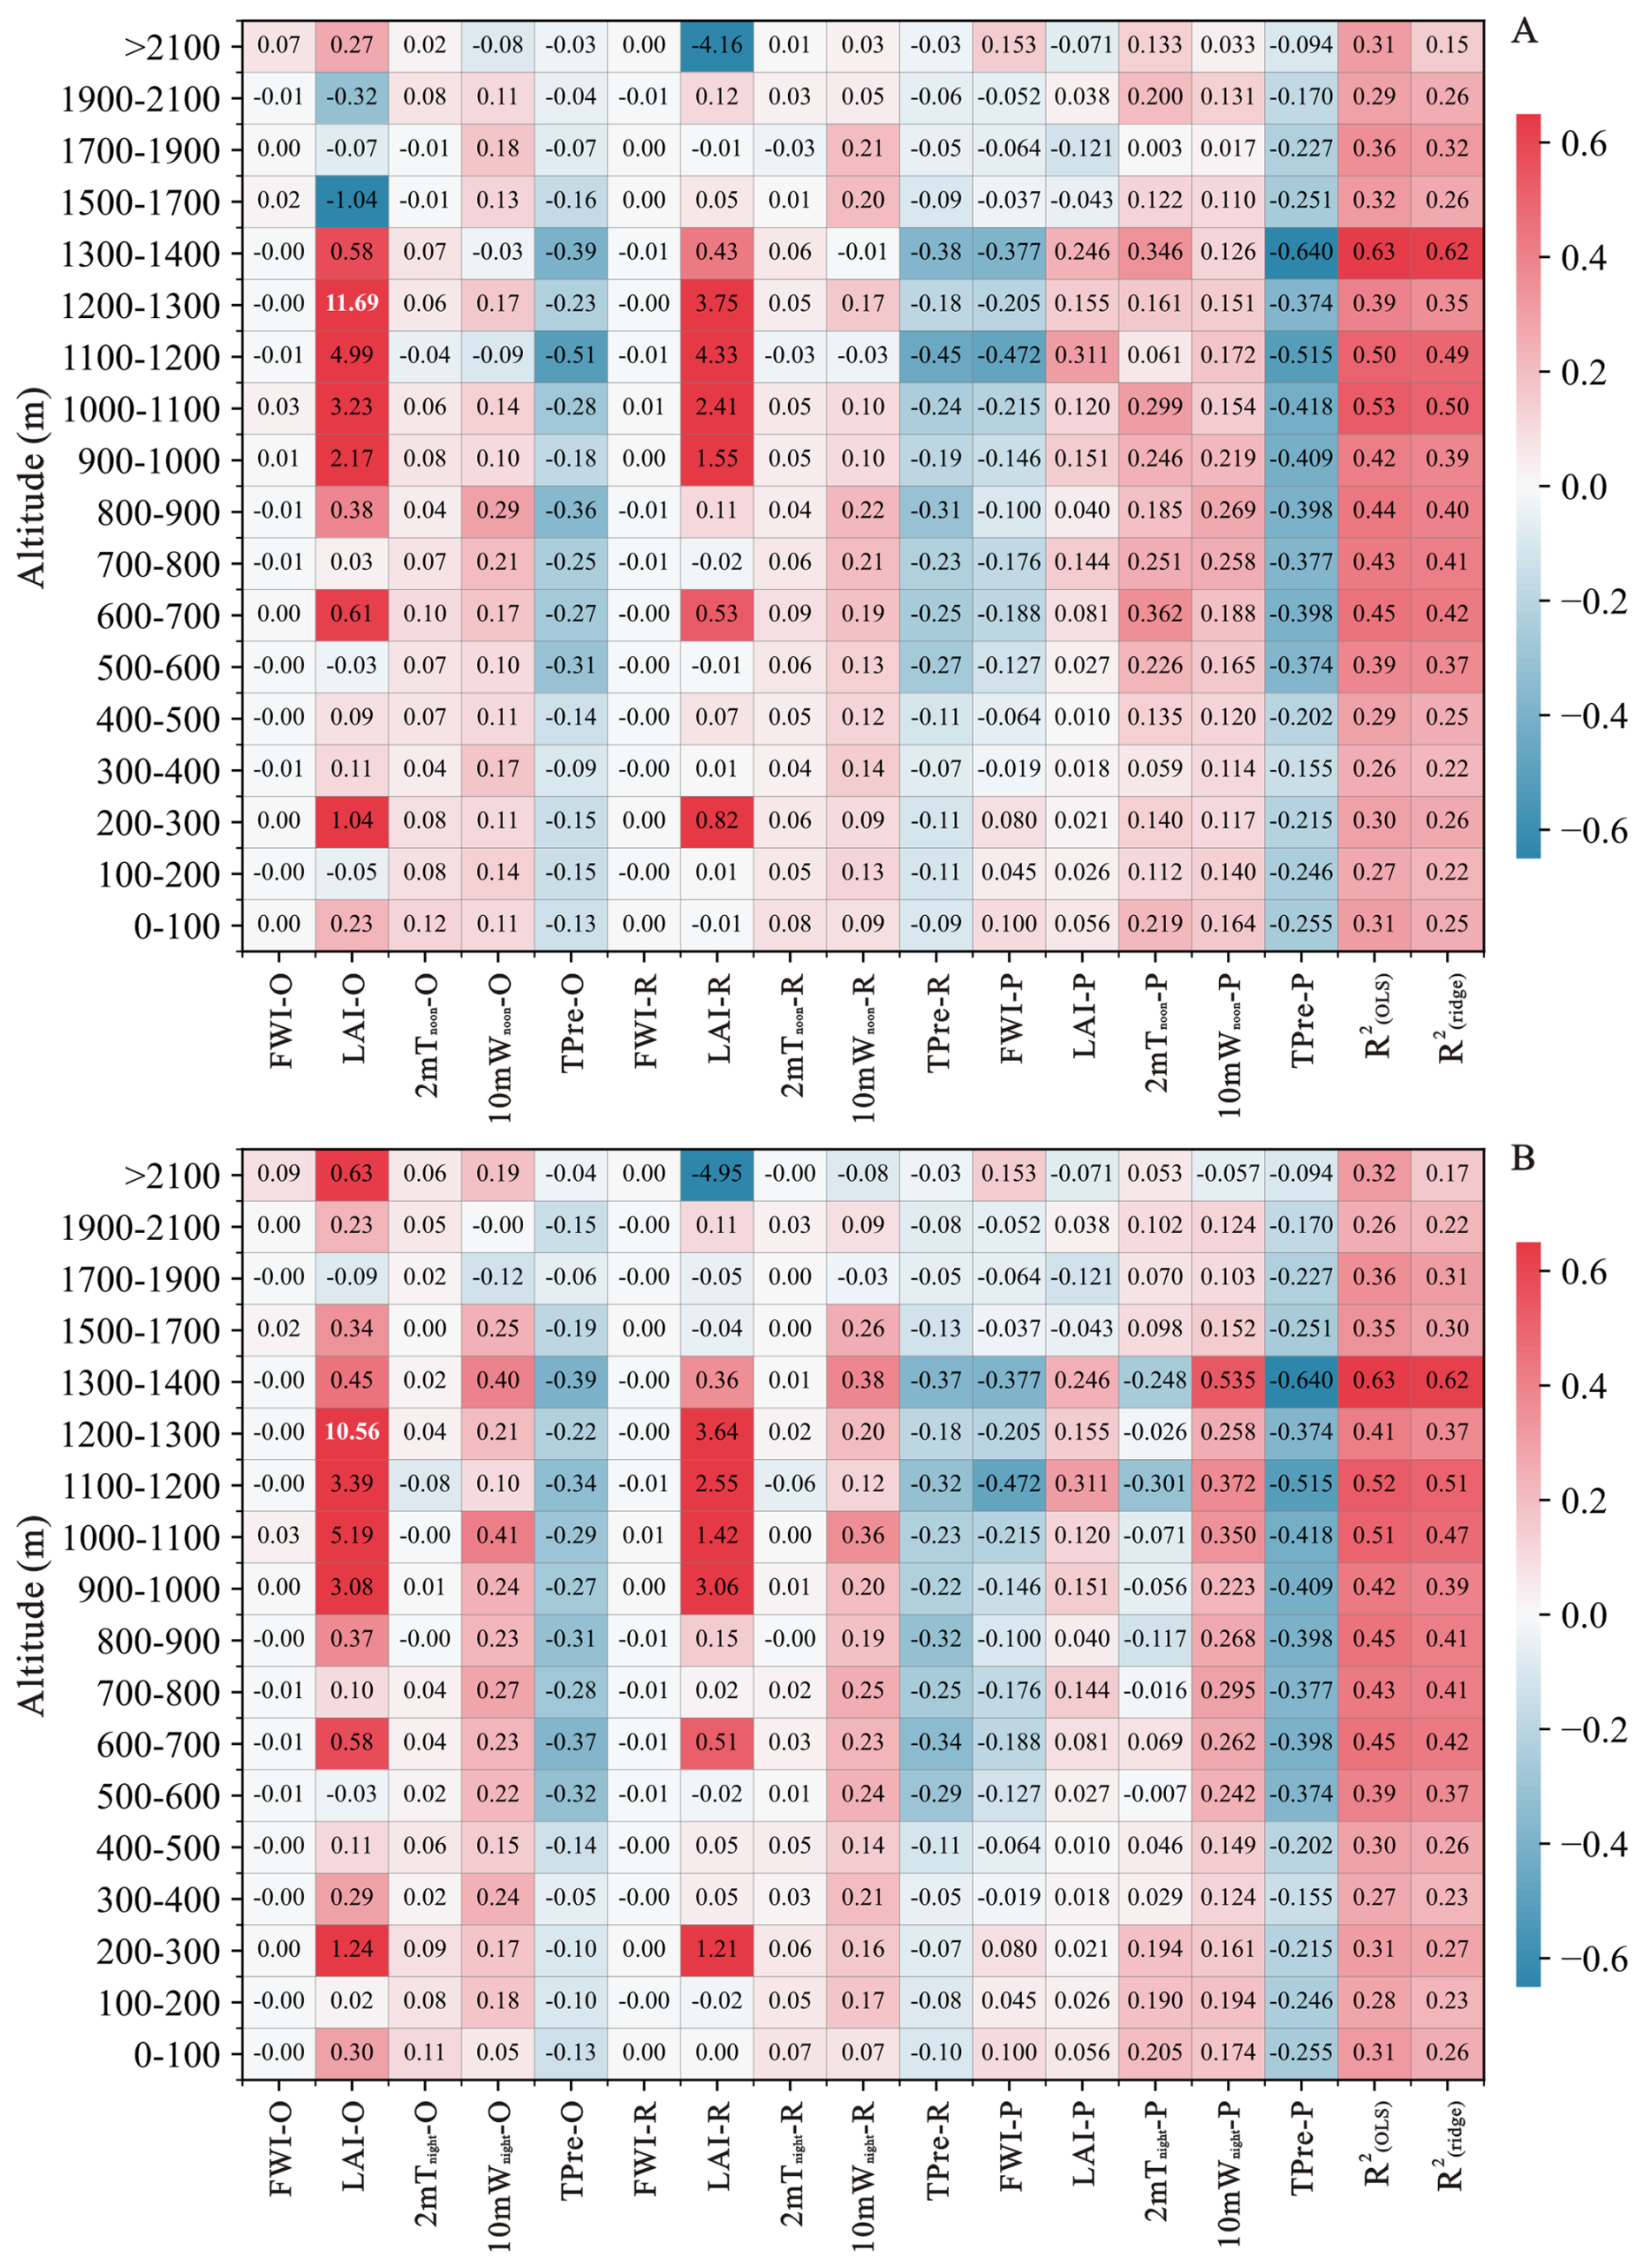
Figure 6Elevational variations in the key drivers of fire activity derived from multiple linear regression. Fire pixel counts were related to the FWI, LAI, 2mT, 10mW, and maximum total precipitation (TPre) (p<0.05). Panels (A) and (B) represent nighttime and midday conditions, respectively. For each predictor, “-O” denotes the OLS standardized coefficient, “-R” the ridge regression coefficient, and “-P” the partial correlation coefficient. Model skill was evaluated using the coefficients of determination derived from both OLS (R2 (OLS)) and ridge regression (R2 (ridge)).
To further disentangle elevational controls on fire activity, we examined individual climatic and ecological variables associated with fuel aridity, ignition potential, and fuel availability. Observed declines in LAI and wind speed with increasing elevation (Fig. 7) are consistent with a reduced probability of fire occurrence at higher altitudes. LAI was selected as a proxy for fuel availability (Yu et al. 2020). Multiple linear regression analyses reveal pronounced elevation-dependent relationships (Fig. 6). At high elevations (>1500 m), fire occurrence shows no significant relationship with LAI. In contrast, fire activity shows clear positive correlations with LAI at both low (200–300 m) and mid-elevations (600–1400 m), highlighting the importance of vegetation density as a proxy for available fuels. While relatively strong regression coefficients are observed in the low-elevation band (200–300 m), the corresponding R2 values are comparatively low, indicating that LAI explains only a limited fraction of the variability in fire occurrence at these elevations. Consequently, the relationship between vegetation and fire activity is more robust at mid-elevations. Although ridge regression produced smaller coefficients than OLS, the coefficient for LAI remained significantly higher than those of the other predictors. These observations support earlier studies showing that vegetation structure and forest composition strongly regulate fire dynamics (Parks et al., 2018; Wang et al., 2022c). In particular, evergreen needleleaf species such as Pinus densiflora and Pinus roxburghii possess resin-rich needles that enhance flammability and promote high-intensity fire behavior (Baek et al., 2022; Kumar and Kumar, 2022).
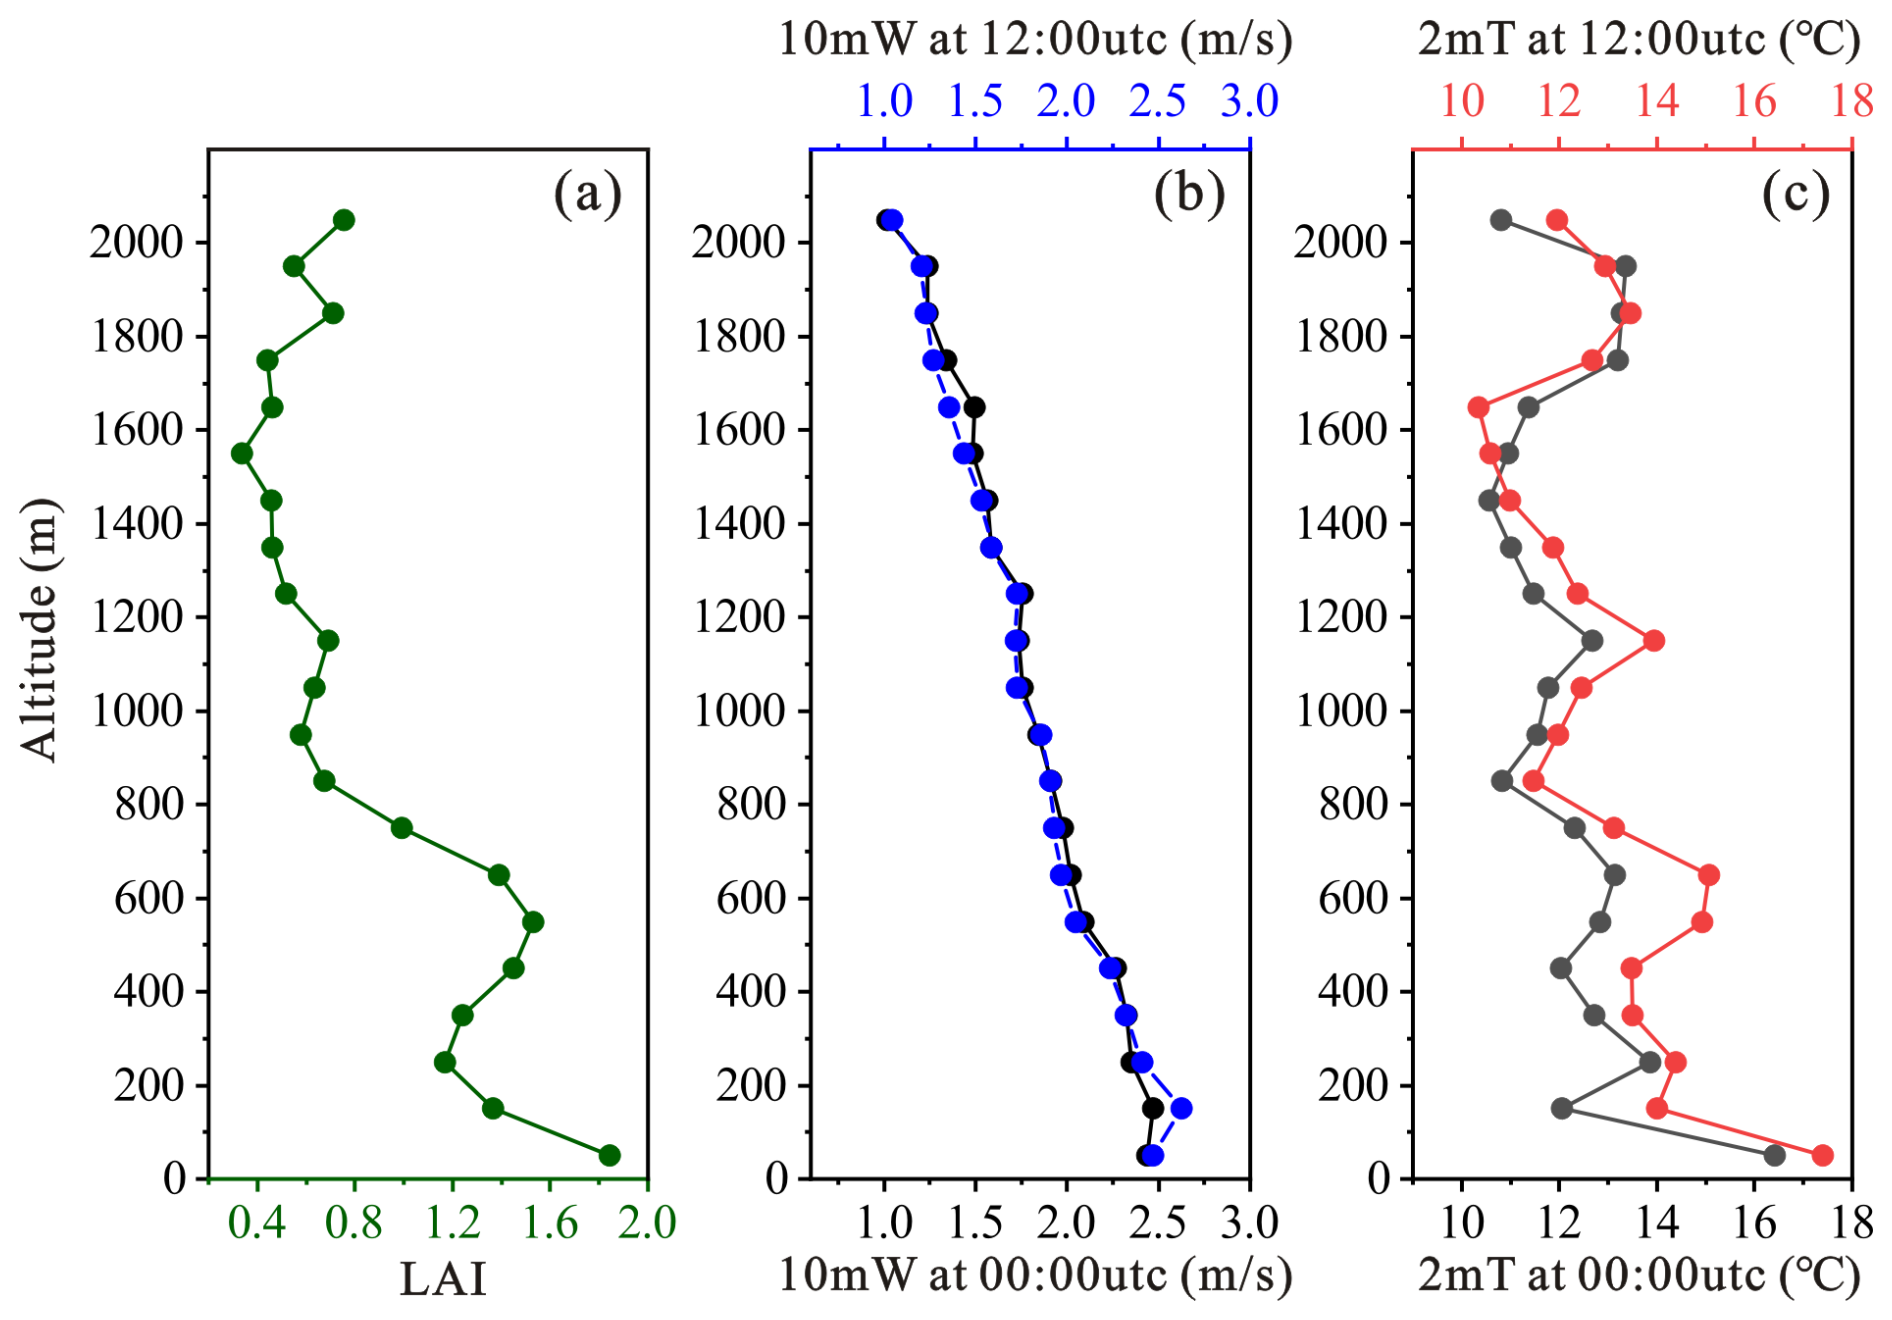
Figure 7Elevational patterns of multiyear mean variables. (a) Leaf area index (LAI). (b) 10 m wind speed (10mW) at 00:00 and 12:00 UTC. (c) 2 m air temperature (2mT) at 00:00 and 12:00 UTC.
Air temperature, closely linked to climate change, influences fire activity by modulating fuel drying and convective processes (Dastour et al., 2024; Duane et al., 2021). However, temperature exhibited negligible effects, with both OLS and ridge coefficients remaining close to zero across all elevations under both nighttime and midday conditions. The weak elevational dependence of 2 m air temperature (Fig. 7) suggests that temperature alone cannot explain the observed decline in fire occurrence. At mid-elevations, nighttime temperature exhibits a weak negative partial correlation with fire occurrence, while daytime temperature shows a positive association, highlighting the complex and diurnally dependent influence of temperature under topographic constraints. In contrast, precipitation emerges as a robust suppressor of fire activity across all elevation bands, with the strongest effects observed at mid-elevations. The consistently negative regression coefficients indicate that precipitation deficits are a primary determinant of fire occurrence and spatial distribution, consistent with previous findings linking fire activity to precipitation amount and rainy-day frequency (Kim et al., 2025). Relative humidity likely reinforces this effect by further modulating fuel moisture, particularly in boreal forest systems (Veraverbeke et al., 2017; Dastour et al., 2024).
Wind speed also exhibits strong elevational dependence. Nighttime wind speed shows a positive association with fire occurrence below 1800 m in both OLS and ridge models, with the strongest influence at mid-elevations (Fig. 6). Daytime wind speed is positively related to fire activity at low elevations but shows no significant relationship at mid-elevations, likely reflecting differences between daytime up-valley winds and nighttime downslope flows. In mountainous terrain, downslope flows may advect warm and dry air toward lower elevations, creating fire-favorable conditions when fuels are sufficiently dry (Abatzoglou et al., 2023, 2021). Partial correlation analyses indicate that, when isolated from other factors, wind speed remains positively associated with fire activity across elevations below 2000 m, particularly at mid-elevations. Elevated wind speeds enhance fire activity by increasing evaporative drying, promoting sustained combustion, and facilitating ember transport (Ma et al., 2020; Jones et al., 2022).
Together, these results identify precipitation, wind speed, and vegetation abundance as primary drivers of the elevation-dependent distribution of forest fires. At mid-elevations, fire activity is jointly controlled by sufficient fuel availability and aridity, the latter mediated by reduced precipitation and elevation-specific wind regimes. In addition, enhanced FAOD associated with fire-emitted smoke aerosols – dominated by light-absorbing black carbon (Yu et al., 2019) – may further contribute to atmospheric heating and fuel drying at seasonal to interannual timescales (Pei et al., 2025), potentially reinforcing fire-favorable conditions. Several potentially important drivers, including anthropogenic ignitions, lightning frequency, soil moisture, and regional fire management practices, were not explicitly considered in this analysis. In addition, the limited number of grid cells (<10) between 1300 and 2100 m reduces statistical robustness, suggesting that fire controls at these elevations may be more complex at the global scale. This threshold differs from that used in the FAOD trend analysis because the two analyses are conducted at different spatial resolutions. Specifically, the FAOD trend analysis is based on a 0.1° grid with a large number of global grid cells, for which a threshold of 50 grid cells is applied to ensure statistical representativeness. In contrast, the elevation-dependent regression analysis is performed on a coarser 1° grid, where the number of available grid cells is substantially smaller; therefore, a lower threshold of 10 grid cells is adopted to maintain sufficient statistical robustness. These unaccounted factors likely contribute to the residual variability in fire occurrence and warrant further investigation.
Across global forested regions from 2012 to 2024, we analyze spatiotemporal variability in forest fire activity and its associated AOD, together with their elevation-dependent drivers, across global forested regions during 2012–2024. Satellite observations reveal a modest but statistically significant increase in forest fire occurrence, with a global mean linear trend of +2.89 % yr−1. Fire trends vary substantially among forest types, with ENF exhibiting the strongest positive trends, while DNF and MF show no significant changes. Fire-associated aerosol loading is dominated by fine-mode particles. The consistent positive trends and statistically significant relationships between FAOD and fire pixel counts, together with the absence of a corresponding response in CAOD, indicate that forest fire emissions primarily enhance the fine aerosol fraction. Both the multiyear mean fire pixel counts and its temporal trend decline systematically with increasing elevation, from lowlands to elevations above 2000 m, highlighting a pronounced elevational control on global forest fire activity. In contrast, FAOD exhibits a more complex elevational structure. Below 600 m, FAOD trends broadly track fire occurrence, whereas at mid-elevations (600–1400 m) FAOD displays elevated mean values and increasing trends despite declining fire occurrence. This divergence suggests that mid-elevation aerosol burdens are influenced not only by local fire activity but also by shifts in forest-type composition and by topographically modulated smoke transport, including aerosol self-lifting driven by radiative absorption and atmospheric convection.
Elevation-stratified multiple linear regression analyses further indicate that forest fire activity is primarily controlled by the combined effects of fuel availability and aridity. Fuel load, represented by leaf area index, plays a critical role at mid-elevations, while precipitation consistently exerts a suppressive influence on fire occurrence across all elevation bands. Wind speed emerges as an important contributor to fuel drying and fire spread, especially in mid-elevation regions. In contrast, temperature and the FWI show limited independent explanatory power once elevation and other covarying factors are considered. Overall, these results highlight elevation as an important organizing dimension linking forest fire activity, aerosol emissions, and their underlying drivers at the global scale. By elucidating how fuel characteristics, meteorological conditions, and topography jointly regulate fire–aerosol interactions across elevation gradients, this study provides a physically grounded framework for improving wildfire risk assessment, interpreting fire-driven aerosol impacts, and refining fire management strategies under a changing climate. Continued investigation incorporating anthropogenic ignitions, lightning activity, and region-specific management practices will be essential for further constraining elevation-dependent fire regimes.
Active fire detections at 375 m resolution were obtained from the NASA Land-SIPS VIIRS product, provided through the Fire Information for Resource Management System (FIRMS) (https://earthdata.nasa.gov/firms, last access: 23 April 2026). Elevation information was derived from the 2024 General Bathymetric Chart of the Oceans (GEBCO) global gridded dataset (https://doi.org/10.5285/1c44ce99-0a0d-5f4f-e063-7086abc0ea0f, GEBCO Bathymetric Compilation Group, 2024), available at https://www.gebco.net/ (last access: 23 April 2026). Land cover classifications were taken from the MODIS Land Cover Type Yearly Climate Modeling Grid (CMG; MCD12Q1), distributed via the Level-1 and Atmosphere Archive & Distribution System (LAADS DAAC) (https://ladsweb.modaps.eosdis.nasa.gov/search/order/1, last access: 23 April 2026). Historical Fire Weather Index (FWI) data were sourced from the Copernicus Emergency Management Service (https://doi.org/10.24381/cds.0e89c522, Copernicus Climate Change Service, 2019). Meteorological variables and leaf area index (LAI) were extracted from the ECMWF Reanalysis v5 (ERA5) archive (https://cds.climate.copernicus.eu/datasets, last access: 23 April 2026). The daily global FAOD and CAOD datasets at 500 nm are available from the authors upon request.
CZ initiated and supervised the study. QP carried out the data analysis and drafted the initial manuscript. XY contributed the daily global FAOD and CAOD datasets. All authors (CZ, QP, XY, XY, AC, and XW) participated in improving the manuscript.
The contact author has declared that none of the authors has any competing interests.
Publisher's note: Copernicus Publications remains neutral with regard to jurisdictional claims made in the text, published maps, institutional affiliations, or any other geographical representation in this paper. The authors bear the ultimate responsibility for providing appropriate place names. Views expressed in the text are those of the authors and do not necessarily reflect the views of the publisher.
We are deeply appreciative of MODIS, GEBCO, ECMWF and NASA's FIRMS teams for granting access to their valuable data.
This work is supported by the Yunnan Provincial Science and Technology Project at Southwest United Graduate School (grant number 202302AP370003).
This paper was edited by Jianping Huang and reviewed by two anonymous referees.
Abatzoglou, J. T. and Williams, A. P.: Impact of anthropogenic climate change on wildfire across western US forests, P. Natl. Acad. Sci. USA, 113, 11770–11775, https://doi.org/10.1073/pnas.1607171113, 2016.
Abatzoglou, J. T., Rupp, D. E., O'Neill, L. W., and Sadegh, M.: Compound Extremes Drive the Western Oregon Wildfires of September 2020, Geophys. Res. Lett., 48, e2021GL092520, https://doi.org/10.1029/2021GL092520, 2021.
Abatzoglou, J. T., Kolden, C. A., Williams, A. P., Sadegh, M., Balch, J. K., and Hall, A.: Downslope Wind-Driven Fires in the Western United States, Earths Future, 11, e2022EF003471, https://doi.org/10.1029/2022EF003471, 2023.
Abatzoglou, J. T., Kolden, C. A., Cullen, A. C., Sadegh, M., Williams, E. L., Turco, M., and Jones, M. W.: Climate change has increased the odds of extreme regional forest fire years globally, Nat. Commun., 16, 6390, https://doi.org/10.1038/s41467-025-61608-1, 2025.
Alexander, M. E. and Cruz, M. G.: Crown fire dynamics in conifer forests, in: Synthesis of Knowledge of Extreme Fire Behavior, US Department of Agriculture, Forest Service, Pacific Northwest Research Station, general technical report PNW-GTR-854, 107–142, https://www.researchgate.net/publication/287678357_Crown_fire_dynamics_in_conifer_forests (last access: 23 April 2026), 2011.
Andela, N., Morton, D. C., Giglio, L., Chen, Y., van der Werf, G. R., Kasibhatla, P. S., DeFries, R. S., Collatz, G. J., Hantson, S., Kloster, S., Bachelet, D., Forrest, M., Lasslop, G., Li, F., Mangeon, S., Melton, J. R., Yue, C., and Randerson, J. T.: A human-driven decline in global burned area, Science, 356, 1356–1361, https://doi.org/10.1126/science.aal4108, 2017.
Andreae, M. O., Rosenfeld, D., Artaxo, P., Costa, A. A., Frank, G. P., Longo, K. M., and Silva-Dias, M. A. F.: Smoking rain clouds over the Amazon, Science, 303, 1337–1342, https://doi.org/10.1126/science.1092779, 2004.
Baek, S., Lim, J., and Kim, W.: Analysis on the Fire Progression and Severity Variation of the Massive Forest Fire Occurred in Uljin, Korea, 2022, Forests, 13, 2185, https://doi.org/10.3390/f13122185, 2022.
Birch, D. S., Morgan, P., Kolden, C. A., Abatzoglou, J. T., Dillon, G. K., Hudak, A. T., and Smith, A. M. S.: Vegetation, topography and daily weather influenced burn severity in central Idaho and western Montana forests, Ecosphere, 6, 17, https://doi.org/10.1890/Es14-00213.1, 2015.
Blanchard-Wrigglesworth, E., DeRepentigny, P., and Frierson, D. M. W.: Increasing boreal fires reduce future global warming and sea ice loss, P. Natl. Acad. Sci., 122, e2424614122, https://doi.org/10.1073/pnas.2424614122, 2025.
Bowman, D. M. J. S., Balch, J. K., Artaxo, P., Bond, W. J., Carlson, J. M., Cochrane, M. A., D'Antonio, C. M., DeFries, R. S., Doyle, J. C., Harrison, S. P., Johnston, F. H., Keeley, J. E., Krawchuk, M. A., Kull, C. A., Marston, J. B., Moritz, M. A., Prentice, I. C., Roos, C. I., Scott, A. C., Swetnam, T. W., van der Werf, G. R., and Pyne, S. J.: Fire in the Earth System, Science, 324, 481–484, https://doi.org/10.1126/science.1163886, 2009.
Canadell, J. G., Meyer, C. P., Cook, G. D., Dowdy, A., Briggs, P. R., Knauer, J., Pepler, A., and Haverd, V.: Multi-decadal increase of forest burned area in Australia is linked to climate change, Nat. Commun., 12, 6921, https://doi.org/10.1038/s41467-021-27225-4, 2021.
Chen, J. Y., Chen, H. W., Li, Z. Q., Wang, Q., Wang, G. Q., Jia, K., and Yan, X.: Divergent radiative forcing of fine-mode aerosols across tree genera during wildfires in North America and Europe, J. Hazard. Mater., 495, 138881, https://doi.org/10.1016/j.jhazmat.2025.138881, 2025.
Clarke, H., Di Giuseppe, F., Johnston, L., Marlon, J., Penman, T., Pitman, A. J., van der Werf, G. R., and Flannigan, M. D.: Gazing into the flames: A guide to assessing the impacts of climate change on landscape fire, Sci. Adv., 11, eadz2429, https://doi.org/10.1126/sciadv.adz2429, 2025.
Copernicus Climate Change Service: Fire danger indices historical data from the Copernicus Emergency Management Service, Copernicus Climate Change Service (C3S) Climate Data Store (CDS) [data set], https://doi.org/10.24381/cds.0e89c522, 2019.
Cunningham, C. X., Williamson, G. J., and Bowman, D. M. J. S.: Increasing frequency and intensity of the most extreme wildfires on Earth, Nat. Ecol. Evol., 8, 1420–1425, https://doi.org/10.1038/s41559-024-02452-2, 2024.
Dastour, H., Ahmed, M. R., and Hassan, Q. K.: Analysis of forest fire patterns and their relationship with climate variables in Alberta's natural subregions, Ecol. Inform., 80, 102531, https://doi.org/10.1016/j.ecoinf.2024.102531, 2024.
de Laat, A. T. J., Stein Zweers, D. C., Boers, R., and Tuinder, O. N. E.: A solar escalator: Observational evidence of the self-lifting of smoke and aerosols by absorption of solar radiation in the February 2009 Australian Black Saturday plume, J. Geophys. Res.-Atmos., 117, https://doi.org/10.1029/2011jd017016, 2012.
Duane, A., Castellnou, M., and Brotons, L.: Towards a comprehensive look at global drivers of novel extreme wildfire events, Climatic Change, 165, 43, https://doi.org/10.1007/s10584-021-03066-4, 2021.
Fan, H., Wang, Y., Zhao, C. F., Yang, Y. K., Yang, X. C., Sun, Y., and Jiang, S. Y.: The Role of Primary Emission and Transboundary Transport in the Air Quality Changes During and After the COVID-19 Lockdown in China, Geophys. Res. Lett., 48, e2020GL091065, https://doi.org/10.1029/2020GL091065, 2021.
Gatti, L. V., Basso, L. S., Miller, J. B., Gloor, M., Domingues, L. G., Cassol, H. L. G., Tejada, G., Aragao, L. E. O. C., Nobre, C., Peters, W., Marani, L., Arai, E., Sanches, A. H., Corrêa, S. M., Anderson, L., Von Randow, C., Correia, C. S. C., Crispim, S. P., and Neves, R. A. L.: Amazonia as a carbon source linked to deforestation and climate change, Nature, 595, 388, https://doi.org/10.1038/s41586-021-03629-6, 2021.
GEBCO Bathymetric Compilation Group: The GEBCO_2024 Grid – a continuous terrain model of the global oceans and land, NERC EDS British Oceanographic Data Centre NOC [data set], https://doi.org/10.5285/1c44ce99-0a0d-5f4f-e063-7086abc0ea0f, 2024.
Haines, D. A.: A lower atmospheric severity index for wildland fires, National Weather Digest, 13, 23–27, 1988.
Hamilton, D. S., Perron, M. M. G., Bond, T. C., Bowie, A. R., Buchholz, R. R., Guieu, C., Ito, A., Maenhaut, W., Myriokefalitakis, S., Olgun, N., Rathod, S. D., Schepanski, K., Tagliabue, A., Wagner, R., and Mahowald, N. M.: Earth, Wind, Fire, and Pollution: Aerosol Nutrient Sources and Impacts on Ocean Biogeochemistry, Annu. Rev. Mar. Sci., 14, 303–330, https://doi.org/10.1146/annurev-marine-031921-013612, 2022.
Harper, H. and Sandwell, D. T.: Global Predicted Bathymetry Using Neural Networks, Earth Space Sci., 11, e2023EA003199, https://doi.org/10.1029/2023EA003199, 2024.
Huang, Y. H., Jin, Y. F., Schwartz, M. W., and Thorne, J. H.: Intensified burn severity in California's northern coastal mountains by drier climatic condition, Environ. Res. Lett., 15, 104033, https://doi.org/10.1088/1748-9326/aba6af, 2020.
Jolly, W. M., Cochrane, M. A., Freeborn, P. H., Holden, Z. A., Brown, T. J., Williamson, G. J., and Bowman, D. M. J. S.: Climate-induced variations in global wildfire danger from 1979 to 2013, Nat. Commun., 6, 7537, https://doi.org/10.1038/ncomms8537, 2015.
Jones, M. W., Abatzoglou, J. T., Veraverbeke, S., Andela, N., Lasslop, G., Forkel, M., Smith, A. J. P., Burton, C., Betts, R. A., van der Werf, G. R., Sitch, S., Canadell, J. G., Santín, C., Kolden, C., Doerr, S. H., and Le Quéré, C.: Global and Regional Trends and Drivers of Fire Under Climate Change, Rev. Geophys., 60, e2020RG000726, https://doi.org/10.1029/2020RG000726, 2022.
Jones, M. W., Veraverbeke, S., Andela, N., Doerr, S. H., Kolden, C., Mataveli, G., Pettinari, M. L., Le Quéré, C., Rosan, T. M., van der Werf, G. R., van Wees, D., and Abatzoglou, J. T.: Global rise in forest fire emissions linked to climate change in the extratropics, Science, 386, eadl5889, https://doi.org/10.1126/science.adl5889, 2024.
Kaskaoutis, D. G., Kumar, S., Sharma, D., Singh, R. P., Kharol, S. K., Sharma, M., Singh, A. K., Singh, S., Singh, A., and Singh, D.: Effects of crop residue burning on aerosol properties, plume characteristics, and long-range transport over northern India, J. Geophys. Res.-Atmos., 119, 5424–5444, https://doi.org/10.1002/2013jd021357, 2014.
Keywood, M., Kanakidou, M., Stohl, A., Dentener, F., Grassi, G., Meyer, C. P., Torseth, K., Edwards, D., Thompson, A. M., Lohmann, U., and Burrows, J.: Fire in the Air: Biomass Burning Impacts in a Changing Climate, Crit. Rev. Env. Sci. Tec., 43, 40–83, https://doi.org/10.1080/10643389.2011.604248, 2013.
Kim, J., Kim, T., Lee, Y. E., and Im, S.: Spatial and temporal variability of forest fires in the Republic of Korea over 1991–2020, Nat. Hazards, 121, 9801–9821, https://doi.org/10.1007/s11069-025-07169-4, 2025.
Kirchmeier-Young, M. C., Malinina, E., Barber, Q. E., Perdomo, K. G., Curasi, S. R., Liang, Y. X., Jain, P., Gillett, N. P., Parisien, M. A., Cannon, A. J., Lima, A. R., Arora, V. K., Boulanger, Y., Melton, J. R., Van Vliet, L., and Zhang, X. B.: Human driven climate change increased the likelihood of the 2023 record area burned in Canada, Npj Climate and Atmospheric Science, 7, 316, https://doi.org/10.1038/s41612-024-00841-9, 2024.
Koren, I., Kaufman, Y. J., Remer, L. A., and Martins, J. V.: Measurement of the effect of Amazon smoke on inhibition of cloud formation, Science, 303, 1342–1345, https://doi.org/10.1126/science.1089424, 2004.
Kumar, S. and Kumar, A.: Hotspot and trend analysis of forest fires and its relation to climatic factors in the western Himalayas, Nat. Hazards, 114, 3529–3544, https://doi.org/10.1007/s11069-022-05530-5, 2022.
Lapola, D. M., Pinho, P., Barlow, J., Aragao, L. E. O. C., Berenguer, E., Carmenta, R., Liddy, H. M., Seixas, H., Silva, C. V. J., Silva-Junior, C. H. L., Alencar, A. A. C., Anderson, L. O., Armenteras, D., Brovkin, V., Calders, K., Chambers, J., Chini, L., Costa, M. H., Faria, B. L., Fearnside, P. M., Ferreira, J., Gatti, L., Gutierrez-Velez, V. H., Han, Z. G., Hibbard, K., Koven, C., Lawrence, P., Pongratz, J., Portela, B. T. T., Rounsevell, M., Ruane, A. C., Schaldach, R., da Silva, S. S., von Randow, C., and Walker, W. S.: The drivers and impacts of Amazon forest degradation, Science, 379, 349, https://doi.org/10.1126/science.abp8622, 2023.
Lau, K. M., Kim, M. K., and Kim, K. M.: Asian summer monsoon anomalies induced by aerosol direct forcing: the role of the Tibetan Plateau, Clim. Dynam., 26, 855–864, https://doi.org/10.1007/s00382-006-0114-z, 2006.
Li, Y. W., Dykema, J. A., Peterson, D. A., Feng, X., Shen, X. L., June, N. A., Fromm, M. D., McHardy, T. M., Jacquot, J. L., Pittman, J. V., Daube, B. C., Wofsy, S. C., Dean-Day, J., Rapp, A. D., Bowman, K. P., Cziczo, D. J., Mickley, L. J., Pierce, J. R., and Keutsch, F. N.: Enhanced radiative cooling by large aerosol particles from wildfire-driven thunderstorms, Sci. Adv., 11, eadw6526, https://doi.org/10.1126/sciadv.adw6526, 2025.
Lin, J., Shen, X., Xing, L., Che, H., and Holben, B. N.: Analysis of Aerosol Type and Fine- and Coarse-mode Aerosol Direct Radiative Forcing over Regions in East and Southeast Asia Based on AERONET Version 3 Data, Aerosol Air Qual. Res., 21, 200503, https://doi.org/10.4209/aaqr.200503, 2021.
Liu, G. Y., Li, J., Ying, T., Su, H. X., Huang, X., and Yu, Y.: Increasing Fire Weather Potential Over Northeast China Linked to Declining Bering Sea Ice, Geophys. Res. Lett., 50, e2023GL105931, https://doi.org/10.1029/2023GL105931, 2023.
Luo, N. A., Zhang, Y., Jiang, Y. Z., Zuo, C., Chen, J. Y., Zhao, W. J., Shi, W. Z., and Yan, X.: Unveiling global land fine- and coarse-mode aerosol dynamics from 2005 to 2020 using enhanced satellite-based monthly inversion data, Environ. Pollut., 348, 123838, https://doi.org/10.1016/j.envpol.2024.123838, 2024.
Ma, Q. H., Wei, L. Y., Wang, Y., Zhang, G. J., Zhou, X. L., and Wang, B.: Fire heat affects the impacts of wildfires on air pollution in the United States, Science, 389, 1137–1142, https://doi.org/10.1126/science.ads1957, 2025.
Ma, W., Feng, Z., Cheng, Z., Chen, S., and Wang, F.: Identifying Forest Fire Driving Factors and Related Impacts in China Using Random Forest Algorithm, Forests, https://doi.org/10.3390/f11050507, 2020.
Menon, S., Hansen, J., Nazarenko, L., and Luo, Y. F.: Climate effects of black carbon aerosols in China and India, Science, 297, 2250–2253, https://doi.org/10.1126/science.1075159, 2002.
Ohneiser, K., Ansmann, A., Witthuhn, J., Deneke, H., Chudnovsky, A., Walter, G., and Senf, F.: Self-lofting of wildfire smoke in the troposphere and stratosphere: simulations and space lidar observations, Atmos. Chem. Phys., 23, 2901–2925, https://doi.org/10.5194/acp-23-2901-2023, 2023.
Pan, Y. D., Birdsey, R. A., Fang, J. Y., Houghton, R., Kauppi, P. E., Kurz, W. A., Phillips, O. L., Shvidenko, A., Lewis, S. L., Canadell, J. G., Ciais, P., Jackson, R. B., Pacala, S. W., McGuire, A. D., Piao, S. L., Rautiainen, A., Sitch, S., and Hayes, D.: A Large and Persistent Carbon Sink in the World's Forests, Science, 333, 988–993, https://doi.org/10.1126/science.1201609, 2011.
Parisien, M. A., Barber, Q. E., Bourbonnais, M. L., Daniels, L. D., Flannigan, M. D., Gray, R. W., Hoffman, K. M., Jain, P., Stephens, S. L., Taylor, S. W., and Whitman, E.: Abrupt, climate-induced increase in wildfires in British Columbia since the mid-2000s, Commun. Earth Environ., 4, 309, https://doi.org/10.1038/s43247-023-00977-1, 2023.
Parks, S. A., Holsinger, L. M., Panunto, M. H., Jolly, W. M., Dobrowski, S. Z., and Dillon, G. K.: High-severity fire: evaluating its key drivers and mapping its probability across western US forests, Environ. Res. Lett., 13, 044037, https://doi.org/10.1088/1748-9326/aab791, 2018.
Pei, Q., Zhao, C., Yang, Y., Chen, A., Cong, Z., Wan, X., Zhang, H., and Wu, G.: Wildfires heat the middle troposphere over the Himalayas and Tibetan Plateau during the peak of fire season, Atmos. Chem. Phys., 25, 10443–10456, https://doi.org/10.5194/acp-25-10443-2025, 2025.
Pinto, M. M., DaCamara, C. C., Hurduc, A., Trigo, R. M., and Trigo, I. F.: Enhancing the fire weather index with atmospheric instability information, Environ. Res. Lett., 15, 0940b0947, https://doi.org/10.1088/1748-9326/ab9e22, 2020.
Qian, Y.: Burning questions on wildfire, Science, 389, 1086–1087, https://doi.org/10.1126/science.aea7430, 2025.
Rogeau, M. P. and Armstrong, G. W.: Quantifying the effect of elevation and aspect on fire return intervals in the Canadian Rocky Mountains, Forest Ecol. Manag., 384, 248–261, https://doi.org/10.1016/j.foreco.2016.10.035, 2017.
Santos, L. C., Lima, M. M., Bento, V. A., Nunes, S. A., DaCamara, C. C., Russo, A., Soares, P. M. M., and Trigo, R. M.: An Evaluation of the Atmospheric Instability Effect on Wildfire Danger Using ERA5 over the Iberian Peninsula, Fire, 6, 120, https://doi.org/10.3390/fire6030120, 2023.
Sharples, J. J., Mills, G. A., and McRae, R. H. D.: Extreme drying events in the Australian high-country and their implications for bushfire risk management, Aust. Meteorol. Ocean., 62, 157–169, https://doi.org/10.22499/2.6203.004, 2012.
Su, H. X., Yu, Y., Guo, W. D., and Mao, J. F.: Convective potential and fuel availability complement near-surface weather in regulating global wildfire activity, Sci. Adv., 11, eadp7765, https://doi.org/10.1126/sciadv.adp7765, 2025.
Tang, W. Y., Llort, J., Weis, J., Perron, M. M. G., Basart, S., Li, Z. C., Sathyendranath, S., Jackson, T., Rodriguez, E. S., Proemse, B. C., Bowie, A. R., Schallenberg, C., Strutton, P. G., Matear, R., and Cassar, N.: Widespread phytoplankton blooms triggered by 2019–2020 Australian wildfires, Nature, 597, 370, https://doi.org/10.1038/s41586-021-03805-8, 2021.
Tian, X. R., Zhao, F. J., Shu, L. F., and Wang, M. Y.: Distribution characteristics and the influence factors of forest fires in China, Forest Ecol. Manag., 310, 460–467, https://doi.org/10.1016/j.foreco.2013.08.025, 2013.
Van Wagner, C. E.: Development and structure of the Canadian Forest Fire Weather Index System, Canadian Forestry Service, Headquarters, Ottawa, https://ostrnrcan-dostrncan.canada.ca/handle/1845/228434(last access: 23 April 2026), 1987.
Veraverbeke, S., Rogers, B. M., Goulden, M. L., Jandt, R. R., Miller, C. E., Wiggins, E. B., and Randerson, J. T.: Lightning as a major driver of recent large fire years in North American boreal forests, Nat. Clim. Change, 7, 529, https://doi.org/10.1038/Nclimate3329, 2017.
Walker, X. J., Rogers, B. M., Veraverbeke, S., Johnstone, J. F., Baltzer, J. L., Barrett, K., Bourgeau-Chavez, L., Day, N. J., de Groot, W. J., Dieleman, C. M., Goetz, S., Hoy, E., Jenkins, L. K., Kane, E. S., Parisien, M. A., Potter, S., Schuur, E. A. G., Turetsky, M., Whitman, E., and Mack, M. C.: Fuel availability not fire weather controls boreal wildfire severity and carbon emissions, Nat. Clim. Change, 10, 1130–1136, https://doi.org/10.1038/s41558-020-00920-8, 2020.
Wang, B., Spessa, A. C., Feng, P. Y., Hou, X., Yue, C., Luo, J. J., Ciais, P., Waters, C., Cowie, A., Nolan, R. H., Nikonovas, T., Jin, H. D., Walshaw, H., Wei, J. H., Guo, X. W., Liu, D. L., and Yu, Q.: Extreme fire weather is the major driver of severe bushfires in southeast Australia, Sci. Bull., 67, 655–664, https://doi.org/10.1016/j.scib.2021.10.001, 2022a.
Wang, H., Jin, B., Zhang, K., Aktar, S., and Song, Z.: Effectiveness in Mitigating Forest Fire Ignition Sources: A Statistical Study Based on Fire Occurrence Data in China, Fire, https://doi.org/10.3390/fire5060215, 2022b.
Wang, W. W., Wang, X. L., Wu, W. L., Guo, F. T., Park, J. N., and Wang, G. Y.: Burn Severity in Canada's Mountain National Parks: Patterns, Drivers, and Predictions, Geophys. Res. Lett., 49, e2022GL097945, https://doi.org/10.1029/2022GL097945, 2022c.
Wang, W. W., Wang, X. L., Flannigan, M. D., Guindon, L., Swystun, T., Castellanos-Acuna, D., Wu, W. L., and Wang, G. Y.: Canadian forests are more conducive to high-severity fires in recent decades, Science, 387, 91, https://doi.org/10.1126/science.ado1006, 2025.
Ward, M., Tulloch, A. I. T., Radford, J. Q., Williams, B. A., Reside, A. E., Macdonald, S. L., Mayfield, H. J., Maron, M., Possingham, H. P., Vine, S. J., O'Connor, J. L., Massingham, E. J., Greenville, A. C., Woinarski, J. C. Z., Garnett, S. T., Lintermans, M., Scheele, B., Carwardine, J., Nimmo, D. G., Lindenmayer, D. B., Kooyman, R. M., Simmonds, J. S., Sonter, L. J., and Watson, J. E. M.: Impact of 2019–2020 mega-fires on Australian fauna habitat, Nat. Ecol. Evol., 4, 1321, https://doi.org/10.1038/s41559-020-1251-1, 2020.
Whitman, E., Parisien, M. A., Thompson, D. K., Hall, R. J., Skakun, R. S., and Flannigan, M. D.: Variability and drivers of burn severity in the northwestern Canadian boreal forest, Ecosphere, 9, e02128, https://doi.org/10.1002/ecs2.2128, 2018.
Xu, C. and You, C.: Climate-linked increasing vegetation fires in global high mountains, Ecography, 2022, e06527, https://doi.org/10.1111/ecog.06527, 2022.
Xu, R., Yu, Y., Meng, X. L., Xue, H. W., Zhao, C. F., and Lin, J. T.: Atmospheric Convection and Aerosol Absorption Boost Wildfire Smoke Injection, Geophys. Res. Lett., 52, e2025GL115989, https://doi.org/10.1029/2025GL115989, 2025.
Yan, X., Zuo, C., Li, Z. Q., Chen, H. W., Jiang, Y. Z., Wang, Q., Wang, G. Q., Jia, K., Yinglan, A., Chen, Z. Y., and Chen, J. Y.: Substantial Underestimation of Fine-Mode Aerosol Loading from Wildfires and Its Radiative Effects in Current Satellite-Based Retrievals over the United States, Environ. Sci. Technol., 58, 15661–15671, https://doi.org/10.1021/acs.est.4c02498, 2024.
Yang, X., Zhao, C., Yang, Y., and Fan, H.: Long-term multi-source data analysis about the characteristics of aerosol optical properties and types over Australia, Atmos. Chem. Phys., 21, 3803–3825, https://doi.org/10.5194/acp-21-3803-2021, 2021a.
Yang, X., Zhao, C., Yang, Y., Yan, X., and Fan, H.: Statistical aerosol properties associated with fire events from 2002 to 2019 and a case analysis in 2019 over Australia, Atmos. Chem. Phys., 21, 3833–3853, https://doi.org/10.5194/acp-21-3833-2021, 2021b.
Yang, X., Wang, Y., Zhao, C., Fan, H., Yang, Y., Chi, Y., Shen, L., and Yan, X.: Health risk and disease burden attributable to long-term global fine-mode particles, Chemosphere, 287, 132435, https://doi.org/10.1016/j.chemosphere.2021.132435, 2022.
Yang, X. C., Zhao, C. F., Zhao, W. J., Fan, H., and Yang, Y. K.: Characterization of global fire activity and its spatiotemporal patterns for different land cover types from 2001 to 2020, Environ. Res., 227, 115746,https://doi.org/10.1016/j.envres.2023.115746, 2023.
Yu, P. F., Toon, O. B., Bardeen, C. G., Zhu, Y. Q., Rosenlof, K. H., Portmann, R. W., Thornberry, T. D., Gao, R. S., Davis, S. M., Wolf, E. T., de Gouw, J., Peterson, D. A., Fromm, M. D., and Robock, A.: Black carbon lofts wildfire smoke high into the stratosphere to form a persistent plume, Science, 365, 587–590, https://doi.org/10.1126/science.aax1748, 2019.
Yu, Y. and Ginoux, P.: Enhanced dust emission following large wildfires due to vegetation disturbance, Nat. Geosci., 15, 878, https://doi.org/10.1038/s41561-022-01046-6, 2022.
Yu, Y., Mao, J. F., Thornton, P. E., Notaro, M., Wullschleger, S. D., Shi, X. Y., Hoffman, F. M., and Wang, Y. P.: Quantifying the drivers and predictability of seasonal changes in African fire, Nat. Commun., 11, https://doi.org/10.1038/s41467-020-16692-w, 2020.
Zhang, Q., Wang, Y. X. Z., Xiao, Q. Y., Geng, G. N., Davis, S. J., Liu, X. D., Yang, J., Liu, J. J., Huang, W. Y., He, C. P., Luo, B. H., Martin, R. V., Brauer, M., Randerson, J. T., and He, K. B.: Long-range PM pollution and health impacts from the 2023 Canadian wildfires, Nature, 645, 672–678, https://doi.org/10.1038/s41586-025-09482-1, 2025.
Zhao, J., Yue, C., Wang, J., Hantson, S., Wang, X., He, B., Li, G., Wang, L., Zhao, H., and Luyssaert, S.: Forest fire size amplifies postfire land surface warming, Nature, 633, 828–834, https://doi.org/10.1038/s41586-024-07918-8, 2024.
Zheng, B., Ciais, P., Chevallier, F., Chuvieco, E., Chen, Y., and Yang, H.: Increasing forest fire emissions despite the decline in global burned area, Sci. Adv., 7, eabh2646, https://doi.org/10.1126/sciadv.abh2646, 2021.