the Creative Commons Attribution 4.0 License.
the Creative Commons Attribution 4.0 License.
The radiative forcing of PM2.5 heavy pollution, its influencing factors and importance to precipitation during 2014–2023 in the Bohai Rim, China
Jun Zhu
Yingying Wang
Xiangao Xia
Xiaofei Lu
Chenguang Tian
Hong Liao
There were PM2.5 heavy pollution events in the Bohai Rim regions in China over the past decade, which can significantly affect radiative forcing (RF). However, the characteristics and influencing factors of RF on heavy pollution days, and its relative importance to precipitation remain unclear. This work combined ground-based and satellite observations and reanalysis data to investigate the RF characteristics of regional PM2.5 heavy pollution in the Bohai Rim regions during the fall and winter of 2014–2023. Additionally, the impact of meteorological vertical profiles on surface PM2.5 and pollution RF, and the importance of various factors to pollution RF and precipitation, were explored based on machine learning algorithms. The results showed that the RF on PM2.5 regional heavy pollution days can be up to approximately −70 Wm−2 at the surface, ±8 Wm−2 at top of atmosphere (TOA), and +80 Wm−2 in the atmosphere in clear-sky, with lower absolute values in all-sky. Low- to medium-altitude inversions of temperature (T) profiles in the boundary layer favored higher surface PM2.5 concentration, whereas isothermal stratification and medium- to high-altitude inversions corresponded to higher surface RF. Lower horizontal speeds and upward motion at low levels can induce higher surface PM2.5 and surface RF. Surface PM2.5 was the most important factor to surface and atmosphere RF in clear-sky, but V wind in high level (500 hPa) in all-sky. Moreover, pollution RFs in all-sky were as important as vertical winds to the total precipitation. Notably, there was considerable regional heterogeneity in the important factors affecting the RF and precipitation in the Bohai Rim regions.
- Article
(6950 KB) - Full-text XML
-
Supplement
(1377 KB) - BibTeX
- EndNote
-
The RF of PM2.5 heavy pollution in the Bohai Rim regions during 2014–2023 is analyzed;
-
The variations in PM2.5 and RF values under different temperature profiles are not consistent;
-
Pollution RFs in all-sky are as important as the vertical winds to the total precipitation;
-
There is regional heterogeneity in the important factors of RF and precipitation in the Bohai Rim.
PM2.5 heavy pollution can harm human health and reduce grain production (Shiraiwa et al., 2017; Tie et al., 2016). Besides, it can affect climate through aerosol-radiation and aerosol-cloud interactions (Zhang et al., 2015). In China, aerosol pollution in the Bohai Rim region (as one of China's most important economic zones) has drawn wide attention. PM2.5 pollution episodes were frequent and even severe around 2013 (Quan et al., 2014; Wang et al., 2014). Its concentration has been declined due to the in-depth implementation of China's emission reduction policies after that (Chen et al., 2024; Ji et al., 2023; Li et al., 2021; Wang et al., 2019). Nevertheless, PM2.5 heavy pollution days (daily PM2.5>150 µg m−3) still occur at some stations in recent years, especially during autumn and winter (Jin et al., 2022; Li et al., 2020; Song et al., 2022; Zhao et al., 2020). Influenced by diffusion and transport, such PM2.5 heavy pollution often exhibits regional characteristics (Jin et al., 2020; Zhang et al., 2019). Thus, regional variations in pollution are worthy of attention.
PM2.5 heavy pollution exhibits significant radiation effects, which have been extensively studied through either observational or modeling approaches (Elias et al., 2009; Kajino et al., 2017; Kumar et al., 2019; Sweerts et al., 2019). Observationally, research often focused on the radiative characteristics of heavy pollution at the station scale, such as measurements of aerosol optical depth (AOD), single scattering albedo (SSA), and other radiative properties (Jin et al., 2019; Li et al., 2018; Ma et al., 2019; Ren et al., 2022; Zheng et al., 2017). Studies on radiative forcing are generally conducted using models equipped with radiation modules (Che et al., 2014; Gao et al., 2014; Iftikhar et al., 2018; Jones et al., 1994; Luo et al., 2019; Park et al., 2001). A work indicated that the radiative forcing during an aerosol pollution episode at the surface in the Baltimore-Washington region reached up to −100 Wm−2 (Park et al., 2001). Some research has been conducted on the radiation effects of PM2.5 heavy pollution in the Bohai Rim region during pollution episodes in short periods (within 3–5 years) (Bi et al., 2014; Lin et al., 2022; Mao and Wan, 2022; Wen et al., 2020; Zhong et al., 2018b). A severe regional haze during 2013 over the west of the Bohai Sea exhibited strong negative radiative forcing (cooling) of −63 to −88 Wm−2 at the surface and strong positive radiative forcing (warming) of 57 to 82 Wm−2 in the atmosphere, with a slightly negative net radiative forcing of about −6 Wm−2 on the top of the atmosphere (Lin et al., 2022). However, research on the radiative forcing of heavy pollution in the Bohai Rim region during autumn and winter over the past decade remains limited.
The radiative forcing of heavy pollution is primarily influenced by aerosol concentration, composition, and vertical distribution (Ding et al., 2019; Haywood and Boucher, 2000; Mishra et al., 2015), while aerosols themselves are affected by factors such as emissions, chemical formation processes, and meteorological dispersion/transport (Calvo et al., 2013; Luo et al., 2003; Zhong et al., 2018a). Considerable research has focused on the impacts of emissions, chemical formation, and meteorological conditions on PM2.5 concentrations in the Bohai Rim region (Du et al., 2022; Ma et al., 2021). Regarding the contribution of meteorological conditions to aerosol pollution, studies combining observations and modeling approaches have demonstrated that synoptic patterns such as high-pressure systems, inversion temperature, weak winds, and southerly flows exacerbate heavy pollution episodes in the Beijing-Tianjin-Hebei region (the west of Bohai Sea) (Liu et al., 2019a; Song et al., 2025; Wu et al., 2018; Zhang et al., 2018). Numerous studies have applied machine learning and deep learning methods to predict surface PM2.5 concentrations by incorporating meteorological conditions (Chen et al., 2018; Kleine Deters et al., 2017; Peng et al., 2022; Wang and Sun, 2019; Zeng et al., 2021). Some work analyzed the impact of meteorological parameters on aerosol radiative properties (such as AOD) (Che et al., 2019; Khoshsima et al., 2014; Tiwari et al., 2015). Nevertheless, the influence of meteorological conditions on the radiative forcing of heavy pollution remains inadequately explored. Particularly, the impacts of the structural characteristics of thermal (temperature) and dynamical (wind) factors across vertical profiles on aerosol pollution-induced radiative forcing have received less attention.
Aerosol radiative forcing can vary somewhat between clear-sky and cloudy (all-sky) conditions (Kim and Ramanathan, 2008). Its radiative effect in cloudy conditions affects precipitation at the same time (Huang et al., 2016; López-Romero et al., 2021; Qian et al., 2009; Stier et al., 2024; Tao et al., 2012; Zhao et al., 2024). Under high pollution conditions, the frequency of heavy rain increases while the frequency of light rain decreases (Liu et al., 2019b). In East China, it was found that the increase of aerosol will obviously increase the precipitation frequency when low aerosol loading, but the excessive aerosol suppresses the precipitation frequency when high aerosol loading in some regions (Sun et al., 2022). Around the Bohai Sea region, aerosol pollution is positively correlated with convective precipitation during autumn and winter (Xiao et al., 2022), and aerosols enhance both warm-topped and cold-topped rain during the warm seasons (Li et al., 2025). In Bohai Rim, PM2.5 heavy pollution days still occurred in the past decade and exhibit radiation effects, while there is a lack of understanding of the relative importance of aerosol radiative effects and thermal (temperature) and dynamical (wind) meteorological conditions on daily precipitation.
In the overview, we find that the following issues exist: (1) What are the characteristics of heavy pollution radiative forcing in the Bohai Sea region during the fall and winter over the past ten years? (2) How are the influences of thermal (temperature) and dynamical (wind) type changes at vertical height in the radiative forcing of heavy pollution in the Bohai Rim region during fall and winter? And what are the most important factors influencing the heavy pollution radiative forcing in combination with the surface PM2.5 concentration? (3) What is the relative importance of heavy pollution radiative forcing and meteorological factors (thermal and dynamical factors) on daily precipitation? To address the above questions, this work combines ground-based and satellite observations and reanalysis data to investigate the pollution and radiation characteristics of regional PM2.5 heavy pollution days in the Bohai Rim regions during the fall and winter of 2014–2023, and uses machine learning methods to analyze the effects of type variations in meteorological parameters (thermal and dynamical factors) at vertical heights on the heavy pollution radiative forcing, to explore the importance of their influencing factors, and to reveal the importance of pollution radiative forcing on daily total precipitation in the Bohai Rim region during the fall and winter of 2014–2023. Therefore, the primary objective of this work is to reveal the heavy pollution radiative forcing in the Bohai Rim region and the impact of meteorological parameters (temperature and wind) at vertical heights on the heavy pollution radiative forcing. The secondary objective is to explore the importance of factors to pollution RF and precipitation on regional heavy pollution days.
2.1 Study region and ground-based stations
The study area is within 37–41° N and 116–123° E (comprising the Bohai Sea and its bay area), and the 11 ground-based stations located at the Bohai Rim region were selected based on the location and quantitative balance, which was separated into the following subregions: the west of the Bohai Sea including the Beijing-Langfang-Tianjin stations on approximately a line (BLT, 116–118° E and 38.5–40.5° N), the north of the Bohai Sea (NB, 118–123° E and 38.5–41° N), and the south of the Bohai Sea (SB, 116.5–123° E and 37–38.5° N), with the same number of stations in the NB and SB regions. The specific study regions and locations of the 11 stations are shown in Fig. 1 and Table S1 in the Supplement. All of the 11 stations are city stations. The BLT region includes three stations of Beijing (BJ), Langfang (LF), and Tianjin (TJ). Tangshan (TS), Qinghuangdao (QHD), Huludao (HLD), and Dalian (DL) are located in the NB region. Stations in the SB region are Cangzhou (CZ), Dongying (DY), Yantai (YT), and Weihai (WH).
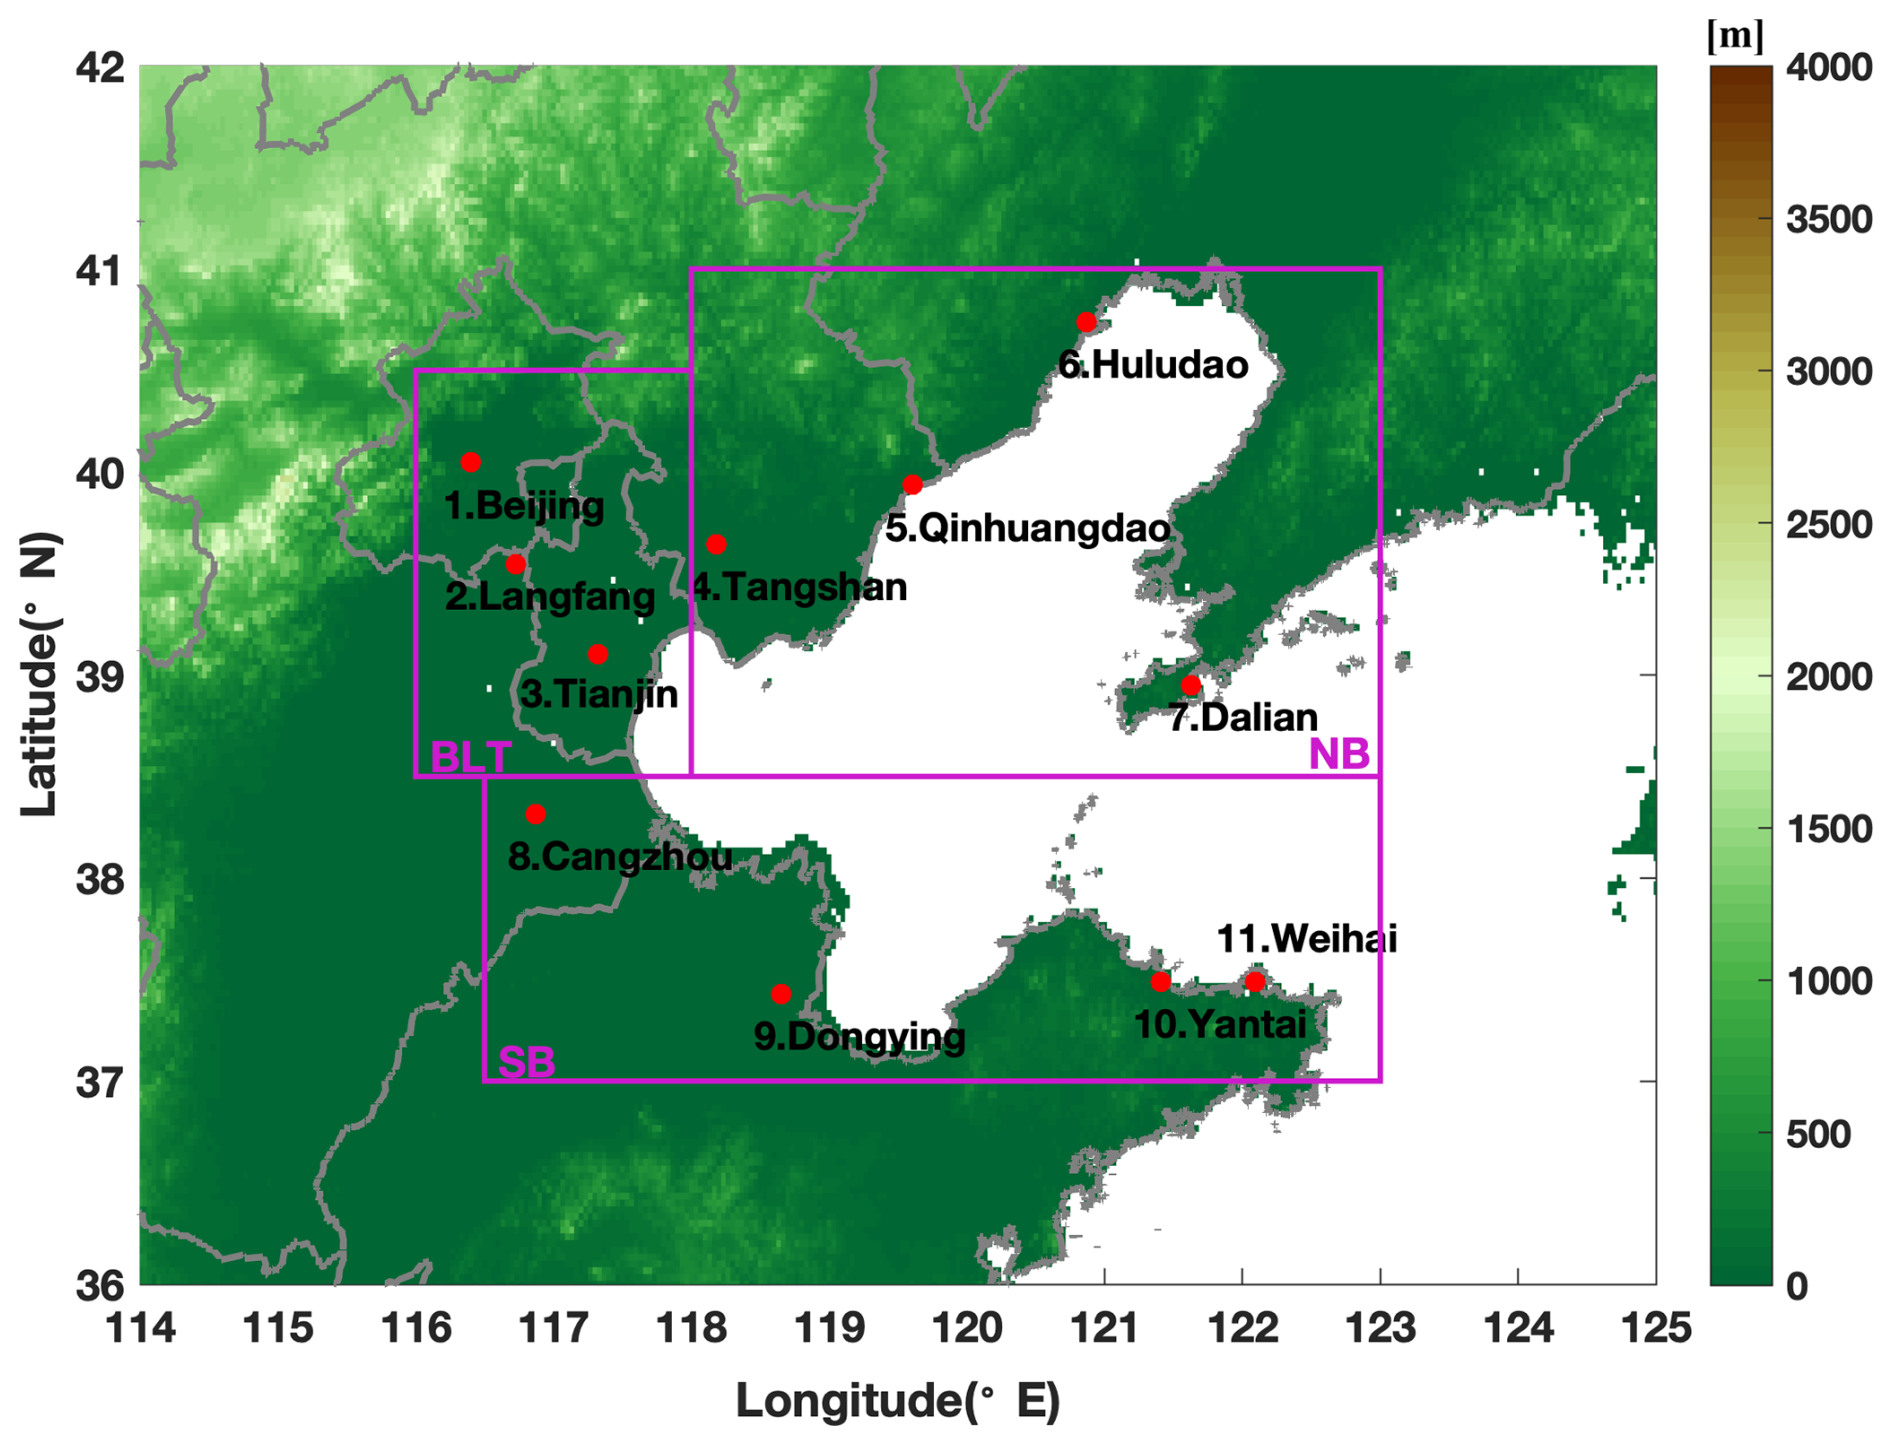
Figure 1Topography of the study area and the 11 ground-based stations located at the Bohai Rim, which are separated into three regions: the west of the Bohai Sea (BLT), north of the Bohai Sea (NB), and south of the Bohai Sea (SB).
2.2 Ground-observed PM2.5 and satellite CERES radiation products
The ground-observed PM2.5 concentrations at the 11 stations were from China's Ministry of Ecology and Environment (CMEE, http://www.cnemc.cn/sssj/, last access: 10 April 2026) in the Bohai Rim. Every station included at least 3–4 observational sites, and the values of all sites in a station were averaged to represent the station. Past studies have shown that the data from the CMEE stations fit Benford's Law and were highly consistent with the data measured by the U.S. Embassy in China since 2013 (Liang et al., 2016; Stoerk, 2016). We used daily concentrations of PM2.5 (averaged by hourly values) at the 11 stations in the study regions during autumn and winter (9–12 and 1–2 months) from 2014–2023 to show the pollution characteristics and to explore the heavy PM2.5 pollution day (daily PM2.5>150 µgm−3) at stations and in the study regions.
The Satellite CERES radiation products (http://ceres.larc.nasa.gov last access: 10 April 2026) were used to illustrate the radiative forcing (RF) on regional heavy polluted days. The CERES Edition 4.1 Synoptic 1° (CERES-SYN1deg) product is a level-3 product at 1°×1° spatial resolution. CERES-SYN1deg provides hourly gridded observed top of atmosphere (TOA) fluxes and computed surface fluxes from the Fu-Liou radiative transfer model, which is suitable for regional diurnal and process studies. The CERES-SYN1deg products have been validated by other measurements (Doelling et al., 2016; Fillmore et al., 2022; Rutan et al., 2015). This work focuses on the aerosol radiative forcing on the heavy PM2.5 pollution day during autumn and winter by using the daily net shortwave radiative flux at the TOA and ground surface from the CERES_SYN1deg-Day_Terra-Aqua-MODIS_Ed4.1 product over the study region. The differences between CERES net radiative fluxes on regional heavy pollution days and the mean of clean days for all stations were used to reflect the radiative forcing (RF) of PM2.5 regional heavy pollution days (abbreviated as pollution RF). The RF in the atmosphere was calculated by the difference of that at the TOA and the surface.
2.3 Reanalysis data TAP and ERA-5
The TAP (http://tapdata.org, last access: 10 April 2026) dataset was developed at Tsinghua University as a cooperative effort among several institutions and teams (Geng et al., 2021). The TAP data are generated based on the combination of multisource data, including ground measurements, satellite aerosol optical parameter retrievals, model simulations, meteorology field, and land use information, as well as population and elevation data, by multilayer machine learning models. The TAP PM2.5 is estimated based on a two-stage machine learning model coupled with the synthetic minority oversampling technique and a tree-based gap-filling method, which improves the PM2.5 estimations on highly polluted days. The TAP PM2.5 showed a higher regression slope (0.97) when evaluated against ground measurements (Geng et al., 2021). The daily PM2.5 data for China with a 10 km resolution (2014–2023) from TAP were used in this study to explore the importance of surface PM2.5 to the pollution RF and daily total precipitation over study regions.
The European Centre for Medium-Range Weather Forecasts (ECMWF) produces global numerical weather predictions for members and cooperating states and reanalysis data for a broader community (Hoffmann et al., 2019). The fifth-generation ECMWF atmospheric reanalysis system (ERA-5) provides hourly wind fields on a 0.25°×0.25° latitude/longitude grid (Hersbach et al., 2020). The profiles of temperature (T) and three wind components (U, V, and W) were used to study the impact of the types of meteorological profiles below 850 hPa on surface PM2.5 and RF on regional heavy pollution days by the k-means classification method. The temperature and three wind components below 850 hPa can reflect thermal, horizontal, and vertical diffusion in the boundary layer. Besides, the temperature and three wind components at four levels (500, 700, 850, and 1000 hPa) were used to explore the importance of factors to pollution RF and precipitation on regional heavy pollution days by machine learning algorithms. The four levels of temperature and winds can reflect transportation in the middle and upper troposphere (700–500 hPa) and boundary layer diffusion (1000–850 hPa).
2.4 Methodology
2.4.1 k-means clustering method
We classified the T and wind components profiles in the boundary layer (below 850 hPa) adopting the k-means clustering method (Lloyd, 1982). K-means clustering is an unsupervised machine learning algorithm used to partition a dataset into distinct groups or clusters, and popular in a wide variety of applications due to its simplicity, efficiency and effectiveness. Through calculation, there were 161 d of regional PM2.5 heavy pollution days in the study regions, which is shown in the next section. Then, the profiles at the 11 stations in Bohai Rim on the 161 regional heavy polluted days are used to cluster (the number of samples is 11×161). We use the k-means algorithm for cluster center initialization and the squared Euclidean distance to measure the similarity to the centroid. We selected the numbers of clusters (2–8) for classification of T, and then combined the elbow method (the corner of the Sum Square Error, shown in Fig. S1 in the Supplement) and the representativity of T profiles to determine the last number of clusters (=5 in this study). The numbers of horizontal and vertical wind component clusters (also 5 clusters) were selected along the T clustering.
2.4.2 Importance estimation based on Random Forest algorithms
We used the Random Forest algorithm to compare and rank the importance of various factors to pollution RF and daily total precipitation. The variable factors concerned in this study were PM2.5, T, and 3 wind components at four levels (500, 700, 850, and 1000 hPa). The Random Forest method is a popular ensemble learning technique that combines multiple decision trees to improve prediction accuracy and reduce overfitting (Breiman, 2001). In addition, it performs excellently for evaluating the independent variables' importance (Cutler et al., 2007). This study mainly used the “out-of-bag” observations method (Archer and Kimes, 2008) in the Random Forest regression model to calculate the importances of variables. Out-of-bag predictor importance estimates by permutation measure how influential the model's predictor variables are at predicting the response. Thus, the larger the calculated value, the greater its importance. For the random forest model training, this study employed a widely used 10-fold cross-validation (CV) method. Through repeated tests, we obtained the optimal hyperparameter of the number of trees from 20 to 100 for different prediction variables in each grid and the number of leaf used the default of 5. The coefficient of determination (R2), root mean square error (RMSE) and mean absolute error (MAE) were used to evaluate the model performance, which was shown in Table S2.
2.4.3 The data usage workflow
Figure 2 exhibited the data usage workflow and framework in this work. The CMEE PM2.5 data at sites and CERES net radiation flux data were used to show the characteristics of PM2.5 and RF on regional heavy pollution days (RHPD) in the Bohai Rim. To explore the characteristics of regional pollution around the Bohai Sea, we identified regional PM2.5 heavy pollution events with multiple stations experiencing PM2.5 heavy pollution on the same days. For each region, a heavy pollution day was defined as when more than half of the stations within the region were heavily polluted. The regional clean day is defined as the day with all stations PM2.5<75 µg m−3 within the study area. This threshold is based on the China National Ambient Air Quality Standards for PM2.5 in 2012.
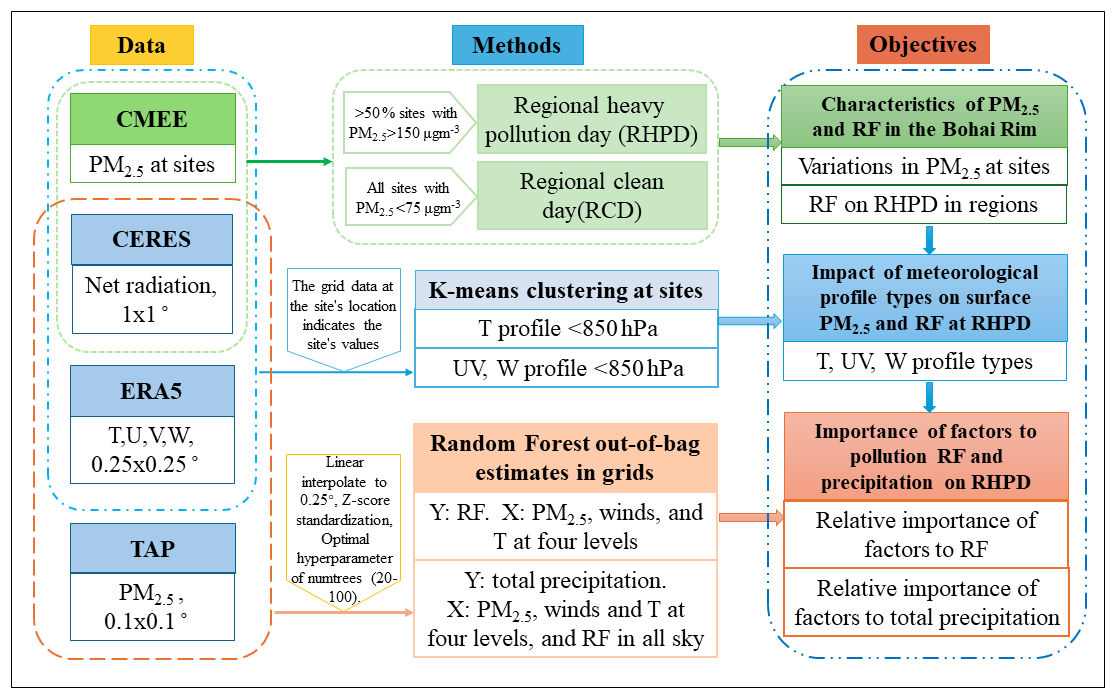
Subsequently, CMEE, CERES, and ERA5 data were combined to analyze the impact of meteorological profile types (temperature and winds) on surface PM2.5 and RF on regional heavy pollution days by using the k-means clustering method at the stations. The RF and meteorological parameters at stations were extracted from grid data of CERES and ERA5, respectively. The extracting method is that the grid data at the site's location indicates the site's values. For the k-means clustering, we clustered the T, horizontal, and vertical winds separately to capture variations in the height of temperature inversion layers and to reveal the relative importance of temperature and wind profile variations below 850 hPa on PM2.5 and RF. The clustering of combined T and winds by the k-means method failed to capture the temperature inversion layers, and could not reveal the relative importance (see Figs. S2 and S3). Since we cluster based on separate parameters in the boundary, the standardization before clustering becomes unnecessary, as standardized and unstandardized results are essentially consistent (see Fig. S4).
To explore the relative importance of factors to pollution RF and precipitation on regional heavy pollution days in the Bohai regions, the gridded data of CERES, ERA-5, and TAP were jointly applied to the random forest algorithm. Due to the differences in the spatial resolution of PM2.5 (from TAP), meteorological parameters (from ERA-5) and radiation data (from CERES), all data needed to be interpolated to a uniform resolution prior to machine learning training. All datasets were interpolated to the resolution of the ERA-5 dataset: 0.25°×0.25°. The CERES radiation data (originally at 1° resolution) were interpolated to 0.25° using a linear interpolation method. Similarly, the TAP PM2.5 data (with resolutions of 10 km or 0.1°) were also interpolated to 0.25° using linear interpolation. However, before the interpolation, NaN values in the TAP dataset (corresponding to ocean areas) were set to zero, and grid points adjacent to land with zero values were replaced with values from the nearest terrestrial grid points. This assumption is reasonable given the lower anthropogenic emissions over the ocean compared to land areas. A comparison between the interpolated data and the original data is provided in Fig. S5. The spatial distributions of the interpolated and original datasets are generally consistent, with minor discrepancies observed only at a few grid points exhibiting abrupt value changes. Since the results of this study primarily focus on regional averages, the errors introduced at a limited number of grid points have less impact on the regional mean outcomes. Given the disparate units and scales of the input variables, we used the Z-Score method to standardize the input variables before the random forest training.
3.1 Characteristics of PM2.5 heavy pollution in the Bohai Rim
3.1.1 Variations in ground-based PM2.5 at stations and regions
The statistical characteristics of PM2.5 concentrations at the regions and stations in the Bohai Rim during autumn and winter from 2014 to 2023 are shown in Fig. 3. The average PM2.5 concentration at all 11 stations around the Bohai Rim during the study period was 52.80±45.34 µg m−3, showing a slightly higher value than that of about 50 µg m−3 in the Yangtze River Delta and 45–48 µg m−3 in the Pearl River Delta of China's economic regions (Hou et al., 2019; Tao et al., 2017). Regionally, the mean daily PM2.5 concentrations were 60.97, 49.90, and 49.57 µg m−3 in the BLT, NB, and SB regions, respectively (i.e., BLT > NB > SB). Among these stations, Cangzhou (the westernmost station in the SB region) experienced the highest mean PM2.5 concentration (68.11±51.68 µg m−3). In contrast, Weihai station (30.57±26.12 µg m−3), also in the SB but easternmost, showed the lowest PM2.5 concentration. In general, although the mean PM2.5 concentration in the NB region was slightly higher than that in the SB, there were no significant north-south differences in Bohai Rim. However, a clear east-west gradient was observed in Bohai Rim, with the western part experiencing more aerosol pollution than the eastern area.
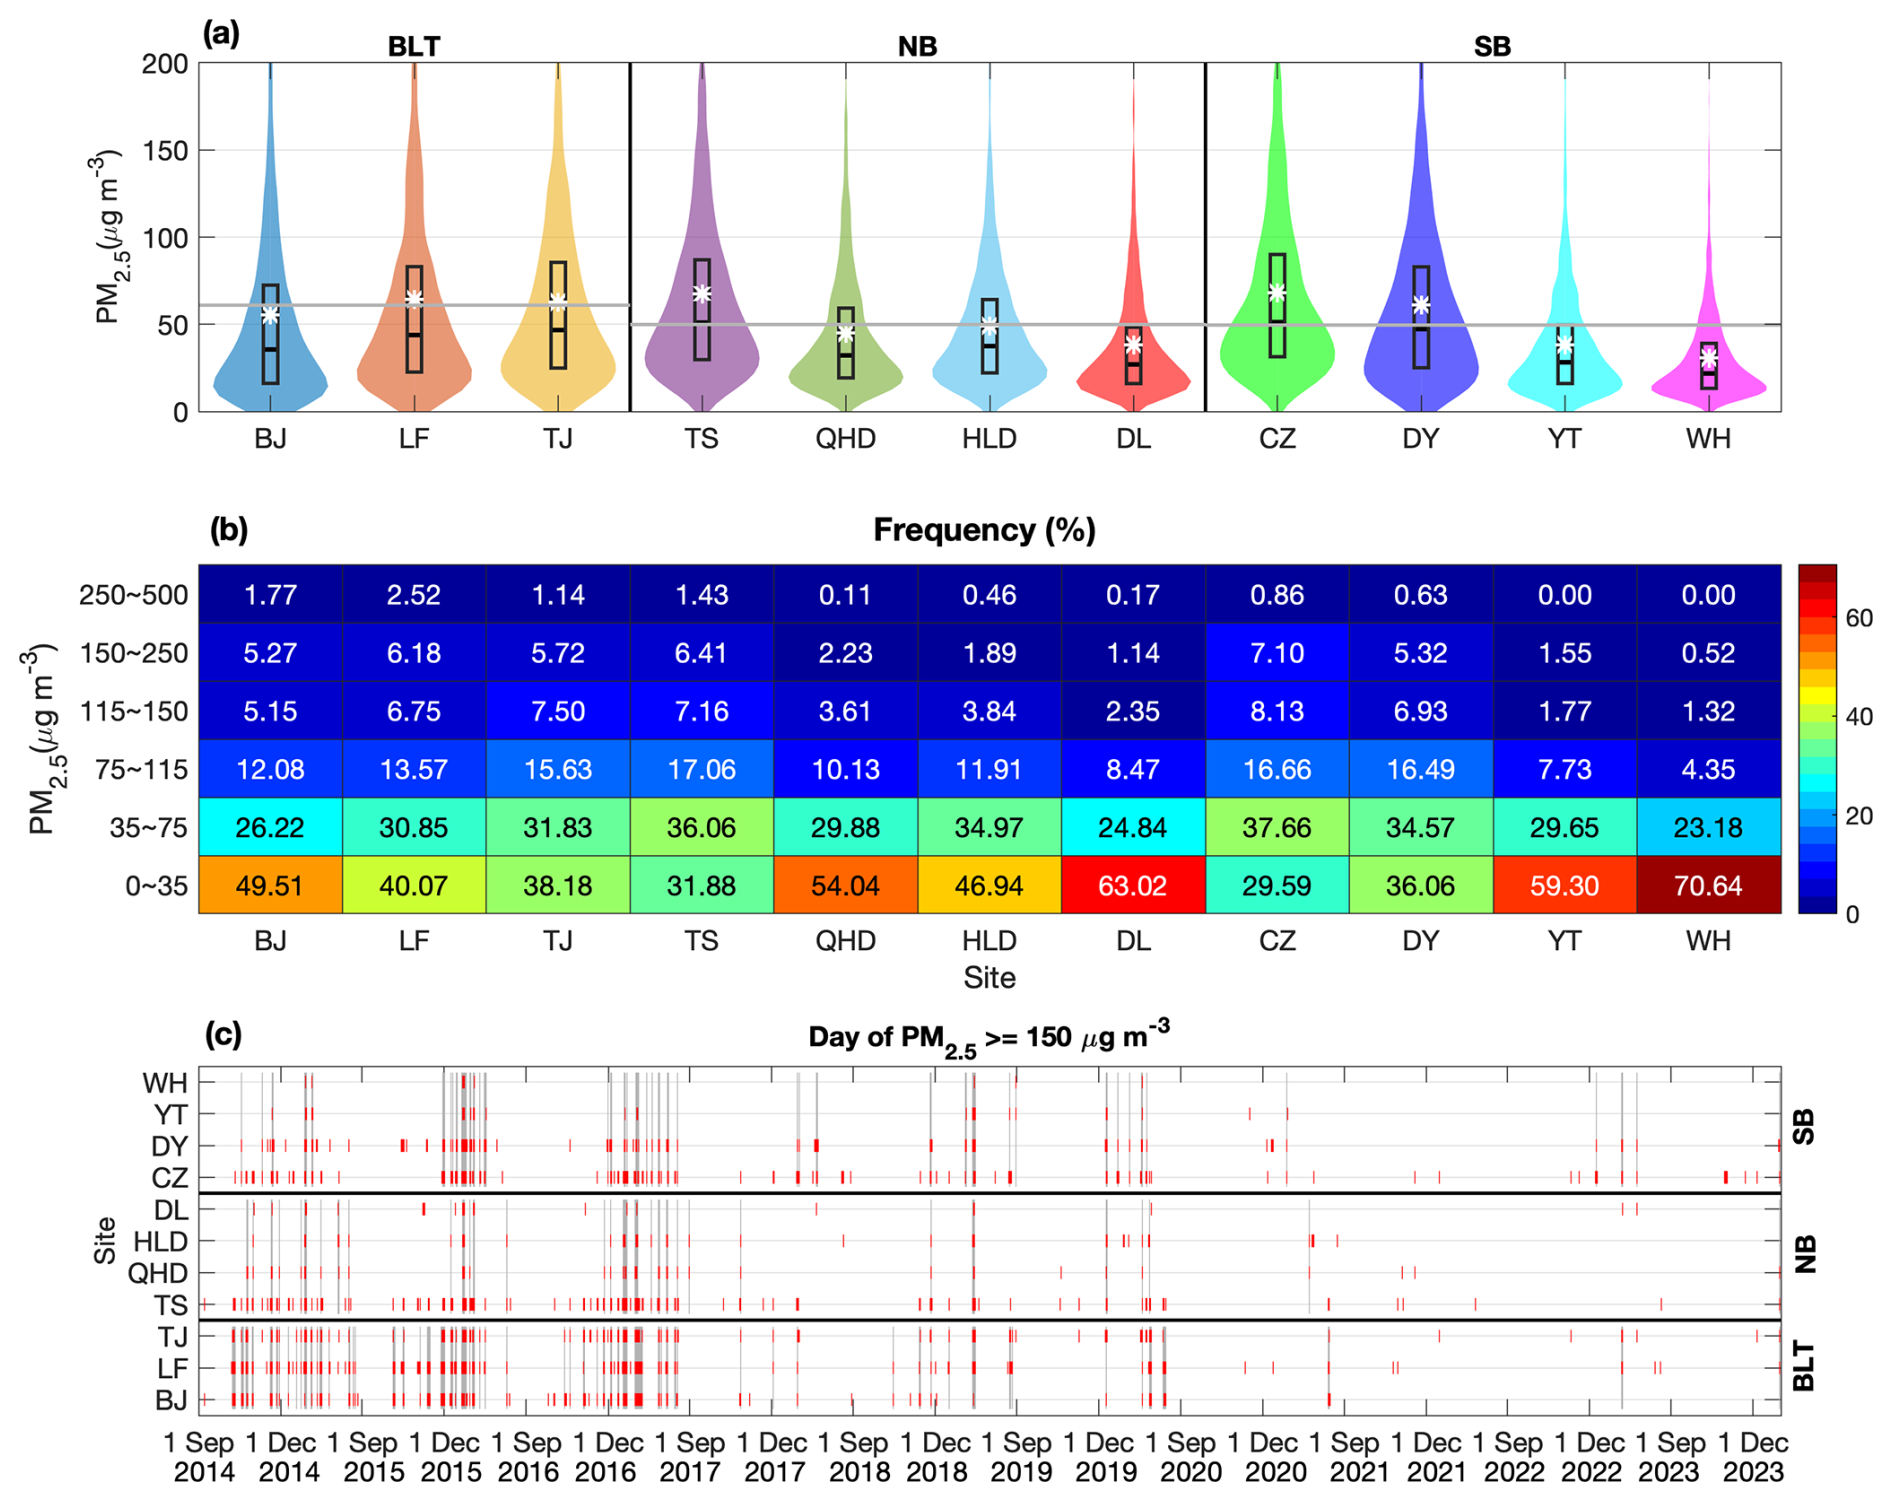
Figure 3The statistics of PM2.5 concentration at the stations in the Bohai Rim in autumn and winter during 2014–2023: (a) Violin plot of daily PM2.5, the mean PM2.5 (white asterisk) at sites and subregions (gray line); (b) Frequency distribution of PM2.5 at stations; (c) The heavy pollution day at each station (red) and for each region (gray).
According to the China National Ambient Air Quality Standards for PM2.5 in 2012 (GB3095–2012 and HJ 633–2012), we calculated the frequencies of PM2.5 concentrations at different levels during autumn and winter from 2014–2023 (Fig. 3b). All stations experienced heavy pollution days (daily PM2.5>150 µg m−3), with the highest frequency at Langfang (8.70 %) and lowest at Weihai (0.52 %). But not all stations experienced severe pollution days (daily PM2.5>250 µg m−3), such as Yantai and Weihai stations in the SB region. The frequencies of heavy pollution days were 6.87 %–8.70 % in BLT, 1.32 %–7.84 % in NB, and 0.52 %–7.96 % in the SB region. The BLT region (the west of Bohai Sea) experienced relatively balanced heavy pollution days, whereas the NB and SB regions exhibited higher frequencies of heavy pollution days at western stations but lower frequencies at eastern stations, indicating the western area suffered more aerosol heavy pollution than the eastern area in the Bohai Rim.
Figure 3c shows the heavy pollution days for stations and regions. There were 130, 51, and 74 d with daily PM2.5 reaching heavy pollution levels in the BLT, NB, and SB regions, respectively. The BLT region exhibited the most of heavy pollution days, and its periods of pollution often coincided with the other two regions, suggesting the possible transport of air pollution through BLT to the other two regions. In total, there were 161 d of regional heavy pollution during autumn and winter in 2014–2023, with a significant decrease from 2017 and even zero in 2021 and 2023. The decreased trend of regional heavy pollution can be attributed to China's air pollution control policies implemented from 2013, as well as the effect of the COVID-19 epidemic beginning in 2019.
3.1.2 Radiative forcing of regional heavy pollution in the Bohai Rim regions
Radiative forcing (RF) is a widely used parameter for measuring impacts on climate. Aerosol radiative forcing refers to the effect of anthropogenic aerosols on radiative fluxes at the surface and at the top of the atmosphere (TOA), as well as in the atmosphere. Figure 4 illustrates the short-wave RF on regional PM2.5 heavy pollution days at the surface and TOA, as well as in the atmosphere for clear-sky and all-sky in the three study regions. The results showed that regional PM2.5 heavy pollution reduced net shortwave radiation reaching the surface, increased the net radiation in the atmosphere, and caused radiative perturbations at the TOA in the study regions. These findings agreed with previous research (Park et al. 2001; Lin et al. 2022). However, our work showed notable regional heterogeneity. At the surface, RF can be up to −70 Wm−2 in clear-sky, and relatively lower at −55 Wm−2 in all-sky, with the largest impact in the NB region. At the TOA, pollution-induced RF is negative in most parts of the BLT and SB regions with values up to Wm−2, but positive in most of the NB region (up to Wm−2), as the positive and negative regions are mainly reflected in the sea and land. Within the atmosphere, the values of pollution RF can reach +80 Wm−2 in clear-sky and +60 Wm−2 in all-sky, with also the largest impact in the NB region, followed by the BLT region. The RF values in clear-sky were higher than those in all-sky, which may be explained by the effect of clouds. The regional variations showed high values in the NB region, which did not agree with PM2.5 concentrations in the three regions (Fig. 3a). This discrepancy may be related to the aerosol vertical profiles, aerosol composition, and even the diffusion and transport of aerosols. For instance, the longer heating season in the NB region may result in higher emissions of absorbing aerosols (such as black carbon), leading to a stronger atmospheric heating effect per unit aerosol mass. Besides, aerosols concentrated at higher altitudes over the ocean due to the regional transport may increase their radiative efficiency due to altered surface-atmosphere interactions. The impacts of diffusion and transport factors are analyzed in the following sections.
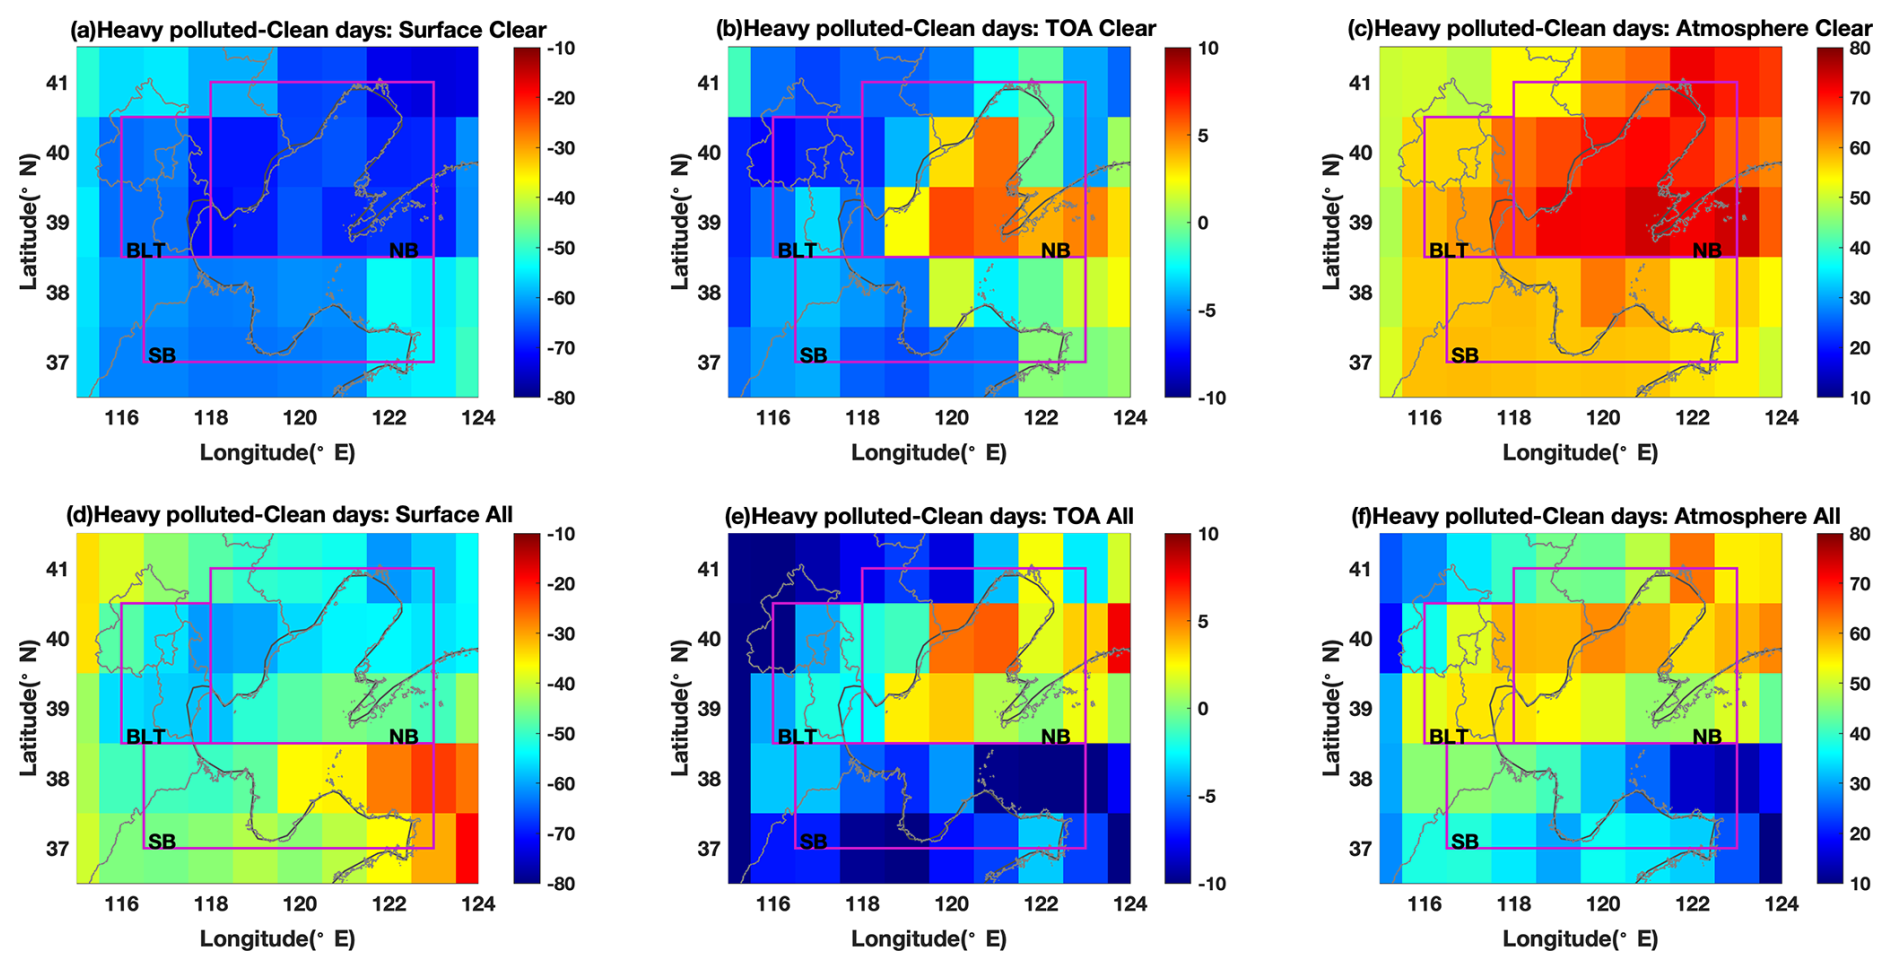
Figure 4The short-wave radiative forcing (Wm−2) on regional PM2.5 heavy pollution days calculated from the difference between CERES net radiative fluxes on regional heavy pollution days and the mean of clean days for all stations: (a, d) at the surface; (b, e) at the top of atmosphere (TOA); (c, f) in the atmosphere, in clear sky (a–c) and all sky (d–f).
3.2 Impact of meteorological profiles on surface PM2.5 and RF at regional heavy pollution days
This section intends to explore the impact of temperature (T) and wind vertical profile types in the Bohai Rim regions on surface PM2.5 concentration and RF during the regional heavy pollution days using stational statistics. Since the boundary layer is the key level for pollution diffusion and transport, the clustering of T and wind vertical profiles is based on meteorological parameters below 850 hPa. For the wind profiles, we take into account the clustering of horizontal wind components (U and V) and the vertical wind component (W).
3.2.1 Effect of temperature profile types
The T clusters and their statistics of stations, PM2.5, and RF are shown in Fig. 5. The five T types in Fig. 5a can represent three temperature stratifications (decreasing stratification-T_C1, decreasing with isothermal stratification-T_C2, and inversion stratification-T_C3-5) and the inversion layers at different altitudes (low-altitude inversion-T_C3, mid-altitude inversion-T_C4, and upper-altitude inversion-T_C5). The decreasing stratification type T_C1 occurred most frequently (>50 %) at all stations, followed by T_C2 and T_C3 (5 %–20 %) (Fig. 5b). T_C5 was the least at most stations, except for Qinhuangdao and Huludao, where the lowest frequency was the T_C4 type. The comparison of proportions of different temperature profile types on all days, regional clean days, and regional heavy pollution days in the study period (Fig. S6) showed clearly that the proportion of temperature inversions occurring on regional heavy pollution days was significantly higher than that on regional clean days, and also exceeded the proportion across all days, indicating the significant role of temperature inversions on regional heavy pollution days. The PM2.5 concentrations at different T types in Fig. 5c exhibited notable variations, with low values at T_C1-2 (decreasing stratification and with isothermal stratification) and relatively high values at inversion stratifications T_C3-5. For the altitude of inversion, PM2.5 concentrations at T_C3 and C4 were higher than at T_C5, indicating that low- to medium-altitude inversions are more conducive to aerosol heavy pollution than the high-altitude inversion. The finding of low-altitude inversion favorable to air pollution is consistent with the past studies (Sun et al., 2025; Wolf et al., 2014; Xiang et al., 2019). However, this effect of T inversion did not occur at all regions in the Bohai Rim, as the BLT region showed lower PM2.5 at T_C5. This could be related to the aerosol emissions and the lower frequency of T_C5 in the BLT region.
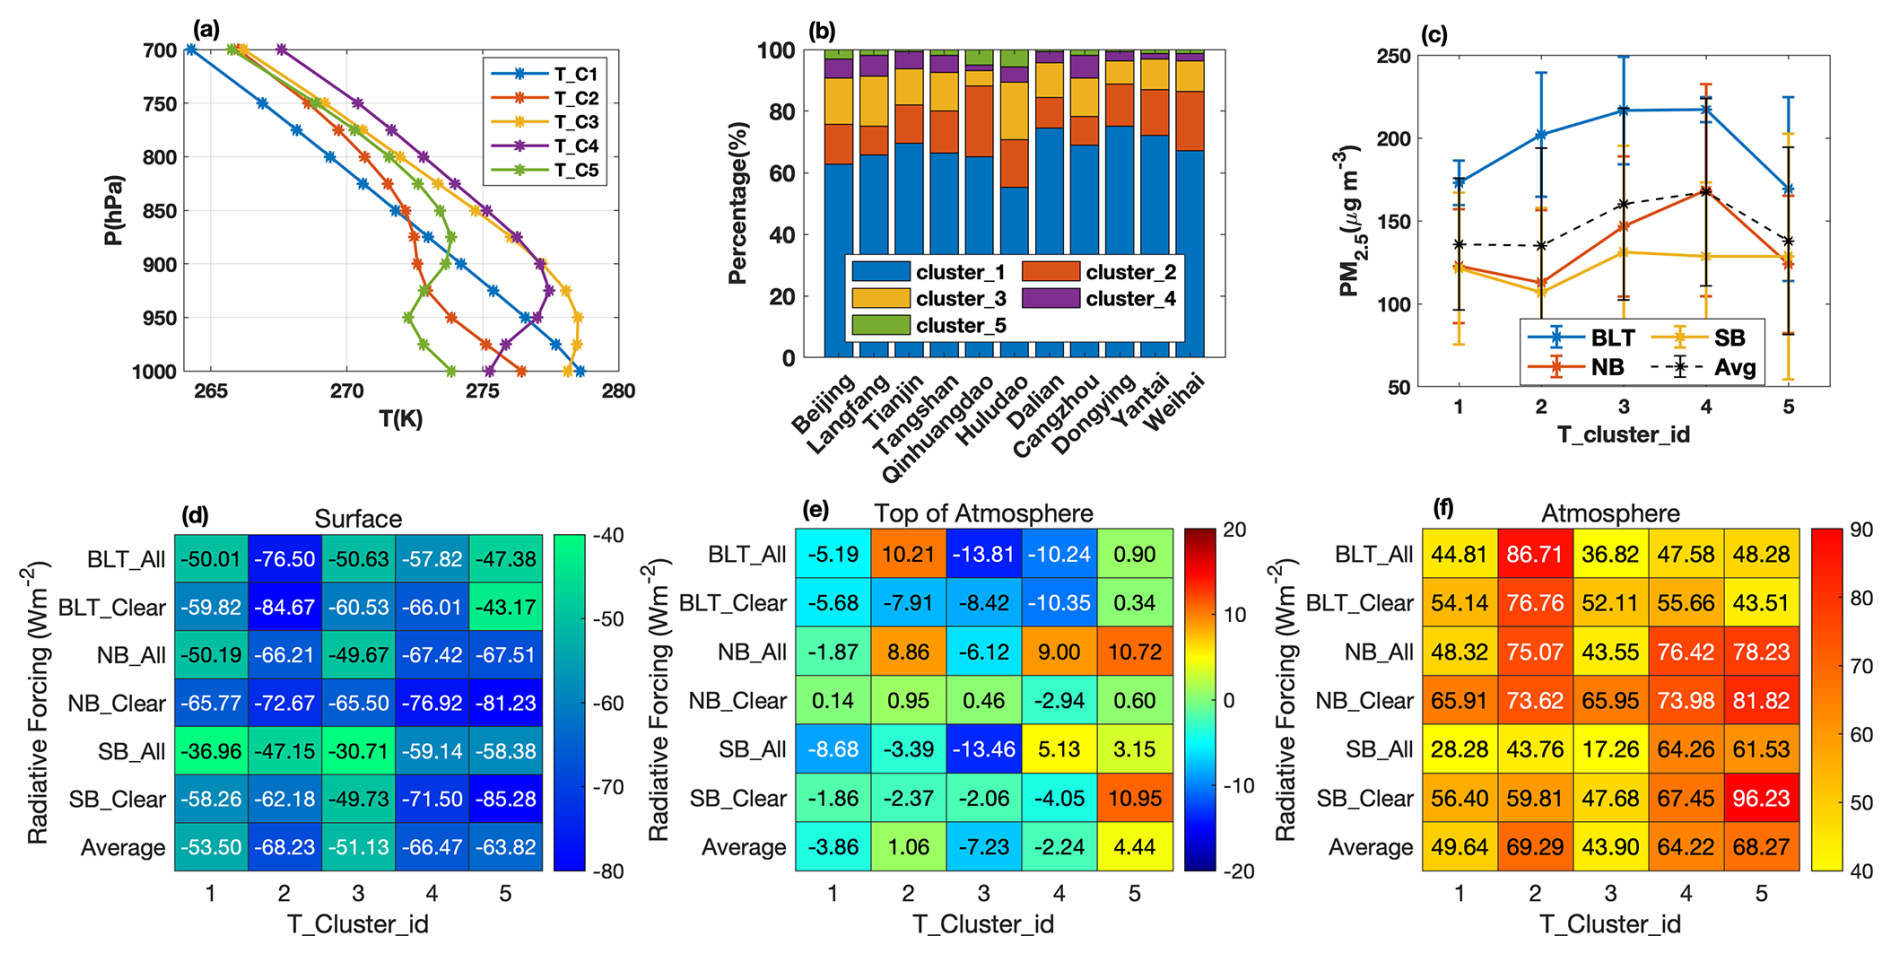
Figure 5The five temperature (T) profiles under 850 hPa by k-means clustering on the regional heavy pollution days (a); their statistics at the 11 stations (b); the PM2.5 concertation (c) and the radiative forcing in the three regions in clear- and all-sky at the surface (d), top of atmosphere (e), and in the atmosphere (f) at the five T clusters.
The pollution RF at the surface for different T types in Fig. 5d was higher at T_C2, T_C4, and T_C5 (−63.82 to −68.23 Wm−2, i.e., T stratification with isothermal layers at high altitude and medium- to high-altitude inversions) and lower at T_C1 and T_C3 (−51.13 to −53.50 Wm−2, i.e., decreasing stratification and low-altitude inversion), which partially agreed with the surface PM2.5 concentrations in Fig. 5c (high at T_C4-5 and low at T_C1). The RF is the result of the total column aerosol, not the surface. RF at T_C3 was lowest, for this low-altitude inversion restrained the aerosol to the surface, leading to high surface PM2.5 but not high column aerosol. The highest surface RF at T_C2 can be explained by the fact that this T stratification allows the aerosol to reach a relatively higher altitude, with the possibility of lower surface PM2.5 but high total column aerosol, leading to higher RF at T_C2. At the TOA (Fig. 5e), RF values were high at T_C3 and T_C5 but with opposite signs, which was related to column aerosol and also the aerosol absorption properties determined by aerosol composition. Within the atmosphere (Fig. 5f), the variations of RF at the five T types resembled those at the surface, which was also related to column aerosol and aerosol composition. Regarding regional differences, the NB region showed a higher RF value than BLT and SB, which may be partially attributed to the effect of pollution transport.
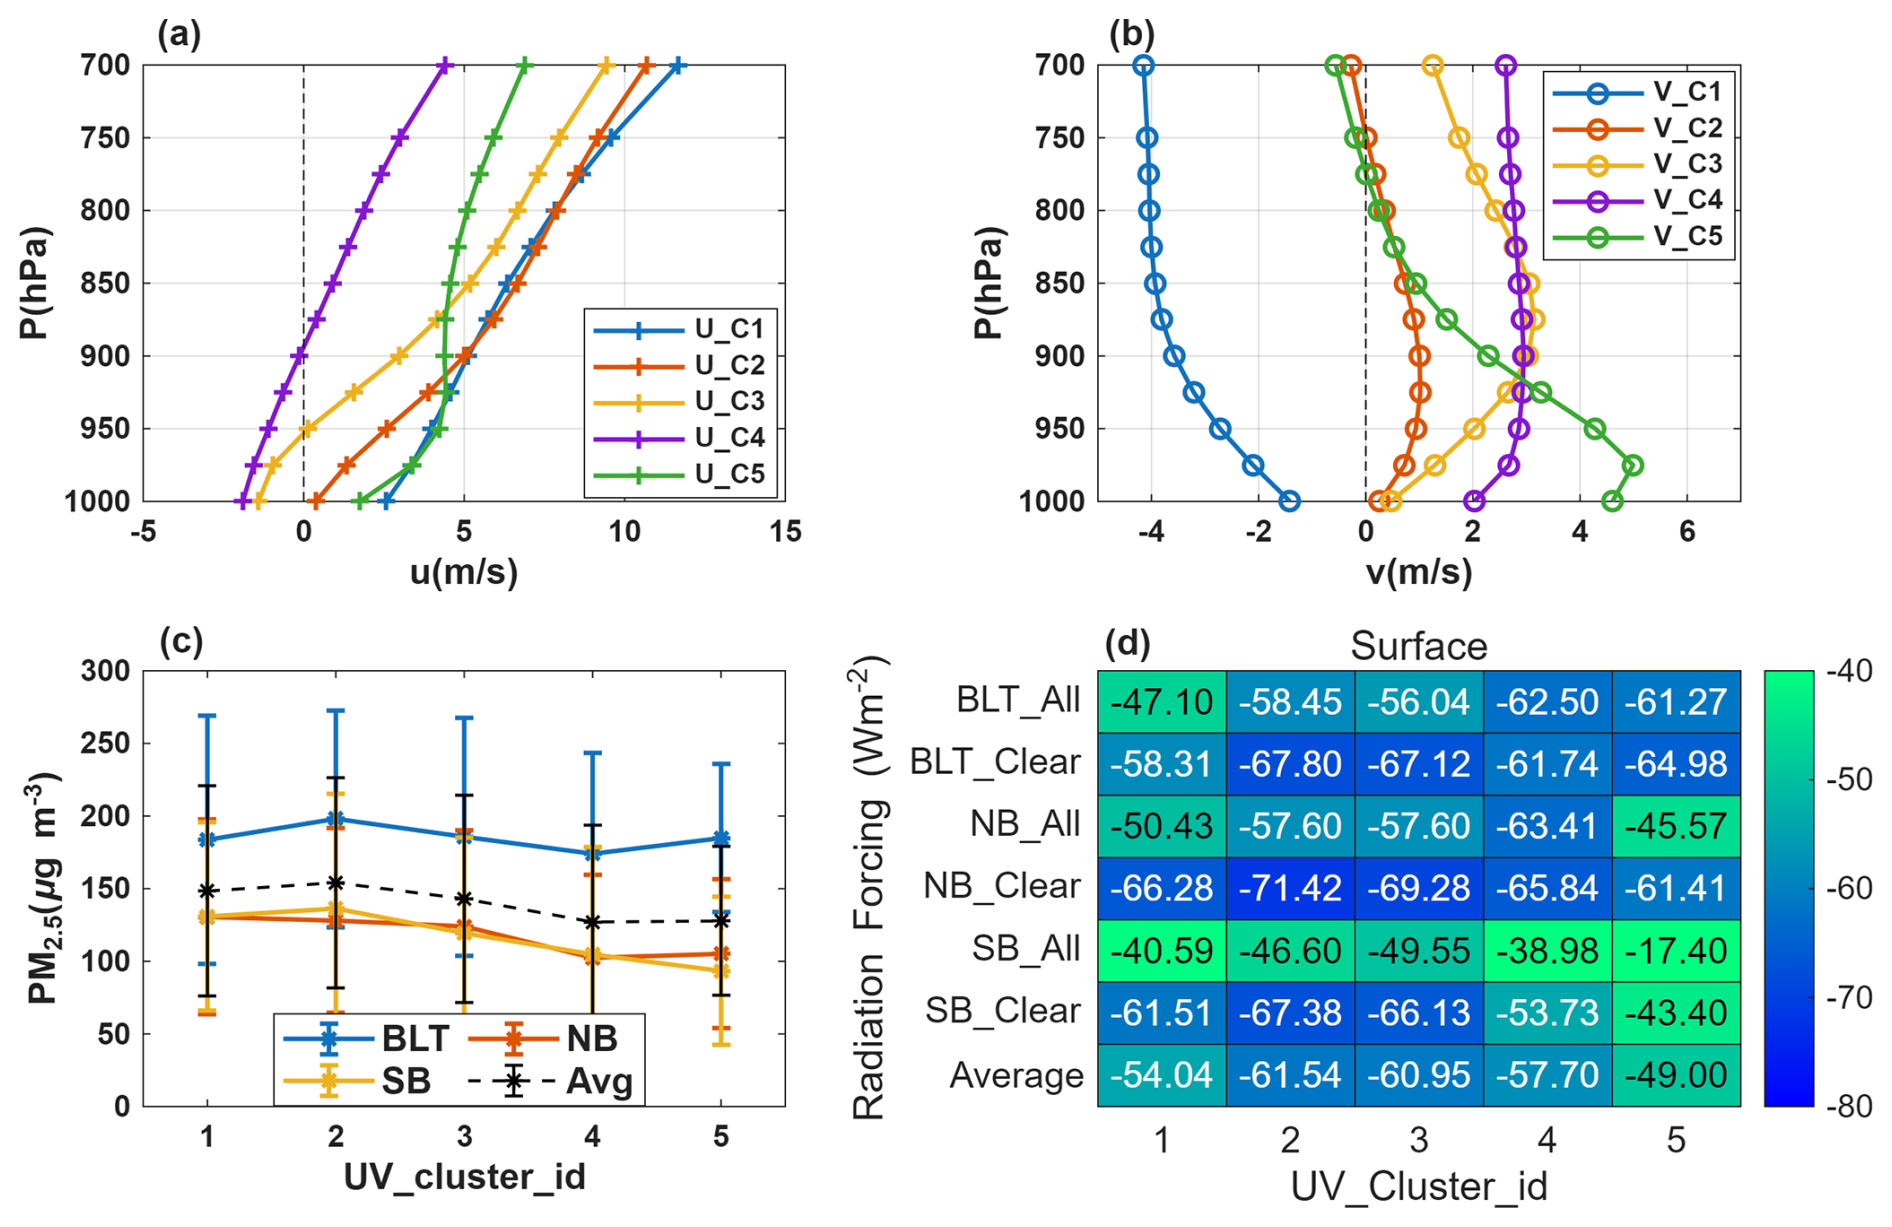
Figure 6The five horizontal wind profiles under 850 hPa by k-means clustering on the regional heavy pollution days: (a) u wind, (b) v wind, (c) the PM2.5 concentrations, and (d) the radiative forcing in the three regions in clear- and all-sky at the surface at the five clusters.
3.2.2 Effect of horizontal and vertical wind profile types
Figure 6 shows the UV clusters and their statistics of surface PM2.5, and RF. The clusters showed that U wind increased with height with different direction of C3 and C4 in lower levels, while the variations in V wind were plentiful with opposite direction of C1 to other classes and smaller speeds of C2 and C3 in the lower levels (Fig. 6a and b). The surface PM2.5 concentrations in different UV types in Fig. 6c showed some variations but were not apparent as T clusters, with high values in UV_C1-3 and relatively low values in UV_C4-5. The relatively high PM2.5 concentration may be related to wind direction and speed, i.e., lower horizontal wind speeds at low levels in both UV_C2-3 (unfavorable for dispersion) and the anomalous direction of V wind in UV_C1 (limited dispersion due to topography) in agreement with the previous research (Liu et al., 2019a; Song et al., 2025; Wu et al., 2018; Zhang et al., 2018). All regions showed higher PM2.5 in UV_C1-3, indicating that the horizontal speed and the direction of the V-component were important factors for pollution dispersion in the Bohai Rim. At the surface, the pollution RF in different UV types in Fig. 6d was higher in UV_C2-3 and lower in UV_C1 and UV_C4-5, indicating lower horizontal speeds at low levels (UV_C2-3 unfavorable for dispersion) causing higher pollution RF. The RF variations among UV clusters mostly matched with surface PM2.5 changes, suggesting that horizontal diffusion differed from the T inversion that restricted the aerosol near the surface. Given the similarity and conciseness, the percentage statistic of stations and RF at the TOA and in the atmosphere of the five horizontal winds clusters is shown in Fig. S7. Regionally, the NB region also exhibited higher RF values at the surface and in the atmosphere than BLT and SB, which may be partially attributed to the effect of pollution transport above the boundary layer. This effect will be discussed in Sect. 3.3.
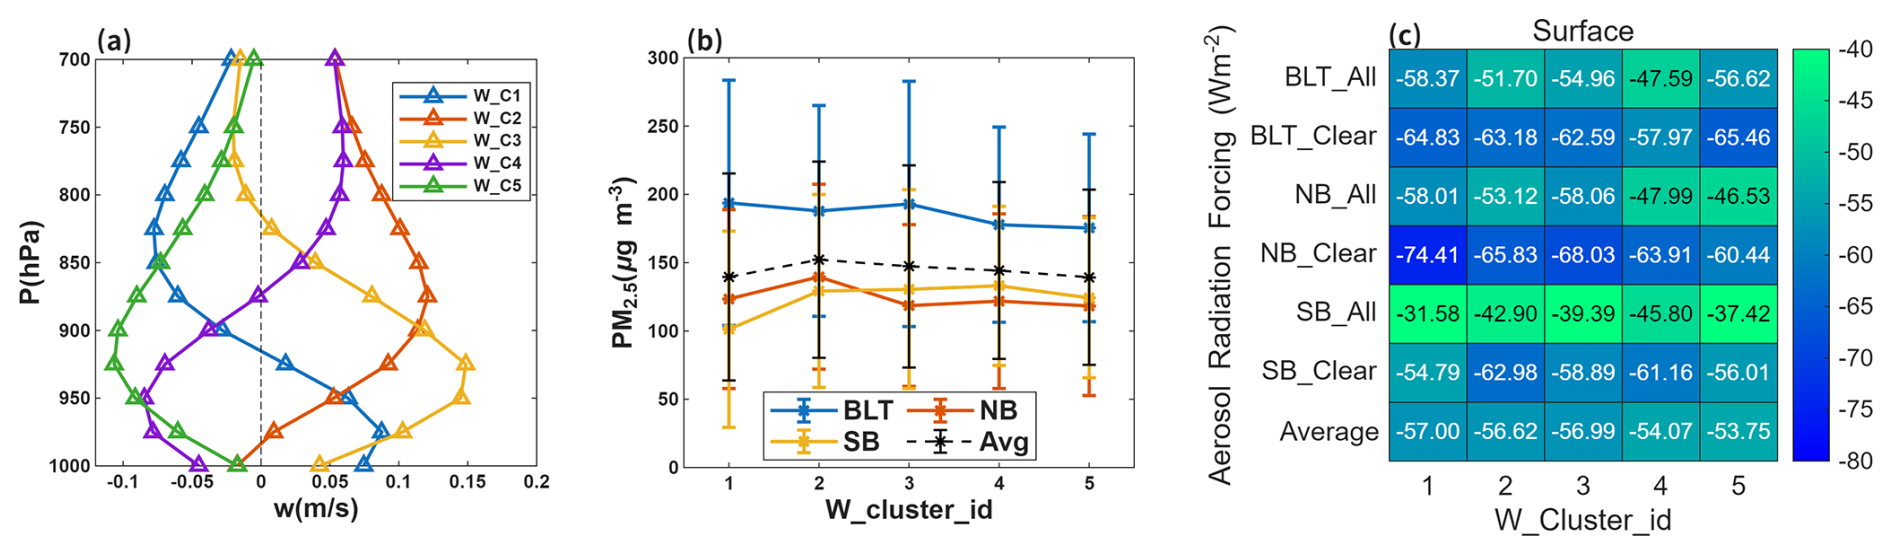
Figure 7The five vertical wind profiles under 850 hPa by k-means clustering on the regional heavy pollution days: (a) the w wind, (b) the PM2.5 concentrations, and (c) the radiative forcing in the three regions in clear- and all-sky at the surface.
Vertical wind may also affect aerosol pollution and its RF, so W wind profiles were clustered and the same number of five clusters were selected (seen in Fig. 7). The five W clusters (Fig. 7a) showed large changes with the height, with predominantly upward of C2-3, downward of C4-5, and ascending firstly and then descending of C1 below 850 hPa. The percentage statistic of stations and RF at the TOA and in the atmosphere of the five W clusters is shown in Fig. S8. Compared with T and horizontal wind clustering, the proportions of the five categories for vertical wind showed no significant differences, with little higher proportions in W_C1-2. The variations in PM2.5 concentrations in different W wind types (Fig. 7b) were not as significant as T and UV clusters, with only slightly high values at W_C1-3 and little low values at W_C4-5. The reason may be that the vertical winds were ascending motion at low levels in W_C1-3, which helped for aerosol dispersion after emission. Conversely, the W winds in W_C4-5 at low levels displayed descending motion, not conducive to diffusion and emission of aerosol. As for the regional variations, this effect of W wind direction was less obvious at NB and SB regions. This may be related to lower aerosol emissions at these two regions than the BLT region, as well as related to aerosol transport. The surface pollution RF at different W types in Fig. 7c was higher in W_C1-3 and lower in W_C4-5, indicating that upward motion at low levels caused higher pollution RF. However, the differences among W profile types were not significant, suggesting lower importance to RF of vertical wind than T and horizontal winds. The RF variations in W clusters mostly matched with changes in the surface PM2.5 concentrations, implying that vertical diffusion and horizontal diffusion were not as same as the T inversion restraining the aerosol to the surface. Regional variations resembled those seen in T and UV clusters.
3.3 The importance of factors to pollution RF and precipitation on regional heavy pollution days
The above two sections have demonstrated that surface PM2.5 concentration and meteorological profile types within the boundary layer (T, horizontal and vertical winds) can affect the pollution RF at the stations around the Bohai Rim area. The transport above the boundary layer may also impact the regional pollution RF. Additionally, the above impact was based on stational statistics. Therefore, our analysis in this section was conducted at all the grids within the Bohai regions. We focused on the surface PM2.5 concentration, temperature, and three wind components at four levels (500, 750, 850, and 1000 hPa), to assess the relative importance of each parameter to pollution RF using machine learning methods (Random Forest and Gradient Boosting algorithms). Regarding the relative importance of factors to total precipitation on regional heavy pollution days, the above parameters, along with RFs in all-sky, were taken into consideration. Ocean and land were also discussed due to the significant discrepancy shown in Fig. 4.
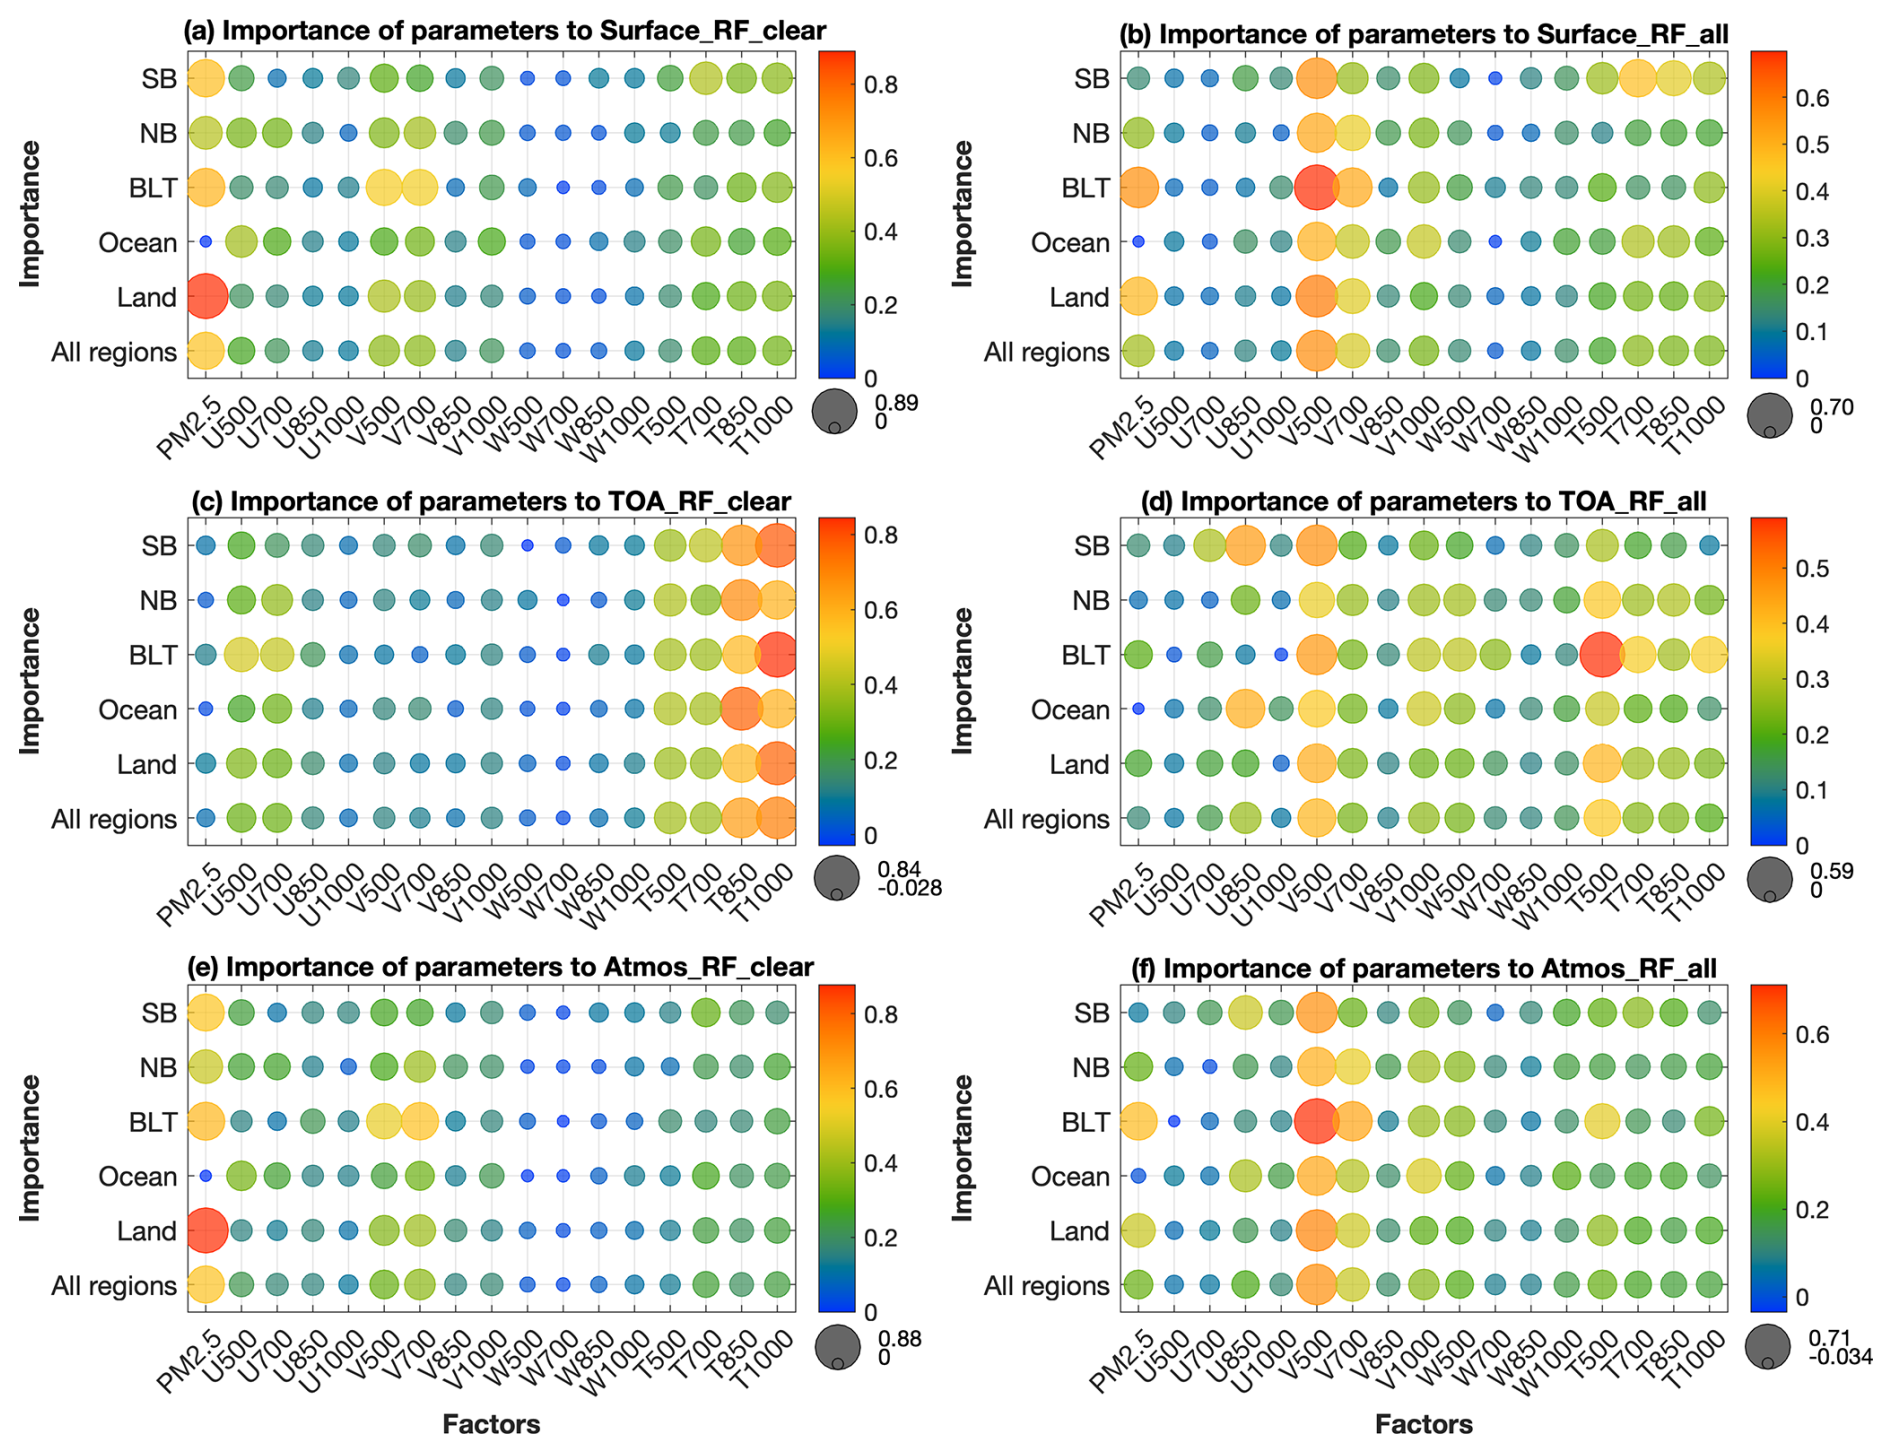
Figure 8The Random Forest's importance of PM2.5, winds, and temperature at four levels (500, 700, 850, and 1000 hPa) to the radiative forcing on regional heavy pollution days at the surface (first row: a, b), top of atmosphere-TOA (second row: c, d), and in the atmosphere-Atmos (third row: e, f) in clear-sky (first column: a, c, e) and all-sky (second column: b, d, f) in different regions. The x-axis indicates different impact factors, while the y-axis denotes different regions. The larger the circle and the redder the color, the greater the importance. Conversely, the smaller the circle and the bluer its color, the less its importance.
3.3.1 The importance of factors to radiative forcing
Figure 8 illustrates the importance of surface PM2.5, winds, and T at four levels to the RF on regional heavy polluted days. For RF at the surface in clear-sky, PM2.5, V wind at high levels (500–700 hPa) and T in low layers (700–1000 hPa) were relatively important factors, with the largest importance of PM2.5 in all study regions. These indicated that surface aerosol concentration, meridional transport, and thermal diffusion in low layers were more important to pollution RF around the Bohai Rim area. Among the three subregions, the importance of T in the lower layer was relatively weaker in the BLT and NB regions (surface aerosol concentration and meridional transport were more important in these two regions), while the importance of V wind at high levels in the SB region was lower (surface aerosol concentration and thermal diffusion in lower layers were more important in the SB region). In all-sky, the relatively important factors were as same as that in clear-sky, but the most important factor was V wind at high level (500 hPa) instead of surface PM2.5, suggesting the meridional transport became more important than surface aerosol concentration to pollution RF in the all-sky.
Regarding the RF at the TOA in clear-sky, the relatively important factors were T at all levels and U wind in high layers (500–700 hPa), with the most important factor of T (in the boundary layer). These were different from those for RF at the surface, indicating that zonal transport and thermal diffusion in the troposphere, especially the T in the boundary layer (not only reflecting the thermal diffusion but also affecting the aerosol chemical formation), were important for TOA RF in clear-sky. Regional differences were not significant, except for the slightly high importance of U wind in high layers in the BLT region. In all-sky, V500 and T500 were relatively important in all regions. But U850 was also important in the SB and ocean regions, and T at low level (1000 hPa) was also important in the BLT region. These reflected that meridional transport and thermal effects in the troposphere were important in all-sky for TOA RF, with the relative importance of zonal transport and diffusion in low levels in the SB and ocean regions.
For RF in the atmosphere, the important factors in clear-sky and all-sky were similar to those at the surface, although the importance of T (thermal effects) was weaker in the atmosphere than at the surface. Regionally, surface PM2.5 was dominant in the SB region under clear-sky, while PM2.5 and V700 (surface aerosol concentration and meridional transport) were nearly equally important in the NB and BLT regions. In all-sky, T500 and PM2.5 were also relatively important after V500-700 in the BLT region, while U850 was also relatively important in the SB region. In the NB region, V factors are dominant.
We also calculated the importance using the Gradient Boosting algorithm. The results showed that the rank of factors' importance was basically unchanged and the factor with the most importance based on the Gradient Boosting algorithm was the same as that from the Random Forest algorithm. Therefore, we used the one machine learning method (Random Forest) to analyze in the following part.
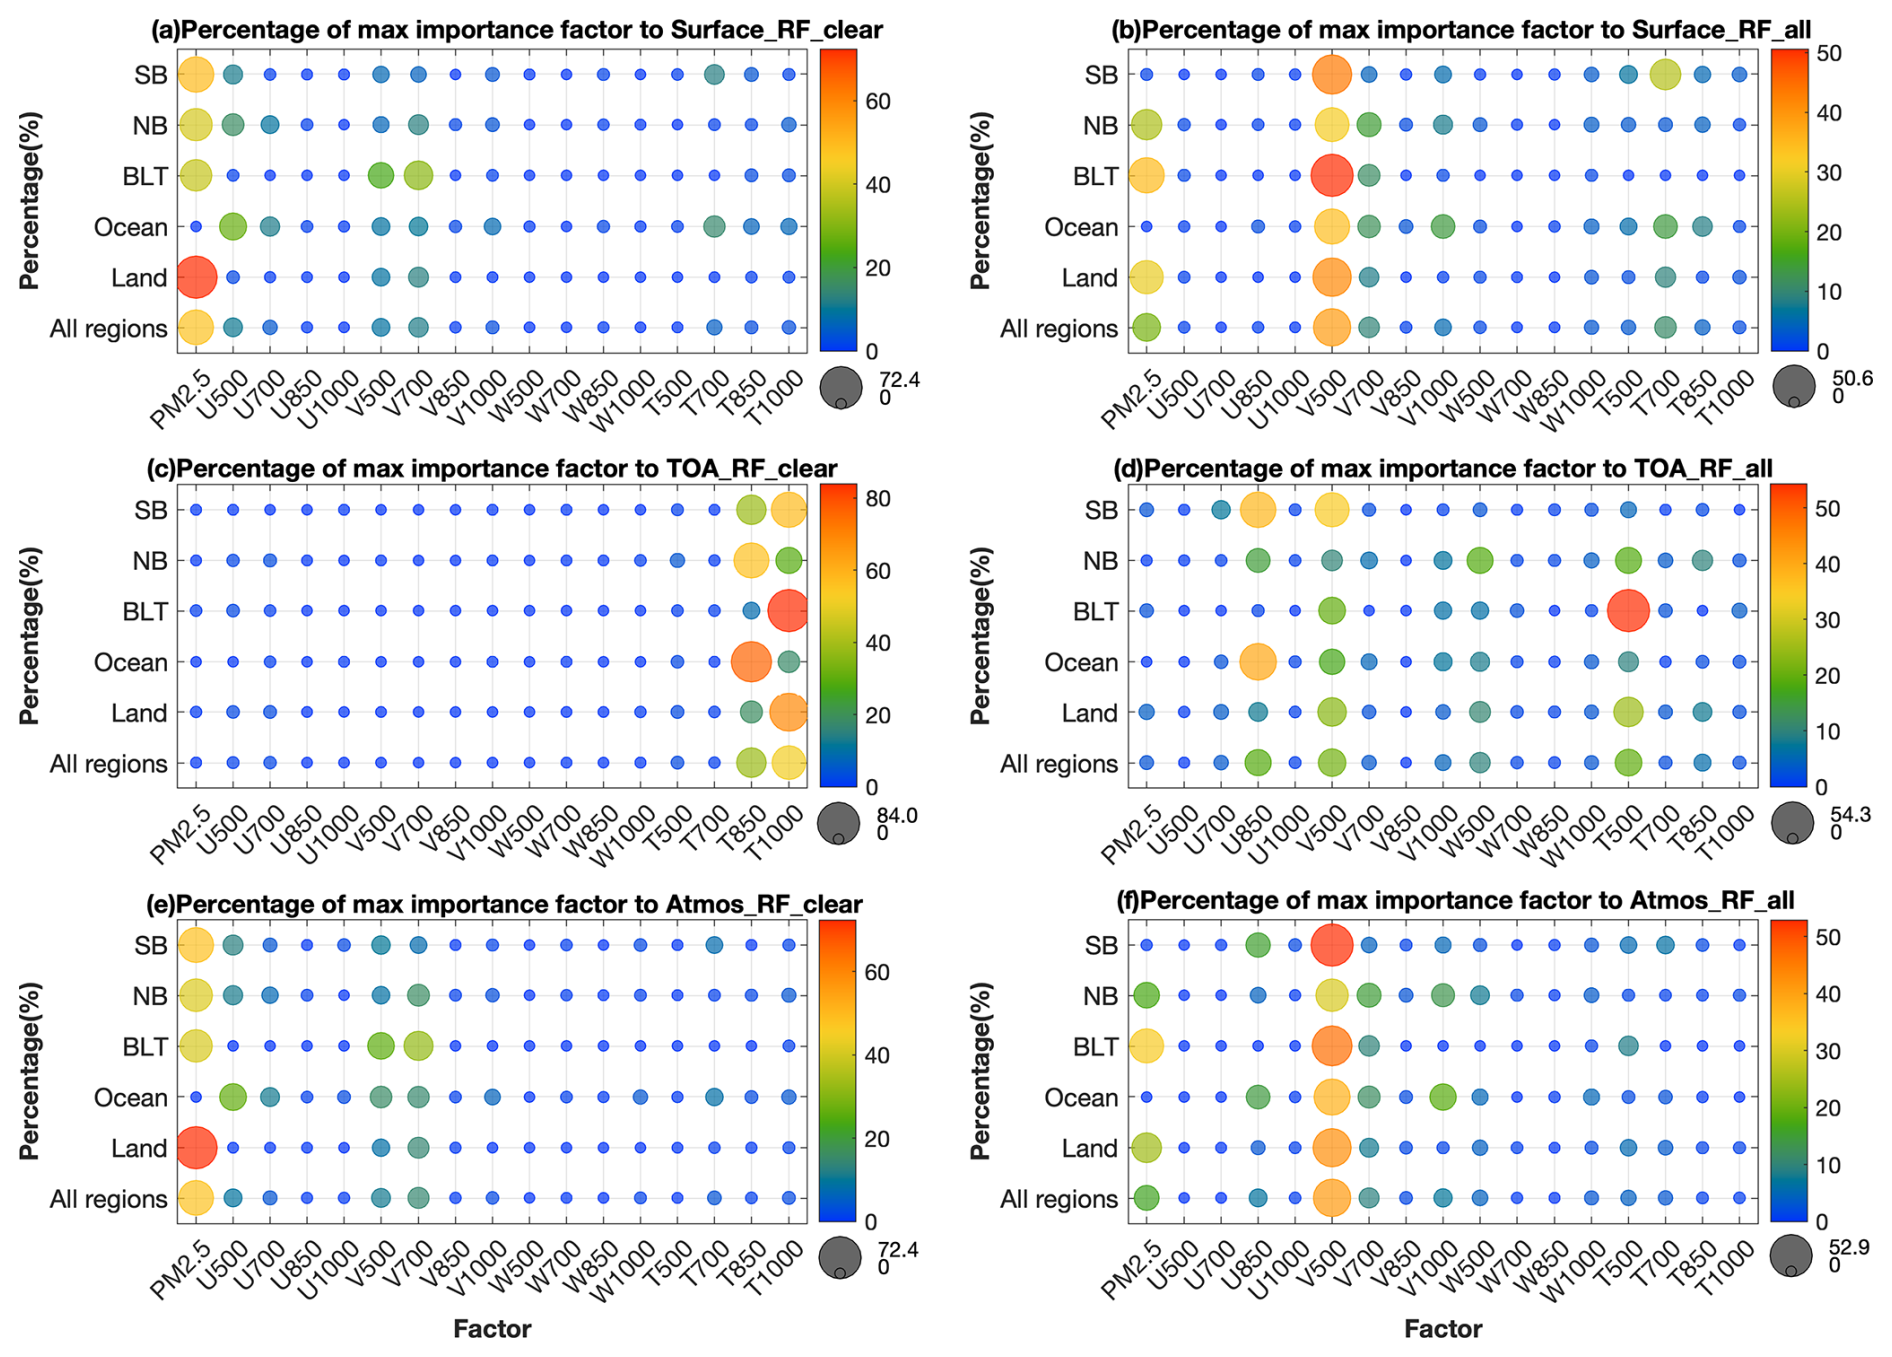
Figure 9The percentage of regional grids with maximum importance factor (including PM2.5, winds, and temperature at four levels) to the radiative forcing on regional heavy pollution days for surface (first row: a, b), TOA (second row: c, d), and atmosphere-Atmos (third row: e, f) in clear sky (first column: a, c, e) and all sky (second column: b, d, f) in different regions. The x-axis indicates different impact factors, while the y-axis denotes different regions. The larger the circle and the redder the color, the higher the percentage. Conversely, the smaller the circle and the bluer its color, the closer the percentage is to 0.
The most important factor has been explored, but what is the grid proportion of each region with the maximum importance factor? Figure 9 shows the percentage of regional grids with maximum importance factor to the RF on regional heavy pollution days. In clear-sky, the most important factor of PM2.5 at the surface and in the atmosphere can account for ∼50 % of all areas with SB > NB > BLT and land > ocean. In addition, the grid percentage of V wind at higher levels (500 and 700 hPa) can reach 30 %–40 %, with the regional variations of SB < NB < BLT. In all-sky for the surface and atmosphere, the maximum factor of V500 accounted for the mean of ∼40 % with the order BLT > SB > NB at the surface and SB > BLT > NB in the atmosphere. Furthermore, the PM2.5 accounted for the mean of ∼20 %, but with larger differences in each region (PM2.5 in BLT can exceed 30 %). Regarding the RF at the TOA, T at low levels accounted for the majority in clear-sky with the largest percentage of 80 % for T1000 in the BLT region, while the larger percentages in all-sky can be of U850, V500, and T500, with the largest percentage of ∼50 % for T500 in the BLT region.
The importance of factors to the pollution RF in clear-sky and all-sky showed a distinct difference: Surface PM2.5 was the most important factor to surface and atmosphere RF in clear-sky, but V wind in high level (500 hPa) in all-sky. In clear-sky, high-concentration surface aerosols directly interact with shortwave radiation (through scattering and absorption), becoming the most important factors of pollution RF at the surface and in the atmosphere. Other meteorological factors may indirectly influence RF by altering aerosol distribution (including horizontal and vertical distribution) and aerosol chemistry formation to affect the RF indirectly, but their effect is far less pronounced than the direct interaction between high-concentration surface aerosols and radiation. In the all-sky, however, the pollution RF is primarily influenced by cloud-radiation interactions. Cloud radiative forcing is affected by cloud characteristics (cloud cover, cloud height, cloud type, etc.), which in turn are influenced by both aerosols and meteorological conditions, with the latter potentially playing a more significant role. The critical role of upper-level (500 hPa) V-wind may be attributed to the strong association between weather systems over the Bohai Rim region and upper-level zonal winds.
The relative importance of influencing factors between land and ocean also exhibited certain variations. Regarding the surface and atmosphere RF, the significance of PM2.5 over land surpassed that over the ocean, while the importance of U and V over the ocean exceeded that over land areas (U500 in clear-sky, V1000 in all-sky). Given that land surfaces exhibited higher aerosol concentrations than oceans, the prominence of PM2.5 over land was entirely justified. The heightened significance of U and V over the ocean was primarily linked to transport from land to the ocean. Based on the land-ocean distribution in Fig. 1, it is evident that zonal winds (particularly westerlies) facilitate the transport of land-based pollutants towards the ocean, while meridional winds also promote this transport (both southerly and northerly winds). Conversely, transport from the ocean to land also occurred, though its impact was comparatively minor relative to the influence of high-concentration aerosols over the land.
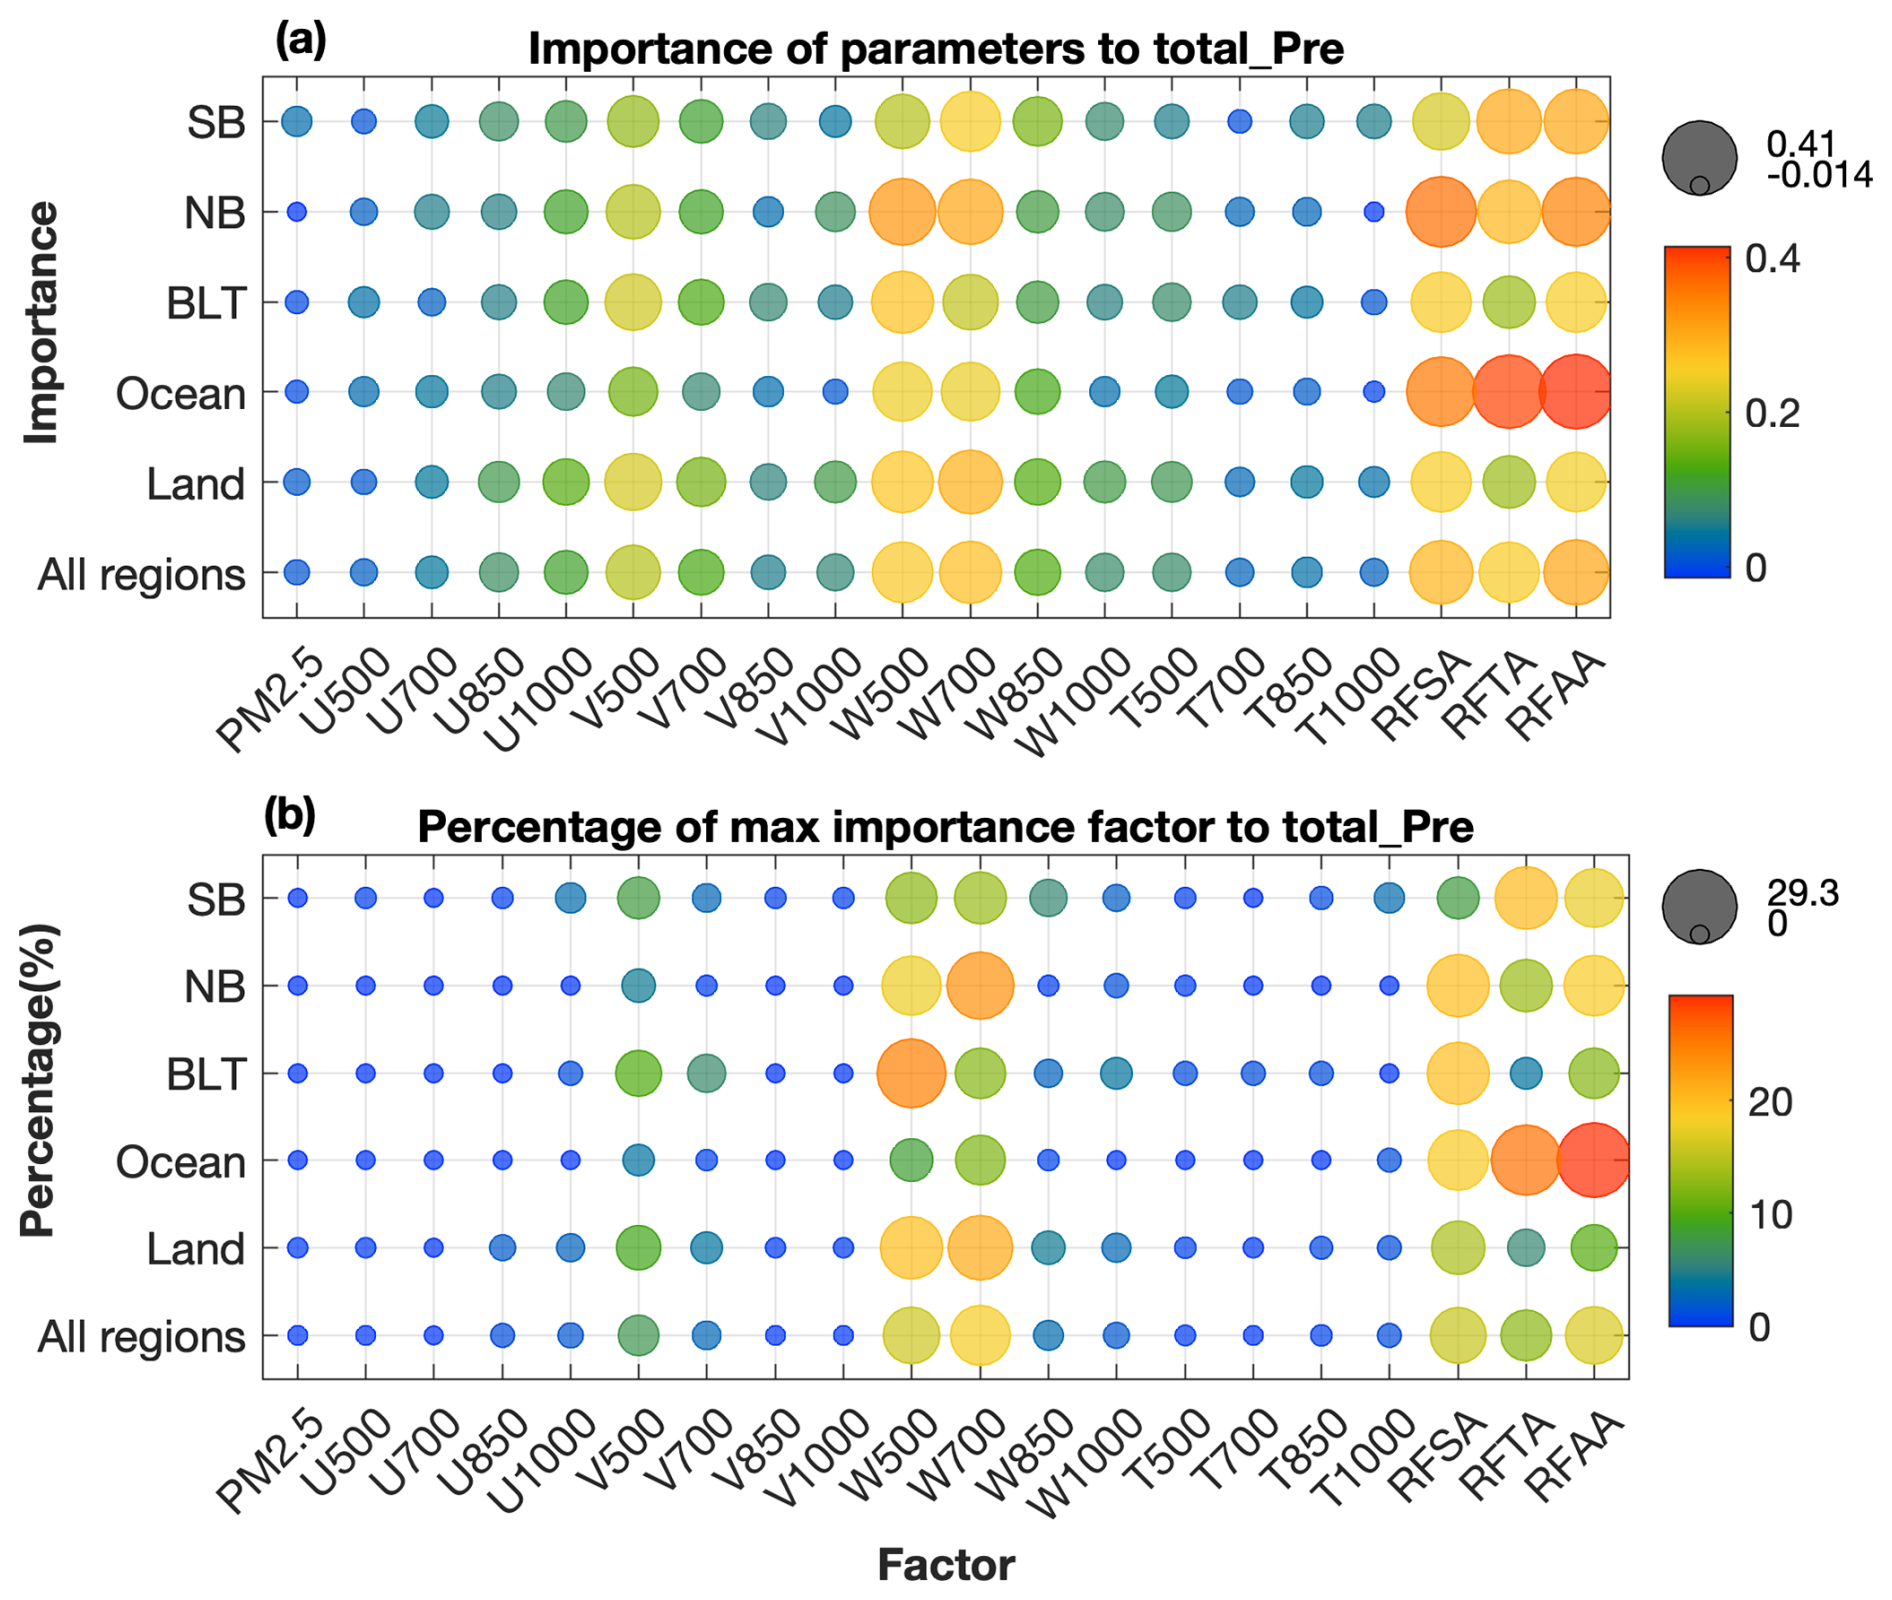
Figure 10(a) The Random Forest's importance of PM2.5, winds, and temperature at four levels, and RF in all-sky to total precipitation; and (b) the percentage of regional grids with maximum importance factor to total precipitation on regional heavy pollution days in different regions.
The importance of influencing factors to pollution RF showed heterogeneity across different regions. This may be related to variations in aerosol concentrations and pollution RF. In clear sky, the BLT region featured high PM2.5 concentrations (Fig. 3) coupled with high RF values (Fig. 4a), whereas the SB region exhibited low PM2.5 concentrations alongside low RF, illustrating the higher importance of PM2.5 impacts on RF at the surface in these two regions (Fig. 8a). Conversely, the NB region, with low PM2.5 concentrations but high RF, showed less importance of PM2.5 than in the BLT and SB. Differences in the importance of meteorological parameters across regions may be related to local topography and geographical location. Figure 1 indicates that the northwestern parts of the BLT and NB regions border mountainous terrain, where wind direction and speed significantly influence pollution dispersion and transport. Consequently, wind (V-wind in the BLT region, U- and V-winds in the NB region) exhibited greater importance for RF in these regions compared to the SB region. Conversely, the SB region's lower latitude and absence of nearby high mountain ranges resulted in temperature factors being more important than in the BLT and NB regions.
3.3.2 The importance of factors to total precipitation
The importance of PM2.5, winds and temperature at four levels, and RF in all-sky to daily total precipitation on regional heavy pollution days in different regions is shown in Fig. 10a. The results showed that the pollution RF in all-sky (at the surface-RFSA, at the TOA-RFTA and in the atmosphere-RFAA) and W wind at high levels (500–700 hPa) were the two most important factors for daily total precipitation, followed by V wind at the high level. In contrast, surface PM2.5, T at each level, and U wind were not important. These indicated that pollution RF in all-sky, vertical movement, and meridional transport in the upper layers were important to total precipitation on heavy aerosol pollution days around the Bohai Rim area, whereas other factors such as surface aerosol concentration and thermal effects were less important. The W wind can generate air convection, which is an essential condition for precipitation, and the V-component may bring the abundant water vapor for precipitation. The pollution RF in all sky (including effects of aerosol-radiation and aerosol-cloud) can affect the development of clouds, start time and duration of precipitation, and then the total precipitation, which is an inherent aerosol–meteorology–precipitation dilemma existing unexplained underlying physical processes (Guo et al., 2018; Li et al., 2011). Regionally, the importance of pollution RF in all-sky was stronger over the ocean areas. Among the three subregions, the importance of pollution RF in all-sky was NB > SB > BLT.
The percentage of regional grids with maximum importance factor to total precipitation (Fig. 10b) demonstrated the important factors of W in the upper layers could account for 15 %–20 % of all regions with NB > BLT > SB and land > ocean. In addition, the percentages of pollution RF in all-sky reached to ∼15 % for all regions, with the largest percentage of ∼30 % over ocean areas and the subregional variations of NB > SB > BLT. As is well known, vertical wind is a key factor for precipitation. Our results confirm it in agreement with previous researches (Jun and Rind, 2024; Wingo and Cecil, 2010). Moreover, the above findings suggested that pollution RFs in all-sky also played a significant role in total precipitation in the Bohai Rim regions. This insight can provide some assistance in precipitation forecasting around the Bohai Rim area, particularly by considering the role of radiative forcing on days with regional heavy pollution.
Using ground-based monitoring data, satellite radiation products, and TAP and ERA5 reanalysis datasets, the radiative forcing of PM2.5 heavy pollution days in the Bohai Rim regions during autumn and winter in 2014–2023 and the impact of meteorological profiles on surface PM2.5 and pollution RF were analyzed. Besides, the importance of factors to pollution RF and precipitation on regional heavy pollution days in the Bohai Rim regions, were investigated by using machine learning algorithms. The results showed that all stations experienced heavy pollution days (daily PM2.5 >150 µg m−3) with frequencies of 0.52 %–8.70 %, and there were 161 d of regional heavy pollution during autumn and winter in 2014–2023. The RF on PM2.5 regional heavy pollution days reached approximately −70 Wm−2 at the surface, ±8 Wm−2 at the TOA and +80 Wm−2 in the atmosphere in clear-sky, with lower absolute values of RF in all sky at the surface and in the atmosphere. Different T and winds profiles can influence the surface PM2.5 and pollution RF. The differences in surface PM2.5 and RF are most pronounced under different temperature profile types. The winds profiles with lower horizontal speeds and upward motion at low levels leaded to slightly higher surface PM2.5 and RF at the surface. Among the parameters of surface PM2.5, winds, and T at four levels, surface PM2.5 was the most important factor to surface and atmosphere RF in clear-sky, while the most important factor in all-sky was the V wind at the high level (500 hPa). As for TOA RF, T in the low level (boundary layer) was the most important factor in clear-sky, whereas both V and T at higher levels were more important in all-sky. For daily total precipitation, pollution RFs in all-sky were as important as vertical winds. Notably, there was regional heterogeneity for the important factors in the Bohai Rim regions.
In the results, we found that the temperature profiles associated higher surface PM2.5 concentration and RF at the surface were not entirely consistent. Specifically, low- to medium-altitude inversions corresponded to higher surface PM2.5 concentrations compared to high-altitude inversion, whereas isothermal stratification of T at high altitudes and medium- to high-altitude inversions were linked to higher surface RF. This discrepancy arises from the association mechanism between RF and surface aerosols: RF reflects the total column aerosol burden rather than just surface aerosol levels. This finding underscores the importance of addressing climate change by considering not only surface pollution concentrations but also aerosol effects throughout the entire atmospheric column. Furthermore, the finding that the variation of RF in the atmosphere was similar to RF at the surface, while RF variation at the TOA differed from RF at the surface in different meteorological profile types, primarily stems from the fact that RF at the surface and in the atmosphere correlates more strongly with aerosol content, whereas RF at the top of the atmosphere depends more on aerosol composition. Additionally, the most important factor to pollution RF in clear-sky and all-sky is different, highlighting the significant role of cloud processes. The regional heterogeneity for the important factors in the Bohai Rim regions may relate to aerosol concentrations, RF values, local topography, and geographical location.
This work revealed the RF of PM2.5 heavy pollution from an observational perspective in the Bohai Rim regions, which improved understanding of the radiative effect of heavy pollution. The analysis of their influence factors of vertical meteorological parameters by combing machine learning algorithms, deepened knowledge of the impact of meteorological parameters in different layers on surface PM2.5 concentration and pollution RF in different positions and skies. Besides, the findings of the importance of pollution RFs to total precipitation can provide some assistance in precipitation forecasting in the Bohai Rim area. Nevertheless, some uncertainties remain in the results. The pollution RF calculated by the difference between CERES net radiative fluxes on regional heavy pollution days and the mean of clean days may be imprecise. Besides, the machine learning method cannot explain the interaction and physical processes between pollution RF, vertical temperature and winds, and precipitation. TAP PM2.5 data contains the meteorological information, and some other factors have not been taken into account in the machine learning, such as terrain elevation. The mechanism and degree of the impact of pollution RF on precipitation are not unequivocal. The interpolation of datasets with different spatial resolutions used for training of the machine learning algorithm may cause some uncertainty. Further studies are required to quantify the impacts of these factors on RF and precipitation and to explore the underlying physical mechanisms or connections through additional observations in diverse regions and in higher spatial resolution, and numerical simulations.
The ground-observed PM2.5 concentrations at the stations were from China's Ministry of Ecology and Environment (CMEE, http://www.cnemc.cn/sssj/, last access: 10 April 2026). The Satellite CERES radiation products are available from http://ceres.larc.nasa.gov last access: 10 April 2026). The reanalysis data- TAP and ERA-5 data can be obtained from http://tapdata.org (last access: 10 April 2026) and https://doi.org/10.24381/cds.bd0915c6 (Hersbach et al., 2023), respectively.
The supplement related to this article is available online at https://doi.org/10.5194/acp-26-5679-2026-supplement.
All authors help to shape the ideas and review this manuscript. JZ, XY, and HC designed, and wrote the manuscript; JZ and YW help to analyze the data; XX, XL, TZ, and HL provided constructive comments on this study.
The contact author has declared that none of the authors has any competing interests.
Publisher's note: Copernicus Publications remains neutral with regard to jurisdictional claims made in the text, published maps, institutional affiliations, or any other geographical representation in this paper. The authors bear the ultimate responsibility for providing appropriate place names. Views expressed in the text are those of the authors and do not necessarily reflect the views of the publisher.
This article is part of the special issue “Sun-photometric measurements of aerosols: harmonization, comparisons, synergies, effects, and applications”. It is not associated with a conference.
This research was supported by National Natural Science Foundation of China (Grant 42030608 and 42575197).
This research has been supported by the National Natural Science Foundation of China (grant nos. 42030608 and 42575197).
This paper was edited by Dantong Liu and reviewed by four anonymous referees.
Archer, K. J. and Kimes, R. V.: Empirical characterization of random forest variable importance measures, Comput. Stat. Data An., 52, 2249–2260, https://doi.org/10.1016/j.csda.2007.08.015, 2008.
Bi, J., Huang, J., Hu, Z., Holben, B. N., and Guo, Z.: Investigating the aerosol optical and radiative characteristics of heavy haze episodes in Beijing during January of 2013, J. Geophys. Res.-Atmos., 119, 9884–9900, https://doi.org/10.1002/2014JD021757, 2014.
Breiman, L.: Random Forests, Mach. Learn., 45, 5–32, https://doi.org/10.1023/A:1010933404324, 2001.
Calvo, A. I., Alves, C., Castro, A., Pont, V., Vicente, A. M., and Fraile, R.: Research on aerosol sources and chemical composition: Past, current and emerging issues, Atmos. Res., 120–121, 1–28, https://doi.org/10.1016/j.atmosres.2012.09.021, 2013.
Che, H., Xia, X., Zhu, J., Li, Z., Dubovik, O., Holben, B., Goloub, P., Chen, H., Estelles, V., Cuevas-Agulló, E., Blarel, L., Wang, H., Zhao, H., Zhang, X., Wang, Y., Sun, J., Tao, R., Zhang, X., and Shi, G.: Column aerosol optical properties and aerosol radiative forcing during a serious haze-fog month over North China Plain in 2013 based on ground-based sunphotometer measurements, Atmos. Chem. Phys., 14, 2125–2138, https://doi.org/10.5194/acp-14-2125-2014, 2014.
Che, H., Gui, K., Xia, X., Wang, Y., Holben, B. N., Goloub, P., Cuevas-Agulló, E., Wang, H., Zheng, Y., Zhao, H., and Zhang, X.: Large contribution of meteorological factors to inter-decadal changes in regional aerosol optical depth, Atmos. Chem. Phys., 19, 10497–10523, https://doi.org/10.5194/acp-19-10497-2019, 2019.
Chen, G., Li, S., Knibbs, L. D., Hamm, N. A. S., Cao, W., Li, T., Guo, J., Ren, H., Abramson, M. J., and Guo, Y.: A machine learning method to estimate PM2.5 concentrations across China with remote sensing, meteorological and land use information, Sci. Total Environ., 636, 52–60, https://doi.org/10.1016/j.scitotenv.2018.04.251, 2018.
Chen, Q., Miao, R., Geng, G., Shrivastava, M., Dao, X., Xu, B., Sun, J., Zhang, X., Liu, M., Tang, G., Tang, Q., Hu, H., Huang, R.-J., Wang, H., Zheng, Y., Qin, Y., Guo, S., Hu, M., and Zhu, T.: Widespread 2013–2020 decreases and reduction challenges of organic aerosol in China, Nat. Commun., 15, 4465, https://doi.org/10.1038/s41467-024-48902-0, 2024.
Cutler, D. R., Edwards Jr., T. C., Beard, K. H., Cutler, A., Hess, K. T., Gibson, J., and Lawler, J. J.: Random Forests for Classification in Ecology, Ecology, 88, 2783–2792, https://doi.org/10.1890/07-0539.1, 2007.
Ding, Q., Sun, J., Huang, X., Ding, A., Zou, J., Yang, X., and Fu, C.: Impacts of black carbon on the formation of advection–radiation fog during a haze pollution episode in eastern China, Atmos. Chem. Phys., 19, 7759–7774, https://doi.org/10.5194/acp-19-7759-2019, 2019.
Doelling, D. R., Sun, M., Nguyen, L. T., Nordeen, M. L., Haney, C. O., Keyes, D. F., and Mlynczak, P. E.: Advances in Geostationary-Derived Longwave Fluxes for the CERES Synoptic (SYN1deg) Product, J. Atmos. Ocean. Tech., 33, 503–521, https://doi.org/10.1175/JTECH-D-15-0147.1, 2016.
Du, H., Li, J., Wang, Z., Chen, X., Yang, W., Sun, Y., Xin, J., Pan, X., Wang, W., Ye, Q., and Dao, X.: Assessment of the effect of meteorological and emission variations on winter PM2.5 over the North China Plain in the three-year action plan against air pollution in 2018–2020, Atmos. Res., 280, 106395, https://doi.org/10.1016/j.atmosres.2022.106395, 2022.
Elias, T., Haeffelin, M., Drobinski, P., Gomes, L., Rangognio, J., Bergot, T., Chazette, P., Raut, J.-C., and Colomb, M.: Particulate contribution to extinction of visible radiation: Pollution, haze, and fog, Atmos. Res., 92, 443–454, https://doi.org/10.1016/j.atmosres.2009.01.006, 2009.
Fillmore, D. W., Rutan, D. A., Kato, S., Rose, F. G., and Caldwell, T. E.: Evaluation of aerosol optical depths and clear-sky radiative fluxes of the CERES Edition 4.1 SYN1deg data product, Atmos. Chem. Phys., 22, 10115–10137, https://doi.org/10.5194/acp-22-10115-2022, 2022.
Gao, Y., Zhao, C., Liu, X., Zhang, M., and Leung, L. R.: WRF-Chem simulations of aerosols and anthropogenic aerosol radiative forcing in East Asia, Atmos. Environ., 92, 250–266, https://doi.org/10.1016/j.atmosenv.2014.04.038, 2014.
Geng, G., Xiao, Q., Liu, S., Liu, X., Cheng, J., Zheng, Y., Xue, T., Tong, D., Zheng, B., Peng, Y., Huang, X., He, K., and Zhang, Q.: Tracking Air Pollution in China: Near Real-Time PM2.5 Retrievals from Multisource Data Fusion, Environ. Sci. Technol., 55, 12106–12115, https://doi.org/10.1021/acs.est.1c01863, 2021.
Guo, J., Liu, H., Li, Z., Rosenfeld, D., Jiang, M., Xu, W., Jiang, J. H., He, J., Chen, D., Min, M., and Zhai, P.: Aerosol-induced changes in the vertical structure of precipitation: a perspective of TRMM precipitation radar, Atmos. Chem. Phys., 18, 13329–13343, https://doi.org/10.5194/acp-18-13329-2018, 2018.
Haywood, J. and Boucher, O.: Estimates of the direct and indirect radiative forcing due to tropospheric aerosols: A review, Rev. Geophys., 38, 513–543, https://doi.org/10.1029/1999RG000078, 2000.
Hersbach, H., Bell, B., Berrisford, P., Hirahara, S., Horányi, A., Muñoz-Sabater, J., Nicolas, J., Peubey, C., Radu, R., Schepers, D., Simmons, A., Soci, C., Abdalla, S., Abellan, X., Balsamo, G., Bechtold, P., Biavati, G., Bidlot, J., Bonavita, M., De Chiara, G., Dahlgren, P., Dee, D., Diamantakis, M., Dragani, R., Flemming, J., Forbes, R., Fuentes, M., Geer, A., Haimberger, L., Healy, S., Hogan, R. J., Hólm, E., Janisková, M., Keeley, S., Laloyaux, P., Lopez, P., Lupu, C., Radnoti, G., de Rosnay, P., Rozum, I., Vamborg, F., Villaume, S., and Thépaut, J.-N.: The ERA5 global reanalysis, Q. J. Roy. Meteor. Soc., 146, 1999–2049, https://doi.org/10.1002/qj.3803, 2020.
Hersbach, H., Bell, B., Berrisford, P., Biavati, G., Horányi, A., Muñoz Sabater, J., Nicolas, J., Peubey, C., Radu, R., Rozum, I., Schepers, D., Simmons, A., Soci, C., Dee, D., and Thépaut, J.-N.: ERA5 hourly data on pressure levels from 1940 to present, Copernicus Climate Change Service (C3S) Climate Data Store (CDS) [data set], https://doi.org/10.24381/cds.bd0915c6, 2023.
Hoffmann, L., Günther, G., Li, D., Stein, O., Wu, X., Griessbach, S., Heng, Y., Konopka, P., Müller, R., Vogel, B., and Wright, J. S.: From ERA-Interim to ERA5: the considerable impact of ECMWF's next-generation reanalysis on Lagrangian transport simulations, Atmos. Chem. Phys., 19, 3097–3124, https://doi.org/10.5194/acp-19-3097-2019, 2019.
Hou, X., Zhu, B., Kumar, K. R., and Lu, W.: Inter-annual variability in fine particulate matter pollution over China during 2013–2018: Role of meteorology, Atmos. Environ., 214, 116842, https://doi.org/10.1016/j.atmosenv.2019.116842, 2019.
Huang, X., Ding, A., Liu, L., Liu, Q., Ding, K., Niu, X., Nie, W., Xu, Z., Chi, X., Wang, M., Sun, J., Guo, W., and Fu, C.: Effects of aerosol–radiation interaction on precipitation during biomass-burning season in East China, Atmos. Chem. Phys., 16, 10063–10082, https://doi.org/10.5194/acp-16-10063-2016, 2016.
Iftikhar, M., Alam, K., Sorooshian, A., Syed, W. A., Bibi, S., and Bibi, H.: Contrasting aerosol optical and radiative properties between dust and urban haze episodes in megacities of Pakistan, Atmos. Environ., 173, 157–172, https://doi.org/10.1016/j.atmosenv.2017.11.011, 2018.
Ji, Y., Zhang, Y., Liu, D., Zhang, K., Cai, P., Zhu, B., Zhang, B., Xian, J., Wang, H., and Ge, X.: Using machine learning to quantify drivers of aerosol pollution trend in China from 2015 to 2022, Appl. Geochem., 151, 105614, https://doi.org/10.1016/j.apgeochem.2023.105614, 2023.
Jin, S., Ma, Y., Zhang, M., Gong, W., Lei, L., and Ma, X.: Comparation of aerosol optical properties and associated radiative effects of air pollution events between summer and winter: A case study in January and July 2014 over Wuhan, Central China, Atmos. Environ., 218, 117004, https://doi.org/10.1016/j.atmosenv.2019.117004, 2019.
Jin, X., Cai, X., Yu, M., Song, Y., Wang, X., Kang, L., and Zhang, H.: Diagnostic analysis of wintertime PM2.5 pollution in the North China Plain: The impacts of regional transport and atmospheric boundary layer variation, Atmos. Environ., 224, 117346, https://doi.org/10.1016/j.atmosenv.2020.117346, 2020.
Jin, X., Cai, X., Yu, M., Wang, X., Song, Y., Wang, X., Zhang, H., and Zhu, T.: Regional PM2.5 pollution confined by atmospheric internal boundaries in the North China Plain: Analysis based on surface observations, Sci. Total Environ., 841, 156728, https://doi.org/10.1016/j.scitotenv.2022.156728, 2022.
Jones, A., Roberts, D. L., and Slingo, A.: A climate model study of indirect radiative forcing by anthropogenic sulphate aerosols, Nature, 370, 450–453, https://doi.org/10.1038/370450a0, 1994.
Jun, T. and Rind, D.: Increasing contribution of the atmospheric vertical motion to precipitation in a warming climate, Commun. Earth Environ., 5, 541, https://doi.org/10.1038/s43247-024-01676-1, 2024.
Kajino, M., Ueda, H., Han, Z., Kudo, R., Inomata, Y., and Kaku, H.: Synergy between air pollution and urban meteorological changes through aerosol-radiation-diffusion feedback – A case study of Beijing in January 2013, Atmos. Environ., 171, 98–110, https://doi.org/10.1016/j.atmosenv.2017.10.018, 2017.
Khoshsima, M., Ahmadi-Givi, F., Bidokhti, A. A., and Sabetghadam, S.: Impact of meteorological parameters on relation between aerosol optical indices and air pollution in a sub-urban area, J. Aerosol Sci., 68, 46–57, https://doi.org/10.1016/j.jaerosci.2013.10.008, 2014.
Kim, D. and Ramanathan, V.: Solar radiation budget and radiative forcing due to aerosols and clouds, J. Geophys. Res.-Atmos., 113, https://doi.org/10.1029/2007JD008434, 2008.
Kleine Deters, J., Zalakeviciute, R., Gonzalez, M., and Rybarczyk, Y.: Modeling PM2.5 Urban Pollution Using Machine Learning and Selected Meteorological Parameters, Journal of Electrical and Computer Engineering, 2017, 5106045, https://doi.org/10.1155/2017/5106045, 2017.
Kumar, S., Srivastava, A. K., Pathak, V., Bisht, D. S., and Tiwari, S.: Surface solar radiation and its association with aerosol characteristics at an urban station in the Indo-Gangetic Basin: Implication to radiative effect, J. Atmos. Sol.-Terr. Phy., 193, 105061, https://doi.org/10.1016/j.jastp.2019.105061, 2019.
Li, J., Wu, Y., Ren, L., Wang, W., Tao, J., Gao, Y., Li, G., Yang, X., Han, Z., and Zhang, R.: Variation in PM2.5 sources in central North China Plain during 2017–2019: Response to mitigation strategies, J. Environ. Manage., 288, 112370, https://doi.org/10.1016/j.jenvman.2021.112370, 2021.
Li, J., Zhao, C., Sun, Y., Zhao, X., Yang, J., Yang, Y., Chen, A., and Zhou, Y.: Distinct Aerosol Impacts on Local Scale Convective Rainfall Between Sichuan Basin and North China Plain Regions in China, J. Geophys. Res.-Atmos., 130, e2024JD042649, https://doi.org/10.1029/2024JD042649, 2025.
Li, Q., Wu, B., Liu, J., Zhang, H., Cai, X., and Song, Y.: Characteristics of the atmospheric boundary layer and its relation with PM2.5 during haze episodes in winter in the North China Plain, Atmos. Environ., 223, 117265, https://doi.org/10.1016/j.atmosenv.2020.117265, 2020.
Li, Z., Niu, F., Fan, J., Liu, Y., Rosenfeld, D., and Ding, Y.: Long-term impacts of aerosols on the vertical development of clouds and precipitation, Nat. Geosci., 4, 888–894, https://doi.org/10.1038/ngeo1313, 2011.
Li, Z. Q., Xu, H., Li, K. T., Li, D. H., Xie, Y. S., Li, L., Zhang, Y., Gu, X. F., Zhao, W., Tian, Q. J., Deng, R. R., Su, X. L., Huang, B., Qiao, Y. L., Cui, W. Y., Hu, Y., Gong, C. L., Wang, Y. Q., Wang, X. F., Wang, J. P., Du, W. B., Pan, Z. Q., Li, Z. Z., and Bu, D.: Comprehensive Study of Optical, Physical, Chemical, and Radiative Properties of Total Columnar Atmospheric Aerosols over China: An Overview of Sun–Sky Radiometer Observation Network (SONET) Measurements, B. Am. Meteorol. Soc., 99, 739–755, https://doi.org/10.1175/BAMS-D-17-0133.1, 2018.
Liang, X., Li, S., Zhang, S., Huang, H., and Chen, S. X.: PM2.5 data reliability, consistency, and air quality assessment in five Chinese cities, J. Geophys. Res.-Atmos., 121, 10220–10236, https://doi.org/10.1002/2016JD024877, 2016.
Lin, Y., Wang, Y., Pan, B., Hu, J., Guo, S., Levy Zamora, M., Tian, P., Su, Q., Ji, Y., Zhao, J., Gomez-Hernandez, M., Hu, M., and Zhang, R.: Formation, radiative forcing, and climatic effects of severe regional haze, Atmos. Chem. Phys., 22, 4951–4967, https://doi.org/10.5194/acp-22-4951-2022, 2022.
Liu, L., Zhang, X., Zhong, J., Wang, J., and Yang, Y.: The `two-way feedback mechanism' between unfavorable meteorological conditions and cumulative PM2.5 mass existing in polluted areas south of Beijing, Atmos. Environ., 208, 1–9, https://doi.org/10.1016/j.atmosenv.2019.02.050, 2019a.
Liu, S., Xing, J., Zhao, B., Wang, J., Wang, S., Zhang, X., and Ding, A.: Understanding of Aerosol–Climate Interactions in China: Aerosol Impacts on Solar Radiation, Temperature, Cloud, and Precipitation and Its Changes Under Future Climate and Emission Scenarios, Curr. Pollution Rep., 5, 36–51, https://doi.org/10.1007/s40726-019-00107-6, 2019b.
Lloyd, S.: Least squares quantization in PCM, IEEE T. Inform. Theory, 28, 129–137, https://doi.org/10.1109/TIT.1982.1056489, 1982.
López-Romero, J. M., Montávez, J. P., Jerez, S., Lorente-Plazas, R., Palacios-Peña, L., and Jiménez-Guerrero, P.: Precipitation response to aerosol–radiation and aerosol–cloud interactions in regional climate simulations over Europe, Atmos. Chem. Phys., 21, 415–430, https://doi.org/10.5194/acp-21-415-2021, 2021.
Luo, C., Mahowald, N. M., and del Corral, J.: Sensitivity study of meteorological parameters on mineral aerosol mobilization, transport, and distribution, J. Geophys. Res.-Atmos., 108, https://doi.org/10.1029/2003JD003483, 2003.
Luo, H., Han, Y., Lu, C., Yang, J., and Wu, Y.: Characteristics of Surface Solar Radiation under Different Air Pollution Conditions over Nanjing, China: Observation and Simulation, Adv. Atmos. Sci., 36, 1047–1059, https://doi.org/10.1007/s00376-019-9010-4, 2019.
Ma, S., Shao, M., Zhang, Y., Dai, Q., and Xie, M.: Sensitivity of PM2.5 and O3 pollution episodes to meteorological factors over the North China Plain, Sci. Total Environ., 792, 148474, https://doi.org/10.1016/j.scitotenv.2021.148474, 2021.
Ma, Y., Zhang, M., Jin, S., Gong, W., Chen, N., Chen, Z., Jin, Y., and Shi, Y.: Long-Term Investigation of Aerosol Optical and Radiative Characteristics in a Typical Megacity of Central China During Winter Haze Periods, J. Geophys. Res.-Atmos., 124, 12093–12106, https://doi.org/10.1029/2019JD030840, 2019.
Mao, Q. and Wan, H.: Study on the Characteristics of Aerosol Radiative Forcing under Complex Pollution Conditions in Beijing, Atmosphere, 13, 501, https://doi.org/10.3390/atmos13030501, 2022.
Mishra, A. K., Koren, I., and Rudich, Y.: Effect of aerosol vertical distribution on aerosol-radiation interaction: A theoretical prospect, Heliyon, 1, https://doi.org/10.1016/j.heliyon.2015.e00036, 2015.
Park, R. J., Stenchikov, G. L., Pickering, K. E., Dickerson, R. R., Allen, D. J., and Kondragunta, S.: Regional air pollution and its radiative forcing: Studies with a single-column chemical and radiation transport model, J. Geophys. Res.-Atmos., 106, 28751–28770, https://doi.org/10.1029/2001JD001182, 2001.
Peng, J., Han, H., Yi, Y., Huang, H., and Xie, L.: Machine learning and deep learning modeling and simulation for predicting PM2.5 concentrations, Chemosphere, 308, 136353, https://doi.org/10.1016/j.chemosphere.2022.136353, 2022.
Qian, Y., Gong, D., Fan, J., Leung, L. R., Bennartz, R., Chen, D., and Wang, W.: Heavy pollution suppresses light rain in China: Observations and modeling, J. Geophys. Res.-Atmos., 114, https://doi.org/10.1029/2008JD011575, 2009.
Quan, J., Tie, X., Zhang, Q., Liu, Q., Li, X., Gao, Y., and Zhao, D.: Characteristics of heavy aerosol pollution during the 2012–2013 winter in Beijing, China, Atmos. Environ., 88, 83–89, https://doi.org/10.1016/j.atmosenv.2014.01.058, 2014.
Ren, X., Wu, J., Gong, C., Gao, W., Zhao, D., Ma, Y., and Xin, J.: The relationship between PM2.5 pollution and aerosol radiative forcing in a heavy industrial city, Taiyuan, in China, Atmos. Res., 267, 105935, https://doi.org/10.1016/j.atmosres.2021.105935, 2022.
Rutan, D. A., Kato, S., Doelling, D. R., Rose, F. G., Nguyen, L. T., Caldwell, T. E., and Loeb, N. G.: CERES Synoptic Product: Methodology and Validation of Surface Radiant Flux, J. Atmos. Ocean. Tech., 32, 1121–1143, https://doi.org/10.1175/JTECH-D-14-00165.1, 2015.
Shiraiwa, M., Ueda, K., Pozzer, A., Lammel, G., Kampf, C. J., Fushimi, A., Enami, S., Arangio, A. M., Fröhlich-Nowoisky, J., Fujitani, Y., Furuyama, A., Lakey, P. S. J., Lelieveld, J., Lucas, K., Morino, Y., Pöschl, U., Takahama, S., Takami, A., Tong, H., Weber, B., Yoshino, A., and Sato, K.: Aerosol Health Effects from Molecular to Global Scales, Environ. Sci. Technol., 51, 13545–13567, https://doi.org/10.1021/acs.est.7b04417, 2017.
Song, Q., Huang, L., Zhang, Y., Li, Z., Wang, S., Zhao, B., Yin, D., Ma, M., Li, S., Liu, B., Zhu, L., Chang, X., Gao, D., Jiang, Y., Dong, Z., Shi, H., and Hao, J.: Driving Factors of PM2.5 Pollution Rebound in North China Plain in Early 2023, Environ. Sci. Technol. Lett., 12, 305–312, https://doi.org/10.1021/acs.estlett.4c01153, 2025.
Song, X., Jia, J., Wu, F., Niu, H., Ma, Q., Guo, B., Shao, L., and Zhang, D.: Local emissions and secondary pollutants cause severe PM2.5 elevation in urban air at the south edge of the North China Plain: Results from winter haze of 2017–2018 at a mega city, Sci. Total Environ., 802, 149630, https://doi.org/10.1016/j.scitotenv.2021.149630, 2022.
Stier, P., van den Heever, S. C., Christensen, M. W., Gryspeerdt, E., Dagan, G., Saleeby, S. M., Bollasina, M., Donner, L., Emanuel, K., Ekman, A. M. L., Feingold, G., Field, P., Forster, P., Haywood, J., Kahn, R., Koren, I., Kummerow, C., L'Ecuyer, T., Lohmann, U., Ming, Y., Myhre, G., Quaas, J., Rosenfeld, D., Samset, B., Seifert, A., Stephens, G., and Tao, W.-K.: Multifaceted aerosol effects on precipitation, Nat. Geosci., 17, 719–732, https://doi.org/10.1038/s41561-024-01482-6, 2024.
Stoerk, T.: Statistical corruption in Beijing's air quality data has likely ended in 2012, Atmos. Environ., 127, 365–371, https://doi.org/10.1016/j.atmosenv.2015.12.055, 2016.
Sun, M., Xie, Z., Yao, X., Wang, S., and Dong, L.: Multilayer temperature inversion structures and their potential impact on atmospheric pollution in northwest China, Atmos. Environ., 343, 120998, https://doi.org/10.1016/j.atmosenv.2024.120998, 2025.
Sun, N., Fu, Y., Zhong, L., and Li, R.: Aerosol effects on the vertical structure of precipitation in East China, npj Clim. Atmos. Sci., 5, 60, https://doi.org/10.1038/s41612-022-00284-0, 2022.
Sweerts, B., Pfenninger, S., Yang, S., Folini, D., van der Zwaan, B., and Wild, M.: Estimation of losses in solar energy production from air pollution in China since 1960 using surface radiation data, Nat. Energy, 4, 657–663, https://doi.org/10.1038/s41560-019-0412-4, 2019.
Tao, J., Zhang, L., Cao, J., Zhong, L., Chen, D., Yang, Y., Chen, D., Chen, L., Zhang, Z., Wu, Y., Xia, Y., Ye, S., and Zhang, R.: Source apportionment of PM2.5 at urban and suburban areas of the Pearl River Delta region, south China – With emphasis on ship emissions, Sci. Total Environ., 574, 1559–1570, https://doi.org/10.1016/j.scitotenv.2016.08.175, 2017.
Tao, W.-K., Chen, J.-P., Li, Z., Wang, C., and Zhang, C.: Impact of aerosols on convective clouds and precipitation, Rev. Geophys., 50, https://doi.org/10.1029/2011RG000369, 2012.
Tie, X., Huang, R.-J., Dai, W., Cao, J., Long, X., Su, X., Zhao, S., Wang, Q., and Li, G.: Effect of heavy haze and aerosol pollution on rice and wheat productions in China, Sci. Rep., 6, 29612, https://doi.org/10.1038/srep29612, 2016.
Tiwari, S., Pandithurai, G., Attri, S. D., Srivastava, A. K., Soni, V. K., Bisht, D. S., Anil Kumar, V., and Srivastava, M. K.: Aerosol optical properties and their relationship with meteorological parameters during wintertime in Delhi, India, Atmos. Res., 153, 465–479, https://doi.org/10.1016/j.atmosres.2014.10.003, 2015.
Wang, J., Wang, S., Jiang, J., Ding, A., Zheng, M., Zhao, B., Wong, D. C., Zhou, W., Zheng, G., Wang, L., Pleim, J. E., and Hao, J.: Impact of aerosol–meteorology interactions on fine particle pollution during China's severe haze episode in January 2013, Environ. Res. Lett., 9, 094002, https://doi.org/10.1088/1748-9326/9/9/094002, 2014.
Wang, X. and Sun, W.: Meteorological parameters and gaseous pollutant concentrations as predictors of daily continuous PM2.5 concentrations using deep neural network in Beijing–Tianjin–Hebei, China, Atmos. Environ., 211, 128–137, https://doi.org/10.1016/j.atmosenv.2019.05.004, 2019.
Wang, Y., Li, W., Gao, W., Liu, Z., Tian, S., Shen, R., Ji, D., Wang, S., Wang, L., Tang, G., Song, T., Cheng, M., Wang, G., Gong, Z., Hao, J., and Zhang, Y.: Trends in particulate matter and its chemical compositions in China from 2013–2017, Sci. China Earth Sci., 62, 1857–1871, https://doi.org/10.1007/s11430-018-9373-1, 2019.
Wen, W., Ma, X., Guo, C., Zhao, X., Xu, J., Liu, L., Wu, H., Zhou, W., and Zhang, Z.: The Aerosol-Radiation Interaction Effects of Different Particulate Matter Components during Heavy Pollution Periods in China, Atmosphere, 11, 254, https://doi.org/10.3390/atmos11030254, 2020.
Wingo, M. T. and Cecil, D. J.: Effects of Vertical Wind Shear on Tropical Cyclone Precipitation, Mon. Weather Rev., 138, 645–662, https://doi.org/10.1175/2009MWR2921.1, 2010.
Wolf, T., Esau, I., and Reuder, J.: Analysis of the vertical temperature structure in the Bergen valley, Norway, and its connection to pollution episodes, J. Geophys. Res.-Atmos., 119, 10645–10662, https://doi.org/10.1002/2014JD022085, 2014.
Wu, J., Bei, N., Li, X., Cao, J., Feng, T., Wang, Y., Tie, X., and Li, G.: Widespread air pollutants of the North China Plain during the Asian summer monsoon season: a case study, Atmos. Chem. Phys., 18, 8491–8504, https://doi.org/10.5194/acp-18-8491-2018, 2018.
Xiang, Y., Zhang, T., Liu, J., Lv, L., Dong, Y., and Chen, Z.: Atmosphere boundary layer height and its effect on air pollutants in Beijing during winter heavy pollution, Atmos. Res., 215, 305–316, https://doi.org/10.1016/j.atmosres.2018.09.014, 2019.
Xiao, Z., Zhu, S., Miao, Y., Yu, Y., and Che, H.: On the relationship between convective precipitation and aerosol pollution in North China Plain during autumn and winter, Atmos. Res., 271, 106120, https://doi.org/10.1016/j.atmosres.2022.106120, 2022.
Zeng, Z., Gui, K., Wang, Z., Luo, M., Geng, H., Ge, E., An, J., Song, X., Ning, G., Zhai, S., and Liu, H.: Estimating hourly surface PM2.5 concentrations across China from high-density meteorological observations by machine learning, Atmos. Res., 254, 105516, https://doi.org/10.1016/j.atmosres.2021.105516, 2021.
Zhang, B., Wang, Y., and Hao, J.: Simulating aerosol–radiation–cloud feedbacks on meteorology and air quality over eastern China under severe haze conditionsin winter, Atmos. Chem. Phys., 15, 2387–2404, https://doi.org/10.5194/acp-15-2387-2015, 2015.
Zhang, H., Cheng, S., Yao, S., Wang, X., and Wang, C.: Insights into the temporal and spatial characteristics of PM2.5 transport flux across the district, city and region in the North China Plain, Atmos. Environ., 218, 117010, https://doi.org/10.1016/j.atmosenv.2019.117010, 2019.
Zhang, Q., Ma, Q., Zhao, B., Liu, X., Wang, Y., Jia, B., and Zhang, X.: Winter haze over North China Plain from 2009 to 2016: Influence of emission and meteorology, Environ. Pollut., 242, 1308–1318, https://doi.org/10.1016/j.envpol.2018.08.019, 2018.
Zhao, C., Sun, Y., Yang, J., Li, J., Zhou, Y., Yang, Y., Fan, H., and Zhao, X.: Observational evidence and mechanisms of aerosol effects on precipitation, Sci. Bull., 69, 1569–1580, https://doi.org/10.1016/j.scib.2024.03.014, 2024.
Zhao, X., Zhao, X., Liu, P., Ye, C., Xue, C., Zhang, C., Zhang, Y., Liu, C., Liu, J., Chen, H., Chen, J., and Mu, Y.: Pollution levels, composition characteristics and sources of atmospheric PM2.5 in a rural area of the North China Plain during winter, J. Environ. Sci., 95, 172–182, https://doi.org/10.1016/j.jes.2020.03.053, 2020.
Zheng, Y., Che, H., Yang, L., Chen, J., Wang, Y., Xia, X., Zhao, H., Wang, H., Wang, D., Gui, K., An, L., Sun, T., Yu, J., Kuang, X., Li, X., Sun, E., Zhao, D., Yang, D., Guo, Z., Zhao, T., and Zhang, X.: Optical and radiative properties of aerosols during a severe haze episode over the North China Plain in December 2016, J. Meteorol. Res., 31, 1045–1061, https://doi.org/10.1007/s13351-017-7073-7, 2017.
Zhong, J., Zhang, X., Dong, Y., Wang, Y., Liu, C., Wang, J., Zhang, Y., and Che, H.: Feedback effects of boundary-layer meteorological factors on cumulative explosive growth of PM2.5 during winter heavy pollution episodes in Beijing from 2013 to 2016, Atmos. Chem. Phys., 18, 247–258, https://doi.org/10.5194/acp-18-247-2018, 2018a.
Zhong, J., Zhang, X., Wang, Y., Liu, C., and Dong, Y.: Heavy aerosol pollution episodes in winter Beijing enhanced by radiative cooling effects of aerosols, Atmos. Res., 209, 59–64, https://doi.org/10.1016/j.atmosres.2018.03.011, 2018b.