the Creative Commons Attribution 4.0 License.
the Creative Commons Attribution 4.0 License.
 | 24 Apr 2026
Measurement report: Ice nucleation ability of perthite feldspar powder
Julia Canet
Laura Rodríguez
Galit Renzer
Pura Alfonso
Mischa Bonn
Konrad Meister
Maite Garcia-Valles
Albert Verdaguer
Feldspars are among the most efficient mineral ice-nucleating particles (INPs) in the atmosphere, yet their ice nucleation behavior varies widely across natural samples. Here, we investigate six feldspar powders selected for their perthitic or anti-perthitic textures and spanning a broad range of K Na compositions. All samples were characterized in terms of mineralogy, bulk and surface chemistry, and microstructure. Droplet-freezing assays revealed consistent onset temperatures between −2 and −4 °C in high-concentration suspensions, suggesting the presence of similar highly active nucleation sites across all tested feldspar types. On the other hand, cumulative and differential freezing spectra showed pronounced differences in the density and distribution of ice nucleation sites, which correlate with both feldspar composition and microtexture. Heterogeneous Underlying-Based (HUB) analysis identified distinct subpopulations of ice nucleation sites. Perthites exhibiting ordered microcline structures showed a continuous increase in nucleation site density with decreasing temperature, whereas samples lacking dominant microcline features displayed plateaus in cumulative spectra over specific temperature ranges, indicating decreased ice nucleation ability of the subpopulation. These results demonstrate that exsolution textures and crystallographic structure play a central role in controlling feldspar ice-nucleation efficiency, with important implications for atmospheric INP parameterizations and cloud microphysics.
- Article
(5852 KB) - Full-text XML
-
Supplement
(2105 KB) - BibTeX
- EndNote


The formation of ice crystals in clouds plays a critical role in Earth's hydrological cycle and climate system, as it influences cloud radiative properties, initiates precipitation, and determines cloud lifetime (Murray et al., 2012, 2021; Burrows et al., 2022; Knopf and Alpert, 2023). In the atmosphere, pure water droplets can supercool to temperatures as low as −38 °C before undergoing homogeneous freezing nucleation. However, most natural clouds are mixed-phase, containing both supercooled liquid droplets and ice crystals. In such clouds, ice formation can occur at much higher temperatures through heterogeneous ice nucleation (IN), which is triggered by some airborne particles collectively known as ice-nucleating particles (INPs). A detailed understanding of INPs and their role in cloud microphysics is crucial for enhancing the accuracy of climate models (Burrows et al., 2022), which are vital tools for forecasting climate change and developing mitigation strategies.
Among known INPs, mineral dust is widely recognized as one of the most influential contributors to heterogeneous IN in the atmosphere (Hoose and Möhler, 2012; Cziczo et al., 2013). These particles are emitted in large quantities through rock weathering and subsequent wind transport, making them a globally abundant source of INPs. More than a decade ago, feldspars, aluminosilicate minerals commonly found in terrestrial dust, were identified as particularly potent INPs, capable of initiating ice formation at significantly warmer temperatures than most other minerals (Atkinson et al., 2013). Since then, considerable research has focused on elucidating the mechanisms that govern ice nucleating efficiency of feldspars (Harrison et al., 2016; Kanji et al., 2017; Whale et al., 2017; Kiselev et al., 2021; Welti et al., 2019).
Previous studies have shown that ice crystals preferentially nucleate on specific crystallographic faces of feldspars (Kiselev et al., 2017), and that crystal defects (Friddle and Thürmer, 2019; Kiselev et al., 2021; Liang et al., 2024) and surface porosity (Pach and Verdaguer, 2019) can substantially enhance IN efficiency at these active sites. Nevertheless, feldspars exhibit a wide range of IN efficiencies. Samples with similar bulk compositions can initiate freezing at markedly different temperatures, ranging from approximately −3 to −20 °C (Kanji et al., 2017; Whale et al., 2017). Comparisons of freezing spectra reveal not only variations in freezing onset temperatures but also pronounced differences in the shape of the efficiency curves (Kanji et al., 2017). While all spectra generally show increasing nucleation efficiency with decreasing temperature, the diversity of spectral shapes complicates direct comparisons and interpretation.
This variability is commonly attributed to the fact that heterogeneous ice nucleation becomes thermodynamically favorable only when a critical ice embryo reaches nanometer-scale dimensions. As a result, nanoscale surface properties – particularly at active sites, i.e., specific surface locations where IN occurs – play a decisive role in determining the freezing behavior of feldspars. As discussed in the literature, features such as crystal defects, surface roughness, porosity, phase boundaries, and other micro- to nanoscale heterogeneities can strongly influence feldspar ice-nucleation activity (Friddle and Thürmer, 2019; Pach and Verdaguer, 2019). However, these features are difficult to control, quantify, or fully characterize. Consequently, predicting the IN potential of a feldspar sample based solely on its bulk chemical or mineralogical composition remains challenging. Nevertheless, it is well established that feldspars with specific crystal structures, such as microcline (Harrison et al., 2016; Whale et al., 2017) and particular chemical compositions such as K Na perthitic intergrowths (Peckhaus et al., 2016; Kiselev et al., 2017) tend to show enhanced nucleation efficiencies. This observation suggests that the nanoscale properties responsible for efficient IN are not entirely independent of macroscopic structural and compositional characteristics.
Feldspars are a group of tectosilicate minerals and constitute one of the most abundant mineral families in Earth's crust. Rock-forming feldspars are aluminosilicates with the general formula AT4O8. A represents potassium (K), sodium (Na), or calcium (Ca), and T represents silicon (Si) and aluminium (Al). In compositional terms, feldspars are conventionally represented within the orthoclase-albite-anorthite (Or–Ab–An) ternary system (Fig. 1a), defined by the endmembers orthoclase (Or; KAlSi3O8), albite (Ab; NaAlSi3O8) and anorthite (An; CaAl2Si2O8); abbreviations follow Warr (2021). The immiscibility between the K-rich and Ca-rich endmembers (Or and An) provides a fundamental basis for feldspar classification. Accordingly, feldspars are subdivided into two binary systems: plagioclase feldspars, compositionally spanning the Ab–An join (NaxCa(1−x)Al(2−x)Si(2+x)O8), and alkali feldspars (Afs), which occupy the Or-Ab join (NaxK(1−x)AlSi3O8).
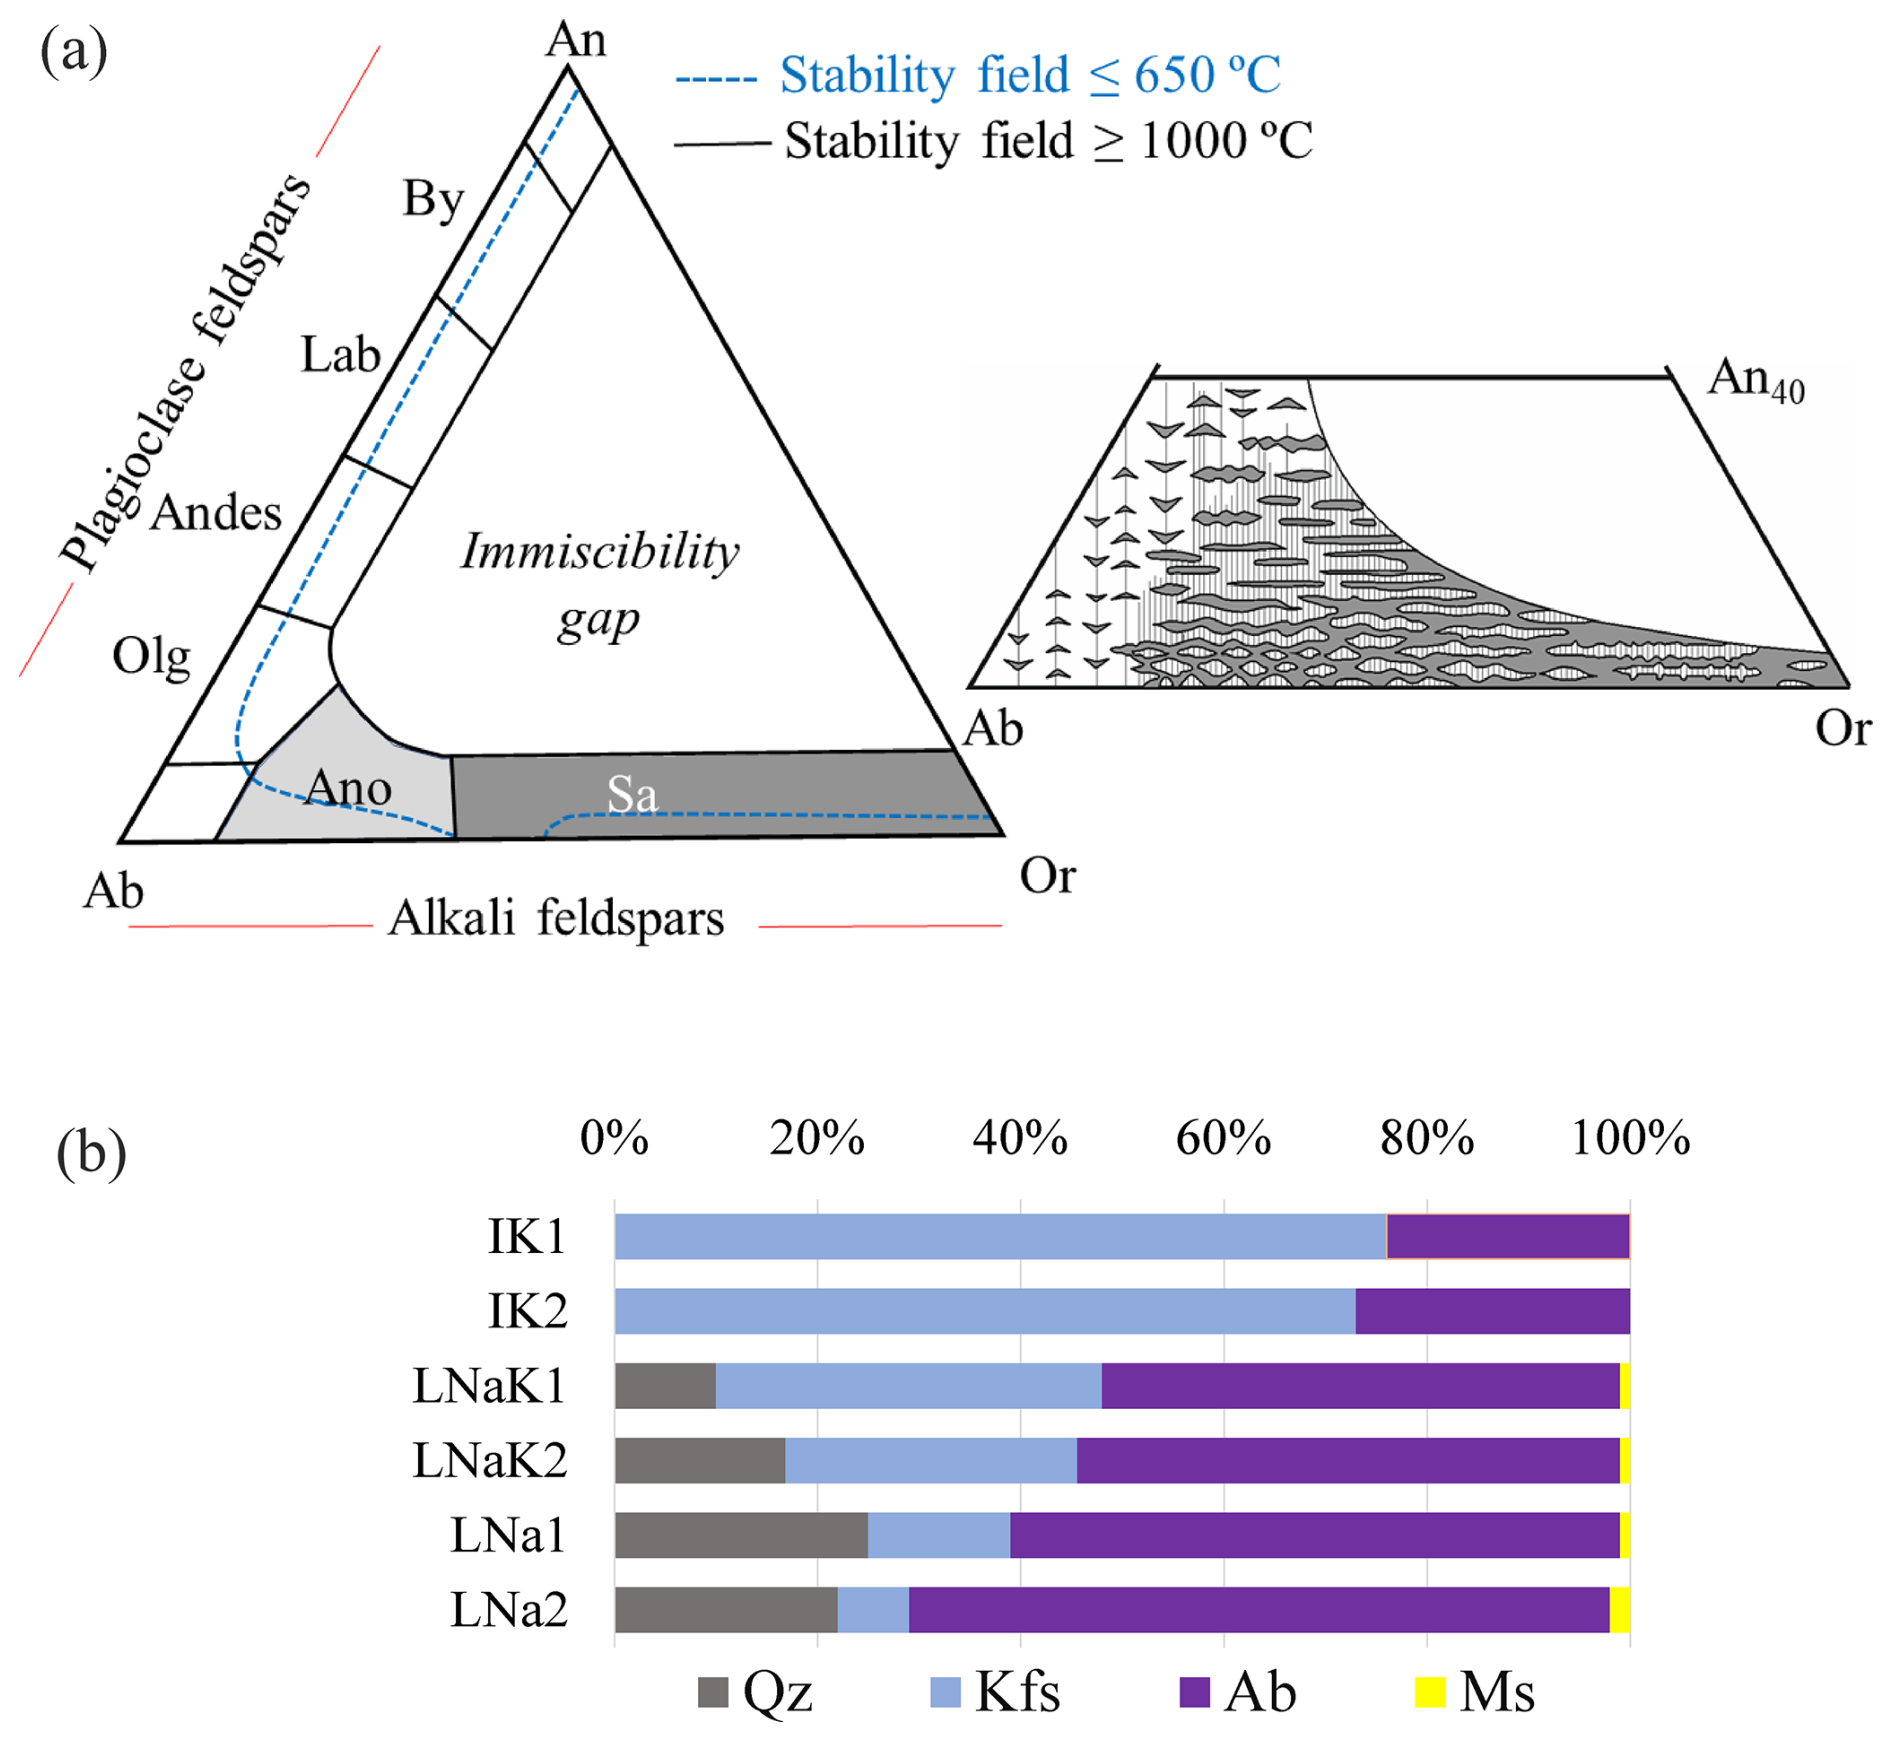
Figure 1(a) Ternary feldspar diagram defined by the endmembers: Or (KAlSi3O8), Ab (NaAlSi3O8), and An (CaAl2Si2O8). Compositions along the Or-Ab join correspond to alkali feldspars, whereas those along the Ab-An join define the plagioclase (Pl) series. The schematic inset illustrates perthitic and anti-perthitic intergrowths of alkali feldspars and their approximate position within the ternary compositional space, modified from Brown and Parsons (1988). (b) Semi-quantitative mineralogical composition (wt %) of the studied materials. Abbreviations: Or, orthoclase; Ab, albite; Olg, oligoclase; Andes, andesine; Lab, labradorite, By, bytownite; An, anorthite; Sa, sanidine; Ano, anorthoclase; Qz, quartz; Kfs, potassic feldspar; and Ms, muscovite.
K-feldspars, (KAlSi3O8), crystallize in three polymorphs: microcline (Mc), which is triclinic and fully ordered with respect to Al–Si distribution; orthoclase (Or), which is monoclinic and partially ordered; and sanidine (Sa), which is monoclinic and highly disordered. Sanidine forms only at high temperatures and is mainly found in acidic volcanic rocks. The Or–Ab solid solution (alkali feldspar) is fully miscible only at high temperatures. Upon cooling, alkali feldspars undergo exsolution, forming intergrowths of Or- and Ab-rich phases. This immiscibility is primarily driven by the large difference in ionic radii between Na and K, which induces lattice strain at low temperatures. A well-known exsolution texture is perthite, consisting of fine albite (Na-rich) lamellae exsolved within a Mc or Or (K-rich) host crystal (Martin et al., 2025). These lamellae are typically subparallel to the (100) crystallographic plane and oriented along the Murchison plane, located between and (Kiselev et al., 2021). In contrast, anti-perthite textures are characterized by K-rich feldspar lamellae exsolved within a Na-rich albite matrix (Ribbe, 2018). The inset of Fig. 1a illustrates the relationship between the molar composition of these intergrowths and the resulting exsolution textures, highlighting the influence of chemical composition on the structural and textural evolution of feldspars during their thermal history. Triclinic K-feldspar (microcline) commonly exhibits twinning according to two perpendicular twin laws – the Albite and Pericline laws – resulting in the characteristic tartan twinning pattern.
K-feldspars – particularly Mc – have consistently been identified as the most efficient mineral ice nucleators (Augustin-Bauditz et al., 2014), while albite has also shown variable, but in some cases significant, ice-nucleating activity (Welti et al., 2019). In contrast, plagioclase feldspars generally exhibit much lower IN efficiency (Harrison et al., 2016). Because alkali feldspars initiate IN at relatively high temperatures, they are especially relevant for mixed-phase cloud formation (Atkinson et al., 2013; Harrison et al., 2016; Kanji et al., 2017). Among these, perthitic and anti-perthitic feldspars are of particular interest, as their exsolution textures introduce nanoscale heterogeneities that are likely to influence the formation and spatial distribution of active icenucleation sites, including activity at temperatures above −5 °C.
Despite their importance, previous studies have reported highly variable freezing spectra for alkali feldspars, even among perthitic samples. Such discrepancies likely arise from uncontrolled differences in sample provenance, crystallographic structure, and microstructural features, as well as from variations in sample preparation and cleaning procedures and experimental conditions, including temperature control and cooling rate, and, particularly for deposition-freezing studies, relative humidity control (Kanji et al., 2017).
To address these issues, we investigate feldspars with perthitic and anti-perthitic textures collected from two well-characterized mining sites. By combining detailed mineralogical and microstructural characterization with quantitative immersion-freezing assays, this study aims to disentangle the respective roles of bulk composition, surface chemistry, and exsolution texture in controlling ice-nucleating efficiency. This controlled approach provides more reproducible insights into the mechanisms by which alkali feldspar structure governs atmospheric IN, thereby narrowing the gap between mineralogical properties and their climatic relevance.
2.1 Materials
Six different feldspar minerals, sourced from two industrial quarries, were investigated for their IN activity. Two K-rich feldspars were sourced directly from the French industrial minerals company Imerys, collected from different extraction fronts. These samples are referred to as ImerysK1 (IK1) and ImerysK2 (IK2). Although the company did not disclose specific mine locations, the samples are known to originate from active industrial operations. Four additional samples were provided by the LLANSÀ, S.A. company, a feldspar quarry located in Llançà, Catalonia, Spain. These included two samples with predominantly Na-rich feldspars and two with a roughly balanced K Na composition, depending on the extraction front. Photographs of the extraction fronts are shown in Fig. S1 of the Supplement. The samples were labeled LlançaNa1 (LNa1), LlançaNa2 (LNa2), LlançaNaK1 (LNaK1), and LlançaNaK2 (LNaK2); see Fig. 1b and Table 1 for the full list and classification of the feldspar minerals used. The bulk rocks were processed in two steps. First, portions of each were crushed and homogenized via ball milling to produce fine powders, primarily for ice nucleation experiments and also for granulometric, chemical, and mineralogical analysis. Second, unprocessed fragments were cut and polished to prepare thin sections and mounts for petrographic and microstructural characterization. This dual approach enabled correlation of ice nucleation behavior with crystallographic structure and surface features of the parent minerals. Ultrapure water (resistivity 18 MΩ cm, pH 6.2), dispensed from a Milli-Q® Integral 3 water purification system (Merck Chemicals GmbH, Darmstadt, Germany), autoclaved at 121 °C for 15 min and filtered through a 0.1 µm bottle top filtration unit (VWR International GmbH, Darmstadt, Germany), was used in all immersion freezing experiments.
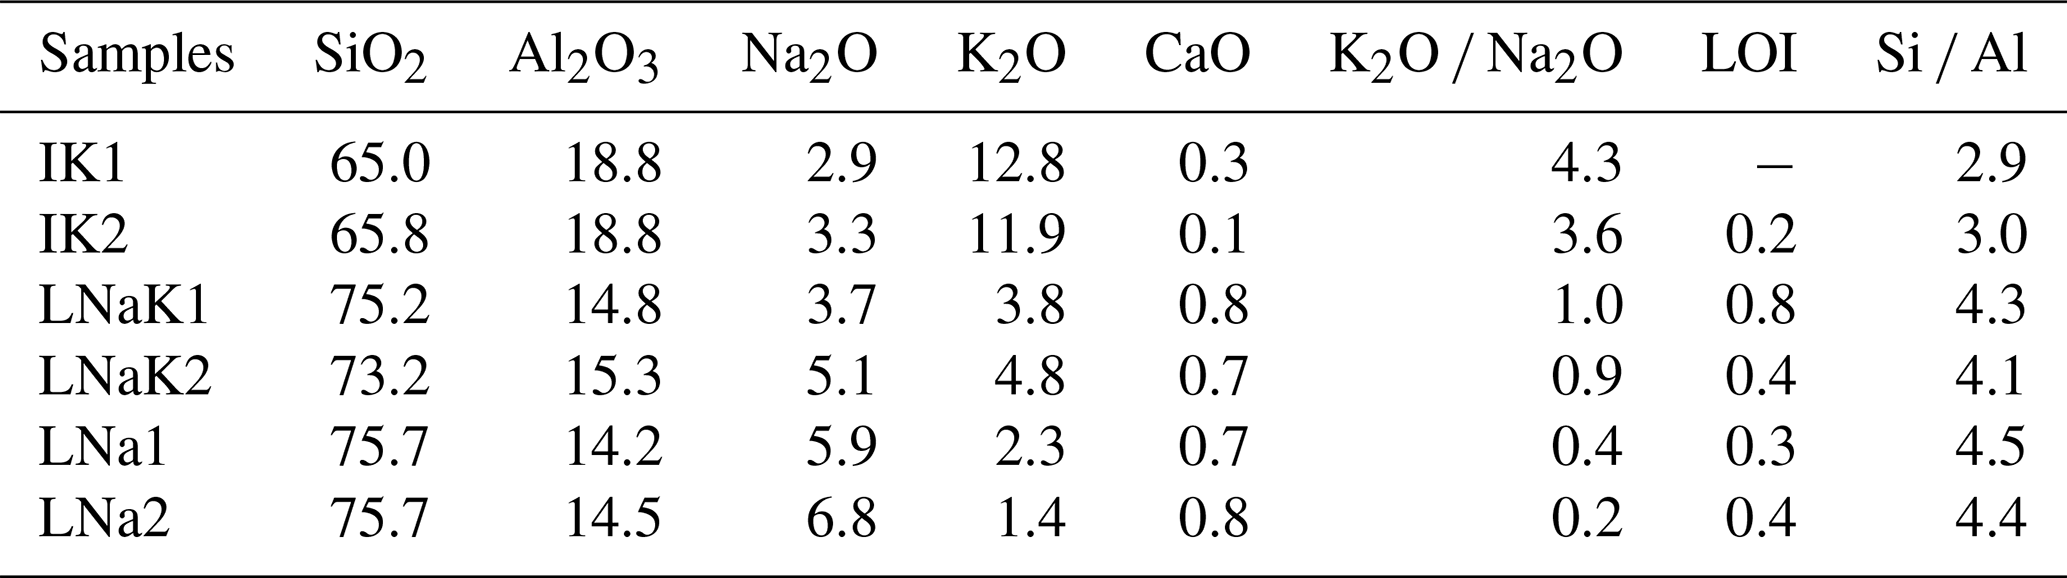
Table 1Bulk chemical composition of the studied feldspar samples, expressed as wt % oxides determined by X-ray fluorescence (XRF). Oxide ratios (K2O Na2O), Loss on ignition (LOI), and Si Al are also reported.
2.2 Chemical and mineral composition
The bulk chemical composition of the feldspar samples was determined using a Philips PW 2400 X-ray fluorescence (XRF) sequential spectrometer located at the Centres Científics i Tecnològics de la Universitat de Barcelona (CCiT-UB). Major oxides were quantified as weight percentages using the fused bead method, while trace elements (in ppm) were measured using pressed powder pellets (see Table 1 and Tables S1 and S2 in the Supplement). Quantification was calibrated against certified geological standards to ensure analytical accuracy. In addition, thermal treatments were conducted to assess Loss on Ignition [ASTM D7348-21].
Mineralogical characterization was conducted through a combination of X-ray diffraction (XRD), Optical Microscope (OM), and Scanning Electron Microscope (SEM). XRD measurements were performed on a PANalytical X'Pert System diffractometer, configured in Bragg-Brentano geometry with Cu Kα radiation (λ=1.54061 Å). Phase identification and semi-quantitative analysis were conducted with the XPert Graphics Identify software (Philips). For microstructural and petrographic examination, double-polished thin sections were observed using a Nikon ACT-1 optical microscope. The same sections were examined using a Hitachi TM-1000 tabletop SEM, coupled with energy-dispersive X-ray spectroscopy (EDS) to analyze microstructural features and verify elemental composition.
2.3 Particle size distribution and specific surface area of feldspar powder
Particle-size distribution (PSD) of the milled feldspar powders were measured by laser diffraction using a Mastersizer 2000 analyzer and its Hydro 2000SM accessory. Powders were dispersed in deionized water, and the suspensions were sonicated for at least 5 min prior to measurement to avoid particle aggregation. The specific surface area (Sa) was determined by N2 adsorption/desorption at 77 K using an ASAP 2020 (Micromeritics Inc.). Prior to measurements, feldspar powders were degassed at 393 K for 24 h. Sa was calculated by applying the Brunauer–Emmett–Teller (BET) method (Brunauer et al., 1938).
2.4 Water freezing ice nucleation measurements
Ice-nucleating behavior was assessed using the immersion-freezing method, which evaluates the temperature at which aqueous droplets containing suspended mineral particles freeze. Feldspar suspensions were serially diluted in ultrapure water using an automated liquid handling station (epMotion ep5073, Eppendorf, Hamburg, Germany) to obtain concentrations of 10 wt %, 5 wt %, 2 wt %, 1 wt %, 0.5 wt %, 0.1 wt %, 0.05 wt %, 0.01 wt % and 0.001 wt %. However, not all concentrations were tested for each feldspar. The 10 wt % and 5 wt % concentrations yielded very similar results and were therefore not both tested for all samples. Additionally, very low concentrations were, in some cases, indistinguishable from pure water experiments and were thus excluded. The tested concentrations are shown in Fig. S4 of the Supplement. For each concentration, 96 droplets of 3 µL were dispensed into two 384-well plates, which were subsequently subjected to IN experiments using the high-throughput Twin-plate Ice Nucleation Assay (TINA), which has been described in detail elsewhere (Kunert et al., 2018). All suspensions were freshly prepared within 2 h prior to the experiments to minimize aging effects, as prolonged water exposure has been shown to modify feldspar IN efficiency (Harrison et al., 2016).
Sample suspensions were cooled from 0 to −30 °C at a constant rate of 1 °C min−1. Droplet freezing was monitored using two infrared cameras (Seek Thermal Compact XR, Seek Thermal Inc., USA), providing a temperature resolution of ±0.2 °C. From the resulting data, the fraction of frozen droplets, fice(T), was calculated as a function of temperature. Cumulative freezing spectra were derived from fice(T) using the approach proposed by Vali (1971, 2014, 2019). Each experiment was performed in triplicate on independent sample batches. Control measurements using pure water showed a background freezing point with an average temperature of −24.3 °C. At concentrations below 0.001 wt %, freezing behavior converged with that of pure water and did not provide additional information on feldspar-induced ice nucleation. Consequently, these data were excluded from the quantitative analysis, which was restricted to temperatures above −20 °C.
3.1 Mineralogical and chemical characterization
The mineralogical composition of the feldspar samples was analyzed using powder XRD, enabling a semi-quantitative assessment of the mineral phases present. The main minerals determined are Na-feldspar, K-feldspar, and quartz (Qz), and a secondary phase is muscovite (KAl(Si3Al)O10(OH,F)2), a mica-type mineral. XRD data indicate that all feldspar samples from the LLANSÀ S.A. mine (LNa1, LNa2, LNaK1, and LNaK2) are richer in Na-feldspar (Ab) than in K-feldspar (Mc or Or). The LNaK samples exhibit a more balanced distribution between the two phases. Quartz and minor muscovite (Ms) are also detected in these samples. In contrast, the Imerys samples (IK1 and IK2) are rich in K-feldspar, with only minor Na-feldspar presence. Neither Qz nor Ms is identified in these latter samples. Semi-quantitative abundances of these mineral phases, expressed as weight percentages, are shown in Fig. 1b.
XRF analysis (Table 1) reveals that IK1 and IK2 contain more than 10 wt % K2O and exhibit K2O Na2O ratios between 3 and 5, consistent with a predominance of K-rich feldspar with respect to plagioclase. In contrast, LNa1 and LNa2 are Na-rich, with Na2O contents exceeding 5 wt % and K2O Na2O ratios well below 1. LNaK1 and LNaK2 show intermediate alkali compositions, with K2O Na2O ratios close to unity. Minor oxides (< 0.5 wt %) are reported in Table S1 in the Supplement, together with full oxide compositions as in Table 1. Loss on ignition (LOI) values are also reported to account for adsorbed water and volatiles, which are found to be negligible. Notably, the Si Al ratio in the Llançà samples is ∼ 4.5, while in the Imerys samples it is closer to 3.0, suggesting the presence of quartz in the former. Although classification based solely on K2O Na2O ratios may be insufficient, the ice-nucleating behavior of the samples correlates closely with this ratio. Furthermore, samples collected from the same extraction front, for example, LNa1 and LNaK1 (see Fig. S1 in the Supplement), exhibit markedly different K Na ratios and correspondingly distinct ice-nucleating behaviors. Therefore, we maintain this classification to facilitate a comprehensive analysis of the results.
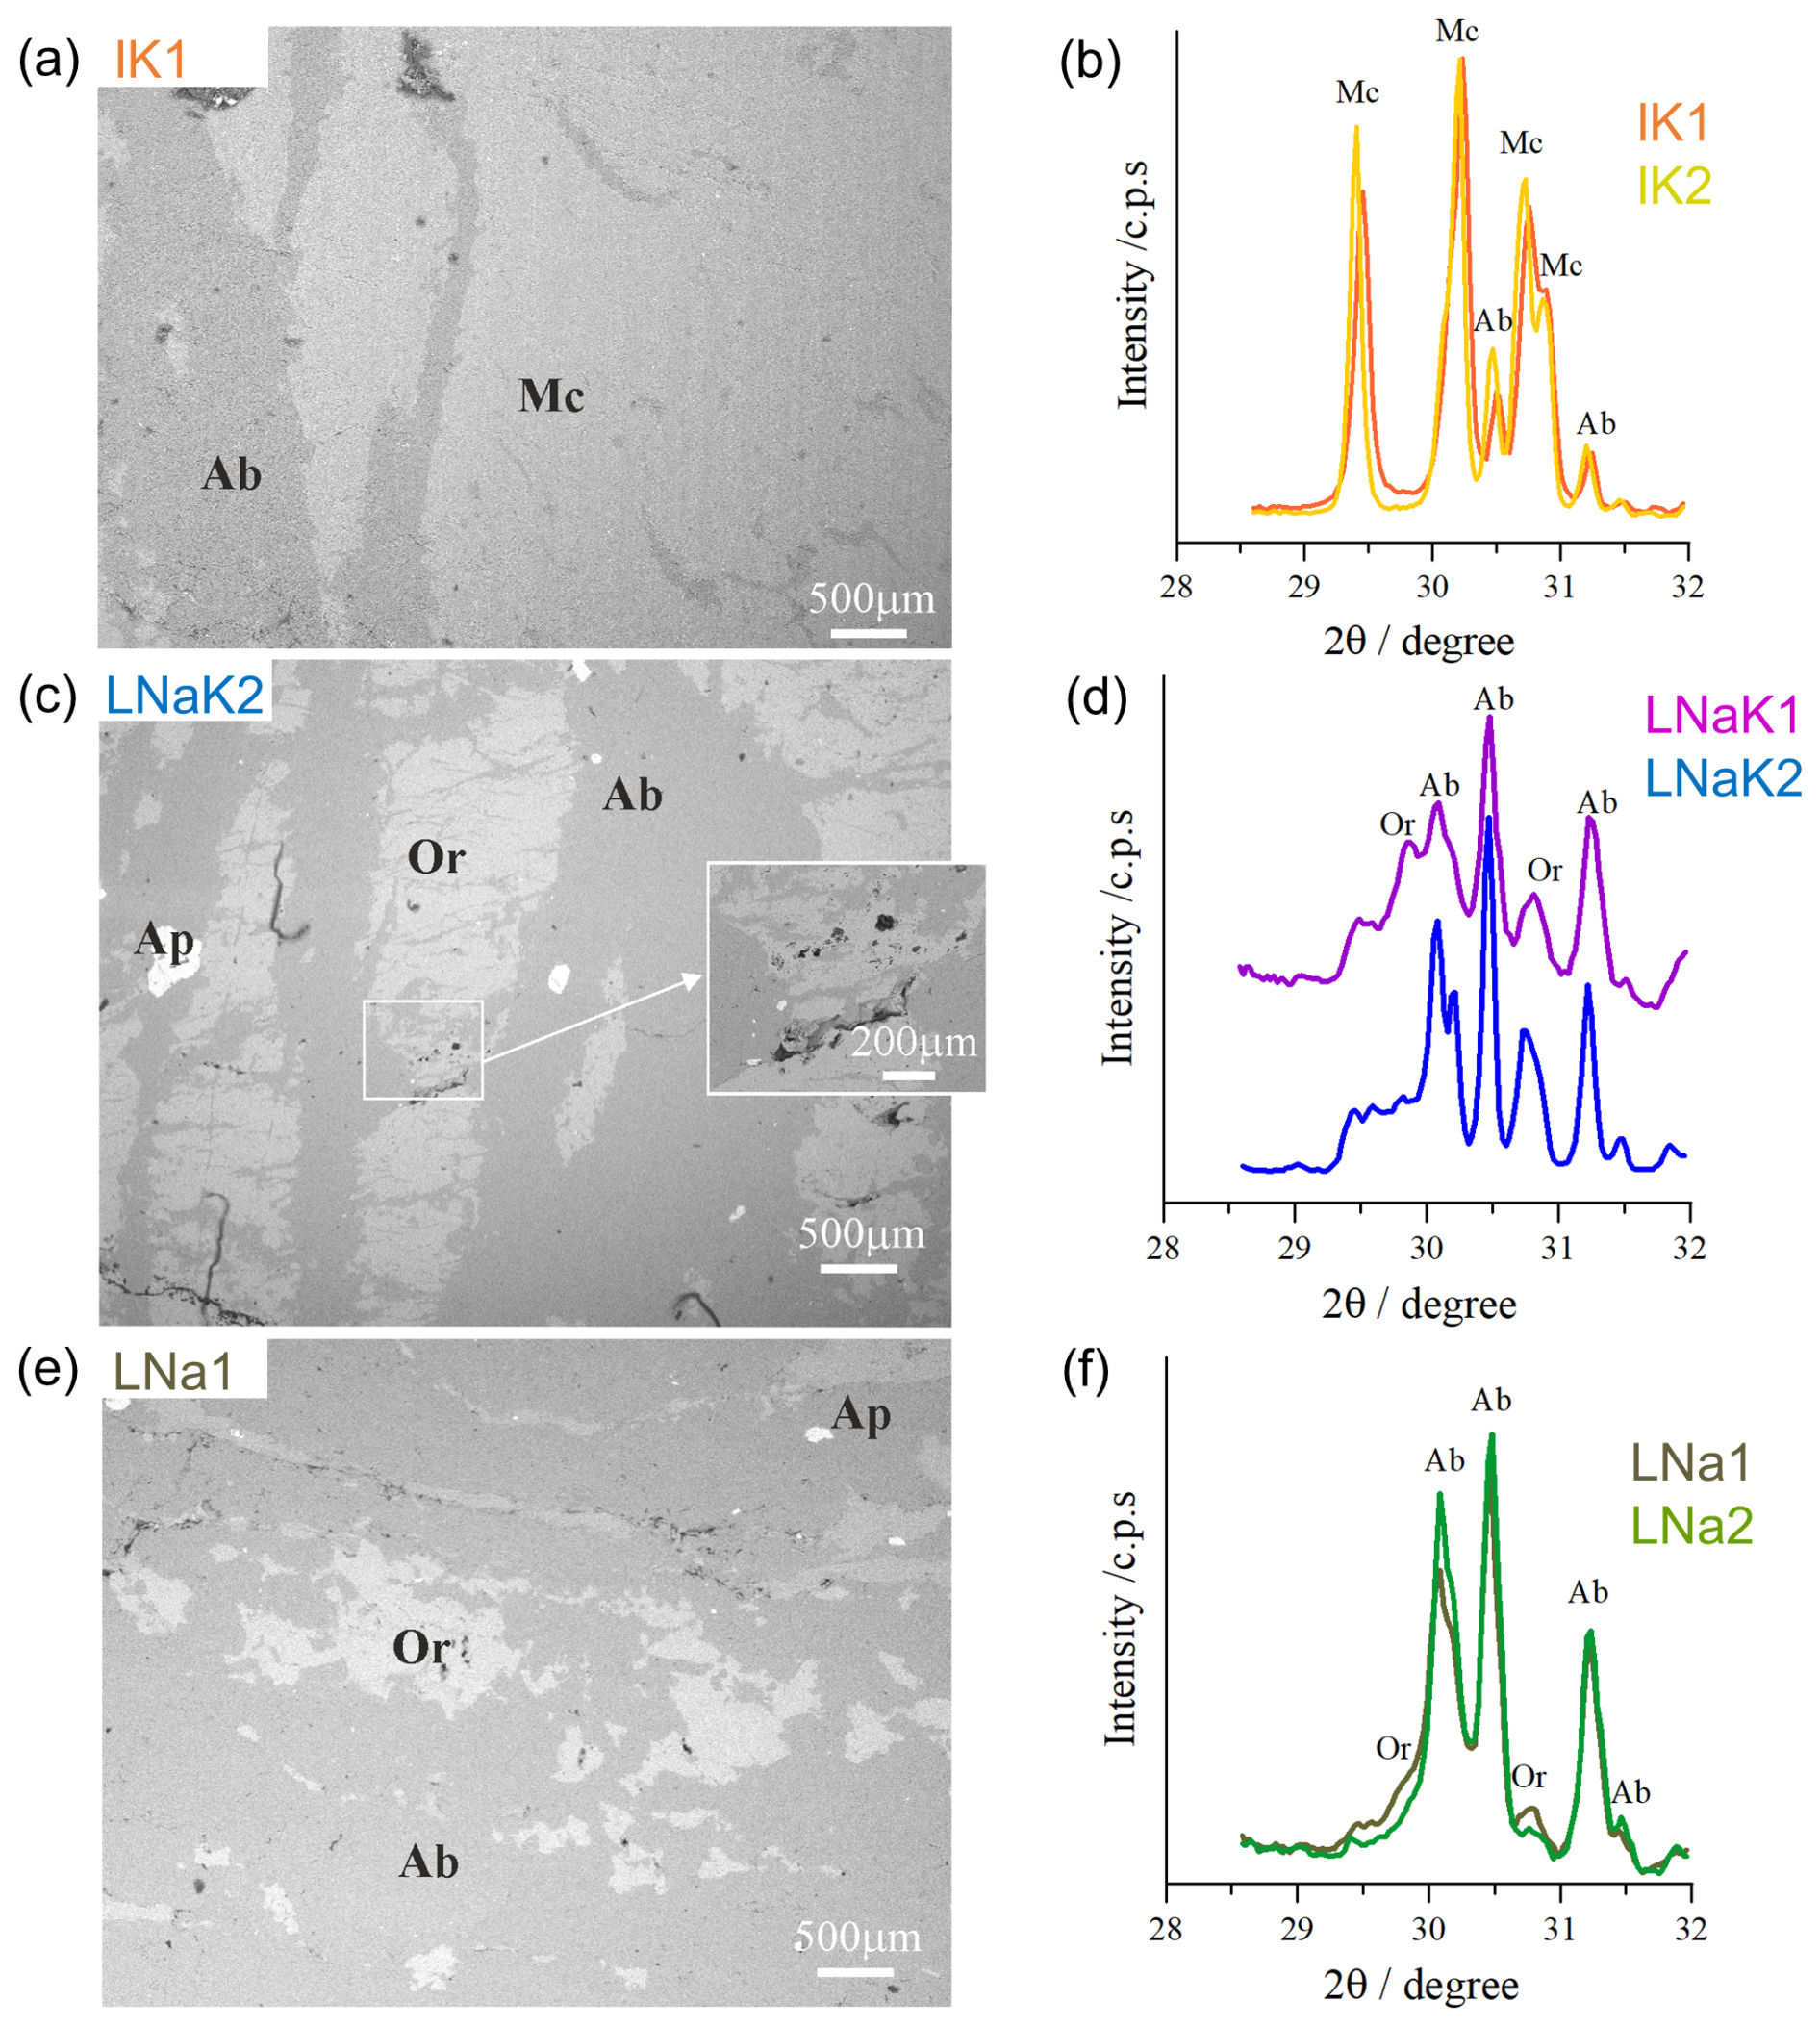
Figure 2Representative scanning electron microscope (SEM) images of (a) IK1, (c) LNaK2, and (e) LNa1. For reference, the 500 and 200 µm scales are indicated in the figures. IK1 and LNaK2 display perthitic texture, whereas LNa1 exhibits anti-perthitic texture. X-ray diffraction (XRD) plots of (b) IK, (d) LNaK, and (f) LNa feldspars in the 2θ range of 28–32°. Peaks corresponding to Ab are observed in all samples, while well-defined Mc peaks are observed only in IK (IK1 and IK2). Or, Ab and Ap are abbreviations for orthoclase, albite and apatite, respectively, which are potassium, sodium and calcium feldspar, respectively.
The K Na distribution in selected samples was further investigated through optical microscopy and SEM analysis of metallographically polished feldspar surfaces. SEM imaging was performed on three samples exhibiting a wide range of K Na ratios – IK1, LNaK2, and LNa1 – as shown in Fig. 2a, c, and e, respectively. The mineralogy identified via optical microscopy and SEM corroborates previous results obtained from XRD. All examined samples exhibit characteristic exsolution textures between the two alkali feldspar phases. SEM observations of Imerys' samples: IK1 (Fig. 2a) and IK2 reveal a typical perthitic texture, where K-feldspar – identified as Mc (brighter regions due to its higher average atomic number, Z≈18) – hosts elongated intergrowths of Ab-type sodic plagioclase (darker regions, Z≈11). Feldspars from Llançà display two distinct characteristics, depending on the exploitation level where they were collected. The LNaK samples contain both Ab and Or (see Fig. S2 in the Supplement), whilst LNa feldspars, which are more albitic, contain mainly Ab with smaller amounts of Or in the form of anti-perthites. The XRD (Fig. 2) peaks associated with Or exhibit lower intensity and considerable broadening, particularly in the LNa powders. These observations suggest that the dominant K-feldspar phase in the Llançà samples is more disordered, corresponding to Or rather than the well-ordered Mc. In the LNaK2, small apatite crystals [Ca5(PO4)3(OH, Cl, F)] are also observed as solid inclusions (see inlet Fig. 2c). In contrast, the LNa1 sample (Fig. 2e) shows an anti-perthitic texture, where Ab forms the dominant matrix with fine exsolutions of Or. Apatite inclusions are again present. All samples exhibit dark-contrast features associated with fluid inclusions, as observed in SEM images and corroborated by optical microscopy, which enables the visualization of internal features. Moreover, optical observations show aligned porosity across all samples (see Fig. S2). The coexistence of aligned porosity and fluid inclusions suggests a shared history of hydrothermal alteration or mineral-fluid interactions. These features are predominantly developed within the K-feldspar phases.
Figure 2b, d and f show the XRD spectra for each of the studied samples in the 2θ range of 28–32°, where characteristic peaks associated with Mc, Or, and Ab structures can be clearly identified (the full-range spectra are also provided in Fig. S3 of the Supplement). Sharp peaks corresponding to Mc and Ab are clearly visible in the spectra of the IK samples from Imerys (Fig. 2b). In contrast, Na-rich powders from Llançà (Fig. 2d) display well-defined Ab peaks, but significantly less pronounced Mc peaks. These peaks exhibit lower intensity and considerable broadening, particularly in the LNa samples (Fig. 2f), where Mc reflections nearly disappear. These observations suggest that the dominant K-feldspar phase in the Llançà samples are more disordered, likely tending toward Or rather than the well-ordered Mc.
3.2 Powder size and specific area
Particle size characterization was performed using laser diffraction, and the key metrics – D10, D50, D90, and average particle size – are presented in Table 2. D10, D50, and D90 values represent the diameters below which 10 %, 50 %, and 90 % of the particles fall, respectively. Complementary surface area measurements were conducted using the BET method. These analyses revealed surface area variations of up to a factor of four across the samples, ranging from 1.35 m2 g−1 for LNaK1 (the lowest) to 5.29 m2 g−1 for LNaK2 (the highest). For the LNa2 sample, two distinct powders were provided, each produced from the same bulk material but subjected to different milling durations, resulting in varying particle size distributions.
Table 2BET analysis of the powder for each sample (m2 g−1) and particle size (µm) according to laser diffraction. D90, D50, D10, and average values are provided.
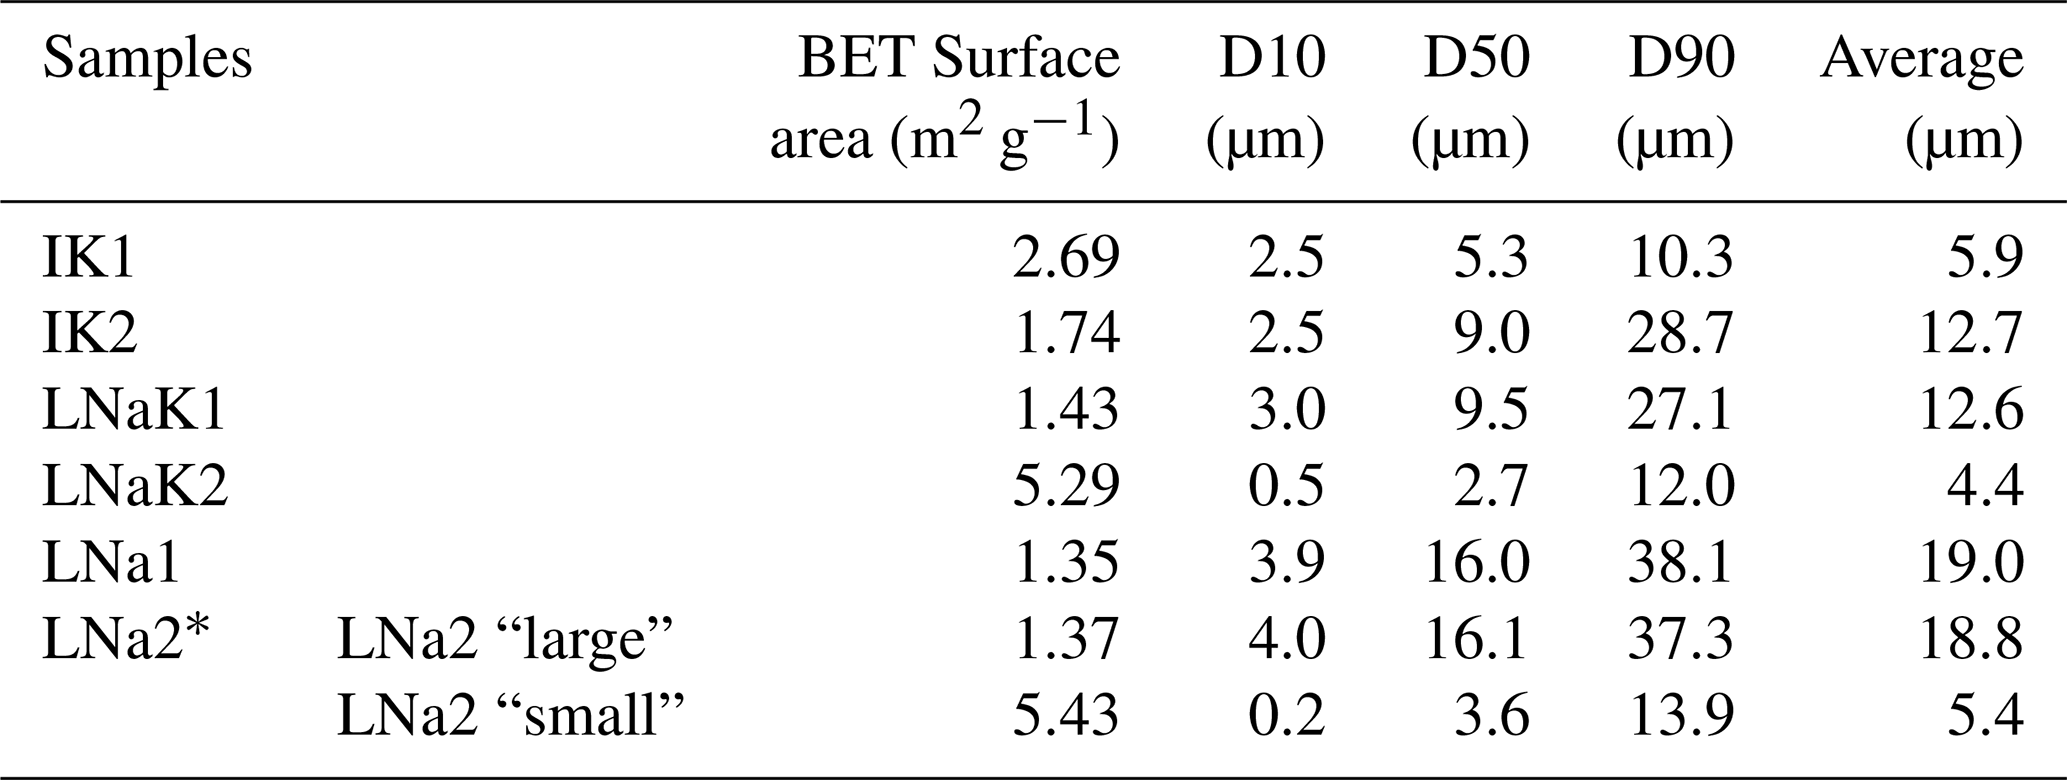
∗ Note that for LNa2, two different powder sizes were studied.
3.3 Fraction of frozen droplets and cumulative surface-site density
Figure 3a shows the fraction of frozen droplets, fice(T), for suspensions of the Na-rich feldspar LNa2 over a wide range of concentrations. At the highest concentration (5 wt %), nearly 90 % of the droplets froze once the temperature reached approximately −4 °C. As the concentration decreased, freezing shifted progressively to lower temperatures; at 0.01 wt %, 90 % of the droplets remained unfrozen until the temperature dropped below −18 °C. At the lowest concentrations (≤ 0.001 wt %), the freezing behavior became indistinguishable from that of pure water and was therefore excluded from the analysis shown in Fig. 3b and c, resulting in a maximum of seven concentrations being plotted.
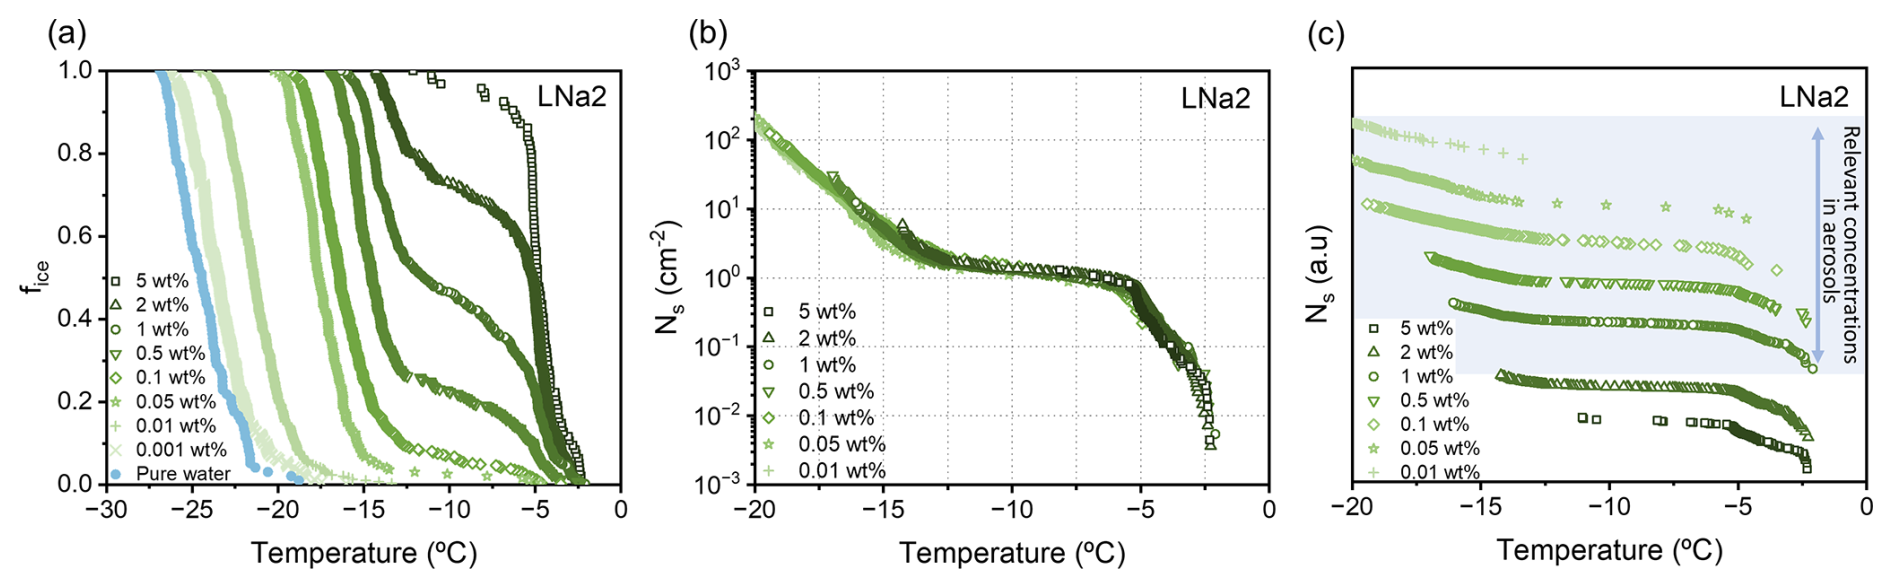
Figure 3Immersion freezing assays of aqueous suspensions containing LNa2 (Na-rich) feldspar. (a) Fraction of frozen droplets, fice(T), for a wide range of concentrations (5 wt % to 0.001 wt %). Freezing of purified water is shown for reference. (b) Cumulative active-site density, Ns(T), derived from data shown in panel (a) using Eq. (1), normalized to surface area. (c) Same Ns(T) data as in panel (b), but displayed with a vertical offset to aid visualization and comparison of the shape and temperature range of the freezing spectra across concentrations. The shaded region in panel (c) indicates the range of concentrations considered atmospherically relevant for aerosol particles. Note: In panel (a), concentrations ≤ 0.001 wt % exhibit freezing behavior indistinguishable from that of pure water and are therefore excluded from the Ns(T) analysis in panels (b) and (c).
Each fice(T) curve in Fig. 3a represents data from 192 to 288 droplets (corresponding to 2–3 replicates of 96-droplet arrays). Across the full range of concentrations tested, between 1500 and 2500 freezing events were recorded per feldspar powder, providing a large dataset for characterizing the ice-nucleating activity of the mineral. The complete set of fice(T) curves for all samples is shown in Fig. S4 of the Supplement. Additional tests were performed to assess the robustness of the measurements. When fice(T) was recorded over three successive freeze–thaw cycles using the same droplet arrays, no significant differences were observed, confirming the stability of the nucleation behavior (see Fig. S5 in the Supplement). Although the low LOI values indicate the absence of substantial organic content in the feldspar samples, selected samples were also tested after heating at 90 and 110 °C for 30 min (see Fig. S6 in the Supplement). No changes in freezing behavior were detected, further suggesting that biological contamination does not contribute to ice nucleation in these samples
To further evaluate the IN behavior of feldspar powders, the cumulative freezing spectrum of each mineral was derived based on Vali's methodology (Vali, 1971). This approach assumes that each individual INP has a characteristic freezing temperature that is independent of its thermal history. Within each droplet, the INP with the highest nucleation temperature governs the freezing event. Given an initial number of droplets, N0, and the number of frozen droplets, NF(T), the cumulative number of active INPs Nm(T) can be calculated as in Eq. (1) (Vali, 1971, 2019; de Almeida Ribeiro et al., 2023)
where is the number of unfrozen droplets at temperature T, and X is a normalization factor (e.g., per unit mass, volume, or surface area of the INPs). For mineral dust, X is often taken as the ice-nucleating surface area available per droplet (X=Sa), which yields the cumulative active-site density per unit area, denoted as Ns(T). In Fig. 3b, the Ns(T) spectrum is shown, obtained from Eq. (1), and normalized to the specific surface area of the powders, which was determined using the BET method. Notably, the contributions derived from different suspension concentrations overlap well within the temperature range where each concentration exhibits significant freezing activity, indicating that the relative distribution of ice nucleation sites is largely independent of dilution. These spectra therefore provide a robust quantitative basis for comparing IN efficiency among the different feldspar samples.
To further illustrate the concentration dependence of the IN activity, Fig. 3c presents Ns(T) for each suspension concentration of one representative feldspar powder. Equivalent behavior is observed for the other feldspars (see Fig. S7 in the Supplement), with the Ns(T) curves offset along the y-axis to facilitate comparison of the temperature ranges and functional forms associated with each concentration. Although our experiments span a wide range of concentrations, including values exceeding those typically expected for atmospherically suspended mineral dust (e.g., 10 wt %, 5 wt %, and 2 wt %), the data clearly show that high-temperature IN activity is observed not only in highly concentrated suspensions but also at lower concentrations (1 wt %, 0.5 wt %, and 0.1 wt %). These observations indicate that the high-temperature IN activity is unlikely to be explained solely by particle aggregation at elevated concentrations, although such effects cannot be entirely excluded. Instead, the results point to intrinsically active ice nucleation sites associated with the feldspar particles. At the highest suspension concentrations, particle aggregation and sedimentation may occur, potentially modifying the effective ice-nucleating surface and limiting the direct atmospheric relevance of these measurements. Nevertheless, the observation of high-temperature IN activity at lower concentrations (≤ 1 wt %) indicates that such active sites remain operative under more dilute concentrations (see shaded region in Fig. 3c). Moreover, mineral particles active at relatively high temperatures have been reported in several previous studies (Harrison et al., 2016; Peckhaus et al., 2016; Kanji et al., 2017; Whale et al., 2017; Keinert et al., 2022). In particular, the Ns(T) spectra derived from suspensions of a microcline perthitic feldspar (labelled FS06) reported by Keinert et al. (2022) at concentrations of 1 wt %, 0.1 wt %, and 0.01 wt % exhibit temperature ranges and curve shapes that are highly comparable to the Ns(T) results presented here.
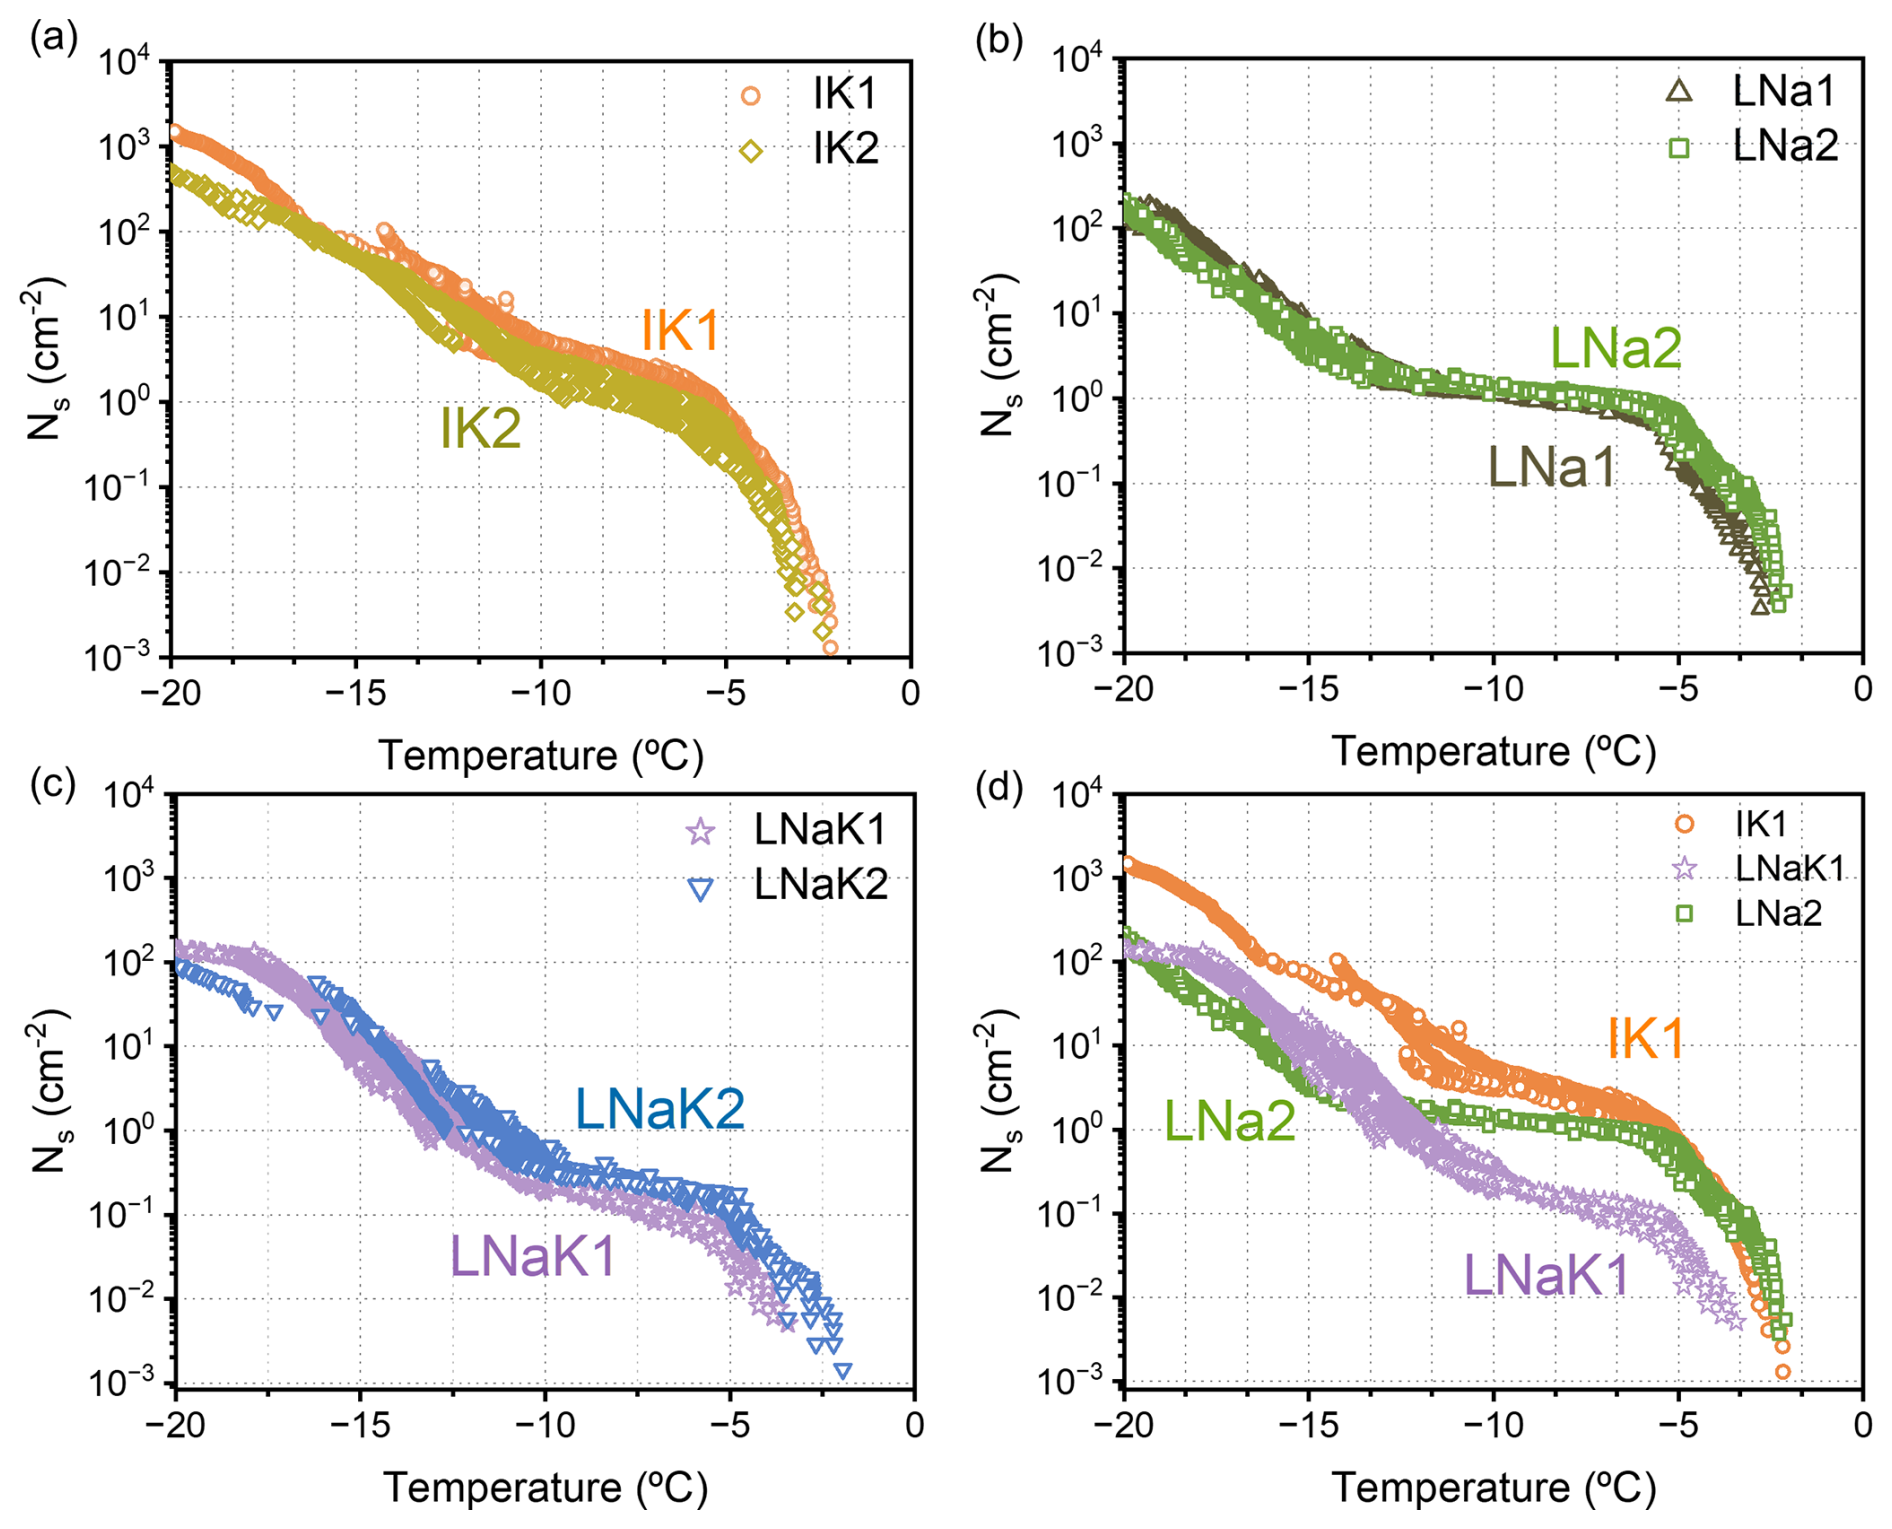
Figure 4Cumulative active-site density freezing spectra, Ns(T), obtained from fice(T), normalized by specific area (in cm−2) as calculated using Eq. (1). (a) K-rich feldspars (IK1, IK2) from Imerys. (b) Na-rich feldspars (LNa1, LNa2) from LLANSÀ S.A. (c) Feldspars with approximately balanced K Na composition (LNaK1, LNaK2) from LLANSÀ S.A. (d) Comparison of representative samples from each feldspar type: IK1 (highest K content), LNa1 (highest Na content), and LNaK1 (no clear dominance of K or Na).
Figure 4 compares the cumulative active-site density spectra, Ns(T), of feldspars grouped by composition. Figure 4a shows the K-rich samples (IK1, IK2), Fig. 4b presents the Na-rich samples (LNa1, LNa2), and Fig. 4c compares feldspars with balanced K Na compositions (LNaK1, LNaK2). Figure 4d contrasts representative spectra from each compositional group: IK1 (highest K content), LNa1 (highest Na content), and LNaK1 (lacking a clear dominance of either K or Na), allowing a direct comparison of IN efficiencies. Figure 4a and b show that, for all powders, the surface density of ice nucleation sites increases sharply as temperature decreases to approximately −5 °C. Between −5 and −15 °C, however, distinct temperature dependencies emerge. The IK samples display a continuous increase in site density on a logarithmic scale, whereas the LNa samples exhibit a pronounced plateau, indicating limited activation of additional nucleation sites within this temperature interval. At temperatures below −15 °C, both feldspar groups again show a marked increase in Ns(T). The LNaK powders exhibit site densities and temperature dependencies that lie between those observed for the IK and LNa samples. This behavior is further highlighted in Fig. 4d, where IK and LNa samples show comparable increases in Ns(T) above −5 °C, while LNaK samples exhibit substantially lower site densities. Below −15 °C, the site densities of the LNa and LNaK samples converge, whereas those of the IK samples remain systematically higher. Collectively, these results indicate that, although the Na K ratio cannot be used as a sole criterion to determine the ice-nucleating activity of feldspars, it plays an important role for the perthitic feldspars studied here. Samples with similar alkali compositions exhibit nearly overlapping freezing spectra, thereby supporting the classification presented in Table 1.
3.4 Powder size effect on the cumulative number of ice nucleators
LNa2 powder was provided by the mine in two different particle-size fractions, referred to as “small-particles” and “large-particles,” with specific surface areas of 5.43 and 1.37 m2 g−1, respectively (see Table 2). The only difference in their preparation was the grinding time. Figure 5 presents the corresponding cumulative freezing spectra normalized by mass (Fig. 5a) and by specific surface area (Fig. 5b). When normalized by mass, the finer particles exhibit higher Nm(T), reflecting their larger surface area per unit mass rather than an intrinsically higher IN activity. Upon normalization to surface area, however, the spectra converge to nearly identical Ns(T) curves, indicating that IN efficiency is governed by the mineral surface itself and is independent of particle size within the size range investigated here.
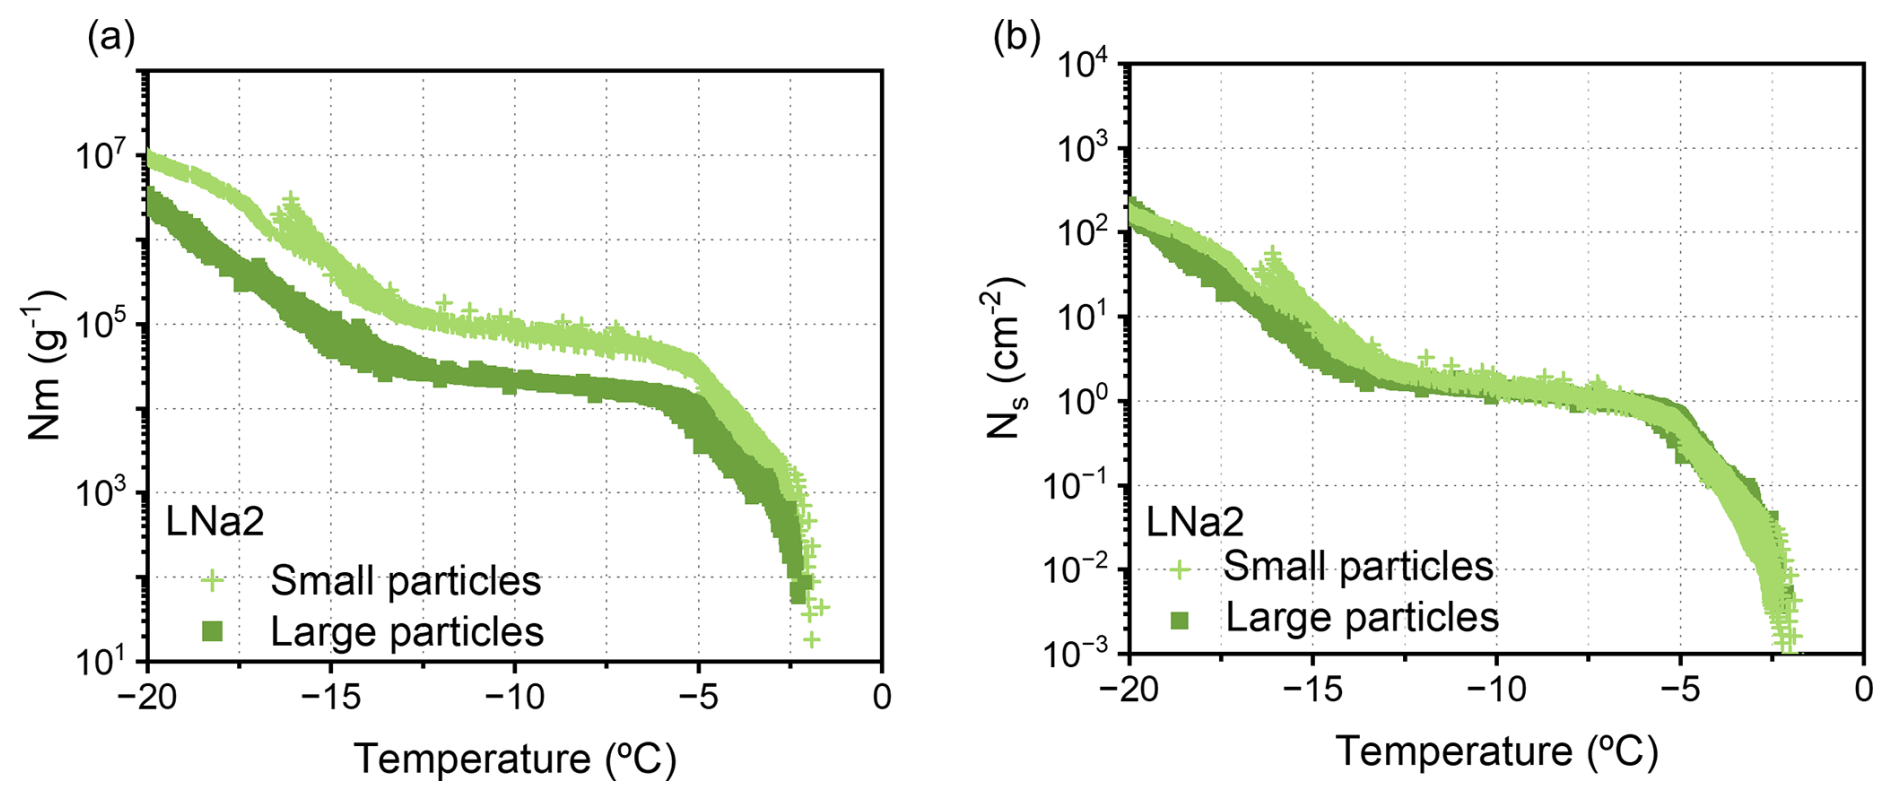
Figure 5Cumulative freezing spectra of LNa2 powder, derived from fice(T) and calculated using Eq. (1), which was ground into two particle-size fractions referred to as “small particles” and “large particles”, with specific surface areas of 5.43 and 1.37 m2 g−1, respectively (see Table 2). The spectra are normalized with respect to (a) the mass of feldspar powder, and (b) the specific surface area.
4.1 Comparison of ice-nucleating activity in alkali feldspars with previous studies
The onset temperatures and spectral trends observed in this study are consistent with previously reported cumulative active-site density freezing spectra, Ns(T), for perthitic feldspars. To illustrate this, Fig. 6 compares representative Ns(T) spectra from each feldspar type analysed here with literature data for perthitic feldspars (Whale et al., 2017), together with two feldspars exhibiting exceptionally high IN activity, nearly pure microcline and albite, reported by Harrison et al. (2016).
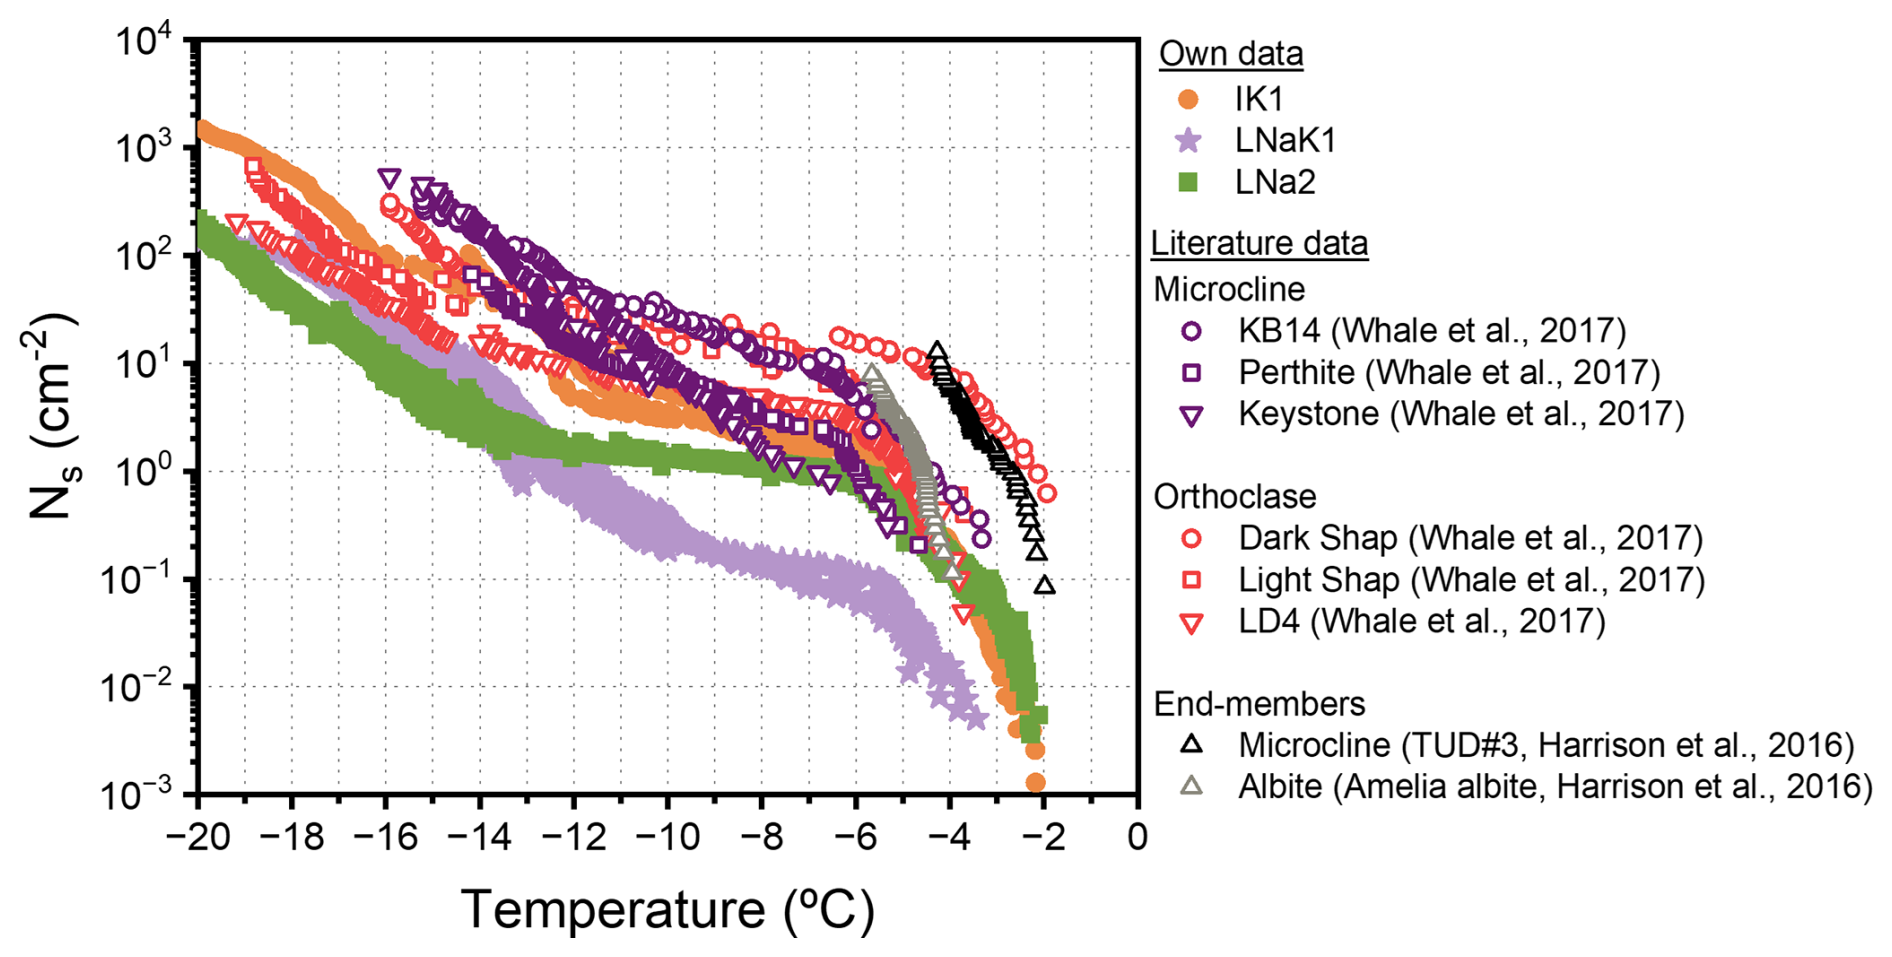
Figure 6Cumulative active-site density, Ns(T), freezing spectra for selected feldspars from this study: IK (K-rich), LNa (Na-rich), and LNaK (intermediate), plotted alongside literature data: perthitic alkali feldspars from Whale et al. (2017) (Microcline: KB14, Perthite, Keystone; Orthoclase: Dark Shap, Light Shap, LD4), and two 1 wt % suspensions of ground powders from Harrison et al. (2016) (TUD#3 microcline, labelled here as Microcline, and Amelia albite, labelled here as Albite).
A key observation, both in this study and in previous work (Whale et al., 2017; Harrison et al., 2016), is that freezing initiates within a narrow temperature interval, approximately between −2 and −4 °C. This range is clearly resolved in our measurements, most likely because the relatively high feldspar concentrations employed (2 wt %, 5 wt %, and 10 wt %) allow for a precise determination of initial freezing events. Notably, onset temperatures are remarkably similar across all samples investigated. The average temperature of the first ten freezing events, T(i,10), falls within this narrow interval for all feldspars: °C, °C, °C, °C, °C, °C (see Table S3).
In contrast, Fig. 6 shows that onset temperatures reported in the literature (Whale et al., 2017; Harrison et al., 2016) are generally slightly lower than those measured here, with the exception of the Dark Shap feldspar. Specifically, calculated values of T(i,10) from reported data are: −3.9 °C (KB14), −5.5 °C (Perthite), −6.3 °C (Keystone), −2.5 °C (Dark Shap), −4.5 °C (Light Shap), −4.3 °C (LD4). It is important to note that these studies used substantially lower feldspar concentrations (0.1 wt % and 1 wt %) than those employed in the present work. At lower concentrations, the detection of IN sites that exists in a very low density on the surface, becomes more challenging, which may bias the apparent onset temperature toward lower values. For both microcline (TUD#3) and albite (Amelia albite) from Harrison et al. (2016), and microcline in particular, the freezing spectra exhibit a very steep (nearly vertical) increase at higher temperatures, indicating high IN efficiency. This behavior suggests that increasing particle concentration would not substantially shift the onset temperature to warmer values. The narrow and consistent onset temperature range observed across alkali feldspars therefore points to a common type of highly efficient nucleation site, likely shared among perthitic feldspars.
In contrast, other feldspar groups, such as plagioclase, exhibit significantly lower onset temperatures (around −10 °C; Harrison et al., 2016; Welti et al., 2019). Although immersion freezing experiments for plagioclase were not conducted in this study, it is unlikely that increasing particle concentration would shift their initial freezing temperatures into the range observed for alkali feldspars. Consequently, the differences in the cumulative freezing spectra (Fig. 5) are best interpreted as reflecting variations in the surface density of these highly active sites, expressed as Ns(T) (sites per cm−2), as well as the presence and relative abundance of additional, less active site populations that contribute to IN at lower temperatures.
4.2 Fraction of frozen droplets and cumulative surface-site density
As shown in Fig. 4, powders originating from the same mine and exhibiting similar mineralogy and K Na ratios display nearly identical cumulative freezing spectra within the statistical uncertainty of the measurements. For example, IK1 and IK2 show comparable freezing behavior and active-site densities (Fig. 4a), although IK1 exhibits a slightly higher site density down to approximately −15 °C, below which deviations become more pronounced. It should be noted that, although IK1 and IK2 were collected from different extraction fronts within the same mine, the absence of precise spatial coordinates limits a more detailed assessment of site-specific geological variability.
In contrast, feldspars from the Llançà mine were collected with well-defined location data, enabling a more detailed evaluation of the influence of geological variability on IN properties. Samples were obtained from three distinct extraction fronts separated by more than 500 m, each characterized by different alkali compositions: one dominated by Na-rich feldspar, another by K-rich feldspar, and a third exhibiting more heterogeneous Na K compositions (see Fig. S1 in the Supplement). Feldspars LNa1 and LNa2, sourced from the Na-rich front and the compositionally variable front, respectively, display nearly identical freezing spectra (Fig. 4b), consistent with their similar K Na ratios and mineralogical characteristics (Table 1). A comparable trend is observed for LNaK1 and LNaK2, collected from the compositionally variable and K-rich fronts, respectively. Although LNaK1 exhibits a slightly higher K Na ratio, it shows a lower density of active nucleation sites down to −15 °C (Fig. 4c). The close similarity in ice-nucleating behavior between these samples suggests that they may expose analogous surface features governing IN activity, potentially arising from similar geological histories or alteration processes. However, since similar surface motifs can form through different mechanisms (Kiselev et al., 2021), this interpretation should be considered indicative rather than definitive. The robustness of these observations is further supported by the finding that, within the particle size range investigated, powder preparation from bulk rock has a negligible impact on intrinsic IN efficiency. Powders of the same mineral ground to different particle sizes were compared (Fig. 5). At equal mass concentrations, finer powders induce a higher number of freezing events per temperature interval, reflecting increased Nm(T) due to greater exposed surface area. However, after normalization by the BET-derived specific surface area (Sa), the freezing spectra converge across all particle sizes, indicating that the observed particle-size dependence arises solely from differences in surface area exposure rather than from changes in intrinsic surface properties.
A previous study by Welti et al. (2019) reported a correlation between particle size and IN activity; however, this effect was restricted to particles smaller than 1 µm, which are significantly finer than those examined in the present study. The same work also proposed the Rb Sr ratio as a potential predictor of freezing efficiency, with higher ratios associated with enhanced IN activity. Our results are consistent with this observation: IK1 and IK2 exhibit Rb Sr ratios nearly an order of magnitude higher than those of the other samples (Table S1) and correspondingly show higher active-site densities between −5 and −20 °C (Fig. 4a).
4.3 Analysis of heterogeneous ice nucleation sites populations using the HUB method
To further explore differences in freezing spectra across feldspars, the distribution of heterogeneous nucleation temperatures was analyzed using the Heterogeneous Underlying-Based (HUB) method (de Almeida Ribeiro et al., 2023; Renzer et al., 2024). This approach employs a stochastic optimization algorithm to fit the experimental cumulative spectra with a linear combination of Gaussian subpopulations, each representing a distinct class of IN sites. The resulting differential spectra resolve the distribution of nucleation temperatures, thereby enabling characterization of the underlying subpopulations.
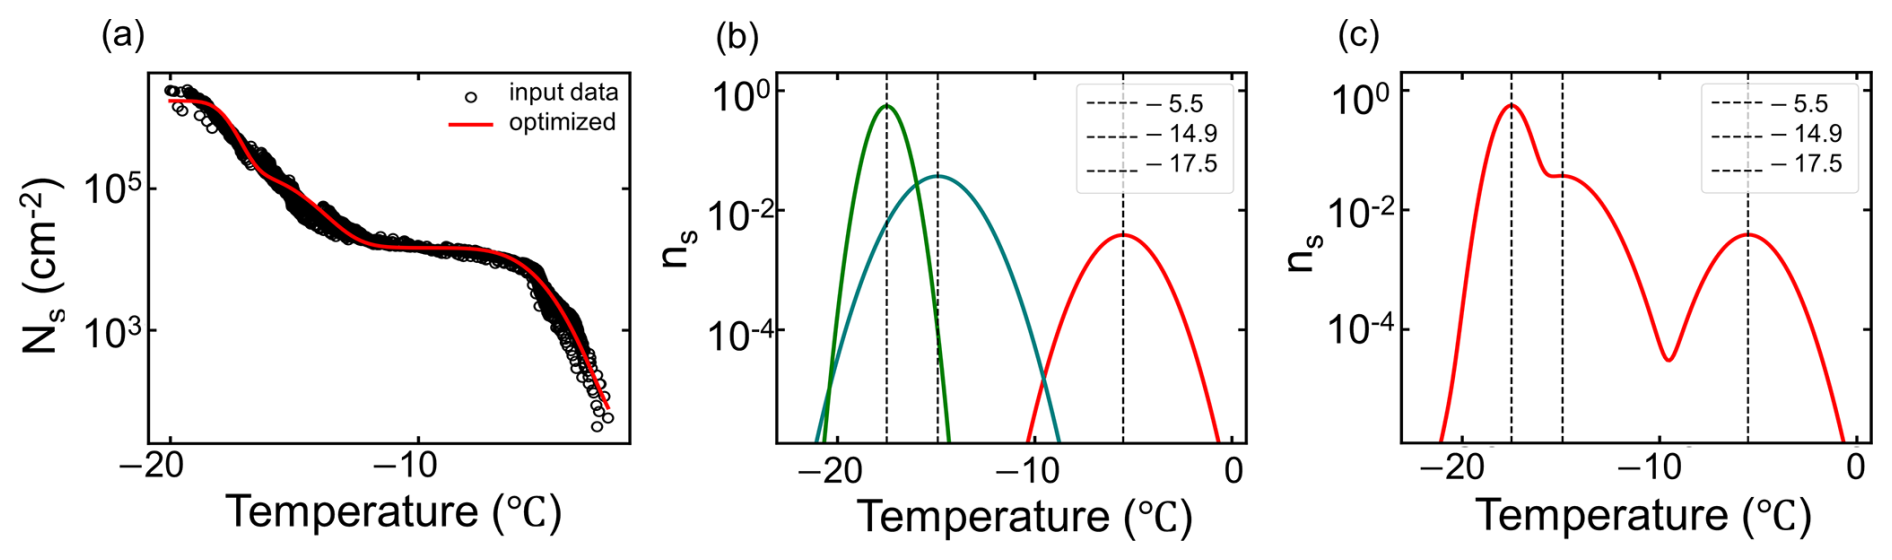
Figure 7Immersion freezing assays of aqueous suspensions of LNa1 feldspar. (a) Cumulative active-site density, Ns(T), (black circles) and the optimized fit (solid red line) obtained through the HUB method (de Almeida Ribeiro et al., 2023), assuming that the differential spectrum can be represented as a linear combination of three Gaussian IN subpopulations. (b) Individual IN site populations obtained from the decomposition of the fitted Ns(T) spectrum shown in panel (a) and dashed vertical lines indicate the characteristic activation temperatures of each population. (c) Combined cumulative active-site density, Ns(T), obtained by summing the individual site populations shown in panel (b).
Figure 7a shows the cumulative freezing for LNa1, with the optimized HUB fit (in red), assuming the differential spectrum consists of a linear combination of three Gaussian subpopulations (Fig. 7b). Figure 7c displays the corresponding normalized distribution function, ns(T), representing the differential freezing spectrum. A mean squared error (MSE) below or approximately 0.01 was achieved when a linear combination of three distinct subpopulations was included in the fitting. Fitting the spectra with two subpopulations, corresponding to two distinct IN classes, failed to reproduce the initial freezing behavior of feldspar powders, yielding an MSE of 0.0652. A more accurate solution is achieved by considering three subpopulations, which lowers MSE to 0.0041 (see Fig. S8 and Table S4 in the Supplement).
4.3.1 HUB subpopulation analysis of ice nucleation sites in alkali feldspars from Imerys and Llançà
Throughout the analysis, we compare the differential active-site density spectra, ns(T), of alkali feldspars by grouping the samples according to their K Na ratio: K-rich (IK), intermediate (LNaK), and Na-rich (LNa). Figure 8 displays the differential freezing spectra for all analysed samples, divided into three temperature-defined regions: A (0 to −7.5 °C), B (−7.5 to −15 °C), and C (−15 to −20 °C). These regions were defined empirically, based on the distinct behaviors observed in the cumulative Ns(T) spectra shown in Fig. 4. Table S5 summarizes, for all analysed feldspars, the characteristic temperatures of the subpopulations identified in the differential freezing spectra, together with the associated freezing probabilities within each temperature range and the corresponding MSE.
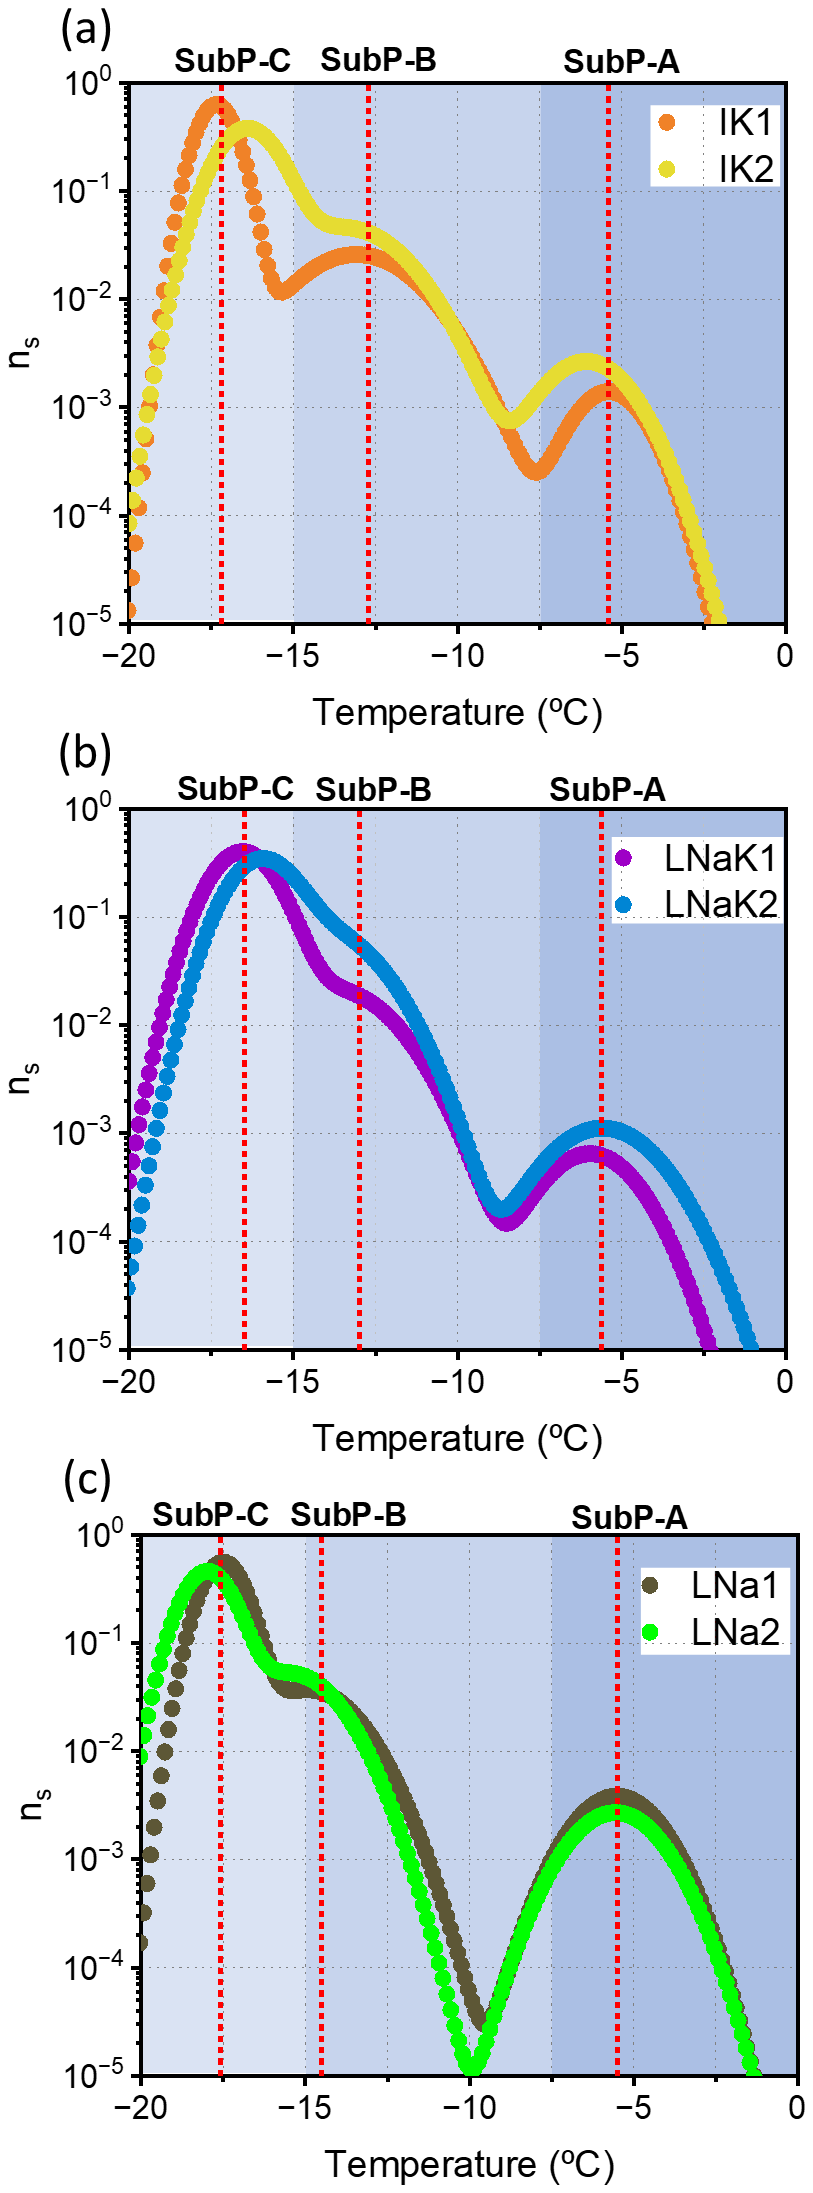
Figure 8Normalized distribution functions representing the differential freezing spectra, ns(T), of feldspar powders obtained using the HUB method (de Almeida Ribeiro et al., 2023). Three activation regions were defined empirically based on the observed behavior: SubP-A (0 to −7.5 °C), SubP-B (−7.5 to −15 °C), and SubP-C (below −15 °C). Vertical red dashed lines indicate the temperature associated with the distinct subpopulations of ice nucleation sites for each panel. Panels show results for (a) K-rich feldspars (IK1 and IK2), (b) feldspars with intermediate K Na ratios (LNaK1 and LNaK2), and (c) Na-rich feldspars (LNa1 and LNa2).
Some trends emerge from the analysis presented in Fig. 8 and Table S5. We first focus on the two endmember groups investigated in this study: IK (K-rich, perthitic feldspars) and LNa (Na-rich, anti-perthitic feldspars). The initial ice-nucleating population (SubP-A) does not show a clear distinction between IK and LNa samples, as both groups initiate freezing at very similar temperatures. However, the freezing probability associated with this first subpopulation appears to be higher for the LNa samples. In contrast, the second ice-nucleating population (SubP-B) exhibits a marked difference between the two groups. IK feldspars nucleate ice at higher temperatures on average (13.1 to −13.5 °C) than LNa samples (15.0 to −15.4 °C). Notably, within the temperature range from −7 to −15 °C, LNa samples – corresponding to anti-perthitic Or structures – show very low ice-nucleating activity. No distinct subpopulation peak is observed in this interval; instead, the signal appears as an extension or shoulder of the peak associated with SubP-C. This behavior explains the extended plateau observed in the cumulative Ns(T) spectra for LNa samples in Fig. 4d.
Feldspars with intermediate Na K ratios (LNaK samples) show a lower freezing probability associated with SubP-A compared to both IK and LNa samples, although the corresponding freezing temperatures are similar. The freezing temperatures of SubP-B for LNaK samples fall between those observed for IK and LNa feldspars. Taken together, these results suggest that SubP-A is common to all feldspar types, but is more prominent in K-rich and Na-rich samples than in compositionally mixed feldspars. SubP-B, active between −7.5 and −15 °C, appears to be strongly associated with the presence of K-rich feldspar domains, as it is absent in LNa samples and significantly reduced in LNaK samples. It is important to note that differences among the feldspar samples are not limited to their Na K ratios; the crystallographic structure of the K-feldspar phase also varies significantly. XRD analysis (see Fig. 2) shows that, in the IK samples, the K-feldspar phase is predominantly Mc, characterized by a high degree of Al–Si ordering and well-defined diffraction peaks. In contrast, for the LNaK and LNa samples, the peaks associated with Mc are broader and of much lower intensity, indicating a predominantly Or structure with lower structural ordering.
4.3.2 HUB subpopulation analysis of ice nucleation sites in perthitic feldspars from literature
To determine whether the distribution of ice-nucleating subpopulations is more directly related to the Na K ratio of feldspars or to the crystallographic structure of the K-feldspar phase, we extended our analysis to published datasets using the same methodology. Specifically, a HUB analysis was performed on cumulative freezing spectra reported by Whale et al. (2017) for six perthitic feldspars (Fig. 9), with the fitted parameters summarized in Table S6 of the Supplement. The feldspars shown in Fig. 9a are dominated by Or, whereas those in Fig. 9c are primarily Mc; both are polymorphs of K-feldspar. Only datasets with sufficient data points to enable a reliable HUB analysis and with confirmed perthitic microstructures were selected. The analyzed samples, listed with their original names, K Na ratios, and reported K-feldspar phases, are as follows: Light Shap (K Na = 2.3, Or), Dark Shap (K Na = 2.3, Or), LD4 (K Na unknown, Or), Perthite (K Na = 1.3, Mc), KB14 (K Na = 0.67, Mc), and Keystone (K Na = 4, Mc) (Whale et al., 2017). This selection spans a wide range of K Na ratios and includes both microcline- and orthoclase-dominated feldspars. The corresponding cumulative Ns(T) freezing spectra for these samples were previously shown in Fig. 6.
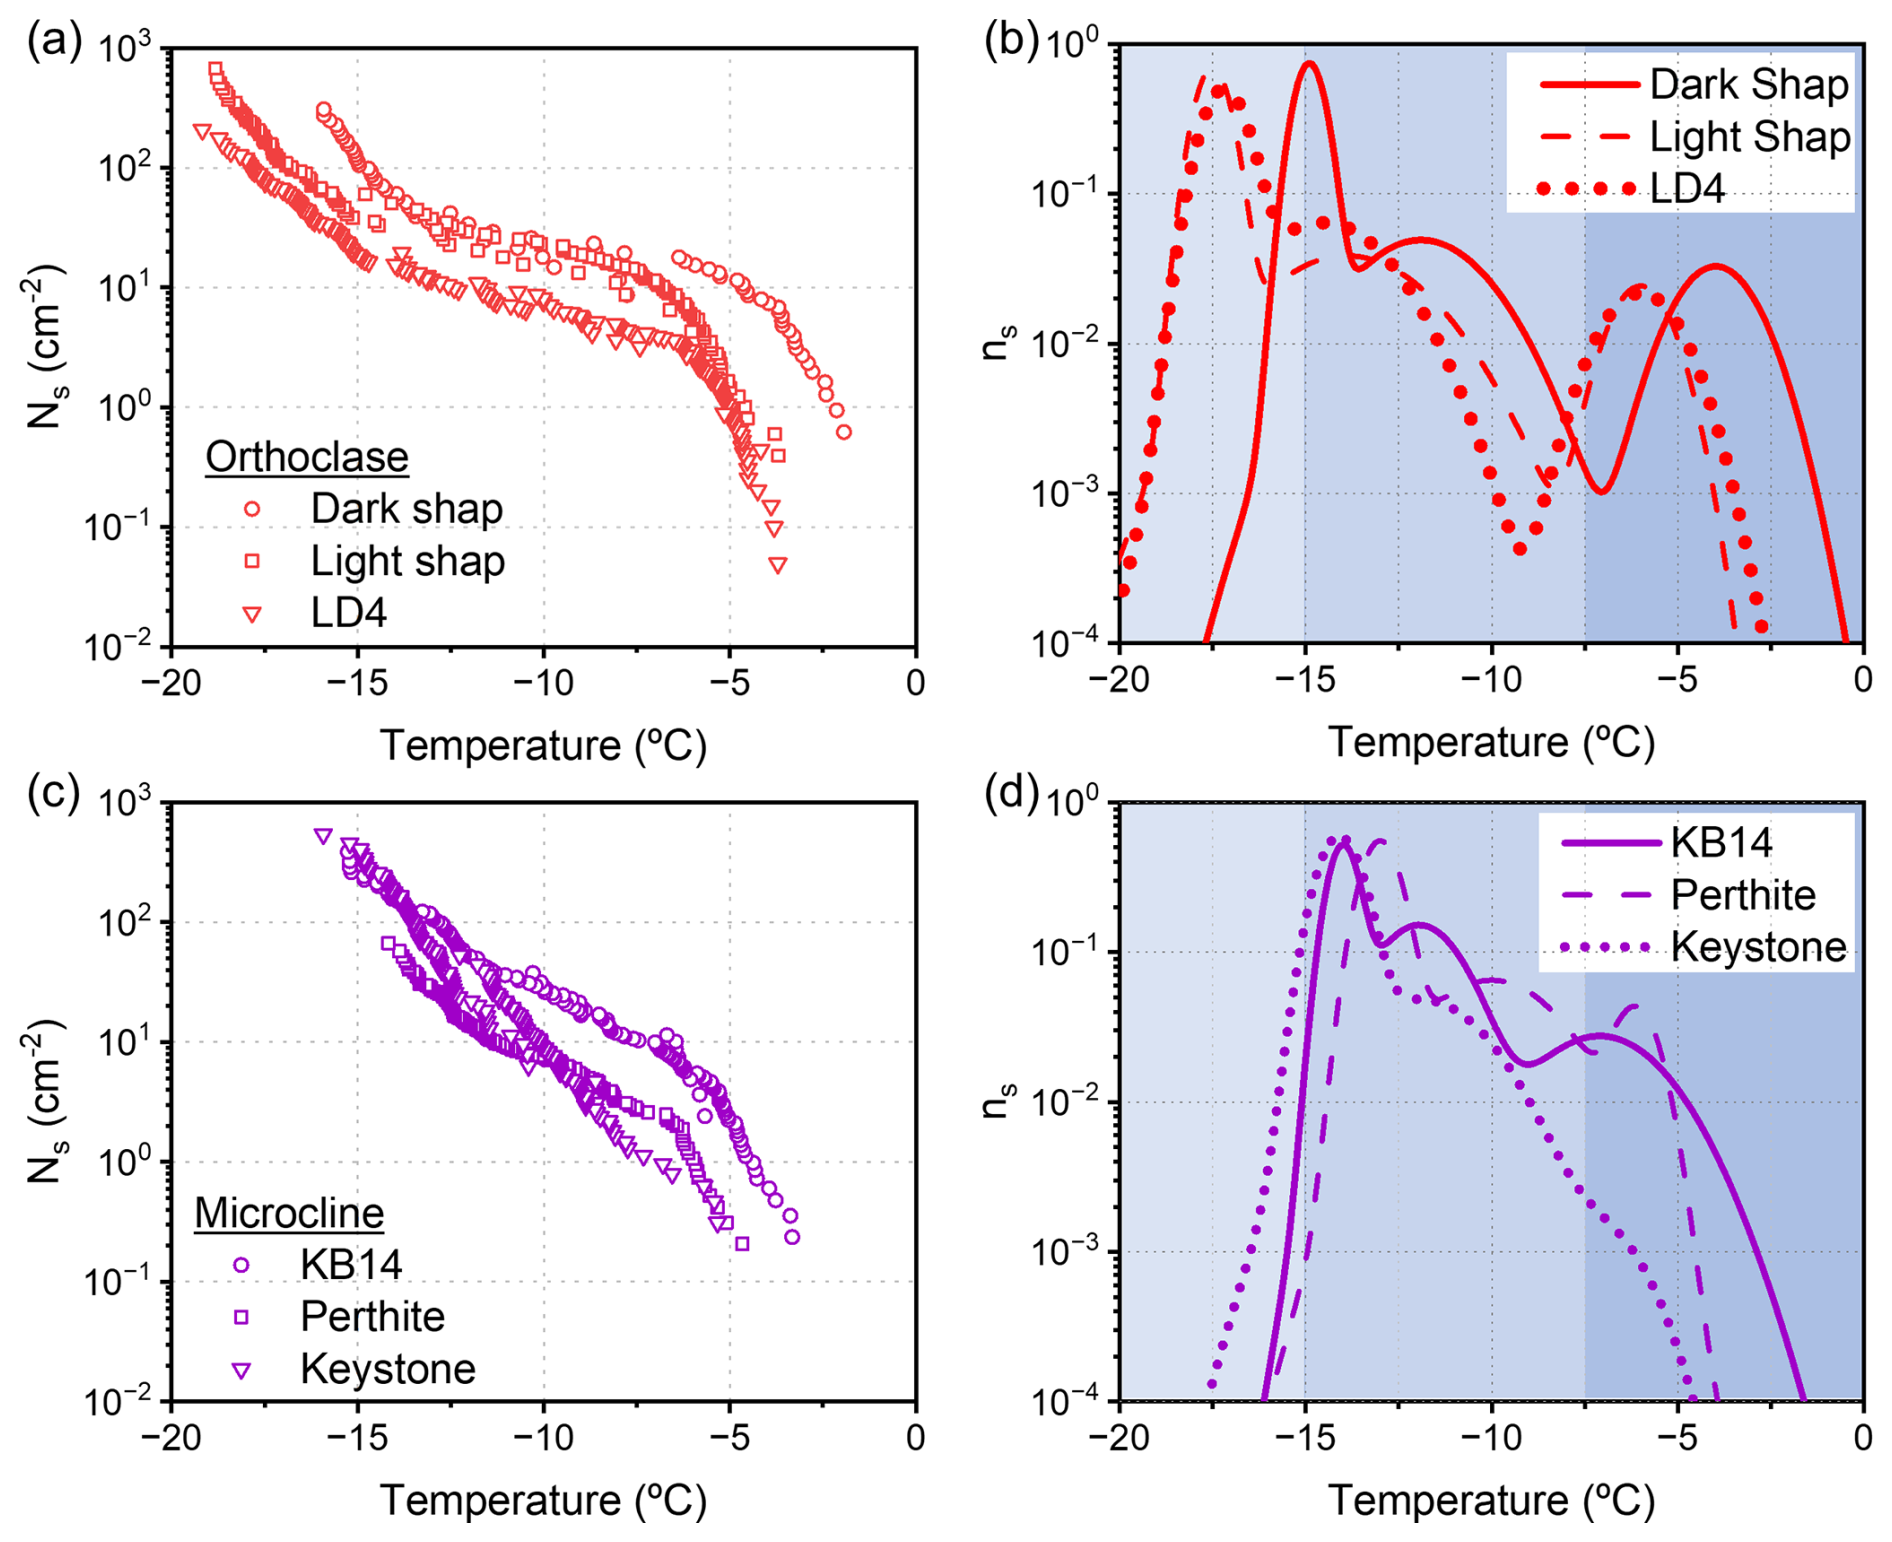
Figure 9Cumulative ice nucleation site densities, Ns(T), and corresponding normalized differential spectra, ns(T), using the HUB method (de Almeida Ribeiro et al., 2023) from selected data of perthites published by Whale et al. (2017). (a, b) Orthoclase perthites (Dark Shap, Light Shap and LD4). (c, d) Microcline perthites (KB14, Perthite, Keystone).
As also observed in our own dataset, these feldspars exhibit two contrasting types of freezing behavior. One group displays a pronounced plateau in the cumulative spectra, similar to that observed for our LNa samples, while the other group shows a more continuous increase in Ns(T) with decreasing temperature. Importantly, this distinction correlates more strongly with the structure of the K-feldspar phase than with the K Na ratio (compare Fig. 9a and c). Orthoclase-dominated feldspars exhibit extended flat regions in their cumulative spectra (red curves in Figs. 6 and 9a), whereas microcline-dominated feldspars show a smoother and more gradual increase in ice-nucleating activity (purple curves in Figs. 6 and 9c).
The HUB analysis of these six feldspars (Fig. 9b and d) identifies three distinct nucleating subpopulations, consistent with the three temperature regions identified in our feldspar powders (Fig. 8). Orthoclase-rich samples exhibit HUB spectra very similar to those of our LNa samples, characterized by the absence or strongly reduced contribution of SubP-B. Notably, this similarity arises despite the opposite alkali compositions: the LNa samples are Na-rich, whereas the orthoclase-rich samples in Fig. 9 are K-rich. This clearly demonstrates that a high K content alone is not sufficient to generate a pronounced SubP-B. In contrast, all microcline-dominated samples exhibit a strong SubP-B contribution, regardless of their K Na ratio, which spans more than an order of magnitude. These results strongly suggest that SubP-B is primarily associated with the presence of microcline K-feldspar phases rather than with bulk alkali composition.
Consistent trends in cumulative Ns(T) spectra have also been reported by Welti et al. (2019), where orthoclase-dominated feldspars tend to show an initial ice-nucleating activity followed by a plateau, whereas microcline-rich samples exhibit a continuous increase in activity with decreasing temperature. However, due to limitations in the resolution and density of the available datasets, a HUB analysis could not be performed for those additional samples.
4.3.3 HUB subpopulation analysis of thermally and chemically treated feldspar from literature
To further investigate the possible nature of the IN sites associated with SubP-A and SubP-B, we analyzed additional datasets from the literature addressing the effects of thermal and chemical treatments on feldspar IN behavior. Specifically, we applied our subpopulation analysis within the HUB framework to the dataset reported by Kiselev et al. (2021). The analyzed samples derive from a gem-quality sanidine (FS08-VS) that was subjected to diffusion-mediated Na-K cation exchange in an NaCl-KCl salt melt, followed by controlled annealing treatments. During the cation exchange at 850 °C, the feldspar composition was shifted to an intermediate value (), inducing the formation of cracks approximately parallel to Murchison plane. This process produces a Na-enriched surface zones relative to the K-rich interior and promotes the exposure of ordered (100) surface patches within crack walls (primary cracks). The cation-exchanged feldspars were subsequently annealed at 550 °C for 64 d either under vacuum (FS08-64c) or in contact with the NaCl-KCl salt melt (FS08-64o). The two annealed feldspars evolve differently: additional crack development occurs in FS08-64o, whereas FS08-64c does not show further fracturing but instead develops nanoscale exsolution lamellae (30 nm). Figure 10a shows the resulting Ns(T) spectra for the untreated feldspar powder (FS08-VS), together with FS08-64c and FS08-64o.
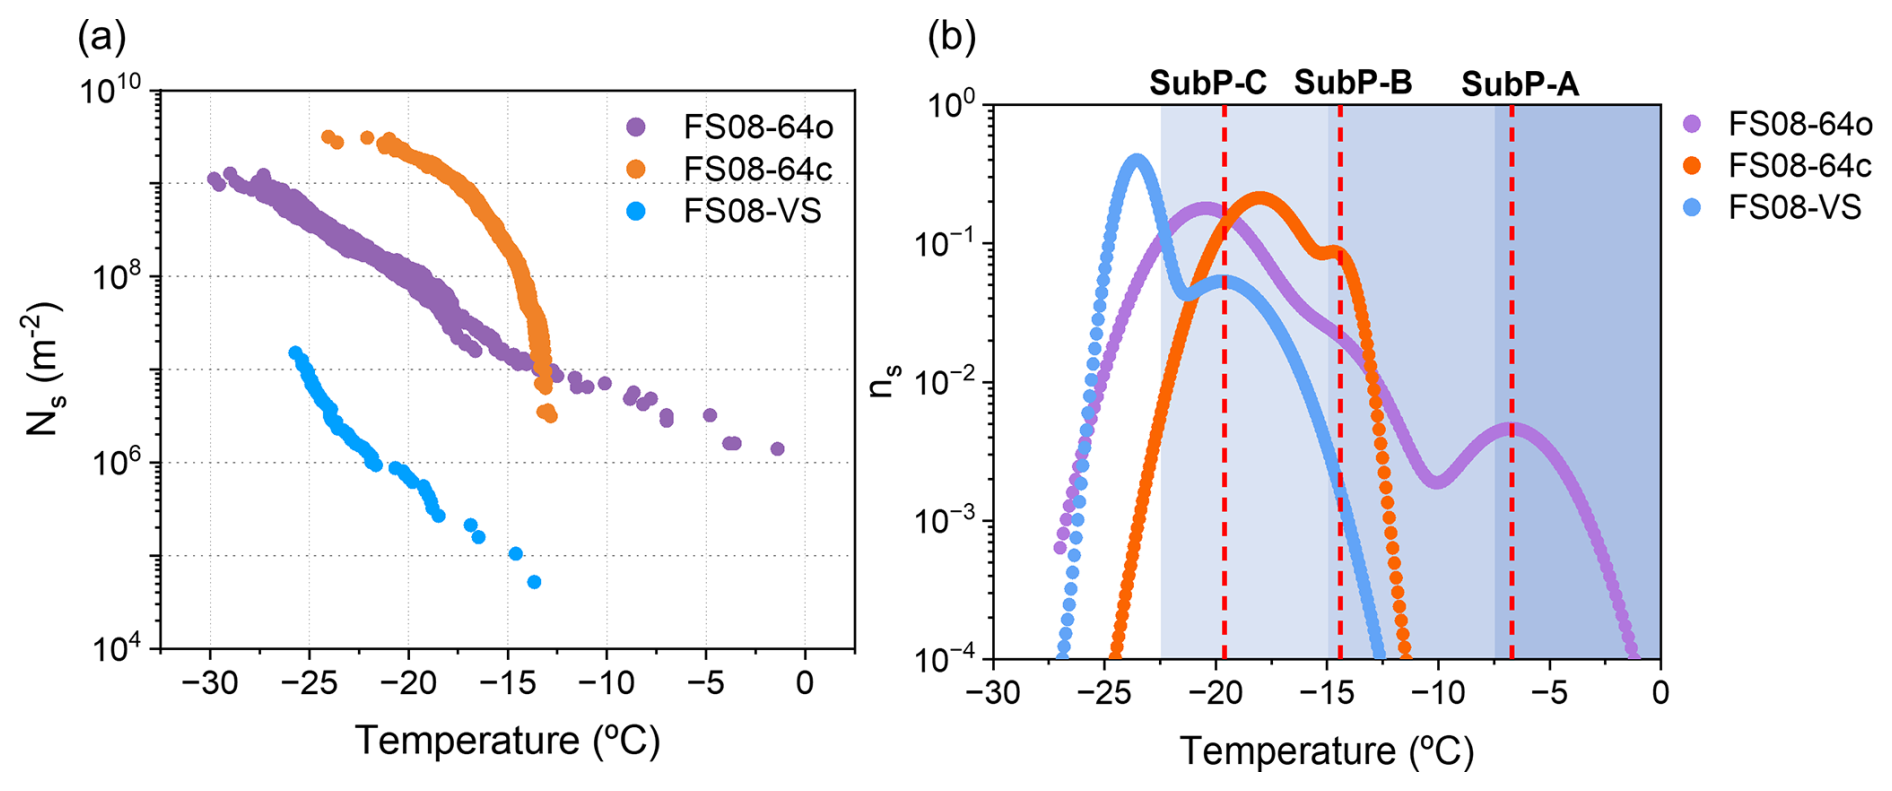
Figure 10Results of the droplet-freezing experiments from Kiselev et al. (2021) for feldspars FS08-64o, FS08-64c and FS08-VS. (a) Cumulative active-site density, Ns(T). (b) Corresponding normalized differential spectra, ns(T), derived from the data in panel (a) using the HUB method (de Almeida Ribeiro et al., 2023).
Figure 10b presents the corresponding HUB analysis. For FS08-VS and FS08-64c, the spectra (restricted to temperatures down to −25 °C) are adequately reproduced using two subpopulations, whereas three subpopulations are required for FS08-64o. Applying the same subpopulation boundaries defined in Fig. 8, FS08-VS exhibits contributions exclusively within SubP-C. In contrast, FS08-64c shows contributions from both SubP-B and SubP-C, while FS08-64o displays contributions spanning all three regions (SubP-A, SubP-B, and SubP-C) (see Table S7 in the Supplement for fitted parameters).
Kiselev et al. (2021) attributed the enhanced IN activity of FS08-64c to the formation of crystallographically ordered (100) surface patches along crack walls during cation exchange and subsequently modified during vacuum annealing. Consistent with this interpretation, our HUB analysis indicates that this treatment specifically increases the contribution of SubP-B, which we associate primarily with perthitic feldspars exhibiting an ordered Mc structure. Such structures are expected to favor a higher density of ordered (100) surface patches within cracks compared to Or-dominated feldspars.
The salt-melt treatment (FS08-64o) leads to the formation of K-enriched zones along both external crystal surfaces and existing crack walls, resulting from reverse cation exchange during annealing at 550 °C. Kiselev et al. (2021) proposed that this process may induce secondary cracking parallel to the crack walls, thereby further enhancing IN activity, although the precise nature of the newly formed nucleation sites remains unresolved. We hypothesize that these additional sites may be associated with increased surface and chemical heterogeneity and, potentially, with water confinement effects within nanoscale surface features. This interpretation is consistent with our broader observation that SubP-A and SubP-C are present across all feldspar samples analyzed in this study, irrespective of whether they are dominated by Mc or Or.
4.3.4 Summary on the role of crystallographic ordering and surface structure
Crystallographic surface ordering has been shown to play a key role in heterogeneous nucleation efficiency (Sosso et al., 2022). In feldspars, it is widely accepted that the microcline K-phase is generally more active in promoting ice nucleation than other K-feldspar polymorphs (Augustin-Bauditz et al., 2014; Welti et al., 2019), a behavior commonly attributed to its higher degree of structural ordering. Ice has been found to preferentially nucleate on the (100) crystallographic face of feldspars (Kiselev et al., 2017; Keinert et al., 2022). Although this process does not require perfect epitaxial matching, partial lattice alignment has been proposed as a contributing factor in several materials (Shimizu et al., 2018; Verdaguer et al., 2006). Supporting this view, SEM observations of feldspars have revealed preferential ice growth depending on the crystallographic orientation of the substrate, suggesting partial structural matching between ice and the feldspar surface (Kiselev et al., 2017; Pach and Verdaguer, 2019). In alkali feldspars, this orientation dependence is thought to arise from how Si Al ordering in the aluminosilicate framework is expressed at the (100) surface. Ordered Mc exposes a more regular arrangement of surface oxygens, hydroxyl (OH) groups, and charge-compensating sites, whereas Or, characterized by partial Si Al disorder, presents a more heterogeneous surface termination (Pedevilla et al., 2016; Kiselev et al., 2017; Franceschi et al., 2024). This effect is believed to be primarily governed by the spatial arrangement and density of OH groups at the mineral surface (Pedevilla et al., 2016; Kiselev et al., 2017; Franceschi et al., 2024). Molecular dynamics simulations further support this interpretation, indicating that OH group density plays a more critical role in ice nucleation activity than lattice symmetry alone (Pedevilla et al., 2017). Consistent with this, experimental studies have demonstrated that chemical modification of surface OH groups can significantly alter the ice-nucleating ability of feldspar surfaces (Peckhaus et al., 2016; Kiselev et al., 2017; Pach and Verdaguer, 2021). Thus, the influence of Si Al ordering on ice nucleation is likely indirect, operating through its control over the chemical and structural regularity of the active (100) surface.
According to our results, this mechanism provides a plausible explanation for the behavior of SubP-B, which dominates nucleation in the −7.5 to −15 °C temperature range. However, it does not appear to be the primary factor governing the highest-temperature nucleation sites associated with SubP-A, which are observed even in samples lacking, or containing only minor amounts of, microcline K-phases. Our analysis indicates that the first subpopulation, characterized by a Gaussian distribution centered between approximately −5 and −6 °C, is not strongly influenced by either the Na K ratio or the specific K-feldspar polymorph (Mc or Or). Nevertheless, the density of this subpopulation is systematically higher in both K-rich and Na-rich perthitic feldspars than in feldspars with more balanced Na K ratios, as evidenced by the cumulative Ns(T) spectra in Fig. 4d and the freezing probabilities reported for SubP-A in Table S5 (Supplement). This trend suggests that ice nucleation in this temperature range is not primarily controlled by crystallographic ordering, but rather by structural imperfections or defects. Such defects are consistent with our analysis of thermally and chemically treated feldspars, which exhibit increasing contributions from SubP-A with increasing surface defect density (Fig. 10). These defects are likely associated with the exsolution textures characteristic of perthitic feldspars. This interpretation is further supported by observations of plagioclase feldspars (Harrison et al., 2016; Welti et al., 2019), which lack perthitic microstructures and exhibit ice nucleation only at significantly lower temperatures. In contrast, the progressive increase in nucleation activity at lower temperatures associated with SubP-B (Fig. 8) correlates strongly with the presence of microcline. In samples where Mc is not the dominant K-feldspar phase, no distinct SubP-B peak is observed, even upon cooling to approximately −15 °C. This behavior is evident both in Or-dominated feldspars reported in the literature (Fig. 9a) and in the Na-rich feldspars analyzed in this study, which contain only minor amounts of Mc (LNa; Fig. 8c). At temperatures below approximately −15 °C, an additional subpopulation (SubP-C) consistently emerges across all feldspar samples examined, indicating a transition to a nucleation regime dominated by more generic, less structurally specific ice nucleation sites.
Ice nucleation (IN) properties of K- and Na-feldspars with perthitic textures were investigated under immersion freezing conditions. Six samples, collected from two different mines and five distinct extraction fronts, were analyzed. Freezing activity was characterized using a wide range of suspension concentrations. For each sample, more than 1000 individual freezing events were evaluated, yielding robust cumulative freezing spectra supported by a large statistical basis. While the density of active ice nucleation sites varied substantially among samples, the initial freezing onset temperatures were remarkably consistent, falling within a narrow temperature range of only a few degrees and closely matching values reported in previous studies. This similarity in onset behavior appears to be characteristic of perthitic feldspars, as other feldspar types, such as plagioclase, generally activate ice nucleation at significantly lower temperatures. Moreover, samples with similar mineralogical compositions and microstructures exhibited nearly identical freezing spectra, indicating that IN efficiency is primarily governed by intrinsic material properties rather than by sampling location.
Two distinct nucleation behaviors were identified. One group of samples exhibited a pronounced plateau in the cumulative active-site density, Ns(T), following the initial freezing onset, spanning approximately −7.5 to −15 °C. This plateau indicates a limited activation of new ice nucleation sites until further cooling triggers a secondary increase in activity. In contrast, the second group displayed a continuous increase in IN site density following onset, without any evident plateau. Importantly, these two patterns are not unique to the samples analyzed here; similar behaviors are observed in previously published freezing spectra, suggesting that they may represent generalizable nucleation modes for feldspars.
To better resolve the nature of the underlying ice nucleation sites, the cumulative freezing spectra were deconvoluted into Gaussian subpopulations using the HUB method. This analysis revealed a fundamental distinction between the two nucleation behaviors. In both cases, three subpopulations were required to achieve a satisfactory fit. However, their relative contributions and temperature distributions differ markedly. Spectra exhibiting a plateau are best described by one subpopulation associated with the initial freezing onset, followed by two additional subpopulations that emerge only at lower temperatures. In contrast, spectra displaying continuous activity require three subpopulations that activate more gradually and overlap over a broader temperature range, resulting in a smooth increase in ice-nucleating site density with decreasing temperature.
Comparison with published mineralogical data suggests that these nucleation behaviors are linked to the crystallographic nature of the K-feldspar phase. Samples that do not develop additional subpopulations after the initial onset are commonly associated with the more disordered orthoclase polymorph, whereas samples exhibiting continuous nucleation activity tend to contain the more structurally ordered Mc phase. Additional HUB analyses of thermally and chemically treated feldspars, designed to increase surface defect densities (e.g., cracks and pores), further support the hypothesis that the initial freezing onset is primarily driven by defect-related sites associated with perthitic intergrowths. In contrast, the emergence of additional ice-nucleating site populations at lower temperatures appears to be strongly influenced by the degree of structural ordering within the feldspar.
These results support the interpretation of three distinct ice nucleation sites populations: a high-temperature population associated with defect-related and chemically heterogeneous surface features (SubP-A), an intermediate-temperature population linked to structurally ordered K-feldspar domains (SubP-B), and a lower-temperature population representing more ubiquitous, less efficient nucleation sites (SubP-C).
Given the central role of feldspar in atmospheric ice nucleation – particularly in the formation of mixed-phase clouds (Atkinson et al., 2013; Chatziparaschos et al., 2023), which influence climate feedback mechanisms (Murray et al., 2021) – these findings may have implications for improving the representation of IN in cloud microphysics and climate models. Beyond atmospheric science, the ability of feldspars to induce ice formation at relatively high temperatures also holds promise for technological applications requiring controlled or enhanced freezing, such as cryopreservation (Murray and Gibson, 2022; Daily et al., 2023). A deeper understanding of the mineralogical features that promote ice nucleation, together with the identification of reliable natural sources of such materials, may therefore provide both scientific insight and technological value.
Additional characterization is provided in the Supplement, and the dataset is available at https://doi.org/10.5281/zenodo.17396669 (Canet et al., 2025).
The supplement related to this article is available online at https://doi.org/10.5194/acp-26-5635-2026-supplement.
AV and LR designed and conceptualized the study. JC and GR conducted the research under supervision of AV, KM and MB. AV led the original draft preparation and were completed by JC, LR, and MGV. GR, KM and MB reviewed the writing. JC and AV analysed and interpreted the data. KM and GR contributed to the interpretation of the results. MGV and PA performed characterization, analysis and provided expertise into the mineralogical aspects. JC and MGV prepared the visualization.
The contact author has declared that none of the authors has any competing interests.
Publisher's note: Copernicus Publications remains neutral with regard to jurisdictional claims made in the text, published maps, institutional affiliations, or any other geographical representation in this paper. The authors bear the ultimate responsibility for providing appropriate place names. Views expressed in the text are those of the authors and do not necessarily reflect the views of the publisher.
We would like to express our gratitude to the help of Albert Orúe from Feldespatos Llansà S.A., and Michel Galvin, for providing us with feldspar samples. We acknowledge the contribution from ICMAB-CSIC's Scientific & Technological Services, in particular Dr. Alejandro Borrás, for performing the BET measurements. We thank Dr. Janine Fröhlich-Nowoisky and Anna-Lena Leifke at the Max Planck Institute for Chemistry for their support and access to laboratory facilities and instrumentation. This work has been performed in the framework of the PhD program “Chemistry and Chemical Engineering” of IQS by JC.
During the preparation of this work the author(s) used ChatGPT in order to assist with grammatical revision. After using this tool/service, the author(s) reviewed and edited the content as needed and take(s) full responsibility for the content of the published article.
This work was supported by multiple research projects. This publication is part of projects CPP2021-009093 and TED2021-129572B-I00 funded by MICIU/AEI/10.13039/501100011033 and by the European Union NextGenerationEU/PRTR. It is also part of projects PID2023-153245NB-I00 and CEX2023-001263-S funded by MCIN/AEI/10.13039/501100011033/FEDER, EU. In addition, this work has been supported by the I-LINK 2024 and IMOVE 2024 call, funded by CSIC.
The article processing charges for this open-access publication were covered by the CSIC Open Access Publication Support Initiative through its Unit of Information Resources for Research (URICI).
This paper was edited by Luis A. Ladino and reviewed by Thomas F. Whale and three anonymous referees.
Atkinson, J. D., Murray, B. J., Woodhouse, M. T., Whale, T. F., Baustian, K. J., Carslaw, K. S., Dobbie, S., O'Sullivan, D., and Malkin, T. L.: The importance of feldspar for ice nucleation by mineral dust in mixed-phase clouds, Nature, 498, 355–358, https://doi.org/10.1038/nature12278, 2013.
Augustin-Bauditz, S., Wex, H., Kanter, S., Ebert, M., Niedermeier, D., Stolz, F., Prager, A., and Stratmann, F.: The immersion mode ice nucleation behavior of mineral dusts: A comparison of different pure and surface modified dusts, Geophys. Res. Lett., 41, 7375–7382, https://doi.org/10.1002/2014GL061317, 2014.
Brown, W. L. and Parsons, I.: Zoned ternary feldspars in the Klokken intrusion: exsolution microtextures and mechanisms, Contr. Mineral. Petrol., 98, 444–454, https://doi.org/10.1007/BF00372364, 1988.
Brunauer, S., Emmett, P. H., and Teller, E.: Adsorption of Gases in Multimolecular Layers, J. Am. Chem. Soc., 60, 309–319, https://doi.org/10.1021/ja01269a023, 1938.
Burrows, S. M., McCluskey, C. S., Cornwell, G., Steinke, I., Zhang, K., Zhao, B., Zawadowicz, M., Raman, A., Kulkarni, G., China, S., Zelenyuk, A., and DeMott, P. J.: Ice-Nucleating Particles That Impact Clouds and Climate: Observational and Modeling Research Needs, Rev. Geophys., 60, e2021RG000745, https://doi.org/10.1029/2021RG000745, 2022.
Canet, J., Rodríguez Domínguez, L., Renzer, G., Alfonso, P., Bonn, M., Meister, K., Garcia-Valles, M., and Verdaguer, A.: Dataset: Ice nucleation ability of perthite feldspar powder, Zenodo [data det], https://doi.org/10.5281/zenodo.17396669, 2025.
Chatziparaschos, M., Daskalakis, N., Myriokefalitakis, S., Kalivitis, N., Nenes, A., Gonçalves Ageitos, M., Costa-Surós, M., Pérez García-Pando, C., Zanoli, M., Vrekoussis, M., and Kanakidou, M.: Role of K-feldspar and quartz in global ice nucleation by mineral dust in mixed-phase clouds, Atmos. Chem. Phys., 23, 1785–1801, https://doi.org/10.5194/acp-23-1785-2023, 2023.
Cziczo, D. J., Froyd, K. D., Hoose, C., Jensen, E. J., Diao, M., Zondlo, M. A., Smith, J. B., Twohy, C. H., and Murphy, D. M.: Clarifying the Dominant Sources and Mechanisms of Cirrus Cloud Formation, Science, 340, 1320–1324, doi.org/10.1126/science.1234145, 2013.
Daily, M. I., Whale, T. F., Kilbride, P., Lamb, S., John Morris, G., Picton, H. M., and Murray, B. J.: A highly active mineral-based ice nucleating agent supports in situ cell cryopreservation in a high throughput format, J. R. Soc. Interface, 20, 20220682, https://doi.org/10.1098/rsif.2022.0682, 2023.
de Almeida Ribeiro, I., Meister, K., and Molinero, V.: HUB: a method to model and extract the distribution of ice nucleation temperatures from drop-freezing experiments, Atmos. Chem. Phys., 23, 5623–5639, https://doi.org/10.5194/acp-23-5623-2023, 2023.
Franceschi, G., Conti, A., Lezuo, L., Abart, R., Mittendorfer, F., Schmid, M., and Diebold, U.: How Water Binds to Microcline Feldspar (001), J. Phys. Chem. Lett., 15, 15–22, https://doi.org/10.1021/acs.jpclett.3c03235, 2024.
Friddle, R. W. and Thürmer, K.: How nanoscale surface steps promote ice growth on feldspar: microscopy observation of morphology-enhanced condensation and freezing, Nanoscale, 11, 21147–21154, https://doi.org/10.1039/c9nr08729j, 2019.
Harrison, A. D., Whale, T. F., Carpenter, M. A., Holden, M. A., Neve, L., O'Sullivan, D., Vergara Temprado, J., and Murray, B. J.: Not all feldspars are equal: a survey of ice nucleating properties across the feldspar group of minerals, Atmos. Chem. Phys., 16, 10927–10940, https://doi.org/10.5194/acp-16-10927-2016, 2016.
Hoose, C. and Möhler, O.: Heterogeneous ice nucleation on atmospheric aerosols: a review of results from laboratory experiments, Atmos. Chem. Phys., 12, 9817–9854, https://doi.org/10.5194/acp-12-9817-2012, 2012.
Kanji, Z. A., Ladino, L. A., Wex, H., Boose, Y., Burkert-Kohn, M., Cziczo, D. J., and Krämer, M.: Overview of Ice Nucleating Particles, Am. Meteorol. Soc., 58, 1.1–1.33, https://doi.org/10.1175/amsmonographs-d-16-0006.1, 2017.
Keinert, A., Deck, K., Gaedeke, T., Leisner, T., and Kiselev, A. A.: Mechanism of ice nucleation in liquid water on alkali feldspars, Faraday Discuss., 235, 148–161, https://doi.org/10.1039/d1fd00115a, 2022.
Kiselev, A., Bachmann, F., Pedevilla, P., Cox, S. J., Michaelides, A., Gerthsen, D., and Leisner, T.: Active sites in heterogeneous ice nucleation-the example of K-rich feldspars, Science, 355, 367–371, https://doi.org/10.1126/science.aai8034, 2017.
Kiselev, A. A., Keinert, A., Gaedeke, T., Leisner, T., Sutter, C., Petrishcheva, E., and Abart, R.: Effect of chemically induced fracturing on the ice nucleation activity of alkali feldspar, Atmos. Chem. Phys., 21, 11801–11814, https://doi.org/10.5194/acp-21-11801-2021, 2021.
Knopf, D. A. and Alpert, P. A.: Atmospheric ice nucleation, Nat. Rev. Phys., 5, 203–217, https://doi.org/10.1038/s42254-023-00570-7, 2023.
Kunert, A. T., Lamneck, M., Helleis, F., Pöschl, U., Pöhlker, M. L., and Fröhlich-Nowoisky, J.: Twin-plate Ice Nucleation Assay (TINA) with infrared detection for high-throughput droplet freezing experiments with biological ice nuclei in laboratory and field samples, Atmos. Meas. Tech., 11, 6327–6337, https://doi.org/10.5194/amt-11-6327-2018, 2018.
Liang, M., Cheng, Y., Zhou, X., Liu, J., and Wang, J.: Determining Roles of Potassium-Feldspar Surface Characters in Affecting Ice Nucleation, Small Methods, 8, 2300407, https://doi.org/10.1002/smtd.202300407, 2024.
Martin, R. F., Galí, S., Alfonso, P., and Melgarejo, J. C: Three-Phase Perthite and the Progressive Predominance of Albite in the Cap de Creus LCT Pegmatite Swarm, Catalunya, Spain, Can. J. Mineral. Petrol., 63, 747–759, https://doi.org/10.3749/240002, 2025.
Murray, B. J., O'sullivan, D., Atkinson, J. D., and Webb, M. E.: Ice nucleation by particles immersed in supercooled cloud droplets, Chem. Soc. Rev., 41, 6519–6554, https://doi.org/10.1039/c2cs35200a, 2012.
Murray, B. J., Carslaw, K. S., and Field, P. R.: Opinion: Cloud-phase climate feedback and the importance of ice-nucleating particles, Atmos. Chem. Phys., 21, 665–679, https://doi.org/10.5194/acp-21-665-2021, 2021.
Murray, K. A. and Gibson, M. I.: Chemical approaches to cryopreservation, Nat. Rev. Chem., 6, 579–593, https://doi.org/10.1038/s41570-022-00407-4, 2022.
Pach, E. and Verdaguer, A.: Pores Dominate Ice Nucleation on Feldspars, J. Phys. Chem. C, 123, 20998–21004, https://doi.org/10.1021/acs.jpcc.9b05845, 2019.
Pach, E. and Verdaguer, A.: Freezing efficiency of feldspars is affected by their history of previous freeze-thaw events, Phys. Chem. Chem. Phys., 23, 24905–24914, https://doi.org/10.1039/d1cp02548a, 2021.
Peckhaus, A., Kiselev, A., Hiron, T., Ebert, M., and Leisner, T.: A comparative study of K-rich and Na Ca-rich feldspar ice-nucleating particles in a nanoliter droplet freezing assay, Atmos. Chem. Phys., 16, 11477–11496, https://doi.org/10.5194/acp-16-11477-2016, 2016.
Pedevilla, P., Cox, S. J., Slater, B., and Michaelides, A.: Can Ice-Like Structures Form on Non-Ice-Like Substrates? The Example of the K-feldspar Microcline, J. Phys. Chem. C, 120, 6704–6713, https://doi.org/10.1021/acs.jpcc.6b01155, 2016.
Pedevilla, P., Fitzner, M., and Michaelides, A.: What makes a good descriptor for heterogeneous ice nucleation on OH-patterned surfaces, Phys. Rev. B, 96, 115441, https://doi.org/10.1103/PhysRevB.96.115441, 2017.
Renzer, G., de Almeida Ribeiro, I., Guo, H. B., Fröhlich-Nowoisky, J., Berry, R. J., Bonn, M., Molinero, V., and Meister, K.: Hierarchical assembly and environmental enhancement of bacterial ice nucleators, P. Natl. Acad. Sci. USA, 121, e2409283121, https://doi.org/10.1073/pnas.2409283121, 2024.
Ribbe, P. H. (Ed.): Feldspar Mineralogy, Vol. 2, Walter de Gruyter GmbH & Co KG, 369 pp., ISBN 0-939950-14-6, 2018.
Shimizu, T. K., Maier, S., Verdaguer, A., Velasco-Velez, J. J., and Salmeron, M.: Water at surfaces and interfaces: From molecules to ice and bulk liquid, Prog. Surf. Sci., 93, 87–107, https://doi.org/10.1016/j.progsurf.2018.09.004, 2018.
Sosso, G. C., Sudera, P., Backes, A. T., Whale, T. F., Fröhlich-Nowoisky, J., Bonn, M., Michaelides, A., and Backus, E. H. G.: The role of structural order in heterogeneous ice nucleation, Chem. Sci., 13, 5014–5026, https://doi.org/10.1039/d1sc06338c, 2022.
Vali, G.: Quantitative evaluation of experimental results on the heterogeneous freezing nucleation of supercooled liquids, J. Atmos. Sci., 28, 402–409, https://doi.org/10.1175/1520-0469(1971)028<0402:QEOERA>2.0.CO;2, 1971.
Vali, G.: Interpretation of freezing nucleation experiments: singular and stochastic; sites and surfaces, Atmos. Chem. Phys., 14, 5271–5294, https://doi.org/10.5194/acp-14-5271-2014, 2014.
Vali, G.: Revisiting the differential freezing nucleus spectra derived from drop-freezing experiments: methods of calculation, applications, and confidence limits, Atmos. Meas. Tech., 12, 1219–1231, https://doi.org/10.5194/amt-12-1219-2019, 2019.
Verdaguer, A., Sacha, G. M., Bluhm, H., and Salmeron, M.: Molecular structure of water at interfaces: Wetting at the nanometer scale, Chem. Rev., 106, 1478–1510, https://doi.org/10.1021/cr040376l, 2006.
Warr, L. N.: IMA–CNMNC approved mineral symbols, Mineral. Mag., 85, 291–320, https://doi.org/10.1180/mgm.2021.43, 2021.
Welti, A., Lohmann, U., and Kanji, Z. A.: Ice nucleation properties of K-feldspar polymorphs and plagioclase feldspars, Atmos. Chem. Phys., 19, 10901–10918, https://doi.org/10.5194/acp-19-10901-2019, 2019.
Whale, T. F., Holden, M. A., Kulak, A. N., Kim, Y. Y., Meldrum, F. C., Christenson, H. K., and Murray, B. J.: The role of phase separation and related topography in the exceptional ice-nucleating ability of alkali feldspars, Phys. Chem. Chem. Phys., 19, 31186–31193, https://doi.org/10.1039/c7cp04898j, 2017.