the Creative Commons Attribution 4.0 License.
the Creative Commons Attribution 4.0 License.
 | 23 Apr 2026
Deriving cropland N2O emissions from space-based NO2 observations
Genevieve Plant
Eric A. Kort
Croplands are the largest anthropogenic source of nitrous oxide (N2O), a potent greenhouse gas and ozone-depleting substance. Agricultural emissions produce small atmospheric signals with high spatiotemporal variability presenting a large observational challenge. If capable, space-based observations could characterize cropland N2O emissions from farmlands across the world. No current satellite can resolve near-surface N2O variations from cropland emissions. However, satellite observations of nitrogen dioxide (NO2), a component of NOx along with nitric oxide (NO), capture cropland emissions. NO, which quickly converts to NO2 in the atmosphere, and N2O are co-emitted from soils. Both gases are produced by microbial soil processes and are emitted in large amounts as a result of excess nitrogen from applied fertilizer. Given their co-emission in croplands, we ask: Can satellite NO2 observations be used to infer N2O emissions? We examine coincident airborne N2O and NOx measurements downwind of California croplands to characterize N2O:NOx emission relationships from farms. We use these emission ratios to transform estimates of agricultural NOx emissions derived from space-based TROPOMI NO2 observations to N2O emissions. We compare these estimates to independent ground and airborne studies in the US Corn Belt and Mississippi River Valley. Space-based estimates are broadly consistent with these ground and airborne studies, suggesting that satellite NO2 observations can be used to infer cropland N2O emissions. Further refinement of a NO2 proxy approach for cropland N2O emissions has the potential to expand observational capabilities to constrain regional and global cropland N2O emissions and inform process models.
- Article
(3720 KB) - Full-text XML
-
Supplement
(558 KB) - BibTeX
- EndNote


Nitrous oxide (N2O) is a potent greenhouse gas and ozone-depleting substance with sizable anthropogenic emissions. In a 100-year time frame, N2O has a global warming potential 298 times that of carbon dioxide (Butterbach-Bahl et al., 2013; Ravishankara et al., 2009). With a long atmospheric lifetime (over 100 years) and no tropospheric sink, N2O emitted from the surface travels to the stratosphere, where it can react with excited oxygen atoms to produce reactive nitrogen oxide radicals that deplete stratospheric ozone. N2O is now the largest contributor to stratospheric ozone depletion of actively emitted anthropogenic gases (Ravishankara et al., 2009). Since the 1700s the atmospheric concentration of N2O has increased by over 60 parts per billion (ppb) (Tian et al., 2024), with an accelerating rate in recent years (Liang et al., 2022).
Agriculture is a dominant source of N2O emissions, contributing 3.8 (2.5–5.8) Tg N2O-N per year, or about 22 % (15 %–34 %) of global emissions, from 2007 to 2016, with a 30 % increase over the past four decades due to nitrogen fertilization (Tian et al., 2020). This trend is expected to accelerate due to the growing demand for food and resources that support agricultural industries as well as waste and industrial processes, highlighting the urgent need for mitigation efforts (Davidson and Kanter, 2014).
Much of what we know about agricultural N2O emissions is the result of near-surface N2O measurements from soil flux chambers. Observations from chamber systems range from ∼ 10 samples per day (automatic chambers) (Rowlings et al., 2015; Sihi et al., 2020) to as infrequently as daily or monthly scales (manual chambers) (Griffis et al., 2013). The small spatial extent of chamber measurements, along with the availability of coincident auxiliary data (e.g., soil moisture, N application rates), permits robust mechanistic analyses of soil N2O emissions. However, given the spatial heterogeneity of N2O emissions (Lawrence et al., 2021a), the small spatial resolution (∼ 1 m2) of chamber measurements becomes a limitation when assessing emissions at larger spatial scales. Eddy covariance methods can be used to study N2O emissions at the field scale, with sensitivity to surface emissions from upwind soils of ∼ 10 to 1000 m2 (di Marco et al., 2005). Observational constraints at much larger scales are possible with tall (∼ 100 s of meters in height) tower measurements of N2O, which are interpreted with atmospheric transport and inverse modeling to infer N2O emissions. This provides emissions information integrated over several hundred kilometers at a monthly temporal resolution (Chen et al., 2016; Griffis et al., 2013; Nevison et al., 2018, 2023).
More recently, airborne sampling approaches have demonstrated the potential to bridge the scale gap from flux chambers/eddy-flux to tall-towers. Depending on their flight altitude, airborne measurements can resolve N2O emissions at the farm (∼ 1–2 km) scale (Gvakharia et al., 2020a) while sampling an area of several hundred kilometers (Dacic et al., 2024; Desjardins et al., 2015; Eckl et al., 2021; Gvakharia et al., 2020a; Herrera et al., 2021; Jimenez et al., 2005; Kort et al., 2008; Xiang et al., 2013). The limitation of airborne observations is that they sample short time windows and sample targeted regions as part of campaigns such as CalNex (2010) (Xiang et al., 2013), FEAST (2017) (Gvakharia et al., 2020a) and MAIZE (2021, 2022) (Dacic et al., 2024; Kort et al., 2022, 2024a, b).
Current observational methods to constrain N2O emissions for the study of process-level emission controls or mitigation strategies are currently limited to the targeted ground and airborne approaches detailed above. A remote-sensing, space-based solution would have the potential to assess agricultural N2O emissions at key spatiotemporal scales and broaden the spatial extent of studies beyond those limited by targeted ground and airborne measurements. However, presently, we cannot directly measure surface-level N2O signals from cropland emissions with a space-based platform. A promising opportunity, however, lies in the widespread remote sensing of nitrogen dioxide (NO2). Nitric oxide (NO) is co-emitted with N2O from agricultural soils (Davidson et al., 2000), and is largely oxidized to NO2 within seconds to minutes after emission (Jacob, 1999). Given that N2O and NO are co-emitted and their emission patterns are driven by similar variables (e.g., fertilizer application) (Harrison et al., 1995; Sanhueza et al., 1990), variability in atmospheric NO2 concentrations from agricultural soils may serve as a useful proxy for corresponding N2O emissions. Space-based NO2 observations track spatiotemporal variations in NO2 in both urban (Acker et al., 2025; Adams et al., 2023; Goldberg et al., 2019a, b, 2021, 2024; Ialongo et al., 2020; Park et al., 2022) and agricultural (Ghude et al., 2010; Huber et al., 2020, 2024; Lin et al., 2023) areas, and have done so for decades (Gonzalez Abad et al., 2019). Beyond the existence of NO2 instrumentation in space, the relatively short lifetime of NO2 means emissions of NO2 lead to large enhancements concentrated in the boundary layer, providing a large signal to observe. For N2O, in contrast, emissions add only a very small enhancement over large background values (often less than 1 ppb signals on background over 330 ppb; Dacic et al., 2024), which presents an observational challenge.
In this work, we explore the potential of using space-based NO2 observations as a proxy for agricultural N2O emissions. We first discuss the driving mechanisms for N2O and NO (NO2) from managed croplands. We then use coincident airborne observations of NO and NO2 (NOx) and N2O from the California Research at the Nexus of Air Quality and Climate Change (CalNex) campaign conducted in California in 2010 to derive N2O–to–NOx emission ratios for large spatial regions commensurate with satellite remote sensing of NO2. The aircraft sampling captures integrated emissions ratios that include heterogeneity of emissions in response to a number of driving process-level variables. We hypothesize that we can apply the observed emission ratio distribution to NOx emissions derived from satellite NO2 observations to obtain an estimate of N2O emissions from space-based observations. This then enables observational analyses that cover large regions of the world and can track changes over time. We evaluate this possibility for the corn belt and the Mississippi River Valley in the USA.
N2O and NO emissions in agricultural soils result from the microbial processes of nitrification and denitrification, with N2O predominating during denitrification (Baggs, 2008; Chen et al., 1995; Müller et al., 2003) and NO during nitrification (Skiba et al., 1993). Soil moisture influences these processes, where high water-filled pore space (WFPS) favors denitrification and low WFPS favors nitrification. This moisture dependency contributes to large emissions of N2O and NO following rainfall events (Kim et al., 2012; Scholes et al., 1997), and poorly drained soils are known to emit more N2O than well-drained soils, which is an important management consideration for N2O reduction strategies (Lawrence et al., 2021a). Drier soils favor lower N2O:NO emission ratios, often close to or less than unity, whereas wet soils can have higher emission ratios (Anderson and Levine, 1987; Davidson, 1992; Johansson and Sanhueza, 1988; Lipschultz et al., 1981; Tortoso and Hutchinson, 1990). Crop type also influences the N2O:NO ratio (Anderson and Levine, 1987).
Fertilizer application is the most important common driver of NO and N2O emissions, and fertilized soils have higher emissions of both trace gases (Harrison et al., 1995; Liu et al., 2017; Sanhueza et al., 1990; Shepherd et al., 1991). In the atmosphere, NO rapidly converts to NO2, which together are referred to as NOx (NO + NO2). The accumulation of fertilizer is hypothesized to drive large post-rainfall emissions of N2O (Cardenas et al., 1993; Johansson, 1984; Johansson and Sanhueza, 1988; Levine et al., 1996) and NOx (Ghude et al., 2010; Jaeglé et al., 2004; Oikawa et al., 2015; Scholes et al., 1997; Smith et al., 1997).
Given the link between fertilizer application and emissions of NO and N2O, we hypothesize that spatiotemporal patterns in NOx emissions from croplands may be a useful proxy to estimate agricultural N2O emissions. Over extended spatial and temporal scales that incorporate a variety of soil conditions and crop types, the variability in N2O:NO emissions should be reduced compared to shorter, more localized observations, such as those made in chamber studies. This integrating effect may increase the fidelity of using emissions ratios to derive N2O emissions.
Satellite observations of NO2 from TROPOMI or TEMPO, with ground pixel sizes in the range of 5.5 × 3.5–2 × 4.75 km, used to derive cropland NOx emissions will be sensitive to the integrated emissions from entire farms and multi-farm conglomerates and counties (∼ 250 km2; Merlos and Hijmans, 2020). To characterize the cropland emission behavior at comparable spatial scales, we use airborne sampling of N2O and NOx to determine an emissions relationship between these gases downwind of agricultural fields. Very few airborne campaigns have been made with continuous, high-accuracy, high-precision measurements of N2O and NOx (NO + NO2) in agricultural regions. For the analysis here we use observations from one of the few campaigns that collected such measurements, the CalNex campaign in 2010 (Fig. 1A), which sampled the San Joaquin and Sacramento Valleys during 6 flights between 7 May and 18 June 2010 (data available at: https://csl.noaa.gov/projects/calnex/, 15 March 2026). In-flight instrumentation included the Harvard/National Center for Atmospheric Research's (NCAR) Dual Quantum Cascade Laser Spectrometer for measurement of N2O (Jimenez et al., 2005; Kort et al., 2011), and a chemiluminescence sensor for NO and NO2 (Pollack et al., 2010; Ryerson et al., 1999, 2001, 2003). During CalNex, measurements of these gases were reported at a 1 s rate, and we applied an additional 5 s centered rolling average. In this study, we isolate cropland regions by restricting our analysis to locations > 0.04° (∼ 3.7–4.4 km) from regions with emissions in the top 1 % of the National Emissions Inventory (NEI) (Strum et al., 2017), and to periods when the aircraft was below 500 m elevation.
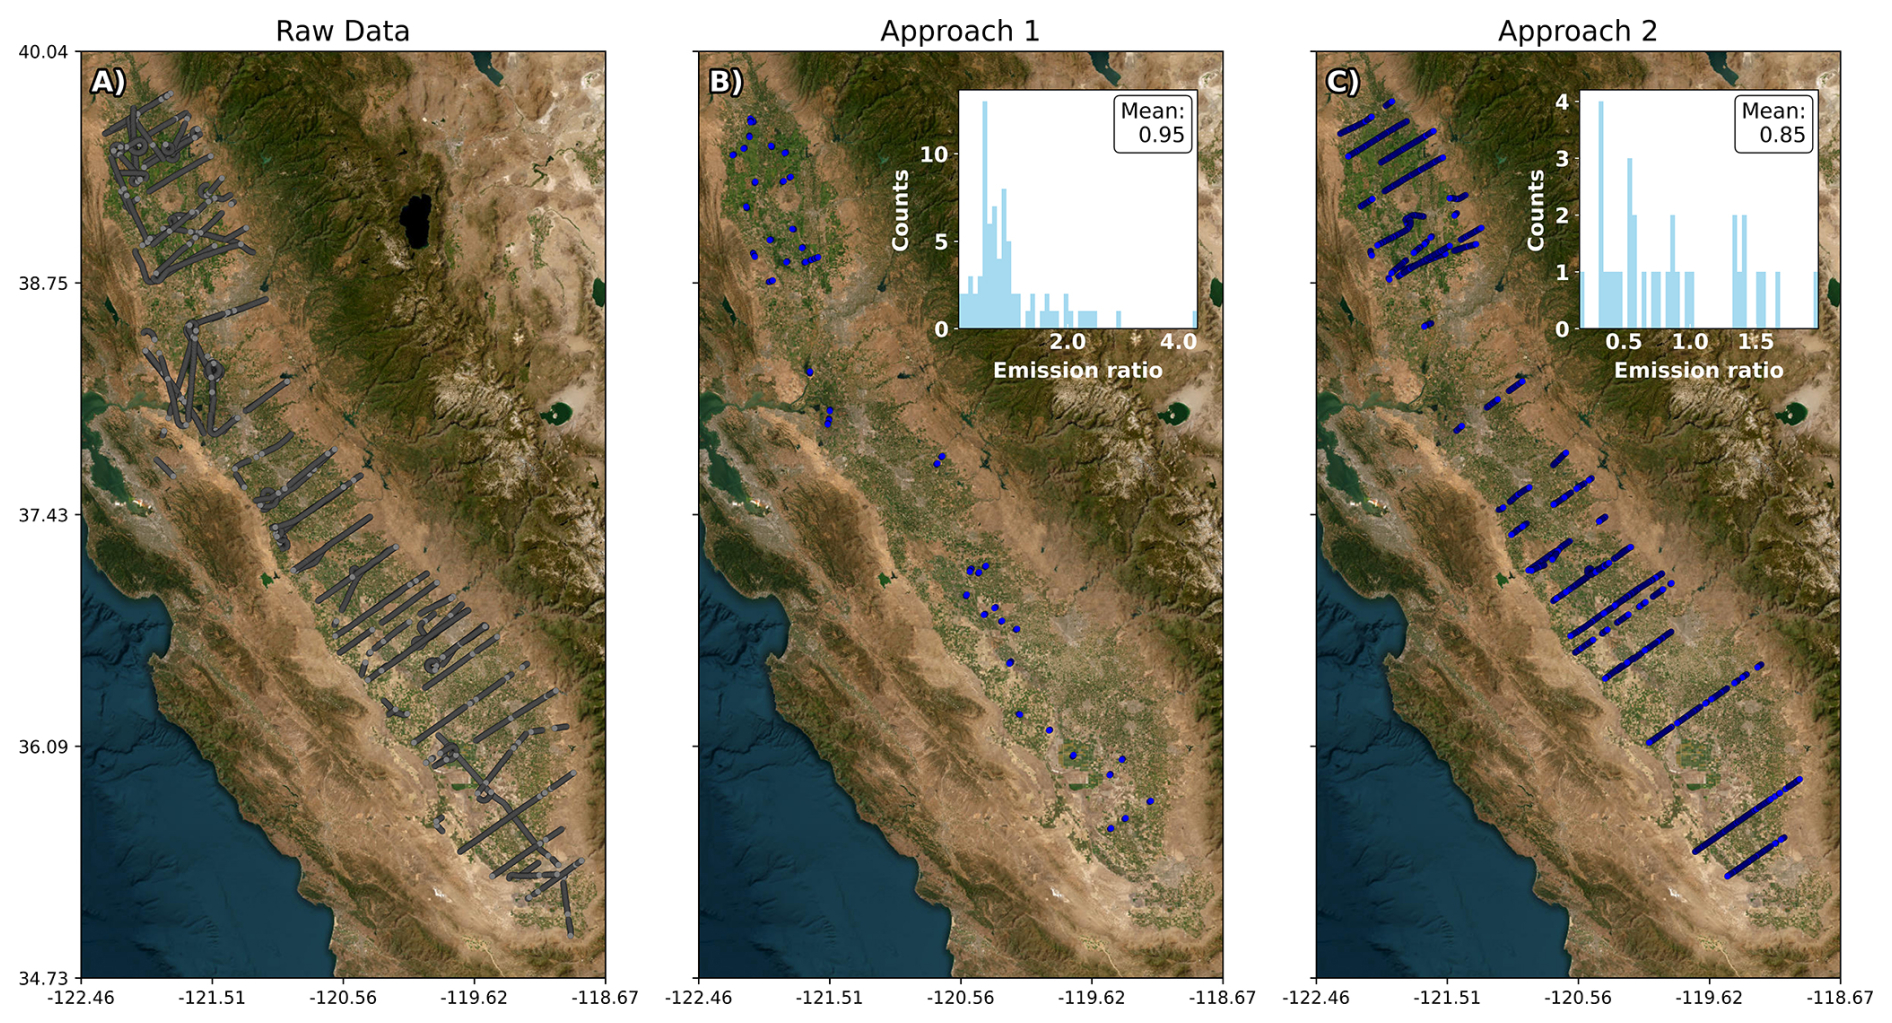
Figure 1Flight maps corresponding to data remaining after filtering steps in (A) the raw CalNex dataset filtered for data within the agricultural fields and away from high NO2-emission areas, (B) in approach 1 and (C) in approach 2. A histogram showing the distribution of binned molecular emission ratios determined in each respective approach is overlaid upon the map. Satellite imagery credit: Esri | Powered by Esri.
Literature from chamber studies often report the emission relationships between NO and N2O. Chamber measurements of soil emissions typically directly observe NO prior to substantial conversion to NO2. In this work we determine N2O:NOx molecular ratios from the aircraft, in order to provide a factor that can be multiplied directly to a soil NOx emissions estimate to generate N2O emissions. The soil NOx estimate could be generated from a range of different approaches, including from space-based NO2 observations as we demonstrate here. While soil emissions of NOx are predominantly NO, when observed from aircraft or satellite downwind of emissions, the majority of this NO has been converted to NO2 (Goldberg et al., 2024; Kimbrough et al., 2017; Pilegaard, 2013; Seinfeld and Pandis, 2016; Williams et al., 1992).
For the CalNex observations, we consider both the NO2 and NO measurements to capture the total quantity of NOx emitted from the agricultural fields. We note the majority of the NO emitted has converted to NO2 by the time the air has reached the aircraft, so if the subsequent analysis was performed only with NO2, the results are very similar.
We apply two methods to characterize N2O:NOx emission relationships from the CalNex airborne dataset. Figure 1B and 1C show histograms of derived emission ratios corresponding to each approach overlaid over flight maps with the location of data from those approaches. We use these emission ratios to characterize the heterogeneity in the empirical relationship between N2O and NOx at the farm to multi-farm scale. Below, we briefly outline each approach.
Approach 1 seeks to isolate concentration enhancement signals from cropland emissions within ∼ 10 km of the aircraft to determine aircraft-derived N2O:NOx emission relationships. We isolate concentration enhancements from near-field cropland emissions by filtering for distinct peaks in N2O concentration and accounting for the chemical loss of NO2. A similar method has been performed to isolate plumes from nearby natural gas flares in the Bakken (Gvakharia et al., 2017). First, we determine N2O, NO and NO2 enhancements as the concentration above the 5th percentile of a rolling, centered, one-minute window for every data point from the CalNex airborne NO, NO2 and N2O dataset. This background approach means enhancements only emerge when they correspond to a plume of this width or narrower. Using a gaussian plume model, a source of this width would be ∼ 2–4 km in distance upwind of the aircraft assuming moderate instability. Sources further than this will impact the background but not the enhancement. In this way, distant (20–100 km) pollution sources do not impact our analysis. We then isolate cases that are separated by at least 5 seconds in time (∼ 500+ m in space) where N2O concentration is enhanced and NO, NO2, and N2O's concentration perturbations exceed instrument noise. We require 8 or more observations where the range from minimum to maximum N2O concentration enhancement exceeds 0.09 ppb. Cases are removed if their slopes are below zero, as these do not imply co-emission.
We account for photochemical loss of NO2 by estimating the distance from the source to the observed N2O enhancement. Assuming the width of an observed enhancement represents a plume's width, we estimate the transport distance from the plume's origin using rural dispersion parameters from Van Zannetti et al. (2013). We assume a moderately unstable atmosphere during CalNex. Based on daily wind conditions, we estimate the transport time relative to the average NO2 lifetime and add this NO2 lost due to photochemistry back to the observed NO2 enhancement, creating a chemically corrected NO2 enhancement. We then add the observed NO enhancement, thus generating a NOx enhancement corresponding to emissions from the agricultural field. For each isolated plume, we use the observed N2O enhancement and chemically corrected NOx enhancement to calculate a N2O:NOx emission ratio using type-II ranged major axis regression. For each plume, the slope represents a unique emission ratio.
The average chemistry corrected enhancement emission ratio (referred to as the emission ratio from here forward) is 0.95 ppb N, a slightly lower value than the ratio (1.36 ppb N) if chemical loss is not accounted for. This adjustment is small compared to the variance we see in the ratio. The final dataset using this approach results in 76 individual plumes observed in the near-field of croplands to derive the N2O:NOx emission ratio, as shown in Fig. 1B. The resultant molecular emissions ratio distribution will encompass variation due to a number of variable drivers of emissions in the upwind region (crop type, fertilizer, soil moisture, etc…).
Approach 2 incorporates the airborne measurements at a broader spatial scale. With this method, we isolate individual flight legs, or portions of the aircraft transects, that are perpendicular to daily wind direction and downwind of agricultural fields. We then characterize each flight leg's N2O:NOx relationship and treat it as a unique concentration enhancement ratio. Similar to approach 1, we derive the background by defining the enhancement as the concentration greater than the 5th percentile of a rolling centered one-minute window around every data point. Approach 2, rather than isolating small-scale cropland emissions as in approach 1, derives an integrated concentration enhancement relationship of N2O to NOx across a portion of the cropland. We assume impacts from chemical loss are averaged out across flight legs and therefore do not directly correct for the chemical loss of NO2. Therefore, for approach 2, we assume enhancement ratios are equivalent to emission ratios. Approach 2 yields an average molecular emissions ratio of 0.85, determined using type-II ranged major axis regression on the N2O and NOx concentration enhancements. Flight legs considered in this method are shown in Fig. 1C. This approach includes more observational data than approach 1, integrating larger domains into the determined emissions ratio.
As seen in Fig. 1, we obtain similar mean N2O:NOx ratios from each method, demonstrating that the relationship is robust to methodological differences and assumptions. The distributions of the derived N2O:NOx values for each approach are also comparable. The Kruskal-Wallis test performed between these two distributions yields a p-value of 0.7827, suggesting no significant difference in median or distribution, and the Welch's t-test, compared between them, shows there is no significant difference between the emission ratios. Emission ratios range between 0.038 and 4.34 ppb N for approach 1 and 0.16 and 1.97 ppb N for approach 2, reflecting expected heterogeneity in N2O:NOx ratio over agricultural lands, and demonstrating that increasing the spatial scale aggregated to create these ratios dampens variability. The N2O:NOx values we observe are in line with N2O:NO values in literature from soil-chamber measurements, which report highly heterogeneous emission ratios typically ranging from ∼ 0.1–10, but that in rare cases can be as high as 100. (Johansson and Sanhueza, 1988; Tortoso and Hutchinson, 1990). This variation occurs as a function of factors such as fertilizer application, crop-type, and other management and environmental factors (Anderson and Levine, 1987; Davidson, 1992; Johansson and Sanhueza, 1988; Lipschultz et al., 1981). As expected with the larger spatial scale of our airborne approach, integrating over variable soil conditions and crop types, our ratios show less variability than prior soil chamber studies and decrease in variability as more observations are aggregated (from approach 1 to approach 2). More coincident observations of N2O and NOx downwind of a variety of agricultural domains under varied conditions could lead to refinement and improvement on the approach outlined here. In the following sections, we use emission ratios derived from approach 2, though there is little sensitivity to this choice.
With N2O:NOx emissions ratios derived from the aircraft measurements, N2O emissions can be determined from space if soil NOx emissions are calculated from space-based NO2 observations. Many different methods can be applied to derive NOx emissions estimates from satellite NO2 observations. For instance, Huber et al. (2020) applied a box model to estimate NOx emissions from TROPOMI-observed NO2 enhancements within the Mississippi River Valley, Ghude et al. (2010) inferred top-down soil NOx emissions from OMI by mass balance, and Lin et al. (2023) estimated soil NOx emissions from TROPOMI based on seasonal variation.
Here, we use a simple chemical box model and TROPOMI NO2 observations to demonstrate quantification of agricultural N2O using space-based NO2 observations. We focus our analysis on three regions (Fig. 2) in the USA where independent ground and airborne measurement campaigns have previously been conducted to determine N2O emissions, providing a basis for direct comparison with this new approach. These independent studies of N2O emissions, conducted in different locations and with different methods, provide an opportunity for evaluation of our emissions ratio method. This evaluation is a strong challenge for this method, as the emissions ratios are determined from aircraft data collected over California in 2010, and crop-type, management practice, soil moisture, and other driving variables can be quite different in these central US regions.
In this work, we use TROPOMI Version 02.04.00 (S5P_L2__NO2____HiR_2) NO2 retrievals (KNMI). TROPOMI observations are filtered for a quality assurance value greater than or equal to 0.75, indicating high-quality data per the operational retrieval (van Geffen et al., 2020). We use these TROPOMI NO2 observations in a chemical box model to determine agricultural NOx emissions in the Mississippi River Valley, Nebraska, and Iowa, employing a similar data-model approach as previously outlined in Huber et al. (2020). The chemical box model defined by Eq. (1):
The first two terms in Eq. (1) captures advection, representing NO2 advected into and out of a box model domain. Here, U represents the average zonal wind speed (m s−1) across the box of interest and X is the distance of the east-to-west edge of the box model domain. V denotes meridional winds and Y denotes north-to-south edge distance along the box model domain. In this work, Δ(NO2,VCD) denotes the mean TROPOMI NO2 column enhancement above a background, here defined as the 5th percentile of NO2 within the box. This enhancement is used as a proxy for the spatial gradient across the domain, where the background value is representative of the inflow into the box and the resulting enhancement is representative of the outflow. This is similar to approaches used in previous studies (Godłowska et al., 2023; Huber et al., 2020; Li et al., 2021). The third term denotes deposition, where Vd denotes the deposition velocity (m s−1) from Yang et al. (2010) (Deposition velocity by month: DJF, 0.02 cm s−1; MAM, 0.16 cm s−1; JJA, 0.29 cm s−1; SON, 0.06 cm s−1). NO2,VCD is the average NO2 vertical column density in the box model domain and ZPBL is the boundary layer height estimate over the box model domain. Similar to Huber et al. (2020), ZPBL is set to 1000 m over the course of the study. The fourth term represents chemical loss, where NO2,VCD again denotes the NO2 vertical column density in the box model domain and “t” represents the lifetime of NOx. The final term ENEI denotes the average fossil fuel NOx emissions in the box model domain from the 2014 NEI inventory (Strum et al., 2017), averaged monthly to eliminate noise. This model outputs an estimate of non-fossil fuel NOx emissions for the box model domain.
Lifetime values used for the analyses were derived from Martin et al. (2003). In Huber et al. (2020) lifetimes of 3, 5, and 7 h were used (also derived from Martin et al., 2003) to constrain the influence of lifetime on the analysis. We opt to use a lifetime value of 3 h for this main text, but variation in results due to these lifetime values of 5 (moderate) and 7 (slow) hours can be observed in Figs. S1 and S2 in the Supplement. As was observed in Huber et al. (2020) lifetime has a large impact on NOx emission estimates.
In this work, we analyze TROPOMI NO2 retrievals on a daily scale. The size and location of the analysis domain vary depending upon the region of interest, but have a minimum size 0.75° × 0.75° to be consistent with the domain size used in Huber et al. (2020). We additionally exclude TROPOMI overpasses from the study if they incorporate less than 30 TROPOMI NO2 observations in our box model domain for the Lawrence et al. (2021a) and Gvakharia et al. (2020a) comparison, or less than 120 TROPOMI NO2 observations for the larger Dacic et al. (2024) comparison region. Once NOx emissions are derived using Eq. (1), we multiply soil NOx emissions (, units of nmol m−2 s−1), by the aircraft-derived N2O:NOx molecular emission ratio to obtain an estimate of N2O flux, , units of nmol m−2 s−1 (Eq. 2).
To incorporate the variability in the observationally derived emission ratio on estimated N2O emissions in this analysis, we employ a Monte Carlo resampling approach where we propagate variation in the N2O:NOx emission ratio through to N2O emissions. We iterate through the daily average values of TROPOMI-derived NOx emissions and multiply each by the distribution of emission ratios shown in Fig. 1C to derive all possible N2O emissions from the variation in N2O:NOx. We then randomly sample one of these N2O realizations over 10 000 iterations to create a distribution of TROPOMI NO2-derived N2O emissions. The 2.5th percentile and the 97.5th percentile define the 95 % confidence interval, with the mean providing a central estimate. This confidence interval reflects uncertainty in the analysis arising from the emission ratio derived in Sect. 3 and not absolute uncertainty in soil NOx emissions. Since our focus in this work is evaluating the viability of the emissions ratio proxy approach, we focus on uncertainty of the N2O:NOx emission ratios and quantify its impact on resulting N2O emission estimates. Depending on what approach one takes to generate NOx emissions estimates from space-based NO2 observations, other uncertainty would be added. For the box model we use here as an illustrative example, we conduct a sensitivity analysis to lifetime and deposition velocity (model terms 3 & 4), shown in Figs. S1–S4.
We compare our space-based N2O emissions estimates derived using California-observed N2O:NOx emission ratios with N2O emissions from independent studies. We first compare N2O emissions derived from TROPOMI-NO2 observations with those obtained from chamber measurements reported by Lawrence et al. (2021a). The chamber measurements, conducted between February 2017 and October 2019 in Iowa crop fields, are compared only for the warm season (May–September) of 2018 and 2019 when TROPOMI was operational, and chamber data was available. The comparison domain spans −94.055 to −93.305 in latitude (0.75°) and 41.605 to 42.355 in longitude (0.75°). The box model domain lies to the north of Des Moines, Iowa, and is centered on the Ames, Iowa field site referenced in Lawrence et al. (2021a) (41.98° N, 93.68° W), and is shown in Fig. 2A, with a star indicating the chamber location.
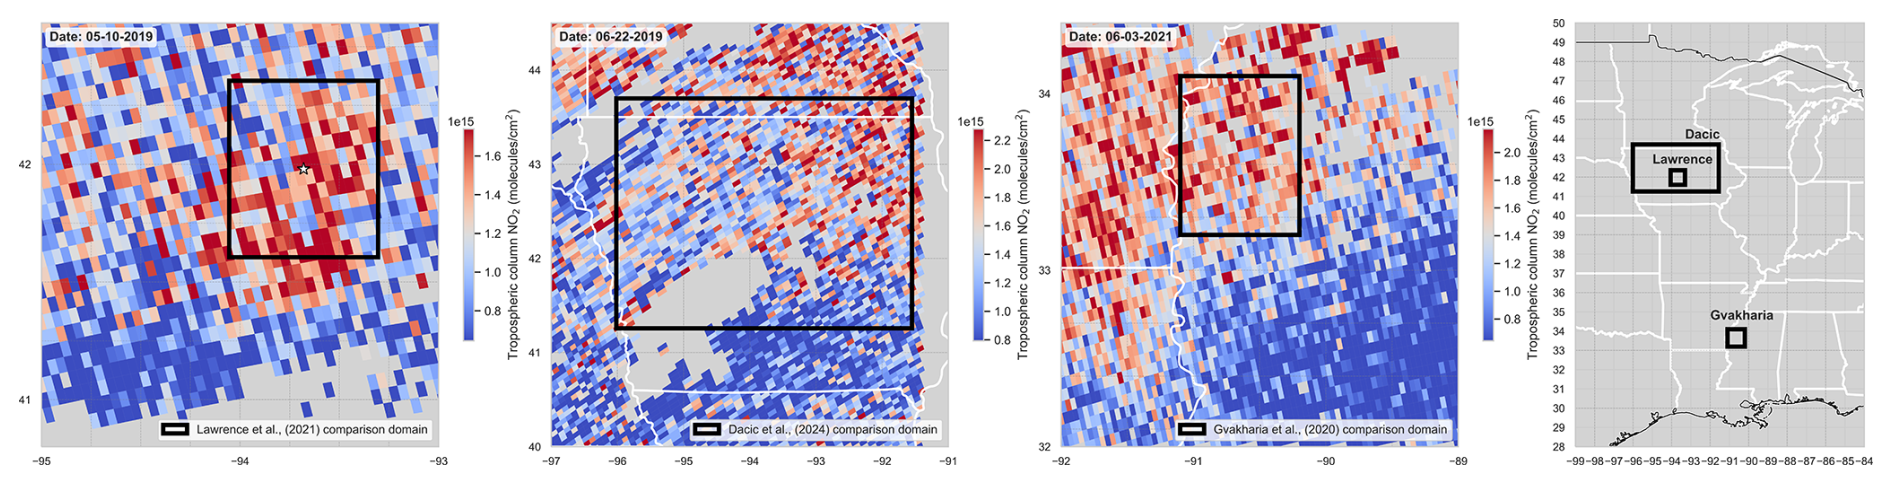
Figure 2TROPOMI tropospheric NO2 columns and the box model domains used for comparison with (A) Lawrence et al. (2021a) with a star denoting the chamber location, (B) Dacic et al. (2024), and (C) Gvakharia et al. (2020a). (D) Each corresponding region shown on a map of the central US.
We calculate the confidence interval for the Lawrence et al. (2021a) chamber dataset by randomly sampling daily average values on days that we also have TROPOMI NO2-derived N2O estimates and calculating a 95th confidence interval. For the same observational time-window, we derive daily N2O emission estimates for the box model domain using the proxy-method described in Sect. 4. The distribution of chamber-N2O emissions and its associated 95 % confidence interval against the mean and 95 % confidence interval for TROPOMI NO2-derived N2O flux are shown in Fig. 3A.
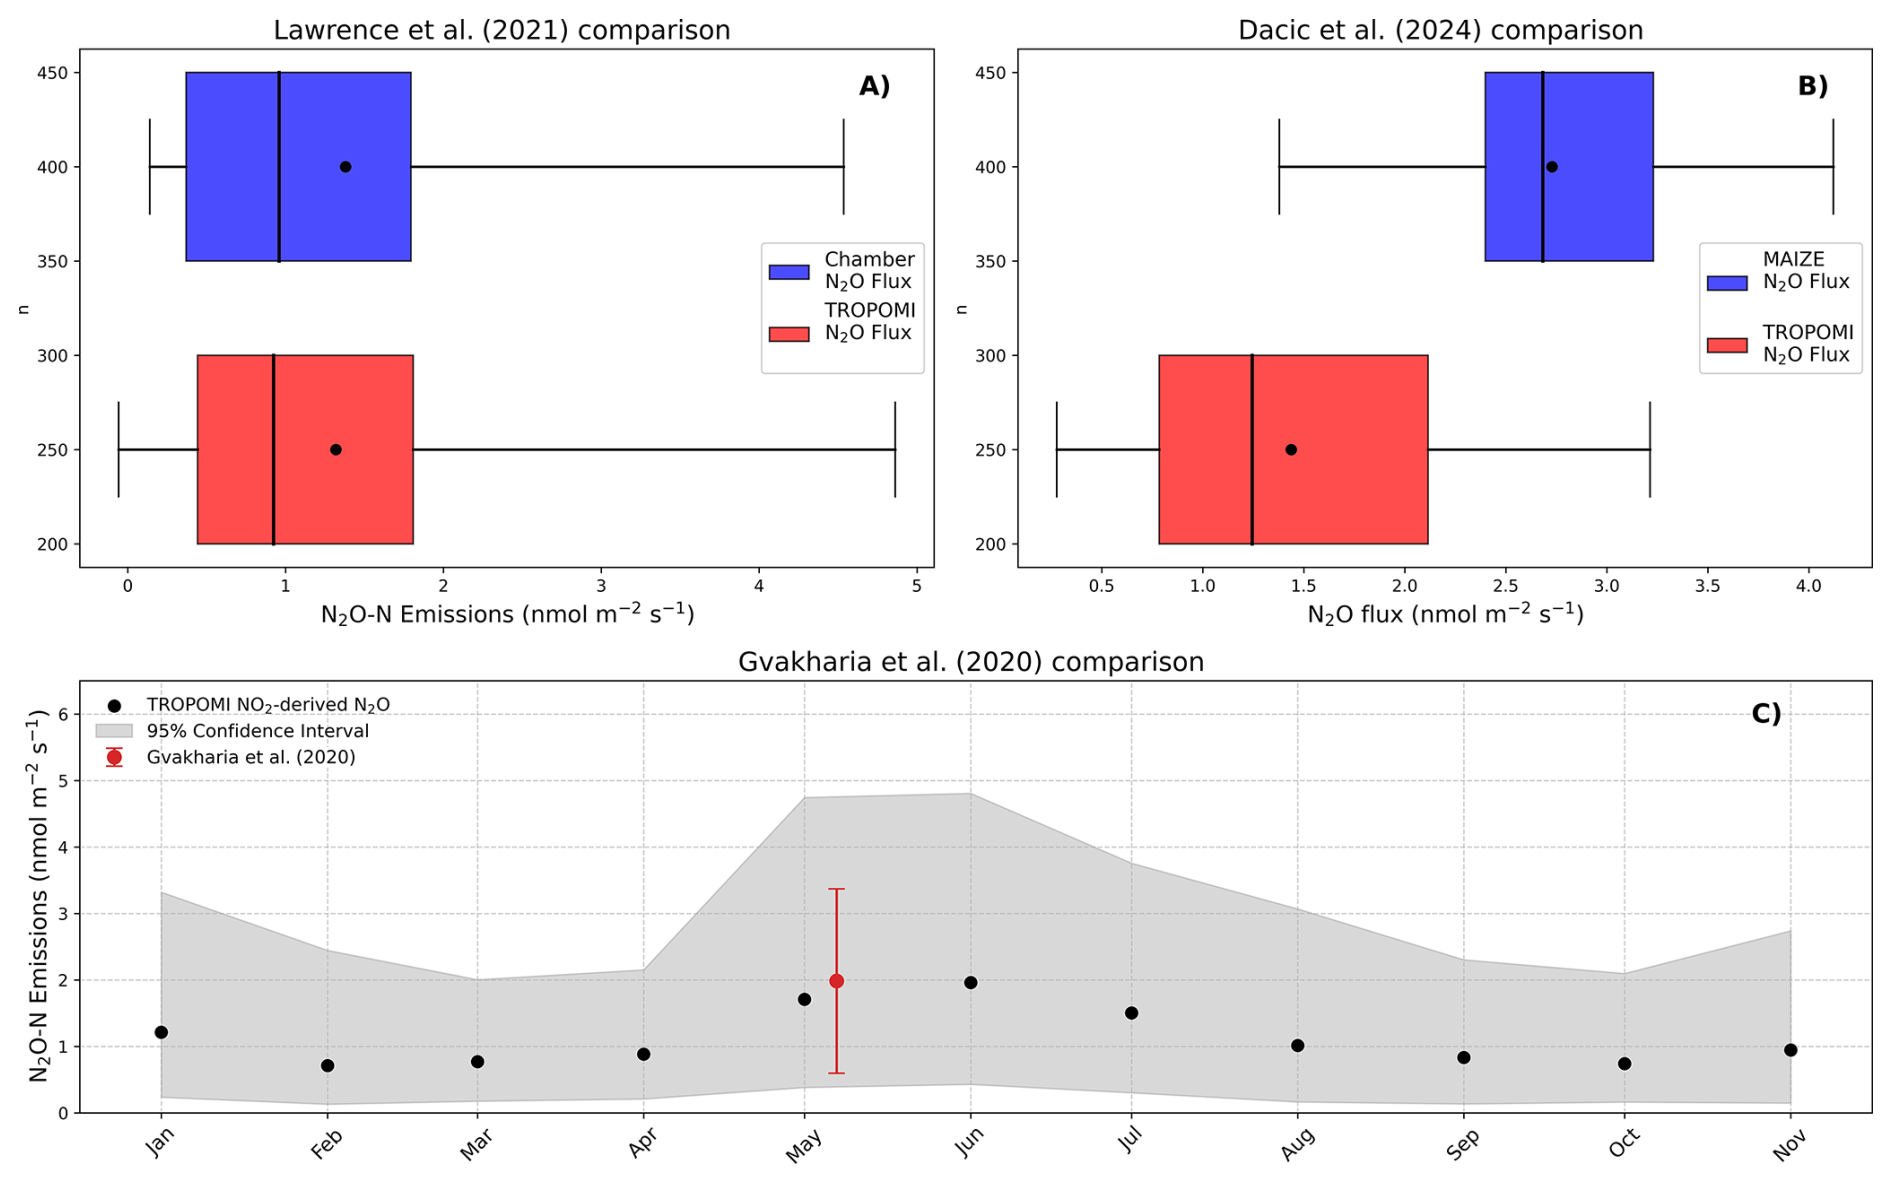
Figure 3Satellite derived estimates concurrence with independent studies. (A, top left) Box plots of the distribution of daily average N2O flux derived from chamber observations detailed in Lawrence et al. (2021a) and TROPOMI observations from that period. (B, top right) Box plots of N2O flux observed by TROPOMI across the MAIZE campaign domain, and ensemble averages for coincident days of the MAIZE (2021–2022) campaign. (C, Bottom) TROPOMI-NO2 derived N2O flux (gray distribution) compared against the N2O flux estimate from Gvakharia et al. (2020a) (red band).
The confidence interval for the mean chamber-derived N2O flux largely overlaps with that of the TROPOMI NO2-derived N2O flux (Fig. 3A). The mean values differ by ∼ 4.5 % (∼ 7.3 % using approach 1), with the chamber-derived flux averaging 1.38 (0.14, 4.53; 95 % CI) nmol N2O m−2 s−1 and the TROPOMI-derived flux averaging 1.32 (−0.06, 4.86; 95 % CI) (1.48 (−0.06, 6.28; 95 % CI) nmol N2O m−2 s−1 using approach 1). We evaluate the difference in these means with a nonparametric permutation test, which indicates the observed differences between population means are not significantly different. These are independent datasets and methods that operate on different scales. The relative agreement in mean values and the overlap in confidence intervals suggest that the TROPOMI-based approach provides a reasonable estimate of long-term chamber-derived mean N2O flux in this study.
Next, we compare TROPOMI NO2-derived N2O fluxes with N2O emissions derived from aircraft observations during the Measurements of Agriculture Illuminating farm-Zone Emissions of N2O (MAIZE) 2021 and 2022 campaigns (Dacic et al., 2024; Kort et al., 2022, 2024a, b). These airborne campaigns measured N2O concentrations over the Iowa croplands during May and June of both years. Observed N2O concentrations were linked to the surface using an atmospheric transport model, and an ensemble of surface fluxes was derived using a Bayesian inversion framework. In this comparison, we use a larger analysis domain to match the area over which the MAIZE campaigns took place. For 5 flight days of the MAIZE campaign (31 May, 3 June 2021, 18, 20, and 21 May 2022), we produce a TROPOMI NO2-derived N2O average flux for the MAIZE domain (S: 40.398; N: 43.399; W: −96.724; E: −90.044, Fig. 2B). We compare this with MAIZE daily ensemble averages. We then randomly sample the MAIZE daily flux ensembles using the previously described Monte Carlo resampling approach to obtain a 95 % confidence interval for MAIZE N2O flux. Figure 3B shows the comparison between airborne-informed MAIZE N2O flux and N2O flux we derive from TROPOMI NO2 observations and our aircraft-derived emission ratios.
While the mean TROPOMI-derived N2O flux is within the 95 % confidence interval of the MAIZE emissions, and vice versa (Fig. 3B), there is less notable agreement than in the comparison with the chamber emissions from Lawrence et al. (2021a) for a similar domain. There exist multiple possible reasons for the larger apparent discrepancy. (1) The comparison is limited to only five days. (2) The MAIZE aircraft flights captured a heavy-tail emissions distribution with small number of fields contributing substantially to total emissions. These high emissions events might be missed by chamber observations, and the coarse scale of the satellite observations used here might reduce sensitivity to small regions with high emissions, thus explaining the TROPOMI and chamber relative agreement with both values lower than determined by flights in MAIZE. (3) It is also possible the enhancement ratio approach used here is failing to capture the emissions ratio as well as desired for this place and time. Still, the mean emissions rate determined from satellite is captured within the airborne campaign 95 % confidence interval, and thus it appears this space-based proxy approach can provide a reasonable mean estimate for this region with five days of observations.
Finally, we compare N2O fluxes derived using the proposed space-based NO2 proxy method to fluxes derived from airborne mass balance estimates from Gvakharia et al. (2020a) over the Mississippi River Valley. During the Fertilizer Emissions Airborne Study (FEAST) in Spring 2017, Gvakharia et al. (2020a) observed N2O fluxes of 1.98 ± 1.39 nmol N2O-N m−2 s−1 in May 2017, noting significant spatial variation. The TROPOMI instrument was not operational until late 2018, so we do not have overlapping data to directly compare TROPOMI NO2-derived N2O flux estimates with those from Gvakharia et al. (2020a). Instead, we calculate emissions for a full calendar year for 2021 and compare these estimates with the May 2017 estimate from the FEAST data (see Figs. 2C and 3C). With the space-based proxy approach, we observe seasonal variation ranging from 0.75 nmol N2O-N m−2 s−1 in March (0.17, 2.0; 95 % CI) (0.83 nmol N2O-N m−2 s−1 using approach 1) to a peak of 1.96 in June (0.43, 4.8; 95 % CI) (2.22 nmol N2O-N m−2 s−1 using approach 1), and our spring estimate is in close agreement with the estimate from Gvakharia et al. (2020a), as shown in Fig. 3C. Specifically, we estimate 1.72 nmol N2O-N m−2 s−1 in May (0.38, 4.8; 95 % CI) (14.3 % difference) (1.93 nmol N2O-N m−2 s−1 in May 2.4 % difference using approach 1) using TROPOMI NO2 observations from 2021.
We find the TROPOMI NO2-derived N2O flux compares favorably with various independent measures of N2O flux and emissions from the corn belt (Dacic et al., 2024; Lawrence et al., 2021a) and Mississippi River Valley (Gvakharia et al., 2020a). For two of the comparisons, space-based estimates are within ∼ 15 % of these independently obtained N2O estimates, despite this testing capturing multiple regions and time-periods, and the airborne derived emission ratios coming from observations in a completely different agricultural region. The N2O:NOx ratios used here were observed with aircraft over California croplands – very different from the rainfed agricultural regions in the Midwest and southern USA. Previous studies have demonstrated strong spatiotemporal variation in emission ratios in response to soil moisture (Anderson and Levine, 1987; Davidson, 1992; Johansson and Sanhueza, 1988; Lipschultz et al., 1981; Tortoso and Hutchinson, 1990) and crop variety (Anderson and Levine, 1987) and suggests in wetter regions N2O:NOx ratios would shift upward in general. If that pattern held at the scales observed here, one would expect the satellite method to produce an underestimate of Midwest and southern USA emissions, which is perhaps another explanation for the comparison between the satellite method and Dacic et al. (2024). The general agreement of our proxy-based N2O estimates with those from independent assessments of cropland N2O emissions demonstrates the potential of scaling satellite-based NO2 observations with N2O:NOx emission ratios to capture agricultural N2O emissions, and that such an approach may provide a viable method to estimate N2O emissions from agricultural regions around the world without necessarily needing location specific N2O:NOx emission ratios. Further measurements of N2O:NOx emissions at commensurate spatial scales with satellite measurements across different agricultural regions over time would be invaluable to further evaluate this method's validity to capture emissions through potentially complex confounding spatial and temporal factors.
Constraining global emissions of N2O is crucial to understanding its spatiotemporal emission distribution, drivers of emissions, and to guide effective mitigation strategies. Ground-based measurements are inherently limited to the regions where they are installed, while airborne methods are often limited to targeted, short-duration research campaigns. North America has been the focus of many studies, but less is known about the other large agricultural regions around the world. Satellite observations, thus, are an attractive option because they have the potential for more spatial coverage (∼ global during the warm season) and relatively fine (∼ daily) temporal resolution. This can also serve to bridge the gap that exists between the present point- and region-scale N2O monitoring. In the absence of direct space-based observations of surface N2O concentrations, we propose to leverage the well-observed trace gas NO2 as a proxy for N2O emissions to create a pathway to monitor N2O emissions in global agricultural regions more comprehensively.
In this work, we derive airborne N2O–to–NOx emission ratios from the CalNex (2010) airborne campaign around a dense agricultural region of California. These ratios represent the molecular emissions ratio of N2O to NOx from croplands at spatial scales commensurate with space-based NO2 observations. We combine these ratios with satellite-derived NOx soil emissions to estimate N2O emissions. We compare our TROPOMI NO2-derived N2O fluxes with N2O emissions estimates from independent chamber observations and two distinct airborne campaigns made in Iowa and the Mississippi River Valley. Our space-based N2O emissions estimates compare favorably with these independent estimates across different regions and as measured by different methods covering different spatial and temporal scales. In comparison with chamber-derived N2O flux (Lawrence et al., 2021a), our estimate of mean flux only differs by 3.8 %, or ∼ 0.12 nmol N2O m−2 s−1. Mean estimates differ from airborne emission ratios taken in the Mississippi River Valley (Gvakharia et al., 2020a) by ∼ 14.3 %. Comparing emissions derived from Bayesian inversion of aircraft data (Dacic et al., 2024) yields a larger N2O flux mean difference by ∼ 60 %. In all cases, the confidence intervals of our space-based N2O flux estimates and those from independent measurements and approaches overlap.
We have demonstrated that space-based NO2 observations as a proxy for N2O cropland emissions compare favorably to independent estimates across multiple agricultural areas and years. This suggests that space-based NO2 retrievals are a viable and robust proxy for N2O flux at scales of at least 0.75 × 0.75°, and over timescales as short as five days. Further development and refinement of approaches to characterize agricultural NO2 from satellite observations and link them to N2O emissions are possible. As presented here, the largest source of uncertainty in the estimated N2O emissions derives from the large variability in the observed airborne N2O:NOx emissions ratio. Improved understanding and definition of this ratio, and what controls variation, could improve the fidelity of this proxy approach. This could be accomplished with airborne observations of NOx and N2O. Capturing different crops, agricultural practices and environmental conditions would provide more insight into emissions ratios and best practices on how to apply to independent satellite data in new domains. A complementary approach to the use of direct atmospheric observations of cropland N2O and NOx in our proxy-based method would be to combine satellite-based or ground-based estimates of soil moisture with a biogeochemical model, such as DayCent (Li et al., 1992; Parton et al., 1998), to derive modeled N2O:NOx emission ratios. With such an approach one could model emissions, and uncertainties, over many different regions and conditions where measurements may not be possible. The work presented here demonstrates a proxy-based approach that may offer a path towards a more spatially comprehensive constraint on regional and global budgets of agricultural N2O emissions.
All data used in this manuscript are archived in public databases. Airborne data from P3 aircraft during the CalNex campaign is available from the NOAA Chemical Sciences Laboratory at https://csl.noaa.gov/projects/calnex/ (last access: 15 March 2026). TROPOMI Level 2 Nitrogen Dioxide total column products, Version 02, are available from the European Space Agency at https://doi.org/10.5270/S5P-9bnp8q8 (ESA and KNMI, 2026). The National Emission Inventory is available from the Environmental Protection Agency at https://www.epa.gov/air-emissions-inventories/2017-national-emissions-inventory-nei-data (last access: 15 March 2026). Chamber flux measurements from Lawrence et al. (2021a) are available at https://doi.org/10.6073/pasta/e6117972f6a80d5f5a9db3549579 10ed (Lawrence et al., 2021b). Airborne data from the FEAST campaign and Gvakharia et al. (2020a) is available at https://doi.org/10.7302/Z2XK8CRG (Gvakharia et al., 2020b). Posterior fluxes from the airborne MAIZE campaign and Dacic et al. (2024) are available at https://doi.org/10.7302/9w5m-mn30 (Kort et al., 2024b).
The supplement related to this article is available online at https://doi.org/10.5194/acp-26-5517-2026-supplement.
TA developed the box model code, conducted all model simulations, and designed and optimized the aircraft data filtering methods. TA also prepared the manuscript, with significant input from EK and GP. EK conceived the project idea. EK and GP provided guidance on methodology and the presentation of results, and contributed to data collection and modeling for the experimental datasets used for comparison.
At least one of the (co-)authors is a member of the editorial board of Atmospheric Chemistry and Physics. The peer-review process was guided by an independent editor, and the authors also have no other competing interests to declare.
Publisher's note: Copernicus Publications remains neutral with regard to jurisdictional claims made in the text, published maps, institutional affiliations, or any other geographical representation in this paper. The authors bear the ultimate responsibility for providing appropriate place names. Views expressed in the text are those of the authors and do not necessarily reflect the views of the publisher.
The authors acknowledge the University of Michigan for supporting this work. The authors thank Dr. Daniel Huber and Dr. Natasha Dacic for their assistance with running the box model and interpreting the MAIZE results respectively. The authors also thank the CalNex, FEAST, MAIZE and TROPOMI science teams for their high-quality data collection and sharing of data into public archives.
This work was supported in part by the University of Michigan and the Environmental Defense Fund (grant no. 8100-000000-10800-100-00) with awards from the Bezos Earth Fund, King Philanthropies, and Arcadia, a charitable fund of Lisbet Rausing and Peter Baldwin.
The article processing charges for this open-access publication were covered by the Max Planck Society.
This paper was edited by Patrick Jöckel and reviewed by Eric Davidson and two anonymous referees.
Acker, S., Holloway, T., and Harkey, M.: Satellite detection of NO2 distributions using TROPOMI and TEMPO and comparison with ground-based concentration measurements, Atmos. Chem. Phys., 25, 8271–8288, https://doi.org/10.5194/acp-25-8271-2025, 2025.
Adams, T. J., Geddes, J. A., and Lind, E. S.: New Insights Into the Role of Atmospheric Transport and Mixing on Column and Surface Concentrations of NO2 at a Coastal Urban Site, J. Geophys. Res.-Atmos., 128, e2022JD038237, https://doi.org/10.1029/2022JD038237, 2023.
Anderson, I. C. and Levine, J. S.: Simultaneous field measurements of biogenic emissions of nitric oxide and nitrous oxide, J. Geophys. Res., 92, 965–976, https://doi.org/10.1029/JD092ID01P00965, 1987.
Baggs, E. M.: A review of stable isotope techniques for N2O source partitioning in soils: recent progress, remaining challenges and future considerations, Rapid Commun. Mass Sp., 22, 1664–1672, https://doi.org/10.1002/RCM.3456, 2008.
Butterbach-Bahl, K., Baggs, E. M., Dannenmann, M., Kiese, R., and Zechmeister-Boltenstern, S.: Nitrous oxide emissions from soils: How well do we understand the processes and their controls, Philos. T. R. Soc. B, 368, https://doi.org/10.1098/RSTB.2013.0122, 2013.
Cardenas, L., Rondon, A., Johansson, C., and Sanhueza, E.: Effects of soil moisture, temperature, and inorganic nitrogen on nitric oxide emissions from acidic tropical savannah soils, J. Geophys. Res., 98, 14783–14790, https://doi.org/10.1029/93JD01020, 1993.
Chen, Y., Tessier, S., MacKenzie, A. F., and Laverdière, M. R.: Nitrous oxide emission from an agricultural soil subjected to different freeze-thaw cycles, Agr. Ecosyst. Environ., 55, 123–128, https://doi.org/10.1016/0167-8809(95)00611-U, 1995.
Chen, Z., Griffis, T. J., Millet, D. B., Wood, J. D., Lee, X., Baker, J. M., Xiao, K., Turner, P. A., Chen, M., Zobitz, J., and Wells, K. C.: Partitioning N2O emissions within the U.S. Corn Belt using an inverse modeling approach, Global Biogeochem. Cy., 30, 1192–1205, https://doi.org/10.1002/2015GB005313, 2016.
Dacic, N., Plant, G., and Kort, E. A.: Airborne Measurements Reveal High Spatiotemporal Variation and the Heavy-Tail Characteristic of Nitrous Oxide Emissions in Iowa, J. Geophys. Res.-Atmos., 129, e2024JD041403, https://doi.org/10.1029/2024JD041403, 2024.
Davidson, E. A.: Sources of Nitric Oxide and Nitrous Oxide following Wetting of Dry Soil, Soil Sci. Soc. Am. J., 56, 95–102, https://doi.org/10.2136/SSSAJ1992.03615995005600010015X, 1992.
Davidson, E. A. and Kanter, D.: Inventories and scenarios of nitrous oxide emissions, Environ. Res. Lett., 9, 105012, https://doi.org/10.1088/1748-9326/9/10/105012, 2014.
Davidson, E. A., Keller, M., Erickson, H. E., Verchot, L. V., and Veldkamp, E.: Testing a Conceptual Model of Soil Emissions of Nitrous and Nitric Oxides: Using two functions based on soil nitrogen availability and soil water content, the hole-in-the-pipe model characterizes a large fraction of the observed variation of nitric oxide and nitrous oxide emissions from soils, Bioscience, 50, 667–680, https://doi.org/10.1641/0006-3568(2000)050[0667:TACMOS]2.0.CO;2, 2000.
Desjardins, R., Rochette, P., Pattey, E., and MacPherson, I.: Measurements of greenhouse gas fluxes using aircraft-and tower-based techniques, ASA Spec. P., 45–62, https://doi.org/10.2134/ASASPECPUB55.C3, 2015.
di Marco, C., Skiba, U., Weston, K., Hargreaves, K., and Fowler, D.: Field scale N2O flux measurements from grassland using eddy covariance, Water Air Soil Poll.: Focus 2004, 4, 143–149, https://doi.org/10.1007/S11267-005-3024-X, 2005.
Eckl, M., Roiger, A., Kostinek, J., Fiehn, A., Huntrieser, H., Knote, C., Barkley, Z. R., Ogle, S. M., Baier, B. C., Sweeney, C., and Davis, K. J.: Quantifying Nitrous Oxide Emissions in the U.S. Midwest: A Top-Down Study Using High Resolution Airborne In-Situ Observations, Geophys. Res. Lett., 48, e2020GL091266, https://doi.org/10.1029/2020GL091266, 2021.
ESA and KNMI: Sentinel-5P TROPOMI NO2 L2, ESA and KNMI [data set], https://doi.org/10.5270/S5P-9bnp8q8, 2026.
Ghude, S. D., Lal, D. M., Beig, G., Van Der A, R., and Sable, D.: Rain-induced soil NOx emission from India during the onset of the summer monsoon: A satellite perspective, J. Geophys. Res.-Atmos., 115, 16304, https://doi.org/10.1029/2009JD013367, 2010.
Goldberg, D. L., Lu, Z., Streets, D. G., De Foy, B., Griffin, D., Mclinden, C. A., Lamsal, L. N., Krotkov, N. A., and Eskes, H.: Enhanced Capabilities of TROPOMI NO2: Estimating NOx from North American Cities and Power Plants, Environ. Sci. Technol., 53, 12594–12601, https://doi.org/10.1021/ACS.EST.9B04488, 2019a.
Goldberg, D. L., Lu, Z., Oda, T., Lamsal, L. N., Liu, F., Griffin, D., McLinden, C. A., Krotkov, N. A., Duncan, B. N., and Streets, D. G.: Exploiting OMI NO2 satellite observations to infer fossil-fuel CO2 emissions from U.S. megacities, Sci. Total Environ., 695, 133805, https://doi.org/10.1016/J.SCITOTENV.2019.133805, 2019b.
Goldberg, D. L., Anenberg, S. C., Kerr, G. H., Mohegh, A., Lu, Z., and Streets, D. G.: TROPOMI NO2 in the United States: A Detailed Look at the Annual Averages, Weekly Cycles, Effects of Temperature, and Correlation With Surface NO2 Concentrations, Earths Future, 9, e2020EF001665, https://doi.org/10.1029/2020EF001665, 2021.
Goldberg, D. L., Tao, M., Kerr, G. H., Ma, S., Tong, D. Q., Fiore, A. M., Dickens, A. F., Adelman, Z. E., and Anenberg, S. C.: Evaluating the spatial patterns of U.S. urban NOx emissions using TROPOMI NO2, Remote Sens. Environ., 300, 113917, https://doi.org/10.1016/J.RSE.2023.113917, 2024.
Gonzalez Abad, G., Souri, A. H., Bak, J., Chance, K., Flynn, L. E., Krotkov, N. A., Lamsal, L., Li, C., Liu, X., Miller, C. C., Nowlan, C. R., Suleiman, R., and Wang, H.: Five decades observing Earth's atmospheric trace gases using ultraviolet and visible backscatter solar radiation from space, J. Quant. Spectrosc. Ra., 238, 106478, https://doi.org/10.1016/J.JQSRT.2019.04.030, 2019.
Griffis, T. J., Lee, X., Baker, J. M., Russelle, M. P., Zhang, X., Venterea, R., and Millet, D. B.: Reconciling the differences between top-down and bottom-up estimates of nitrous oxide emissions for the U.S. Corn Belt, Global Biogeochem. Cy., 27, 746–754, https://doi.org/10.1002/GBC.20066, 2013.
Gvakharia, A., Kort, E. A., Brandt, A., Peischl, J., Ryerson, T. B., Schwarz, J. P., Smith, M. L., and Sweeney, C.: Methane, Black Carbon, and Ethane Emissions from Natural Gas Flares in the Bakken Shale, North Dakota, Environ. Sci. Technol., 51, 5317–5325, https://doi.org/10.1021/ACS.EST.6B05183, 2017.
Gvakharia, A., Kort, E. A., Smith, M. L., and Conley, S.: Evaluating Cropland N2O Emissions and Fertilizer Plant Greenhouse Gas Emissions With Airborne Observations, J. Geophys. Res.-Atmos., 125, e2020JD032815, https://doi.org/10.1029/2020JD032815, 2020a.
Gvakharia, A., Kort, E. A., Smith, M. L., and Conley, S.: Airborne measurements from the FEAST campaign, University of Michigan Deep Blue Data [data set], https://doi.org/10.7302/Z2XK8CRG, 2020b.
Godłowska, J., Hajto, M. J., Lapeta, B., and Kaszowski, K.: The attempt to estimate annual variability of NOx emission in Poland using Sentinel-5P/TROPOMI data, Atmos. Environ., 294, 119482, https://doi.org/10.1016/J.ATMOSENV.2022.119482, 2023.
Harrison, R. M., Yamulki, S., Goulding, K. W. T., and Webster, C. P.: Effect of fertilizer application on NO and N2O fluxes from agricultural fields, J. Geophys. Res., 100, 25923–25931, https://doi.org/10.1029/95JD02461, 1995.
Herrera, S. A., Diskin, G. S., Harward, C., Sachse, G., De Wekker, S. F. J., Yang, M., Choi, Y., Wisthaler, A., Mallia, D. V., and Pusede, S. E.: Wintertime Nitrous Oxide Emissions in the San Joaquin Valley of California Estimated from Aircraft Observations, Environ. Sci. Technol., 55, 4462–4473, https://doi.org/10.1021/ACS.EST.0C08418, 2021.
Huber, D. E., Steiner, A. L., and Kort, E. A.: Daily Cropland Soil NOx Emissions Identified by TROPOMI and SMAP, Geophys. Res. Lett., 47, e2020GL089949, https://doi.org/10.1029/2020GL089949, 2020.
Huber, D. E., Kort, E. A., and Steiner, A. L.: Soil Moisture, Soil NOx and Regional Air Quality in the Agricultural Central United States, J. Geophys. Res.-Atmos., 129, e2024JD041015, https://doi.org/10.1029/2024JD041015, 2024.
Ialongo, I., Virta, H., Eskes, H., Hovila, J., and Douros, J.: Comparison of TROPOMI/Sentinel-5 Precursor NO2 observations with ground-based measurements in Helsinki, Atmos. Meas. Tech., 13, 205–218, https://doi.org/10.5194/amt-13-205-2020, 2020.
Jacob, D. J.: Introduction to Atmospheric Chemistry, Princeton University Press, Princeton, ISBN 978-0691001852, 1999.
Jaeglé, L., Martin, R. V., Chance, K., Steinberger, L., Kurosu, T. P., Jacob, D. J., Modi, A. I., Yoboué, V., Sigha-Nkamdjou, L., and Galy-Lacaux, C.: Satellite mapping of rain-induced nitric oxide emissions from soils, J. Geophys. Res.-Atmos., 109, 21310, https://doi.org/10.1029/2004JD004787, 2004.
Jimenez, R., Herndon, S., Shorter, J. H., Nelson, D. D., McManus, J. B., and Zahniser, M. S.: Atmospheric trace gas measurements using a dual quantum-cascade laser mid-infrared absorption spectrometer, Novel In-Plane Semiconductor Lasers IV, Vol. 5738, SPIE, https://doi.org/10.1117/12.597130, 2005, 2005.
Johansson, C.: Field measurements of emission of nitric oxide from fertilized and unfertilized forest soils in Sweden, J. Atmos. Chem., 1, 429–442, https://doi.org/10.1007/BF00053804, 1984.
Johansson, C. and Sanhueza, E.: Emission of NO from savanna soils during rainy season, J. Geophys. Res.-Atmos., 93, 14193–14198, https://doi.org/10.1029/JD093ID11P14193, 1988.
Kim, D.-G., Vargas, R., Bond-Lamberty, B., and Turetsky, M. R.: Effects of soil rewetting and thawing on soil gas fluxes: a review of current literature and suggestions for future research, Biogeosciences, 9, 2459–2483, https://doi.org/10.5194/bg-9-2459-2012, 2012.
Kimbrough, S., Chris Owen, R., Snyder, M., and Richmond-Bryant, J.: NO to NO2 Conversion Rate Analysis and Implications for Dispersion Model Chemistry Methods using Las Vegas, Nevada Near-Road Field Measurements, Atmos. Environ., 165, 23–34, https://doi.org/10.1016/J.ATMOSENV.2017.06.027, 2017.
Kort, E. A., Eluszkiewicz, J., Stephens, B. B., Miller, J. B., Gerbig, C., Nehrkorn, T., Daube, B. C., Kaplan, J. O., Houweling, S., and Wofsy, S. C.: Emissions of CH4 and N2O over the United States and Canada based on a receptor-oriented modeling framework and COBRA-NA atmospheric observations, Geophys. Res. Lett., 35, https://doi.org/10.1029/2008GL034031, 2008.
Kort, E. A., Patra, P. K., Ishijima, K., Daube, B. C., Jiménez, R., Elkins, J., Hurst, D., Moore, F. L., Sweeney, C., and Wofsy, S. C.: Tropospheric distribution and variability of N2O: Evidence for strong tropical emissions, Geophys. Res. Lett., 38, https://doi.org/10.1029/2011GL047612, 2011.
Kort, E. A., Plant, G., and Dacic, N.: Aircraft Data (2021) for Measurement of Agriculture Illuminating farm-Zone Emissions of N2O (MAIZE), University of Michigan – Deep Blue Data [data set], https://doi.org/10.7302/0jvh-0c91, 2022.
Kort, E. A., Plant, G., and Dacic, N.: Aircraft Data (2022) for Measurement of Agriculture Illuminating farm-Zone Emissions of N2O (MAIZE), University of Michigan – Deep Blue Data [data set], https://doi.org/10.7302/tmfd-nw87, 2024a.
Kort, E. A., Plant, G., and Dacic, N.: Posterior Flux Ensemble for Measurement of Agriculture Illuminating farm-Zone Emissions of N2O (MAIZE), University of Michigan – Deep Blue Data [data set], https://doi.org/10.7302/9w5m-mn30, 2024b.
Lawrence, N. C., Tenesaca, C. G., VanLoocke, A., and Hall, S. J.: Nitrous oxide emissions from agricultural soils challenge climate sustainability in the US Corn Belt, P. Natl. Acad. Sci. USA, 118, e2112108118, https://doi.org/10.1073/PNAS.2112108118, 2021a.
Lawrence, N. C., Tenesaca, C. G., VanLoocke, A., and Hall, S. J.: Chamber flux measurements supporting Lawrence et al. (2021), Environmental Data Initiative [data set], https://doi.org/10.6073/pasta/e6117972f6a80d5f5a9db354957910ed, 2021b.
Levine, J. S., Winstead, E. L., Parsons, D. A. B., Scholes, M. C., Scholes, R. J., Cofer, W. R., Cahoon, D. R., and Sebacher, D. I.: Biogenic soil emissions of nitric oxide (NO) and nitrous oxide (N2O) from savannas in South Africa: The impact of wetting and burning, J. Geophys. Res.-Atmos., 101, 23689–23697, https://doi.org/10.1029/96JD01661, 1996.
Li, C., Frolking, S., and Frolking, T. A.: A model of nitrous oxide evolution from soil driven by rainfall events: 2. Model applications, J. Geophys. Res., 97, 9777–9783, https://doi.org/10.1029/92jd00510, 1992.
Li, M., McDonald, B. C., McKeen, S. A., Eskes, H., Levelt, P., Francoeur, C., Harkins, C., He, J., Barth, M., Henze, D. K., Bela, M. M., Trainer, M., de Gouw, J. A., and Frost, G. J.: Assessment of Updated Fuel-Based Emissions Inventories Over the Contiguous United States Using TROPOMI NO2 Retrievals, J. Geophys. Res.-Atmos., 126, e2021JD035484, https://doi.org/10.1029/2021JD035484, 2021.
Liang, Q., Nevison, C., Dlugokencky, E., Hall, B. D., and Dutton, G.: 3-D Atmospheric Modeling of the Global Budget of N2O and Its Isotopologues for 1980–2019: The Impact of Anthropogenic Emissions, Global Biogeochem. Cy., 36, e2021GB007202, https://doi.org/10.1029/2021GB007202, 2022.
Lin, X., van der A, R. J., de Laat, J., Huijnen, V., Mijling, B., Ding, J., Eskes, H., Douros, J., Liu, M., Zhang, X., Liu, Z., van der, R. A., and Liu avander, Z.: European soil NOx emissions derived from satellite NO2 observations, Authorea [preprint], https://doi.org/10.22541/ESSOAR.170224578.81570487/V1, 2023.
Lipschultz, F., Zafiriou, O. C., Wofsy, S. C., McElroy, M. B., Valois, F. W., and Watson, S. W.: Production of NO and N2O by soil nitrifying bacteria, Nature, 294, 641–643, https://doi.org/10.1038/294641A0, 1981.
Liu, S., Lin, F., Wu, S., Ji, C., Sun, Y., Jin, Y., Li, S., Li, Z., and Zou, J.: A meta-analysis of fertilizer-induced soil NO and combined NO + N2O emissions, Glob. Change Biol., 23, 2520–2532, https://doi.org/10.1111/GCB.13485, 2017.
Martin, R. V., Jacob, D. J., Chance, K., Kurosu, T. P., Palmer, P. I., and Evans, M. J.: Global inventory of nitrogen oxide emissions constrained by space-based observations of NO2 columns, J. Geophys. Res.-Atmos., 108, https://doi.org/10.1029/2003JD003453, 2003.
Merlos, F. A. and Hijmans, R. J.: The scale dependency of spatial crop species diversity and its relation to temporal diversity, P. Natl. Acad. Sci. USA, 117, 26176–26182, https://doi.org/10.1073/PNAS.2011702117, 2020.
Müller, C., Kammann, C., Ottow, J. C. G., and Jäger, H. J.: Nitrous oxide emission from frozen grassland soil and during thawing periods, J. Plant Nutr. Soil Sc., 166, 46–53, https://doi.org/10.1002/JPLN.200390011, 2003.
Nevison, C., Andrews, A., Thoning, K., Dlugokencky, E., Sweeney, C., Miller, S., Saikawa, E., Benmergui, J., Fischer, M., Mountain, M., and Nehrkorn, T.: Nitrous Oxide Emissions Estimated With the CarbonTracker-Lagrange North American Regional Inversion Framework, Global Biogeochem. Cy., 32, 463–485, https://doi.org/10.1002/2017GB005759, 2018.
Nevison, C., Lan, X., and Ogle, S. M.: Remote Sensing Soil Freeze-Thaw Status and North American N2O Emissions From a Regional Inversion, Global Biogeochem. Cy., 37, e2023GB007759, https://doi.org/10.1029/2023GB007759, 2023.
Oikawa, P. Y., Ge, C., Wang, J., Eberwein, J. R., Liang, L. L., Allsman, L. A., Grantz, D. A., and Jenerette, G. D.: Unusually high soil nitrogen oxide emissions influence air quality in a high-temperature agricultural region, Nat. Commun., 6, 1–10, https://doi.org/10.1038/NCOMMS9753, 2015.
Park, J. U., Park, J. S., Diaz, D. S., Gebetsberger, M., Müller, M., Shalaby, L., Tiefengraber, M., Kim, H. J., Park, S. S., Song, C. K., and Kim, S. W.: Spatiotemporal inhomogeneity of total column NO2 in a polluted urban area inferred from TROPOMI and Pandora intercomparisons, GISci. Remote Sens., 59, 354–373, https://doi.org/10.1080/15481603.2022.2026640, 2022.
Parton, W. J., Hartman, M., Ojima, D., and Schimel, D.: DAYCENT and its land surface submodel: description and testing, Global Planet. Change, 19, 35–48, https://doi.org/10.1016/S0921-8181(98)00040-X, 1998.
Pilegaard, K.: Processes regulating nitric oxide emissions from soils, Philos. T. R. Soc. B, 368, 20130126, https://doi.org/10.1098/rstb.2013.0126, 2013.
Pollack, I. B., Lerner, B. M., and Ryerson, T. B.: Evaluation of ultraviolet light-emitting diodes for detection of atmospheric NO2 by photolysis – Chemiluminescence, J. Atmos. Chem., 65, 111–125, https://doi.org/10.1007/S10874-011-9184-3, 2010.
Ravishankara, A. R., Daniel, J. S., and Portmann, R. W.: Nitrous oxide (N2O): The dominant ozone-depleting substance emitted in the 21st century, Science, 326, 123–125, https://doi.org/10.1126/SCIENCE.1176985, 2009.
Rowlings, D. W., Grace, P. R., Scheer, C., and Liu, S.: Rainfall variability drives interannual variation in N2O emissions from a humid, subtropical pasture, Sci. Total Environ., 512–513, 8–18, https://doi.org/10.1016/J.SCITOTENV.2015.01.011, 2015.
Ryerson, T. B., Huey, L. G., Knapp, K., Neuman, J. A., Parrish, D. D., Sueper, D. T., and Fehsenfeld, F. C.: Design and initial characterization of an inlet for gas-phase NOy measurements from aircraft, J. Geophys. Res.-Atmos., 104, 5483–5492, https://doi.org/10.1029/1998JD100087, 1999.
Ryerson, T. B., Trainer, M., Holloway, J. S., Parrish, D. D., Huey, L. G., Sueper, D. T., Frost, G. J., Donnelly, S. G., Schauffler, S., Atlas, E. L., Kuster, W. C., Goldan, P. D., Hübler, G., Meagher, J. F., and Fehsenfeld, F. C.: Observations of ozone formation in power plant plumes and implications for ozone control strategies, Science, 292, 719–723, https://doi.org/10.1126/SCIENCE.1058113, 2001.
Ryerson, T. B., Trainer, M., Angevine, W. M., Brock, C. A., Dissly, R. W., Fehsenfeld, F. C., Frost, G. J., Goldan, P. D., Holloway, J. S., Hübler, G., Jakoubek, R. O., Kuster, W. C., Neuman, J. A., Nicks, D. K., Parrish, D. D., Roberts, J. M., Sueper, D. T., Atlas, E. L., Donnelly, S. G., Flocke, F., Fried, A., Potter, W. T., Schauffler, S., Stroud, V., Weinheimer, A. J., Wert, B. P., Wiedinmyer, C., Alvarez, R. J., Banta, R. M., Darby, L. S., and Senff, C. J.: Effect of petrochemical industrial emissions of reactive alkenes and NOx on tropospheric ozone formation in Houston, Texas, J. Geophys. Res.-Atmos., 108, 4249, https://doi.org/10.1029/2002JD003070, 2003.
Sanhueza, E., Wei Min Hao, Scharffe, D., Donoso, L., and Crutzen, P. J.: N2O and NO emissions from soils of the northern part of the Guayana Shield, Venezuela, J. Geophys. Res., 95, 22481–22488, https://doi.org/10.1029/JD095ID13P22481, 1990.
Scholes, M. C., Martin, R., Scholes, R. J., Parsons, D., and Winstead, E.: NO and N2O emissions from savanna soils following the first simulated rains of the season, Nutr. Cycl. Agroecosys., 48, 115–122, https://doi.org/10.1023/A:1009781420199, 1997.
Seinfeld, J. H. and Pandis, S. N.: Atmospheric chemistry and physics: from air pollution to climate change, John Wiley & Sons, ISBN 978-1118947401, 2016.
Shepherd, M. F., Barzetti, S., and Hastie, D. R.: The production of atmospheric NOx and N2O from a fertilized agricultural soil, Atmos. Environ. A-Gen., 25, 1961–1969, https://doi.org/10.1016/0960-1686(91)90277-E, 1991.
Sihi, D., Davidson, E. A., Savage, K. E., and Liang, D.: Simultaneous numerical representation of soil microsite production and consumption of carbon dioxide, methane, and nitrous oxide using probability distribution functions, Glob. Change Biol., 26, 200–218, https://doi.org/10.1111/GCB.14855, 2020.
Skiba, U., Smith, K. A., and Fowler, D.: Nitrification and denitrification as sources of nitric oxide and nitrous oxide in a sandy loam soil, Soil Biol. Biochem., 25, 1527–1536, https://doi.org/10.1016/0038-0717(93)90007-X, 1993.
Smith, K. A., McTaggart, I. P., and Tsuruta, H.: Emissions of N2O and NO associated with nitrogen fertilization in intensive agriculture, and the potential for mitigation, Soil Use Manage., 13, 296–304, https://doi.org/10.1111/J.1475-2743.1997.TB00601.X, 1997.
Strum, M., Eyth, A., and Vukovich, J.: Preparation of Emissions Inventories for the Version 7, 2014 Emissions Modeling Platform for NATA, https://www.acom.ucar.edu/Models/EPA/cmaq_cb6/ (last access: 15 March 2026), 2017.
Tian, H., Xu, R., Canadell, J. G., Thompson, R. L., Winiwarter, W., Suntharalingam, P., Davidson, E. A., Ciais, P., Jackson, R. B., Janssens-Maenhout, G., Prather, M. J., Regnier, P., Pan, N., Pan, S., Peters, G. P., Shi, H., Tubiello, F. N., Zaehle, S., Zhou, F., Arneth, A., Battaglia, G., Berthet, S., Bopp, L., Bouwman, A. F., Buitenhuis, E. T., Chang, J., Chipperfield, M. P., Dangal, S. R. S., Dlugokencky, E., Elkins, J. W., Eyre, B. D., Fu, B., Hall, B., Ito, A., Joos, F., Krummel, P. B., Landolfi, A., Laruelle, G. G., Lauerwald, R., Li, W., Lienert, S., Maavara, T., MacLeod, M., Millet, D. B., Olin, S., Patra, P. K., Prinn, R. G., Raymond, P. A., Ruiz, D. J., van der Werf, G. R., Vuichard, N., Wang, J., Weiss, R. F., Wells, K. C., Wilson, C., Yang, J., and Yao, Y.: A comprehensive quantification of global nitrous oxide sources and sinks, Nature, 586, 248–256, https://doi.org/10.1038/S41586-020-2780-0, 2020.
Tian, H., Pan, N., Thompson, R. L., Canadell, J. G., Suntharalingam, P., Regnier, P., Davidson, E. A., Prather, M., Ciais, P., Muntean, M., Pan, S., Winiwarter, W., Zaehle, S., Zhou, F., Jackson, R. B., Bange, H. W., Berthet, S., Bian, Z., Bianchi, D., Bouwman, A. F., Buitenhuis, E. T., Dutton, G., Hu, M., Ito, A., Jain, A. K., Jeltsch-Thömmes, A., Joos, F., Kou-Giesbrecht, S., Krummel, P. B., Lan, X., Landolfi, A., Lauerwald, R., Li, Y., Lu, C., Maavara, T., Manizza, M., Millet, D. B., Mühle, J., Patra, P. K., Peters, G. P., Qin, X., Raymond, P., Resplandy, L., Rosentreter, J. A., Shi, H., Sun, Q., Tonina, D., Tubiello, F. N., van der Werf, G. R., Vuichard, N., Wang, J., Wells, K. C., Western, L. M., Wilson, C., Yang, J., Yao, Y., You, Y., and Zhu, Q.: Global nitrous oxide budget (1980–2020), Earth Syst. Sci. Data, 16, 2543–2604, https://doi.org/10.5194/essd-16-2543-2024, 2024.
Tortoso, A. C. and Hutchinson, G. L.: Contributions of autotrophic and heterotrophic nitrifiers to soil NO and N2O emissions, Appl. Environ. Microb., 56, 1799–1805, https://doi.org/10.1128/AEM.56.6.1799-1805.1990, 1990.
van Geffen, J., Boersma, K. F., Eskes, H., Sneep, M., ter Linden, M., Zara, M., and Veefkind, J. P.: S5P TROPOMI NO2 slant column retrieval: method, stability, uncertainties and comparisons with OMI, Atmos. Meas. Tech., 13, 1315–1335, https://doi.org/10.5194/amt-13-1315-2020, 2020.
Van Zannetti, P., Reinhold, N., and York, N.: Air Pollution Modeling Theories, Computational Methods, Computational Mechanics Publications Southampton Boston, ISBN 978-1853121005, 2013.
Williams, E. J., Hutchinson, G. L., and Fehsenfeld, F. C.: NOx And N2O Emissions From Soil, Global Biogeochem. Cy., 6, 351–388, 1992.
Xiang, B., Miller, S. M., Kort, E. A., Santoni, G. W., Daube, B. C., Commane, R., Angevine, W. M., Ryerson, T. B., Trainer, M. K., Andrews, A. E., Nehrkorn, T., Tian, H., and Wofsy, S. C.: Nitrous oxide (N2O) emissions from California based on 2010 CalNex airborne measurements, J. Geophys. Res.-Atmos., 118, 2809–2820, https://doi.org/10.1002/JGRD.50189, 2013.
Yang, R., Hayashi, K., Zhu, B., Li, F., and Yan, X.: Atmospheric NH3 and NO2 concentration and nitrogen deposition in an agricultural catchment of Eastern China, Sci. Total Environ., 408, 4624–4632, https://doi.org/10.1016/J.SCITOTENV.2010.06.006, 2010.
- Abstract
- Introduction
- Emissions of N2O and NO from Managed Croplands
- Deriving Emission Ratios from CalNex Airborne N2O, NO, and NO2 Observations
- Deriving N2O from Satellite NO2 Observations
- Comparison with Independent Estimates of N2O
- Conclusion
- Data availability
- Author contributions
- Competing interests
- Disclaimer
- Acknowledgements
- Financial support
- Review statement
- References
- Supplement