the Creative Commons Attribution 4.0 License.
the Creative Commons Attribution 4.0 License.
 | 14 Apr 2026
Hygroscopic growth obscures actual variation in anthropogenic aerosol optical depth over central China during 2010–2024
Zhenping Yin
Detlef Müller
Fuchao Liu
Yunpeng Zhang
Kaiming Huang
Particle bulk optical property parameters play an essential role in evaluating air quality, which, however, can be substantially enhanced under humid atmospheric conditions via hygroscopic growth. Here we use 532 nm polarization lidar observations, ERA5 humidity data, and Hänel hygroscopic-growth parameters from our previous study (Jing et al., 2026) during 2010–2024 to retrieve vertical profiles of ambient and dry aerosol backscatter and extinction coefficients of anthropogenic pollution over central China. Particle hygroscopic growth led to enhanced particle backscatter coefficient by 11 %–46 % below 2 km on an annual basis for the considered time frame. Anthropogenic Aerosol Optical Depth (AOD) was ∼30 % higher under ambient atmospheric conditions. We found values of AODamb=0.404 and AODdry=0.315. In Jing et al. (2025), we reported a significant decline of −0.068 yr−1 for AODamb during China's rapid air-cleaning period of 2010–2017. Here, we find a 28 % lower decline rate for AODdry (−0.049 yr−1), which more accurately reflects the reduction in anthropogenic aerosol emission. Hygroscopic-growth-induced net AOD (ΔAODRH) dropped sharply in 2011–2014, most likely as a result of emission mitigation and drier atmospheric conditions, then rebounded in 2014–2019 as rising humidity conditions and the presence of hydrophilic aerosols. Since 2020, ΔAODRH has remained high attributed to rising humidity conditions but weakening hygroscopicity. AODamb suggests peak pollution in summer, while AODdry identifies winter as the true air-pollution maximum. These results highlight the significant impact of aerosol water uptake on its optical properties; therefore, it must be accounted for to ensure accurate air quality assessments.
- Article
(3086 KB) - Full-text XML
- BibTeX
- EndNote


Over the past few decades, rapid industrialization and urbanization in China have led to a significant increase in the emission of anthropogenic aerosols, resulting in a major environmental challenge, i.e., atmospheric/air pollution (Che et al., 2007; Wang et al., 2009; Zhang et al., 2012). Episodes of haze events have become more frequent and intense post-2011, posing a serious risk to human health (Li et al., 2023a). One of the most widespread, prolonged, and severe haze events occurred in January 2013, affecting vast regions across North, East, Central, and South China with satellite-observed aerosol optical depth (AOD) exceeding 2.0 (Tao et al., 2014; Wang et al., 2014; Zhang et al., 2021). Since then, the issue of atmospheric pollution has received widespread attention.
In response, the Chinese government has implemented a series of air quality control policies since 2013 (The State Council of the People's Republic of China, 2013, 2018, 2023). As a result, significant improvements in air quality have been observed over the past 15 years, as evidenced by large reductions in surface PM2.5 (Particulate Matter that has an aerodynamic diameter of 2.5 µm or less) concentrations and AOD, and increased visibility (Zheng et al., 2018; Ding et al., 2019; Zhang et al., 2019; de Leeuw et al., 2022). From 2013 to 2017, surface PM2.5 concentrations rapidly declined by 33 % (Zhang et al., 2019); however, the improvement in the frequency of low visibility scenarios has not been as rapid as expected, given the significant reduction in aerosol mass concentration (Liu et al., 2020; Xu et al., 2020). From 2018 onwards, the improvement of air quality has notably slowed down or even stagnated (Geng et al., 2024; Jing et al., 2025). This slowdown can be attributed to changes in aerosol composition (Yao et al., 2021), an increased fraction of fine-mode particles (Joo et al., 2025), unfavorable meteorological conditions (Wang et al., 2018), climate change (An et al., 2019), and so on. These factors can even be coupled together, resulting in a complicated issue. One of the most vital inductive factors is the change of aerosol chemical composition, with an increase in the proportion of nitrate and a decrease in sulfate (An et al., 2019; Liu et al., 2020; Yao et al., 2021). The higher nitrate content enhances the water-uptake capability of aerosols, which increases their extinction efficiency in a humid (ambient) atmosphere, and is denoted as “hygroscopic growth”. In recent years, the ongoing warming climate may increase the carrying capacity of moisture in the atmosphere (Stoy et al., 2022), which increases aerosol extinction as a result of particle hygroscopic growth (Chen et al., 2019).
In China, meteorological conditions and changes of atmospheric chemistry together contribute to the limited air quality improvement (i.e., the observation that aerosol extinction does not drop as much as one would expect, and vice versa the lower-than-expected increase of atmospheric visibility, atmospheric transmission, and consequently the decrease of aerosol mass concentration) via aerosol hygroscopic growth. For these reasons, it is necessary to quantify the contribution of aerosol hygroscopic growth to air quality (Kallihosur et al., 2024). Furthermore, aerosols emitted near the surface can be lifted into upper layers of the atmosphere from where they can be transported in the free troposphere by various mechanisms, and where humidity conditions can significantly differ from the conditions in the planetary boundary layer.
Therefore, it is crucial to include height-resolved aerosol extinction measurements in observations of the ambient atmosphere, which allows for an improved understanding of the contribution of aerosol hygroscopicity from the different parts of the atmospheric column (Veselovskii et al., 2009; Perez-Ramirez et al., 2021). Lidar measurements provide height-resolved aerosol optical properties such as extinction and backscatter coefficients, and therefore are particularly useful when combined with relative humidity profiles from radiosonde measurements or reanalysis data to evaluate the impact of aerosol hygroscopicity on the atmospheric environment (Granados-Muñoz et al., 2015; Sicard et al., 2022). In addition, aerosol extinction can be used to retrieve visibility (Wu et al., 2016) and aerosol mass concentration (Ganguly et al., 2009; Mamouri and Ansmann, 2016; Shin et al., 2025); these parameters are widely applied in air quality assessment. In this context, correcting the hygroscopic-growth-induced amplification of aerosol extinction in advance is essential to realize valid spatio-temporal comparisons or evaluations of air quality regionally and globally (Toth et al., 2016).
Zhang et al. (2019) observed significant reductions in PM2.5 concentrations across China from 2013 to 2017, with the highest levels of PM2.5 concentrations in northern and central China. However, central China has received relatively less attention compared to other key regions such as the Beijing-Tianjin-Hebei region (BTH), the Yangtze River Delta region (YRD), and the Pearl River Delta region (PRD) (He et al., 2020). Central China hosts massive local industries that contribute to numerous types of anthropogenic aerosol emissions (Zhang et al., 2015; Liao et al., 2020). In particular, central China is located in a subtropical monsoon region that is strongly impacted by abundant water vapor as a result of evaporation of water from numerous regional lakes and rivers, as well as from long-range transport of water vapor from the oceans surrounding China. With respect to the conditions over central China, Xiao et al. (2025) reported the largest water vapor flux of 353.9 in summer, resulting from the transport of water vapor from the Indian Ocean by the Asian summer monsoon system, and the lowest value of around 100 in winter, transported from the Arabian Peninsula and its surrounding seas via the southern branch of the westerlies along the southern side of the Tibetan Plateau. This moisture provides favorable conditions for aerosol hygroscopic growth, which contributes to the formation of low-visibility haze events (Ma et al., 2019).
Consequently and to better understand the aforementioned observations, we have been conducting continuous ground-based polarization lidar observations in the megacity of Wuhan in central China since 2010. To the best of our knowledge, our research work uses the longest lidar dataset for central China. We began monitoring the height-resolved local tropospheric aerosols in 2010, which is four years earlier than the start of China's official comprehensive surface pollution measurements in 2014 (Yin et al., 2021). These observations are used to derive aerosol backscatter and extinction profiles in the lower and middle troposphere, as well as AOD. Based on this long-term (2010–2024) lidar dataset collected over Wuhan, Jing et al. (2025) investigated the evolution of tropospheric aerosols and identified two distinct phases in total AOD during 2010–2024: a significant declining trend (−0.077 yr−1) during 2010–2017 (Stage I), followed by a fluctuating period during 2018–2024 (Stage II); they further reported a decline rate of −0.068 yr−1 for anthropogenic AOD during Stage I. Using the same dataset, Jing et al. (2026) examined the long-term hygroscopic growth characteristics of anthropogenic aerosols based on the Hänel parameterization. As a further step and follow-up study, the present work also employed the 2010–2024 lidar dataset but focused on deriving anthropogenic aerosol extinction and AOD under dry conditions. Specifically, we adopt the annual average Hänel hygroscopic-growth parameter γ from Jing et al. (2026) to remove the influence of hygroscopic growth from the ambient anthropogenic aerosol extinction and AOD reported in Jing et al. (2025). Thia approach enables a more accurate assessment of the effectiveness of China's air quality control policies over the past 15 years.
This article is organized as follows. In Sect. 2, we provide a brief description of the instruments and data processing methods. Section 3 presents the variations of optical parameters of anthropogenic aerosols with and without hygroscopic-growth enhancement over Wuhan. Section 4 provides a summary and conclusions.
2.1 Polarization lidar and data processing
Our lidar site is located on the campus of Wuhan University (30.5° N, 114.4° E) in Wuhan, China. A 532 nm ground-based polarization lidar has been used for continuously observing tropospheric aerosols since October 2010 (Kong and Yi, 2015; He et al., 2021; Yi et al., 2021a, b; Jing et al., 2024, 2025, 2026; Fu et al., 2026). The raw data are stored with a time resolution of 1 min and a vertical resolution of 30 m. A total of 24 910 cloud-free profiles with signal accumulation times of 30–80 min were obtained from 2139 d between October 2010 and September 2024 by a cloud screening algorithm (Yin et al., 2021). For each profile, the particle backscatter (or extinction) coefficient βp (αp) is retrieved using the Fernald method (Fernald, 1984), assuming a fixed lidar ratio (LR) of 50 sr. In addition, the lidar provides the linear volume (aerosol + molecule) and linear particle (only aerosol) depolarization ratios, i.e., δv and δp. These two parameters indicate the degree of the non-sphericity of the scattering objects (Freudenthaler et al., 2009). Based on βp and δp, we can derive the dust and non-dust component of the particle backscatter (extinction) coefficient βd and βnd (αd and αnd) using the polarization-lidar photometer networking (POLIPHON) method (Tesche et al., 2009; Mamouri and Ansmann, 2014). In Wuhan, the non-dust component is primarily associated with anthropogenic aerosols.
2.2 Radiosonde and ERA5 reanalysis data
Two radiosondes are launched daily around 08:00 and 20:00 local time (LT) at 30.6° N, 114.1° E, approximately 24 km away from our lidar site. The radiosondes provide us with vertical profiles of temperature, pressure, relative humidity (RH), water vapor mixing ratio (WVMR), wind speed (WS), and wind direction (WD) from the surface up to ∼30 km altitude. Potential temperature θ is calculated from these meteorological parameters with the method by Bolton (1980). To match the altitude bins of lidar profiles, radiosonde data with variable vertical resolution are interpolated using a cubic spline interpolation method. The matched radiosonde and lidar profiles are then used to identify aerosol hygroscopic growth cases and estimate the associated hygroscopic growth parameter γ (see Sect. 2.3).
The European Center for Medium-Range Weather Forecasts (ECMWF) fifth-generation reanalysis (ERA5) provides global hourly atmospheric data from January 1940 onward (Copernicus Climate Change Service, Climate Data Store, 2025). ERA5 RH profiles (Hersbach et al., 2023a) are interpolated to match the altitude bins of lidar profiles and used to assess the influence of hygroscopic growth on the particle backscatter coefficient. Figure 1 shows the differences in RH data obtained from radiosonde measurements and ERA5 data over Wuhan. The comparably small mean difference of −0.63 % suggests that it is reasonable to use ERA5 RH data for the long-term study. ERA5 boundary layer height (BLH) data are also applied to distinguish hygroscopic growth effects within the boundary layer (BL) and free troposphere (FT) (Hersbach et al., 2023b). The diurnal maximum BLH is adopted as the boundary between the BL and FT.
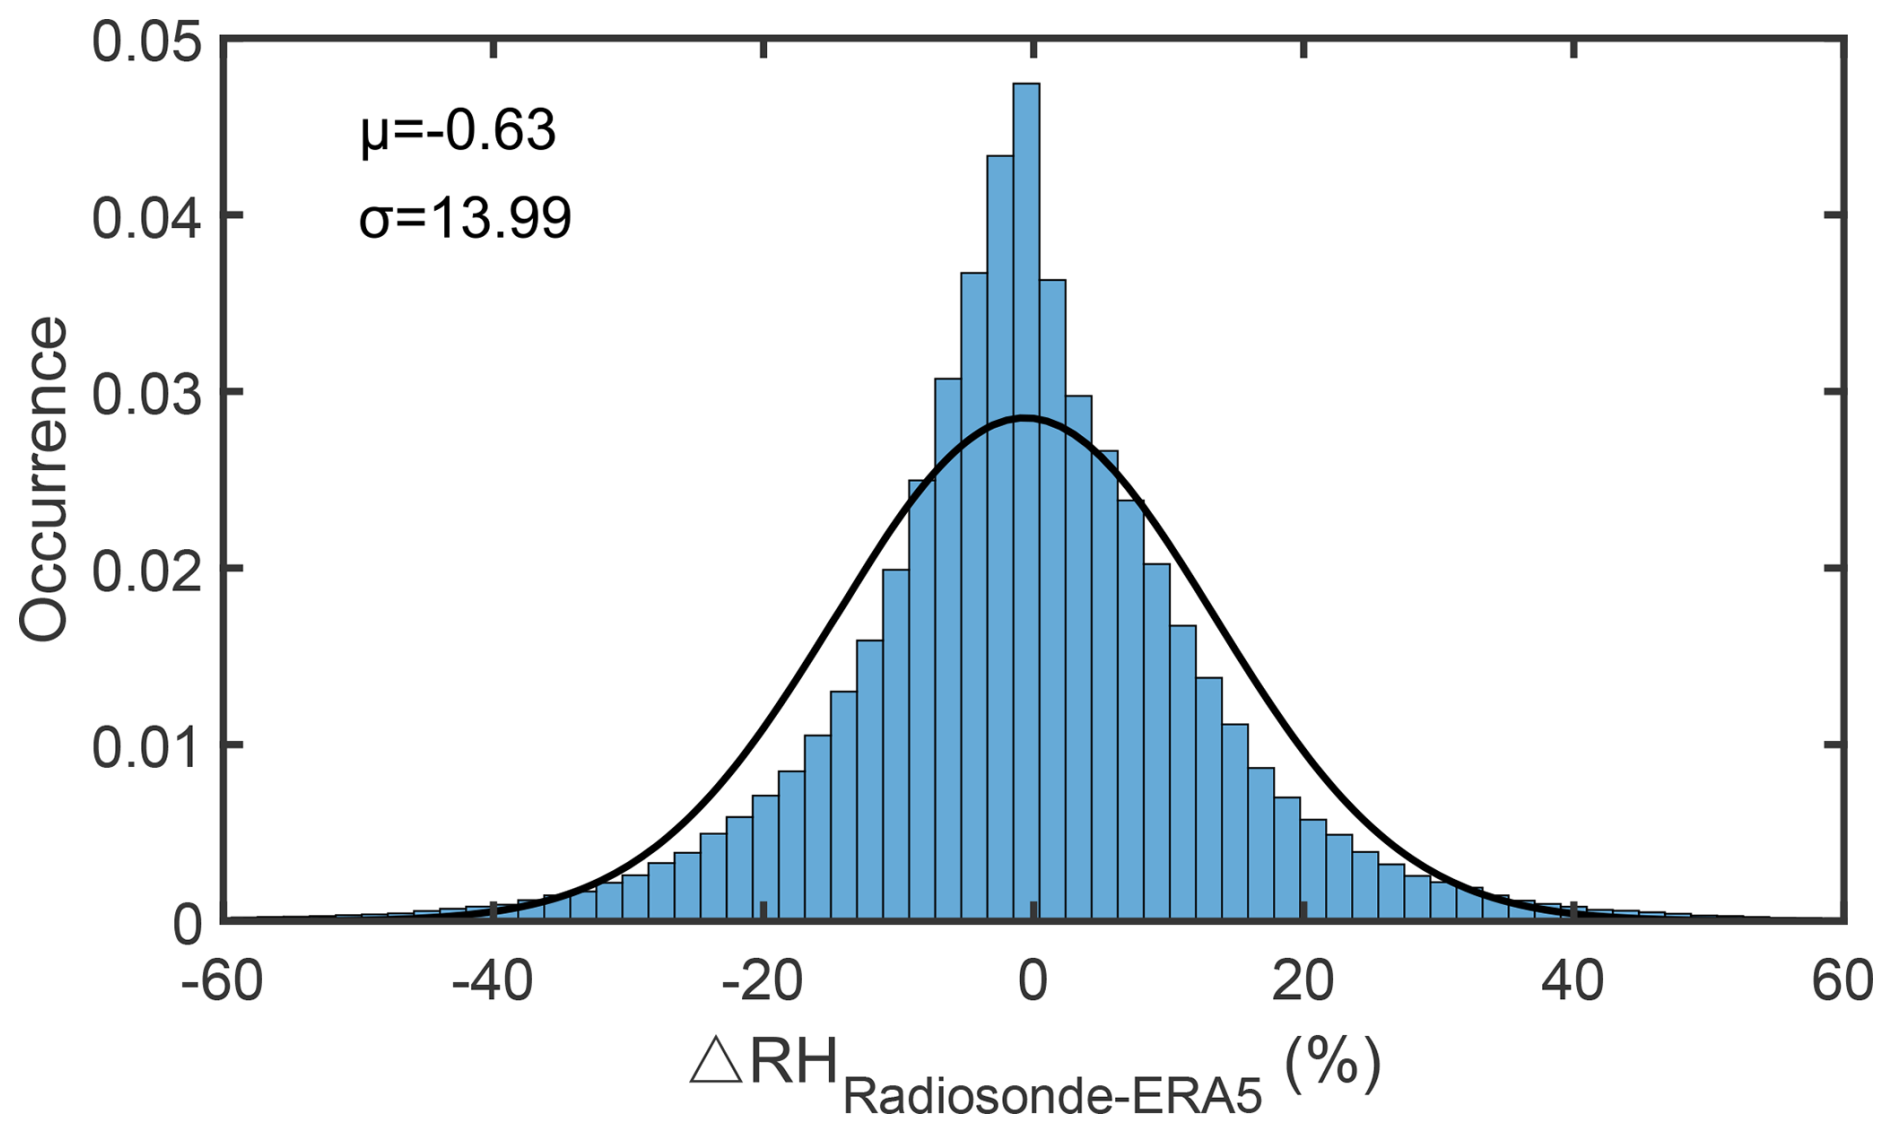
Figure 1The differences in RH over Wuhan between 2010 and 2024 obtained from simultaneous radiosonde measurements and ERA5 data. μ is the mean value and σ is the standard deviation.
2.3 Dry aerosol optical depth estimation
The capability of lidar to measure aerosol hygroscopicity was first demonstrated by Ferrare et al. (1998). Subsequently, a thorough method of quantitatively estimating the aerosol hygroscopic properties based on lidar observations was established by Veselovskii et al. (2009). In this study, the variation of the lidar-derived anthropogenic particle backscatter coefficient βnd with RH is considered under the assumption of an external mixture between dust and non-dust (anthropogenic) aerosols (Jing et al., 2026). The particle backscatter coefficient enhancement factor, fβ(RH), is defined as the ratio of βnd at a given RH to that for dry conditions (Hänel, 1976):
Lidar-derived cloud-free profiles within 2 h before or after radiosonde launches (around 08:00 or 20:00 LT) are selected. An aerosol layer is identified, when βnd increases monotonically and simultaneously with radiosonde-measured RH. Within such aerosol layers, variations of key radiosonde meteorological parameters are constrained as follows: (1) ; (2) Δθ<2 K; (3) ; (4) ΔWD<15° (Sicard et al., 2022). These criteria indicate well-mixed atmospheric conditions and ensure that the observed increase in βnd is driven solely by water uptake rather than additional aerosol emissions or compositional changes (Granados-Muñoz et al., 2015). Since the RH range varies among different cases, a common reference RHref is required for comparability. Accordingly, the widely used Hänel parameterization is applied to obtain the reference backscatter enhancement factor, fref–Hänel(RH) (Veselovskii et al., 2009; Perez-Ramirez et al., 2021):
where γ is the hygroscopic growth parameter, with small values representing weakly hygroscopic particles (e.g., dust) and large values representing highly hygroscopic particles (e.g., sea salt) (Titos et al., 2016). Note that the Hänel parametrization is applicable only above the deliquescence relative humidity (DRH), which is defined as the phase transition point at which a hygroscopic solid transform from the solid phase to the liquid phase at a specific RH (Mauer and Taylor, 2010). Generally, water-soluble inorganic salts exhibit distinct DRH values, e.g., 80 % for ammonium sulfate, 75 % for sodium chloride, and 61 % for ammonium nitrate (Lee et al., 2001; Wise et al., 2007; Zawadowicz et al., 2015). Under ambient conditions, however, the DRH of inorganic salts trends to decrease when they are internally mixed with organic compounds (Brooks et al., 2002; Luo et al., 2020). In this study, we adopt RHref=40 %, a threshold commonly used to define the upper limit of the initial dry conditions (Granados-Muñoz et al., 2015; Navas-Guzmán et al., 2019; Sicard et al., 2022). Combining Eqs. (1) and (2), the dry backscatter coefficient of anthropogenic aerosols can be expressed as:
Due to the lack of a Raman channel in our lidar system, the hygroscopic effect on lidar ratio is not considered in this study (Zhao et al., 2017). The dry particle extinction coefficient αnd,dry can be obtained by multiplying βnd,dry with a fixed lidar ratio of 50 sr. Thus, the ambient aerosol optical depth (AODamb) and dry aerosol optical depth (AODdry) for anthropogenic aerosols can be given by:
where Zb=0 km and Zt=7 km are the lower and upper integration limits, respectively. For our lidar system, the lowermost height with complete field-of-view (FOV) observation is 0.3 km. Therefore, particle extinction coefficients below 0.35 km were assumed to be equal to those at 0.35 km (Jing et al., 2025). The effect of hygroscopic growth on AOD is then defined as (Kallihosur et al., 2024):
Furthermore, ΔAODRH can be divided into contributions from the BL and FT, denoted as ΔAODRH,BL and ΔAODRH,FT, respectively. Figure 2 provides the flowchart of the data processing procedure used in this study.
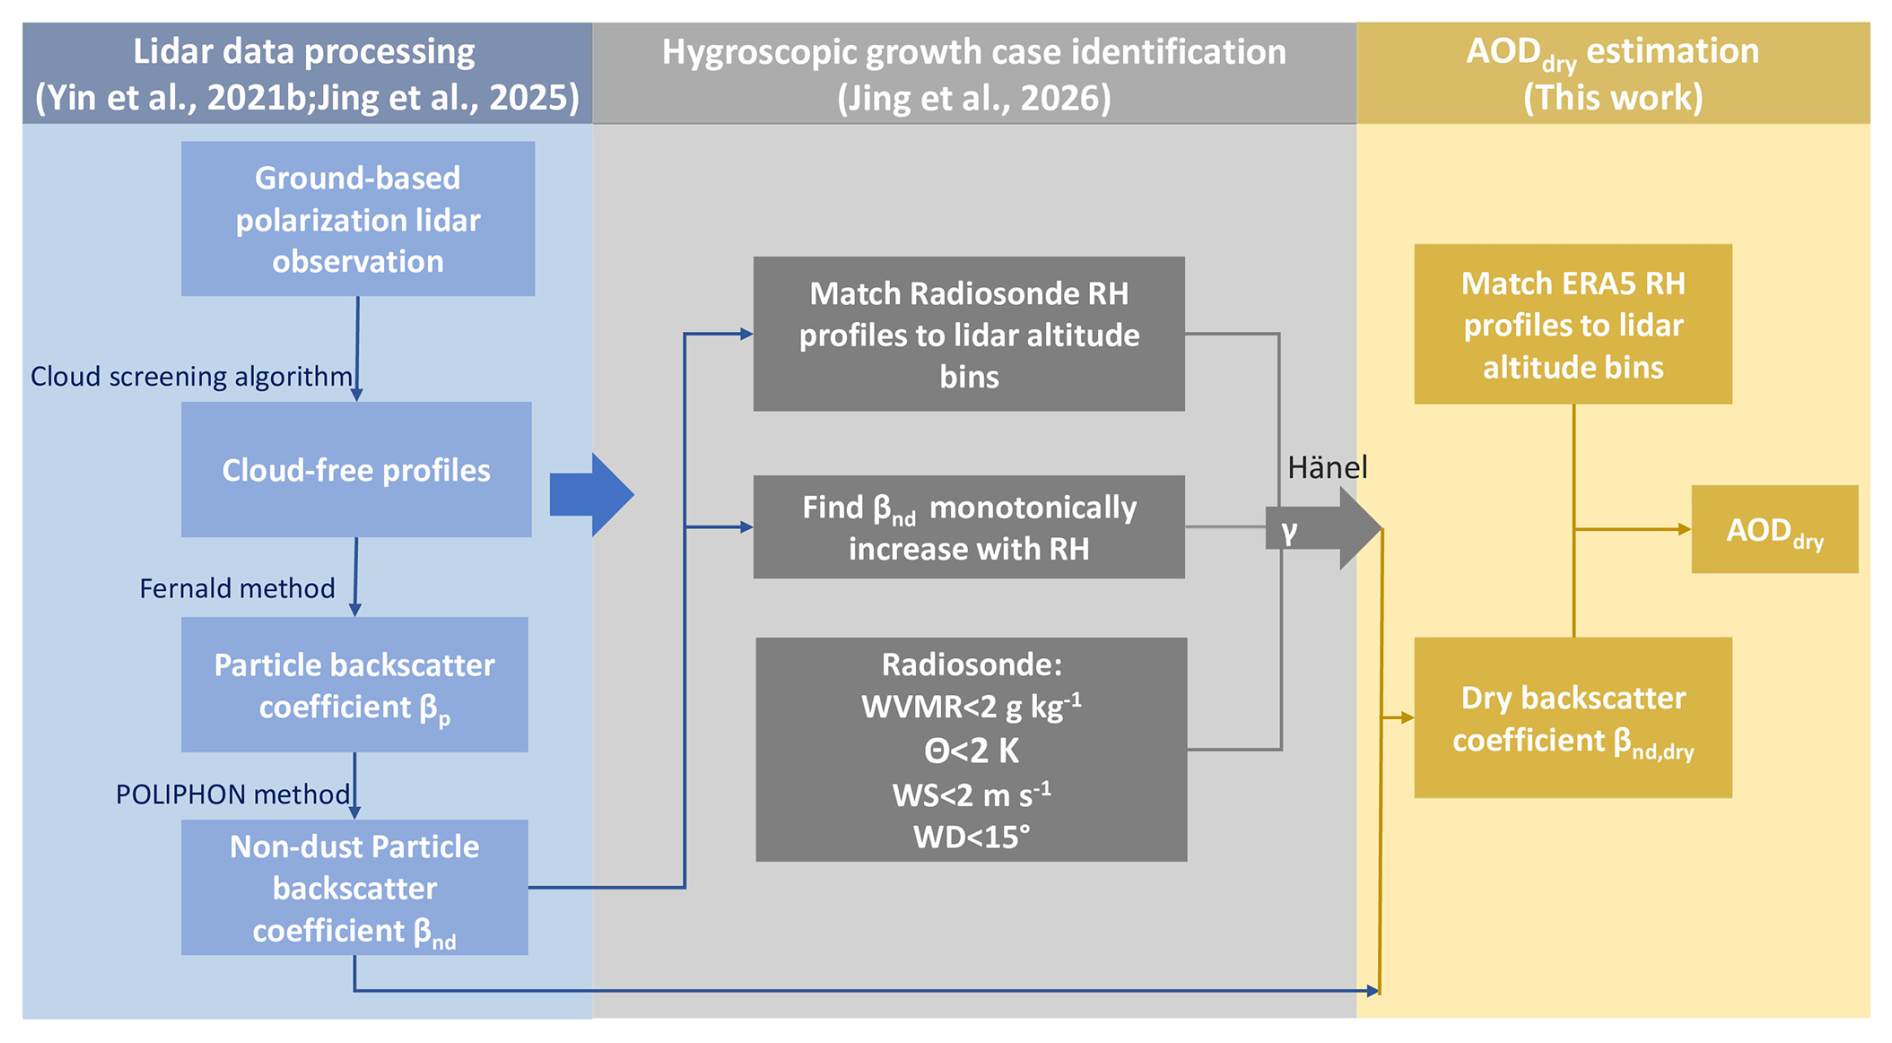
Figure 2Flowchart of lidar data processing, hygroscopic growth case identification, and the scheme of estimating AODdry from lidar-derived AODamb.
As mentioned in Sect. 2.1, the particle backscatter (or extinction) coefficient is retrieved using the Fernald method with an assumed fixed lidar ratio of 50 sr for anthropogenic aerosols. However, it should be noted that the lidar ratio varies with ambient RH and can increase notably under high RH conditions. For example, Haarig et al. (2025) reported that the lidar ratio of continental aerosols measured by Raman lidar at 532 nm was 48.1 ± 7.4 sr at 70 %–80 % RH, and increased to 65.3 ± 9.9 sr at 85 %–92 % RH. To assess the uncertainty in AOD introduced by the influence of hygroscopic growth on lidar ratio, a sensitivity analysis is presented in Appendix A. After removing the influence of hygroscopic growth, AODdry is 10 %–25 % lower than the value obtained using the original assumption of LR=50 sr.
3.1 Hygroscopic-growth-enhanced optical parameters of anthropogenic aerosols
We examined all the observational data collected with a 532 nm polarization lidar from October 2010 to September 2024. We identified 24 910 cloud-free profiles for further analysis. For each cloud-free profile, the particle backscatter coefficient (βp) profile was derived with an automatic algorithm originally developed by Yin et al. (2021) and later extended by He et al. (2024) and Jing et al. (2025). Together with particle depolarization ratio (δp), the βp profiles can be divided into dust (βd) and non-dust (βnd) backscatter coefficient profiles (Mamouri and Ansmann, 2014). The hygroscopic growth of mineral dust was neglected due to its hydrophobic nature. The influence of sea salt was negligible since Wuhan is an inland city (He et al., 2025). All the non-dust components were considered anthropogenic aerosols. As reported in Jing et al. (2026), we identified 192 cases (cloud-free aerosol profiles) with specific features regarding anthropogenic aerosol hygroscopic growth (see method section for details). The particle backscatter coefficient-related enhancement factor, fβ(RH), has been provided in Jing et al. (2026) and is also shown here in Fig. 3a (grey curve) for the convenience of readers. Using the Hänel parameterization (Hänel, 1976), we derived a corresponding hygroscopic growth parameter γ=0.62 ± 0.24. For urban pollutions, γ values typically situate between 0.4 and 0.6, depending on the proportions of inorganic salt components, such as sulfate and nitrate, which are generally considered more hydrophilic (Bedoya-Velásquez et al., 2018; Sicard et al., 2022; Miri et al., 2024).
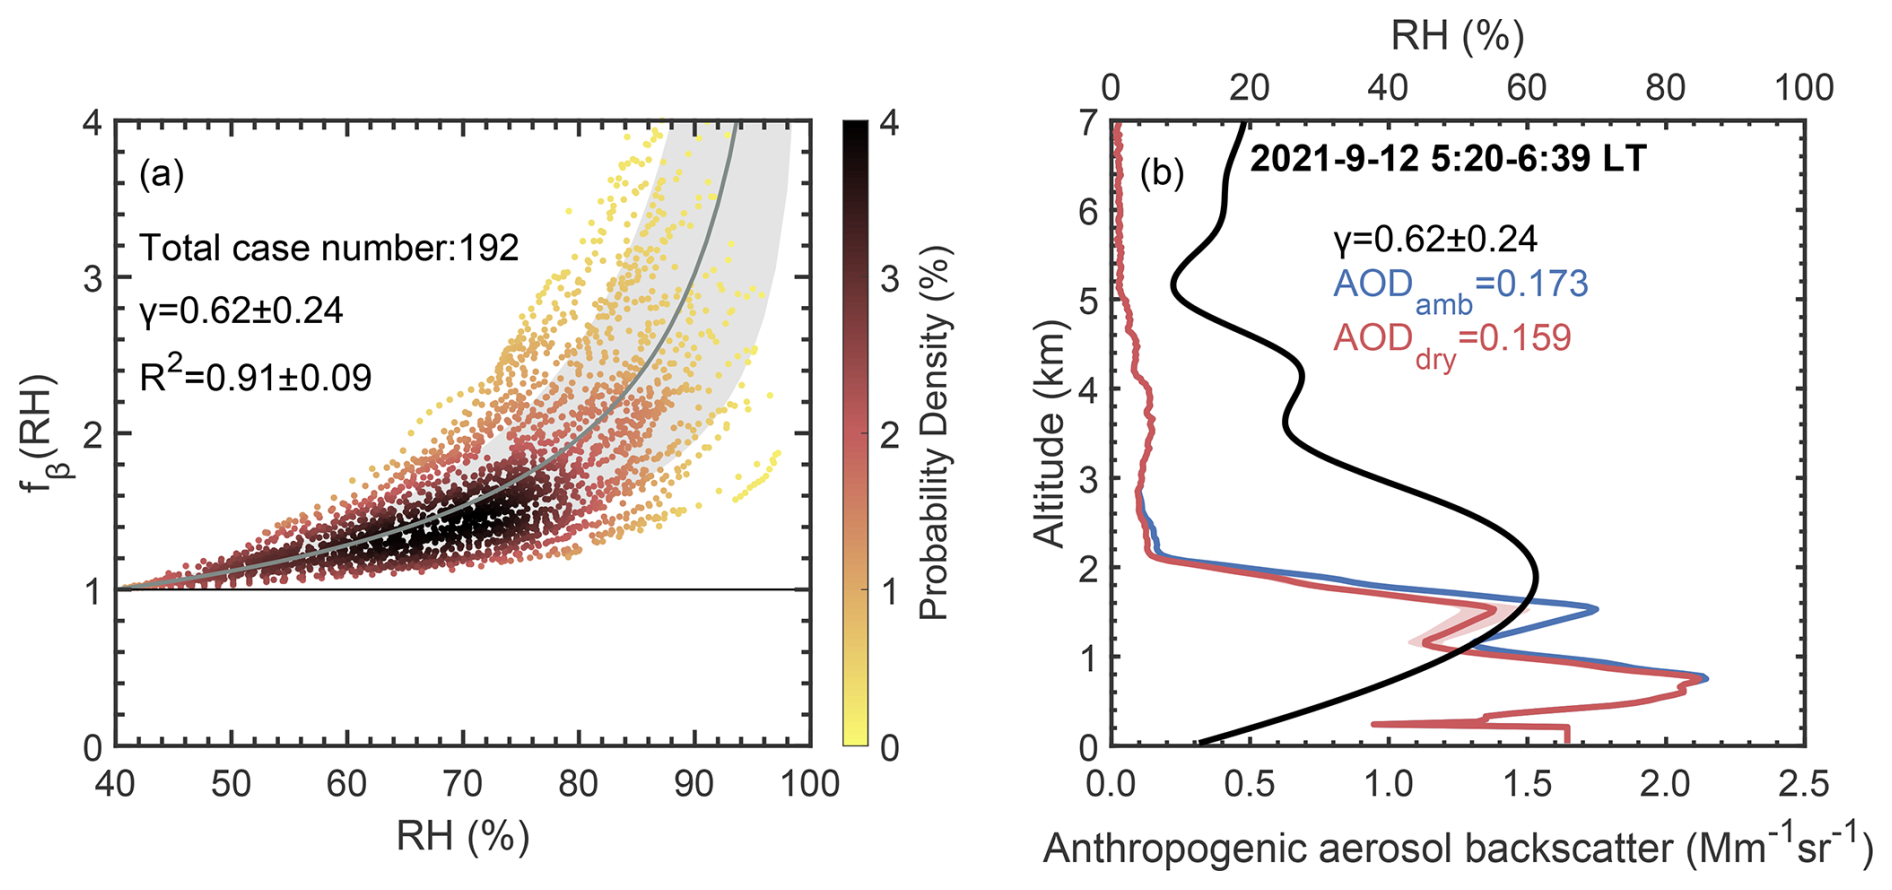
Figure 3(a) Probability density distribution of particle backscatter coefficient enhancement factors (RHref=40 %) from 192 identified anthropogenic aerosol hygroscopic growth cases in the lower and middle troposphere (0–7 km) (Jing et al., 2026); (b) Example of modifying a lidar-derived ambient particle backscatter coefficient profile (blue curve) to a dry profile (red curve) by removing the hygroscopic growth contribution on 12 September 2021. The red shaded area represents the uncertainty based on the standard deviation of γ (0.24). The RH profile (black curve) is provided by ERA5 reanalysis data.
Figure 3b shows a representative example on 12 September 2021, along with the relative humidity (RH) profile from ERA5 reanalysis data. The criteria for identifying such an aerosol hygroscopic growth case are introduced in detail in the method section hereafter. Concurrent observations of the volume (particle + molecule) depolarization ratio also indicate the anthropogenic (non-dust) aerosols during the period (not shown here). During 05:20–06:39 LT, the lidar-derived particle backscatter coefficient in the ambient atmosphere was clearly enhanced by aerosol hygroscopic growth at altitudes of 1–2 km, where RH exceeded 40 % (Sicard et al., 2022). By integrating the particle backscatter coefficient from surface to 7 km altitude and assuming a fixed lidar ratio of 50 sr (Fernald, 1984), the 532 nm AOD changed from 0.173 (AODamb) to 0.159 ± 0.005 (AODdry), indicating an AOD increase of approximately 9 % due to hygroscopic growth. In addition, Jing et al. (2026) observed a year-by-year variation of γ values over Wuhan. The evolution of annual mean γ was highly consistent with the variation of the annual mean NO2-to-SO2 concentration ratio, indicating that these variations were caused by changes of the chemical compositions of anthropogenic aerosols. In our study, we used the annual mean of γ for each year (Jing et al., 2026), respectively, for calculating the lidar-derived particle backscatter coefficient under dry and humid ambient atmospheric conditions.
Figure 4 presents the annual mean profiles of the anthropogenic aerosol backscatter coefficient derived under ambient and dry atmospheric conditions, i.e., βnd,amb and βnd,dry. It can be seen that aerosol hygroscopic growth mainly takes place in the lower troposphere (from the surface to ∼3 km). In particular, below 2 km, the particle backscatter coefficient is enhanced by 11 %–46 % due to hygroscopic growth. With the substantial improvement of air quality in China, βnd,amb values within the lower troposphere have generally decreased.
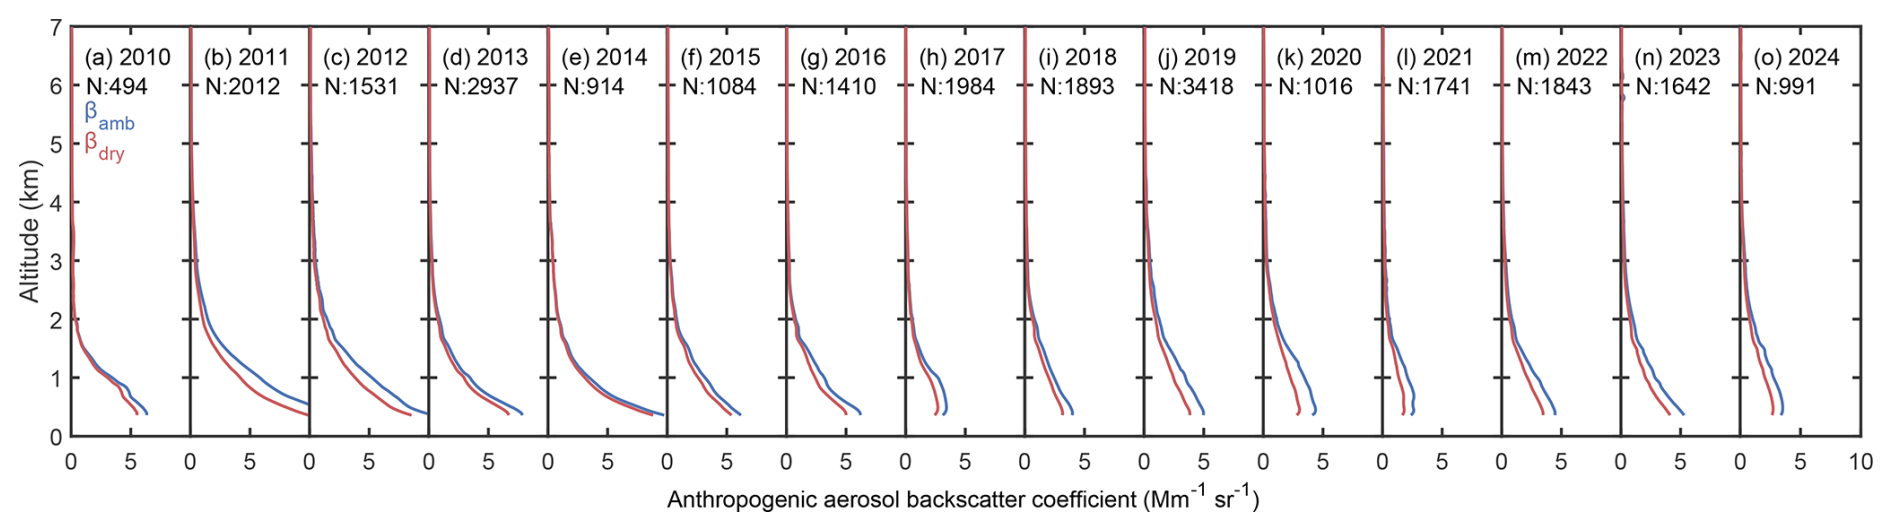
Figure 4Annual mean profiles of lidar-derived 532 nm anthropogenic aerosol backscatter coefficient under ambient and dry conditions over Wuhan, i.e., βnd,amb and βnd,dry. “N” denotes the number of profiles used for calculating the average profile for each year.
All the lidar-derived particle backscatter coefficient profiles were modified from ambient to dry atmospheric conditions by the use of the pre-derived annual mean hygroscopic growth parameter from Jing et al. (2026). On the basis of this information, we obtained AODamb and AODdry for the anthropogenic aerosols (see method section for details). Figure 5 presents the frequency distribution of AODamb and AODdry in Wuhan. The average AODdry and AODamb were measured to be 0.315 ± 0.164 and 0.404 ± 0.219, respectively, across the period considered in our study. These results indicate that hygroscopic growth on average enhanced AOD by approximately 30 % under humid atmospheric conditions. This change in AOD corresponds to an extinction enhancement factor () of 1.28, which is much lower than the value of approximately 1.8 reported for India (Nair et al., 2020; Kallihosur et al., 2024). This result suggests a higher atmospheric water vapor content in India, leading to more intense particle water uptake. Notably, the frequency distribution patterns of AODdry and AODamb are rather different. AODamb shows a slightly skewed, relatively broad Gamma distribution with a peak around 0.30–0.50, whereas AODdry exhibits a much narrower Gaussian distribution with a sharp maximum at 0.30–0.35. After accounting for hygroscopic growth, most AOD values exceeding 0.70 disappear, suggesting that hygroscopic growth largely increased the occurrence of severe air pollution events in Wuhan (Zhang et al., 2021). A similar changing pattern was reported by Kallihosur et al. (2024) for the hygroscopic modification of AOD over the eastern Indo-Gangetic Plain using satellite observations. The only major difference is that the average AODdry and AODamb in India are much higher average, reaching 0.41 and 0.74, respectively, due to more severe pollution.
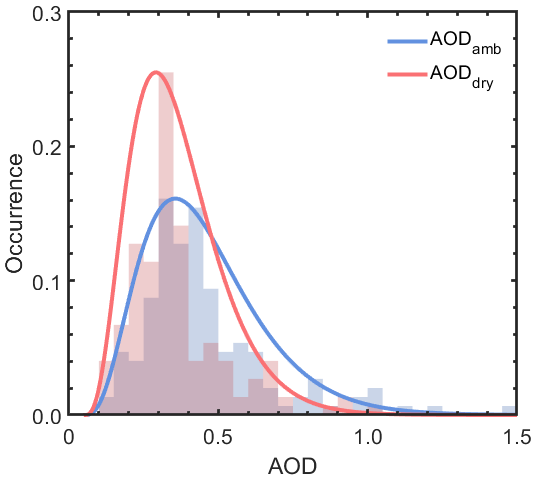
Figure 5Frequency probability of the lidar-derived 532 nm anthropogenic (non-dust) AODamb and AODdry in Wuhan during 2010–2024.
3.2 Long-term variation of anthropogenic AOD in the ambient and dry atmosphere
Figure 6a illustrates the evolution of lidar-derived anthropogenic AODamb and AODdry in Wuhan from 2011 to 2024. For representativeness, we removed the value of 2010 from our analysis since the routine observations started only from October of that year. Hygroscopic growth corrections were applied to all cloud-free lidar profiles with the use of ERA5 RH profiles. The standard deviation of the annual mean γ would affect AODdry, as indicated by the error bars in Fig. 6a, resulting in an uncertainty of approximately 10 %. Jing et al. (2025) previously reported that the 532 nm AODamb in Wuhan decreased rapidly with a rate of −0.068 yr−1 during 2010–2017 (defined as “stage I”), followed by a fluctuating period from 2018 to 2024 (defined as “stage II”). When accounting for hygroscopic growth in “stage I”, the rate of decline of AODdry was −0.049 yr−1, i.e., approximately 28 % lower than the rate of decline of AODamb. This result indicates that the actual reduction in aerosol emissions was slower than that suggested by the direct lidar measurements in the ambient atmosphere. In contrast, in “stage II”, both AODdry and AODamb ceased to decline and instead exhibited slight fluctuations; such a fluctuation pattern of AOD variation after 2017 onwards was also confirmed by MODIS Multi-Angle Implementation of Atmospheric Correction (MAIAC) data across China (de Leeuw et al., 2022). One explanation may be the imbalance in NO2 and SO2 emissions, which increases the ability of aerosol water uptake, i.e., aerosol hygroscopicity. This effect is likely to be the reason for offsetting the partial benefits of air pollution mitigation actions (Liu et al., 2018; Geng et al., 2024; Jing et al., 2025). A marked decrease in both AODamb and AODdry occurred in 2020, corresponding to the COVID-19 lockdown (Yao et al., 2021). The subsequent gradual increase reflects the resumption of labor and production processes. Overall, AODdry provides a more accurate representation of actual aerosol emissions than AODamb.
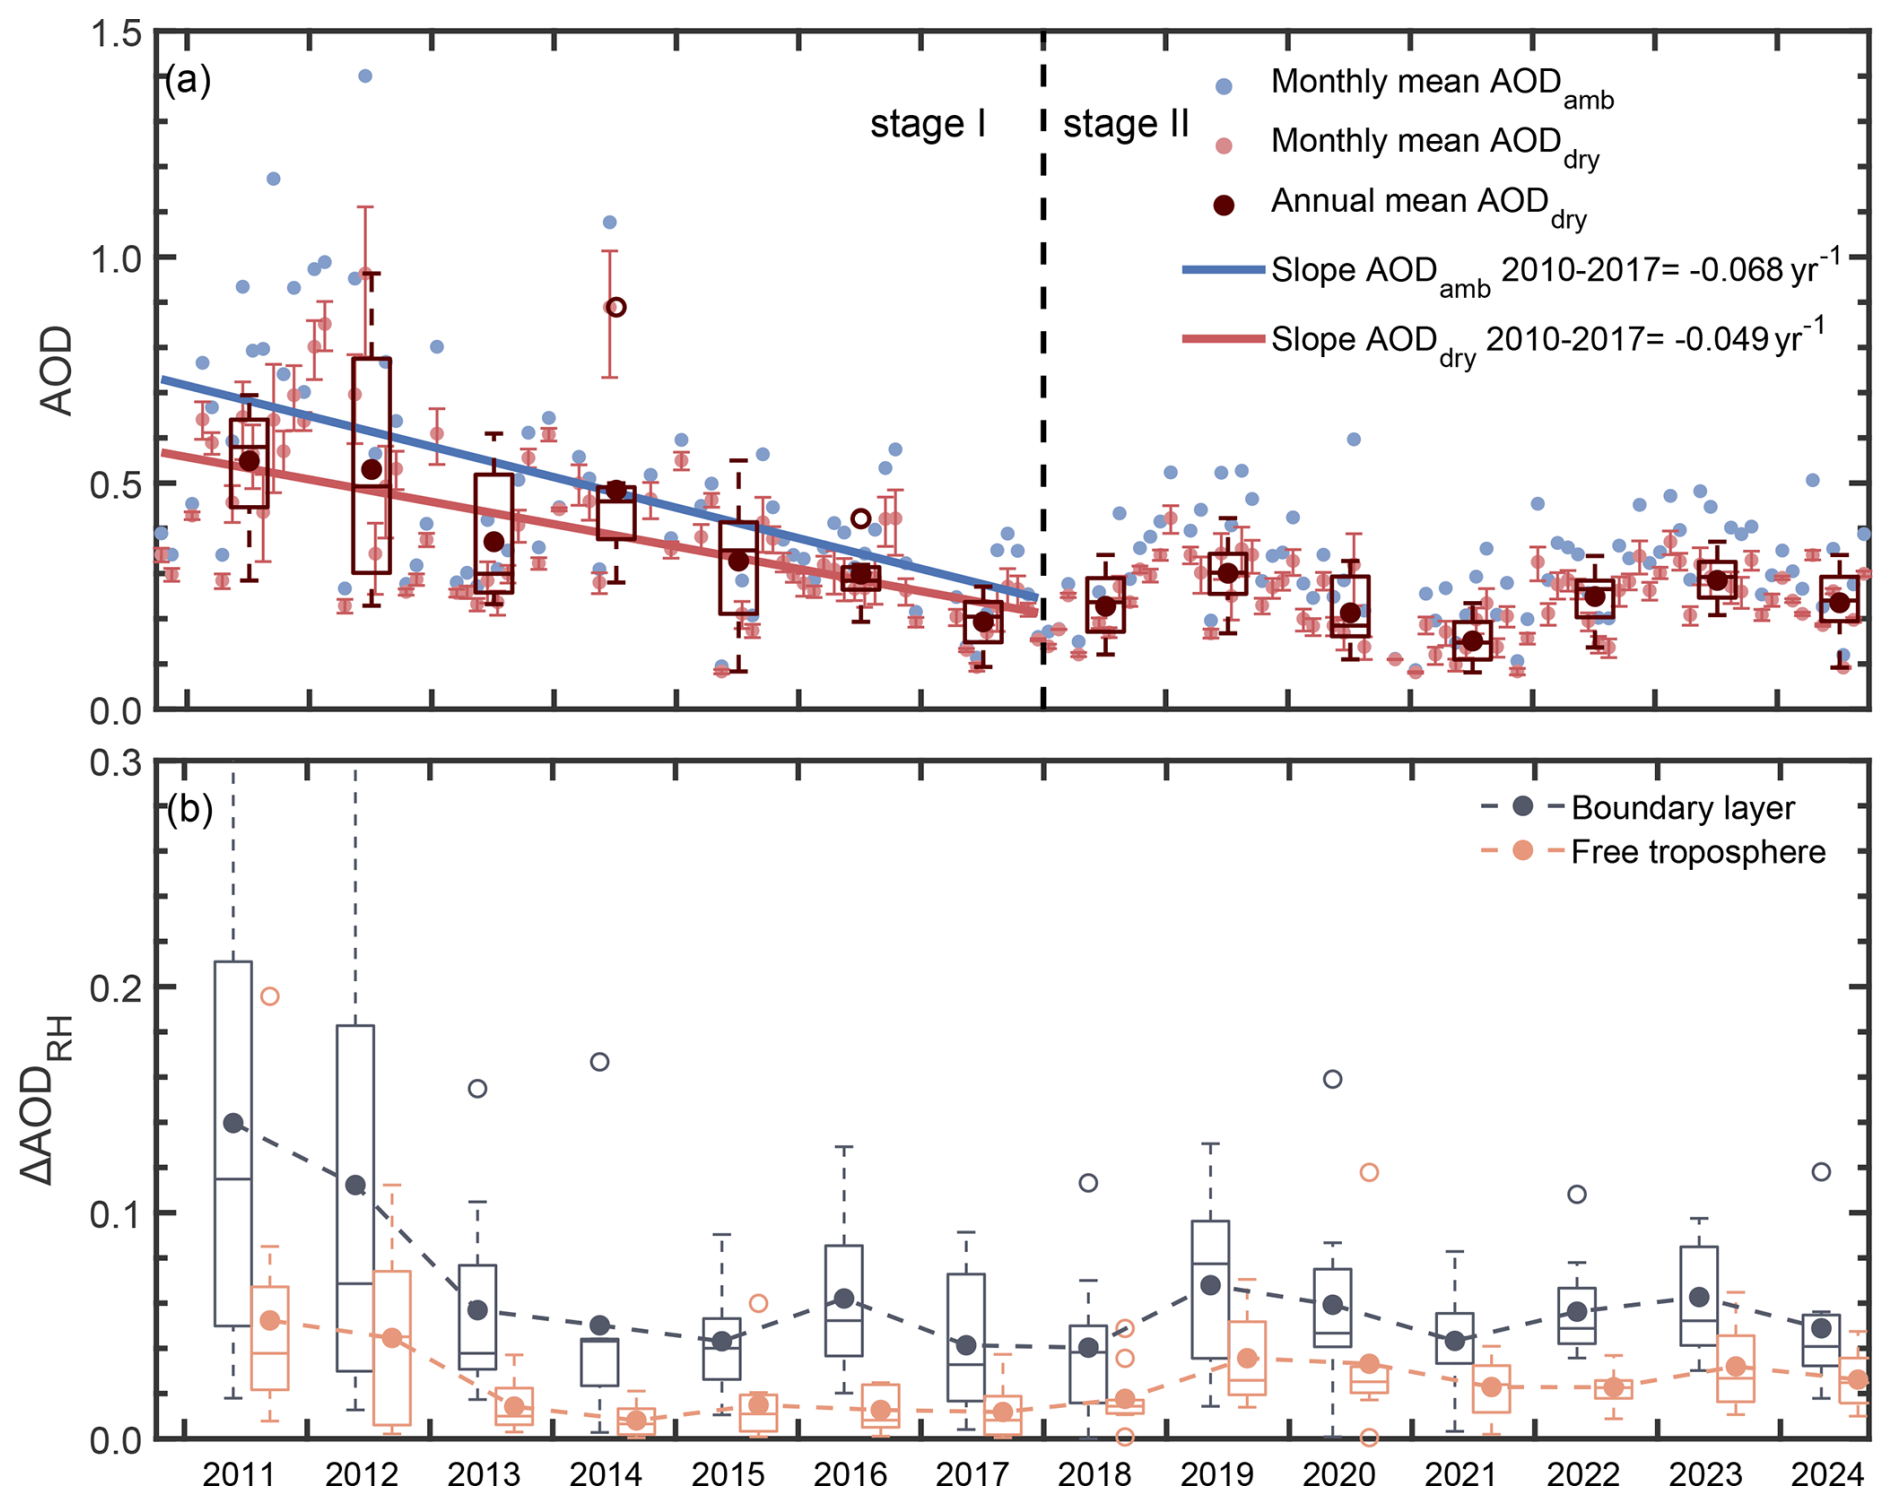
Figure 6(a) Evolution of lidar-derived anthropogenic AODamb and AODdry in Wuhan from 2011 to 2024. Each point denotes a monthly mean value. The error bars on the red points reflect the uncertainties caused by the standard deviation in γ. Linear regressions for 2010–2017 are shown as solid lines. The vertical dashed line divides the data record into stage I (2010–2017) and stage II (2018–2024), as discussed by Jing et al. (2025). (b) Evolution of enhanced AOD due to hygroscopic growth in the boundary layer and free troposphere, denoted as ΔAODRH,BL and ΔAODRH,FT, over the same period.
Lidar provides height-resolved measurements of particle extinction, which allows for further analysis of the contributions of hygroscopic growth to AOD in the boundary layer (BL) and free troposphere (FT), denoted as ΔAODRH,BL and ΔAODRH,FT, respectively, with their temporal evolutions shown in Fig. 6b. On an annual basis, ΔAODRH,BL is generally 2–5 times larger than the corresponding ΔAODRH,FT, indicating a much stronger contribution of aerosol hygroscopic growth within the BL, where most water vapor resides. Both ΔAODRH,BL and ΔAODRH,FT exhibit an evident drop between 2011 and 2013, which likely shows the effect of the reducedrate of decline of AOD during “stage I” (from −0.068 yr−1 for AODamb to −0.049 yr−1 for AODdry). During the winter seasons of 2011–2013, comparably high monthly-mean AODamb values were observed, corresponding to the most severe wintertime haze events recorded in Wuhan (Zhang et al., 2021). These events typically occurred under conditions of intense aerosol emissions combined with a stagnant and highly humid atmosphere. Such rather severe air pollution episodes were effectively mitigated within the first two years after data collection had begun (2011 and 2012), probably because of the implementation of measures outlined in the “Technical guidelines for air pollution control projects” by the Chinese government (Ministry of Ecology and Environment of the People's Republic of China, 2010). From 2014 to 2024, ΔAODRH,BL is generally stable and only slightly fluctuates between 0.04 and 0.07 with a variation rate lower than 0.002 yr−1. In contrast, ΔAODRH,FT has a comparably lower rate of variation between 0 and 0.02 in 2014–2018, after which the variation rate increases to 0.02–0.04 in 2019–2024. This result suggests a more pronounced impact of hygroscopic growth on AODamb in the FT in recent years.
To assess the relative contributions of hygroscopic growth in the BL and FT, Fig. 7a presents the annual mean fractions, i.e., and , respectively. Figure 7b provides the corresponding RH values in the BL and FT, revealing that the BL (55.8 % ± 11.1 %) is substantially more humid than the FT (32.7 % ± 11.2 %). In general, the relative contribution of hygroscopic growth does not vary linearly or monotonously with RH, as it is jointly controlled by aerosol hygroscopicity capability (depends on chemical composition) and ambient moisture conditions. During the initial four-year period (2011–2014), both and show a marked decline, which was driven primarily by effective mitigation of severe air pollution episodes (Jing et al., 2025) and a concurrent shift toward a drier atmosphere (Fig. 7b: RHBL from 55.6 % to 47.0 %; RHFT from 31.4 % to 25.9 %).
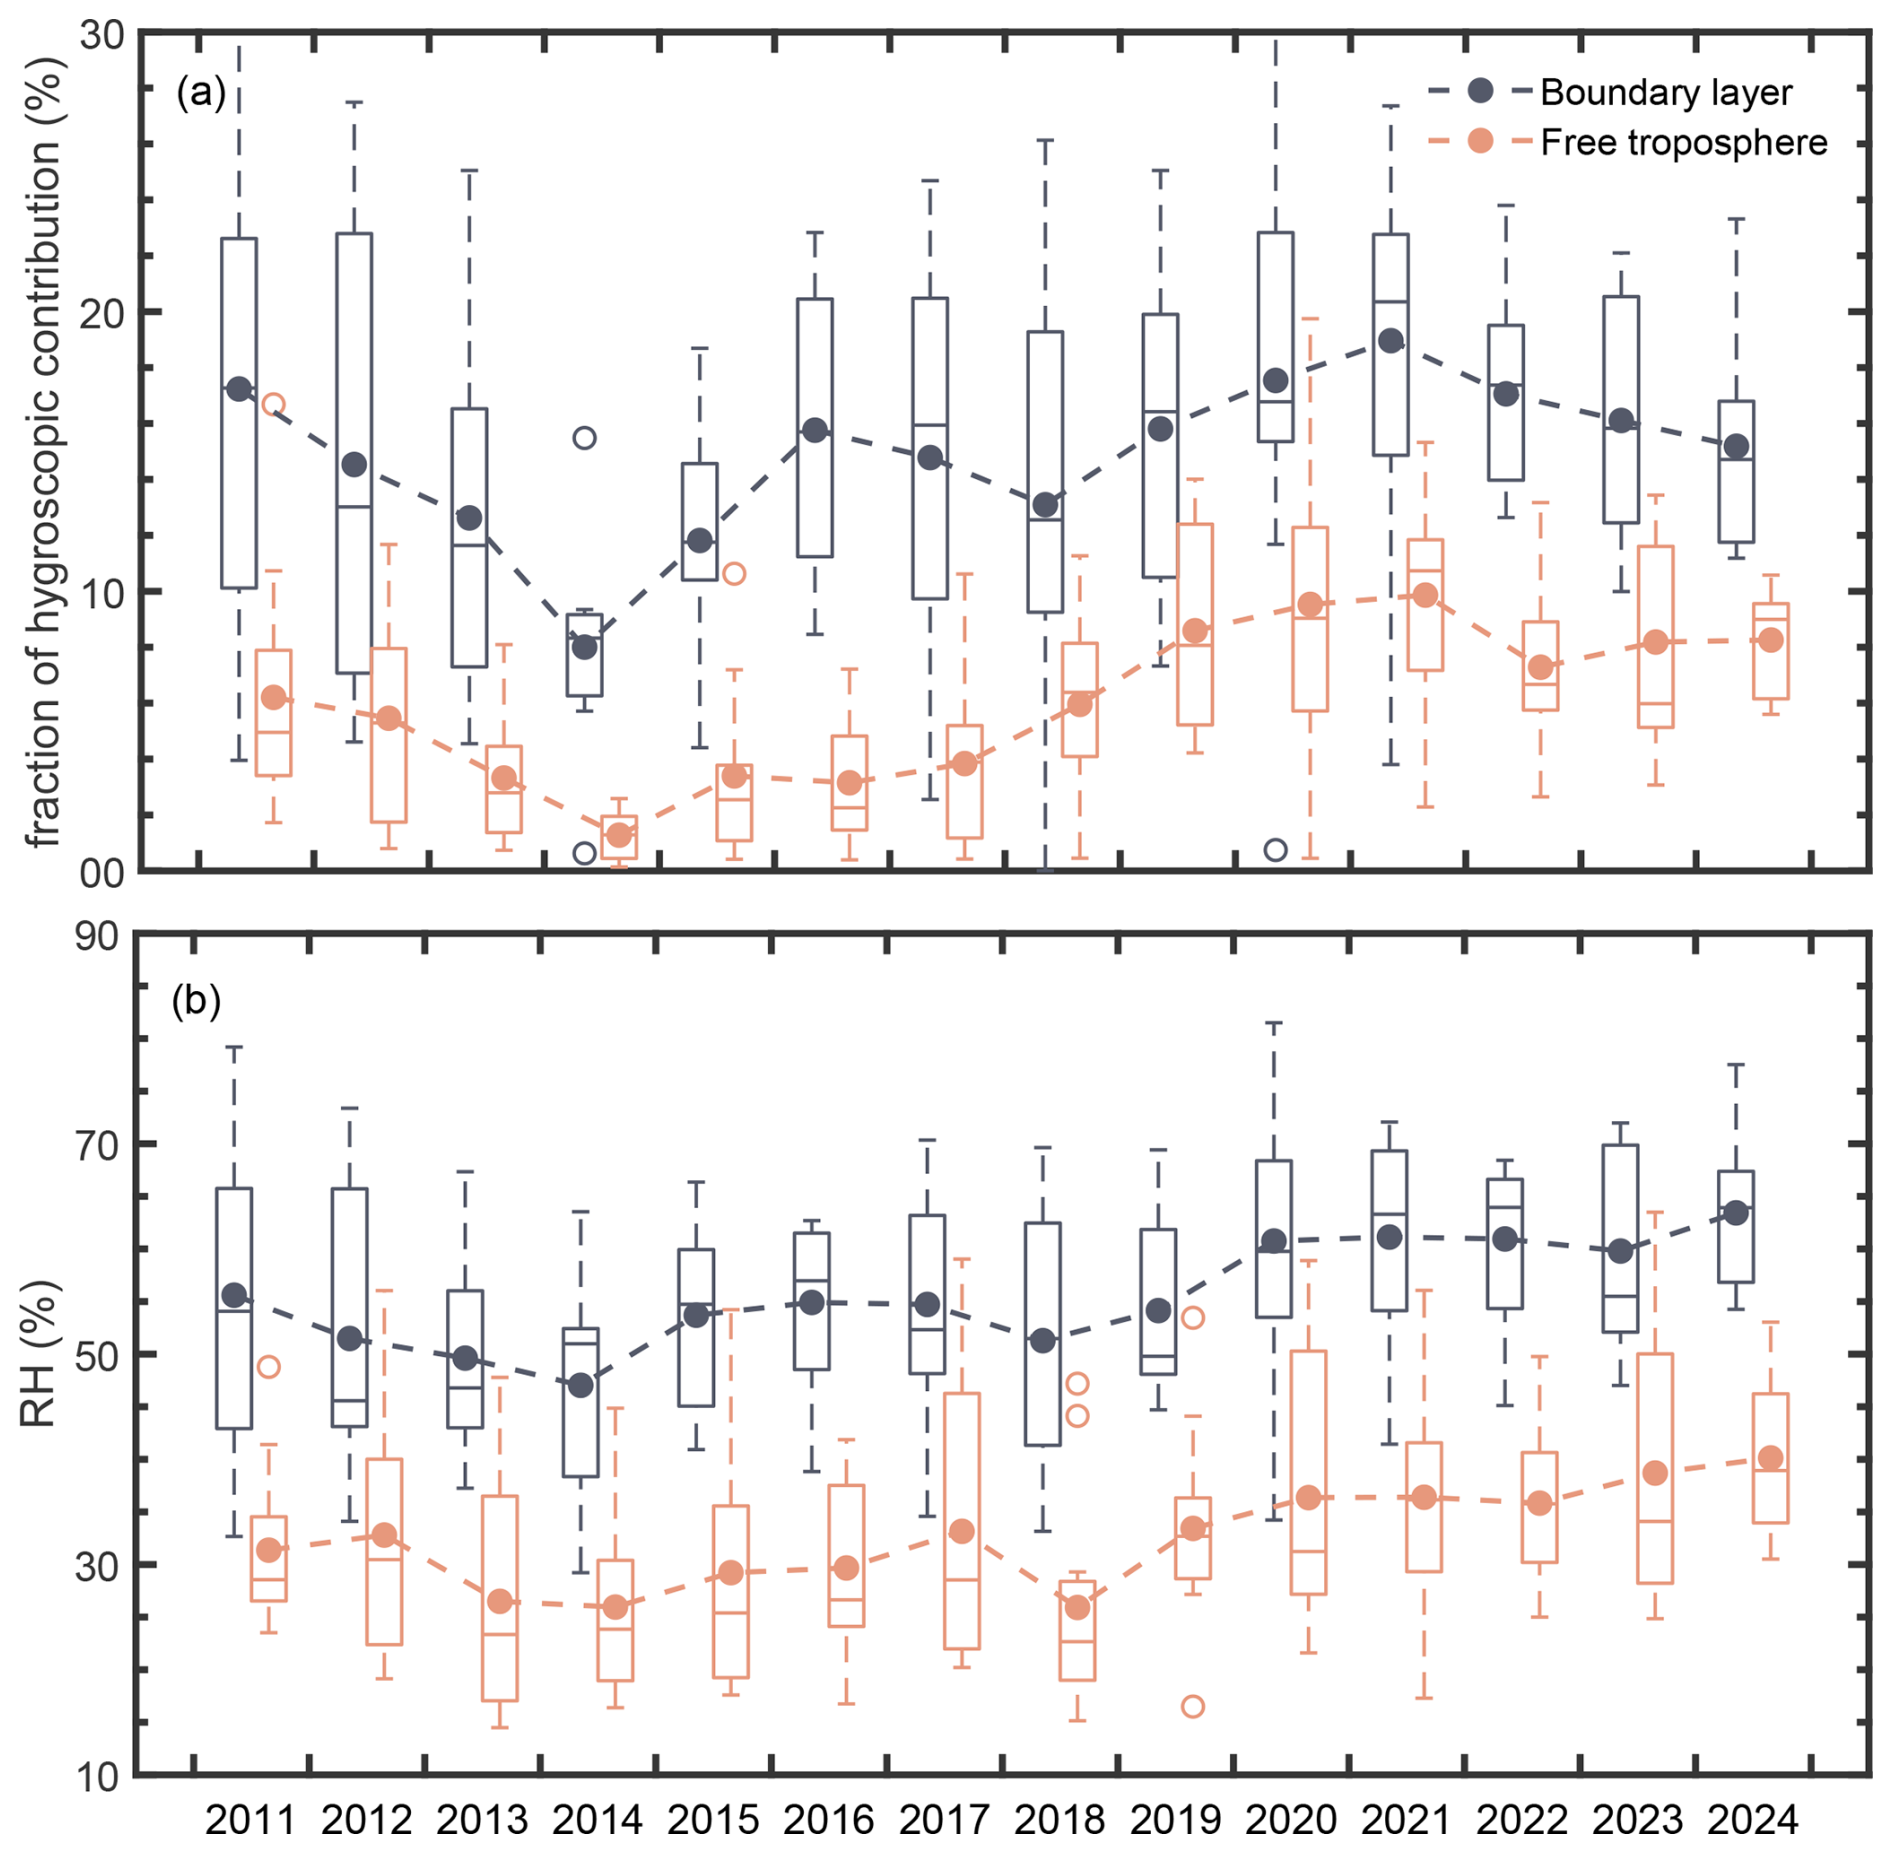
Figure 7(a) Variation of the fractions of enhanced 532 nm anthropogenic AOD due to hygroscopic growth in the BL and FT, i.e., and , from 2011 to 2024. (b) Evolution of the ERA5 RH in the BL and FT over the same period.
In general, the atmosphere has become more humid post-2014, with a rate of increase of around 1.3 % yr−1, which likely is linked to frequent El Niño events over the past decade, i.e., 2015/16, 2018/19, and 2023/24 (Zhai et al., 2016; Guan et al., 2023; Li et al., 2023). Zhong et al. (2023) reported that El Niño-induced North Pacific anticyclones tend to transport warmer and wetter air to southern China, resulting in increased rainfall and water vapor content. Note that the only exception to the humidifying trend is the dip in RH observed in 2018, which is attributed to the anomalous severe drought that occurred over central China from mid-summer through late autumn, during which year-on-year precipitation declined by 20 %–50 %. However, variations in the fractional contribution of hygroscopic growth can be divided into two periods with distinct patterns. From 2014 to 2019, both and exhibit a gradual increase, rising from 8 % to 16 % and from 1 % to 9 %, respectively. This increase is jointly driven by rising RH and a growing proportion of more hydrophilic nitrate aerosols (Jing et al., 2026). This consistent increasing trend also suggests that aerosol sources and/or compositions in the BL and FT were similar. From 2020 onwards, and fluctuate at relatively high levels of 15 %–19 % and 7 %–10 %, respectively. Although RH continues to increase, the upward trend in the hygroscopic growth contribution is partially offset by a slight decline of the hygroscopic growth parameter γ since 2020 (Jing et al., 2026).
3.3 Seasonal patterns of hygroscopic-growth contributions to anthropogenic AOD
Figure 8 shows the seasonal variations of AODamb, AODdry, ΔAODRH,BL, and ΔAODRH,FT. Based on AODamb, summer (0.427) appears to be the most polluted season over central China, followed by autumn (0.421) and winter (0.417). However, when examining AODdry, a different seasonal pattern emerges once hygroscopic growth is considered. The most severe air pollution prevails in winter. We find a maximum value of 0.354 for AODdry, followed by autumn (0.330) and summer (0.295). This variation of AOD during the seasons reflects a more realistic depiction of air quality over central China, because winter not only holds the highest aerosol emissions (Zhang et al., 2015), but also features stagnant meteorological conditions that hinder the removal of accumulated aerosols from the atmospheric column (Ma et al., 2019; Zhang et al., 2021).
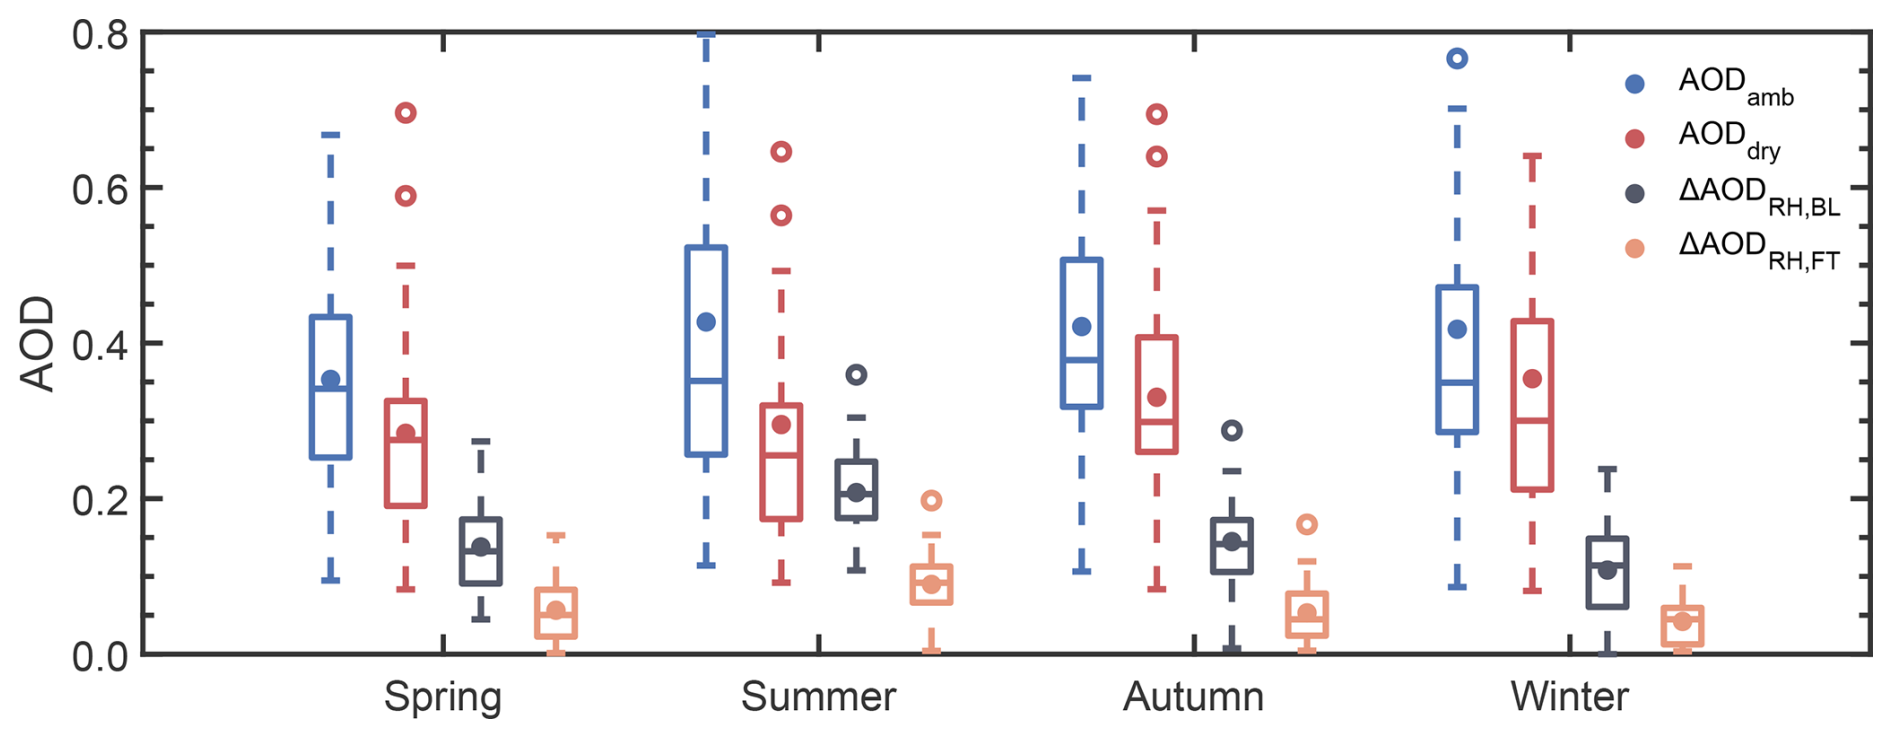
Figure 8Seasonal variations of 532 nm anthropogenic AODamb, AODdry, ΔAODRH,BL, and ΔAODRH,FT in Wuhan during 2010–2024.
Wuhan is subject to the monsoon climate. The Asian summer monsoon plays an essential role in transporting water vapor from the Indian Ocean and Western Pacific and has a dominant impact on summer precipitation southeast of the Hu Huanyong Line, a line directly connects Heihe in Southwestern China and Tengchong in Northeastern China and generally overlap with the 400 mm isohyet (Zheng et al., 2022). Water vapor over the Yangtze River Valley primarily originates from the Indian Ocean. This water vapor is carried by advection transport associated with the Indian summer monsoon and the West Pacific Subtropical High (Chu et al., 2021). In contrast, the Asian winter monsoon, which is driven by the Arctic Oscillation and Siberian High, advects cold, dry air from Siberia (Wu and Wang, 2002). This movement of air suppresses precipitation in the mid-latitudes of East Asia and therefore results in a relatively cold and dry atmosphere (Wang et al., 2014). These seasonal climatic characteristics lead to much higher atmospheric moisture in summer compared with winter, causing hygroscopic growth to contribute much more to the observed ambient AOD during summer. Additionally, the seasonal patterns of the hygroscopic growth contribution to AOD are consistent across altitudes, with the highest values occurring in winter (0.82 in the BL, and 0.88 in the FT) and the lowest values in summer (0.66 in the BL, and 0.72 in the FT).
In summary, as a follow-up study to Jing et al. (2025) and Jing et al. (2026), we derive backscatter coefficient profiles of anthropogenic aerosols in the ambient atmosphere using ground-based polarization lidar observations over central China from 2010 to 2024. By combining these lidar-derived backscatter profiles with ERA5 RH profiles, we further calculate the corresponding dry backscatter (and subsequently dry extinction) coefficient profiles by removing the contributions associated with hygroscopic growth. Our results reveal that hygroscopic growth of anthropogenic aerosols occurs primarily below 2 km. We find year-to-year particle backscatter enhancements ranging from 11 % to 46 %. The anthropogenic AOD in the ambient atmosphere (AODamb=0.404) amplifies the dry anthropogenic AOD (AODdry=0.315) by ∼30 % via hygroscopic particle growth.
During China's rapid air-cleaning period of 2010–2017, anthropogenic aerosol emissions over central China decreased substantially, with AODamb exhibiting a rate of decline of −0.068 yr−1 as previously reported by Jing et al. (2025). However, this rate does not accurately reflect the actual improvement of atmospheric pollution, i.e., a rate of decline of −0.049 yr−1 which we derived from AODdry. The AOD contributed by hygroscopic growth, i.e., ΔAODRH, decreases rapidly from 2011 to 2013 and remains at a relatively low level thereafter. In addition, ΔAODRH,BL is generally 2–5 times larger than the corresponding ΔAODRH,FT, which indicated a much stronger contribution from aerosol hygroscopic growth within the BL, where most water vapor resides. Regarding the relative contributions of hygroscopic growth, both and exhibit the following features: (1) a marked decline during 2011–2014, due to effective mitigation of severe air pollution episodes and a concurrent shift toward a drier atmosphere as the result of changes of meteorological conditions over China; (2) a gradual increase during 2014–2019 (rising from 8 % to 16 % in the BL, and from 1 % to 9 % in the FT), influenced jointly by rising RH and a growing proportion of more hydrophilic nitrate aerosols; (3) fluctuations at relatively high levels from 2020 onward (15 %–19 % in the BL and 7 %–10 % in the FT), as the upward trend associated with increasing RH is partially offset by a slight decline in the hygroscopic growth parameter γ since 2022. Furthermore, the seasonal variation of AODamb suggests that summer is the most polluted season, followed by autumn and winter. However, when removing hygroscopic growth effects, AODdry identifies that winter is in fact the peak pollution period over central China.
This study demonstrates that long-term ground-based observations combined with reanalysis meteorological data can capture the accurate variations in the atmospheric environment (air quality) through the derived dry AODs. This approach can also be extended from a single lidar site to regional, national, and even continental scales through established ground-based lidar networks, such as well-developed EARLINET in Europe (Pappalardo et al., 2014), MPLNET in the United States (Welton et al., 2001), and the recently developed CARLNET in China (Shao et al., 2025). In addition, AOD is a widely used optical parameter in atmospheric science and can be further applied to derive key environmental metrics such as aerosol mass concentration (Shin et al., 2025). Achieving this will require reliable extinction-to-volume conversion factors, along with representative aerosol size distributions and densities (Mamouri and Ansmann, 2016; He et al., 2025). Such regional-specific pre-set aerosol information can be obtained from independent measurements, including sun photometers and optical particle counters. With these comprehensive observations and data processing methods, lidar observation holds strong potential for monitoring three-dimensional variations of tropospheric pollution and improving aerosol reanalysis products as input constraints.
Previous studies have reported a fixed LR of 50 sr as an average value derived from combined lidar and sun photometer measurements (Takamura et al., 1994) or Raman lidar observations (Müller et al., 2007) for urban aerosols in the ambient troposphere. Therefore, here we adopted typical lidar ratio values for anthropogenic aerosols from existing literature. Here a sensitivity analysis is conducted to assess the uncertainty of applying a fixed lidar ratio of 50 sr for all conditions. The LR–RH relationship from Zhao et al. (2017) is adopted for the sensitivity analysis:
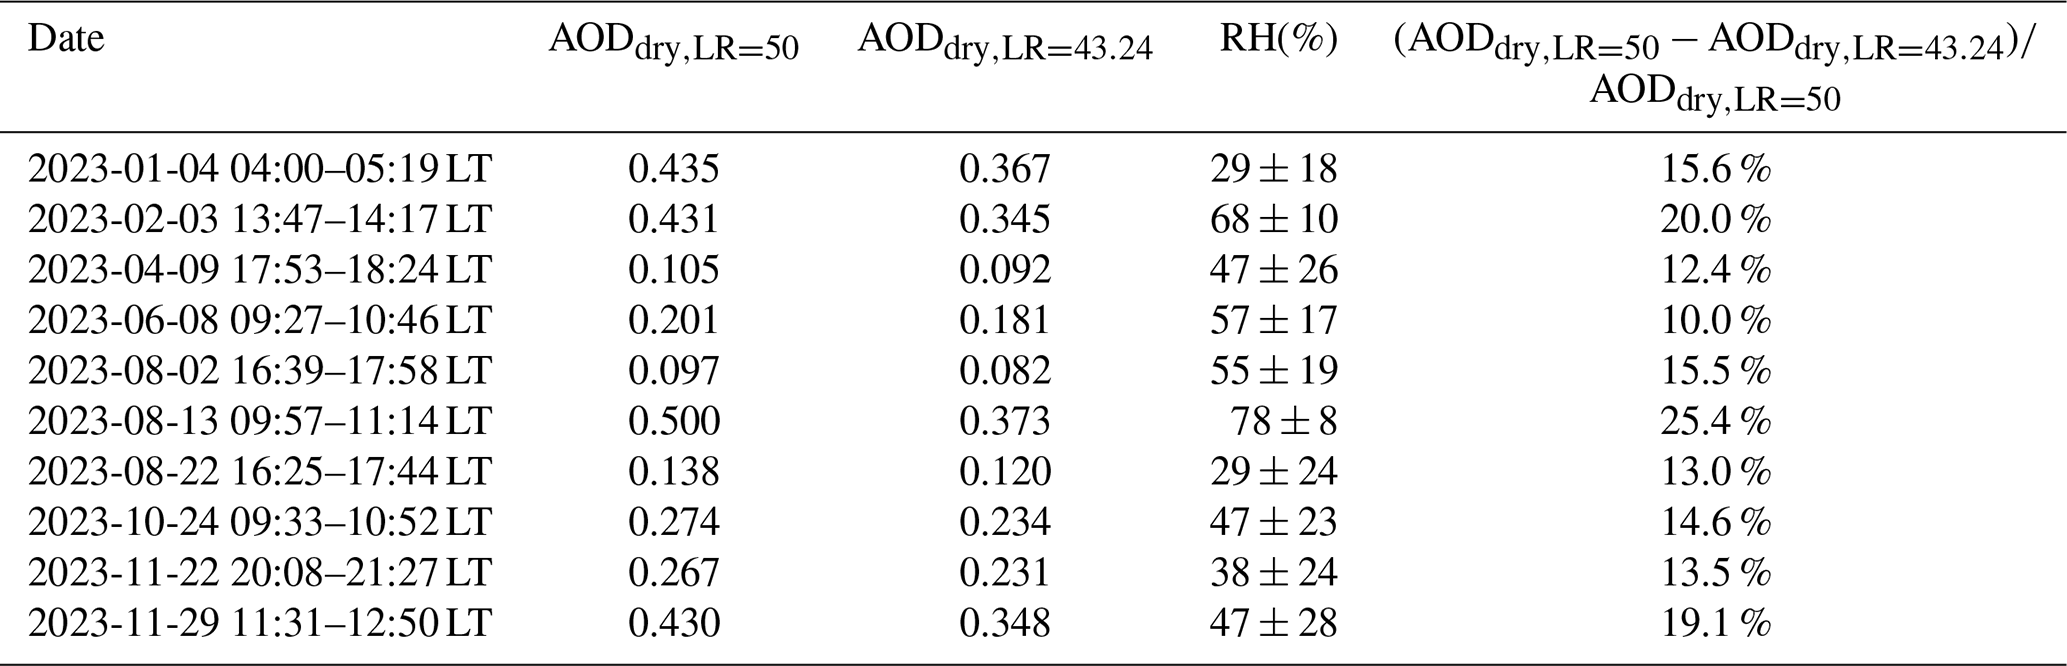
Since the RH in the lower troposphere over Wuhan ranges approximately from 40 % to 70 % (see Fig. 7b of our manuscript), we set LR0=47 sr in Eq. (A1); this assigns a LR of 50 sr to RH conditions around 50 %–55 %. As derived from Eq. (A1) (Zhao et al., 2017), if RH=40 %, sr, which will be applied at RH<40 %. Taking the case on 2 August 2023 as an example, LR can reach up to 70 sr when RH excceds 80 % (Fig. A1a), resulting in a rapid increase in the extinction coefficient at corresponding altitudes (Fig. A1b). After removing the influence of hygroscopic growth, the extinction coefficient is lower than that obtained using the original LR=50 sr (Fig. A1c). The corrected AODdry is 0.082, representing a 15.5 % decrease from the original value of 0.097. Furthermore, 10 cases in 2023 (γ=0.6) were also analyzed, covering a range of pollution levels and RH conditions (Table A1). The results indicate that when considering the effect of hygroscopic growth on lidar ratio, corrected AODdry values generally decrease by 10 %–25 %.
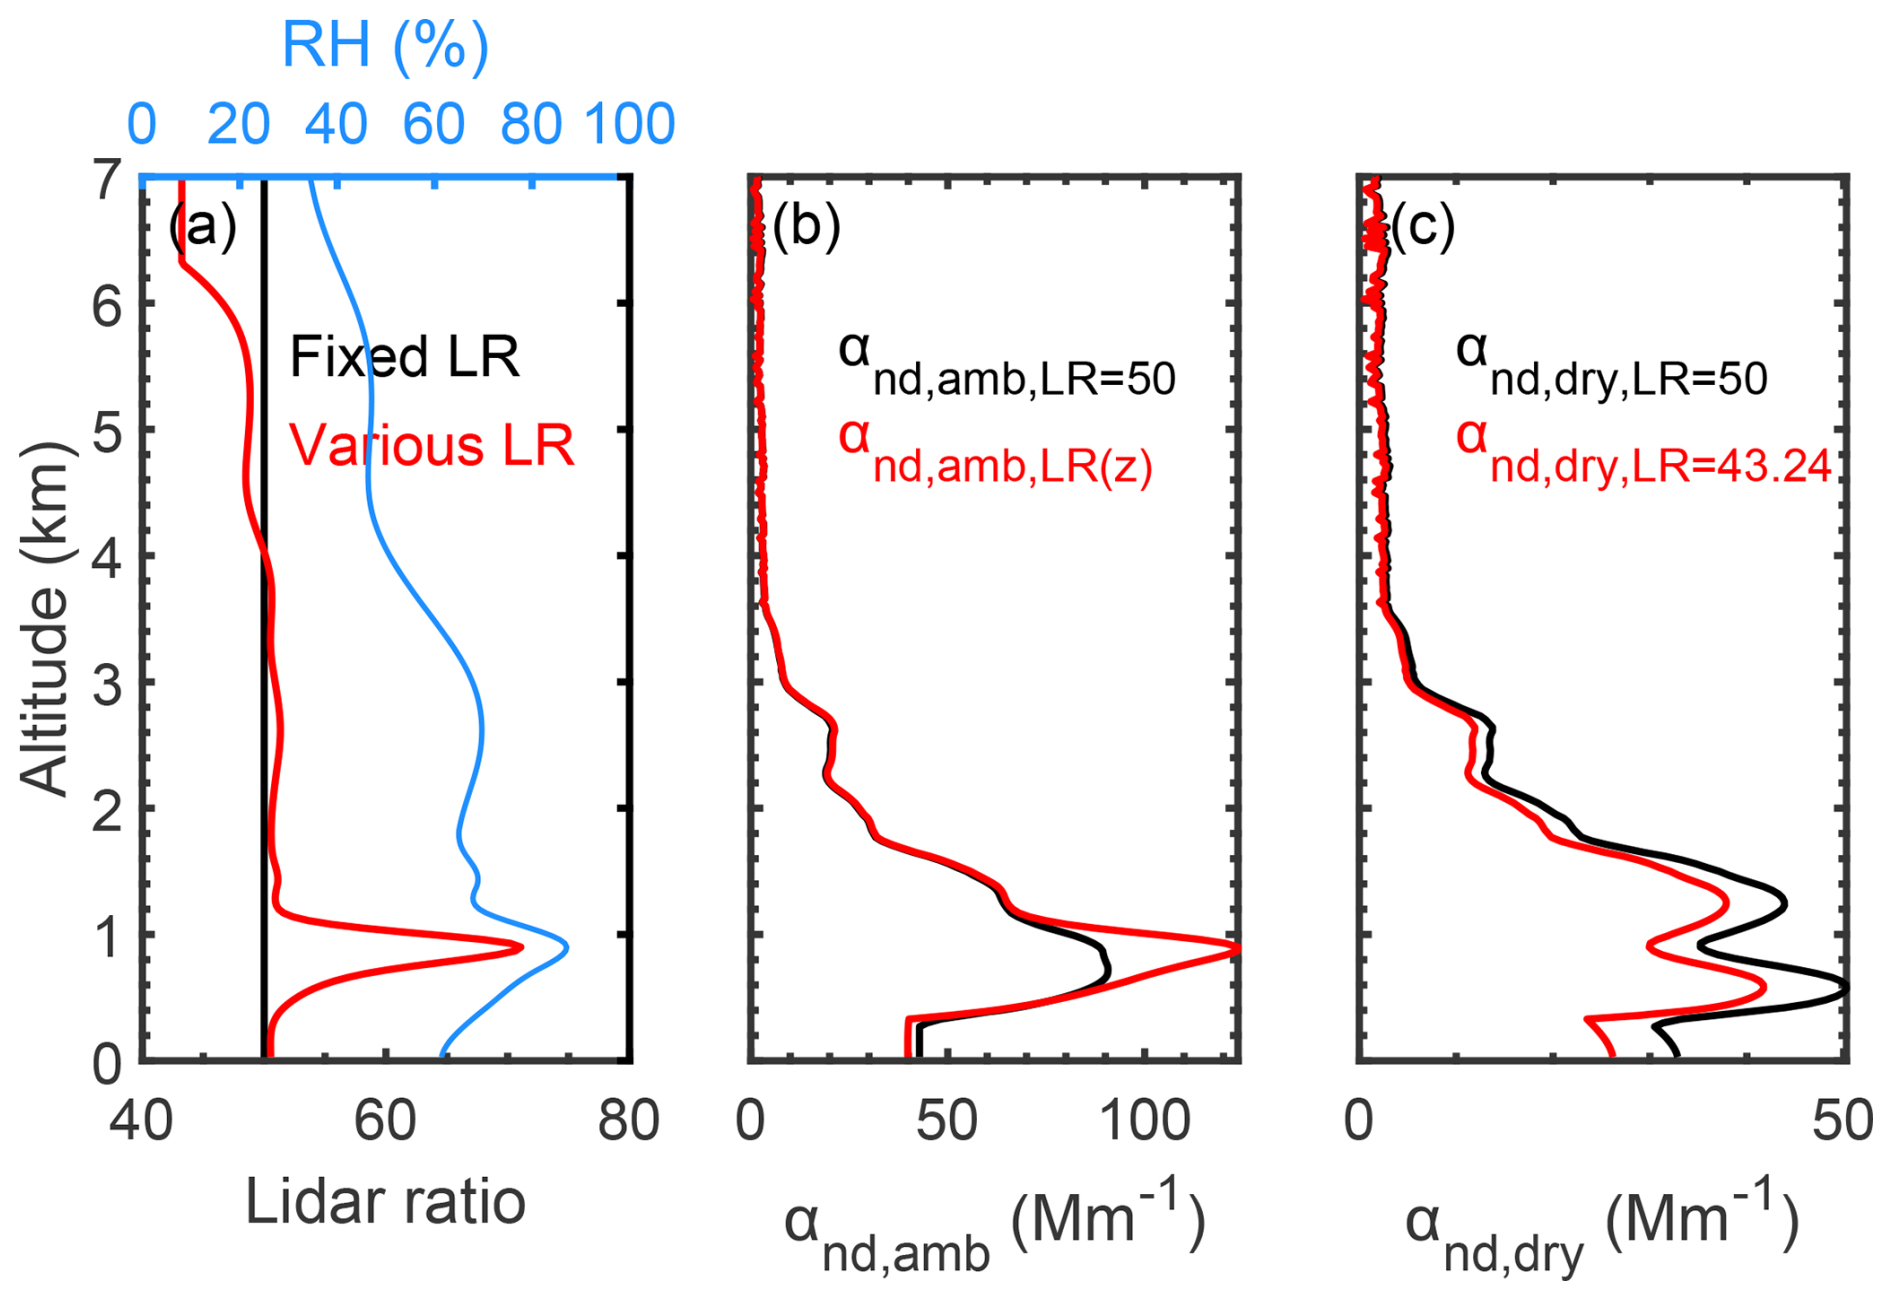
Figure A1Profiles of (a) lidar ratio and relative humidity; (b) non-dust extinction coefficient in ambient atmosphere; (c) non-dust extinction coefficient in dry conditions during 16:39–17:58 LT on 2 August 2023. The Black curves denote the results obtained using the original fixed lidar ratio of 50 sr, while the red curves denote the corrected results.
Table A1Comparisons of AODdry: original LR versus corrected LR.
ERA5 reanalysis data can be obtained from https://cds.climate.copernicus.eu/datasets (Copernicus Climate Change Service, Climate Data Store, 2025). The radiosonde data can be obtained from https://weather.uwyo.edu/upperair/sounding.shtml (University of Wyoming Atmospheric Science Radiosonde Archive, 2025). Lidar data are available on reasonable request from the corresponding author (heyun@whu.edu.cn).
YH conceived the research, analyzed the data, wrote the manuscript, and acquired the research funding. DJ analyzed the data and wrote the manuscript. ZY, DM, FL, YZ, YY, and KH participated in scientific discussions and reviewed and proofread the manuscript. FY acquired the research funding and led the study. All authors contributed to the discussion and revision.
The contact author has declared that none of the authors has any competing interests.
Publisher's note: Copernicus Publications remains neutral with regard to jurisdictional claims made in the text, published maps, institutional affiliations, or any other geographical representation in this paper. The authors bear the ultimate responsibility for providing appropriate place names. Views expressed in the text are those of the authors and do not necessarily reflect the views of the publisher.
The authors thank the colleagues who participated in the operation of the lidar system at our site. We also acknowledge the European Centre for Medium-Range Weather Forecasts (ECMWF) for ERA5 reanalysis data, and the University of Wyoming for radiosonde data.
This work was supported by the National Natural Science Foundation of China (grant nos. 42575138, 42005101, 42575141, and 42205130), Hubei Provincial Special Project for Central Government Guidance on Local Science and Technology Development (2025CFC003), and the Meridian Space Weather Monitoring Project (China).
This paper was edited by Silke Gross and reviewed by three anonymous referees.
An, Z., Huang, R. J., Zhang, R., Tie, X., Li, G., Cao, J., Zhou, W., Shi, Z., Han, Y., Gu, Z., and Ji, Y.: Severe haze in northern China: A synergy of anthropogenic emissions and atmospheric processes, P. Natl. Acad. Sci. USA, 116, 8657–8666, https://doi.org/10.1073/pnas.1900125116, 2019.
Bedoya-Velásquez, A. E., Navas-Guzmán, F., Granados-Muñoz, M. J., Titos, G., Román, R., Casquero-Vera, J. A., Ortiz-Amezcua, P., Benavent-Oltra, J. A., de Arruda Moreira, G., Montilla-Rosero, E., Hoyos, C. D., Artiñano, B., Coz, E., Olmo-Reyes, F. J., Alados-Arboledas, L., and Guerrero-Rascado, J. L.: Hygroscopic growth study in the framework of EARLINET during the SLOPE I campaign: synergy of remote sensing and in situ instrumentation, Atmos. Chem. Phys., 18, 7001–7017, https://doi.org/10.5194/acp-18-7001-2018, 2018.
Bolton, D.: The computation of equivalent potential temperature, Mon. Weather Rev., 108, 1046–1053, https://doi.org/10.1175/1520-0493(1980)108<1046:TCOEPT>2.0.CO;2, 1980.
Brooks, S. D., Wise, M. E., Cushing, M., and Tolbert, M. A.: Deliquescence behavior of organic/ammonium sulfate aerosol, Geophys. Res. Lett., 29, 1917, https://doi.org/10.1029/2002GL014733, 2002.
Che, H., Zhang, X., Li, Y., Zhou, Z., and Qu, J.: Horizontal visibility trends in China 1981–2005, Geophys. Res. Lett., 34, L24706, https://doi.org/10.1029/2007GL031450, 2007.
Chen, J., Li, Z., Lv, M., Wang, Y., Wang, W., Zhang, Y., Wang, H., Yan, X., Sun, Y., and Cribb, M.: Aerosol hygroscopic growth, contributing factors, and impact on haze events in a severely polluted region in northern China, Atmos. Chem. Phys., 19, 1327–1342, https://doi.org/10.5194/acp-19-1327-2019, 2019.
Chu, Q., Wang, Q., Feng, G., Jia, Z., and Liu, G.: Roles of water vapor sources and transport in the intraseasonal and interannual variation in the peak monsoon rainfall over East China, Clim. Dynam., 57, 2153–2170, https://doi.org/10.1007/s00382-021-05799-5, 2021.
Copernicus Climate Change Service, Climate Data Store: ERA5 hourly data on from 1940 to present, Copernicus Climate Change Service (C3S) Climate Data Store (CDS), https://cds.climate.copernicus.eu/datasets, last access: 19 December 2025.
de Leeuw, G., Fan, C., Li, Z., Dong, J., Li, Y., Ou, Y., and Zhu, S.: Spatiotemporal variation and provincial scale differences of the AOD across China during 2000–2021, Atmos. Pollut. Res., 13, 101359, https://doi.org/10.1016/j.apr.2022.101359, 2022.
Ding, A., Huang, X., Nie, W., Chi, X., Xu, Z., Zheng, L., Xu, Z., Xie, Y., Qi, X., Shen, Y., Sun, P., Wang, J., Wang, L., Sun, J., Yang, X.-Q., Qin, W., Zhang, X., Cheng, W., Liu, W., Pan, L., and Fu, C.: Significant reduction of PM2.5 in eastern China due to regional-scale emission control: evidence from SORPES in 2011–2018, Atmos. Chem. Phys., 19, 11791–11801, https://doi.org/10.5194/acp-19-11791-2019, 2019.
Fernald, F. G.: Analysis of atmospheric lidar observations: some comments, Appl. Optics, 23, 652–653, https://doi.org/10.1364/AO.23.000652, 1984.
Ferrare, R. A., Melfi, S. H., Whiteman, D. N., Evans, K. D., Poellot, M., and Kaufman, Y. J.: Raman lidar measurements of aerosol extinction and backscattering: 2. Derivation of aerosol real refractive index, single-scattering albedo, and humidification factor using Raman lidar and aircraft size distribution measurements, J. Geophys. Res.-Atmos., 10, 19673–19689, https://doi.org/10.1029/98JD01647, 1998.
Freudenthaler, V., Esselborn, M., Wiegner, M., Heese, B., Tesche, M., Ansmann, A., Müller, D., Althausen, D., Wirth, M., Fix, A., Ehret, G., Knippertz, P., Toledano, C., Gasteiger, J., Garhammer, M., and Seefeldner, M.: Depolarization ratio profiling at several wavelengths in pure Saharan dust during SAMUM2006, Tellus B, 61, 165–179, https://doi.org/10.1111/j.1600-0889.2008.00396.x, 2009.
Fu, T., He, Y., Jia, Y., Jing, D., and Yi, F.: Lidar observations of optical properties of two upper troposphere and lower stratosphere aerosol plumes at Wuhan, Atmos. Res., 327, 108347, https://doi.org/10.1016/j.atmosres.2025.108347, 2026.
Ganguly, D., Ginoux, P., Ramaswamy, V., Dubovik, O., Welton, J., Reid, E. A., and Holben, B. N.: Inferring the composition and concentration of aerosols by combining AERONET and MPLNET data: Comparison with other measurements and utilization to evaluate GCM output, J. Geophys. Res.-Atmos., 114, D16203, https://doi.org/10.1029/2009JD011895, 2009.
Geng, G., Liu, Y., Liu, Y., Liu, S., Cheng, J., Yan, L., Wu, N., Hu, H., Tong, D., Zheng, B., Yin, Z., He, K., and Zhang, Q.: Efficacy of China's clean air actions to tackle PM2.5 pollution between 2013 and 2020, Nat. Geosci., 17, 987–994, https://doi.org/10.1038/s41561-024-01540-z, 2024.
Granados-Muñoz, M. J., Navas-Guzmán, F., Bravo-Aranda, J. A., Guerrero-Rascado, J. L., Lyamani, H., Valenzuela, A., Titos, G., Fernández-Gálvez, J., and Alados-Arboledas, L.: Hygroscopic growth of atmospheric aerosol particles based on active remote sensing and radiosounding measurements: selected cases in southeastern Spain, Atmos. Meas. Tech., 8, 705–718, https://doi.org/10.5194/amt-8-705-2015, 2015.
Guan, C., Wang, X., and Yang, H.: Understanding the development of the 2018/19 central Pacific El Niño, Adv. Atmos. Sci., 40, 177–185, https://doi.org/10.1007/s00376-022-1410-1, 2023.
Haarig, M., Engelmann, R., Baars, H., Gast, B., Althausen, D., and Ansmann, A.: Discussion of the spectral slope of the lidar ratio between 355 and 1064 nm from multiwavelength Raman lidar observations, Atmos. Chem. Phys., 25, 7741–7763, https://doi.org/10.5194/acp-25-7741-2025, 2025.
Hänel, G.: The properties of atmospheric aerosol particles as functions of the relative humidity at thermodynamic equilibrium with the surrounding moist air, in: Advances in Geophysics, edited by: Landsberg, H. E. and Mieghem, J. V., Elsevier, 73–188, https://doi.org/10.1016/S0065-2687(08)60142-9, 1976.
He, Q., Gu, Y., and Zhang, M.: Spatiotemporal trends of PM2.5 concentrations in central China from 2003 to 2018 based on MAIAC-derived high-resolution data, Environ. Int., 137, 105536, https://doi.org/10.1016/j.envint.2020.105536, 2020.
He, Y., Yi, F., Yi, Y., Liu, F., and Zhang, Y.: Heterogeneous nucleation of midlevel cloud layer influenced by transported Asian dust over Wuhan (30.5° N, 114.4° E), China, J. Geophys. Res.-Atmos., 126, e2020JD033394, https://doi.org/10.1029/2020JD033394, 2021.
He, Y., Jing, D., Yin, Z., Ohneiser, K., and Yi, F.: Long-term (2010–2021) lidar observations of stratospheric aerosols in Wuhan, China, Atmos. Chem. Phys., 24, 11431–11450, https://doi.org/10.5194/acp-24-11431-2024, 2024.
He, Y., Choudhury, G., Tesche, M., Ansmann, A., Yi, F., Müller, D., and Yin, Z.: Extended POLIPHON dust conversion factor dataset for lidar-derived cloud condensation nuclei and ice-nucleating particle concentration profiles, Atmos. Meas. Tech., 18, 5669–5685, https://doi.org/10.5194/amt-18-5669-2025, 2025.
Hersbach, H., Bell, B., Berrisford, P., Biavati, G., Horányi, A., Muñoz Sabater, J., Nicolas, J., Peubey, C., Radu, R., Rozum, I., Schepers, D., Simmons, A., Soci, C., Dee, D., and Thépaut, J.-N.: ERA5 hourly data on pressure levels from 1940 to present, Copernicus Climate Change Service (C3S) Climate Data Store (CDS) [data set], https://doi.org/10.24381/cds.bd0915c6, 2023a.
Hersbach, H., Bell, B., Berrisford, P., Biavati, G., Horányi, A., Muñoz Sabater, J., Nicolas, J., Peubey, C., Radu, R., Rozum, I., Schepers, D., Simmons, A., Soci, C., Dee, D., and Thépaut, J.-N.: ERA5 hourly data on single levels from 1940 to present, Copernicus Climate Change Service (C3S) Climate Data Store (CDS) [data set], https://doi.org/10.24381/cds.adbb2d47, 2023b.
Jing, D., He, Y., Yin, Z., Liu, F., and Yi, F.: Long-term characteristics of dust aerosols over central China from 2010 to 2020 observed with polarization lidar, Atmos. Res., 297, 107129, https://doi.org/10.1016/j.atmosres.2023.107129, 2024.
Jing, D., He, Y., Yin, Z., Huang, K., Liu, F., and Yi, F.: Evolution of tropospheric aerosols over central China during 2010–2024 as observed by lidar, Atmos. Chem. Phys., 25, 17047–17067, https://doi.org/10.5194/acp-25-17047-2025, 2025.
Jing, D., He, Y., Yin, Z., Müller, D., Huang, K., and Yi, F.: Hygroscopic growth characteristics of anthropogenic aerosols over central China revealed by lidar observations, Atmos. Meas. Tech., 19, 389–403, https://doi.org/10.5194/amt-19-389-2026, 2026.
Joo, S., Shin, J., Tesche, M., Dehkhoda, N., Kim, T., and Noh, Y.: Increased number concentrations of small particles explain perceived stagnation in air quality over Korea, Atmos. Chem. Phys., 25, 1023–1036, https://doi.org/10.5194/acp-25-1023-2025, 2025.
Kallihosur, T., Nair, V. S., and Sinha, P. R.: Winter haze amplification by aerosol hygroscopic growth over eastern Indo-Gangetic Plain, Commun. Earth Environ., 5, 656, https://doi.org/10.1038/s43247-024-01792-y, 2024.
Kong, W. and Yi, F.: Convective boundary layer evolution from lidar backscatter and its relationship with surface aerosol concentration at a location of a central China megacity, J. Geophys. Res.-Atmos., 120, 7928–7940, https://doi.org/10.1002/2015JD023248, 2015.
Lee, W. M. G., Huang, W. M., and Chen, Y. Y.: Effect of relative humidity on mixed aerosols in atmosphere, J. Environ. Sci. Heal. A, 36, 533–544, https://doi.org/10.1081/ESE-100103482, 2001.
Li, C., van Donkelaar, A., Hammer, M. S., McDuffie, E. E., Burnett, R. T., Spadaro, J. V., Chatterjee, D., Cohen, A. J., Apte, J. S., Southerland, V. A., Anenberg, S. C., Brauer, M., and Martin, R. V.: Reversal of trends in global fine particulate matter air pollution, Nat. Commun., 14, 5349, https://doi.org/10.1038/s41467-023-41086-z, 2023a.
Li, K., Zheng, F., Cheng, L., Zhang, T., and Zhu, J.: Record-breaking global temperature and crises with strong El Niño in 2023–2024, Innov. Geosci., 1, 100030, https://doi.org/10.59717/j.xinn-geo.2023.100030, 2023b.
Liao, W., Zhou, J., Zhu, S., Xiao, A., Li, K., and Schauer, J. J.: Characterization of aerosol chemical composition and the reconstruction of light extinction coefficients during winter in Wuhan, China, Chemosphere, 241, 125033, https://doi.org/10.1016/j.chemosphere.2019.125033, 2020.
Liu, J., Ren, C., Huang, X., Nie, W., Wang, J., Sun, P., Chi, X., and Ding, A.: Increased aerosol extinction efficiency hinders visibility improvement in eastern China, Geophys. Res. Lett., 47, e2020GL090167, https://doi.org/10.1029/2020GL090167, 2020.
Liu, M., Huang, X., Song, Y., Xu, T., Wang, S., Wu, Z., Hu, M., Zhang, L., Zhang, Q., Pan, Y., Liu, X., and Zhu, T.: Rapid SO2 emission reductions significantly increase tropospheric ammonia concentrations over the North China Plain, Atmos. Chem. Phys., 18, 17933–17943, https://doi.org/10.5194/acp-18-17933-2018, 2018.
Luo, Q., Hong, J., Xu, H., Han, S., Tan, H., Wang, Q., Tao, J., Ma, N., Cheng, Y., and Su, H.: Hygroscopicity of amino acids and their effect on the water uptake of ammonium sulfate in the mixed aerosol particles, Sci. Total Environ., 734, 139318, https://doi.org/10.1016/j.scitotenv.2020.139318, 2020.
Ma, Y., Zhang, M., Jin, S., Gong, W., Chen, N., Chen, Z., Jin, Y., and Shi, Y.: Long-term investigation of aerosol optical and radiative characteristics in a typical megacity of Central China during winter haze periods, J. Geophys. Res.-Atmos., 124, 12093–12106, https://doi.org/10.1029/2019JD030840, 2019.
Mamouri, R. E. and Ansmann, A.: Fine and coarse dust separation with polarization lidar, Atmos. Meas. Tech., 7, 3717–3735, https://doi.org/10.5194/amt-7-3717-2014, 2014.
Mamouri, R.-E. and Ansmann, A.: Potential of polarization lidar to provide profiles of CCN- and INP-relevant aerosol parameters, Atmos. Chem. Phys., 16, 5905–5931, https://doi.org/10.5194/acp-16-5905-2016, 2016.
Mauer, L. J. and Taylor, L. S.: Water-solids interactions: deliquescence. Annu. Rev. Food Sci. T., 1, 41–63, https://doi.org/10.1146/annurev.food.080708.100915, 2010.
Ministry of Ecology and Environment of the People's Republic of China: Technical guidelines for air pollution control projects, https://www.mee.gov.cn/ywgz/fgbz/bz/bzwb/other/hjbhgc/201012/t20101224199112.shtml (last access: 18 December 2025), 2010 (in Chinese).
Miri, R., Pujol, O., Hu, Q., Goloub, P., Veselovskii, I., Podvin, T., and Ducos, F.: Innovative aerosol hygroscopic growth study from Mie–Raman–fluorescence lidar and microwave radiometer synergy, Atmos. Meas. Tech., 17, 3367–3375, https://doi.org/10.5194/amt-17-3367-2024, 2024.
Müller, D., Ansmann, A., Mattis, I., Tesche, M., Wandinger, U., Althausen, D., and Pisani, G.: Aerosol-type-dependent lidar ratios observed with Raman lidar, J. Geophys. Res.-Atmos., 112, D16202, https://doi.org/10.1029/2006JD008292, 2007.
Nair, V. S., Giorgi, F., and Keshav Hasyagar, U.: Amplification of South Asian haze by water vapour–aerosol interactions, Atmos. Chem. Phys., 20, 14457–14471, https://doi.org/10.5194/acp-20-14457-2020, 2020.
Navas-Guzmán, F., Martucci, G., Collaud Coen, M., Granados-Muñoz, M. J., Hervo, M., Sicard, M., and Haefele, A.: Characterization of aerosol hygroscopicity using Raman lidar measurements at the EARLINET station of Payerne, Atmos. Chem. Phys., 19, 11651–11668, https://doi.org/10.5194/acp-19-11651-2019, 2019.
Pappalardo, G., Amodeo, A., Apituley, A., Comeron, A., Freudenthaler, V., Linné, H., Ansmann, A., Bösenberg, J., D'Amico, G., Mattis, I., Mona, L., Wandinger, U., Amiridis, V., Alados-Arboledas, L., Nicolae, D., and Wiegner, M.: EARLINET: towards an advanced sustainable European aerosol lidar network, Atmos. Meas. Tech., 7, 2389–2409, https://doi.org/10.5194/amt-7-2389-2014, 2014.
Pérez-Ramírez, D., Whiteman, D. N., Veselovskii, I., Ferrare, R., Titos, G., Granados-Muñoz, M. J., Sánchez-Hernández, G., and Navas-Guzmán, F.: Spatiotemporal changes in aerosol properties by hygroscopic growth and impacts on radiative forcing and heating rates during DISCOVER-AQ 2011, Atmos. Chem. Phys., 21, 12021–12048, https://doi.org/10.5194/acp-21-12021-2021, 2021.
Shao, N., Wang, Q., Bu, Z., Yin, Z., Dai, Y., Chen, Y., and Wang, X.: China Aerosol Raman Lidar Network (CARLNET) – Part I: Water Vapor Raman Channel Calibration and Quality Control, Remote Sens.-Basel, 17, 414, https://doi.org/10.3390/rs17030414, 2025.
Shin, J., Sim, J., Tesche, M., Yoon, J., Kim, D., and Noh, Y.: Machine learning-based retrieval of aerosol size and hygroscopicity using horizontal scanning LiDAR and PM data, npj Clim. Atmos. Sci., 9, 3, https://doi.org/10.1038/s41612-025-01276-6, 2025.
Sicard, M., Fortunato dos Santos Oliveira, D. C., Muñoz-Porcar, C., Gil-Díaz, C., Comerón, A., Rodríguez-Gómez, A., and Dios Otín, F.: Measurement report: Spectral and statistical analysis of aerosol hygroscopic growth from multi-wavelength lidar measurements in Barcelona, Spain, Atmos. Chem. Phys., 22, 7681–7697, https://doi.org/10.5194/acp-22-7681-2022, 2022.
Stoy, P. C., Roh, J., and Bromley, G. T.: It's the heat and the humidity: The complementary roles of temperature and specific humidity to recent changes in the energy content of the near-surface atmosphere, Geophys. Res. Lett., 49, e2021GL096628, https://doi.org/10.1029/2021GL096628, 2022.
Takamura, T., Sasano, Y., and Hayasaka, T.: Tropospheric aerosol optical properties derived from lidar, sun photometer, and optical particle counter measurements, Appl. Optics, 33, 7132–7140, https://doi.org/10.1364/AO.33.007132, 1994.
Tao, M., Chen, L., Xiong, X., Zhang, M., Ma, P., Tao, J., and Wang, Z.: Formation process of the widespread extreme haze pollution over northern China in January 2013: Implications for regional air quality and climate, Atmos. Environ., 98, 417–425, https://doi.org/10.1016/j.atmosenv.2014.09.026, 2014.
Tesche, M., Ansmann, A., Müller, D., Althausen, D., Engelmann, R., Freudenthaler, V., and Groß, S.: Vertically resolved separation of dust and smoke over Cape Verde using multiwavelength Raman and polarization lidars during Saharan Mineral Dust Experiment 2008, J. Geophys. Res.-Atmos., 114, D13202, https://doi.org/10.1029/2009JD011862, 2009.
The State Council of the People's Republic of China: Action Plan on Air Pollution Prevention and Control, https://www.gov.cn/zwgk/2013-09/12/content_2486773.html (last access: 18 December 2025), 2013.
The State Council of the People's Republic of China: Three-year Plan on Defending the blue sky, https://www.gov.cn/zhengce/content/2018-07/03/content_5303158.html (last access: 18 December 2025), 2018.
The State Council of the People's Republic of China: Action Plan for continuous improvement of air quality, https://www.gov.cn/gongbao/2023/issue_10886/202312/content_6921385.html (last access: 18 December 2025), 2023.
Titos, G., Cazorla, A., Zieger, P., Andrews, E., Lyamani, H., Granados-Muñoz, M. J., Olmo, F. J., and Alados-Arboledas, L.: Effect of hygroscopic growth on the aerosol light-scattering coefficient: A review of measurements, techniques and error sources, Atmos. Environ., 141, 494–507, https://doi.org/10.1016/j.atmosenv.2016.07.021, 2016.
Toth, T. D., Zhang, J., Campbell, J. R., Reid, J. S., and Vaughan, M. A.: Temporal variability of aerosol optical thickness vertical distribution observed from CALIOP, J. Geophys. Res.-Atmos., 121, 9117–9139, https://doi.org/10.1002/2015JD024668, 2016.
University of Wyoming Atmospheric Science Radiosonde Archive: https://weather.uwyo.edu/upperair/sounding.shtml, last access: 19 December 2025.
Veselovskii, I., Whiteman, D. N., Kolgotin, A., Andrews, E., and Korenskii, M.: Demonstration of aerosol property profiling by multiwavelength lidar under varying relative humidity conditions, J. Atmos. Ocean. Tech., 26, 1543–1557, https://doi.org/10.1175/2009JTECHA1254.1, 2009.
Wang, H., Tan, S. C., Wang, Y., Jiang, C., Shi, G. Y., Zhang, M. X., and Che, H. Z.: A multisource observation study of the severe prolonged regional haze episode over eastern China in January 2013, Atmos. Environ., 89, 807–815, https://doi.org/10.1016/j.atmosenv.2014.03.004, 2014.
Wang, K., Dickinson, R., and Liang, S.: Clear sky visibility has decreased over land globally from 1973 to 2007, Science, 323, 1468–1470, https://doi.org/10.1126/science.1167549, 2009.
Wang, X., Dickinson, R. E., Su, L., Zhou, C., and Wang, K.: PM2.5 pollution in China and how it has been exacerbated by terrain and meteorological conditions, B. Am. Meteorol. Soc., 99, 105–119, https://doi.org/10.1175/BAMS-D-16-0301.1, 2018.
Welton, E. J., Campbell, J. R., Spinhirne, J. D., and Scott III, V. S.: Global monitoring of clouds and aerosols using a network of micropulse lidar systems, in: Second International Asia-Pacific Symposium on Remote Sensing of the Atmosphere, Environment, and Space, International Society for Optics and Photonics, Sendai, Japan, 151–158, https://doi.org/10.1117/12.417040, 2001.
Wise, M. E., Semeniuk, T. A., Bruintjes, R., Martin, S. T., Russell, L. M., and Buseck, P. R.: Hygroscopic behavior of NaCl-bearing natural aerosol particles using environmental transmission electron microscopy, J. Geophys. Res.-Atmos., 112, D10224, https://doi.org/10.1029/2006JD007678, 2007.
Wu, B. and Wang, J.: Winter Arctic oscillation, Siberian high and East Asian winter monsoon, Geophys. Res. Lett., 29, 1897, https://doi.org/10.1029/2002GL015373, 2002.
Wu, J., Luo, J., Zhang, L., Xia, L., Zhao, D., and Tang, J.: Improvement of aerosol optical depth retrieval using visibility data in China during the past 50 years, J. Geophys. Res.-Atmos., 119, 13370–13387, https://doi.org/10.1002/2014JD021550, 2016.
Xiao, X., Zhang, X., Xiao, Z., Liu, Z., Wang, D., Zhang, C., Rao, Z., He, X., and Guan, H.: Water vapor transport and its influence on water stable isotopes in the Dongting Lake basin, Atmos. Chem. Phys., 25, 6475–6496, https://doi.org/10.5194/acp-25-6475-2025, 2025.
Xu, W., Kuang, Y., Bian, Y., Liu, L., Li, F., Wang, Y., Xue, B., Luo, B., Huang, S., Yuan, B., Zhao, P., and Shao, M.: Current challenges in visibility improvement in southern China, Environ. Sci. Tech. Let., 7, 395–401, https://doi.org/10.1021/acs.estlett.0c00274, 2020.
Yao, L., Kong, S., Zheng, H., Chen, N., Zhu, B., Xu, K., Cao, W., Zhang, Y., Zheng, M., Cheng, Y., Hu, Y., Zhang, Z., Yan, Y., Liu, D., Zhao, T., Bai, Y., and Qi, S.: Co-benefits of reducing PM2.5 and improving visibility by COVID-19 lockdown in Wuhan, npj Clim. Atmos. Sci., 4, 40, https://doi.org/10.1038/s41612-021-00195-6, 2021.
Yi, Y., Yi, F., Liu, F., Zhang, Y., Yu, C., and He, Y.: Microphysical process of precipitating hydrometeors from warm-front mid-level stratiform clouds revealed by ground-based lidar observations, Atmos. Chem. Phys., 21, 17649–17664, https://doi.org/10.5194/acp-21-17649-2021, 2021a.
Yi, Y., Yi, F., Liu, F., He, Y., Zhang, Y., and Yu, C.: A prolonged and widespread thin mid-level liquid cloud layer as observed by ground-based lidars, radiosonde and space-borne instruments, Atmos. Res., 263, 105815, https://doi.org/10.1029/2020JD033394, 2021b.
Yin, Z., Yi, F., Liu, F., He, Y., Zhang, Y., Yu, C., and Zhang, Y.: Long-term variations of aerosol optical properties over Wuhan with polarization lidar, Atmos. Environ., 259, 118508, https://doi.org/10.1016/j.atmosenv.2021.118508, 2021.
Zawadowicz, M. A., Proud, S. R., Seppalainen, S. S., and Cziczo, D. J.: Hygroscopic and phase separation properties of ammonium sulfate/organics/water ternary solutions, Atmos. Chem. Phys., 15, 8975–8986, https://doi.org/10.5194/acp-15-8975-2015, 2015.
Zhai, P., Yu, R., Guo, Y., Li, Q., Ren, X., Wang, Y., Xu, W., Liu, Y., and Ding, Y.: The strong El Niño of 2015/16 and its dominant impacts on global and China's climate, J. Meteorol. Res., 30, 283–297, https://doi.org/10.1007/s13351-016-6101-3, 2016.
Zhang, F., Wang, Z., Cheng, H., Lv, X., Gong, W., Wang, X., and Zhang, G.: Seasonal variations and chemical characteristics of PM2.5 in Wuhan, central China, Sci. Total Environ., 518–519, 97–105, https://doi.org/10.1016/j.scitotenv.2015.02.054, 2015.
Zhang, Q., He, K., and Huo, H.: Cleaning China's air, Nature, 484, 161–162, https://doi.org/10.1038/484161a, 2012.
Zhang, Q., Zheng, Y., Tong, D., Shao, M., Wang, S., Zhang, Y., Xu, X., Wang, J., He, H., Liu, W., Ding, Y., Lei, Y., Li, J., Wang, Z., Zhang, X., Wang, Y., Cheng, J., Liu, Y., Shi, Q., Yan, L., Geng, G., Hong, C., Li, M., Liu, F., Zheng, B., Cao, J., Ding, A., Gao, J., Fu, Q., Huo, J., Liu, B., Yang, F., He, K., and Hao, J.: Drivers of improved PM2.5 air quality in China from 2013 to 2017, P. Natl. Acad. Sci. USA, 116, 24463–24469, https://doi.org/10.1073/pnas.1907956116, 2019.
Zhang, Y., Zhang, Y., Yu, C., and Yi, F.: Evolution of aerosols in the atmospheric boundary layer and elevated layers during a severe, persistent haze episode in a central China megacity, Atmosphere-Basel, 12, 152, https://doi.org/10.3390/atmos12020152, 2021.
Zhao, G., Zhao, C., Kuang, Y., Tao, J., Tan, W., Bian, Y., Li, J., and Li, C.: Impact of aerosol hygroscopic growth on retrieving aerosol extinction coefficient profiles from elastic-backscatter lidar signals, Atmos. Chem. Phys., 17, 12133–12143, https://doi.org/10.5194/acp-17-12133-2017, 2017.
Zheng, B., Tong, D., Li, M., Liu, F., Hong, C., Geng, G., Li, H., Li, X., Peng, L., Qi, J., Yan, L., Zhang, Y., Zhao, H., Zheng, Y., He, K., and Zhang, Q.: Trends in China's anthropogenic emissions since 2010 as the consequence of clean air actions, Atmos. Chem. Phys., 18, 14095–14111, https://doi.org/10.5194/acp-18-14095-2018, 2018.
Zheng, S., Pan, Y., Yu, L., Liu, S., and Peng, D.: Possible future movement of the Hu line based on IPCC CMIP6 scenarios, Environ. Res. Commun., 4, 095008, https://doi.org/10.1088/2515-7620/ac8c85, 2022.
Zhong, W., Wu, Y., Yang, S., Ma, T., Cai, Q., and Liu, Q.: Heavy Southern China spring rainfall promoted by multi-year El Niño events, Geophys. Res. Lett., 50, e2022GL102346, https://doi.org/10.1029/2022GL102346, 2023.
- Abstract
- Introduction
- Data and methods
- Results
- Summary and conclusions
- Appendix A: Sensitivity analysis of the influence of the applied fixed lidar ratio on derived AODdry
- Data availability
- Author contributions
- Competing interests
- Disclaimer
- Acknowledgements
- Financial support
- Review statement
- References