the Creative Commons Attribution 4.0 License.
the Creative Commons Attribution 4.0 License.
 | 14 Apr 2026
Novel insights on causes of disproportionate trends between particulate NO3− and NOx emissions in Canadian urban atmospheres
Qinchu Fan
Xiaohong Yao
Particulate nitrate (NO) is a key target for air pollution control; however, its response to NOx emission reductions remains uncertain, particularly in cold climates. This study assesses long-term trends in fine- and coarse-mode NO (f-NO and c-NO) from 1990 to 2019 across seven Canadian cities, using data from by the National Air Pollution Surveillance (NAPS) network. The analysis reveals disproportionate trends between NO and NOx emissions nationwide. In Edmonton, annual mean f-NO decreased by approximately 60 % between 2007 and 2019, while provincial NOx emissions declined by only 10 %–20 %. Similar patterns were observed in five of the six other cities during the most recent decade. These disproportionate trends are attributed to reductions in primary f-NO emissions, localized dispersion processes, and wind anomalies modulated by Arctic Oscillation. In contrast, all cities exhibited a temporary increase in f-NO during 1998–2007, coinciding with early NOx control measures and consistent with an unintended enhancement of primary f-NO emissions formed within stationary combustion plumes. c-NO was largely insensitive to NOx reduction in most cities (except for Edmonton), with variability governed primarily by neutralization reactions with alkaline aerosols rather than by the availability of gaseous HNO3. These findings provide insight into the weak or absent response of f-NO to NOx emission reductions observed globally, particularly in cold-climate regions.
- Article
(7305 KB) - Full-text XML
-
Supplement
(1180 KB) - BibTeX
- EndNote


The works published in this journal are distributed under the Creative Commons Attribution 4.0 License. This license does not affect the Crown copyright work, which is re-usable under the Open Government Licence (OGL). The Creative Commons Attribution 4.0 License and the OGL are interoperable and do not conflict with, reduce or limit each other. The co-author Leiming Zhang is an employee of the Canadian Government and therefore claims Crown copyright for the respective contributions.
© Crown copyright 2026
Particulate nitrate (NO) has been a central focus of pollution control strategies in the past several decades due to its impact on air quality, climate, and ecosystem health (Balamurugan et al., 2022; Bell et al., 2007; Chan et al., 2021; Cheng et al., 2024; Dabek-Zlotorzynska et al., Dang et al., 2024; Duce et al., 2008; Font et al., 2024; Harrison et al., 2022; Man et al., 2015; Pullokaran et al., 2024; Squizzato et al., 2018; Sun et al., 2025; Thunis et al., 2021; Wang et al., 2020; Zaveri et al., 2021; Zhai et al., 2021; Zhang et al., 2008; Zhou et al., 2022). NO impacts air quality because it is a major chemical component of particulate matter, particularly fine particles. Besides, photolysis of NO produces highly reactive oxidants, such as hydroxyl radicals, HOCl, and Cl2, thereby enhancing atmospheric oxidation capacity (Chen et al., 2025; Gen et al., 2022; Peng et al., 2022). NO contributes to climatic effects directly through radiative forcing and indirectly through increasing cloud condensation nuclei (Drugé et al., 2019; Zaveri et al., 2021). For instance, a modeling study showed that nitrate aerosols contributed significantly to shortwave radiative cooling, reaching up to −5 W m−2 on a regional scale under clear-sky condition and −0.8 W m−2 on global average (Zaveri et al., 2021). NH4NO3 formed from condensation of gaseous species of NH3 and HNO3 can rapidly grow to the sizes of cloud condensation nuclei in cold atmospheres (Höpfner et al., 2019; Wang et al., 2022; Zhu et al., 2014). Additionally, NO contributes to atmospheric nitrogen deposition, which has ecosystem implications (Bose et al., 2018; Iizuka et al., 2025), and it can even undergo long-range transport in the atmosphere and eventually deposit into oceans or remote continental regions (Iizuka et al., 2025; Jonson et al., 2022; Qi et al., 2018).
Given the significant reductions of SO2 emissions worldwide in the past four decades, the impacts of NO on air quality, climate, and ecosystem health have garnered increasing attention (Aas et al., 2019; Feng et al., 2020; Hand et al., 2024; Sun et al., 2018; Velazquez-Garcia et al., 2023; Wang et al., 2021; Zhai et al., 2021). Unlike sulfate (SO), which predominantly exists in fine particulate matter (PM2.5), NO exists in both fine- and coarse-mode particles (referred to as f-NO and c-NO, respectively). As a semi-volatile substance, the fine and coarse fractions of NO vary with season and location (Peng et al., 2024; Yao and Zhang, 2012a, b; Zhang et al., 2008) because its volatility and partitioning with its gaseous precursors are influenced by ambient meteorological and chemical conditions, including temperature (T), relative humidity (RH), and mixing ratios of HNO3 and NH3 (Guo et al., 2016; Huo et al., 2025; Seinfeld and Pandis, 2016; Yao et al., 2003). This complicates the response of f-NO and c-NO to changes in NOx emissions (Balamurugan et al., 2022; Chan et al., 2021; Huo et al., 2025; Thunis et al., 2021; Zhai et al., 2021). Additionally, reduced NOx emissions may enhance the formation of N2O5 at nighttime, a product that can form f-NO through secondary aerosol formation, thereby further influencing the response of f-NO to emission reductions (Fan et al., 2020; Shah et al., 2018; Wang et al., 2023; Ward et al., 2025; Yan et al., 2023; Zhou et al., 2022). It has been reported that f-NO can form from condensable species in fresh stationary combustion plumes, followed by dispersion and evaporation under freezing ambient conditions (Environmental Protection Agency, 2017; Shen et al., 2022; Xiao et al., 2025; Yang et al., 2024). This mechanism has been largely overlooked in studies examining the response of NO to NOx emission reductions, particularly in regions with prolonged cold seasons.
Canada is a nation experiencing long cold winters. Higher concentrations of f-NO were predominantly observed during cold winter seasons, except during large-scale wildfire events mostly occurring in warm seasons (Bari and Kindzierski, 2016a, b; Dabek-Zlotorzynska et al., 2011; Edgerton et al., 2020; Jeong et al., 2011; Wang et al., 2021). The contributions of primary and/or secondary sources to the elevated f-NO concentrations in Canadian cold atmospheres remain poorly understood. The primary emissions of f-NO likely arise from two major processes: (i) the rapid formation of f-NO through reactions between HNO3gas and NH3gas within the first few seconds after combustion plumes exit the stack outlet (or vehicle exhaust pipes) and undergo cooling; and (ii) the formation of f-NO via the reaction 2NO2 + H2O → HNO3 + HNO2 within droplets produced in fresh cooling combustion plumes, followed by NH3gas neutralization before these droplets evaporate into ambient aerosols. Note that the fresh plumes contain extremely high concentrations of various air pollutants, enabling the occurrence of the above-mentioned reactions (Seinfeld and Pandis, 2016; Zhang et al., 2021, 2023).
The aforementioned knowledge gap hinders our understanding of how changes in primary f-NO emissions influence the annual-scale response of f-NO to NOx emission reductions. This gap appears to be global rather than unique to Canada, as indicated by the brief review of particulate NO trends and their responses to NOx emission reductions summarized in Sect. S1 in the Supplement. Two key points emerge. (1) The limited number of trend studies on particulate NO across Canada, including f-NO and total NO (= f-NO + c-NO) in suspended particles, suggest that long-term changes are neither spatially uniform nor monotonic. (2) The non-linear and sometimes counterintuitive response of particulate NO to NOx emission controls has been widely reported in the United States, Europe, and China, yet the underlying drivers remain insufficiently constrained. Together, these cross-regional comparisons motivate a Canada-focused synthesis that explicitly evaluates the non-linear influences of co-evolving precursor emissions, gas–particle partitioning, and meteorological variability in interpreting long-term f-NO trends.
Additionally, significant decreases in NOx emissions across Canada mainly occurred between 1998 and 2008, with slight time shifting across different provinces (ECCC, 2021). PM2.5 speciation data since 2003 alone may not fully elucidate the response of NO to reduced NOx emissions. Fortunately, both f-NO and c-NO data are available from the National Air Pollution Surveillance (NAPS) at 12 urban sites (Dabek-Zlotorzynska et al., 2011; Dabek-Zlotorzynska et al., 2019). Seven of these 12 sites have integrated measurements of particulate chemical components spanning 1–3 decades, enabling the examination of long-term trends in f-NO and c-NO in Canadian urban atmospheres and their responses to reduced NOx emissions.
In this study we investigated long-term trends in the annual average mass concentrations of f-NO and c-NO in Canadian urban atmospheres, with a particular focus on the responses of f-NO and c-NO to NOx emission reductions since 1990 and the associated mechanisms. The analyses are structured into three major parts: Part 1 examines the long-term trends of f-NO and c-NO, firstly in Edmonton (Sect. 3.1) and then extended the other six cities (Sect. 3.2 and 3.3); Part 2 investigates the key factors influencing f-NO levels in Edmonton (Sect. 3.4) and the role of primary f-NO emissions in shaping these trends (Sect. 3.5); and Part 3 provides a comprehensive assessment of uncertainties associated with f-NO and their potential impact on the observed trends (Sect. 3.6). Finally, a summary of the major findings and potential implications are presented in Sect. 4.
2.1 Monitoring sites and data sources
The present study utilized long-term data monitored at two urban sites in Edmonton (S-90132, Latitude: 53.486° N, Longitude: 113.465° W; and S-90130, Latitude: 53.544° N, Longitude: 113.499° W), as well as one urban site in each of the other six cities, including Winnipeg (49.898° N, 97.147° W), Victoria (48.442° N, 123.363° W), Vancouver (49.281° N, 122.849° W), Montreal (45.543° N, 73.572° W), Quebec City (46.821° N, 71.221° W), and Hamilton (43.258° N, 79.862° W) (Figs. S1 and S2). The first four cities are in western Canada with Edmonton in the province of Alberta, Winnipeg in the province of Manitoba, and Victoria and Vancouver in the province of British Columbia. The other three cities are in eastern Canada with Montreal and Quebec City in the province of Quebec and Hamilton in the province of Ontario.
In Edmonton, at the S-90132 site speciation PM2.5 samplers have been used since 2007 to measure mass concentrations of PM2.5, ionic concentrations in PM2.5, and the levels of acidic and alkaline gases, with 24 h integrated sampling occurring one in every 3 d (Bari and Kindzierski, 2016a, b). At the S-90130 site, ionic species, including NO, SO, NH, Na+, and various elements in both PM2.5 and PM2.5–10 were collected using Dichotomous Air Samplers (Thermo, US), with 24 h integrated sampling occurring one in every 6 d during 1986–2005. Since no emission data were available before 1990, only the data after 1990 were included in this study. The ionic data were missing in 2006 at both sites. Note that the identical Dichotomous Air Samplers were also used at S-90132 for several years to collect PM2.5, though no ionic data, for comparison purpose. Both datasets were included because neither alone covers the primary NOx mitigation period in Edmonton.
In Hamilton, an identical speciation sampler has been used since 2013 to measure ionic components in PM2.5 and gases, with sampling occurring one in every 3 d. In this city, only elements have been measured in samples collected by the Dichotomous Air Sampler since then. At the other five urban sites selected for this study, speciation PM2.5 data were either unavailable (Winnipeg and Quebec City) or collected one in every six days after 2005 (Victoria, Vancouver, and Montreal). PM2.5 air samplers (Thermo, US) were used in Victoria and Winnipeg after 2012, and PM2.5 samplers (TISCH, US) were used in Vancouver and Montreal after 2016. Corresponding NO data in PM2.5–10 were not available at these sites since then. In this study, NO in PM2.5 collected by speciation samplers was also referred to as f-NO. The same definition is applied to f-SO and f-NH, which were used to facilitate the analysis of f-NO.
Hourly average mass concentrations of PM2.5 and mixing ratios of NO2 were also routinely measured at each site, except that no NO2 mixing ratios were reported at S-90132. In this case, the values from S-90130 were used in this study. For certain parts of the year at the sites in Victoria and Quebec City, NO2 mixing ratios were also unavailable. In these cases, the mixing ratios of NO2 measured at different sites within a 1–2 km radius in the same city were used to facilitate the analysis. All the data are publicly available through the National Air Pollution Surveillance (NAPS) program network (https://data-donnees.ec.gc.ca/data/air/monitor/national-air-pollution-surveillance-naps-program/?lang=en, last access: 13 November 2025) and summarized in Table S1.
NOx, SO2, and NH3 emissions data at the provincial level in Canada were obtained from https://www.canada.ca/en/environment-climate-change/services/environmental-indicators/air-pollutant-emissions.html (last access: 13 November 2025). The monthly average wind fields were downloaded from https://psl.noaa.gov/data/gridded/data.narr.html (last access: 13 November 2025, Figs. 1 and S1), and the Arctic Oscillation (AO) Indexes were obtained from https://www.ncdc.noaa.gov/teleconnections/ao/ (last access: 13 November 2025, Fig. S1d). Ground-level meteorological data from the airports of these cities were also downloaded from https://www.ncei.noaa.gov/products/land-based-station/integrated-surface-database (last access: 13 November 2025).
It should be noted that existing techniques for measuring ambient HNO3gas are subject to certain artifacts. Specifically, the Na2CO3-coated denuder used in speciation samplers is designed to remove acidic gases upstream of PM2.5 collection on a Teflon filter, thereby minimizing positive artifacts in the collected PM2.5 (Dabek-Zlotorzynska et al., 2011, 2019). However, measurements obtained using the denuder technique do not exclusively represent HNO3gas. Instead, they include HNO3gas, N2O5gas, and other acidic gases that react with Na2CO3 to form NaNO3. Consequently, the reported concentrations reflect an upper bound of (HNO3gas + N2O5gas). To avoid ambiguity, the measured values are denoted as HNO rather than HNO3gas throughout the following discussion. Importantly, this measurement uncertainty does not materially affect the conclusions of the present study, as HNO concentrations remain substantially lower than the corresponding particulate nitrate levels during the high-nitrate winter periods examined here (see Sect. 3.4). Nevertheless, the upper-bound nature of HNO may introduce bias in gas–particle equilibrium analyses, particularly during winter nighttime high-concentration episodes, when the true HNO3gas mixing ratio may be considerably lower than HNO due to a potentially substantial contribution from N2O5gas.
2.2 Statistical analysis
Annual average mass concentrations of f-NO and c-NO were calculated from all available data in each calendar year. However, data loss was common in each city and year despite sampling occurring one in every three or 6 d. To minimize uncertainty from data loss and ensure sufficient data for trend analysis, data for trend analysis were excluded for any year when measurements for two consecutive months were unavailable. To analyze the time series of the annual average mass concentrations of each species, the Mann–Kendall (M–K) analysis was employed. The qualitative trend results determined by the M–K method include: (i) an increasing/decreasing trend with a P value of < 0.05, (ii) a probable increasing/decreasing trend with a P value between 0.05 and 0.1, (iii) a stable trend with a P value > 0.1, as well as a ratio of < 1.0 between the standard deviation and the mean of the dataset, and (iv) a no trend with a P > 0.1 and other conditions (Lin et al., 2022).
To quantify the overall effect of climate anomalies on the annual average f-NO between a pair of two years, our recently developed identical-percentile regression analysis was used (Lin et al., 2022; Yao and Zhang, 2024). In this method, the data sizes of the paired 2-year should be the same (e.g., with the same time resolution and filling up all the missing data). The two sets of data, originally in time series, are sorted separately from the smallest to the largest to generate two percentile-based data arrays, which were then used for regression analysis with the intercept being set to be zero. The regression analysis can also be conducted using data in any particular percentile range for exploring different research targets. If the data sizes of the paired two-year are different, the one with a larger size can be modified to match the one with a smaller size using the method presented by Lin et al. (2022) and Yao and Zhang (2024) before applying the regression analysis described above. Moreover, a Random Forest (RF) model was employed to evaluate the relative importance of meteorological and seasonal timing variables in driving f-NO formation (Sect. S2 in the Supplement), and the Flexible 0-D Atmospheric Model (F0AM) was applied to simulate secondary production of f-NO (Sect. S3 in the Supplement).
3.1 Complexity of particulate nitrate trends in urban atmosphere of Edmonton
As mentioned in Sect. 2.1, two sites (S-90130 and S-90132) in Edmonton were selected for investigation due to the discontinued data coverage at both sites. Annual average mass concentrations of f-NO at S-90130 from 1990 to 2005 and at S-90132 from 2007 to 2019 were analyzed to illustrate the complexity of particulate nitrate trends in the urban atmosphere (Fig. 1a). As mentioned in Sect. 2.1, data in 2006 were missing at both sites. For comparison, annual average mass concentrations of c-NO at S-90130 from 1990 to 2005 are also shown in Fig. 1a and those of f-NH and f-SO at S-90130 and S-90132 from 1990 to 2019 are shown in Fig. S3. To facilitate analysis, annual average mixing ratios of NO2 at S-90130 from 1995 to 2019 are shown in Fig. 1b, and annual provincial total emissions of NOx, SO2, and NH3 in Alberta are also presented (Figs. 1b, S3a and S3c, respectively). Correlation analyses between f-NO (or c-NO) and provincial total emissions of NOx in 1990–2005 and between f-SO and provincial total emissions of SO2 in 1990–2019 are conducted (Figs. 1c and S3b, respectively).
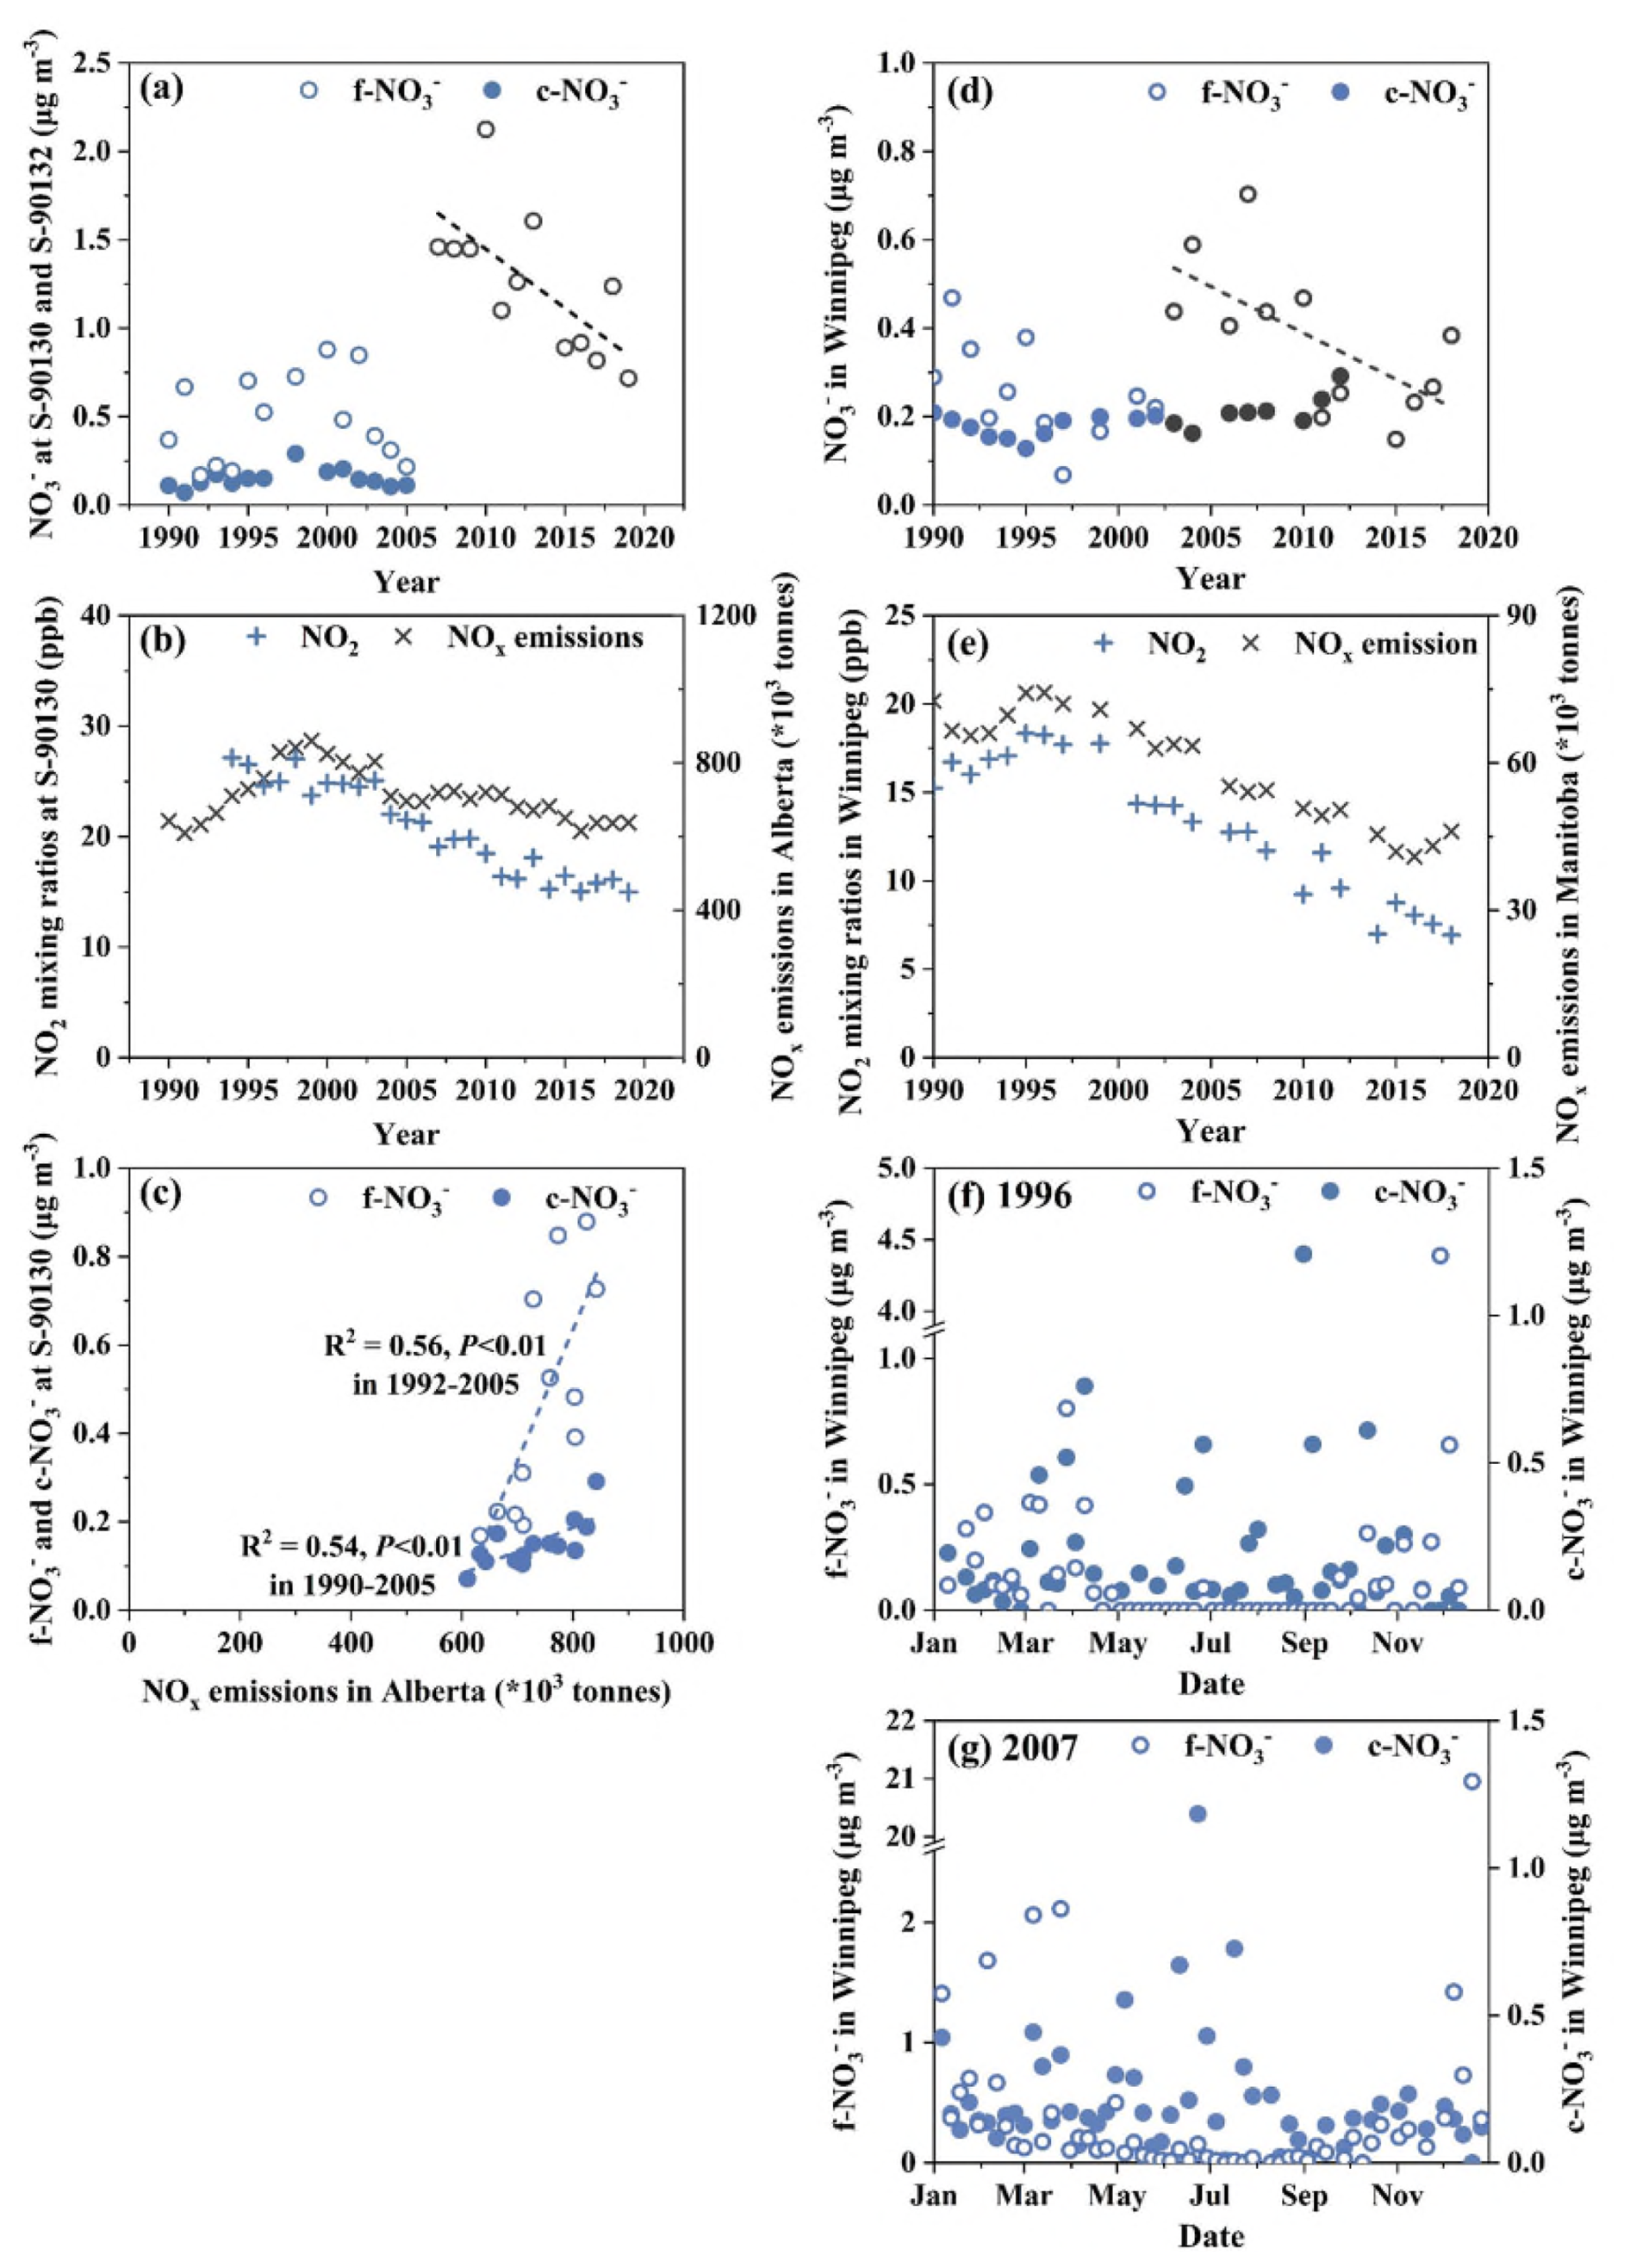
Figure 1(a) Annual variations of mass concentrations of f-NO and c-NO in Edmonton, (b) annual variations of mixing ratio of NO2 in Edmonton and provincial total NOx emissions, (c) f-NO and c-NO at S-90130 vs. NOx emissions, (d) f-NO and c-NO in Winnipeg, (e) NO2 mixing ratio in Winnipeg and provincial total NOx emissions, and time series of 24 h integrated f-NO and c-NO in 1996 (f) and 2007 (g) at a time resolution of one sample in every 3 d. Blue and black markers in panel (a) represent data obtained at S-90130 and S-90132 in Edmonton, respectively. Blue and black markers in panel (d) represent data points in Winnipeg before and after 2003, respectively. Dashed lines in panel (c) denote least-squares regression fits for f-NO and c-NO.
At S-90130, annual average f-NO and c-NO was 0.48 ± 0.25 µg m−3 (average ± standard deviation) and 0.15 ± 0.05 µg m−3, respectively, during 1990–2005. No trend or stable trend was found for these species (P > 0.10), likely due to a bell-shaped change in provincial total NOx emissions from 1990 to 2005. In fact, a significant correlation was found between annual average c-NO and provincial total NOx emissions during 1990–2005 (P < 0.01). However, a significant correlation between annual average f-NO and provincial NOx emissions was obtained only during 1992–2005 (P < 0.01), but not for the entire period during 1990–2005 with the values in 1990–1991 being substantially deviating from the regression curve. Such a deviation is yet to be explained. Notably, f-NO and c-NO were not significantly correlated in any individual year during 1990–2005 (R2 < 0.1; P > 0.05). The same pattern was observed at the other six sites analyzed in this study. The lack of correlation between f-NO and c-NO is discussed in detail in Sect. 3.2.
At S-90132, annual average f-NO was 1.3 ± 0.40 µg m−3 during 2007–2019. f-NO exhibited a decreasing trend (P < 0.01), with a Sen's Slope of 0.063 µg m−3 yr−1, resulting in an overall decrease of approximately 60 % during this period. In comparison, the monitored NO2 mixing ratios at a different site (S-90130) decreased by approximately 20 %, while provincial total NOx emissions in Alberta were reduced by only ∼ 10 % during the same period. Such disproportionate decreases were also identified for both f-NO and c-NO3 at S-90130 in the selected period of 1997–2005, with a ∼ 60 % decrease in their annual average concentrations compared to a ∼ 20 % decrease in both the NO2 mixing ratios and provincial NOx total emissions. Notably, NO2 mixing ratios at the urban site were significantly correlated with Alberta's total provincial NOx emissions, with R2 = 0.81 over 1997–2019 (P < 0.01) and a slightly weaker correlation (R2 = 0.57) over the shorter period of 2007–2019 (P < 0.01). These results indicate broadly consistent NOx mitigation signals at both the provincial and city scales. Thus, the disproportionate large decrease in the annual average f-NO at S-90132 relative to the reduction in provincial NOx emissions is analyzed below by considering major driving factors (Sect. 3.4), primary and secondary sources (Sect. 3.5), and potential uncertainties in the data of the generated annual average f-NO (Sect. 3.6). It should be noted that the annual average f-NO measured at S-90132 in 2007–2019 were significantly higher than those recorded at S-90130 in 1990–2005 (P < 0.01), which could be attributed to an unexpected mitigation effect, as analyzed in Sect. 3.3 below.
Unlike f-NO, annual average f-SO exhibited a relatively smooth decreasing trend (P < 0.01), with a Sen's slope of 0.029 µg m−3 yr−1 if combining data at S-90130 from 1990 to 2005 and at S-90132 from 2007 to 2019 together (Fig. S3a). This trend was mostly consistent with a 0.021 µg m−3 yr−1 decrease in the provincial total SO2 emissions from 1990 to 2019. Additionally, a moderately strong correlation was found between the annual average f-SO and the provincial total SO2 emissions over the three decades (P < 0.01, Fig. S3b). The f-SO trend in the urban atmosphere reflects the mitigation effect, as has also been reported for rural atmospheres in Canada (Cheng and Zhang, 2017; Feng et al., 2020). f-SO, typically formed through in-cloud aqueous reactions and with non-volatile properties, is generally associated with regional sources, and thus tends to be spatially homogeneously distributed in urban scales (Bell et al., 2007; He et al., 2001; Park et al., 2004). This may explain the much smaller gaps in the annual average f-SO between the two nearby urban sites, as compared to the case of f-NO.
Annual average f-NH exhibited a decreasing trend (P < 0.05) if combining data at S-90130 from 1990 to 2005 and at S-90132 from 2007 to 2019 (Fig. S3c). However, the trend was stable at both sites during the two separate periods (P > 0.10). From 1990 to 2019, the provincial total NH3 emissions increased by approximately 40 % (Fig. S3c). The phenomenon of the decoupled trends between f-NH and NH3 emissions widely occurred in Canada and the U.S. in the recent decades, as reported in Yao and Zhang (2019). This is because the level of f-NH was mainly controlled by those of SO and NO through neutralization reactions, especially under NH3-rich conditions (Bari and Kindzierski, 2016b; Dabek-Zlotorzynska et al., 2011; Edgerton et al., 2020). The equivalent ratios of NH to (SO + NO) in two selected years support this hypothesis (Fig. S4).
3.2 Trends of f-NO and c-NO in urban atmospheres of Winnipeg – an inland city in western Canada
The annual average f-NO in Winnipeg varied within a range of 0.07–0.70 µg m−3, with a long-term average of 0.32 ± 0.15 µg m−3 from 1990 to 2018. A stable trend in annual average f-NO was identified by the M–K method (P = 0.51; Fig. 1d). The annual average c-NO varied within an even smaller range of 0.13–0.29 µg m−3, with a long-term average of 0.19 ± 0.04 µg m−3 during 1990–2012. A probable increasing trend in annual average c-NO was identified (P = 0.06). Over the same period, both the annual average mixing ratio of NO2 at this site and provincial total NOx emissions in Manitoba exhibited decreasing trends (P < 0.01) (Fig. 1e), and they correlated with each other strongly (R2 = 0.90, P < 0.01). The absence of a corresponding decrease in f-NO concentration compared to NOx emissions is likely attributable to enhanced primary emissions of f-NO-containing aerosols, as discussed in Sect. 3.3 and 3.5 below. This is clearly supported by the following evidence: from 1999 to 2004, annual average f-NO increased by approximately 200 %, even as provincial NOx emissions and NO2 mixing ratios declined by about 10 %. Accordingly, the trend in f-NO concentrations was analyzed in two separate periods: 1990–2002 and 2003–2018. The year of 2003 is allocated into the second rather than the first period based on the curve of annual variation shown in Fig. 1d. In the first period (1990–2002), f-NO showed a probable decreasing trend, with a Sen's Slope of 0.017 µg m−3 yr−1 and a total decline of about 80 %. This sharp decrease cannot be explained by the relatively modest 10 %–20 % reductions in NO2 and NOx during the same period, suggesting that highly localized factors and/or uncertainties caused by coarse resolution data (1 in every 6 d) were likely the dominant contributors. The related uncertainty analysis is presented in Sect. 3.6 below. In the second period (2003–2018), f-NO exhibited a decreasing trend with a Sen's Slope of 0.018 µg m−3 yr−1, amounting to an overall reduction of approximately 70 %, which also exceeded the ∼ 50 % reduction in NO2 mixing ratios at the same site and the ∼ 30 % reduction in provincial NOx emissions. The disproportionate trends between f-NO and NOx emissions observed in Winnipeg are similar to the case in Edmonton discussed above.
When the time series of daily concentrations of f-NO and c-NO were examined for a low-concentration year (1996) and a high-concentration year (2007) (Fig. 1f–g), elevated concentrations of f-NO were predominantly observed during the cold months. High concentrations of f-NO were likely from primary sources, as discussed in Sect. 3.5 below, considering the similar climate in inland western Canada. This, however, needs to be confirmed using HNO data, which are not available at this site. In contrast, elevated concentrations of c-NO typically occurred during warmer months. Again, no significant correlation was observed between f-NO and c-NO in any year (R2 < 0.1, P > 0.05). Given the probable increasing trend in annual average c-NO despite decreasing NOx emissions at both city and provincial scales, and considering the seasonal pattern of elevated levels, it is likely that the trend in c-NO was governed by the availability of alkali aerosols associated with suspended road dust and road-salt particles capable of neutralizing HNO, rather than by changes in HNO itself. As further illustrated in Sect. 3.4 below for the case of Edmonton, stagnant winter meteorological conditions did not coincide with elevated HNO concentrations, likely due to the accompanying sub-freezing temperatures. Moreover, stagnant and freezing conditions are not conducive to the suspension of road dust and road-salt particles during winter. This interpretation is also supported by findings reported in literature at rural sites in Canada (Cheng and Zhang, 2017; Feng et al., 2020) and urban and rural sites in the U.S. (Sickles and Shadwick, 2015) and U.K. (Tang et al., 2018), where positive correlations between HNO and NO2 have been observed, suggesting that a reduction in NOx would not typically lead to enhanced HNO formation.
3.3 Time window for unintended effects of NOx mitigation on f-NO aerosols in Canadian urban atmospheres and associated shaped trends of f-NO and c-NO
Long-term trends of f-NO could be distorted by unintentionally increased f-NO primary emissions resulted from certain NOx mitigation measures. Such phenomena were repeatedly observed in urban atmospheres across Canada during a consistent time window from approximately 1998 to 2007, as illustrated in Figs. 1 and S5 as well as those aforementioned in Edmonton and Winnipeg. During this period, similar NOx mitigation actions were taken in both Canada and the U.S., regulated by the Canada – U.S. Air Quality Agreement signed in 1991 and further expanded in 2000. Although mitigation policies were likely implemented independently in each province in Canada, and the exact timing may have varied slightly, a consistent pattern emerged. For example, in the province of Quebec, the annual average f-NO increased by approximately 150 % in Quebec City from 1998 to 2003 and by around 300 % in Montreal from 1998 to 2002. During the same period, annual average mixing ratio of NO2 decreased by approximately 10 % in both cities, while provincial total NOx emissions remained nearly unchanged. In the province of Ontario, annual average f-NO in Hamilton remained relatively low at 0.69 ± 0.09 µg m−3 during 1995–1999, but rose sharply to 1.6 µg m−3 in 2001, with a notable dip to 0.85 µg m−3 in 2002 possibly due to climate anomaly, bounced back to 1.7 µg m−3 in 2004 and stabilized at 1.6 µg m−3 in 2005. During the period from 1999–2005, both observed NO2 mixing ratios in Hamilton and provincial NOx emissions in Ontario began to decline by 20 %–30 %. A similar pattern was also found in western coastal urban areas such as Victoria and Vancouver, both located in British Columbia, between 1998 and 2002 (Fig. 2), where annual average f-NO increased by approximately 100 % while NO2 mixing ratios and provincial NOx emissions declined by 10 %–30 %. These widespread, disproportionate trends between f-NO and NOx emissions across multiple cities strongly suggest that, during this early control window, NOx mitigation measures may have been accompanied by an unintended increase in primary f-NO emissions, potentially associated with condensable particulate matter (CPM) and/or by-products of emission control technologies. However, no direct facility measurement data were made 20-year ago to verify this hypothesis. In fact, the USEPA only issued the method protocol for determining condensable particulate matter in 2017. Evidence from recent studies in developing countries further indicates that early-stage NOx controls (e.g., NH3-SCR operated at > 300 °C) can be susceptible to imperfect ammonia dosing and the formation of associated by-products (Yang et al., 2016). This provides a plausible mechanistic explanation, although the specific causes in Canada and the United States cannot be definitively determined in the absence of historical CPM measurements. Accordingly, trend analysis of particulate nitrate should treat this period separately, with a demarcation line drawn at approximately 2002 or later.
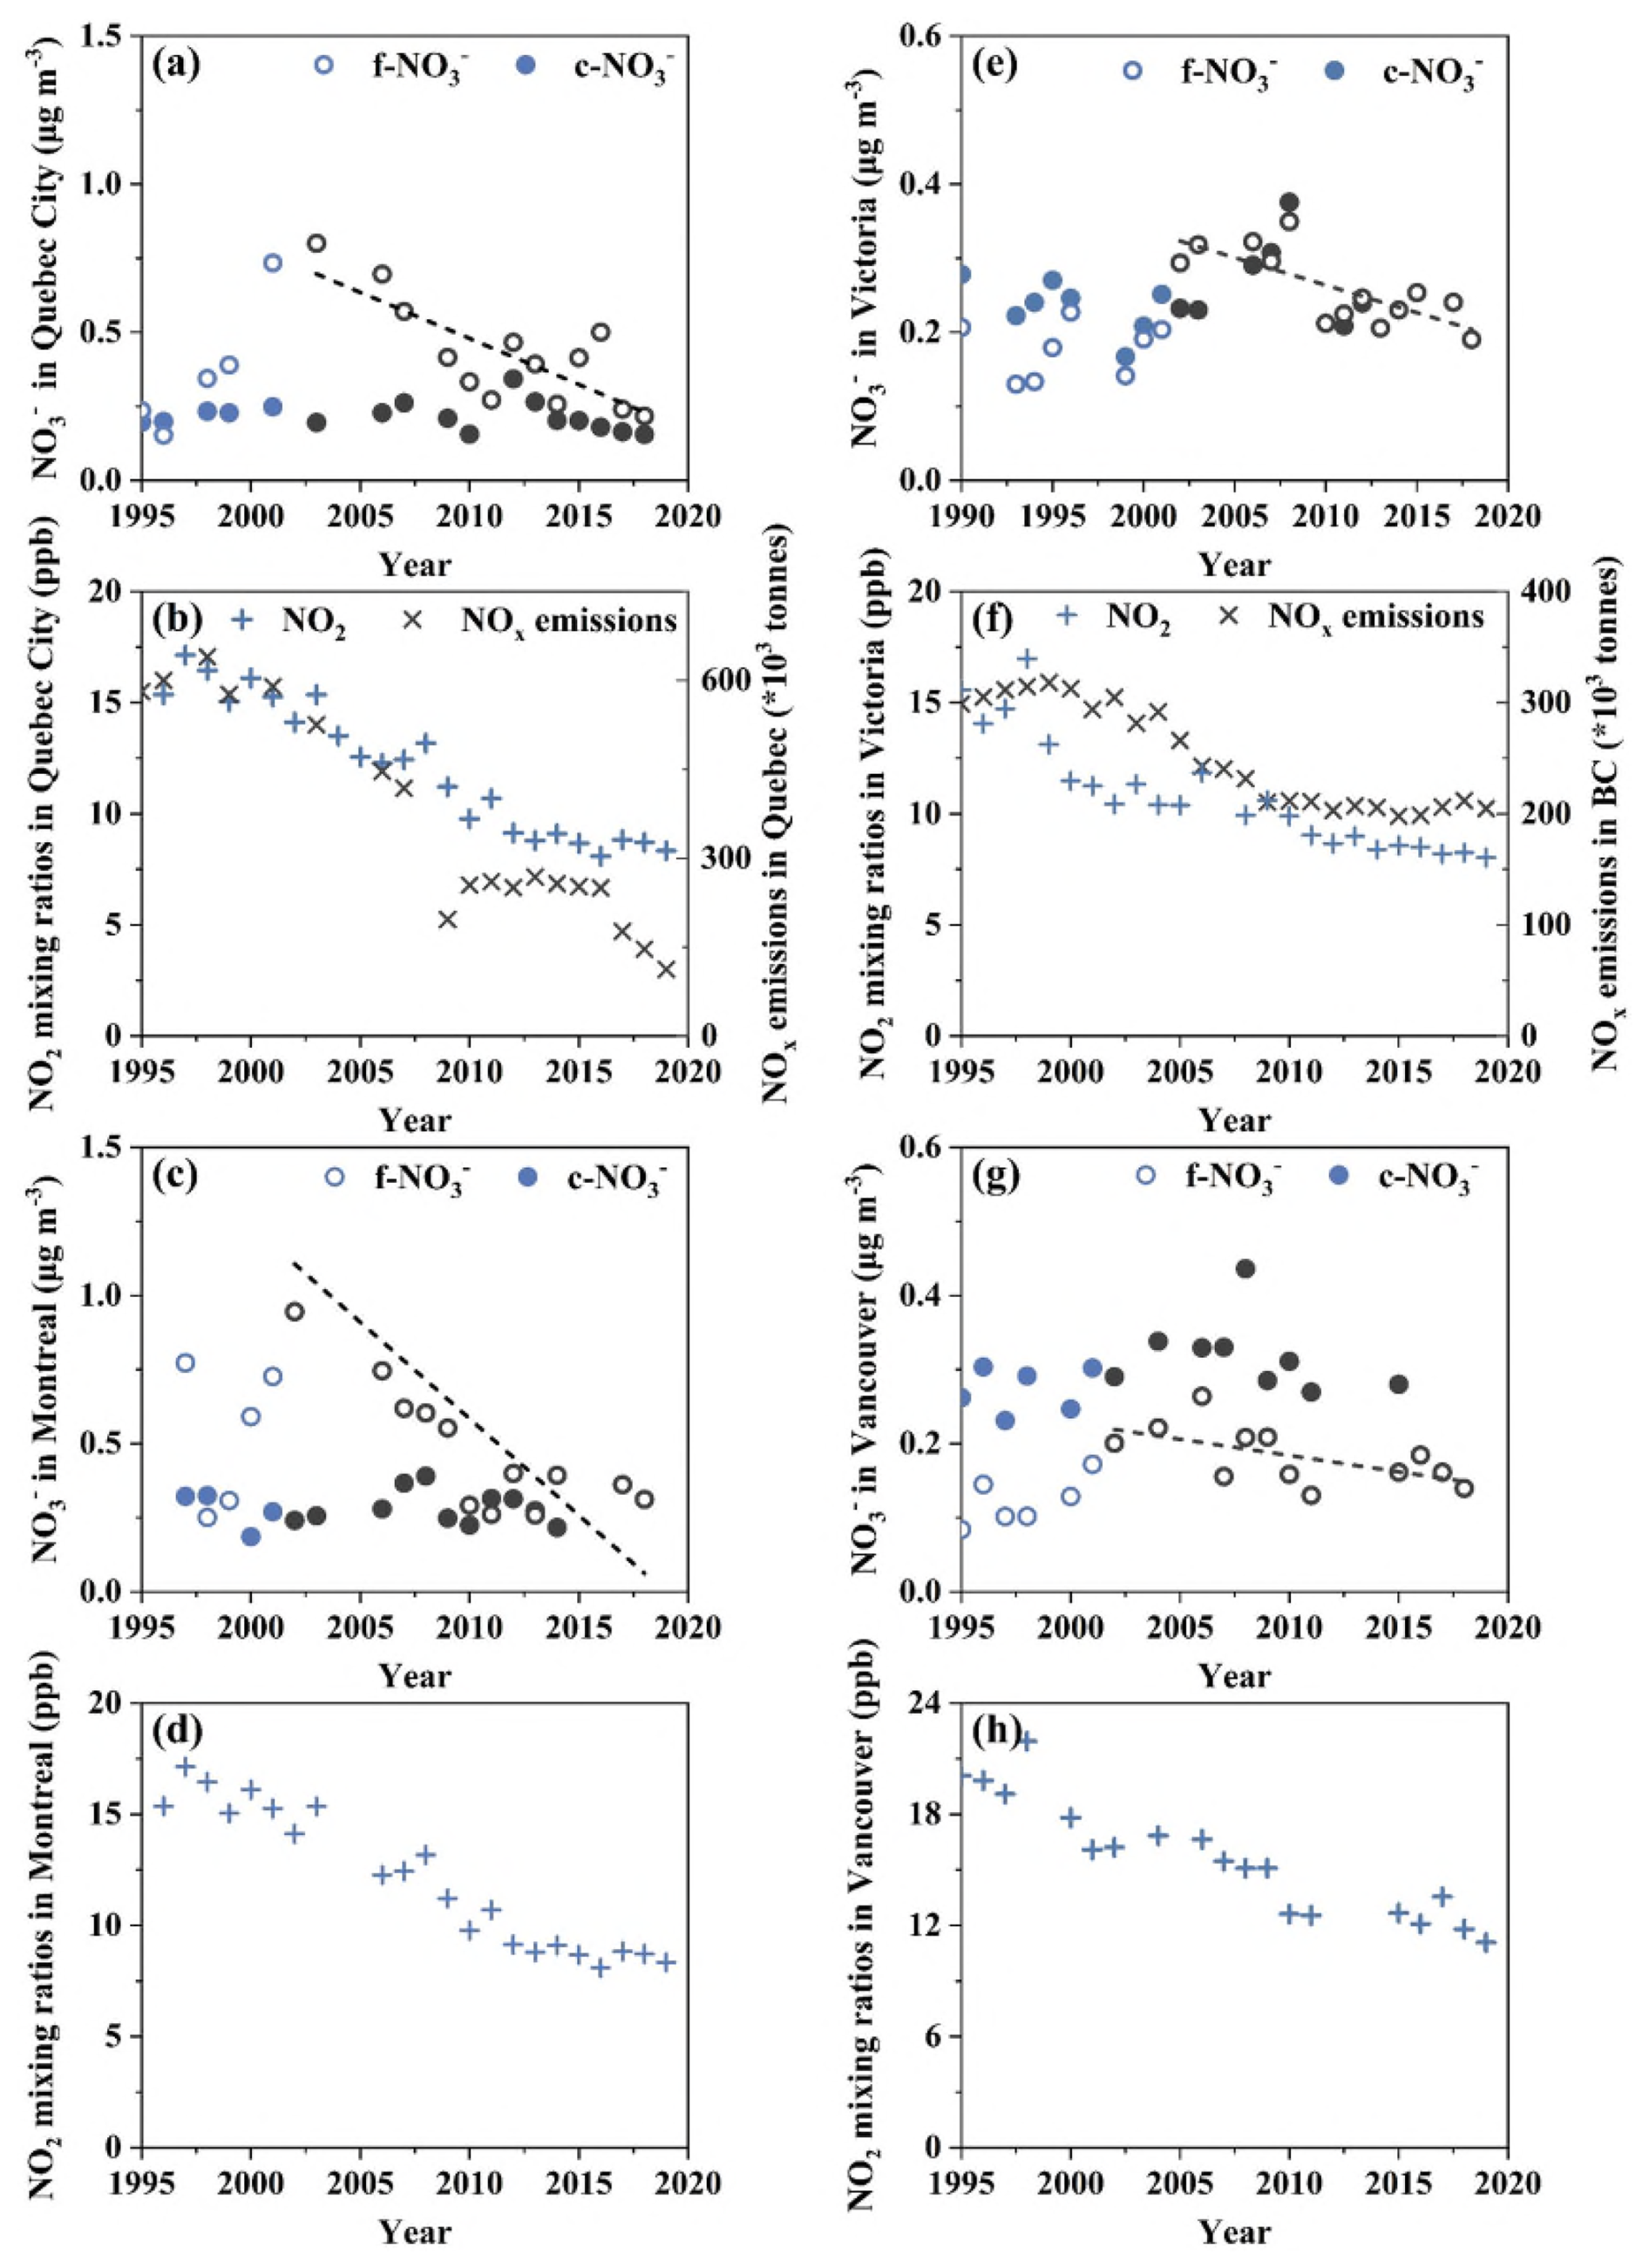
Figure 2(a) Annual variations of mass concentrations of f-NO and c-NO in Quebec City, (b) annual variations of mixing ratio of NO2 in Quebec City and provincial total NOx emissions, (c) f-NO and c-NO in Montreal, (d) NO2 mixing ratio in Montreal, (e) f-NO and c-NO in Victoria, (f) NO2 mixing ratio in Victoria, (g) f-NO and c-NO in Vancouver, and (h) NO2 mixing ratio in Vancouver. Blue and black markers in panel (a) represent data points before and after 2003, respectively. Blue and black markers in panels (c), (e), and (g) represent data points before and after 2002, respectively.
In contrast to this early-phase behavior, several lines of evidence suggest that primary f-NO emissions have likely declined in recent years. At the national scale, Canada's electricity supply has shifted markedly toward CO2-emission-free sources (now exceeding 80 %), which are also largely free of NOx emissions. This transition should reduce primary nitrate-related emissions from the power sector (Canada Electricity Advisory Council, 2024). In addition, the rapidly increasing share of zero-emission vehicles, accounting for 10.8 % of new vehicle registrations in 2023, is expected to further decrease primary f-NO emissions from the transportation sector (Statistics Canada, 2024). Consistent with these broader trends, observations in Edmonton show that the decline in annual mean f-NO concentrations over the past decade has been substantially larger than the corresponding decrease in NO2. This divergence supports the interpretation that reductions in primary f-NO emissions have likely been an important contributing factor.
Setting the demarcation line at 2003 in Quebec City (noting the substantial data loss in 2002 for this city) and at 2002 in Montreal, the annual average f-NO decreased by more than 70 % over the subsequent 16- or 17-year period, largely agree with the 40 %–60 % reductions in NO2 mixing ratios and provincial NOx emissions during the same period. The slight differences in their decreasing rates could be attributed to unintended changes in primary emissions of f-NO3 aerosols as discussed above, non-linear atmospheric chemistry process involving other chemical species, and data uncertainties, etc. Notably, the annual average c-NO showed no significant trend during these periods in either city, suggesting that c-NO levels may have been more strongly influenced by the presence of alkali aerosols capable of neutralizing HNO rather than by the availability of HNO itself. Data prior to 2002 (Montreal) or 2003 (Quebec City) were insufficient in duration to support robust trend analysis; nevertheless, the influence of unintended mitigation effects during this period was still evident. In comparison, if removing the demarcation line and considering the whole data record together, annual average f-NO would show no clear trend from 1995 to 2018 in Quebec City and a stable trend from 1997 to 2018 in Montreal. Over the full period, annual average f-NO and c-NO were 0.41 ± 0.19 and 0.19 ± 0.05 µg m−3, respectively, in Quebec City and 0.57 ± 0.38 and 0.28 ± 0.06 µg m−3, respectively, in Montreal.
Similarly, if setting a demarcation line at the year of 2002 for Victoria and Vancouver, f-NO would show either a significant decreasing trend or a probable decreasing trend, with a total decrease of around 40 % in both cities from 2002 to 2018. These declines were broadly consistent with the 30 %–40 % decreases in both NO2 mixing ratios and provincial NOx emissions during the same period. From 1990 to 2002, f-NO showed either no trend or a stable trend, which was consistent with the trend in the provincial NOx emissions, but inconsistent with the observed decreasing trend in NO2 mixing ratio during this period. If looking at the full data record of c-NO together (from 1990 to 2012 in Victoria or 2015 in Vancouver), either no trend or a stable trend was identified in either city, regardless of using the full data record or just data after the year 2002. The absence of a clear decreasing trend in c-NO concentration, despite significant NOx emissions, appears to be a common feature across Canadian urban environments. Unlike the other cities aforementioned where annual average concentrations of f-NO were much higher than those of c-NO, in Victoria, annual average concentrations of f-NO and c-NO were similar, oscillating around 0.23 ± 0.06 µg m−3 (1990 to 2018) and 0.25 ± 0.05 µg m−3 (1990 to 2012), respectively. In contrast, annual average concentrations of f-NO (0.16 ± 0.05 µg m−3 in 1990–2018) were significantly smaller than that of c-NO (0.31 ± 0.05 µg m−3 in 1990–2015) (P < 0.01) in Vancouver, and the same conclusion can be generated if only using data in 1990–2015.
In Hamilton, no statistically significant trends were identified for f-NO and c-NO, whether considering the full time series or just the period post-2005. This is somewhat different than the cases in the other cities discussed above, suggesting potentially strong impact of local sources, besides the other main factors discussed above, considering that Hamilton is an industrial city with heavy density of industries. Annual average f-NO and c-NO in this city were 0.88 ± 0.35 and 0.46 ± 0.12 µg m−3, respectively, during the period of 1995 to 2019.
3.4 Key factors influencing annual average f-NO and its trends in Edmonton
To explore key factors influencing the annual average f-NO and its trends in Edmonton, we selected data from two representative years (2010 and 2015) at site S-90132 for comparative analysis. The year 2010 was chosen because in this year abnormally high annual average f-NO was observed compared to all the other years during the period of 2007–2019, suggesting possible impact by climate anomaly in this year. The year 2015 was chosen because in this year annual average f-NO represents the median value of a five-year period of 2015–2019, likely reflecting the average climatic conditions, knowing that the annual average NO2 mixing ratio observed at a nearby site (S-90130) and the provincial total NOx emissions were nearly constant during 2015–2019. From 2010 to 2015, the decrease in NO2 mixing ratios in Edmonton (11 %) was consistent with the decline in Alberta's provincial NOx emissions (10 %). In contrast, the annual mean concentration of f-NO decreased much more sharply (by 58 %), falling from 2.1 µg m−3 in 2010 to 0.89 µg m−3 in 2015.
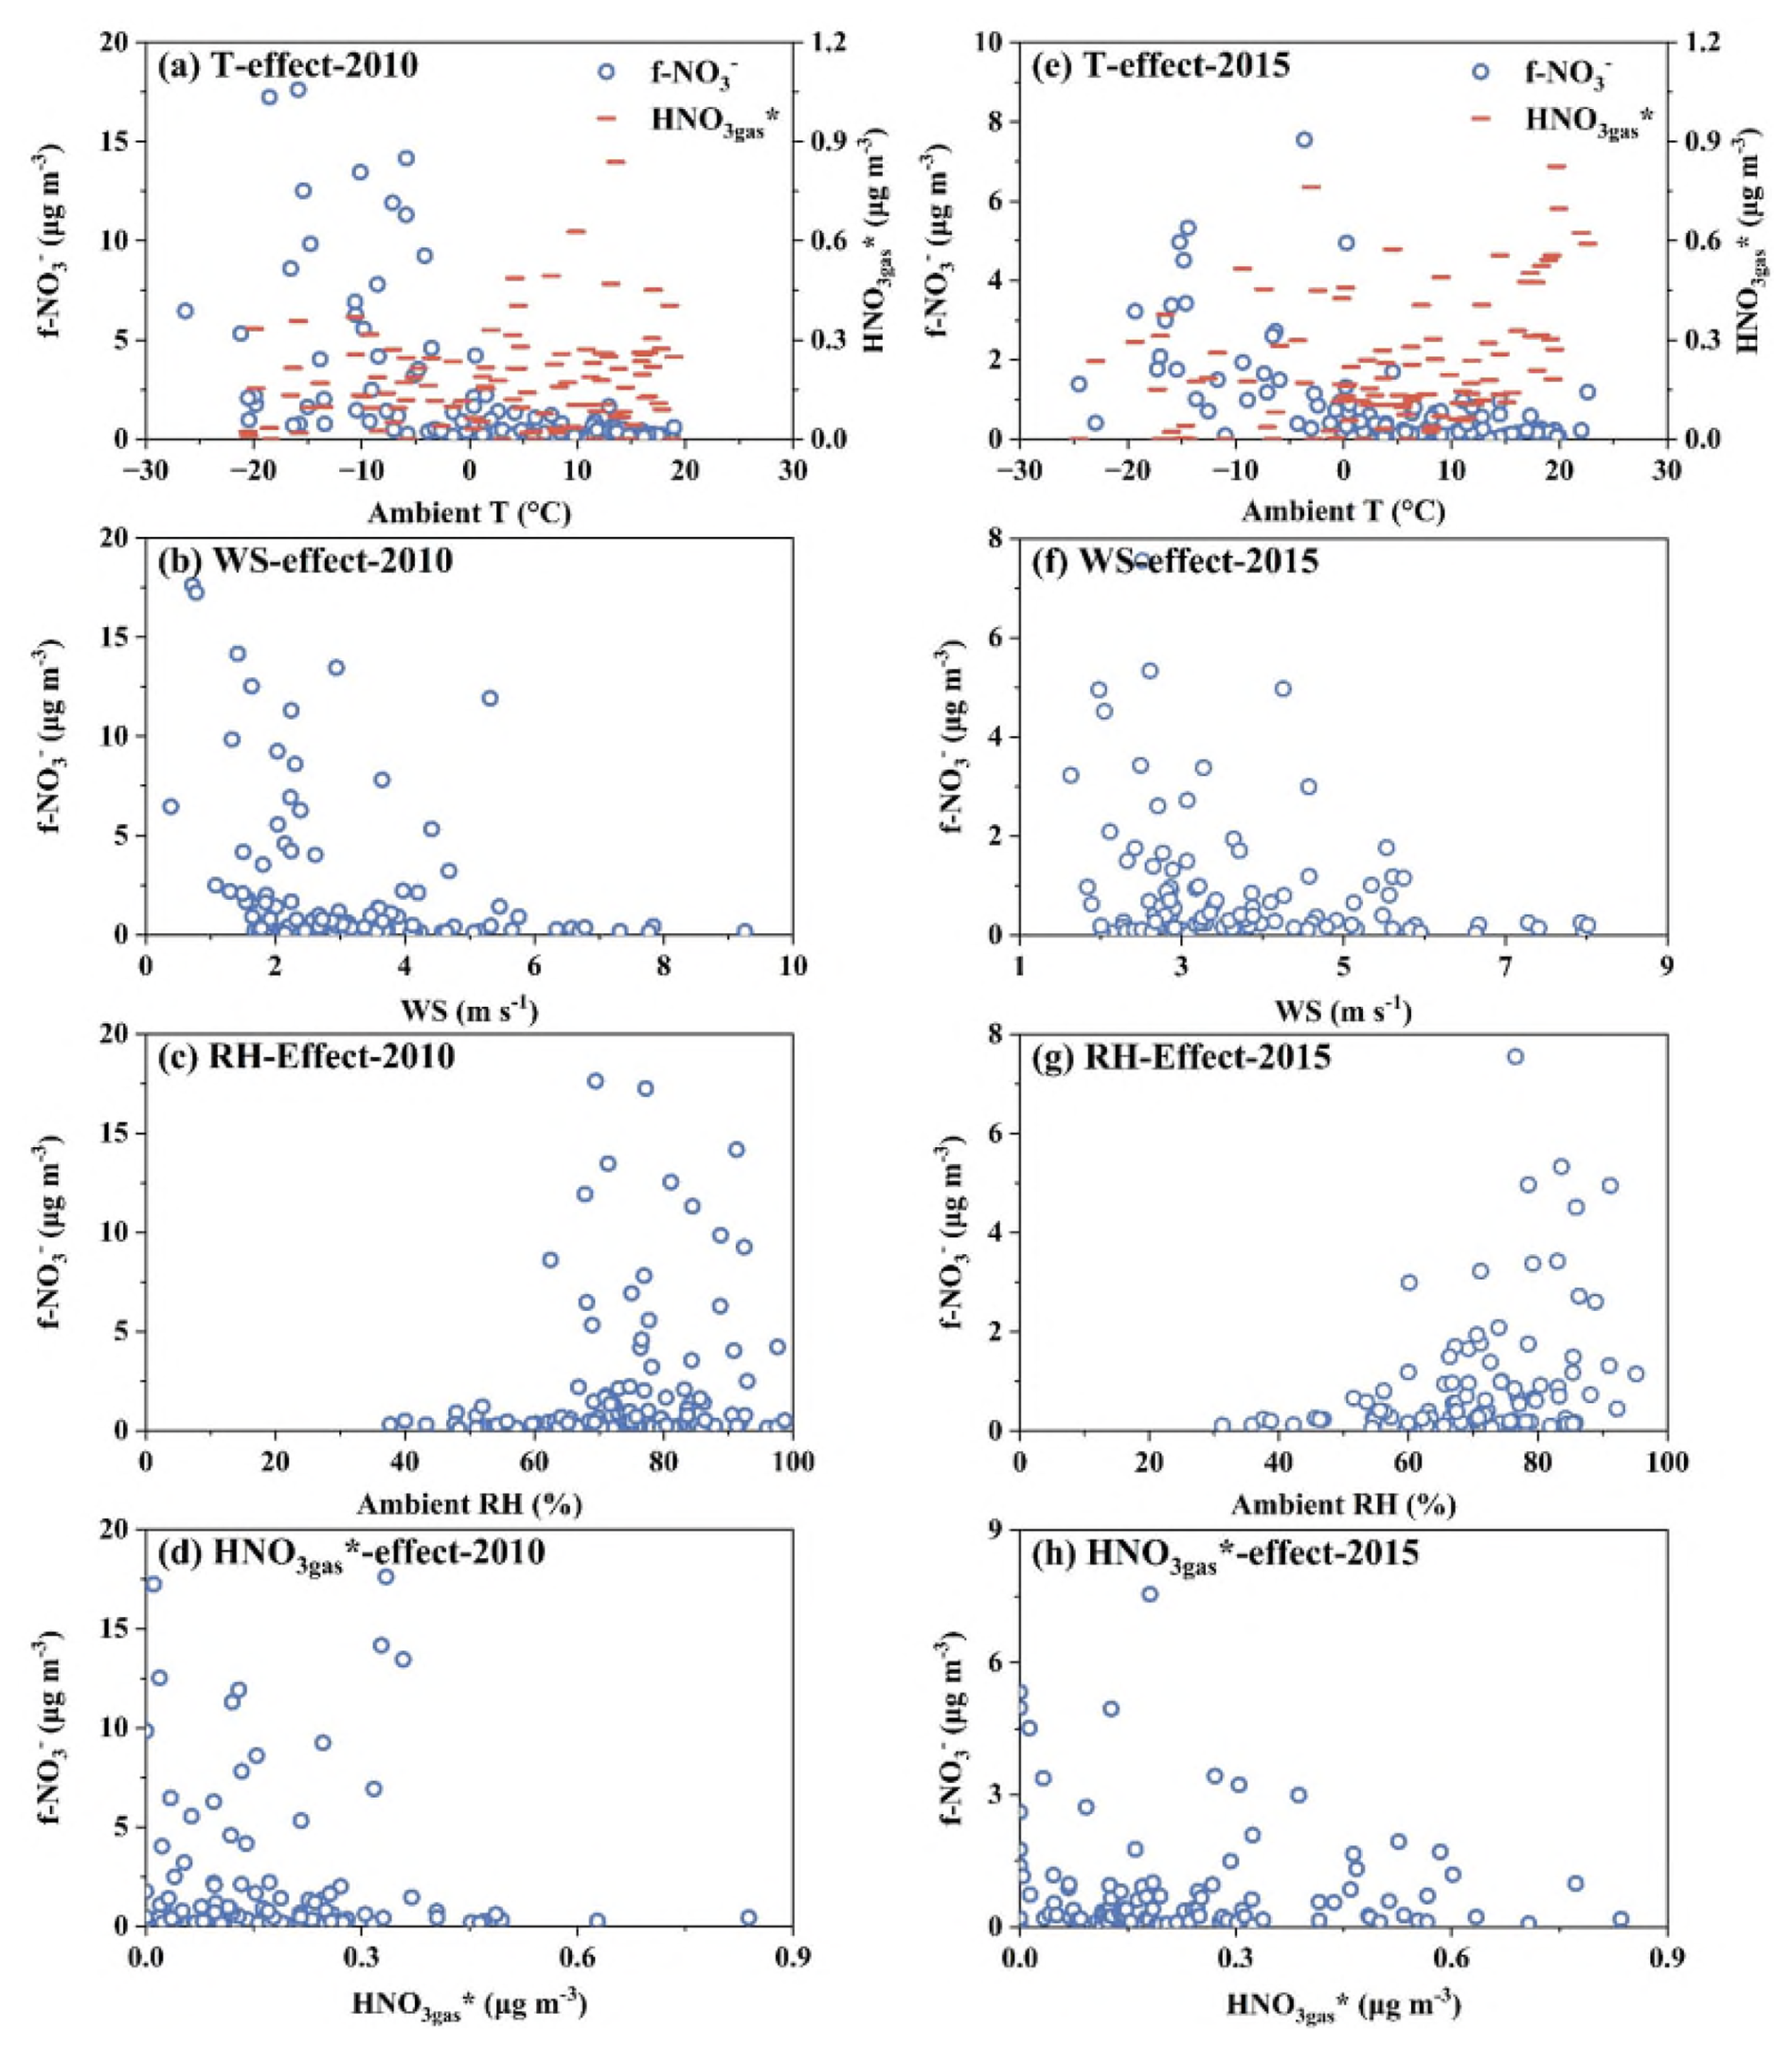
Figure 3Single-factor (T, WS, RH, and HNO) effects on daily f-NO (and HNO in the case of T factor) in 2010 and 2015.
Through the comparative analysis, seasonal variations of f-NO, various single-factor effects on f-NO, and the impact of climate anomalies on f-NO were explored. As shown in Fig. 3a and b, higher concentrations of f-NO were predominantly observed during cold months, including January to March and November to December, in both 2010 and 2015. These higher concentrations during the five cold months contributed to 81 % and 88 % of the annual averages in 2015 and 2010, respectively. Thus, the annual trends in f-NO were mainly determined by higher concentrations of f-NO in cold months in Edmonton. Based on wind fields shown in Figs. S1 and S2, air masses reaching to this site in the cold winter should come from the remote northern areas with low pollution levels due to the strong northwest wind, which should have lowered concentrations of f-NO in the urban atmosphere. Thus, the high concentrations of f-NO observed at this site should be caused by local accumulation under stagnant weather conditions. Therefore, the emissions of f-NO-contained aerosols related to mitigation measures, the precursors and formation pathways of f-NO, and meteorological conditions during the winter period should be considered as key factors determining the annual average f-NO.
We then correlated the 24 h integrated daily concentrations of f-NO with ambient T, wind speed (WS), RH, and HNO to explore various single-factor effects on f-NO (Fig. 3). A demarcation line was observed at −3 °C in 2010 and 0.5 °C in 2015, with substantially lower f-NO concentration at T on the right than left side of the line (Fig. 3a and e). Lower ambient T favored the gas-aerosol partitioning of NH4NO3 in PM2.5 (Seinfeld and Pandis, 2016; Shah et al., 2018). However, lower ambient T also weakened photochemical reactions due to reduced amounts of intermediate volatility organic compounds or semi-volatile organic compounds in the gas phase (McDonald et al., 2018; Wernis et al., 2022). This reduction in photochemical activity subsequently lowered the concentration of HNO to some extent, e.g., the concentrations of HNO observed at T > 20 °C increased by over a factor of four relative to those at T < −10 °C in 2015 as shown in Fig. 3e. The sources of f-NO and its formation pathways during the winter period will be revisited in Sect. 3.5. The causes for the different T values of the demarcation line between 2010 and 2015 are not clear. The concentrations of f-NO decreased with increasing WS due to the dispersion effect, and no elevated concentrations were observed once WS is stronger than 5 m s−1 (Fig. 3b and f). The concentrations of f-NO had little dependence on ambient RH (Fig. 3c and g), e.g., the highest concentrations in both years occurred at RH of 70 %–80 % instead of > 80 %. The lowest concentrations of f-NO appearing at RH < 60 % is because RH < 60 % typically occurred at ambient T greater than 0 °C in Edmonton. In addition, the relative importance of 15 major variables on f-NO concentration was examined using a Random Forest model, as detailed in Sect. S2 in the Supplement. The ambient T ranked as the dominant factor, followed by PM2.5 mass concentration, NO2 mixing ratio, boundary layer height, etc.
It should be noted that gas–particle equilibrium between HNO3–NH3 and submicron NH4NO3 is unlikely to be achieved at temperatures below −10 °C, given the relatively long equilibration timescales. Based on the results of characteristic timescales analysed by Wexler and Seinfeld (1990, 1992) and dynamically simulated by Meng and Seinfeld (1996), particles with diameters of approximately 0.5–0.7 µm generally require hours to approach equilibrium – typically on the order of ∼ 1–6 h with a more conservative upper bound of ∼ 6–20 h. Under such low-temperature conditions, the assumption of instantaneous thermodynamic equilibrium becomes questionable; therefore, equilibrium thermodynamic modelling was not applied here. At even lower temperatures, the equilibration timescale would extend to tens of hours for highly viscous or glassy particles, as suggested by Li and Shiraiwa (2019).
Correlation analysis between simultaneously measured f-NO and HNO showed that f-NO concentrations higher than 4 µg m−3 occurred when HNO concentrations were lower than 0.4 µg m−3 in both years (Fig. 3d and h). Thus, the high f-NO3 concentrations were not likely caused from the secondary formation of f-NO from HNO in ambient air, as further discussed in Sect. 3.5 below. Considering that the concentrations of NH3gas (data not shown here) were generally more than one order of magnitude higher than those of HNO, NH3gas should not be the limiting factor for f-NO formation, and was therefore excluded from further analysis below.
Climate anomaly can have significant impacts on air pollution (Andersson et al., 2007; Wetherbee and Mast, 2016; Yao and Zhang, 2020). One of the factors related to climate anomaly in winter Canadian urban atmospheres is AO (Burakowski et al., 2008; Higgins et al., 2002; Yao and Zhang, 2020). Other climate drivers, such as ENSO, Arctic sea-ice variability, and long-term warming, may influence f-NO during the warming season. However, their impact on the annual trend is likely negligible, as it is dominated by wintertime f-NO. As shown in Figs. S1 and S2, the mean wind speed from January to March across Alberta decreased significantly in 2010 compared to the other years. The AO index during the winter period in 2010 was in the most negative phase observed in the last four decades (Fig. S1d). Typically, the belt of strong winds circulating around 55° N latitude weakens during such a phase, which allows colder Arctic air masses to penetrate further south into the mid-latitudes (Higgins et al., 2002). The substantial decrease in WS during the winter period of 2010 likely contributed to the higher annual average f-NO in this year. It is noticed that the recorded ambient T in Edmonton in this winter was similar to the climatic mean value (https://www.ncei.noaa.gov/products/land-based-station/integrated-surface-database, last access: 13 November 2025), further supporting the hypothesis that it is the weaken WS caused by AO anomaly, rather than changes in T, that enhanced the accumulation of f-NO.
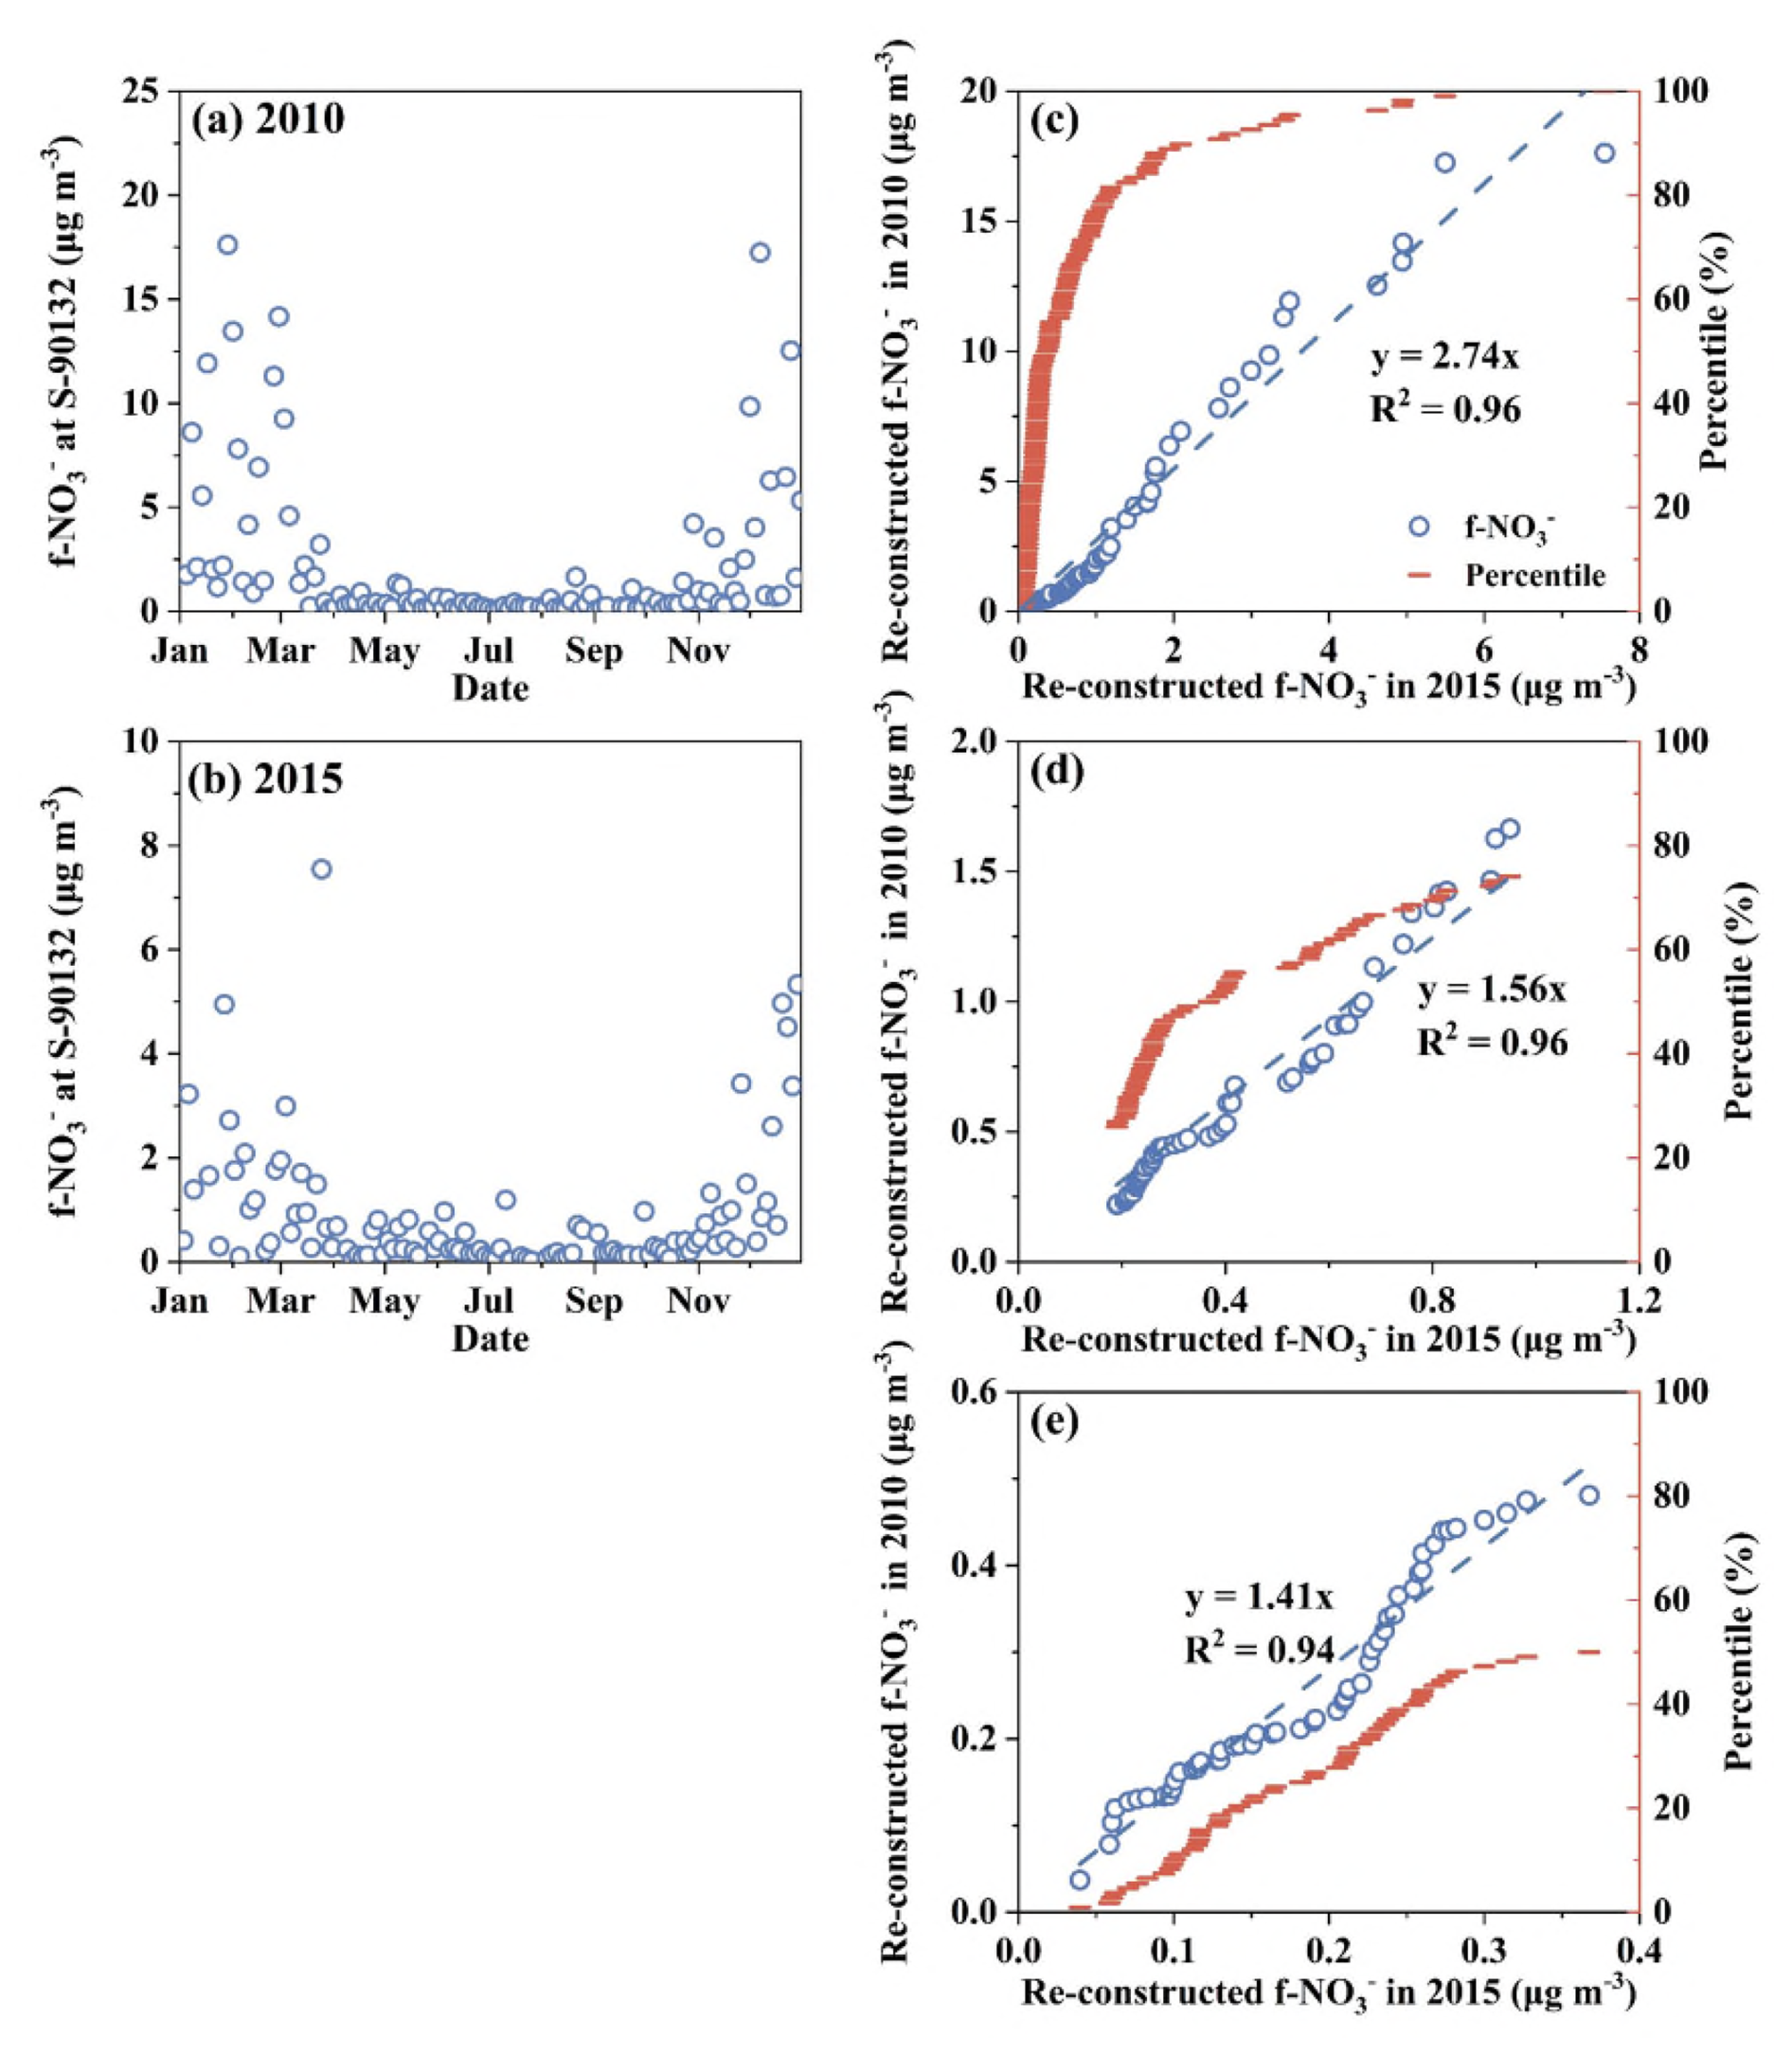
Figure 4Time series of 24 h integrated f-NO in 2010 (a) and 2015 (b) in Edmonton at a time resolution of one sample in every 3 d, and correlations in the re-constructed f-NO between 2015 and 2010 using data points with values of full range (0th–100th percentiles) (c), central 50 % (25th–75th percentile) (d), and lower 50 % (0th–50th percentile) (e).
To further examine the effects of the AO anomaly on f-NO accumulation in 2010 relative to that in 2015, we conducted the identical-percentile regression analysis between the two years (Fig. 4c–e). With the intercept being forced to zero, similar to the approach commonly used in chemical experiments for establishing the standard curve (Yao et al., 2011), the slope of the regression equation was 2.74 if using all the data (0th to 100th percentiles), 1.56 if using the central 50 % data (25th to 75th percentiles), and 1.41 if only using the lower 50 % data (0th to 50th percentiles). The differences in f-NO concentration between the two years were clearly enlarged when higher concentrations were included, due to the AO anomaly effect in the winter of 2010. Assuming a log-normal distribution of the data, the lower percentiles and higher percentiles data, i.e., 0th to 2.5th percentiles and 97.5th to 100th percentiles, are normally excluded from 95 % confidence level. This is because these data points have lower probability densities and their corresponding values are more vulnerable to climate anomaly impact such as AO with negative and positive phases. The highest probability density should always occur at the 50th percentile, where the corresponding value should be least affected by AO. To minimize potential error from using a single value, we used the average values of the 47.5th–52.5th percentiles, which were 0.63 µg m−3 in 2010 and 0.45 µg m−3 in 2015. The ratio of these two values (= 1.4) was nearly identical to the slope of the regression equation using data from the 0th to 50th percentiles presented above. Thus, the annual average f-NO in 2010 was recalculated by the corresponding value in 2015 being multiplying by a factor of 1.4 in order to deduct the AO anomaly effect. The recalculated annual average f-NO in 2010 would decrease from the original value of 2.1 to 1.2 µg m−3. Interestingly, removing the AO effect in 2010 would only have a minor impact on the decadal trends from 2007 to 2019, e.g., the Sen's Slope only showed small changes: which was 0.063 µg m−3 yr−1 using the original annual average values including the year 2010, 0.060 µg m−3 yr−1 if excluding the year 2010, and 0.057 µg m−3 yr−1 if replacing the year 2010 value with 1.2 µg m−3.
Overall, the AO largely affected the annual average f-NO in 2010. Nevertheless, such an impact only has marginal effects on the decadal trends of f-NO, as the AO typically oscillates between negative and positive phases within 2–3 years (Fig. S1d). The enhanced or weakened effects of AO in 2–3 years can be largely canceled out in extracting the decadal trend of f-NO. The overall effect appeared to be too small to explain the above-mentioned disproportionate responses of the annual average f-NO to the reduced NOx emissions, and more exploration on this issue is presented in Sect. 3.5 and 3.6 below.
3.5 Rethinking the role of primary emissions of NH4NO3 during the cold season in Canadian urban atmospheres
From the analysis presented in the previous section we concluded that the high concentrations of f-NO in the winter were mainly due to local accumulation under stagnant meteorological conditions, rather than long-range transport driven by north-westerly winds. This raised the fundamental question: what is the role of primary emissions in combustion plumes or secondary formation of NH4NO3 in ambient air in contributing to f-NO in Canadian urban atmospheres during the cold season? To answer this question, we proposed a hypothesis, i.e., whether HNO concentrations significantly increased under conditions with low f-NO concentrations compared to cases with high f-NO concentrations, and then examined the hypothesis below. Theoretical analysis and implications of the hypothesis were provided in Supplement (Sect. S4).
To examine the weaker hypothesis outlined above, we first divided the 2010 observations into two temperature regimes: T < 0 °C and 0 °C < T ≤ 4 °C. Observations with T < 0 °C were further divided into two subsets based on f-NO concentrations, using the thresholds of > 4 and ≤ 4 µg m−3. These three groups were then compared, i.e., Group 1: T < 0 °C and f-NO > 4 µg m−3, in which case there were 19 samples with average HNO and f-NO concentrations being 0.15 ± 0.09 and 8.8 ± 4.4 µg m−3, respectively; Group 2: T < 0 °C and f-NO < 4 µg m−3, in which case there were 26 samples with average HNO and f-NO concentrations being 0.15 ± 0.12 and 1.3 ± 0.7 µg m−3, respectively; and Group 3: 0 °C < T ≤ 4 °C, in which case there were 13 samples with average HNO and f-NO concentrations being 0.15 ± 0.11 and 1.3 ± 1.7 µg m−3, respectively. Apparently, the average HNO concentrations did not differ between the three Groups (P < 0.01); thus, the initial hypothesis has to be rejected. This suggests that the process of secondary formation of NH4NO3 from HNO was not the main contributor to the observed high concentrations of f-NO, leaving the process of primary emissions as the only major contributor. In addition, the markedly reduced f-NO concentrations at T > 0 °C were likely due to volatilization of a portion of primarily emitted f-NO.
To further test the robustness of the above analysis, we expanded the dataset to include measurements at T ≤ 4 °C from both 2010 and 2015, yielding a total of 108 f-NO samples (Group 1: n = 23; Group 2: n = 54; Group 3: n = 31). The mean (± SD) concentrations of f-NO and HNO were 8.7 ± 4.1 and 0.16 ± 0.11 µg m−3 for Group 1, 1.4 ± 0.95 and 0.17 ± 0.16 µg m−3 for Group 2, and 0.9 ± 1.1 and 0.15 ± 0.10 µg m−3 for Group 3, respectively. Even with the expanded dataset, mean HNO did not differ significantly among the three groups (Welch one-way ANOVA, P=0.74), despite the intentionally large contrast in f-NO imposed by the group definitions.
The above analysis results suggest that the trend of f-NO in Edmonton was likely governed by the primary emissions of f-NO aerosols, as well as the extents of their volatilization and dispersion during the cold season. The dependence of volatilization of f-NO on ambient T and dispersion on WS has been recently confirmed in observational and modeling studies (Huo et al., 2025; Peng et al., 2024; Shen et al., 2022). As mentioned in the Introduction, the primary emissions of f-NO likely have two major sources (or processes). The first source is also conventionally defined as condensable particulate emission and associated with the combustion of (N2 + O2), which produces various oxidized nitrogen species, including HNO, NOx, etc. (Environmental Protection Agency, 2017). The amount of primary NH4NO3 formed from HNO in cooling plumes theoretically depends on the combustion technology, the use of catalytic reduction systems employing NH3, and the ambient T (Palash et al., 2013; Javed et al., 2007; Zhang et al., 2021), which may not be controlled by NOx emission levels. In some reported cases, mitigation measures reduced NOx emissions, but simultaneously increased primary emissions of f-NO (Feng et al., 2020; Palash et al., 2013; Javed et al., 2007; Yang et al., 2024; Zhao et al., 2020). As evidences presented in Sections 3.3, this phenomenon likely occurred across various Canadian urban atmospheres. In contrast, the second source in fresh cooling plumes is directly linked to NOx emissions through the chemical conversion of NO2 in cooling plume droplets, although it is highly sensitive to the lifetime of these droplets (Shen et al., 2022; Wang et al., 2016; Wang et al., 2020). In addition, primary nitrate aerosols from traffic emissions were reportedly unimportant in urban atmospheres across Canada and U.S. (Chalbot et al., 2013; Jeong et al., 2020), leaving only one possibility that primary nitrate aerosols were mainly derived from stationary combustion sources.
Although secondary f-NO formation should always occur to some extent in ambient air, the relative contribution from this process to the total f-NO is very small during the periods with high f-NO concentrations. As shown in Sect. S3 in the Supplement, the modeled maximum potential contribution from secondary formation can only account for a small fraction of the observed f-NO (< 15 % in the baseline runs, and < 45 % even in the empirical-estimate runs known to have overpredictions in general). These results support the hypothesis presented above that primary f-NO was the dominant contributor to the high f-NO concentration in winter. Moreover, higher f-NO concentrations were generally observed under low wind speeds (WS < 1–2 m s−1). Given that the sampling site is about 17 km from the farthest urban edge, the transport time for both primary and secondary f-NO to reach the site was therefore estimated to be approximately 2–4 h. This timescale is far too short for substantial secondary formation of f-NO in such cold ambient air (T < −10 °C), unless in-source processes dominated (Environmental Protection Agency, 2017; Shen et al., 2022; Zhang et al., 2023). Within this 2–4 h transport window, the amount of HNO dry deposition should also be minimum, especially under low-temperature conditions.
3.6 Uncertainties affecting f-NO trends in Edmonton
Three categories of uncertainties that may affect the observed trends of f-NO in Edmonton were analyzed: (i) differences in observational results between the speciation sampler and the Dichotomous sampler, (ii) spatial inhomogeneity due to highly localized factors, and (iii) artifacts introduced by the sampling frequency (e.g., every third or sixth day), which may influence the calculation of annual averages. For category (i) uncertainty, PM2.5 mass concentrations measured by the two different instruments at site S-90132 in 2010 showed strong agreement for most samples, with occasional discrepancies at lower concentration levels (Fig. S6). Specifically, when the regression intercept was forced to zero, the resulting equation was (R2 = 0.94), and the difference in annual average concentrations was less than 10 % (10.3 µg m−3 from the Dichotomous sampler vs. 11.1 µg m−3 from the speciation sampler).
For category (ii) uncertainty, Fig. S7 compares real-time PM2.5 mass concentrations measured simultaneously at two sites 7 km apart (S-90132 and S-90130) from 2011 to 2014. Other years were excluded due to significant data loss at one or both sites. Regression slopes between the two sites (with intercepts forced to zero) are 0.86, 0.82, 0.58, and 0.67, with corresponding differences in annual average concentrations of 21 %, 15 %, 40 %, and 39 % in 2011, 2012, 2013, and 2014, respectively. The significant year-to-year differences between the two sites are unlikely caused by mitigation policies, climate variability, or changes in the atmospheric formation pathways of PM2.5, but rather by spatial inhomogeneity driven by highly localized factors that varied from year to year (Yeganeh et al., 2025). The influence of such localized effects appears to be substantial and may represent an important, yet often overlooked, contributor to the disproportionately large decreases in the annual average f-NO relative to reductions in provincial total NOx emissions over decadal timescales. More broadly, pronounced intra-urban spatial heterogeneity has been documented for many ionic aerosol components (with sulfate generally exhibiting a more regional character), underscoring the importance of high-resolution urban monitoring for interpreting long-term trends. At the same time, compared with routine PM mass measurements, sustained long-term, high-resolution chemical speciation monitoring requires substantially greater investment in instrumentation, maintenance, and operational resources, making such measurements more challenging to maintain over multi-year periods. This practical limitation highlights the need to carefully consider site representativeness and spatial heterogeneity when interpreting long-term nitrate trends derived from fixed-site observations.
It is noted that while the annual average PM2.5 mass concentrations were significantly higher at S-90130 than S-90132 (P < 0.01) during 2010–2014, the opposite trend was observed for the annual average f-NO, e.g., higher at S-90132 during 2007–2019 compared to those at S-90130 during 1990–2005. The highest annual average f-NO concentration at S-90130 appeared in 2000 and that at S-90132 appeared in 2010 (Fig. 1a). The mass fractions of f-NO in PM2.5 were 0.050 ± 0.065 in 2000 and 0.13 ± 0.13 in 2010 (Fig. S4), indicating that PM2.5 at S-90132 contained more f-NO aerosols during 2007–2019 than at S-90130 during 1990–2005, strongly supporting the hypothesis that mitigation measures reduced NOx emissions in Edmonton, while simultaneously increased primary f-NO emissions from the first source (see Sect. 3.3) after 2005.
Concerning category (iii) uncertainty, no continuous measurements of f-NO were available to assess its magnitude. We thus used continuous measurements of PM2.5 data at S-90130 as a proxy for this evaluation. Given that the annual average PM2.5 mass concentration in 2010 was approximately 50 % larger than in 2011, the analysis was conducted using data from 2011 to 2020 instead of 2010 to 2020. Daily average PM2.5 mass concentrations were first calculated for every day of the year. Then for each year, annual average PM2.5 mass concentrations were calculated from daily average concentrations using (i) full dataset, (ii) one in every 3 d data (three subsets), and (iii) one in every 6 d data (six subsets). Thus, a total of 10 sets of annual average PM2.5 data series was created for the period of 2011–2020, which was then used for decadal trend analysis. The trend derived from the full dataset showed a decreasing trend with a Sen's Slope of 0.43 µg m−3 yr−1. Consistent decreasing trends were also obtained from using the one in every 3 d subset data series, with Sen's Slope values of 0.46, 0.46, and 0.42 µg m−3 yr−1, respectively, indicating an error of less than 8 %. When using the one in every 6 d subset data series, five out of six data subsets also showed a decreasing trend, with Sen's Slope values of 0.47, 0.50, 0.45, 0.45, and 0.44 µg m−3 yr−1, respectively, indicating an error of less than 10 % in most cases. However, one subset data series showed a probable decreasing trend, with a Sen's Slope of 0.38 µg m−3 yr−1.
Using the same approach described above, we also compared the decadal trends obtained from using one in every 3 d data, which are readily available, with those from using one in every 6 d data, which are arbitrarily split from the former data set into two subsets. One of the two subsets for f-NO showed a decreasing trend with a Sen's Slope of 0.055 µg m−3 yr−1, which is close to the original value of 0.063 µg m−3 yr−1; however, the other subset exhibited a stable trend. For f-SO, both subsets showed decreasing trends, with Sen's Slope values of 0.033 and 0.018 µg m−3 yr−1, respectively, although deviating to some extent from the original estimate of 0.022 µg m−3 yr−1. For f-NH, both subsets showed stable trends, consistent with the results derived from the original dataset. Overall, using one in every three or 6 d data can generate decadal trends with reasonable accuracy, although the obtained trends need to be interpreted carefully when the trends are not significant or the changing rates are very small.
In the literature (Sect. S1 in the Supplement), changes in atmospheric NH3 and f-SO have been reported to influence long-term trends in f-NO3 to some extent. However, evidence of increasing atmospheric NH3 in Canada, together with reduced NH3 consumption for neutralizing the two major inorganic acids, suggests that NH3 is generally abundant and unlikely to be the limiting factor for f-NO formation (Yao and Zhang, 2019). Consistent with this interpretation, large f-NO f-SO mass ratios are frequently observed in high-f-NO samples during the cold season across Canada. For example, in Edmonton in 2010, samples with f-NO > 4 µg m−3 exhibited f-NO f-SO mass ratios ranging from 1.5 to 12, with a median of 5.5. These results indicate that the elevated f-NO concentrations overwhelmingly dominated its long-term trend. In such cases, the slight decrease in f-SO may exert only a minor influence on the trend in f-NO. Nevertheless, these complex interactions warrant further investigation using three-dimensional (3-D) air quality modelling; however, such efforts remain challenging, as illustrated below.
Existing studies using 3-D chemical transport models (CTMs) simulating particulate NO over North America are summarized in Sect. S5 in the Supplement. Several key points can be generated from these studies. (1) CTMs are widely applied and can often reproduce broad spatial patterns and major controlling processes of particulate NO over the United States and Canada; however, they frequently exhibit systematic biases in magnitude, long-term trends, and sensitivities to emission controls, with a substantial risk of error compensation (ECCC, 2016; Kim et al., 2014, 2023; Luo et al., 2019; Pappin et al., 2024; Pun et al., 2009; Russell et al., 2019; Semeniuk et al., 2025; Shah et al., 2018; Smyth et al., 2009; Walker et al., 2012). (2) The standard GEOS-Chem v12.0.0 simulation substantially overestimated surface PM2.5 NO over the U.S. (1.89 µg m−3 vs. 0.70 µg m−3), with pronounced spatial heterogeneity: outside California, the normalized mean bias reached +176 %, whereas California exhibited an opposite bias of −62 %, implying region-dependent dominant error sources (e.g., meteorology, emissions, and/or thermodynamics) (Luo et al., 2019; Walker et al., 2012). (3) Simulated particulate NO often responds to NOx controls in a strongly non-linear, and sometimes counterintuitive manner, posing a persistent “acidity–partitioning” challenge for trend attribution. For instance, in the northeastern United States, observations show that PM10 nitrate increased by 95 % (urban) and 57 % (rural) from 2005 to 2015 despite declining NOx emissions, and this behavior was attributed to changes in aerosol acidity and gas–particle partitioning feedbacks that can offset the expected effect of precursor reductions (Kim et al., 2023). Finally, condensable particulate nitrate, as defined in US EPA Method 202 (Environmental Protection Agency, 2017), as well as its enhanced fraction under sub-freezing conditions, is generally not represented in current emission inventories. Given its potential importance, as suggested by our analysis presented above, incorporating temperature-dependent condensable nitrate into emission inventories is likely necessary to improve the representation and prediction of f-NO in 3-D air quality modelling.
The in-depth analysis results presented in this study demonstrate that the dynamics of particulate nitrate in Canadian urban atmospheres are governed by complex interactions among emission reductions, primary sources, and cold-climate meteorology. Three key insights emerge:
- i.
Non-linear responses of f-NO to NOx emission reductions in all the cities: Early phase implementation of NOx control measures paradoxically increased f-NO during 1998–2007, likely due to altered combustion plume chemistry favoring rapid f-NO formation in cold-climate conditions. Significant declines in f-NO (e.g., 60 % in Edmonton) outpaced NOx reductions in the most recent decade, driven by diminishing primary emissions, highly localized factors, and AO induced dispersion effects.
- ii.
Decoupled c-NO and NOx reductions in all the cities except Edmonton: c-NO remained stable or increased slightly while NOx emissions were reduced. c-NO trends were likely controlled by the abundance of alkali aerosols, highlighting the limited efficacy of NOx-focused policies for controlling c-NO.
- iii.
Critical role of primary f-NO emissions in winter in all the cities: Over 80 % of the annual f-NO burden was originated from cold-season primary emissions, with minimal contribution from secondary formation process, emphasizing the need for season-specific mitigation strategies. However, confirmation of this role requires three-dimensional air quality modeling with updated emission inventories that explicitly incoporate condensable particulate matter under subzero ambient temperatures.
Collectively, these findings call for a paradigm shift in air quality management. Effective mitigation strategies must explicitly address primary particulate nitrate sources, incorporate gas–particle partitioning dynamics under cold-climate conditions, and account for interactions with alkali-containing aerosols. Policy frameworks should further prioritize enhanced real-time measurements of PM2.5 chemical composition to better resolve localized and seasonal variability, particularly in regions experiencing prolonged winter conditions. In parallel, coordinated unmanned aerial vehicle and ground-based observations of CPM under contrasting temperature and atmospheric dispersion regimes are essential to provide direct observational evidence of its role and contributions.
The access of the data used in this study is described in Sect. 2 above.
The supplement related to this article is available online at https://doi.org/10.5194/acp-26-4917-2026-supplement.
QF, XY and LZ designed the research, conducted the data analysis and wrote the manuscript.
At least one of the (co-)authors is a member of the editorial board of Atmospheric Chemistry and Physics. The peer-review process was guided by an independent editor, and the authors also have no other competing interests to declare.
Publisher's note: Copernicus Publications remains neutral with regard to jurisdictional claims made in the text, published maps, institutional affiliations, or any other geographical representation in this paper. The authors bear the ultimate responsibility for providing appropriate place names. Views expressed in the text are those of the authors and do not necessarily reflect the views of the publisher.
QF and XY are supported by the National Natural Science Foundation of China (grant no. 42276036). We greatly appreciate all the personnel of the NAPS Partners who operate the sites across Canada and collect the field samples, and the staff of the Analysis and Air Quality Section in Ottawa for the laboratory chemical analyses and QA/QC of the data used in the present study. NPRI/APEI groups are also acknowledged for their efforts in generating emissions data across Canada.
This research has been supported by the National Natural Science Foundation of China (grant no. 42276036).
This paper was edited by Qi Chen and reviewed by two anonymous referees.
Aas, W., Mortier, A., Bowersox, V., Cherian, R., Faluvegi, G., Fagerli, H., Hand, J., Klimont, Z., Galy-Lacaux, C., Lehmann, C. M. B., Myhre, C. L., Myhre, G., Olivié, D., Sato, K., Quaas, J., Rao, P. S. P., Schulz, M., Shindell, D., Skeie, R. B., Stein, A., Takemura, T., Tsyro, S., Vet, R., and Xu, X.: Global and regional trends of atmospheric sulfur, Sci. Rep., 9, 953, https://doi.org/10.1038/s41598-018-37304-0, 2019.
Andersson, C., Langner, J., and Bergström, R.: Interannual variation and trends in air pollution over Europe due to climate variability during 1958–2001 simulated with a regional CTM coupled to the ERA40 reanalysis, Tellus B, 59, 77–98, https://doi.org/10.1111/j.1600-0889.2006.00196.x, 2007.
Balamurugan, V., Chen, J., Qu, Z., Bi, X., and Keutsch, F. N.: Secondary PM2.5 decreases significantly less than NO2 emission reductions during COVID lockdown in Germany, Atmos. Chem. Phys., 22, 7105–7129, https://doi.org/10.5194/acp-22-7105-2022, 2022.
Bari, M. A. and Kindzierski, W. B.: Fine particulate matter (PM2.5) in Edmonton, Canada: source apportionment and potential risk for human health, Environ. Pollut., 218, 219–229, https://doi.org/10.1016/j.envpol.2016.06.014, 2016a.
Bari, M. A. and Kindzierski, W. B.: Eight-year (2007–2014) trends in ambient fine particulate matter (PM2.5) and its chemical components in the capital region of Alberta, Canada, Environ. Int., 91, 122–132, https://doi.org/10.1016/j.envint.2016.02.033, 2016b.
Bell, M. L., Dominici, F., Ebisu, K., Zeger, S. L., and Samet, J. M.: Spatial and temporal variation in PM2.5 chemical composition in the United States for health effects studies, Environ. Health Perspect., 115, 989–995, https://doi.org/10.1289/ehp.9621, 2007.
Bose, S., Rosa, M. J., Chiu, Y.-H. M., Hsu, H.-H. L., Di, Q., Lee, A., Kloog, I., Wilson, A., Schwartz, J., Wright, R. O., Morgan, W. J., Coull, B. A., and Wright, R. J.: Prenatal nitrate air pollution exposure and reduced child lung function: Timing and fetal sex effects, Environ. Res., 167, 591–597, https://doi.org/10.1016/j.envres.2018.08.019, 2018.
Burakowski, E. A., Wake, C. P., Braswell, B., and Brown, D. P.: Trends in wintertime climate in the northeastern United States: 1965–2005, J. Geophys. Res.-Atmos., 113, D20114, https://doi.org/10.1029/2008JD009870, 2008.
Canada Electricity Advisory Council: Powering Canada: A blueprint for success, https://natural-resources.canada.ca/energy-sources/powering-canada-blueprint-success (last access: 28 March 2026), 2024.
Chalbot, M.-C., McElroy, B., and Kavouras, I. G.: Sources, trends and regional impacts of fine particulate matter in southern Mississippi valley: significance of emissions from sources in the Gulf of Mexico coast, Atmos. Chem. Phys., 13, 3721–3732, https://doi.org/10.5194/acp-13-3721-2013, 2013.
Chan, Y.-C., Evans, M. J., He, P., Holmes, C. D., Jaeglé, L., Kasibhatla, P., Liu, X.-Y., Sherwen, T., Thornton, J. A., Wang, X., Xie, Z., Zhai, S., and Alexander, B.: Heterogeneous nitrate production mechanisms in intense haze events in the North China Plain, J. Geophys. Res.-Atmos., 126, e2021JD034688, https://doi.org/10.1029/2021JD034688, 2021.
Chen, G., Fan, X., Yu, S., Tham, Y. J., Lin, Z., Ji, X., Xu, L., and Chen, J.: HOCl formation driven by photochemical processes enhanced atmospheric oxidation capacity in a coastal atmosphere, Environ. Sci. Technol., 59, 5164–5171, https://doi.org/10.1021/acs.est.5c01363, 2025.
Cheng, B., Alapaty, K., and Arunachalam, S.: Spatiotemporal trends in PM2.5 chemical composition in the conterminous U.S. during 2006–2020, Atmos. Environ., 316, 120188, https://doi.org/10.1016/j.atmosenv.2023.120188, 2024.
Cheng, I. and Zhang, L.: Long-term air concentrations, wet deposition, and scavenging ratios of inorganic ions, HNO3, and SO2 and assessment of aerosol and precipitation acidity at Canadian rural locations, Atmos. Chem. Phys., 17, 4711–4730, https://doi.org/10.5194/acp-17-4711-2017, 2017.
Dabek-Zlotorzynska, E., Dann, T. F., Martinelango, P. K., Celo, V., Brook, J. R., Mathieu, D., Ding, L., and Austin, C. C.: Canadian National Air Pollution Surveillance (NAPS) PM2.5 speciation program: Methodology and PM2.5 chemical composition for the years 2003–2008, Atmos. Environ., 45, 673–686, https://doi.org/10.1016/j.atmosenv.2010.10.024, 2011.
Dabek-Zlotorzynska, E., Celo, V., Ding, L., Herod, D., Jeong, C.-H., Evans, G., and Hilker, N.: Characteristics and sources of PM2.5 and reactive gases near roadways in two metropolitan areas in Canada, Atmos. Environ., 218, 116980, https://doi.org/10.1016/j.atmosenv.2019.116980, 2019.
Dang, R., Jacob, D. J., Zhai, S., Yang, L. H., Pendergrass, D. C., Coheur, P., Clarisse, L., Van Damme, M., Choi, J., Park, J., Liu, Z., Xie, P., and Liao, H.: A satellite-based indicator for diagnosing particulate nitrate sensitivity to precursor emissions: application to East Asia, Europe, and North America, Environ. Sci. Technol., 58, 20101–20113, https://doi.org/10.1021/acs.est.4c08082, 2024.
Drugé, T., Nabat, P., Mallet, M., and Somot, S.: Model simulation of ammonium and nitrate aerosols distribution in the Euro-Mediterranean region and their radiative and climatic effects over 1979–2016, Atmos. Chem. Phys., 19, 3707–3731, https://doi.org/10.5194/acp-19-3707-2019, 2019.
Duce, R. A., LaRoche, J., Altieri, K., Arrigo, K. R., Baker, A. R., Capone, D. G., Cornell, S., Dentener, F., Galloway, J., Ganeshram, R. S., Geider, R. J., Jickells, T., Kuypers, M. M., Langlois, R., Liss, P. S., Liu, S. M., Middelburg, J. J., Moore, C. M., Nickovic, S., Oschlies, A., Pedersen, T., Prospero, J., Schlitzer, R., Seitzinger, S., Sorensen, L. L., Uematsu, M., Ulloa, O., Voss, M., Ward, B., and Zamora, L.: Impacts of atmospheric anthropogenic nitrogen on the open ocean, Science, 320, 893–897, https://doi.org/10.1126/science.1150369, 2008.
ECCC: Canada–United States transboundary particulate matter science assessment 2013, https://publications.gc.ca/site/eng/9.811711/publication.html (last access: 13 November 2025), 2016.
ECCC: Air pollutant emissions, https://www.canada.ca/en/environment-climate-change/services/environmental-indicators/air-pollutant-emissions.html (last access: 13 November 2021), 2021.
Edgerton, E. S., Hsu, Y.-M., White, E. M., Fenn, M. E., and Landis, M. S.: Ambient concentrations and total deposition of inorganic sulfur, inorganic nitrogen and base cations in the Athabasca oil sands region, Sci. Total Environ., 706, 134864, https://doi.org/10.1016/j.scitotenv.2019.134864, 2020.
Environmental Protection Agency: Method 202 – Dry Impinger Method for Determining Condensable Particulate Emissions From Stationary Sources, proposed rule, Fed. Regist., 82, 42508–42530, 2017.
Fan, M.-Y., Zhang, Y.-L., Lin, Y.-C., Cao, F., Zhao, Z.-Y., Sun, Y., Qiu, Y., Fu, P., and Wang, Y.: Changes of emission sources to nitrate aerosols in Beijing after the clean air actions: evidence from dual isotope compositions, J. Geophys. Res.-Atmos., 125, e2019JD031998, https://doi.org/10.1029/2019JD031998, 2020.
Feng, J., Chan, E., and Vet, R.: Air quality in the eastern United States and Eastern Canada for 1990–2015: 25 years of change in response to emission reductions of SO2 and NOx in the region, Atmos. Chem. Phys., 20, 3107–3134, https://doi.org/10.5194/acp-20-3107-2020, 2020.
Font, A., de Brito, J. F., Riffault, V., Conil, S., Jaffrezo, J.-L., and Bourin, A.: Long-term measurements of aerosol composition at rural background sites in France: sources, seasonality and mass closure of PM2.5, Atmos. Environ., 334, 120724, https://doi.org/10.1016/j.atmosenv.2024.120724, 2024.
Gen, M., Liang, Z., Zhang, R., Go Mabato, B. R., and Chan, C. K.: Particulate nitrate photolysis in the atmosphere, Environ. Sci. Atmos., 2, 111–127, https://doi.org/10.1039/d1ea00087j, 2022.
Guo, T., Li, K., Zhu, Y., Gao, H., and Yao, X.: Concentration and size distribution of particulate oxalate in marine and coastal atmospheres – implication for the increased importance of oxalate in nanometer atmospheric particles, Atmos. Environ., 142, 19–31, https://doi.org/10.1016/j.atmosenv.2016.07.026, 2016.
Hand, J. L., Prenni, A. J., and Schichtel, B. A.: Trends in seasonal mean speciated aerosol composition in remote areas of the United States from 2000 through 2021, J. Geophys. Res.-Atmos., 129, e2023JD039902, https://doi.org/10.1029/2023JD039902, 2024.
Harrison, R. M., Beddows, D. C. S., Tong, C., and Damayanti, S.: Non-linearity of secondary pollutant formation estimated from emissions data and measured precursor-secondary pollutant relationships, npj Clim. Atmos. Sci., 5, 71, https://doi.org/10.1038/s41612-022-00297-9, 2022.
He, K., Yang, F., Ma, Y., Zhang, Q., Yao, X., Chan, C. K., Cadle, S., Chan, T., and Mulawa, P.: The characteristics of PM2.5 in Beijing, China, Atmos. Environ., 35, 4959–4970, https://doi.org/10.1016/S1352-2310(01)00301-6, 2001.
Higgins, R. W., Leetmaa, A., and Kousky, V. E.: Relationships between climate variability and winter temperature extremes in the United States, J. Climate, 15, 1555–1572, https://doi.org/10.1175/1520-0442(2002)015<1555:RBCVAW>2.0.CO;2, 2002.
Höpfner, M., Ungermann, J., Borrmann, S., Wagner, R., Spang, R., Riese, M., Stiller, G., Appel, O., Batenburg, A. M., Bucci, S., Cairo, F., Dragoneas, A., Friedl-Vallon, F., Hünig, A., Johansson, S., Krasauskas, L., Legras, B., Leisner, T., Mahnke, C., Möhler, O., Molleker, S., Müller, R., Neubert, T., Orphal, J., Preusse, P., Rex, M., Saathoff, H., Stroh, F., Weigel, R., and Wohltmann, I.: Ammonium nitrate particles formed in upper troposphere from ground ammonia sources during Asian monsoons, Nat. Geosci., 12, 608–612, https://doi.org/10.1038/s41561-019-0385-8, 2019.
Huo, H., Gao, Y., Sun, L., Gao, Y., Gao, H., and Yao, X.: Investigating dual character of atmospheric ammonia on particulate NH4NO3: reducing evaporation versus promoting formation, Atmos.-Basel, 16, 685, https://doi.org/10.3390/atmos16060685, 2025.
Iizuka, Y., Matsumoto, M., Kawakami, K., Sasage, M., Ishino, S., Hattori, S., Uemura, R., Matsui, H., Fujita, K., Oshima, N., Spolaor, A., Svensson, A., Vinther, B. M., Ohno, H., Seki, O., and Matoba, S.: Acidity-driven gas-particle partitioning of nitrate regulates its transport to Arctic through the industrial era, Nat. Commun., 16, 4272, https://doi.org/10.1038/s41467-025-59208-0, 2025.
Javed, M. T., Irfan, N., and Gibbs, B. M.: Control of combustion-generated nitrogen oxides by selective non-catalytic reduction, J. Environ. Manage., 83, 251–289, https://doi.org/10.1016/j.jenvman.2006.03.006, 2007.
Jeong, C., McGuire, M. L., Herod, D., Dann, T., Dabek–Zlotorzynska, E., Wang, D., Ding, L., Celo, V., Mathieu, D., and Evans, G.: Receptor model based identification of PM2.5 sources in Canadian cities, Atmos. Pollut. Res., 2, 158–171, https://doi.org/10.5094/APR.2011.021, 2011.
Jeong, C.-H., Traub, A., Huang, A., Hilker, N., Wang, J. M., Herod, D., Dabek-Zlotorzynska, E., Celo, V., and Evans, G. J.: Long-term analysis of PM2.5 from 2004 to 2017 in Toronto: composition, sources, and oxidative potential, Environ. Pollut., 263, 114652, https://doi.org/10.1016/j.envpol.2020.114652, 2020.
Jonson, J. E., Fagerli, H., Scheuschner, T., and Tsyro, S.: Modelling changes in secondary inorganic aerosol formation and nitrogen deposition in Europe from 2005 to 2030, Atmos. Chem. Phys., 22, 1311–1331, https://doi.org/10.5194/acp-22-1311-2022, 2022.
Kim, H., Walters, W. W., Kysela, L., and Hastings, M. G.: Long-term trends in inorganic aerosol chemical composition and chemistry at an urban and rural site in the Northeastern US, Sci. Total Environ., 904, 166848, https://doi.org/10.1016/j.scitotenv.2023.166848, 2023.
Kim, Y. J., Spak, S. N., Carmichael, G. R., Riemer, N., and Stanier, C. O.: Modeled aerosol nitrate formation pathways during wintertime in the Great Lakes region of North America, J. Geophys. Res.-Atmos., 119, 12420–12445, https://doi.org/10.1002/2014JD022320, 2014.
Li, Y. and Shiraiwa, M.: Timescales of secondary organic aerosols to reach equilibrium at various temperatures and relative humidities, Atmos. Chem. Phys., 19, 5959–5971, https://doi.org/10.5194/acp-19-5959-2019, 2019.
Lin, Y., Zhang, L., Fan, Q., Meng, H., Gao, Y., Gao, H., and Yao, X.: Decoupling impacts of weather conditions on interannual variations in concentrations of criteria air pollutants in South China – constraining analysis uncertainties by using multiple analysis tools, Atmos. Chem. Phys., 22, 16073–16090, https://doi.org/10.5194/acp-22-16073-2022, 2022.
Luo, G., Yu, F., and Schwab, J.: Revised treatment of wet scavenging processes dramatically improves GEOS-Chem 12.0.0 simulations of surface nitric acid, nitrate, and ammonium over the United States, Geosci. Model Dev., 12, 3439–3447, https://doi.org/10.5194/gmd-12-3439-2019, 2019.
Man, H., Zhu, Y., Ji, F., Yao, X., Lau, N. T., Li, Y., Lee, B. P., and Chan, C. K.: Comparison of daytime and nighttime new particle growth at the HKUST supersite in Hong Kong, Environ. Sci. Technol., 49, 7170–7178, https://doi.org/10.1021/acs.est.5b02143, 2015.
McDonald, B. C., de Gouw, J. A., Gilman, J. B., Jathar, S. H., Akherati, A., Cappa, C. D., Jimenez, J. L., Lee-Taylor, J., Hayes, P. L., McKeen, S. A., Cui, Y. Y., Kim, S.-W., Gentner, D. R., Isaacman-VanWertz, G., Goldstein, A. H., Harley, R. A., Frost, G. J., Roberts, J. M., Ryerson, T. B., and Trainer, M.: Volatile chemical products emerging as largest petrochemical source of urban organic emissions, Science, 359, 760–764, https://doi.org/10.1126/science.aaq0524, 2018.
Meng, Z. and Seinfeld, J. H.: Time scales to achieve atmospheric gas-aerosol equilibrium for volatile species, Atmos. Environ., 30, 2889–2900, https://doi.org/10.1016/1352-2310(95)00493-9, 1996.
Palash, S. M., Masjuki, H. H., Kalam, M. A., Masum, B. M., Sanjid, A., and Abedin, M. J.: State of the art of NOx mitigation technologies and their effect on the performance and emission characteristics of biodiesel-fueled compression ignition engines, Energy Conv. Manag., 76, 400–420, https://doi.org/10.1016/j.enconman.2013.07.059, 2013.
Pappin, A. J., Charman, N., Egyed, M., Blagden, P., Duhamel, A., Miville, J., Popadic, I., Manseau, P. M., Marcotte, G., Mashayekhi, R., Racine, J., Rittmaster, R., Edwards, B., Kipusi, W., and Smith-Doiron, M.: Attribution of fine particulate matter and ozone health impacts in Canada to domestic and US emission sources, Sci. Total Environ., 909, 168529, https://doi.org/10.1016/j.scitotenv.2023.168529, 2024.
Park, R. J., Jacob, D. J., Field, B. D., Yantosca, R. M., and Chin, M.: Natural and transboundary pollution influences on sulfate-nitrate-ammonium aerosols in the United States: Implications for policy, J. Geophys. Res.-Atmos., 109, D15204, https://doi.org/10.1029/2003JD004473, 2004.
Peng, W., Zhu, B., Kang, H., Chen, K., Lu, W., Lu, C., Kang, N., Hu, J., Chen, H., and Liao, H.: Inconsistent 3-d structures and sources of sulfate ammonium and nitrate ammonium aerosols during cold front episodes, J. Geophys. Res.-Atmos., 129, e2023JD039958, https://doi.org/10.1029/2023JD039958, 2024.
Peng, X., Wang, T., Wang, W., Ravishankara, A. R., George, C., Xia, M., Cai, M., Li, Q., Salvador, C. M., Lau, C., Lyu, X., Poon, C. N., Mellouki, A., Mu, Y., Hallquist, M., Saiz-Lopez, A., Guo, H., Herrmann, H., Yu, C., Dai, J., Wang, Y., Wang, X., Yu, A., Leung, K., Lee, S., and Chen, J.: Photodissociation of particulate nitrate as a source of daytime tropospheric Cl2, Nat. Commun., 13, 939, https://doi.org/10.1038/s41467-022-28383-9, 2022.
Pullokaran, D., Bhardwaj, A., Haswani, D., Yadav, K., Sunder Raman, R., Shukla, D., Dhandapani, A., Iqbal, J., Kumar, R. N., Prasad, L., Venkatesh, P., and Murthy, B. M. S.: Spatio-temporal trends of the relationships between surface PM2.5 and its chemical constituents across three COALESCE network locations in India: a mass closure investigation, J. Geophys. Res.-Atmos., 129, e2023JD039855, https://doi.org/10.1029/2023JD039855, 2024.
Pun, B. K., Balmori, R. T. F., and Seigneur, C.: Modeling wintertime particulate matter formation in central California, Atmos. Environ., 43, 402–409, https://doi.org/10.1016/j.atmosenv.2008.08.040, 2009.
Qi, J., Liu, X., Yao, X., Zhang, R., Chen, X., Lin, X., Gao, H., and Liu, R.: The concentration, source and deposition flux of ammonium and nitrate in atmospheric particles during dust events at a coastal site in northern China, Atmos. Chem. Phys., 18, 571–586, https://doi.org/10.5194/acp-18-571-2018, 2018.
Russell, M., Hakami, A., Makar, P. A., Akingunola, A., Zhang, J., Moran, M. D., and Zheng, Q.: An evaluation of the efficacy of very high resolution air-quality modelling over the Athabasca oil sands region, Alberta, Canada, Atmos. Chem. Phys., 19, 4393–4417, https://doi.org/10.5194/acp-19-4393-2019, 2019.
Seinfeld, J. H. and Pandis, S. N.: Atmospheric Chemistry and Physics: From Air Pollution to Climate Change, 3rd edn., John Wiley & Sons, Hoboken, NJ, ISBN 9781118947401, 2016.
Semeniuk, K., Dastoor, A., and Lupu, A.: Implementation of the MOSAIC aerosol module (v1.0) in the Canadian air quality model GEM-MACH (v3.1), Geosci. Model Dev., 18, 6479–6515, https://doi.org/10.5194/gmd-18-6479-2025, 2025.
Shah, V., Jaeglé, L., Thornton, J. A., Lopez-Hilfiker, F. D., Lee, B. H., Schroder, J. C., Campuzano-Jost, P., Jimenez, J. L., Guo, H., Sullivan, A. P., Weber, R. J., Green, J. R., Fiddler, M. N., Bililign, S., Campos, T. L., Stell, M., Weinheimer, A. J., Montzka, D. D., and Brown, S. S.: Chemical feedbacks weaken the wintertime response of particulate sulfate and nitrate to emissions reductions over the eastern United States, P. Natl. Acad. Sci. USA, 115, 8110–8115, https://doi.org/10.1073/pnas.1803295115, 2018.
Shen, Y., Meng, H., Yao, X., Peng, Z., Sun, Y., Zhang, J., Gao, Y., Feng, L., Liu, X., and Gao, H.: Does ambient secondary conversion or the prolonged fast conversion in combustion plumes cause severe PM2.5 air pollution in China?, Atmos.-Basel, 13, 673, https://doi.org/10.3390/atmos13050673, 2022.
Sickles II, J. E. and Shadwick, D. S.: Air quality and atmospheric deposition in the eastern US: 20 years of change, Atmos. Chem. Phys., 15, 173–197, https://doi.org/10.5194/acp-15-173-2015, 2015.
Smyth, S. C., Jiang, W., Roth, H., Moran, M. D., Makar, P. A., Yang, F., Bouchet, V. S., and Landry, H.: A comparative performance evaluation of the AURAMS and CMAQ air-quality modelling systems, Atmos. Environ., 43, 1059–1070, https://doi.org/10.1016/j.atmosenv.2008.11.027, 2009.
Squizzato, S., Masiol, M., Rich, D. Q., and Hopke, P. K.: PM2.5 and gaseous pollutants in New York state during 2005–2016: spatial variability, temporal trends, and economic influences, Atmos. Environ., 183, 209–224, https://doi.org/10.1016/j.atmosenv.2018.03.045, 2018.
Statistics Canada: New motor vehicle registrations, fourth quarter 2023, The Daily, released 12 March 2024, https://www150.statcan.gc.ca/n1/daily-quotidien/240312/dq240312c-eng.htm (last access: 24 February 2026), 2024.
Sun, P., Wang, J., Liu, Y., Nie, W., Chi, X., Xu, Z., Ge, D., Ren, C., Zhu, C., Huang, X., and Ding, A.: Enhanced particulate nitrate formation in residual layer exacerbates near-surface pollution: insights from tethered airship and long-term ground measurements, J. Geophys. Res.-Atmos., 130, e2024JD042672, https://doi.org/10.1029/2024JD042672, 2025.
Sun, W., Shao, M., Granier, C., Liu, Y., Ye, C. S., and Zheng, J. Y.: Long-term trends of anthropogenic SO2, NOx, CO, and NMVOCs emissions in China, Earths Future, 6, 1112–1133, https://doi.org/10.1029/2018EF000822, 2018.
Tang, Y. S., Braban, C. F., Dragosits, U., Simmons, I., Leaver, D., van Dijk, N., Poskitt, J., Thacker, S., Patel, M., Carter, H., Pereira, M. G., Keenan, P. O., Lawlor, A., Conolly, C., Vincent, K., Heal, M. R., and Sutton, M. A.: Acid gases and aerosol measurements in the UK (1999–2015): regional distributions and trends, Atmos. Chem. Phys., 18, 16293–16324, https://doi.org/10.5194/acp-18-16293-2018, 2018.
Thunis, P., Clappier, A., Beekmann, M., Putaud, J. P., Cuvelier, C., Madrazo, J., and de Meij, A.: Non-linear response of PM2.5 to changes in NOx and NH3 emissions in the Po basin (Italy): consequences for air quality plans, Atmos. Chem. Phys., 21, 9309–9327, https://doi.org/10.5194/acp-21-9309-2021, 2021.
Velazquez-Garcia, A., Crumeyrolle, S., de Brito, J. F., Tison, E., Bourrianne, E., Chiapello, I., and Riffault, V.: Deriving composition-dependent aerosol absorption, scattering and extinction mass efficiencies from multi-annual high time resolution observations in northern France, Atmos. Environ., 298, 119613, https://doi.org/10.1016/j.atmosenv.2023.119613, 2023.
Walker, J. M., Philip, S., Martin, R. V., and Seinfeld, J. H.: Simulation of nitrate, sulfate, and ammonium aerosols over the United States, Atmos. Chem. Phys., 12, 11213–11227, https://doi.org/10.5194/acp-12-11213-2012, 2012.
Wang, G., Zhang, R., Gomez, M. E., Yang, L., Levy Zamora, M., Hu, M., Lin, Y., Peng, J., Guo, S., Meng, J., Li, J., Cheng, C., Hu, T., Ren, Y., Wang, Y., Gao, J., Cao, J., An, Z., Zhou, W., Li, G., Wang, J., Tian, P., Marrero-Ortiz, W., Secrest, J., Du, Z., Zheng, J., Shang, D., Zeng, L., Shao, M., Wang, W., Huang, Y., Wang, Y., Zhu, Y., Li, Y., Hu, J., Pan, B., Cai, L., Cheng, Y., Ji, Y., Zhang, F., Rosenfeld, D., Liss, P. S., Duce, R. A., Kolb, C. E., and Molina, M. J.: Persistent sulfate formation from London fog to Chinese haze, P. Natl. Acad. Sci. USA, 113, 13630–13635, https://doi.org/10.1073/pnas.1616540113, 2016.
Wang, H., Zhang, L., Cheng, I., Yao, X., and Dabek-Zlotorzynska, E.: Spatiotemporal trends of PM2.5 and its major chemical components at urban sites in Canada, J. Environ. Sci., 103, 1–11, https://doi.org/10.1016/j.jes.2020.09.035, 2021.
Wang, H., Wang, H., Lu, X., Lu, K., Zhang, L., Tham, Y. J., Shi, Z., Aikin, K., Fan, S., Brown, S. S., and Zhang, Y.: Increased night-time oxidation over China despite widespread decrease across the globe, Nat. Geosci., 16, 217–223, https://doi.org/10.1038/s41561-022-01122-x, 2023.
Wang, M., Kong, W., Marten, R., He, X.-C., Chen, D., Pfeifer, J., Heitto, A., Kontkanen, J., Dada, L., Kürten, A., Yli-Juuti, T., Manninen, H. E., Amanatidis, S., Amorim, A., Baalbaki, R., Baccarini, A., Bell, D. M., Bertozzi, B., Bräkling, S., Brilke, S., Murillo, L. C., Chiu, R., Chu, B., De Menezes, L.-P., Duplissy, J., Finkenzeller, H., Carracedo, L. G., Granzin, M., Guida, R., Hansel, A., Hofbauer, V., Krechmer, J., Lehtipalo, K., Lamkaddam, H., Lampimäki, M., Lee, C. P., Makhmutov, V., Marie, G., Mathot, S., Mauldin, R. L., Mentler, B., Müller, T., Onnela, A., Partoll, E., Petäjä, T., Philippov, M., Pospisilova, V., Ranjithkumar, A., Rissanen, M., Rörup, B., Scholz, W., Shen, J., Simon, M., Sipilä, M., Steiner, G., Stolzenburg, D., Tham, Y. J., Tomé, A., Wagner, A. C., Wang, D. S., Wang, Y., Weber, S. K., Winkler, P. M., Wlasits, P. J., Wu, Y., Xiao, M., Ye, Q., Zauner-Wieczorek, M., Zhou, X., Volkamer, R., Riipinen, I., Dommen, J., Curtius, J., Baltensperger, U., Kulmala, M., Worsnop, D. R., Kirkby, J., Seinfeld, J. H., El-Haddad, I., Flagan, R. C., and Donahue, N. M.: Rapid growth of new atmospheric particles by nitric acid and ammonia condensation, Nature, 581, 184–189, https://doi.org/10.1038/s41586-020-2270-4, 2020.
Wang, M., Xiao, M., Bertozzi, B., Marie, G., Rörup, B., Schulze, B., Bardakov, R., He, X.-C., Shen, J., Scholz, W., Marten, R., Dada, L., Baalbaki, R., Lopez, B., Lamkaddam, H., Manninen, H. E., Amorim, A., Ataei, F., Bogert, P., Brasseur, Z., Caudillo, L., De Menezes, L.-P., Duplissy, J., Ekman, A. M. L., Finkenzeller, H., Carracedo, L. G., Granzin, M., Guida, R., Heinritzi, M., Hofbauer, V., Höhler, K., Korhonen, K., Krechmer, J. E., Kürten, A., Lehtipalo, K., Mahfouz, N. G. A., Makhmutov, V., Massabò, D., Mathot, S., Mauldin, R. L., Mentler, B., Müller, T., Onnela, A., Petäjä, T., Philippov, M., Piedehierro, A. A., Pozzer, A., Ranjithkumar, A., Schervish, M., Schobesberger, S., Simon, M., Stozhkov, Y., Tomé, A., Umo, N. S., Vogel, F., Wagner, R., Wang, D. S., Weber, S. K., Welti, A., Wu, Y., Zauner-Wieczorek, M., Sipilä, M., Winkler, P. M., Hansel, A., Baltensperger, U., Kulmala, M., Flagan, R. C., Curtius, J., Riipinen, I., Gordon, H., Lelieveld, J., El-Haddad, I., Volkamer, R., Worsnop, D. R., Christoudias, T., Kirkby, J., Möhler, O., and Donahue, N. M.: Synergistic HNO3–H2SO4–NH3 upper tropospheric particle formation, Nature, 605, 483–489, https://doi.org/10.1038/s41586-022-04605-4, 2022.
Ward, R. X., Baliaka, H. D., Schulze, B. C., Kerr, G. H., Crounse, J. D., Hasheminassab, S., Bahreini, R., Dillner, A. M., Russell, A., Ng, N. L., Wennberg, P. O., Flagan, R. C., and Seinfeld, J. H.: Poorly quantified trends in ammonium nitrate remain critical to understand future urban aerosol control strategies, Sci. Adv., 11, eadt8957, https://doi.org/10.1126/sciadv.adt8957, 2025.
Wernis, R. A., Kreisberg, N. M., Weber, R. J., Drozd, G. T., and Goldstein, A. H.: Source apportionment of VOCs, IVOCs and SVOCs by positive matrix factorization in suburban Livermore, California, Atmos. Chem. Phys., 22, 14987–15019, https://doi.org/10.5194/acp-22-14987-2022, 2022.
Wetherbee, G. A. and Mast, M. A.: Annual variations in wet-deposition chemistry related to changes in climate, Clim. Dyn., 47, 3141–3155, https://doi.org/10.1007/s00382-016-3017-7, 2016.
Wexler, A. S. and Seinfeld, J. H.: The distribution of ammonium salts among a size and composition dispersed aerosol, Atmos. Environ. A, 24, 1231–1246, https://doi.org/10.1016/0960-1686(90)90088-5, 1990.
Wexler, A. S. and Seinfeld, J. H.: Analysis of aerosol ammonium nitrate: departures from equilibrium during SCAQS, Atmos. Environ. A, 26, 579–591, https://doi.org/10.1016/0960-1686(92)90171-G, 1992.
Xiao, H., Chen, T., Zhang, Q., Wang, R., Xiao, H., Xu, Y., Guan, W., Long, A., and Xiao, H.: Changes in the dominant contributions of nitrate formation and sources during haze episodes: insights from dual isotopic evidence, J. Geophys. Res.-Atmos., 130, e2024JD042175, https://doi.org/10.1029/2024JD042175, 2025.
Yan, C., Tham, Y. J., Nie, W., Xia, M., Wang, H., Guo, Y., Ma, W., Zhan, J., Hua, C., Li, Y., Deng, C., Li, Y., Zheng, F., Chen, X., Li, Q., Zhang, G., Mahajan, A. S., Cuevas, C. A., Huang, D. D., Wang, Z., Sun, Y., Saiz-Lopez, A., Bianchi, F., Kerminen, V.-M., Worsnop, D. R., Donahue, N. M., Jiang, J., Liu, Y., Ding, A., and Kulmala, M.: Increasing contribution of nighttime nitrogen chemistry to wintertime haze formation in Beijing observed during COVID-19 lockdowns, Nat. Geosci., 16, 975–981, https://doi.org/10.1038/s41561-023-01285-1, 2023.
Yang, L., Shi, Y., and Luo, L.: Review of emission characteristics of fine particles during coal-fired SCR DeNOx process, Proc. Chin. Soc. Electr. Eng., 36, 4342–4348, https://doi.org/10.13334/j.0258-8013.pcsee.160371, 2016.
Yang, T., Li, H., Xu, W., Song, Y., Xu, L., Wang, H., Wang, F., Sun, Y., Wang, Z., and Fu, P.: Strong impacts of regional atmospheric transport on the vertical distribution of aerosol ammonium over Beijing, Environ. Sci. Technol. Lett., 11, 29–34, https://doi.org/10.1021/acs.estlett.3c00791, 2024.
Yao, X. and Zhang, L.: Chemical processes in sea-salt chloride depletion observed at a Canadian rural coastal site, Atmos. Environ., 46, 189–194, https://doi.org/10.1016/j.atmosenv.2011.09.081, 2012a.
Yao, X. H. and Zhang, L.: Supermicron modes of ammonium ions related to fog in rural atmosphere, Atmos. Chem. Phys., 12, 11165–11178, https://doi.org/10.5194/acp-12-11165-2012, 2012b.
Yao, X. and Zhang, L.: Causes of large increases in atmospheric ammonia in the last decade across North America, ACS Omega, 4, 22133–22142, https://doi.org/10.1021/acsomega.9b03284, 2019.
Yao, X. and Zhang, L.: Decoding long-term trends in the wet deposition of sulfate, nitrate, and ammonium after reducing the perturbation from climate anomalies, Atmos. Chem. Phys., 20, 721–733, https://doi.org/10.5194/acp-20-721-2020, 2020.
Yao, X. and Zhang, L.: Identifying decadal trends in deweathered concentrations of criteria air pollutants in Canadian urban atmospheres with machine learning approaches, Atmos. Chem. Phys., 24, 7773–7791, https://doi.org/10.5194/acp-24-7773-2024, 2024.
Yao, X., Lau, A. P. S., Fang, M., Chan, C. K., and Hu, M.: Size distributions and formation of ionic species in atmospheric particulate pollutants in Beijing, China: 1 – inorganic ions, Atmos. Environ., 37, 2991–3000, https://doi.org/10.1016/S1352-2310(03)00255-3, 2003.
Yao, X., Lee, C. J., Evans, G. J., Chu, A., Godri, K. J., McGuire, M. L., Ng, A. C., and Whitelaw, C.: Evaluation of ambient SO2 measurement methods at roadside sites, Atmos. Environ., 45, 2781–2788, https://doi.org/10.1016/j.atmosenv.2011.01.070, 2011.
Yeganeh, B., Shakerdonyavi, A., Zafarmomen, N., and Taheri, A.: Comprehensive spatiotemporal analysis of long-term mobile monitoring for traffic-related particles in a complex urban environment, Atmos. Pollut. Res., 102870, https://doi.org/10.1016/j.apr.2025.102870, 2025.
Zaveri, R. A., Easter, R. C., Singh, B., Wang, H., Lu, Z., Tilmes, S., Emmons, L. K., Vitt, F., Zhang, R., Liu, X., Ghan, S. J., and Rasch, P. J.: Development and evaluation of chemistry-aerosol-climate model CAM5-Chem-MAM7-MOSAIC: Global atmospheric distribution and radiative effects of nitrate aerosol, J. Adv. Model. Earth Syst., 13, e2020MS002346, https://doi.org/10.1029/2020MS002346, 2021.
Zhai, S., Jacob, D. J., Wang, X., Liu, Z., Wen, T., Shah, V., Li, K., Moch, J. M., Bates, K. H., Song, S., Shen, L., Zhang, Y., Luo, G., Yu, F., Sun, Y., Wang, L., Qi, M., Tao, J., Gui, K., Xu, H., Zhang, Q., Zhao, T., Wang, Y., Lee, H. C., Choi, H., and Liao, H.: Control of particulate nitrate air pollution in China, Nat. Geosci., 14, 389–395, https://doi.org/10.1038/s41561-021-00726-z, 2021.
Zhang, L., Vet, R., Wiebe, A., Mihele, C., Sukloff, B., Chan, E., Moran, M. D., and Iqbal, S.: Characterization of the size-segregated water-soluble inorganic ions at eight Canadian rural sites, Atmos. Chem. Phys., 8, 7133–7151, https://doi.org/10.5194/acp-8-7133-2008, 2008.
Zhang, Q., Wang, Y., Liu, M., Zheng, M., Yuan, L., Liu, J., Tao, S., and Wang, X.: Wintertime formation of large sulfate particles in China and implications for human health, Environ. Sci. Technol., 57, 20010–20023, https://doi.org/10.1021/acs.est.3c05645, 2023.
Zhang, Z., Li, Y., Zhang, X., Zhang, H., and Wang, L.: Review of hazardous materials in condensable particulate matter, Fuel Process. Technol., 220, 106892, https://doi.org/10.1016/j.fuproc.2021.106892, 2021.
Zhao, S., Hu, B., Gao, W., Li, L., Huang, W., Wang, L., Yang, Y., Liu, J., Li, J., Ji, D., Zhang, R., Zhang, Y., and Wang, Y.: Effect of the “coal to gas” project on atmospheric NOX during the heating period at a suburban site between Beijing and Tianjin, Atmos. Res., 241, 104977, https://doi.org/10.1016/j.atmosres.2020.104977, 2020.
Zhou, M., Nie, W., Qiao, L., Huang, D. D., Zhu, S., Lou, S., Wang, H., Wang, Q., Tao, S., Sun, P., Liu, Y., Xu, Z., An, J., Yan, R., Su, H., Huang, C., Ding, A., and Chen, C.: Elevated formation of particulate nitrate from N2O5 hydrolysis in the Yangtze River Delta region from 2011 to 2019, Geophys. Res. Lett., 49, e2021GL097393, https://doi.org/10.1029/2021GL097393, 2022.
Zhu, Y., Sabaliauskas, K., Liu, X., Meng, H., Gao, H., Jeong, C.-H., Evans, G. J., and Yao, X.: Comparative analysis of new particle formation events in less and severely polluted urban atmosphere, Atmos. Environ., 98, 655–664, https://doi.org/10.1016/j.atmosenv.2014.09.043, 2014.