the Creative Commons Attribution 4.0 License.
the Creative Commons Attribution 4.0 License.
 | 14 Apr 2026
Impact of primary oxygenated volatile organic compounds on ozone formation in the Yangtze River Delta region
Xun Li
Xuan Li
Rusha Yan
Yaqin Gao
Kangjia Gong
Hongli Wang
Momei Qin
Jianlin Hu
Oxygenated volatile organic compounds (OVOCs) play a crucial role in tropospheric radical chemistry, which in turn enhances atmospheric oxidation capacity and drives the formation of secondary pollutants. However, large uncertainties in their emissions pose challenges to accurately assessing their impacts on regional air quality. In this study, we incorporate updated anthropogenic emission inventories for the Yangtze River Delta (YRD) region, featuring source-resolved OVOC profiles derived from measurements and literature, into the Community Multiscale Air Quality (CMAQ) model to improve regional OVOC simulations. The model reproduced the diurnal and seasonal variations of most observed OVOC concentrations, particularly carbonyl compounds, with moderate correlation coefficients of 0.40–0.79. Primary OVOCs originating from direct emissions accounted for 30 %–70 % of total OVOC concentrations, with higher contributions during colder months due to weaker atmospheric oxidation capacity and slight increases in anthropogenic OVOC emissions. In urban areas, hydroperoxyl radicals (HO2) served as a dominant oxidant driving NO-to-NO2 conversion, with more than 90 % of primary HO2 production attributed to OVOC photooxidation. Primary OVOCs alone accounted for approximately 20 %–50 % of primary HO2 production, with stronger influences in regions with elevated OVOC emissions. Sensitivity analysis further indicated that key primary OVOCs contributed to ozone formation at levels comparable to traditional VOC precursors. These findings underscore the critical yet often overlooked role of primary OVOCs in urban ozone formation, highlighting the need for more comprehensive assessments in regions like the YRD.
- Article
(6005 KB) - Full-text XML
-
Supplement
(3778 KB) - BibTeX
- EndNote


Tropospheric ozone (O3) pollution arises from the continuous oxidation of nitric oxide (NO) to nitrogen dioxide (NO2) by hydroperoxyl (HO2) and organic peroxy (RO2) radicals. These radicals are generated through initiation processes, such as the photolysis of oxygenated volatile organic compounds (OVOCs) and the ozonolysis of unsaturated VOCs, and are subsequently recycled via radical chain propagation reactions. Under polluted conditions, OVOC photolysis can become a dominant radical source, substantially enhancing O3 formation (Yang et al., 2024; Tan et al., 2019b; Xue et al., 2016; Qu et al., 2021; Stockwell et al., 2021). Box model simulations constrained by observed OVOC concentrations have significantly improved the simulated HO2, RO2, and hydroxyl (OH) radical levels (Wang et al., 2022b, 2023; Yang et al., 2022), underscoring the critical role of OVOCs in radical budgets. These findings highlight the need for accurate representation of OVOC speciation and concentrations in air quality models to support effective O3 mitigation strategies.
Significant discrepancies persist between modeled and observed OVOC concentrations. Box models driven by observed pollutant concentrations, which reflect the chemically aged residuals of reactive species, may misrepresent OVOC variations (Liu et al., 2015). As OVOCs are generated through the multi-step oxidation of VOCs, chemical transport model biases are strongly influenced by uncertainties in VOC precursor emissions, which largely depend on the accuracy of activity data and emission factors (Smith et al., 2022). In addition, the chemical production and loss pathways of OVOCs play a critical role. For example, the yield of formaldehyde (HCHO), the simplest aldehyde, is highly sensitive to isoprene chemistry and can directly affect ozone production rates (Marvin et al., 2017). The uptake of small aldehydes and organic acids by deliquesced particles represents an important source of secondary organic aerosols (SOAs). While the SOA formation mechanisms of glyoxal and methylglyoxal have been extensively studied, the contribution of other small aldehydes and organic acids remains poorly quantified due to limited studies and sparse observational data (Gkatzelis et al., 2021).
Another important yet often overlooked factor lies in the uncertainties associated with OVOC emissions. Only a limited number of OVOC species are explicitly represented in most emission inventories, partially due to the constraints of traditional detection techniques (Pfannerstill et al., 2023; Wang et al., 2022a). Moreover, VOC and OVOC sources are typically aggregated into broad categories (e.g., industry, transportation, residential, and power), and their total emissions are generally reported on a monthly or annual basis. This introduces substantial uncertainties in temporal and spatial allocations, particularly for industrial sources that encompass diverse processes and exhibit sector-specific characteristics (Hu et al., 2025). In addition, emerging sources of OVOC emissions, such as ancillary solvent use associated with vehicles, are not yet incorporated into emission estimation methodologies (Cliff et al., 2023). Collectively, uncertainties in emissions and chemical mechanisms contribute to substantial underestimations of certain OVOCs, such as HCHO, alcohols, ketones, and organic acids, particularly in urban environments dominated by anthropogenic emissions (Luecken et al., 2018; He et al., 2024; Liu et al., 2023; Pfannerstill et al., 2023). In recent years, several studies have developed OVOC emission profiles with improved speciation and quantification accuracy (Wang et al., 2024a, 2022a; Ou et al., 2015; Mo et al., 2016). Nevertheless, differences in emission development methods and the limited representation of source categories lead to substantial variations in reported OVOC and VOC source profiles (Niu et al., 2023), which hinder systematic investigations into the spatiotemporal characteristics of OVOCs and their roles in regional ozone formation.
In this study, an updated emission inventory with refined profiles of OVOCs and their VOC precursors is incorporated into the Community Multiscale Air Quality (CMAQ) model to improve OVOC simulations over the Yangtze River Delta (YRD) region in China. Our previous work demonstrated the critical role of OVOC oxidation in enhancing atmospheric oxidation capacity and promoting ozone formation in this region, based on top-down emission adjustments constrained by field observations (Li et al., 2022a). To build upon those findings, we employ a speciation-improved bottom-up approach by integrating updated sector-specific source profiles into the YRD emission inventory, thereby refining the speciation of primary OVOCs and quantifying the contributions of their precursors. Based on this refinement, the roles of primary and secondary OVOCs in radical production and ozone formation, as well as the significance of primary OVOCs and traditional VOC precursors on ozone mitigation during a pollution episode, are investigated. These findings help bridge the knowledge gap regarding the complex sources and atmospheric evolution of OVOCs, elucidating their crucial roles in influencing urban ozone chemistry.
2.1 Model description
The CMAQ model version 5.2, coupled with the SAPRC07tic chemical mechanism and the AERO6 aerosol module, was applied to simulate OVOC distributions in the YRD during 27 March–30 April (EP1) and 20 October–20 November (EP2) of 2019. Several model updates, including heterogeneous reactions of sulfur dioxide (SO2), NO2, glyoxal, and methylglyoxal, were implemented as described in a previous study (Mao et al., 2022). Two nested domains were configured, with the outer domain (d01) covering eastern China and the inner domain (d02) encompassing the YRD. These domains had horizontal resolutions of 12 km × 12 km (127 × 202 grid cells) and 4 km × 4 km (238 × 268 grid cells), respectively (Fig. S1 in the Supplement). Meteorological fields were generated using the Weather Research and Forecasting (WRF) model version 4.2.2, with initial and boundary conditions provided by the fifth generation ECMWF atmospheric reanalysis of the global climate (ERA5) dataset. Anthropogenic emissions in d01 were derived from the Multi-resolution Emission Inventory for China (MEIC) version 1.4 (Geng et al., 2024) for mainland China and the Regional Emission inventory in ASia (REAS) version 3.2.1 (Kurokawa and Ohara, 2020) for other Asian countries and regions. For d02, the 2019 YRD emission inventory incorporating updated VOC profiles (2019 YRD inventory) was applied to the YRD, while the MEICv1.4 was used for the remaining regions. Biogenic emissions were generated using the Model of Emissions of Gases and Aerosols from Nature (MEGAN) version 2.1. Open biomass burning emissions were based on the Fire INventory from NCAR (FINN) version 2.5 (Wiedinmyer et al., 2023). The spatial and temporal allocations of anthropogenic and open biomass burning emissions followed previous work (Hu et al., 2016; An et al., 2021). Notably, the temporal allocation did not account for temporary emission control measures during the China International Import Expo 2019 (CIIE 2019, 27 October–10 November 2019) (Wang et al., 2025). To avoid potential biases and to better represent typical emission conditions in the YRD, model simulation results for this period were excluded from the analysis. In addition, the first five days of each simulation were designated as spin-up and were not considered in subsequent analysis. A complete list of all OVOCs and their precursors used in the model is provided in Table S1 in the Supplement.
The 2019 YRD inventory was developed based on the 2017 version (An et al., 2021), with updated activity data for each source sector. Key improvements included refined VOC speciation, particularly of OVOCs, for major source categories such as transportation (gasoline and diesel vehicles), industrial processes, and residential biomass burning (Gao et al., 2022; Wang et al., 2022a). The VOC composition of emissions from diesel vehicles, industrial processes, and residential biomass burning was characterized based on 160 localized, source-resolved measurements conducted in China. Specifically, twenty in-use heavy-duty diesel vehicles from five major brands were tested, encompassing China VI (n=6), China V (n=10), and China IV (n=4) emission standards. For industrial emissions, a total of 84 samples were collected from priority sectors, including petrochemical industries, chemical raw material production, and other chemical production sectors such as plywood production, coking, pesticides production, ink production, and rubber production. For residential biomass burning, 23 samples of the combustion of four representative biomass fuels (wood, corncob, bean straw, and corn straw) and two common coal types (anthracite and briquette coal) were collected from the stack nozzles of household stoves. Details of the sampling protocols and analytical procedures can be found in a previous study (Gao et al., 2023). VOC profiles for other sources, such as gasoline vehicles, were based on published literature (Wang et al., 2022a; Huang et al., 2024). To develop representative source profiles, a two-step aggregation method was employed. First, sub-category average profiles were derived by averaging individual samples within each specific emission standard, industrial stage, and types of raw materials, products, and fuels. Second, the integrated source profiles were synthesized by weighting these sub-category profiles according to their corresponding total VOC emissions. This method aligns with the national technical guidelines for integrated air pollutant emission inventories (Ministry of Ecology and Environment, 2024).
As a result of these refinements, OVOCs accounted for 56.9 % of total VOC emissions from diesel vehicles (DVE), followed by 44.6 % from residential biomass burning (RBB) and 39.2 % from industrial processes (INP) (Table S2). Among all OVOCs, carbonyl species showed significant enhancements in these three source categories. Aldehyde contributions nearly doubled in DVE and INP, with a particularly large increase in HCHO. In contrast, the emissions of alcohols, such as methanol (MEOH) and ethanol (ETOH) from INP, decreased. Contributions from other OVOCs, including acetic acid (CCOOH) as well as phenols and cresols (CRES), also increased in INP and DVE. Although the overall OVOC fraction from gasoline vehicle emissions slightly decreased, the chemical composition exhibited a marked change, with increases in carbonyls and decreases in alcohols and esters. In this study, primary OVOCs are defined as those directly emitted from anthropogenic and biogenic sources, whereas secondary OVOCs refer to those formed via the photooxidation of VOC precursors.
2.2 Observation data
A suite of pollutant and meteorological observations from ground monitoring stations (Fig. S1) was collected for model evaluation. High time-resolution measurements of 77 OVOCs, including 14 aldehydes and ketones, 23 organic acids and esters, 10 furan compounds, and 30 oxygenated aromatic compounds, were recorded at a 10 s interval using a Proton Transfer Reaction-Quadruple interface Time-of-Flight Mass Spectrometer (PTR-QiTOF) at the Shanghai Academy of Environmental Sciences (SAES). Species were identified by jointly applying the Tofware software package v3.2.3 (Tofwerk Inc.), the proton transfer reaction mass spectrometry (PTR-MS) spectral library (Pagonis et al., 2019), the PubChem database, and source-specific emission profiles reported in literature (Hatch et al., 2017; Koss et al., 2018; Stockwell et al., 2021; Tanzer-Gruener et al., 2022; Coggon et al., 2021). Sensitivities for species with authentic standards were determined through calibration using multi-gradient known concentrations of given VOCs. For identified species lacking standards, their theoretical sensitivities were estimated based on correlations with kinetic rate constants of VOCs (Sekimoto et al., 2017). The raw data were screened to remove outliers (values below background levels) and missing data, and then averaged to hourly means.
In addition, C2–C12 hydrocarbons, C2–C5 carbonyls, and C1–C4 alcohols were measured using an online gas chromatography system equipped with a mass spectrometer and a flame ionization detector (GC-MS/FID, TH-300, Wuhan Tianhong Instruments, China) at an hourly resolution. For major aromatic hydrocarbons and carbonyl compounds, good agreement between measurements by PTR-QiTOF and GC-MS/FID was observed (Gao et al., 2022). Formaldehyde and peroxyacetyl nitrate (PAN) were measured using a commercial Hantzsch monitor (AL4021, Aero-Laser GmbH, Germany) and an online gas chromatography-electron capture detector (PANs-1000, Focused Photonics, China), respectively. Details on the instrumentation, analytical procedures, and data quality assurance have been described in previous work (Gao et al., 2022; Liu et al., 2019; Du et al., 2025; Gao et al., 2023).
Hourly O3 concentrations in 14 cities across the YRD were obtained from the China National Environmental Monitoring Center (https://air.cnemc.cn:18007; last access: 1 November 2024). Meteorological parameters, including temperature, relative humidity, wind speed, and wind direction, were obtained for four representative cities (Shanghai, Nanjing, Hefei, and Hangzhou) from the China Meteorological Administration (http://data.cma.cn/; last access: 1 November 2024). To evaluate model performance, statistical metrics such as Pearson correlation coefficient (R), mean bias (MB), mean error (ME), normalized mean bias (NMB), normalized mean error (NME), root mean square error (RMSE), and index of agreement (IOA) were calculated and compared against benchmark values where available (Tables S3, S4). Additional details are provided in Sect. S1 in the Supplement, and comparisons between model results and observations can be found in Figs. S2–S5.
3.1 Model evaluation
Comparisons between observed and predicted OVOC concentrations at SAES are presented in Figs. 1 and S6, with the corresponding statistical metrics summarized in Table S5. Among all the observed OVOCs, alcohols emerged as the dominant species in spring (EP1), with ethanol exhibiting the highest median concentrations (6–12 ppb), which declined to 1.9–4.6 ppb in fall (EP2). The model underestimated ethanol during both episodes, with larger biases in EP1. This discrepancy may be attributed to uncertainties in the emission inventory. The monitoring site is located in a typical urban environment characterized by dense commercial and residential buildings and heavy traffic, with strong influences from transportation and solvent use emissions (Liu et al., 2019, 2021). One likely underestimated source of alcohols is the use of alcohol-containing solvent products such as windshield washer fluid, particularly from electric vehicles (Cliff et al., 2023). Considering the rapid growth in electric vehicle ownership in China in recent years, the relative importance of this alcohol source is expected to increase. Another potential source of alcohols is the use of household cleaning and personal care products, which may not be fully represented in the current emission inventory (Mo et al., 2021; Wang et al., 2024b).
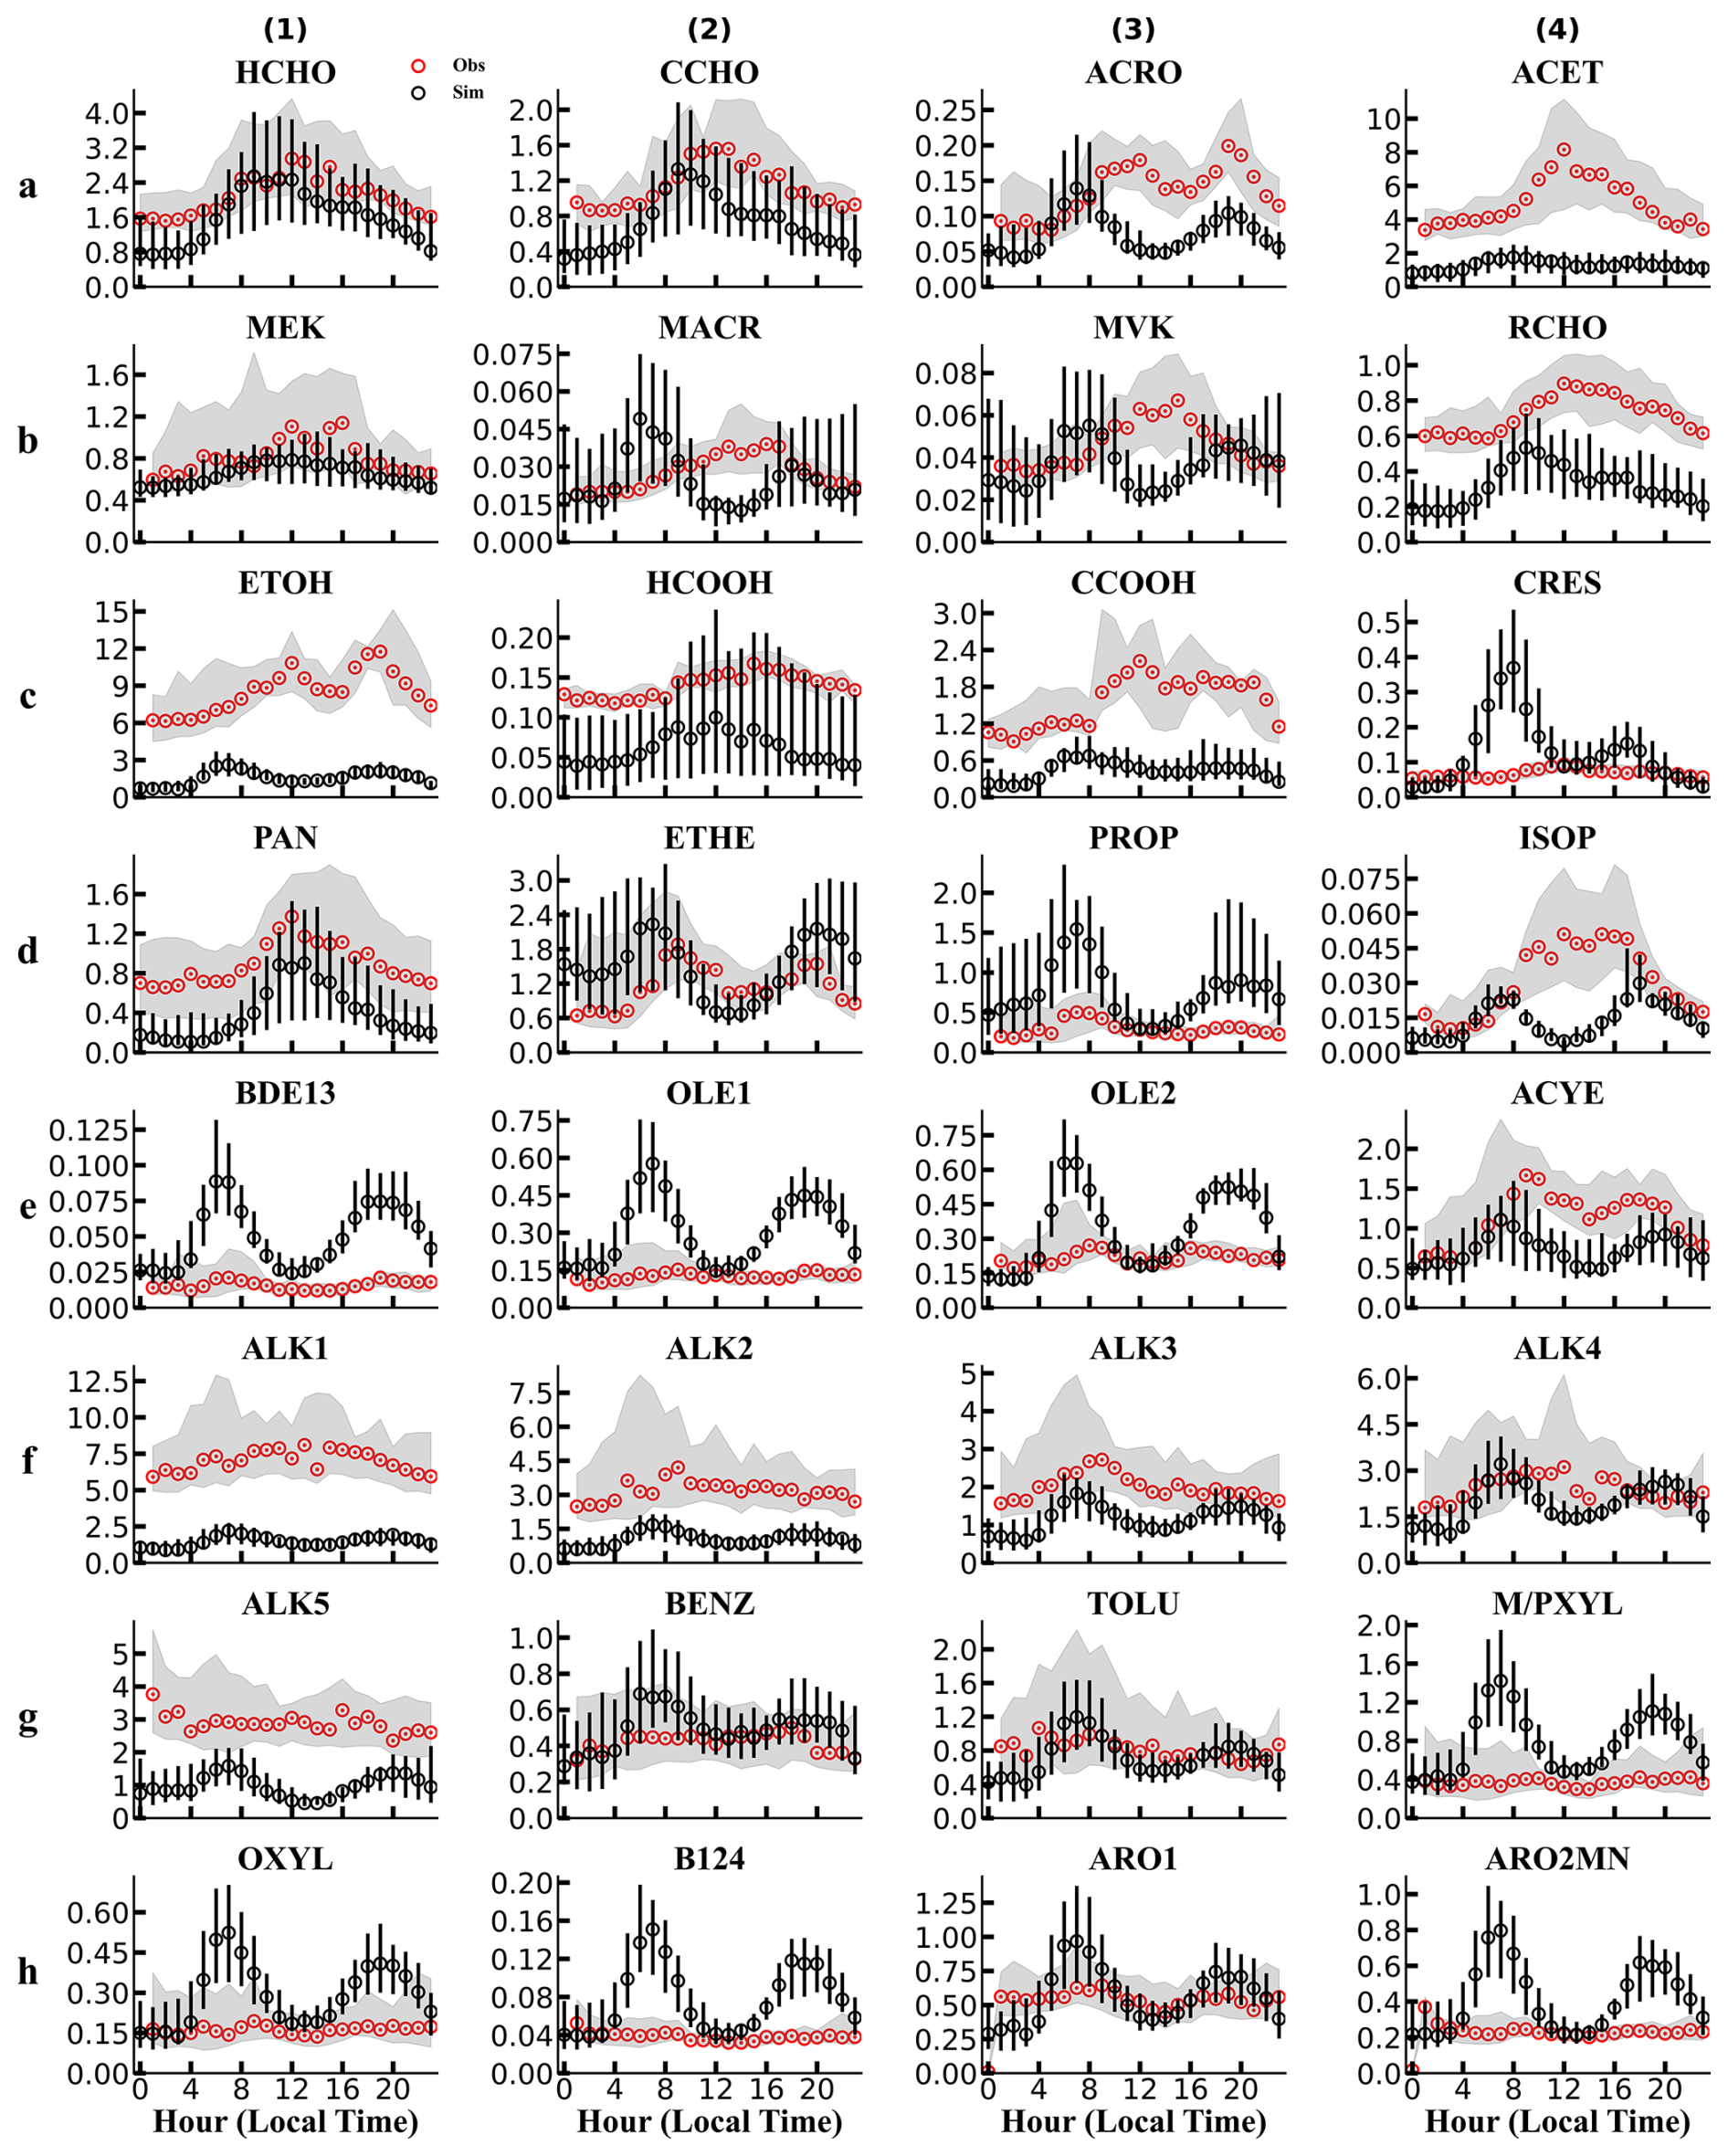
Figure 1Diurnal variations of OVOCs and their precursors in Shanghai, April 2019 (ppb). Red and black circles indicate the median observations and model predictions, respectively; shaded areas and black bars represent the interquartile ranges (25th–75th percentiles) of observations and model predictions, respectively.
Formic acid and acetic acid were the most abundant organic acids during both episodes, with the average concentrations of 0.15 (1.95) ppb and 1.88 (2.59) ppb in the EP1 (EP2) period, respectively. The model consistently underestimated both species, with larger biases in EP2 (Fig. S6 and Table S5). These discrepancies may be partially attributed to uncertainties in the emission inventory. During EP2, acetic acid exhibited strong correlations with biomass burning tracers, such as guaiacol and furan compounds and their derivatives (Pearson coefficients >0.80, p<0.001). In addition, acetic acid showed consistently high correlations with ethyl acetate, methyl ethyl ketone (MEK), and toluene (Pearson coefficients of 0.75–0.85, p<0.001) in both periods, species that are commonly associated with emissions from volatile chemical products (VCPs) (Wang et al., 2024b; McDonald et al., 2018). The underestimation of emissions from these sources likely contributes to the low bias in simulated acetic acid concentrations. However, MEK and toluene may also originate from other sources, such as fuel combustion, and their model performance varied between episodes, being slightly underestimated in EP1 but overestimated in EP2. Therefore, the underestimation of both formic and acetic acids may partially stem from insufficient representation of secondary production. Observations showed that formic acid exhibited moderate to strong correlations with its precursor methylglyoxal in both periods. Laboratory studies have demonstrated that both formic and acetic acids can be produced via aqueous-phase reactions of glyoxal and methylglyoxal (Yu et al., 2011; Zhang et al., 2021; Sui et al., 2017; Lim et al., 2013), with uptake modulated by interactions with inorganic aerosols (i.e., salting effects) (Waxman et al., 2015; Kampf et al., 2013). In the current model, these heterogeneous processes are represented by first-order reactions, with rate constants determined by fixed uptake coefficients (γ=0.016 during daytime and a constant loss rate of s−1 at night), and all products are lumped into a single surrogate species. The simplified treatment of heterogeneous chemistry likely leads to an underestimation of formic and acetic acids, particularly under high aerosol loadings in urban environments, where salting-out effects reduce their solubility in the aqueous phase (Babaei-Gharehbagh et al., 2025). Other sources of model bias may include missing secondary formation pathways, such as multiphase reactions of HCHO and photochemical aging of aerosols, and underestimated yields of formic and acetic acids from precursor VOCs (Yuan et al., 2015; Millet et al., 2015; Permar et al., 2023; Jiang et al., 2023; Cope et al., 2021; Franco et al., 2021; Malecha and Nizkorodov, 2016; Shen et al., 2026).
Most carbonyl species were well captured by the model. During the warm season (EP1), observed carbonyl concentrations exhibited pronounced diurnal variations with daytime maxima, primarily driven by photochemical production. In contrast, such diurnal patterns were less evident in EP2 (Fig. S6), likely due to reduced secondary formation under lower atmospheric oxidation capacity (Fig. S7). HCHO and acetone (ACET) were the most abundant aldehyde and ketone species, with average observed concentrations of 2.52 (2.58) ppb and 5.75 (1.89) ppb during EP1 (EP2), respectively. HCHO is a common oxidation product of VOCs in the troposphere and can also originate from emissions, including fuel and biomass combustion, industrial processes, and the evaporation of indoor building materials (Wang et al., 2022a; Xing et al., 2024; Liang and Yang, 2013; Permar et al., 2021). The model generally reproduced the observed HCHO concentrations, although slight underestimations persisted in both seasons (Table S5). Model performance for ACET varied seasonally, with good agreement in EP2 but significant underestimation in EP1. Since biogenic sources of acetone are important (Lyu et al., 2024; Hu et al., 2013), the larger discrepancy observed in the warm season may be partially due to the model's inadequate representation of urban green vegetation (Maison et al., 2024; Ma et al., 2022).
Notably, biases in OVOC concentrations are influenced by those of their precursors. For example, model biases in methacrolein (MACR) and methyl vinyl ketone (MVK) exhibited similar temporal patterns to those of isoprene (ISOP), reflecting their common origin via isoprene oxidation. The model failed to reproduce the peak noon concentration of isoprene, likely due to the underestimated biogenic emissions from urban green spaces. Overall, most key OVOC precursors, including reactive alkanes (ALK3/ALK4), aromatic hydrocarbons, and alkenes (e.g., ethylene and propylene), were well captured by the model. The simultaneous overestimation of reactive VOC precursors and underestimation of OVOCs also indicates that uncertainties in their photochemical mechanisms may contribute to the model biases in OVOC concentrations.
3.2 Regional characteristics of OVOCs
At the regional scale, average OVOC concentrations across the YRD ranged from 5 to 25 ppb in both periods, with elevated levels observed in the central and northern areas (Fig. 2a, d). HCHO, MEOH, ACET, and acetaldehyde (CCHO) were the dominant species (Fig. S8), with concentration ranges of 2–8, 2–4, 2–4, and 1–3 ppb, respectively. High levels of HCHO, ACET, and CCHO mainly occurred in areas strongly influenced by anthropogenic emissions, where MEOH was predominantly concentrated in regions affected by biogenic emissions in the southern and southwestern YRD (Fig. S9). The concentrations of ETOH, HCOOH, and CCOOH fell in ranges of 1.0–3.0, 0.1–0.4, and 0.5–2.0 ppb, respectively. Given the substantial underestimations of all three species, their actual concentrations are likely higher than the model predictions. In contrast to observations in Shanghai, the model predicted higher concentrations of most OVOCs in EP2 than in EP1 across the YRD, likely due to biases in the model representation of OVOCs (Table S5). The higher simulated MEOH concentrations in EP1 relative to EP2 may be partially attributed to stronger contributions from biogenic sources during the warm season (Fig. S9d, h).
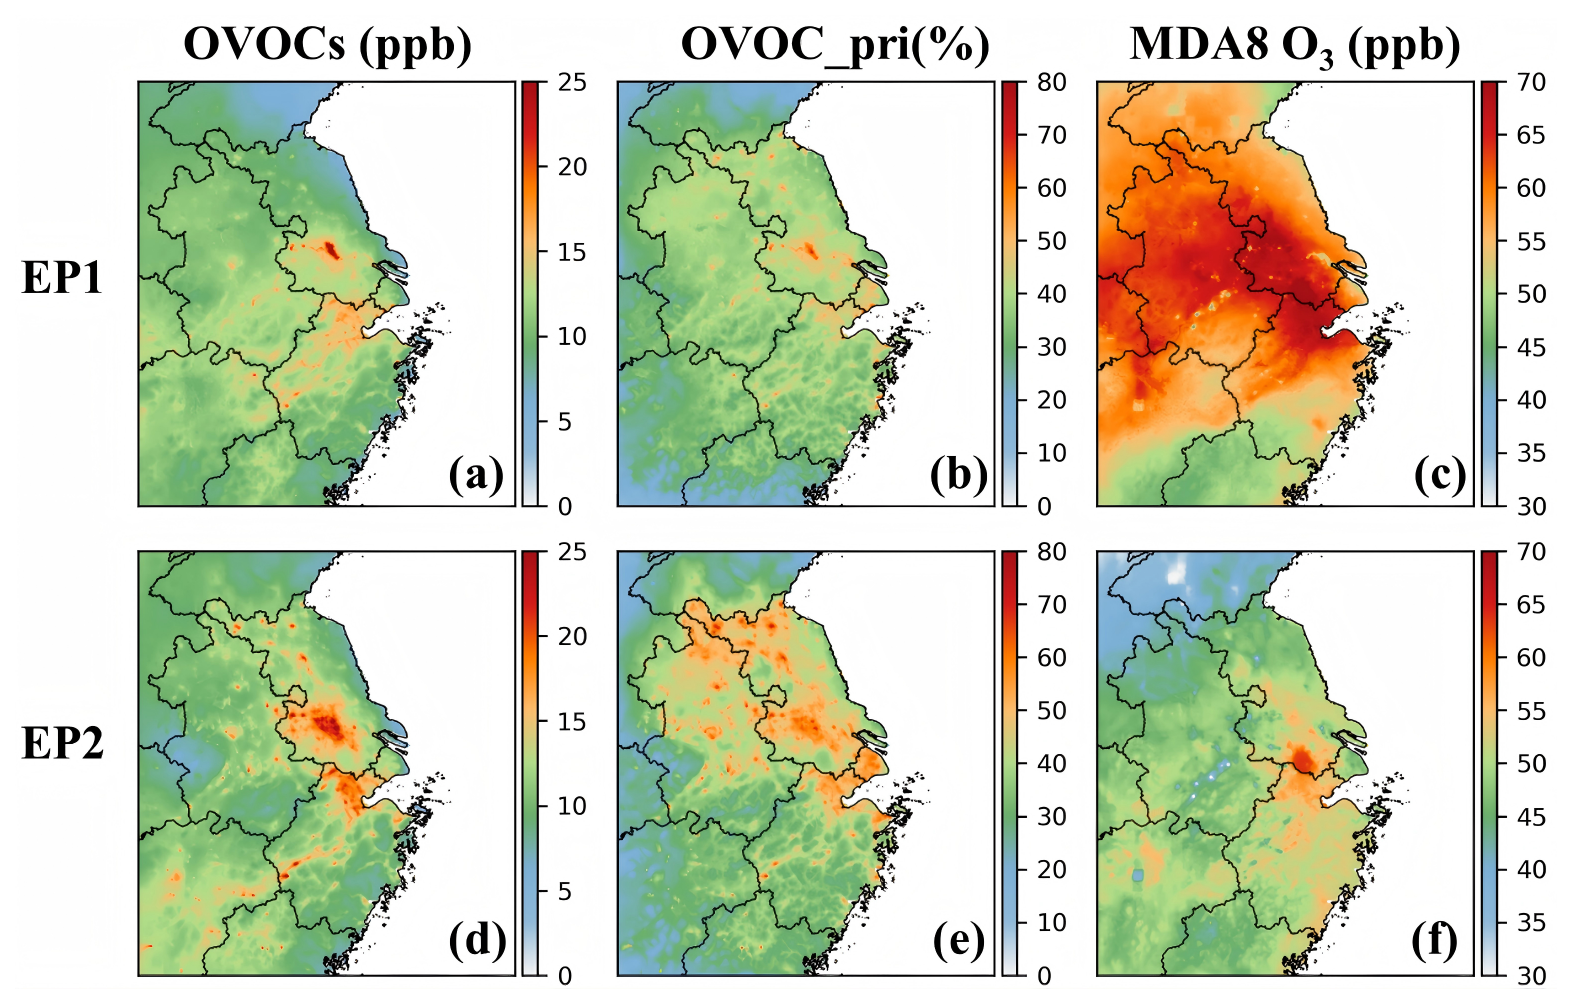
Figure 2Episode-averaged total OVOC concentrations (a, d), emission contributions to total OVOCs (b, e), and daily maximum 8 h average ozone (MDA8 O3) concentrations (c, f) during the two episodes.
On average, the model predicted that approximately 30 %–70 % of total OVOCs originated from emissions rather than from VOC oxidation production. The contributions of primary OVOCs showed significant seasonal and spatial variations. During the warm season, secondary OVOCs dominated across the entire domain, while elevated emission contributions were observed along the Yangtze River and in northern Jiangsu, northern Zhejiang, and Shanghai (Fig. 2b). In contrast, during the cold season, primary OVOCs played a larger role in Jiangsu and Anhui Provinces as well as in Shanghai and northern Zhejiang (Fig. 2e), consistent with our previous findings for October 2017 in the YRD (Li et al., 2022a).
CRES accounted for the highest OVOC emission rate across the YRD (22 %), followed by HCHO (16 %), ACET (14.4 %), CCOOH (12.5 %), and ETOH (9.5 %) (Table S6). High emission contributions to ambient CRES and CCOOH were also observed, followed by ACET (Fig. S10). Notably, the emission contributions of CCOOH may be biased due to uncertainties in emission inventories and chemical production in the model. Primary emissions accounted for approximately 20 %–60 % of ambient HCHO, with maxima reaching up to 76 % in EP1 and 87 % in EP2 in Jiangsu Province. The model also estimated a substantial fraction of biacetyl (BACL) originating from primary emissions (more than 60 %), particularly in Jiangsu and Anhui Provinces, as well as Shanghai.
The spatial distributions of OVOCs and ozone were closely aligned, with OVOC hotspots coinciding with regions of elevated daily maximum 8 h average ozone (MDA8 O3) concentrations (Fig. 2c, f). Further analysis revealed that OVOC photooxidation constituted a significant source of HO2 radicals in the YRD, serving as a key driver of NO-NO2 cycling and thereby influencing ozone formation.
3.3 Role of OVOCs in ozone formation
To investigate the relationship between OVOCs and O3 formation at the monitoring site in Shanghai, a “clean period” (1–4 April) and a “pollution period” (5–7 April) were selected. During the clean period, observed MDA8 O3 concentrations (81.4–139.4 µg m−3) complied with China's Ambient Air Quality Standards (GB 3095-2012) threshold of 160 µg m−3. In contrast, MDA8 O3 levels during the pollution period ranged from 161.3 to 189.1 µg m−3, exceeding this standard. The model showed good agreement with observations, successfully capturing temporal variations of both MDA8 O3 and OVOC concentrations during these periods, demonstrating its capability to represent OVOC sources and sinks as well as their role in ozone formation.
The ozone production rate (P(O3), ppb h−1), defined as the rate at which ozone is produced through the conversion of NO to NO2 by peroxy radicals, was calculated as follows:
where k0 and ki are the rate constants for the reactions of NO with HO2 and RO2 radicals (unit: molec.−1 cm3 s−1), respectively, and [HO2], [RO2], and [NO] denote their respective concentrations (unit: ppb). In RO2 + NO reactions, alkyl nitrates can form as byproducts, with yields (α) depending on the specific RO2 species. Accordingly, a NO2 yield of (1−α) was applied to the corresponding RO2 + NO reactions. The NO2 molar yields for reactions producing alkyl nitrate byproducts in the current model are listed in Table S7. The analysis of P(O3) and radical chemistry is focused on the daytime period (09:00–17:00 local time).
As shown in Fig. 3a and b, the daytime average P(O3) during the clean period was approximately half that under the polluted conditions, at 5.89 and 12.2 ppb h−1, respectively. HO2-driven oxidation accounted for 53 %–61 % of daytime P(O3) during the clean period, increasing slightly to 54 %–63 % under the polluted conditions. Ozone production via the HO2 pathway peaked around noon, coinciding with the highest P(O3), and declined gradually to approximately 50 % later in the day. These results indicate that the HO2 pathway consistently dominates ozone production in Shanghai, regardless of pollution levels.
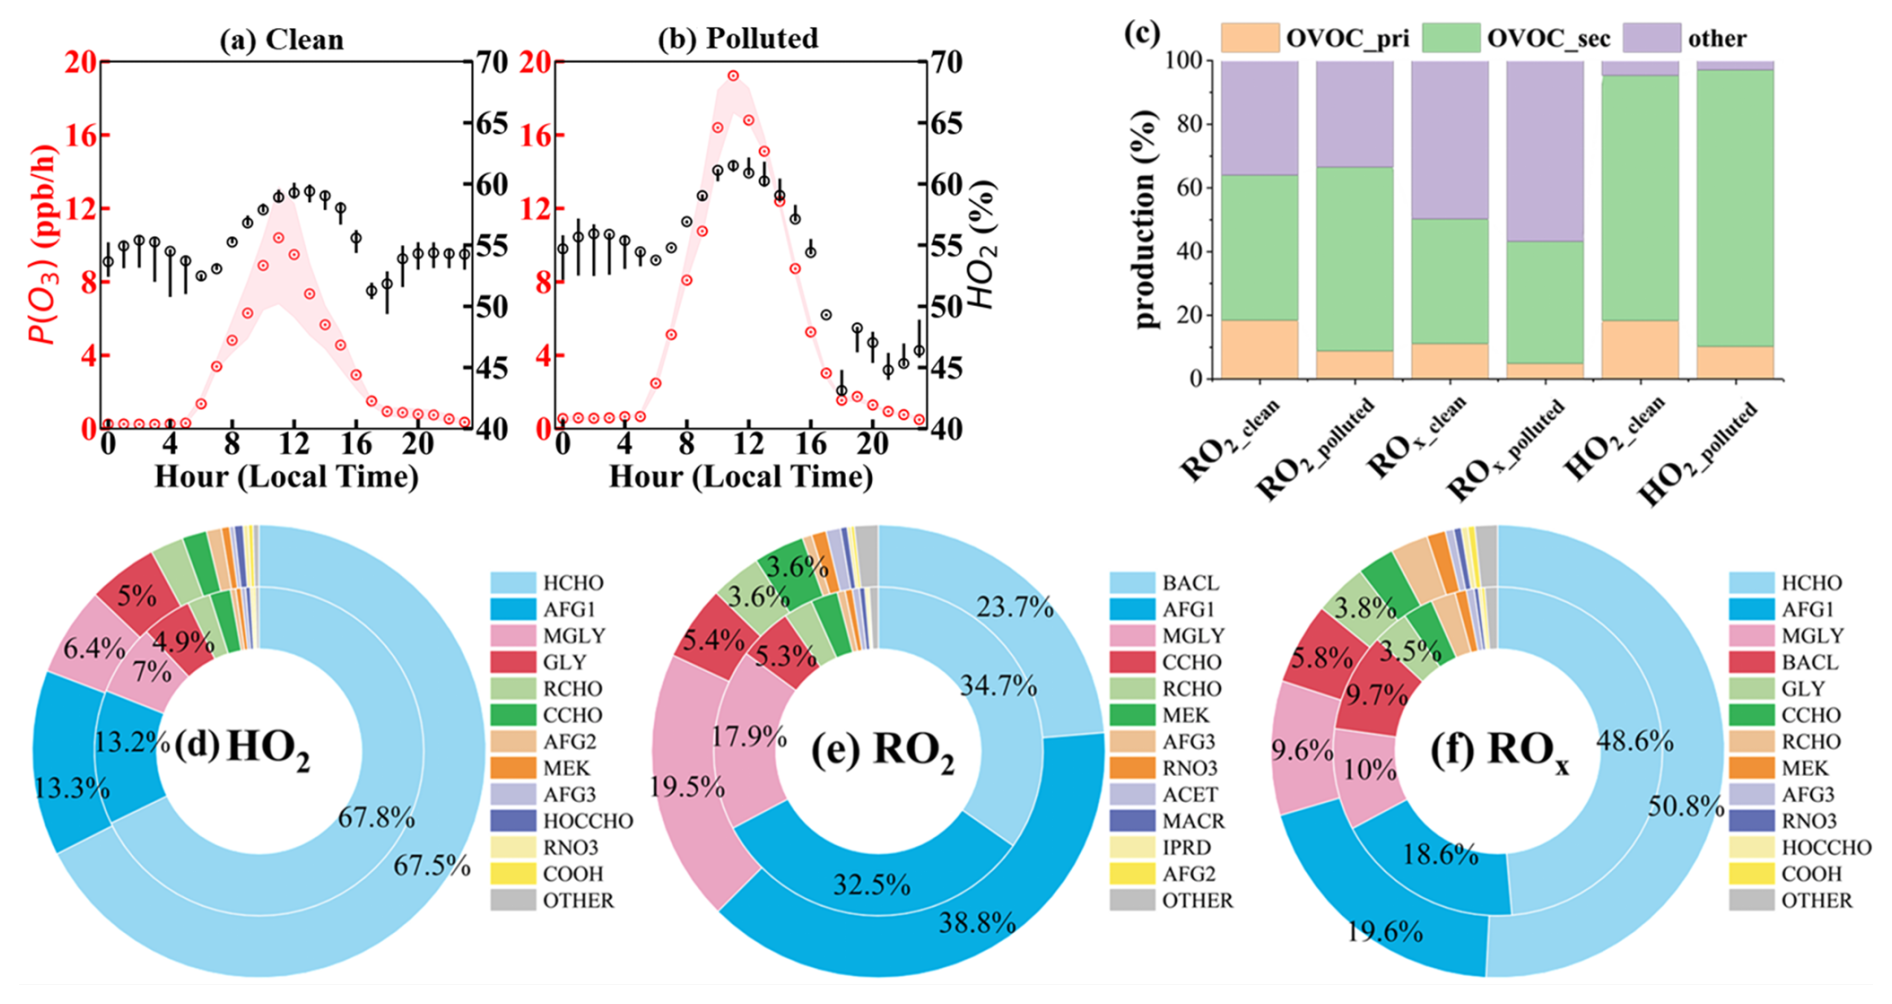
Figure 3Diurnal variations of ozone production rates (a, b) and contributions of major sources (c) and individual OVOC species (d–f) to daytime primary HO2, RO2, and ROx production under clean and polluted conditions at SAES in Shanghai. In (a) and (b), red and black circles represent the median P(O3) and the contribution of the HO2 + NO pathway, respectively. The shaded areas and black bars denote the interquartile ranges. In (c), “OVOC_pri” and “OVOC_sec” denote contributions from primary and secondary OVOCs, respectively. Panels (d)–(f) show the fractional contributions of individual OVOC species to total OVOC-derived primary radical productions during clean (inner ring) and polluted (outer ring) periods.
The dominant role of HO2-driven oxidation in ozone production was further confirmed in other urban areas of the YRD. During both EP1 and EP2, HO2 radicals contributed approximately 55 %–80 % of total ozone production in regions with elevated P(O3) (Figs. 4a, d and S11a, d). These regions, including Shanghai, are strongly affected by anthropogenic emissions, with substantial NOx emission rates (approximately 0.4–2.0 mol s−1; Fig. S9) and HO2 concentrations exceeding those of RO2 radicals (Fig. S11). In these urban areas, primary OVOCs from major sources, such as industrial processes, solvent use, residential sources, and transportation, made substantial contributions to P(O3) and peroxy radical levels (particularly HO2), ranging 5 %–40 % and 4 %–47 %, respectively (Figs. S12–S15). In contrast, the RO2 pathway dominated ozone production in the southern and southwestern parts of the domain, where high emissions of biogenic VOCs and relatively low emissions of NOx prevail (Fig. S9). The enhanced role of RO2 radicals in these regions is attributed to their higher concentrations and comparable reactivities to HO2 radicals in converting NO to NO2.
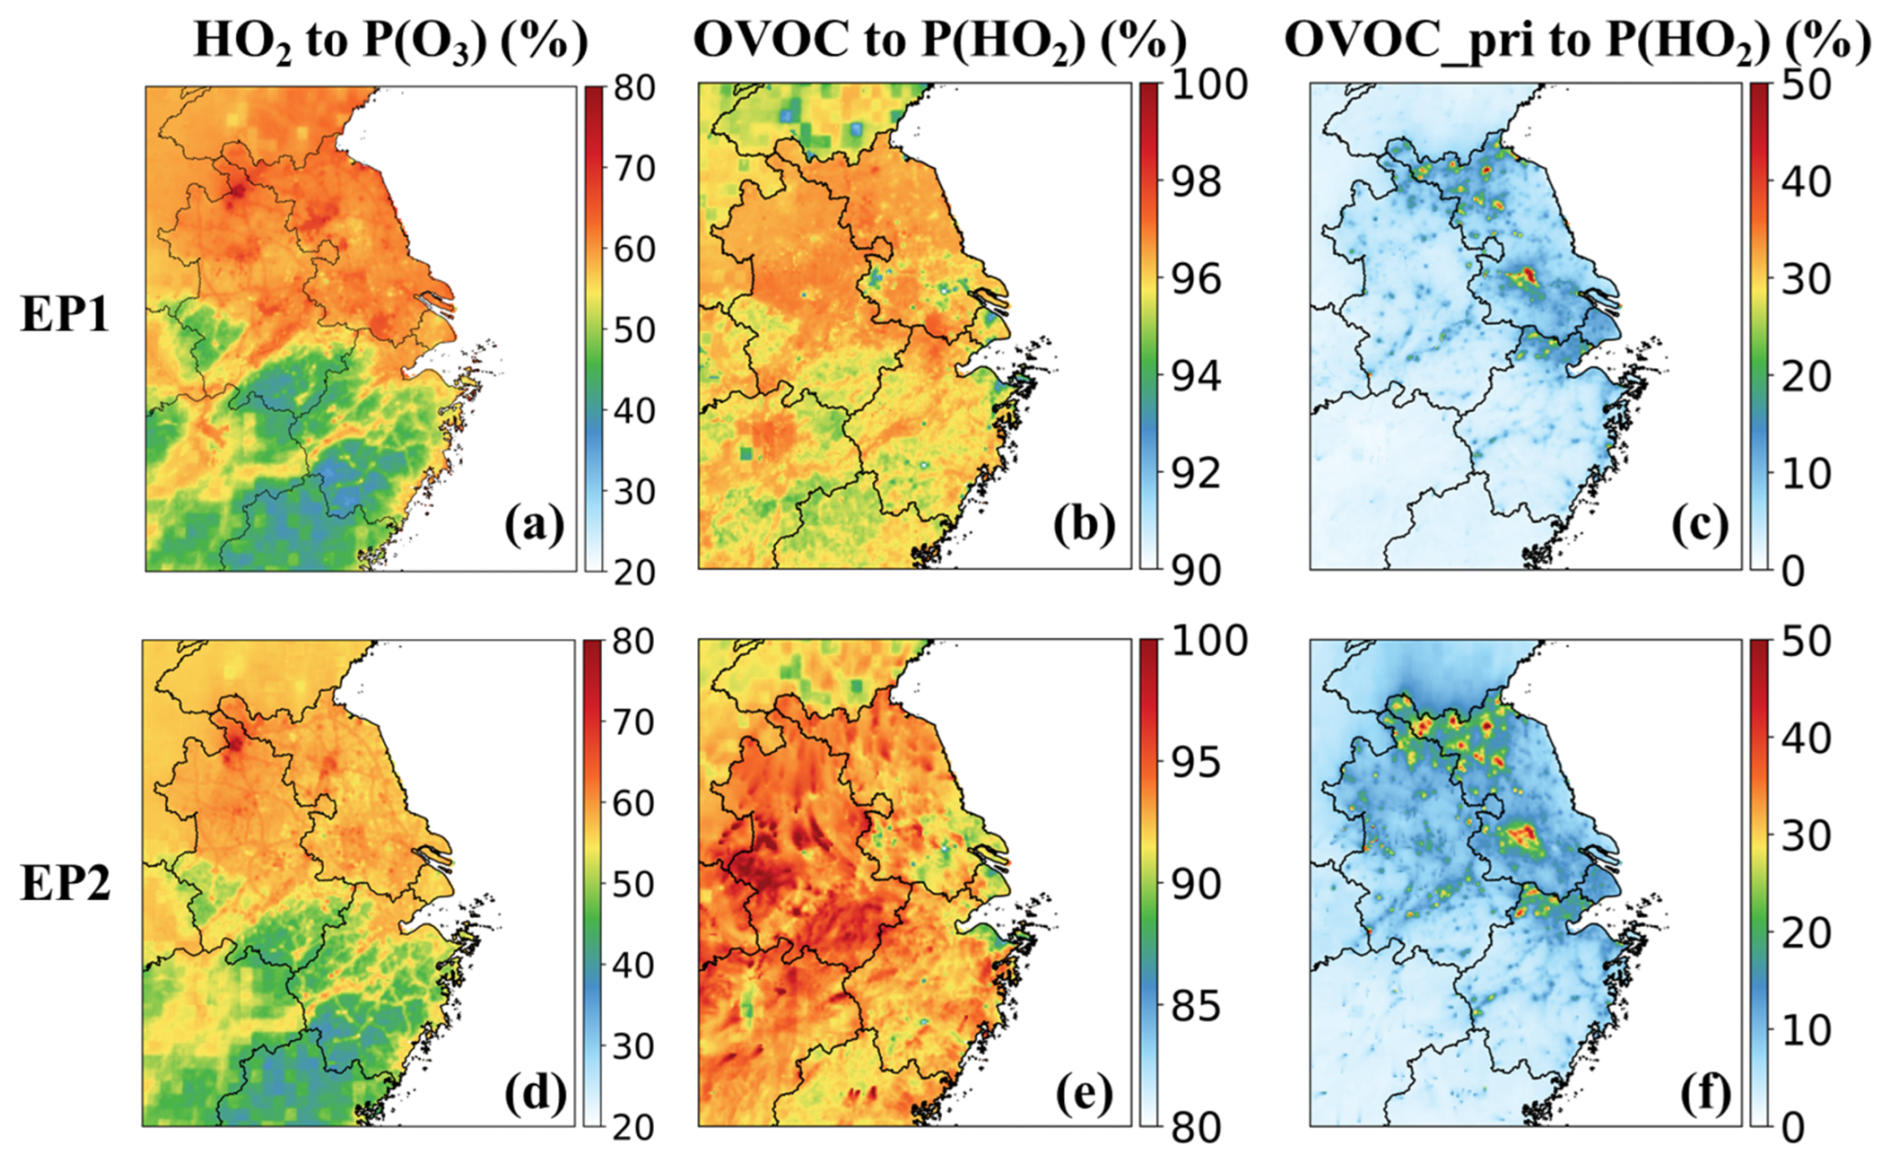
Figure 4Daytime-averaged contributions of the HO2 + NO pathway to ozone production rates (a, d), OVOC contributions to primary HO2 radical production (b, e), and contributions from primary OVOCs (c, f) during the two episodes.
To elucidate the mechanism of daytime HO2 radical production, the contributions of OVOCs to the formation of primary HO2, RO2, and ROx radicals (ROx = HO2 + OH + RO2) are assessed. Primary radicals refer to those generated through the photolysis of OVOCs, nitrous acid (HONO), and O3 and the ozonolysis of OVOCs and unsaturated VOCs, while contributions from radical interconversion and cycling are excluded. The contribution of HNO4 to HO2 production is not considered, as HNO4 is rapidly formed and decomposed through the reversible reaction between NO2 and HO2. RO2 production from peroxy organic nitrates (PNs) is also excluded from the analysis because peroxyacyl radicals rapidly react with NO2 to form PNs, leading to strong coupling between RO2 and PNs (Zeng et al., 2019; Zhang et al., 2015; Lin et al., 2024). Generally, OVOC photooxidation dominated primary HO2 radical production in Shanghai, with the contributions of 95.3 % and 97.0 % under clean and polluted conditions (Fig. 3c). Similar findings have been reported in other urban areas, where OVOC photolysis accounted for over 80 % of primary HO2 radicals, highlighting its importance in NO-NO2 cycling and ozone production (Qu et al., 2021; Xue et al., 2016; Yang et al., 2018). Notably, the significance of primary OVOCs in producing HO2 radicals is suppressed under polluted conditions, which was only half of that under clean conditions. This is associated with increases in both secondary OVOC concentrations and their relative contributions to total OVOCs.
As HO2 can be produced from RO2 and ROx radical cycling, the influences of OVOCs in the primary RO2 and ROx production are further examined. Similar to HO2, substantial contributions were observed from OVOCs, with a more significant contribution to RO2 by 64.0 % and 66.5 % during clean and polluted periods, respectively. HO2 can also be formed via RO2 + NO and RO2 + RO2 reactions. The high contribution to primary RO2 also conveys the crucial role of OVOCs in HO2 production. For ROx radicals, OVOCs still exhibited substantial impacts, accounting for 50.2 % and 43.2 % of their primary production rates under clean and polluted conditions. The contributions of primary OVOCs to RO2 and ROx are comparable to those to HO2 radicals, falling within the ranges of 8.69 %–18.4 % and 4.8 %–11.0 %, respectively. This suggests that secondary OVOCs are important contributors to HO2 production through radical chain propagation.
In Shanghai, HCHO was the most significant contributor to primary HO2 (∼ 68 %) under both clean and polluted conditions, followed by photoreactive monounsaturated dicarbonyls from aromatic fragmentation (AFG1, ∼ 13 %). Methylglyoxal (MGLY) and glyoxal (GLY) also played an important role in primary HO2 production, accounting for 6 %–7 % and 5 % among all OVOCs. These findings align with a modeling study in Beijing, which showed that HCHO, MGLY, and aromatic oxidation products played an important role in HO2 production (Qu et al., 2021). A substantial fraction of RO2 was attributed to the oxidation of BACL, AFG1, and MGLY, contributing 23.7 %–34.7 %, 32.5 %–38.8 %, and 17.9 %–19.5 % of OVOC-derived RO2, respectively. As a result, HCHO, AFG1, MGLY, and BACL are major OVOC species generating primary ROx.
Across the YRD, OVOC photooxidation contributed 90 %–98 % of primary HO2 when the HNO4 pathway was excluded (Fig. 4b, e). Primary OVOCs accounted for 20 %–50 % (Fig. 4c, f), with more significant impacts during the cold season, due to a higher contribution from emissions to their ambient levels (Fig. 2e). A high proportion of primary RO2 was sourced from OVOCs by 50 %–98 % (Fig. S16a, c). However, secondary OVOCs generally made more pronounced contributions to primary RO2 production at the regional scale, except at a few hotspots where their contributions were comparable to those from primary OVOCs (Fig. S17a, c). The overall contribution of OVOCs to primary ROx production ranged from 40 % to 70 % in the YRD (Fig. S16b, d). It is evident that OVOCs play an essential role in HO2 production and could significantly affect ozone formation in this region.
3.4 Sensitivity of ozone formation to OVOCs and precursors
Given that a substantial fraction of OVOCs originates from emissions, the sensitivity of ozone formation to anthropogenic emissions of OVOCs and their precursors was systematically examined using the CMAQ model coupled with the High-Order Decoupled Direct Method (HDDM). The model configuration followed Li et al. (2022b), with the same inputs described in Sect. 2.1. The daytime average ozone responses to the complete removal of various VOCs (ΔO3) at SAES, along with their normalized contributions relative to total anthropogenic emissions across the domain (ΔO3/ΔEi) under different polluted conditions, are discussed below.
Among all primary OVOCs, HCHO exhibited the most significant impact, contributing 0.90 and 1.01 ppb to ozone formation under clean and polluted conditions, respectively (Fig. 5a). These ozone changes were comparable to those of most VOC precursors except ethylene (ETHE). BACL was also a key OVOC precursor, contributing 0.35 and 0.50 ppb of ozone under clean and polluted conditions, respectively. BACL undergoes photolysis to produce acetyl peroxy radicals (CH3CO3), which facilitates NO-to-NO2 conversion at a rate significantly higher than most other peroxy radicals represented in the model. On a per-unit-mass basis, OVOCs demonstrated substantially higher ozone formation efficiencies than other VOC precursors. Notably, BACL emerged as the most potential contributor in Shanghai, generating and ppb of ozone per gram emitted under clean and polluted conditions, respectively. HCHO, MVK, MACR, and MGLY also exhibited relatively high ozone formation efficiencies, contributing (1.57–3.77) × 10−4 ppb per gram emitted across both conditions.
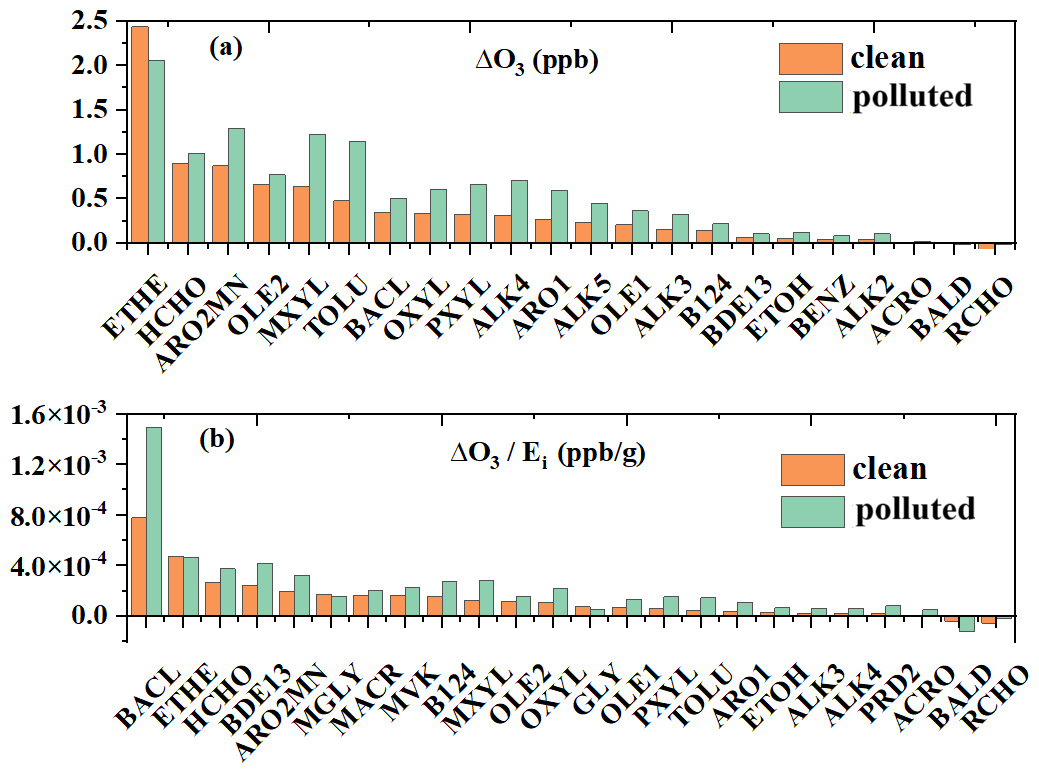
Figure 5Sensitivity of daytime average ozone to individual OVOCs and VOC precursors (a), and emission-normalized ozone changes (b) at SAES in Shanghai during the clean and polluted periods.
Similar sensitivities of O3 formation to OVOC and VOC precursor emission controls were also observed across the YRD. Among all OVOCs, HCHO demonstrated the most pronounced impact, with emission reductions leading to ozone decreases of up to 2.0 ppb in Jiangsu Province (Fig. S18). This effect was comparable to that of aromatic hydrocarbons (ARO2MN and TOLU) and reactive alkenes (OLE2), and exceeded the influence of most other VOC precursors, except ETHE and propylene (PROP). BACL also exhibited considerable effects, causing up to 1.0 ppb decreases in O3, similar to reactive alkanes (ALK3-5), alkenes (OLE1), and most aromatic hydrocarbons. Notably, emission reductions of certain OVOCs (e.g., CCHO, RCHO, ACRO, and CRES) can lead to spatially divergent ozone responses, with both increases and decreases in the YRD. This likely arises from differences in the radical pathways associated with OVOC photooxidation: some pathways involve reactions with NO2 to form relatively stable NOx reservoir species, whereas others promote NO-to-NO2 conversion. The competition between these pathways varies regionally with the abundances of OVOCs and NOx, resulting in spatial heterogeneity in ozone sensitivities. Nonetheless, controlling emissions of OVOCs, particularly HCHO and BACL, represents an efficient strategy for reducing O3 in the YRD.
OVOCs are key precursors of peroxy radicals that drive NO-to-NO2 conversion, thereby facilitating O3 accumulation in the troposphere. Model biases in simulating OVOCs are often attributed to uncertainties in VOC precursor emissions and the photochemical mechanisms used in chemical transport models. However, we emphasize that primary anthropogenic emissions constitute significant yet often underrepresented sources of ambient OVOCs, particularly in urban environments where industrial activities, solvent use, and fuel combustion dominate. High local emission contributions to ambient OVOCs (9 %–53 % for carbonyl compounds and 50 %–87 % for alcohols) have also been reported in other Chinese cities based on field measurements (Wu et al., 2020; Huang et al., 2020). Certain OVOCs, such as formaldehyde, acetone, and alcohols, are highly volatile, and their emission rates are therefore expected to exhibit strong temperature dependence. This inference is supported by direct measurements of 13 volatile emission sources during a sampling campaign in central China, which revealed significantly higher proportions of OVOCs in total VOC emissions from car painting, waste transfer station, and laundry sources in summer than in winter (Niu et al., 2021). With ongoing climate warming and more frequent heatwave events, emissions of these OVOC species are expected to increase, potentially enhancing atmospheric oxidation capacity and accelerating secondary pollutant formation. The impacts of such temperature-driven changes in OVOC emissions remain insufficiently understood and warrant further investigation.
HO2 radicals dominated ozone formation in urban areas of the YRD, contributing 53 %–63 % of the daytime ozone production rate under both clean and polluted conditions in Shanghai, and ranging from 55 % to 80 % across the region during both warm and cold seasons. This is consistent with findings from other urban environments heavily influenced by anthropogenic emissions (Tan et al., 2019a; Hu et al., 2023). Therefore, emission controls targeting major HO2 radical contributors could be an effective strategy for ozone mitigation in urban regions like the YRD. Traditionally, the significance of OVOCs in the free radical budget has been mainly recognized through their formation as secondary products from VOC precursors. However, we demonstrated that primary HO2 produced via OVOC photooxidation accounted for 90 %–98 % of primary HO2 production, with primary OVOCs alone contributing approximately 20 %–50 %. As a result, key OVOC species (e.g., HCHO) can compete with their precursors in generating HO2 radicals and influence ozone formation. In addition, the contributions of OVOCs to RO2 radicals, such as BACL, also promote ozone production and should not be overlooked.
Several uncertainties remain in the current study. Improvements are needed in representing multiphase chemistry, especially in detailed VOC speciation, multistep oxidation reactions, and the heterogeneous production and/or loss of small aldehydes and carboxylic acids. Additionally, emission profiles of organic acids and alcohols require further refinement, along with improved characterization of the temperature dependence of evaporative emissions. Previous studies have shown that alcohols contribute substantially to total OH reactivity and ozone formation, with their impacts intensifying at higher temperatures (Pfannerstill et al., 2023; Luecken et al., 2018; Pusede et al., 2014); however, large discrepancies between model-predicted and observed concentrations of these compounds were identified in the current study. The underestimation of OVOCs may result in biased predictions of their seasonal variability. With constraints from long-term OVOC measurements, future studies should extend to all seasons and other regions, focusing on the contributions of OVOC emissions to their ambient concentrations and the sensitivity of ozone formation to OVOC emission reductions, with improved representation of OVOC emissions, speciation, and multiphase chemistry.
The CMAQ source code is archived at https://doi.org/10.5281/zenodo.1167892 (US EPA Office of Research and Development, 2017). The input files to CMAQ, WRF, and MEGAN, and meteorology and ozone observation data can be downloaded from the links and cited references given in the method section. VOC observation data at Shanghai and Python scripts for processing data and generating figures are available upon reasonable request from the corresponding author.
The supplement related to this article is available online at https://doi.org/10.5194/acp-26-4901-2026-supplement.
J.L. designed the research. Xuan L. and Xun L. conducted the simulations and analyzed the data. R.Y., Y.G., and H.W. provided the 2019YRD emissions and ground observation data of VOCs at Shanghai. Xun L. and Xuan L. drafted the main text. All authors contributed to interpreting the results and editing the manuscript.
The contact author has declared that none of the authors has any competing interests.
Publisher's note: Copernicus Publications remains neutral with regard to jurisdictional claims made in the text, published maps, institutional affiliations, or any other geographical representation in this paper. The authors bear the ultimate responsibility for providing appropriate place names. Views expressed in the text are those of the authors and do not necessarily reflect the views of the publisher.
Authors acknowledge the financial support of the National Key R&D Program of China (grant nos. 2022YFE0136200 and 2023YFC3706105) and the National Natural Science Foundation of China (grant no. 42077199).
This work was financially supported by the National Key R&D Program of China (grant nos. 2022YFE0136200 and 2023YFC3706105) and the National Natural Science Foundation of China (grant no. 42077199).
This paper was edited by Zhibin Wang and reviewed by four anonymous referees.
An, J., Huang, Y., Huang, C., Wang, X., Yan, R., Wang, Q., Wang, H., Jing, S., Zhang, Y., Liu, Y., Chen, Y., Xu, C., Qiao, L., Zhou, M., Zhu, S., Hu, Q., Lu, J., and Chen, C.: Emission inventory of air pollutants and chemical speciation for specific anthropogenic sources based on local measurements in the Yangtze River Delta region, China, Atmos. Chem. Phys., 21, 2003–2025, https://doi.org/10.5194/acp-21-2003-2021, 2021.
Babaei-Gharehbagh, A., Taylor, R., Pratap, V., Na, S., Carlton, A. G., and Hennigan, C. J.: Effects of Inorganic Salts on the Gas-Aqueous Partitioning of Formic Acid and Acetic Acid, ACS Earth Space Chem., 9, 2705–2714, https://doi.org/10.1021/acsearthspacechem.5c00225, 2025.
Cliff, S. J., Lewis, A. C., Shaw, M. D., Lee, J. D., Flynn, M., Andrews, S. J., Hopkins, J. R., Purvis, R. M., and Yeoman, A. M.: Unreported VOC Emissions from Road Transport Including from Electric Vehicles, Environ. Sci. Technol., 57, 8026–8034, https://doi.org/10.1021/acs.est.3c00845, 2023.
Coggon, M. M., Gkatzelis, G. I., McDonald, B. C., Gilman, J. B., Schwantes, R. H., Abuhassan, N., Aikin, K. C., Arend, M. F., Berkoff, T. A., Brown, S. S., Campos, T. L., Dickerson, R. R., Gronoff, G., Hurley, J. F., Isaacman-VanWertz, G., Koss, A. R., Li, M., McKeen, S. A., Moshary, F., Peischl, J., Pospisilova, V., Ren, X., Wilson, A., Wu, Y., Trainer, M., and Warneke, C.: Volatile chemical product emissions enhance ozone and modulate urban chemistry, P. Natl. Acad. Sci. USA, 118, e2026653118, https://doi.org/10.1073/pnas.2026653118, 2021.
Cope, J. D., Abellar, K. A., Bates, K. H., Fu, X., and Nguyen, T. B.: Aqueous Photochemistry of 2-Methyltetrol and Erythritol as Sources of Formic Acid and Acetic Acid in the Atmosphere, ACS Earth Space Chem., 5, 1265–1277, https://doi.org/10.1021/acsearthspacechem.1c00107, 2021.
Du, C., Wang, H., Gao, Y., Yan, R., Jing, S. a., Zhou, M., Wang, Q., Lou, S., Huang, C., Huang, D. D., Shang, Y., and An, J.: Processes Driving Diurnal and Seasonal Variations of Formaldehyde in an Urban Environment, ACS Earth Space Chem., 9, 1174–1184, https://doi.org/10.1021/acsearthspacechem.5c00020, 2025.
Franco, B., Blumenstock, T., Cho, C., Clarisse, L., Clerbaux, C., Coheur, P. F., De Mazière, M., De Smedt, I., Dorn, H. P., Emmerichs, T., Fuchs, H., Gkatzelis, G., Griffith, D. W. T., Gromov, S., Hannigan, J. W., Hase, F., Hohaus, T., Jones, N., Kerkweg, A., Kiendler-Scharr, A., Lutsch, E., Mahieu, E., Novelli, A., Ortega, I., Paton-Walsh, C., Pommier, M., Pozzer, A., Reimer, D., Rosanka, S., Sander, R., Schneider, M., Strong, K., Tillmann, R., Van Roozendael, M., Vereecken, L., Vigouroux, C., Wahner, A., and Taraborrelli, D.: Ubiquitous atmospheric production of organic acids mediated by cloud droplets, Nature, 593, 233–237, https://doi.org/10.1038/s41586-021-03462-x, 2021.
Gao, Y., Wang, H., Yuan, L., Jing, S., Yuan, B., Shen, G., Zhu, L., Koss, A., Li, Y., Wang, Q., Huang, D. D., Zhu, S., Tao, S., Lou, S., and Huang, C.: Measurement report: Underestimated reactive organic gases from residential combustion – insights from a near-complete speciation, Atmos. Chem. Phys., 23, 6633–6646, https://doi.org/10.5194/acp-23-6633-2023, 2023.
Gao, Y. Q., Wang, H. L., Liu, Y., Zhang, X., Jing, S. A., Peng, Y. R., Huang, D. D., Li, X., Chen, S. Y., Lou, S. R., Li, Y. J., and Huang, C.: Unexpected High Contribution of Residential Biomass Burning to Non-Methane Organic Gases (NMOGs) in the Yangtze River Delta Region of China, J. Geophys. Res.-Atmos., 127, 14, https://doi.org/10.1029/2021jd035050, 2022.
Geng, G., Liu, Y., Liu, Y., Liu, S., Cheng, J., Yan, L., Wu, N., Hu, H., Tong, D., Zheng, B., Yin, Z., He, K., and Zhang, Q.: Efficacy of China's clean air actions to tackle PM2.5 pollution between 2013 and 2020, Nat. Geosci., 17, 987–994, https://doi.org/10.1038/s41561-024-01540-z, 2024.
Gkatzelis, G. I., Papanastasiou, D. K., Karydis, V. A., Hohaus, T., Liu, Y., Schmitt, S. H., Schlag, P., Fuchs, H., Novelli, A., Chen, Q., Cheng, X., Broch, S., Dong, H., Holland, F., Li, X., Liu, Y., Ma, X., Reimer, D., Rohrer, F., Shao, M., Tan, Z., Taraborrelli, D., Tillmann, R., Wang, H., Wang, Y., Wu, Y., Wu, Z., Zeng, L., Zheng, J., Hu, M., Lu, K., Hofzumahaus, A., Zhang, Y., Wahner, A., and Kiendler-Scharr, A.: Uptake of Water-soluble Gas-phase Oxidation Products Drives Organic Particulate Pollution in Beijing, Geophys. Res. Lett., 48, e2020GL091351, https://doi.org/10.1029/2020GL091351, 2021.
Hatch, L. E., Yokelson, R. J., Stockwell, C. E., Veres, P. R., Simpson, I. J., Blake, D. R., Orlando, J. J., and Barsanti, K. C.: Multi-instrument comparison and compilation of non-methane organic gas emissions from biomass burning and implications for smoke-derived secondary organic aerosol precursors, Atmos. Chem. Phys., 17, 1471–1489, https://doi.org/10.5194/acp-17-1471-2017, 2017.
He, M., Ditto, J. C., Gardner, L., Machesky, J., Hass-Mitchell, T. N., Chen, C., Khare, P., Sahin, B., Fortner, J. D., Plata, D. L., Drollette, B. D., Hayden, K. L., Wentzell, J. J. B., Mittermeier, R. L., Leithead, A., Lee, P., Darlington, A., Wren, S. N., Zhang, J., Wolde, M., Moussa, S. G., Li, S.-M., Liggio, J., and Gentner, D. R.: Total organic carbon measurements reveal major gaps in petrochemical emissions reporting, Science, 383, 426–432, https://doi.org/10.1126/science.adj6233, 2024.
Hu, B. Y., Chen, G. J., Chen, J. S., Xu, L. L., Fan, X. L., Hong, Y. W., Li, M. R., Lin, Z. Y., Huang, M. Q., Zhang, F. W., and Wang, H.: The effect of nitrous acid (HONO) on ozone formation during pollution episodes in southeastern China: Results from model improvement and mechanism insights, Sci. Total Environ., 891, 13, https://doi.org/10.1016/j.scitotenv.2023.164477, 2023.
Hu, J., Chen, J., Ying, Q., and Zhang, H.: One-year simulation of ozone and particulate matter in China using WRF/CMAQ modeling system, Atmos. Chem. Phys., 16, 10333–10350, https://doi.org/10.5194/acp-16-10333-2016, 2016.
Hu, L., Millet, D. B., Kim, S. Y., Wells, K. C., Griffis, T. J., Fischer, E. V., Helmig, D., Hueber, J., and Curtis, A. J.: North American acetone sources determined from tall tower measurements and inverse modeling, Atmos. Chem. Phys., 13, 3379–3392, https://doi.org/10.5194/acp-13-3379-2013, 2013.
Hu, L., Chen, L., Lin, W., Yao, L., Feng, Y., Zhao, J., Wu, W., Zheng, C., and Gao, X.: Quantifying Real-Time VOC Emissions of Typical Sources in the Chemical Industrial Park Using Multiplexed Online Mass Spectrometry, Environ. Sci. Technol., 59, 22784–22795, https://doi.org/10.1021/acs.est.5c11270, 2025.
Huang, D. D., Hu, Q., He, X., Huang, R.-J., Ding, X., Ma, Y., Feng, X., Jing, S. a., Li, Y., Lu, J., Gao, Y., Chang, Y., Shi, X., Qian, C., Yan, C., Lou, S., Wang, H., and Huang, C.: Obscured Contribution of Oxygenated Intermediate-Volatility Organic Compounds to Secondary Organic Aerosol Formation from Gasoline Vehicle Emissions, Environ. Sci. Technol., 58, 10652–10663, https://doi.org/10.1021/acs.est.3c08536, 2024.
Huang, X.-F., Zhang, B., Xia, S.-Y., Han, Y., Wang, C., Yu, G.-H., and Feng, N.: Sources of oxygenated volatile organic compounds (OVOCs) in urban atmospheres in North and South China, Environ. Pollut., 261, 114152, https://doi.org/10.1016/j.envpol.2020.114152, 2020.
Jiang, Y., Xia, M., Wang, Z., Zheng, P., Chen, Y., and Wang, T.: Photochemical ageing of aerosols contributes significantly to the production of atmospheric formic acid, Atmos. Chem. Phys., 23, 14813–14828, https://doi.org/10.5194/acp-23-14813-2023, 2023.
Kampf, C. J., Waxman, E. M., Slowik, J. G., Dommen, J., Pfaffenberger, L., Praplan, A. P., Prévôt, A. S. H., Baltensperger, U., Hoffmann, T., and Volkamer, R.: Effective Henry's Law Partitioning and the Salting Constant of Glyoxal in Aerosols Containing Sulfate, Environ. Sci. Technol., 47, 4236–4244, https://doi.org/10.1021/es400083d, 2013.
Koss, A. R., Sekimoto, K., Gilman, J. B., Selimovic, V., Coggon, M. M., Zarzana, K. J., Yuan, B., Lerner, B. M., Brown, S. S., Jimenez, J. L., Krechmer, J., Roberts, J. M., Warneke, C., Yokelson, R. J., and de Gouw, J.: Non-methane organic gas emissions from biomass burning: identification, quantification, and emission factors from PTR-ToF during the FIREX 2016 laboratory experiment, Atmos. Chem. Phys., 18, 3299–3319, https://doi.org/10.5194/acp-18-3299-2018, 2018.
Kurokawa, J. and Ohara, T.: Long-term historical trends in air pollutant emissions in Asia: Regional Emission inventory in ASia (REAS) version 3, Atmos. Chem. Phys., 20, 12761–12793, https://doi.org/10.5194/acp-20-12761-2020, 2020.
Li, J. Y., Xie, X. D., Li, L., Wang, X. Y., Wang, H. L., Jing, S. A., Ying, Q., Qin, M. M., and Hu, J. L.: Fate of Oxygenated Volatile Organic Compounds in the Yangtze River Delta Region: Source Contributions and Impacts on the Atmospheric Oxidation Capacity, Environ. Sci. Technol., 56, 11212–11224, https://doi.org/10.1021/acs.est.2c00038, 2022a.
Li, X., Qin, M., Li, L., Gong, K., Shen, H., Li, J., and Hu, J.: Examining the implications of photochemical indicators for O3–NOx–VOC sensitivity and control strategies: a case study in the Yangtze River Delta (YRD), China, Atmos. Chem. Phys., 22, 14799–14811, https://doi.org/10.5194/acp-22-14799-2022, 2022b.
Liang, W. and Yang, X.: Indoor formaldehyde in real buildings: Emission source identification, overall emission rate estimation, concentration increase and decay patterns, Build Environ., 69, 114–120, https://doi.org/10.1016/j.buildenv.2013.08.009, 2013.
Lim, Y. B., Tan, Y., and Turpin, B. J.: Chemical insights, explicit chemistry, and yields of secondary organic aerosol from OH radical oxidation of methylglyoxal and glyoxal in the aqueous phase, Atmos. Chem. Phys., 13, 8651–8667, https://doi.org/10.5194/acp-13-8651-2013, 2013.
Lin, Z., Xu, L., Yang, C., Chen, G., Ji, X., Li, L., Zhang, K., Hong, Y., Li, M., Fan, X., Hu, B., Zhang, F., and Chen, J.: Trends of peroxyacetyl nitrate and its impact on ozone over 2018–2022 in urban atmosphere, npj Clim. Atmos. Sci., 7, 192, https://doi.org/10.1038/s41612-024-00746-7, 2024.
Liu, Y., Wang, H., Jing, S., Peng, Y., Gao, Y., Yan, R., Wang, Q., Lou, S., Cheng, T., and Huang, C.: Strong regional transport of volatile organic compounds (VOCs) during wintertime in Shanghai megacity of China, Atmos. Environ., 244, 117940, https://doi.org/10.1016/j.atmosenv.2020.117940, 2021.
Liu, Y., Zhou, M., Zhao, M., Jing, S., Wang, H., Lu, K., and Shen, H.: Determination of Urban Formaldehyde Emission Ratios in the Shanghai Megacity, Environ. Sci. Technol., 57, 16489–16499, https://doi.org/10.1021/acs.est.3c06428, 2023.
Liu, Y., Yuan, B., Li, X., Shao, M., Lu, S., Li, Y., Chang, C.-C., Wang, Z., Hu, W., Huang, X., He, L., Zeng, L., Hu, M., and Zhu, T.: Impact of pollution controls in Beijing on atmospheric oxygenated volatile organic compounds (OVOCs) during the 2008 Olympic Games: observation and modeling implications, Atmos. Chem. Phys., 15, 3045–3062, https://doi.org/10.5194/acp-15-3045-2015, 2015.
Liu, Y., Wang, H., Jing, S., Gao, Y., Peng, Y., Lou, S., Cheng, T., Tao, S., Li, L., Li, Y., Huang, D., Wang, Q., and An, J.: Characteristics and sources of volatile organic compounds (VOCs) in Shanghai during summer: Implications of regional transport, Atmos. Environ., 215, 116902, https://doi.org/10.1016/j.atmosenv.2019.116902, 2019.
Luecken, D. J., Napelenok, S. L., Strum, M., Scheffe, R., and Phillips, S.: Sensitivity of Ambient Atmospheric Formaldehyde and Ozone to Precursor Species and Source Types Across the United States, Environ. Sci. Technol., 52, 4668–4675, https://doi.org/10.1021/acs.est.7b05509, 2018.
Lyu, X., Li, H., Lee, S.-C., Xiong, E., Guo, H., Wang, T., and de Gouw, J.: Significant Biogenic Source of Oxygenated Volatile Organic Compounds and the Impacts on Photochemistry at a Regional Background Site in South China, Environ. Sci. Technol., 58, 20081–20090, https://doi.org/10.1021/acs.est.4c05656, 2024.
Ma, M., Gao, Y., Ding, A., Su, H., Liao, H., Wang, S., Wang, X., Zhao, B., Zhang, S., Fu, P., Guenther, A. B., Wang, M., Li, S., Chu, B., Yao, X., and Gao, H.: Development and Assessment of a High-Resolution Biogenic Emission Inventory from Urban Green Spaces in China, Environ. Sci. Technol., 56, 175–184, https://doi.org/10.1021/acs.est.1c06170, 2022.
Maison, A., Lugon, L., Park, S. J., Baudic, A., Cantrell, C., Couvidat, F., D'Anna, B., Di Biagio, C., Gratien, A., Gros, V., Kalalian, C., Kammer, J., Michoud, V., Petit, J. E., Shahin, M., Simon, L., Valari, M., Vigneron, J., Tuzet, A., and Sartelet, K.: Significant impact of urban tree biogenic emissions on air quality estimated by a bottom-up inventory and chemistry transport modeling, Atmos. Chem. Phys., 24, 6011-6046, https://doi.org/10.5194/acp-24-6011-2024, 2024.
Malecha, K. T. and Nizkorodov, S. A.: Photodegradation of Secondary Organic Aerosol Particles as a Source of Small, Oxygenated Volatile Organic Compounds, Environ. Sci. Technol., 50, 9990–9997, https://doi.org/10.1021/acs.est.6b02313, 2016.
Mao, J., Li, L., Li, J., Sulaymon, I. D., Xiong, K., Wang, K., Zhu, J., Chen, G., Ye, F., Zhang, N., Qin, Y., Qin, M., and Hu, J.: Evaluation of Long-Term Modeling Fine Particulate Matter and Ozone in China During 2013–2019, Front. Environ. Sci., 10, https://doi.org/10.3389/fenvs.2022.872249, 2022.
Marvin, M. R., Wolfe, G. M., Salawitch, R. J., Canty, T. P., Roberts, S. J., Travis, K. R., Aikin, K. C., de Gouw, J. A., Graus, M., Hanisco, T. F., Holloway, J. S., Hübler, G., Kaiser, J., Keutsch, F. N., Peischl, J., Pollack, I. B., Roberts, J. M., Ryerson, T. B., Veres, P. R., and Warneke, C.: Impact of evolving isoprene mechanisms on simulated formaldehyde: An inter-comparison supported by in situ observations from SENEX, Atmos. Environ., 164, 325–336, https://doi.org/10.1016/j.atmosenv.2017.05.049, 2017.
McDonald, B. C., de Gouw, J. A., Gilman, J. B., Jathar, S. H., Akherati, A., Cappa, C. D., Jimenez, J. L., Lee-Taylor, J., Hayes, P. L., McKeen, S. A., Cui, Y. Y., Kim, S.-W., Gentner, D. R., Isaacman-VanWertz, G., Goldstein, A. H., Harley, R. A., Frost, G. J., Roberts, J. M., Ryerson, T. B., and Trainer, M.: Volatile chemical products emerging as largest petrochemical source of urban organic emissions, Science, 359, 760–764, https://doi.org/10.1126/science.aaq0524, 2018.
Millet, D. B., Baasandorj, M., Farmer, D. K., Thornton, J. A., Baumann, K., Brophy, P., Chaliyakunnel, S., de Gouw, J. A., Graus, M., Hu, L., Koss, A., Lee, B. H., Lopez-Hilfiker, F. D., Neuman, J. A., Paulot, F., Peischl, J., Pollack, I. B., Ryerson, T. B., Warneke, C., Williams, B. J., and Xu, J.: A large and ubiquitous source of atmospheric formic acid, Atmos. Chem. Phys., 15, 6283–6304, https://doi.org/10.5194/acp-15-6283-2015, 2015.
Ministry of Ecology and Environment, P. R. of China: Technical Guidelines for Compiling an Integrated Emission Inventory of Air Pollutants and Greenhouse Gases, https://www.mee.gov.cn/xxgk2018/xxgk/xxgk06/202401/t20240130_1065242.html?keywords=, 30 January 2024.
Mo, Z., Shao, M., and Lu, S.: Compilation of a source profile database for hydrocarbon and OVOC emissions in China, Atmos. Environ., 143, 209–217, https://doi.org/10.1016/j.atmosenv.2016.08.025, 2016.
Mo, Z., Cui, R., Yuan, B., Cai, H., McDonald, B. C., Li, M., Zheng, J., and Shao, M.: A mass-balance-based emission inventory of non-methane volatile organic compounds (NMVOCs) for solvent use in China, Atmos. Chem. Phys., 21, 13655–13666, https://doi.org/10.5194/acp-21-13655-2021, 2021.
Niu, Z., Kong, S., Zheng, H., Yan, Q., Liu, J., Feng, Y., Wu, J., Zheng, S., Zeng, X., Yao, L., Zhang, Y., Fan, Z., Cheng, Y., Liu, X., Wu, F., Qin, S., Yan, Y., Ding, F., Liu, W., Zhu, K., Liu, D., and Qi, S.: Temperature dependence of source profiles for volatile organic compounds from typical volatile emission sources, Sci. Total Environ., 751, 141741, https://doi.org/10.1016/j.scitotenv.2020.141741, 2021.
Niu, Z., Kong, S., Zheng, H., Hu, Y., Zheng, S., Cheng, Y., Yao, L., Liu, W., Ding, F., Liu, X., and Qi, S.: Differences in compositions and effects of VOCs from vehicle emission detected using various methods, Environ. Pollut., 333, 122077, https://doi.org/10.1016/j.envpol.2023.122077, 2023.
Ou, J., Zheng, J., Li, R., Huang, X., Zhong, Z., Zhong, L., and Lin, H.: Speciated OVOC and VOC emission inventories and their implications for reactivity-based ozone control strategy in the Pearl River Delta region, China, Sci. Total Environ., 530–531, 393–402, https://doi.org/10.1016/j.scitotenv.2015.05.062, 2015.
Pagonis, D., Sekimoto, K., and de Gouw, J.: A Library of Proton-Transfer Reactions of H3O+ Ions Used for Trace Gas Detection, J. Am. Soc. Mass Sp., 30, 1330–1335, https://doi.org/10.1007/s13361-019-02209-3, 2019.
Permar, W., Wang, Q., Selimovic, V., Wielgasz, C., Yokelson, R. J., Hornbrook, R. S., Hills, A. J., Apel, E. C., Ku, I.-T., Zhou, Y., Sive, B. C., Sullivan, A. P., Collett Jr, J. L., Campos, T. L., Palm, B. B., Peng, Q., Thornton, J. A., Garofalo, L. A., Farmer, D. K., Kreidenweis, S. M., Levin, E. J. T., DeMott, P. J., Flocke, F., Fischer, E. V., and Hu, L.: Emissions of Trace Organic Gases From Western U.S. Wildfires Based on WE-CAN Aircraft Measurements, J. Geophys. Res.-Atmos., 126, e2020JD033838, https://doi.org/10.1029/2020JD033838, 2021.
Permar, W., Wielgasz, C., Jin, L., Chen, X., Coggon, M. M., Garofalo, L. A., Gkatzelis, G. I., Ketcherside, D., Millet, D. B., Palm, B. B., Peng, Q., Robinson, M. A., Thornton, J. A., Veres, P., Warneke, C., Yokelson, R. J., Fischer, E. V., and Hu, L.: Assessing formic and acetic acid emissions and chemistry in western U.S. wildfire smoke: implications for atmospheric modeling, Environ. Sci. Atmos., 3, 1620–1641, https://doi.org/10.1039/D3EA00098B, 2023.
Pfannerstill, E. Y., Arata, C., Zhu, Q., Schulze, B. C., Woods, R., Harkins, C., Schwantes, R. H., McDonald, B. C., Seinfeld, J. H., Bucholtz, A., Cohen, R. C., and Goldstein, A. H.: Comparison between Spatially Resolved Airborne Flux Measurements and Emission Inventories of Volatile Organic Compounds in Los Angeles, Environ. Sci. Technol., 57, 15533–15545, https://doi.org/10.1021/acs.est.3c03162, 2023.
Pusede, S. E., Gentner, D. R., Wooldridge, P. J., Browne, E. C., Rollins, A. W., Min, K.-E., Russell, A. R., Thomas, J., Zhang, L., Brune, W. H., Henry, S. B., DiGangi, J. P., Keutsch, F. N., Harrold, S. A., Thornton, J. A., Beaver, M. R., St. Clair, J. M., Wennberg, P. O., Sanders, J., Ren, X., VandenBoer, T. C., Markovic, M. Z., Guha, A., Weber, R., Goldstein, A. H., and Cohen, R. C.: On the temperature dependence of organic reactivity, nitrogen oxides, ozone production, and the impact of emission controls in San Joaquin Valley, California, Atmos. Chem. Phys., 14, 3373–3395, https://doi.org/10.5194/acp-14-3373-2014, 2014.
Qu, H., Wang, Y., Zhang, R., Liu, X., Huey, L. G., Sjostedt, S., Zeng, L., Lu, K., Wu, Y., Shao, M., Hu, M., Tan, Z., Fuchs, H., Broch, S., Wahner, A., Zhu, T., and Zhang, Y.: Chemical Production of Oxygenated Volatile Organic Compounds Strongly Enhances Boundary-Layer Oxidation Chemistry and Ozone Production, Environ. Sci. Technol., 55, 13718–13727, https://doi.org/10.1021/acs.est.1c04489, 2021.
Sekimoto, K., Li, S.-M., Yuan, B., Koss, A., Coggon, M., Warneke, C., and de Gouw, J.: Calculation of the sensitivity of proton-transfer-reaction mass spectrometry (PTR-MS) for organic trace gases using molecular properties, Int. J. Mass Spectrom., 421, 71–94, https://doi.org/10.1016/j.ijms.2017.04.006, 2017.
Shen, H., Huang, L., Zhao, Y., Zhao, M., Yang, Y., Li, H., Wu, H., and Chen, Z.: High Yields of Formic Acid and Acetic Acid during Multi-generational Oxidation of Toluene, EGUsphere [preprint], https://doi.org/10.5194/egusphere-2026-234, 2026.
Smith, S. J., McDuffie, E. E., and Charles, M.: Opinion: Coordinated development of emission inventories for climate forcers and air pollutants, Atmos. Chem. Phys., 22, 13201–13218, https://doi.org/10.5194/acp-22-13201-2022, 2022.
Stockwell, C. E., Coggon, M. M., Gkatzelis, G. I., Ortega, J., McDonald, B. C., Peischl, J., Aikin, K., Gilman, J. B., Trainer, M., and Warneke, C.: Volatile organic compound emissions from solvent- and water-borne coatings – compositional differences and tracer compound identifications, Atmos. Chem. Phys., 21, 6005–6022, https://doi.org/10.5194/acp-21-6005-2021, 2021.
Sui, X., Zhou, Y., Zhang, F., Chen, J., Zhu, Z., and Yu, X.-Y.: Deciphering the aqueous chemistry of glyoxal oxidation with hydrogen peroxide using molecular imaging, Phys. Chem. Chem. Phys., 19, 20357–20366, https://doi.org/10.1039/C7CP02071F, 2017.
Tan, Z., Lu, K., Hofzumahaus, A., Fuchs, H., Bohn, B., Holland, F., Liu, Y., Rohrer, F., Shao, M., Sun, K., Wu, Y., Zeng, L., Zhang, Y., Zou, Q., Kiendler-Scharr, A., Wahner, A., and Zhang, Y.: Experimental budgets of OH, HO2, and RO2 radicals and implications for ozone formation in the Pearl River Delta in China 2014, Atmos. Chem. Phys., 19, 7129–7150, https://doi.org/10.5194/acp-19-7129-2019, 2019a.
Tan, Z., Lu, K., Jiang, M., Su, R., Wang, H., Lou, S., Fu, Q., Zhai, C., Tan, Q., Yue, D., Chen, D., Wang, Z., Xie, S., Zeng, L., and Zhang, Y.: Daytime atmospheric oxidation capacity in four Chinese megacities during the photochemically polluted season: a case study based on box model simulation, Atmos. Chem. Phys., 19, 3493–3513, https://doi.org/10.5194/acp-19-3493-2019, 2019b.
Tanzer-Gruener, R., Rajan, P. E., Dugan, L. D., Bier, M. E., Robinson, A. L., and Presto, A. A.: Watching Paint Dry: Organic Vapor Emissions from Architectural Coatings and their Impact on Secondary Organic Aerosol Formation, Environ. Sci. Technol., 56, 11236–11245, https://doi.org/10.1021/acs.est.2c02478, 2022.
US EPA Office of Research and Development: CMAQ (5.2), Zenodo [code], https://doi.org/10.5281/zenodo.1167892, 2017.
Wang, H., He, Q., Kong, H., Qin, K., Zheng, B., Lin, J., and Zhao, Y.: Declining short-term emission control opportunity for major events in Chinese cities, Nat. Cities, 2, 434–446, https://doi.org/10.1038/s44284-025-00233-x, 2025.
Wang, J., Zhang, Y., Zhao, W., Wu, Z., Luo, S., Zhang, H., Zhou, H., Song, W., Zhang, W., and Wang, X.: Observationally Constrained Modeling of Peroxy Radical During an Ozone Episode in the Pearl River Delta Region, China, J. Geophys. Res.-Atmos., 128, e2022JD038279, https://doi.org/10.1029/2022JD038279, 2023.
Wang, S., Yuan, B., Wu, C., Wang, C., Li, T., He, X., Huangfu, Y., Qi, J., Li, X.-B., Sha, Q., Zhu, M., Lou, S., Wang, H., Karl, T., Graus, M., Yuan, Z., and Shao, M.: Oxygenated volatile organic compounds (VOCs) as significant but varied contributors to VOC emissions from vehicles, Atmos. Chem. Phys., 22, 9703–9720, https://doi.org/10.5194/acp-22-9703-2022, 2022a.
Wang, S., Yuan, B., He, X., Cui, R., Song, X., Chen, Y., Wu, C., Wang, C., Huangfu, Y., Li, X.-B., Wang, B., and Shao, M.: Emission characteristics of reactive organic gases (ROGs) from industrial volatile chemical products (VCPs) in the Pearl River Delta (PRD), China, Atmos. Chem. Phys., 24, 7101–7121, https://doi.org/10.5194/acp-24-7101-2024, 2024a.
Wang, W., Yuan, B., Peng, Y., Su, H., Cheng, Y., Yang, S., Wu, C., Qi, J., Bao, F., Huangfu, Y., Wang, C., Ye, C., Wang, Z., Wang, B., Wang, X., Song, W., Hu, W., Cheng, P., Zhu, M., Zheng, J., and Shao, M.: Direct observations indicate photodegradable oxygenated volatile organic compounds (OVOCs) as larger contributors to radicals and ozone production in the atmosphere, Atmos. Chem. Phys., 22, 4117–4128, https://doi.org/10.5194/acp-22-4117-2022, 2022b.
Wang, Y., Huang, J., Zhao, B., Du, Y., Huang, L., Lai, D., Su, Q., Manomaiphiboon, K., and Li, L.: Full-Volatility Reactive Organic Carbon Emissions from Volatile Chemical Products in Mainland China, ACS ES&T Air, 1, 1541–1553, https://doi.org/10.1021/acsestair.4c00116, 2024b.
Waxman, E. M., Elm, J., Kurtén, T., Mikkelsen, K. V., Ziemann, P. J., and Volkamer, R.: Glyoxal and Methylglyoxal Setschenow Salting Constants in Sulfate, Nitrate, and Chloride Solutions: Measurements and Gibbs Energies, Environ. Sci. Technol., 49, 11500–11508, https://doi.org/10.1021/acs.est.5b02782, 2015.
Wiedinmyer, C., Kimura, Y., McDonald-Buller, E. C., Emmons, L. K., Buchholz, R. R., Tang, W., Seto, K., Joseph, M. B., Barsanti, K. C., Carlton, A. G., and Yokelson, R.: The Fire Inventory from NCAR version 2.5: an updated global fire emissions model for climate and chemistry applications, Geosci. Model Dev., 16, 3873–3891, https://doi.org/10.5194/gmd-16-3873-2023, 2023.
Wu, C., Wang, C., Wang, S., Wang, W., Yuan, B., Qi, J., Wang, B., Wang, H., Wang, C., Song, W., Wang, X., Hu, W., Lou, S., Ye, C., Peng, Y., Wang, Z., Huangfu, Y., Xie, Y., Zhu, M., Zheng, J., Wang, X., Jiang, B., Zhang, Z., and Shao, M.: Measurement report: Important contributions of oxygenated compounds to emissions and chemistry of volatile organic compounds in urban air, Atmos. Chem. Phys., 20, 14769–14785, https://doi.org/10.5194/acp-20-14769-2020, 2020.
Xing, C., Liu, C., Lin, J., Tan, W., and Liu, T.: VOCs hyperspectral imaging: A new insight into evaluate emissions and the corresponding health risk from industries, J. Hazard. Mater., 461, 132573, https://doi.org/10.1016/j.jhazmat.2023.132573, 2024.
Xue, L., Gu, R., Wang, T., Wang, X., Saunders, S., Blake, D., Louie, P. K. K., Luk, C. W. Y., Simpson, I., Xu, Z., Wang, Z., Gao, Y., Lee, S., Mellouki, A., and Wang, W.: Oxidative capacity and radical chemistry in the polluted atmosphere of Hong Kong and Pearl River Delta region: analysis of a severe photochemical smog episode, Atmos. Chem. Phys., 16, 9891–9903, https://doi.org/10.5194/acp-16-9891-2016, 2016.
Yang, X., Xue, L., Wang, T., Wang, X., Gao, J., Lee, S., Blake, D. R., Chai, F., and Wang, W.: Observations and Explicit Modeling of Summertime Carbonyl Formation in Beijing: Identification of Key Precursor Species and Their Impact on Atmospheric Oxidation Chemistry, J. Geophys. Res.-Atmos., 123, 1426–1440, https://doi.org/10.1002/2017jd027403, 2018.
Yang, X., Lu, K., Ma, X., Gao, Y., Tan, Z., Wang, H., Chen, X., Li, X., Huang, X., He, L., Tang, M., Zhu, B., Chen, S., Dong, H., Zeng, L., and Zhang, Y.: Radical chemistry in the Pearl River Delta: observations and modeling of OH and HO2 radicals in Shenzhen in 2018, Atmos. Chem. Phys., 22, 12525–12542, https://doi.org/10.5194/acp-22-12525-2022, 2022.
Yang, X., Zhang, G., Pan, G., Fan, G. L., Zhang, H. Y., Ge, X., and Du, M. Y.: Significant contribution of carbonyls to atmospheric oxidation capacity (AOC) during the winter haze pollution over North China Plain, J. Environ. Sci., 139, 377–388, https://doi.org/10.1016/j.jes.2023.06.004, 2024.
Yu, G., Bayer, A. R., Galloway, M. M., Korshavn, K. J., Fry, C. G., and Keutsch, F. N.: Glyoxal in Aqueous Ammonium Sulfate Solutions: Products, Kinetics and Hydration Effects, Environ. Sci. Technol., 45, 6336–6342, https://doi.org/10.1021/es200989n, 2011.
Yuan, B., Veres, P. R., Warneke, C., Roberts, J. M., Gilman, J. B., Koss, A., Edwards, P. M., Graus, M., Kuster, W. C., Li, S.-M., Wild, R. J., Brown, S. S., Dubé, W. P., Lerner, B. M., Williams, E. J., Johnson, J. E., Quinn, P. K., Bates, T. S., Lefer, B., Hayes, P. L., Jimenez, J. L., Weber, R. J., Zamora, R., Ervens, B., Millet, D. B., Rappenglück, B., and de Gouw, J. A.: Investigation of secondary formation of formic acid: urban environment vs. oil and gas producing region, Atmos. Chem. Phys., 15, 1975–1993, https://doi.org/10.5194/acp-15-1975-2015, 2015.
Zeng, L., Fan, G.-J., Lyu, X., Guo, H., Wang, J.-L., and Yao, D.: Atmospheric fate of peroxyacetyl nitrate in suburban Hong Kong and its impact on local ozone pollution, Environ. Pollut., 252, 1910–1919, https://doi.org/10.1016/j.envpol.2019.06.004, 2019.
Zhang, G., Mu, Y., Zhou, L., Zhang, C., Zhang, Y., Liu, J., Fang, S., and Yao, B.: Summertime distributions of peroxyacetyl nitrate (PAN) and peroxypropionyl nitrate (PPN) in Beijing: Understanding the sources and major sink of PAN, Atmos. Environ., 103, 289–296, https://doi.org/10.1016/j.atmosenv.2014.12.035, 2015.
Zhang, R., Gen, M., Fu, T.-M., and Chan, C. K.: Production of Formate via Oxidation of Glyoxal Promoted by Particulate Nitrate Photolysis, Environ. Sci. Technol., 55, 5711–5720, https://doi.org/10.1021/acs.est.0c08199, 2021.