the Creative Commons Attribution 4.0 License.
the Creative Commons Attribution 4.0 License.
Exceptional wildfire smoke over Greece in summer 2023: a synergistic study of aerosol optical-microphysical and UVB radiative impacts
Marilena Gidarakou
Alexandros Papayannis
Maria Mylonaki
Eleni Kralli
Kostas Eleftheratos
Ilias Fountoulakis
Olga Zografou
Evangelia Diapouli
Maria I. Gini
Stergios Vratolis
Konstantinos Granakis
Konstantinos Eleftheriadis
Nikolaos Evangeliou
Christine Groot Zwaaftink
Eugenia Giagka
Marios-Andreas Zagklis
Igor Veselovskii
During summer 2023, Greece experienced one of its most severe wildfire seasons in recent decades, with widespread fires across Evros, Rodopi, Attica, the Peloponnese, and several islands. This study investigates the aerosol optical and microphysical properties, as well as the impact on ground-level ultraviolet-B (UVB) radiation over Athens, focusing on two major wildfire episodes (18–21 July and 22–25 August). A synergistic approach was deployed, combining satellite imagery (MODIS), FLEXPART simulations, ground-based remoter sensing, in situ aerosol and radiation measurements. Elevated aerosol optical depths (AOD) up to 1.2, high fine-mode fractions (FMF) (> 0.85), and Ångström exponents (AE) above 1.5 indicated a strong dominance of fine biomass burning aerosols. The Single scattering albedo (SSA) ranged from 0.85 to 0.98, showing enhanced absorption during biomass burning periods and weaker absorption when smoke was mixed with dust. At 320 nm, dust presence resulted in stronger absorption, with SSA below 0.8 for pure dust cases compared to smoke mixtures. Particle linear depolarization ratios (PLDR), varied between 0.03 and 0.20, with higher values (∼ 0.10–0.20) reflecting the presence of non-spherical dust particles, and lower values (∼ 0.03–0.08) indicating spherical smoke particles. Ground-level UVB irradiance decreased by up to 50 % during peak smoke episodes, highlighting strong aerosol radiative impacts. Concurrently, PM10 and PM2.5 concentrations increased to 94 and 49 µg m−3, respectively, while organic aerosols peaked at 22.77 µg m−3, consistent with intense fire activity. FLEXPART simulations confirmed long-range transport of smoke from active fire regions, with additional contributions from regional pollution and Saharan dust.
- Article
(15440 KB) - Full-text XML
-
Supplement
(1244 KB) - BibTeX
- EndNote
Wildfires are an increasing environmental threat in the Mediterranean, driven by very high temperatures, prolonged droughts, and extreme weather events associated with global warming and climate change (Ruffault et al., 2018). These events release large amounts of aerosols and trace gases (PM, CO, NOx, VOCs), affecting air quality, human health, ecosystems, and climate (Knorr et al., 2017; Mylonaki et al., 2024; Vasilakopoulou et al., 2023). Moreover, biomass burning aerosols have significant radiative effects, altering atmospheric heating rates and contributing to short- and long-term climate forcing (Intergovernmental Panel On Climate Change (IPCC), 2023).
Previous studies have documented wildfire impacts in Greece (Peloponnese 2007; Athens 2009, 2021; Evia 2021; Evros 2023) (Amiridis et al., 2012; Kaskaoutis et al., 2011, 2024; Masoom et al., 2023; Michailidis et al., 2024; Osswald et al., 2023; Turquety et al., 2009), highlighting long-range transport, elevated aerosol loadings, and complex vertical layering. For example, Kaskaoutis et al. (2011) showed long-distance transport during 2007 fires, while Amiridis et al. (2012) and Michailidis et al. (2024) reported extreme AOD and UV attenuation near urban centers. Modelling studies (Osswald et al., 2023) emphasized pollutant exceedances and public health concerns, and more recent work stressed the importance of multi-instrument observations to capture interactions between smoke, dust, and other short-lived climate forcers (Amiridis et al., 2024; Poutli et al., 2024). Nevertheless, comprehensive multi-parameter analyses of extreme smoke-dust episodes remain limited.
Beyond the Mediterranean region numerous studies have investigated biomass burning impacts worldwide. Large-scale fire events in the Amazon (Baars et al., 2012; Mayol-Bracero et al., 2002), boreal regions (Burton et al., 2012; Groß et al., 2013; Murayama et al., 2004; Ortiz-Amezcua et al., 2017; Torres et al., 2020), and Australia (Ohneiser et al., 2020; Papanikolaou et al., 2022; Sellitto et al., 2022) have demonstrated severe impacts on atmospheric composition, radiative forcing, and long-range transport of smoke plumes. For instance, the 2019–2020 Australian wildfires injected smoke into the stratosphere with measurable global radiative effects (Chang et al., 2021; Heinold et al., 2022; Sellitto et al., 2023), while Canadian boreal fires in 2023 produced trans-Atlantic smoke transport to Europe (Gidarakou et al., 2025; Reichardt et al., 2024; Veselovskii et al., 2024). Such international examples highlight that biomass burning is not a regional problem but a global phenomenon with far-reaching implications. In this context, our study complements previous work by providing a detailed analysis of extreme wildfire-dust interactions in the Eastern Mediterranean, a climate-change hotspot.
In this paper we focus on summer of 2023 which was one of the most catastrophic wildfire seasons in Greece. The Evros wildfire, ignited on 19 August, burned over 90 000 ha under extreme heat (> 40 °C) and strong winds, making it the largest single wildfire recorded in the European Union since 2000 by the European Forest Fire Information System (EFFIS). Beyond its direct destruction, this event highlights the increasing likelihood of extreme wildfires under a warming Mediterranean climate and the need to understand their atmospheric consequences. Furthermore, we note that during summer seasons our study area is affected by wildfire smoke particles from the Balkan region (Papayannis et al., 2014).
A notable feature of the 2023 wildfires season was the simultaneous presence of intense wildfire smoke aerosols and Saharan dust particles, as revealed from the analysis of MODIS data (not shown here). Thus, smoke plumes from Evros reached central and southern Greece, including the Athens basin, while dust outbreaks contributed coarse particles, creating complex mixtures of fine-mode smoke (r < 0.5 µm) and coarse mineral dust (Dubovik and King, 2000; Holben et al., 1998). Such episodes are particularly relevant due to their distinct optical, microphysical, which influence air quality and climate forcing (Liu et al., 2022, 2020; Masoom et al., 2023). Beyond their atmospheric effects, they also pose risks for human health and ecosystems: exposure to fine particles from wildfire smoke has been linked to respiratory and cardiovascular diseases (Chirizzi et al., 2017; Mylonaki et al., 2024), while dust-smoke mixtures may worsen health impacts and reduce agricultural productivity (Singh et al., 2022).
The presented data were collected during the summer campaign of the European Partnership on Metrology project BIOSPHERE (Metrology for Earth Biosphere: Cosmic rays, UV radiation and fragility of ozone shield) (Pierrard et al., 2025) which aims to develop and use novel instrumentation and methods to assess how the increasing ionization of the atmosphere affects the human and ecological health on our planet.
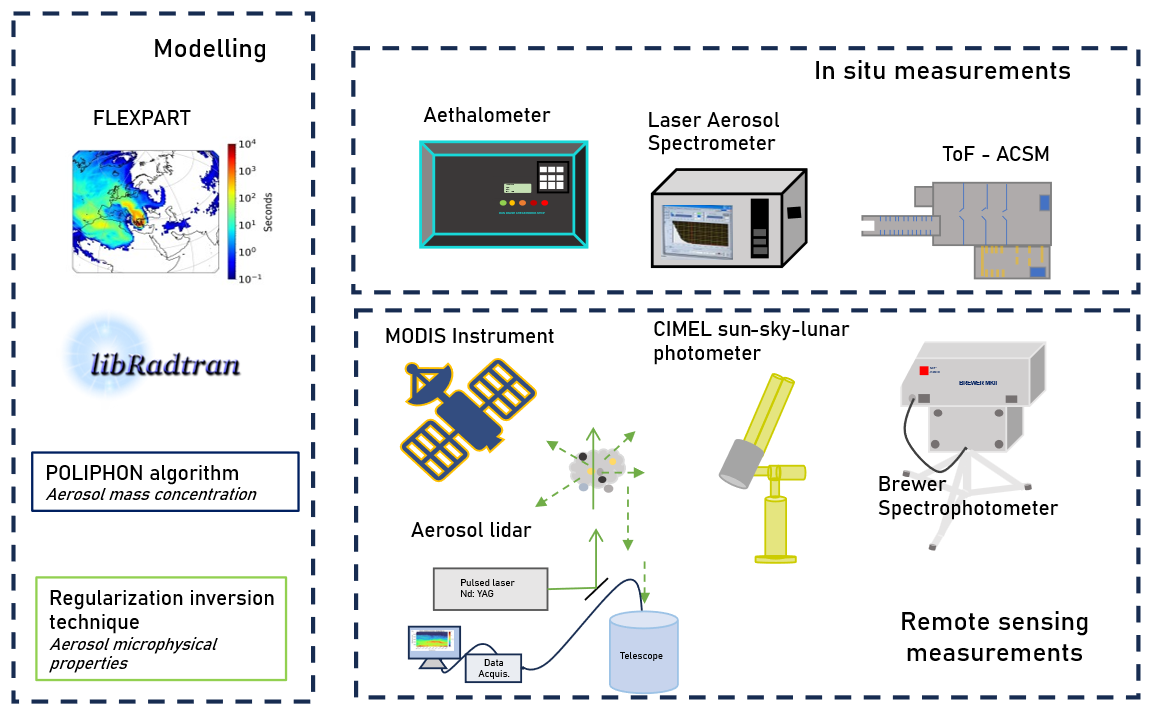
Figure 1Schematic overview of the instrumentation set-up used in this study. The figure illustrates the integration of multi-platform observations from the NTUA (lidar and photometer), DEM (air quality and aerosol composition), and BRFAA (Brewer spectrophotometer) stations, together with satellite observations (MODIS FIRMS), FLEXPART dispersion modelling, as well as the POLIPHON algorithm and the Regularization inversion technique, highlighting the synergistic use of active and passive remote sensing, in situ data, and modelling tools.
This study focuses on transport of wildfire smoke and Saharan dust particles over Athens during 17 July–30 August 2023, with emphasis on the Evros wildfires event. A synergistic approach was employed, combining active and passive remote sensing, in situ air quality and solar UVB measurements, satellite observations, and FLEXPART modelling. Each observational component contributes in a complementary way to the overall analysis. Lidar measurements provide the vertical distribution of aerosol optical properties and through inversion, the corresponding microphysical properties can be retrieved. Sun-sky-lunar photometer and Brewer observations provide column-integrated optical and radiative characteristics, air quality and aethalometer data quantify surface-level impacts. Finally, satellite retrievals extend the spatial coverage over the wider region. FLEXPART simulations link these observations to air mass transport pathways, distinguishing between Saharan dust intrusions and wildfire plumes. This integrated approach provides a comprehensive understanding of aerosol vertical distribution, optical and microphysical properties, and radiative effects, while also allowing cross-validation among instruments. Overall, this study extends previous research on Greek wildfire episodes and highlights the atmospheric consequences of increasingly catastrophic events in a warming climate.
The paper is structured as follows: Sect. 2 describes the instrumentation and methodology, including lidar systems, sun-sky-lunar photometric retrievals, air quality monitoring, solar irradiance measurements, satellite observations and FLEXPART simulations. Section 3 presents the results, covering event evolution, aerosol optical and microphysical properties, and their impact on both columnar and near-surface conditions. Section 4 summarizes the main conclusions of the study.
The main observation site was the National Technical University of Athens (NTUA) (37.96° N, 23.78° E; ∼ 212 ), where two lidar systems, a Raman lidar and a depolarization lidar, along with a CIMEL sun-sky-lunar photometer were operated. Additionally, aerosol and air quality measurements were obtained at the Demokritos station (DEM) (37.99° N, 23.81° E ∼ 270 ), which provided data from an aethalometer, a Time-of-Flight Aerosol Chemical Speciation Monitor (ToF-ACSM, Aerodyne Research Inc., USA) for monitoring aerosol chemical composition, as well as 1 h data of PM10 and PM2.5 concentrations. At the Biomedical Research Foundation of the Academy of Athens (BRFAA) (37.99° N, 23.78° E; ∼ 180 ), a Brewer spectrophotometer contributed measurements of UVB radiation and aerosol optical depth. To support the analysis of wildfire impacts and atmospheric transport, FLEXPART dispersion modelling and wildfire detections from MODIS (FIRMS) satellite imagery data were also used. Figure 1 provides an overview of all instruments, modelling tools, and algorithms used in this study.
2.1 Lidar systems
Two lidar systems were used to retrieve aerosol optical properties: the DEPOLarization lidar systEm (DEPOLE) and the elastic-Raman lidar system aErosol and Ozone Lidar system (EOLE). DEPOLE is based on a pulsed Nd: YAG laser emitting at 355 and 532 nm with linear polarization purity more than 99.5 %, achieved using a polarizing filter. The elastically backscattered lidar signals are collected at both wavelengths by a 200 mm diameter Dall–Kirkham () Cassegrainian telescope and are separated into parallel and cross-polarization components using polarizing beam splitter cubes. DEPOLE achieves full overlap at approximately 500 (Papayannis et al., 2020). DEPOLE provides vertical profiles of the aerosol elastic backscatter coefficient and volume and particle linear depolarization ratios VLDR and PLDR, respectively, at 355 and 532 nm, as well as the aerosol Ångström exponent between these two wavelengths ().
The EOLE lidar system is based on a pulsed Nd: YAG laser emitting simultaneously at 355, 532, and 1064 nm. The receiving unit includes a 300 mm diameter () Cassegrainian telescope, which collects both the elastically backscattered signals and the vibrational-rotational Raman signals generated by atmospheric N2 at 387 and 607 nm, and H2O at 407 nm. EOLE provides vertical profiles of the aerosol backscatter coefficients at 355, 532, and 1064 nm, and extinction coefficients at 355 and 532 nm, as well as the water vapor mixing ratio in the troposphere. Additionally, EOLE provides vertical profiles of intensive aerosol parameters, including the lidar ratio (LR) at 355 and 532 nm, and aerosol Ångström exponents derived from extinction () and backscatter (, ) coefficients. The system reaches full overlap at approximately 800 Based on these observations and using well-known methodologies, we can separate the lidar signals between aerosols and clouds, spherical and non-spherical particles in mixed aerosol layers (Ansmann et al., 2012, 2019; Tesche et al., 2009).
Both lidar systems were used in combination, with EOLE providing Raman-derived extinction profiles and DEPOLE contributing depolarization measurements. This combined use allowed the application of the POLIPHON algorithm, which utilizes extinction (Raman) and depolarization data at 532 nm to separate fine and coarse particle contributions and to estimate aerosol mass concentrations (see Sect. 2.6.4).
2.2 CIMEL sun-sky-lunar photometer data
Sun-sky-lunar photometric measurements are continuously conducted at NTUA, using a CE318-T sun-sky-lunar photometer, part of the Aerosol Robotic Network (AERONET) and operated by the Laser Remote Sensing Unit (LRSU). The instrument performs automated observations of direct solar irradiance and sky radiance in both the almucantar and principal plane, typically every 15 and 30 min, respectively, across multiple spectral channels (including 340, 380, 440, 500, 670, 870, 940, and 1020 nm). The instrument performs also nighttime measurements using lunar irradiance. In this study, we used Level 2.0 (cloud-screened and quality-assured) AERONET Version 3 retrievals, including aerosol optical depth (AOD), Ångström exponent (AE), single-scattering albedo (SSA), fine/coarse AOD, and aerosol volume size distributions (VSD), to characterize the optical and microphysical columnar properties of aerosols over Athens. Lunar AOD data were additionally used to extend the temporal coverage during night periods with elevated aerosol presence. For days with extreme smoke loads (e.g., 24 and 27 August 2023), Level 1.0 data were used for direct sun products due to the automatic cloud-screening algorithm discarding valid data as cloudy under the high temporal variability of wildfire plumes. Correspondingly, Level 1.5 inversion products (SSA, VSD) were used on these days, while Level 2.0 products were used otherwise.
2.3 Air Quality data
In addition to column-integrated optical and microphysical properties, in situ aerosol measurements were also used to better characterize the smoke plume's chemical and optical properties. The aerosol absorption coefficient was obtained using an aethalometer (AE33, Magee Scientific, USA), operating at seven wavelengths (370, 470, 520, 590, 660, 880, and 950 nm). The mass concentration of equivalent black carbon (eBC) was calculated based on the Mass Absorption Coefficient (MAC) values provided by the instrument manufacturer. The AE33 sampled through a PM10 inlet at 880 nm with a 1 min resolution, and the obtained measurements were subsequently averaged to hourly values (Diapouli et al., 2017; Stathopoulos et al., 2021). The measured eBC was divided into two fractions (Biomass Burning and Fossil Fuel) using the model proposed by Sandradewi et al. (2008). Furthermore, the non-refractory chemical composition of fine aerosols, including organics, sulfate (), nitrate (), ammonium (), and chloride (Cl−1) was monitored using a time-of-flight aerosol chemical8 speciation monitor (ToF-ACSM, Aerodyne Research Inc., USA) with a time resolution of 15 min (Fröhlich et al., 2015; Zografou et al., 2022). PM2.5 and PM10 hourly mass concentrations were also obtained by the use of a Laser Aerosol Spectrometer (LAS) 3340A (TSI Inc., USA), coupled with gravimetric analysis of 24 h PM10 and PM2.5 samples collected on Teflon filters by the use of reference low volume samplers ( SEQ 47/50-CD with Peltier cooler, Sven Leckel GmbH, Germany), according to EN12341. LAS provides the aerosol number concentration at different sizes, up to 10 µm. Hourly averages of the number concentrations were converted to volume concentrations. PM2.5 and PM10 mass concentrations on an hourly basis were then calculated by integrating the volume concentrations over the respective size range and converting to mass through comparison with the 24 h average PM10 and PM2.5 concentrations obtained gravimetrically.
2.4 Brewer spectrophotometer data
In this study, we analysed UV radiation measurements (315–325 nm) for the period 16 July–30 August 2023 obtained by a Brewer MKIV spectrophotometer operating daily at the Biomedical Research Foundation of the Academy of Athens (BRFAA; 37.99° N, 23.78° E; 180 ). The institute is located in a green area, approximately 4 km away from the city center (Eleftheratos et al., 2021) and the NTUA site. The instrument is calibrated on a biennial basis by International Ozone Services Inc., Toronto, Ontario, Canada (http://www.io3.ca, last access: 12 July 2025). The last two calibrations took place in Athens, Greece in 2023 and in El Arenosillo, Spain in 2025. Additionally, every two months, UV spectra from the Brewer are calibrated using a set of three 200 W lamps that are traceable to the National Institute of Standards and Technology (https://www.nist.gov, last access: 25 August 2025). The spectra used in this study have been quality controlled and assured as described in Masoom et al. (2023).
The 315–325 nm wavelength range has been chosen because at these wavelengths, for relatively high aerosol loads (e.g., during wildfire or dust events), the effect of aerosols is dominant over the effect of ozone. For shorter wavelengths (< 315 nm) variations and uncertainties in total ozone induce higher uncertainties regarding the quantification of the impact of aerosols. We consider that the impact of aerosols at these wavelengths is representative for their impact on UV-B (290–315 nm integral). Hereinafter, the 320 nm irradiance is referred to as UV-B irradiance.
The impact of aerosols on the 290–315 nm integral could be masked, at least partially (Fountoulakis et al., 2016, 2019), by the effect of ozone, and this is why we choose to show the results for the 320 nm irradiance. Given that most of the attenuation by ozone takes place in the stratosphere while interaction of the UV-B radiation with aerosols happens at the lowest 2–3 km in the troposphere, complex interactions between UV-B, aerosols and ozone under heavy aerosol load are not expected to impact the variability in UV-B, at least significantly. Differences between the variability (caused by aerosols) in the 320 nm irradiance and the 290–315 nm integral are expected to be mostly due to the corresponding differences in aerosol optical properties (AOD, SSA), which would introduce a slightly larger variability for shorter wavelengths. The differences, however, are estimated to be small, within the uncertainty limits in the UV measurements.
The AOD data from the Brewer have been retrieved at selected wavelengths used to measure columnar ozone (306.3, 310.1, 313.5, 316.8, 320.1 nm) according to the methodology described in López-Solano et al. (2018) (López-Solano et al., 2018). Comparison with the AOD at 340 nm from the CIMEL (extrapolated to the desired wavelengths using the 340–440 nm AE) for the period 2023–2025 revealed an average agreement better than 0.05 with a standard deviation ranging between ∼ 0.05 (for 320. 1 nm) and ∼ 0.1 (for 306.3 nm) (Fig. S1 in the Supplement).
For the case studies, the differences between the 320 nm AOD retrieved from the Brewer and the extrapolated AOD (from 340 to 320 nm using the Ångström exponent) derived from the CIMEL are generally smaller for the dust case (0.02–0.05) compared to the smoke case (0.05–0.08). Nevertheless, a more comprehensive analysis is required to determine whether these differences reflect limitations of the Ångström approximation in capturing the spectral curvature of AOD at short wavelengths or arise from the overall uncertainty of the AOD retrievals.
2.5 Satellite data
Active fire data during the study period were obtained from the Moderate Resolution Imaging Spectroradiometer (MODIS) instruments aboard the Terra and Aqua satellites (Giglio et al., 2016). These data were accessed via the Fire Information for Resource Management System (FIRMS) platform (https://firms.modaps.eosdis.nasa.gov/map, last access; 15 December 2025). To ensure high confidence in the identification of active fire locations, only detections with a confidence level greater than 80 % were considered. This threshold was chosen to identify regions affected by biomass-burning emissions and to confirm that the air masses reaching Athens passed over fire-affected areas enriched with smoke aerosols (Justice et al., 2002; Vadrevu and Lasko, 2018).
2.6 Modelling and algorithms
2.6.1 Microphysical Aerosol Properties
Aerosol microphysical properties within dust and/or biomass-burning layers were retrieved using the regularization inversion technique (Müller et al., 1999), based on lidar profiles of extinction (355–532 nm), backscatter (355, 532, 1064 nm), and depolarization (355, 532 nm). This 3b + 2e + 2δ configuration combines Raman lidar backscatter and extinction data from EOLE (3b + 2e) with depolarization measurements (2δ) from DEPOLE, providing enhanced sensitivity to particle shape and composition. The inversion provided the effective radius (Reff), number concentration (N), surface area+(S), volume (V), and the real (mR) and imaginary (mI) parts of the refractive index. The refractive index was assumed constant across the 355–1064 nm range and averaged over particle size. Particles were considered as spheres (PLDR < 10 %) or spheroids (PLDR > 10 %). Uncertainties are estimated at ± 0.05 for mR, ± 50 % for mI and N, and below 20 % for Reff, S, and V (Müller et al., 2005).
2.6.2 Spectral surface solar radiation
To quantify the impact of aerosols on UV-B irradiance, a comparison between measured and modelled irradiances has been performed. Since the irradiance at wavelengths that are shorter than ∼ 315 nm is affected strongly by variations in total ozone (and the corresponding uncertainties in the used total ozone values), we focused on the irradiance at 320 nm (315–325 nm average). Radiative transfer simulations were performed using the disort (DIScrete Ordinate Radiative Transfer) pseudo-spherical approximation (Buras et al., 2011) of the UVSPEC radiative transfer model that is included in the libRadtran v2.0.6 package (Emde et al., 2016). The simulations were performed for the coordinates of the BRFAA, for the exact time of the measurements, using the columnar ozone measured by the Brewer as input. Two sets of simulations were performed: (i) simulations assuming cloud-free and aerosol-free skies, and (ii) simulations assuming cloud-free skies, for the measured AOD at 320 nm, and for various SSA values (0.6–1 with a step of 0.02). The former simulations were compared to the measured irradiances to quantify the overall aerosol effect. The latter were also compared to the measured irradiances, this time to estimate the SSA at 320 nm as described in Bais et al. (2005).
Climatological profiles of atmospheric molecules corresponding to mid-latitude summer (Anderson et al., 1986) and the extraterrestrial spectrum proposed by Kurucz (1994) were used for all simulations. More detailed discussion for the UV-B modelling and the conditions that ensure the comparability between the measured and modelled irradiances can be found in Masoom et al. (2023).
2.6.3 FLEXPART modelling
To identify aerosol sources in the case studies (Sect. 3), we used the FLEXPART v10.4 Lagrangian model (Pisso et al., 2019; Stohl et al., 1998), driven by ECMWF ERA5 data (Hersbach et al., 2020) (0.5° resolution, hourly, 137 vertical levels). Backward simulations (”retroplume” mode) released particles from 0–4000 m at NTUA and tracked them 30 d back, covering typical lifetimes of BC and dust (∼ 1 week). FLEXPART computed source-receptor matrices (footprints), which, when combined with emission inventories, indicate the contribution of each source region. The model accounts for gravitational settling, dry/wet deposition, turbulence, and deep convection, offering a more complete representation than simple trajectories. Anthropogenic BC sources were derived from the ECLIPSEv6 inventory (Klimont et al., 2017) (e.g., transport, industry, domestic combustion), while biomass burning used GFEDv4 (Giglio et al., 2013). Dust emissions were estimated with FLEXDUST (Groot Zwaaftink et al., 2022), using ECMWF data at 0.25° resolution and including particles from 0.2 to 20 µm. FLEXPART has been widely applied for BC and dust transport modelling and source appointment in various regions, in particular over Europe (Evangeliou et al., 2021; Gidarakou et al., 2024; Groot Zwaaftink et al., 2022). In our case, most lidar-retrieved aerosol layers were located below 4 km, thus, well represented by the 0–4000 m release range. For a few events where layers extended up to 5 km, sensitivity tests using an extended 4000–5000 m release showed negligible differences in the source–receptor patterns, confirming that the chosen configuration adequately captures the observed aerosol transport.
2.6.4 Aerosol Mass Concentration
Aerosol mass concentration profiles for dust and non-dust components were estimated using the POLIPHON algorithm (Ansmann et al., 2012; Mamouri and Ansmann, 2014; Tesche et al., 2009), which combines depolarization lidar and sun photometer data. Depolarization lidar distinguishes dust from non-dust aerosols from aerosol backscatter and depolarization profiles, while sun photometry provides fine/coarse-mode AODs and microphysical properties (volume and surface area). Mass concentrations were calculated using aerosol-specific properties like PLDR, lidar ratio, density, and volume-to-AOD ratios. To this end we used a coarse-mode density of 2.6 g cm−3 (dust) (Hess et al., 1998; Proestakis et al., 2024) and a fine-mode density of 1.35 g cm−3 (smoke) (Engelhart et al., 2012; Reid et al., 2005). The method remains effective even when lidar and photometer data are not strictly collocated, especially for stable dust events. Total uncertainty in retrieved mass concentrations is ∼ 36 %–40 % and assumed mass densities (± 20 %). Volume-to-AOD ratios may vary by up to 10 % for dust and 20 % for smoke (Ansmann et al., 2012, 2019). In our case, the lidar and the sun–sky photometer are collocated on the same building, ensuring consistent column and profile measurements and minimizing spatial mismatch. Therefore, the reported total uncertainty (∼ 36 %–40 %) primarily reflects the combined variability in assumed aerosol properties and retrieval parameters rather than site separation effects.
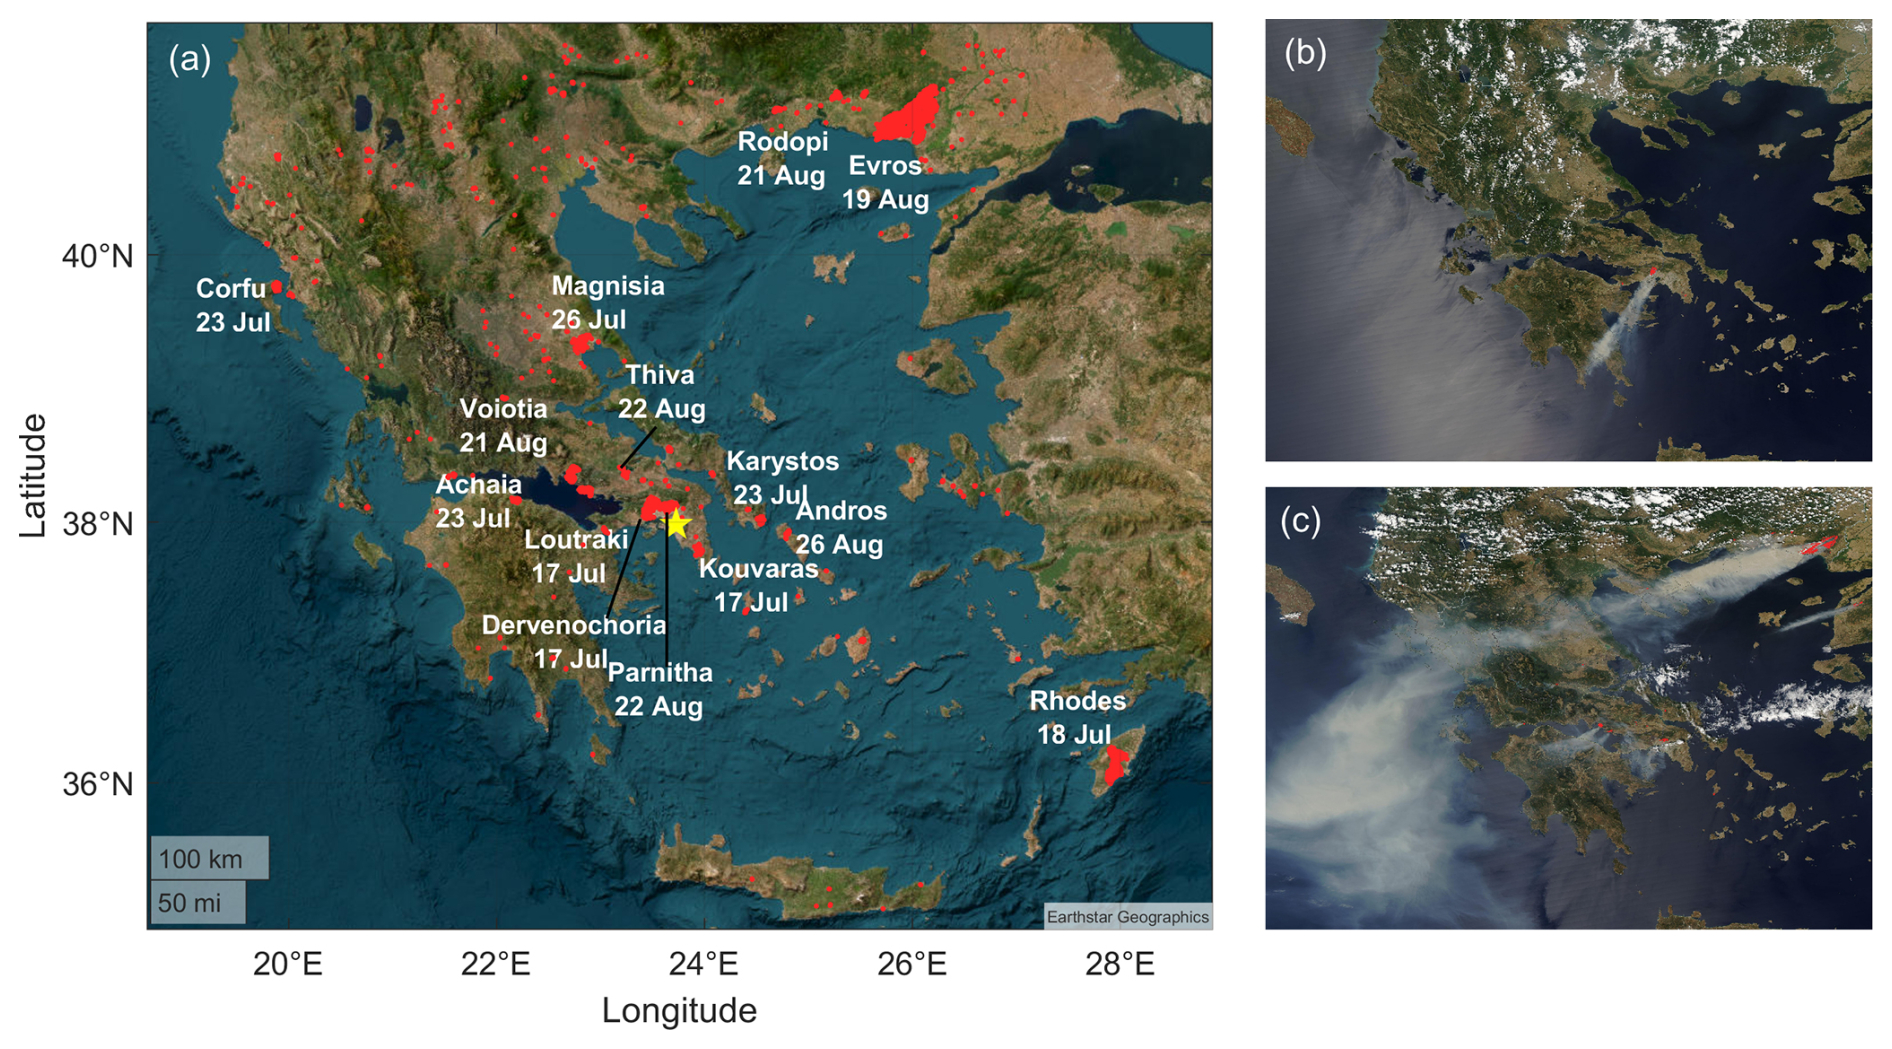
Figure 2(a) Map of Greece illustrating wildfires detected by Aqua MODIS NASA Satellite imagery from 17 July to 31 August 2023 and satellite image showing wildfires over Greece (b) afternoon 18 July 2023 and (c) afternoon 22 August 2023 – data from Aqua MODIS, NASA.
3.1 Description of the wildfire/dust events (17 July–31 August 2023)
Between 17 July and 31 August 2023, Greece experienced one of its most severe wildfire seasons in recent decades, with extensive fires affecting both the mainland and several islands. Major wildfire activity was recorded in regions such as Evros, Rodopi, Attica, Central Greece, the Peloponnese, and islands like Rhodes, Corfu, and Evia (Fig. 2a). According to EFFIS, approximately 170 000 ha were burned during this period (Wildfires: 2023 among the worst in the EU in this century – The Joint Research Centre: EU Science Hub, 2026). The most catastrophic event occurred in Evros region, northeastern Greece, where a wildfire that began on 19 August was further intensified by strong northeasterly winds and ultimately burned over 93 000 ha, surpassing the previous national record, and becoming the largest wildfire ever recorded in the European Union since 2000 (OBSERVER: Global Wildfire Watch: Copernicus EMS and CAMS Monitor Wildfires in 2023 | Copernicus, 2026). The Copernicus Atmosphere Monitoring Service (CAMS) reported that Greece's wildfire emissions in July 2023 reached record-breaking levels, with over 1 Mt of carbon released by 25 July, nearly twice the previous record from 2007. These emissions coincided with an intense heatwave, characterized by temperatures exceeding 40° C and prolonged drought, which created ideal conditions for wildfire ignition and spread.
On 18 July, the Moderate Resolution Imaging Spectroradiometer (MODIS) aboard NASA's Aqua satellite captured a true-color image of active burning fires near Athens, with a thick gray smoke plume being transported southwestward by strong winds (Fig. 2b). This event marked the onset of significant biomass-burning influence over Athens.
Smoke plumes from these fires were transported across the Aegean Sea and Athens, reaching altitudes up to ∼ 6 km. The elevated aerosol layers observed over Athens during this period resulted from both fine-mode biomass burning (BB) particles and coarse-mode Saharan dust intrusions.
FLEXPART simulations and MODIS fire detection data provided clear evidence of the origin and evolution of these intrusions. Between 20 and 25 July, air masses arriving over Athens originated from North Africa, including Morocco, Tunisia, and northern Algeria, merging over the central Mediterranean before reaching Greece. Consequently, aerosols over Athens during this period were a mixture of smoke, marine aerosols, and mineral dust, primarily below 6 km height.
From 21 to 29 August, the aerosol load over Athens was dominated by intense smoke conditions with minimal dust influence. More precisely on 22 August, MODIS imagery once again revealed a dense smoke plume originating from large fires in Northern Greece, visibly extending southward toward Athens, emphasizing the persistence of biomass-burning influence (Fig. 2c).
These observations were supported by multi-instrument aerosol characterization, including multiwavelength Raman and depolarization lidars, sun-sky-lunar photometer measurements, and in situ observations of black carbon (BC), elemental black carbon (eBC), PM10, PM2.5, aerosol chemical composition, and UVB radiation data.
Synoptic meteorological conditions marked by extreme heat, low relative humidity, and persistent northeasterly winds, not only facilitated the spread of fires but also supported the transport of smoke and dust. In some cases, pyrocumulonimbus clouds further enhanced vertical and horizontal dispersion of aerosols. The combined influence of wildfire smoke and Saharan dust led to exceptionally high aerosol loads over Athens, with significant implications for air quality, and public health. These events highlight the critical need for continuous, multi-instrument aerosol monitoring to assess the impacts of extreme atmospheric events.
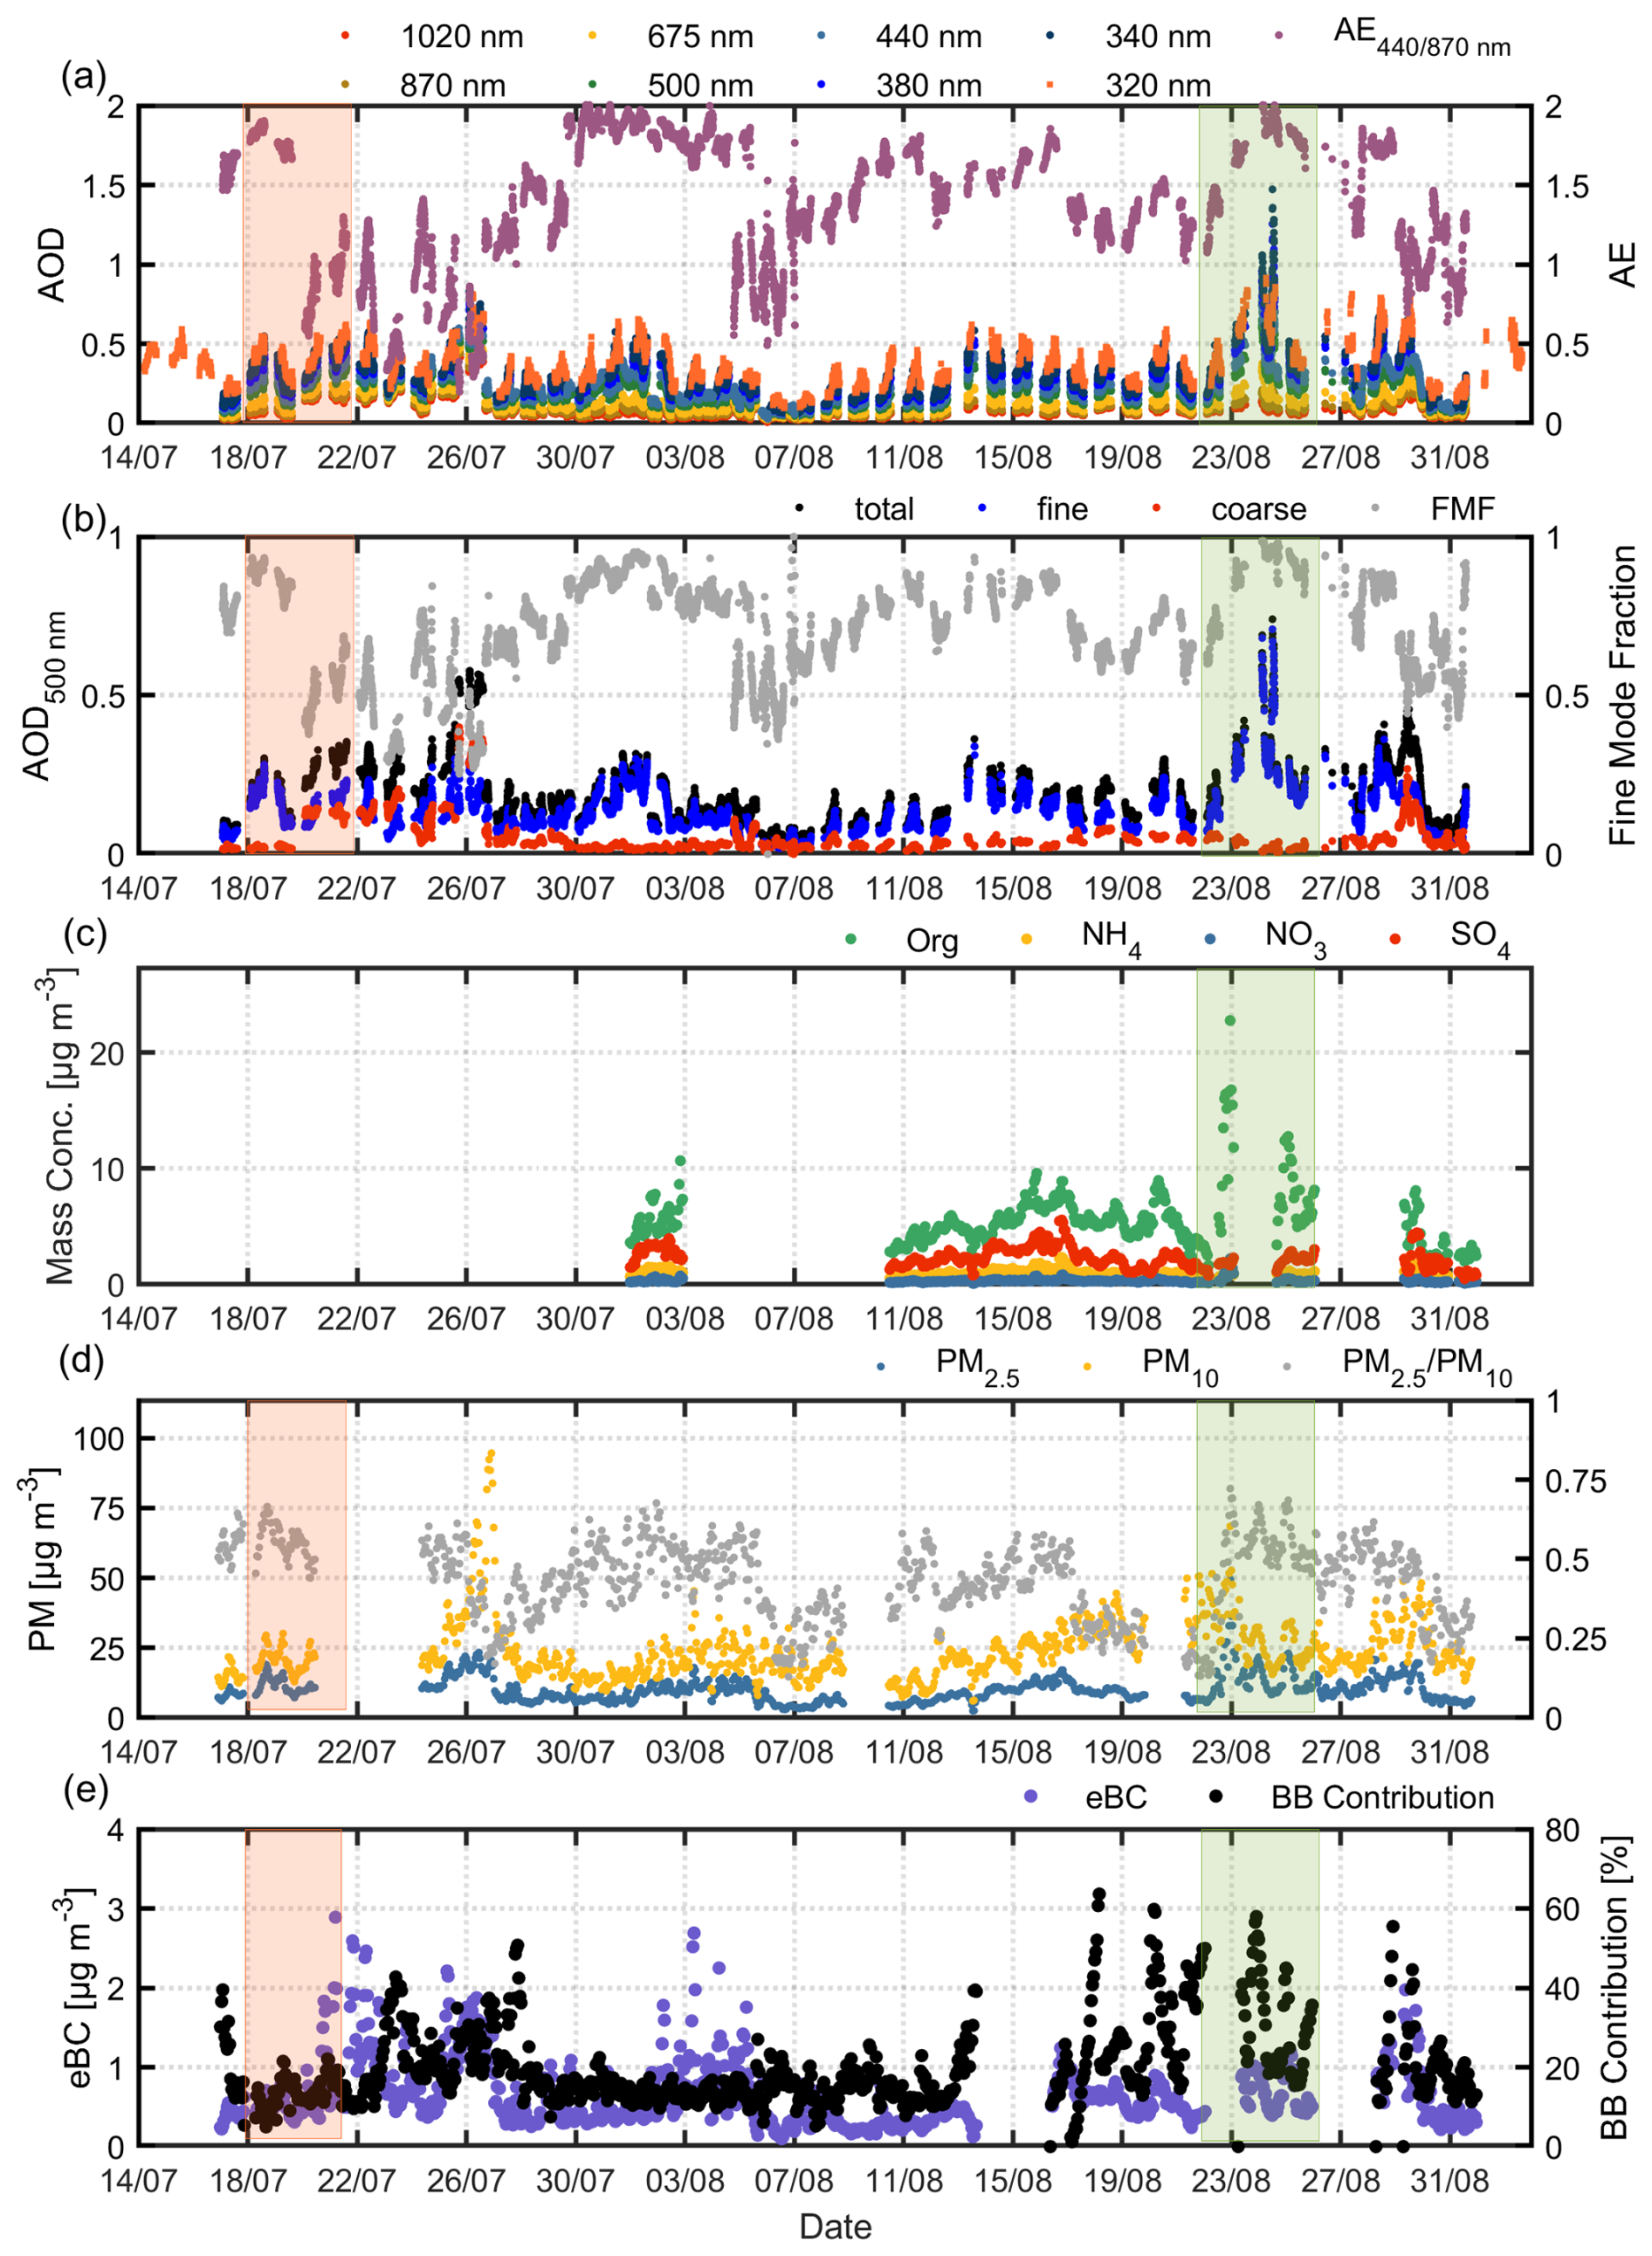
Figure 3Time-series of hourly averaged values of (a) AOD for various wavelengths (340–1020 nm) and AE at 440/870 nm obtained by the CIMEL sun-sky-lunar photometer and AOD at 320 nm obtained by the Brewer spectrophotometer (b) AOD and AE at 500 nm along with the Fine Mode Fraction (FMF) obtained by the CIMEL sun-sky-lunar photometer (c) mass concentration of various chemical composition (Org, , Cl, ) obtained by ToF – ACSM (d) 1 h PM2.5 and PM10 concentration (e) eBC concentration and BB contribution obtained by the aethalometer.
In summary, the combined influence of biomass-burning aerosols and Saharan dust led to exceptionally high aerosol loads over Athens during several episodes in July and August 2023, with serious implications for air quality, radiative forcing, and public health (Mylonaki et al., 2024). These extreme events underscore the critical need for continuous, multi-instrument atmospheric monitoring to assess the evolving impacts of climate-driven hazards on regional air quality.
3.2 Impact on air quality and columnar aerosol properties
Figure 3 presents the temporal evolution of aerosol optical properties (Fig. 3a and b) and chemical composition (Fig. 3c–e) over Athens from 17 July to 31 August, encompassing a period of intense atmospheric perturbations related to regional wildfires and long-range dust transport from Sahara. Figure 3a presents the AOD from the CIMEL sun-sky-lunar photometer (1020–340 nm range), alongside the AE calculated from the 440/870 nm pair. Throughout the observation period, AOD values reveal moderate to high aerosol loads, with pronounced peaks occurring in late August. AE values mostly remain above 1, indicating a dominant contribution from fine-mode particles, particularly during the high-AOD events observed between 21 and 30 August, during the wildfires that took place in the Evros region. The combination of elevated AOD at shorter wavelengths and enhanced AE suggests the presence of absorbing, fine-mode aerosols, likely associated with smoke from the widespread wildfires that affected mainland Greece and surrounding regions during this time. These findings align with previous observations of increased fine-mode AOD and AE during summer wildfire outbreaks in Greece (Kazadzis et al., 2007; Masoom et al., 2023; Michailidis et al., 2024; Raptis et al., 2020).
Figure 3b presents the temporal evolution of total, fine-mode, and coarse-mode AOD at 500 nm, alongside the Fine Mode Fraction (FMF), which quantifies the dominance of submicron aerosol particles. The FMF varied substantially throughout the study period (17 July–31 August), reflecting the changing nature and sources of aerosols over Athens. From 17 to 19 July, FMF ranged between 0.69 and 0.93, suggesting the predominance of fine-mode particles, potentially influenced by regional pollution or transported smoke. A notable shift occurred between 20 and 26 July, when FMF dropped significantly (0.37–0.73), reaching values as low as ∼ 0.2–0.4 on 23 and 25 July. This indicates a stronger contribution from coarse-mode aerosols, consistent with dust intrusion events, which are frequent over Greece during summer (Masoom et al., 2023).
In the period from 26 July to 5 August, the FMF increased again to values around 0.75, indicating the fine- mode dominance once again. A brief decline on 6 August (FMF < 0.5) was followed by a more stable period from 7 to 22 August, where FMF fluctuated between 0.47 and 0.96, with a mean around 0.7. This pattern likely reflects a mix of background aerosols and contributions from regional BB. A pronounced shift occurred between 23 and 26 August, when FMF exceeded 0.9, peaking on 24 August. This peak coincides with the major wildfire event in the Evros region, one of the most intense fire episodes of the summer in Greece, strongly impacting the aerosol load over Athens with freshly emitted fine particles.
The consistently high FMF values during the latter part of August, together with the concurrent rise in fine and total AOD, indicate a substantial contribution from wildfire smoke. Similar aerosol signatures have been reported in earlier fire-affected episodes in Greece and the eastern Mediterranean, where increased FMF and AE values are linked to enhanced black carbon, organic aerosols, and secondary fine particles (Kaskaoutis et al., 2021; Liakakou et al., 2020; Paraskevopoulou et al., 2014). In contrast, the relatively limited coarse-mode AOD throughout most of August suggests a negligible impact from Saharan dust during this period.
Figure 3c presents the mass concentrations of selected non-refractory PM1 chemical species, organics (Org), ammonium (), sulfate (), and nitrate () measured by the ToF-ACSM during August 2023. Organic aerosols clearly dominate the chemical composition, with a mean concentration of 5.45 µg m−3, ranging from 1.32 to 22.77 µg m−3. The highest organic levels were recorded between 22 and 26 August, peaking on 22 August, in accordance with the intense wildfires in northeastern Greece. These elevated concentrations highlighting the major influence of biomass burning – fine-mode aerosol loading over Athens during this period. displayed a more stable background behaviour, with a mean of 2.23 µg m−3 (range: 0.50–5.56 µg m−3), showing moderate increases during selected episodes, likely linked to regional transport and secondary aerosol formation processes. On the other hand, concentrations remained relatively low and variable, averaging 0.89 µg m−3 (range: 0.16–2.34 µg m−3), consistent with its volatility and the typically high temperatures in Athens during summer that limit its partitioning to the particle phase (Zografou et al., 2022). also exhibited low concentrations (mean: 0.33 µg m−3, range: 0.09–2.22 µg m−3) and followed similar temporal trends to , supporting the likely presence of ammonium sulfate or ammonium nitrate components during secondary formation episodes. These observations highlight the dominant role of organic aerosols during fire events, while secondary inorganic species such as and contributed more steadily to the PM1 composition throughout August.
Figure 3d presents the hourly mean concentrations of PM2.5 and PM10, obtained from real-time optical measurements together with gravimetric analysis of PM filter samples during July and August 2023. The average concentrations were 10.37 µg m−3 for PM2.5 and 22.76 µg m−3 for PM10, with values ranging from 2.50 to 49.41 µg m−3 and 6.07 to 94.60 µg m−3, respectively. Elevated PM2.5 concentrations were evident during 18–22 July (orange shading) and 22–26 August (green shading), coinciding with periods of enhanced AOD (Fig. 3a and b) and changes in aerosol size/composition, thus, reflecting significant aerosol loading events. During 18–22 July, the PM2.5 PM10 ratio remained around 0.5, suggesting a mixture of fine smoke particles and coarse dust. In late August, the ratio increased to 0.6–0.7, peaking at 0.7 on 22 August, consistent with the dominance of biomass burning particles. The concurrent increase of PM10 concentrations also points to contributions from coarse particles, likely resuspended dust, or aged smoke plumes.
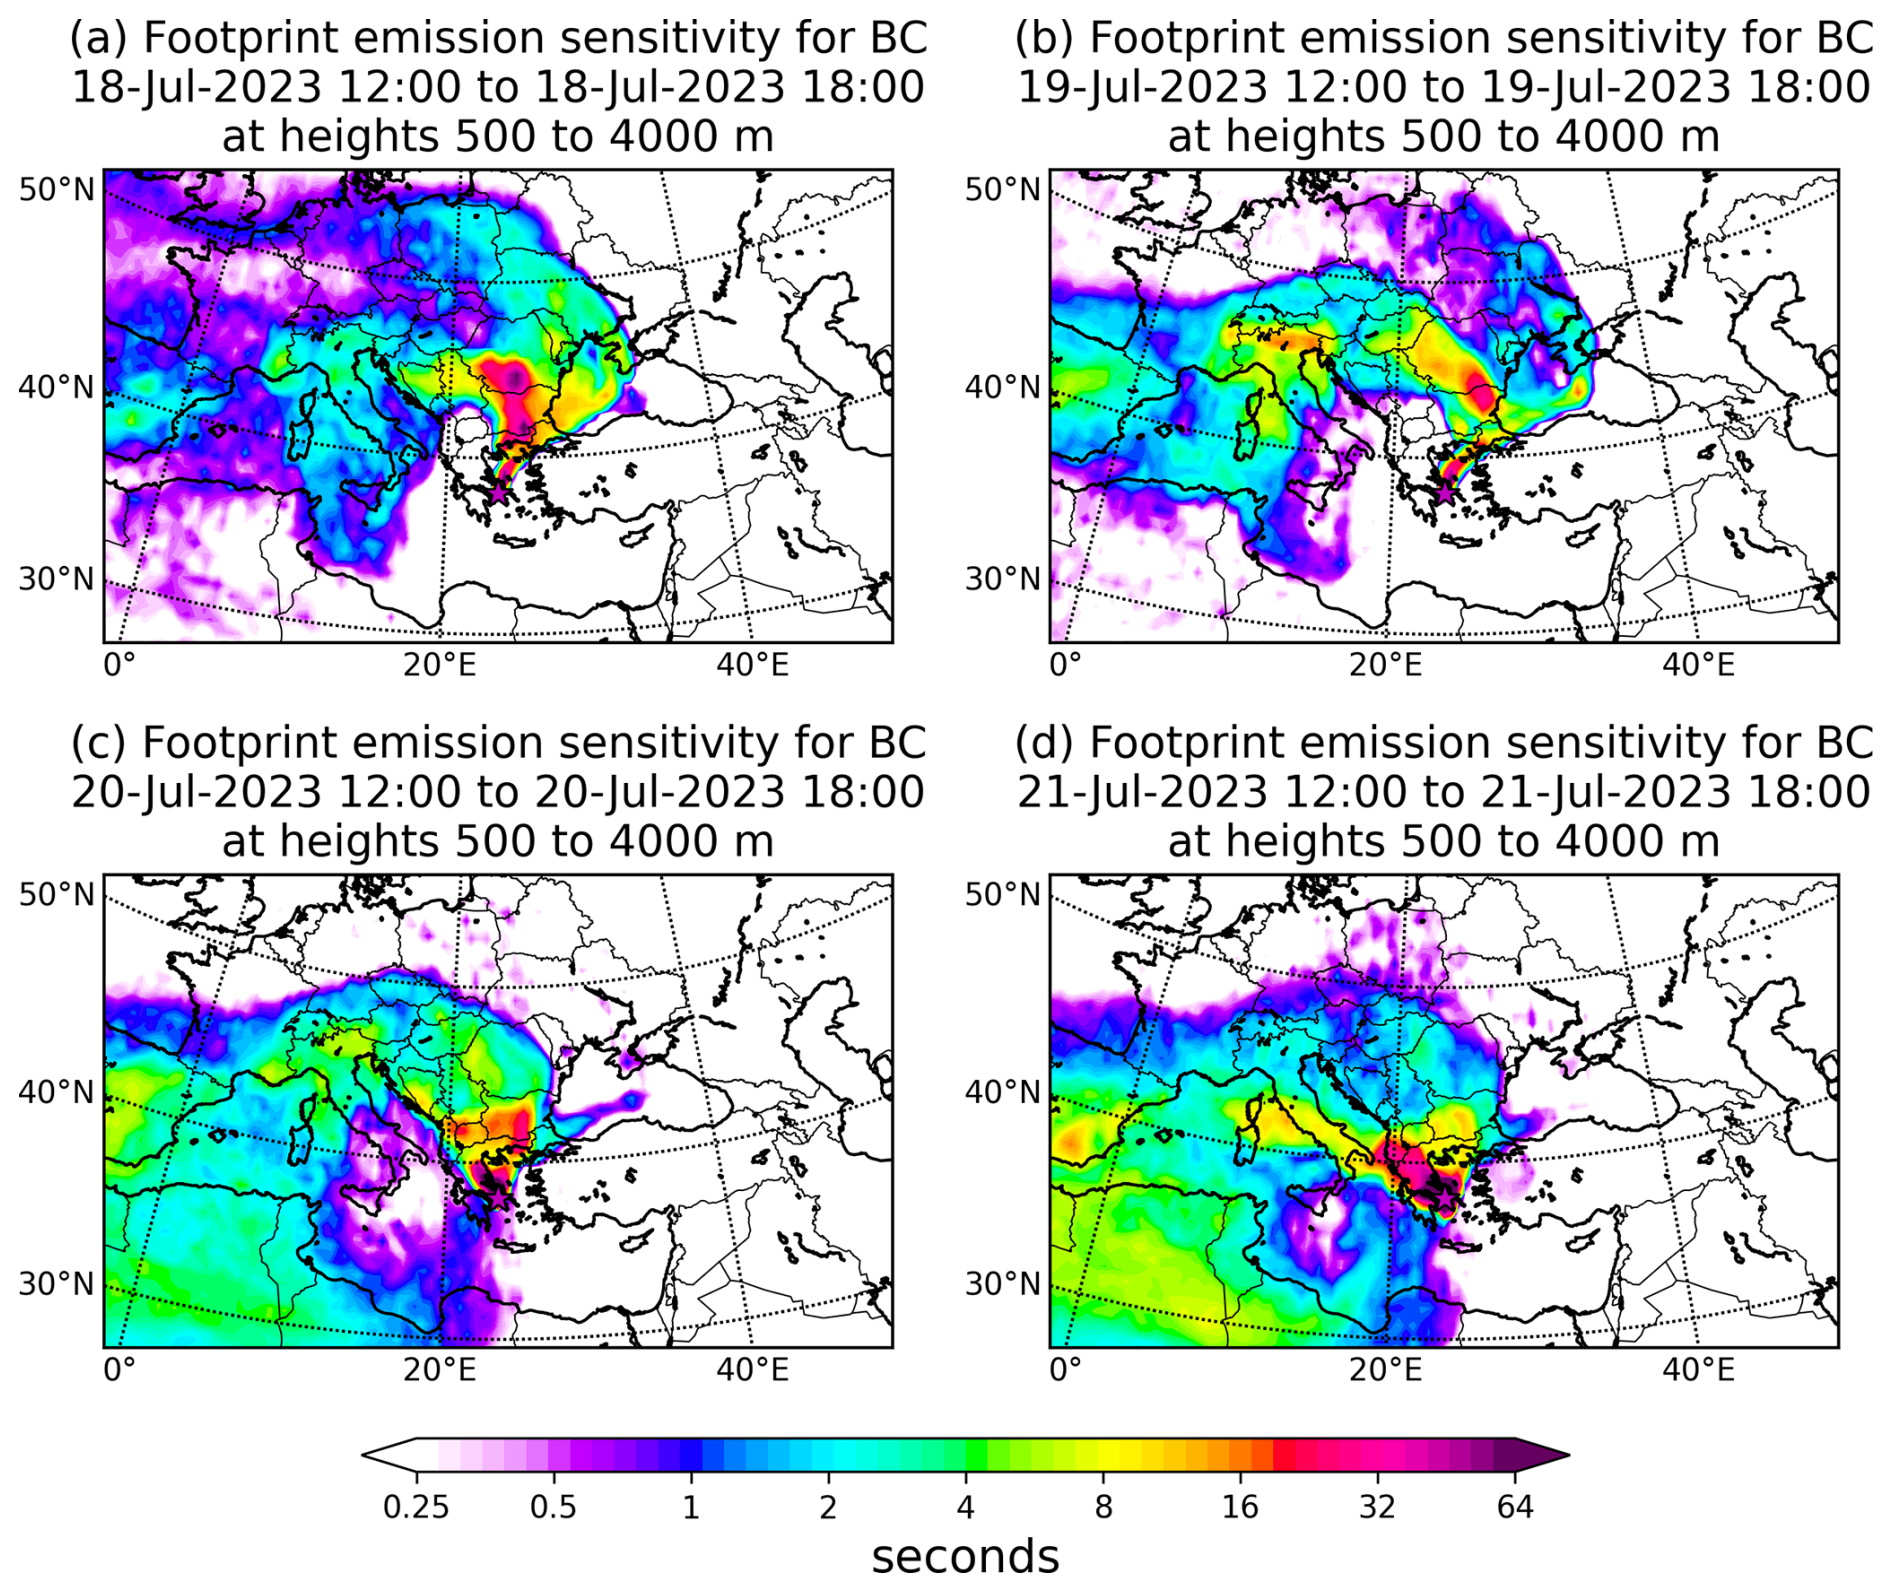
Figure 4Footprint emission sensitivities for BC calculated using FLEXPART for air masses arriving in Athens between 0.5 and 4.0 km from 18 to 21 July 2023 (12:00 to 18:00 UTC).
To further quantify the relationship between particulate matter and columnar aerosol loading, we computed the Spearman correlation between hourly PM2.5 and PM10 concentrations and AOD at 500 nm (Fig. S2 in the Supplement). PM2.5 shows a moderate positive correlation with AOD (ρ = 0.60, p≪ 0.01), consistent with the strong influence of fine smoke particles, while PM10 exhibits a weaker but still significant correlation (ρ = 0.20, p≪ 0.01), reflecting contributions from coarse particles such as dust. These results confirm that surface PM enhancements generally coincide with periods of elevated aerosol loading during the wildfire and dust events. Enhanced eBC concentrations (∼ 1.0 µg m−3 on 21–24 August; Fig. 3e), together with the sharp increase in the BB fraction (> 50 %), further confirm the strong wildfire influence. Outside the wildfire periods, lower BB % values suggest mixed traffic and background sources. To further examine the coupling between elevated smoke layers and surface aerosol enhancements, ERA5-derived planetary boundary layer height (PBLH) data were analyzed together with simultaneous lidar and in-situ observations (Figs. S3 and S4 in the Supplement). During July and August episodes, the PBLH increased during daytime, occasionally intersecting the lower portion of the elevated aerosol layers, coinciding with surface PM2.5 and eBC peaks. These findings indicate that part of the surface aerosol enhancement can be attributed to downward mixing of transported smoke, in addition to local planetary boundary layer contributions.
3.3 Transport of fresh smoke and dust (the case of 18–21 July 2023)
FLEXPART footprint emission sensitivities for BC from 18 to 21 July 2023 (12:00–18:00 UTC) indicate that air masses arriving over Athens between 0.5 and 4.0 km altitude were strongly influenced by biomass burning (wildfires) activity, particularly originating from southern and northeastern Greece. The footprint maps (Fig. 4a–d) show increased residence time over active wildfire regions such as Dervenochoria, Greece (Fig. 2b), supporting the transport of smoke plumes from local forest fires. Additional emission sensitivities over the Balkans and Central Europe suggest potential contributions from regional air pollution sources.
From 20 July onward, the footprint emission sensitivities extend over North Africa, indicating the influence of Saharan dust during the latter part of this period. This shift in source influence from predominant local biomass burning to a combination with mineral dust corresponds with elevated PM2.5 concentrations, increased PM2.5 PM10 ratios (∼ 0.6) and enhanced organic aerosol fractions observed during the episode.
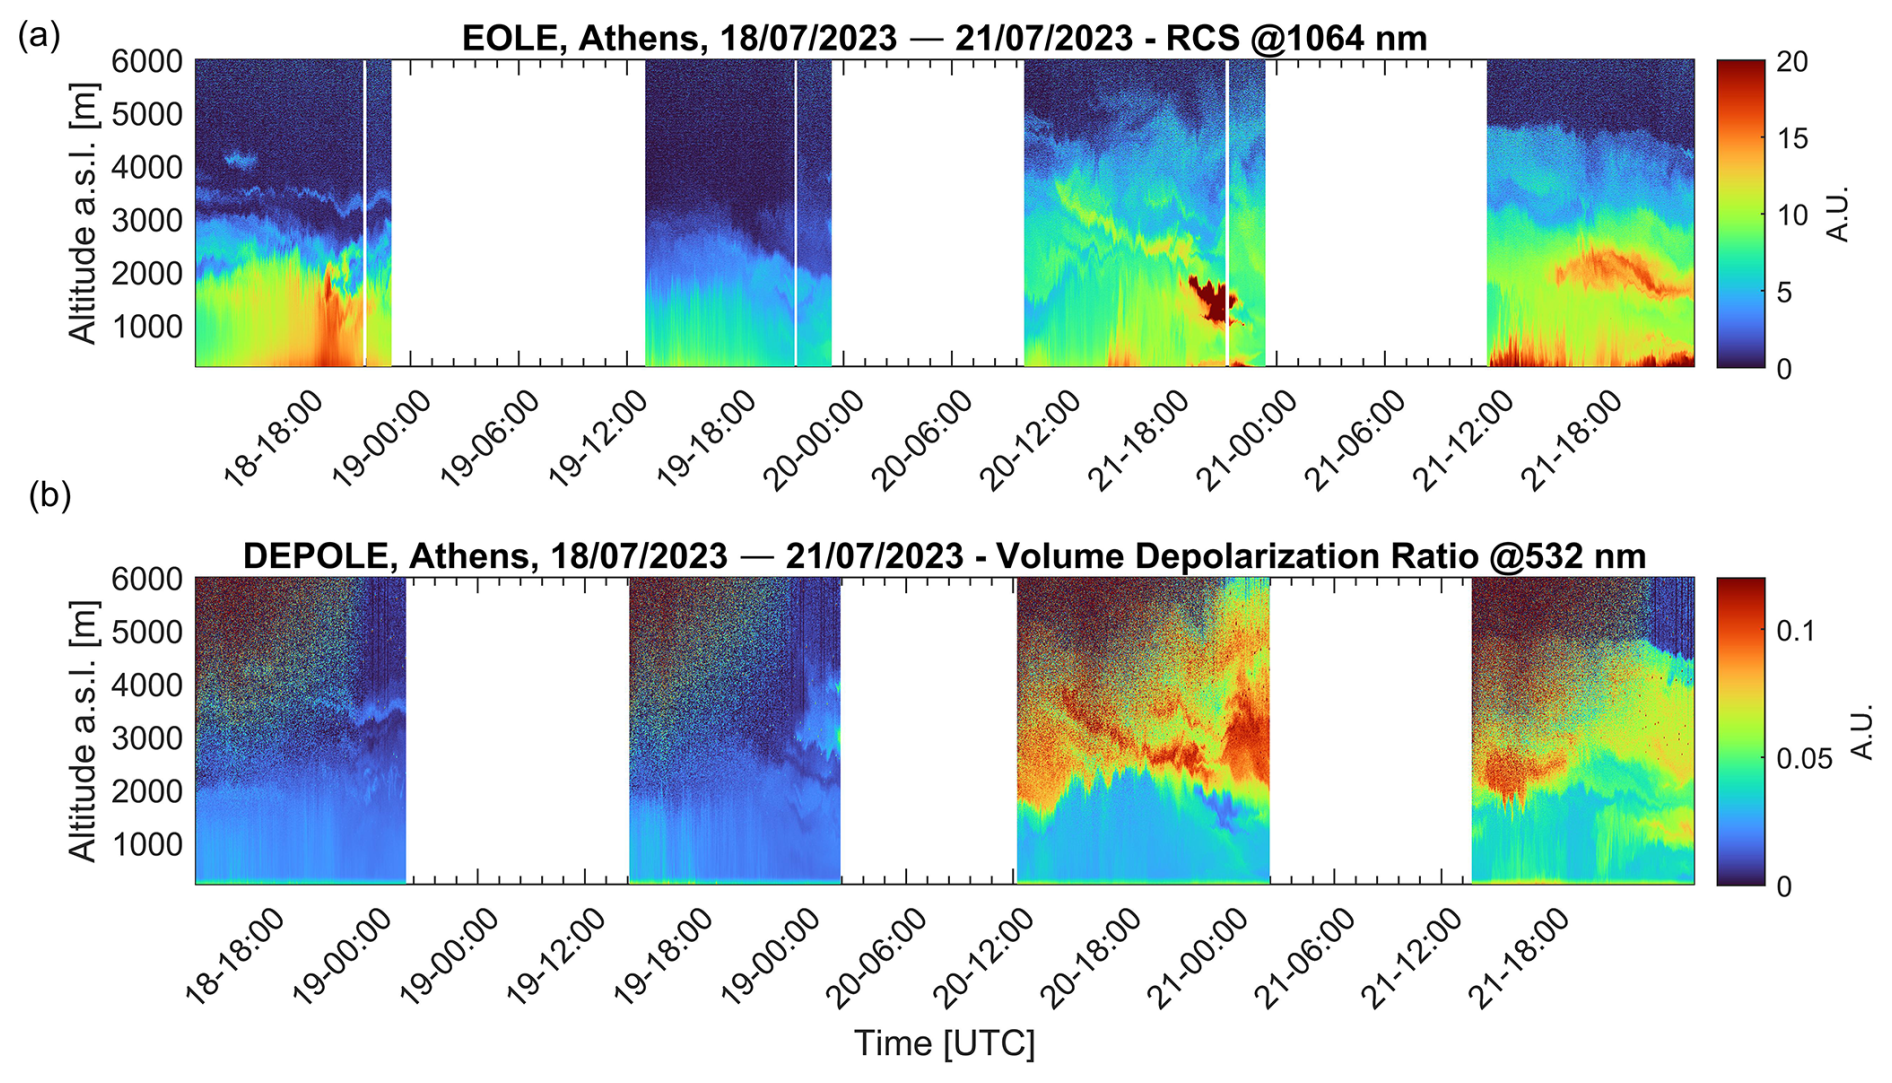
Figure 5Spatio-temporal evolution of the (a) range-corrected lidar signal (RCS) at 1064 nm and (b) volume depolarization ratio at 532 nm for the period 18–21 July 2023.
Figure 5 presents the spatio-temporal evolution of the range-corrected lidar signal (RCS, in arbitrary units) at 1064 nm, obtained from the EOLE system between 18 and 21 July 2023, from ∼ 0.5 to 6.0 km height a.s.l. On 18 July, two distinct aerosol layers were observed above the Planetary Boundary Layer (PBL): one extending from 0.5 to 2.0 km and another between 2.5 and 3.0 km height, with a very thin, detached layer around ∼ 3.8 km height during daytime hours, likely related to transported smoke. During nighttime, the lower aerosol layer persisted, while two thin layers around 2.5 and 3.8 km remained visible, maintaining a similar vertical structure.
On 19 July, a more stable situation was observed with a dominant aerosol layer from ∼ 0.5 to 2.0 km height and a thin, elevated one, between 2.0 and 3.0 km. As the day progressed into the evening, the elevated layer appeared to descend slightly. During nighttime, the PBL height remained, while a faint layer was observed aloft, consistent with aged smoke residues.
A more dynamic picture emerged on 20 July, coinciding with the arrival of dust particles. The lidar signals showed increased atmospheric mixing and vertical redistribution of aerosols. Early in the day, several distinct layers were identified: from 0.5 to 1.5, 1.5 to 3.0, 3.0 to 3.5 km heights, and thinner layers between 3.5 and 5.0 km. As the day progressed, these thin upper-tropospheric layers descended and merged with lower ones, forming more compact and optically dense features. Between 19:00 and 21:40 UTC, cloud formation was observed near 2.0 km height, likely induced by the interaction of biomass burning particles and mineral dust particles.
On 21 July, a multi-layered structure developed: an elevated layer between 1.5 and 2.5 km, another from 2.5 to 3.0 km, and a thin lofted layer between 4.0 and 5.0 km, likely associated with long-range dust transport. Between 12:40 and 18:00 UTC, a dense aerosol accumulation was noted around 2.5 km, while the higher layers remained persistent. In the evening and nighttime hours, the atmospheric structure appeared to stabilize, with layers becoming more stratified and less turbulent.

Figure 6Vertical profiles of aerosol (a) backscatter coefficient (355, 532 and 1064 nm) (b) extinction coefficient and AOD (355 and 532 nm) (c) lidar ratio (355 and 532 nm) Ångström (d) m exponent (e) PLDR (532 nm) and (f) aerosol mass concentration (coarse, fine mode and total particles) obtained by the EOLE and DEPOLE lidar systems on 21 July 2023 (18:20–18:50 UTC).
The vertical profiles of the aerosol optical properties retrieved on 21 July presented in Fig. 6, show three distinct aerosol layers between 1.6 and 3.8 km. These profiles were averaged over a 30 min period to retrieve the temporal stability and enhance the signal-to-noise ratio of the measurements during the occurrence of the dense aerosol layer observed at that time. The lowest layer (1.62–2.16 km) is characterized by elevated aerosol backscatter coefficients, especially at 355 nm (3.79 ) (Fig. 6a), and a high AE ( ≈ 1.60), indicating a dominance of fine-mode particles, likely biomass burning. However, the moderate PLDR (∼ 0.11) suggests the presence of some non-spherical particles, possibly indicating dust and smoke mixtures (Sicard et al., 2012; Janicka et al., 2017). The middle aerosol layer (2.52–3.00 km) shows slightly lower backscatter but similarly high lidar ratios (LR355 ≈ 36 sr), with an increase in PLDR to ∼ 0.16, reinforcing the mixing hypothesis. The upper layer (3.18–3.84 km) presents the highest PLDR (∼ 0.19) and the lowest AE, which is consistent with a more coarse-dominated aerosol layer, despite lower backscatter and extinction values. ERA5-derived PBLH values indicate that the PBL remained below the base of the elevated smoke and dust layers during the early morning but grew sufficiently in the afternoon to intersect the lower layers. This suggests that downward mixing from the free troposphere could contribute to surface PM enhancements, consistent with the observed PM2.5 peaks.
Figure 6b presents the aerosol extinction coefficients at 355 and 532 nm, which peak in the lower and middle layers, with values exceeding 100 M m−1 at 355 nm, further confirming a strong aerosol load. In addition, the layer-resolved AOD retrieved from the extinction lidar profiles highlights the significant optical contribution of each layer to the total column. Specifically, the AOD at 355 nm ranged from 0.27 in the lower layers to 0.12 at higher altitudes, while at 532 nm it ranged from 0.14 to 0.05. These values are consistent with a mixed smoke-dust episode, with the higher AOD at shorter wavelengths indicating pronounced fine-mode particles from smoke, while the significant contribution at 532 nm reflects the presence of coarse mineral dust within the same air mass. Figure 6c shows lidar ratios, reaching 57 sr at 532 nm, which are typical of absorbing smoke but also possible dust contributions (Groß et al., 2011). Figure 6d presents the AE, showing a clear gradient from high (smoke) in the lower layer to low (dust) in the upper layer (Baars et al., 2012; Salgueiro et al., 2021). Figure 6e illustrates the PLDR at 532 nm, which increases with height (PLDR ∼ 0.2) and indicates the dust influence in the upper layers. Finally, Fig. 5f presents the mass concentration profiles of fine, coarse, and total aerosols, highlighting the enhanced contribution from coarse-mode particles with increasing altitude. Within the identified aerosol layers, coarse-mode mass concentrations ranged from 20 ± 7 to 55 ± 20 µg m−3, with values increasing up to 4.5 km. In contrast, the fine-mode mass concentration exhibited a mean of 8 ± 3 µg m−3, with a peak of 36 ± 12 µg m−3 observed at around 1.8 km, corresponding to the lower aerosol layer. These vertical profiles confirm the presence of both fine and coarse particles, with the coarse mode clearly dominating at higher altitudes. The observed aerosol layers indicate a mixed event of biomass burning and Saharan dust over Athens.
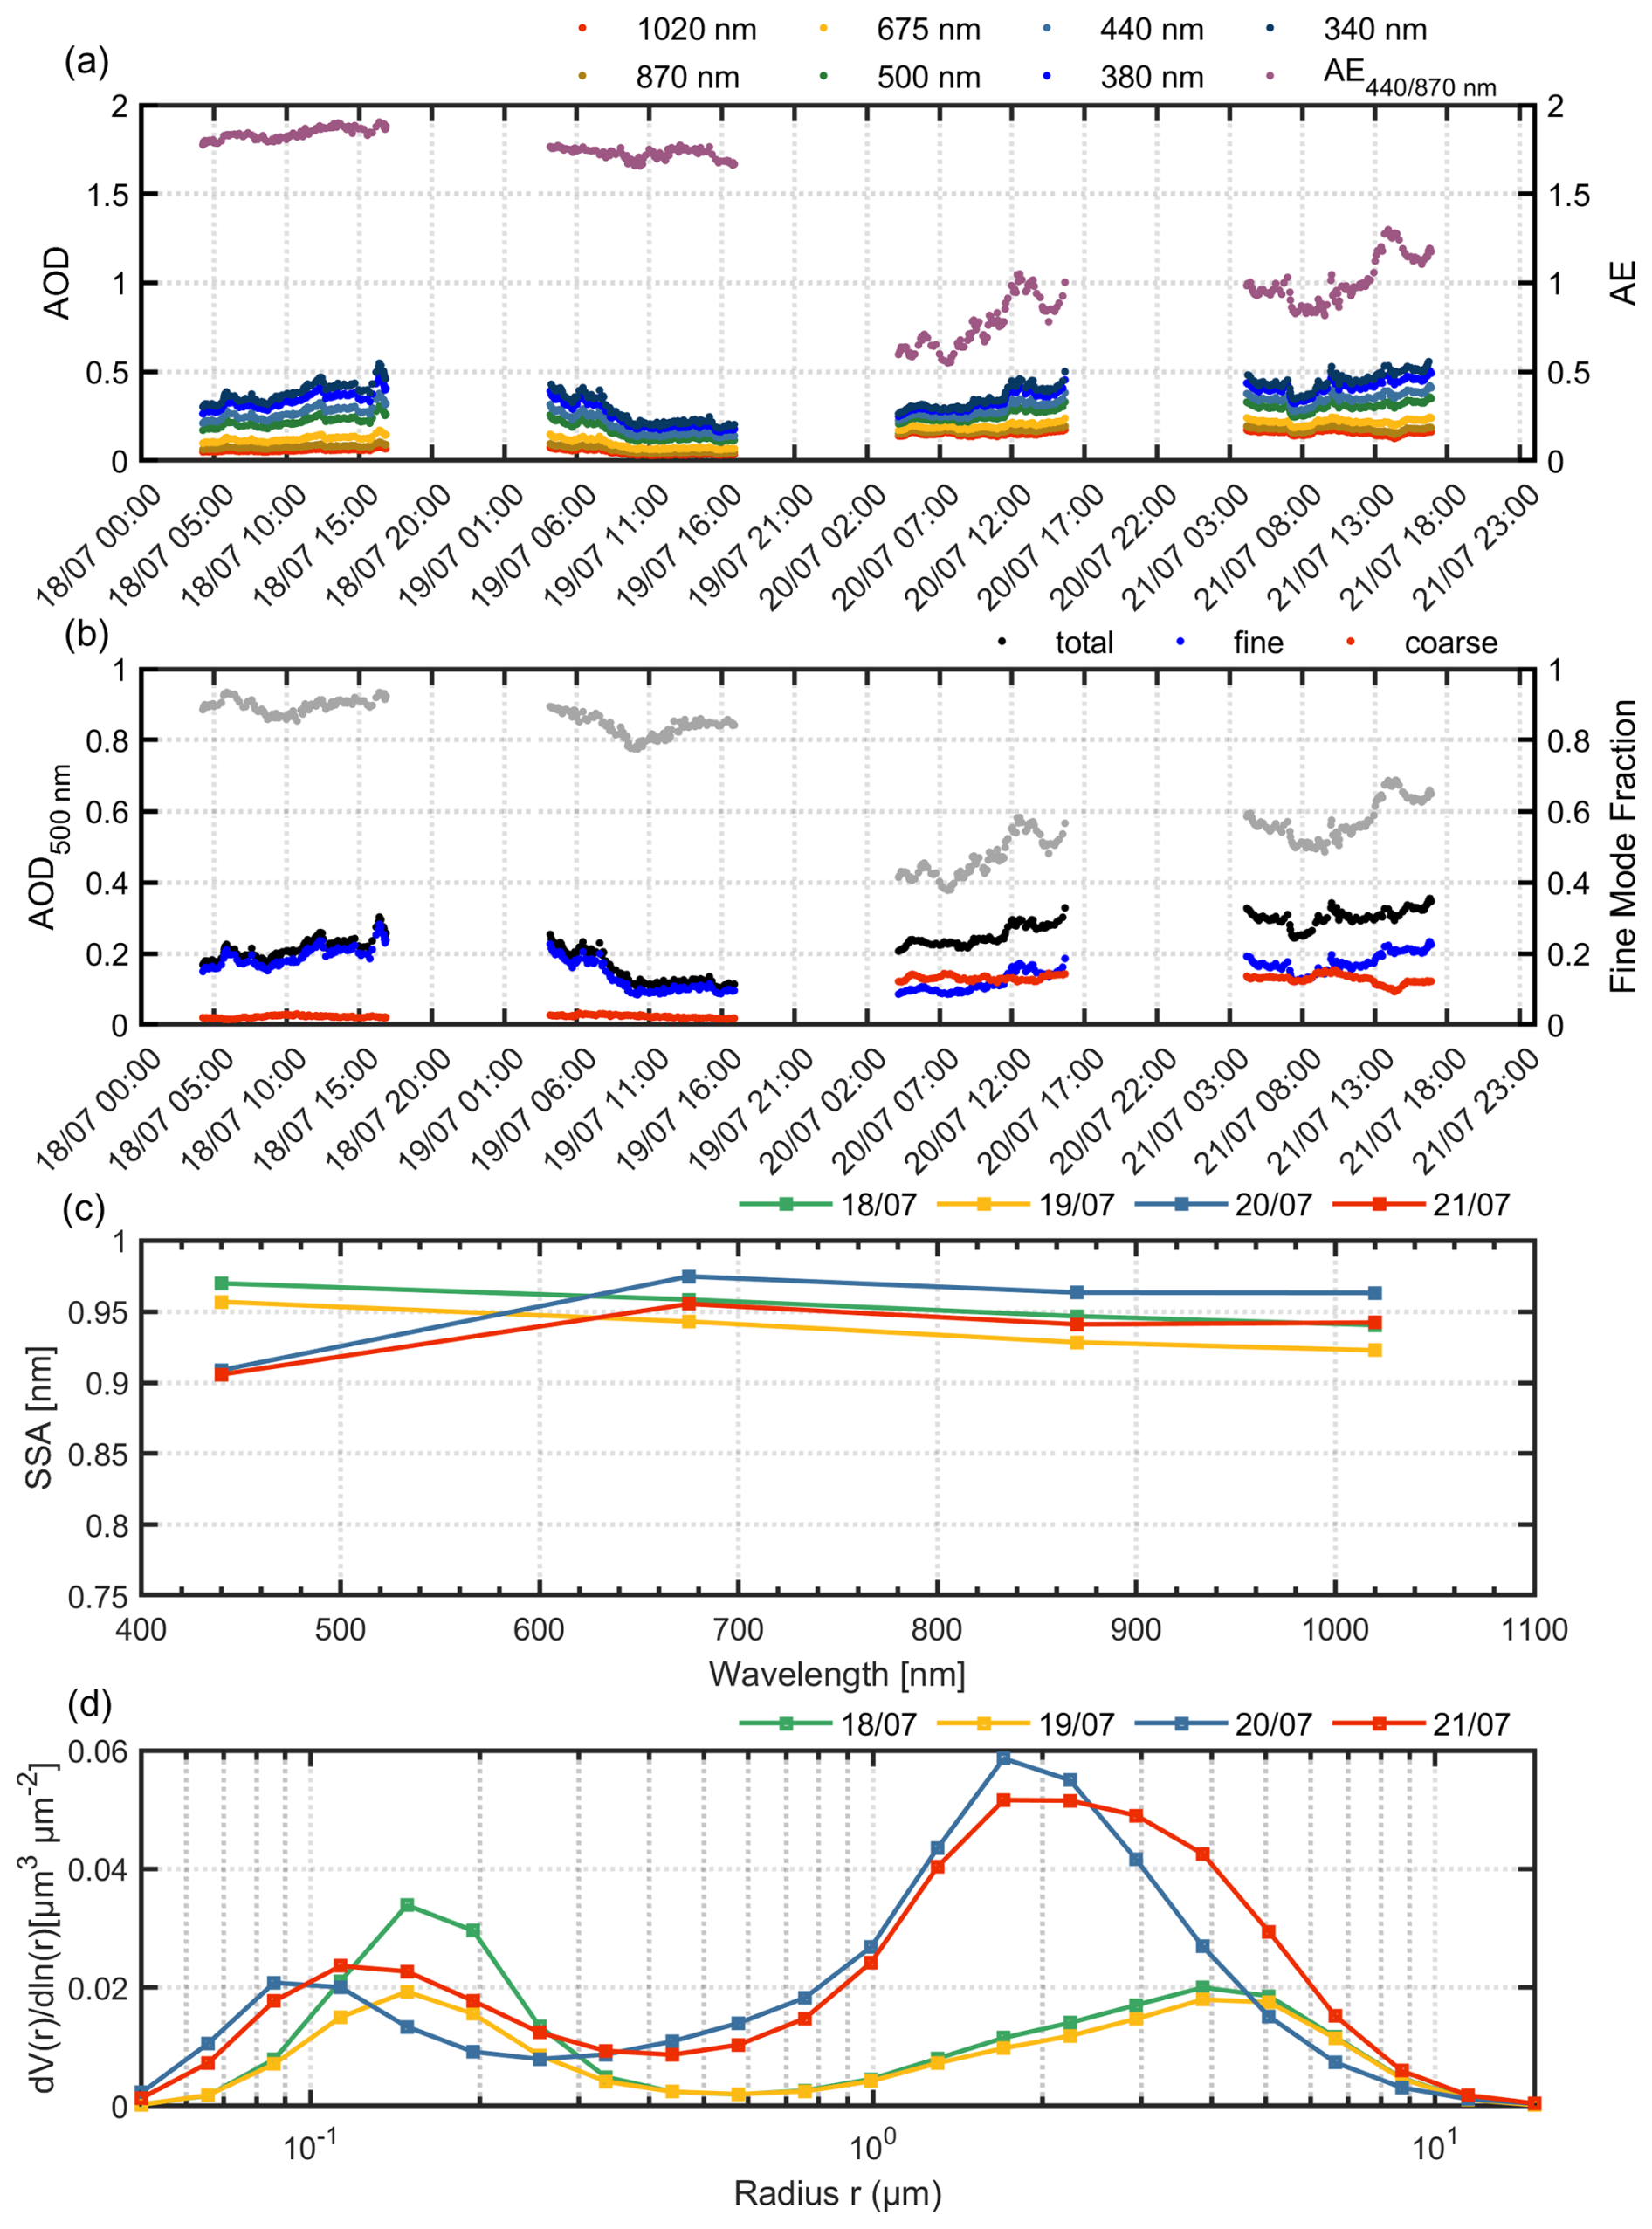
Figure 7Time−series of values of the (a) AOD for various wavelengths (340–1020 nm) and AE at 440/870 nm (b) AOD at 500 nm along with the FMF (c) SSA wavelength dependence and (d) Particle volume size distribution obtained by the NTUA CIMEL sun-sky-lunar photometer for the period 18–21 July 2023.
Figure 7 presents time-series of columnar aerosol optical and microphysical properties retrieved by the NTUA CIMEL sun-sky-lunar photometer for the period 18–21 July 2023, capturing the evolving impact of regional biomass burning and dust transport over Athens. Figure 7a shows the AOD at multiple wavelengths (340–1020 nm), along with the AE (440/870 nm). The elevated AOD values and relatively high AE (> 1.5) observed during 18–19 July indicate the dominance of fine-mode particles, consistent with smoke from local and regional fires. On 20–21 July, a decrease in AE values along with sustained high AOD ones suggests a mixture of aerosols, due to the additional presence of coarse-mode dust particles from North Africa.
Figure 7b focuses on the AOD at 500 nm and the FMF values remained above 0.8 on 18–19 July, confirming the fine-mode dominance typical of biomass-burning aerosols. A slight decline in FMF (< 0.6) on 20–21 July corresponds to the arrival of Saharan dust, introducing a coarse-mode component to the aerosol mixture.
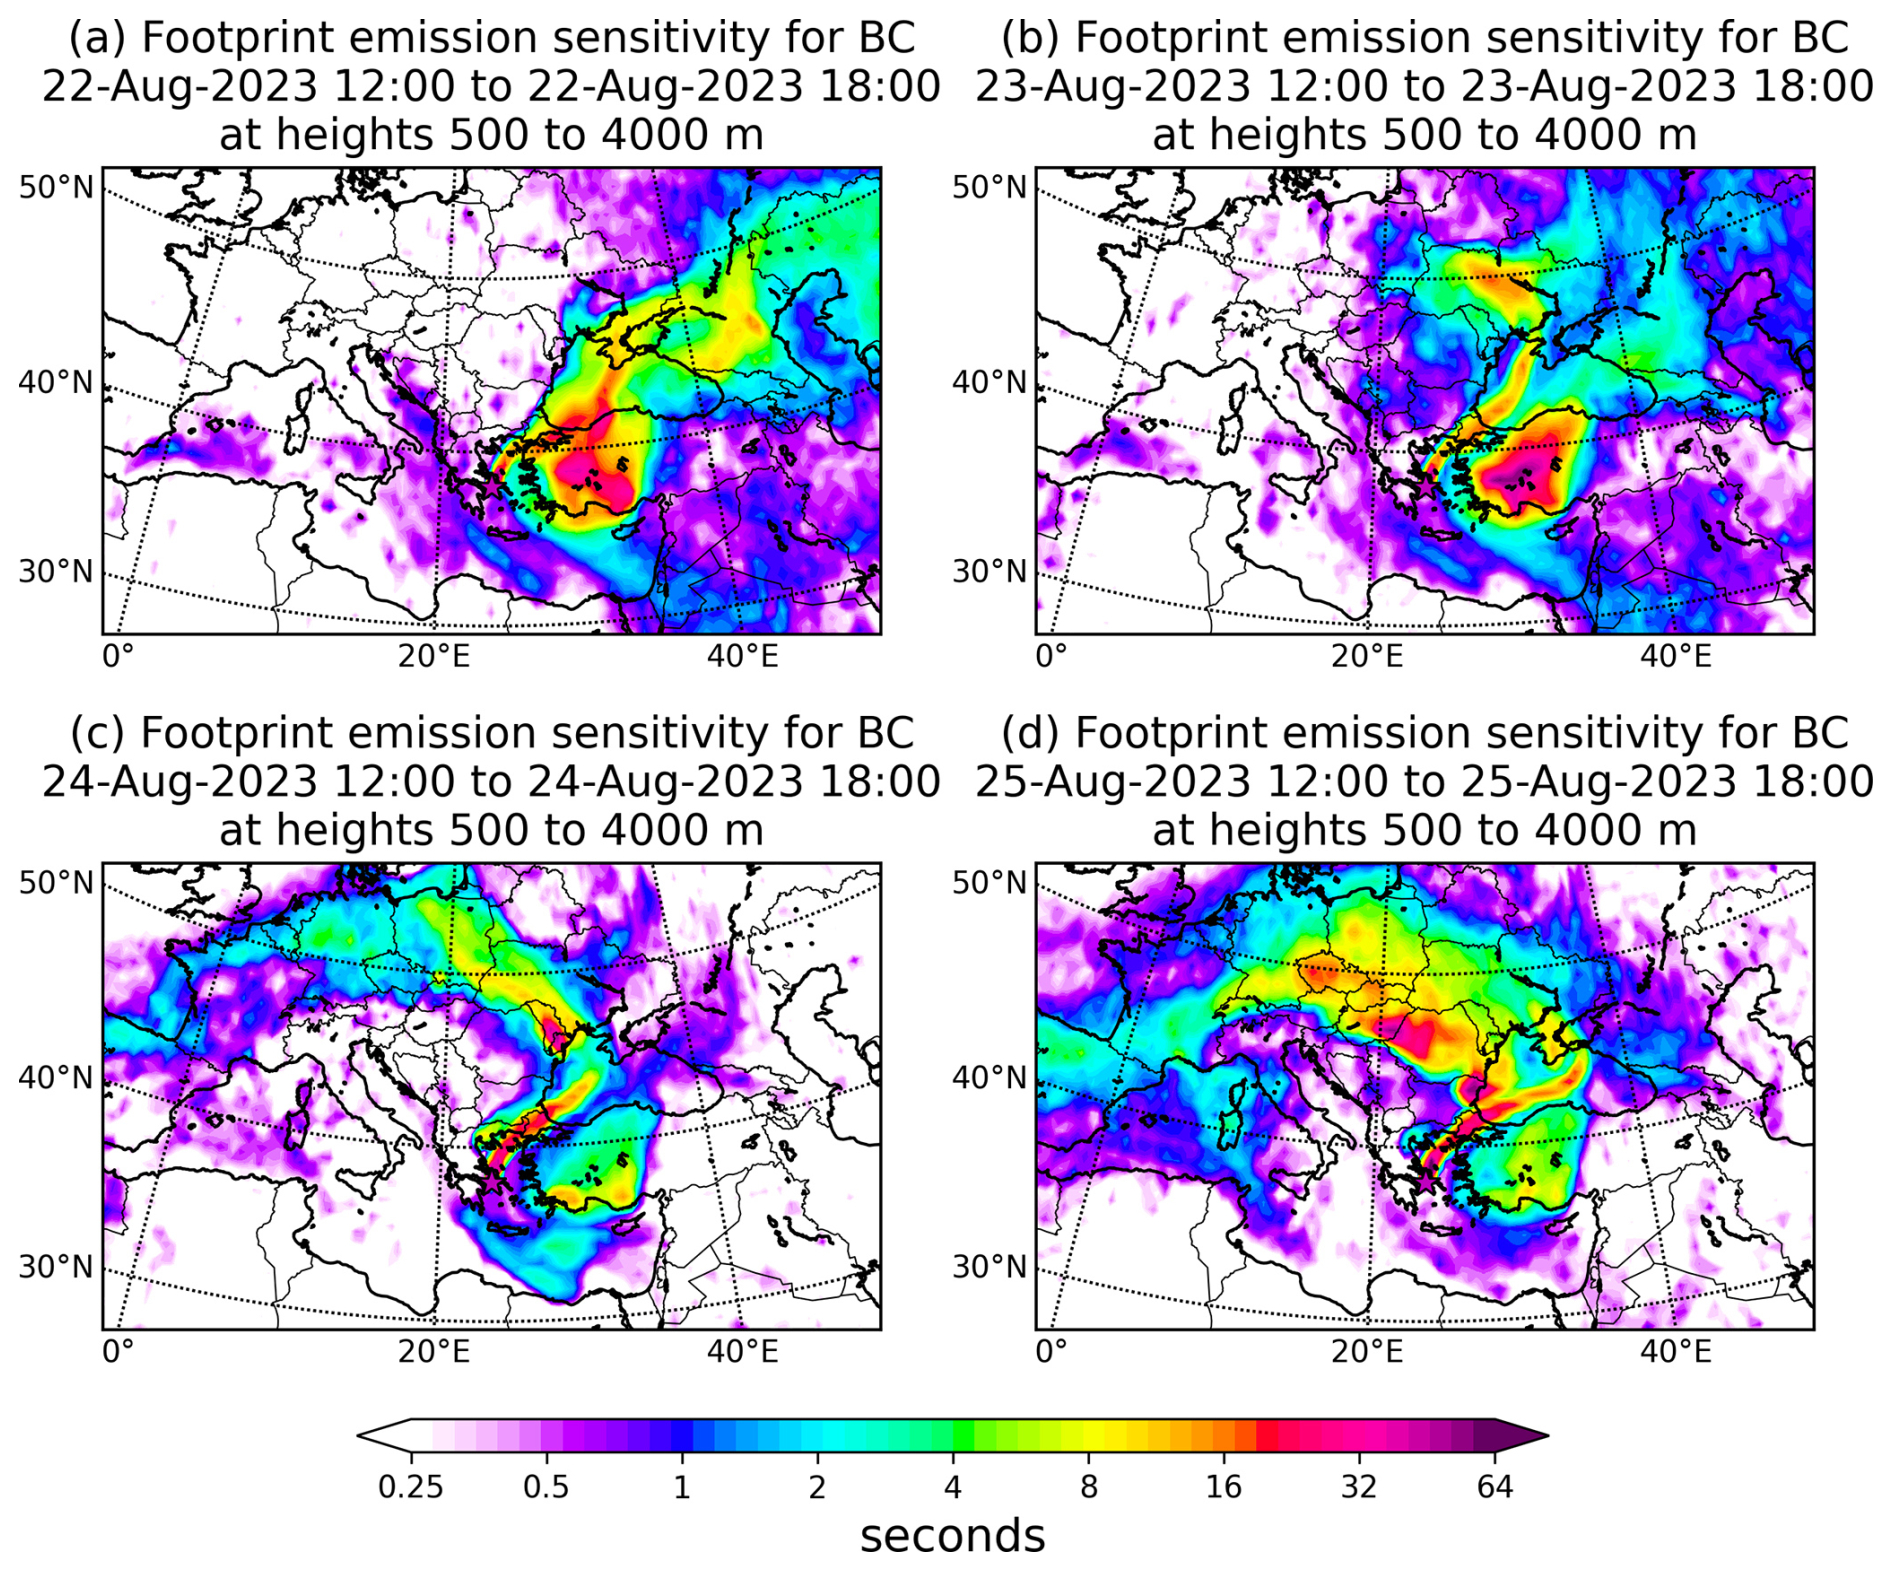
Figure 8Footprint emission sensitivities for BC obtained using FLEXPART for the air masses arriving over Athens between 0.5 and 4.0 km from 22 to 25 August 2023 (12:00 to 18:00 UTC).
Figure 7c presents the wavelength dependence of SSA for the period 18–21 July 2023. The SSA values, reported at 440, 675, 870, and 1020 nm, show consistently high values (> 0.90), indicative of scattering-dominated aerosols. On 18 July, SSA values ranged from 0.97 at 440 nm to 0.94 at 1020 nm, suggesting a presence of fine-mode, weakly absorbing particles. A slight decrease was observed on 19 July, indicating a modest increase in aerosol absorption. Notably, on 20 July the SSA values were quite low at 440 nm (0.91), but higher values were found (∼ 0.96) at longer wavelengths, possibly reflecting a mixture of absorbing fine-mode smoke and coarse-mode dust. By 21 July, the SSA spectrum remained relatively stable but slightly lower at shorter wavelengths, consistent with aged biomass burning aerosols that exhibit moderate absorption, particularly in the bluer region. Moreover, the volume size distribution (Fig. 7d), showing a prominent fine-mode peak during 18–19 July, which becomes broader on 20–21 July, reflecting the superposition of fine and coarse aerosol modes. This agrees well with the interpretation of a mixed aerosol event resulting from the interaction of smoke and Saharan dust over the Athens basin.
3.4 Transport of fresh smoke particles (the case of 22–25 August 2023)
Footprint emission sensitivities for BC from 22 to 25 August 2023 (12:00–18:00 UTC) (Fig. 7) confirm that the air masses arriving over Athens between 0.5 and 4.0 km altitude passed over regions with intense wildfire activity, particularly over northern Greece, and specifically the Rodopi and Evros regions (Fig. 2c). This spatial overlap underscores a strong biomass burning (BB) influence on the aerosol composition observed over Athens during this episode.
More specifically, the footprint emission sensitivities from 22 to 25 August (Fig. 8a–d) show increased residence time over the Evros and Rodopi wildfire zones (Fig. 2b), suggesting direct transport of smoke plumes from forest fires. Additional sensitivity over parts of the Balkans and Turkey correspond to potential regional pollution contributions. In contrast, the lack of significant sensitivity over North Africa indicates a minimal dust influence during this period.

Figure 9Spatio-temporal evolution of the (a) range-corrected lidar signal (RCS) at 1064 nm and (b) volume depolarization ratio at 532 nm for the period 22–25 August 2023.
Figure 9 presents the spatio-temporal evolution of the range-corrected lidar signal (RCS) at 1064 nm over Athens from 22 to 25 August 2023, revealing persistent layers of transported biomass burning aerosols within the free troposphere and a dynamically evolving PBL.
On 22 August, the PBL extended up to ∼ 1.0 km in the morning, with a distinct aerosol layer observed aloft between 3.0–4.0 km. Around 14:00–14:30 UTC, cloud formation occurred at ∼ 4.0 km, likely associated with the interaction of lofted BB aerosols and residual moisture. Between 14:30 and 16:00 UTC, this upper layer gradually descended to ∼ 2.0 km, and persisted at that height until 19:00 UTC, positioned above a slightly deepened PBL (∼ 1.3 km). A diffuse aerosol layer persisted above, extending up to 4.0 km height.
On 23 August, a shallow PBL (≤ 1.0 km) was maintained throughout the day. Overlying this, persistent lofted aerosol layers were identified between 2.0–3.0 and 3.0–4.0 km, intensifying progressively through the evening. Cloud formation was observed at ∼ 5.0 km, attributed to BB plume-driven condensation activity.
During 24 August, multiple stratified aerosol layers were present above the PBL (∼ 1.0 km), notably at 2.0–3.0, 3.2–3.5, and 4.0–4.8 km as early as 11:45 UTC. These layers became progressively more optically dense during the day. Between 15:30 and 19:20 UTC, mid-tropospheric cloud formation occurred at ∼ 1.8 and ∼ 2.8 km, likely due to interactions between hygroscopic smoke particles and elevated humidity (Fig. S5 in the Supplement). The elevated aerosol layering persisted through the night (after 20:00 UTC), with continued cloud presence.
On 25 August, the lidar signal revealed a relatively stable vertical aerosol structure, with a well-defined layer up to ∼ 2.0 km and a distinct elevated layer near ∼ 4.0 km. The upper layer intensified in the late afternoon (around 17:00 UTC), resulting in cloud formation by 20:00 UTC, consistent with sustained BB aerosol presence and favorable thermodynamic conditions.
These observations confirm the persistent influence of BB aerosols over Athens during this period, affecting both aerosol vertical structure and cloud formation processes.

Figure 10Vertical profiles of aerosol (a) backscatter coefficient (355, 532 and 1064 nm) (b) extinction coefficient and AOD (355 and 532 nm) (c) lidar ratio (355 and 532 nm) (d) Ångström exponent (e) PLDR (532 nm) and (f) aerosol mass concentration (coarse, fine mode and total particles) obtained by the EOLE and DEPOLE lidar systems on 24 August 2023 (17:50–18:40 UTC).
Figure 10 illustrates the vertical profiles of the aerosol optical properties retrieved on 24 August 2023, during an episode dominated by biomass burning smoke particles transported from the Evros and Rodopi regions in northeastern Greece, as confirmed by FLEXPART simulations (Fig. 8). The backscatter coefficients (Fig. 10a) reveal three distinct aerosol layers between 1.5–1.8, 3.0–3.72 and 3.96–4.62 km. The upper layers exhibited enhanced backscatter coefficients at all 3 wavelengths (e.g. b355 ≈ 3.25 ), suggesting a more concentrated aerosol load, while both layers showed backscatter AE ( ≈ 1.4) indicative of fine-mode particles.
Figure 10b presents the aerosol extinction coefficients at 355 and 532 nm, peaking up to 130 M m−1 in the lower layer and 120 M m−1 in the upper one. These high extinction values point to substantial aerosol optical depth, consistent with a dense smoke plume. Furthermore, the layer-resolved AOD at 355 nm, ranged from 0.32 in the lower, more concentrated smoke layer to 0.06 in the upper one, while at 532 nm it ranged from 0.12 to 0.0035. The much larger AOD at the shorter wavelength reflects the dominance of fine-mode smoke particles, which exhibit a strong wavelength dependence with rapidly decreasing optical depth across longer wavelengths. The extremely low AOD values at 532 nm aloft also indicate that the upper layers contained more diluted smoke, with only a minor contribution to the total column Moreover, the lidar ratios of 51 sr (355 nm) and 85 sr (532 nm) in the lower layer, and slightly reduced values (50 and 65 sr) in the upper layer (Fig. 10c) are both indicative of the presence of biomass burning aerosol (Alados-Arboledas et al., 2011; Müller et al., 2007).
The aerosol Ångström exponents, ≈ 1.4 and ranged from 0.2 to −0.05, the latter suggesting the presence of slightly larger particles (Nicolae et al., 2013) in the upper layer. The low values of the PLDR (≤ 0.057) (Fig. 10e), further supported the absence of mineral dust and the predominance of spherical smoke particles (Gidarakou et al., 2024; Haarig et al., 2019). Finally, Fig. 10f presents the vertical profiles of aerosol mass concentration, clearly showing fine-mode dominance across both elevated layers, consistent with the presence of biomass burning aerosols, as also supported by FLEXPART simulations. Fine-mode mass concentrations ranged from 23 ± 7 to 30 ± 10 µg m−3 within the layers, with increasing values observed up to 4.5 km. These elevated concentrations are attributed to biomass-burning emissions from intense wildfires in Evros and Rodopi, with the smoke plume clearly visible in the MODIS/Aqua satellite image acquired on the afternoon of 22 August 2023 (Fig. 2c). A slight contribution from coarse-mode particles was also detected, but the overall signal remained dominated by the fine fraction, typical of aged, lofted smoke layers.
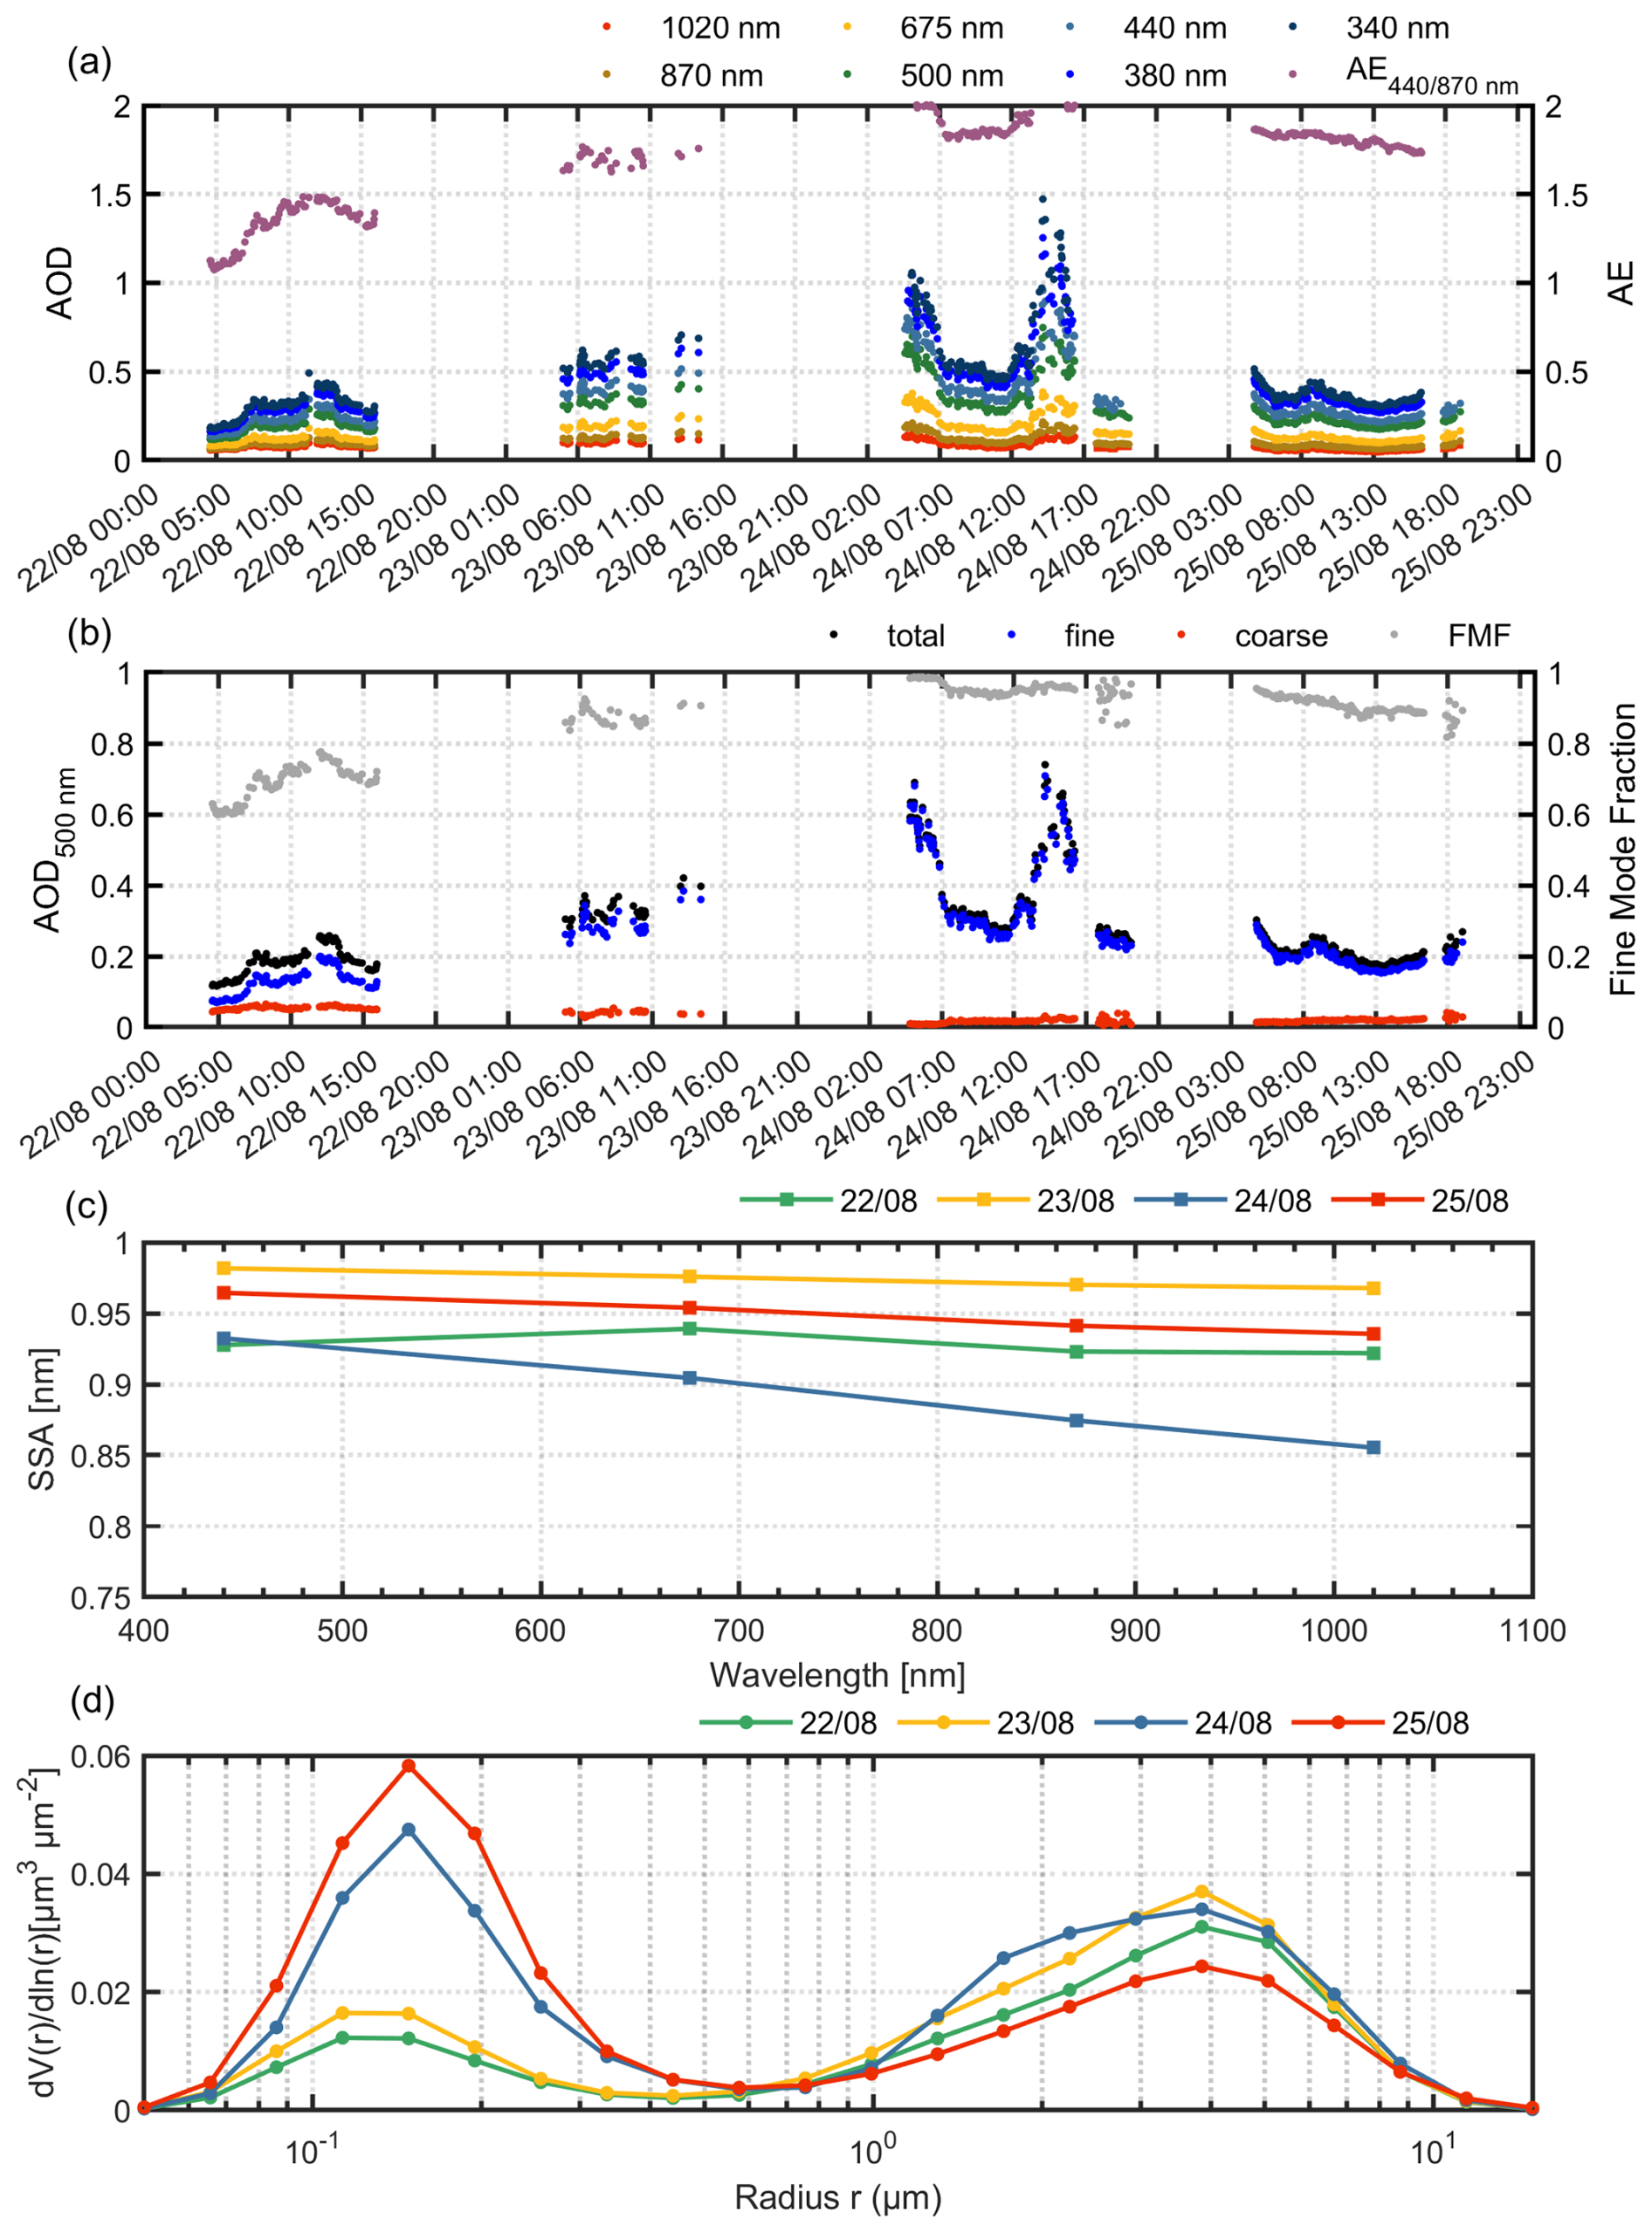
Figure 11Time-series of values of the (a) AOD for various wavelengths (340–1020 nm) and AE at 440/870 nm (b) AOD at 500 nm along with the FMF (c) SSA wavelength dependence and (d) particle volume size distribution obtained by the NTUA CIMEL sun-sky-lunar photometer for the period 22–25 August 2023.
Figure 11 presents the time series of the columnar aerosol optical and microphysical properties retrieved from the NTUA CIMEL sun-sky-lunar photometer during the 22–25 August 2023 period, which coincided with intense wildfire activity in northern Greece. The AOD (Fig. 11a) remained elevated throughout the period, particularly at shorter wavelengths, specifically it increased from ∼ 0.3 to 0.5 the first two days, while it increased a lot on 24 August reaching values up to 1.5 indicating the arrival of intense smoke plumes. The AE values were consistently high from 1.5–2.0 with peak again on 24 August confirming the dominance of fine-mode aerosols, biomass-burning smoke. Moreover, the AOD at 500 nm had the same trend and remained peaked on 24 August reaching ∼ 0.7, with the FMF (Fig. 11b) exceeding 0.6 on 22 August reaching even 1.0 on the last day, further supporting the strong influence of fine particles. Figure 11c shows the SSA as a function of wavelength from AERONET observations between 22 and 25 August 2023, highlighting variations in aerosol absorption and scattering properties across four wavelengths: 440, 675, 870, and 1020 nm. On 22 August, the SSA values were moderate (≈ 0.92–0.94), suggesting internally mixed aerosols with moderate absorption, likely linked to transported smoke. A peak in SSA values was observed on 23 August, reaching 0.98 at 440 nm, indicating highly scattering aerosols, consistent with a cleaner or more aged smoke plume. In contrast, 24 August showed a marked decrease in SSA values with wavelength from 0.93 at 440 nm to just 0.85 at 1020 nm was found on 24 August, revealing the presence of more absorbing, coarse-mode particles, likely due to a denser biomass burning plume (Fig. 11c). By 25 August, the SSA values increased again (up to 0.96 at 440 nm), suggesting a shift back toward less absorbing, finer-mode aerosols. This spectral dependence suggests the presence of internally mixed carbonaceous particles, with stronger absorption in the visible and near-infrared range (Russell et al., 2010).
Finally, the particle volume size distribution shown in Fig. 11d is characterized by a dominant fine-mode peak, accompanied by a noticeable coarse-mode contribution, consistent with the presence of smoke plumes from regional wildfires influencing the air masses over Athens during this period.
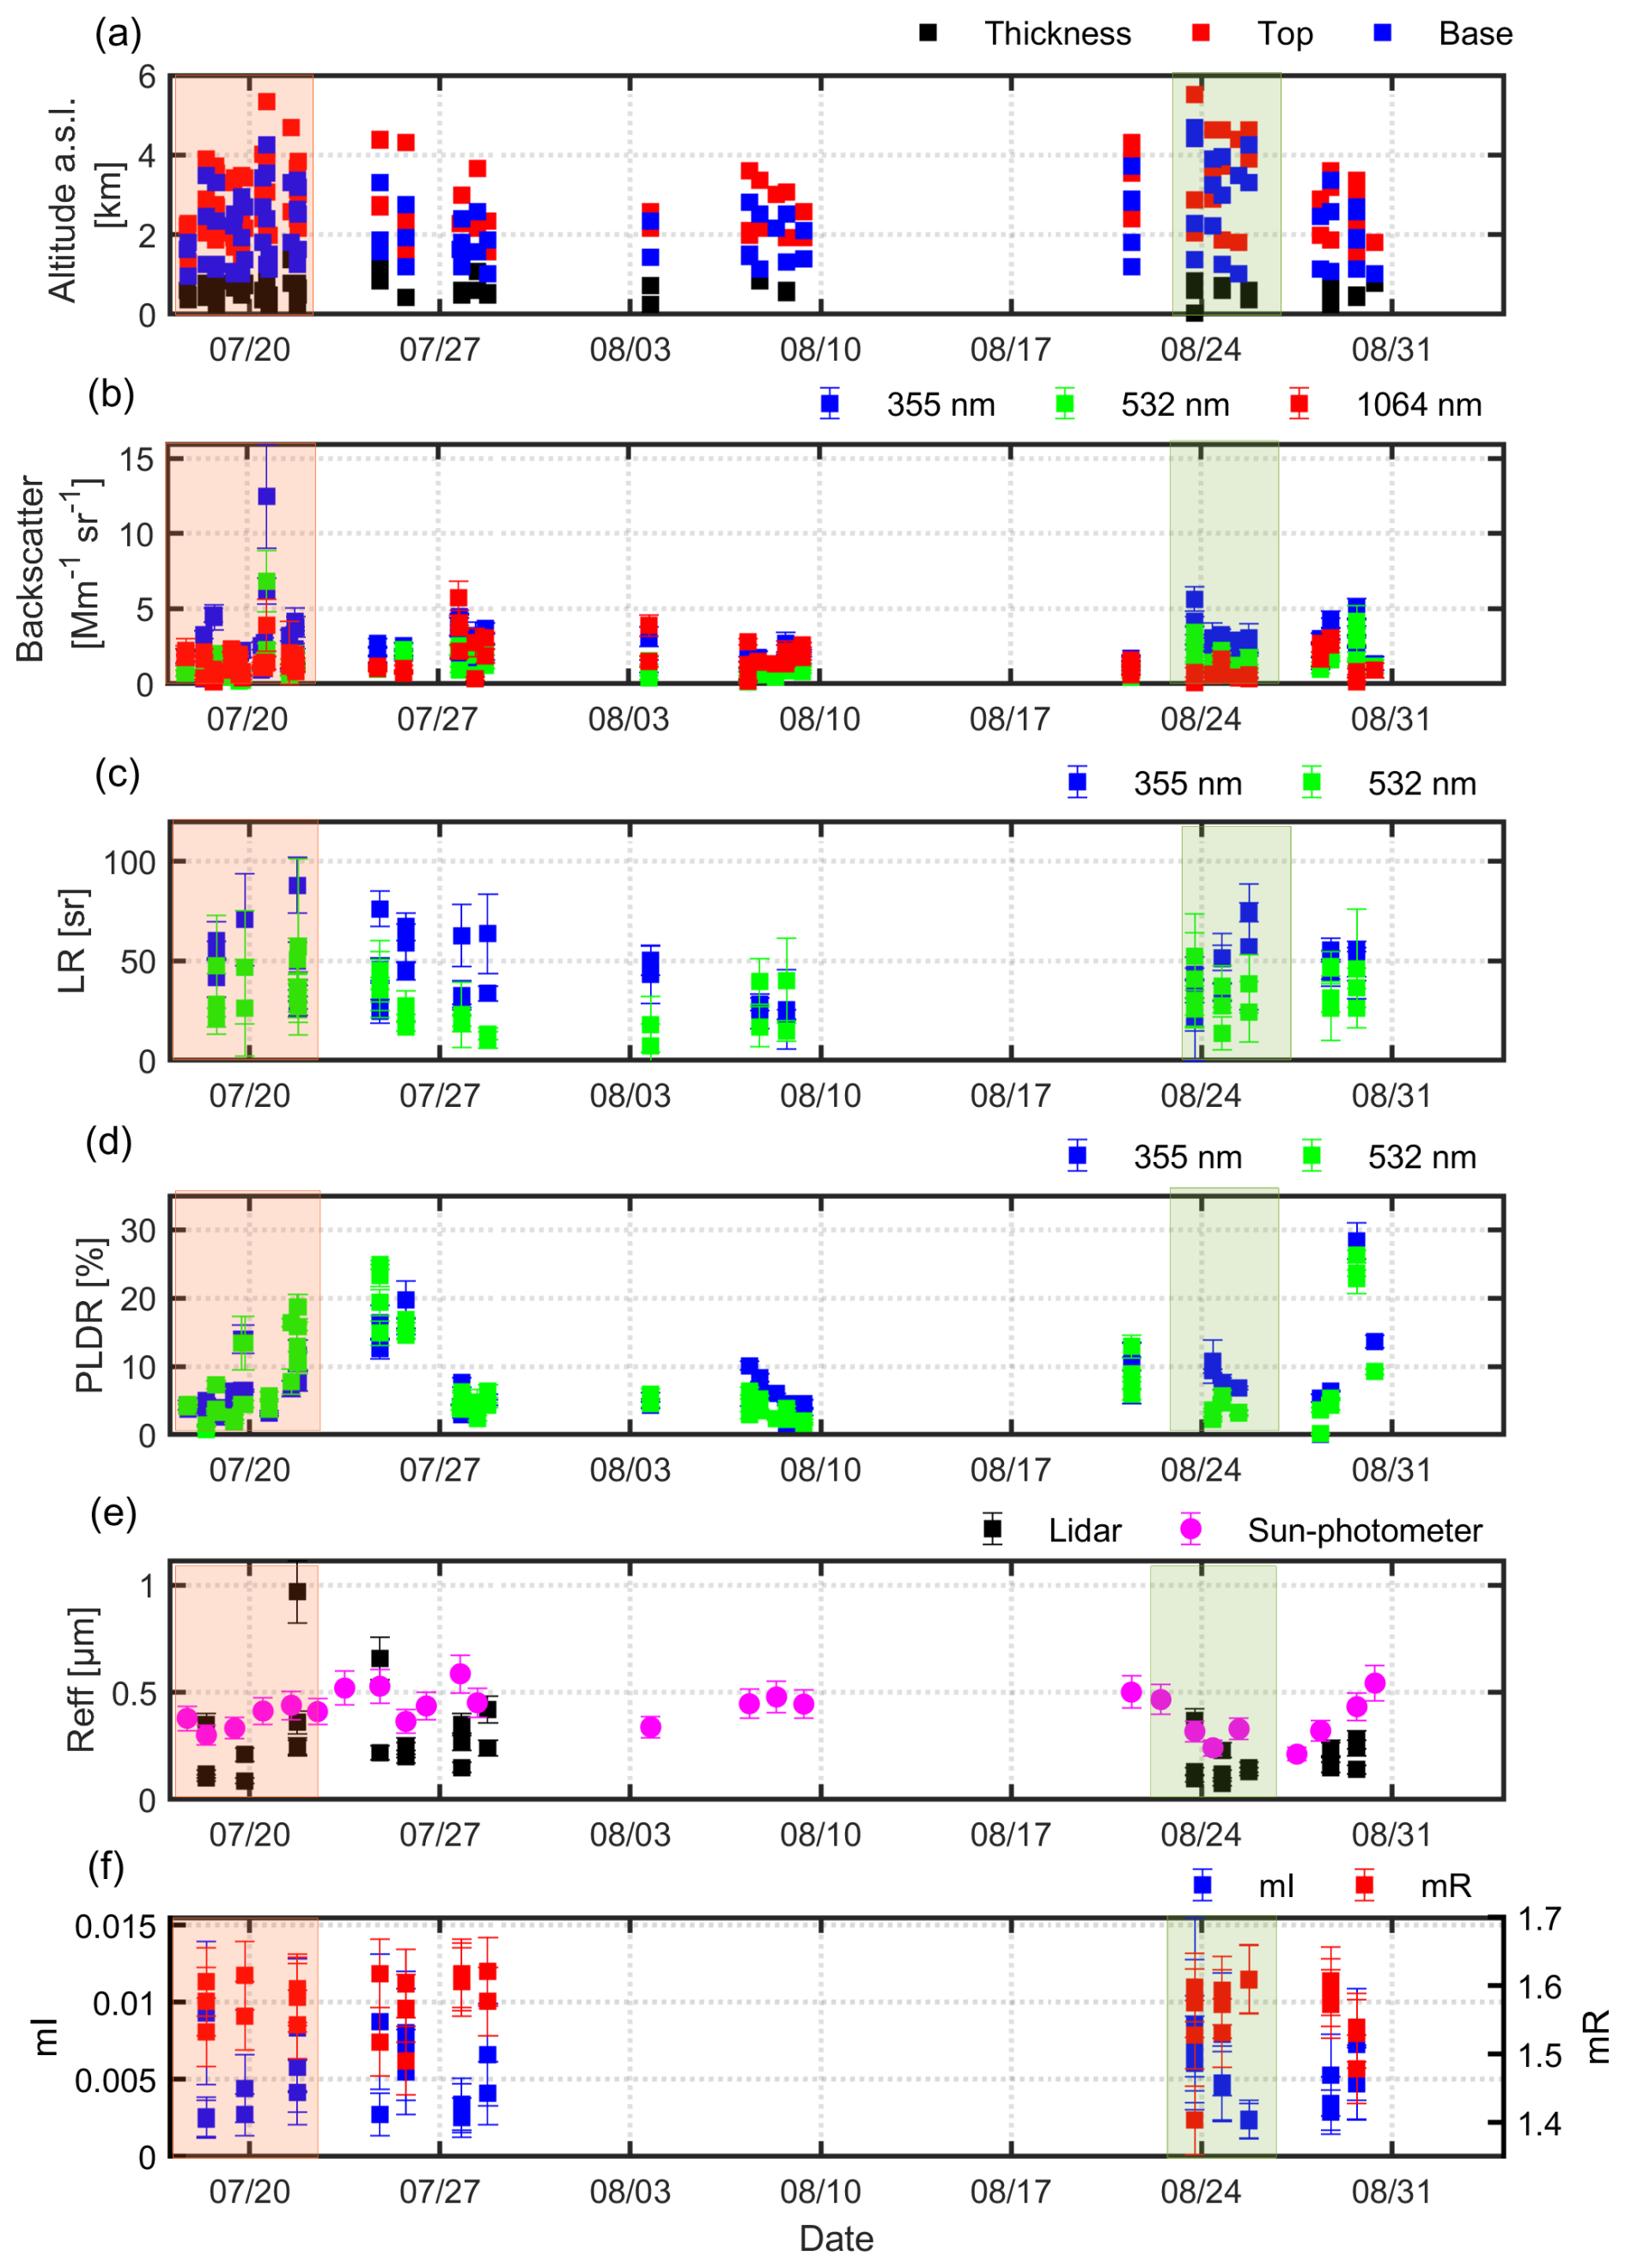
Figure 12Aerosol geometrical, optical, and microphysical properties retrieved over Athens during the period from 17 July to 30 August 2023: (a) base, top, and thickness off the aerosol layers, (b) backscatter coefficients (355, 532, and 1064 nm), (c) LR (355 and 532 nm), (d) PLDR (355 and 532 nm), (e) Reff, and (f) imaginary (mI) and real (mR) parts of the complex refractive index.
3.5 Aerosol optical and microphysical properties
Figure 12 presents the geometrical (Thickness and Base and Top of the aerosol layers) and optical (backscatter coefficient, LR, PLDR and microphysical properties (effective radius and refractive index – real and imaginary) for the period from 17 July to 30 August, according to aerosols layers observed. During the biomass burning and dust period (17 to 21 July), aerosol layers were observed from heights of 0.96 to 5.34 km, while the mean thickness of the aerosol layers was equal to 0.60 km. High values of aerosol backscatter coefficient that were recorded during this period, exceeding 12 ± 4 at 355 nm (20 July), as well as enhanced ones at 532 nm, even reaching 6.8 ± 2 , are indicative of dense aerosol loads. The LR at 355 nm varied from 30 ± 6 to 86 ± 14 sr (21 July), presenting an average value equal to 48 ± 4 sr. The LR at 532 nm presented an increased range from 27 (18 July) to 58 sr (21 July) and an average value of 37 ± 8 sr. These LR values indicate the significant presence of Saharan dust aerosols, along with fresh biomass burning particles (Mylonaki et al., 2021; Papagiannopoulos et al., 2018). Furthermore, PLDR values at both 355 and 532 nm ranged approximately from 0.03 to 0.19, with a mean value of 0.06 ± 0.01 at 355 nm and 0.08 ± 0.01 at 532 nm. These PLDR values at 355 and 532 nm highlight the presence of non-spherical particles (0.03–0.08), with slightly enhanced values indicating smoke-dust mixtures (PLDR ∼ 0.1–0.2). Specifically, the PLDR was stronger in lower layers and reduced in upper layers, supporting mixed-type aerosols (Giannakaki et al., 2016; Nemuc et al., 2013). variability and differing sensitivity to aerosol layers.
The peak of Reff values on 21 July reflects the presence of a dense dust plume mixed with smoke particles (Weinzierl et al., 2011). Real refractive index – mR ranged from 1.53 ± 0.05 to 1.61 ± 0.05, while imaginary parts – mI reached up to 0.0093 ± 0.005, especially on 18 July, indicating the presence of moderately absorbing, smoke particles (Nicolae et al., 2013). A quantitative classification of the aerosol types based on established lidar ratio and depolarization thresholds (Fig. S8 in the Supplement) further supports this interpretation, distinguishing dust-dominated, smoke-dominated, and mixed aerosol layers during this period.
During the period from 22 to 25 August, aerosol layers were observed between ∼ 1.0 and 5.5 km, with an average thickness of 0.56 km. Mean aerosol backscatter coefficients reached 3.03 ± 0.44 at 355 nm and 1.65 ± 0.24 at 532 nm, with peak values of 5.64 and 3.42 , respectively, indicating the presence of a moderately dense aerosol load. The LR values at 355 nm ranged from ∼ 25 to 75 sr, with an average of 44 ± 11 sr, while LR at 532 nm varied from ∼ 15 to 52 sr, averaging 32 ± 13 sr. These values suggest a mixture of aerosol types, likely dominated by fresh biomass burning particles.

Figure 13UVB irradiance attenuation at 320 nm for the period 14 July–30 August at SZAs of (a) 60°, (b) 50°, (c) 40°, and (d) 30°, as measured by the Brewer spectroradiometer (blue) and compared with clear-sky simulations from the libRadtran model (red). The percentage difference between observations and model is also shown (black dashed line), as well as the diurnal UVB irradiance at 320 nm for three representative cases: (e) 21 July (smoke + dust), (f) 23 July (dust), and (g) 24 August (smoke), compared to clear-sky values.
The LR532 LR355 ratio had a mean of ∼ 0.72, further supporting this classification (Nicolae et al., 2013). PLDR values at 355 and 532 nm ranged from ∼ 0.04 to 0.10, with average values of 0.08 and 0.04, respectively, indicating the presence of mostly mixed non-spherical particles with smoke ones. In terms of microphysical properties, the retrieved Reff values ranged from ∼ 0.07 to 0.37 µm, with an average of 0.16 ± 0.02 µm. The sun photometer-derived Reff values ranged from 0.24 to 0.47 µm, averaging 0.34 µm. To quantify the consistency between lidar and sun photometer retrievals, we calculated correlation and bias statistics (Fig. S6 in the Supplement). The Pearson correlation coefficient is 0.39 (p = 0.033) and the Spearman correlation is 0.54 (p = 0.002). The root-mean-square error (RMSE) is 0.213 µm, with a mean bias (Lidar – Sun) of −0.132 µm. These results indicate that the two retrievals capture consistent temporal variability, although lidar slightly underestimates the column-integrated Reff. The RMSE and mean bias suggest that column-integrated radiative calculations using either product would differ by ∼ 0.2 µm, which is within the expected uncertainty of aerosol microphysical retrievals. The real part of the refractive index (mR) varied from 1.43 to 1.61 (mean: 1.56), and the imaginary part (mI) reached up to 0.0103, indicating strongly absorbing aerosols (Weinzierl et al., 2011). These absorption features are supported by independent observations: AERONET SSA at 440 nm decreased to ∼ 0.85 during peak wildfire events, eBC concentrations measured at the surface peaked concurrently with elevated smoke layers, and ACSM measurements indicate a high fraction of organics. Together, these constraints confirm that the strong absorption is real and not driven solely by the lidar retrievals.

Figure 14SSA at 320 nm for three representative cases: (a) 21 July (smoke + dust), (b) 23 July (dust), and (c) 24 August (smoke). The dotted blue lines represent the SSA values for irradiances that are within ± 5 % around the measured values.
3.6 Impact of aerosols on ground solar UVB irradiance
Figure 13a–d show the measured UVB irradiance at 320 nm (blue line) from the Brewer spectrophotometer at specific SZAs of 60, 50, 40, and 30°, respectively, compared with UVB estimates from the clear-sky radiative transfer model (LibRadtran; red line). The percentage difference between measurements and model values is also shown (black dashed line). Figure 13e–g present the diurnal evolution of UVB irradiance at 320 nm for three characteristic cases: Fig. 13e smoke + dust (21 July), Fig. 13f dust only (23 July), and Fig. 13g smoke only (24 August). Measured UVB (blue) is plotted alongside clear-sky model simulations (red) to highlight the attenuation impacts of different aerosol types on surface UVB levels.
All analyzed periods correspond to cloud-free conditions, as confirmed by visual inspection of the lidar spatio–temporal profiles and Brewer data. Measurements affected by cloud or thin cloud presence were excluded to ensure reliable comparison with the clear-sky radiative transfer simulations. However, we note that a small influence from optically thin or subvisible cirrus clouds cannot be entirely ruled out in certain cases, since our lidar system operates in a fixed vertical configuration and may not detect very weak or high-level cirrus layers.
Overall, the largest discrepancies are observed during the second case study (22–25 August), when biomass burning aerosols were dominant. On 24 August, the percentage difference at SZA = 60° reached up to 40 % (Fig. 13a), while at SZA = 30°, a peak difference of 42 % was recorded on 23 August (Fig. 13d), highlighting the strong attenuation effect of smoke. In contrast, during the first case study (18–21 July), which was influenced by a mixture of dust and smoke, UVB attenuation was less pronounced. On 21 July, for example, the difference at SZA = 60° reached ∼ 23 %, and up to 11 % at SZA = 40° (Fig. 13c). A similar pattern is observed for dust aerosol conditions on 23 July. However, when smoke is the dominant aerosol type, as in late August, the UVB attenuation becomes significantly stronger, especially at lower SZAs.
These patterns are also supported by the diurnal plots in Fig. 13e–g, which present UVB irradiance measurements at 320 nm for three selected days, each representing a different aerosol event discussed in Sect. 3: 21 July (smoke + dust), 23 July (dust-dominated), and 24 August (smoke-dominated). On 21 July, elevated AOD resulted from the combined presence of smoke and dust, while 23 July was characterized by high AOD due to the presence of dust. The most extreme UVB attenuation occurred on 24 August, coinciding with the highest AOD values of the period, driven by smoke. In contrast, the least attenuation was observed on 23 July, corresponding to the lowest AOD among the three days. These differences align with aerosol optical characteristics shown in Fig. 3: 21 July featured high Ångström exponent (AE > 1) and fine-mode fraction (FMF ≈ 0.6), indicating mixed aerosols, 23 July had low AE (∼ 0.5) and FMF (∼ 0.3), consistent with coarse-mode dust dominance, while 24 August exhibited strong fine-mode influence, with AE around 2.0 and AOD at 340 nm exceeding 1.0.
The SSA in the UV can differ significantly from the SSA at visible wavelengths. By comparing the measured spectra with modelled spectra, we estimated the SSA at 320 nm, as well as the SSA for irradiances that are within the uncertainty range of the Brewer spectral measurements (i.e., 5 %) (Bais et al., 2001). At Fig. 13, we show the SSA values for the same days as in Fig. 13e–g. For the smoke event (24 August) the SSA at 320 nm is similar to the SSA at 440 nm (Fig. 11). Very low SSA values (0.75–0.8), well below the SSA values in the visible spectral region (Fig. 7) were found for the dust dominated mixture (23 July), which is in agreement with the results of past studies (Fountoulakis et al., 2019; Raptis et al., 2018). The boundaries shown in Fig. 14 do not represent the full range of uncertainties in the retrieval of the SSA. Additional uncertainty in the order of 0.1 must be considered due to uncertainties in the inputs that were used for the libRadtran simulations (AOD, surface albedo, aerosol profile, etc) (e.g., Fountoulakis et al., 2019). Thus, the results presented here should be treated with caution. Nevertheless, they provide a strong indication for the validity of the findings of previous studies showing that dust particles can be more absorbing in the UV-B compared to smoke particles.
Summer 2023 was marked one of the most severe wildfire seasons in recent Greek history, with large-scale fires affecting regions, such as Evros, Rodopi, Attica, the Peloponnese, and several islands. This study examined the optical and microphysical properties of smoke aerosols (sometimes mixed with dust particles) long-ranged transported over Athens from two major wildfires in Greece (18–21 July and 22–25 August 2023) and investigated the aerosol impact on UVB solar radiation at ground level using a combination of satellite observations (MODIS), FLEXPART transport modelling, ground-based lidar and sun-sky-lunar photometer measurements, and in situ aerosol and radiation data.
Throughout the observation period (17 July–31 August), Athens experienced significant aerosol loading, largely attributed to biomass burning events. The most intense air pollution episode occurred in late August and was associated with wildfires in northeastern Greece. Elevated AOD values, consistently high Ångström exponent (AE > 1), and fine-mode fraction (FMF > 0.9 on 24 August) indicated the dominant presence of fine, absorbing particles, typical of fresh smoke. AOD values retrieved from Brewer and CIMEL instruments (in the 320–1020 nm spectral region) showed close agreement (∼ 0.05 difference), supporting the reliability of the optical data. Ground level chemical composition analyses revealed peak organic aerosol concentrations (22.77 µg m−3 on 22 August), with black carbon fraction from biomass burning exceeding 80 %. PM10 and PM2.5 concentrations were also enhanced, reaching hourly maxima of 94 and 49 µg m−3, respectively, with PM2.5 PM10 ratios up to 0.7, further confirming the presence of fine aerosols from biomass burning processes.
During the July episode (17–21 July), our lidar observations showed elevated aerosol layers between 0.96 and 5.34 km, with an average thickness of 0.60 km. High values of aerosol backscatter coefficients were recorded, along with LR values of 48 ± 4 sr (355 nm) and 37 ± 8 sr (532 nm), consistent with smoke-dust mixtures. PLDR values of 0.06 (355 nm) and 0.08 (532 nm) further supported our findings. Aerosol microphysical retrievals indicated effective radii up to 0.97 µm, real refractive indices between 1.53–1.61, and imaginary parts up to 0.0093, suggesting moderately absorbing particles. In contrast, during 22–25 August, the aerosol layers extended up to 5.5 km with slightly thinner mean thickness (0.56 km). Aerosol backscatter coefficient values were lower in comparison to the first case (18–21 July), but the LRs remained elevated (around 45 sr). PLDR values averaged at 0.08 (355 nm) and 0.04 (532 nm), while the retrieved particles values showed smaller effective radii (mean: 0.16 µm), with higher imaginary refractive index (0.0103) values, indicating the presence of strongly absorbing particles (Pokhrel et al., 2016).
The impact of the aerosol particles on solar UV radiation at ground level was substantial. Indeed, the UVB irradiance dropped by up to 50 % (26 August) during the smoke-heavy days compared to the previous ones. The August episode showed even stronger attenuation, with UVB reductions of 40 % at SZA = 60° and 42 % at SZA = 30°. In contrast, the mixed dust-smoke period in July showed smaller reductions (∼ 25 %). Daily UVB cycles supported these trends: 21 July exhibited moderate attenuation alongside AE > 1 and FMF ≈ 0.6; 23 July (dust-dominated) showed weaker UVB effects with AE ∼ 0.5 and FMF ∼ 0.3; while 24 August (smoke-dominated) recorded AE ∼ 2.0, AOD > 1.0, and the strongest UVB suppression. During the smoke events the absorption efficiency of the particles was found to be comparable or lower than the absorption efficiency in the visible wavelengths (i.e., comparable or larger SSA in the UV), while the presence of dust results in lower SSA values in the UVB relative to the visible region.
The FLEXPART simulations confirmed the transport of biomass burning aerosols from northeastern Greece regions (Evros, Rodopi) to Athens. Additional contributions from Saharan dust and regional pollution, particularly in July, modulated the observed aerosol properties.
Overall, the present study highlights the value of integrating satellite, modelling, and ground-based observations to assess the complex impacts of wildfire aerosols. Our findings highlighted the strong influence of fire emissions on aerosol optical, microphysical, and radiative properties over Athens in summer 2023. In addition, we provided a systematic comparison between Brewer-derived AOD and CIMEL AERONET AOD, showing good agreement (average difference < 0.05, standard deviation 0.05–0.1 depending on wavelength). A complementary comparison between layer-integrated AOD retrieved from lidar and CIMEL sun-photometer measurements (355 vs. 340 and 532 vs. 500 nm) is included in the Supplement (Fig. S7 in the Supplement). This further validates the use of Brewer measurements for investigating aerosol effects on UVB radiation at ground level, since UVB radiation near ground plays a crucial role in human health and local air pollution photochemistry.
Lidar optical data are available in the repository: https://doi.org/10.5281/zenodo.17787794 (Papayannis et al., 2025). Lidar microphysical data as well as in situ data are available in the repository: https://doi.org/10.5281/zenodo.18924230 (Gidarakou et al., 2026). Brewer spectrophotometer data are available in the repository: https://doi.org/10.5281/zenodo.17714735 (Fountoulakis, 2025). All Aqua MODIS NASA Satellite imagery can be found in: https://worldview.earthdata.nasa.gov/ (last access: 15 December 2025). All AERONET data used in this work can be accessed through the AERONET web page: http://aeronet.gsfc.nasa.gov/ (last access: 20 February 2026). All FLEXPART results can be viewed or downloaded from https://atmo-access.nilu.no/NTUA_2023.py (last access: 20 August 2025). The air mass backward trajectory analysis is based on air mass transport computation by the NOAA (National Oceanic and Atmospheric Administration) HYSPLIT (HYbrid Single-Particle Lagrangian Integrated Trajectory) model (http://ready.arl.noaa.gov/HYSPLIT_traj.php, last access: 15 December 2025). GDAS1 (Global Data Assimilation System 1) re-analysis products from the National Weather Service's National Centers for Environmental Prediction are available at https://www.ready.noaa.gov/gdas1.php (last access: 15 December 2025).
The supplement related to this article is available online at https://doi.org/10.5194/acp-26-4313-2026-supplement.
Conceptualization, A.P. and M.G.; methodology, M.G. and A.P.; software, M.G., I.V., N.E., C.G.Z, E.K. and M.M.; validation, I.V., M.G., M.I.G., O.Z., K.G., K. Eleftheriadis., E.D., K. Eleftheratos, and I.F.; investigation, M.G., A.P., K. Eleftheratos. and I.F.; data curation, M.G., E.D., O.Z., M.M., I.V., I.F.; writing – original draft preparation, M.G.; writing – review and editing, M.G., A.P., K. Eleftheratos and I.F.; visualization, M.G., N.E., C.G.Z.; All authors have read and agreed to the published version of the manuscript.
The contact author has declared that none of the authors has any competing interests.
Publisher's note: Copernicus Publications remains neutral with regard to jurisdictional claims made in the text, published maps, institutional affiliations, or any other geographical representation in this paper. The authors bear the ultimate responsibility for providing appropriate place names. Views expressed in the text are those of the authors and do not necessarily reflect the views of the publisher.
This article is part of the special issue “Sun-photometric measurements of aerosols: harmonization, comparisons, synergies, effects, and applications”. It is not associated with a conference.
The authors acknowledge the use of data and/or imagery from NASA's Fire Information for Resource Management System (FIRMS) (https://earthdata.nasa.gov/firms, last access: 15 December 2025), part of NASA's Earth Observing System Data and Information System (EOSDIS). The map shown in Fig. 2a is provided by Earthstar Geographics. The AERONET project at NASA GSFC is supported by the Earth Observing System Program Science Office Cal-Val, Radiation Science program at NASA headquarters, and various field campaigns. We would also like to thank AERONET for their continuous efforts in providing high-quality measurements and derivative products.
The publication fees of this article were funded by the COST Action CA21119 Harmonia (International network for harmonisation of atmospheric aerosol retrievals from ground-based photometers), funded by COST (European Cooperation in Science and Technology). M.G. was supported by the Hellenic Foundation for Research and Innovation (HFRI) under the 4th Call for HFRI Ph.D. Fellowships (Fellowship number: 9293). The project 21GRD02 BIOSPHERE has received funding from the European Partnership on Metrology, co-financed by the European Union's Horizon Europe Research and Innovation Programme and by the Participating States. The FLEXPART results used a virtual access service that is supported by the European Commission under the Horizon 2020 – Research and Innovation Framework Programme, H2020-INFRAIA-2020-1, ATMO-ACCESS. Grant Agreement number: 101008004. The computations/simulations/[SIMILAR] were performed using resources provided by Sigma2 – the National Infrastructure for High-Performance Computing and Data Storage in Norway.
This paper was edited by Suvarna Fadnavis and reviewed by two anonymous referees.
Alados-Arboledas, L., Müller, D., Guerrero-Rascado, J. L., Navas-Guzmán, F., Pérez-Ramírez, D., and Olmo, F. J.: Optical and microphysical properties of fresh biomass burning aerosol retrieved by Raman lidar, and star-and sun-photometry, Geophys. Res. Lett., 38, https://doi.org/10.1029/2010GL045999, 2011.
Amiridis, V., Zerefos, C., Kazadzis, S., Gerasopoulos, E., Eleftheratos, K., Vrekoussis, M., Stohl, A., Mamouri, R. E., Kokkalis, P., Papayannis, A., Eleftheriadis, K., Diapouli, E., Keramitsoglou, I., Kontoes, C., Kotroni, V., Lagouvardos, K., Marinou, E., Giannakaki, E., Kostopoulou, E., Giannakopoulos, C., Richter, A., Burrows, J. P., and Mihalopoulos, N.: Impact of the 2009 Attica wild fires on the air quality in urban Athens, Atmos. Environ., 46, 536–544, https://doi.org/10.1016/j.atmosenv.2011.07.056, 2012.
Amiridis, V., Kazadzis, S., Gkikas, A., Voudouri, K. A., Kouklaki, D., Koukouli, M.-E., Garane, K., Georgoulias, A. K., Solomos, S., Varlas, G., Kampouri, A., Founda, D., Psiloglou, B. E., Katsafados, P., Papachristopoulou, K., Fountoulakis, I., Raptis, P.-I., Georgiou, T., Gialitaki, A., Proestakis, E., Tsekeri, A., Drakaki, E., Marinou, E., Giannakaki, E., Misios, S., Kapsomenakis, J., Eleftheratos, K., Hatzianastassiou, N., Kalabokas, P., Zanis, P., Vrekoussis, M., Papayannis, A., Kazantzidis, A., Kourtidis, K., Balis, D., Bais, A. F., and Zerefos, C.: Natural Aerosols, Gaseous Precursors and Their Impacts in Greece: A Review from the Remote Sensing Perspective, Atmosphere, 15, 753, https://doi.org/10.3390/atmos15070753, 2024.
Anderson, G. P., Clough, S. A., Kneizys, F. X., Chetwynd, J. H., and Shettle, E. P.: AFGL Atmospheric Constituent Profiles (0.120 km), Tech. Rep. AFGL-TR-86-0110, Air Force Geophys. Lab., Hanscom Air Force Base, Bedford, Mass., 1986.
Ansmann, A., Seifert, P., Tesche, M., and Wandinger, U.: Profiling of fine and coarse particle mass: case studies of Saharan dust and Eyjafjallajökull/Grimsvötn volcanic plumes, Atmos. Chem. Phys., 12, 9399–9415, https://doi.org/10.5194/acp-12-9399-2012, 2012.
Ansmann, A., Mamouri, R.-E., Hofer, J., Baars, H., Althausen, D., and Abdullaev, S. F.: Dust mass, cloud condensation nuclei, and ice-nucleating particle profiling with polarization lidar: updated POLIPHON conversion factors from global AERONET analysis, Atmos. Meas. Tech., 12, 4849–4865, https://doi.org/10.5194/amt-12-4849-2019, 2019.
Baars, H., Ansmann, A., Althausen, D., Engelmann, R., Heese, B., Müller, D., Artaxo, P., Paixao, M., Pauliquevis, T., and Souza, R.: Aerosol profiling with lidar in the Amazon Basin during the wet and dry season, J. Geophys. Res.-Atmos., 117, https://doi.org/10.1029/2012JD018338, 2012.
Bais, A. F., Gardiner, B. G., Slaper, H., Blumthaler, M., Bernhard, G., McKenzie, R., Webb, A. R., Seckmeyer, G., Kjeldstad, B., Koskela, T., Kirsch, P. J., Gröbner, J., Kerr, J. B., Kazadzis, S., Leszczynski, K., Wardle, D., Josefsson, W., Brogniez, C., Gillotay, D., Reinen, H., Weihs, P., Svenoe, T., Eriksen, P., Kuik, F., and Redondas, A.: SUSPEN intercomparison of ultraviolet spectroradiometers, J. Geophys. Res.-Atmos., 106, 12509–12525, https://doi.org/10.1029/2000JD900561, 2001.
Bais, A. F., Kazantzidis, A., Kazadzis, S., Balis, D. S., Zerefos, C. S., and Meleti, C.: Deriving an effective aerosol single scattering albedo from spectral surface UV irradiance measurements, Atmos. Environ., 39, 1093–1102, https://doi.org/10.1016/j.atmosenv.2004.09.080, 2005.
Buras, R., Dowling, T., and Emde, C.: New secondary-scattering correction in DISORT with increased efficiency for forward scattering, J. Quant. Spectrosc. Ra., 112, 2028–2034, https://doi.org/10.1016/j.jqsrt.2011.03.019, 2011.
Burton, S. P., Ferrare, R. A., Hostetler, C. A., Hair, J. W., Rogers, R. R., Obland, M. D., Butler, C. F., Cook, A. L., Harper, D. B., and Froyd, K. D.: Aerosol classification using airborne High Spectral Resolution Lidar measurements – methodology and examples, Atmos. Meas. Tech., 5, 73–98, https://doi.org/10.5194/amt-5-73-2012, 2012.
Chang, D. Y., Yoon, J., Lelieveld, J., Park, S. K., Yum, S. S., Kim, J., and Jeong, S.: Direct radiative forcing of biomass burning aerosols from the extensive Australian wildfires in 2019–2020, Environ. Res. Lett., 16, 044041, https://doi.org/10.1088/1748-9326/abecfe, 2021.
Chirizzi, D., Cesari, D., Guascito, M. R., Dinoi, A., Giotta, L., Donateo, A., and Contini, D.: Influence of Saharan dust outbreaks and carbon content on oxidative potential of water-soluble fractions of PM2.5 and PM10, Atmos. Environ., 163, 1–8, https://doi.org/10.1016/j.atmosenv.2017.05.021, 2017.
Diapouli, E., Kalogridis, A.-C., Markantonaki, C., Vratolis, S., Fetfatzis, P., Colombi, C., and Eleftheriadis, K.: Annual Variability of Black Carbon Concentrations Originating from Biomass and Fossil Fuel Combustion for the Suburban Aerosol in Athens, Greece, Atmosphere, 8, 234, https://doi.org/10.3390/atmos8120234, 2017.
Dubovik, O. and King, M. D.: A flexible inversion algorithm for retrieval of aerosol optical properties from Sun and sky radiance measurements, J. Geophys. Res.-Atmos., 105, 20673–20696, https://doi.org/10.1029/2000JD900282, 2000.
Eleftheratos, K., Kouklaki, D., and Zerefos, C.: Sixteen Years of Measurements of Ozone over Athens, Greece with a Brewer Spectrophotometer, Oxygen, 1, 32–45, https://doi.org/10.3390/oxygen1010005, 2021.
Emde, C., Buras-Schnell, R., Kylling, A., Mayer, B., Gasteiger, J., Hamann, U., Kylling, J., Richter, B., Pause, C., Dowling, T., and Bugliaro, L.: The libRadtran software package for radiative transfer calculations (version 2.0.1), Geosci. Model Dev., 9, 1647–1672, https://doi.org/10.5194/gmd-9-1647-2016, 2016.
Engelhart, G. J., Hennigan, C. J., Miracolo, M. A., Robinson, A. L., and Pandis, S. N.: Cloud condensation nuclei activity of fresh primary and aged biomass burning aerosol, Atmos. Chem. Phys., 12, 7285–7293, https://doi.org/10.5194/acp-12-7285-2012, 2012.
Evangeliou, N., Platt, S. M., Eckhardt, S., Lund Myhre, C., Laj, P., Alados-Arboledas, L., Backman, J., Brem, B. T., Fiebig, M., Flentje, H., Marinoni, A., Pandolfi, M., Yus-Dìez, J., Prats, N., Putaud, J. P., Sellegri, K., Sorribas, M., Eleftheriadis, K., Vratolis, S., Wiedensohler, A., and Stohl, A.: Changes in black carbon emissions over Europe due to COVID-19 lockdowns, Atmos. Chem. Phys., 21, 2675–2692, https://doi.org/10.5194/acp-21-2675-2021, 2021.
Fountoulakis, I.: WP2 – Athens Campaign – BRFAA, Zenodo [data set], https://doi.org/10.5281/zenodo.17714735, 2025.
Fountoulakis, I., Bais, A. F., Fragkos, K., Meleti, C., Tourpali, K., and Zempila, M. M.: Short- and long-term variability of spectral solar UV irradiance at Thessaloniki, Greece: effects of changes in aerosols, total ozone and clouds, Atmos. Chem. Phys., 16, 2493–2505, https://doi.org/10.5194/acp-16-2493-2016, 2016.
Fountoulakis, I., Natsis, A., Siomos, N., Drosoglou, T., and Bais, A. F.: Deriving Aerosol Absorption Properties from Solar Ultraviolet Radiation Spectral Measurements at Thessaloniki, Greece, Remote Sens., 11, 2179, https://doi.org/10.3390/rs11182179, 2019.
Fröhlich, R., Cubison, M. J., Slowik, J. G., Bukowiecki, N., Canonaco, F., Croteau, P. L., Gysel, M., Henne, S., Herrmann, E., Jayne, J. T., Steinbacher, M., Worsnop, D. R., Baltensperger, U., and Prévôt, A. S. H.: Fourteen months of on-line measurements of the non-refractory submicron aerosol at the Jungfraujoch (3580 ) – chemical composition, origins and organic aerosol sources, Atmos. Chem. Phys., 15, 11373–11398, https://doi.org/10.5194/acp-15-11373-2015, 2015.
Giannakaki, E., van Zyl, P. G., Müller, D., Balis, D., and Komppula, M.: Optical and microphysical characterization of aerosol layers over South Africa by means of multi-wavelength depolarization and Raman lidar measurements, Atmos. Chem. Phys., 16, 8109–8123, https://doi.org/10.5194/acp-16-8109-2016, 2016.
Gidarakou, M., Papayannis, A., Kokkalis, P., Evangeliou, N., Vratolis, S., Remoundaki, E., Groot Zwaaftink, C., Eckhardt, S., Veselovskii, I., Mylonaki, M., Argyrouli, A., Eleftheriadis, K., Solomos, S., and Gini, M. I.: Optical and Microphysical Properties of the Aerosols during a Rare Event of Biomass-Burning Mixed with Polluted Dust, Atmosphere, 15, 190, https://doi.org/10.3390/atmos15020190, 2024.
Gidarakou, M., Papayannis, A., Gao, K., Gidarakos, P., Crouzy, B., Foskinis, R., Erb, S., Zhang, C., Lieberherr, G., Collaud Coen, M., Sikoparija, B., Kanji, Z. A., Clot, B., Calpini, B., Giagka, E., and Nenes, A.: Profiling pollen and biomass burning particles over Payerne, Switzerland using laser-induced fluorescence lidar and in situ techniques during the 2023 PERICLES campaign, EGUsphere [preprint], https://doi.org/10.5194/egusphere-2025-2978, 2025.
Gidarakou, M., Gini, M. I., Eleftheriadis, K., Zografou, O., Granakis, K., and Veselovskii, I.: Data used in egusphere-2025-5856, Zenodo [data set], https://doi.org/10.5281/zenodo.18924230, 2026.
Giglio, L., Randerson, J. T., and van der Werf, G. R.: Analysis of daily, monthly, and annual burned area using the fourth-generation global fire emissions database (GFED4), J. Geophys. Res.-Biogeo., 118, 317–328, https://doi.org/10.1002/jgrg.20042, 2013.
Giglio, L., Schroeder, W., and Justice, C. O.: The collection 6 MODIS active fire detection algorithm and fire products, Remote Sens. Environ., 178, 31–41, https://doi.org/10.1016/j.rse.2016.02.054, 2016.
Groot Zwaaftink, C. D., Aas, W., Eckhardt, S., Evangeliou, N., Hamer, P., Johnsrud, M., Kylling, A., Platt, S. M., Stebel, K., Uggerud, H., and Yttri, K. E.: What caused a record high PM10 episode in northern Europe in October 2020?, Atmos. Chem. Phys., 22, 3789–3810, https://doi.org/10.5194/acp-22-3789-2022, 2022.
Groß, S., Tesche, M., Freudenthaler, V., Toledano, C., Wiegner, M., Ansmann, A., Althausen, D., and Seefeldner, M.: Characterization of Saharan dust, marine aerosols and mixtures of biomass-burning aerosols and dust by means of multi-wavelength depolarization and Raman lidar measurements during SAMUM 2, Tellus B, 63, 706, https://doi.org/10.1111/j.1600-0889.2011.00556.x, 2011.
Groß, S., Esselborn, M., Weinzierl, B., Wirth, M., Fix, A., and Petzold, A.: Aerosol classification by airborne high spectral resolution lidar observations, Atmos. Chem. Phys., 13, 2487–2505, https://doi.org/10.5194/acp-13-2487-2013, 2013.
Haarig, M., Walser, A., Ansmann, A., Dollner, M., Althausen, D., Sauer, D., Farrell, D., and Weinzierl, B.: Profiles of cloud condensation nuclei, dust mass concentration, and ice-nucleating-particle-relevant aerosol properties in the Saharan Air Layer over Barbados from polarization lidar and airborne in situ measurements, Atmos. Chem. Phys., 19, 13773–13788, https://doi.org/10.5194/acp-19-13773-2019, 2019.
Heinold, B., Baars, H., Barja, B., Christensen, M., Kubin, A., Ohneiser, K., Schepanski, K., Schutgens, N., Senf, F., Schrödner, R., Villanueva, D., and Tegen, I.: Important role of stratospheric injection height for the distribution and radiative forcing of smoke aerosol from the 2019–2020 Australian wildfires, Atmos. Chem. Phys., 22, 9969–9985, https://doi.org/10.5194/acp-22-9969-2022, 2022.
Hersbach, H., Bell, B., Berrisford, P., Hirahara, S., Horányi, A., Muñoz-Sabater, J., Nicolas, J., Peubey, C., Radu, R., Schepers, D., Simmons, A., Soci, C., Abdalla, S., Abellan, X., Balsamo, G., Bechtold, P., Biavati, G., Bidlot, J., Bonavita, M., De Chiara, G., Dahlgren, P., Dee, D., Diamantakis, M., Dragani, R., Flemming, J., Forbes, R., Fuentes, M., Geer, A., Haimberger, L., Healy, S., Hogan, R. J., Hólm, E., Janisková, M., Keeley, S., Laloyaux, P., Lopez, P., Lupu, C., Radnoti, G., de Rosnay, P., Rozum, I., Vamborg, F., Villaume, S., and Thépaut, J.-N.: The ERA5 global reanalysis, Q. J. Roy. Meteor. Soc., 146, 1999–2049, https://doi.org/10.1002/qj.3803, 2020.
Hess, M., Koepke, P., and Schult, I.: Optical Properties of Aerosols and Clouds: The Software Package OPAC, B. Am. Meteorol. Soc., 79, 831–844, https://doi.org/10.1175/1520-0477(1998)079<0831:OPOAAC>2.0.CO;2, 1998.
Holben, B. N., Eck, T. F., Slutsker, I., Tanré, D., Buis, J. P., Setzer, A., Vermote, E., Reagan, J. A., Kaufman, Y. J., Nakajima, T., Lavenu, F., Jankowiak, I., and Smirnov, A.: AERONET—A Federated Instrument Network and Data Archive for Aerosol Characterization, Remote Sens. Environ., 66, 1–16, https://doi.org/10.1016/S0034-4257(98)00031-5, 1998.
Intergovernmental Panel On Climate Change (IPCC): Climate Change 2021 – The Physical Science Basis: Working Group I Contribution to the Sixth Assessment Report of the Intergovernmental Panel on Climate Change, 1st edn., Cambridge University Press, https://doi.org/10.1017/9781009157896, 2023.
Janicka, L., Stachlewska, I. S., Veselovskii, I., and Baars, H.: Temporal variations in optical and microphysical properties of mineral dust and biomass burning aerosol derived from daytime Raman lidar observations over Warsaw, Poland, Atmos. Environ., 169, 162–174, https://doi.org/10.1016/j.atmosenv.2017.09.022, 2017.
Justice, C. O., Giglio, L., Korontzi, S., Owens, J., Morisette, J. T., Roy, D., Descloitres, J., Alleaume, S., Petitcolin, F., and Kaufman, Y.: The MODIS fire products, Remote Sens. Environ., 83, 244–262, https://doi.org/10.1016/S0034-4257(02)00076-7, 2002.
Kaskaoutis, D. G., Kharol, S. K., Sifakis, N., Nastos, P. T., Sharma, A. R., Badarinath, K. V. S., and Kambezidis, H. D.: Satellite monitoring of the biomass-burning aerosols during the wildfires of August 2007 in Greece: Climate implications, Atmos. Environ., 45, 716–726, https://doi.org/10.1016/j.atmosenv.2010.09.043, 2011.
Kaskaoutis, D. G., Grivas, G., Stavroulas, I., Bougiatioti, A., Liakakou, E., Dumka, U. C., Gerasopoulos, E., and Mihalopoulos, N.: Apportionment of black and brown carbon spectral absorption sources in the urban environment of Athens, Greece, during winter, Sci. Total Environ., 801, 149739, https://doi.org/10.1016/j.scitotenv.2021.149739, 2021.
Kaskaoutis, D. G., Petrinoli, K., Grivas, G., Kalkavouras, P., Tsagkaraki, M., Tavernaraki, K., Papoutsidaki, K., Stavroulas, I., Paraskevopoulou, D., Bougiatioti, A., Liakakou, E., Rashki, A., Sotiropoulou, R. E. P., Tagaris, E., Gerasopoulos, E., and Mihalopoulos, N.: Impact of peri-urban forest fires on air quality and aerosol optical and chemical properties: The case of the August 2021 wildfires in Athens, Greece, Sci. Total Environ., 907, 168028, https://doi.org/10.1016/j.scitotenv.2023.168028, 2024.
Kazadzis, S., Bais, A., Amiridis, V., Balis, D., Meleti, C., Kouremeti, N., Zerefos, C. S., Rapsomanikis, S., Petrakakis, M., Kelesis, A., Tzoumaka, P., and Kelektsoglou, K.: Nine years of UV aerosol optical depth measurements at Thessaloniki, Greece, Atmos. Chem. Phys., 7, 2091–2101, https://doi.org/10.5194/acp-7-2091-2007, 2007.
Klimont, Z., Kupiainen, K., Heyes, C., Purohit, P., Cofala, J., Rafaj, P., Borken-Kleefeld, J., and Schöpp, W.: Global anthropogenic emissions of particulate matter including black carbon, Atmos. Chem. Phys., 17, 8681–8723, https://doi.org/10.5194/acp-17-8681-2017, 2017.
Knorr, W., Dentener, F., Lamarque, J.-F., Jiang, L., and Arneth, A.: Wildfire air pollution hazard during the 21st century, Atmos. Chem. Phys., 17, 9223–9236, https://doi.org/10.5194/acp-17-9223-2017, 2017.
Kurucz, R. L.: Synthetic Infrared Spectra, Symp. – Int. Astron. Union, 154, 523–531, https://doi.org/10.1017/S0074180900124805, 1994.
Liakakou, E., Stavroulas, I., Kaskaoutis, D. G., Grivas, G., Paraskevopoulou, D., Dumka, U. C., Tsagkaraki, M., Bougiatioti, A., Oikonomou, K., Sciare, J., Gerasopoulos, E., and Mihalopoulos, N.: Long-term variability, source apportionment and spectral properties of black carbon at an urban background site in Athens, Greece, Atmos. Environ., 222, 117137, https://doi.org/10.1016/j.atmosenv.2019.117137, 2020.
Liu, C.-C., Portmann, R. W., Liu, S., Rosenlof, K. H., Peng, Y., and Yu, P.: Significant Effective Radiative Forcing of Stratospheric Wildfire Smoke, Geophys. Res. Lett., 49, e2022GL100175, https://doi.org/10.1029/2022GL100175, 2022.
Liu, L., Cheng, Y., Wang, S., Wei, C., Pöhlker, M. L., Pöhlker, C., Artaxo, P., Shrivastava, M., Andreae, M. O., Pöschl, U., and Su, H.: Impact of biomass burning aerosols on radiation, clouds, and precipitation over the Amazon: relative importance of aerosol–cloud and aerosol–radiation interactions, Atmos. Chem. Phys., 20, 13283–13301, https://doi.org/10.5194/acp-20-13283-2020, 2020.
López-Solano, J., Redondas, A., Carlund, T., Rodriguez-Franco, J. J., Diémoz, H., León-Luis, S. F., Hernández-Cruz, B., Guirado-Fuentes, C., Kouremeti, N., Gröbner, J., Kazadzis, S., Carreño, V., Berjón, A., Santana-Díaz, D., Rodríguez-Valido, M., De Bock, V., Moreta, J. R., Rimmer, J., Smedley, A. R. D., Boulkelia, L., Jepsen, N., Eriksen, P., Bais, A. F., Shirotov, V., Vilaplana, J. M., Wilson, K. M., and Karppinen, T.: Aerosol optical depth in the European Brewer Network, Atmos. Chem. Phys., 18, 3885–3902, https://doi.org/10.5194/acp-18-3885-2018, 2018.
Mamouri, R. E. and Ansmann, A.: Fine and coarse dust separation with polarization lidar, Atmos. Meas. Tech., 7, 3717–3735, https://doi.org/10.5194/amt-7-3717-2014, 2014.
Masoom, A., Fountoulakis, I., Kazadzis, S., Raptis, I.-P., Kampouri, A., Psiloglou, B. E., Kouklaki, D., Papachristopoulou, K., Marinou, E., Solomos, S., Gialitaki, A., Founda, D., Salamalikis, V., Kaskaoutis, D., Kouremeti, N., Mihalopoulos, N., Amiridis, V., Kazantzidis, A., Papayannis, A., Zerefos, C. S., and Eleftheratos, K.: Investigation of the effects of the Greek extreme wildfires of August 2021 on air quality and spectral solar irradiance, Atmos. Chem. Phys., 23, 8487–8514, https://doi.org/10.5194/acp-23-8487-2023, 2023.
Mayol-Bracero, O. L., Guyon, P., Graham, B., Roberts, G., Andreae, M. O., Decesari, S., Facchini, M. C., Fuzzi, S., and Artaxo, P.: Water-soluble organic compounds in biomass burning aerosols over Amazonia 2. Apportionment of the chemical composition and importance of the polyacidic fraction, J. Geophys. Res.-Atmos., 107, LBA 59-1–LBA 59-15, https://doi.org/10.1029/2001JD000522, 2002.
Michailidis, K., Garane, K., Karagkiozidis, D., Peletidou, G., Voudouri, K.-A., Balis, D., and Bais, A.: Extreme wildfires over northern Greece during summer 2023 – Part A: Effects on aerosol optical properties and solar UV radiation, Atmos. Res., 311, 107700, https://doi.org/10.1016/j.atmosres.2024.107700, 2024.
Müller, D., Wandinger, U., and Ansmann, A.: Microphysical particle parameters from extinction and backscatter lidar data by inversion with regularization: theory, Appl. Optics, 38, 2346, https://doi.org/10.1364/AO.38.002346, 1999.
Müller, D., Mattis, I., Wandinger, U., Ansmann, A., Althausen, D., and Stohl, A.: Raman lidar observations of aged Siberian and Canadian forest fire smoke in the free troposphere over Germany in 2003: Microphysical particle characterization, J. Geophys. Res.-Atmos., 110, 2004JD005756, https://doi.org/10.1029/2004JD005756, 2005.
Müller, D., Ansmann, A., Mattis, I., Tesche, M., Wandinger, U., Althausen, D., and Pisani, G.: Aerosol-type-dependent lidar ratios observed with Raman lidar, J. Geophys. Res.-Atmos., 112, https://doi.org/10.1029/2006JD008292, 2007.
Murayama, T., Müller, D., Wada, K., Shimizu, A., Sekiguchi, M., and Tsukamoto, T.: Characterization of Asian dust and Siberian smoke with multi-wavelength Raman lidar over Tokyo, Japan in spring 2003, Geophys. Res. Lett., 31, https://doi.org/10.1029/2004GL021105, 2004.
Mylonaki, M., Papayannis, A., Anagnou, D., Veselovskii, I., Papanikolaou, C.-A., Kokkalis, P., Soupiona, O., Foskinis, R., Gidarakou, M., and Kralli, E.: Optical and Microphysical Properties of Aged Biomass Burning Aerosols and Mixtures, Based on 9-Year Multiwavelength Raman Lidar Observations in Athens, Greece, Remote Sens., 13, 3877, https://doi.org/10.3390/rs13193877, 2021.
Mylonaki, M., Gini, M., Georgopoulou, M., Pilou, M., Chalvatzaki, E., Solomos, S., Diapouli, E., Giannakaki, E., Lazaridis, M., Pandis, S. N., Nenes, A., Eleftheriadis, K., and Papayannis, A.: Wildfire and African dust aerosol oxidative potential, exposure and dose in the human respiratory tract, Sci. Total Environ., 913, 169683, https://doi.org/10.1016/j.scitotenv.2023.169683, 2024.
Nemuc, A., Vasilescu, J., Talianu, C., Belegante, L., and Nicolae, D.: Assessment of aerosol's mass concentrations from measured linear particle depolarization ratio (vertically resolved) and simulations, Atmos. Meas. Tech., 6, 3243–3255, https://doi.org/10.5194/amt-6-3243-2013, 2013.
Nicolae, D., Nemuc, A., Müller, D., Talianu, C., Vasilescu, J., Belegante, L., and Kolgotin, A.: Characterization of fresh and aged biomass burning events using multiwavelength Raman lidar and mass spectrometry, J. Geophys. Res.-Atmos., 118, 2956–2965, https://doi.org/10.1002/jgrd.50324, 2013.
OBSERVER: Global Wildfire Watch: Copernicus EMS and CAMS Monitor Wildfires in 2023 | Copernicus, https://www.copernicus.eu/en/news/news/observer-global-wildfire-watch-copernicus-ems-and-cams-monitor-wildfires-2023 (last access: 20 January 2026).
Ohneiser, K., Ansmann, A., Baars, H., Seifert, P., Barja, B., Jimenez, C., Radenz, M., Teisseire, A., Floutsi, A., Haarig, M., Foth, A., Chudnovsky, A., Engelmann, R., Zamorano, F., Bühl, J., and Wandinger, U.: Smoke of extreme Australian bushfires observed in the stratosphere over Punta Arenas, Chile, in January 2020: optical thickness, lidar ratios, and depolarization ratios at 355 and 532 nm, Atmos. Chem. Phys., 20, 8003–8015, https://doi.org/10.5194/acp-20-8003-2020, 2020.
Ortiz-Amezcua, P., Guerrero-Rascado, J. L., Granados-Muñoz, M. J., Benavent-Oltra, J. A., Böckmann, C., Samaras, S., Stachlewska, I. S., Janicka, Ł., Baars, H., Bohlmann, S., and Alados-Arboledas, L.: Microphysical characterization of long-range transported biomass burning particles from North America at three EARLINET stations, Atmos. Chem. Phys., 17, 5931–5946, https://doi.org/10.5194/acp-17-5931-2017, 2017.
Osswald, T., Gama, C., Fernandes, A. P., Lopes, D., Varela, V., and Miranda, A. I.: Effects of the wildfires in August 2021 on the air quality of Athens through a numerical simulation, Int. J. Wildland Fire, 32, 1633–1645, https://doi.org/10.1071/WF22148, 2023.
Papagiannopoulos, N., Mona, L., Amodeo, A., D'Amico, G., Gumà Claramunt, P., Pappalardo, G., Alados-Arboledas, L., Guerrero-Rascado, J. L., Amiridis, V., Kokkalis, P., Apituley, A., Baars, H., Schwarz, A., Wandinger, U., Binietoglou, I., Nicolae, D., Bortoli, D., Comerón, A., Rodríguez-Gómez, A., Sicard, M., Papayannis, A., and Wiegner, M.: An automatic observation-based aerosol typing method for EARLINET, Atmos. Chem. Phys., 18, 15879–15901, https://doi.org/10.5194/acp-18-15879-2018, 2018.
Papanikolaou, C.-A., Kokkalis, P., Soupiona, O., Solomos, S., Papayannis, A., Mylonaki, M., Anagnou, D., Foskinis, R., and Gidarakou, M.: Australian Bushfires (2019–2020): Aerosol Optical Properties and Radiative Forcing, Atmosphere, 13, 867, https://doi.org/10.3390/atmos13060867, 2022.
Papayannis, A., Nicolae, D., Kokkalis, P., Binietoglou, I., Talianu, C., Belegante, L., Tsaknakis, G., Cazacu, M. M., Vetres, I., and Ilic, L.: Optical, size and mass properties of mixed type aerosols in Greece and Romania as observed by synergy of lidar and sunphotometers in combination with model simulations: A case study, Sci. Total Environ., 500–501, 277–294, https://doi.org/10.1016/j.scitotenv.2014.08.101, 2014.
Papayannis, A., Kokkalis, P., Mylonaki, M., Soupiona, R., Papanikolaou, C. A., Foskinis, R., and Giakoumaki, A.: Recent Upgrades of the EOLE and AIAS Lidar Systems of the National Technical University of Athens Operating Since 2000 in Athens, Greece, EPJ Web Conf., 237, 02030, https://doi.org/10.1051/epjconf/202023702030, 2020.
Papayannis, A., Mylonaki, M., Gidarakou, M., and Kralli, E.: WP2 – Athens Campaign – NTUA / Level 2 – (June–August 2023), Zenodo [data set], https://doi.org/10.5281/zenodo.17787794, 2025.
Paraskevopoulou, D., Liakakou, E., Gerasopoulos, E., Theodosi, C., and Mihalopoulos, N.: Long-term characterization of organic and elemental carbon in the PM2.5 fraction: the case of Athens, Greece, Atmos. Chem. Phys., 14, 13313–13325, https://doi.org/10.5194/acp-14-13313-2014, 2014.
Pierrard, V., Bolsée, D., Winant, A., Al-Qaaod, A., Krasniqi, F., Bonhome, M. P. de, Botek, E., Laeken, L. V., Sapundjiev, D., Malderen, R. V., Mangold, A., Ambrozova, I., Sommer, M., Slegl, J., Geronikolou, S. A., Georgakilas, A. G., Dorn, A., Rapp, B., Solc, J., Marek, L., Oancea, C., Doppler, L., Langer, R., Walsh, S., Sabia, M., Vuolo, M., Papayannis, A., Granja, C., Pierrard, V., Bolsée, D., Winant, A., Al-Qaaod, A., Krasniqi, F., Bonhome, M. P. de, Botek, E., Laeken, L. V., Sapundjiev, D., Malderen, R. V., Mangold, A., Ambrozova, I., Sommer, M., Slegl, J., Geronikolou, S. A., Georgakilas, A. G., Dorn, A., Rapp, B., Solc, J., Marek, L., Oancea, C., Doppler, L., Langer, R., Walsh, S., Sabia, M., Vuolo, M., Papayannis, A., and Granja, C.: BIOSPHERE measurement campaign from January 2024 to March 2024 and in May 2024: Effects of the solar events on the radiation belts, UV radiation and ozone in the atmosphere, AIMS Geosci., 11, 117–154, https://doi.org/10.3934/geosci.2025007, 2025.
Pisso, I., Sollum, E., Grythe, H., Kristiansen, N. I., Cassiani, M., Eckhardt, S., Arnold, D., Morton, D., Thompson, R. L., Groot Zwaaftink, C. D., Evangeliou, N., Sodemann, H., Haimberger, L., Henne, S., Brunner, D., Burkhart, J. F., Fouilloux, A., Brioude, J., Philipp, A., Seibert, P., and Stohl, A.: The Lagrangian particle dispersion model FLEXPART version 10.4, Geosci. Model Dev., 12, 4955–4997, https://doi.org/10.5194/gmd-12-4955-2019, 2019.
Pokhrel, R. P., Wagner, N. L., Langridge, J. M., Lack, D. A., Jayarathne, T., Stone, E. A., Stockwell, C. E., Yokelson, R. J., and Murphy, S. M.: Parameterization of single-scattering albedo (SSA) and absorption Ångström exponent (AAE) with for aerosol emissions from biomass burning, Atmos. Chem. Phys., 16, 9549–9561, https://doi.org/10.5194/acp-16-9549-2016, 2016.
Poutli, M., Mamouri, R. E., Nisantzi, A., Ene, D., Michailidis, K., Balis, D., and Hadjimitsis, D.: Variability of Smoke Optical Properties in Eastern Mediterranean, in: IGARSS 2024 – 2024 IEEE International Geoscience and Remote Sensing Symposium, 5782–5786, https://doi.org/10.1109/IGARSS53475.2024.10641256, 2024.
Proestakis, E., Gkikas, A., Georgiou, T., Kampouri, A., Drakaki, E., Ryder, C. L., Marenco, F., Marinou, E., and Amiridis, V.: A near-global multiyear climate data record of the fine-mode and coarse-mode components of atmospheric pure dust, Atmos. Meas. Tech., 17, 3625–3667, https://doi.org/10.5194/amt-17-3625-2024, 2024.
Raptis, I.-P., Kazadzis, S., Eleftheratos, K., Amiridis, V., and Fountoulakis, I.: Single Scattering Albedo's Spectral Dependence Effect on UV Irradiance, Atmosphere, 9, 364, https://doi.org/10.3390/atmos9090364, 2018.
Raptis, I.-P., Kazadzis, S., Amiridis, V., Gkikas, A., Gerasopoulos, E., and Mihalopoulos, N.: A Decade of Aerosol Optical Properties Measurements over Athens, Greece, Atmosphere, 11, 154, https://doi.org/10.3390/atmos11020154, 2020.
Reichardt, J., Lauermann, F., and Behrendt, O.: Fluorescence spectra of atmospheric aerosols, https://doi.org/10.5194/egusphere-2024-3928, 19 December 2024.
Reid, J. S., Eck, T. F., Christopher, S. A., Koppmann, R., Dubovik, O., Eleuterio, D. P., Holben, B. N., Reid, E. A., and Zhang, J.: A review of biomass burning emissions part III: intensive optical properties of biomass burning particles, Atmos. Chem. Phys., 5, 827–849, https://doi.org/10.5194/acp-5-827-2005, 2005.
Ruffault, J., Curt, T., Martin-StPaul, N. K., Moron, V., and Trigo, R. M.: Extreme wildfire events are linked to global-change-type droughts in the northern Mediterranean, Nat. Hazards Earth Syst. Sci., 18, 847–856, https://doi.org/10.5194/nhess-18-847-2018, 2018.
Russell, P. B., Bergstrom, R. W., Shinozuka, Y., Clarke, A. D., DeCarlo, P. F., Jimenez, J. L., Livingston, J. M., Redemann, J., Dubovik, O., and Strawa, A.: Absorption Angstrom Exponent in AERONET and related data as an indicator of aerosol composition, Atmos. Chem. Phys., 10, 1155–1169, https://doi.org/10.5194/acp-10-1155-2010, 2010.
Salgueiro, V., Costa, M. J., Guerrero-Rascado, J. L., Couto, F. T., and Bortoli, D.: Characterization of forest fire and Saharan desert dust aerosols over south-western Europe using a multi-wavelength Raman lidar and Sun-photometer, Atmos. Environ., 252, 118346, https://doi.org/10.1016/j.atmosenv.2021.118346, 2021.
Sandradewi, J., Prévôt, A. S. H., Szidat, S., Perron, N., Alfarra, M. R., Lanz, V. A., Weingartner, E., and Baltensperger, U.: Using Aerosol Light Absorption Measurements for the Quantitative Determination of Wood Burning and Traffic Emission Contributions to Particulate Matter, Environ. Sci. Technol., 42, 3316–3323, https://doi.org/10.1021/es702253m, 2008.
Sellitto, P., Belhadji, R., Kloss, C., and Legras, B.: Radiative impacts of the Australian bushfires 2019–2020 – Part 1: Large-scale radiative forcing, Atmos. Chem. Phys., 22, 9299–9311, https://doi.org/10.5194/acp-22-9299-2022, 2022.
Sellitto, P., Belhadji, R., Cuesta, J., Podglajen, A., and Legras, B.: Radiative impacts of the Australian bushfires 2019–2020 – Part 2: Large-scale and in-vortex radiative heating, Atmos. Chem. Phys., 23, 15523–15535, https://doi.org/10.5194/acp-23-15523-2023, 2023.
Sicard, M., Mallet, M., Garcia-Vizcaino, D., Comeŕon, A., Rocadenbosch, F., Dubuisson, P., and Muñoz-Porcar, C.: Intense dust and extremely fresh biomass burning outbreak in Barcelona, Spain: Characterization of their optical properties and estimation of their direct radiative forcing, Environ. Res. Lett., 7, 034016–1–6, https://doi.org/10.1088/1748-9326/7/3/034016, 2012.
Singh, A., Srivastava, A. K., Pathak, V., and Shukla, A. K.: Quantifying the impact of biomass burning and dust storm activities on aerosol characteristics over the Indo-Gangetic Basin, Atmos. Environ., 270, 118893, https://doi.org/10.1016/j.atmosenv.2021.118893, 2022.
Stathopoulos, V. K., Evangeliou, N., Stohl, A., Vratolis, S., Matsoukas, C., and Eleftheriadis, K.: Large Circulation Patterns Strongly Modulate Long-Term Variability of Arctic Black Carbon Levels and Areas of Origin, Geophys. Res. Lett., 48, e2021GL092876, https://doi.org/10.1029/2021GL092876, 2021.
Stohl, A., Hittenberger, M., and Wotawa, G.: Validation of the lagrangian particle dispersion model FLEXPART against large-scale tracer experiment data, Atmos. Environ., 32, 4245–4264, https://doi.org/10.1016/S1352-2310(98)00184-8, 1998.
Tesche, M., Ansmann, A., Müller, D., Althausen, D., Engelmann, R., Freudenthaler, V., and Groß, S.: Vertically resolved separation of dust and smoke over Cape Verde using multiwavelength Raman and polarization lidars during Saharan Mineral Dust Experiment 2008, J. Geophys. Res.-Atmos., 114, https://doi.org/10.1029/2009JD011862, 2009.
Torres, O., Bhartia, P. K., Taha, G., Jethva, H., Das, S., Colarco, P., Krotkov, N., Omar, A., and Ahn, C.: Stratospheric Injection of Massive Smoke Plume From Canadian Boreal Fires in 2017 as Seen by DSCOVR-EPIC, CALIOP, and OMPS-LP Observations, J. Geophys. Res.-Atmos., 125, e2020JD032579, https://doi.org/10.1029/2020JD032579, 2020.
Turquety, S., Hurtmans, D., Hadji-Lazaro, J., Coheur, P.-F., Clerbaux, C., Josset, D., and Tsamalis, C.: Tracking the emission and transport of pollution from wildfires using the IASI CO retrievals: analysis of the summer 2007 Greek fires, Atmos. Chem. Phys., 9, 4897–4913, https://doi.org/10.5194/acp-9-4897-2009, 2009.
Vadrevu, K. and Lasko, K.: Intercomparison of MODIS AQUA and VIIRS I-Band Fires and Emissions in an Agricultural Landscape—Implications for Air Pollution Research, Remote Sens., 10, 978, https://doi.org/10.3390/rs10070978, 2018.
Vasilakopoulou, C. N., Matrali, A., Skyllakou, K., Georgopoulou, M., Aktypis, A., Florou, K., Kaltsonoudis, C., Siouti, E., Kostenidou, E., Błaziak, A., Nenes, A., Papagiannis, S., Eleftheriadis, K., Patoulias, D., Kioutsioukis, I., and Pandis, S. N.: Rapid transformation of wildfire emissions to harmful background aerosol, npj Clim. Atmos. Sci., 6, 218, https://doi.org/10.1038/s41612-023-00544-7, 2023.
Veselovskii, I., Hu, Q., Goloub, P., Podvin, T., Boissiere, W., Korenskiy, M., Kasianik, N., Khaykyn, S., and Miri, R.: Derivation of depolarization ratios of aerosol fluorescence and water vapor Raman backscatters from lidar measurements, Atmos. Meas. Tech., 17, 1023–1036, https://doi.org/10.5194/amt-17-1023-2024, 2024.
Weinzierl, B., Sauer, D., Esselborn, M., Petzold, A., Veira, A., Rose, M., Mund, S., Wirth, M., Ansmann, A., Tesche, M., Gross, S., and Freudenthaler, V.: Microphysical and optical properties of dust and tropical biomass burning aerosol layers in the Cape Verde region—an overview of the airborne in situ and lidar measurements during SAMUM-2, Tellus B Chem. Phys. Meteorol., 63, 589, https://doi.org/10.1111/j.1600-0889.2011.00566.x, 2011.
Wildfires: 2023 among the worst in the EU in this century, The Joint Research Centre: EU Science Hub, https://joint-research-centre.ec.europa.eu/jrc-news-and-updates/wildfires-2023-among-worst-eu-century-2024-04-10_en (last access: 20 January 2026).
Zografou, O., Gini, M., Manousakas, M. I., Chen, G., Kalogridis, A. C., Diapouli, E., Pappa, A., and Eleftheriadis, K.: Combined organic and inorganic source apportionment on yearlong ToF-ACSM dataset at a suburban station in Athens, Atmos. Meas. Tech., 15, 4675–4692, https://doi.org/10.5194/amt-15-4675-2022, 2022.