the Creative Commons Attribution 4.0 License.
the Creative Commons Attribution 4.0 License.
 | 24 Mar 2026
Observing the role of wind-driven processes in the evolution of warm marine cloud properties
Vishnu Nair
Edward Gryspeerdt
Antti Arola
Antti Lipponen
Timo Virtanen
The cloud droplet effective radius is a key variable when evaluating the interactions between aerosols and clouds. The activation of fine-sized sea salt from the ocean results in the formation of more but smaller cloud droplets (reducing the effective radius) in marine stratocumulus. Coarse sea spray aerosols are generated for high surface wind speeds and act as giant cloud condensation nuclei, which activate to form larger droplets. This increases the effective radius and initiates precipitation. These high wind speeds also lead to enhanced moisture fluxes from the ocean surface. Although the opposing impacts of wind-driven fine and coarse marine sea spray aerosols have been documented, their observations have been limited to instantaneous satellite images. In this work, a novel framework is introduced that uses short-timescale observations of the temporal evolution of clouds to identify, isolate, and extract the process fingerprints of marine sea-salt and surface fluxes on stratocumulus cloud properties. This method shows that changes in droplet size previously attributed to aerosol are actually due to increases in evaporation from the ocean surface due to high surface wind speeds. However, when this is accounted for, a clear impact of giant cloud condensation nuclei is observed, reducing cloud droplet number concentrations by initiating precipitation in polluted clouds. By isolating the causal aerosol impact on clouds from confounding factors, this method provides a pathway to improved constraints on the human forcing of the climate, whilst also demonstrating how marine aerosols limit the effectiveness of anthropogenic aerosol perturbations.
- Article
(10054 KB) - Full-text XML
- BibTeX
- EndNote


Aerosols affect the Earth's radiation budget directly by reflecting and absorbing incoming solar radiation, and indirectly by acting as nucleation sites on which cloud droplets form (Twomey, 1974; Bellouin et al., 2020). Indirect effects occur by changing existing or new cloud properties and can have a cooling effect on global surface temperatures, hence offsetting a large part of the greenhouse gas warming (Stocker et al., 2013). This is by modifying the cloud reflectivity, both by affecting droplet size and by driving time-dependent “adjustments” (Albrecht, 1989), modifying the evolution of cloud properties (Glassmeier et al., 2021; Fons et al., 2023; Gryspeerdt et al., 2022a). The effective radiative forcing from aerosol-cloud interactions (ACI) is the largest source of uncertainty in human forcing of the climate (Andreae et al., 2005; Bellouin et al., 2020). ACI contributions are mainly due to the instantaneous Twomey effect (Twomey, 1974) which affects the cloud microphysical properties, or due to adjustments to the cloud macrophysical properties.
The adjustments of low clouds, such as marine stratocumulus (MSC), to aerosol perturbations are crucial to the Earth's radiation budget (Slingo, 1990). There are significant changes in the budget for even a small change in MSC coverage and thickness, with even a 4 % increase in the global area covered by low-level stratus clouds offsetting a 2–3 K temperature increase from higher atmospheric CO2 concentrations (Randall et al., 1984). Two key measures of the properties of clouds that affect its radiative properties and hence the effect of MSC on the ocean albedo are the liquid water path (LWP, a measure of the total liquid water in a cloud), and the cloud droplet number concentration (Nd, a measure of the number of droplets in a cloud).
The cloud droplet effective radius, re, is physically, the area weighted mean of the cloud droplet size distribution. For a constant LWP, an increase in aerosol concentration (or cloud condensation nuclei, CCN) leads to an increase in Nd and a decrease in re (Twomey, 1977). More numerous smaller cloud droplets with a larger total droplet surface area reflect more sunlight, leading to an increase in cloud albedo. The decrease in re can also modify the cloud macrostructure by suppressing precipitation (due to weakened collision-coalescence between droplets) which causes both the LWP and albedo to increase (Albrecht, 1989). On the other hand, lower re can also suppress in-cloud droplet sedimentation and enhance cloud-top evaporative cooling which causes an increase in turbulent entrainment of free tropospheric air. Depending on the humidity of the entrained air, this can lead to a decrease or increase in LWP (Ackerman et al., 2004; Bretherton et al., 2007).
As well as the aerosol impact on cloud, cloud processes (such as precipitation) can modify aerosol. These feedback loops of processes that occur simultaneously are difficult to unravel and are further dependent on different cloud and meteorological regimes, complicating the identification of causal aerosol impacts on cloud (Fons et al., 2023). There are differences in the estimates of the climate effects due to ACI from global climate models and observations. The accuracy of the representations of these separate adjustment processes in models is believed to be one of the reasons for this discrepancy (Mülmenstädt et al., 2024a, b). This creates a requirement for strong observational constraints on cloud processes, to ensure that models have accurate representations of ACI.
There are multiple processes that can modify the cloud re, either by changing the cloud Nd or by changing the LWP. A key process via the Nd pathway is the additional activation of cloud droplets on CCN from different sources. The marine aerosol population generally consists of aerosols generated from the ocean surface: sea-salt from the action of wind stresses at the ocean surface (primary aerosols) and the emission of biogenic sulfur gases (dimethyl sulfide) which oxidizes in the atmosphere to form sulfate aerosols (secondary aerosols), aerosols entrained from the free troposphere, and aerosols from anthropogenic sources (sulfates, black and organic carbon) and natural sources (dust) from the continent that are advected to the marine boundary layer. The role of sea spray aerosols is unique as the consequence of the ACI can vary depending on the size of sea salt generated. The cloud-top re retrieved from satellite observations has systematically higher values over the ocean than over land which has a higher fine anthropogenic aerosol (radii < 1 µm) concentration (Bréon et al., 2002; Kaufman et al., 2005).
Fine (radii < 1 µm) and coarse (radii > 1 µm) sea salt, both mechanically generated by wind, coexist over the ocean and form a significant part of the respective (fine and coarse) aerosol modes. It is well established that their generation and subsequent concentrations and size distributions are strongly related to the sea surface (10 m) wind speeds. Perturbing clouds with fine sea salt (FSS) would lead to a reduction in re thereby brightening clouds. However, coarse marine aerosols (CMA), which are generated for surface wind speeds greater than 4 m s−1 (Lehahn et al., 2010), act as “giant” CCNs and have been hypothesized to enhance warm rain by accelerating the formation of larger cloud droplets (larger re) (Ludlam, 1951; Feingold et al., 1999; Lasher-Trapp et al., 2001; Rosenfeld et al., 2002; L'Ecuyer et al., 2009; Lehahn et al., 2011; Jung et al., 2015). By triggering rain and reducing the LWP, CMA can break up and hence reduce cloud reflectivity. However, other model studies have questioned this impact, showing that this depends on the aerosol concentration; CMA have a negligible impact on precipitation initiation in clean clouds (Dagan et al., 2015), or no impact at all (Blyth et al., 2013). More recent research (Liu et al., 2022, 2025) suggests that there is an optimal combination which can effectively brighten clouds due to reduced re and enhanced cloud cover. Although it is not an anthropogenic aerosol, sea-salt sets the background “unpolluted” state of the cloud, modifying the aerosol forcing. This makes it essential to correctly represent fine and coarse marine aerosol in any model used for future climate assessment.
The impact of different cloud adjustments to fine and coarse sea salt has potential implications for geoengineering through marine cloud brightening (MCB). MCB deliberately injects clouds with aerosols (ideally seawater spray), to lower re and increase reflectivity. In addition to setting the cloud background condition, thus determining how effective MCB can be in some conditions, the size distribution of the seeded aerosol now becomes important (Hoffmann and Feingold, 2021). Due to technical limitations, the seawater sprayed often contains coarse particles as well which can cause cloud breakup by initiating precipitation, making it important to consider the combined and opposing effects of fine and coarse sea salt and the possible consequences in MCB projects.
Cloud re modification occurs via changes in cloud LWP as well. An increase in cloud LWP leads to a a vertically deeper cloud which results in a higher cloud top re under the adiabaticity assumption. At stronger surface wind speeds, there is more evaporation at the ocean surface and a consequent increase in surface moisture flux. This leads to a moist marine boundary layer, a lower cloud base, and the formation of thicker clouds with a larger LWP (Chen et al., 2011). Therefore, increased low-level horizontal wind speeds can enhance the emission of fine sea salt and giant CCNs while at the same time evaporating and transporting more moisture into clouds. This makes the wind speed (ws) a major driver of cloud change over the ocean through multiple pathways (Fig. 3). It is vital to distinguish between these two causal pathways (ws–Nd–re versus ws–LWP–re) and extract the “fingerprints” of these different processes to ensure accurate assessments of the climate response to anthropogenic aerosol changes.
Current observational studies are based on instantaneous satellite imagery. Recent observational assessments of the combined effects of FSS and CMA on cloud re and warm rain (Liu et al., 2022), and cloud radiative effects (Liu et al., 2025) used instantaneous measures of the LWP, fixed to separate the combined effects of meteorological factors. However, studies including the evolution of nocturnal clouds over 12 h (model studies; Hoffmann et al., 2020; Glassmeier et al., 2021) and short timescales (day time observations; Gryspeerdt et al., 2022a) reveal that the LWP can evolve differently based on the initial Nd perturbation. The impacts of Nd on LWP are not accurately captured by instantaneous measurements (Arola et al., 2022; Zhang et al., 2024). Temporal evolution of cloud properties provides a separate pathway to isolate aerosol impact on cloud (Meskhidze et al., 2009; Glassmeier et al., 2021; Gryspeerdt et al., 2021, 2022a; Fons et al., 2023), removes any reliance on predetermined/instantaneous and possibly confounded (by meteorological and other cloud controlling factors) Nd–LWP relationships, and ensures the accuracy of interpreted causal relationships (Zhang et al., 2024).
This work measures the impact of different processes on the evolution of re over short time scales using a variety of observational data sets. A new framework is introduced to identify the role of different cloud processes in observations of cloud evolution. By assessing the impact of different meteorological properties on cloud evolution over a three hour time period, this framework isolates the individual fingerprints of fine and coarse sea salt, and surface fluxes, on LWP and Nd changes. The analysis highlights the importance of the initial/background state of the cloud in the temporal evolution of its macrophysical and microphysical properties. Non-aerosol processes have a more effective role in controlling the production of larger cloud droplets whereas coarse marine aerosols limit the overall impact of anthropogenic aerosols on cloud properties in very polluted conditions.
2.1 Observational and meteorological reanalysis data
The properties of the cloud field are calculated from the Moderate Resolution Imaging Spectroradiometer (MODIS) cloud retrieval (Platnick et al., 2017) onboard both the Aqua and Terra satellites over the 10-year period 2007–2017 (inclusive). The Terra and Aqua satellites provide information about cloud properties 3 h apart from the two daytime overpasses. The cloud Nd and LWP is derived from the values of re and the cloud optical depth τ from the 2.1 µm retrievals (Quaas et al., 2006; Grosvenor et al., 2018). The cloud Nd is calculated following the sampling criteria in Grosvenor et al. (2018), and sampling strategy G18 in Gryspeerdt et al. (2022b). Only single-layered, liquid-phase clouds are considered. This strategy also excludes pixels with solar zenith > 65° and satellite zenith angle > 55° to account for uncertainties at high viewing angles. An adiabatic cloud is assumed for all the selected pixels. The LWP is calculated using all available liquid pixels. These data are then aggregated to a 1° × 1° latitude-longitude grid.
Following Gryspeerdt et al. (2021), boundary layer winds are used to account for advection between the observation times of the different instruments, restricting analysis to grid boxes where Nd and LWP are available for both instruments. The cloud field is advected using ERA5 reanalysis wind fields at 1000 hPa. The advection is calculated on a 0.25° × 0.25° resolution grid (as the movement of the cloud fields over 3h is expected to be less than 1°). Each grid box on the fine resolution grid is treated as a parcel trajectory and advected using the wind fields. The Aqua data are then sampled at the end points of these trajectories, and aggregated to a 1° × 1° grid.
Surface wind speeds are obtained from ERA5, reanalysis product (on a 1° × 1° grid) that offer an estimate of global atmospheric conditions that are collocated with the MODIS observations (Hersbach et al., 2023). Precipitating and not-precipitating cases are differentiated using the probability of precipitation (PoP) at each MODIS grid point, based on the proportion of liquid re retrievals greater than 15 µm (Rosenfeld et al., 2002). This is calculated from the MODIS level 3 daily gridded product (MOD08_D3) using the re histogram counts. The PoP is the ratio of small drops (sum of all histogram bins less than 15 µm) to all drops in the distribution/histogram (sum of all bins). If PoP > 70 %, then the gridbox is considered to be precipitating. The results in Sect. 3.1 and 3.2 are from a region within the southeastern Atlantic stratocumulus deck between 40° S to 10° N and 30° W to 10° E.
2.2 Difference of rates (DoR)
The temporal evolution of the Nd and LWP ( and respectively), is obtained by calculating the difference in properties between the two daytime satellite overpasses, which are approximately 3 h apart – at 10:30 and 13:30 local solar time for Terra and Aqua respectively. Joint histograms in the Nd–LWP space are then generated by binning the cloud data as a function of their initial Nd and LWP (Gryspeerdt et al., 2022a). These are then converted to relative rates of changes by dividing the differences first with the bin widths (Nd bins for dNd, and the LWP bins for dLWP), and then with the time step of 3 h (time difference between Aqua and Terra observations). The final result is expressed as a percentage with units of (% per hour) by multiplying with 100.
By strictly controlling the initial state of the cloud, we account for the confounding impact of existing meteorological variables which can change the properties of aerosol and the cloud simultaneously, and could introduce spurious correlations on the development of Nd-LWP relationships. If the clouds are advected across regions with a large gradient in meteorological properties, this would result in a large change in the cloud properties owing to how correlated the cloud is to a strong climatological change. Clouds with a high (low) initial value of LWP or Nd is likely to show a decrease (increase) in LWP or Nd, which is consistent with a “regression to the mean” effect. This can happen as a statistical effect, where even when the cloud is remaining stationary, a positively biased first measurement (of re) is followed by a smaller second measurement. Since re is positively correlated with LWP and negatively correlated with Nd, this shows up as a highly negative dLWP and a large positive dNd. Previous studies (Eastman et al., 2016; Eastman and Wood, 2016) accounted for this by looking at anomalous changes across Lagrangian trajectories by removing seasonal means for day and night separately. On the other hand, it was shown by Gryspeerdt et al. (2021) (where dLWP and dNd were calculated in a similar way from MODIS Terra and Aqua) that the “flowfields” (the rate of change of Nd and LWP) do not look the same when dLWP and dNd are binned by the final LWP and Nd. If there was indeed a regression to the mean effect, the flowfields should have looked the same when calculated from either direction. As stated in Gryspeerdt et al. (2021), while this does not completely rule out the impact of retrieval biases and the regression to the mean effect, it does rule out the possiblity of the results being a statistical artefact caused by random biases.
Here, the difference-of-rates (DoR) method is introduced which accounts for these effects. The relative rates of change (in % per hour) are calculated by separating or stratifying the cloud population based on a cloud/meteorological variable (such as surface (10 m) wind speeds, ws), and calculating the differences with respect to a reference data set. For example, in Fig. 2, the DoR (presented herewith with a symbol Δ) with respect to ws is calculated as
where > 4 m s−1 and < 4 m s−1. Here, the cloud population with is the reference data set. Multiple DoRs can be calculated by splitting into smaller bins/data ranges (different columns in Fig. 2).
3.1 The precipitation fingerprint
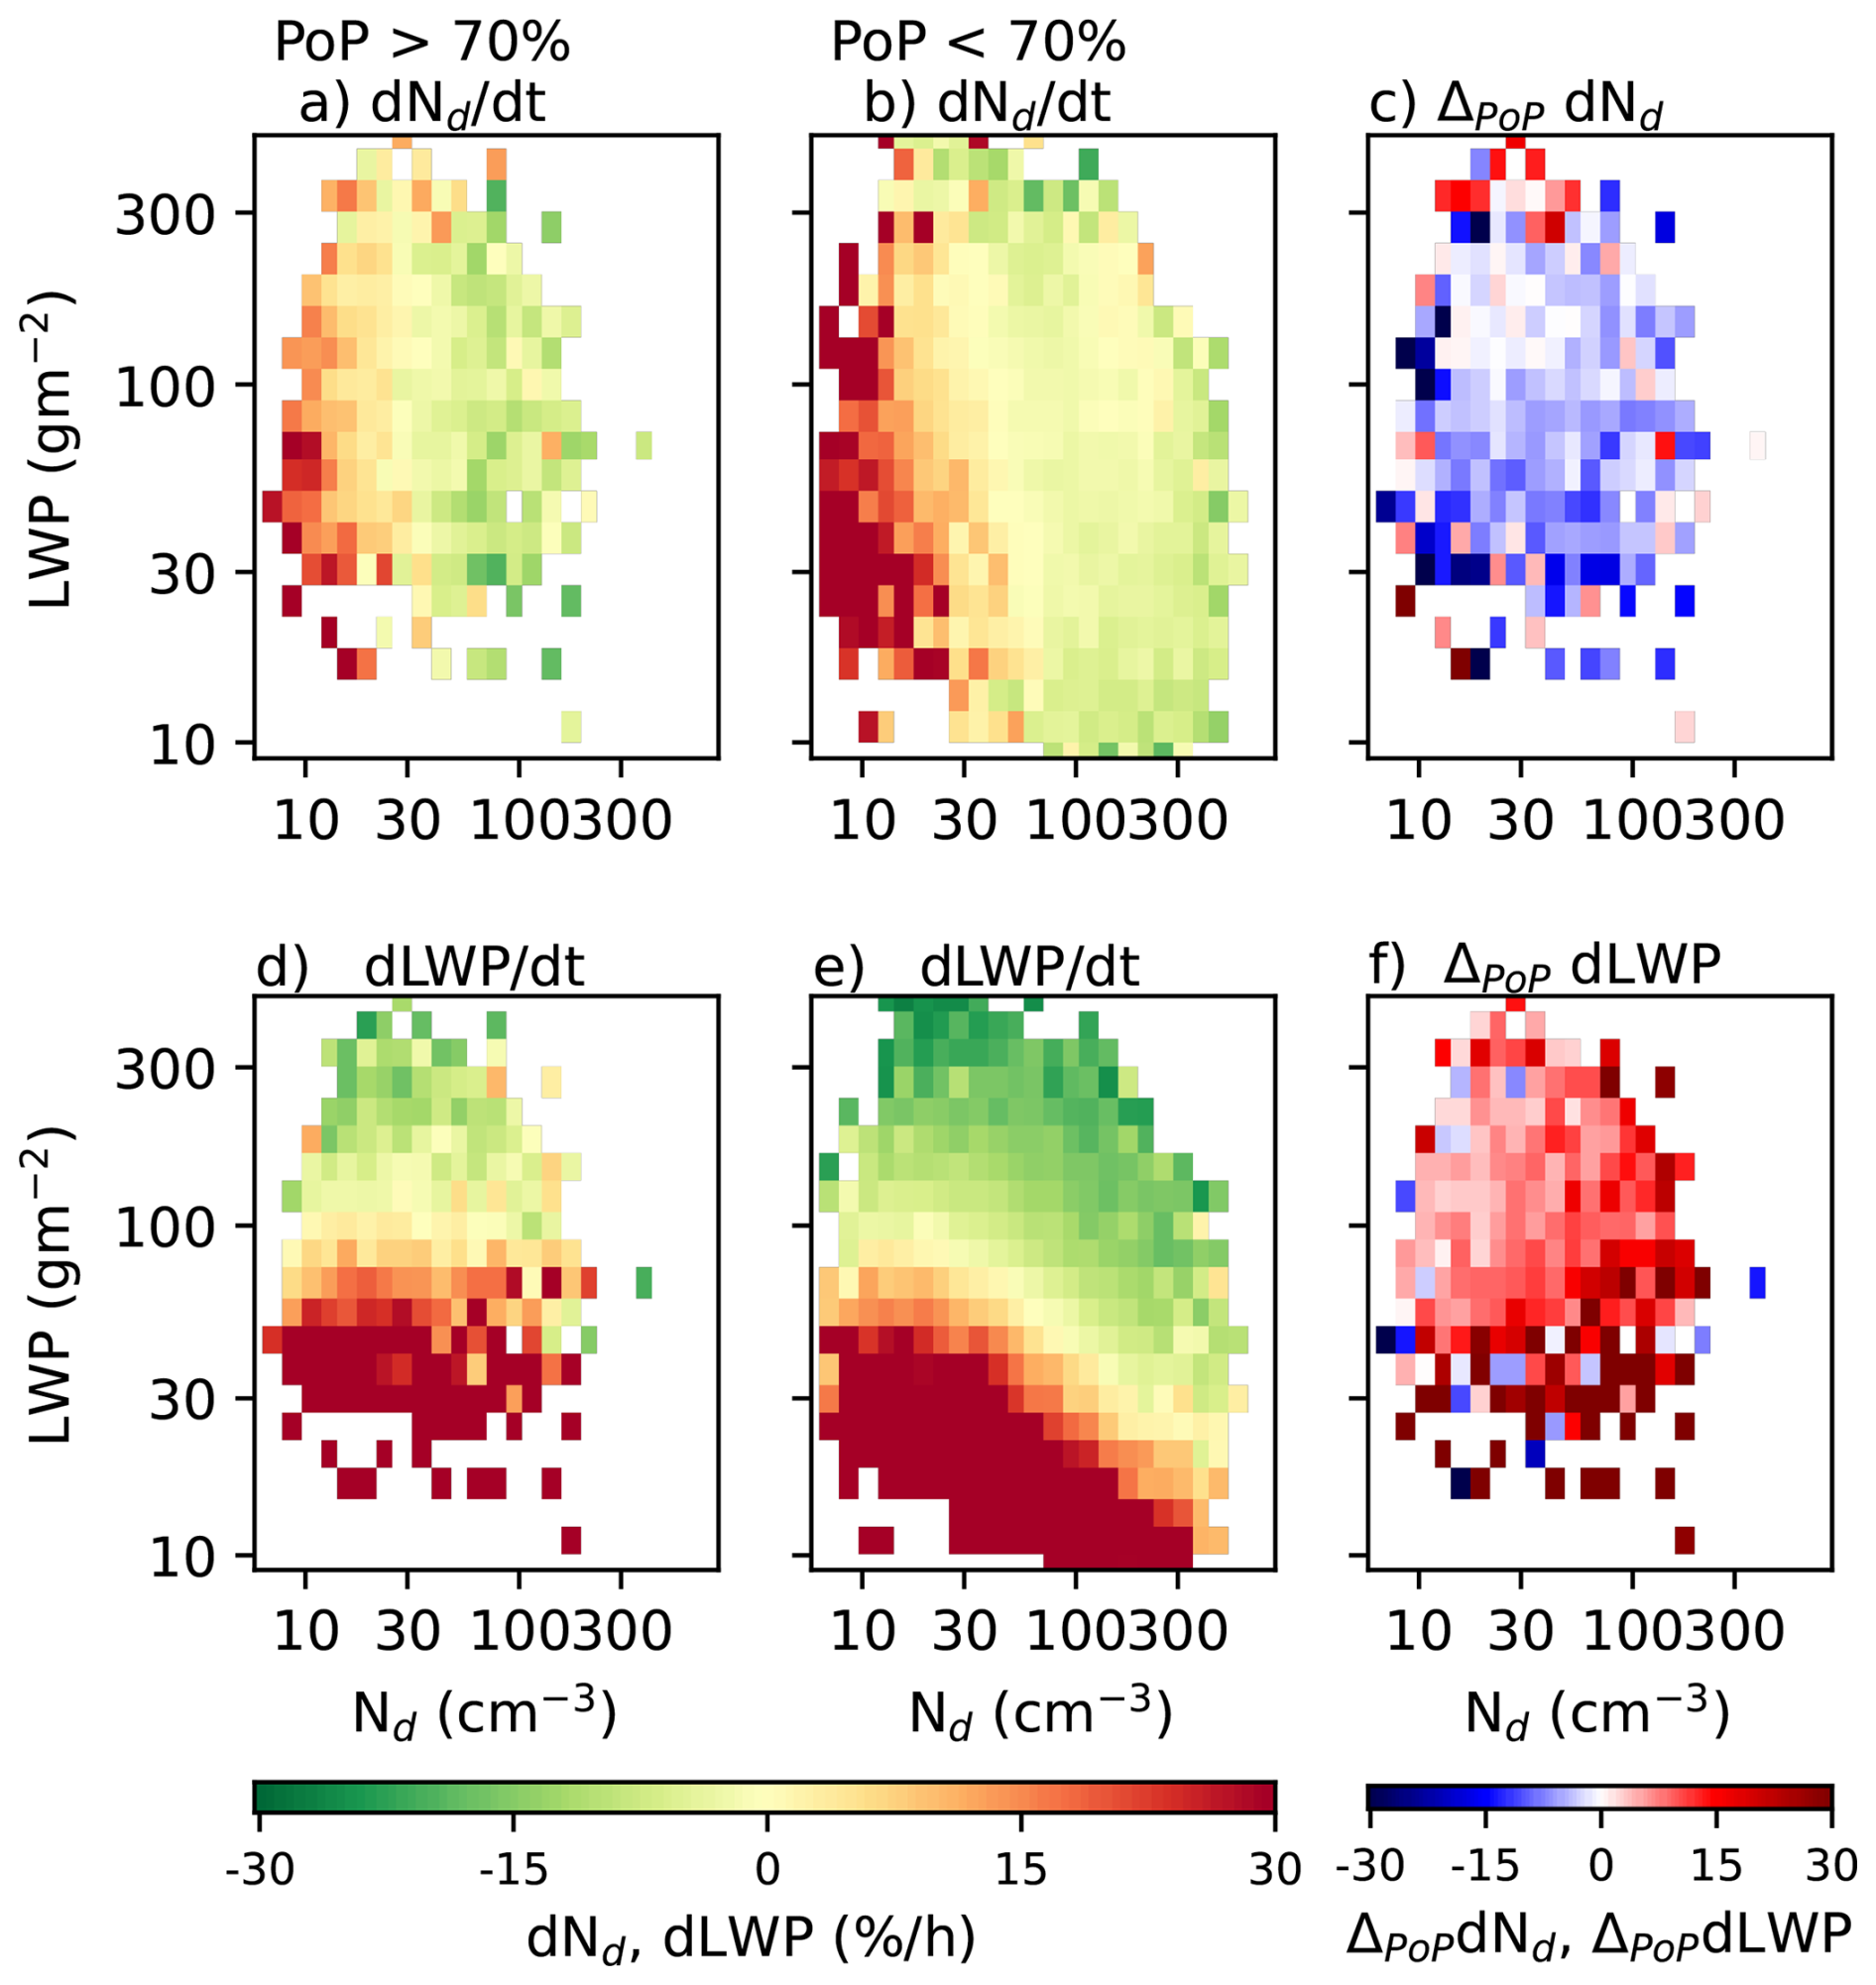
In addition to acting as a sink for the cloud Nd through the sedimentation of droplets, precipitation plays a key role in the scavenging of CCN (wet or below-cloud scavenging), which in turn can reduce Nd. The effects of precipitation are usually seen primarily in the (upper) left quadrant (LWP > 50 g m−2, Nd<50 cm−3), i.e., for clouds with a high initial LWP and a low Nd. An overall positive change is seen in the dNd field in this region for both precipitating and non-precipitating clouds (red region in Fig. 1a, b), which is possibly a regression to the mean effect (discussed in the next paragraph). In addition to precipitation, other processes such as the primary production of CCN from sea spray, and entrainment of aerosols from the free troposphere (especially closer to the coast) can possibly act as significant sources of Nd for clouds with an initially low Nd. However, precipitation rates as low as 1 mm d−1 have been shown to be effective in reducing Nd by a factor of three over the SE Pacific (Wood et al., 2012). The DoRs between precipitating and not-precipitating clouds (Fig. 1c) reveal that precipitation acts as a sink for the cloud Nd, with a reduction of Nd observed in more strongly precipitating cases. Precipitation results in a smaller overall net increase in dNd (i.e., the change in Nd over 3 h) with Fig. 1a showing lighter reds and darker greens. There is a smaller decrease (larger increase) in dNd for not-precipitating clouds in Fig. 1b (darker reds and lighter greens). Consequently, the corresponding DoR, ΔPoPdNd (difference between Fig. 1a and b, i.e., a − b), is negative (Fig. 1c).
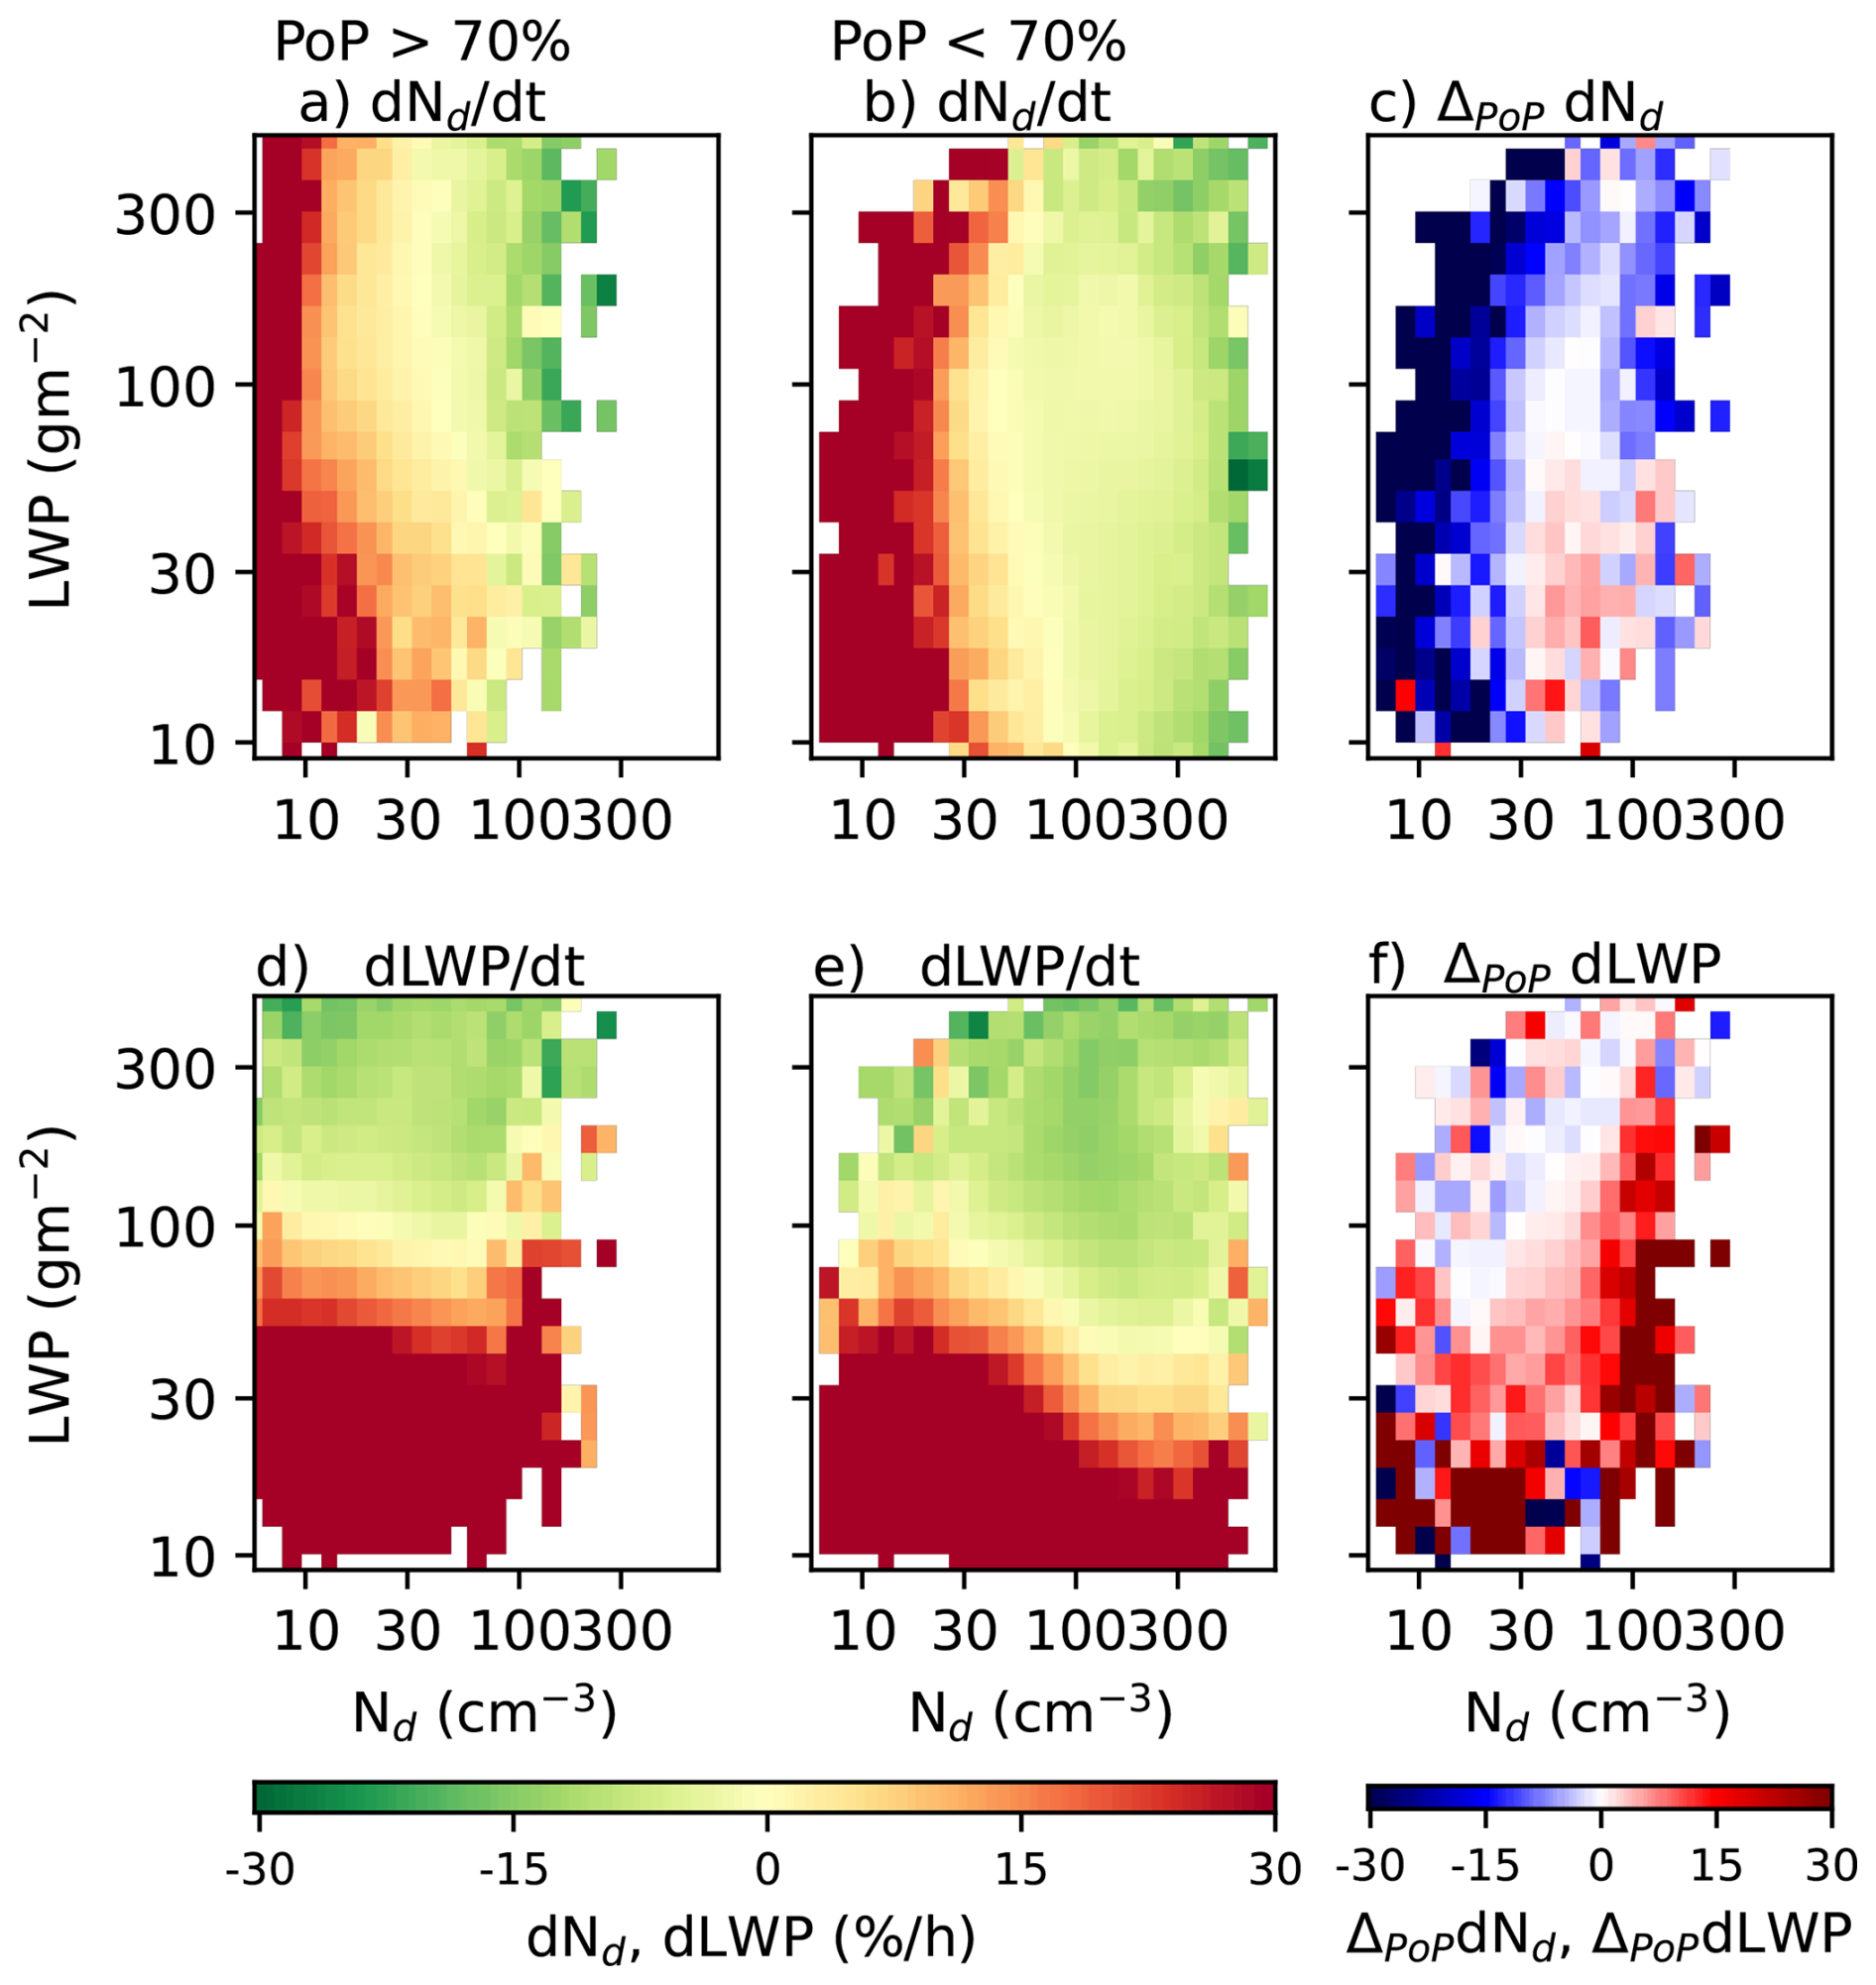
Figure 1The effect of precipitation on (a, b) and (d, e). (a) for precipitating clouds(PoP > 70 %), (b) for not-precipitating clouds (PoP < 70 %), (c) ΔPoPdNd, the difference between panels (a) and (b), (d) for precipitating clouds (PoP > 70 %), (e) for not-precipitating clouds (PoP < 70 %), (f) ΔPoPLWP= panels (d)–(e).
The few positive values (red) in the DoR field in Fig. 1c are possibly not-precipitating clouds which were not filtered out using the re threshold. The positive and negative regions in Fig. 1a and b may be partly driven by the regression to the mean effect by using a filter in re, which is also used to calculate Nd and LWP. Similar patterns were obtained as in the Fig. 1a–c when an independent data source (Eastman et al., 2019) for precipitation was used Appendix A). The MODIS filters were subsequently chosen to identify precipitating clouds for the rest of the analysis. Using re as a measure of precipitation allows the precipitation data at the start of the time step to be included, such that the impact of precipitation on the cloud evolution is identified (rather than the impact of cloud evolution on precipitation, as is obtained using precipitation from the later overpass at the end of the timestep).
Droplet sedimentation at the cloud-top entrainment interfacial layer (EIL) depletes liquid water from this zone, leading to reduced entrainment and thicker clouds (high LWP) (Ackerman et al., 2004; Bretherton et al., 2007). In precipitating clouds the re is generally higher leading to droplets sedimenting out of the EIL. Conversely, in not-precipitating clouds, the re is smaller, and there are more, smaller cloud droplets in the entrainment interfacial layer at the cloud top. This leads to evaporative enhancement of entrainment of free tropospheric air, leading to a thinner cloud layer or a higher decrease (or a smaller increase) in LWP in not-precipitating clouds compared to precipitating ones. Consequently, the DoR for LWP is positive in Fig. 1f everywhere except in the region corresponding to the strongly negative region in Fig. 1c for Nd. Here, strongly precipitating clouds lose more liquid water (as rain) resulting in a more negative (less positive) change in LWP.
3.2 Disentangling the impact of wind driven processes on cloud effective radius
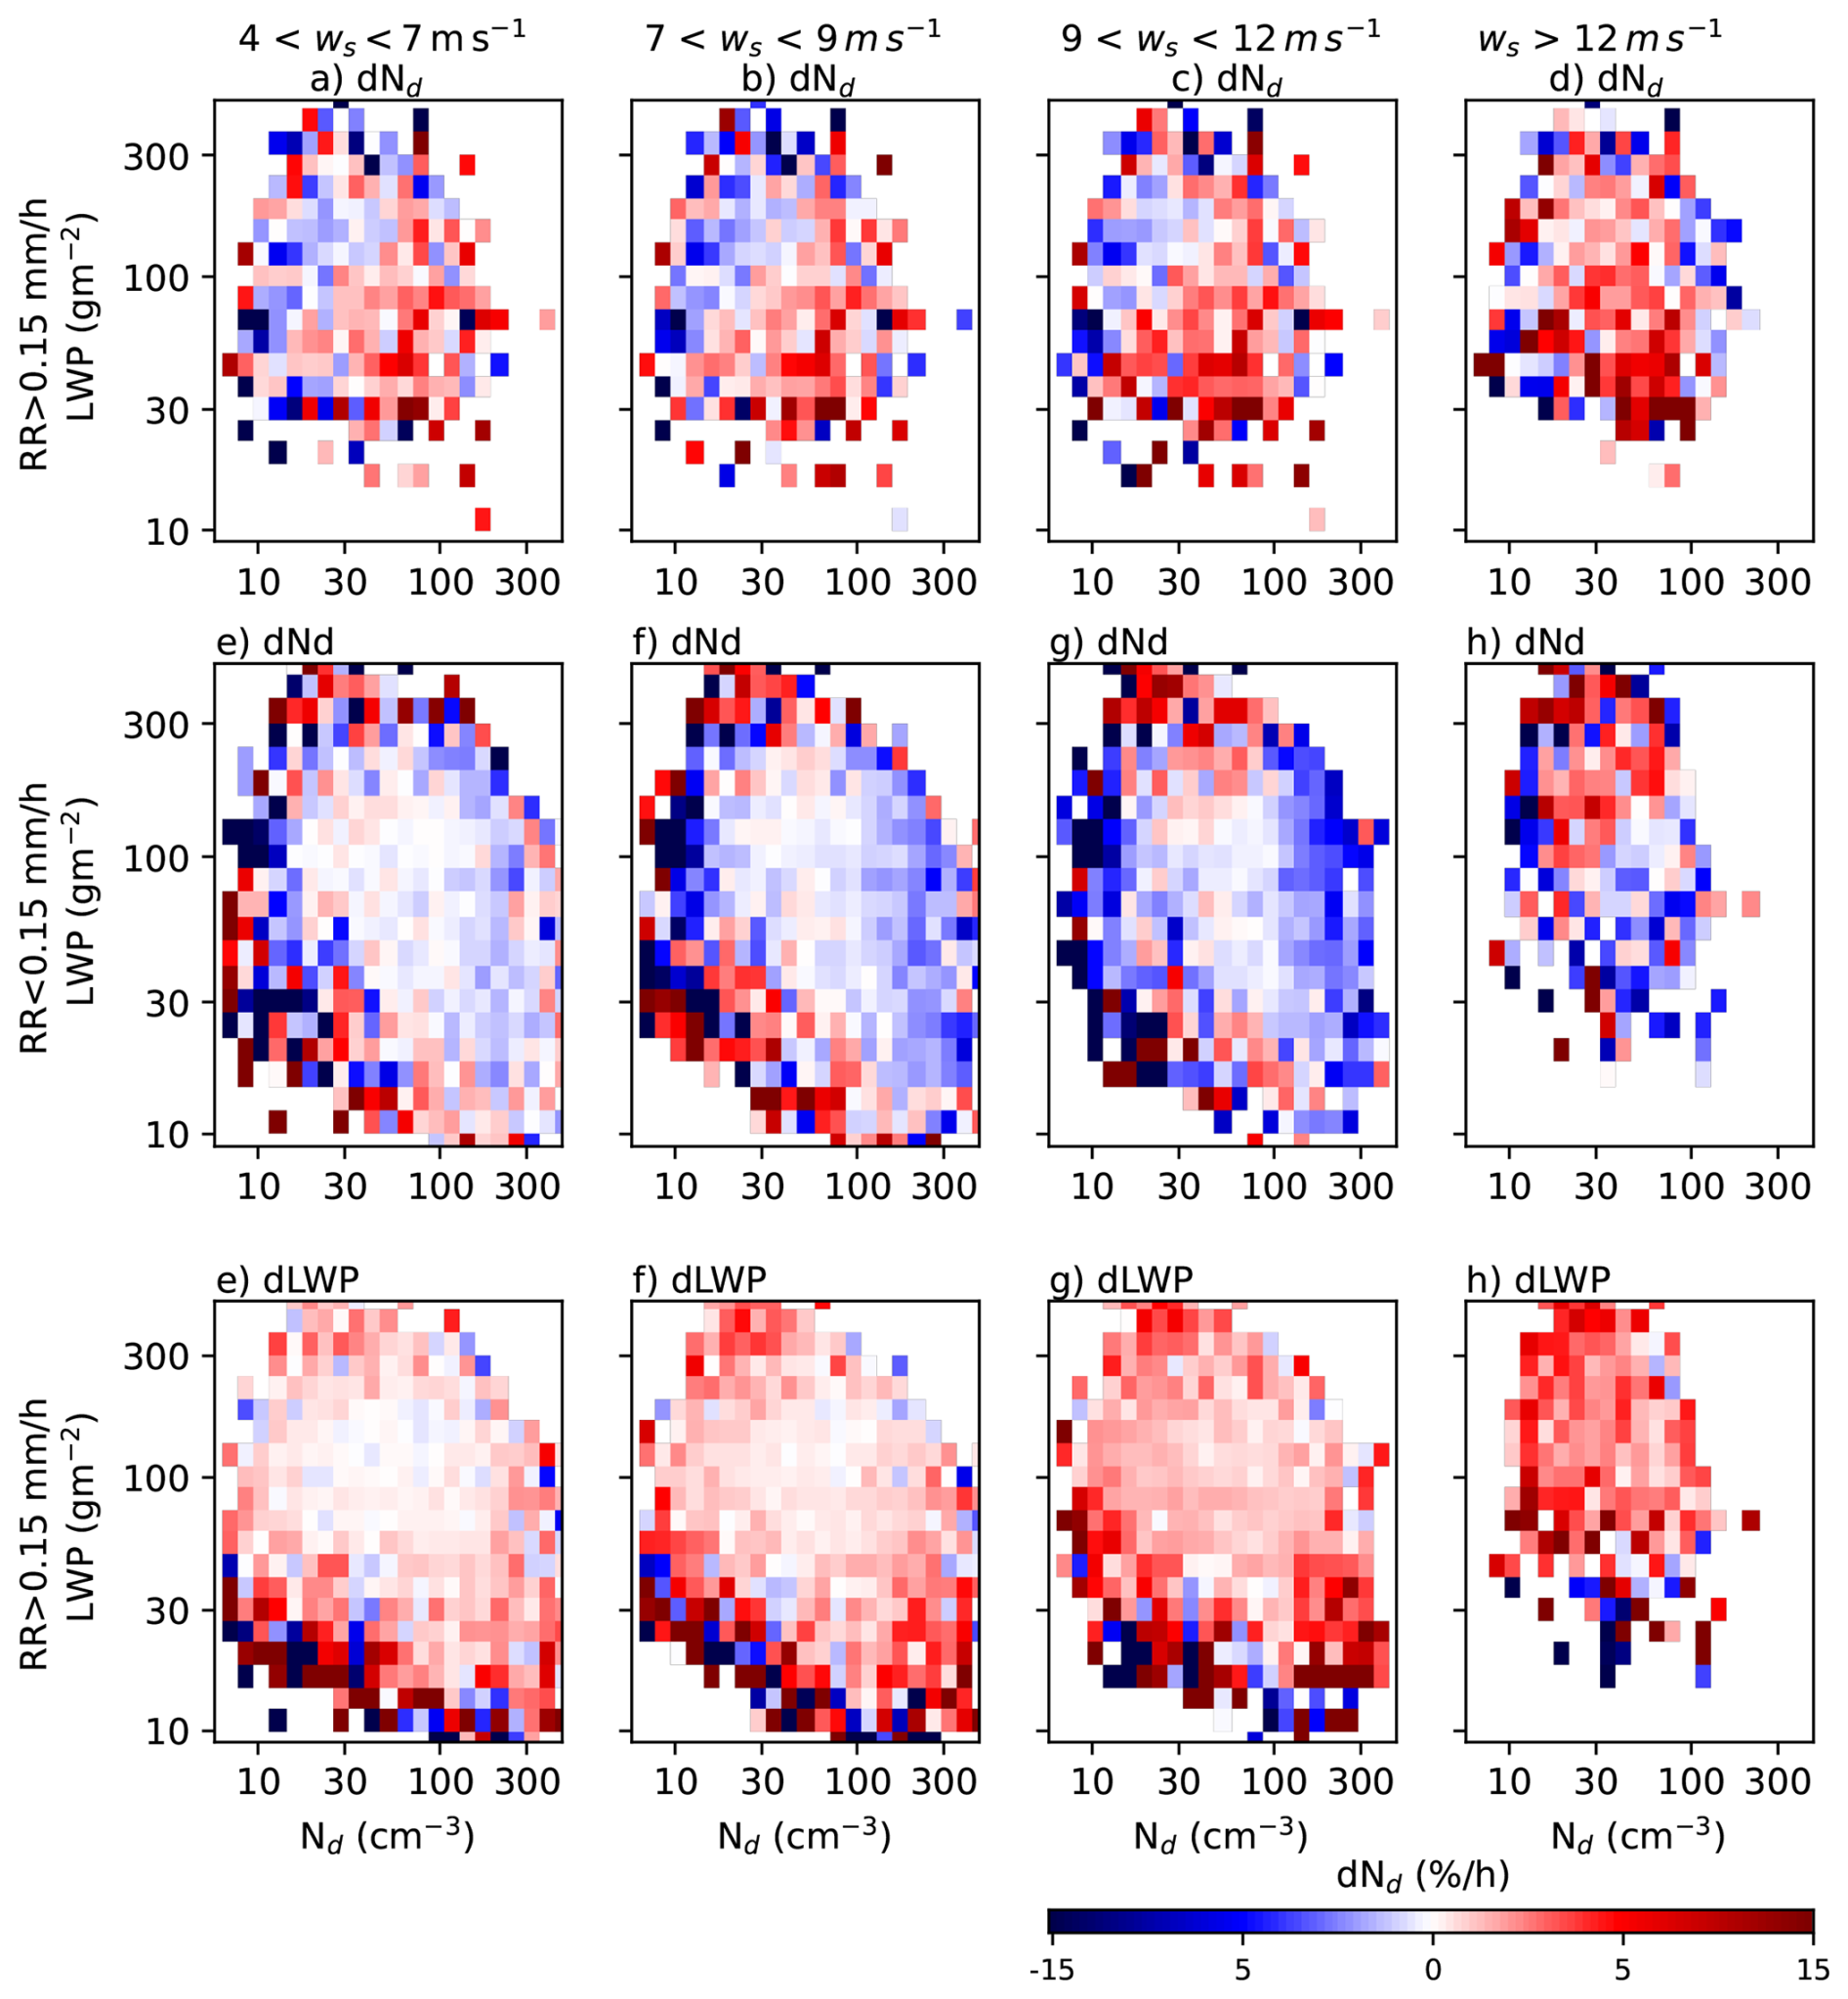
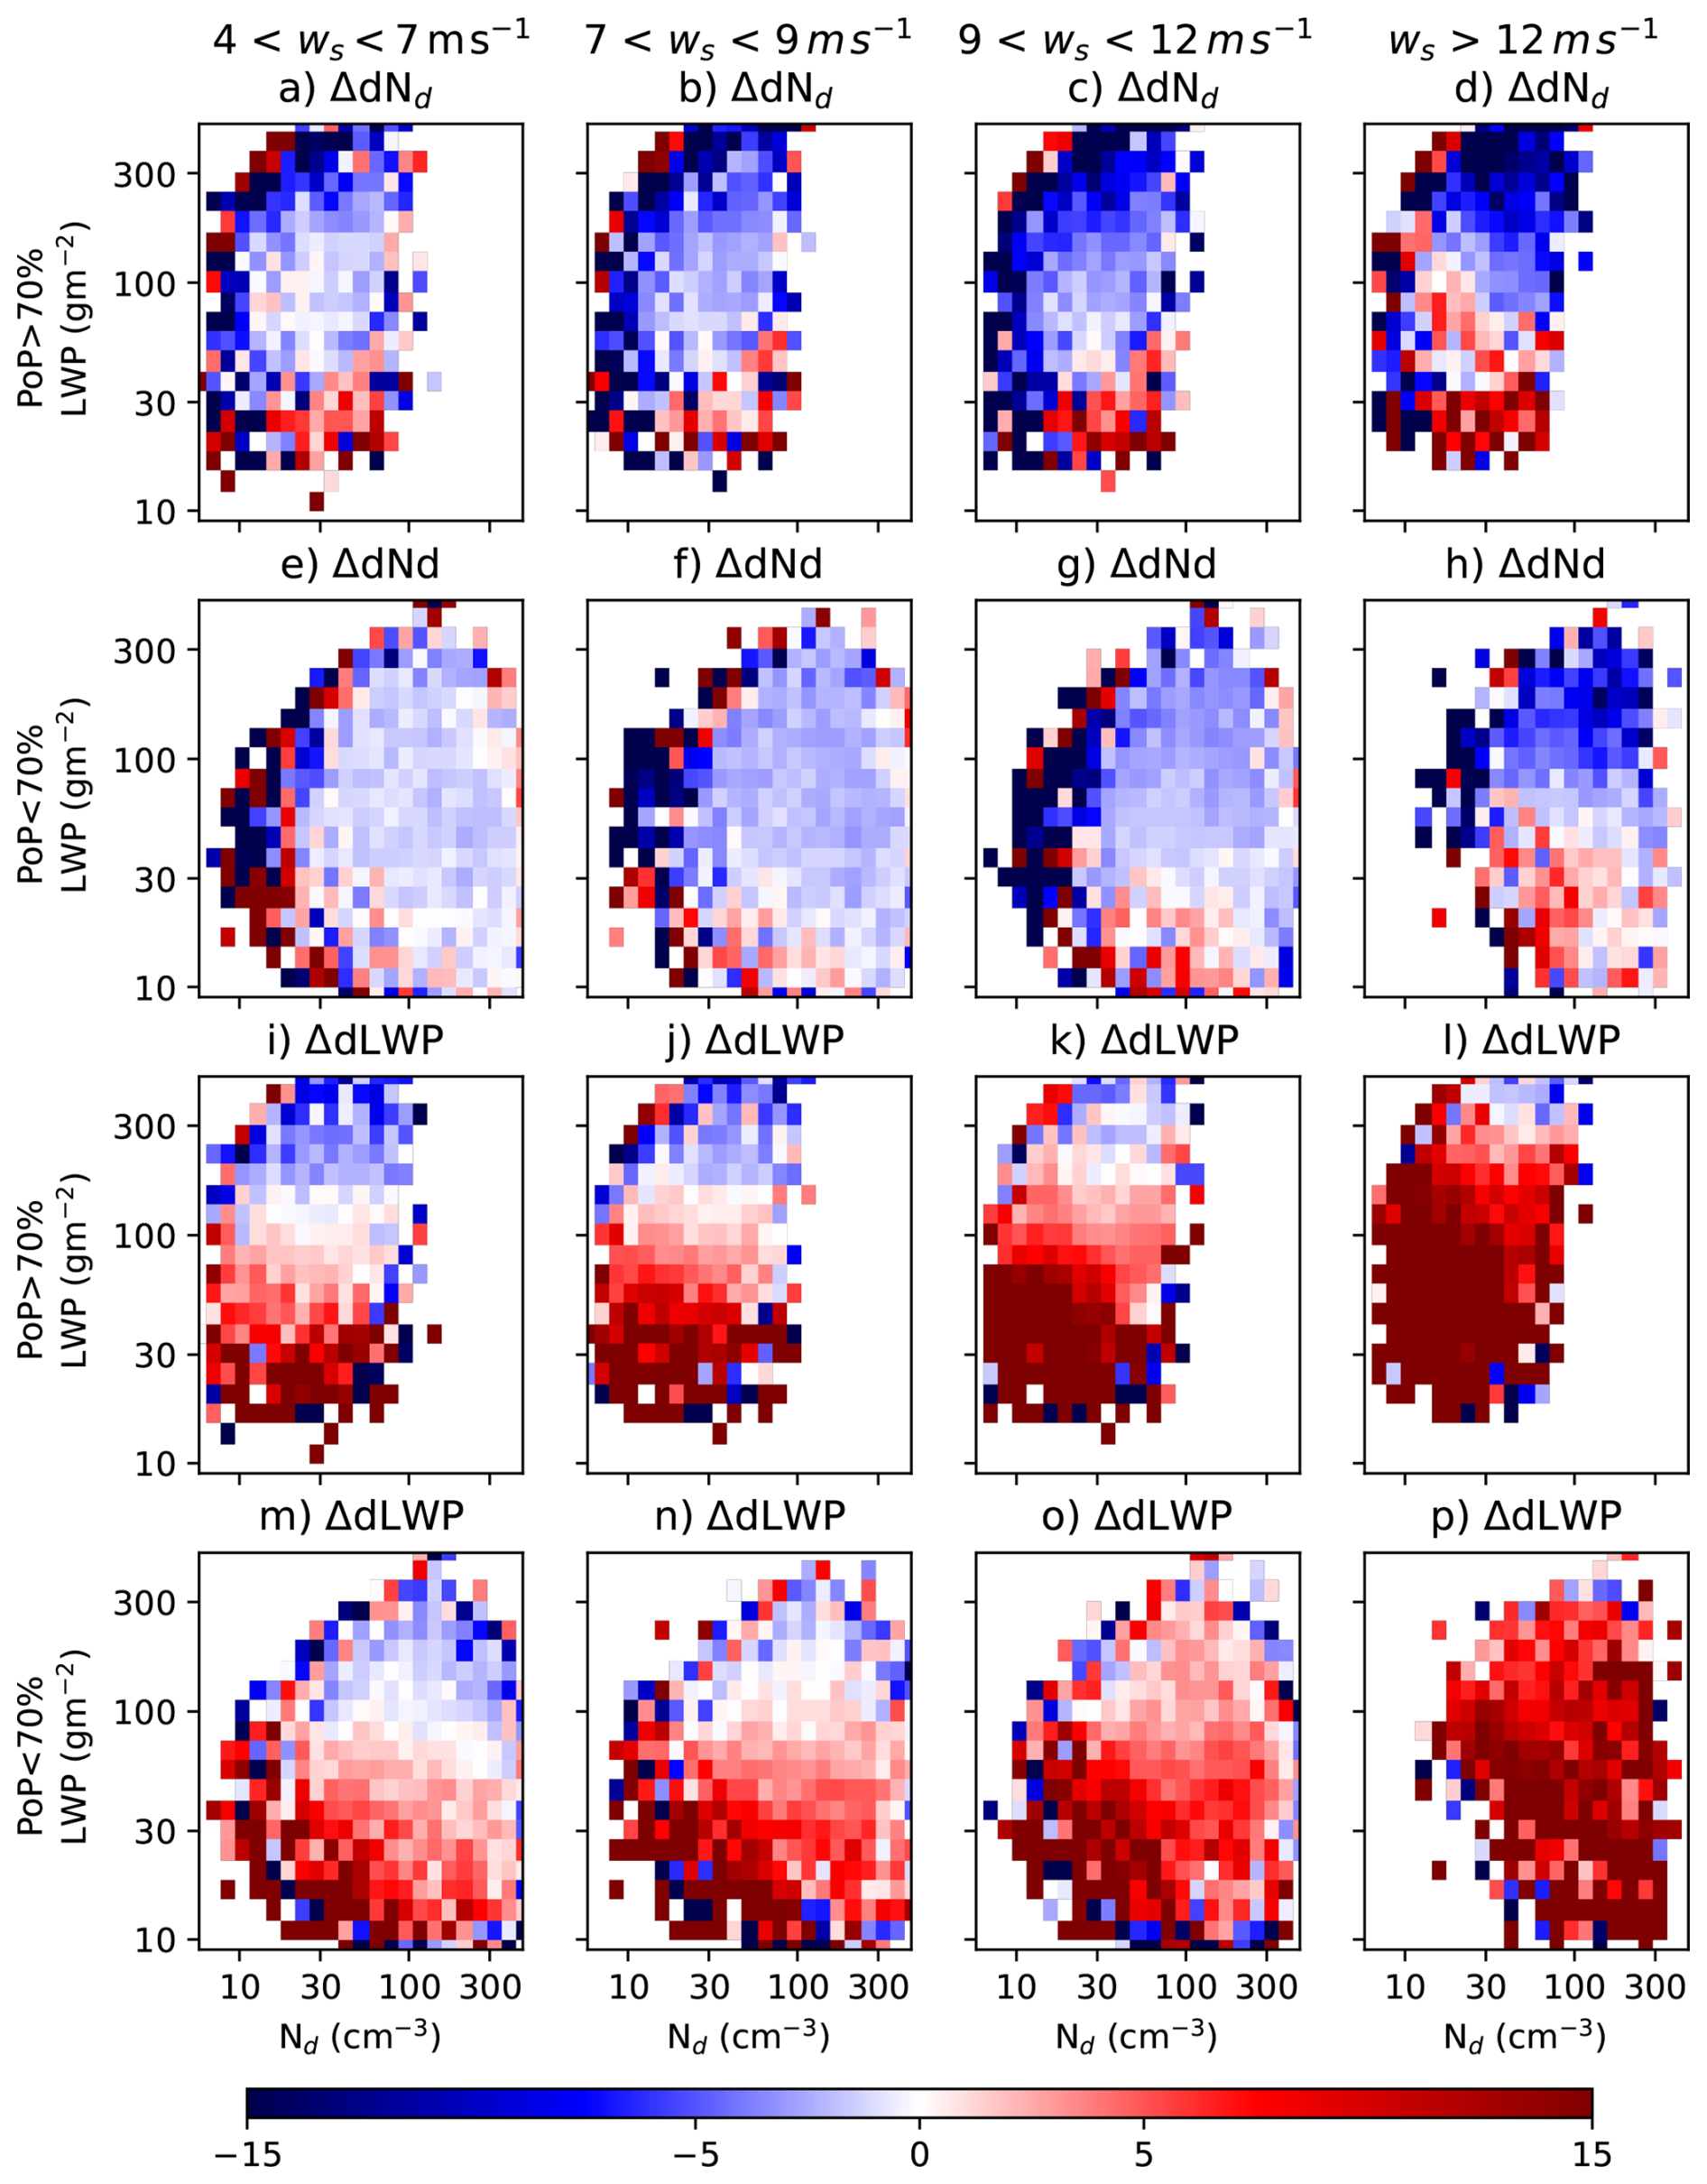
With the new framework effectively extracting the precipitation fingerprint, we apply this technique to identify the different processes that modify the re. To investigate the simultaneous effects of FSS and CMA in altering re through changes in Nd, the DoRs are calculated by stratifying the data by surface wind speeds. Horizontal low-level (10 m) winds have been shown to be strongly correlated with sea salt production (Lewis and Schwartz, 2004). In contrast to Fig. 1, all the plots in Fig. 2 are DoRs, and dLWP, calculated for different wind speed ranges and with respect to a reference dataset with ws < 4 m s−1 (as detailed in the methods section). Additionally, we treat initially precipitating and not-precipitating clouds separately as the impact of aerosol-induced precipitation suppression works differently for these two categories.
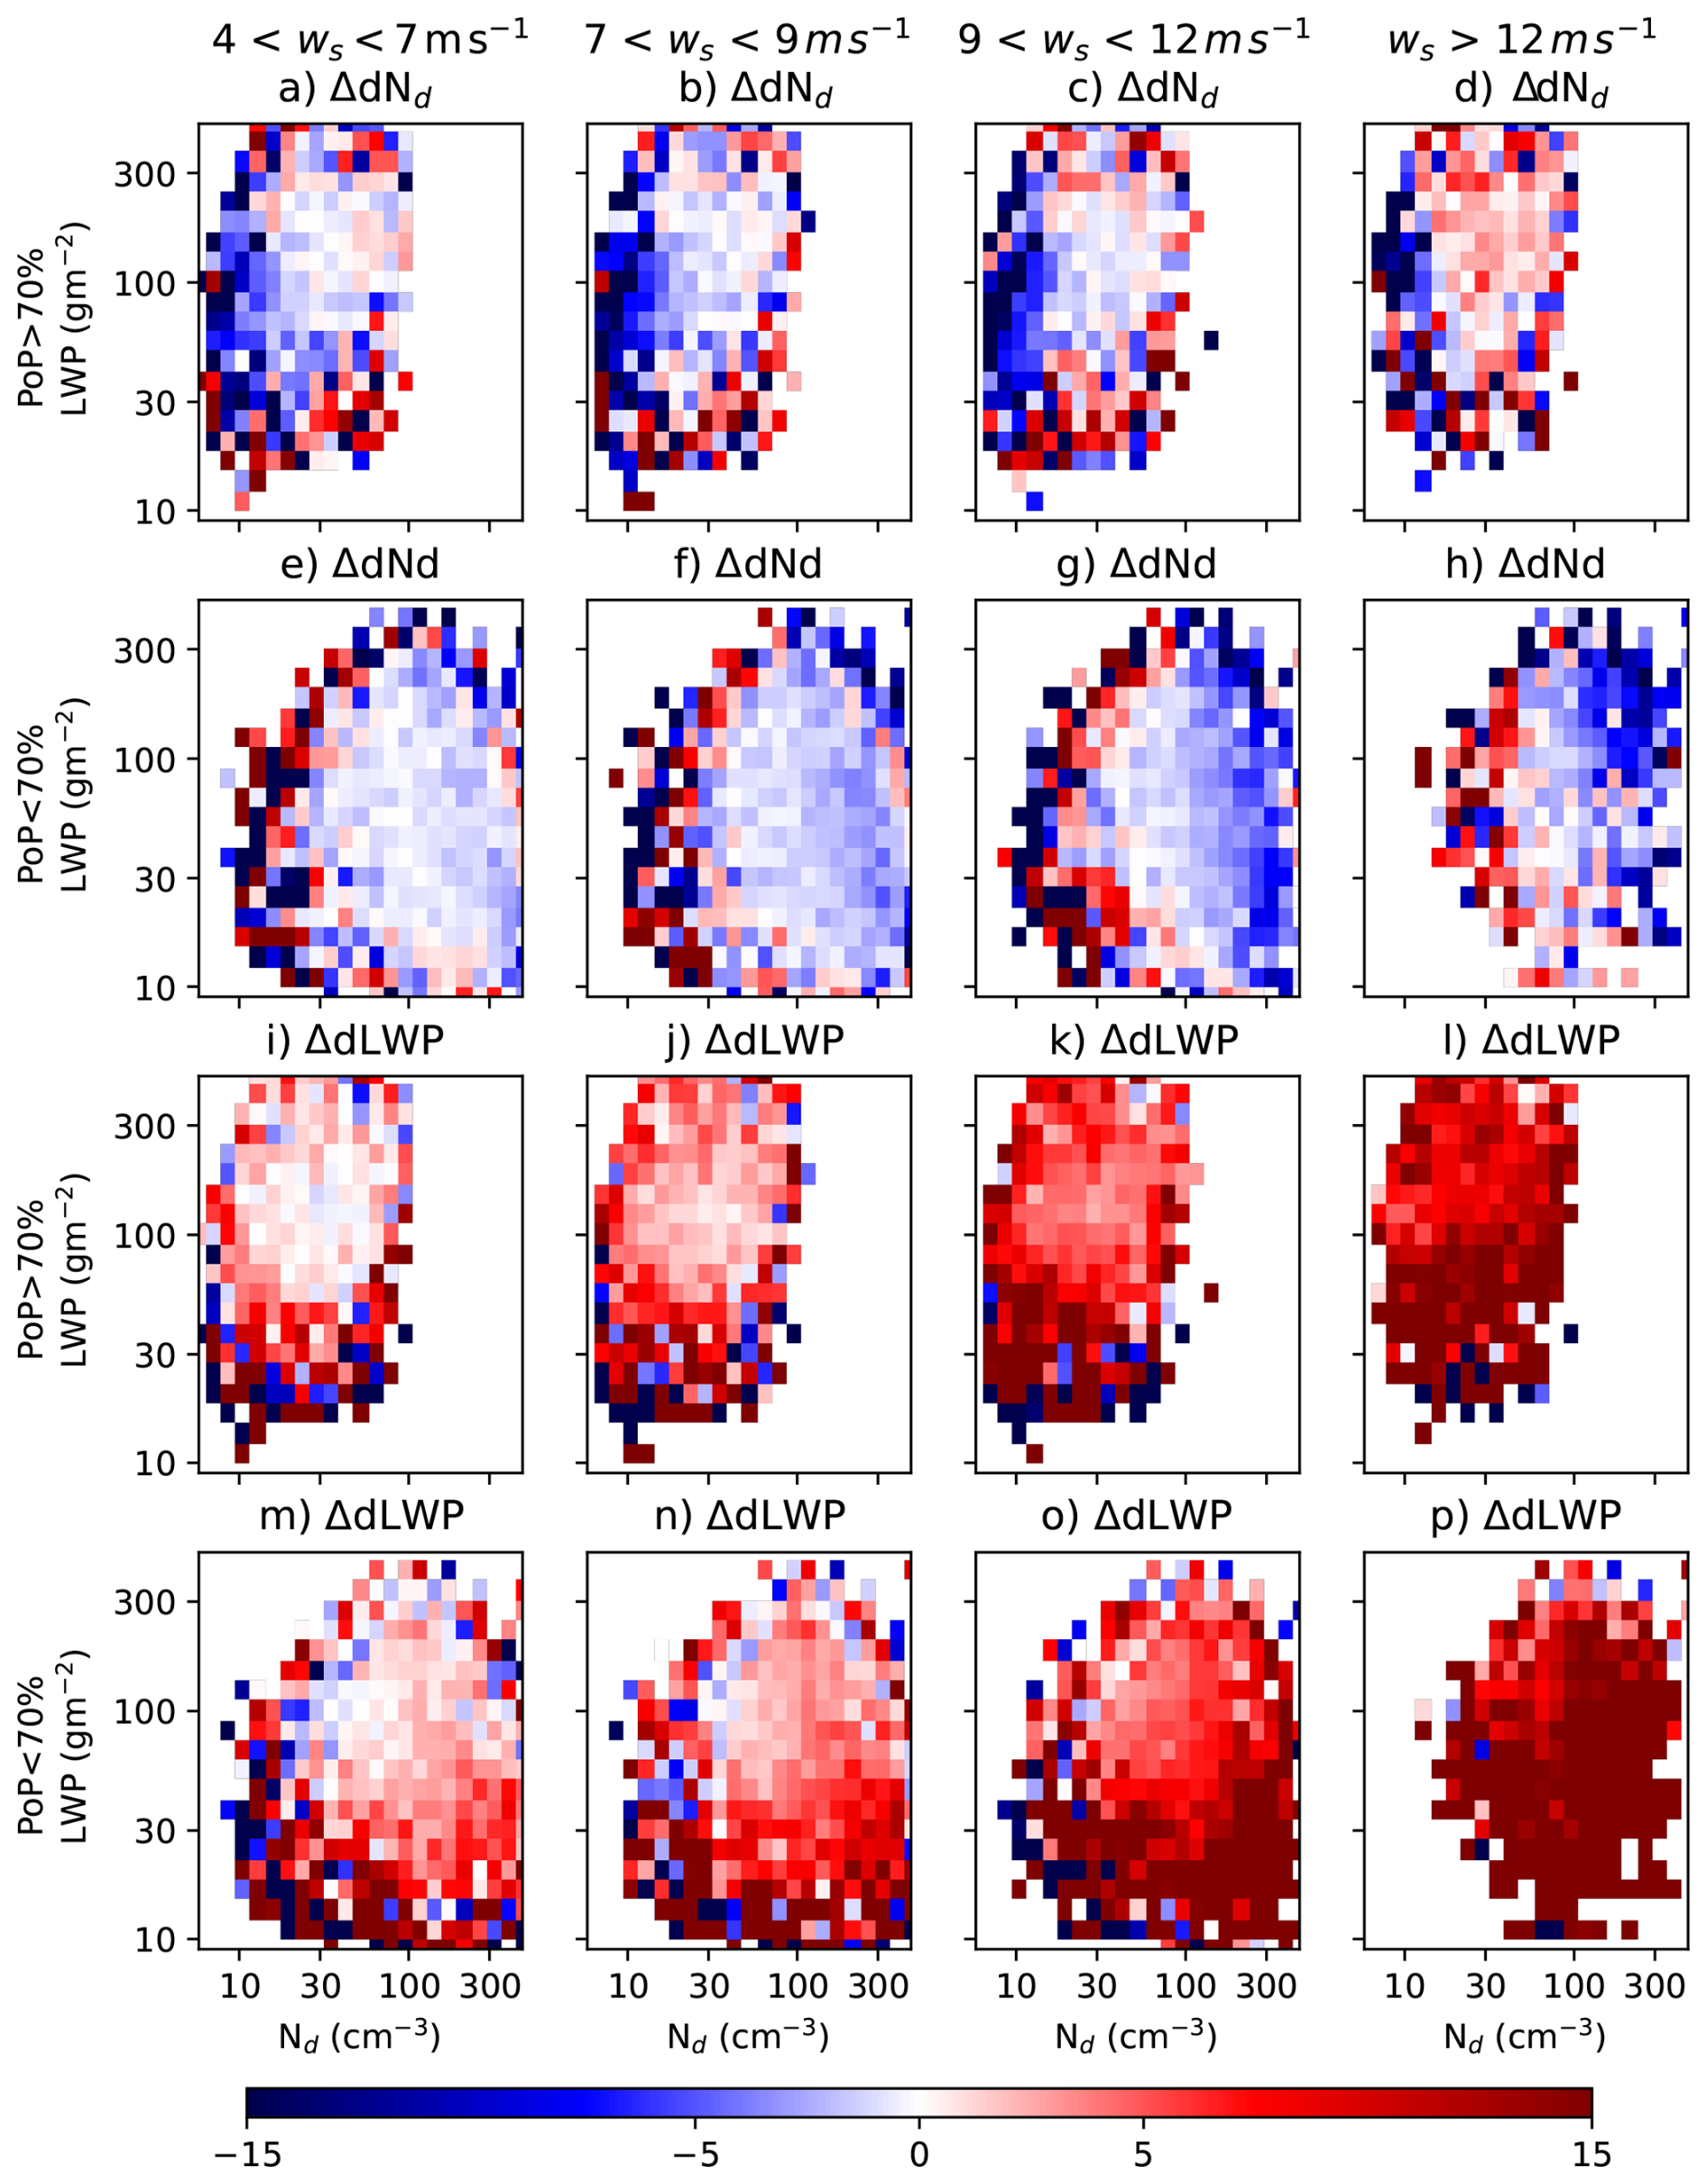
Figure 2Effect of surface wind speed on Nd and LWP. All panels show DoRs, and , where m s−1 and, (a) m s−1, (b) m s−1, (c) m s−1, (d) ws>12 m s−1 for precipitating clouds. Panels (e)–(h) are ΔdNd for not-precipitating clouds, panels (i)–(l) are ΔdLWP for precipitating clouds and panels (m)–(p) are ΔdLWP for not-precipitating clouds for similar ws ranges.
For initially precipitating clouds, precipitation suppression is expected to increase at higher ws with the introduction of additional FSS. Therefore, dNd would tend to be less (more) negative (positive) as ws increases (due to reduced in-cloud scavenging). Consequently, would be negative (blue) as seen in the left quadrant in Fig. 2a to d.
A positive fingerprint, consistent with FSS acting as CCN, strengthens with wind speed and dominates the precipitation effect at wind speeds greater than 12 m s−1 in Fig. 2d. In addition to the increased aerosol burden, high ws leads to stronger updrafts at the cloud base (Colón-Robles et al., 2006) increasing the activation of FSS and the formation of new droplets.
The effect of CMA is seen in not-precipitating clouds with a high initial Nd (> 100 cm−3) in Fig. 2e–h, with a negative trend in consistent with the results from (Feingold et al., 1999; Yin et al., 2000). The CMA are usually the first to activate and form droplets at the cloud base. This depletes the supersaturation here, thereby inhibiting the activation of FSS into smaller droplets. This skews the droplet size distribution to larger sizes, enhancing the collision-coalescence rate (Rosenfeld et al., 2002). Both processes lead to a higher re which is a key precursor to precipitation initiation.
A negative region is consistent with a giant CCN-induced reduction in dNd. In addition to fewer new activated droplets, the smaller dNd could also be due to giant CCN-induced precipitation (in initially not-precipitating clouds). Once giant CCNs are activated, condensational growth and collision-coalescence to raindrop sizes are expedited within this time scale (of 3 h). Increasing ws leads to the formation of more CMA which shows up as a stronger signal in the DoR. As expected, there is no perceptible impact of CMA on already raining clouds as drizzle is already active.
A relationship between CMA and re by altering Nd can clearly be seen. However, there is a strong positive signal in ΔdLWP across all initial Nd suggesting an alternate pathway to explain the ws–re correlation. Stronger surface winds over the ocean lead to an increase in surface fluxes through increased evaporation (Kazil et al., 2016; Eastman et al., 2022). This moistens the marine boundary layer and increases the moisture available at the cloud base. This can increase the cloud depth either by lowering the cloud base through condensation or increasing the cloud top height by entrainment (driven by buoyant production of kinetic energy in the updrafts; Kazil et al., 2016). The current methodology does not allow us to distinguish between these two effects. In addition, higher wind speeds enhance wave formation – these waves can break and produce white caps and sea spray, which enhances the sea-to-air latent heat flux. This is an additional source to the cloud LWP leading to thicker clouds with larger droplets, and corresponding larger dLWP over the observed period (Fig. 2i–l).
3.3 Geographical variability
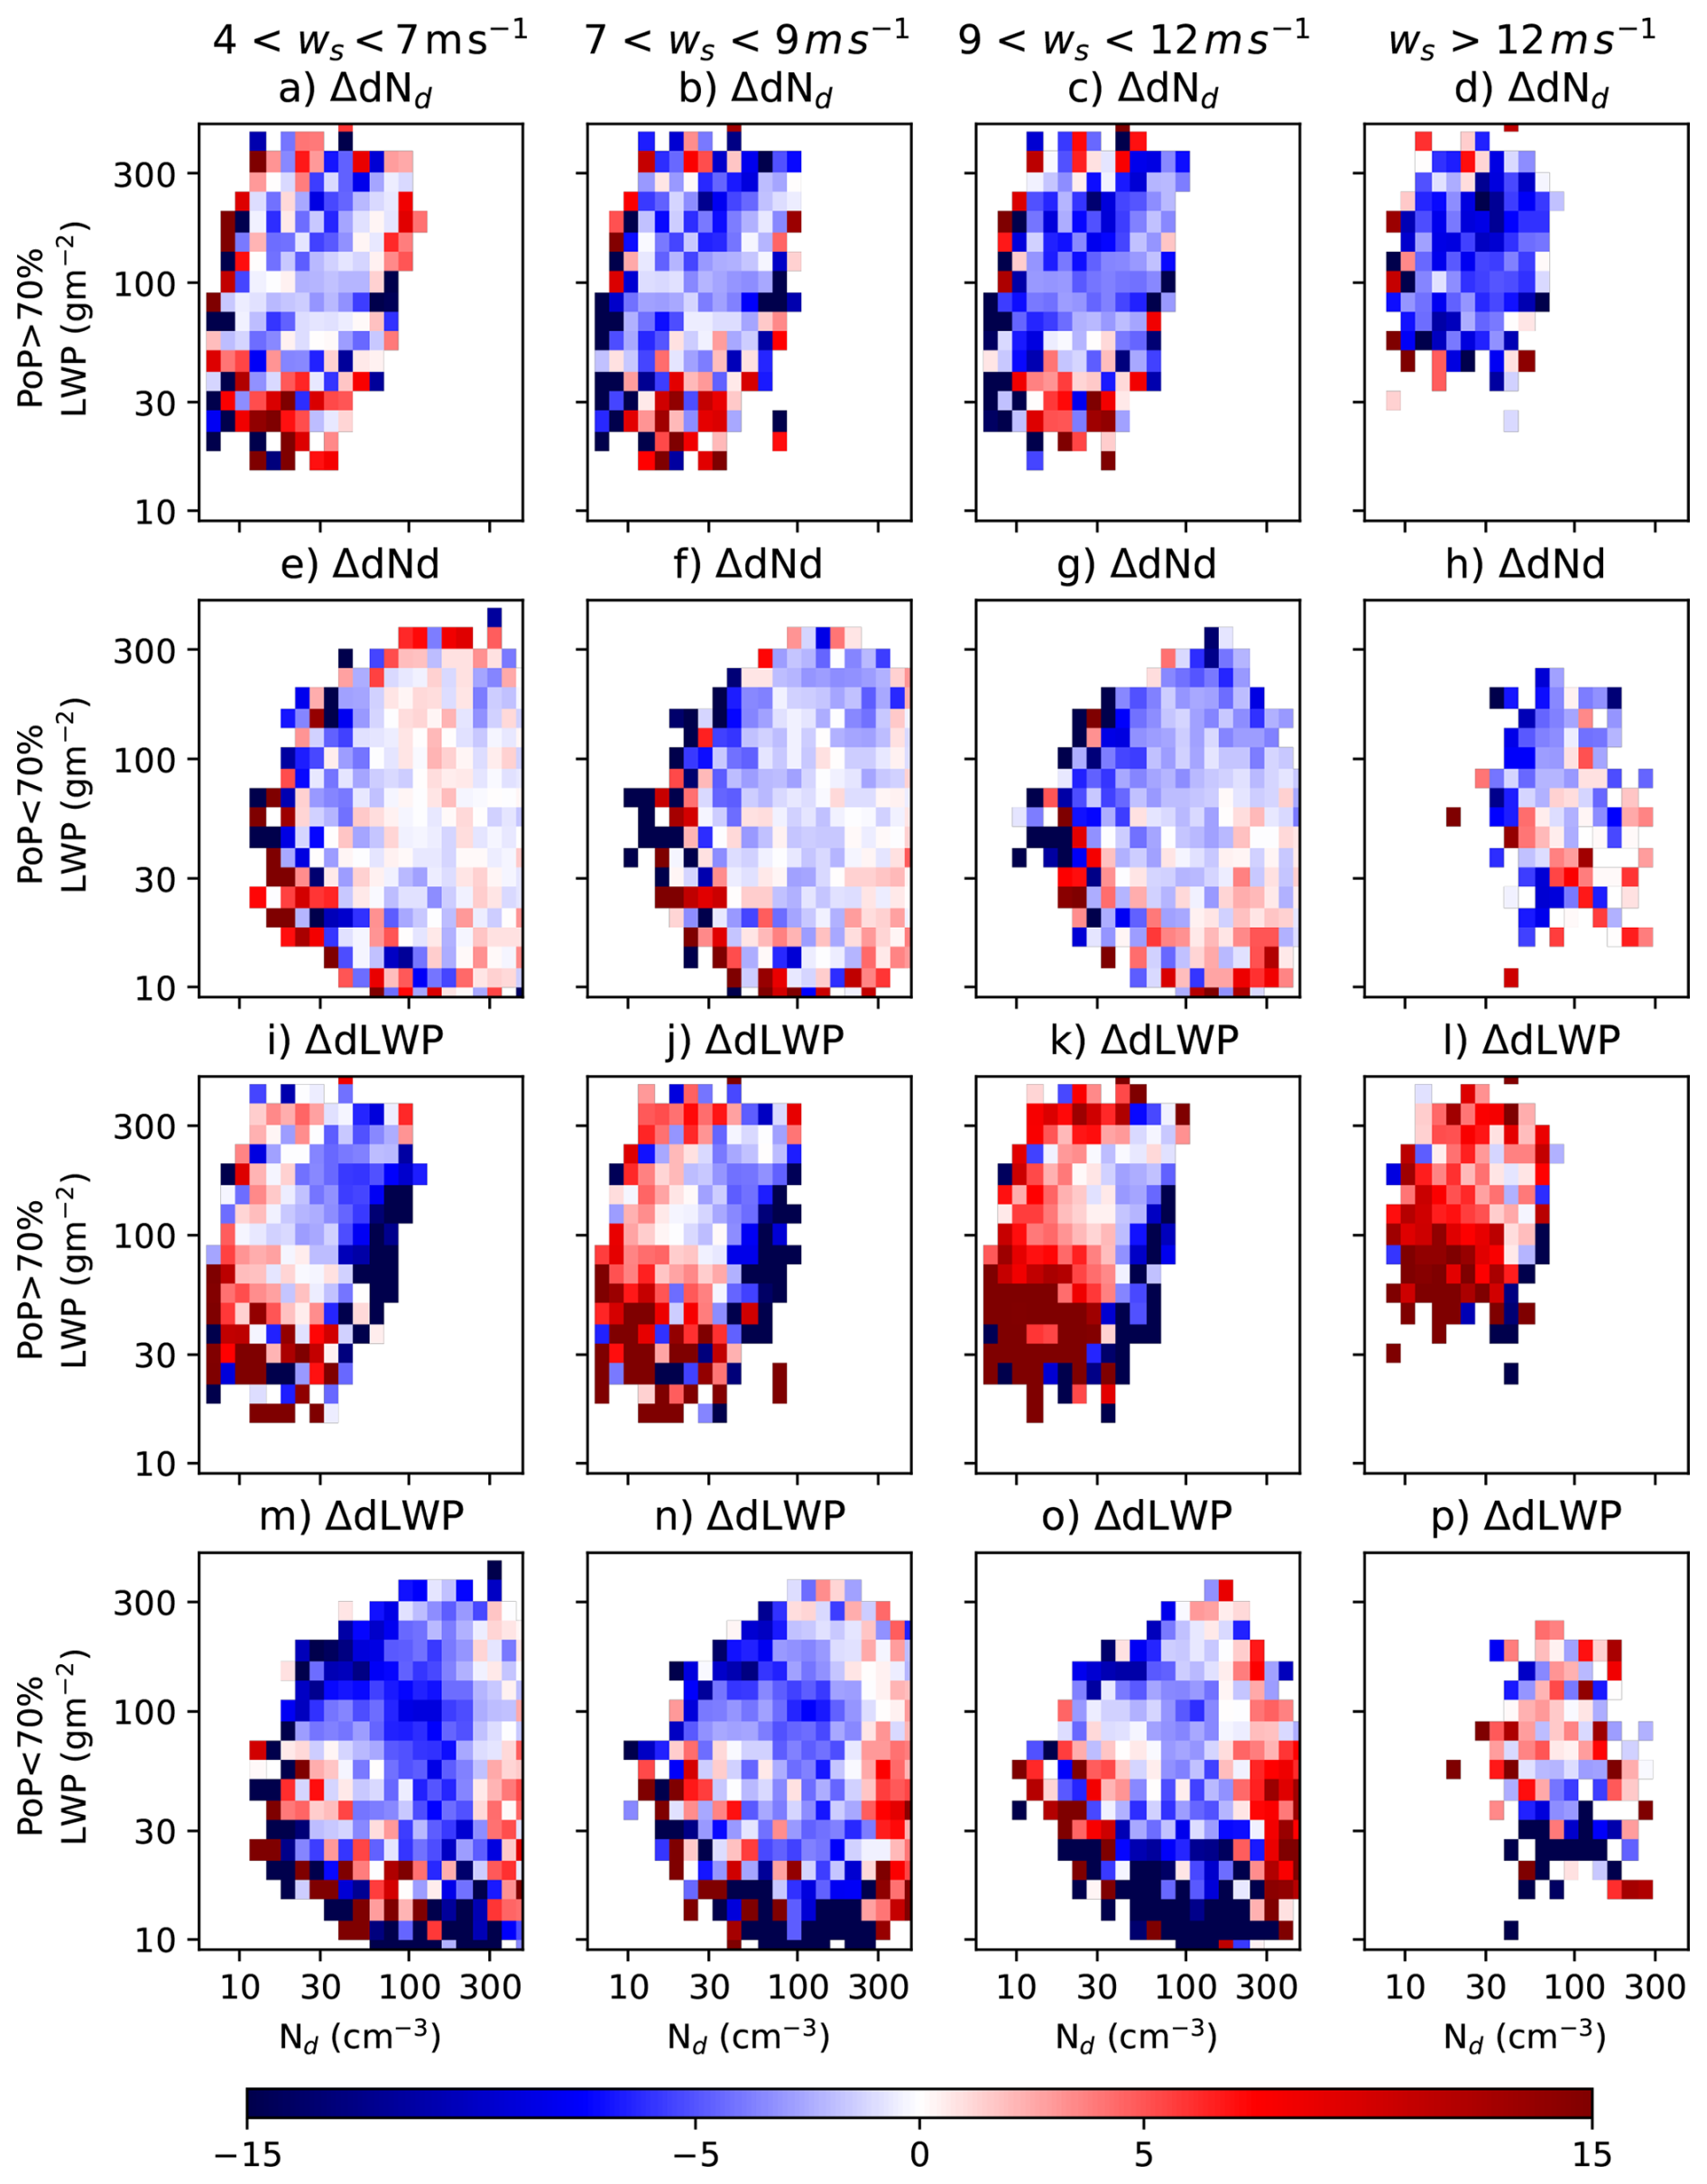
The analysis presented thus far was restricted to the southeastern Atlantic (SEA) Sc clouds. In this section, we extend the analysis to the rest of the globe. DoR plots similar to Fig. 2 are generated for the stratocumulus decks over the north and south Pacific oceans (Figs. C1 and C2 in Appendix C). In the north Pacific (NP) Sc deck, results are broadly consistent with those found over the SEA deck: for initially non-precipitating clouds, the influence of GCCN is evident, with a decrease in Nd at high initial Nd and LWP > 30 g m−2 (Fig. C1e–h). For precipitating clouds, however, the impact of precipitation dominates the Nd response, even at very high ws (Fig. C1a–d). Similar to the SEA deck, LWP in the NP deck increases with ws (Fig. C1i–p) for both not-precipitating and precipitating clouds. In contrast, for the south Pacific (SP) Sc clouds, the signals associated with the same processes are less clear when using the DoR method – the changes in Nd appear to show similar behavior as the NP clouds for both not-precipitating and precipitating clouds (Fig. C2a–h), as does the change in LWP for precipitating clouds. For not-precipitating clouds (Fig. C2m–p), there is a strong negative and positive presence with no obvious pattern emerging.
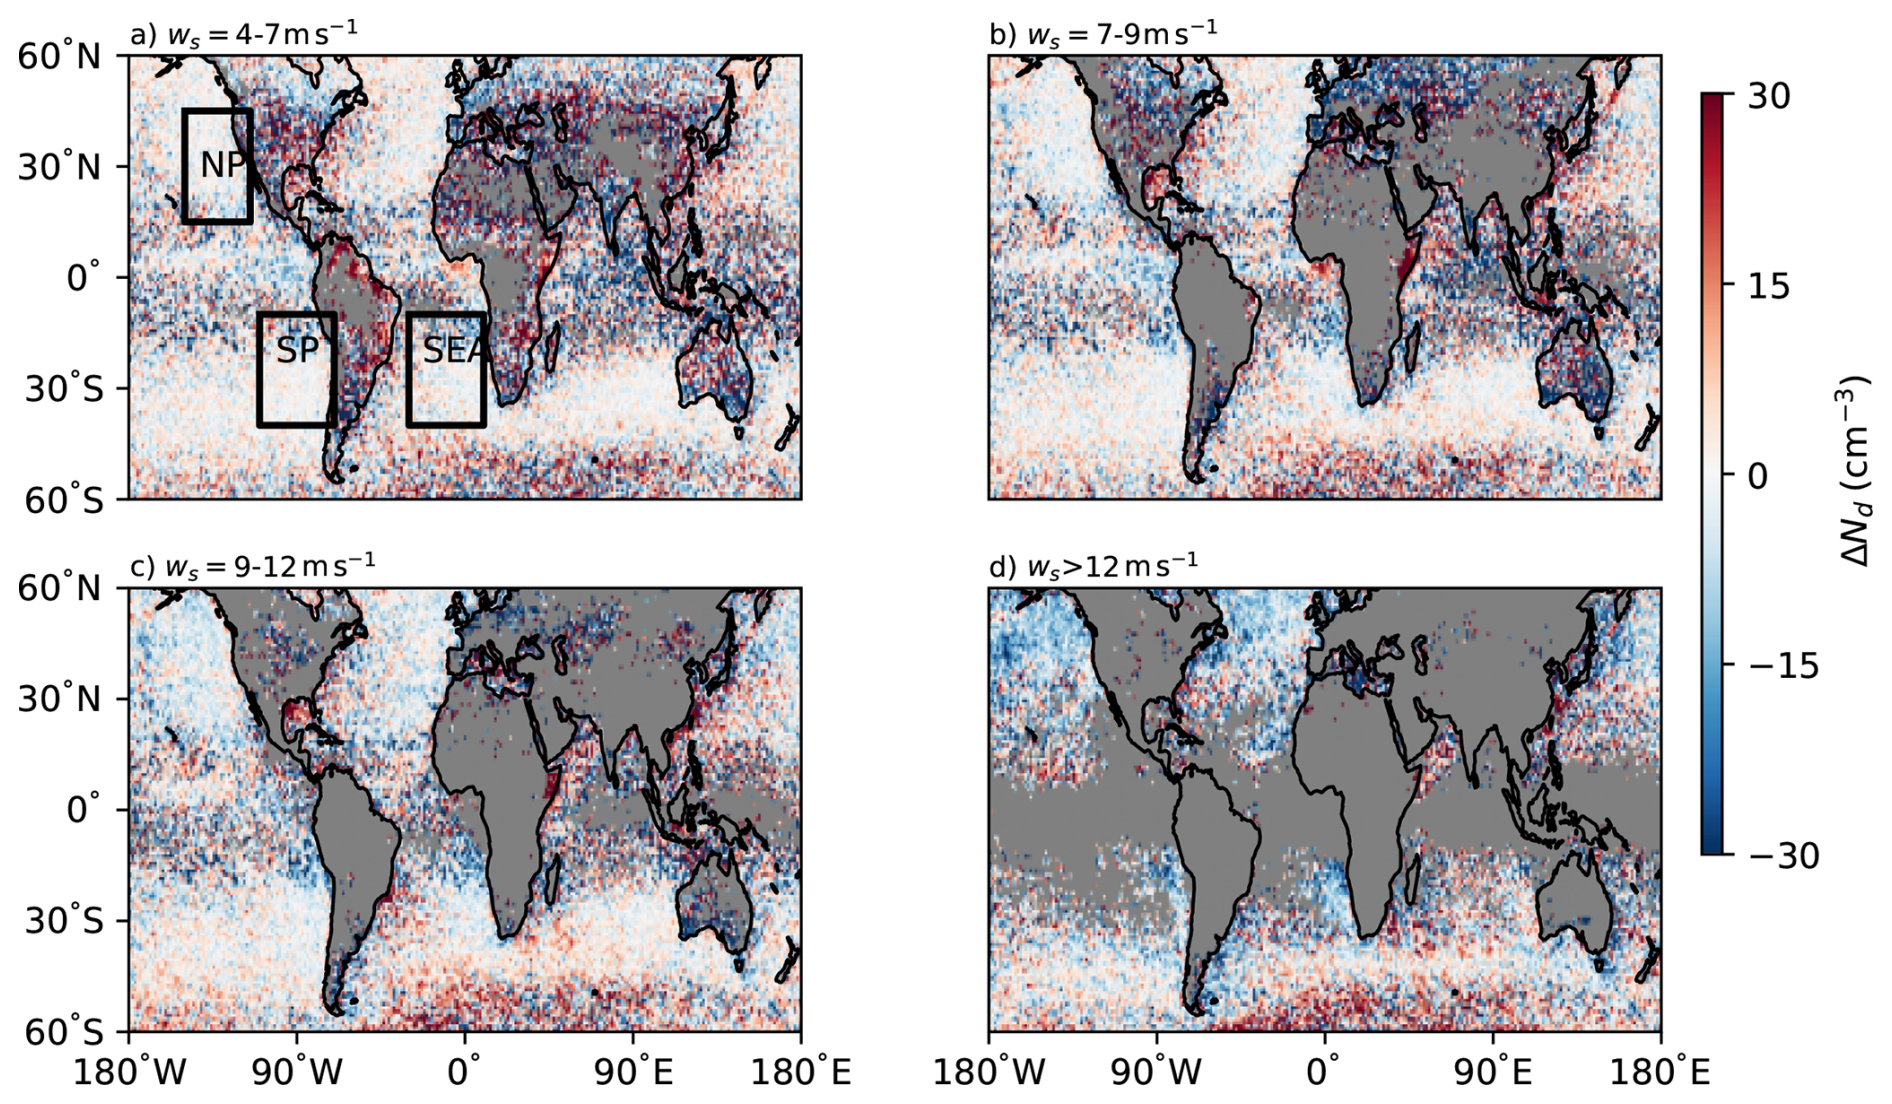
Figure 3Variability in dNd across the globe for different wind speed ranges shown here as the DoR (in cm−3) for initial 30 < Nd < 100 cm−3. The boxes show the Sc decks/regions, data from which are used to generate the DoR joint histograms for the south east Atlantic (SEA), north Pacific (NP) and the south pacific (SP).
To further investigate this behavior, global maps of the DoRs of dNd ( in cm−3) and dLWP (dLWP in g m−2) are analyzed for different ws ranges. These are plotted separately for clouds with a mid-range (30 < Nd < 100 cm−3) and high (Nd > 100 cm−3) initial Nd. Figure 3, showing not-precipitating clouds with an initial Nd between 30 and 100 cm−3, reveals transitioning from positive to negative values in the northern hemisphere and regions off the shore of the African and south American continents with increasing ws. The areas enclosed in the three boxes are the grid points used to make the joint histograms in Figs. 2,C1 and C2 for the SEA, NP and SP decks respectively.
It is possible that the negative DoRs are driven by competition for activation between sea salt and sulfates advected from the continent. Sea-salt aerosols are an important component of the so-called natural “background aerosol/CCN” population. Introduction of more sea-salt aerosols in already polluted background states (over and offshore from the continent) results in competition between CCN particles for the liquid water/supersaturation required to activate to form cloud droplets. At higher wind speeds, sea salt becomes a dominant contributor to background aerosol concentrations, especially in the coarse mode. The increased surface area enhances condensation of water vapor thereby reducing maximum supersaturation. This inhibits the activation of new sulfates or other small aerosols leading to a net reduction in Nd (Ghan et al., 1998; Fossum et al., 2020) or a smaller increase in dNd compared to low ws conditions. This could explain the negative values (blue regions) over the northern hemisphere and along the coast of the continents in the southern hemisphere. More pristine conditions exists further away from the continental coastlines in the southern hemisphere where the competition is less prominent, leading to almost constant changes (positive) as ws increases in these regions.
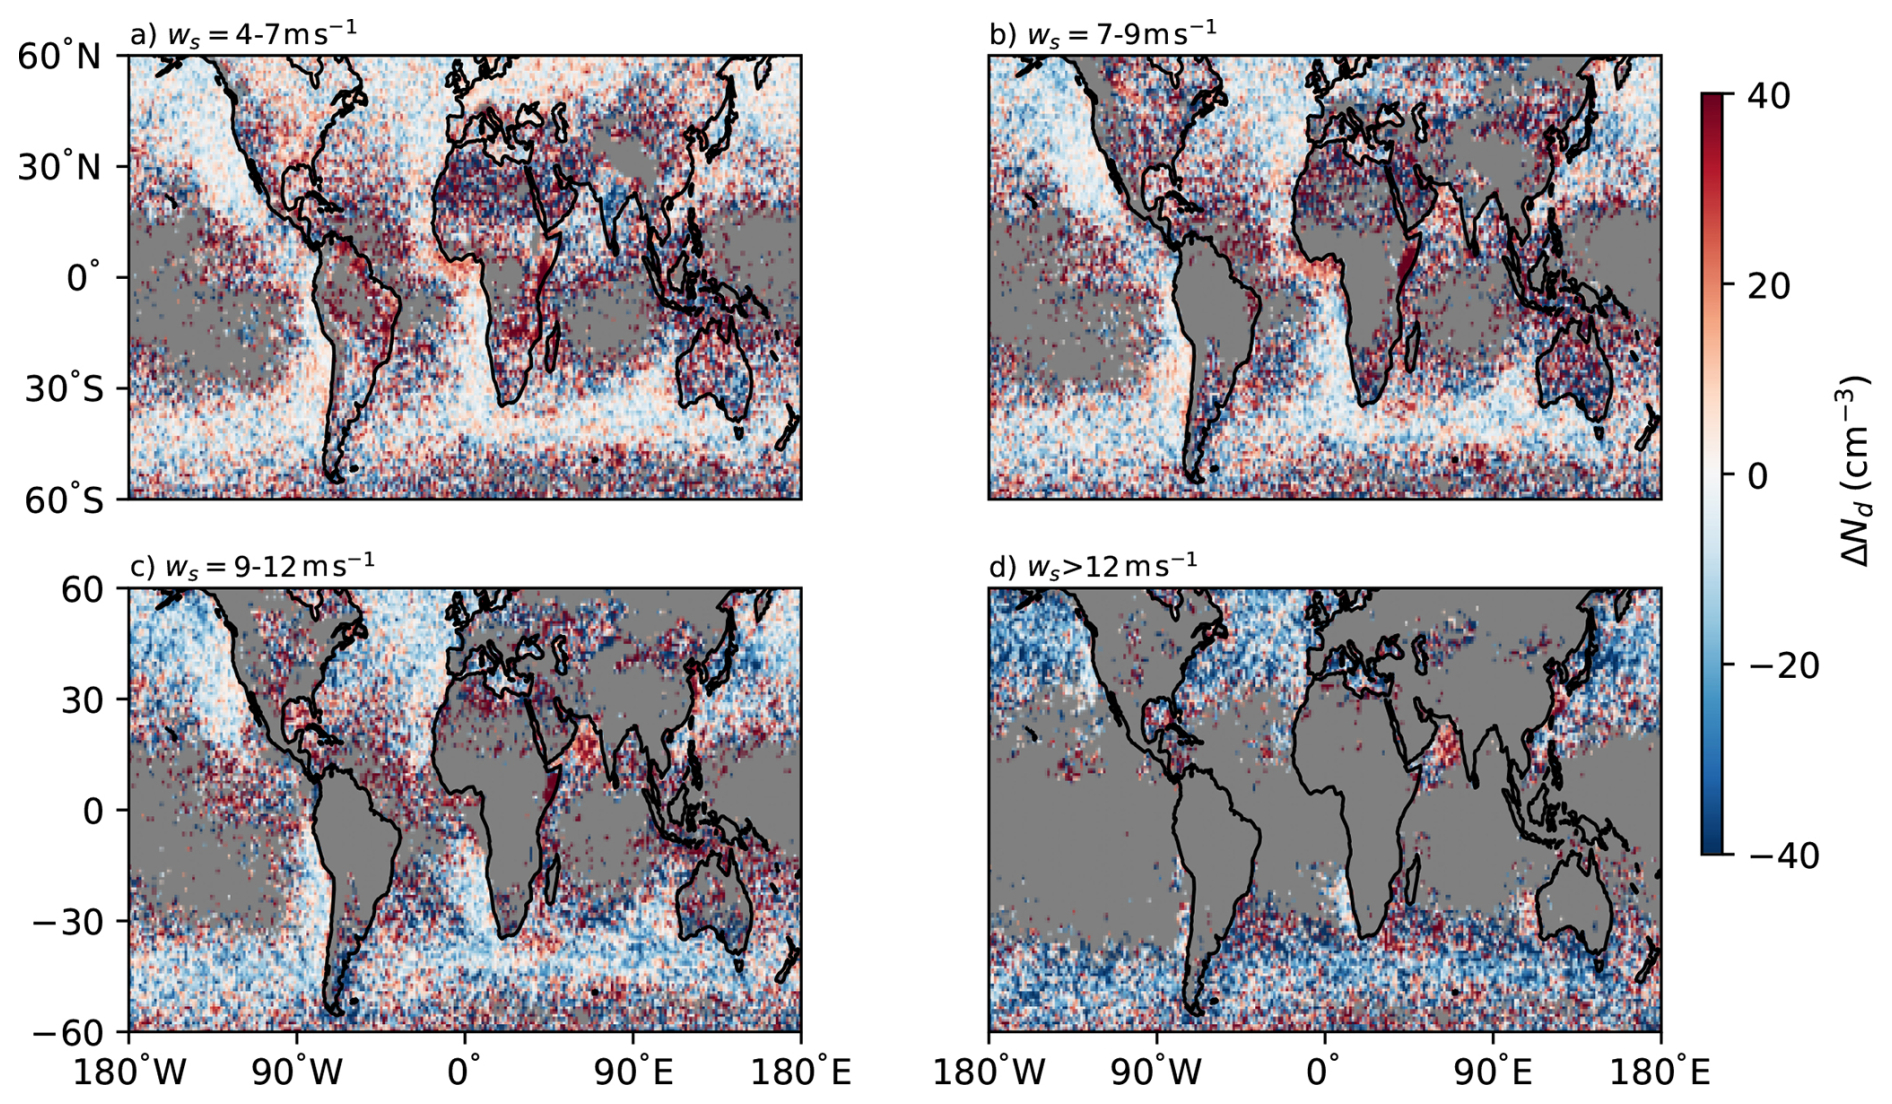
Figure 4Variability in dNd across the globe for different wind speed ranges ( in cm−3) for Nd > 100 cm−3.
The influence of GCCN in initiating precipitation is illustrated in Fig. 4, which shows (in cm−3) for different ws for initially not-precipitating clouds with Nd > 100 cm−3. Outside the tropics, a robust decrease in dNd is observed over the oceans in both hemispheres driven by precipitation.
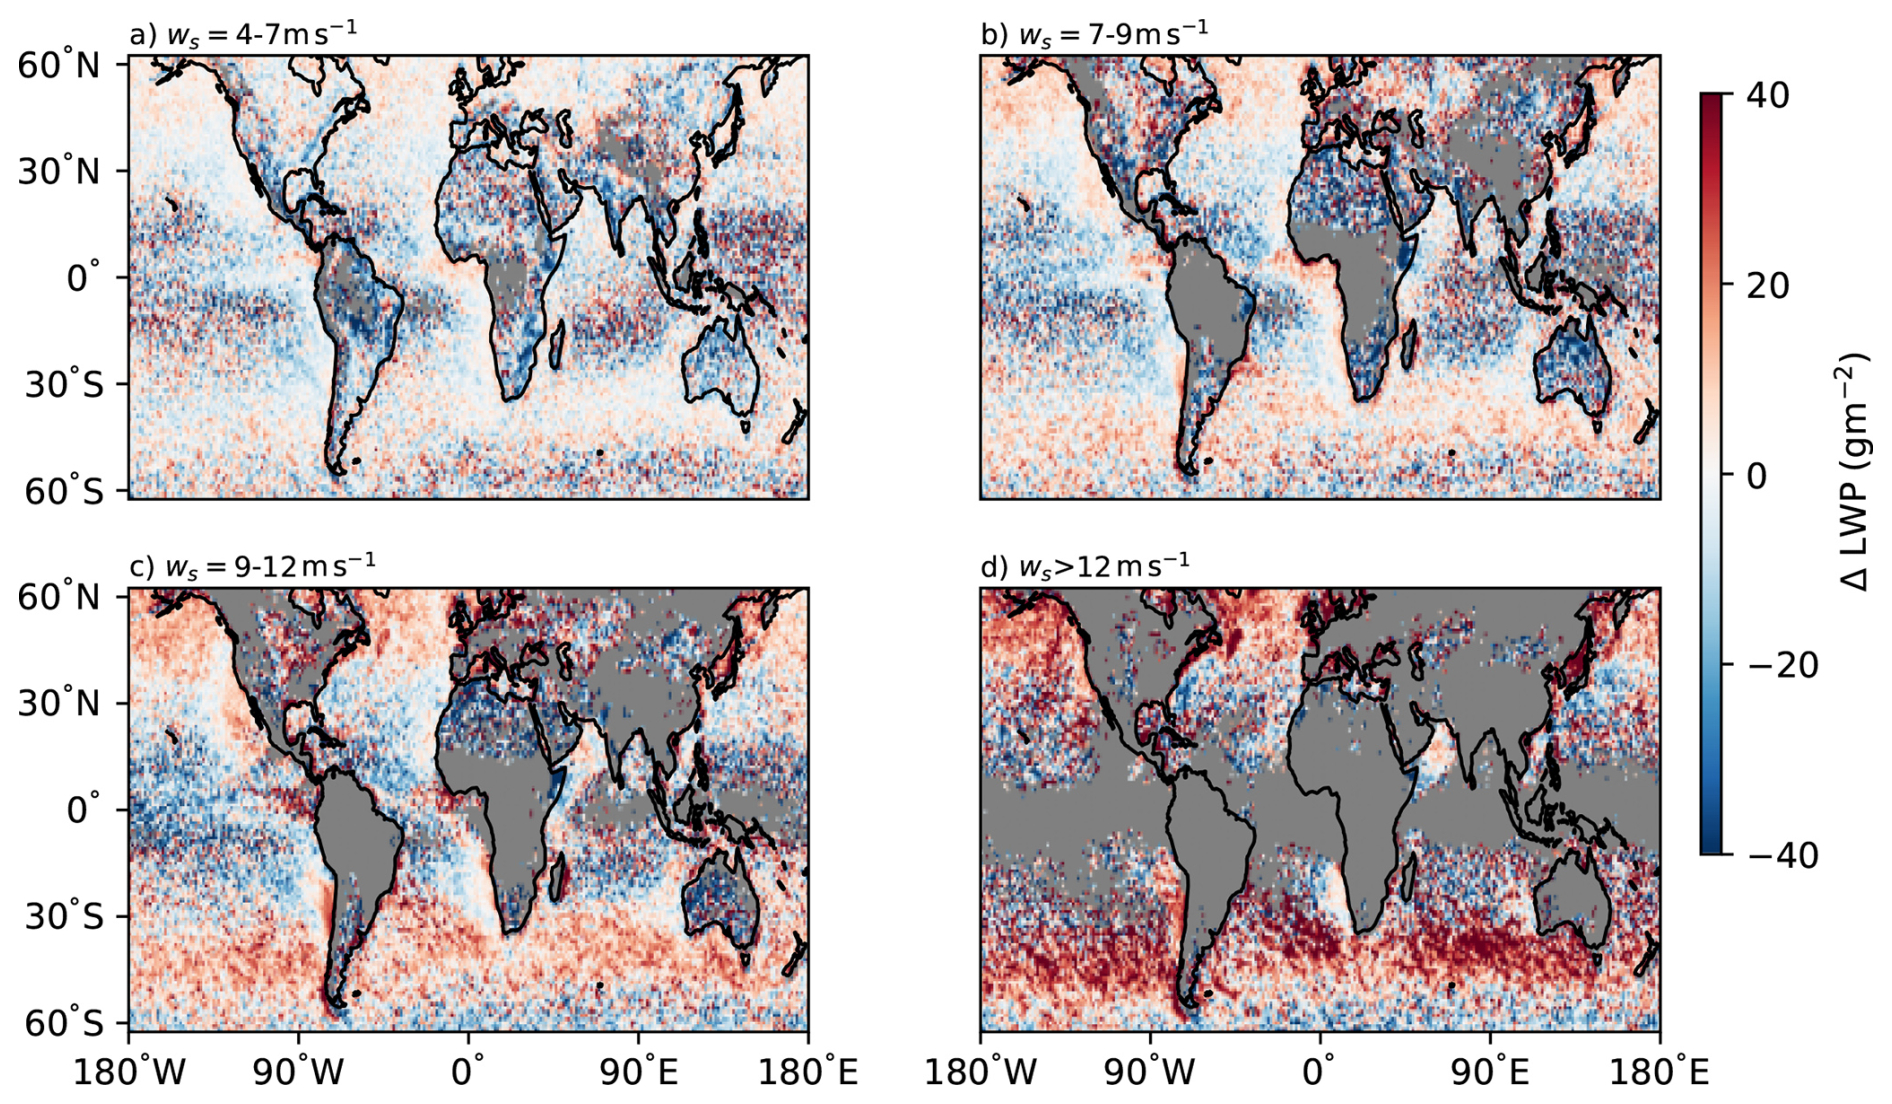
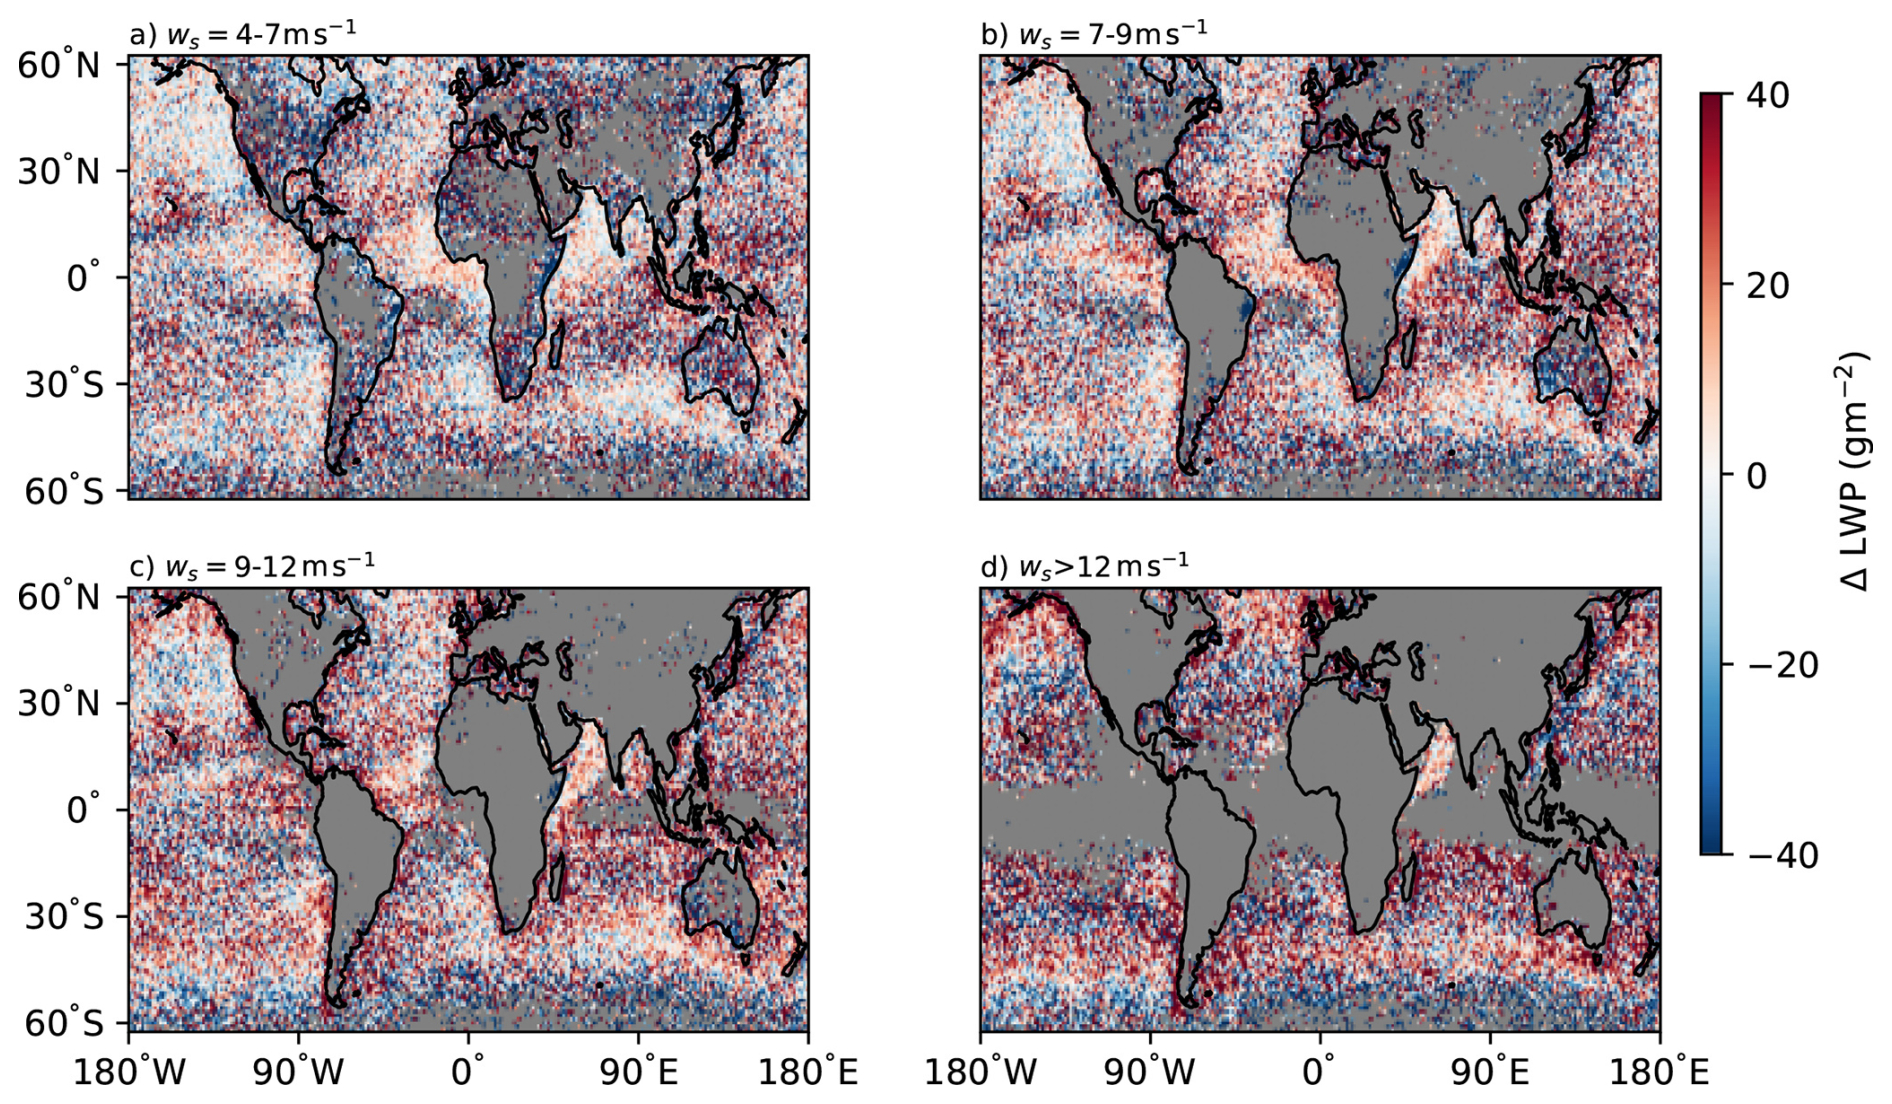
Figure 5Variability in dLWP across the globe for different wind speed ranges ( LWP in g m−2) for all non-precipitating clouds with an initial Nd > 30 cm−3.
Figure 5 shows the global distribution of DoRs of dLWP (LWP in g m−2) for not-precipitating clouds with an initial droplet number concentration Nd > 30 cm−3. A clear increase in dLWP with increasing ws is observed. This signal is particularly pronounced over the subtropical and mid-latitude oceans in both hemispheres. Notably, a distinct increase in dLWP is evident for the SP deck, especially near the coast. This coastal signal is not clearly captured in the DoR joint histograms (Fig. C2m–p), likely because those include clouds farther offshore, where stratocumulus transitions to cumulus regimes. For initially precipitating clouds, even though the change in LWP appears more positive (Fig. C3), no distinct signals can be observed in the maps even though the DoR histograms capture the increase in LWP. Coarsening the grid to a 5° × 5° grid also did not reveal any clear patterns (not shown) in the maps. However, a combination of the DoR method along with global maps of the DoRs can provide a strong picture of the effects of wind-driven processes over the evolution of Sc decks across the globe along with any hemispherical differences.
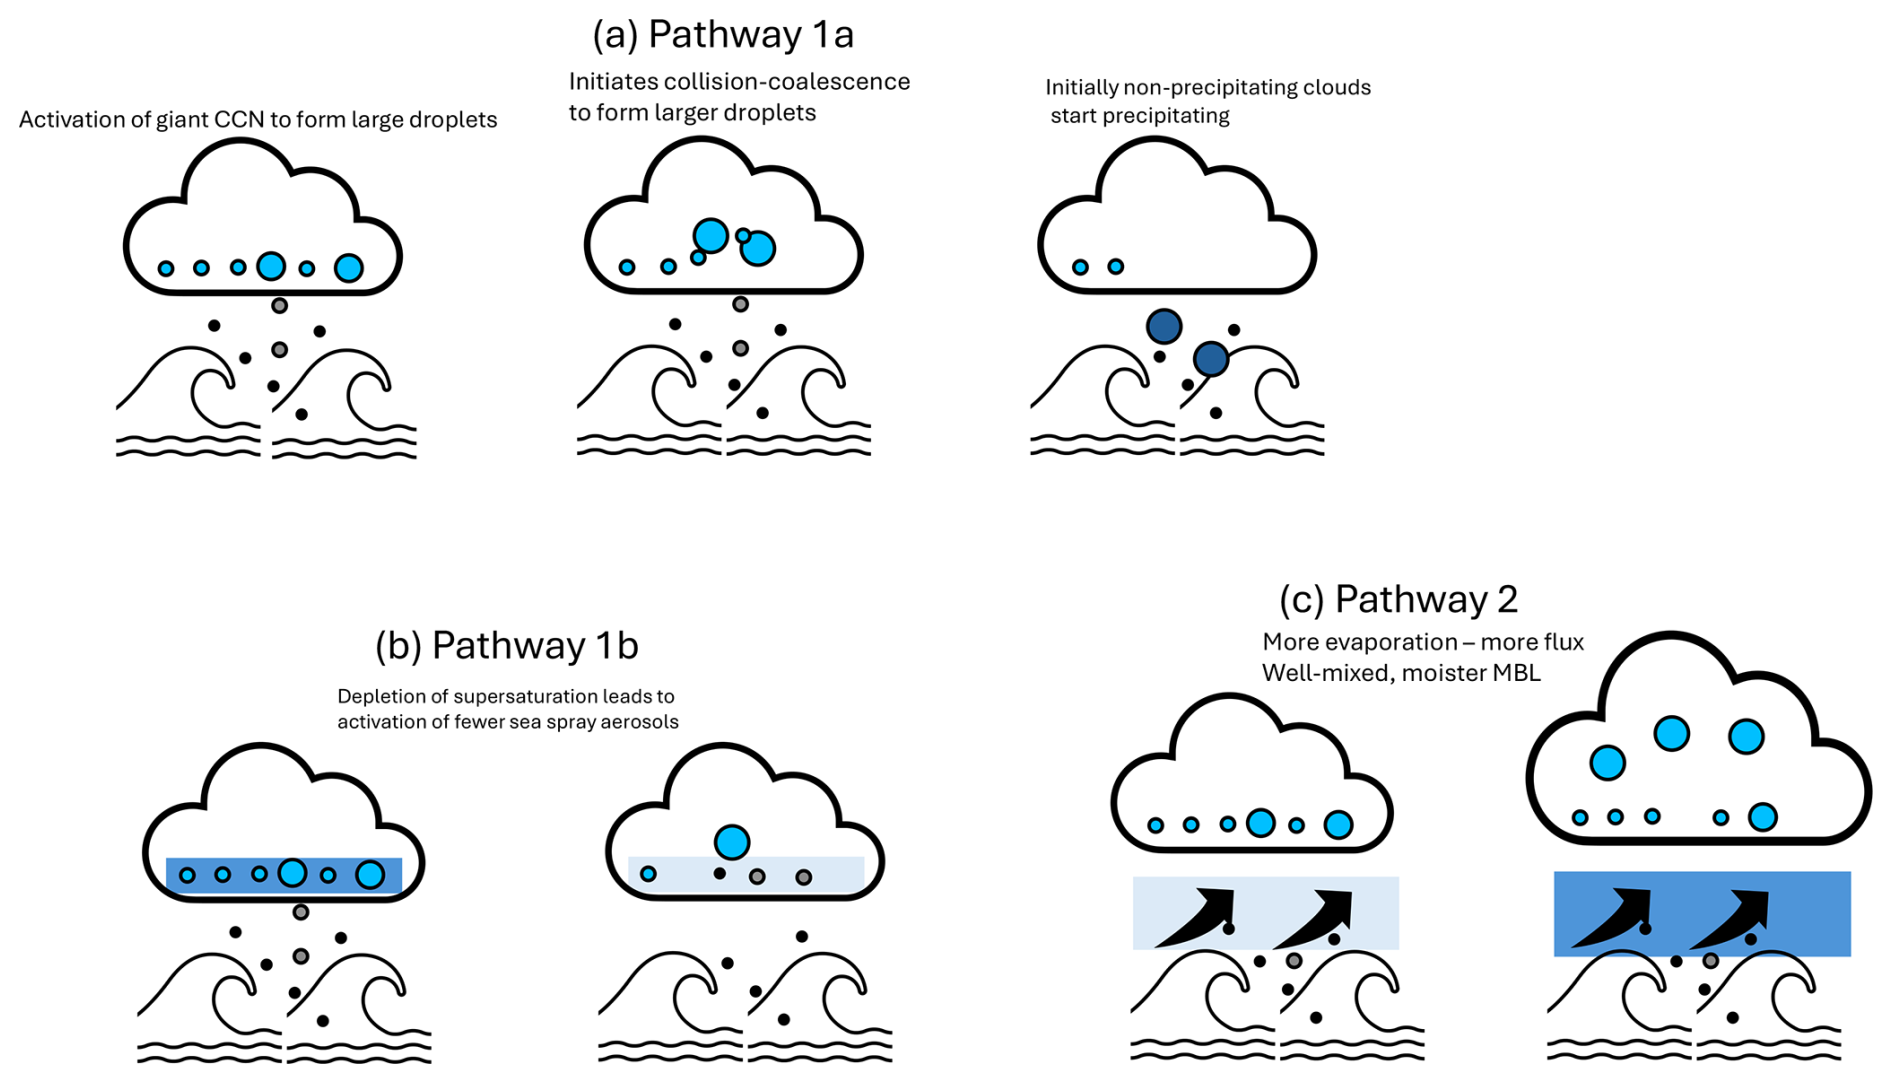
This article highlights the effectiveness of two different pathways through which surface wind-driven processes can modify the cloud droplet effective radius re. Using observations of the temporal evolution of clouds, process fingerprints of the effects of marine aerosols on the cloud properties were extracted. Giant CCNs were shown to reduce cloud Nd (Figs. 2e–h and 4) through two different pathways as illustrated in Fig. 6:
-
Pathway 1a: initiating precipitation in clouds with an initially high droplet number concentration.
-
Pathway 1b: depleting supersaturation by activating to form larger droplets. This increases competition for supersaturation among the remaining CCNs leading to the activation of fewer new droplets.
In addition to the role of fine and giant CCNs, we identify and highlight the role of wind-driven surface fluxes in the thickening of marine stratocumulus clouds and therefore in the increase of re (pathway 2 in Fig. 6). Similar modification in moisture in the STBL through stronger surface fluxes in response to higher surface wind speeds have been shown before (Kazil et al., 2016; Eastman et al., 2022).
The percentage changes of re due to changes in Nd and LWP via the different pathways can be quantified by using Eqs. (B1) and (B2), and using values for d(ln Nd) and d(ln LWP) from Fig. 2f and j respectively. In Fig. 2f, for Nd>100 cm−3 and LWP across the range here, d(ln Nd) is approximately −2.5 % (light blue in the colorbar). Similarly, in Fig. 2n, d(ln LWP) is approximately 5 % for Nd>100. This corresponds to an increase in d(ln re) of 7.5 % and 30 % respectively when used in Eqs. (B1) and (B2) (details in Appendix B). This clearly identifies the second pathway – via increased surface fluxes – as the more dominant physical process that increases re, while simultaneously obscuring the impact of marine aerosol on clouds.
Investigating the Nd and LWP responses to changes in ws across the globe yielded interesting results which makes it important to address the interactions of non-sea-salt aerosols with fine and coarse sea salt. Near-surface wind speeds have been shown to control the formation of sulfate aerosols through oceanic emissions of dimethyl sulfide (Huebert et al., 2004). Additionally, the presence of continents, and consequently a more polluted background state in the northern hemisphere causes different responses in cloud Nd and LWP compared to the more pristine conditions over the oceans in the southern hemisphere. At low wind speeds, sulfate concentration exceeds that of sea salt, especially in the accumulation mode which provides the majority of the cloud CCN. However, as wind speed increases, the concentration of sea salt in the accumulation mode increases and they end up dominating the CCNs in cleaner clouds. For high (low) sulfate concentrations and weak (strong) updrafts, sea salt will reduce (increase) the maximum supersaturation and reduce the number concentration of activated sulfate particles (Ghan et al., 1998) as seen in Fig. 3. The wind-driven sea salt emissions, while acting as new CCN, can also suppress aerosol nucleation by removing nucleating molecules.
However, sea salt is always preferentially activated as CCN at lower supersaturations as they are larger than sulfate particles. Also, majority of the marine aerosols in the coarse mode, ie, greater than 1 µm, will be sea salt and hence we do not expect other aerosol sources to interfere with the GCCN results presented here.
It is important to acknowledge the possible role of surface winds on stratocumulus topped boundary layer (STBL) dynamics. Specifically, the role of surface shear on cloud-top entrainment rate. Entrainment of free tropospheric (FT) aerosols across the cloud-top entrainment interfacial layer (EIL) can lead to the introduction of CCN. This possibly affects our results if a direct correlation exists between wind-generated surface shear and entrainment rates. However, even though there is considerable evidence of wind shear across the inversion enhancing the entrainment rate of dry, warm FT air and reducing the cloud fraction and LWP (Schulz and Mellado, 2018; Wang et al., 2008, 2012; Zamora Zapata et al., 2021), the effect of surface shear on entrainment in STBL is still unclear. Increased low level vertical wind shear can contribute to a turbulent and well-mixed STBL. However, any increase to entrainment (a turbulent kinetic energy (TKE) consuming process) is dependent on the availability of the surface shear-generated TKE at the EIL. This surface shear generated TKE must be transferred through the entire depth of the STBL to the EIL as it goes through the energy cascade process of turbulence, before it can be used to drive entrainment. However, studies on the STBL specifically looking at the role of surface shear and cloud top shear failed to see conclusive evidence on an increase in entrainment rates due to only surface shear (Zamora Zapata et al., 2021). Studies on the interaction of a constant large-scale wind speed with the STBL showed that it is possible through buoyancy driven dynamics (rather than shear driven) for geostrophic wind to promote STBL growth and enhance entrainment throughout the diurnal cycle (Kazil et al., 2016). Higher surface moisture flux at increased wind speed boosts the latent heat release and buoyant production of TKE in cloud updrafts leading to increased entrainment. At the same time, they point out that features of boundary layer dynamics that determine entrainment exist, but require more in-depth study. This suggests that we cannot completely discount the possibility that wind driven entrainment of aerosols from the FT can affect the results in this work, especially in Fig. 2.
Additionally, depending on the humidity of the entrained FT air, there could be an increase or decrease in cloud LWP (Ackerman et al., 2004). Accounting for the contribution of surface winds to cloud-top entrainment and hence Nd and LWP would require controlling for both FT aerosol concentration and relative humidity (in addition to wind speeds) which complicates the analysis using DoRs. Since we expect the ws – surface shear – entrainment correlation to be weak, and the ws – sea salt correlation to be strong and dominate the Nd – LWP phase space, we choose to focus on the latter and reserve the former analysis for future work.
While retrieval biases can still affect the quantification of the initial state, the focus on time development reduces the impact of correlated errors in Nd and LWP that affected previous studies (Arola et al., 2022). Further studies are required to assess the impact of other factors on these fingerprints, particularly the diurnal cycle (Zhang et al., 2024). Including the effects of the diurnal cycle will account for variability in the Nd-LWP relationship over longer time scales. Observations from geostationary satellites are ideal for these analyses by evaluating cloud evolution through Lagrangian trajectories over longer time scales than those considered here. These will also have the advantage of using smaller time steps than the 3 h considered in this work.
The impact of fine sea salt follows previous observational studies, increasing Nd, but coarse marine aerosol is shown to decrease Nd, particularly in initially not-precipitating cases with a high Nd. This shows that even small amounts of coarse aerosol can limit the efficacy of anthropogenic aerosol injections, providing an important constraint on the cloud response to aerosol and limiting the effectiveness of proposed marine cloud brightening programs.
It is possible that the positive and negative regions in Fig. 1a and b are partly driven by the regression to the mean effect. Whereby, a positively biased first measurement would likely be followed by a smaller second measurement. By applying a threshold on re (which is used to calculate both Nd and LWP) to distinguish between precipitating and not-precipitating clouds, there is a chance that similar regression to mean effects are inadvertently introduced in the DoRs in Fig. 1c.
We perform an alternate analysis using an independent data source for precipitation: warm rain rates inferred from AMSR/E and AMSR/2 89 GHz passive microwave brightness temperatures trained using CloudSat rain rate observations (Eastman et al., 2019). The results for DoRs from the dataset provided by Eastman et al. (2019) in Figs. A1 and A2 suggest patterns similar to those in Figs. 1 and 2. This suggests that the patterns are indicative of precipitation effects rather than the regression to the mean (which might still be at play but less dominant). We refrain from using the data set from Eastman et al. (2019) to identify precipitating clouds in the main manuscript as these are collocated with data from Aqua, which is at the end of the time step in the context of this manuscript. By using the effective radius as a measure of precipitation we are using more information of the cloud microphysics and obtain data from the start of the time step. This allows us to identify the role of precipitation and other processes during the evolution of the cloud. Original CloudSat rain rate observations were also considered, but these are too sparse/patchy to provide reliable results.
The cloud Nd and LWP are calculated using
where Qext is the extinction efficiency factor (unitless), fad is the adiabaticity fraction, τc is the cloud optical depth (unitless), where rv is the volume-mean droplet radius, ρw is the density of liquid water (kg m−3).
The change in re with a change in Nd can be represented as
The data supporting the conclusions, along with the code used for processing this data and generating the figures in this study are available with the identifier https://doi.org/10.5281/zenodo.17426841 (Nair, 2025).
EG and VN designed the study. VN performed the analysis and wrote the paper. All of the authors assisted in the interpretation of the results and commented on the paper.
The contact author has declared that none of the authors has any competing interests.
Publisher's note: Copernicus Publications remains neutral with regard to jurisdictional claims made in the text, published maps, institutional affiliations, or any other geographical representation in this paper. The authors bear the ultimate responsibility for providing appropriate place names. Views expressed in the text are those of the authors and do not necessarily reflect the views of the publisher.
The authors would like to thank the editor and two anonymous reviewers for their helpful comments and suggestions on the paper.
This research has been supported by the Horizon Europe programme under grant agreement no. 101137680 via project CERTAINTY (Cloud-aERosol inTeractions & their impActs IN The earth sYstem).
This paper was edited by Anna Possner and reviewed by two anonymous referees.
Ackerman, A. S., Kirkpatrick, M. P., Stevens, D. E., and Toon, O. B.: The impact of humidity above stratiform clouds on indirect aerosol climate forcing, Nature, https://doi.org/10.1038/nature03174, 2004. a, b, c
Albrecht, B. A.: Aerosols, Cloud Microphysics, and Fractional Cloudiness, Science, 245, 1227–1230, https://doi.org/10.1126/science.245.4923.1227, 1989. a, b
Andreae, M. O., Jones, C. D., and Cox, P. M.: Strong present-day aerosol cooling implies a hot future, Nature, 435, 1187–1190, https://doi.org/10.1038/nature03671, 2005. a
Arola, A., Lipponen, A., Kolmonen, P., Virtanen, T. H., Bellouin, N., Grosvenor, D. P., Gryspeerdt, E., Quaas, J., and Kokkola, H.: Aerosol effects on clouds are concealed by natural cloud heterogeneity and satellite retrieval errors, Nat. Commun., 13, 7357, https://doi.org/10.1038/s41467-022-34948-5, 2022. a, b
Bellouin, N., Quaas, J., Gryspeerdt, E., Kinne, S., Stier, P., Watson-Parris, D., Boucher, O., Carslaw, K. S., Christensen, M., Daniau, A.-L., Dufresne, J.-L., Feingold, G., Fiedler, S., Forster, P., Gettelman, A., Haywood, J. M., Lohmann, U., Malavelle, F., Mauritsen, T., McCoy, D. T., Myhre, G., Mülmenstädt, J., Neubauer, D., Possner, A., Rugenstein, M., Sato, Y., Schulz, M., Schwartz, S. E., Sourdeval, O., Storelvmo, T., Toll, V., Winker, D., and Stevens, B.: Bounding Global Aerosol Radiative Forcing of Climate Change, Rev. Geophys., 58, e2019RG000660, https://doi.org/10.1029/2019RG000660, 2020. a, b
Blyth, A. M., Lowenstein, J. H., Huang, Y., Cui, Z., Davies, S., and Carslaw, K. S.: The production of warm rain in shallow maritime cumulus clouds, Q. J. Roy. Meteor. Soc., 139, 20–31, https://doi.org/10.1002/qj.1972, 2013. a
Bréon, F.-M., Tanré, D., and Generoso, S.: Aerosol Effect on Cloud Droplet Size Monitored from Satellite, Science, 295, 834–838, https://doi.org/10.1126/science.1066434, 2002. a
Bretherton, C. S., Blossey, P. N., and Uchida, J.: Cloud droplet sedimentation, entrainment efficiency, and subtropical stratocumulus albedo, Geophys. Res. Lett., 34, https://doi.org/10.1029/2006GL027648, 2007. a, b
Chen, Y.-C., Xue, L., Lebo, Z. J., Wang, H., Rasmussen, R. M., and Seinfeld, J. H.: A comprehensive numerical study of aerosol-cloud-precipitation interactions in marine stratocumulus, Atmos. Chem. Phys., 11, 9749–9769, https://doi.org/10.5194/acp-11-9749-2011, 2011. a
Colón-Robles, M., Rauber, R. M., and Jensen, J. B.: Influence of low-level wind speed on droplet spectra near cloud base in trade wind cumulus, Geophys. Res. Lett., 33, https://doi.org/10.1029/2006GL027487, 2006. a
Dagan, G., Koren, I., and Altaratz, O.: Aerosol effects on the timing of warm rain processes, Geophys. Res. Lett., 42, 4590–4598, https://doi.org/10.1002/2015GL063839, 2015. a
Eastman, R. and Wood, R.: Factors controlling low cloud evolution over the eastern subtropical oceans: A Lagrangian perspective using the A-Train satellites, J. Atmos. Sci., 73, 331–351, 2016. a
Eastman, R., Wood, R., and Bretherton, C. S.: Time Scales of Clouds and Cloud-Controlling Variables in Subtropical Stratocumulus from a Lagrangian Perspective, J. Atmos. Sci., 73, 3079–3091, https://doi.org/10.1175/JAS-D-16-0050.1, 2016. a
Eastman, R., Lebsock, M., and Wood, R.: Warm Rain Rates from AMSR-E 89-GHz Brightness Temperatures Trained Using CloudSat Rain-Rate Observations, J. Atmos. Ocean. Tech., 36, 1033–1051, https://doi.org/10.1175/JTECH-D-18-0185.1, 2019. a, b, c, d
Eastman, R., McCoy, I. L., and Wood, R.: Wind, Rain, and the Closed to Open Cell Transition in Subtropical Marine Stratocumulus, J. Geophys. Res.-Atmos., 127, e2022JD036795, https://doi.org/10.1029/2022JD036795, 2022. a, b
Feingold, G., Cotton, W. R., Kreidenweis, S. M., and Davis, J. T.: The Impact of Giant Cloud Condensation Nuclei on Drizzle Formation in Stratocumulus: Implications for Cloud Radiative Properties, J. Atmos. Sci., 56, 4100–4117, https://doi.org/10.1175/1520-0469(1999)056<4100:TIOGCC>2.0.CO;2, 1999. a, b
Fons, E., Runge, J., Neubauer, D., and Lohmann, U.: Stratocumulus adjustments to aerosol perturbations disentangled with a causal approach, npj Clim. Atmos. Sci., 6, https://doi.org/10.1038/s41612-023-00452-w, 2023. a, b, c
Fossum, K. N., Ovadnevaite, J., Ceburnis, D., Preißler, J., Snider, J. R., Huang, R.-J., Zuend, A., and O'Dowd, C.: Sea-spray regulates sulfate cloud droplet activation over oceans, npj Clim. Atmos. Sci., 3, 14, https://doi.org/10.1038/s41612-020-0116-2, 2020. a
Ghan, S. J., Guzman, G., and Abdul-Razzak, H.: Competition between Sea Salt and Sulfate Particles as Cloud Condensation Nuclei, J. Atmos. Sci., 55, 3340–3347, https://doi.org/10.1175/1520-0469(1998)055<3340:CBSSAS>2.0.CO;2, 1998. a, b
Glassmeier, F., Hoffmann, F., Johnson, J. S., Yamaguchi, T., Carslaw, K. S., and Feingold, G.: Aerosol-cloud-climate cooling overestimated by ship-track data, Science, 371, 485–489, https://doi.org/10.1126/science.abd3980, 2021. a, b, c
Grosvenor, D. P., Sourdeval, O., Zuidema, P., Ackerman, A., Alexandrov, M. D., Bennartz, R., Boers, R., Cairns, B., Chiu, J. C., Christensen, M., Deneke, H., Diamond, M., Feingold, G., Fridlind, A., Hünerbein, A., Knist, C., Kollias, P., Marshak, A., McCoy, D., Merk, D., Painemal, D., Rausch, J., Rosenfeld, D., Russchenberg, H., Seifert, P., Sinclair, K., Stier, P., van Diedenhoven, B., Wendisch, M., Werner, F., Wood, R., Zhang, Z., and Quaas, J.: Remote Sensing of Droplet Number Concentration in Warm Clouds: A Review of the Current State of Knowledge and Perspectives, Rev. Geophys., 56, 409–453, https://doi.org/10.1029/2017RG000593, 2018. a, b
Gryspeerdt, E., Goren, T., and Smith, T. W. P.: Observing the timescales of aerosol–cloud interactions in snapshot satellite images, Atmos. Chem. Phys., 21, 6093–6109, https://doi.org/10.5194/acp-21-6093-2021, 2021. a, b, c, d
Gryspeerdt, E., Glassmeier, F., Feingold, G., Hoffmann, F., and Murray-Watson, R. J.: Observing short-timescale cloud development to constrain aerosol–cloud interactions, Atmos. Chem. Phys., 22, 11727–11738, https://doi.org/10.5194/acp-22-11727-2022, 2022a. a, b, c, d
Gryspeerdt, E., McCoy, D. T., Crosbie, E., Moore, R. H., Nott, G. J., Painemal, D., Small-Griswold, J., Sorooshian, A., and Ziemba, L.: The impact of sampling strategy on the cloud droplet number concentration estimated from satellite data, Atmos. Meas. Tech., 15, 3875–3892, https://doi.org/10.5194/amt-15-3875-2022, 2022b. a
Hersbach, H., Bell, B., Berrisford, P., Biavati, G., Horányi, A., Muñoz Sabater, J., Nicolas, J., Peubey, C., Radu, R., Rozum, I., Schepers, D., Simmons, A., Soci, C., Dee, D., and Thépaut, J.-N. : ERA5 hourly data on pressure levels from 1940 to present, Copernicus Climate Change Service (C3S) Climate Data Store (CDS) [data set], https://doi.org/10.24381/cds.bd0915c6, 2023. a
Hoffmann, F. and Feingold, G.: Cloud Microphysical Implications for Marine Cloud Brightening: The Importance of the Seeded Particle Size Distribution, J. Atmos. Sci., 78, 3247–3262, https://doi.org/10.1175/JAS-D-21-0077.1, 2021. a
Hoffmann, F., Glassmeier, F., Yamaguchi, T., and Feingold, G.: Liquid Water Path Steady States in Stratocumulus: Insights from Process-Level Emulation and Mixed-Layer Theory, J. Atmos. Sci., 77, 2203–2215, https://doi.org/10.1175/JAS-D-19-0241.1, 2020. a
Huebert, B. J., Blomquist, B. W., Hare, J. E., Fairall, C. W., Johnson, J. E., and Bates, T. S.: Measurement of the sea-air DMS flux and transfer velocity using eddy correlation, Geophys. Res. Lett., 31, https://doi.org/10.1029/2004GL021567, 2004. a
Jung, E., Albrecht, B. A., Jonsson, H. H., Chen, Y.-C., Seinfeld, J. H., Sorooshian, A., Metcalf, A. R., Song, S., Fang, M., and Russell, L. M.: Precipitation effects of giant cloud condensation nuclei artificially introduced into stratocumulus clouds, Atmos. Chem. Phys., 15, 5645–5658, https://doi.org/10.5194/acp-15-5645-2015, 2015. a
Kaufman, Y. J., Koren, I., Remer, L. A., Rosenfeld, D., and Rudich, Y.: The effect of smoke, dust, and pollution aerosol on shallow cloud development over the Atlantic Ocean, P. Natl. Acad. Sci. USA, 102, 11207–11212, https://doi.org/10.1073/pnas.0505191102, 2005. a
Kazil, J., Feingold, G., and Yamaguchi, T.: Wind speed response of marine non-precipitating stratocumulus clouds over a diurnal cycle in cloud-system resolving simulations, Atmos. Chem. Phys., 16, 5811–5839, https://doi.org/10.5194/acp-16-5811-2016, 2016. a, b, c, d
Lasher-Trapp, S. G., Knight, C. A., and Straka, J. M.: Early Radar Echoes from Ultragiant Aerosol in a Cumulus Congestus: Modeling and Observations, J. Atmos. Sci., 58, 3545–3562, https://doi.org/10.1175/1520-0469(2001)058<3545:EREFUA>2.0.CO;2, 2001. a
L'Ecuyer, T. S., Berg, W., Haynes, J., Lebsock, M., and Takemura, T.: Global observations of aerosol impacts on precipitation occurrence in warm maritime clouds, J. Geophys. Res.-Atmos., 114, https://doi.org/10.1029/2008JD011273, 2009. a
Lehahn, Y., Koren, I., Boss, E., Ben-Ami, Y., and Altaratz, O.: Estimating the maritime component of aerosol optical depth and its dependency on surface wind speed using satellite data, Atmos. Chem. Phys., 10, 6711–6720, https://doi.org/10.5194/acp-10-6711-2010, 2010. a
Lehahn, Y., Koren, I., Altaratz, O., and Kostinski, A. B.: Effect of coarse marine aerosols on stratocumulus clouds, Geophys. Res. Lett., 38, https://doi.org/10.1029/2011GL048504, 2011. a
Lewis, E. and Schwartz, S.: Sea Salt Aerosol Production: Mechanisms, Methods, Measurements and Models – A Critical Review, Washington DC American Geophysical Union Geophysical Monograph Series, 152, 299–344, https://doi.org/10.1029/GM152, 2004. a
Liu, F., Mao, F., Rosenfeld, D., Pan, Z., Zang, L., Zhu, Y., Yin, J., and Gong, W.: Opposing comparable large effects of fine aerosols and coarse sea spray on marine warm clouds, Commun. Earth Environ., 3, 232, https://doi.org/10.1038/s43247-022-00562-y, 2022. a, b
Liu, F., Mao, F., Rosenfeld, D., Pan, Z., Zang, L., Zhu, Y., and Gong, W.: Marine Stratocumulus Clouds With More Coarse Sea Spray Aerosols Are Brighter, Geophys. Res. Lett., 52, e2024GL113718, https://doi.org/10.1029/2024GL113718, 2025. a, b
Ludlam, F. H.: The production of showers by the coalescence of cloud droplets, Q. J. Roy. Meteor. Soc., 77, 402–417, https://doi.org/10.1002/qj.49707733306, 1951. a
Meskhidze, N., Remer, L. A., Platnick, S., Negrón Juárez, R., Lichtenberger, A. M., and Aiyyer, A. R.: Exploring the differences in cloud properties observed by the Terra and Aqua MODIS Sensors, Atmos. Chem. Phys., 9, 3461–3475, https://doi.org/10.5194/acp-9-3461-2009, 2009. a
Mülmenstädt, J., Ackerman, A. S., Fridlind, A. M., Huang, M., Ma, P.-L., Mahfouz, N., Bauer, S. E., Burrows, S. M., Christensen, M. W., Dipu, S., Gettelman, A., Leung, L. R., Tornow, F., Quaas, J., Varble, A. C., Wang, H., Zhang, K., and Zheng, Y.: Can general circulation models (GCMs) represent cloud liquid water path adjustments to aerosol–cloud interactions?, Atmos. Chem. Phys., 24, 13633–13652, https://doi.org/10.5194/acp-24-13633-2024, 2024a. a
Mülmenstädt, J., Gryspeerdt, E., Dipu, S., Quaas, J., Ackerman, A. S., Fridlind, A. M., Tornow, F., Bauer, S. E., Gettelman, A., Ming, Y., Zheng, Y., Ma, P.-L., Wang, H., Zhang, K., Christensen, M. W., Varble, A. C., Leung, L. R., Liu, X., Neubauer, D., Partridge, D. G., Stier, P., and Takemura, T.: General circulation models simulate negative liquid water path–droplet number correlations, but anthropogenic aerosols still increase simulated liquid water path, Atmos. Chem. Phys., 24, 7331–7345, https://doi.org/10.5194/acp-24-7331-2024, 2024b. a
Nair, V.: Data files and postprocessing script, Zenodo [data set], https://doi.org/10.5281/zenodo.17426841, 2025. a
Platnick, S., Meyer, K. G., King, M. D., Wind, G., Amarasinghe, N., Marchant, B., Arnold, G. T., Zhang, Z., Hubanks, P. A., Holz, R. E., Yang, P., Ridgway, W. L., and Riedi, J.: The MODIS Cloud Optical and Microphysical Products: Collection 6 Updates and Examples From Terra and Aqua, IEEE T. Geosci. Remote, 55, 502–525, https://doi.org/10.1109/TGRS.2016.2610522, 2017. a
Quaas, J., Boucher, O., and Lohmann, U.: Constraining the total aerosol indirect effect in the LMDZ and ECHAM4 GCMs using MODIS satellite data, Atmos. Chem. Phys., 6, 947–955, https://doi.org/10.5194/acp-6-947-2006, 2006. a
Randall, D. A., Coakley, J. A., Fairall, C. W., Kropfli, R. A., and Lenschow, D. H.: Outlook for Research on Subtropical Marine Stratiform Clouds, B. Am. Meteorol. Soc., 65, 1290–1301, https://doi.org/10.1175/1520-0477(1984)065<1290:OFROSM>2.0.CO;2, 1984. a
Rosenfeld, D., Lahav, R., Khain, A., and Pinsky, M.: The Role of Sea Spray in Cleansing Air Pollution over Ocean via Cloud Processes, Science, 297, 1667–1670, https://doi.org/10.1126/science.1073869, 2002. a, b, c
Schulz, B. and Mellado, J. P.: Wind Shear Effects on Radiatively and Evaporatively Driven Stratocumulus Tops, J. Atmos. Sci., 75, 3245–3263, https://doi.org/10.1175/JAS-D-18-0027.1, 2018. a
Slingo, A.: Sensitivity of the Earth's radiation budget to changes in low clouds, Nature, 343, 49–51, https://doi.org/10.1038/343049a0, 1990. a
Stocker, T. F., Qin, D., Plattner, G.-K., Tignor, M., Allen, S. K., Boschung, J., Nauels, A., Xia, Y., Bex, V., and Midgley, P. M. (Eds.): Climate Change 2013: The Physical Science Basis, contribution of Working Group I to the Fifth Assessment Report of the Intergovernmental Panel on Climate Change, Cambridge University Press, Cambridge, United Kingdom and New York, NY, USA, https://doi.org/10.1017/CBO9781107415324, 2013. a
Twomey, S.: Pollution and the planetary albedo, Atmos. Environ., 8, 1251–1256, https://doi.org/10.1016/0004-6981(74)90004-3, 1974. a, b
Twomey, S.: The Influence of Pollution on the Shortwave Albedo of Clouds, J. Atmos. Sci., 34, 1149–1152, https://doi.org/10.1175/1520-0469(1977)034<1149:TIOPOT>2.0.CO;2, 1977. a
Wang, S., Golaz, J.-C., and Wang, Q.: Effect of intense wind shear across the inversion on stratocumulus clouds, Geophys. Res. Lett., 35, https://doi.org/10.1029/2008GL033865, 2008. a
Wang, S., Zheng, X., and Jiang, Q.: Strongly sheared stratocumulus convection: an observationally based large-eddy simulation study, Atmos. Chem. Phys., 12, 5223–5235, https://doi.org/10.5194/acp-12-5223-2012, 2012. a
Wood, R., Leon, D., Lebsock, M., Snider, J., and Clarke, A. D.: Precipitation driving of droplet concentration variability in marine low clouds, J. Geophys. Res.-Atmos., 117, https://doi.org/10.1029/2012JD018305, 2012. a
Yin, Y., Levin, Z., Reisin, T. G., and Tzivion, S.: The effects of giant cloud condensation nuclei on the development of precipitation in convective clouds – a numerical study, Atmos. Res., 53, 91–116, https://doi.org/10.1016/S0169-8095(99)00046-0, 2000. a
Zamora Zapata, M., Heus, T., and Kleissl, J.: Effects of Surface and Top Wind Shear on the Spatial Organization of Marine Stratocumulus-Topped Boundary Layers, J. Geophys. Res.-Atmos., 126, e2020JD034162, https://doi.org/10.1029/2020JD034162, 2021. a, b
Zhang, J., Chen, Y.-S., Yamaguchi, T., and Feingold, G.: Cloud water adjustments to aerosol perturbations are buffered by solar heating in non-precipitating marine stratocumuli, Atmos. Chem. Phys., 24, 10425–10440, https://doi.org/10.5194/acp-24-10425-2024, 2024. a, b, c
- Abstract
- Introduction
- Data and Methods
- Results and Discussion
- Conclusions and Outlook
- Appendix A: Investigating regression to the mean effects using an independent data source for precipitation
- Appendix B: Cloud re sensitivities to changes in LWP and Nd
- Appendix C: Geographical variability in Sc evolution
- Code and data availability
- Author contributions
- Competing interests
- Disclaimer
- Acknowledgements
- Financial support
- Review statement
- References