the Creative Commons Attribution 4.0 License.
the Creative Commons Attribution 4.0 License.
 | 20 Mar 2026
Long-range impacts of biomass burning on PM2.5: a case study of the UK with a globally nested model
Damaris Y. T. Tan
Mathew R. Heal
David S. Stevenson
Stefan Reis
Massimo Vieno
Eiko Nemitz
Open biomass burning impacts air quality through direct emissions of fine particulate matter (PM2.5) and its role in secondary PM2.5 formation. Here the interest is in the long distance and cumulative influences of biomass burning on annual mean concentrations of PM2.5 in a country far removed from major biomass burning regions: the UK. A novel, globally nested setup of the EMEP4UK atmospheric chemistry transport model is used to isolate contributions to UK PM2.5 from global biomass burning activity. Long-range influences are found to be considerable, with 0.99 µg m−3 of UK-averaged PM2.5 in 2019 being conditional on biomass burning emissions. Of this, 97 % and 73 % are associated with biomass burning outside the UK and outside the model's European domain, respectively – notably from Russia, Asia and boreal North America – which highlights the importance of boundary conditions on regional modelling setups. The simulations suggest some influences of biomass burning have lags of several weeks. The long-range component is enhanced by the role of biomass burning in secondary aerosol formation (58 % of PM2.5 conditional on biomass burning), of which 55 % is organic; the inorganic component (mainly ammonium nitrate) derives from increased oxidation of local emissions, which may be mitigated through local emissions reductions. The PM2.5 conditional on biomass burning is highly policy relevant for the UK, constituting (for 2019) 20 % of the current WHO target and 10 % of the contribution from all sources. This relative contribution is likely to increase as anthropogenic PM2.5 declines and as climate change increases northern-hemispheric extratropical biomass burning.
- Article
(7508 KB) - Full-text XML
- BibTeX
- EndNote


Open biomass burning (BB) impacts many fundamental aspects of the environment, including biodiversity, radiative forcing and air pollution (Keywood et al., 2013; Bowman et al., 2020; Jiang et al., 2016; Kelly et al., 2020; Lasslop et al., 2019; Voulgarakis and Field, 2015; Xu et al., 2024). Sources of BB include prescribed fires, agricultural fires and wildfires (UNEP, 2022). Whilst agricultural burning is a major concern in some areas, globally much attention is focused on wildfires, as anthropogenic changes in climate, population and land-use are increasing their frequency and intensity across the globe (UNEP, 2022; Cunningham et al., 2024; Seydi et al., 2025); for example, climatic factors are linked to increased wildfires, in the extratropics particularly (Jones et al., 2024b), while reductions in historic fire management practices are also linked to increased wildfire frequency and severity (Hessburg et al., 2021; Moura et al., 2019).
With respect to its impact on air quality, BB is a large source of particulate matter with an aerodynamic diameter of less than 2.5 µm (PM2.5), both directly via primary PM2.5 emissions and indirectly via the formation of secondary PM2.5 (Lim et al., 2019; Ahern et al., 2019; Vakkari et al., 2014; He et al., 2024; Hodshire et al., 2019; Tan et al., 2025b). Long-term exposure to PM2.5 is the air pollutant measure of greatest concern to human health, due to its wide-ranging contributions to morbidity and premature mortality (Whaley et al., 2022; Garcia et al., 2023; Xu et al., 2024). In response to this, the World Health Organization (WHO) has set a challenging annual mean air quality guideline for PM2.5 of 5 µg m−3 (WHO, 2021).
The UK and Europe have relatively low incidence of BB compared to other world regions (Wiedinmyer et al., 2023), and this is mainly from wildfires because agricultural burning is largely prohibited (since 1993 in the UK; Ciais et al., 2010) and prescribed burning is likewise tightly regulated (Harper et al., 2018). The contribution of BB to PM2.5 has therefore tended to be ignored in these locations whilst policy attention has focused on mitigation of anthropogenic sources of air pollutants. However, as anthropogenic emissions contributing to PM2.5 in the UK, Europe and elsewhere continue to decline, other sources, such as those associated with BB, are becoming relatively more important. In addition, there is increasing recognition of the relevance of intercontinental-scale transport of wildfire plumes (Witham and Manning, 2007; Diapouli et al., 2014; Cottle et al., 2014; Vaughan et al., 2018; Zhang et al., 2025; Masoom et al., 2025). It is therefore timely to quantify the influence of BB locally and globally on countries such as the UK in more detail – particularly in the context of achieving the WHO air quality guideline.
BB enhances concentrations of PM2.5 at distance via the long-range transport and chemical reactions of its emissions. The aging of primary organic aerosols and the formation of secondary organic aerosols from BB emissions have been subject to many laboratory, field and modelling studies (Lim et al., 2019; Ahern et al., 2019; Vakkari et al., 2014; He et al., 2024; Hodshire et al., 2019). However, BB emissions can have more subtle indirect long-range impacts on secondary pollutants that only modelling studies can reveal. Tan et al. (2025b) demonstrated the role of BB in the long-distance formation of ammonium nitrate (NH4NO3), a component of secondary inorganic aerosol (SIA). BB emissions of carbon monoxide (CO), NO + NO2 (NOx) and volatile organic compounds (VOCs) perturb the OH + HO2 (HOx) cycle at the global scale, leading to increased local-scale oxidation of NOx and hence increased NH4NO3 formation in regions with high local emissions of anthropogenic NOx and ammonia (NH3). The phrasing “PM2.5 conditional on BB”, and its associated short-hand “PM2.5(BB)”, is therefore used in this paper to refer to PM2.5 and its constituents that are consequent on BB. The terminology “conditional on” emphasises the fact that some of the mass making up these concentrations does not derive directly from BB emissions, but that this component of PM2.5 would not exist without the BB emissions.
The aim of this study, therefore, is to quantify the local and long-range, and direct and indirect, impacts of BB on annual mean PM2.5 in the UK, as an example of a country that is distant from areas of major BB. The focus is on the cumulative influences on the annual mean, as long-term exposure to PM2.5 has much greater public health burden than short-term exposures. Previous work has considered the short-term impacts on UK air quality of individual wildfire events (Graham et al., 2020; Witham and Manning, 2007), but to the authors' knowledge no studies quantify the long-term contributions of long-range transport of BB globally on UK PM2.5. It is shown that a global nested model is needed to accurately account for long-range transport. The results from the 2019 model year (chosen because of the relatively high BB activity in the UK that year; Perry et al., 2022) are also set in the wider context of global BB emissions from 2012 to 2023. Although the UK is used as a case study, the methodology applied, and the qualitative insight generated, are general.
2.1 Model setup
This work used a novel, globally nested setup of the EMEP4UK atmospheric chemistry transport model (ACTM), consisting of the three domains shown in Fig. 1. In its standard setup (Vieno et al., 2016b), EMEP4UK operates over the two domains labelled B and C in the figure, with mostly prescribed boundary concentrations for domain B, and is a UK application of the European Monitoring and Evaluation Programme Meteorological Synthesizing Centre – West (EMEP MSC-W) Eulerian ACTM (Simpson et al., 2012). As the standard setup of EMEP4UK cannot accurately account for the transient influences of pollutant transport into domain B, the model was extended to full global coverage. The global domain A provides hourly boundary conditions for the intermediate European domain B, which provides hourly boundary conditions for the inner domain C covering the UK and Republic of Ireland (ROI). Simulations were carried out with EMEP MSC-W model version 5.0.
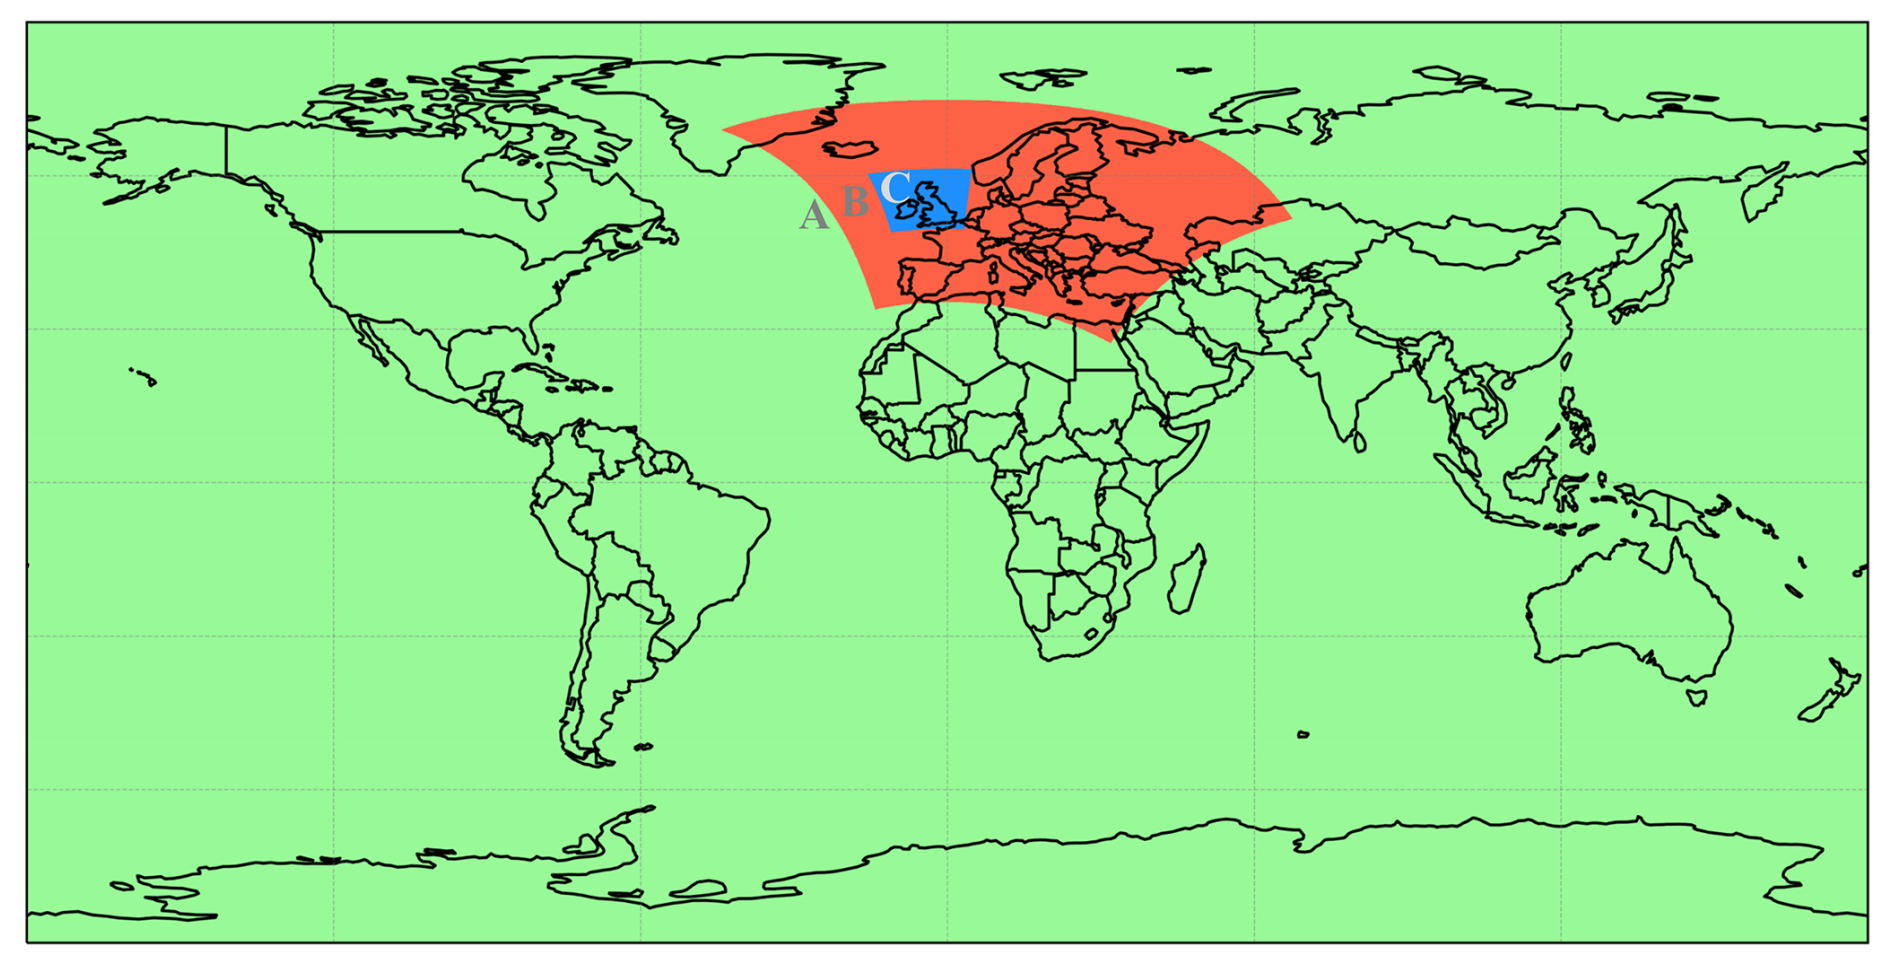
Figure 1Domains of the globally nested configuration of the EMEP4UK model used here: the outer global domain A, an intermediate European domain B, and an inner domain C covering the UK and ROI. Only domains B and C are used in the standard configuration of EMEP4UK.
Meteorology to drive the ACTM was calculated with the Weather Research and Forecast (WRF) model v4.2.2 (Skamarock et al., 2019) at spatial resolutions of 1° × 1°, 27 km × 27 km and 3 km × 3 km for domains A–C respectively. There are 21 vertical layers extending up to 100 hPa. Reanalysis data from the US National Centers for Environmental Prediction (NCEP)/National Center for Atmospheric Research (NCAR) Global Forecast System (GFS) and Newtonian nudging of wind vectors and temperature every 6 h at 1° resolution (Saha et al., 2010) were used. WRF parameterisations are as described by Ge et al. (2021).
Model runs were conducted for the year 2019 and included a full year of spin-up (2018). Global domain simulations used anthropogenic emissions from the Task Force on Hemispheric Transport of Air Pollution (HTAP) v3 inventory for 2018 (Crippa et al., 2023; HTAP, 2024). The agricultural waste burning sector was not included to avoid the double counting of this source of BB emissions. European domain simulations used 2019 anthropogenic emissions from the Centre for Emission Inventories and Projections (CEIP) (CEIP, 2021). In the innermost domain, simulations used 2019 anthropogenic emissions from the NAEI (2021) for the UK and MapEIre from the Department of Environmental Science at Aarhus University and the Irish EPA (2021) for ROI. Emissions of isoprene and other biogenic VOCs from vegetation, NOx from lightning and soils, marine dimethyl sulfide (DMS), and wind-derived dust and sea salt are linked to the meteorological year and simulated as reported in Simpson et al. (2012) and model update reports (Fagerli et al., 2024).
Gas-phase chemistry and inorganic aerosol thermodynamics are simulated with the EmChem19 chemical scheme (Bergström et al., 2022) and the Model for an Aerosol Reacting System (MARS) (Binkowski and Shankar, 1995), respectively. Secondary organic aerosol (SOA) formation, ageing and phase partitioning are parameterised using a 5-bin 1-D volatility basis set with effective saturation concentration C* mid-points of 0.1, 1, 10, 100, 1000 µg m−3 (Ots et al., 2016; Donahue et al., 2006; Bergström et al., 2012). Primary organic aerosol (POA) is treated as non-volatile and chemically inert, as is assumed by emissions inventories (Simpson et al., 2012). The model quantifies dry and wet removal processes as described by Simpson et al. (2012), Vieno et al. (2014), and Ge et al. (2021).
Model output includes hourly gaseous and aerosol concentrations for all vertical model layers. The lowest model layer has a thickness of ∼ 48 m, and modelled air pollutant concentrations described here as surface concentrations have been adjusted to correspond to 3 m above the surface (Simpson et al., 2012). PM2.5 is calculated as the sum of the fine (< 2.5 µm diameter) fractions of sulfate (SO), nitrate (NO), ammonium (NH), organic matter (OM), sea salt, windblown dust, road dust, black carbon (BC), ash and a remaining primary component. A water component is not included to avoid ambiguity about how much water is associated with each PM2.5 constituent.
2.2 BB emissions
BB emissions for 2018 and 2019 were obtained from the Fire INventory from NCAR (FINN) v2.5 dataset, which uses fire detections from both Moderate Resolution Imaging Spectroradiometer (MODIS) and Visible Infrared Imaging Radiometer Suite (VIIRS) (Wiedinmyer et al., 2023; UCAR/NCAR/ACOM, 2023). The latter yields fire detection down to 375 m resolution. FINNv2.5 provides daily estimates of aerosol and trace gas emissions from BB globally at 0.1° × 0.1° resolution, calculated using burned area from active fire detections. BB emissions are regridded to model resolution and evenly distributed from the surface up to 800 hPa (Fagerli et al., 2023).
2.3 Sensitivity experiments
The following model experiments were carried out:
- 1.
“BASE”: the base run with all emissions included.
- 2.
“NBB”: no BB emissions globally.
- 3.
“NEBB”: no European BB emissions anywhere in domain B in Fig. 1, including in the UK.
- 4.
“NUBB”: no UK BB emissions within domain C in Fig. 1. Note that BB emissions in ROI were retained in this model run.
- 5.
“NRxBB”: no Region x BB emissions, where x refers to the region numbers defined in Fig. 2. For example, “NR1BB” denotes the model run with no BB emissions in Region 1 of Fig. 2. This set of simulations were carried out in the global domain only, and for 2019 only, because of the computational expense and to provide an estimate of the time taken for the spin-up of BB-derived species.
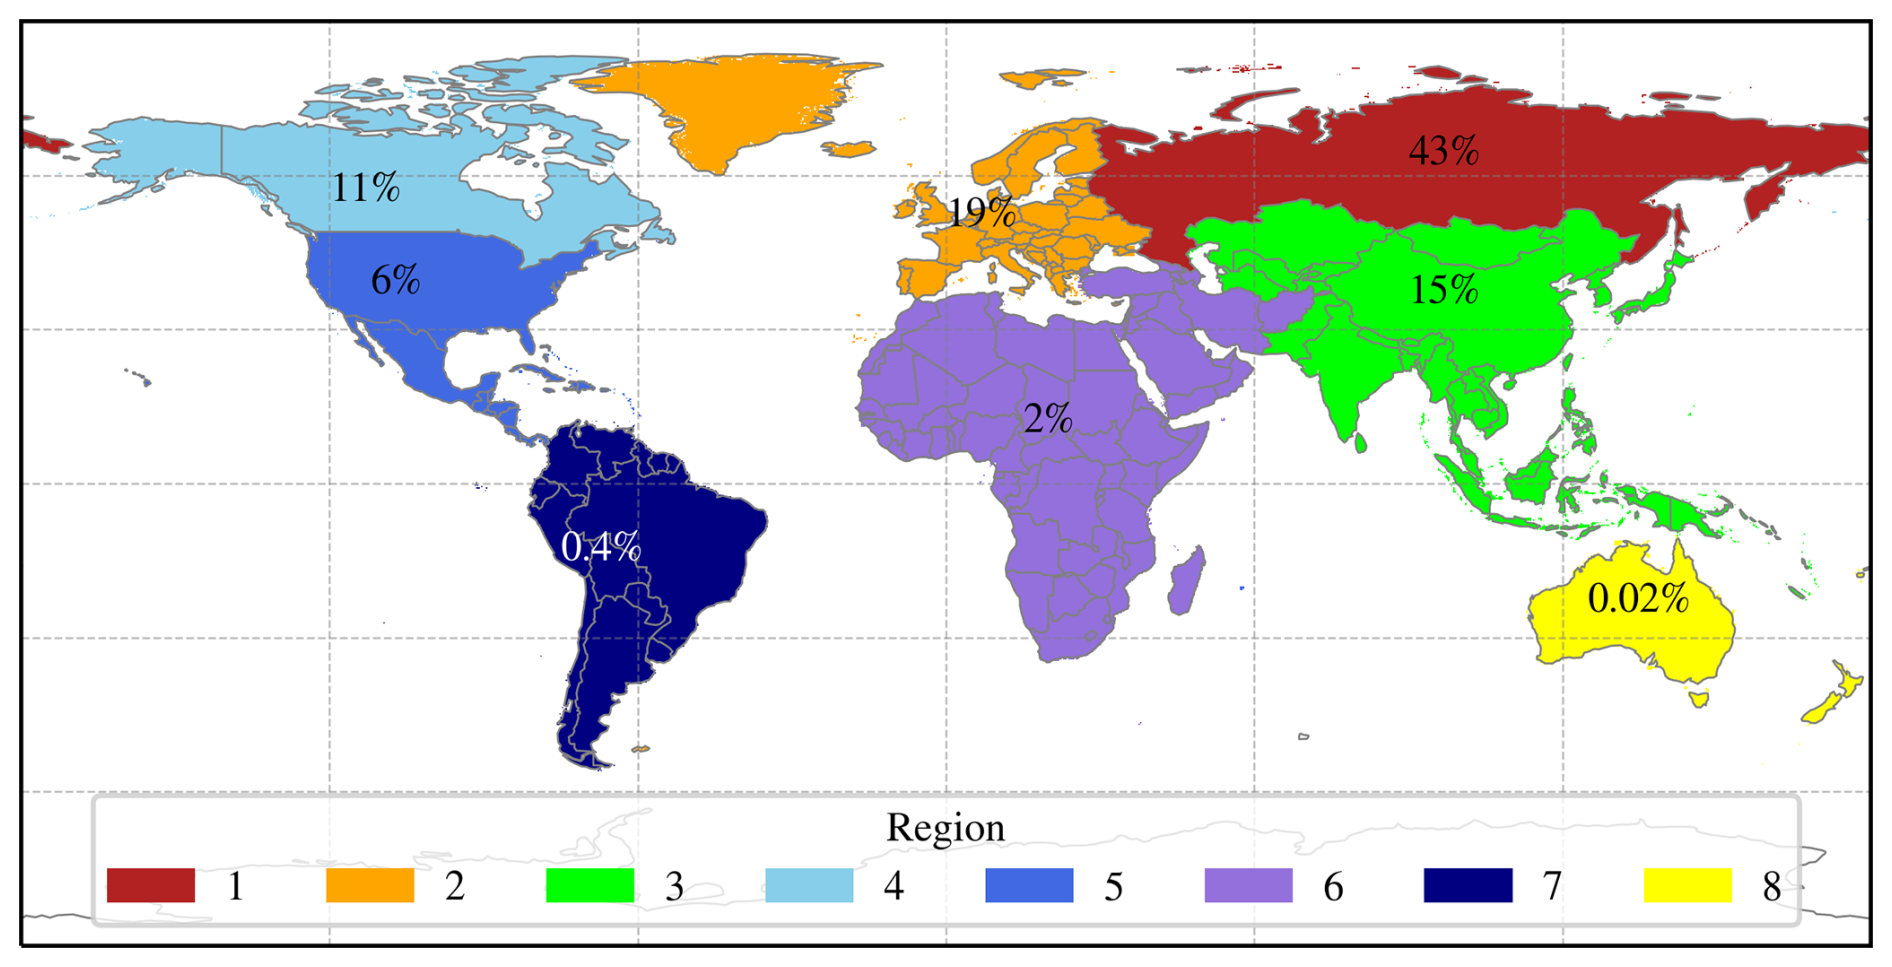
Figure 2The eight source regions used for source-receptor experiments with the UK as the receptor region. The legend shows the assigned numbers. The percentage value superimposed on each source region is the relative contribution made by that region's BB emissions to the 2019 UK annual mean PM2.5 conditional on biomass burning. The percentages do not sum to 100 % because of contributions from BB emissions in 2018 and non-linear interactions not captured by these “brute force” model experiments.
The regions 1 to 8 are based on those proposed for perturbation experiments under the “HTAP3 Fires” model intercomparison project (Whaley et al., 2025), which were derived from the 14 Global Fire Emissions Database (GFED) regions frequently used in fire emissions datasets (Giglio et al., 2013). These regions were chosen to allow comparison to experiments carried out under the “HTAP3 Fires” project. Some minor changes were made to increase the relevance for the UK.
Concentrations conditional on BB emissions globally were calculated by subtracting the NBB run from the BASE run. Concentrations conditional on BB in the European domain illustrated in Fig. 1 were calculated by subtracting the NEBB model run from the BASE model run. Concentrations conditional on BB in the UK were calculated by subtracting the NUBB model run from the BASE model run. Concentrations conditional on BB emissions in each Region x defined in Fig. 2 were calculated by subtracting each NRxBB run from the BASE run. Population-weighted concentration means for the UK were calculated following the methodology described by Reis et al. (2018). Gridded 2021 UK population data were obtained from Carnell et al. (2025) (Fig. A1 of Appendix A), which uses data from the 2022 (Scotland) and 2021 (rest of the UK) Censuses and a 2021 Land Cover Map.
2.4 Model evaluation
The EMEP4UK model in its standard configuration is regularly evaluated against measurements and is widely used for air quality studies (Lin et al., 2017; Ots et al., 2016; Vieno et al., 2016a; Purser et al., 2023; Nemitz et al., 2020; Liška et al., 2024; Macintyre et al., 2023a, b). To evaluate the globally nested configuration of the model, the BASE model run was repeated using the standard configuration of EMEP4UK, the setup of which is described in Vieno et al. (2010, 2014, 2016b) and Appendix B. The globally nested version of EMEP4UK is compared in Appendix B both to the standard configuration of EMEP4UK and to UK supersite measurements, focussing on annual mean PM2.5 components. Secondary inorganic and total organic aerosol components of PM2.5 are generally well represented in the globally nested version, particularly at sites most influenced by PM2.5(BB). The major instance of global model overestimation is sea salt, which is not relevant to this study and is linked to changes made in recent versions of the EMEP MSC-W model code, where a larger percentage of the sea salt uplift is attributed to the fine fraction to improve model performance for Continental Europe (Fagerli et al., 2021).
The 2019 UK annual mean surface distribution of PM2.5 conditional on BB, referred to here as PM2.5(BB), is shown in Fig. 3. Table 1 provides 2019 UK annual mean quantities related to PM2.5(BB).
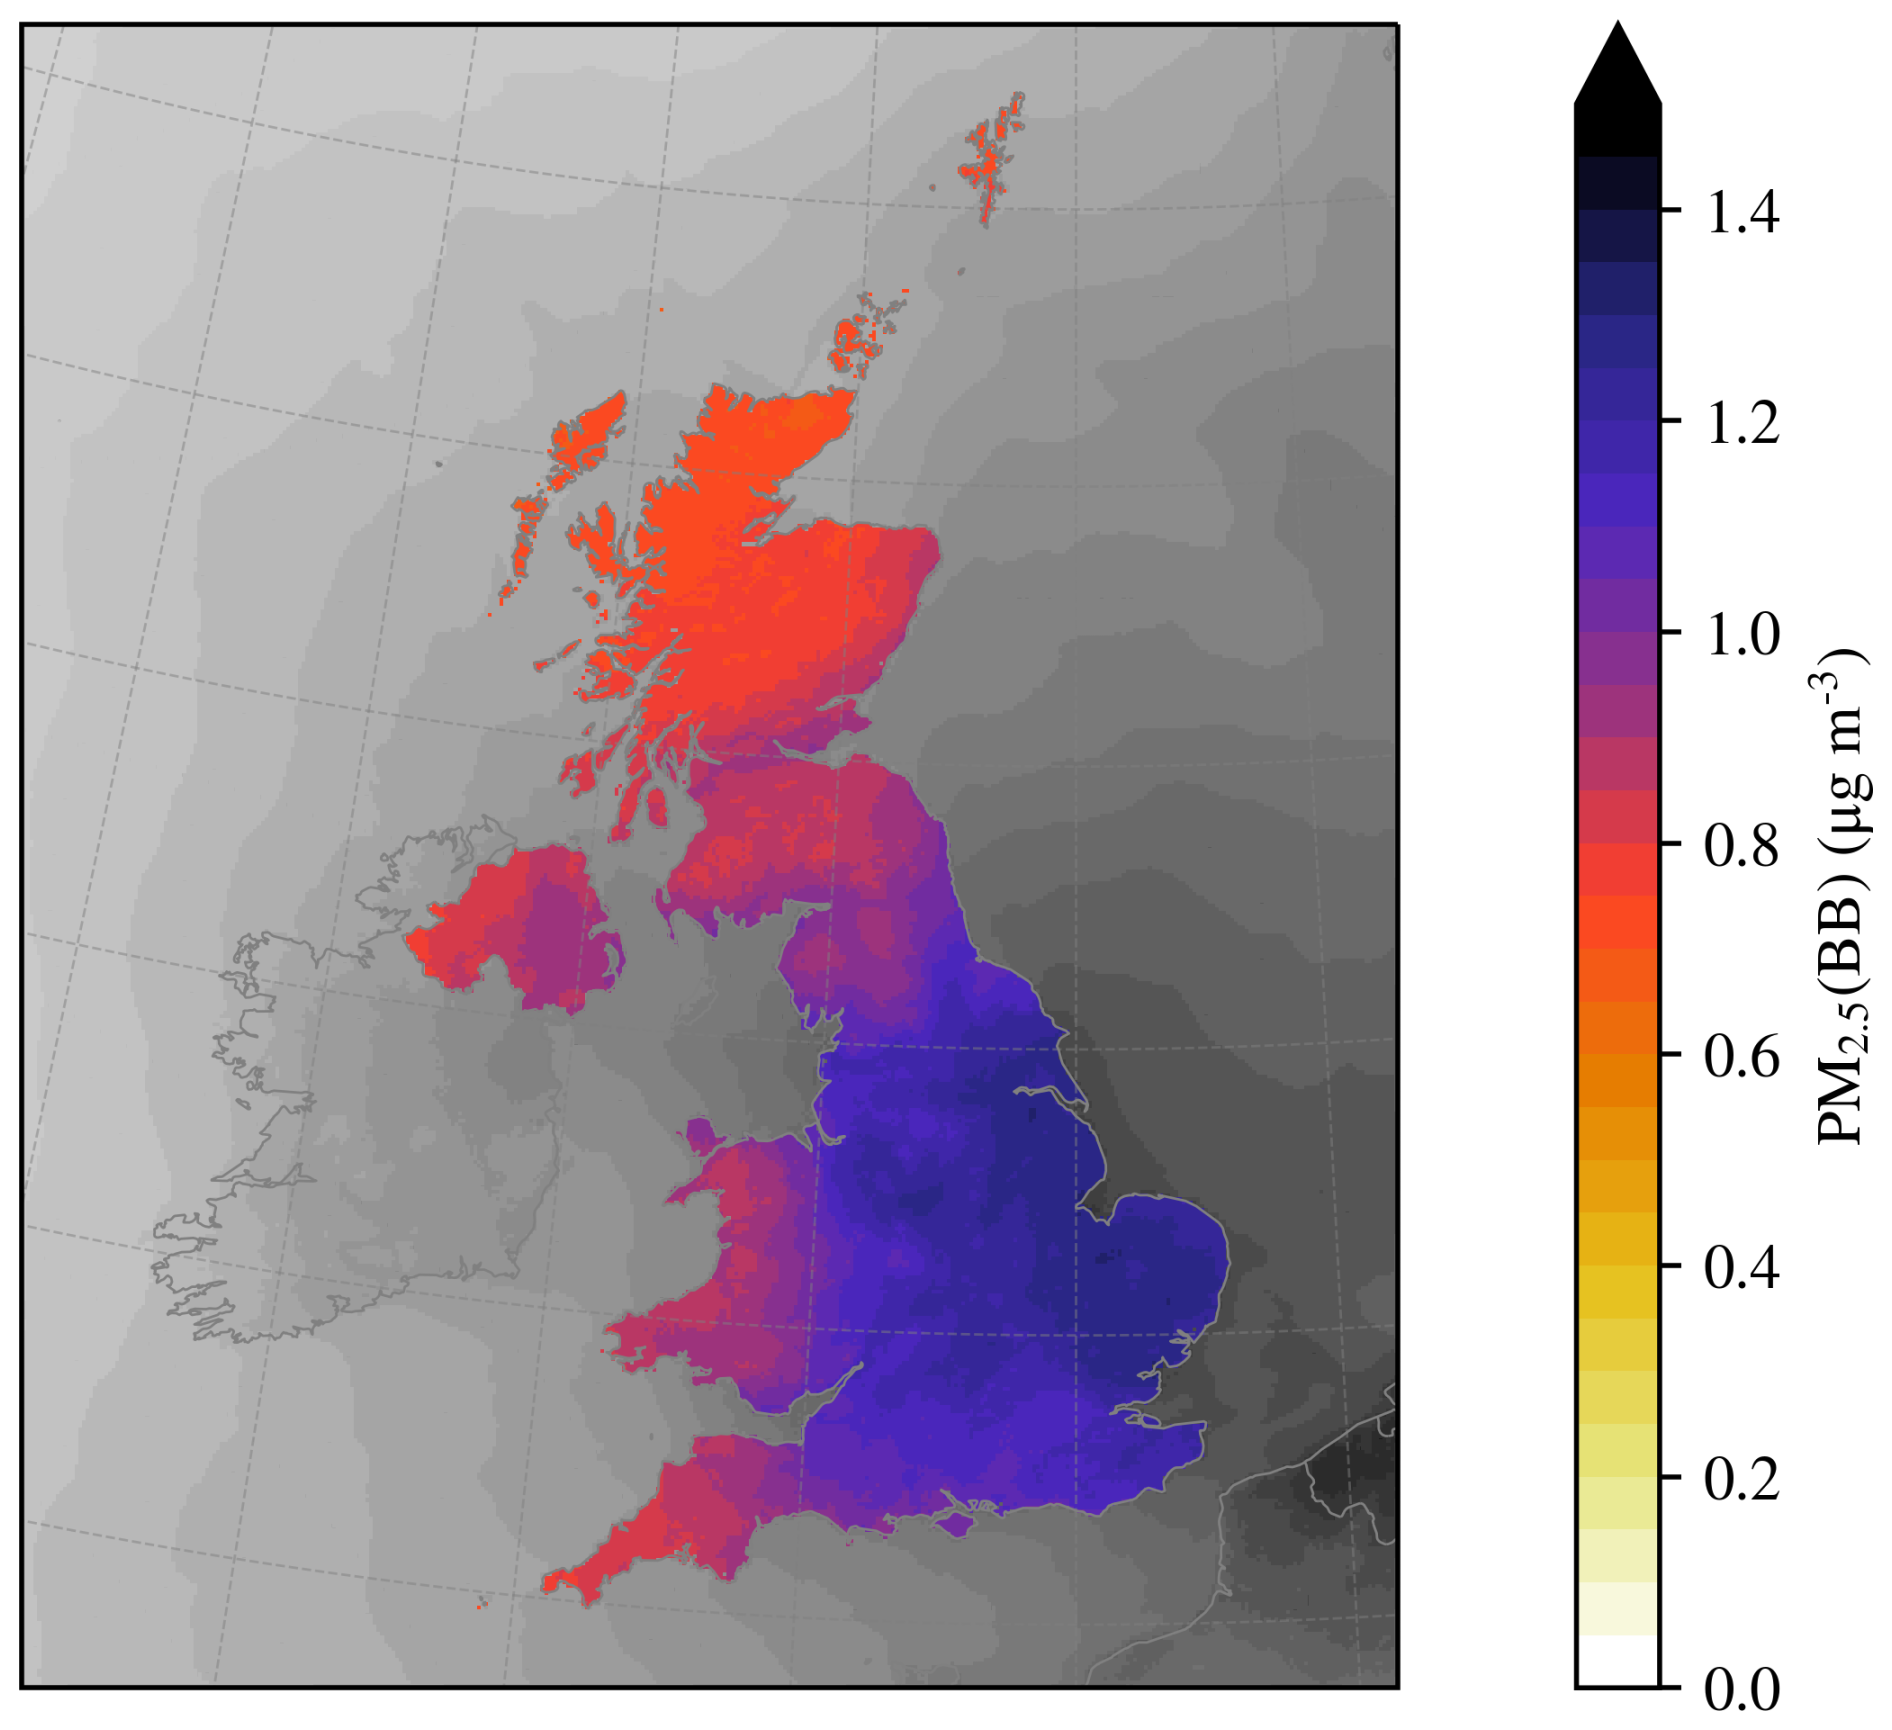
Figure 3The spatial distribution of 2019 UK annual mean PM2.5 concentrations conditional on BB (PM2.5(BB)). Values outside the UK are coloured grey in order to focus attention on the areas that contribute to calculations of UK statistics. The bins used in the grey shading align with those in the colour legend enabling their values to be extrapolated from the latter.
Table 1UK-wide 2019 annual means of the corresponding time series shown in Fig. 4a–e. (a) Percentage contributions of PM2.5 conditional on biomass burning (PM2.5(BB)) and PM2.5 from all other sources to total UK annual mean PM2.5. (b) Annual mean and population-weighted annual mean PM2.5(BB) concentrations, and the maximum and minimum PM2.5(BB) concentrations across all the model grid cells over UK landmass. (c, d, e) Percentage contributions to the UK annual mean PM2.5(BB) concentration split by (c) BB emissions in the UK, the European model domain and the global model domain (as defined in Fig. 1), (d) primary vs. secondary components, and (e) chemical composition. Percentage contributions to UK annual mean PM2.5(BB) corresponding to Fig. 4f are shown in Fig. 2.
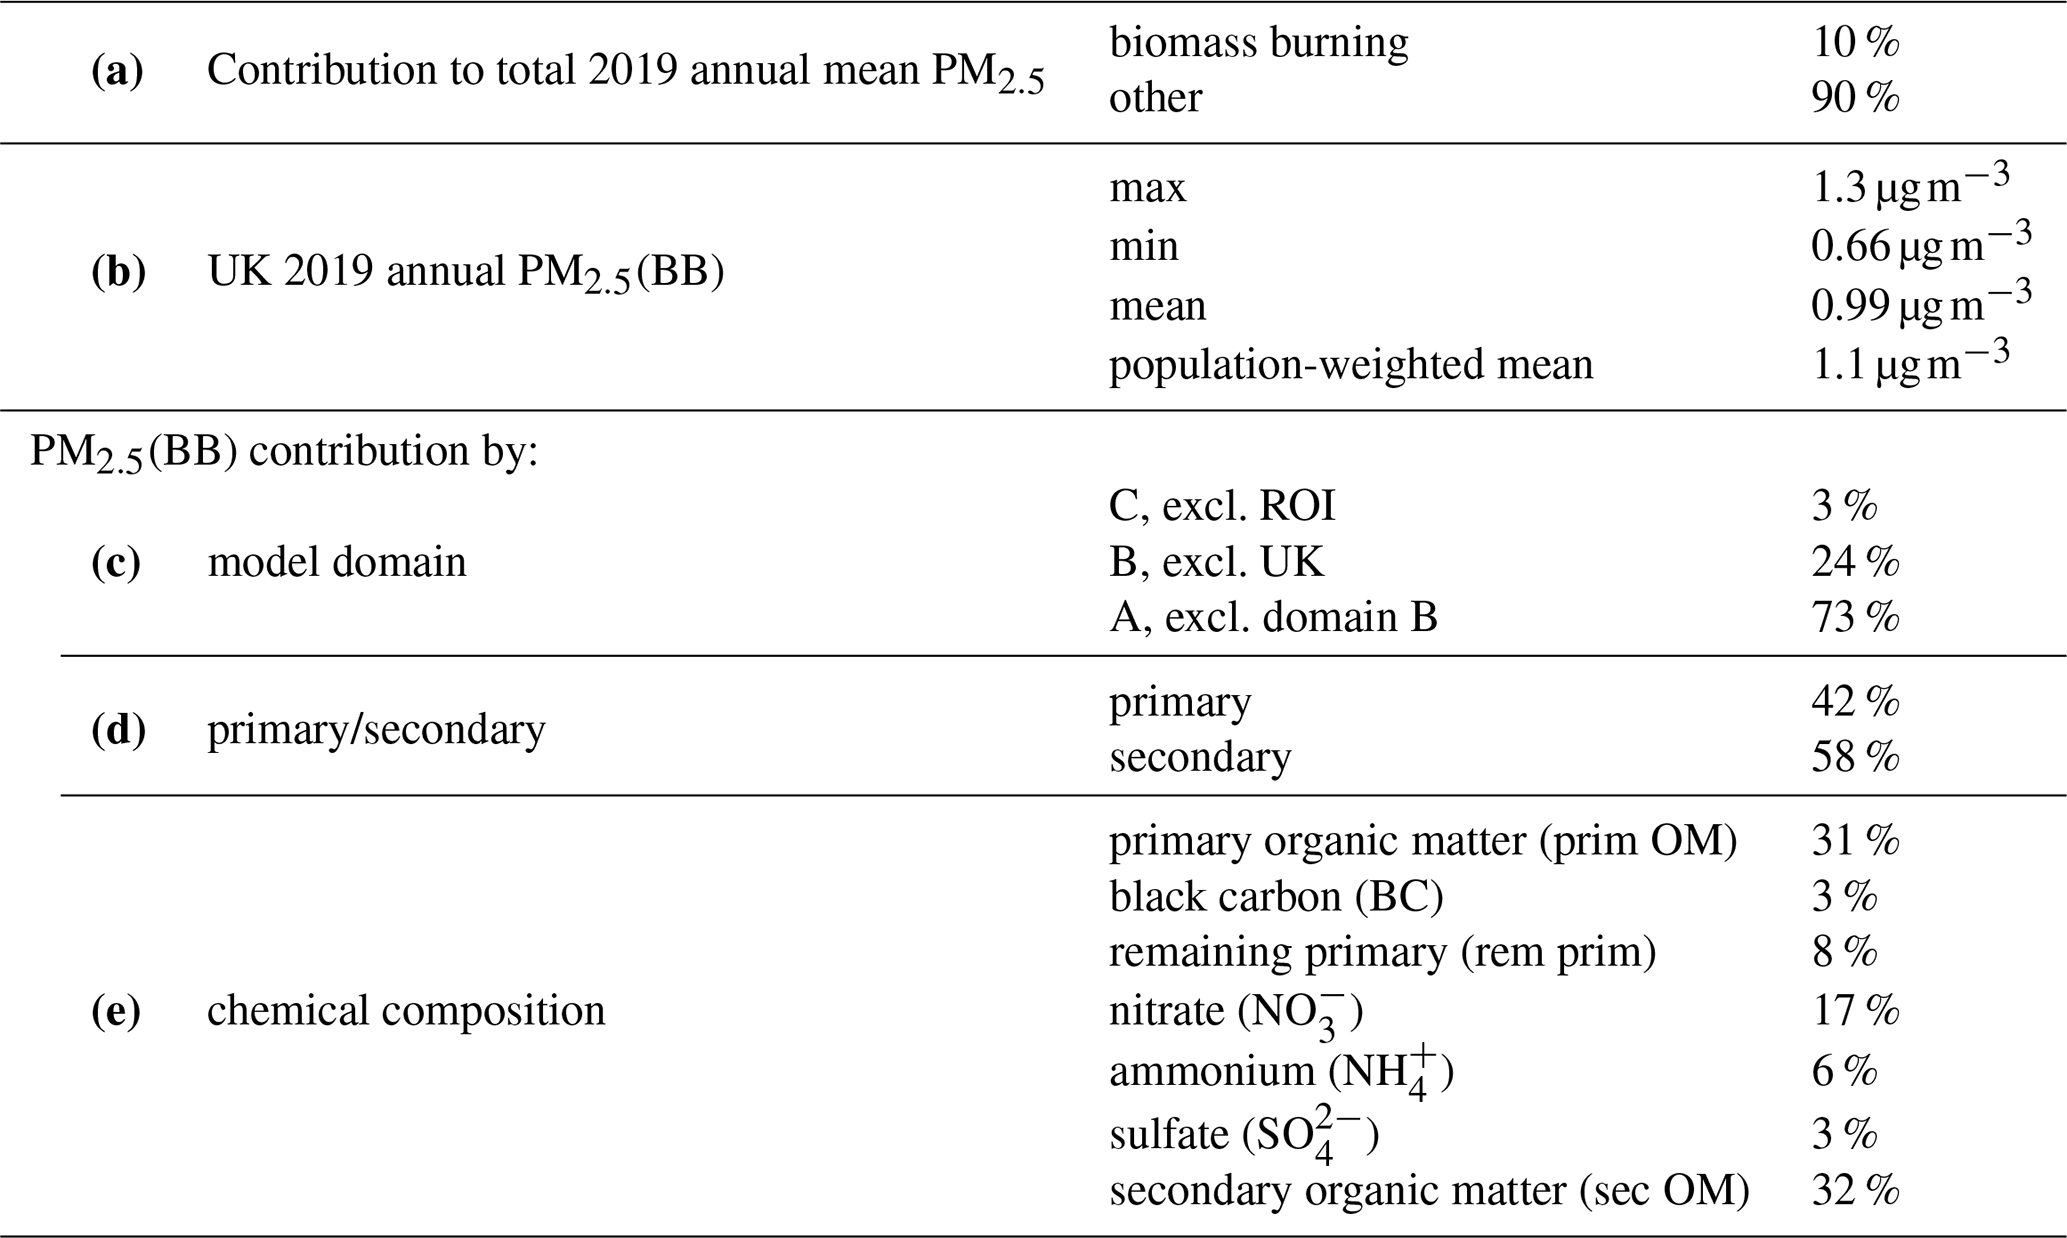
Figure 4 provides 2019 UK daily mean time series of the quantities related to PM2.5(BB). Total PM2.5 (all sources) is plotted in Fig. 4a (left y axis), with the contribution of PM2.5(BB) in blue and all other contributions to PM2.5 in grey stacked on top; the right y axis and purple line show the daily percentage contribution of PM2.5(BB) to total PM2.5. Table 1a shows that, on an annual-mean basis, PM2.5(BB) contributes 10 % to the 2019 UK annual mean PM2.5. This contribution will vary greatly geographically, with the relative contribution being lower at PM2.5 concentration hotspots and higher at background locations.
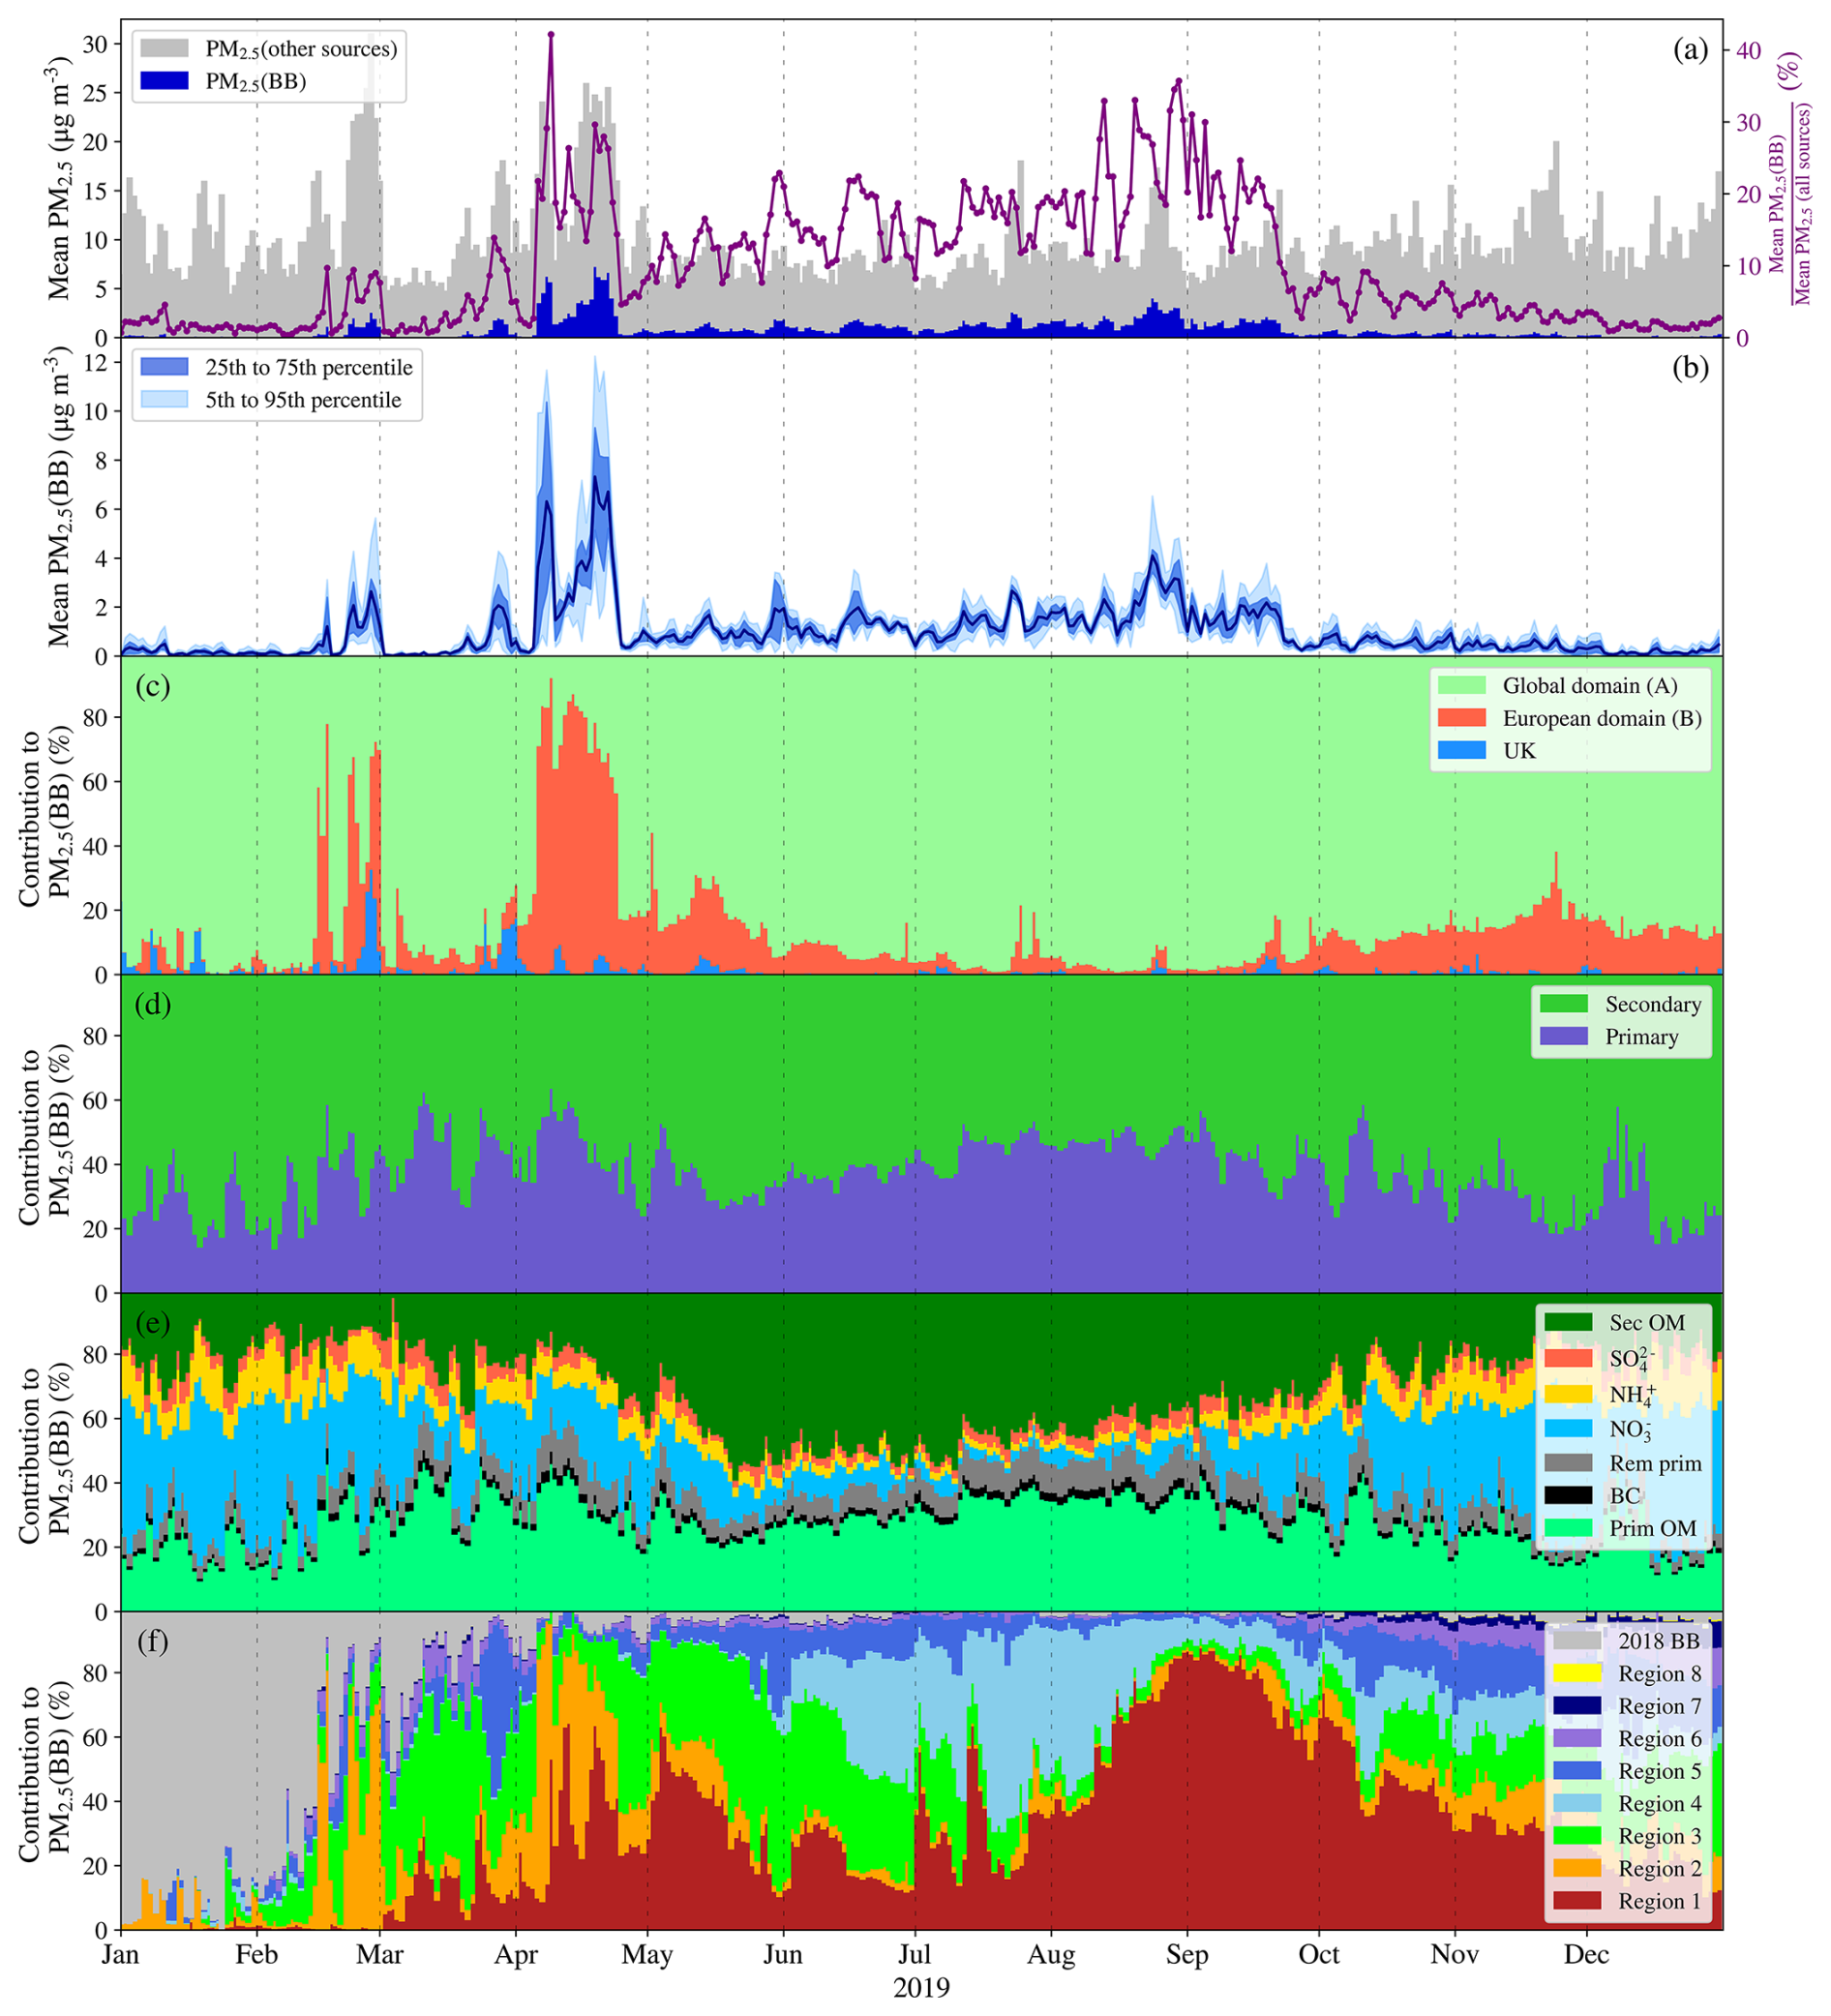
Figure 4Time series of daily mean values (for 2019) of quantities related to UK-average PM2.5(BB), i.e. to PM2.5 conditional on biomass burning emissions. (a) Left y axis: UK daily mean PM2.5, with the contribution of PM2.5(BB) in blue, and all other contributions in grey stacked on top; right y axis (purple): percentage contribution of PM2.5(BB) to total PM2.5 (all sources). (b) Daily mean PM2.5(BB), with shading showing the 25th to 75th and 5th to 95th percentiles of PM2.5(BB) values across all the model grid cells over UK landmass. (c–f) The percentage contributions to daily mean PM2.5(BB), split by (c) BB emissions in the UK, the European domain (Fig. 1) and globally, (d) primary and secondary components, (e) chemical composition (legend abbreviations defined in Table 1), and (f) BB emissions in the source regions 1–8 defined in Fig. 2. The grey area in panel (f) represents contributions from BB emissions in 2018 and a minor contribution from non-linear interactions between model experiments. The absolute PM2.5(BB) concentrations shown in panel (b) should be noted when considering the relative contributions to PM2.5(BB) in panels (c)–(f) to avoid over-interpretation of contributions to negligible absolute concentrations.
Figure 4b shows the UK daily mean PM2.5(BB) in 2019 (blue line), with the 25th to 75th percentile envelope (dark shading) and the 5th to 95th percentile envelope (light shading) of the daily mean PM2.5(BB) values across all the model grid cells over UK landmass. The maximum and minimum model grid cell annual mean PM2.5(BB) concentrations are 1.3 and 0.66 µg m−3, respectively (Table 1b). The UK-wide annual mean and population-weighted annual mean concentrations of PM2.5(BB) are 0.99 and 1.1 µg m−3, respectively (Table 1b).
Figure 4c shows the percentage contribution to 2019 UK daily mean PM2.5(BB) by BB emissions from the UK, the European domain (defined in Fig. 1) and the global domain. The corresponding contributions of BB emissions from these three domains to the 2019 UK annual mean PM2.5(BB) are 3 %, 24 % and 73 %, respectively (Table 1c).
Figure 4d apportions the chemical composition of the 2019 UK daily mean PM2.5(BB) into primary and secondary components, with a more detailed chemical composition shown in Fig. 4e. The annual mean values corresponding to the quantities plotted in Fig. 4d and e are provided in sections Table 1d and e respectively.
Figure 4f shows the percentage contributions to 2019 UK daily mean PM2.5(BB) from BB emissions in the 8 source regions defined in Fig. 2. The grey colour is the contribution to UK daily mean PM2.5(BB) from BB emissions in 2018 (source-receptor experiments were only carried out for 2019). This illustrates that long-range impacts of BB on the UK have timescales of several weeks. A minor contribution to the grey colour also derives from non-linear interactions of BB-related species not captured by the “brute force” model experiments – in which all relevant BB emissions are switched off in a given model perturbation run. The annual contributions of the BB emissions from each source region to UK PM2.5(BB) are shown in Fig. 2. The percentages on this figure do not sum to 100 % for the two aforementioned reasons in relation to the grey colour in Fig. 4f.
Annual mean surface concentrations of PM2.5 conditional on biomass burning (PM2.5(BB)) are considered here because annual mean surface PM2.5 is the metric of air pollution associated with the greatest human health burden, and is consequently subject to air quality guidelines and standards.
4.1 The need for global-scale modelling
Data in Table 1c reveal that a majority (73 %) of the 2019 UK annual mean PM2.5(BB) derives from BB emissions outside the EMEP4UK model's European domain. This clearly demonstrates that continental-scale modelling is insufficient to capture the full contribution of BB and that a global nesting approach is needed to provide realistic and spatially and temporally resolved boundary conditions to regional ACTMs in order to accurately capture the very long-range impacts of BB emissions. These long-range contributions from episodic emissions, such as from BB, would not be accurately captured through the prescribed boundary conditions of the standard configuration of EMEP4UK.
4.2 Biomass burning contributions to UK PM2.5
In 2019, the annual mean PM2.5(BB) associated with all BB emissions globally is 0.99 µg m−3 (averaged over the UK), which is a significant proportion (10 %) of total annual mean UK PM2.5 from all sources (Table 1). To the authors' knowledge, no other studies quantify the long-term contributions of the long-range transport of BB globally on UK PM2.5, to allow comparison here. The equivalent population-weighted PM2.5(BB) value associated with all BB emissions globally is 1.1 µg m−3, or 22 % of the WHO PM2.5 annual mean guideline concentration (WHO, 2021). Averaged over the UK and the full year, the PM2.5(BB) comprises of more secondary aerosol than primary aerosol (58 % and 42 %, respectively) (Table 1d). The dominant primary component is primary OM, constituting a proportion of 31/42, or 74 %, of the primary PM2.5(BB). BC from BB emissions comprises just 3 % of PM2.5(BB) (7 % of the primary PM2.5(BB)). Within the secondary component of UK annual mean PM2.5(BB), 55 % is SOA and 45 % is SIA, the latter dominated by NH4NO3 (Table 1e). The enhanced NH4NO3 formation is a subtle but important indirect consequence of BB emissions: the BB emissions change global oxidant concentrations which react with the large anthropogenic emissions of NOx and NH3 in the UK (and elsewhere) (Tan et al., 2025b). The extent to which this component is reproduced by a standard regional implementation of a model such as the EMEP MSC-W model depends on the concentrations of oxidant drivers, such as CO, used as boundary concentrations. The standard setup of the EMEP4UK model uses prescribed boundary concentrations for CO (with a latitudinal gradient); these long-range chemical influences are another reason why a global version of the model is required. Other models such as GEOS-Chem (The International Chem User Community, 2025; Marvin et al., 2024) and CHIMERE (Menut et al., 2013; Mazzeo et al., 2022) often pick up their boundary concentrations from global model outputs, and if these include BB emissions should take account of this contribution. In contrast to NH4NO3, the model output indicates that the UK SOA conditional on BB is formed through the oxidation of pyrogenic VOC emissions, rather than through oxidation of locally emitted VOCs via a mechanism similar to that underpinning the BB-induced NH4NO3 formation (Tan et al., 2025b).
The above discussion is based on UK averages for the whole year. The PM2.5(BB) concentrations vary spatially across the UK (Fig. 3) and temporally during the year (Fig. 4). Largest values of PM2.5(BB) occur in the southeast (maximum model grid cell annual mean value of 1.3 µg m−3), and lowest values in the northwest (miniumum grid cell annual mean value of 0.66 µg m−3). Meteorology plays a major role in explaining this southeast-northwest gradient, with the majority of contributions to PM2.5(BB) arising from BB emissions in Regions 1, 2 and 3 to the east of the UK (Fig. 2). South, east and central England also have large anthropogenic emissions of NOx and NH3, as do other densely populated areas of the UK such as central Scotland (see Figs. A1 and A2 in Appendix A). As a result, SIA formation conditional on BB is particularly enhanced in these areas (Tan et al., 2025b), which contributes to the southeast-northwest gradient and to the superposition of spatial patterns of UK anthropogenic emissions on this gradient.
The greater population-weighted 2019 annual UK mean PM2.5(BB) of 1.1 µg m−3, compared with the annual mean PM2.5(BB) of 0.99 µg m−3, shows that larger absolute PM2.5(BB) exposures coincide with more densely populated areas of the UK (see Fig. A1 in Appendix A). This is a consequence of both meteorology and higher anthropogenic emissions of NH3 and particularly of NOx in highly populated regions, resulting in enhanced NH4NO3 formation conditional on BB in the higher populated regions (Tan et al., 2025b).
With respect to the temporal variabilities in BB contributions to UK PM2.5, Fig. 4 shows that the colder months of October to March are generally characterised by low concentrations of PM2.5(BB) (daily mean values less than 1 µg m−3). For the year of study here – 2019 – this period of low PM2.5(BB) concentrations is interspersed with episodes of higher concentrations in February, March and April, which can be attributed to sources closer to the UK. Highest PM2.5(BB) concentrations occur during a prolonged episode in April when daily mean PM2.5(BB) exceeds 5 µg m−3 for 6 d and contributes between 13 % and 42 % of daily mean PM2.5 from all sources. The PM2.5(BB) contribution is superimposed on an already elevated episode of PM2.5 pollution caused by the easterly air flow conditions that increase long-range transport of PM2.5 and its precursors from continental Europe into the UK, together with reducing dispersion, as per analyses of previous spring-time episodes (Vieno et al., 2014, 2016a). Particulate nitrate in particular is often found to peak in early spring in the UK due to easterly air flow (Charron et al., 2013; Abdalmogith and Harrison, 2005) and increased agricultural emissions of NH3 at this time (Vieno et al., 2016a). The majority of the PM2.5(BB) component during this episode is associated with BB in the model's European domain (predominantly from eastern Europe and the western areas of Russia also included in that domain). Similar episodic peaks in PM2.5(BB) occur at the end of February and March 2019, with values exceeding 1 µg m−3 on 13 d, and 2 µg m−3 on 5 d. Notably, there is a larger contribution from BB in the UK here, as revealed in Fig. 4c, as well as contributions from southern Europe in the February episode. This is consistent with Copernicus Atmosphere Monitoring Service (CAMS) reports of notable BB activity in the UK, northern Spain, southern France, Portugal and southeastern Europe in February 2019 (Copernicus, 2019).
Although there are no large variations in the proportions of primary and secondary PM2.5(BB) during the year (Fig. 4d), there is a notable trend for the secondary component to consist more of SIA in winter and more of SOA in summer (Fig. 4e); the lower temperatures in winter shift the NH4NO3 equilibrium to the particle phase (Stelson and Seinfeld, 1982). Figure 4b and d show a tendency for the lowest concentrations of PM2.5(BB) to have a larger proportion of secondary aerosol (confirmed by a scatter plot of daily percentage secondary contribution vs. daily mean PM2.5(BB), not shown). This is because PM2.5(BB) concentrations are lowest when the associated BB sources are further removed from the UK receptor region, but the longer transport distances provide more time for secondary chemical transformations.
The warmer months of May to September are characterised by a continuous period of moderately elevated PM2.5(BB), with daily mean values ranging between 0.4 and 4.1 µg m−3. The mean (±1 standard deviation) daily value over this period is 1.4 ± 0.7 µg m−3. This occurs at a time of lower total PM2.5 concentrations (all sources), resulting in a contribution of PM2.5(BB) ranging between 6 and 36 %. In this period, the contribution from SIA is lower due to the increased NH4NO3 dissociation constant at warmer temperatures (Stelson and Seinfeld, 1982). There is a higher contribution of SOA relative to the primary component due to increased oxidation and emission of VOCs at higher temperatures and greater sunlight. The majority of this PM2.5(BB) is attributed to BB outside the model's European domain, with larger contributions from Regions 1 (2019 Siberian wildfires; Bondur et al., 2020; Cho et al., 2025), 3 and 4 of Fig. 2.
The extended period of elevated PM2.5(BB) during the warmer months dominates the annual mean values in Table 1. The largest contributions to PM2.5(BB) are ascribed to BB in Regions 1 (Russia), 2 (Europe), 3 (Asia excluding Russia) and 4 (boreal North America), with respective contributions of 43 %, 19 %, 15 % and 11 % (Fig. 2). Only 3 % is attributed to BB within the UK. Southern hemispheric BB makes negligible contribution to UK PM2.5(BB) (< 2 %). Approximately 5 % of PM2.5(BB) is attributed to BB in the previous year (2018), for which the NRxBB experiments were not performed due to the computational expense involved. However, whilst its geographic origin has not been identified, it provides useful information about the spin-up time of BB-related species, which Fig. 4f shows is approximately 3 months. Although only global model runs were used for the NRxBB experiments – and therefore the exact percentages shown in Fig. 2 would likely differ slightly if these had been followed by additional European and UK nesting – these experiments nevertheless provide a good indication of the relative contribution of BB emissions in Regions 1–8 to UK PM2.5(BB) values.
4.3 Biomass burning contributions in 2019 compared to other years
Figure 5a compares the annual total global BB emissions of PM2.5 for 2019, split by Regions 1–8 (Fig. 2), with the emissions from all other years from 2012 to 2023 according to the FINNv2.5 dataset. The spatial distribution of BB emissions for 2019 is shown in Fig. C1 in Appendix C. Although 2019 has the highest global emissions in the 2012–2023 period, this is driven by anomalously high emissions in the southern hemisphere (especially Region 8 of Fig. 2 – the Australian “Black Summer” of 2019–2020; Davey and Sarre, 2020; Zhang et al., 2020), which our modelling shows do not impact the UK.
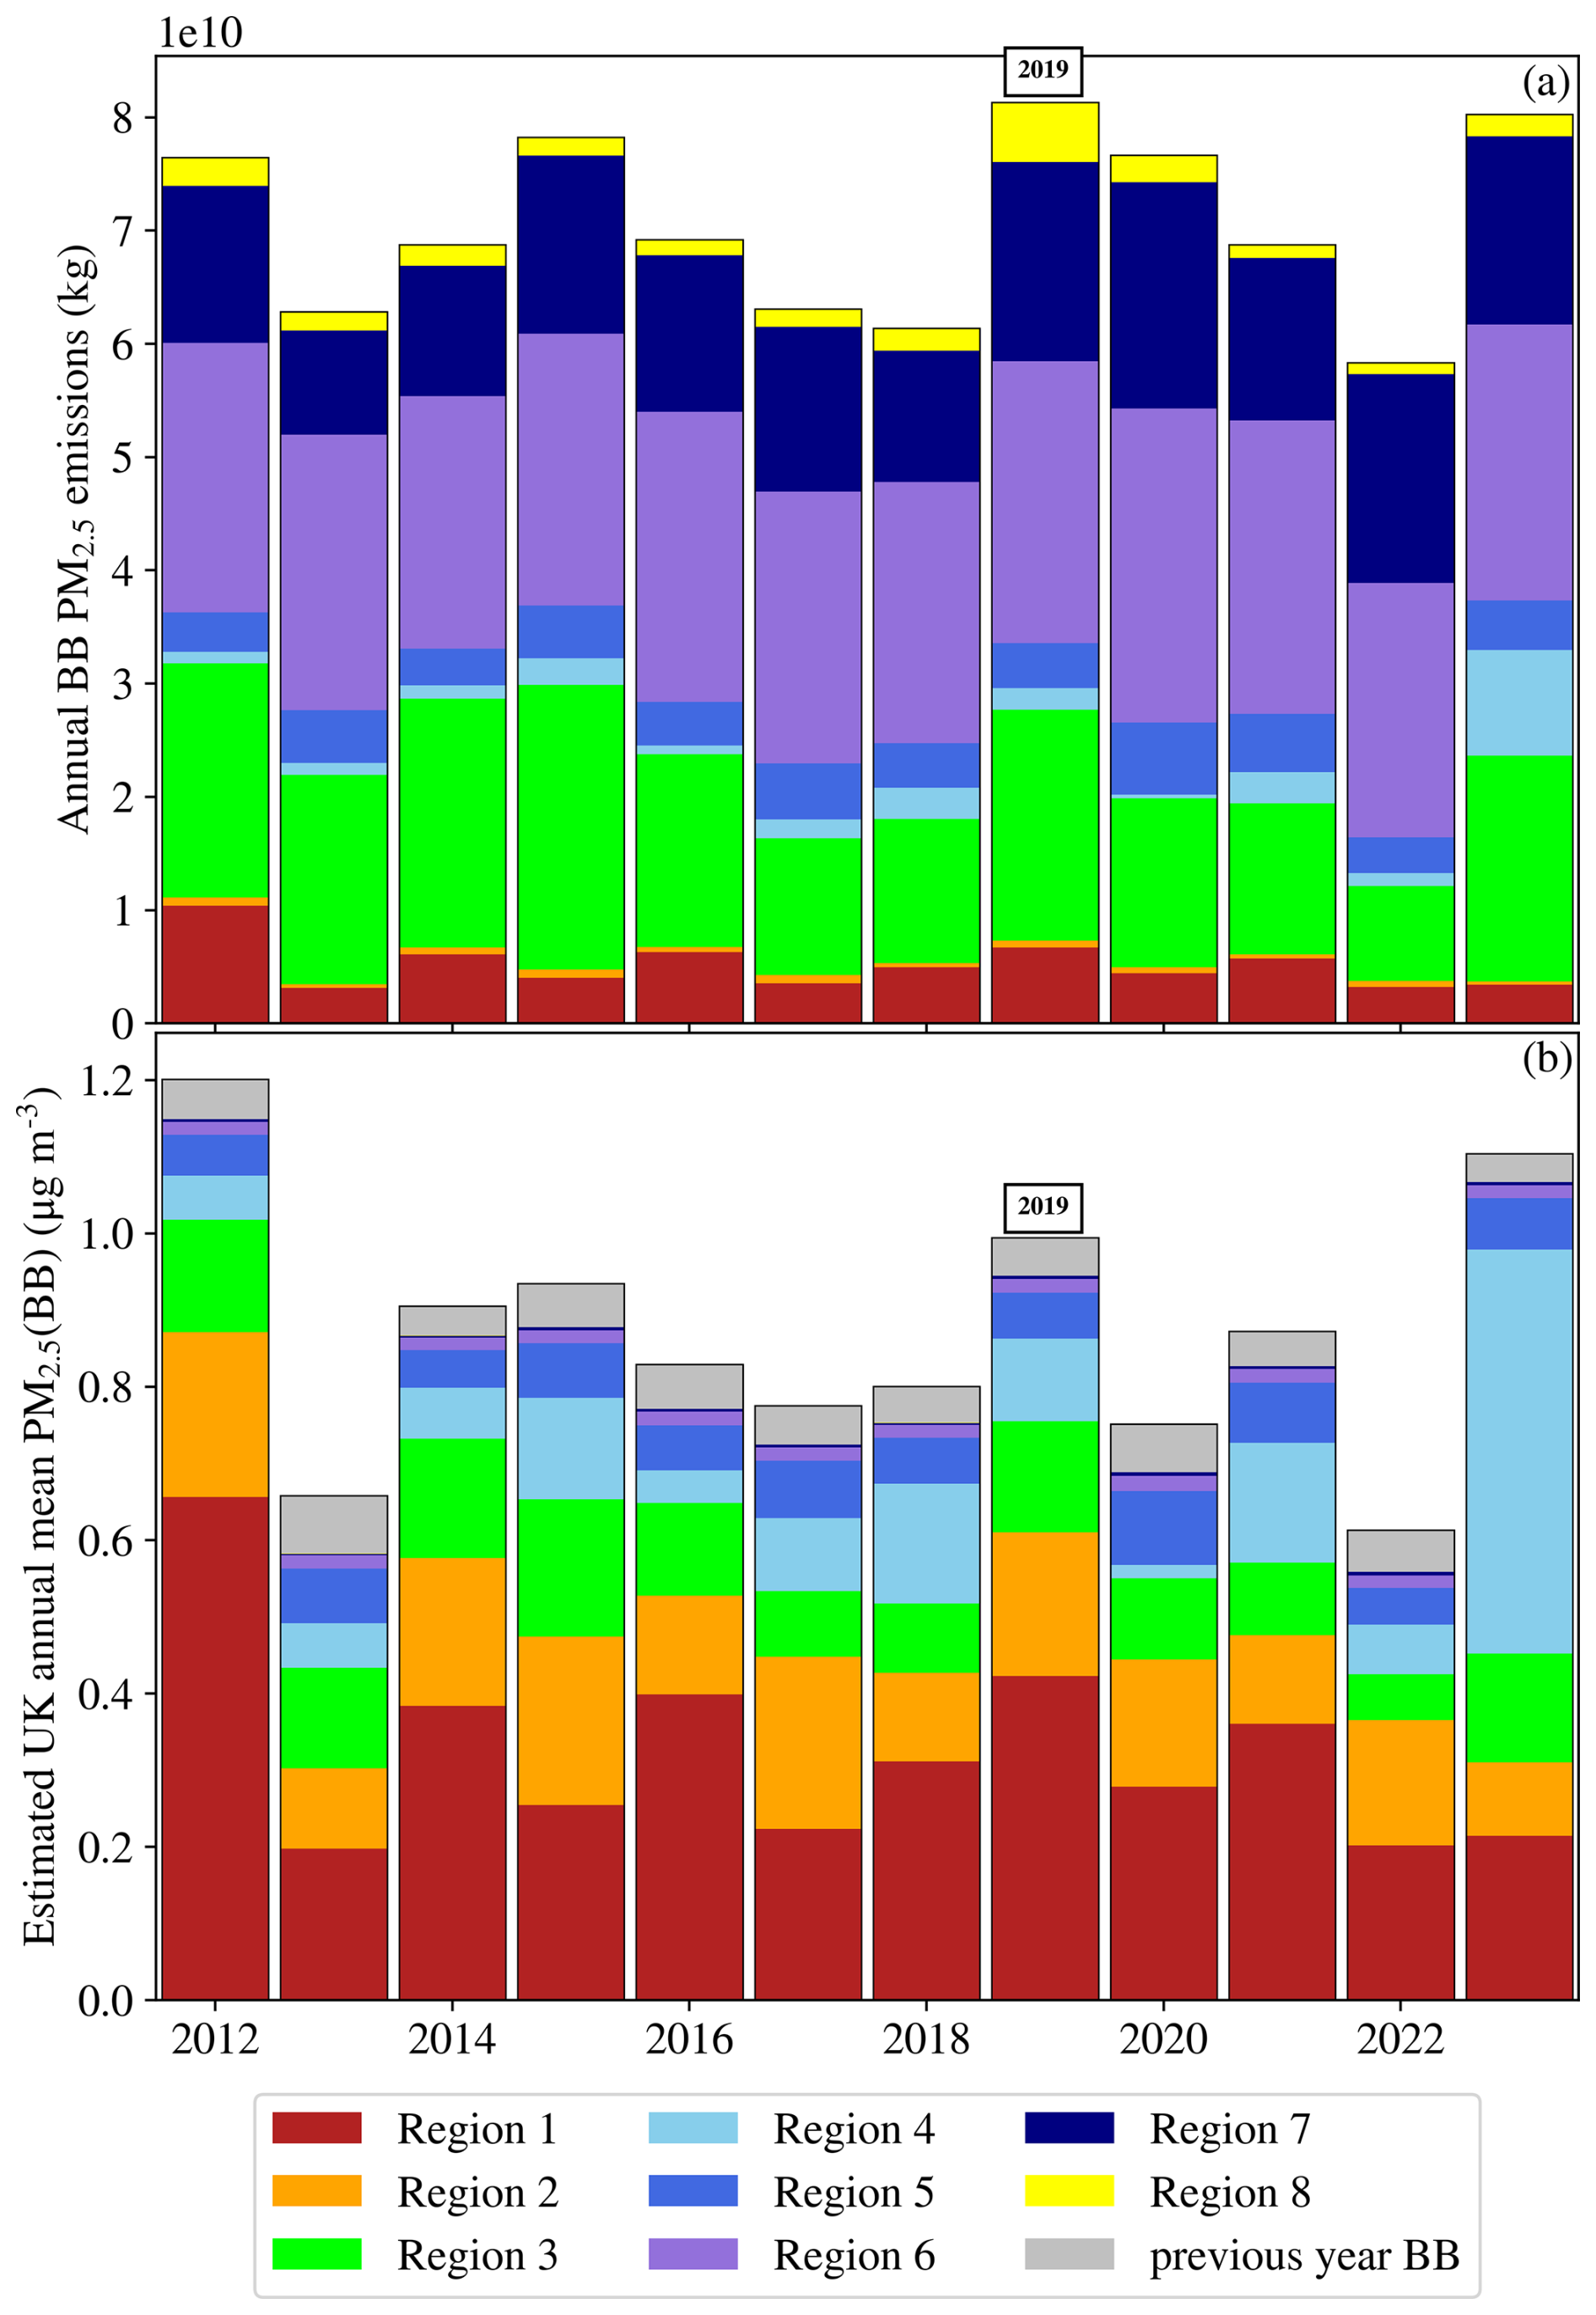
Figure 5(a) The contributions from Regions 1-8 to annual global BB emissions of PM2.5 from 2012 to 2023, using data from FINNv2.5 (Wiedinmyer et al., 2023). Regions are defined in Fig. 2. (b) An estimate of the contributions of the source region emissions shown in panel (a) to UK annual mean PM2.5(BB) in 2012 to 2023, using 2019 as a reference year. The methodology and its assumptions are described in the main text. The bar for 2019 in panel (b) shows the absolute annual means corresponding to the relative contributions shown in Fig. 4f.
Figure 5b provides an estimate of how much PM2.5 in the UK would likewise have been conditional on BB emissions from each Region 1–8 in each of the other years from 2012 to 2023, based on the assumption that the source-receptor relationships calculated for 2019 are applicable also to the other years. Annual BB emissions of PM2.5 from each region were weighted according to the impact of the 2019 BB emissions from that region on UK PM2.5(BB) in 2019, using the following method. First, the multiplication factor required to convert the 2019 BB emissions of PM2.5 (Fig. 5a) into the UK 2019 annual mean PM2.5(BB) for Regions 1–8 was calculated. This was applied to the annual BB emissions of PM2.5 for 2012 to 2023 to give the corresponding values in Fig. 5b. The component attributed to BB in the previous year (grey stack in Fig. 5b) was obtained by calculating a separate multiplication factor, relating the component of 2019 UK annual mean PM2.5(BB) attributed to BB in 2018 (grey stack in the 2019 bar in Fig. 5b) with the estimated UK annual mean PM2.5(BB) for 2018 (excluding the remaining component from 2017) (non-grey stacks in the 2018 bar in Fig. 5b). This factor was then applied to each year, n − 1, between 2012 and 2022, to give the component of UK annual mean PM2.5(BB) in year n attributed to BB in year n − 1. The value for the year 2012 is an average of the years 2013–2023, as this is the earliest year for which the BB emissions data used here were available.
This methodology makes the assumptions that: (i) most importantly, annual source-receptor relationships hold across each year, i.e. the combination of the locations and times of the BB emissions and the long-range meteorological transport in other years is similar to that in 2019; (ii) emissions of other species from BB, for example CO, are proportional to the trends in PM2.5 emissions; (iii) anthropogenic emissions remain sufficiently similar across the time period that variations in oxidant fields and secondary aerosol formation depend principally on changes in magnitudes of BB emissions.
Whilst the values in Fig. 5b include these assumptions, the figure provides an indication of the contributions of BB emissions globally to UK PM2.5 in all these other years without running an unfeasibly large number of sensitivity experiments. The 2023 estimate for Region 4 (0.5 µg m−3) can be validated by comparison to literature values of European PM2.5 exposure from the 2023 Canadian wildfires (Zhang et al., 2025). It is within the 95 % confidence interval of 0.32–0.50 µg m−3, providing confidence that the assumptions made here are not unreasonable.
The mean contribution calculated across these years is 0.87 ± 0.17 µg m−3, where the uncertainty range is the associated standard deviation of the annual values. This weighting method suggests that 2019 is not an exceptional year for UK PM2.5(BB) (within 1 standard deviation of the mean), despite this year having high BB emissions globally. This is because inter-annual variability of UK PM2.5(BB) is dominated by variability in northern hemispheric BB emissions, particularly Regions 1, 2 and 4 (Fig. 2), which are not exceptionally high in 2019. The contribution of BB in Region 4 (boreal North America), in particular, is expected to be significantly larger in recent years, with intense wildfire activity in 2023 (Jones et al., 2024a; Zhang et al., 2025), 2024 and 2025 (Kelley et al., 2025).
4.4 Study caveats
This study uses a single model – a novel, globally nested version of the EMEP4UK model. Model output will vary with the associated chemical and deposition schemes and meteorological model used, and the spatial resolution of the global model run. It will also vary with the choice of anthropogenic and BB emissions datasets (which may have different spatial patterns, timings and magnitudes of emissions). For example, FINNv2.5 has generally larger emissions than other BB datasets (Wiedinmyer et al., 2023) such as FINNv1.5 (Wiedinmyer et al., 2011), GFED4 (Giglio et al., 2013) or Global Fire Assimilation System (GFAS)v1.2 (Kaiser et al., 2012). Choice of the BB emissions dispersion scheme is also an important factor, particularly on a regional scale, though this has been found to be less important when considering long-range transport and longer time-scales (Whaley et al., 2025; Field et al., 2024), as are being considered in this work. These caveats apply to any similar study using an atmospheric model.
The comparison between modelled and measured PM2.5 components for the model setup used here is discussed in Appendix B. Although, on an annual-mean scale the model overestimates total PM2.5 compared to measurements, the predominant contributor to this is the overestimation of sea salt, which has no influence on this study. It is not possible directly to validate model results of PM2.5(BB) and its components because measurement-based source apportionment approaches cannot distinguish between domestic wood burning and open BB, as their levoglucosan and potassium marker compounds are common to both sources. Measurements also cannot distinguish the portion of inorganic NH4NO3 that depends on the BB impact on atmospheric oxidants. This illustrates the advantages of using ACTMs to reveal the complex relationship between source and receptor regions which measurements alone cannot.
While the specific numerical values of model output presented here are inevitably subject to much uncertainty, the use of a long-standing and well-validated ACTM and internationally-accepted input datasets provides confidence that these findings are broadly correct.
This study has highlighted that BB emissions can have significant impact on annual mean surface PM2.5 in locations such as the UK, that are generally well removed from the main regions of BB. The 2019 UK annual mean PM2.5(BB) of ∼ 1 µg m−3 is highly policy relevant since it constitutes 10 % of the annual mean total PM2.5 concentration, and 20 % of the 5 µg m−3 WHO guideline value for PM2.5 (WHO, 2021). The impact of BB emissions therefore needs to be considered when seeking to reduce PM2.5 concentrations towards the WHO guideline value. Since 97 % and 73 % of UK PM2.5(BB) are respectively associated with BB emissions outside the UK and outside the European model domain (Table 1c and Fig. 1), it may appear at first sight that most of the PM2.5(BB) lies outside national, and even European, policy control. However, reducing local anthropogenic NH3 and NOx emissions may contribute to mitigation of the SIA component conditional on BB emissions (which, for the UK in 2019, constituted 26 % of PM2.5(BB), see Table 1e).
These long-range impacts of BB can only be fully revealed with models that simulate atmospheric chemistry and transport processes at the global scale (or at least at the scale of the relevant northern or southern hemisphere). The need for a global-scale approach is particularly important when considering components of PM2.5(BB) that cannot be identified as a consequence of BB using measurements alone, for example the NH4NO3 conditional on BB emissions that are a long distance from the receptor location (Tan et al., 2025b).
The influence of PM2.5(BB) is likely to become relatively more important as nations seek to reduce local anthropogenic emissions, such that smaller transboundary contributions to PM2.5 pollution become more relevant. The proportion of PM2.5 in UK and Europe that is conditional on BB emissions is also likely to increase in future because literature suggests that this region will experience increases in wildfire frequency, magnitude and intensity (UNEP, 2022; Fernandez-Anez et al., 2021; Perry et al., 2022; Arnell et al., 2021; Burton et al., 2025; Albertson et al., 2010), whilst conventional anthropogenic sources will likely remain static or decrease further. (It remains unclear, however, if, or to what extent, any potential associated reductions in the SIA component conditional on BB may mitigate the increase in the non-SIA component.) There is indication that extratropical wildfires, which this study has shown to dominate the BB impacts on the UK, are particularly strongly influenced by climatic factors compared with human activity (Jones et al., 2024b; Cunningham et al., 2024; Garroussi et al., 2024; Xie et al., 2022). This provides additional impetus for limiting climate change.
A1 UK population map
Figure A1 shows the gridded 1 km × 1 km UK population map from Carnell et al. (2025), which uses data from the 2022 (Scotland) and 2021 (rest of the UK) Censuses and a 2021 Land Cover Map. This population data was used to calculate the population-weighted mean of PM2.5 conditional on biomass burning (PM2.5(BB)) in Table 1 in the main text.
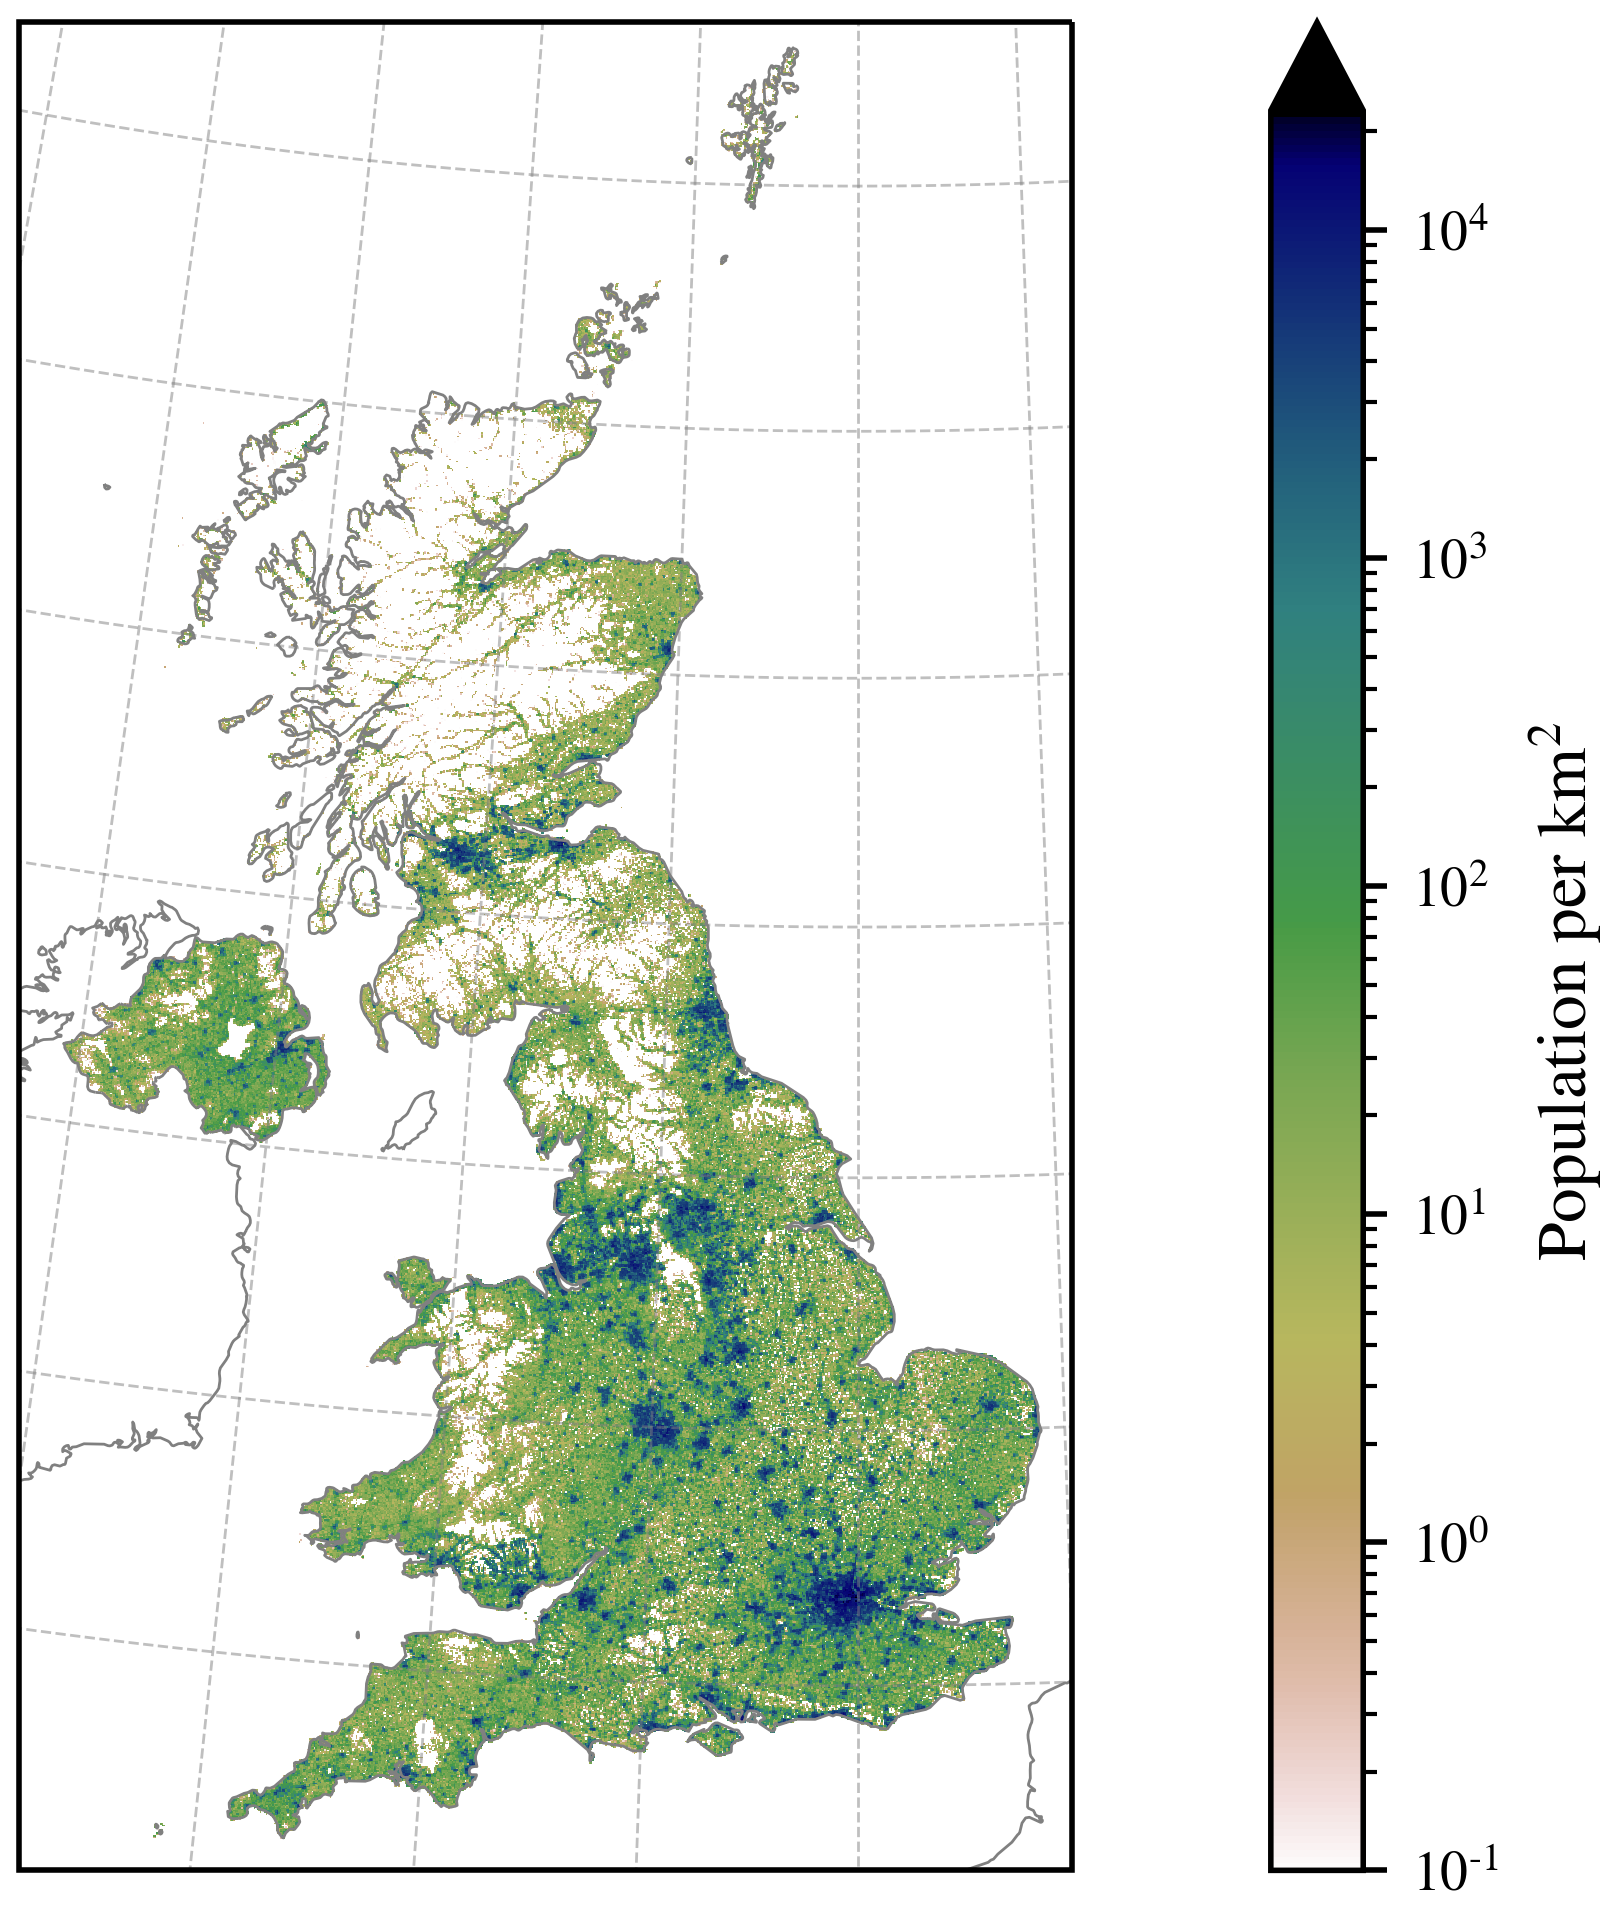
Figure A1Gridded 2021 UK population data obtained from Carnell et al. (2025), which uses data from the 2022 (Scotland) and 2021 (rest of the UK) Censuses and a 2021 Land Cover Map.
A2 UK emissions and related concentrations
Figure A2 shows maps of total annual emissions from all sources of (a) NOx and (b) NH3 used in the model's domain C, and the model simulated annual mean surface concentrations of (c) NOx and (d) NH3. These maps confirm that areas of largest PM2.5(BB) concentrations in the UK correspond to areas of large NOx and NH3 emissions. This is because of the localised contribution of in situ NH4NO3 formation conditional on changes in oxidant concentrations brought about by BB emissions (Tan et al., 2025b).
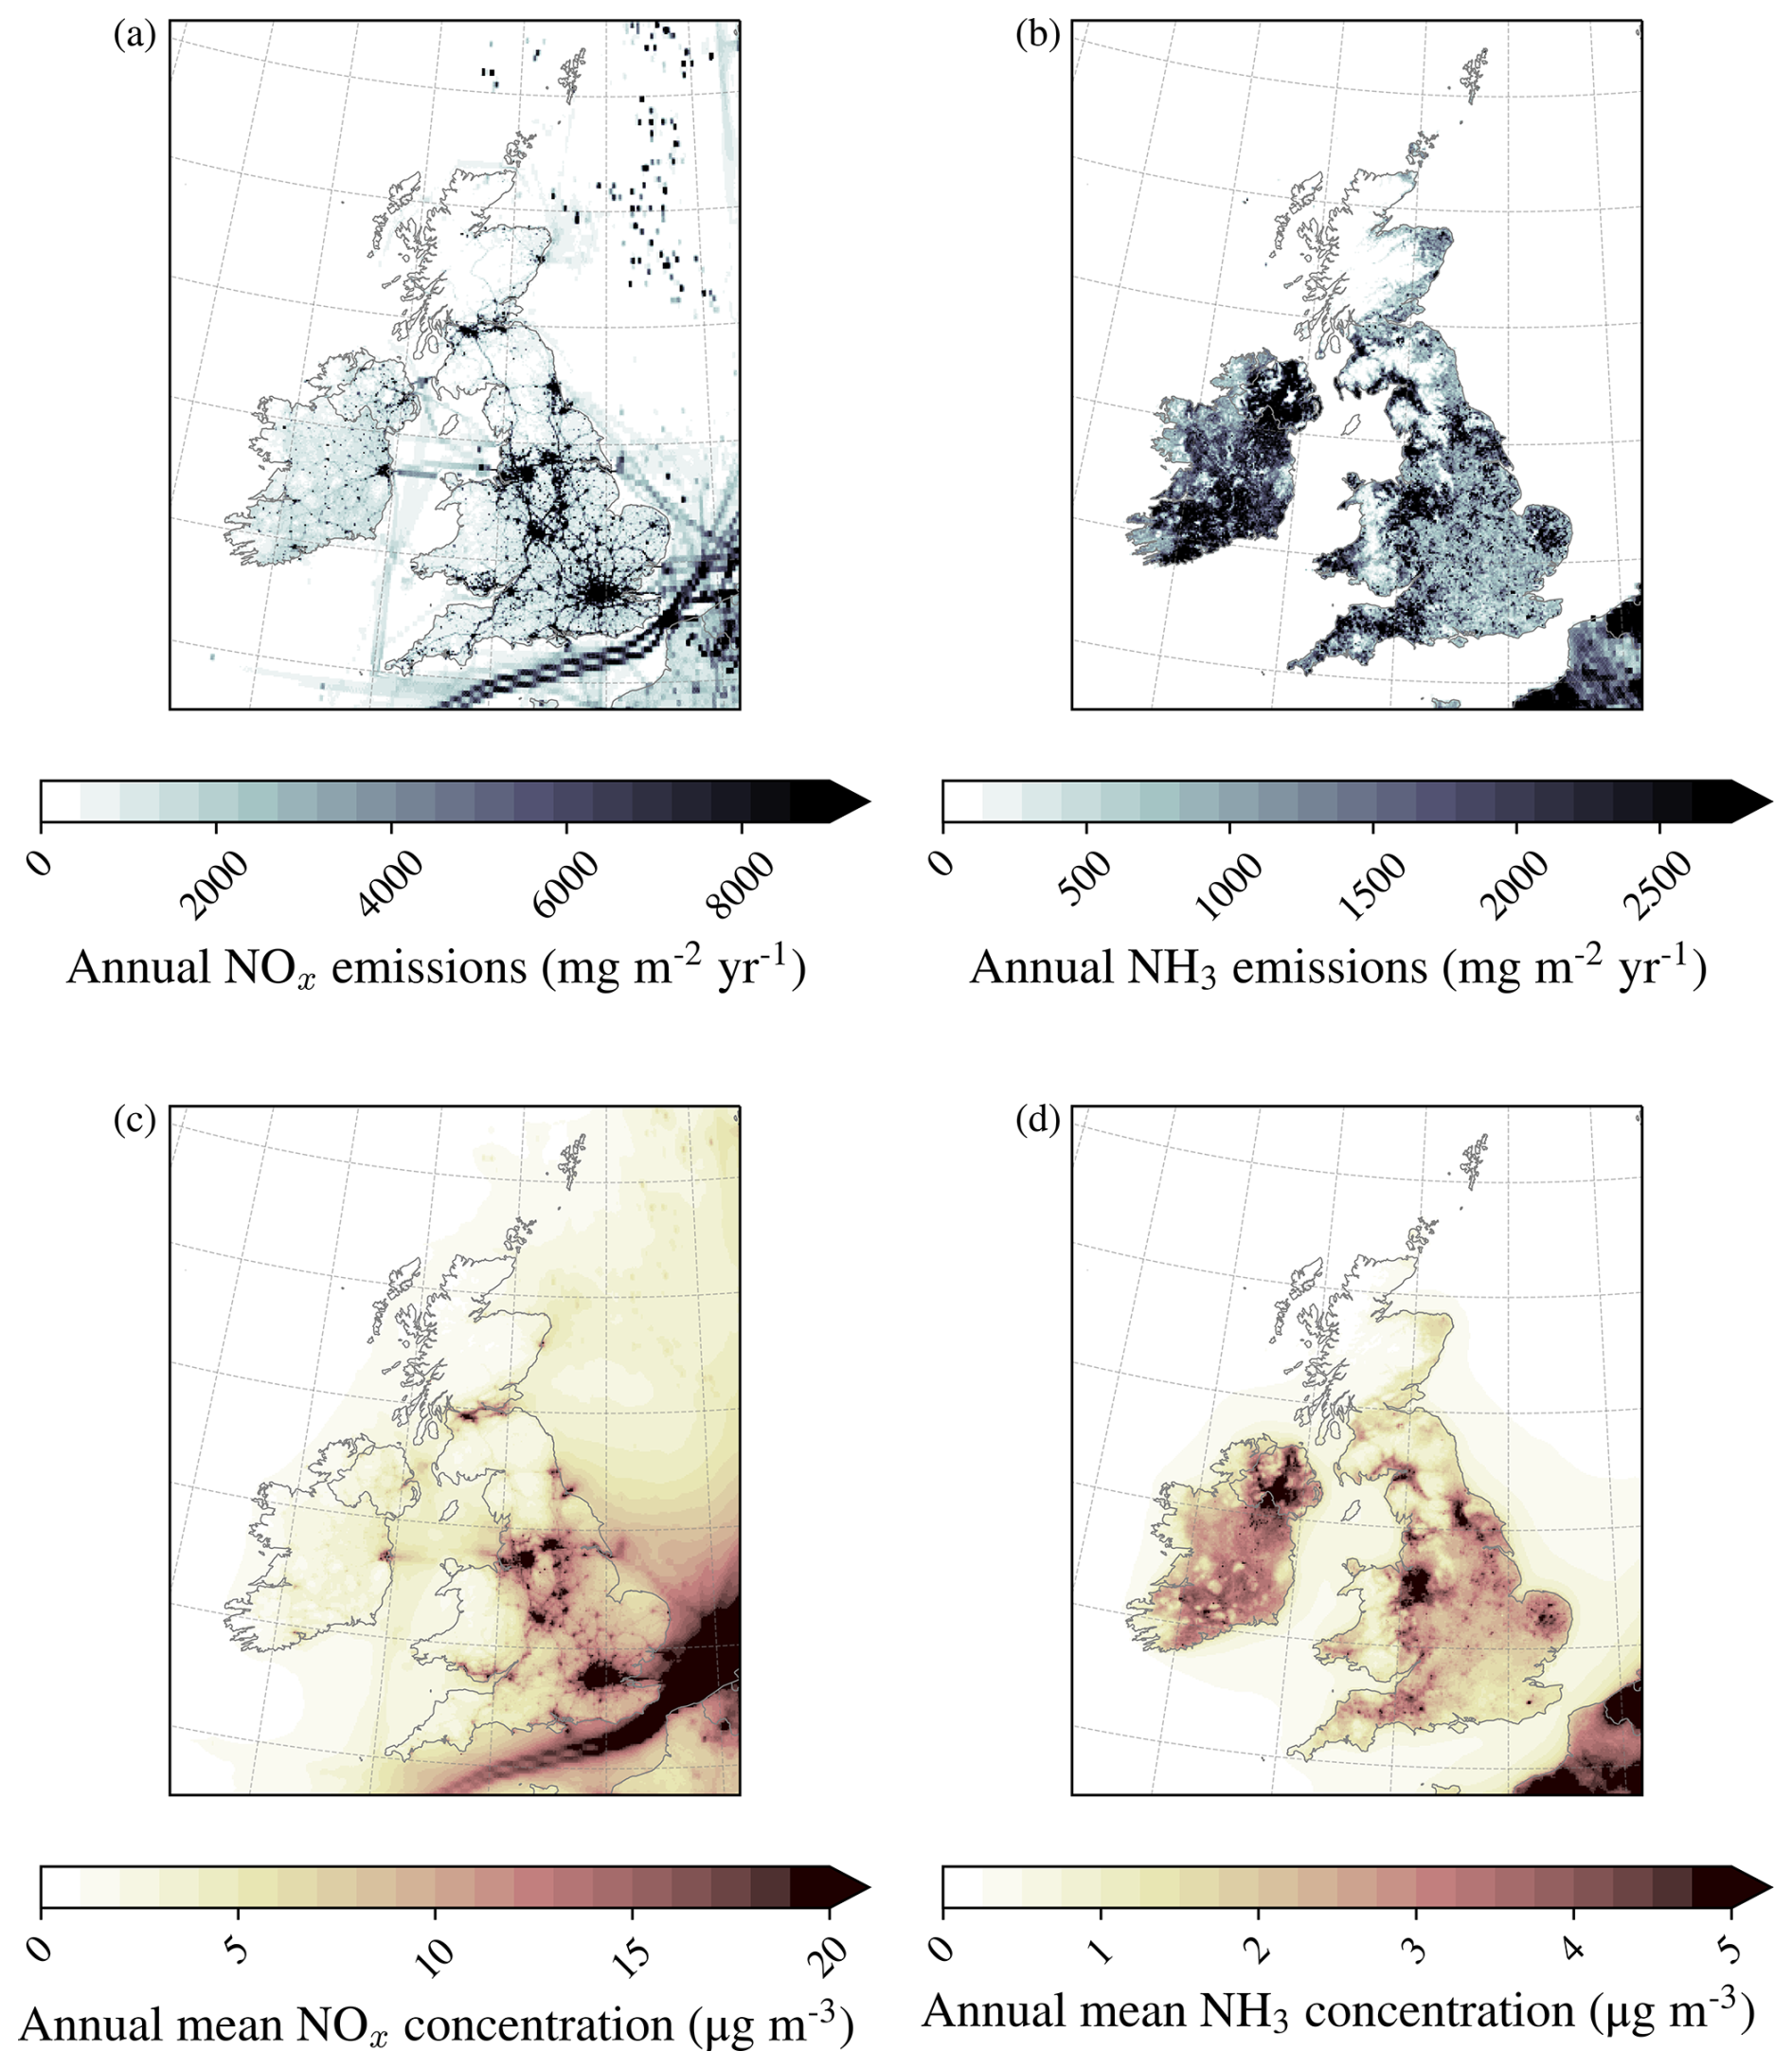
Figure A2Total 2019 annual emissions (all sources) of (a) NOx and (b) NH3 used in the BASE model run over domain C, and the resultant 2019 annual mean surface concentrations of (c) NOx and (d) NH3.
EMEP4UK is a UK application of the EMEP MSC-W Eulerian ACTM (Simpson et al., 2012). In its standard configuration, EMEP4UK operates over the two domains labelled B (199 × 169 grid cells) and C (369 × 447 grid cells) in Fig. 1 of the main paper. It utilises prescribed initial and boundary conditions for long-lived species, as described by Simpson et al. (2012). These derive from simple functions that vary with altitude, time, and in some cases with latitude. They apply to many components of PM2.5 such as SO, NO, NH and sea salt, as well as species which influence PM2.5 components such as some VOCs, CO, NOx, nitric acid (HNO3) and peroxyacyl nitrate (PAN). These boundary condition concentrations vary sinusoidally with time, and their magnitudes decay exponentially with height down to a minimum value. Ozone (O3) is treated differently, using the “Mace-Head correction”: climatological O3 data are adjusted to measurements at the Mace Head measuring station on the west coast of Ireland. Adjustments are made to all prescribed boundary conditions to account for long-term trends.
This study uses a different setup for the initial and boundary conditions of domain B, with the introduction of an additional global model run (domain A in Fig. 1 of the main text). This provides boundary conditions for domain B which are based on 2019 BB emissions and the 2019 meteorological year. Initial conditions are provided by running the model over domain A for the previous year (2018) to allow for the spin-up of long-lived species. This setup is required when considering the impact of BB emissions, as the majority of BB occurs outside the standard EMEP4UK domains (see Fig. 5 in the main text), and the initial and boundary conditions of the standard EMEP4UK setup cannot capture the highly episodic nature of these emissions.
Figure B1 compares the 2019 annual mean concentrations of the SO, NO, NH, BC, organic matter (OM), dust and sea salt components of PM2.5, from the standard (left bar) and globally nested (middle bar) model setups, and from measurements (right bar), at the (a) Auchencorth Moss, (b) London Honor Oak Park, and (c) Chilbolton Observatory sites. The locations of these sites are shown in the bottom right panel of the figure. Auchencorth Moss and Chilbolton Observatory are rural background sites, whilst London Honor Oak Park is an urban background site. These are the only background sites in the UK at which the majority of the components of PM2.5 are measured simultaneously. Only background sites were chosen to assess the performance of long-range transport for both model setups because sites near to sources contributing to PM2.5 concentrations show strong spatial gradients that cannot be resolved by regional ACTMs. Sites (b) and (c) are located in the part of the UK that is most strongly influenced by PM2.5 conditional on BB (see Fig. 3 of the main text). Measurements were taken from the UK Air data archive (DEFRA, 2025), using all available measurements for a given component to calculate a “best possible” annual mean concentration for that component at that site. Site (b) did not have BC measurements for 2019, so this component has been omitted in all bars of Fig. B1b to allow a like-for-like comparison. Both measurements (where available) and modelling agree that concentrations of BC are small in comparison to the concentrations of other components considered here.
OM at sites (a) and (c) was calculated from measurements of organic carbon by transmittance, using a rural background organic mass upscaling factor of 2.1 (Font et al., 2024). A conversion factor was not required for site (b), as this site has an Aerosol Chemical Speciation Monitor (ACSM) that provides concentrations of OM directly. The measured sea salt concentration was calculated from measurements of sodium (Na+) in PM2.5, using known mass ratios to sea salt and its ionic components (Seinfeld and Pandis, 2016; Twigg et al., 2015). Values for measured dust were derived by scaling measured calcium (Ca2+) concentrations under the arbitrary assumption that dust comprises one-third calcium carbonate. There were no measurements of crustal elements such as Fe, Al, Si and Ti with which to attempt a more sophisticated estimation of dust concentrations. The uncertainty in quantifying a measured dust component is not important, however, since Fig. B1 shows that both modelling and measurement agree that dust is a minor component of PM2.5 at these sites. In addition to all the uncertainties inherent in the methodologies used to derive the modelled and measured concentrations for each of these components, any model-measurement comparison is also subject to uncertainties associated with incomplete temporal coverage in the measurements and comparison between a point measurement and a 3 km × 3 km grid average.
Figure B1 shows that the major components at each site are the secondary inorganic components (SO, NO, NH), OM and sea salt. Although at first glance it appears that the globally nested version of EMEP4UK overestimates compared to measurements, the majority of the overestimation lies within the sea salt component (for all three sites), as well as the contribution from OM at site (a). The percentage overestimations of the modelled estimates of sea salt compared with the measurements at the three sites are (a) 109 %, (b) 193 % and (c) 44 %. This overestimation of sea salt for UK sites is due to changes made in recent versions of the EMEP MSC-W model code to attribute a larger percentage of the sea salt to the fine particulate matter fraction (Fagerli et al., 2021). This was done to improve model performance over Continental Europe, a long way from the sea, but has had the consequence of increasing modelled concentrations of sea salt over the UK, situated on the edge of the Atlantic Ocean and experiencing predominantly westerly air flow. In contrast, the global model inorganic components generally compare very well with the measurements, with percentage differences of (a) 36 %, (b) 10 % and (c) −1 %. The OM component derived using the globally nested model compares well at sites (b) and (c), with percentage differences of 6 % and 10 % respectively, but is overestimated at site (a) by 121 %.
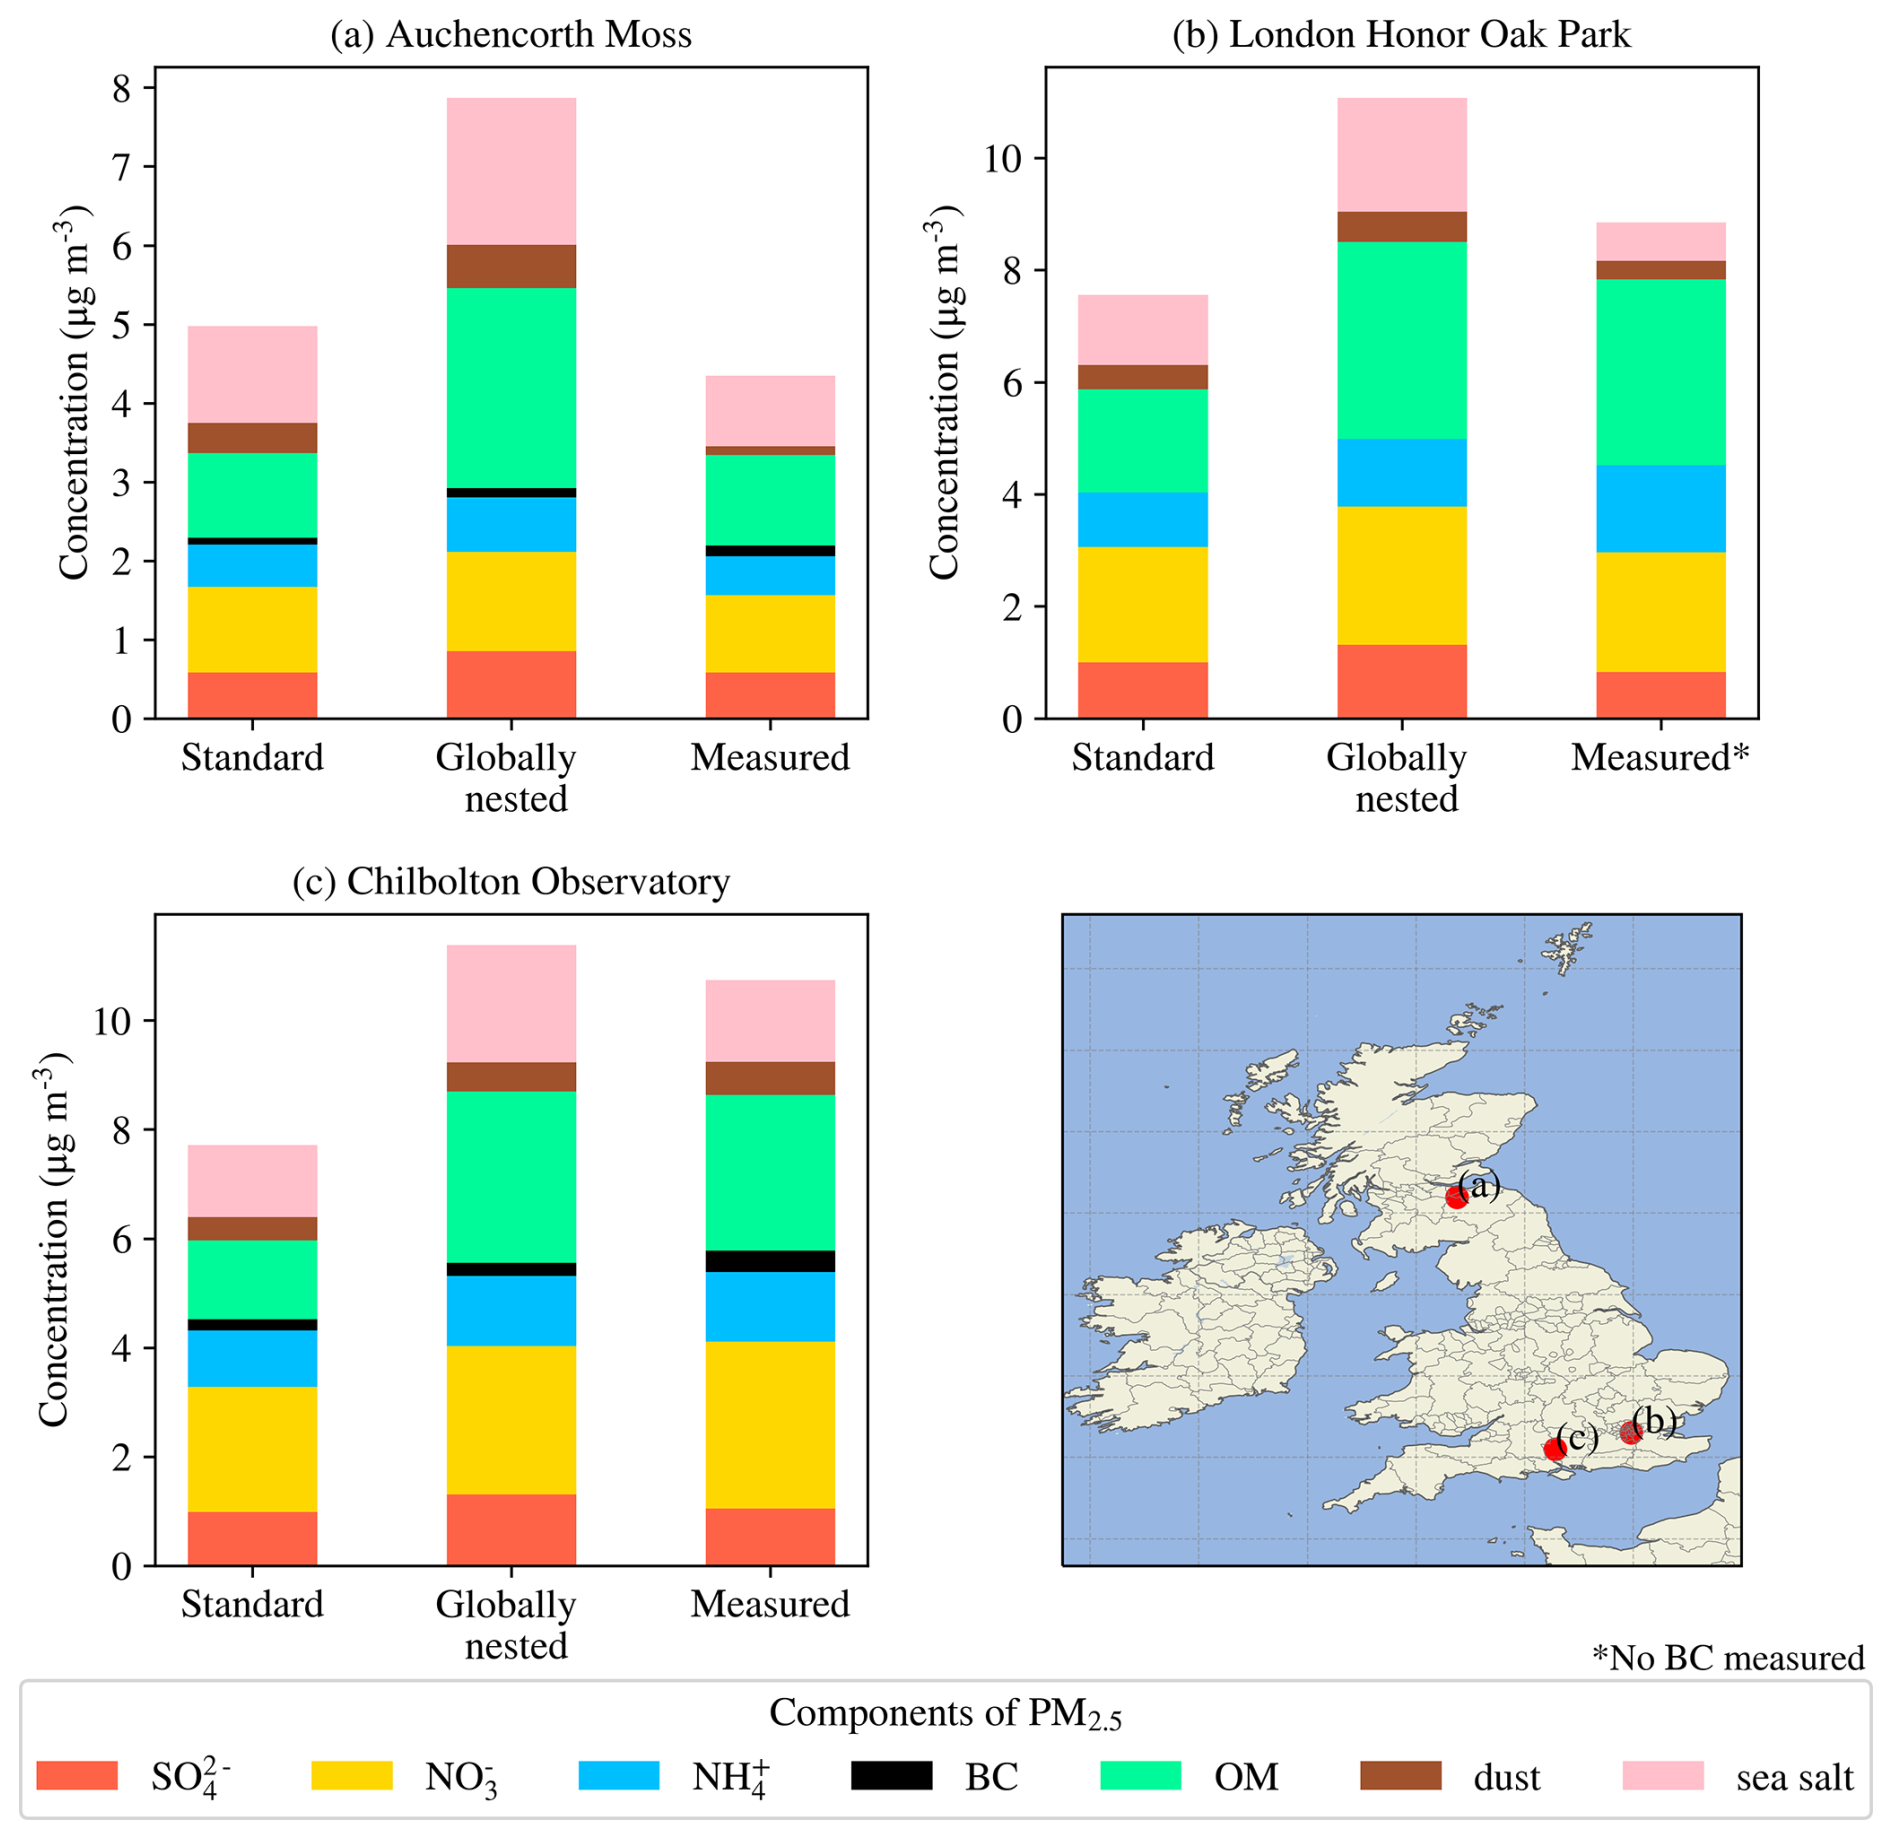
Figure B1Comparison between modelled and measurement-derived SO, NO, NH, BC, OM, dust and sea salt components of PM2.5 at (a) Auchencorth Moss, (b) London Honor Oak Park and (c) Chilbolton Observatory measurement sites. Sites (a) and (c) are rural background sites, site (b) is an urban background site. Site locations are shown in the bottom right panel. The left and middle bar of each panel show the 2019 annual modelled mean concentrations calculated using the standard and globally nested configurations of EMEP4UK, respectively, for the model grid containing the measurement site. The concentrations for each component in the right bar are the averages calculated using all available measurements in 2019 for that component at that site. Measurements were taken from the UK Air data archive (DEFRA, 2025). There were no measurements of BC at site (b) in 2019, so BC has also been omitted from the modelled data at this site.
The standard configuration of EMEP4UK generally underestimates somewhat compared to measurements at all three sites, with the exception of the sea salt component; for the same reasons as for the globally nested setup of the model, sea salt is overestimated at sites (a) and (b) by 38 % and 81 %, respectively. The sea salt overestimation is smaller in this model setup because of the lower amount of ocean surface contained within the standard configuration of EMEP4UK, especially for the southwest wind direction which tends to be associated with the largest wind speeds and sea salt concentrations. There is good agreement for sea salt at site (c) with a model-measurement difference of −12 %. The OM in the standard model configuration compares well with measurements at site (a) with a percentage difference of −6 %, but underestimates at the other sites with percentage differences of −45 % at site (b) and −49 % at site (c) (these are the two sites most influenced by PM2.5 conditional on BB). This is explained by the standard model's failure to capture OM from very long-range transport which originates from beyond model domain B and is also not accounted for in the boundary concentrations. On the other hand, the inorganic components are again well represented by the standard configuration of the model, with percentage differences of 7 %, −11 % and −20 % at sites (a), (b) and (c) respectively. This indicates that, in general, long-range transport of SIA from outside model domain B is less of an issue due to its shorter atmospheric lifetime. The standard model setup will not, however, accurately capture the SIA component conditional on BB, which is dependent on the long-range transport of oxidant drivers emitted by BB, but any underestimation is within the range of uncertainty associated with this model-measurement comparison.
The global distribution of annual BB emissions of PM2.5 for 2019, as estimated by FINNv2.5 (Wiedinmyer et al., 2023), are plotted in Fig. C1. The map highlights Central and South America, Central Africa, Siberia, Southeast Asia, and southeastern Australia as regions with large BB emissions. The FINNv2.5 dataset is the source of the data plotted in Fig. 5a in the main text.
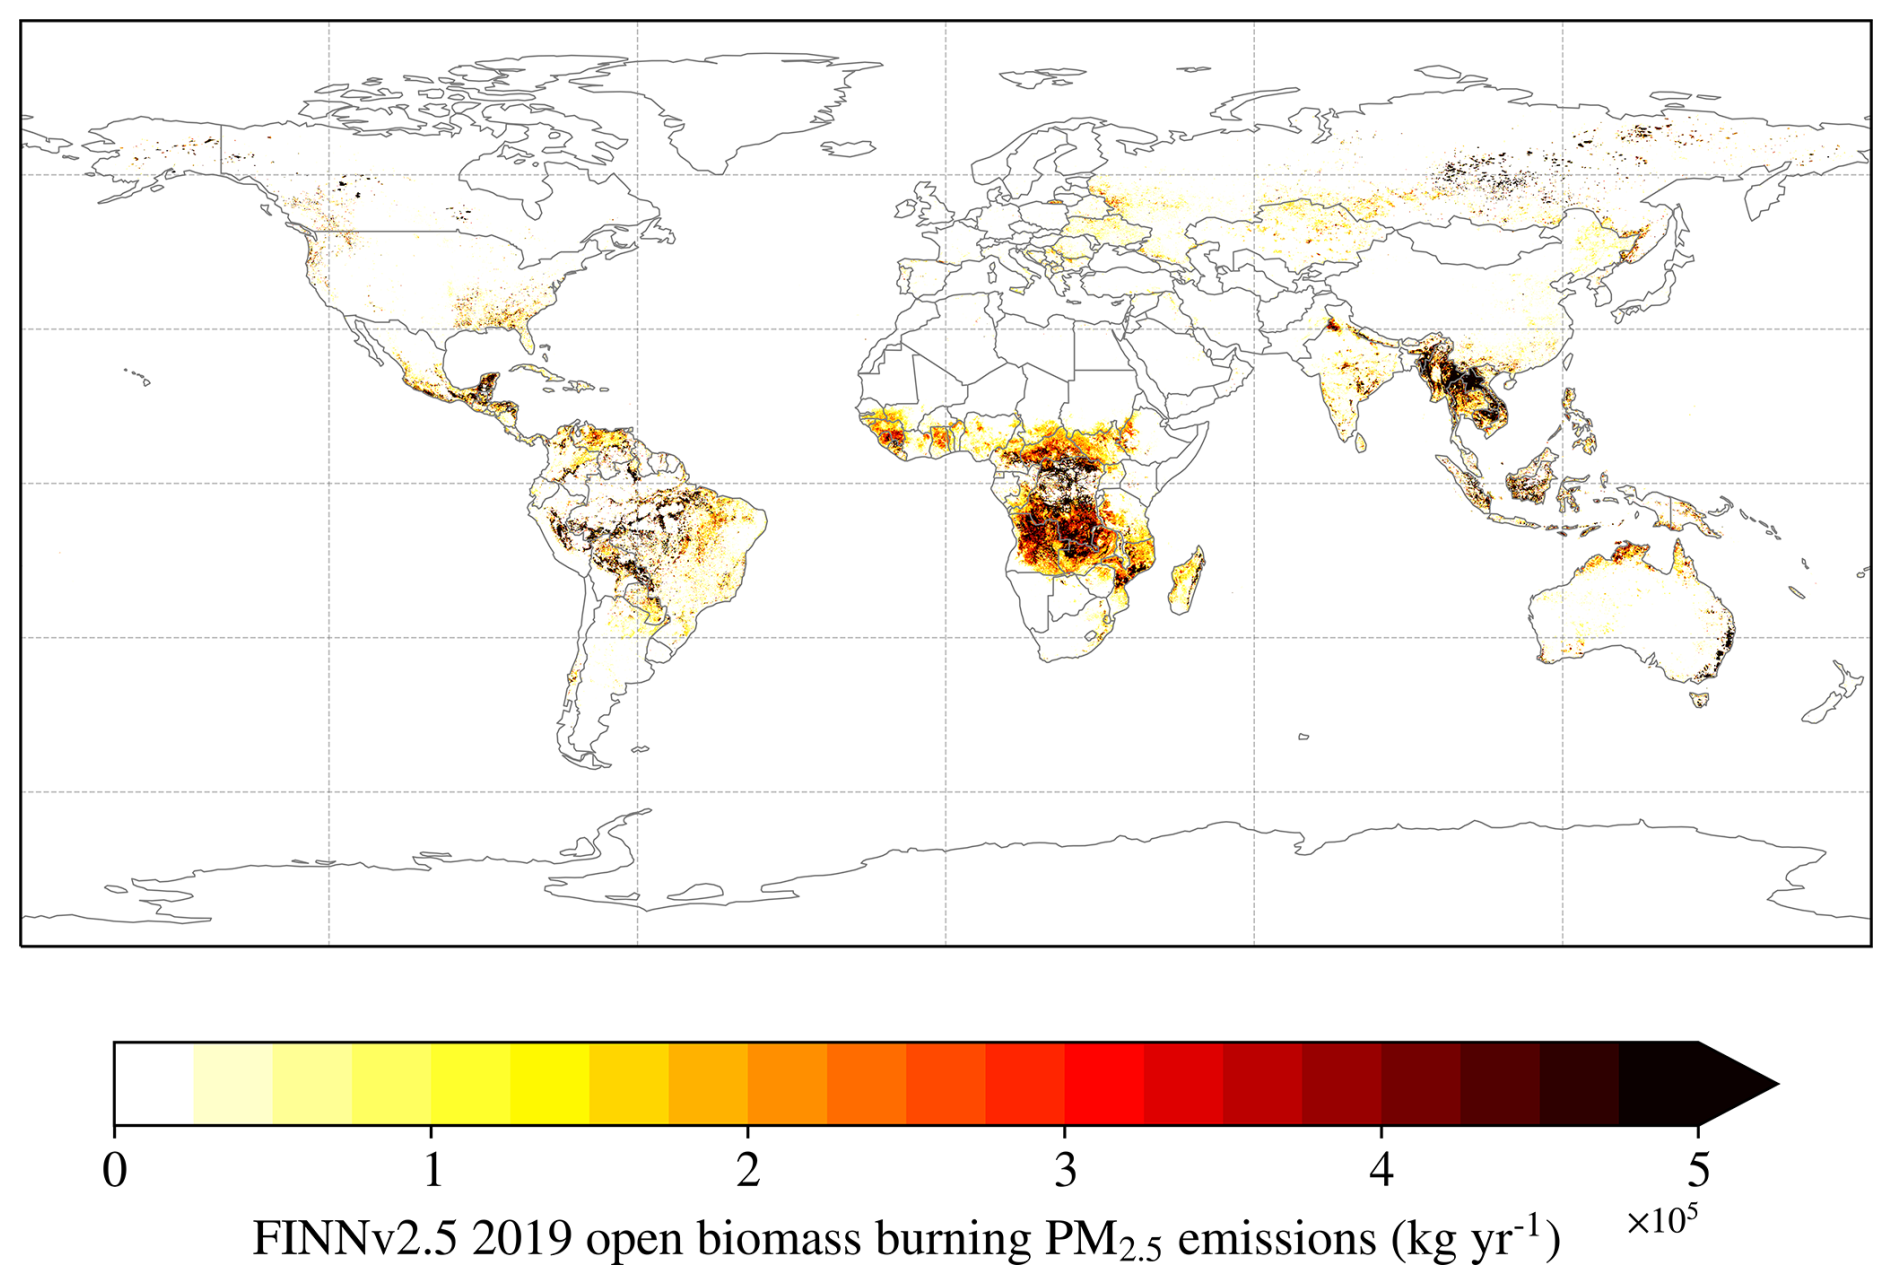
Figure C1The spatial distribution of 2019 global BB PM2.5 emissions as reported in the FINNv2.5 dataset (Wiedinmyer et al., 2023).
EMEP MSC-W model code is available from the Norwegian Meteorological Institute GitHub pages (https://github.com/metno/emep-ctm, last access: 1 September 2025). WRF model code is available from the Weather Research and Forecasting Model GitHub pages (https://github.com/wrf-model/WRF, last access: 1 September 2025).
EMEP4UK model output used for this study is available at https://doi.org/10.5281/zenodo.17382060 (Tan et al., 2025a).
DYTT performed model simulations, data analyses and wrote the text under supervision by MRH, MV, DSS, SR and EN. MRH, DSS, SR and EN edited and commented on the text.
The contact author has declared that none of the authors has any competing interests.
The findings and discussions presented here are those of the authors and do not necessarily represent the views of the funders.
Publisher's note: Copernicus Publications remains neutral with regard to jurisdictional claims made in the text, published maps, institutional affiliations, or any other geographical representation in this paper. The authors bear the ultimate responsibility for providing appropriate place names. Views expressed in the text are those of the authors and do not necessarily reflect the views of the publisher.
The authors acknowledge helpful discussions with Marsailidh Twigg and the UK Centre for Ecology & Hydrology's air quality modelling group (Janice Scheffler, Yuanlin Wang, Tomás̆ Lis̆ka, Christina Hood).
Damaris Y. T. Tan acknowledges studentship funding from the UK Department for the Environment, Food and Rural Affairs under contract ECM-53210 (Support for national air pollution control strategies).
This work has been supported by the UK Department for the Environment, Food and Rural Affairs (Defra) under Contract ECM-53210: Support for national air pollution control strategies (including studentship funding for Damaris Y. T. Tan). This work was partially supported by the following UK Research and Innovation (UKRI) grants: the UKCEH National Capability for UK Challenges programme (NE/Y006208/1), the UKCEH National Capability for Global Challenges programme (NE/X006247/1) and the UKRI GCRF South Asian Nitrogen Hub (NE/S009019/1).
This paper was edited by Simone Tilmes and reviewed by Tobias Osswald and Jie Zhang.
Abdalmogith, S. S. and Harrison, R. M.: The use of trajectory cluster analysis to examine the long-range transport of secondary inorganic aerosol in the UK, Atmos. Environ., 39, 6686–6695, https://doi.org/10.1016/j.atmosenv.2005.07.059, 2005. a
Ahern, A. T., Robinson, E. S., Tkacik, D. S., Saleh, R., Hatch, L. E., Barsanti, K. C., Stockwell, C. E., Yokelson, R. J., Presto, A. A., Robinson, A. L., Sullivan, R. C., and Donahue, N. M.: Production of Secondary Organic Aerosol During Aging of Biomass Burning Smoke From Fresh Fuels and Its Relationship to VOC Precursors, J. Geophys. Res.-Atmos., 124, 3583–3606, https://doi.org/10.1029/2018JD029068, 2019. a, b
Albertson, K., Aylen, J., Cavan, G., and McMorrow, J.: Climate change and the future occurrence of moorland wildfires in the Peak District of the UK, Climate Research, 45, 105–118, https://doi.org/10.3354/cr00926, 2010. a
Arnell, N. W., Freeman, A., and Gazzard, R.: The effect of climate change on indicators of fire danger in the UK, Environ. Res. Lett., 16, 044027, https://doi.org/10.1088/1748-9326/abd9f2, 2021. a
Bergström, R., Denier van der Gon, H. A. C., Prévôt, A. S. H., Yttri, K. E., and Simpson, D.: Modelling of organic aerosols over Europe (2002–2007) using a volatility basis set (VBS) framework: application of different assumptions regarding the formation of secondary organic aerosol, Atmos. Chem. Phys., 12, 8499–8527, https://doi.org/10.5194/acp-12-8499-2012, 2012. a
Bergström, R., Hayman, G. D., Jenkin, M. E., and Simpson, D.: Update and comparison of atmospheric chemistry mechanisms for the EMEP MSC-W model system-EmChem19a, EmChem19X, CRIv2R5Em, CB6r2Em, and MCMv3.3Em, Norwegian Meteorological Institute, https://emep.int/publ/reports/2022/MSCW_technical_1_2022.pdf (last access: 1 September 2025), 2022. a
Binkowski, F. S. and Shankar, U.: The Regional Particulate Matter Model: 1. Model description and preliminary results, J. Geophys. Res.-Atmos., 100, 26191–26209, https://doi.org/10.1029/95JD02093, 1995. a
Bondur, V. G., Mokhov, I. I., Voronova, O. S., and Sitnov, S. A.: Satellite Monitoring of Siberian Wildfires and Their Effects: Features of 2019 Anomalies and Trends of 20-Year Changes, Dokl. Earth Sci., 492, 370–375, https://doi.org/10.1134/S1028334X20050049, 2020. a
Cho, Y., Kim, H., Park, R. J., and Kim, S.-W.: Unprecedented East Siberian wildfires intensify Arctic snow darkening through enhanced poleward transport of black carbon, Sci. Total Environ., 961, 178423, https://doi.org/10.1016/j.scitotenv.2025.178423, 2025. a
Copernicus: Did 2019 really bring us an unusual number of wildfires?, https://atmosphere.copernicus.eu/did-2019-really-bring-us-unusual-number-wildfires (last access: 11 August 2025), 2019. a
Davey, S. M. and Sarre, A.: Editorial: the 2019/20 Black Summer bushfires, Aust. Forestry, 83, 47–51, https://doi.org/10.1080/00049158.2020.1769899, 2020. a
Bowman, D. M., Kolden, C. A., Abatzoglou, J. T., Johnston, F. H., van der Werf, G. R., and Flannigan, M.: Vegetation fires in the Anthropocene, Nature Reviews Earth & Environment, 1, 500–515, https://doi.org/10.1038/s43017-020-0085-3, 2020. a
Burton, C., Ciavarella, A., Kelley, D. I., Hartley, A. J., McCarthy, M., New, S., Betts, R. A., and Robertson, E.: Very high fire danger in UK in 2022 at least 6 times more likely due to human-caused climate change, Environ. Res. Lett., 20, 044003, https://doi.org/10.1088/1748-9326/adb764, 2025. a
Carnell, E., Tomlinson, S., and Reis, S.: UK gridded population at 1 km resolution for 2021 based on Census 2021/2022 and Land Cover Map 2021, NERC EDS Environmental Information Data Centre [data set], https://doi.org/10.5285/7beefde9-c520-4ddf-897a-0167e8918595, 2025. a, b, c
CEIP: EMEP Centre on Emission Inventories and Projections, https://www.ceip.at/ (last access: 24 November 2021), 2021. a
Charron, A., Degrendele, C., Laongsri, B., and Harrison, R. M.: Receptor modelling of secondary and carbonaceous particulate matter at a southern UK site, Atmos. Chem. Phys., 13, 1879–1894, https://doi.org/10.5194/acp-13-1879-2013, 2013. a
Ciais, P., Wattenbach, M., Vuichard, N., Smith, P., Piao, S. L., Don, A., Luyssaert, S., Janssens, I. A., Bondeau, A., Dechow, R., Leip, A., Smith, P., Beer, C., van der Werf, G. R., Gervois, S., Van Oost, K., Tomelleri, E., Freibauer, A., Schulze, E. D., and CARBOEUROPE Synthesis Team: The European carbon balance. Part 2: croplands, Glob. Change Biol., 16, 1409–1428, https://doi.org/10.1111/j.1365-2486.2009.02055.x, 2010. a
Cottle, P., Strawbridge, K., and McKendry, I.: Long-range transport of Siberian wildfire smoke to British Columbia: Lidar observations and air quality impacts, Atmos. Environ., 90, 71–77, https://doi.org/10.1016/j.atmosenv.2014.03.005, 2014. a
Crippa, M., Guizzardi, D., Butler, T., Keating, T., Wu, R., Kaminski, J., Kuenen, J., Kurokawa, J., Chatani, S., Morikawa, T., Pouliot, G., Racine, J., Moran, M. D., Klimont, Z., Manseau, P. M., Mashayekhi, R., Henderson, B. H., Smith, S. J., Suchyta, H., Muntean, M., Solazzo, E., Banja, M., Schaaf, E., Pagani, F., Woo, J.-H., Kim, J., Monforti-Ferrario, F., Pisoni, E., Zhang, J., Niemi, D., Sassi, M., Ansari, T., and Foley, K.: The HTAP_v3 emission mosaic: merging regional and global monthly emissions (2000–2018) to support air quality modelling and policies, Earth Syst. Sci. Data, 15, 2667–2694, https://doi.org/10.5194/essd-15-2667-2023, 2023. a
Cunningham, C. X., Williamson, G. J., and Bowman, D. M.: Increasing frequency and intensity of the most extreme wildfires on Earth, Nature Ecology & Evolution, 8, 1420–1425, https://doi.org/10.1038/s41559-024-02452-2, 2024. a, b
DEFRA: UK AIR Data Archive, https://uk-air.defra.gov.uk/data/ (last access: 26 September 2025), 2025. a, b
Department of Environmental Science at Aarhus University and the Irish EPA: National mapping of GHG and non-GHG emissions sources (MapEIre), https://projects.au.dk/mapeire (last access: 7 October 2021), 2021. a
Diapouli, E., Popovicheva, O., Kistler, M., Vratolis, S., Persiantseva, N., Timofeev, M., Kasper-Giebl, A., and Eleftheriadis, K.: Physicochemical characterization of aged biomass burning aerosol after long-range transport to Greece from large scale wildfires in Russia and surrounding regions, Summer 2010, Atmos. Environ., 96, 393–404, https://doi.org/10.1016/j.atmosenv.2014.07.055, 2014. a
Donahue, N. M., Robinson, A. L., Stanier, C. O., and Pandis, S. N.: Coupled Partitioning, Dilution, and Chemical Aging of Semivolatile Organics, Environ. Sci. Technol., 40, 2635–2643, https://doi.org/10.1021/es052297c, 2006. a
Fagerli, H., Tsyro, S., Simpson, D., Nyíri, Á., Wind, P., Gauss, M., Benedictow, A., Klein, H., Valdebenito, A., Mu, Q., Waersted, E. G., Gliß, J., Brenna, H., Mortier, A., Griesfeller, J., Aas, W., Hjellbrekke, A., Solberg, S., Tørseth, K., Yttri, K. E., Mareckova, K., Matthews, B., Schindlbacher, S., Ullrich, B., Wankmüller, R., Scheuschner, T., and Kuenen, J. J. P.: Transboundary particulate matter, photo-oxidants, acidifying and eutrophying components, EMEP Status Report 1/2021, Norwegian Meteorological Institute, https://emep.int/publ/reports/2021/EMEP_Status_Report_1_2021.pdf (last access: 1 September 2025), 2021. a, b
Fagerli, H., Benedictow, A., van Caspel, W., Gauss, M., Ge, Y., Jonson, J. E., Klein, H., Nyíri, Á., Simpson, D., Tsyro, S., Aas, W., Valdebenito, Á., Wind, P., Hjellbrekke, A., Solberg, S., Tørseth, K., Yttri K. E., Emep, Y., Matthews, B., Schindlbacher, S., Ullrich, B., Wankmüller, R., Klimont, Z., Scheuschner, T., Kuenen, J. J. P., and Wegener, R.: Transboundary particulate matter, photo-oxidants, acidifying and eutrophying components, EMEP Status Report 1/2023, Norwegian Meteorological Institute, https://emep.int/publ/reports/2023/EMEP_Status_Report_1_2023.pdf (last access: 1 September 2025), 2023. a
Fagerli, H., Benedictow, A., Blake, L., van Caspel, W., Denby, B. R., Gauss, M., Jonson, J. E., Klein, H., Lange, G. F., Mousing, E. A., Nyíri, Á., Olivié, D., Segers, A., Simpson, D., Tsyro, S., Valdebenito, A., Wind, P., Aas, W., Fiebig, M., Hjellbrekke, A., Solberg, S., Tørseth, K., Yttri, K. E., Redeyoff, O., Matthews, B., Schindlbacher, S., Ullrich, B., Wankmüller, R., Scheuschner, T., Kuenen, J. P., Guevara, M., Jaffrezo, J.-L., Dominutti, P., Uzu, G., Conil, S., Favez, O., and Močnik, G.: Convention on Long-range Transboundary Air Pollution Co-operative programme for monitoring and evaluation of the lang-range transmission of air pollutants in Europe, EMEP Status Report 1/2024, Norwegian Meteorological Institute, https://emep.int/publ/reports/2024/EMEP_Status_Report_1_2024.pdf (last access: 1 September 2025), 2024. a
Fernandez-Anez, N., Krasovskiy, A., Müller, M., Vacik, H., Baetens, J., Hukić, E., Solomun, M. K., Atanassova, I., Glushkova, M., Bogunović, I., Fajković, H., Djuma, H., Boustras, G., Adámek, M., Devetter, M., Hrabalikova, M., Huska, D., Barroso, P. M., Vaverková, M. D., Zumr, D., Jõgiste, K., Metslaid, M., Koster, K., Köster, E., Pumpanen, J., Ribeiro-Kumara, C., Prima, S. D., Pastor, A., Rumpel, C., Seeger, M., Daliakopoulos, I., Daskalakou, E., Koutroulis, A., Papadopoulou, M. P., Stampoulidis, K., Xanthopoulos, G., Aszalós, R., Balázs, D., Kertész, M., Valkó, O., Finger, D. C., Thorsteinsson, T., Till, J., Bajocco, S., Gelsomino, A., Amodio, A. M., Novara, A., Salvati, L., Telesca, L., Ursino, N., Jansons, A., Kitenberga, M., Stivrins, N., Brazaitis, G., Marozas, V., Cojocaru, O., Gumeniuc, I., Sfecla, V., Imeson, A., Veraverbeke, S., Mikalsen, R. F., Koda, E., Osinski, P., Castro, A. C. M., Nunes, J. P., Oom, D., Vieira, D., Rusu, T., Bojović, S., Djordjevic, D., Popovic, Z., Protic, M., Sakan, S., Glasa, J., Kacikova, D., Lichner, L., Majlingova, A., Vido, J., Ferk, M., Tičar, J., Zorn, M., Zupanc, V., Hinojosa, M. B., Knicker, H., Lucas-Borja, M. E., Pausas, J., Prat-Guitart, N., Ubeda, X., Vilar, L., Destouni, G., Ghajarnia, N., Kalantari, Z., Seifollahi-Aghmiuni, S., Dindaroglu, T., Yakupoglu, T., Smith, T., Doerr, S., and Cerda, A.: Current Wildland Fire Patterns and Challenges in Europe: A Synthesis of National Perspectives, Air Soil Water Res., 14, 1–19, https://doi.org/10.1177/11786221211028185, 2021. a
Field, R. D., Luo, M., Bauer, S. E., Hickman, J. E., Elsaesser, G. S., Mezuman, K., van Lier-Walqui, M., Tsigaridis, K., and Wu, J.: Estimating the Impact of a 2017 Smoke Plume on Surface Climate Over Northern Canada With a Climate Model, Satellite Retrievals, and Weather Forecasts, J. Geophys. Res.-Atmos., 129, e2023JD039396, https://doi.org/10.1029/2023JD039396, 2024. a
Font, A., F. de Brito, J., Riffault, V., Conil, S., Jaffrezo, J.-L., and Bourin, A.: Calculations of the conversion factor from organic carbon to organic matter for aerosol mass balance, Atmos. Pollut. Res., 15, 102301, https://doi.org/10.1016/j.apr.2024.102301, 2024. a
Garcia, A., Santa-Helena, E., Falco, A. D., de Paula Ribeiro, J., Gioda, A., and Gioda, C. R.: Toxicological Effects of Fine Particulate Matter (PM2.5): Health Risks and Associated Systemic Injuries – Systematic Review, Water Air Soil Poll., 234, 346, https://doi.org/10.1007/s11270-023-06278-9, 2023. a
Garroussi, S. E., Giuseppe, F. D., Barnard, C., and Wetterhall, F.: Europe faces up to tenfold increase in extreme fires in a warming climate, npj Climate and Atmospheric Science, 7, https://doi.org/10.1038/s41612-024-00575-8, 2024. a
Ge, Y., Heal, M. R., Stevenson, D. S., Wind, P., and Vieno, M.: Evaluation of global EMEP MSC-W (rv4.34) WRF (v3.9.1.1) model surface concentrations and wet deposition of reactive N and S with measurements, Geosci. Model Dev., 14, 7021–7046, https://doi.org/10.5194/gmd-14-7021-2021, 2021. a, b
Giglio, L., Randerson, J. T., and van der Werf, G. R.: Analysis of daily, monthly, and annual burned area using the fourth-generation global fire emissions database (GFED4), J. Geophys. Res.-Biogeo., 118, 317–328, https://doi.org/10.1002/jgrg.20042, 2013. a, b
Graham, A. M., Pope, R. J., Pringle, K. P., Arnold, S., Chipperfield, M. P., Conibear, L. A., Butt, E. W., Kiely, L., Knote, C., and McQuaid, J. B.: Impact on air quality and health due to the Saddleworth Moor fire in northern England, Environ. Res. Lett., 15, 074018, https://doi.org/10.1088/1748-9326/ab8496, 2020. a
Harper, A. R., Doerr, S. H., Santin, C., Froyd, C. A., and Sinnadurai, P.: Prescribed fire and its impacts on ecosystem services in the UK, Sci. Total Environ., 624, 691–703, https://doi.org/10.1016/j.scitotenv.2017.12.161, 2018. a
He, Y., Zhao, B., Wang, S., Valorso, R., Chang, X., Yin, D., Feng, B., Camredon, M., Aumont, B., Dearden, A., Jathar, S. H., Shrivastava, M., Jiang, Z., Cappa, C. D., Yee, L. D., Seinfeld, J. H., Hao, J., and Donahue, N. M.: Formation of secondary organic aerosol from wildfire emissions enhanced by long-time ageing, Nat. Geosci., 17, 124–129, https://doi.org/10.1038/s41561-023-01355-4, 2024. a, b
Hessburg, P. F., Prichard, S. J., Hagmann, R. K., Povak, N. A., and Lake, F. K.: Wildfire and climate change adaptation of western North American forests: a case for intentional management, Ecol. Appl., 31, e02432, https://doi.org/10.1002/eap.2432, 2021. a
Hodshire, A. L., Akherati, A., Alvarado, M. J., Brown-Steiner, B., Jathar, S. H., Jimenez, J. L., Kreidenweis, S. M., Lonsdale, C. R., Onasch, T. B., Ortega, A. M., and Pierce, J. R.: Aging Effects on Biomass Burning Aerosol Mass and Composition: A Critical Review of Field and Laboratory Studies, Environ. Sci. Technol., 53, 10007–10022, https://doi.org/10.1021/acs.est.9b02588, 2019. a, b
HTAP: HTAPv3 mosaic, https://edgar.jrc.ec.europa.eu/dataset_htap_v3 (last access: 3 December 2024), 2024. a
Jiang, Y., Lu, Z., Liu, X., Qian, Y., Zhang, K., Wang, Y., and Yang, X.-Q.: Impacts of global open-fire aerosols on direct radiative, cloud and surface-albedo effects simulated with CAM5, Atmos. Chem. Phys., 16, 14805–14824, https://doi.org/10.5194/acp-16-14805-2016, 2016. a
Jones, M. W., Kelley, D. I., Burton, C. A., Di Giuseppe, F., Barbosa, M. L. F., Brambleby, E., Hartley, A. J., Lombardi, A., Mataveli, G., McNorton, J. R., Spuler, F. R., Wessel, J. B., Abatzoglou, J. T., Anderson, L. O., Andela, N., Archibald, S., Armenteras, D., Burke, E., Carmenta, R., Chuvieco, E., Clarke, H., Doerr, S. H., Fernandes, P. M., Giglio, L., Hamilton, D. S., Hantson, S., Harris, S., Jain, P., Kolden, C. A., Kurvits, T., Lampe, S., Meier, S., New, S., Parrington, M., Perron, M. M. G., Qu, Y., Ribeiro, N. S., Saharjo, B. H., San-Miguel-Ayanz, J., Shuman, J. K., Tanpipat, V., van der Werf, G. R., Veraverbeke, S., and Xanthopoulos, G.: State of Wildfires 2023–2024, Earth Syst. Sci. Data, 16, 3601–3685, https://doi.org/10.5194/essd-16-3601-2024, 2024a. a
Jones, M. W., Veraverbeke, S., Andela, N., Doerr, S. H., Kolden, C., Mataveli, G., Pettinari, M. L., Quéré, C. L., Rosan, T. M., van der Werf, G. R., van Wees, D., and Abatzoglou, J. T.: Global rise in forest fire emissions linked to climate change in the extratropics, Science, 386, eadl5889, https://doi.org/10.1126/science.adl5889, 2024b. a, b
Kaiser, J. W., Heil, A., Andreae, M. O., Benedetti, A., Chubarova, N., Jones, L., Morcrette, J.-J., Razinger, M., Schultz, M. G., Suttie, M., and van der Werf, G. R.: Biomass burning emissions estimated with a global fire assimilation system based on observed fire radiative power, Biogeosciences, 9, 527–554, https://doi.org/10.5194/bg-9-527-2012, 2012. a
Kelley, D. I., Burton, C., Di Giuseppe, F., Jones, M. W., Barbosa, M. L. F., Brambleby, E., McNorton, J. R., Liu, Z., Bradley, A. S. I., Blackford, K., Burke, E., Ciavarella, A., Di Tomaso, E., Eden, J., Ferreira, I. J. M., Fiedler, L., Hartley, A. J., Keeping, T. R., Lampe, S., Lombardi, A., Mataveli, G., Qu, Y., Silva, P. S., Spuler, F. R., Steinmann, C. B., Torres-Vázquez, M. Á., Veiga, R., van Wees, D., Wessel, J. B., Wright, E., Bilbao, B., Bourbonnais, M., Gao, C., Di Bella, C. M., Dintwe, K., Donovan, V. M., Harris, S., Kukavskaya, E. A., N'Dri, A. B., Santín, C., Selaya, G., Sjöström, J., Abatzoglou, J. T., Andela, N., Carmenta, R., Chuvieco, E., Giglio, L., Hamilton, D. S., Hantson, S., Meier, S., Parrington, M., Sadegh, M., San-Miguel-Ayanz, J., Sedano, F., Turco, M., van der Werf, G. R., Veraverbeke, S., Anderson, L. O., Clarke, H., Fernandes, P. M., and Kolden, C. A.: State of Wildfires 2024–2025, Earth Syst. Sci. Data, 17, 5377–5488, https://doi.org/10.5194/essd-17-5377-2025, 2025. a
Kelly, L. T., Giljohann, K. M., Duane, A., Aquilué, N., Archibald, S., Batllori, E., Bennett, A. F., Buckland, S. T., Canelles, Q., Clarke, M. F., Fortin, M.-J., Hermoso, V., Herrando, S., Keane, R. E., Lake, F. K., McCarthy, M. A., Morán-Ordóñez, A., Parr, C. L., Pausas, J. G., Penman, T. D., Regos, A., Rumpff, L., Santos, J. L., Smith, A. L., Syphard, A. D., Tingley, M. W., and Brotons, L.: Fire and biodiversity in the Anthropocene, Science, 370, eabb0355, https://doi.org/10.1126/science.abb0355, 2020. a
Keywood, M., Kanakidou, M., Stohl, A., Dentener, F., Grassi, G., Meyer, C. P., Torseth, K., Edwards, D., Thompson, A. M., Lohmann, U., and Burrows, J.: Fire in the Air: Biomass Burning Impacts in a Changing Climate, Crit. Rev. Env. Sci. Tech., 43, 40–83, https://doi.org/10.1080/10643389.2011.604248, 2013. a
Lasslop, G., Coppola, A. I., Voulgarakis, A., Yue, C., and Veraverbeke, S.: Influence of Fire on the Carbon Cycle and Climate, Current Climate Change Reports, 5, 112–123, https://doi.org/10.1007/s40641-019-00128-9, 2019. a
Lim, C. Y., Hagan, D. H., Coggon, M. M., Koss, A. R., Sekimoto, K., de Gouw, J., Warneke, C., Cappa, C. D., and Kroll, J. H.: Secondary organic aerosol formation from the laboratory oxidation of biomass burning emissions, Atmos. Chem. Phys., 19, 12797–12809, https://doi.org/10.5194/acp-19-12797-2019, 2019. a, b
Lin, C., Heal, M. R., Vieno, M., MacKenzie, I. A., Armstrong, B. G., Butland, B. K., Milojevic, A., Chalabi, Z., Atkinson, R. W., Stevenson, D. S., Doherty, R. M., and Wilkinson, P.: Spatiotemporal evaluation of EMEP4UK-WRF v4.3 atmospheric chemistry transport simulations of health-related metrics for NO2, O3, PM10, and PM2.5 for 2001–2010, Geosci. Model Dev., 10, 1767–1787, https://doi.org/10.5194/gmd-10-1767-2017, 2017. a
Liška, T., Heal, M. R., Lin, C., Vieno, M., Carnell, E. J., Tomlinson, S. J., Loh, M., and Reis, S.: The effect of workplace mobility on air pollution exposure inequality – a case study in the Central Belt of Scotland, Environ. Res.: Health, 2, 025006, https://doi.org/10.1088/2752-5309/ad3840, 2024. a
Macintyre, H. L., Mitsakou, C., Vieno, M., Heal, M. R., Heaviside, C., and Exley, K. S.: Impacts of emissions policies on future UK mortality burdens associated with air pollution, Environ. Int., 174, 107862, https://doi.org/10.1016/j.envint.2023.107862, 2023a. a
Macintyre, H. L., Mitsakou, C., Vieno, M., Heal, M. R., Heaviside, C., and Exley, K. S.: Future impacts of O3 on respiratory hospital admission in the UK from current emissions policies, Environ. Int., 178, 108046, https://doi.org/10.1016/j.envint.2023.108046, 2023b. a
Marvin, M. R., Palmer, P. I., Yao, F., Latif, M. T., and Khan, M. F.: Uncertainties from biomass burning aerosols in air quality models obscure public health impacts in Southeast Asia, Atmos. Chem. Phys., 24, 3699–3715, https://doi.org/10.5194/acp-24-3699-2024, 2024. a
Masoom, A., Kazadzis, S., Modini, R. L., Gysel-Beer, M., Gröbner, J., Coen, M. C., Navas-Guzman, F., Kouremeti, N., Brem, B. T., Nowak, N. K., Martucci, G., Hervo, M., and Erb, S.: Long range transport of Canadian Wildfire smoke to Europe in Fall 2023: aerosol properties and spectral features of smoke particles, EGUsphere [preprint], https://doi.org/10.5194/egusphere-2025-2755, 2025. a
Mazzeo, A., Burrow, M., Quinn, A., Marais, E. A., Singh, A., Ng'ang'a, D., Gatari, M. J., and Pope, F. D.: Evaluation of the WRF and CHIMERE models for the simulation of PM2.5 in large East African urban conurbations, Atmos. Chem. Phys., 22, 10677–10701, https://doi.org/10.5194/acp-22-10677-2022, 2022. a
Menut, L., Bessagnet, B., Khvorostyanov, D., Beekmann, M., Blond, N., Colette, A., Coll, I., Curci, G., Foret, G., Hodzic, A., Mailler, S., Meleux, F., Monge, J.-L., Pison, I., Siour, G., Turquety, S., Valari, M., Vautard, R., and Vivanco, M. G.: CHIMERE 2013: a model for regional atmospheric composition modelling, Geosci. Model Dev., 6, 981–1028, https://doi.org/10.5194/gmd-6-981-2013, 2013. a
Moura, L. C., Scariot, A. O., Schmidt, I. B., Beatty, R., and Russell-Smith, J.: The legacy of colonial fire management policies on traditional livelihoods and ecological sustainability in savannas: Impacts, consequences, new directions, J. Environ. Manage., 232, 600–606, https://doi.org/10.1016/j.jenvman.2018.11.057, 2019. a
NAEI: Data, https://naei.beis.gov.uk/data/ (last access: 7 October 2021), 2021. a
Nemitz, E., Vieno, M., Carnell, E., Fitch, A., Steadman, C., Cryle, P., Holland, M., Morton, R. D., Hall, J., Mills, G., Hayes, F., Dickie, I., Carruthers, D., Fowler, D., Reis, S., and Jones, L.: Potential and limitation of air pollution mitigation by vegetation and uncertainties of deposition-based evaluations, Philos. T. Roy. Soc. A, 378, 20190320, https://doi.org/10.1098/rsta.2019.0320, 2020. a
Ots, R., Young, D. E., Vieno, M., Xu, L., Dunmore, R. E., Allan, J. D., Coe, H., Williams, L. R., Herndon, S. C., Ng, N. L., Hamilton, J. F., Bergström, R., Di Marco, C., Nemitz, E., Mackenzie, I. A., Kuenen, J. J. P., Green, D. C., Reis, S., and Heal, M. R.: Simulating secondary organic aerosol from missing diesel-related intermediate-volatility organic compound emissions during the Clean Air for London (ClearfLo) campaign, Atmos. Chem. Phys., 16, 6453–6473, https://doi.org/10.5194/acp-16-6453-2016, 2016. a, b
Perry, M. C., Vanvyve, E., Betts, R. A., and Palin, E. J.: Past and future trends in fire weather for the UK, Nat. Hazards Earth Syst. Sci., 22, 559–575, https://doi.org/10.5194/nhess-22-559-2022, 2022. a, b
Purser, G., Heal, M. R., Carnell, E. J., Bathgate, S., Drewer, J., Morison, J. I. L., and Vieno, M.: Simulating impacts on UK air quality from net-zero forest planting scenarios, Atmos. Chem. Phys., 23, 13713–13733, https://doi.org/10.5194/acp-23-13713-2023, 2023. a
Reis, S., Liška, T., Vieno, M., Carnell, E. J., Beck, R., Clemens, T., Dragosits, U., Tomlinson, S. J., Leaver, D., and Heal, M. R.: The influence of residential and workday population mobility on exposure to air pollution in the UK, Environ. Int., 121, 803–813, https://doi.org/10.1016/j.envint.2018.10.005, 2018. a
Saha, S., Moorthi, S., Pan, H.-L., Wu, X., Wang, J., Nadiga, S., Tripp, P., Kistler, R., Woollen, J., Behringer, D., Liu, H., Stokes, D., Grumbine, R., Gayno, G., Wang, J., Hou, Y.-T., ya Chuang, H., Juang, H.-M. H., Sela, J., Iredell, M., Treadon, R., Kleist, D., Delst, P. V., Keyser, D., Derber, J., Ek, M., Meng, J., Wei, H., Yang, R., Lord, S., van den Dool, H., Kumar, A., Wang, W., Long, C., Chelliah, M., Xue, Y., Huang, B., Schemm, J.-K., Ebisuzaki, W., Lin, R., Xie, P., Chen, M., Zhou, S., Higgins, W., Zou, C.-Z., Liu, Q., Chen, Y., Han, Y., Cucurull, L., Reynolds, R. W., Rutledge, G., and Goldberg, M.: The NCEP Climate Forecast System Reanalysis, B. Am. Meteorol. Soc., 91, 1015–1058, https://doi.org/10.1175/2010BAMS3001.1, 2010. a
Seinfeld, J. H. and Pandis, S. N.: Atmospheric Chemistry and Physics: From Air Pollution to Climate Change, JohnWiley & Sons, Hoboken, New Jersey, 3rd edn., ISBN 9781119221166, 2016. a
Seydi, S. T., Abatzoglou, J. T., Jones, M. W., Kolden, C. A., Filippelli, G., Hurteau, M. D., AghaKouchak, A., Luce, C. H., Miao, C., and Sadegh, M.: Increasing global human exposure to wildland fires despite declining burned area, Science, 389, 826–829, https://doi.org/10.1126/science.adu6408, 2025. a
Simpson, D., Benedictow, A., Berge, H., Bergström, R., Emberson, L. D., Fagerli, H., Flechard, C. R., Hayman, G. D., Gauss, M., Jonson, J. E., Jenkin, M. E., Nyíri, A., Richter, C., Semeena, V. S., Tsyro, S., Tuovinen, J.-P., Valdebenito, Á., and Wind, P.: The EMEP MSC-W chemical transport model – technical description, Atmos. Chem. Phys., 12, 7825–7865, https://doi.org/10.5194/acp-12-7825-2012, 2012. a, b, c, d, e, f, g
Skamarock, W. C., Klemp, J. B., Dudhia, J., Gill, D. O., Liu, Z., Berner, J., Wang, W., Powers, J. G., Duda, M. G., Barker, D. M., and Huang, X.-Y.: A Description of the Advanced Research WRF Model Version 4, NCAR Tech. Note NCAR/TN-556+STR, https://doi.org/10.5065/1dfh-6p97, 2019. a
Stelson, A. and Seinfeld, J.: Relative humidity and temperature dependence of the ammonium nitrate dissociation constant, Atmos. Environ., 16, 983–992, https://doi.org/10.1016/0004-6981(82)90184-6, 1982. a, b
Tan, D. Y. T., Heal, M. R., Stevenson, D. S., Reis, S., Vieno, M., and Nemitz, E.: Model output for the results in Tan, D. Y. T., Heal, M. R., Stevenson, D. S., Reis, S., Vieno, M., and Nemitz, E.: Long-range impacts of biomass burning on PM2.5: a case study of the UK with a globally nested model. Atmos. Chem. Phys. (DOI: 10.5194/egusphere-2025-5524), Version v1, Zenodo [data set], https://doi.org/10.5281/zenodo.17382060, 2025a. a
Tan, D. Y. T., Heal, M. R., Vieno, M., Stevenson, D. S., Reis, S., and Nemitz, E.: Changes in atmospheric oxidants teleconnect biomass burning and ammonium nitrate formation, npj Climate and Atmospheric Science, 8, 277, https://doi.org/10.1038/s41612-025-01150-5, 2025b. a, b, c, d, e, f, g, h
The International GEOS-Chem User Community: Geos-Chem, https://geoschem.github.io/ (last access: 1 September 2025), 2025. a
Twigg, M. M., Di Marco, C. F., Leeson, S., van Dijk, N., Jones, M. R., Leith, I. D., Morrison, E., Coyle, M., Proost, R., Peeters, A. N. M., Lemon, E., Frelink, T., Braban, C. F., Nemitz, E., and Cape, J. N.: Water soluble aerosols and gases at a UK background site – Part 1: Controls of PM2.5 and PM10 aerosol composition, Atmos. Chem. Phys., 15, 8131–8145, https://doi.org/10.5194/acp-15-8131-2015, 2015. a
UCAR/NCAR/ACOM: Fire Inventory from NCAR version 2 Fire Emission, https://doi.org/10.5065/XNPA-AF09, 2023. a
UNEP: Spreading like Wildfire – The Rising Threat of Extraordinary Landscape Fires. A UNEP Rapid Response Assessment, https://www.unep.org/resources/report/spreading-wildfire-rising-threat-extraordinary-landscape-fires (last access: 1 September 2026), 2022. a, b, c
Vakkari, V., Kerminen, V.-M., Beukes, J. P., Tiitta, P., van Zyl, P. G., Josipovic, M., Venter, A. D., Jaars, K., Worsnop, D. R., Kulmala, M., and Laakso, L.: Rapid changes in biomass burning aerosols by atmospheric oxidation, Geophys. Res. Lett., 41, 2644–2651, https://doi.org/10.1002/2014GL059396, 2014. a, b
Vaughan, G., Draude, A. P., Ricketts, H. M. A., Schultz, D. M., Adam, M., Sugier, J., and Wareing, D. P.: Transport of Canadian forest fire smoke over the UK as observed by lidar, Atmos. Chem. Phys., 18, 11375–11388, https://doi.org/10.5194/acp-18-11375-2018, 2018. a
Vieno, M., Dore, A. J., Stevenson, D. S., Doherty, R., Heal, M. R., Reis, S., Hallsworth, S., Tarrason, L., Wind, P., Fowler, D., Simpson, D., and Sutton, M. A.: Modelling surface ozone during the 2003 heat-wave in the UK, Atmos. Chem. Phys., 10, 7963–7978, https://doi.org/10.5194/acp-10-7963-2010, 2010. a
ieno, M., Heal, M. R., Hallsworth, S., Famulari, D., Doherty, R. M., Dore, A. J., Tang, Y. S., Braban, C. F., Leaver, D., Sutton, M. A., and Reis, S.: The role of long-range transport and domestic emissions in determining atmospheric secondary inorganic particle concentrations across the UK, Atmos. Chem. Phys., 14, 8435–8447, https://doi.org/10.5194/acp-14-8435-2014, 2014. a, b, c
Vieno, M., Heal, M. R., Twigg, M. M., MacKenzie, I. A., Braban, C. F., Lingard, J. J. N., Ritchie, S., Beck, R. C., Móring, A., Ots, R., Di Marco, C. F., Nemitz, E., Sutton, M. A., and Reis, S.: The UK particulate matter air pollution episode of March–April 2014: more than Saharan dust, Environ. Res. Lett., 11, 044004, https://doi.org/10.1088/1748-9326/11/4/044004, 2016a. a, b, c
Vieno, M., Heal, M. R., Williams, M. L., Carnell, E. J., Nemitz, E., Stedman, J. R., and Reis, S.: The sensitivities of emissions reductions for the mitigation of UK PM2.5, Atmos. Chem. Phys., 16, 265–276, https://doi.org/10.5194/acp-16-265-2016, 2016b. a, b
Voulgarakis, A. and Field, R. D.: Fire Influences on Atmospheric Composition, Air Quality and Climate, Current Pollution Reports, 1, 70–81, https://doi.org/10.1007/s40726-015-0007-z, 2015. a
Whaley, C. H., Butler, T., Adame, J. A., Ambulkar, R., Arnold, S. R., Buchholz, R. R., Gaubert, B., Hamilton, D. S., Huang, M., Hung, H., Kaiser, J. W., Kaminski, J. W., Knote, C., Koren, G., Kouassi, J.-L., Lin, M., Liu, T., Ma, J., Manomaiphiboon, K., Bergas Masso, E., McCarty, J. L., Mertens, M., Parrington, M., Peiro, H., Saxena, P., Sonwani, S., Surapipith, V., Tan, D. Y. T., Tang, W., Tanpipat, V., Tsigaridis, K., Wiedinmyer, C., Wild, O., Xie, Y., and Zuidema, P.: HTAP3 Fires: towards a multi-model, multi-pollutant study of fire impacts, Geosci. Model Dev., 18, 3265–3309, https://doi.org/10.5194/gmd-18-3265-2025, 2025. a, b
Whaley, P., Nieuwenhuijsen, M., and Burns, J. (Eds.): Update of the WHO Global Air Quality Guidelines: Systematic Reviews, Environ. Int., https://www.sciencedirect.com/special-issue/10MTC4W8FXJ (last access: 1 September 2025), 2022. a
WHO: WHO global air quality guidelines: particulate matter (PM2.5 and PM10), ozone, nitrogen dioxide, sulfur dioxide and carbon monoxide, World Health Organization, ISBN 9789240034228, 2021. a, b, c
Wiedinmyer, C., Akagi, S. K., Yokelson, R. J., Emmons, L. K., Al-Saadi, J. A., Orlando, J. J., and Soja, A. J.: The Fire INventory from NCAR (FINN): a high resolution global model to estimate the emissions from open burning, Geosci. Model Dev., 4, 625–641, https://doi.org/10.5194/gmd-4-625-2011, 2011. a
Wiedinmyer, C., Kimura, Y., McDonald-Buller, E. C., Emmons, L. K., Buchholz, R. R., Tang, W., Seto, K., Joseph, M. B., Barsanti, K. C., Carlton, A. G., and Yokelson, R.: The Fire Inventory from NCAR version 2.5: an updated global fire emissions model for climate and chemistry applications, Geosci. Model Dev., 16, 3873–3891, https://doi.org/10.5194/gmd-16-3873-2023, 2023. a, b, c, d, e, f
Witham, C. and Manning, A.: Impacts of Russian biomass burning on UK air quality, Atmos. Environ., 41, 8075–8090, https://doi.org/10.1016/j.atmosenv.2007.06.058, 2007. a, b
Xie, Y., Lin, M., Decharme, B., Delire, C., 705 Horowitz, L. W., Lawrence, D. M., Li, F., and Séférian, R.: Tripling of western US particulate pollution from wildfires in a warming climate, P. Natl. Acad. Sci. USA, 119, e2111372119, https://doi.org/10.1073/pnas.2111372119, 2022. a
Xu, R., Ye, T., Huang, W., Yue, X., Morawska, L., Abramson, M. J., Chen, G., Yu, P., Liu, Y., Yang, Z., Zhang, Y., Wu, Y., Yu, W., Wen, B., Zhang, Y., Hales, S., Lavigne, E., Saldiva, P. H., Coelho, M. S., Matus, P., Roye, D., Klompmaker, J., Mistry, M., Breitner, S., Zeka, A., Raz, R., Tong, S., Johnston, F. H., Schwartz, J., Gasparrini, A., Guo, Y., and Li, S.: Global, regional, and national mortality burden attributable to air pollution from landscape fires: a health impact assessment study, The Lancet, 404, 2447–2459, https://doi.org/10.1016/S0140-6736(24)02251-7, 2024. a, b
Zhang, Q., Wang, Y., Xiao, Q., Geng, G., Davis, S. J., Liu, X., Yang, J., Liu, J., Huang, W., He, C., Luo, B., Martin, R. V., Brauer, M., Randerson, J. T., and He, K.: Long-range PM2.5 pollution and health impacts from the 2023 Canadian wildfires, Nature, 645, 672–678, https://doi.org/10.1038/s41586-025-09482-1, 2025. a, b, c
Zhang, Y., Beggs, P. J., McGushin, A., Bambrick, H., Trueck, S., Hanigan, I. C., Morgan, G. G., Berry, H. L., Linnenluecke, M. K., Johnston, F. H., Capon, A. G., and Watts, N.: The 2020 special report of the MJA–Lancet Countdown on health and climate change: lessons learnt from Australia's “Black Summer”, Med. J. Australia, 213, 490–492.e10, https://doi.org/10.5694/mja2.50869, 2020. a
- Abstract
- Introduction
- Methodology
- Results
- Discussion
- Conclusions
- Appendix A: UK population and emissions
- Appendix B: The globally nested EMEP4UK model
- Appendix C: Biomass burning emissions
- Code availability
- Data availability
- Author contributions
- Competing interests
- Disclaimer
- Acknowledgements
- Financial support
- Review statement
- References