the Creative Commons Attribution 4.0 License.
the Creative Commons Attribution 4.0 License.
 | 18 Mar 2026
Response of extreme precipitation to dust aerosols in the Tarim Basin over the past 50 years
Ze Chen
Chenglong Zhou
Jiacheng Gao
Congzhen Zhu
Meiqi Song
Yu Wang
Yabin Wei
Lu Meng
Mingjie Ma
Cong Wen
Climate warming is simultaneously intensifying both dust activity and extreme precipitation (EP) in the arid and semi-arid regions. Meanwhile, dust aerosols further influence EP through complex cloud physical processes. However, significant uncertainties remain regarding the modulating role of dust aerosols within the aerosol-cloud-precipitation interaction system. There is a pressing need to quantitatively resolve this complex process to address disaster prevention challenges in arid regions. Based on long-term ground-based observations, satellite data, reanalysis data, and the Coupled Model Intercomparison Project Phase 6 (CMIP6) models, this study leverages a systematic analysis to investigate the impact of dust aerosols on EP in the Tarim Basin. Results reveal that dust-related extreme precipitation (D_EP) accounts for a relatively high proportion of EP (35.52 % for frequency and 34.34 % for precipitation amount) in the Tarim Basin. Dust weather provides the necessary lifting for precipitation, while water vapor acts as a limiting factor. Accordingly, dust aerosols enhance precipitation efficiency by increasing cloud particle radius and promoting cloud water path, ice water path, and cloud top height under conditions of sufficient moisture. Furthermore, the regional average contribution of dust aerosols to EP events is quantified as 6.6 % using long-term in situ observations. CMIP6 projections indicate that D_EP events will persist at relatively high values in the near term. These findings reveal that dust aerosols serve as a key regulator of the water cycle in arid regions, providing a new perspective for understanding the mechanisms driving EP.
- Article
(6305 KB) - Full-text XML
- BibTeX
- EndNote


Under climate warming, dust events are increasing in frequency and intensity as hazardous phenomena that severely impact the natural environment and human activities (Chen et al., 2023; Liu et al., 2022). Dust aerosols not only directly impair ambient air quality – with PM2.5 pollution responsible for approximately 4.2 million premature deaths annually (Shaddick et al., 2020), but also substantially influence the earth's energy balance and hydrological cycle through aerosol-radiation and aerosol-cloud interactions (Kok et al., 2023; Song et al., 2024; Zhou et al., 2022, 2023). Climate change is amplifying extreme precipitation (EP) in arid regions, particularly the deserts of Northwest China. A significant wetting trend is observed, marked by increased frequency and intensity of summer EP events and associated floods (Li et al., 2019; Li and Yao, 2023; Yao et al., 2022). These patterns suggest a complex interaction between dust activities and EP under climate change (Zhou et al., 2025), which poses significant challenges to disaster prevention and mitigation efforts.
Current research has advanced our understanding of aerosol-cloud-precipitation interactions, yet a significant knowledge gap remains regarding how dust aerosols influence EP in arid regions under a warming climate. Based on multi-source observations and numerical simulations, existing research has preliminarily revealed that dust aerosols influence cloud lifetime and structure through cloud microphysical processes (e.g., ice-nucleating effects) and radiative processes (e.g., altering atmospheric stability), thereby exerting complex influences on precipitation. On the one hand, dust aerosols can enhance precipitation by intensifying ice-phase processes and promoting the growth of solid hydrometeors (Dong et al., 2018; Pan et al., 2024). Additionally, through its radiative effects, the absorption of solar radiation by dust layers induces upper-level warming and surface cooling, which collectively accumulate convective instability and ultimately trigger more intense convective precipitation (Guo et al., 2018; Huang et al., 2014). On the other hand, they may also suppress convective development through radiative effects that induce lower-level cooling, enhance environmental wind shear, and reduce convective available potential energy. Furthermore, an increase in cloud particle number concentration may lead to competitive consumption of available moisture, restricting the effective growth of individual cloud droplets and thereby exerting a suppressive effect on precipitation (Leung and Van Den Heever, 2023; Li et al., 2017). In summary, the net impact of dust aerosols on precipitation is strongly dependent on the ambient thermodynamic and dynamic conditions as well as the cloud type (Zhu et al., 2023). However, these studies are often limited by sparse observational data, uncertainties in model parameterizations, and inadequate representation of physical processes, making it difficult to accurately quantify the net effect of dust under varying meteorological conditions and thus hindering a mechanistic understanding and reliable prediction of EP (Li et al., 2024, 2011).
This study aims to quantitatively assess the response of EP to dust aerosols in the Tarim Basin. Firstly, using ground observations and reanalysis data for March–August from 1975 to 2024, we diagnose the climatic characteristics and environmental conditions of D_EP events. Then we apply the observational minus reanalysis (OMR) approach to quantitatively reveal the net contribution of dust aerosols to EP at a climate observational scale. Finally, we leverage CMIP6 projections to project the future evolution of D_EP events. The results would advance the understanding of aerosol-cloud-precipitation interactions and provide scientific support for climate risk assessment and disaster prevention in arid regions.
2.1 Ground observations
Daily observational data for March–August from 1975 to 2024 were obtained from 27 national meteorological stations in the Tarim Basin, provided by the National Meteorological Information Center of the China Meteorological Administration. With Tazhong Station (TZ) as the boundary, the areas to its south are Yingjisha (YJS), Maigaiti (MGT), Shache (SC), Zepu (ZP), Qiemo (QM), Yecheng (YC), Pishan (PS), Moyu (MY), Hetian (HT), Luopu (LP), Minfeng (MF), Cele (CL), and Yutian (YT); while the areas to its north are Ruoqiang (RQ), Yuepuhu (YPH), Kashi (KS), Jiashi (JS), Atushi (ATS), Keping (KP), Alar (ALE), Tieganlike (TGLK), Awati (AWT), Aksu (AKS), Shaya (SY), Xinhe (XH), and Korla (KEL). The datasets include variables such as weather phenomena, temperature, relative humidity, and precipitation. Any occurrence of floating dust, blowing sand, or dust storm was recorded as a dust event (Cheng et al., 2023).
2.2 Satellite observations
For March–August from 2000 to 2024, the CERES_SYN1deg cloud dataset released by the National Aeronautics and Space Administration (NASA) was employed. Derived from observations by the Clouds and the Earth's Radiant Energy System (CERES) instrument, this dataset benefits from high pointing accuracy, rapid response, and low systematic error in its servo system (Wielicki et al., 1998), ensuring high reliability for cloud parameter retrieval. The dataset has a spatial resolution of 1° and an hourly temporal resolution. Selected variables from this dataset, including cloud top height, liquid water path, ice water path, and cloud water/ice particle radius, analyzed the influence of dust aerosols on cloud microphysical processes.
2.3 Reanalysis data
The dynamical fields and precipitation data were obtained from the ERA5 and its derivative ERA5-Land datasets, respectively, both provided by the European Centre for Medium-Range Weather Forecasts (ECMWF) (Hersbach et al., 2020). With a horizontal spatial resolution of 0.1°, the hourly reanalysis data were processed into daily averages for each March–August during 1975–2024. The analyzed variables included the u and v components of wind, vertical velocity, temperature, and precipitation.
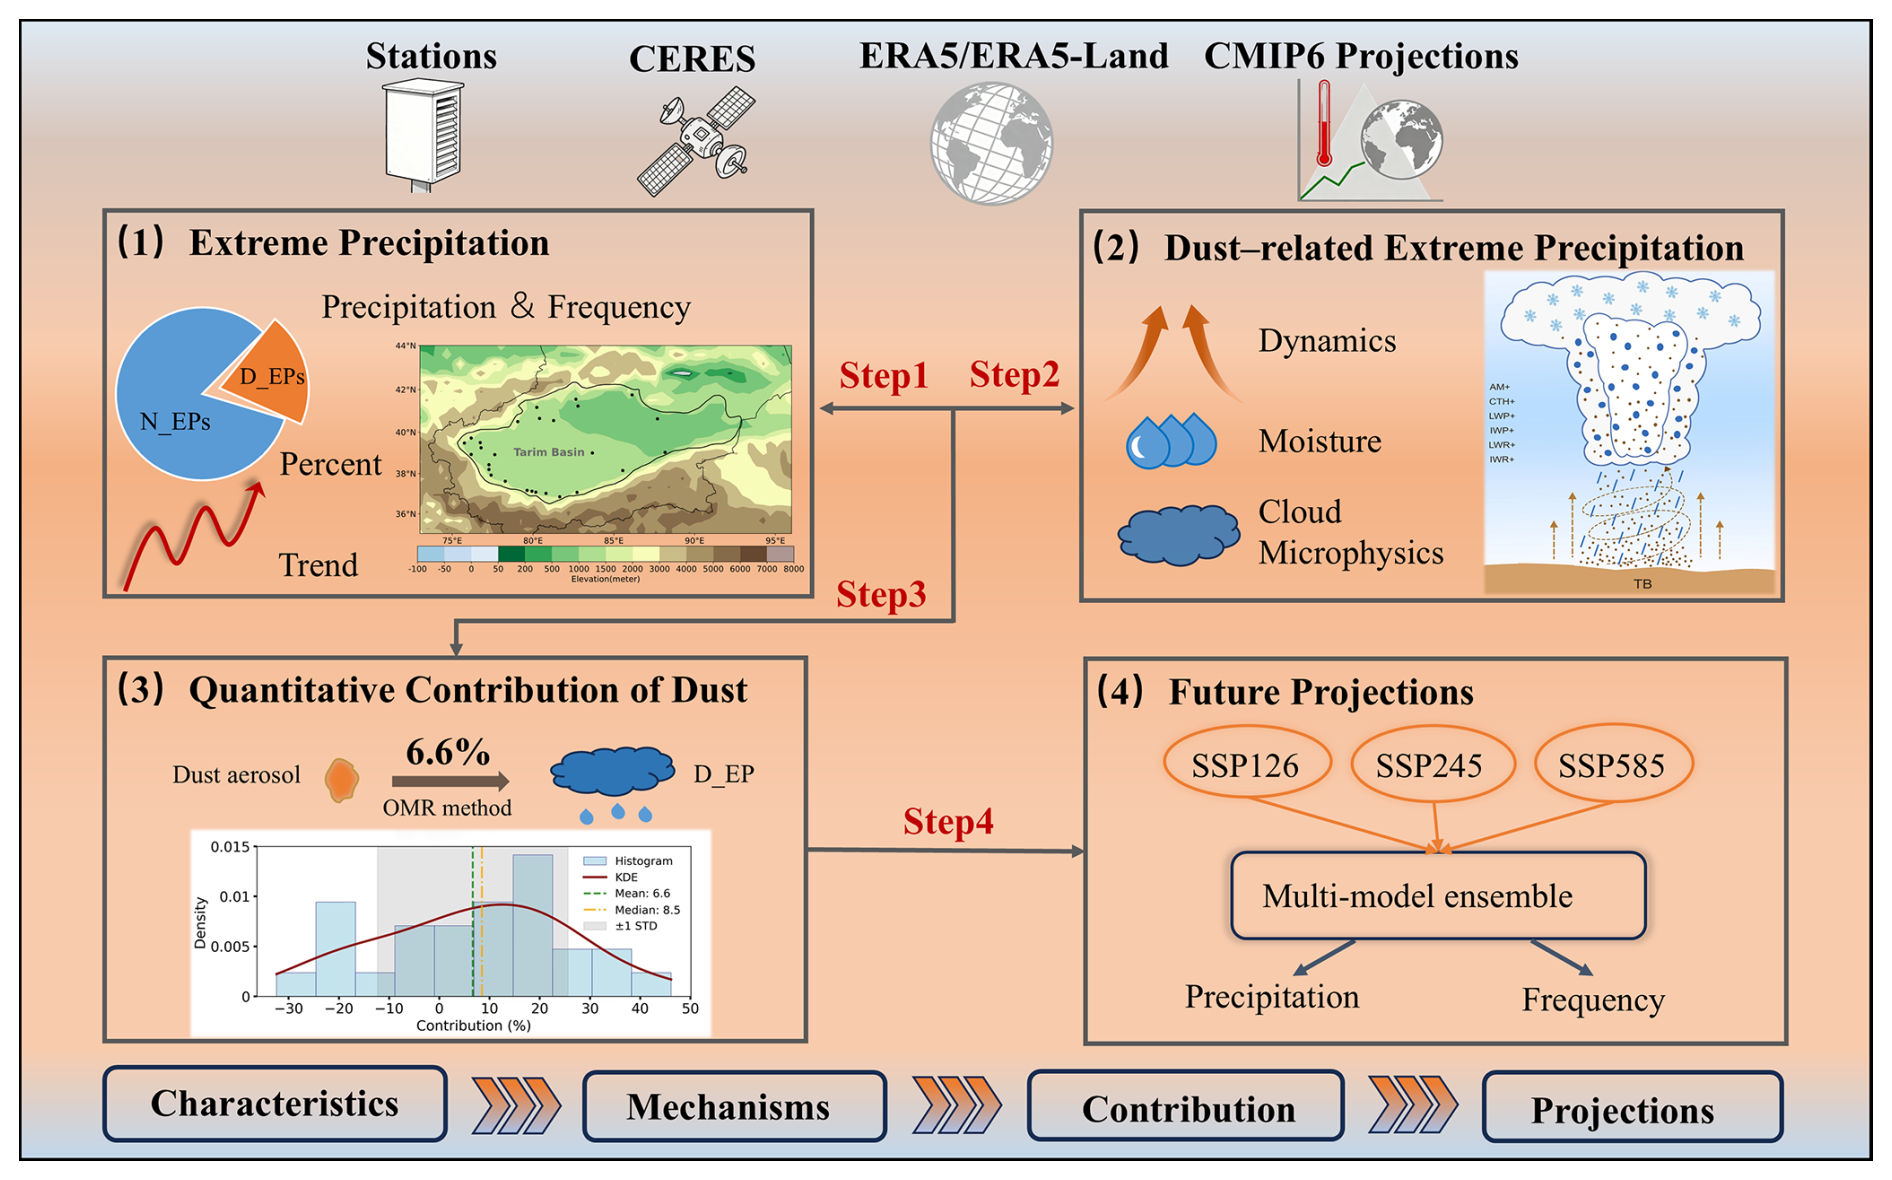
Figure 1Technical framework of this study.
2.4 Climate projection data
Projections from five global climate models (UKESM1-0, NorESM2-LM, MPI-ESM1-2-LR, MPI-ESM1-2-HR, AWI-ESM-1-REcoM) from the Coupled Model Intercomparison Project Phase 6 (CMIP6) were analyzed under three Shared Socioeconomic Pathway (SSP) scenarios (SSP1-2.6, SSP2-4.5, and SSP5-8.5) to assess changes in D_EP over the Tarim Basin (O'Neill et al., 2016; Riahi et al., 2017). It is noteworthy that only five to six models satisfy the requirement for daily scale output of both precipitation and aerosol optical depth (AOD). The period 1995–2014 served as the historical baseline, while 2021–2100 was designated as the future projection period.
2.5 Definition of EP events
Extreme precipitation (EP) events were defined using the percentile threshold method, whereby daily precipitation values (≥0.1 mm) at each station were arranged in ascending order, and values exceeding a specific percentile were classified as EP (Liu et al., 2013). When an EP event occurs synchronously with a dust weather event, it is defined as a dust-related extreme precipitation (D_EP) event, with those occurring in the absence of dust events defined as non-dust extreme precipitation (N_EP) events. While many studies adopt the 90th percentile or higher thresholds (Hu et al., 2021; Ma, 2021), such an approach yields limited samples in arid regions like our study area, where precipitation is scarce. At the 90th percentile, the average annual frequency of EP events per station is only 1.7 events, with D_EP events occurring merely 0.4 times, resulting in a sample size insufficient for robust statistical inference. Therefore, the 75th percentile was selected as the threshold to meet research needs. This threshold results in 5611 total EP events, including 1588 D_EP events, accounting for 7 % of all precipitation events. This choice maintains the extremity of events while significantly improving sample representativeness. D_EP events in future climate projections are defined based on the EP and AOD thresholds statistically derived from station observations (Zhou et al., 2025).
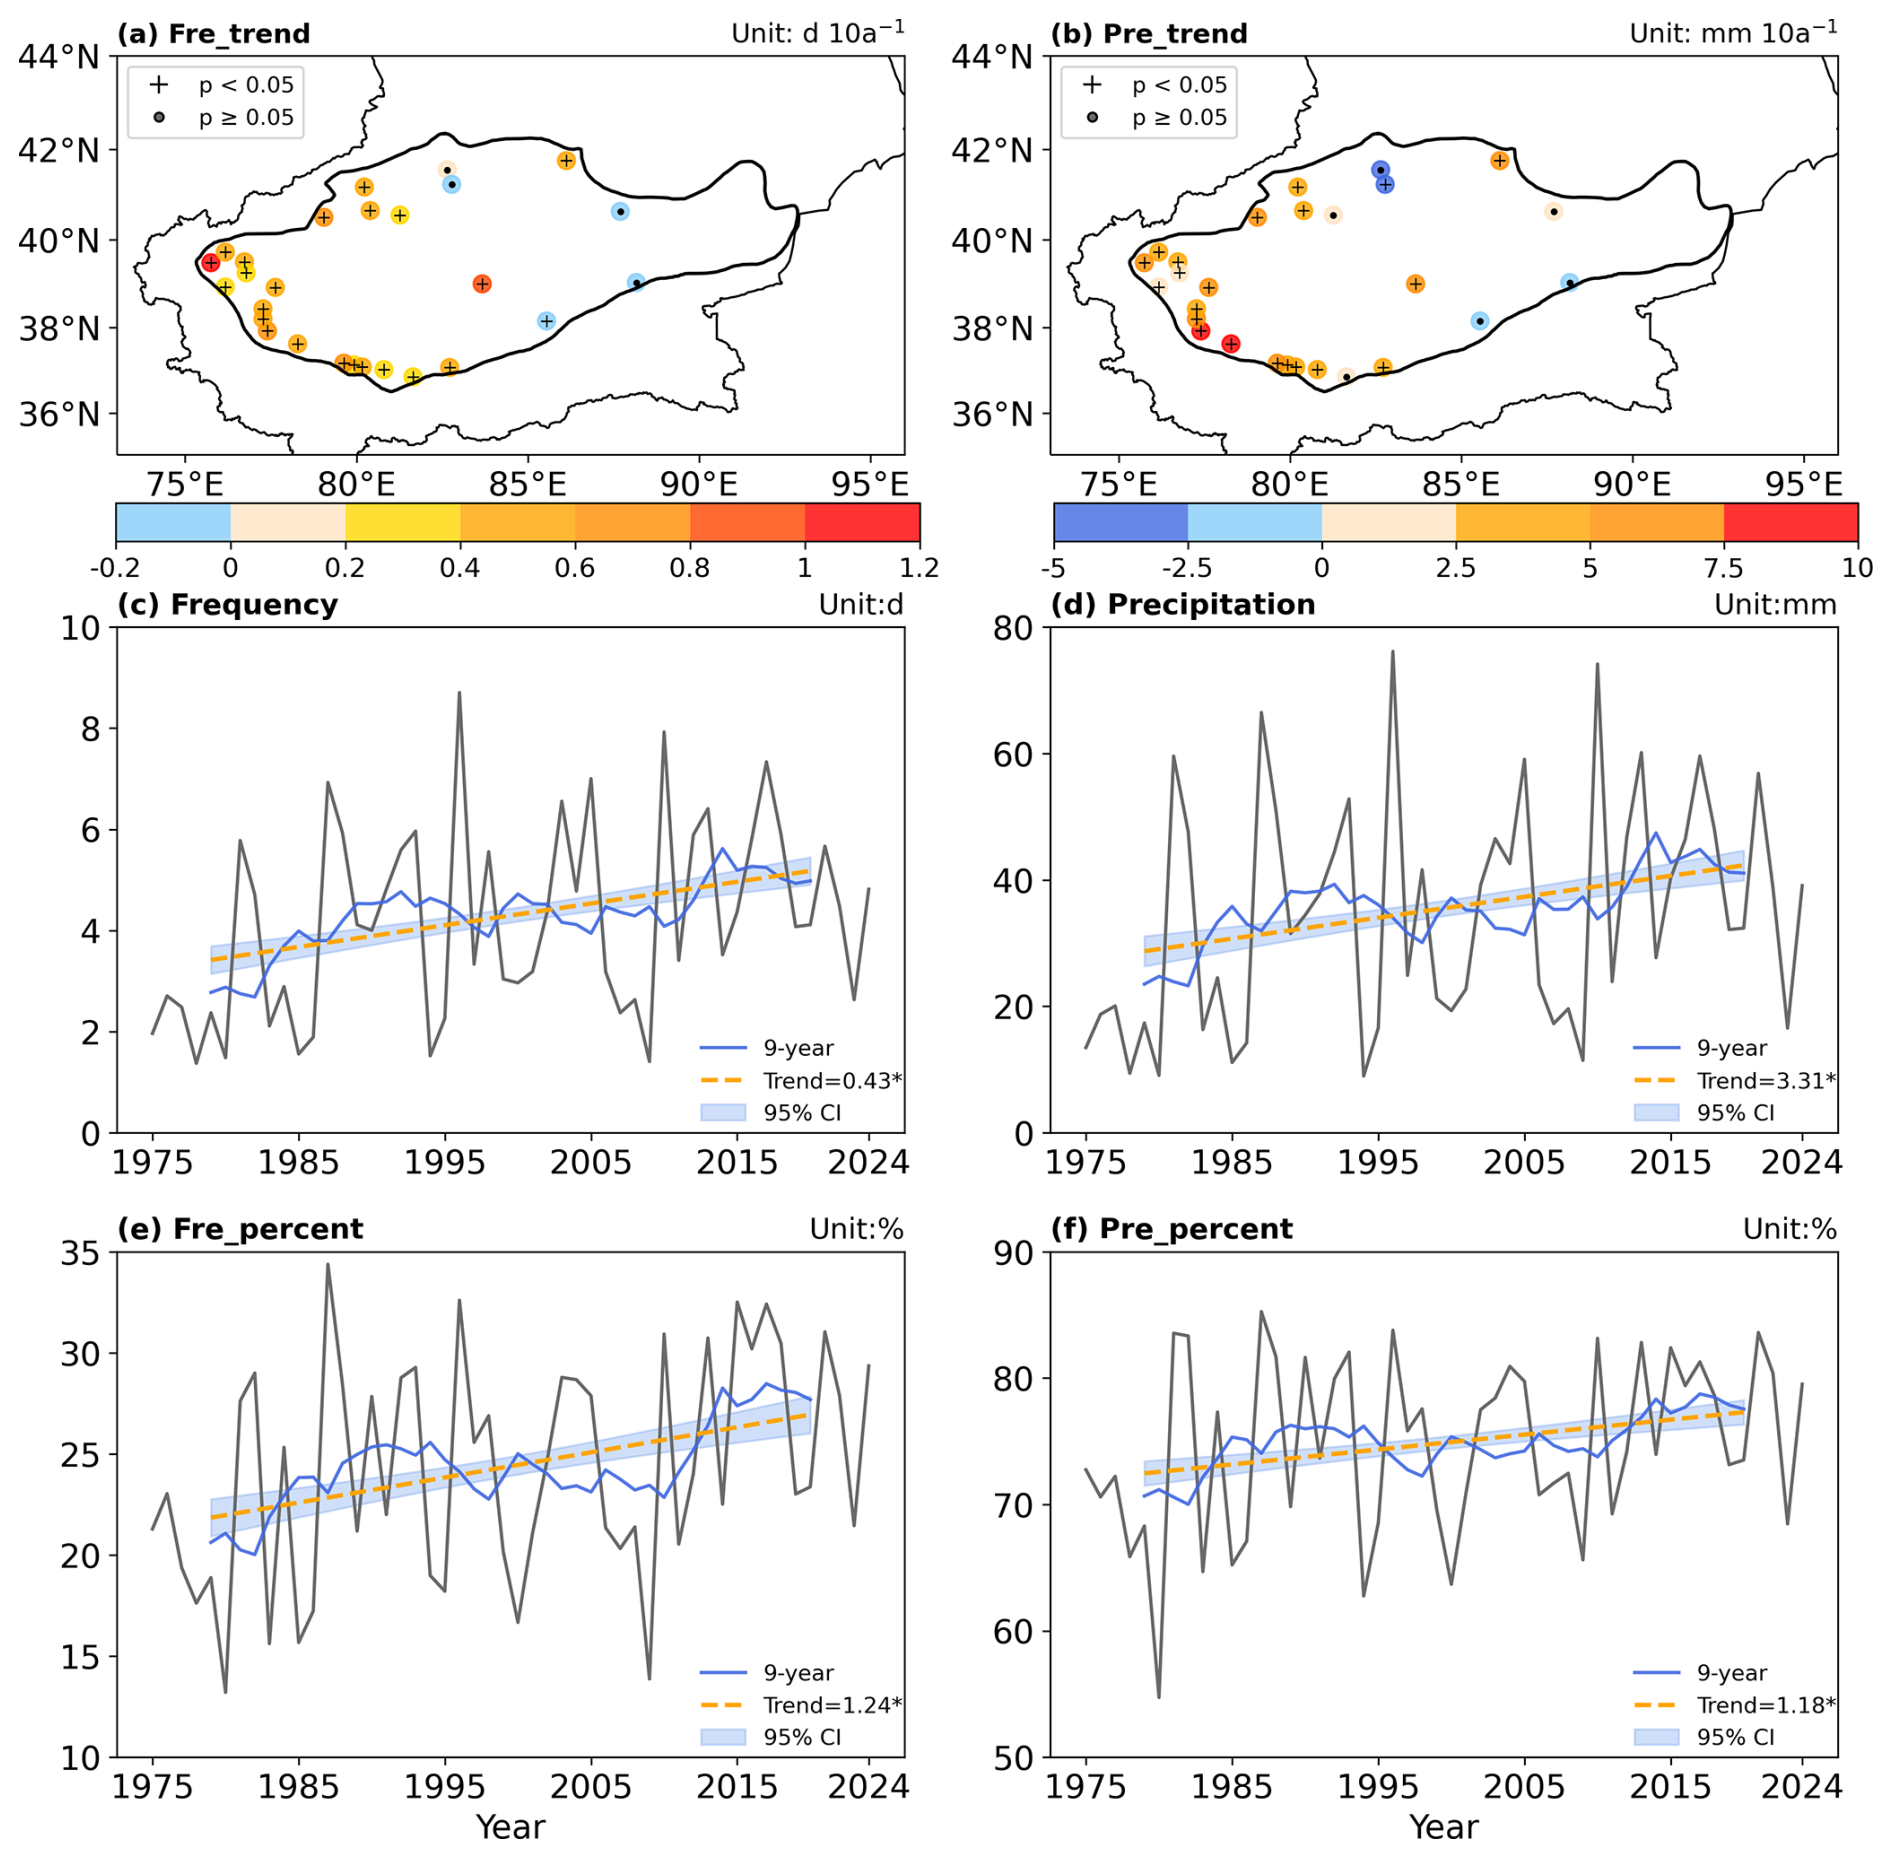
Figure 2Spatiotemporal characteristics of EP events in the Tarim Basin during March–August 1975–2024. (a) Spatial distribution of trends in the frequency of EP (units: d 10 a−1); (b) Spatial distribution of trends in the amount of EP (units: mm 10 a−1); (c) Interannual variation in the frequency of EP (units: d); (d) Interannual variation in the amount of EP (units: mm); (e) Interannual variation in the proportion of EP frequency to total precipitation frequency (units: %); (f) Interannual variation in the proportion of EP amount to total precipitation amount (units: %). The plus sign (+) and dot (⋅) in (a) and (b) denote trends that are statistically significant and non-significant at the 95 % confidence level based on the Student's t-test; the asterisk (*) in (c)–(f) indicates statistical significance.
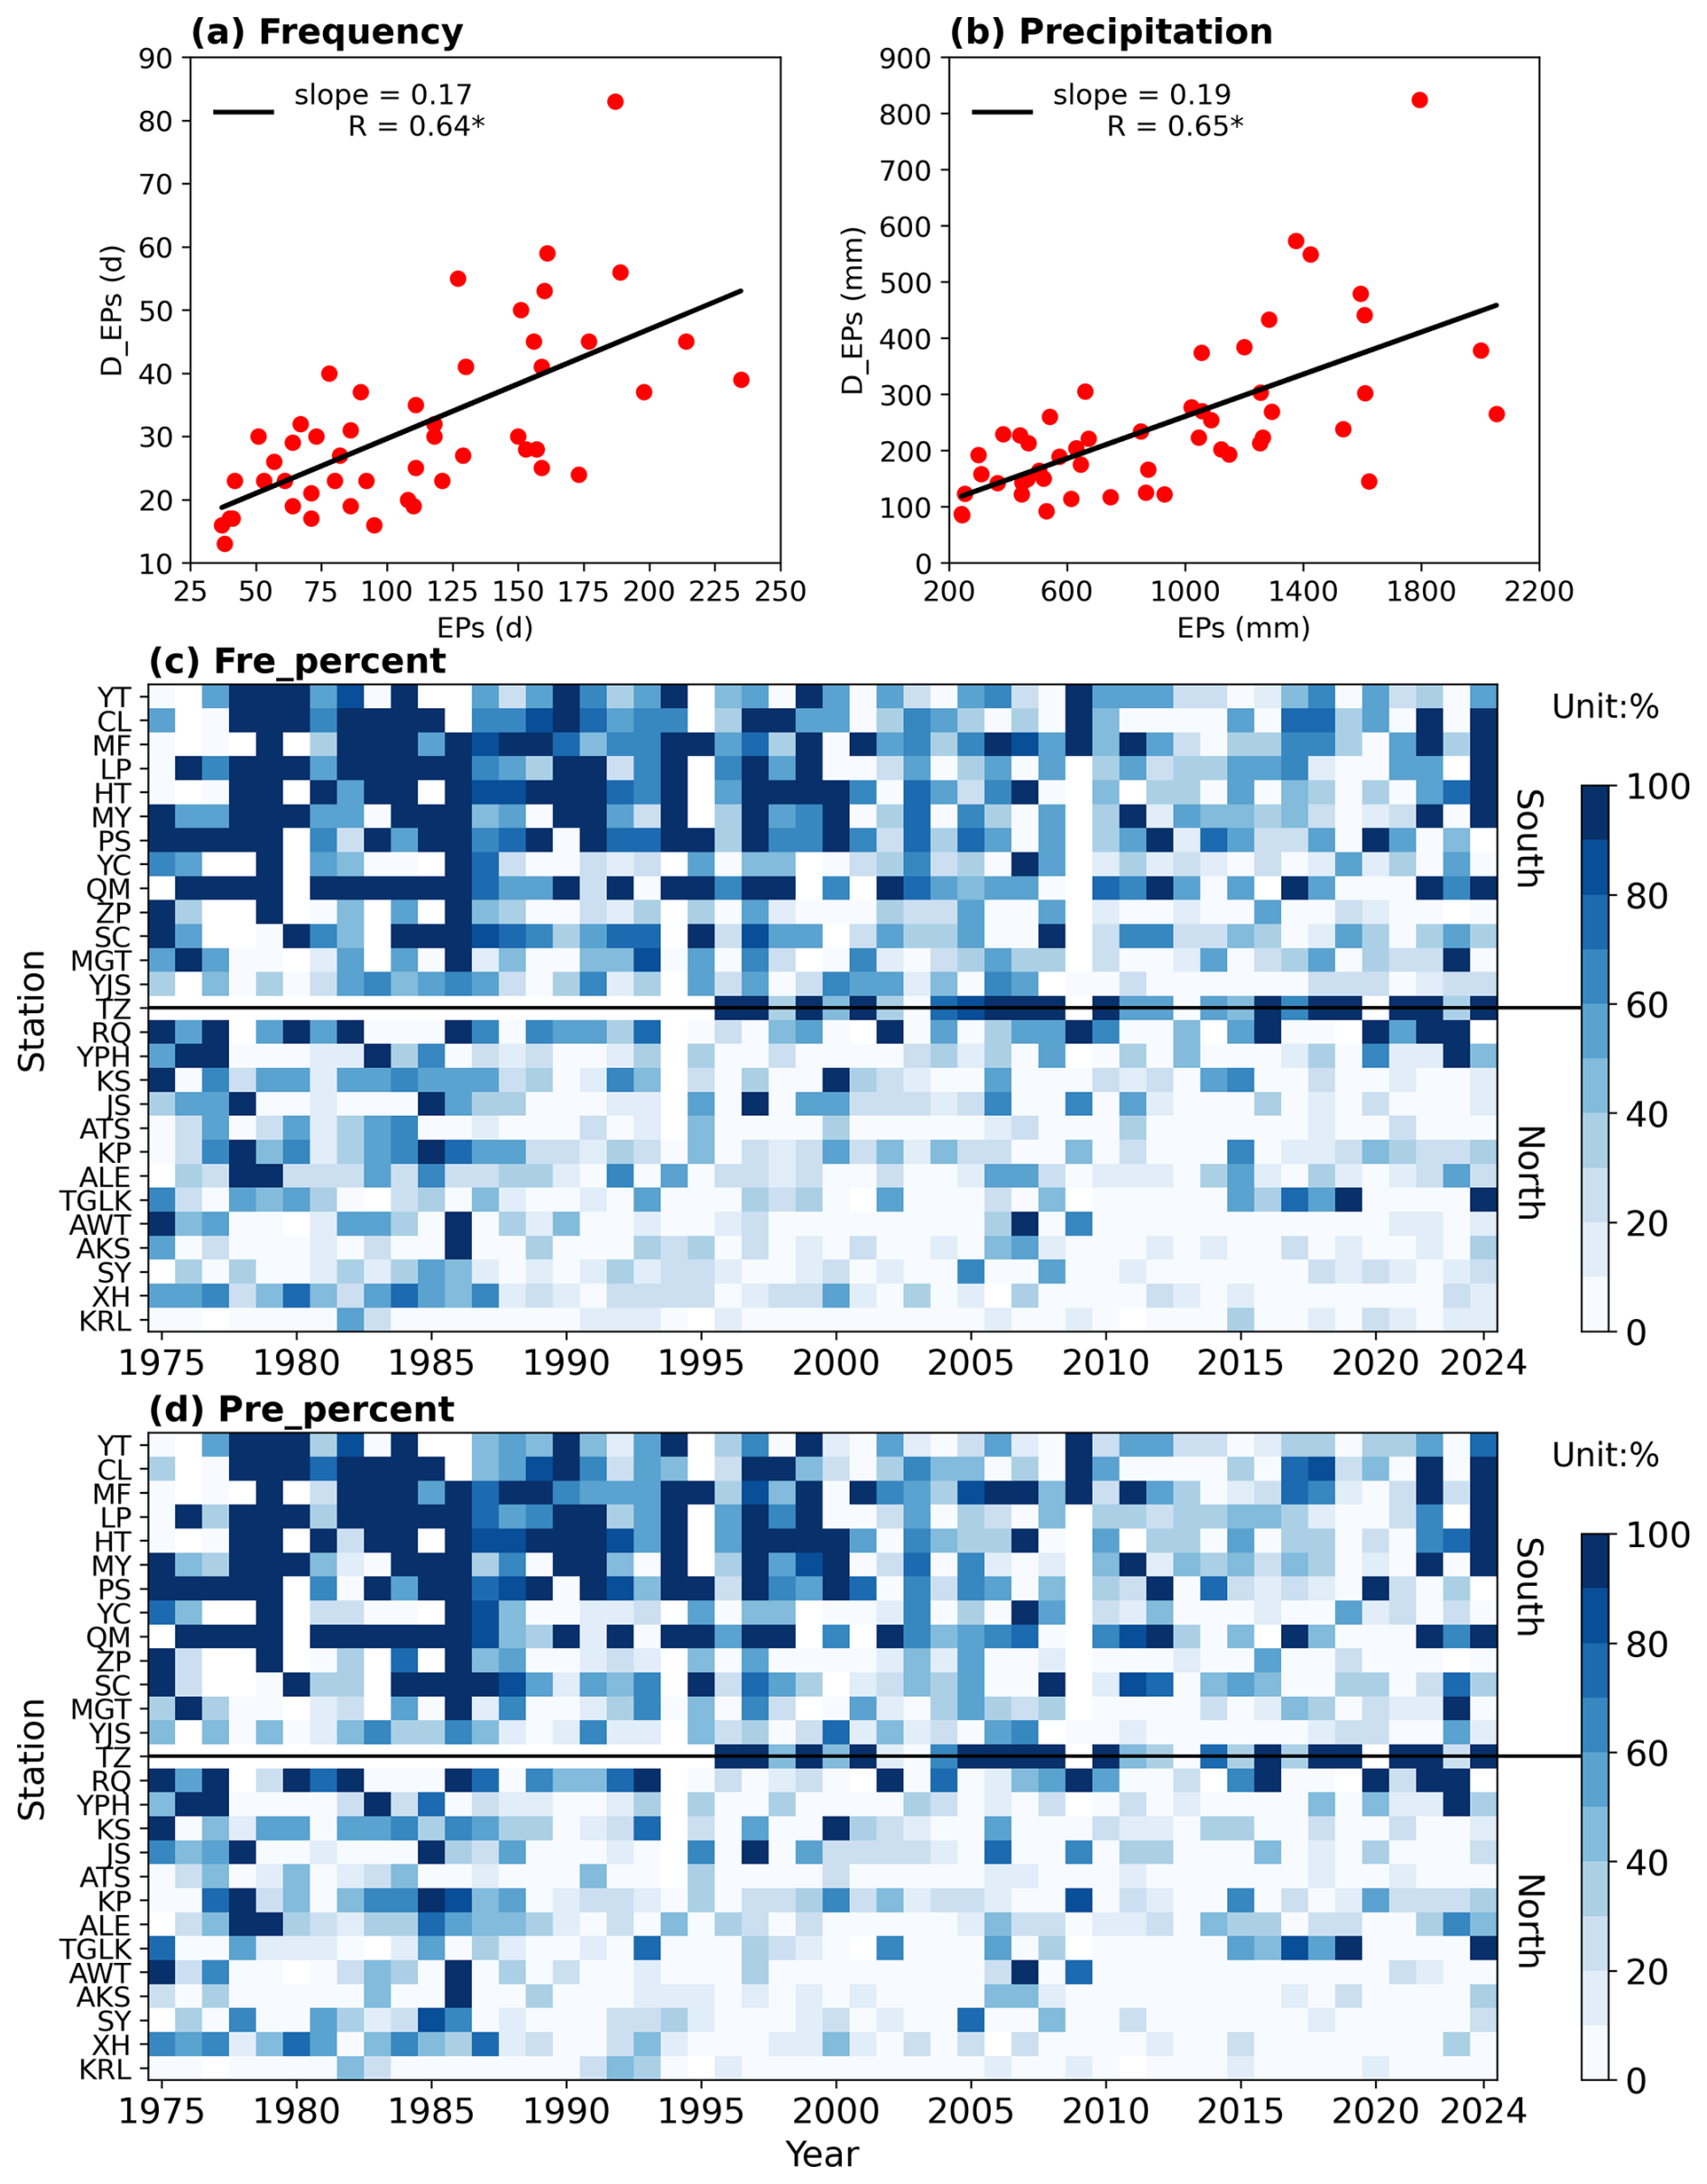
Figure 3Statistical relationship between D_EP and total EP during March–August 1975–2024. (a) Scatter plot and fitted line of D_EP frequency versus total EP frequency (units: d). (b) Scatter plot and fitted line of D_EP amount versus total EP amount (units: mm). (c) Heatmap of the interannual variation in the percentage contribution of D_EP frequency at each station (units: %). (d) Heatmap of the interannual variation in the percentage contribution of D_EP amount at each station (units: %). The asterisk (*) in (a) and (b) indicates statistical significance.
2.6 Quantifying the contribution of dust aerosols on EP
The OMR method was employed to quantitatively estimate the contribution of dust aerosols to EP. Initially, the OMR approach developed to quantify urbanization effects on climate systems (Cai and Kalnay, 2005; Kalnay and Cai, 2003; Yang et al., 2011), it has been subsequently applied to reveal anthropogenic influences on the lower atmosphere and regional climate (Ding et al., 2013, 2016; Huang et al., 2018; Zhao et al., 2014). More recent applications have successfully uncovered aerosol impacts on daily weather forecast errors and effects of biomass burning aerosols on clouds (Ding et al., 2021; Huang and Ding, 2021). Therefore, this method could identify physical processes inadequately represented in models by calculating differences between observational and reanalysis data.
The precipitation in the ERA5-Land reanalysis data used in this study originates from ERA5 and indirectly benefits from the assimilation of multi-source observations, yet it does not directly incorporate aerosol processes (Muñoz-Sabater et al., 2021). Furthermore, ERA5-Land reanalysis data also contain the inherent model systematic biases along with factors such as local climate, topography, and precipitation intensity (Gomis-Cebolla et al., 2023; Li et al., 2022; Tan et al., 2023). Therefore, by comparing the discrepancies in D_EP events between observations and reanalysis data, while removing the associated systematic errors from the reanalysis, we can isolate the contribution of dust aerosols to EP.
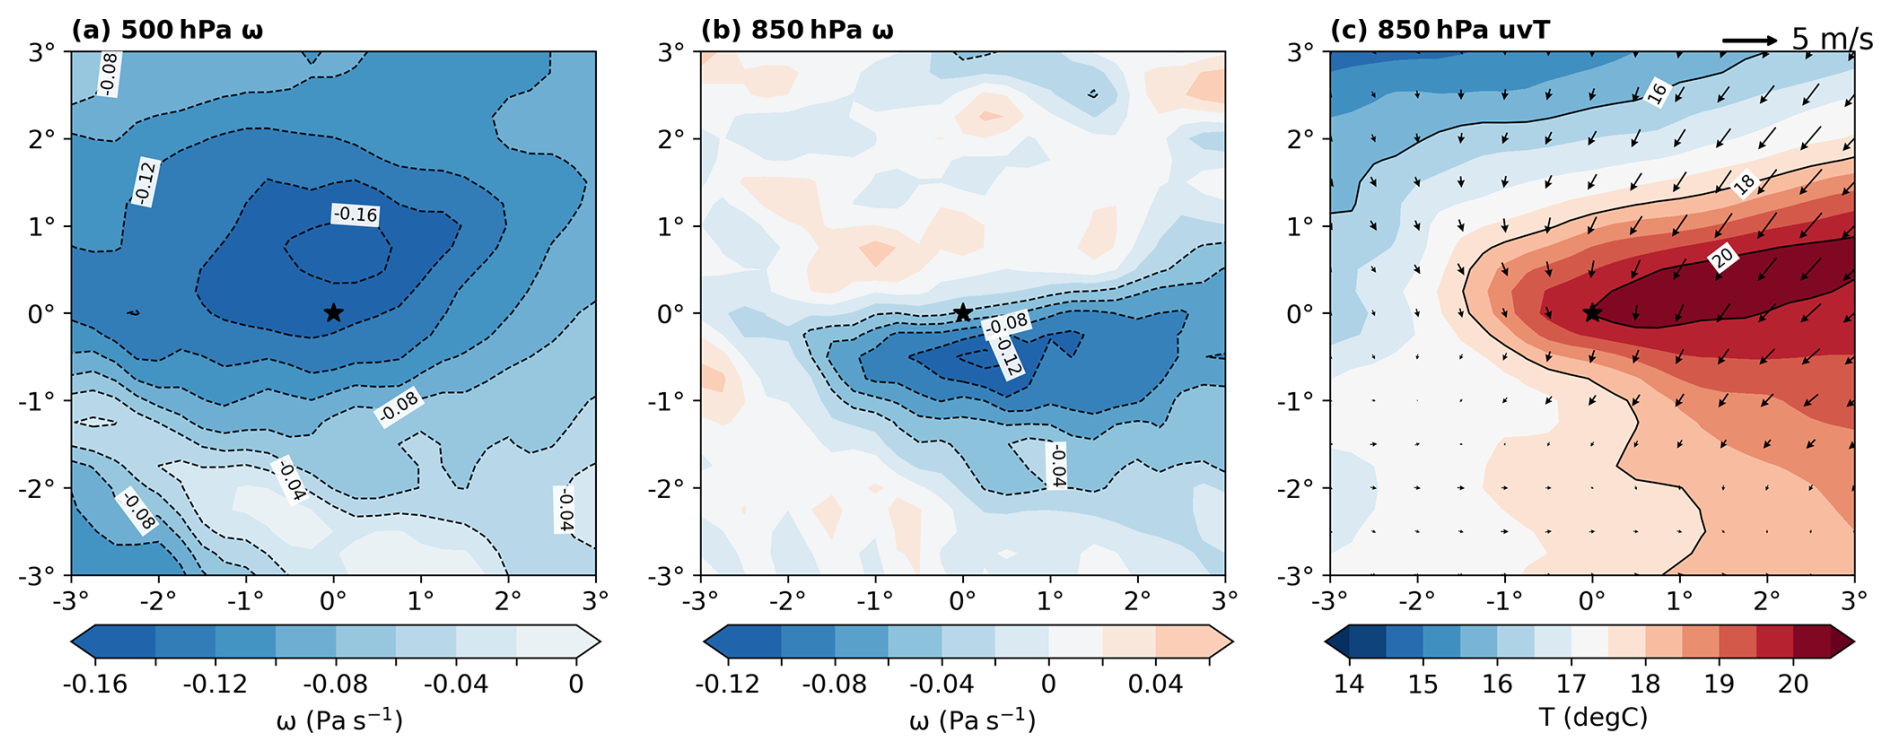
Figure 4Dynamic conditions for D_EP events during March–August 1975–2024, composited using a moving coordinate system. (a) Vertical velocity at 500 hPa (units: Pa s−1). (b) Vertical velocity at 850 hPa (units: Pa s−1). (c) Thermodynamic field at 850 hPa: vectors represent wind field (units: m s−1), and shading represents temperature field (units: °C). The star symbol (⋆) denotes the origin of the composited stations.
2.7 Methodology
The evaluation and analysis of the dust aerosol effects on EP comprises four steps (Fig. 1). Step 1. Statistical analysis of the spatiotemporal characteristics of EP. This step involves analyzing the changes in the frequency and amount of EP, followed by identifying the proportion and relationship of EP events influenced by dust aerosols relative to the total EP. Step 2. Uncovering the physical mechanisms through which dust aerosols affect clouds and precipitation. This step involves analyzing the background environmental conditions from the perspectives of dynamic and water vapor conditions, and investigate the internal pathways of influence via cloud microphysical processes. Step 3. Quantifying the contribution of dust aerosols to precipitation. Based on long-term observations from national meteorological stations and ERA5-Land reanalysis precipitation data, the OMR method is employed to quantitatively evaluate the contribution of dust aerosols to EP. Step 4. Projecting future trends in D_EP. Utilizing CMIP6 models, future changes in the frequency and amount of D_EP are projected under three different pollutant emission scenarios.
3.1 Characteristics of EP in the Tarim Basin
Observational data indicate that a majority of stations in the Tarim Basin show significant increasing trends in the frequency and amount of EP events, with 81 % and 74 % of stations exhibiting such trends, respectively (Fig. 2a and b). Their nine-year moving averages exhibit significant upward trends at rates of 0.43 d 10 a−1 and 3.31 mm 10 a−1, respectively (Fig. 2c and d). On average, EP events account for 24 % of the total number of precipitation events but contribute up to 75 % of the total precipitation amount. Furthermore, these proportions show significant increasing trends at rates of 1.24 and 1.18 % 10 a−1, respectively (Fig. 2e and f), highlighting the dominant role of EP in the regional precipitation structure. This phenomenon may be associated with moister atmospheric conditions and enhanced precipitation efficiency under global warming (Zhang et al., 2023). When the thresholds for EP are set at the 90th, 85th, and 80th percentiles, the statistical characteristics of EP events exhibit a consistent increasing trend (figure omitted), thereby confirming the rationality of the selected threshold and the overall robustness of the research findings.
To investigate the impact of dust aerosols on EP, a statistical analysis was conducted on EP events associated with dust events in the region. Over the past 50 years, the number of D_EP days has shown a significant positive correlation with the total number of EP events days (; Fig. 3a), while the correlation for precipitation amounts is even stronger (; Fig. 3b). By averaging the annual percentages of D_EP frequency and precipitation from each station relative to total EP, the multi-year average contribution is obtained as 35.52 % (34.34 %). Before the year of 2000, D_EP events were dominant at 21 % of the stations, with contribution rates exceeding 90 %, a phenomenon particularly pronounced in areas south of TZ Station (Fig. 3c and d). The more pronounced contribution of D_EP events in the southern region may be attributed to two factors: firstly, the spatial pattern of summer moisture transport in the Tarim Basin, which is greater in the southwest and lesser in the northeast (Ma et al., 2025a); secondly, the basin's dust activity exhibits a spatial distribution of higher frequency in the south and lower frequency in the north, providing more abundant aerosol conditions in the southern area (Cheng et al., 2023).
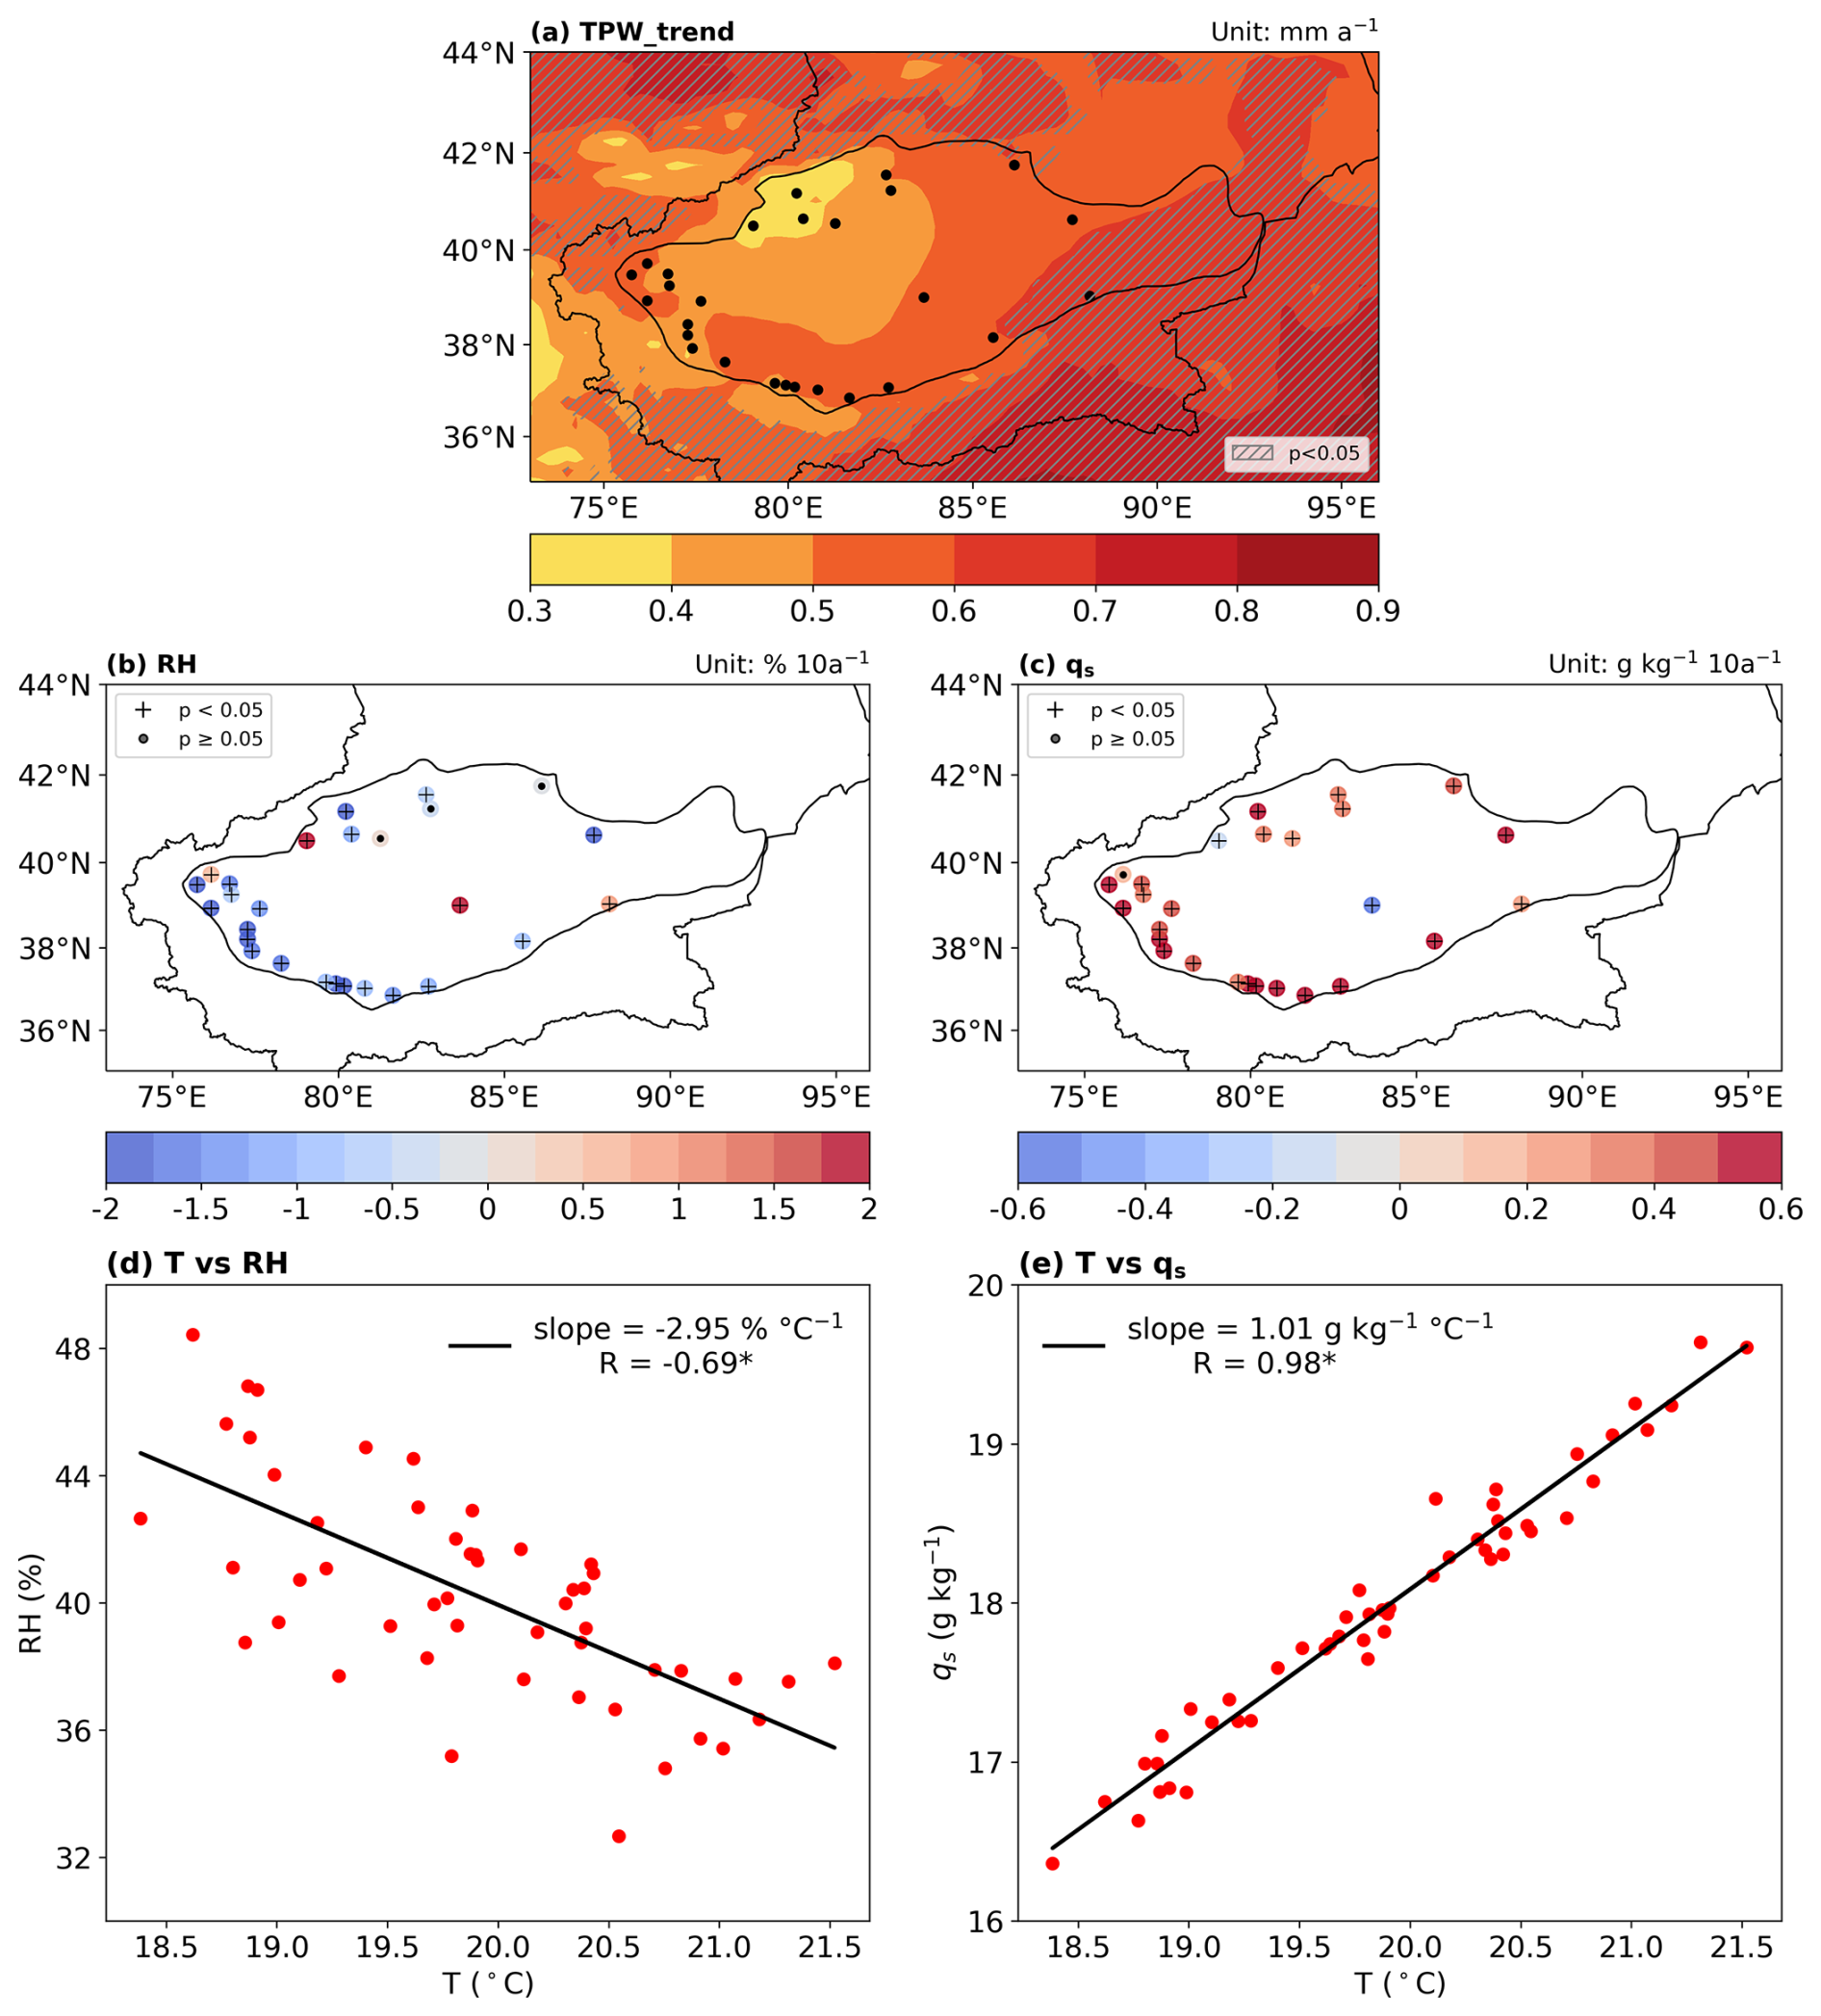
Figure 5Characteristics of moisture condition variations during March–August 1975–2024. (a) Spatial distribution of the interannual trend in TPW (black dots denote observational station locations; units: mm a−1). (b) Trend in relative humidity (units: % 10 a−1). (c) Trend in saturation specific humidity (units: ). (d) Scatter plot and linear fit of relative humidity versus temperature. (e) Scatter plot and linear fit of saturation specific humidity versus temperature. The shaded areas in (a), and the plus signs (+) in (b) and (c), indicate statistical significance at the 95 % confidence level, whereas the dots (⋅) denote non-significant trends.
3.2 Impact Mechanisms of Dust Aerosols on EP
To reveal the underlying causes of D_EP events, the following section will systematically analyze key influencing factors, including dynamic conditions, moisture conditions, and cloud microphysical characteristics.
3.2.1 Dynamic Conditions
Given the vast area of Tarim Basin, applying a regional average within a geographically fixed coordinate system to spatially dispersed rainfall centers can introduce significant biases. To address this limitation, the study area was reconstructed using a moving coordinate system centered on the stations experiencing D_EP events, thereby more accurately capturing the dynamic characteristics of the core rainfall region (Xue et al., 2025).
The synergistic effect of dynamic and thermodynamic processes establishes a weather background conducive to precipitation. One day prior to the occurrence of D_EP events, an ascent center is observed north of the station at the 500 hPa level, while at the 850 hPa level, the ascent center is located south of the station (Fig. 4a and b). This vertical misalignment between the upper- and lower-level ascent centers favors the development of a baroclinically unstable atmospheric stratification, thereby providing favorable dynamic lifting conditions for the onset of D_EP events. Simultaneously, the low-level (850 hPa) horizontal wind field exhibits convergence features near the station, and a local warm core supplies thermodynamic instability energy for convective development, which collectively sustain and intensify the unstable conditions in the region (Fig. 4c). The macroscale process of synergistic dynamical and thermodynamic lifting directly modulates the response of extreme precipitation to dust aerosols. It does so by providing the sustained ascent that simultaneously transports moisture and activates the microphysical effects of dust. Once activated, dust particles serve as efficient ice nuclei, enhancing ice-phase processes and latent heat release, which intensifies convection and precipitation efficiency (Xu et al., 2025; Sun et al., 2022). This interaction establishes a positive feedback loop, whereby the large-scale conditions amplify the microphysical impact of dust on precipitation.
3.2.2 Moisture Conditions
Humidity is a key limiting factor for the formation of D_EP events in the Tarim Basin. Although the regional atmospheric total precipitable water vapor (TPW) shows a consistent increasing trend (Fig. 5a), observational data indicate that 78 % of the stations experienced a significant decrease in relative humidity (RH; Fig. 5b), while 89 % of the stations recorded a significant increase in saturation specific humidity (qs; Fig. 5c). Under climate warming, arid regions in northern China exhibit a pronounced warming trend (Huang et al., 2016). Rising temperatures lead to an increase in saturation vapor pressure, which enhances the air's capacity to hold moisture. Consequently, despite the overall increase in TPW, RH decreases, resulting in a reduction in actual atmospheric moisture levels and making it more difficult for the air to reach saturation and condensation conditions (Fig. 5d and e). However, the observed increase in EP events within the Tarim Basin (Fig. 2), which underscores that dust aerosols play a significant role in EP events.
Figure 6 compares the normalized distributions of the difference between RH and qs across three types of events, providing further insight into the moisture conditions associated with different events. The results show that for D_EP events, the RH at all stations is significantly higher than during Dust events, with 85 % of the stations more prone to saturation. Compared to N_EP events, although the RH at all stations is relatively lower, 52 % of the stations still exhibit a relatively higher tendency toward saturation. The results indicate that compared to Dust events, both D_EP events and EP events exhibit significantly more favorable moisture conditions. Furthermore, when comparing D_EP events and EP events, the former demonstrates a higher level of moisture saturation, providing more favorable conditions for dust aerosols to act as ice nuclei or condensation and thereby promote precipitation.
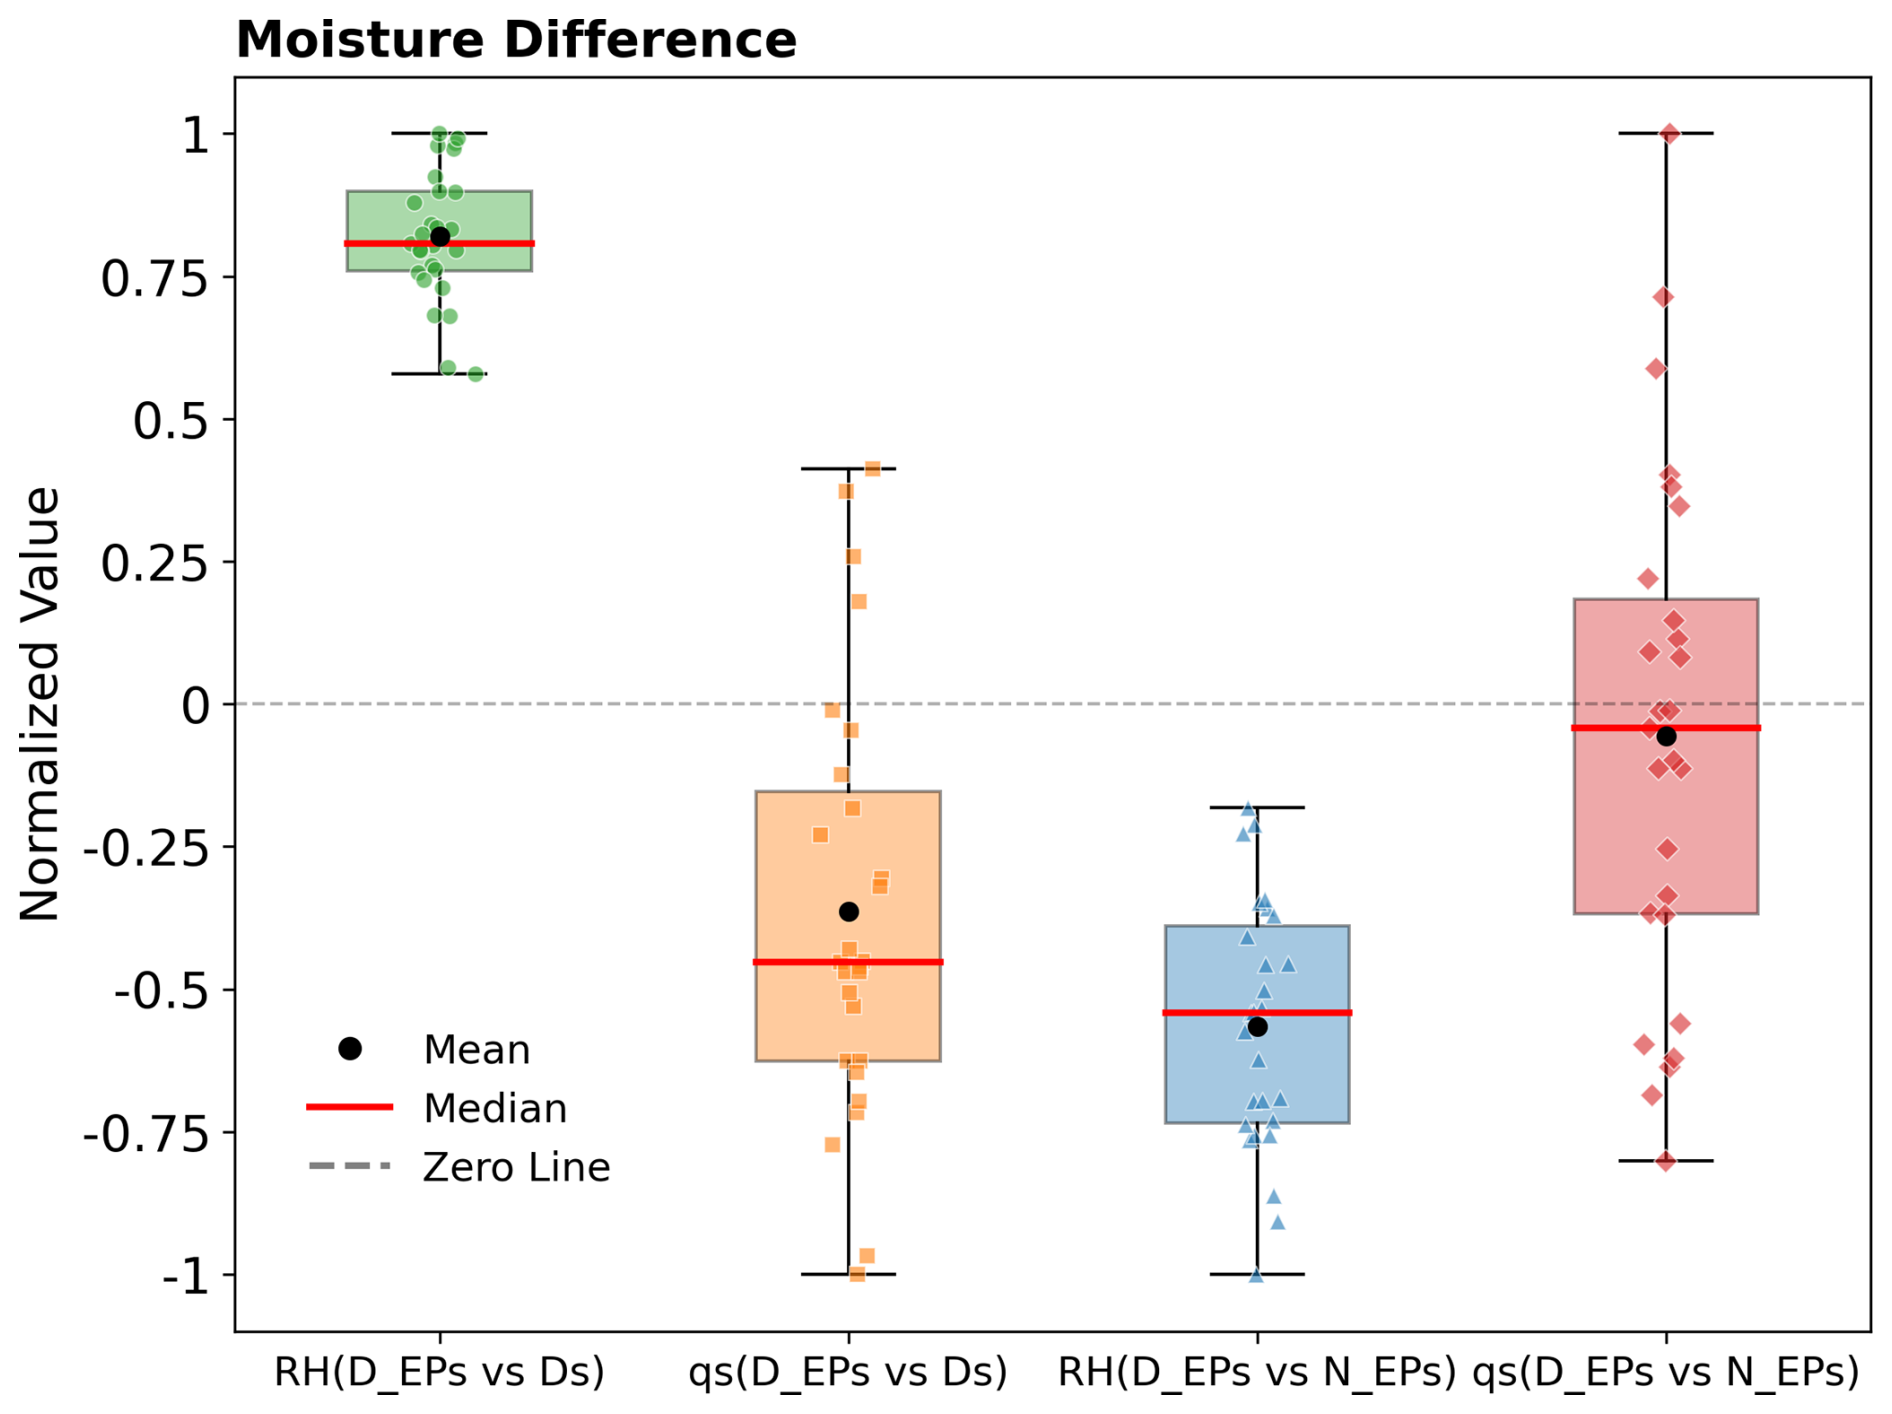
Figure 6Normalized differences in RH and qs for D_EP, Dust (Ds), and EP events during March–August 1975–2024. Black dots represent mean values, red solid lines indicate medians, and gray dashed lines denote the zero reference.
3.2.3 Cloud Physical Properties
The formation and intensity of precipitation are critically constrained by cloud microphysical properties, which govern the growth and conversion efficiency of hydrometeors within clouds and are macroscopically manifested in parameters such as cloud-top height and cloud water path, both positively correlated with precipitation (Song et al., 2019; Zhao et al., 2024b). Satellite observations reveal that during D_EP events, the average cloud top height (CTH) can reach approximately 8 km, exhibiting more pronounced vertical development compared to N_EP events (Fig. 7a and f). Accompanying this is a notable increase in hydrometeor content, with ice water path and ice-phase particle effective radius approximately twice their liquid counterparts (Fig. 7b–e). Further comparison with N_EP events shows that 63 % of stations observed larger liquid water path values, while 85 % of stations exhibited higher ice water path values (Fig. 7g and h). This enhancement can be attributed to the role of dust aerosols acting as efficient ice nuclei. Their insoluble surfaces provide a solid-liquid interface that facilitates the formation of ice embryos, thereby promoting the freezing of supercooled droplets (Zhang et al., 2012). The resulting ice crystals then grow through processes such as collision-coalescence, leading to a significant increase in the size of ice-phase particles, as indicated by the ice water radius (IWR; Fig. 7j). Notably, the mean liquid water radius (LWR) is also larger during D_EP events (Fig. 7i), which is likely attributable to strong updrafts supplying abundant moisture that enhances condensation concurrent with ice growth. This ultimately enhances precipitation efficiency by increasing the sedimentation velocity of precipitation particles. These microphysical processes can suppress the formation of light precipitation while promoting the occurrence of heavy precipitation, consequently leading to an increased frequency of extreme weather events (Shao et al., 2022; Zhao et al., 2025).
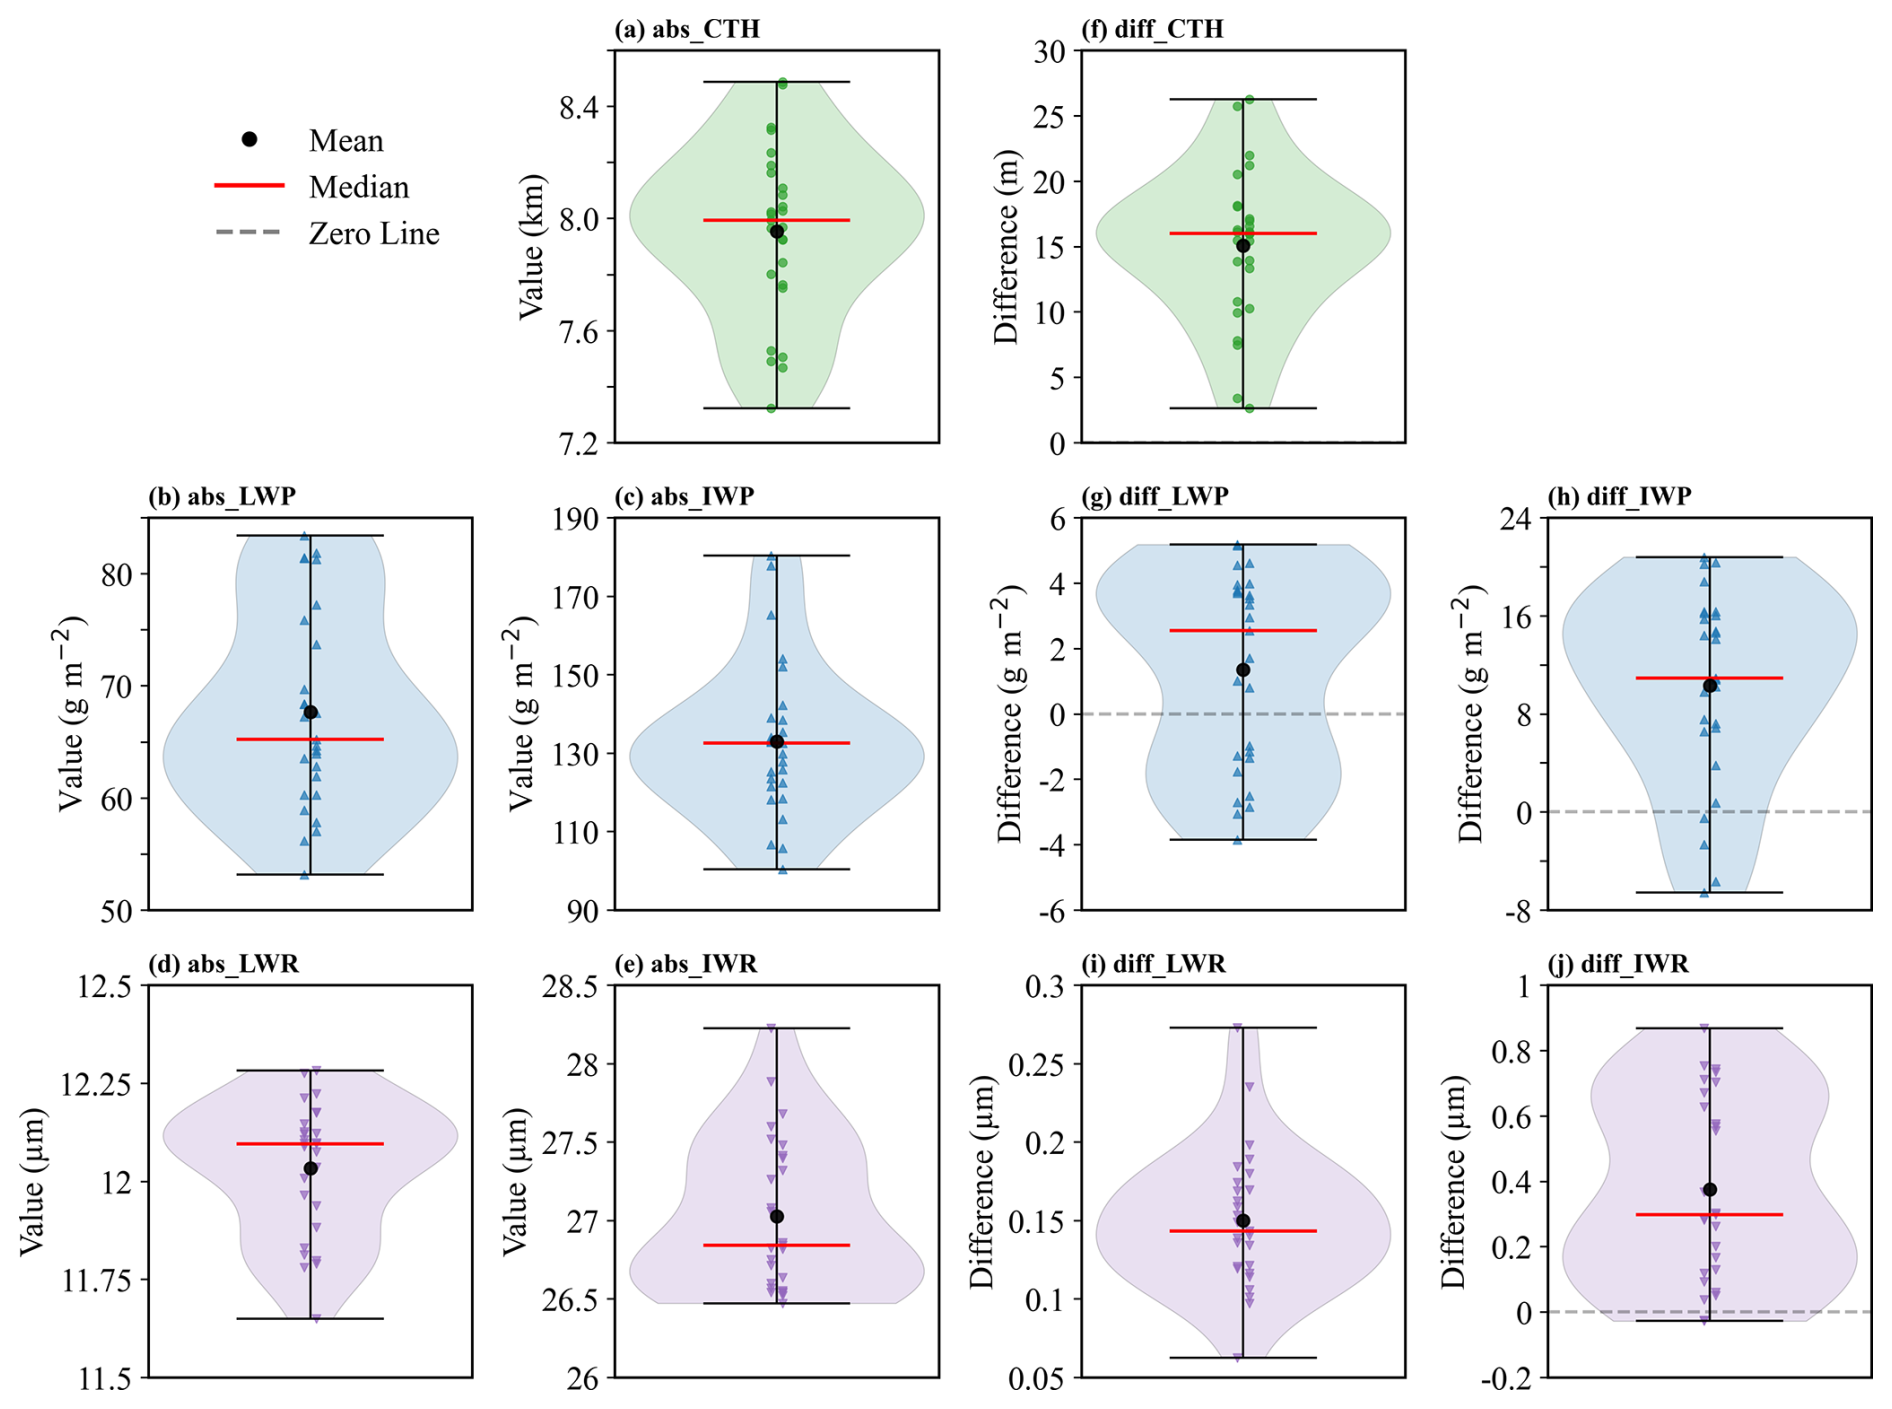
Figure 7Cloud physical properties during D_EP events and their differences from N_EP events in March–August 2000–2024. (a–e) Absolute values during D_EP events: (a) CTH (km), (b) LWP (g m−2), (c) IWP (g m−2), (d) LWR (µm), (e) IWR (µm). (f–j) Differences (D_EP minus N_EP): (f) CTH (m), (g) LWP, (h) IWP, (i) LWR, (j) IWR. Black dots represent mean values, red solid lines indicate medians, and gray dashed lines denote the zero reference line.
In summary, Fig. 8 illustrates the mechanisms by which dust influences EP events. Dust events provide strong dynamic lifting and concurrently transport copious amounts of dust aerosols (Ma et al., 2023, 2025b; Meng et al., 2025; Zhou et al., 2020). When moisture is insufficient, abundant dust aerosols acting as condensation nuclei “compete” for the limited available water vapor. This increases cloud droplet number concentration while reducing the cloud droplet effective radius, and may shorten cloud lifetime by enhancing droplet evaporation, ultimately suppressing effective precipitation and resulting in a pure dust event (Fig. 8a). In contrast, under sufficient moisture conditions, the hygroscopicity of dust aerosols promotes the hygroscopic growth of cloud droplets, and their efficacy as ice nuclei activates ice crystal processes. These ice crystals then grow by deposition and riming, releasing latent heat and accelerating particle collision-coalescence, thereby fostering cloud vertical development and precipitation formation (Fig. 8b).
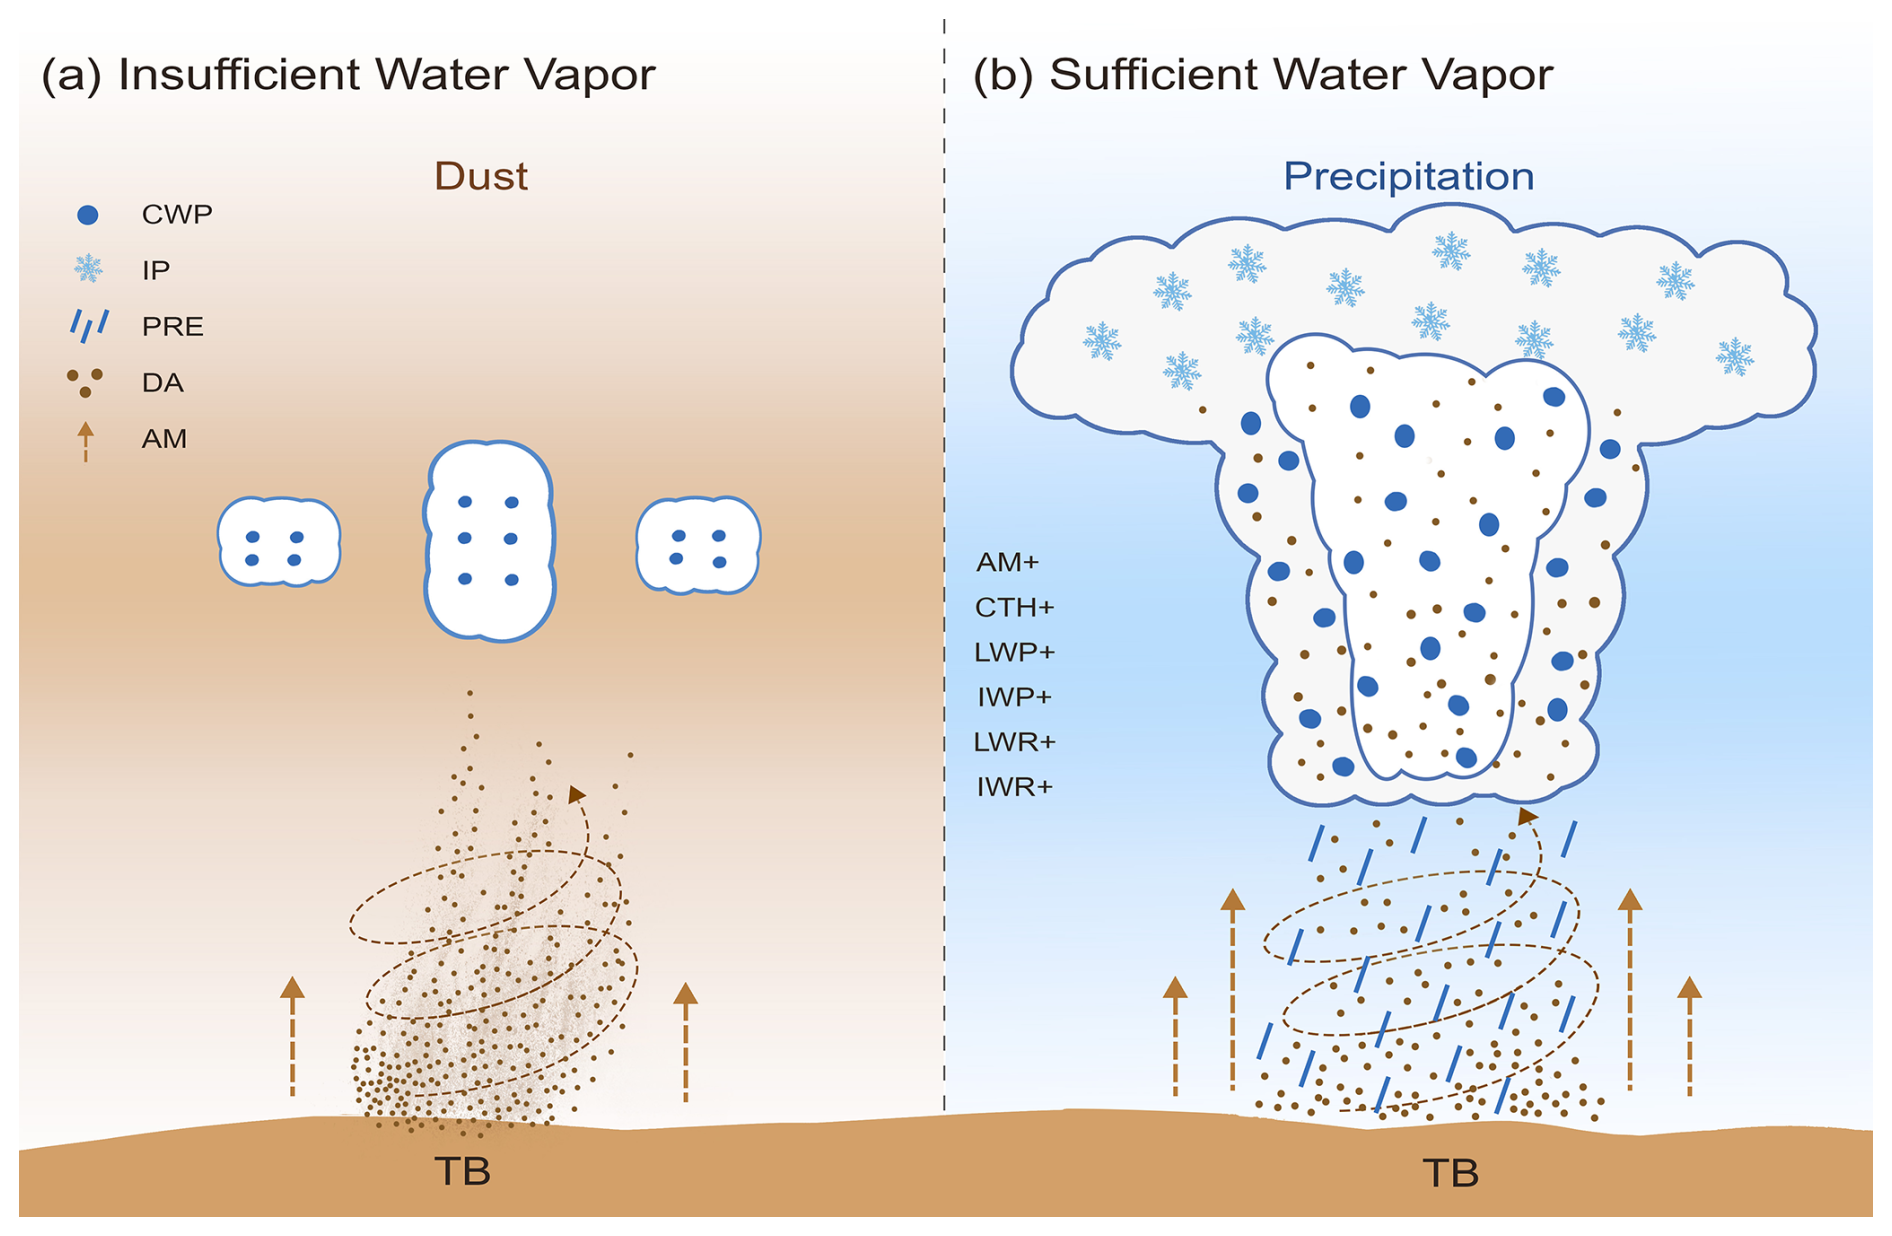
Figure 8Mechanisms of dust aerosol effects on clouds and precipitation (TB, Tarim Basin; CWP, cloud water particles; IP, ice particles; PRE, precipitation; DA, dust aerosols; AM, ascending motion; CTH, cloud top height; LWP, liquid water path; IWP, ice water path; LWR, liquid water radius; IWR, ice water radius).
3.3 Contribution of Dust Aerosols to EP and Future Projections
Previous studies have confirmed that the OMR method can effectively reveal aerosol effects not captured by reanalysis data (Ding et al., 2021; Huang et al., 2020; Huang and Ding, 2021). A broad consensus supported by robust theoretical evidence indicates that aerosol-radiation interactions and aerosol-cloud interactions are key drivers of precipitation changes (Zhao et al., 2024a). Whether these interactions result in an enhancement or suppression of precipitation depends on the specific physical mechanisms dominated by dust aerosols. Consistently, as shown in Fig. 9a, the probability density distribution of the dust aerosol contribution to EP, derived from bias-corrected ERA5-Land precipitation data, spans both negative and positive values, but exhibits a unimodal pattern with a peak interval of 5 % to 25 %. Locally observed negative contributions may be related to warming, drying, and enhanced evaporation caused by the accumulation of absorbing aerosols in the lower atmosphere (Sun et al., 2023). From a net effect perspective, the mean contribution of 6.6 % demonstrates an overall positive influence of dust aerosols on regional EP.
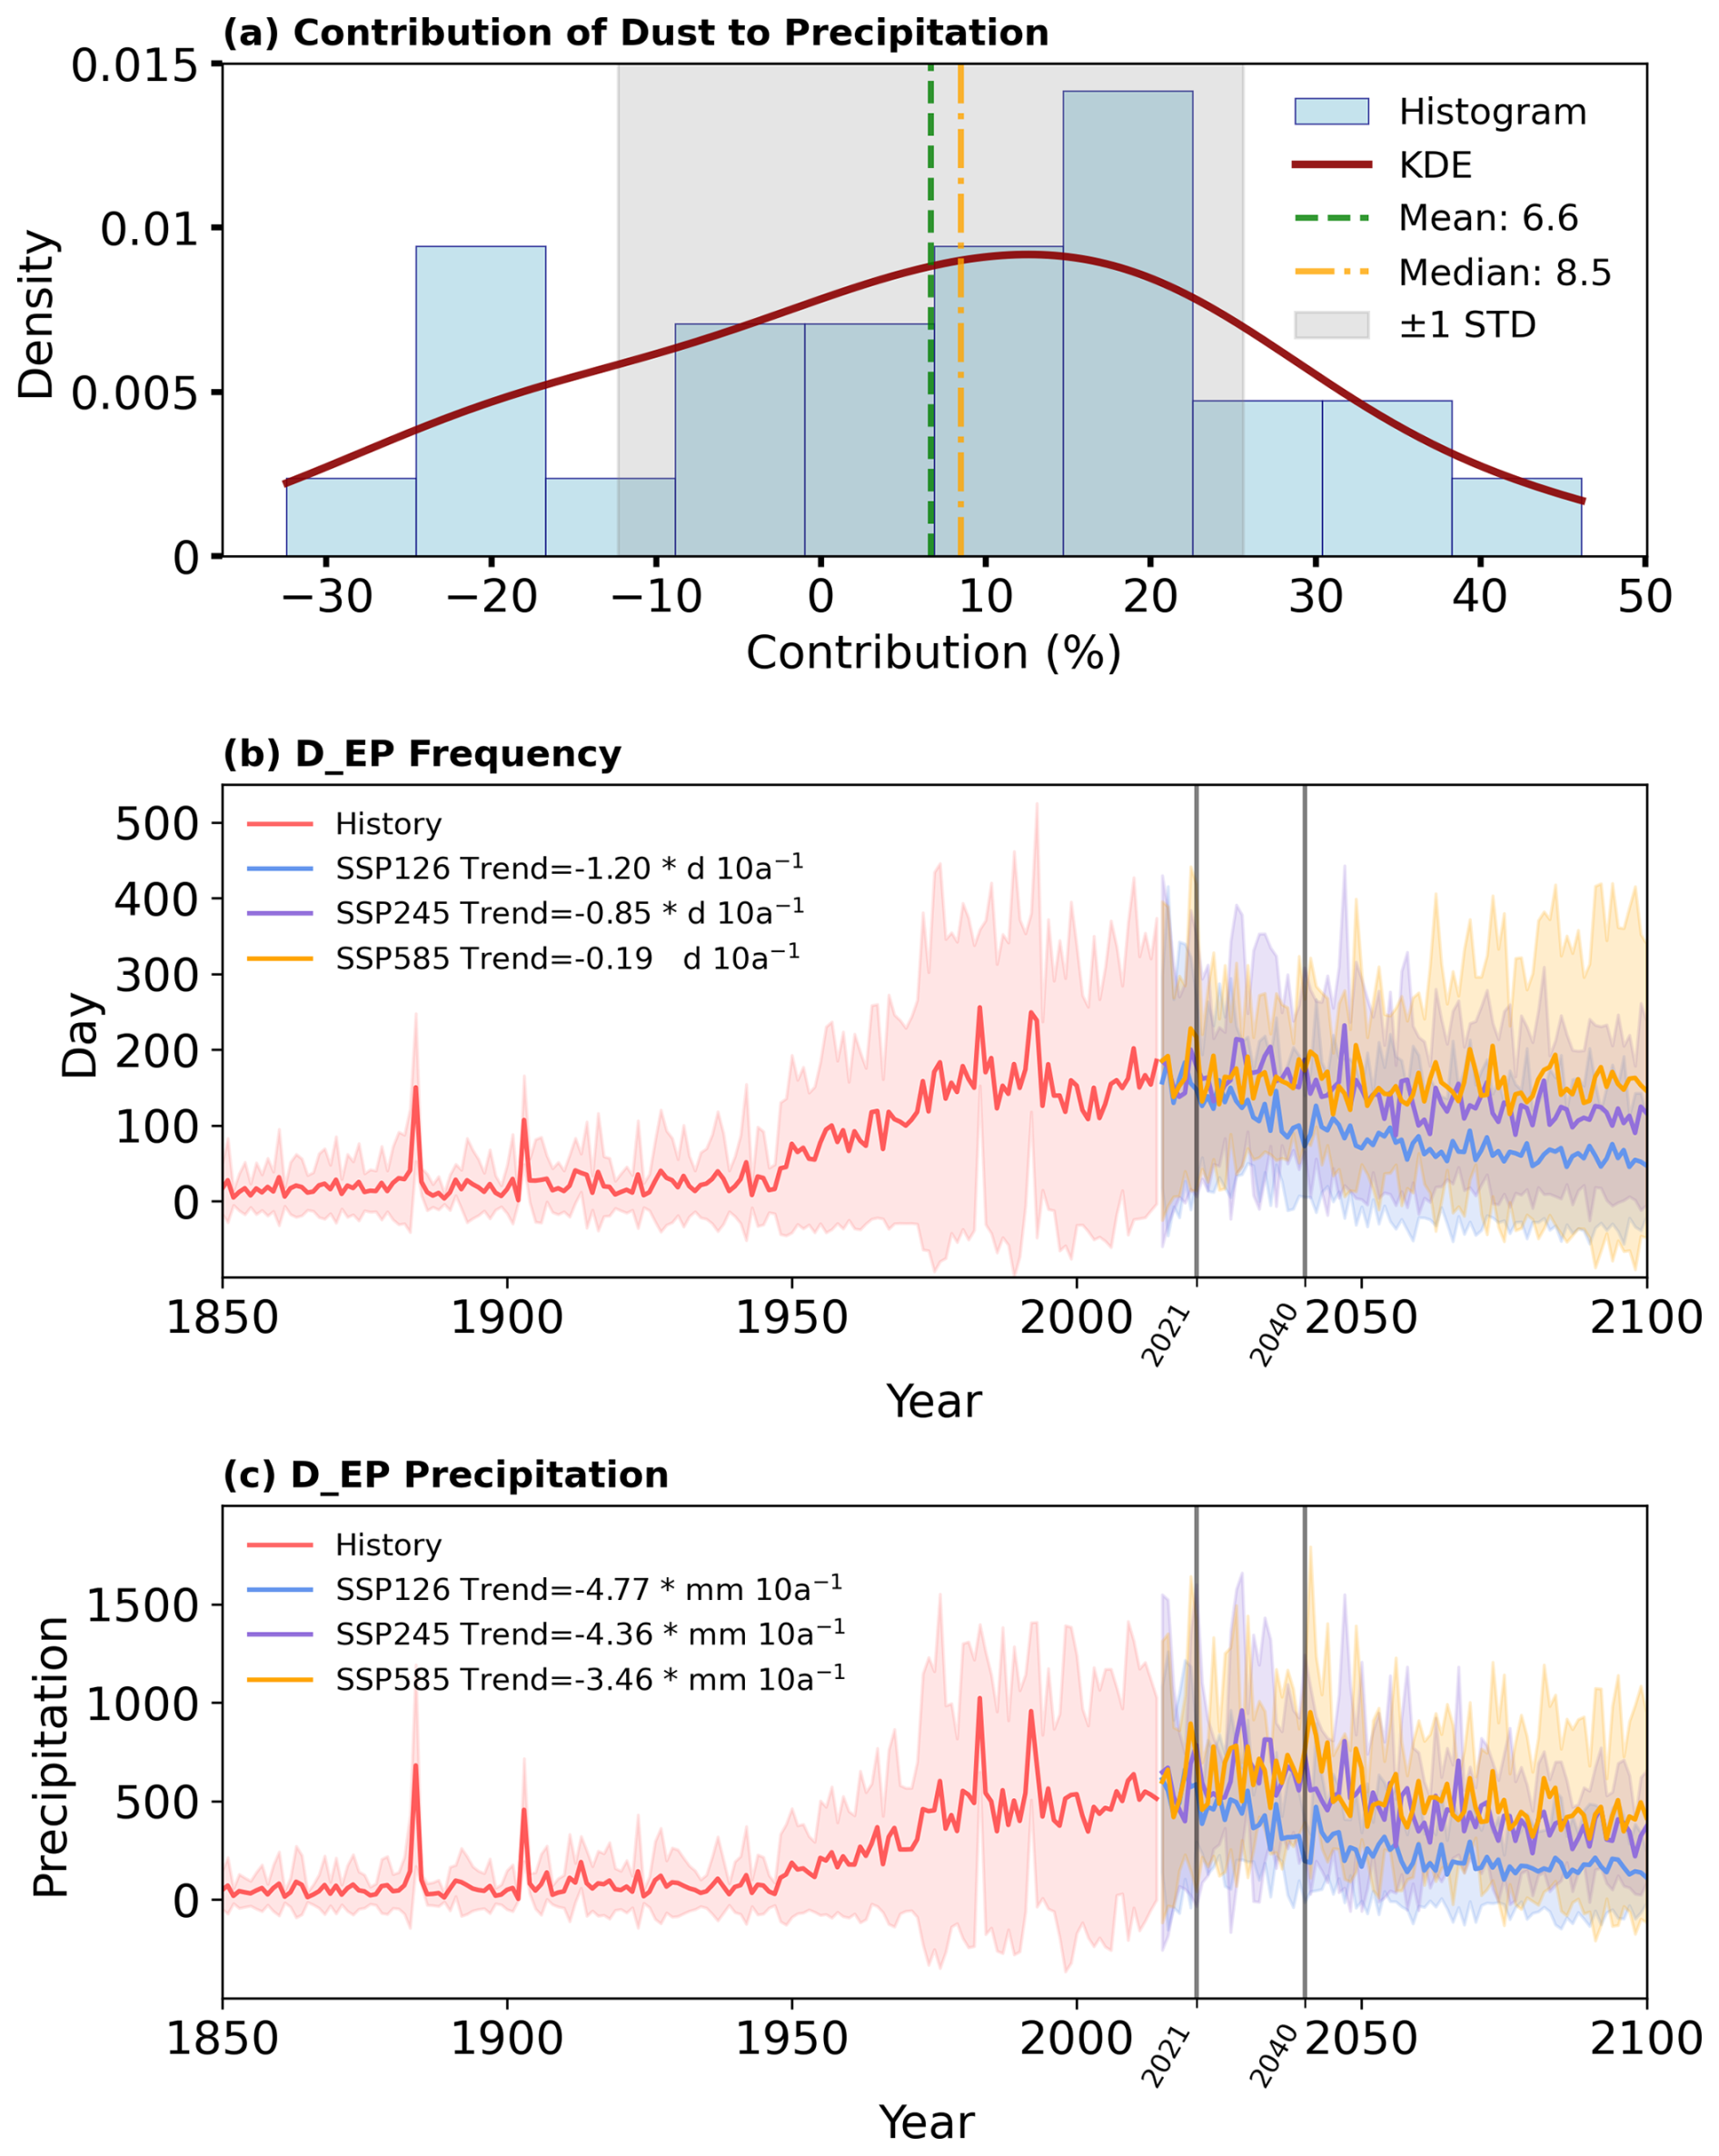
Figure 9Contribution of dust to EP and projected future changes in D_EP events. (a) Probability density distribution of the dust contribution rate to EP. (b) Time series of the annual D_EP days from historical observations and multi-scenario future projections (units: d). (c) Time series of the total annual D_EP events from historical data and multi-scenario future projections (units: mm).
To further understand the impact of dust aerosols on EP, analyzes of CMIP6 model projections are conducted for future changes in D_EP events under different emission scenarios. Historical simulations indicate that D_EP events were low probability occurrences prior to 1950, after which their frequency increased continuously and gradually evolved into a regionally common weather phenomenon. This finding is consistent with the results of Zhou et al. (2025) based on ground-based observations, confirming the model capability to reproduce historical climate states. Under future scenarios, the frequency of D_EP events in the Tarim Basin shows a strong dependence on emission scenarios. Under the low-emission scenario (SSP126), the annual frequency exhibits a significant decreasing trend (), which is particularly pronounced in the near term (2021–2040; ). In contrast, under the medium- and high-emission scenarios (SSP245 and SSP585), the declining trend weakens considerably (−0.85 and ). Notably, the downward trend under SSP585 is statistically insignificant, and frequency remains high with fluctuations in the near term, reflecting the complex modulation of cloud microphysical processes by high aerosol concentrations. Correspondingly, a decreasing trend with diminishing rates (−4.77, −4.36, and ) is observed for D_EP precipitation from 2015 to 2100 as the emission scenario intensifies. It is noteworthy that during the near-term period, only SSP126 shows a significant reduction in precipitation (), whereas SSP245 and SSP585 exhibit increasing trends (1.67 and 1.58 mm 10 a−1, respectively). This suggests that under future high-emission backgrounds, dust aerosols may partly offset or even reverse the precipitation reduction caused by declining event frequency, likely through enhanced ice-nucleating effects. These results highlight the nonlinear response characteristics of aerosol-cloud-precipitation interactions across different emission pathways.
This study demonstrates that despite the overall increase in atmospheric moisture content under global warming, the actual atmospheric humidity in the study region shows a declining trend, making it more difficult for the air to reach saturation. However, dust events can promote a positive precipitation feedback by transporting abundant dust aerosols and coupling with the dynamic-thermodynamic processes that enhance vertical moisture transport. Observational statistics confirm that over the past 50 years, D_EP accounts for 35.52 % in frequency and 34.34 % in precipitation amount of the total regional EP. Notably, 21 % of stations in the southern part contributed over 90 % before the year of 2000. Quantitative assessment further indicates that the average net contribution of dust aerosols to EP is 6.6 %. Given this overall promotive effect on precipitation, D_EP events are projected to persist at elevated levels throughout the near-term 21st century under high-emission scenarios. The results reveal the amplifying mechanism of dust aerosols on EP through the combined effects of ice nucleation and condensation under favorable moisture conditions, and highlight the particularly significant role of dust in promoting ice-phase particle growth, thus emphasizing its function as an efficient ice nucleus.
However, as this study is primarily based on observations and statistics from a specific region, the generalizability of the dust aerosol-precipitation feedback mechanism to other arid and semi-arid regions remains limited. Future work could extend the CMIP6 models to broader arid and semi-arid areas to thoroughly evaluate the regional commonalities and differences in the dust aerosol-precipitation feedback mechanisms under different climatic backgrounds, thus advancing a more holistic understanding of the interaction mechanisms between the water cycle and climate change in global drylands.
The data and data analysis method are available upon request.
Meteorological observation data were provided by the National Meteorological Information Center at http://data.cma.cn (last access: March 2026) under a restricted license and are thus not publicly distributable. The CERES dataset can be obtained from https://ceres.larc.nasa.gov/Data/ (last access: March 2026). The ERA5 reanalysis dataset is accessible via the ECMWF at https://doi.org/10.24381/cds.bd0915c6 (Hersbach et al., 2023). Daily precipitation data from five CMIP6 models are available through the Earth System Grid Federation's CMIP6 archives at https://esgf-node.llnl.gov/projects/cmip6/ (last access: March 2026).
Ze Chen conducted the analysis and validation, created the visualizations, and wrote the original draft of the manuscript. Chenglong Zhou designed the study and contributed key ideas as well as the review and revision of the manuscript. Jiacheng Gao and Congzhen Zhu provided the data. Meiqi Song, Yu Wang and Yabin Wei interpreted the data. Lu Meng, Mingjie Ma, and Cong Wen contributed to the interpretation and writing of the paper with contributions from the coauthors.
The contact author has declared that none of the authors has any competing interests.
Publisher's note: Copernicus Publications remains neutral with regard to jurisdictional claims made in the text, published maps, institutional affiliations, or any other geographical representation in this paper. The authors bear the ultimate responsibility for providing appropriate place names. Views expressed in the text are those of the authors and do not necessarily reflect the views of the publisher.
The authors are grateful to the science teams for providing the accessible data products used in this study.
This work was jointly supported by the Tianshan Young Talent Support Program of Xinjiang Uygur Autonomous Region (grant no. 2024TSYCCX0044), Major Science and Technology Program of Xinjiang Uygur Autonomous Region (grant no. 2024A03006-1), Natural Science Foundation of Xinjiang Uygur Autonomous Region (grant no. 2022D01A366), Youth Innovation Team of China Meteorological Administration (grant no. CMA2024QN13), Scientific and Technological Innovation Team (Tianshan Innovation Team) project (grant no. 2022TSYCTD0007), the S&T Development Fund of CAMS (grant no. 2021KJ034), and Tianchi Talent Program of Xinjiang Uygur Autonomous Region (2025).
This paper was edited by Jianping Huang and reviewed by two anonymous referees.
Cai, M. and Kalnay, E.: Can Reanalysis Have Anthropogenic Climate Trends without Model Forcing?, J. Climate, 18, 1844–1849, https://doi.org/10.1175/JCLI3347.1, 2005.
Chen, S., Zhao, D., Huang, J., He, J., Chen, Y., Chen, J., Bi, H., Lou, G., Du, S., Zhang, Y., and Yang, F.: Mongolia Contributed More than 42 % of the Dust Concentrations in Northern China in March and April 2023, Adv. Atmos. Sci., 40, 1549–1557, https://doi.org/10.1007/s00376-023-3062-1, 2023.
Cheng, H., Lin, Y., Chen, P., Liang, F., and Wang, Y.: Spatial characteristics of sand-dust weather days and influencing factors in the Tarim Basin, Arid Zone Res., 40, 1707–1717, https://doi.org/10.13866/j.azr.2023.11.01, 2023 (in Chinese).
Ding, A. J., Fu, C. B., Yang, X. Q., Sun, J. N., Petäjä, T., Kerminen, V.-M., Wang, T., Xie, Y., Herrmann, E., Zheng, L. F., Nie, W., Liu, Q., Wei, X. L., and Kulmala, M.: Intense atmospheric pollution modifies weather: a case of mixed biomass burning with fossil fuel combustion pollution in eastern China, Atmos. Chem. Phys., 13, 10545–10554, https://doi.org/10.5194/acp-13-10545-2013, 2013.
Ding, A. J., Huang, X., Nie, W., Sun, J. N., Kerminen, V.-M., Petäjä, T., Su, H., Cheng, Y. F., Yang, X.-Q., Wang, M. H., Chi, X. G., Wang, J. P., Virkkula, A., Guo, W. D., Yuan, J., Wang, S. Y., Zhang, R. J., Wu, Y. F., Song, Y., Zhu, T., Zilitinkevich, S., Kulmala, M., and Fu, C. B.: Enhanced haze pollution by black carbon in megacities in China, Geophys. Res. Lett., 43, 2873–2879, https://doi.org/10.1002/2016GL067745, 2016.
Ding, K., Huang, X., Ding, A., Wang, M., Su, H., Kerminen, V.-M., Petäjä, T., Tan, Z., Wang, Z., Zhou, D., Sun, J., Liao, H., Wang, H., Carslaw, K., Wood, R., Zuidema, P., Rosenfeld, D., Kulmala, M., Fu, C., Pöschl, U., Cheng, Y., and Andreae, M. O.: Aerosol-boundary-layer-monsoon interactions amplify semi-direct effect of biomass smoke on low cloud formation in Southeast Asia, Nat. Commun., 12, 6416, https://doi.org/10.1038/s41467-021-26728-4, 2021.
Dong, X., Li, R., Wang, Y., Fu, Y., and Zhao, C.: Potential Impacts of Sahara Dust Aerosol on Rainfall Vertical Structure Over the Atlantic Ocean as Identified From EOF Analysis, J. Geophys. Res., 123, 8850–8868, https://doi.org/10.1029/2018JD028500, 2018.
Gomis-Cebolla, J., Rattayova, V., Salazar-Galán, S., and Francés, F.: Evaluation of ERA5 and ERA5-Land reanalysis precipitation datasets over Spain (1951–2020), Atmos. Res., 284, 106606, https://doi.org/10.1016/j.atmosres.2023.106606, 2023.
Guo, J., Liu, H., Li, Z., Rosenfeld, D., Jiang, M., Xu, W., Jiang, J. H., He, J., Chen, D., Min, M., and Zhai, P.: Aerosol-induced changes in the vertical structure of precipitation: a perspective of TRMM precipitation radar, Atmos. Chem. Phys., 18, 13329–13343, https://doi.org/10.5194/acp-18-13329-2018, 2018.
Hersbach, H., Bell, B., Berrisford, P., Hirahara, S., Horányi, A., Muñoz-Sabater, J., Nicolas, J., Peubey, C., Radu, R., Schepers, D., Simmons, A., Soci, C., Abdalla, S., Abellan, X., Balsamo, G., Bechtold, P., Biavati, G., Bidlot, J., Bonavita, M., De Chiara, G., Dahlgren, P., Dee, D., Diamantakis, M., Dragani, R., Flemming, J., Forbes, R., Fuentes, M., Geer, A., Haimberger, L., Healy, S., Hogan, R. J., Hólm, E., Janisková, M., Keeley, S., Laloyaux, P., Lopez, P., Lupu, C., Radnoti, G., De Rosnay, P., Rozum, I., Vamborg, F., Villaume, S., and Thépaut, J.: The ERA5 global reanalysis, Q. J. Roy. Meteor. Soc., 146, 1999–2049, https://doi.org/10.1002/qj.3803, 2020.
Hersbach, H., Bell, B., Berrisford, P., Biavati, G., Horányi, A., Muñoz Sabater, J., Nicolas, J., Peubey, C., Radu, R., Rozum, I., Schepers, D., Simmons, A., Soci, C., Dee, D., and Thépaut, J.-N.: ERA5 hourly data on pressure levels from 1940 to present, Copernicus Climate Change Service (C3S) Climate Data Store (CDS) [data set], https://doi.org/10.24381/cds.bd0915c6, 2023.
Hu, W., Yao, J., He, Q., and Chen, J.: Changes in precipitation amounts and extremes across Xinjiang (northwest China) and their connection to climate indices, PeerJ, 9, e10792, https://doi.org/10.7717/peerj.10792, 2021.
Huang, J., Wang, T., Wang, W., Li, Z., and Yan, H.: Climate effects of dust aerosols over East Asian arid and semiarid regions, J. Geophys. Res.-Atmos., 119, https://doi.org/10.1002/2014JD021796, 2014.
Huang, J., Yu, H., Guan, X., Wang, G., and Guo, R.: Accelerated dryland expansion under climate change, Nat. Clim. Change, 6, 166–171, https://doi.org/10.1038/nclimate2837, 2016.
Huang, X. and Ding, A.: Aerosol as a critical factor causing forecast biases of air temperature in global numerical weather prediction models, Sci. Bull., 66, 1917–1924, https://doi.org/10.1016/j.scib.2021.05.009, 2021.
Huang, X., Wang, Z., and Ding, A.: Impact of Aerosol-PBL Interaction on Haze Pollution: Multiyear Observational Evidences in North China, Geophys. Res. Lett., 45, 8596–8603, https://doi.org/10.1029/2018GL079239, 2018.
Huang, X., Ding, A., Wang, Z., Ding, K., Gao, J., Chai, F., and Fu, C.: Amplified transboundary transport of haze by aerosol–boundary layer interaction in China, Nat. Geosci., 13, 428–434, https://doi.org/10.1038/s41561-020-0583-4, 2020.
Kalnay, E. and Cai, M.: Impact of urbanization and land-use change on climate, Nature, 423, 528–531, https://doi.org/10.1038/nature01675, 2003.
Kok, J. F., Storelvmo, T., Karydis, V. A., Adebiyi, A. A., Mahowald, N. M., Evan, A. T., He, C., and Leung, D. M.: Mineral dust aerosol impacts on global climate and climate change, Nat. Rev. Earth Environ., 4, 71–86, https://doi.org/10.1038/s43017-022-00379-5, 2023.
Leung, G. R. and Van Den Heever, S. C.: Aerosol breezes drive cloud and precipitation increases, Nat. Commun., 14, 2508, https://doi.org/10.1038/s41467-023-37722-3, 2023.
Li, G., Yang, H., Zhang, Y., Huang, C., Pan, X., Ma, M., Song, M., and Zhao, H.: More Extreme Precipitation in Chinese Deserts From 1960 to 2018, Earth Space Sci., 6, 1196–1204, https://doi.org/10.1029/2018EA000538, 2019.
Li, M. and Yao, J.: Precipitation extremes observed over and around the Taklimakan Desert, China, PeerJ, 11, e15256, https://doi.org/10.7717/peerj.15256, 2023.
Li, R., Dong, X., Guo, J., Fu, Y., Zhao, C., Wang, Y., and Min, Q.: The implications of dust ice nuclei effect on cloud top temperature in a complex mesoscale convective system, Sci. Rep.-UK, 7, 13826, https://doi.org/10.1038/s41598-017-12681-0, 2017.
Li, S., Su, T., Xiang, R., and Schär, C.: Direct and semi-direct aerosol effects on the scaling of extreme sub-daily precipitation over East China, Environ. Res. Lett., 19, 124074, https://doi.org/10.1088/1748-9326/ad9294, 2024.
Li, Y., Qin, X., Liu, Y., Jin, Z., Liu, J., Wang, L., and Chen, J.: Evaluation of Long-Term and High-Resolution Gridded Precipitation and Temperature Products in the Qilian Mountains, Qinghai–Tibet Plateau, Front. Environ. Sci., 10, 906821, https://doi.org/10.3389/fenvs.2022.906821, 2022.
Li, Z., Niu, F., Fan, J., Liu, Y., Rosenfeld, D., and Ding, Y.: Long-term impacts of aerosols on the vertical development of clouds and precipitation, Nat. Geosci., 4, 888–894, https://doi.org/10.1038/ngeo1313, 2011.
Liu, B., Chen, J., Chen, X., Lian, Y., and Wu, L.: Uncertainty in determining extreme precipitation thresholds, J. Hydrol., 503, 233–245, https://doi.org/10.1016/j.jhydrol.2013.09.002, 2013.
Liu, Y., Xu, R., Ziegler, A. D., and Zeng, Z.: Stronger winds increase the sand-dust storm risk in northern China, Environ. Sci. Atmos., 2, 1259–1262, https://doi.org/10.1039/D2EA00058J, 2022.
Ma, C., Liu, Y., Liu, J., and Yang, L.: Spatial and temporal distribution characteristics of cloud water resources in the Tarim Basin in summer, Arid Zone Res., 42, 223–235, https://doi.org/10.13866/j.azr.2025.02.04, 2025a (in Chinese).
Ma, M., Yang, X., He, Q., and Mamtimin, A.: Improvement of dust emission parameterization scheme for dust devils based on intensive observations in the northern margin of the Taklimakan Desert, Theor. Appl. Climatol., 151, 1227–1237, https://doi.org/10.1007/s00704-022-04258-3, 2023.
Ma, M., Yang, X., Yang, F., He, Q., Mamtimin, A., Zheng, X., Zhou, C., and Huo, W.: Dust emission contributions and regulatory mechanisms of dust devils in the Taklimakan Desert, Nat. Hazards, https://doi.org/10.1007/s11069-025-07618-0, 2025b.
Ma, Q.: Multiscale Characteristics and Influencing Mechanisms of Summer Extreme Precipitation Changes in Central Asia, PhD thesis, Nanjing University of Information Science and Technology, https://doi.org/10.27248/d.cnki.gnjqc.2021.000004, 2021 (in Chinese).
Meng, L., He, Q., Zhao, T., Zhang, H., Yang, X., Mamtimin, A., Yang, F., Zhou, C., and Huo, W.: Interactions between dust aerosols and the ultra-high atmospheric boundary layer: Case study of vertical observation over the Taklimakan Desert, China, Atmos. Environ., 343, 120977, https://doi.org/10.1016/j.atmosenv.2024.120977, 2025.
Muñoz-Sabater, J., Dutra, E., Agustí-Panareda, A., Albergel, C., Arduini, G., Balsamo, G., Boussetta, S., Choulga, M., Harrigan, S., Hersbach, H., Martens, B., Miralles, D. G., Piles, M., Rodríguez-Fernández, N. J., Zsoter, E., Buontempo, C., and Thépaut, J.-N.: ERA5-Land: a state-of-the-art global reanalysis dataset for land applications, Earth Syst. Sci. Data, 13, 4349–4383, https://doi.org/10.5194/essd-13-4349-2021, 2021.
O'Neill, B. C., Tebaldi, C., van Vuuren, D. P., Eyring, V., Friedlingstein, P., Hurtt, G., Knutti, R., Kriegler, E., Lamarque, J.-F., Lowe, J., Meehl, G. A., Moss, R., Riahi, K., and Sanderson, B. M.: The Scenario Model Intercomparison Project (ScenarioMIP) for CMIP6, Geosci. Model Dev., 9, 3461–3482, https://doi.org/10.5194/gmd-9-3461-2016, 2016.
Pan, H., Ren, G., Wang, M., Wang, J., and Kumar, K. R.: Investigation on the spatiotemporal and vertical structure of ice cloud and aerosol parameters from multi-source satellite datasets (2007–2021) over the Tarim Basin, China, J. Atmos. Sol.-Terr. Phys., 256, 106185, https://doi.org/10.1016/j.jastp.2024.106185, 2024.
Riahi, K., Van Vuuren, D. P., Kriegler, E., Edmonds, J., O'Neill, B. C., Fujimori, S., Bauer, N., Calvin, K., Dellink, R., Fricko, O., Lutz, W., Popp, A., Cuaresma, J. C., Kc, S., Leimbach, M., Jiang, L., Kram, T., Rao, S., Emmerling, J., Ebi, K., Hasegawa, T., Havlik, P., Humpenöder, F., Da Silva, L. A., Smith, S., Stehfest, E., Bosetti, V., Eom, J., Gernaat, D., Masui, T., Rogelj, J., Strefler, J., Drouet, L., Krey, V., Luderer, G., Harmsen, M., Takahashi, K., Baumstark, L., Doelman, J. C., Kainuma, M., Klimont, Z., Marangoni, G., Lotze-Campen, H., Obersteiner, M., Tabeau, A., and Tavoni, M.: The Shared Socioeconomic Pathways and their energy, land use, and greenhouse gas emissions implications: An overview, Global Environ. Chang., 42, 153–168, https://doi.org/10.1016/j.gloenvcha.2016.05.009, 2017.
Shaddick, G., Thomas, M. L., Mudu, P., Ruggeri, G., and Gumy, S.: Half the world's population are exposed to increasing air pollution, Npj Clim. Atmos. Sci., 3, 23, https://doi.org/10.1038/s41612-020-0124-2, 2020.
Shao, T., Liu, Y., Wang, R., Zhu, Q., Tan, Z., and Luo, R.: Role of anthropogenic aerosols in affecting different-grade precipitation over eastern China: A case study, Sci. Total Environ., 807, 150886, https://doi.org/10.1016/j.scitotenv.2021.150886, 2022.
Song, C., McCoy, D. T., Eidhammer, T., Gettelman, A., McCoy, I. L., Watson-Parris, D., Wall, C. J., Elsaesser, G., and Wood, R.: Buffering of Aerosol-Cloud Adjustments by Coupling Between Radiative Susceptibility and Precipitation Efficiency, Geophys. Res. Lett., 51, e2024GL108663, https://doi.org/10.1029/2024GL108663, 2024.
Song, H.-J., Lim, B., and Joo, S.: Evaluation of Rainfall Forecasts with Heavy Rain Types in the High-Resolution Unified Model over South Korea, Weather Forecast., 34, 1277–1293, https://doi.org/10.1175/WAF-D-18-0140.1, 2019.
Sun, N., Fu, Y., Zhong, L., and Li, R.: Aerosol effects on the vertical structure of precipitation in East China, Npj Clim. Atmos. Sci., 5, 60, https://doi.org/10.1038/s41612-022-00284-0, 2022.
Sun, Y., Wang, Y., Zhao, C., Zhou, Y., Yang, Y., Yang, X., Fan, H., Zhao, X., and Yang, J.: Vertical Dependency of Aerosol Impacts on Local Scale Convective Precipitation, Geophys. Res. Lett., 50, e2022GL102186, https://doi.org/10.1029/2022GL102186, 2023.
Tan, M. L., Armanuos, A. M., Ahmadianfar, I., Demir, V., Heddam, S., Al-Areeq, A. M., Abba, S. I., Halder, B., Cagan Kilinc, H., and Yaseen, Z. M.: Evaluation of NASA POWER and ERA5-Land for estimating tropical precipitation and temperature extremes, J. Hydrol., 624, 129940, https://doi.org/10.1016/j.jhydrol.2023.129940, 2023.
Wielicki, B. A., Barkstrom, B. R., Baum, B. A., Charlock, T. P., Green, R. N., Kratz, D. P., Lee, R. B., Minnis, P., Smith, G. L., Wong, T., Young, D. F., Cess, R. D., Coakley, J. A., Crommelynck, D. A. H., Donner, L., Kandel, R., King, M. D., Miller, A. J., Ramanathan, V., Randall, D. A., Stowe, L. L., and Welch, R. M.: Clouds and the Earth's Radiant Energy System (CERES): algorithm overview, IEEE T. Geosci. Remote, 36, 1127–1141, https://doi.org/10.1109/36.701020, 1998.
Xu, X., Cai, W., Zhao, T., Zhang, H., Guo, X., Liu, W., Zhang, T., Zhao, R., Wu, C., Li, Y., Wang, L., Yan, P., and Yang, C.: Understanding clouds and precipitation over the Mount Qomolangma: how does the aerosol activation effect exist? Sci. Bull., 70, 3649–3658, https://doi.org/10.1016/j.scib.2025.09.031, 2025.
Xue, Y., Yao, S., and Huang, Q.: Mechanistic Diversity of Hourly Extreme Rainfall in the Middle and Lower Reaches of the Yangtze River Basin, J. Geophys. Res.-Atmos., 130, e2025JD043729, https://doi.org/10.1029/2025JD043729, 2025.
Yang, X., Hou, Y., and Chen, B.: Observed surface warming induced by urbanization in east China, J. Geophys. Res., 116, D14113, https://doi.org/10.1029/2010JD015452, 2011.
Yao, J., Chen, Y., Guan, X., Zhao, Y., Chen, J., and Mao, W.: Recent climate and hydrological changes in a mountain–basin system in Xinjiang, China, Earth-Sci. Rev., 226, 103957, https://doi.org/10.1016/j.earscirev.2022.103957, 2022.
Zhang, D., Wang, Z., Heymsfield, A., Fan, J., Liu, D., and Zhao, M.: Quantifying the impact of dust on heterogeneous ice generation in midlevel supercooled stratiform clouds, Geophys. Res. Lett., 39, L18805, https://doi.org/10.1029/2012GL052831, 2012.
Zhang, J., Wang, S., Huang, J., He, Y., and Ren, Y.: The Precipitation-Recycling Process Enhanced Extreme Precipitation in Xinjiang, China, Geophys. Res. Lett., 50, e2023GL104324, https://doi.org/10.1029/2023GL104324, 2023.
Zhao, C., Sun, Y., Yang, J., Li, J., Zhou, Y., Yang, Y., Fan, H., and Zhao, X.: Observational evidence and mechanisms of aerosol effects on precipitation, Sci. Bull., 69, 1569–1580, https://doi.org/10.1016/j.scib.2024.03.014, 2024a.
Zhao, C., Li, J., and Yang, Y.: A Short Review of Microphysical Effects of Aerosols on Clouds and Precipitation, Chin. J. Atmos. Sci., 49, 949–963, https://doi.org/10.3878/j.issn.1006-9895.2503.25015, 2025 (in Chinese).
Zhao, L., Lee, X., Smith, R. B., and Oleson, K.: Strong contributions of local background climate to urban heat islands, Nature, 511, 216–219, https://doi.org/10.1038/nature13462, 2014.
Zhao, P., Liu, X., and Zhao, C.: Potential Modulation of Aerosol on Precipitation Efficiency in Southwest China, Remote Sens.-Basel, 16, 1445, https://doi.org/10.3390/rs16081445, 2024b.
Zhou, C., Yang, F., Mamtimin, A., Huo, W., Liu, X., He, Q., Zhang, J., and Yang, X.: Wind erosion events at different wind speed levels in the Tarim Basin, Geomorphology, 369, 107386, https://doi.org/10.1016/j.geomorph.2020.107386, 2020.
Zhou, C., Liu, Y., Zhu, Q., He, Q., Zhao, T., Yang, F., Huo, W., Yang, X., and Mamtimin, A.: In situ observation of warm atmospheric layer and the heat contribution of suspended dust over the Tarim Basin, Atmos. Chem. Phys., 22, 5195–5207, https://doi.org/10.5194/acp-22-5195-2022, 2022.
Zhou, C., Liu, Y., Yang, X., Zhu, Q., Alam, K., Yang, F., Ali, M., Huo, W., and He, Q.: Positive Feedback of Dust Direct Radiative Effect on Dust Emission in Taklimakan Desert, Geophys. Res. Lett., 50, e2023GL103512, https://doi.org/10.1029/2023GL103512, 2023.
Zhou, C., Liu, Y., Li, D., Zhu, Q., Tan, Z., Luo, R., Song, M., Zhu, C., Wang, Y., Mamtimin, A., Yang, X., Yang, F., Huo, W., Gao, J., Ma, M., and Wang, T.: Multisource Observations of Dust Rain in the Tarim Basin: Dust Events Act as a Trigger for Rainfall, ACS EST Air, 2, 2275–2287, https://doi.org/10.1021/acsestair.5c00217, 2025.
Zhu, H., Li, R., Yang, S., Zhao, C., Jiang, Z., and Huang, C.: The impacts of dust aerosol and convective available potential energy on precipitation vertical structure in southeastern China as seen from multisource observations, Atmos. Chem. Phys., 23, 2421–2437, https://doi.org/10.5194/acp-23-2421-2023, 2023.