the Creative Commons Attribution 4.0 License.
the Creative Commons Attribution 4.0 License.
 | 12 Mar 2026
Historical and future changes of surface ozone over China from CMIP6 models, including an assessment of present-day uncertainties in model prediction
Shuai Li
Qi Chen
Yonghang Chen
Zhili Wang
Xinping Wu
Ozone (O3) contributes to global climate change and poses a direct threat to human health. This study investigates the historical variability, future projections, and associated present-day uncertainties of surface O3 concentrations over China using simulations from nine CMIP6 models and observational data from the Tracking Air Pollution in China (TAP) dataset. A multi-model ensemble mean (MME), constructed using an equal-weighted approach, is used to evaluate model uncertainties across different seasons, underlying surface types, total cloud cover, and PM2.5 concentrations, and assess model performance under future Shared Socioeconomic Pathway (SSP) scenarios. The results show that the MME captures the pronounced seasonal cycle of surface O3, with higher concentrations during June–August (JJA, ∼ 105 µg m−3) and lower values during December–February (DJF, ∼ 55 µg m−3), but underestimates O3 across most regions of China, particularly in East China. Model performance varies with environmental conditions, showing lower bias, MAE, and RMSE over natural land surfaces than over anthropogenic surfaces. The O3 bias is minimized under cloudy conditions, maximized under partly cloudy conditions, and generally increases with rising PM2.5 concentrations before declining beyond a certain threshold. Over the historical period, the MME simulates a substantial increase in annual mean surface O3 across China (∼ 39.3 µg m−3). Future projections indicate continued O3 increases under weak mitigation (SSP3-7.0), with East China rising by 26.9 %, and widespread decreases under strong mitigation (SSP1-2.6), particularly in Southwest and South China (> 30 µg m−3). Analysis of model spread and its drivers indicates that uncertainties in surface O3 projections arise from the combined effects of emissions (including precursors and PM2.5), climate conditions, and model representations of chemistry and circulation. Improving the understanding of these coupled influences is essential for enhancing the reliability of regional O3 projections and for informing effective air quality and climate mitigation strategies in China.
- Article
(10694 KB) - Full-text XML
-
Supplement
(1677 KB) - BibTeX
- EndNote


Ozone (O3) is one of the most important trace gas components in the Earth's atmosphere, serving as a protective barrier for the global ecosystem and a crucial heat source in the stratosphere (Zhang et al., 2017). Variations in O3 concentrations strongly influence the climate of both the stratosphere and the troposphere (Xie et al., 2017; Haase and Matthes, 2019; Lin and Ming, 2021), and play a critical role in controlling the atmospheric temperature structure. Studies have shown that 90 % of atmospheric O3 is concentrated in the stratosphere, with only about 10 % distributed in the troposphere. However, the climatic effects caused by tropospheric O3 variations can be comparable to the perturbations induced in the stratosphere (Xie and Zhang, 2014). As one of the major sources of OH radicals, O3 indirectly determines the lifetime of various trace constituents in the troposphere (Levy, 1971). Additionally, O3 is an important greenhouse gas, a strong oxidant, and a plant toxin, which not only influences global climate change (Monks et al., 2015) but also directly harms human health (Shindell et al., 2012; Wang et al., 2021) and vegetation growth (Avnery et al., 2011; Lin et al., 2018; Feng et al., 2018). The Global Burden of Disease Report (GBDR) estimates that more than 360 000 premature deaths worldwide in 2019 were attributable to exposure to ambient O3, and that high O3 exposure may exacerbate the PM2.5-mortality risk (Weichenthal et al., 2017). Therefore, studying the evolution of O3 is of great significance for understanding global climate change and protecting terrestrial ecosystems.
Over the past decade, due to rapid industrial development, precursor pollutants have been emitted in large quantities, causing severe PM2.5 and O3 pollution in China (Maji et al., 2018; Lu et al., 2018; Qin et al., 2021). To improve air quality, the State Council issued the “Air Pollution Prevention and Control Action Plan” (APPCAP) in 2013, with the goal of reducing PM2.5 concentrations in the key regions of Beijing-Tianjin-Hebei, the Yangtze River Delta, and the Pearl River Delta by 25 %, 20 %, and 15 %, respectively, by 2017. Accordingly, a series of air pollution control measures have been implemented, including optimizing industrial structure, increasing the supply of clean energy, limiting high-emission vehicles, and banning high-emission sources such as open biomass burning (Qiu et al., 2016). As a result, since the “13th Five-Year Plan”, China has made significant progress in air pollution mechanism research and control (Li et al., 2020; Lu et al., 2020; An et al., 2022; Su et al., 2022), particularly with a notable decrease in the annual average concentration of PM2.5 in major regions.
In stark contrast to the improvements in PM2.5 pollution control, most regions in China experienced a persistently fluctuating upward trend in annual O3 concentrations during 2013–2018, with an average annual increase of 1–3 ppb (Li et al., 2019). By 2018, the national annual mean O3 concentration had increased by 17.59 % and 15.22 % compared to 2013 and 2015 levels, respectively (Wang et al., 2020). The proportion of O3-polluted days has become increasingly significant, and prolonged, large-scale O3 pollution episodes have occurred more frequently, particularly in major urban agglomerations such as the Beijing-Tianjin-Hebei (BTH), Yangtze River Delta (YRD), and Pearl River Delta (PRD) regions (Dai et al., 2020; Zhao et al., 2020). Notably, since 2015 in the PRD and since 2017 in the YRD, the proportion of days with O3 exceedance has surpassed that of particulate matter, making O3 the primary pollutant (Lu et al., 2018; Wang et al., 2020). Despite the positive effects of policy implementation on reducing nitrogen oxides (NOx) and volatile organic compounds (VOCs) in China (Lu et al., 2018), significant uncertainties remain regarding the abundance, spatial distribution, and related processes of these short-lived gases, which constrain the further optimization and effectiveness of emission control policies (Wild et al., 2020). Against this backdrop, surface O3 pollution in China continues to worsen and expand from 2015 to 2024 (Wang et al., 2020; Xiao et al., 2022; Fig. S8). While PM2.5 pollution has shown consistent improvement, effectively controlling O3 pollution has emerged as a critical challenge for air quality management in China, posing serious difficulties for both the scientific community and policymakers. Under the guidance of China's national “Dual-Carbon” strategy, which targets carbon peaking by 2030 and carbon neutrality by 2060, synergistic control of greenhouse gas emissions and air pollutants has become essential for achieving sustained improvements in air quality. This is because the dominant CO2 emission sectors (e.g., power generation, industrial production, and transportation) are also major sources of O3 precursors such as NOx and anthropogenic VOCs. Therefore, reducing fossil fuel combustion can bring co-benefits by mitigating both climate warming and O3 pollution. Given this context, accurately understanding the spatiotemporal evolution of surface O3 concentrations in China is of great importance, as it provides a scientific basis for evaluating the effectiveness of emission control measures and for guiding future air quality management strategies.
Currently, ground-based observations (including surface and radiosonde measurements) (Zhan et al., 2021; Liu et al., 2022), satellite remote sensing retrievals (such as column concentrations, vertical profiles, and multi-source data fusion) (Hubert et al., 2021; Zhao et al., 2022), and model simulations (Xue et al., 2020; Morgenstern, 2021) provide essential data and analytical approaches for monitoring O3 and its precursors, investigating pollution sources and transport characteristics, and evaluating the accuracy of retrieval products. Ground-based observations are known for their high accuracy, satellite remote sensing offers broad coverage, and model simulations can extend both spatially and temporally through parameterization. These methods complement each other and collectively support O3-related research. For decades, both chemical-climate models (CCMs) and chemical transport models (CTMs) have been indispensable tools for studying global surface O3. CTMs are widely used for high-resolution regional simulations, while CCMs are particularly suited for investigating long-term global trends, reproducing historical O3 distributions, predicting future changes across various spatial and temporal scales, and exploring interactions with precursors and atmospheric physical-dynamic processes. However, due to the complexity of the tropospheric O3 budget mechanisms, particularly the effects of chemical reaction chains, precursor emission distributions, and meteorological conditions, significant discrepancies remain in model results, both among different models and compared with observations. These discrepancies reflect the limitations of the models in parameterization of physical and chemical processes, as well as uncertainties in emission inventories and boundary conditions. Therefore, identifying, investigating, and quantifying the differences between models and observations is crucial for improving and advancing model performance (Young et al., 2018).
Beyond individual model studies, international multimodel initiatives have advanced understanding of surface O3 pollution. The Hemispheric Transport of Air Pollution (HTAP) project (Fiore et al., 2009) and its regional counterpart MICS-Asia underscore the role of hemispheric and transboundary transport in shaping regional O3 patterns (Li et al., 2019). The Tropospheric O3 Assessment Report (TOAR) provides a global benchmark for evaluating surface O3 models and assessing historical trends using harmonized observations and multimodel comparisons (Young et al., 2018).
CMIP6 and the latest IPCC AR6 adopt new emission scenarios driven by different socioeconomic pathways, the Shared Socioeconomic Pathways (SSPs), replacing the four Representative Concentration Pathways (RCPs) used in CMIP5. This represents a significant advancement over the CMIP5 scenarios (Eyring et al., 2016; Zhou et al., 2019). Previous studies have shown that most CMIP6 Earth System Models (ESMs) are capable of capturing the spatial distribution of global surface O3 concentrations (Turnock et al., 2020; Ivanciu et al., 2021; Griffiths et al., 2021; Shang et al., 2021), but they tend to produce an overall positive bias of 5 %–10 % (3.6 ± 4.4 ppbv) (Sun and Archibald, 2021), with larger biases in the Northern Hemisphere and smaller biases in the Southern Hemisphere. This discrepancy may be attributed to the limitations of O3 precursor emission data (Young et al., 2013). Currently, the evaluation of the latest CMIP6 simulations for surface O3 in China is still limited. Therefore, this paper, based on multi-model O3 products from CMIP6, conducts an analysis of the historical and future changes of surface O3 in China, as well as the associated present-day uncertainties. First, using the O3 dataset from the Tracking Air Pollution in China (TAP), we assess the distribution and uncertainty of surface O3 simulated by nine CMIP6 models under various conditions, including different temperatures, cloud cover levels, complex land surface types, and pollutant concentrations, for the period 2015–2023 across China and its seven sub-regions (Northeast China, North China, East China, South China, Central China, Northwest China, and Southwest China) (Fig. 1). Secondly, the changes in surface O3 over different regions of China during the historical period 1850–2014 are calculated to provide a background for the analysis of future changes. Then, based on different SSPs in CMIP6 experiments, the future changes in surface O3 across China are predicted and analysed for the period 2015–2100. Finally, a comparison of different CMIP6 models under a single future scenario (SSP3-7.0) is conducted to identify the potential causes of model differences, aiming to provide valuable references for future O3 pollution control and prediction efforts.
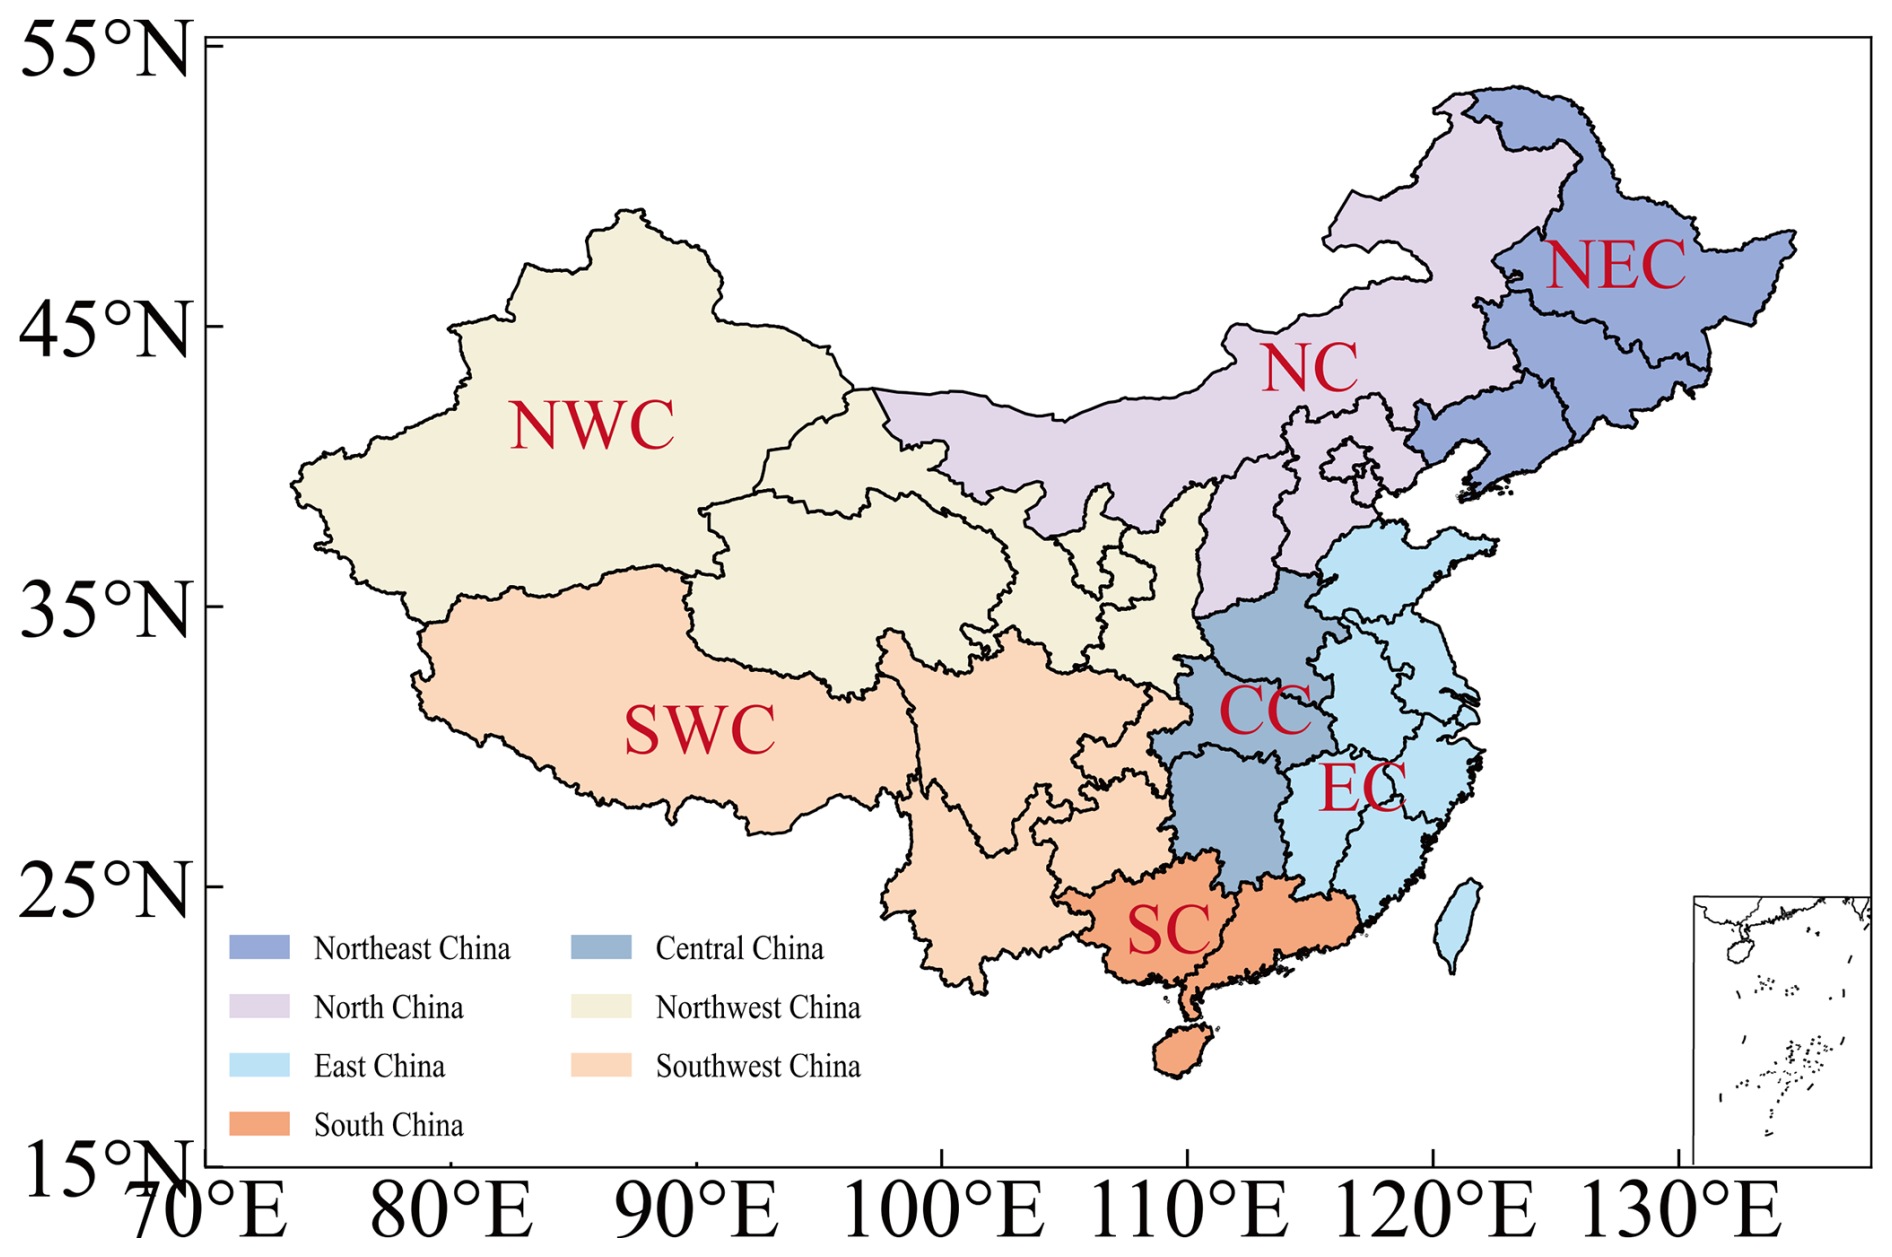
Figure 1Geographic locations of China and its seven sub-regions used in this study (Northeast China (NEC), North China (NC), East China (EC), South China (SC), Central China (CC), Northwest China (NWC), and Southwest China (SWC)).
The data used in this paper primarily includes O3 products simulated by all models (9 models) in the CMIP6 chemistry models (“AERmon” CMIP6 table ID) under both historical and future scenarios (see Tables 1 and S4). All data can be accessed from the World Climate Research Programme node (WCRP) (https://esgf-node.llnl.gov/search/cmip6/, last access: 8 April 2024). Specifically, all available data from 1850 to 2014 were obtained from the CMIP6 historical experiments (Eyring et al., 2016), which simulate surface O3 changes in China during the industrial period. Additionally, all available data for the period 2015–2100 from different SSP scenarios in ScenarioMIP (O'Neill et al., 2016), were used, and the specific SSP3-7.0-lowNTCF scenario from AerChemMIP (Collins et al., 2017) was used to investigate future changes in surface O3 across different regions of China. To investigate the potential drivers behind the differences in future surface O3 projections over China and its sub-regions under the SSP3-7.0 scenario, this study further incorporates VOC emissions data provided by CMIP6. In CMIP6, variables representing non-methane volatile organic compound (NMVOC) emissions primarily include emivoc and emibvoc. The emivoc variable denotes the total emission rate of NMVOCs, covering both anthropogenic and biogenic sources, whereas emibvoc represents NMVOC emissions from natural sources (e.g., vegetation), and is commonly used as a proxy for biogenic volatile organic compounds (BVOCs). For clarity and consistency, the terms NMVOCs and BVOCs are hereafter used to refer to the emission fluxes represented by emivoc and emibvoc, respectively.
Table 1Number of ensemble members used for the historical- and future-scenario experiments from each model in the analysis of surface O3 in this study.
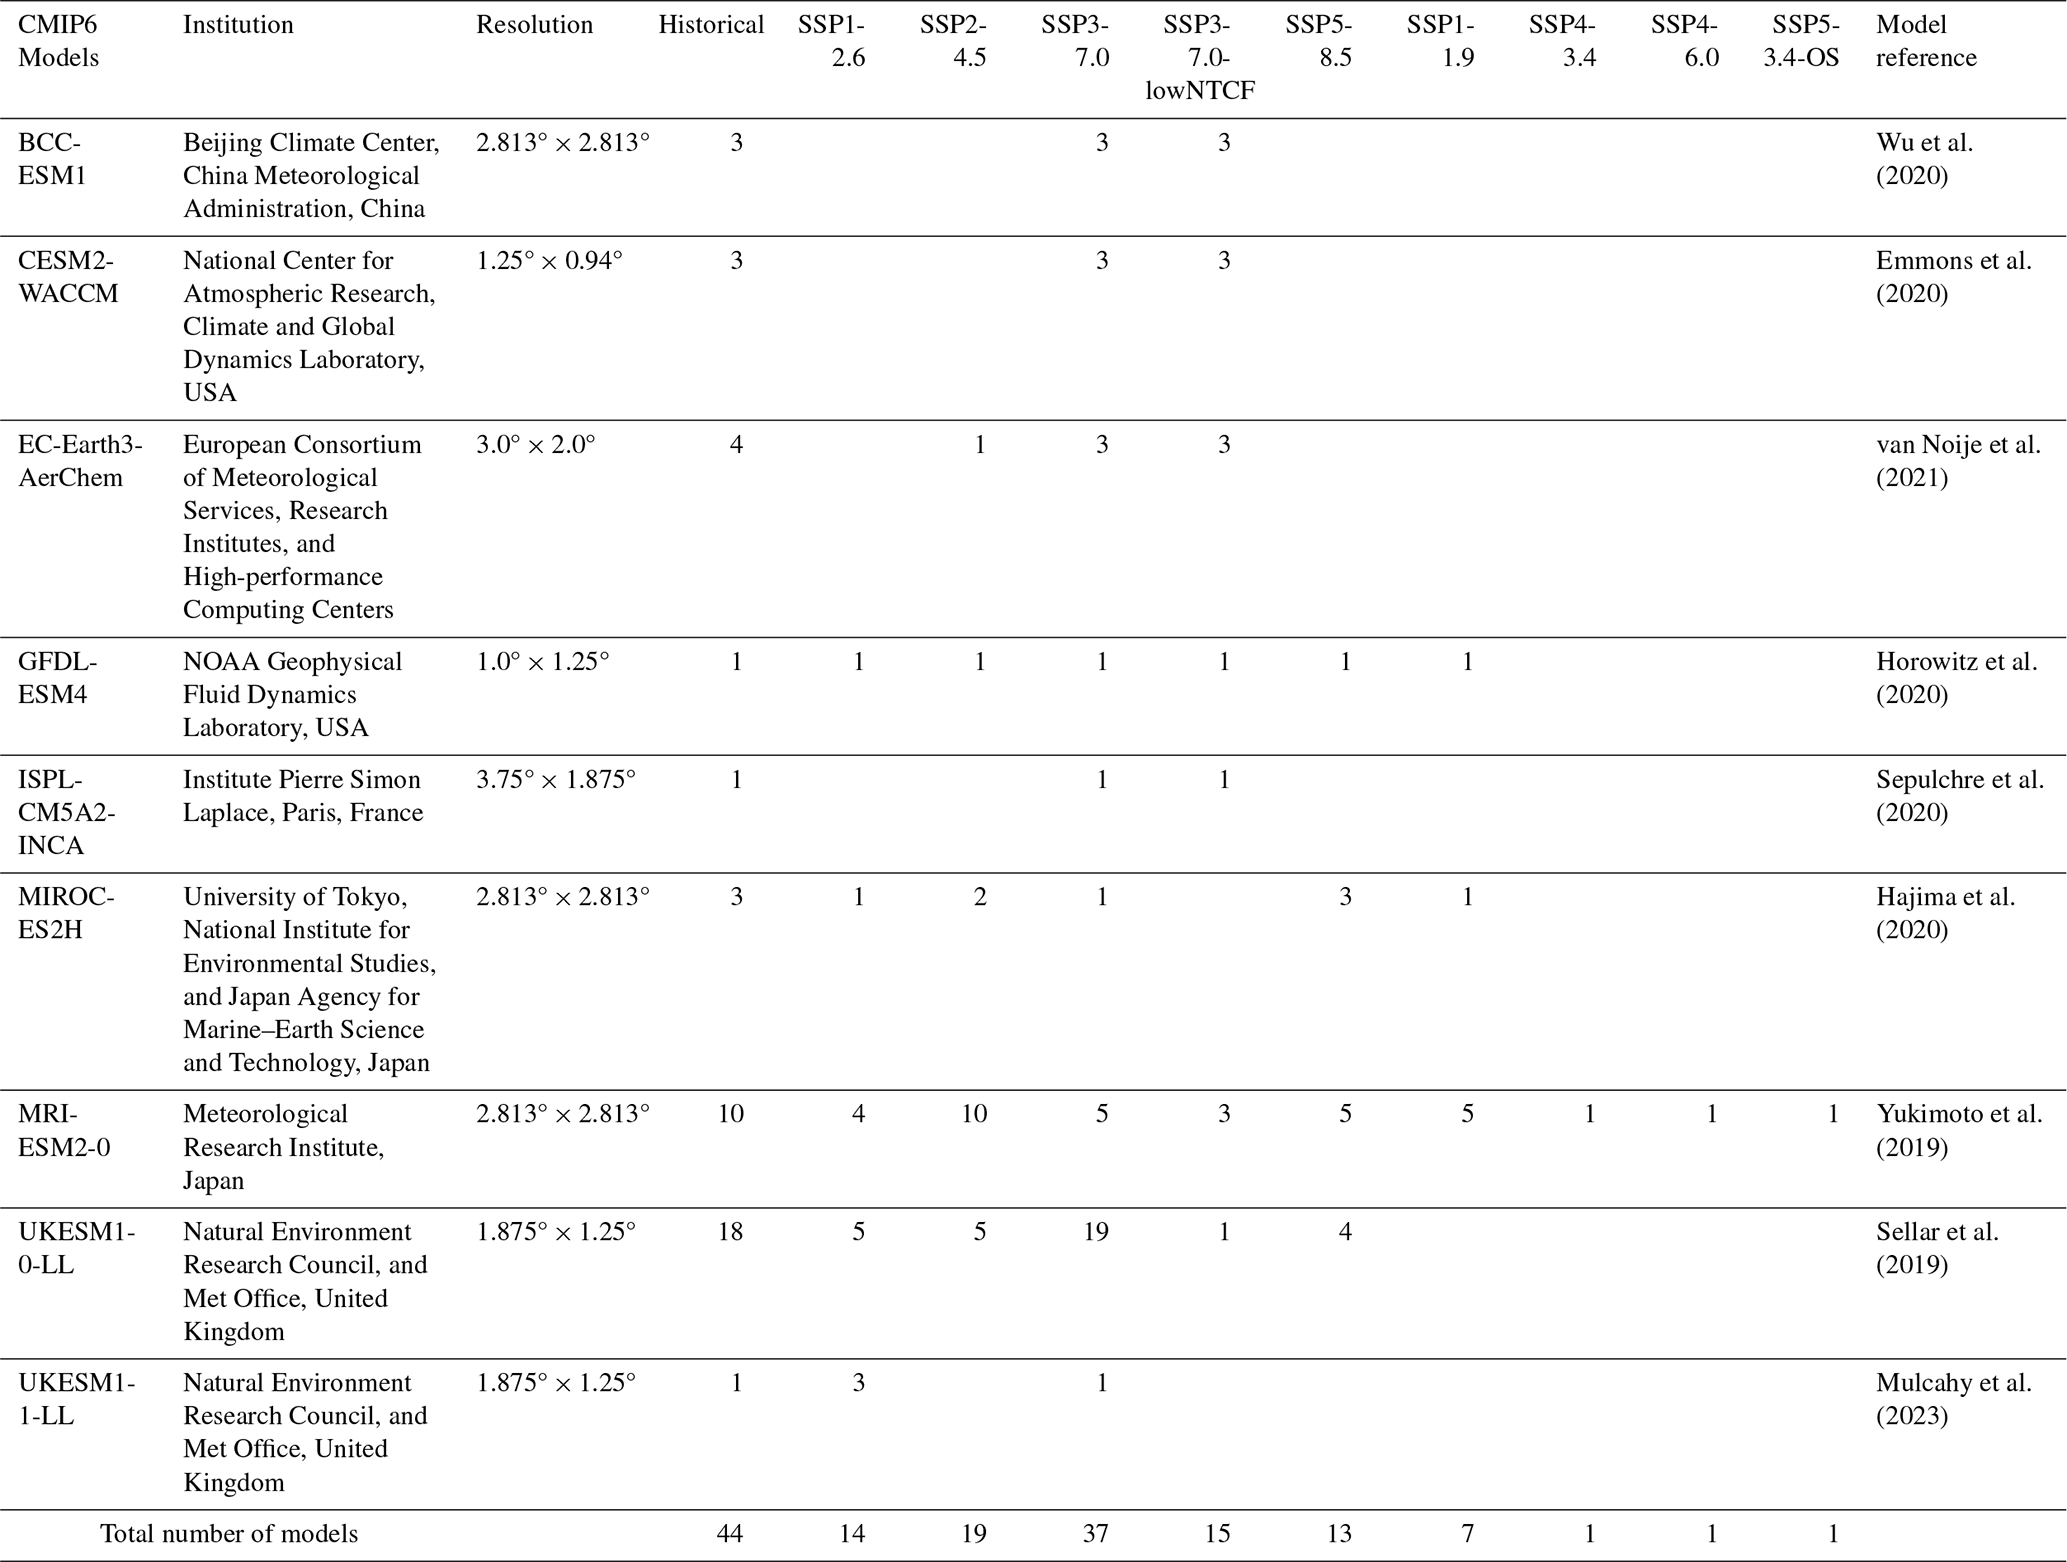
For the historical experiments, CMIP6 provides O3 data from 9 models and 44 ensemble members. The future scenario with the most available data is SSP3-7.0, with O3 data from 9 models and 37 ensemble members, followed by SSP3-7.0-lowNTCF, which includes 8 models and 15 ensemble members. For other Tier 1 scenarios (SSP1-2.6 and SSP2-4.5), O3 data from 5 models are available, while SSP5-8.5 includes 4 models. Due to the limited availability and inconsistent model coverage of Tier 2 CMIP6 scenarios (SSP1-1.9, SSP4-3.4, SSP4-6.0, and SSP5-3.4-OS), all present-day uncertainty analyses and multi-model spread analysis in this study are conducted exclusively using Tier 1 scenarios. Tier 2 scenarios are included in Sect. 5.1 only to illustrate potential future trajectories of surface O3 under alternative emission pathways. Some numerical changes are reported to highlight relative differences between these scenarios, but they are not used for robust multi-model inter-scenario comparisons or quantitative uncertainty assessment. Although one CMIP6 model (MRI-ESM2-0) provides simulations for all Tier 1 and Tier 2 scenarios, single-model inter-scenario comparisons are not performed, as our analysis relies on multi-model ensemble statistics to ensure representative and robust conclusions.
To assess the uncertainty in the CMIP6 simulation of present-day O3 concentrations, this study utilizes the TAP (http://tapdata.org.cn/, last access: 8 April 2024) O3 monthly products for the period from January 2015 to December 2023, with a spatial resolution of 0.1°. TAP is a near-real-time atmospheric composition tracking dataset for China, developed by Tsinghua University in collaboration with several other institutions, which mainly includes O3, PM2.5 and their major chemical components. The O3 product is derived through a machine learning model that integrates multiple data sources, including O3 observational data, satellite remote sensing vertical profiles of O3, CMAQ simulations, WRF simulations, vegetation indices, nighttime lights, and population data, to estimate daily O3 concentrations. TAP estimates show a high correlation with in-situ observations of maximum daily 8 h average O3, with an R2 value of up to 0.70 (Xue et al., 2020; Xiao et al., 2022).
In this paper, surface O3 concentration is obtained from the lowest vertical layer of each CMIP6 model. For each model, all available ensemble members are averaged using an equal-weighted approach to obtain the model simulation result; in the MME calculation, the models are likewise combined using an equal-weighted scheme, which inherently assumes independence among the models. All CMIP6 data are linearly interpolated to a 0.1° horizontal resolution to match the TAP dataset when assessing uncertainties in present-day O3 simulations. It should be noted that CMIP6 outputs, originally at coarse spatial resolutions (> 100 km), retain only large-scale spatial patterns through linear interpolation and do not introduce physically meaningful fine-scale features. As a result, localized concentration peaks, particularly in highly urbanized regions, may be smoothed or underestimated, and the interpolated concentrations are therefore more representative of regional-scale patterns rather than urban-scale variability. This approach has been widely adopted in previous CMIP6-based air quality studies when comparing global model outputs with higher-resolution datasets (Turnock et al., 2020; Su et al., 2022).
Internal variability due to ensemble spread was quantified for CMIP6 models with more than two realizations under SSP3-7.0. For each model, the standard deviation (SD) of monthly mean surface O3 across ensemble members was calculated for each month and then averaged over 2015–2023 to yield a single metric (Table S6). Ensemble means of each model were used for inter-model comparisons. The internal variability (generally 2–4 µg m−3) is smaller than inter-model differences, indicating that it does not compromise the robustness of the multi-model comparison based on ensemble means.
The present-day uncertainty of CMIP6-simulated surface O3 concentrations is assessed by comparison with TAP observations under different environmental conditions, including underlying surface types, total cloud cover, and PM2.5 concentrations and their components. To avoid introducing additional uncertainty from the CMIP6 models themselves, independent datasets are used for stratification: Total cloud cover from the ERA5 reanalysis, underlying surface types from the MODIS/MCD12Q1 product (treated as fixed categories), and PM2.5 data from the TAP observations (Table S1 in the Supplement). To ensure spatial consistency, continuous CMIP6 O3 fields are linearly interpolated onto the 0.1° TAP grid, while categorical underlying surface types are resampled to the same grid using a nearest-neighbor method to preserve their classification. Therefore, interpolation affects only continuous model fields and does not alter land surface categories, although it may smooth fine-scale gradients in modeled concentrations. To quantify uncertainties, for different underlying surface types, cloud cover category, and PM2.5 concentration and their components, the difference between CMIP6 MME and TAP observations is calculated at each grid cell. The bias, MAE, and RMSE of these differences within each group are used as metrics of model uncertainty.
In this section, we first evaluate the inter-model performance and spatiotemporal characteristics of CMIP6 surface O3 simulations. TAP is then used as an independent reference to assess CMIP6 uncertainties under different environmental conditions, including underlying surface types, cloud cover levels, and PM2.5 concentrations and their components (Sect. 3.2–3.4).
3.1 Inter-model performance and spatiotemporal evaluation
Temperature directly influences O3 production by affecting the rates of photochemical reactions and the emission of plant VOCs, such as isoprene (Coates et al., 2016). Therefore, this study compares and analyzes the multi-year annual mean and seasonal distribution, SD, and biases with TAP data for surface O3 concentrations over China based on the multi-model Ensemble Mean (MME) of CMIP6 for the period 2015–2023 (Fig. 2). It is evident that during summer (June, July, and August; JJA), MME shows higher O3 concentrations, with a mean value of 105 µg m−3. This pattern is primarily attributable to increased photolysis activity, higher levels of oxidants, and enhanced biogenic emissions, all of which promote O3 formation. Additionally, high temperatures are typically associated with increased atmospheric stability and a reduction in mixing layer height, making it more difficult for O3 to disperse and dilute, leading to its accumulation near the surface and higher concentrations (Yang et al., 2022). In spring (March, April, and May; MAM) and autumn (September, October, and November; SON), the simulated O3 concentrations are lower than in JJA, with mean values of 89 and 78 µg m−3, respectively. The lowest O3 concentrations are observed in winter (December, January, and February; DJF), with a mean of 55 µg m−3.
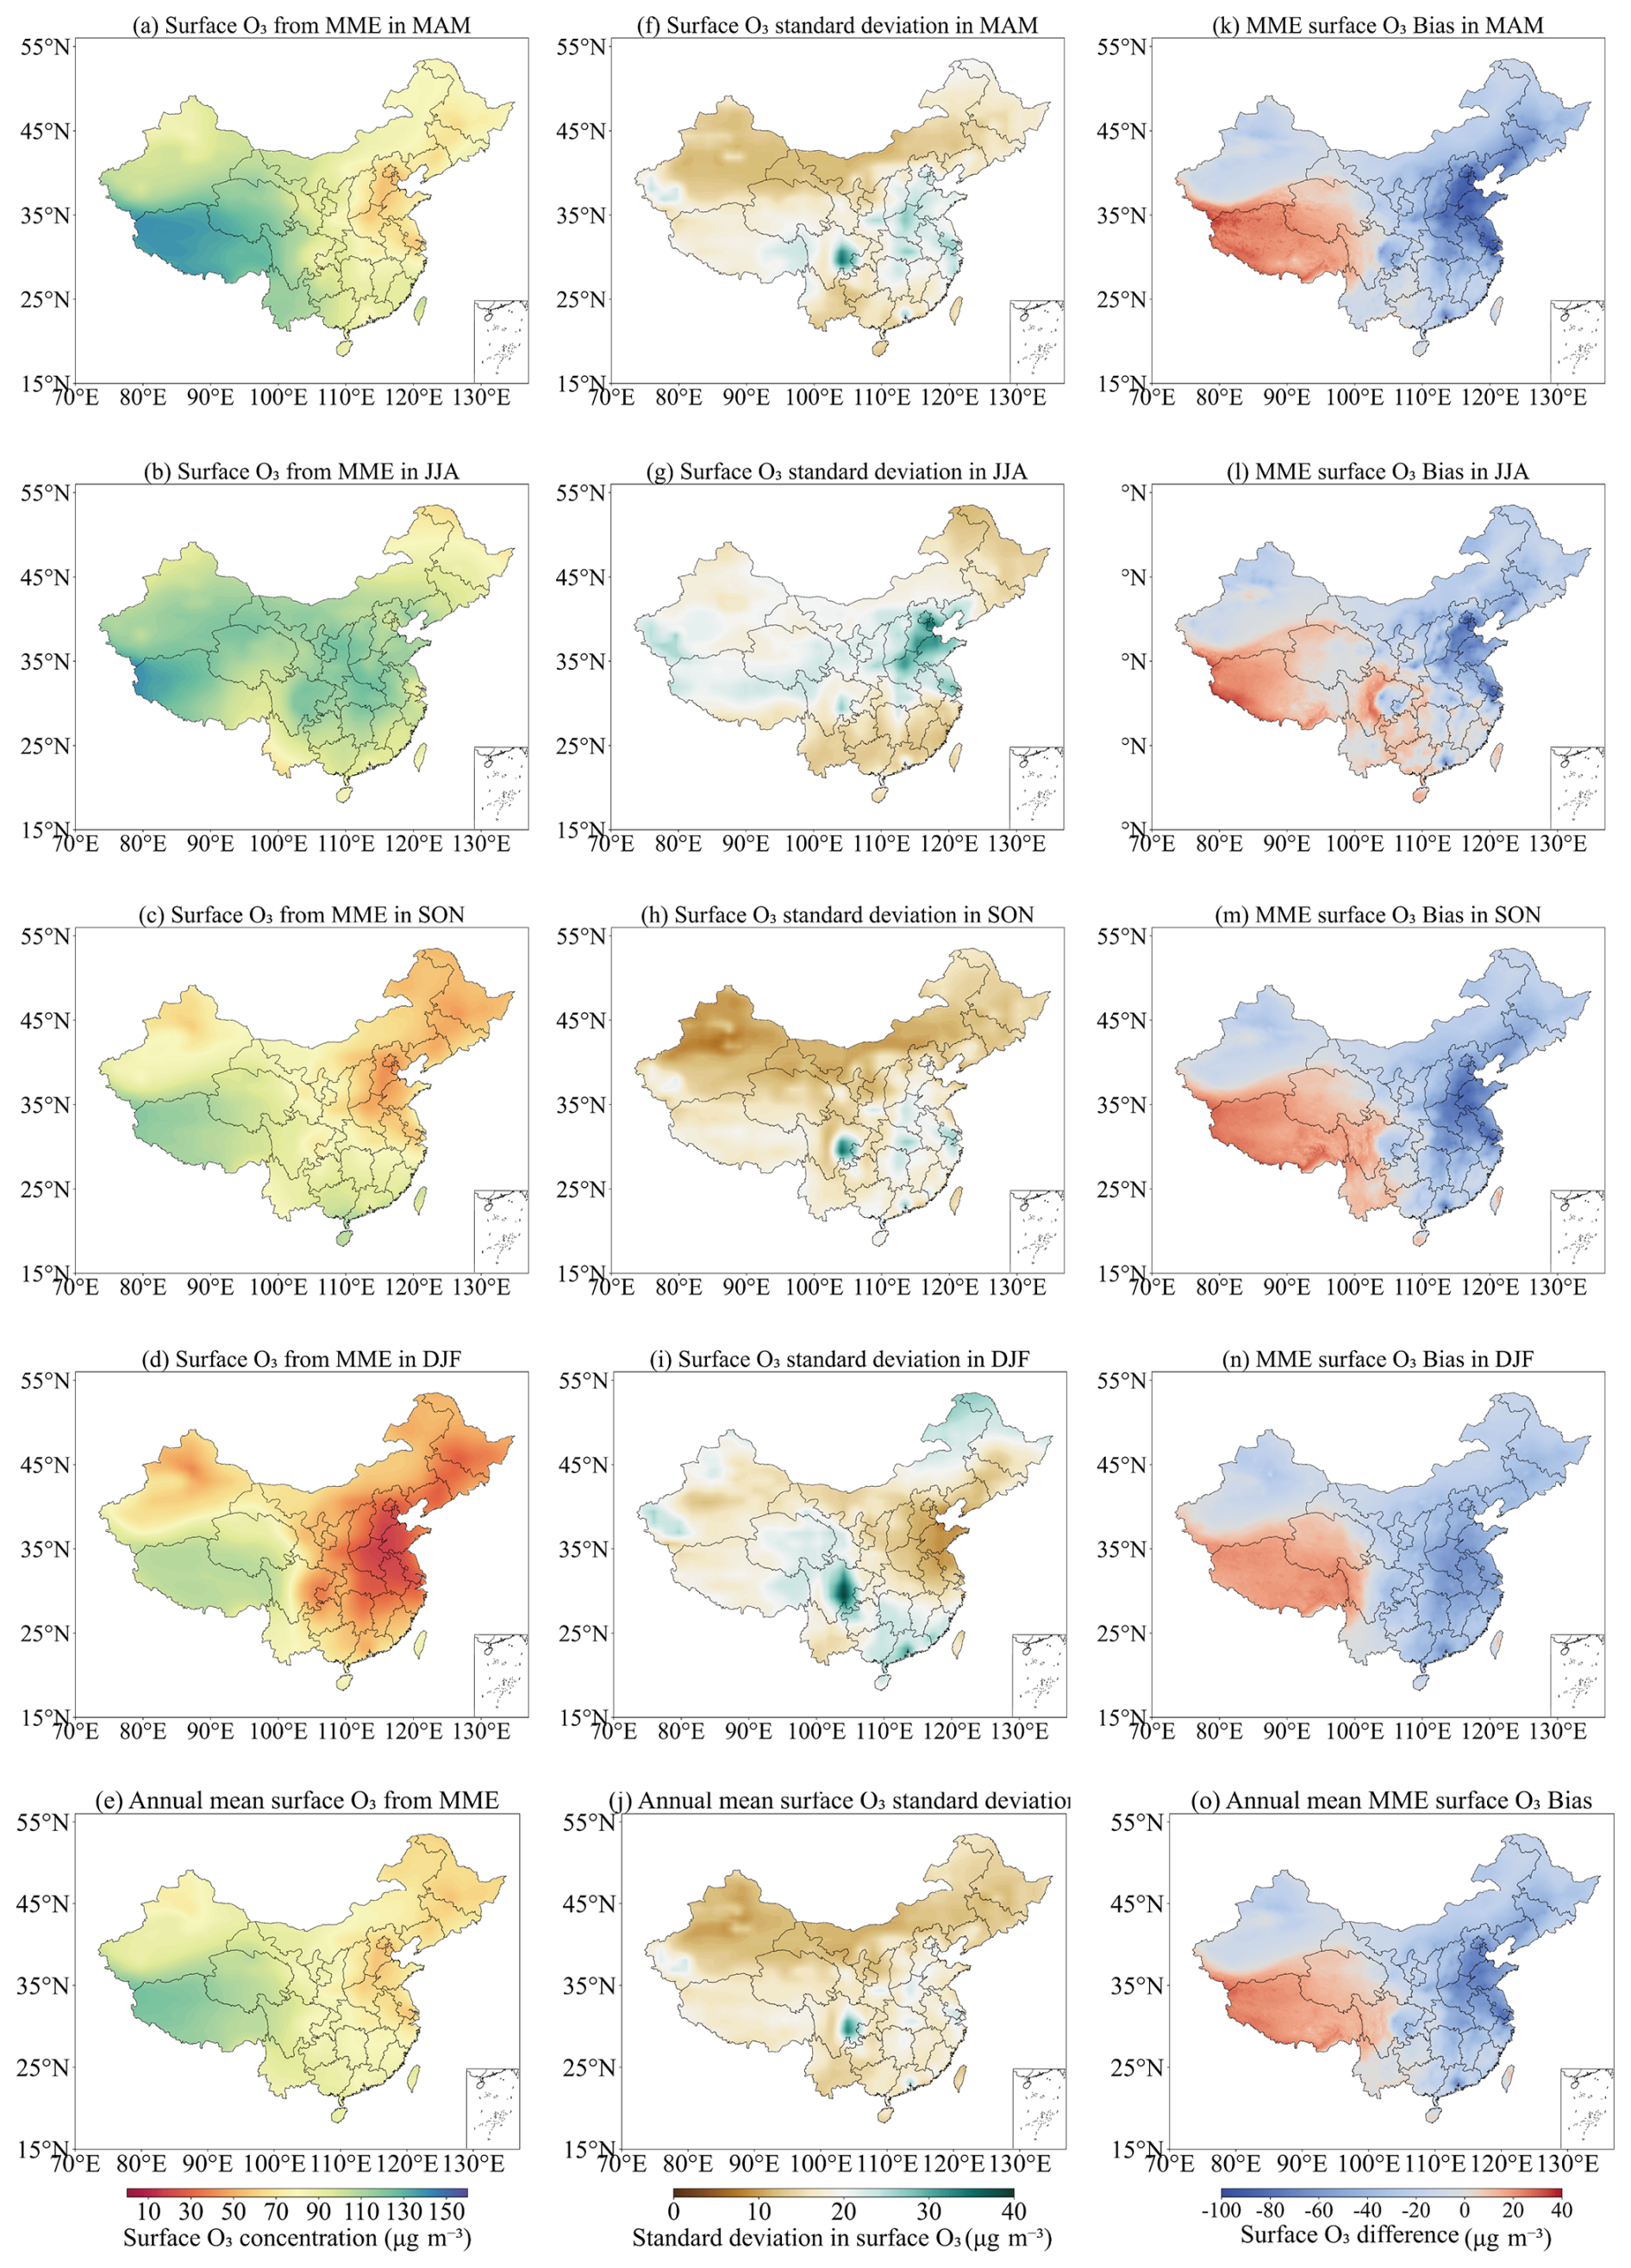
Figure 2Multi-model (nine CMIP6 models) annual and seasonal mean surface O3 concentrations over the 2015–2023 period in (a) MAM; (b) JJA; (c) SON; (d) DJF; and (e) annual mean. The SD of the MME in (f)MAM, (g) DJF, (h) JJA, (i) SON, and (j) annual mean. The difference between the MME and TAP observations in (k) MAM, (l) DJF, (m) JJA, (n) SON, and (o) annual mean.
For the seven sub-regions (Fig. 1), the seasonal patterns are generally consistent with those of China as a whole (except for South China). Among them, Central China exhibits the highest O3 concentration during JJA, reaching up to 117 µg m−3, while the lowest concentration occurs in DJF, at only 34 µg m−3. In South China, O3 concentrations are higher in SON, with a mean value of 99 µg m−3, slightly exceeding those in JJA. According to the TAP data, O3 concentrations in JJA are also lower than those in MAM and SON in South China, and only slightly higher than in DJF. This seasonal pattern may be related to the southeast monsoon, which has been shown in previous studies to strengthen during JJA and enhance northward transport while increasing precipitation and humidity (Yin et al., 2019), thereby reducing O3 concentrations. In Southwest China, O3 concentrations during MAM, SON, and DJF are notably higher than in other regions, particularly in the Tibetan Plateau, where the average O3 concentration in DJF exceeds 90 µg m−3. This may result from transboundary transport from foreign regions, especially India, where precursor emissions and O3 concentrations are relatively high (Sahu et al., 2021). In addition, recent modeling work has shown that the Tibetan Plateau receives substantial background O3 from the free troposphere and long-range transport. Li et al. (2014) demonstrated that trans-Eurasian transport contributes 10–15 ppbv of surface O3 to western China, superimposed on a natural background of 35–40 ppbv, with particularly strong influence from Indian emissions during the summer monsoon. Furthermore, the Tibetan Plateau is also a known hotspot of stratosphere–troposphere exchange (STE), where stratospheric O3 can be transported downward into the troposphere through tropopause folding and subsidence, further contributing to elevated background O3 levels in this region (Yin et al., 2023). In Northwest China, O3 concentrations remain relatively high across all four seasons, although a seasonal cycle is present with the highest values in JJA (113 µg m−3). O3 concentrations in MAM and DJF are the second highest among all regions, following Southwest China. The high O3 levels can be attributed to multiple factors. First, the region is arid and receives strong solar radiation, which promotes efficient photochemical O3 production. Second, although overall anthropogenic emissions are relatively low compared with eastern and southern China, some cities such as Urumqi and Yinchuan still exhibit relatively high O3 concentrations during summer, indicating that local emissions from industrial, energy, and traffic activities cannot be neglected (Zhu et al., 2023). Third, Northwest China can be affected by long-range transport of O3 and its precursors from surrounding and remote source regions. Modeling studies have shown that European anthropogenic emissions can enhance surface O3 over northwestern China by approximately 2–6 ppbv during spring and summer, while contributions from the Middle East may occasionally add another 1–4 ppbv (Li et al., 2014). Finally, high-altitude areas are more susceptible to STE, allowing O3 from the upper troposphere and lower stratosphere to be transported downward, further elevating surface O3 background levels (Yin et al., 2023). Northeast China, on the other hand, has the lowest O3 concentrations among all sub-regions, particularly during MAM, JJA, and SON, with concentrations of only 76, 88, and 54 µg m−3, respectively. This can be attributed to several factors: first, the cooler climate and shorter period of strong solar radiation in northeast China slow down the rate of photochemical O3 production. Second, the region has relatively lower emissions of reactive VOCs compared to the more industrialized and densely populated regions of eastern and southern China, which constrains the overall O3 production potential. Third, northeast China is frequently influenced by clean continental air masses from Siberia, which effectively dilute local and regional pollutant concentrations. In the experimental scenario designed by Zhang et al. (2018), which applied clean-air background concentration boundary conditions and excluded the influence of transboundary anthropogenic emissions from foreign regions, simulated O3 concentrations decreased significantly over western China but showed little change over eastern China. These results suggest that emissions from external regions primarily affect O3 levels in western China, whereas domestic emissions remain the dominant contributor to O3 concentrations in eastern China.
The inter-model SD (Table S2) is largest in DJF (19.0 µg m−3), but this peak is mainly confined to the Sichuan Basin in Southwest China and parts of South China. In contrast, although the SD in JJA is slightly lower (18.8 µg m−3), elevated values extend across a much broader area, particularly in North China and East China. The SD decreases in MAM (16.8 µg m−3) and is smallest in SON (15.2 µg m−3). This suggests greater diversity in the seasonal O3 cycles simulated by individual models during DJF, especially for UKESM1-0-LL and UKESM1-1-LL, which exhibit the most pronounced seasonal cycles among the nine models (Fig. 3), with significant negative biases in simulated O3 concentrations during DJF.
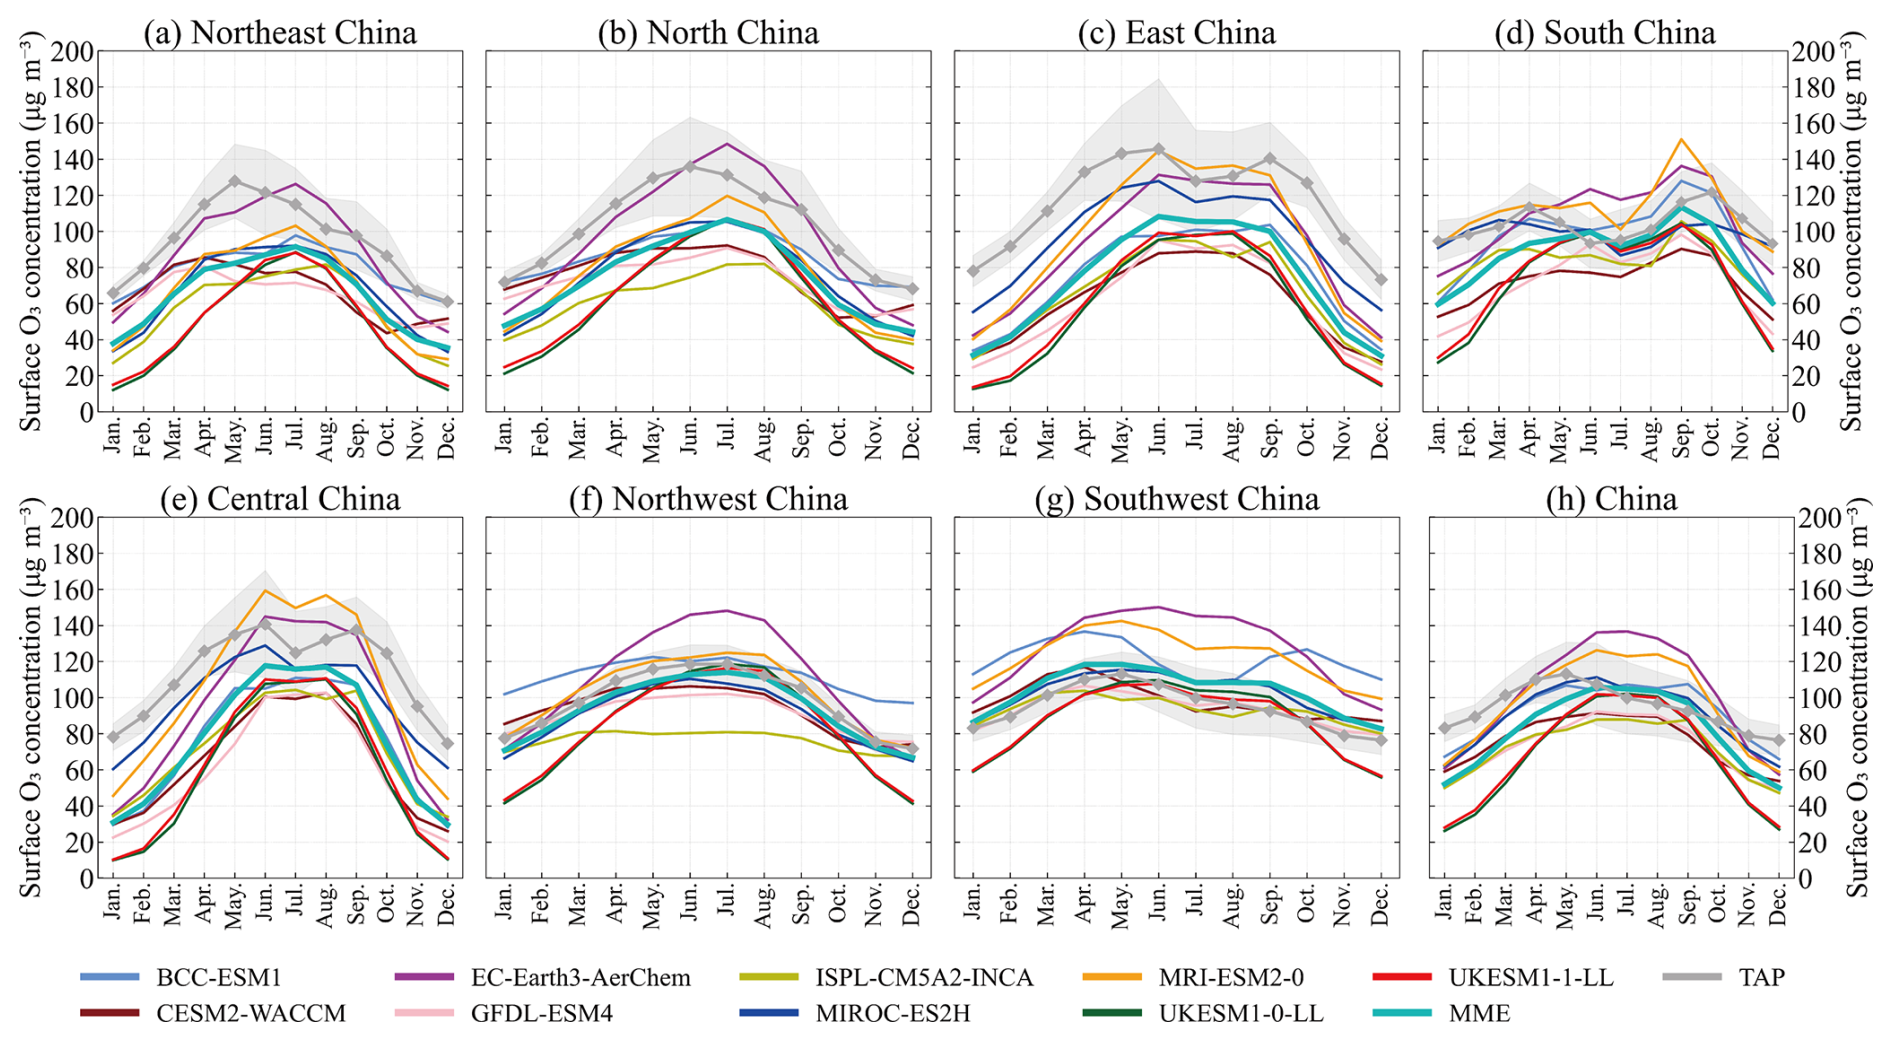
Figure 3Comparison of the annual cycle of O3 concentrations, between individual CMIP6 models, the MME and TAP in China and sub-regions for the period 2015–2023. The grey shading shows SD of TAP observations within the region.
The spatial distribution of the MME bias reveals distinct seasonal and regional patterns. On a national average, MME underestimates surface O3 concentrations, with the largest negative biases occurring in MAM (−25.4 µg m−3) and DJF (−25.3 µg m−3), and smaller ones in SON (−22.9 µg m−3) and JJA (−12.8 µg m−3). Spatially, the most pronounced underestimations are found over eastern and northern China, particularly during MAM and SON. In contrast, positive biases (overestimations) are evident in Southwest China and in parts of Northwest China (primarily Qinghai Province), especially during SON. Notably, Northwest China (excluding the Qinghai overestimation) exhibits the smallest absolute biases among all sub-regions, with simulated O3 concentrations aligning most closely with the TAP data across all seasons.
The annual cycles of surface O3 concentrations in China and its sub-regions simulated by the nine CMIP6 models were compared with the TAP-derived values (Fig. 3). It can be seen that the correlation between the two is generally good in most regions (r>0.73), which suggests that the seasonality of the circulation patterns, stratosphere-troposphere exchange, and natural emissions are well captured (Table S3). However, (1) The timing of O3 peak concentrations in the MME (mostly in July–August, except for East and Central China in June, and Southwest China in April) is overall slightly delayed compared to TAP (mostly in May–June), which is consistent with the results of the ACCMIP models (Young et al., 2018). (2) The nine CMIP6 models evaluated in this study generally underestimate O3 concentrations across most sub-regions of China. The most pronounced underestimations occur in UKESM1-0-LL and UKESM1-1-LL. Although these two models show slight overestimations in Southwest China from June to September, as well as in South China in June and in Northwest China in August, underestimation remains the dominant pattern, particularly in East and Central China during MAM and DJF, where simulated O3 concentrations are over 60 µg m−3 lower than the TAP values. This is consistent with the findings of Turnock et al. (2020), who suggested that these biases may be related to excessive NOx titration in the UKESM1-0-LL model, leading to an underestimation of surface O3 concentrations over much of the Northern Hemisphere continental regions during DJF. Liu et al. (2022) further conducted a global evaluation of surface O3 biases in UKESM1, identifying temperature, photolysis rates, and regional chemical composition as key predictors, which may help explain the underestimations identified in this study. (3) In contrast, a small number of CMIP6 models evaluated in this study, including BCC-ESM1, EC-Earth3-AerChem, and MRI-ESM2-0, show a certain degree of overestimation in surface O3 concentrations throughout the year in Southwest China (with an average overestimation of 30 µg m−3), Northwest China (with an average overestimation of 10 µg m−3), and during JJA in South China. This may result from common sources of error in the models, such as uncertainties in emission inventories, deposition processes, or vertical mixing (Wild et al., 2020). Additionally, the coarse resolution of ESMs may lead to overestimation of O3 concentrations in polluted areas, while higher-resolution models and better consistency between nested models may improve the accuracy of simulated surface O3 concentrations (Neal et al., 2017).
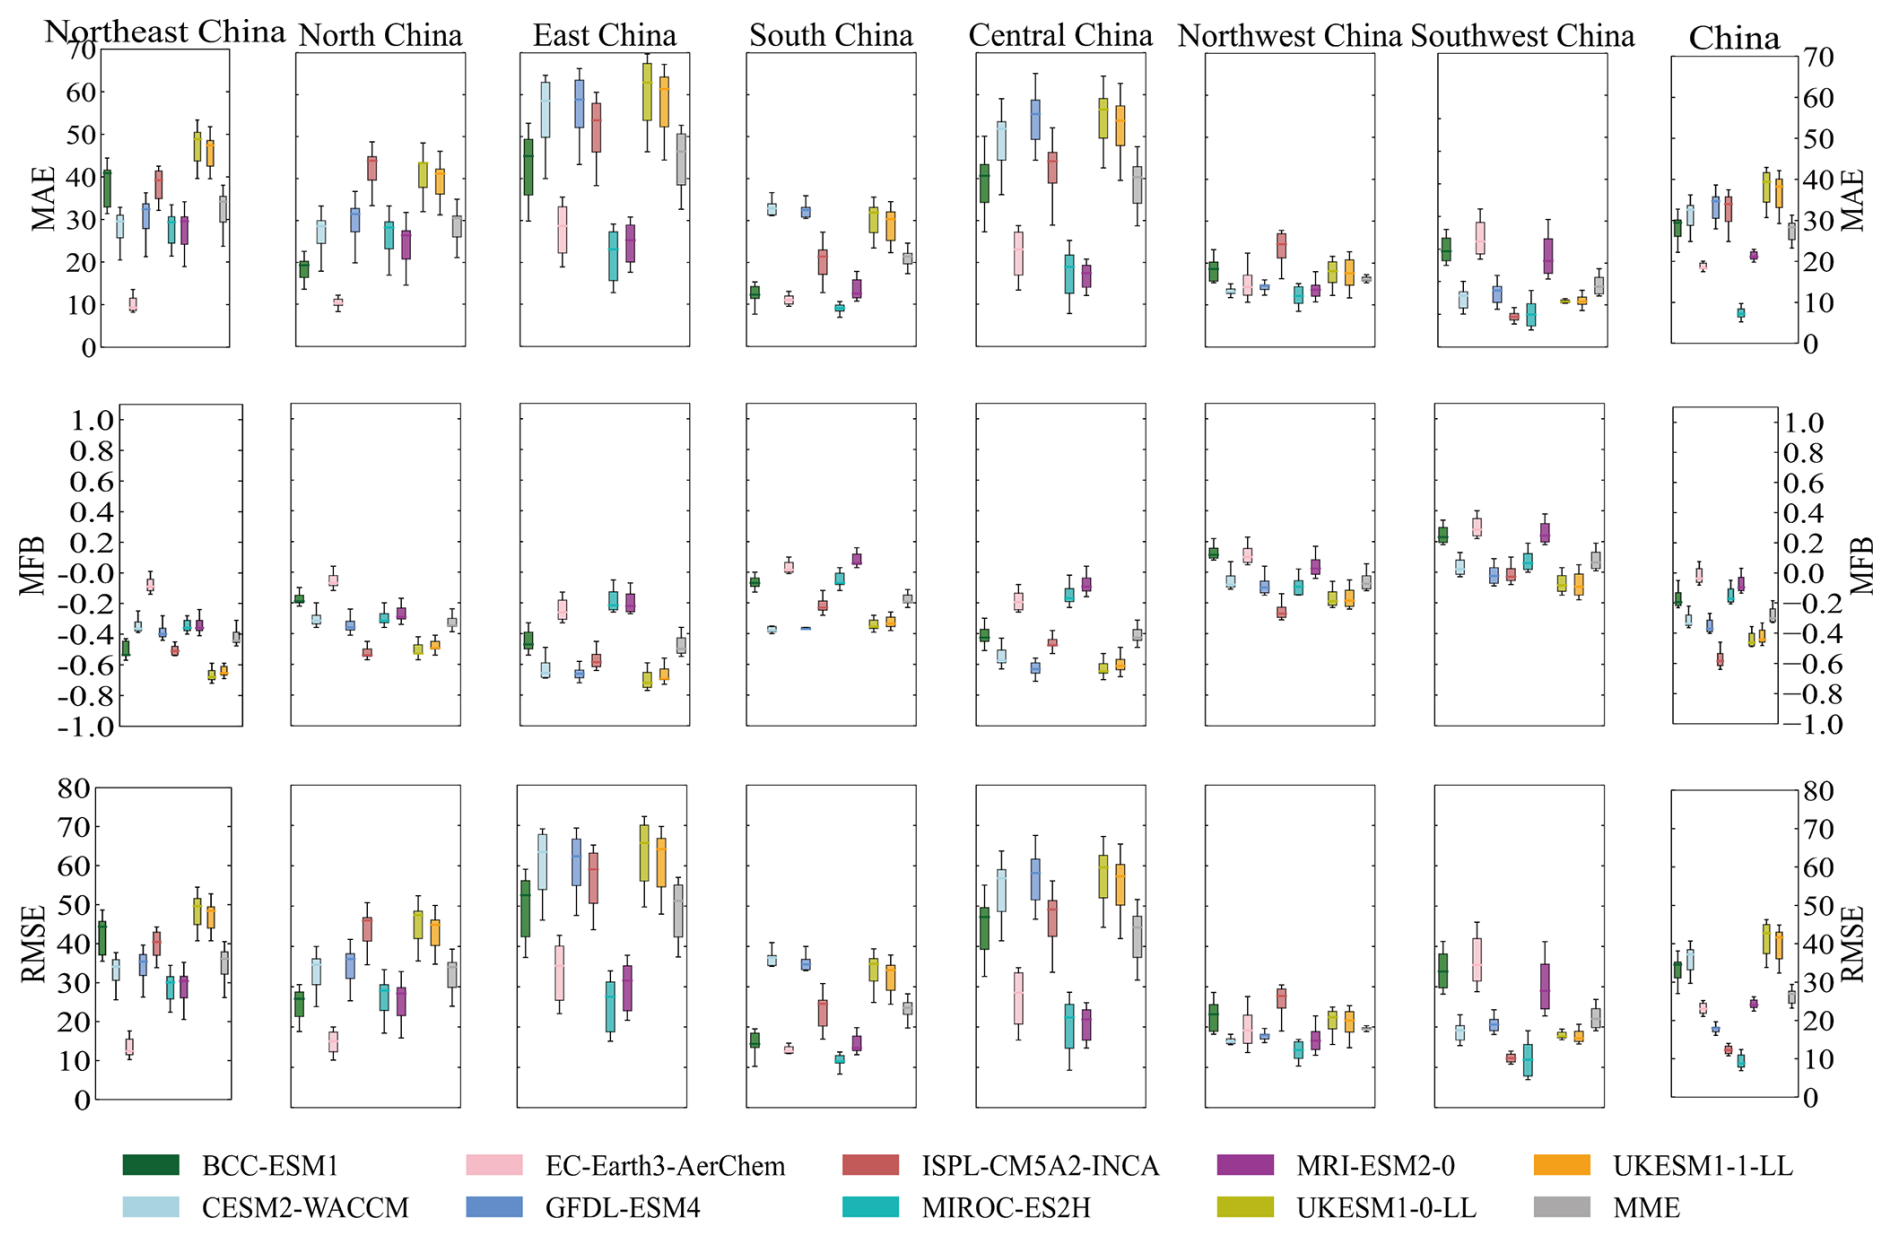
Figure 4Distribution of differences for O3 concentrations (µg m−3) from nine CMIP6 models in China and sub-regions during 2015–2023. The box plots show the 25th and 75th percentiles as solid boxes, median values as solid lines, dots represent the concentrations from MAE, MFB and RMSE, and whiskers extending to the minimum and maximum.
Figure 4 presents a comparison of the Mean Absolute Error (MAE), Mean Fractional bias (MFB), and Root Mean Square Error (RMSE) between the CMIP6 models and TAP for surface O3 concentrations. Combined with the bias for different months and sub-regions (Fig. 5), correlation coefficients, and SD (Fig. 6), it can be observed that the MME simulates the O3 concentration over China with the smallest bias in June and the largest in January. Among the sub-regions, the simulation results for Northwest China are the most accurate, with high correlation and the smallest MAE, MFB, RMSE, SD, and bias. In contrast, the largest MAE, MFB, RMSE, SD, and bias are found in East China, particularly in the autumn and winter. For individual models, EC-Earth3-AerChem shows the smallest annual average bias for O3 concentrations in China, with an MFB close to zero; BCC-ESM1 exhibits the best correlation; MIROC-ES2H has the smallest MAE and RMSE, providing relatively good simulation results; while UKESM1-0-LL has the largest MAE, MFB, RMSE, SD, and bias. Among the sub-regions, MIROC-ES2H provides relatively good simulations of O3 concentrations in South China, while UKESM1-0-LL shows the largest MAE, MFB, RMSE, SD, and bias in East China. Overall, the MME of CMIP6 performs better in simulating O3 concentrations during JJA, with larger discrepancies observed in DJF. The simulation in Northwest China is closest to TAP, while the largest discrepancies occur in East China. EC-Earth3-AerChem is better suited for simulating or forecasting the annual average O3 concentrations over China, while MIROC-ES2H is more appropriate for error-sensitive scenario analyses. BCC-ESM1 demonstrates superior performance in terms of correlation and temporal consistency, whereas both UKESM1-0-LL and UKESM1-1-LL exhibit higher simulation uncertainties.
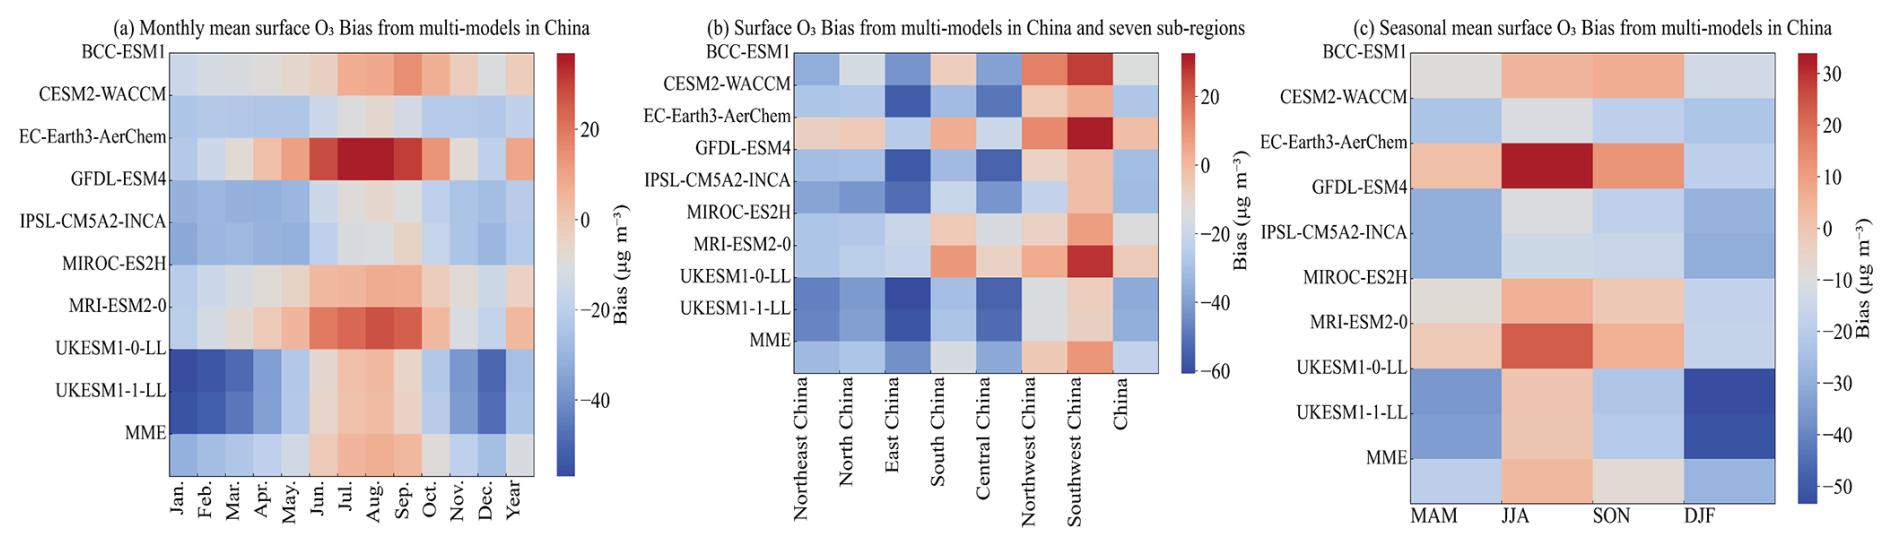
Figure 5Heatmap of O3 concentrations bias from nine CMIP6 models compared to TAP across different months, seasons and regions in China and sub-regions.
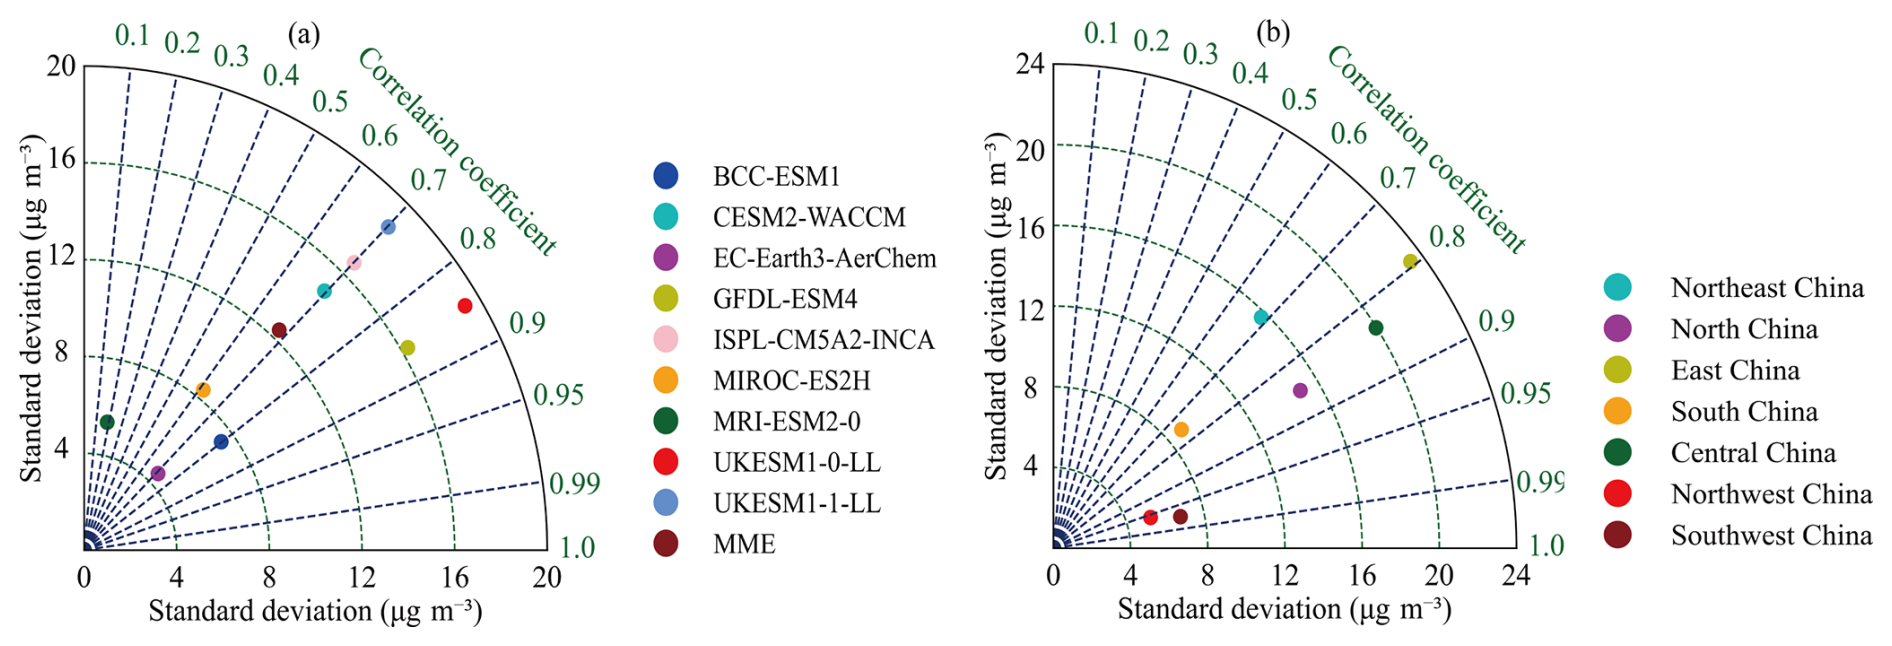
Figure 6Taylor diagram of the annual mean surface O3 concentrations simulated by nine CMIP6 models compared with the TAP data during 2015–2023 in China and sub-regions. The radial coordinate shows the SD in the spatial pattern, normalized by the observed SD. The azimuthal variable shows the correlation of the modeled spatial pattern with the observed spatial pattern.
3.2 Under different underlying surface types
Vegetation type, land cover, and land use changes can influence biogenic emissions, which in turn affect the accuracy of model-simulated O3 concentrations (Ashworth et al., 2012). To investigate the impact of these factors on simulation discrepancies and minimize the interference of temperature changes, this study focuses on the JJA period in Northwest China, which has similar climatic conditions and complex surface types. The selected typical underlying surfaces include natural land surfaces such as grassland, forest, desert, and snow and ice (perennial snow), as well as anthropogenic land surfaces such as cropland and urban. By comparing the bias, MAE, RMSE, and SD of MME-simulated surface O3 concentrations relative to TAP (Fig. 7), it is observed that TAP simulates lower O3 concentrations over natural land surfaces compared to anthropogenic land surfaces, and the MME simulations generally follow this trend. However, the MME simulation results show the highest O3 concentrations over snow and ice surfaces and the lowest over cropland surfaces. Overall, the MME simulations exhibit lower bias, MAE, and RMSE for natural land surfaces compared to anthropogenic land surfaces, with the best performance over forest and desert surfaces, and the worst performance over urban surfaces, followed by cropland and snow and ice surfaces.
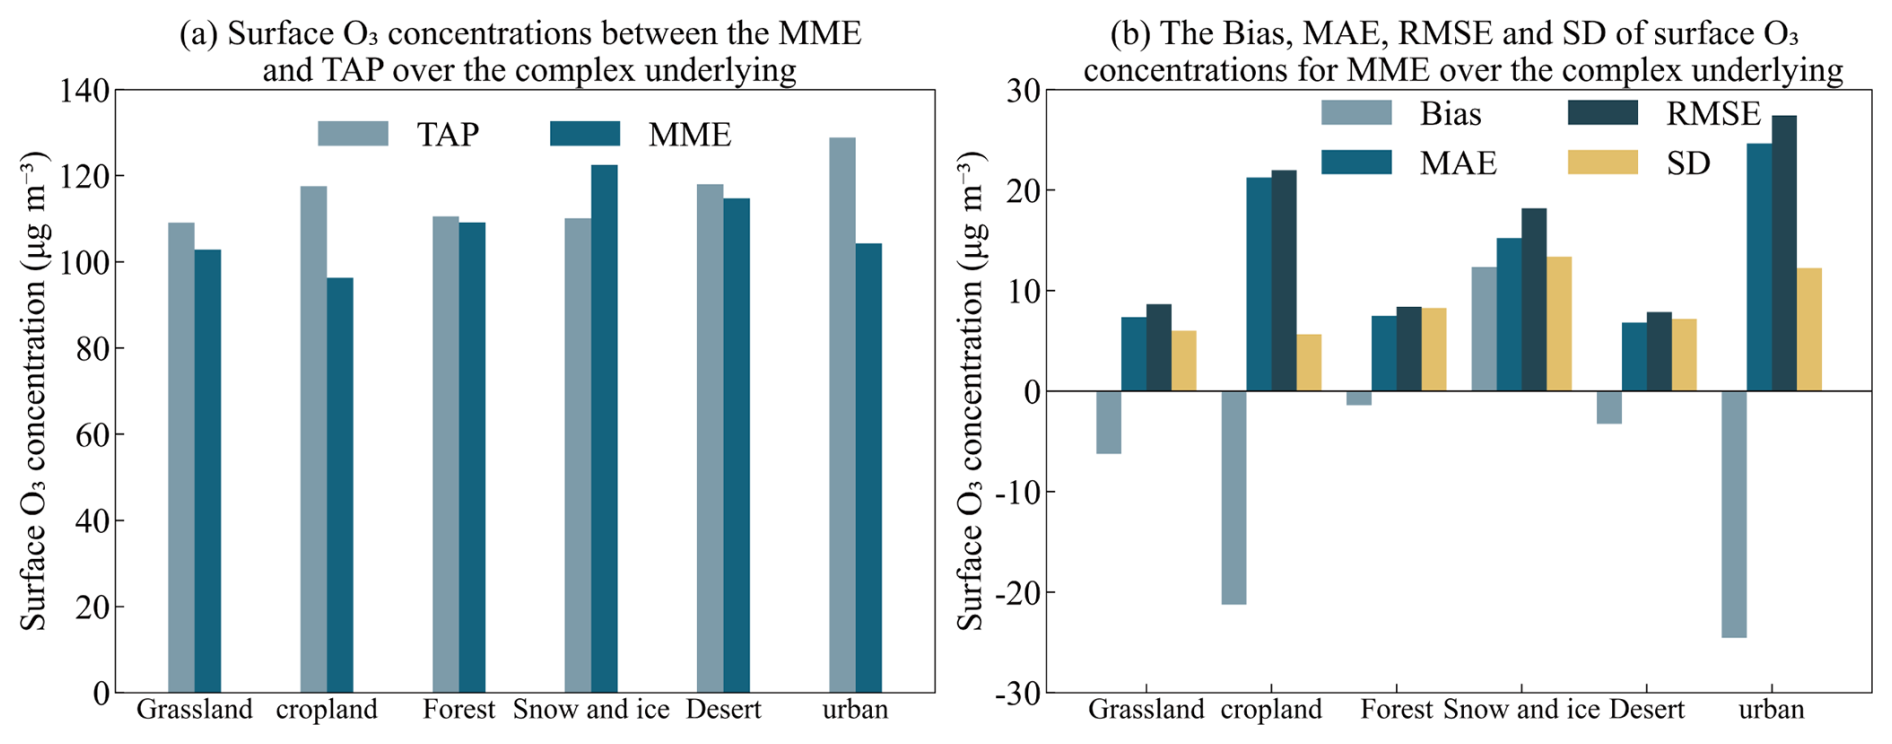
Figure 7The biases, MAE, RMSE and SD of surface O3 concentrations simulated by CMIP6 models relative to TAP from 2015 to 2023 over the complex underlying surface in China.
Natural land surfaces tend to provide more consistent physical and chemical conditions, with limited direct human interference, leading to relatively more accurate simulations of surface O3 concentrations. Although natural ecosystems can involve complex processes, such as BVOC emissions from vegetation, deforestation, or wildfires, our analysis based on long-term (JJA) MME effectively smooths out the random uncertainties associated with such transient events. Consequently, the underlying stability of natural surfaces in our study region becomes the dominant feature. In Northwest China during JJA, the dominant natural land types (grassland, desert, forest, and snow and ice) generally undergo limited land-use change and exhibit weaker anthropogenic disturbances compared with cropland and urban surfaces. Under these relatively stable conditions, biogenic emission patterns are more predictable, as demonstrated by global modeling studies using MEGAN2.1 (Guenther et al., 2012). In addition, dry deposition, a major sink of tropospheric O3, is more reliably captured over natural surfaces, where vegetation cover and leaf area index are relatively stable. Accurate parameterization of both stomatal and non-stomatal deposition pathways ensures reliable O3 removal, reducing bias, MAE, and RMSE in multi-model ensemble simulations (Val Martin et al., 2014). In contrast, urban surfaces, characterized by intensive human activities and diverse anthropogenic emission sources (e.g., transportation and industry), present a more complex environment for O3 formation and destruction. The heterogeneous land cover complicates dry deposition parameterization, often leading to underestimation of O3 removal and larger discrepancies in simulated concentrations.
Snow and ice surfaces can influence O3 dry deposition during the cold season, particularly in northern China where snow cover often persists for several months. Their high albedo reduces the absorption of solar radiation at the surface and weakens photochemical activity, including the photolysis of NO2 that contributes to O3 formation. In addition, snow and ice generally exhibit lower O3 uptake capacity, with deposition velocities (0.03 cm s−1) typically smaller than those over vegetated or soil surfaces (Wesely et al., 1981). The magnitude and direction of O3 flux over snow also depend on factors such as deposited trace gases, solar irradiance, snow temperature, and the underlying substrate (Helmig et al., 2007), but current atmospheric chemistry models often lack detailed parameterizations for these processes. As a result, O3 deposition over snow and ice remains a potential source of uncertainty for cold-season simulations. It should also be noted that, in the context of O3 removal, wet deposition contributes minimally to O3 removal because of its low solubility. Therefore, while dry deposition over snow and ice may be locally important in winter or high-altitude regions, wet deposition has little impact on surface O3 concentrations.
The simulation bias over cropland may stem from the fact that croplands are often associated with agricultural activities (e.g., fertilization and irrigation), which release large amounts of NOx and VOCs, thereby increasing the complexity of O3 formation. Furthermore, changes in vegetation types and management practices in agricultural land can also influence biogenic emissions, further affecting the simulation of O3 concentrations and leading to larger model biases.
The simulation biases identified over different surfaces highlight potential challenges for modeling surface O3 in China. Specifically, the high errors over cropland and urban areas likely reflect the need for improved model representation of regionally characteristic anthropogenic activities and heterogeneous land cover. Meanwhile, uncertainties over snow and ice surfaces point to gaps in modeling cold-season processes, critical for high-altitude and northern parts of China. While global models may not resolve all local processes, analyzing biases by land cover type provides crucial insight into how these regionally characteristic processes, such as the interplay of anthropogenic and biogenic emissions, deposition, and meteorology, govern surface O3 patterns. This regional perspective helps interpret model-observation discrepancies in China and provides context for understanding O3 simulation uncertainties related to land cover. These findings suggest that enhancing parameterizations for characteristic land-surface processes could improve the reliability of global and regional models applied.
3.3 Under different level of total cloud cover
The analysis of surface O3 bias between MME and TAP under different cloud conditions (Fig. 8) is based on total cloud cover from the ERA5 monthly reanalysis dataset. Using these data, and following the classification of Han and Cong (2015), conditions were categorized into four levels: clear sky (0 %–10 %), partly cloudy (20 %–30 %), cloudy (40 %–70 %), and overcast (80 %–100 %). It is important to note that while ERA5 provides observation-constrained, physically consistent fields suitable for this diagnostic purpose, uncertainties inherent to any reanalysis (e.g., from retrieval errors and model assumptions) remain. Nonetheless, ERA5 is considered one of the most reliable datasets for studying cloud-meteorology interactions (Wu et al., 2023), supporting the robustness of our comparative analysis. The analysis results indicate that the TAP simulation exhibits the highest surface O3 concentrations under partly cloudy conditions, while O3 concentrations generally decrease with increasing total cloud cover under other cloud cover categories (except during JJA). This pattern is primarily attributed to the attenuation of solar radiation by clouds, which suppresses photochemical O3 production. In addition, accompanying precipitation processes can influence atmospheric stability and boundary layer development, which may indirectly affect surface O3 concentrations. Under partly cloudy conditions, however, the atmosphere tends to be more stable, with weaker vertical mixing, allowing O3 to accumulate near the surface. During JJA, the relationship becomes more complex. High pollutant loads and intricate meteorological conditions likely counteract the influence of total cloud cover, leading to a less straightforward association between cloud amount and O3 concentrations.
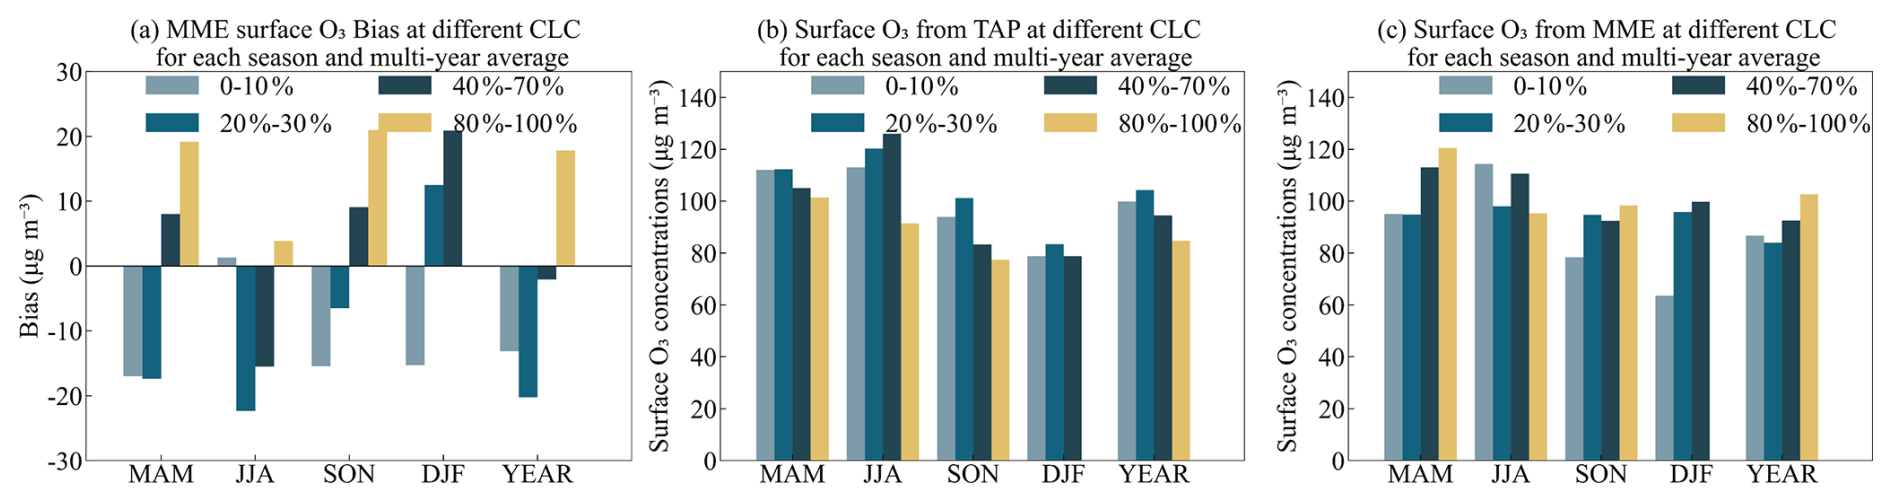
Figure 8The bias in surface O3 concentrations simulated by CMIP6 models relative to TAP from 2015 to 2023 under different total cloud cover levels in China.
In contrast, the MME simulations do not fully reproduce this pattern. The annual mean bias is smallest under cloudy conditions and largest under partly cloudy conditions. On a seasonal scale, the smallest bias occurs under clear-sky conditions during JJA, while the largest bias is found under partly cloudy conditions. These discrepancies may stem from the complex interactions by which cloud cover modulates shortwave radiation, photochemical rates, and meteorological variables such as temperature, precipitation, and boundary layer height. They are also closely tied to structural differences among models in physical parameterizations, radiative transfer schemes, and chemical mechanisms.
Therefore, when using CMIP6 models for O3-related assessment and projection, it is important to consider how cloud cover modulates shortwave radiation and photochemical reaction rates, how precipitation affects atmospheric stability and boundary layer development, and how other meteorological variables such as temperature, humidity, and wind influence both chemical reactions and pollutant transport. Proper attention to these interactions is particularly crucial under polluted and complex meteorological conditions, where the parameterization of these coupled processes in current models remains challenging. Improving their representation is therefore key to reducing systematic uncertainties and enhancing projection accuracy (Jacob and Winner, 2009).
3.4 Under different concentrations of PM2.5 and their components
Aerosols play a crucial role in the simulation of surface O3 concentrations. Variations in PM2.5 can influence O3 formation through several pathways: (1) chemical effects: changes in aerosol composition (e.g., sulfate, nitrate, organic matter, BC) can perturb the concentrations of key radicals (e.g., OH, HO2) and thus alter photochemical reaction rates (Wang et al., 2019); (2) radiative effects: aerosols modify optical properties and reduce actinic flux at the surface, thereby suppressing photolysis rates and slowing O3 production; and (3) heterogeneous effects: reactions on aerosol surfaces can directly consume NOx or other precursors, shifting the chemical environment for O3 formation (Qu et al., 2021). Lou et al. (2014) showed that considering aerosols reduces the mean bias in simulated O3 over China from 33 % to 9 % using GEOS-Chem. Therefore, this study analyzes the bias in surface O3 concentrations simulated by the MME relative to TAP under different PM2.5 levels (Fig. 9). The results show that during the JJA and SON, when PM2.5 concentrations are relatively low, TAP data indicate that O3 concentrations increase with rising PM2.5 levels. During the DJF, when PM2.5 concentrations are higher, O3 concentrations decrease as PM2.5 levels increase. This is primarily due to the fact that, during JJA and SON, although the increases in PM2.5 concentrations can attenuate solar radiation and participate in heterogeneous uptake of HO2 and RO2 radicals. However, their overall inhibitory effect on O3 formation is relatively weaker during these seasons because abundant sunlight and strong photochemical activity compensate for aerosol-induced reductions in photolysis rates. In addition, O3 formation is typically VOC-limited regime, under which heterogeneous radical loss plays a smaller relative role (Liu et al., 2019). In contrast, during DJF, limited solar radiation, stronger atmospheric stability, and elevated NOx concentrations amplify the aerosol impacts, reduced photolysis rates become more critical, heterogeneous radical uptake more effectively suppresses the HOx cycle, and NOx titration is more likely to occur. Meanwhile, the increase in BC concentration in PM2.5 (Fig. S1) enhances the light absorption of PM2.5, further reducing UV radiation and inhibiting O3 photochemical production. Additionally, other components of PM2.5, such as NO and OM, may influence O3 through specific pathways, particulate nitrate photolysis generates NO2 and OH radicals, promoting O3 formation, while OM and organic nitrates modulate radical (RO) cycling and NOx partitioning, thereby affecting O3 photochemistry (Li et al., 2025). Observational evidence from Chen et al. (2021) in Delhi supports this seasonal behavior: reductions in PM2.5 significantly enhance solar radiation, reduce AOD, and increase the photolysis rate of key O3 precursors, thereby exacerbating O3 accumulation under VOC-limited conditions, particularly in winter, when AOD is reduced by 50 %, O3 generation can increase by 25 %.
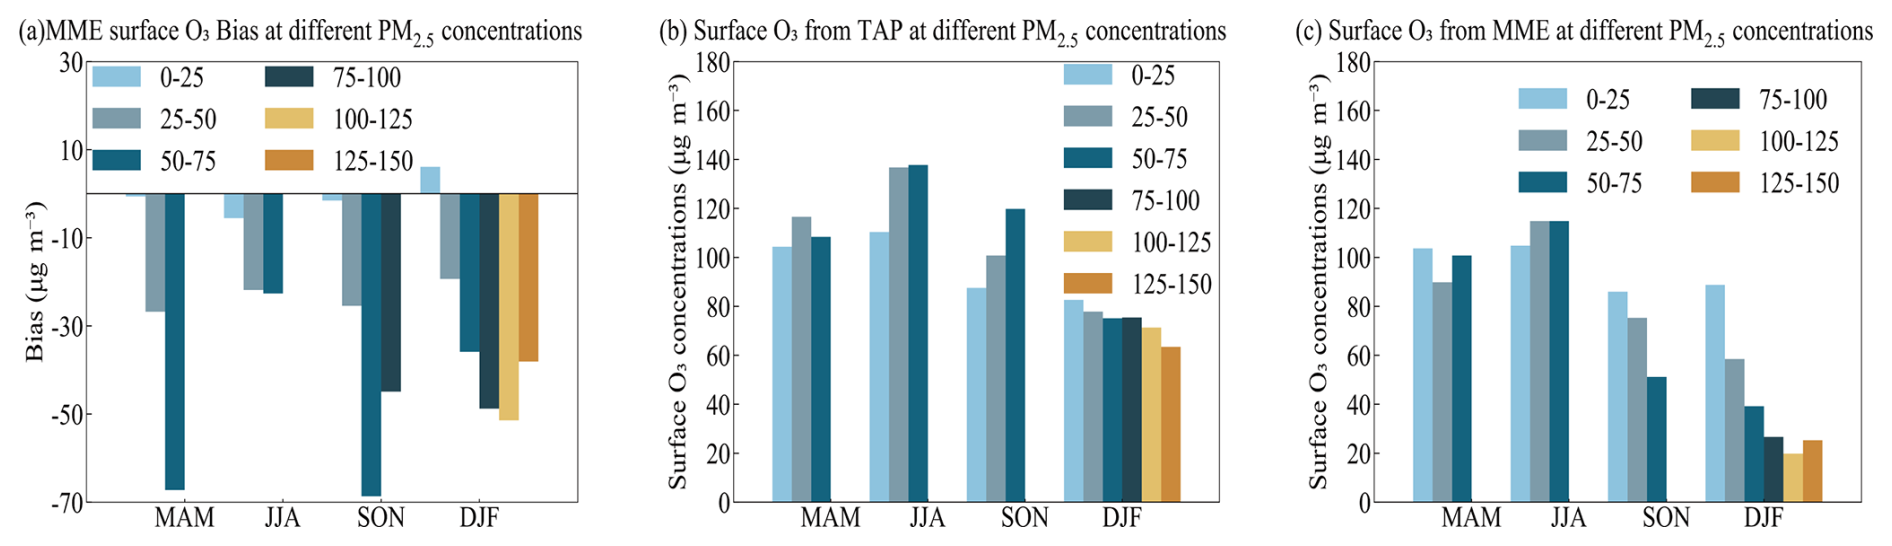
Figure 9The bias in surface O3 concentrations simulated by CMIP6 models relative to TAP from 2015 to 2023, under different PM2.5 concentrations in China.
The MME simulation results indicate that surface O3 concentrations generally decrease with increasing PM2.5 levels (except during JJA). However, under extreme pollution conditions in DJF, O3 concentrations exhibit a slight increase once PM2.5 exceeds 125 µg m−3. This suggests a complex nonlinear relationship between PM2.5 and O3 formation. Previous studies have shown that reducing aerosol emissions without corresponding cuts in precursor pollutants could lead to increased surface O3 over eastern China (Li et al., 2018), indicating that aerosols suppress O3 production through light attenuation and heterogeneous reactions. At low to moderate PM2.5 concentrations, the increase in PM2.5 largely inhibits O3 formation by scavenging key radicals (e.g., HO2 and NOx) and reducing solar radiation intensity, thereby leading to a decline in O3. However, under extreme pollution conditions, especially in winter, this suppressing effect tends to saturate. Meanwhile, the nocturnal titration of O3 is weakened under high NOx conditions, which, combined with unfavorable meteorological conditions such as temperature inversions and a lower boundary layer, results in O3 concentrations no longer decreasing with further increases in PM2.5 and may even slightly increase.
These findings highlight that the synergistic and inhibitory effects between PM2.5 and O3 vary significantly across seasons and pollution levels. This implies that future air pollution control strategies should adopt coordinated mitigation of both PM2.5 and O3 precursors to avoid potential side effects from single-pollutant reduction policies.
This study analyzes the changes in annual mean surface O3 concentrations in China and its sub-regions from the pre-industrial period to the present day, based on nine CMIP6 models and MME results, relative to the 2015–2023 mean (Fig. 10). The MME results show that, since 1850, the annual mean surface O3 concentration in China has increased by 39.3 ± 14.4 µg m−3 (±1 SD), with the maximum change of 57.9 µg m−3 (from the MIROC-ES2H model) and the minimum change of 23.1 µg m−3 (from the UKESM1-0-LL model). Before 1950, the annual mean increase in O3 concentration was relatively slow, at only 0.12 µg m−3; however, after 1950, the rate of increase accelerated significantly, with an annual mean increase of 0.28 µg m−3. This change is likely primarily related to the significant increase in anthropogenic activities during this period, especially the substantial increase in anthropogenic precursor emissions, such as CH4, NOx, CO, and NMVOCs. The simulations of historical O3 concentrations by different CMIP6 models show that the EC-Earth3-AerChem model yields the highest values, while the IPSL-CM5A2-INCA model yields the lowest. These differences reflect variations in aerosol, climate, and atmospheric chemistry process simulations across different models. Griffiths et al. (2021), based on ground, sounding, and satellite data from the past few decades, assess the performance of multiple CMIP6 models in simulating surface O3 concentrations. Their study indicates that these models are capable of accurately reproducing the spatial distribution, seasonal variation, and interannual variability and trends of surface O3 concentrations. This also indicates the reliability of CMIP6 models in simulating historical surface O3 variations, which provides support for their future projections of O3 concentrations under climate change scenarios.
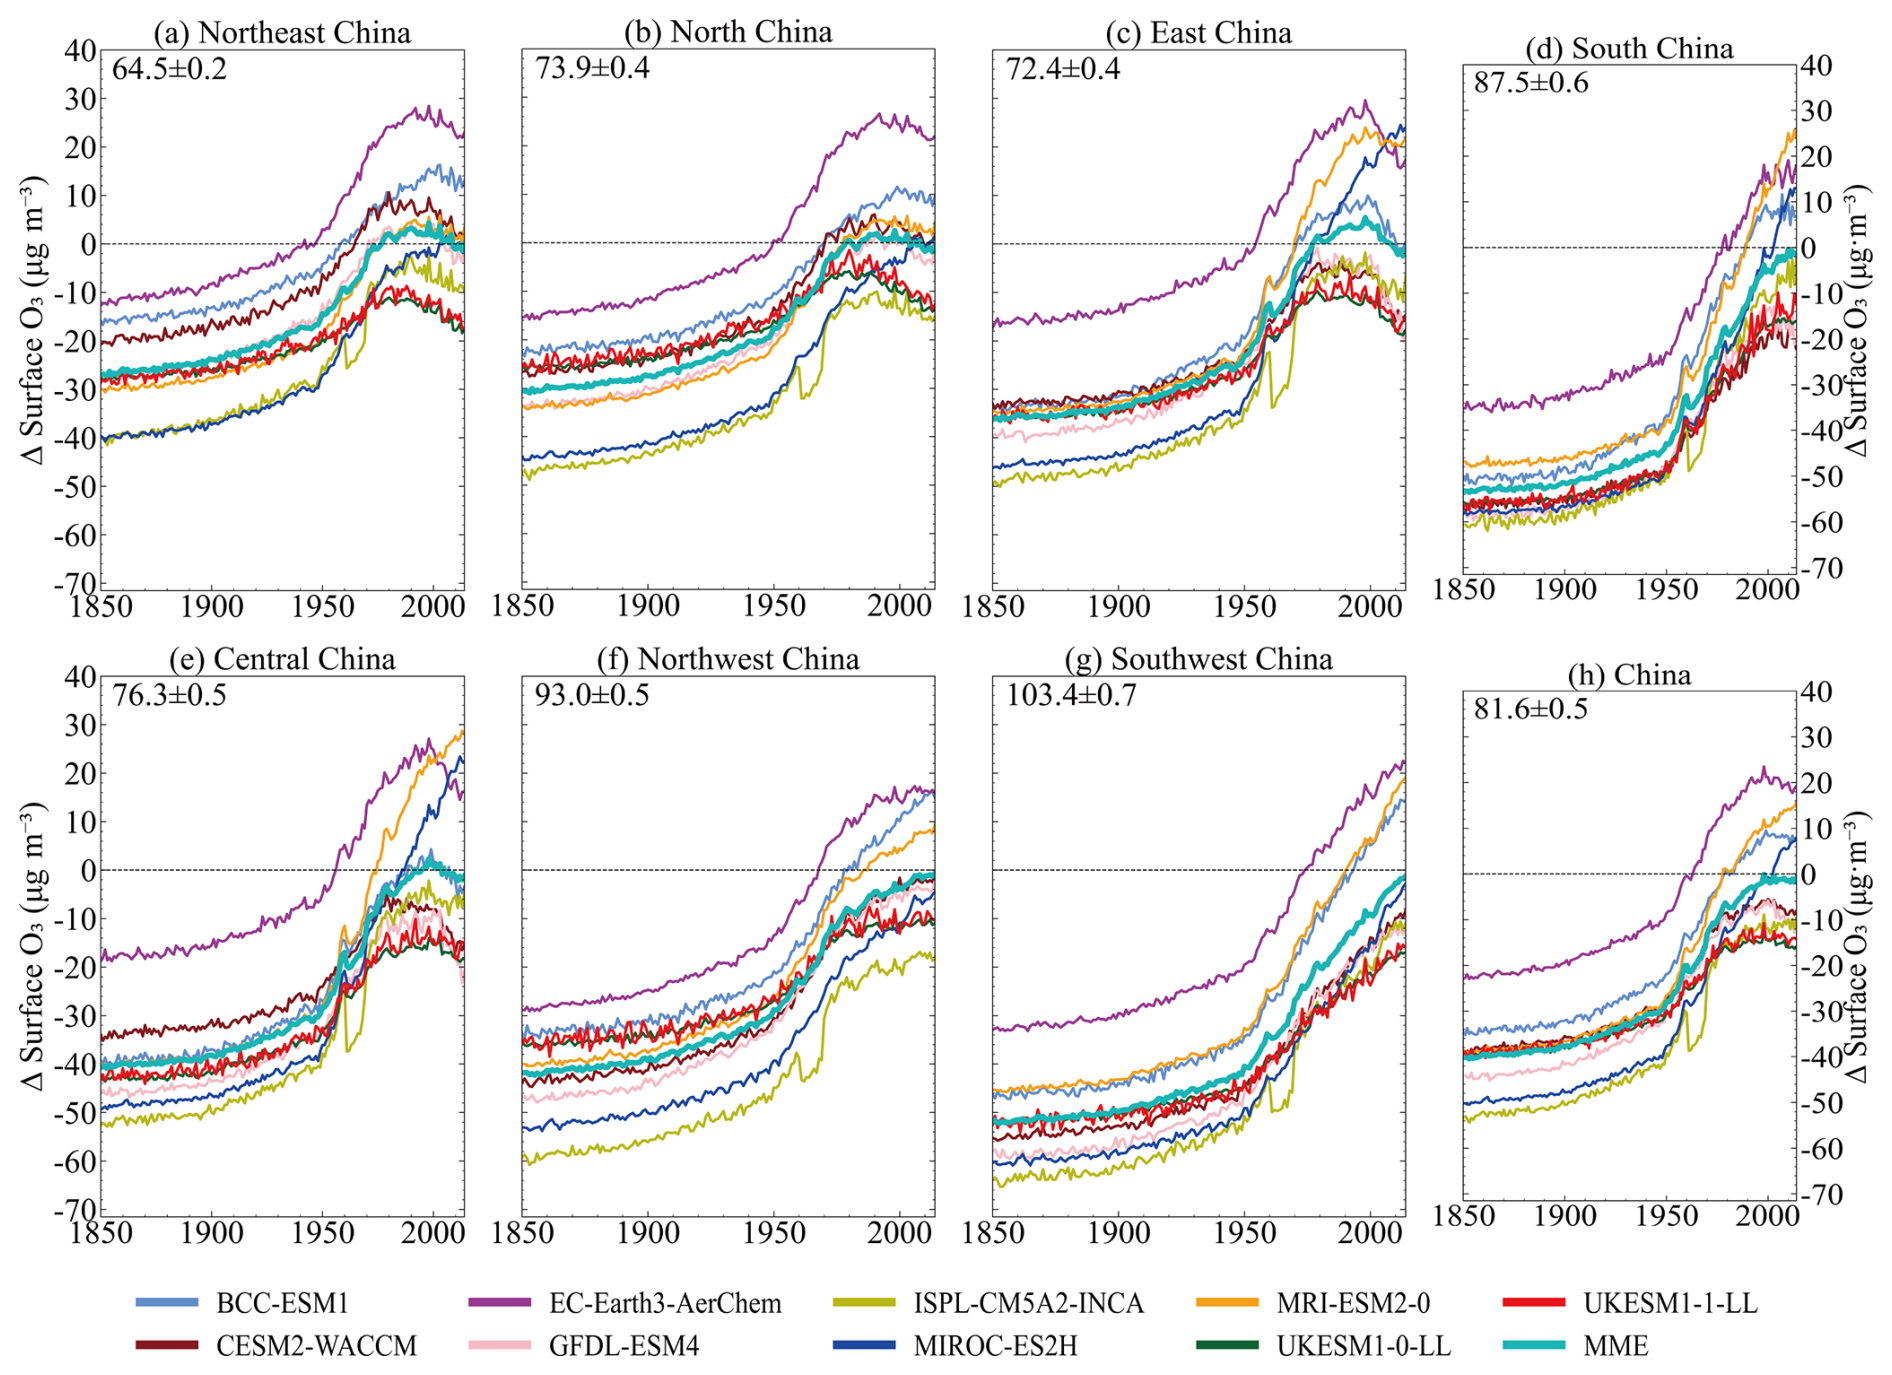
Figure 10Changes in the China and sub-regions annual mean surface O3 concentrations from the pre-industrial period to present day, relative to a 2015–2023 mean value, across nine CMIP6 models and MME. The multi-model annual mean 2015–2023 surface O3 concentrations (±1 SD) are shown in the top left of each panel.
The simulated historical changes in surface O3 concentrations across China show substantial regional and inter-model variations. For instance, UKESM1-0-LL simulates the smallest increase (most notably in Northeast China), whereas MIROC-ES2H simulates the largest (particularly in Central China), followed by MRI-ESM2-0 and BCC-ESM1. Although UKESM1-0-LL shows a minimal surface O3 response, it projects a larger historical increase in tropospheric O3 burden compared to other CMIP6 models (Griffiths et al., 2021). Moreover, the simulated historical changes in surface O3 from UKESM1-0-LL are comparable to those from the HTAP_param (an emission-only-driven model), indicating that the magnitude of change simulated by UKESM1-0-LL is similar to that solely from changes in precursor emissions (Turnock et al., 2020). This implies that UKESM1-0-LL may exhibit relatively weak contributions from non-emission-driven processes (e.g., chemistry-climate interactions) compared with other CMIP6 models.
Central China exhibits the largest discrepancies in historical surface O3 changes among the CMIP6 models, with the maximum inter-model difference reaching 29.6 µg m−3. This pronounced inter-model spread can be understood in light of previous findings. As highlighted by Turnock et al. (2020), such variability in CMIP6 surface O3 responses primarily arises from two factors: (i) differences in the simulated 1850 baseline O3 concentrations, and (ii) differences in regional O3 trend rates, reflecting model-dependent chemical sensitivities to precursor emissions, particularly the nonlinear O3-NOx relationship. These mechanisms provide a consistent explanation for why models such as MIROC-ES2H simulate much stronger historical increases in surface O3 than models like UKESM1-0-LL. Importantly, inter-model differences in chemical sensitivity extend beyond the response to NOx alone, encompassing the treatment of other precursors and, critically, aerosol-chemistry interactions. In Central China, precisely where the inter-model spread is greatest, large historical changes in PM2.5 concentrations (Su et al., 2022) may further modulate O3 formation by influencing heterogeneous radical loss on aerosol surfaces. This aerosol modulation effect is likely most pronounced during seasons characterized by high PM2.5 loadings and weak photochemical activity (e.g., winter), when reduced solar radiation and enhanced atmospheric stability may amplify the impact of aerosol-related processes on surface O3.
In summary, the substantial inter-model spread in historical surface O3 trends over China since 1850 reflects a combination of uncertainties associated with the pre-industrial baseline state and model-dependent chemical sensitivities. These sensitivities extend beyond precursor emissions alone, encompassing differences in chemical mechanisms and aerosol-chemistry interactions, which can further modulate regional O3 responses. This highlights the need for future multi-model attribution and constraint-based approaches to explicitly disentangle baseline-related uncertainty from process-level representation differences.
5.1 Projected trends under different SSP scenarios
Figure 11 shows the future changes in surface O3 concentrations across China and its sub-regions under different CMIP6 scenarios (relative to the 2015–2023 mean). Overall, it is projected that by 2100, surface O3 concentrations in China will decrease in most scenarios, with sub-regions responding similarly to the national trend, though with varying magnitudes (Fig. 12). In the Tier 1 experiment, under the SSP1-2.6 scenario, which involves low radiative forcing, strong climate mitigation, and significant air pollution reduction, Surface O3 concentrations in China are projected to decrease relative to the 2013–2024 annual mean, by 12.6 ± 3.1 µg m−3 (±1 SD of the MME), corresponding to a reduction of approximately 16 % by 2050, and by 25.3 ± 7.2 µg m−3, corresponding to a reduction of approximately 32% by 2100. Due to substantial reductions in precursor emissions, a decrease in CH4 concentrations, and relatively small climate changes, under this scenario, surface O3 concentrations in all sub-regions also show significant declines. Projections indicate that by 2100, surface O3 concentrations in the Southwest and South China regions will decrease by more than 30 µg m−3, while in East China, which experiences the smallest reduction, O3 concentrations will still decrease by nearly 20 µg m−3.
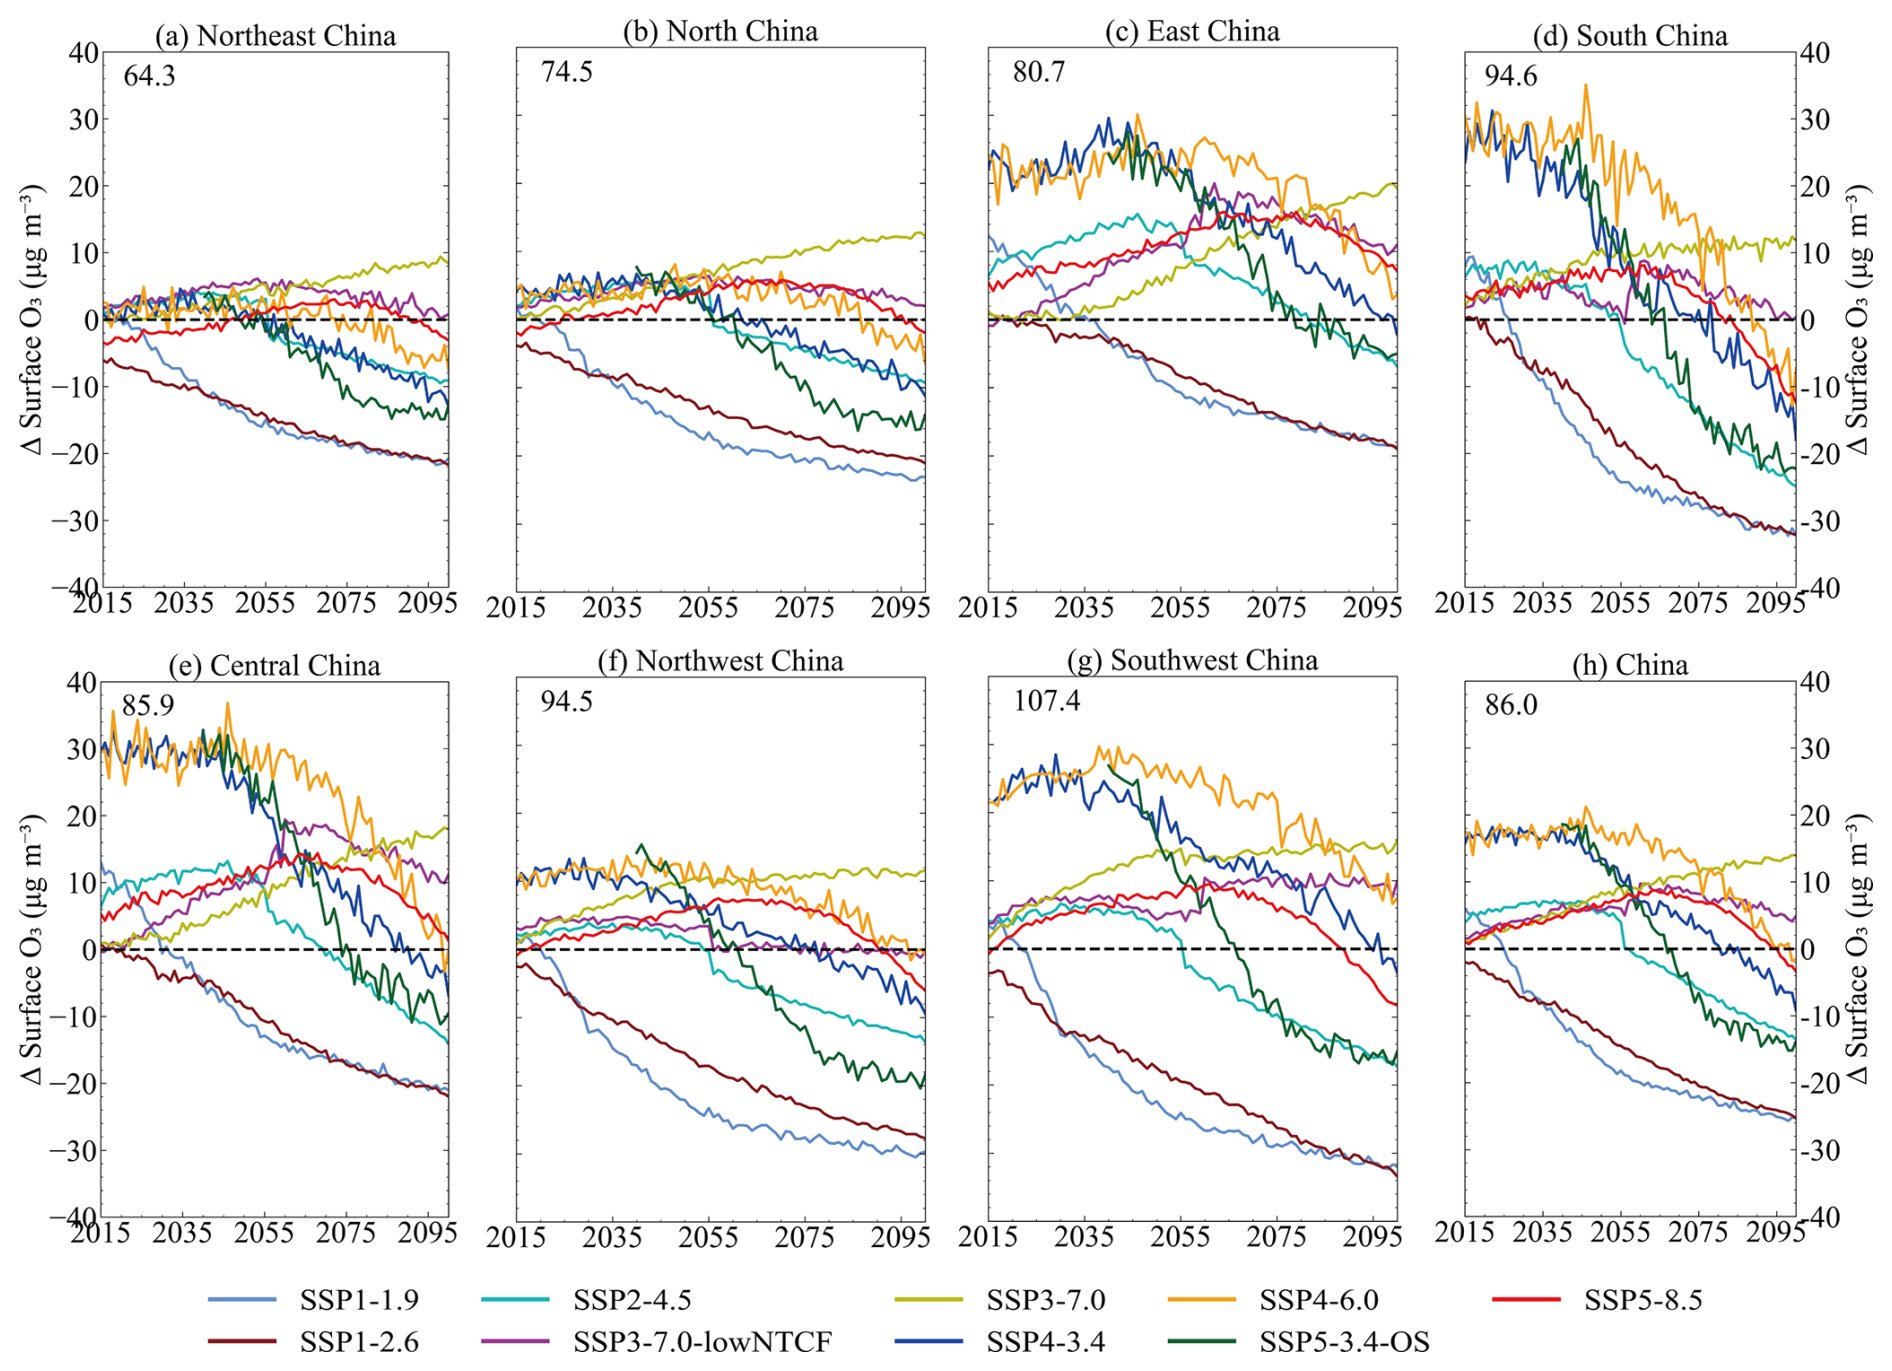
Figure 11Future China and sub-regions changes in annual mean surface O3 under different CMIP6 SSP scenarios. The dashed black line represents the curve of the difference at zero. For the Tier 2 scenarios (SSP4-3.4, SSP4-6.0, and SSP5-3.4-OS), O3 data are available only from MRI-ESM2-0. As MRI-ESM2-0 simulates higher O3 over most regions of China compared to the MME, these scenarios show larger initial deviations in the national panel and in some regions. The multi-model regional mean for 2015–2023 is shown in the top-left corner of each panel.
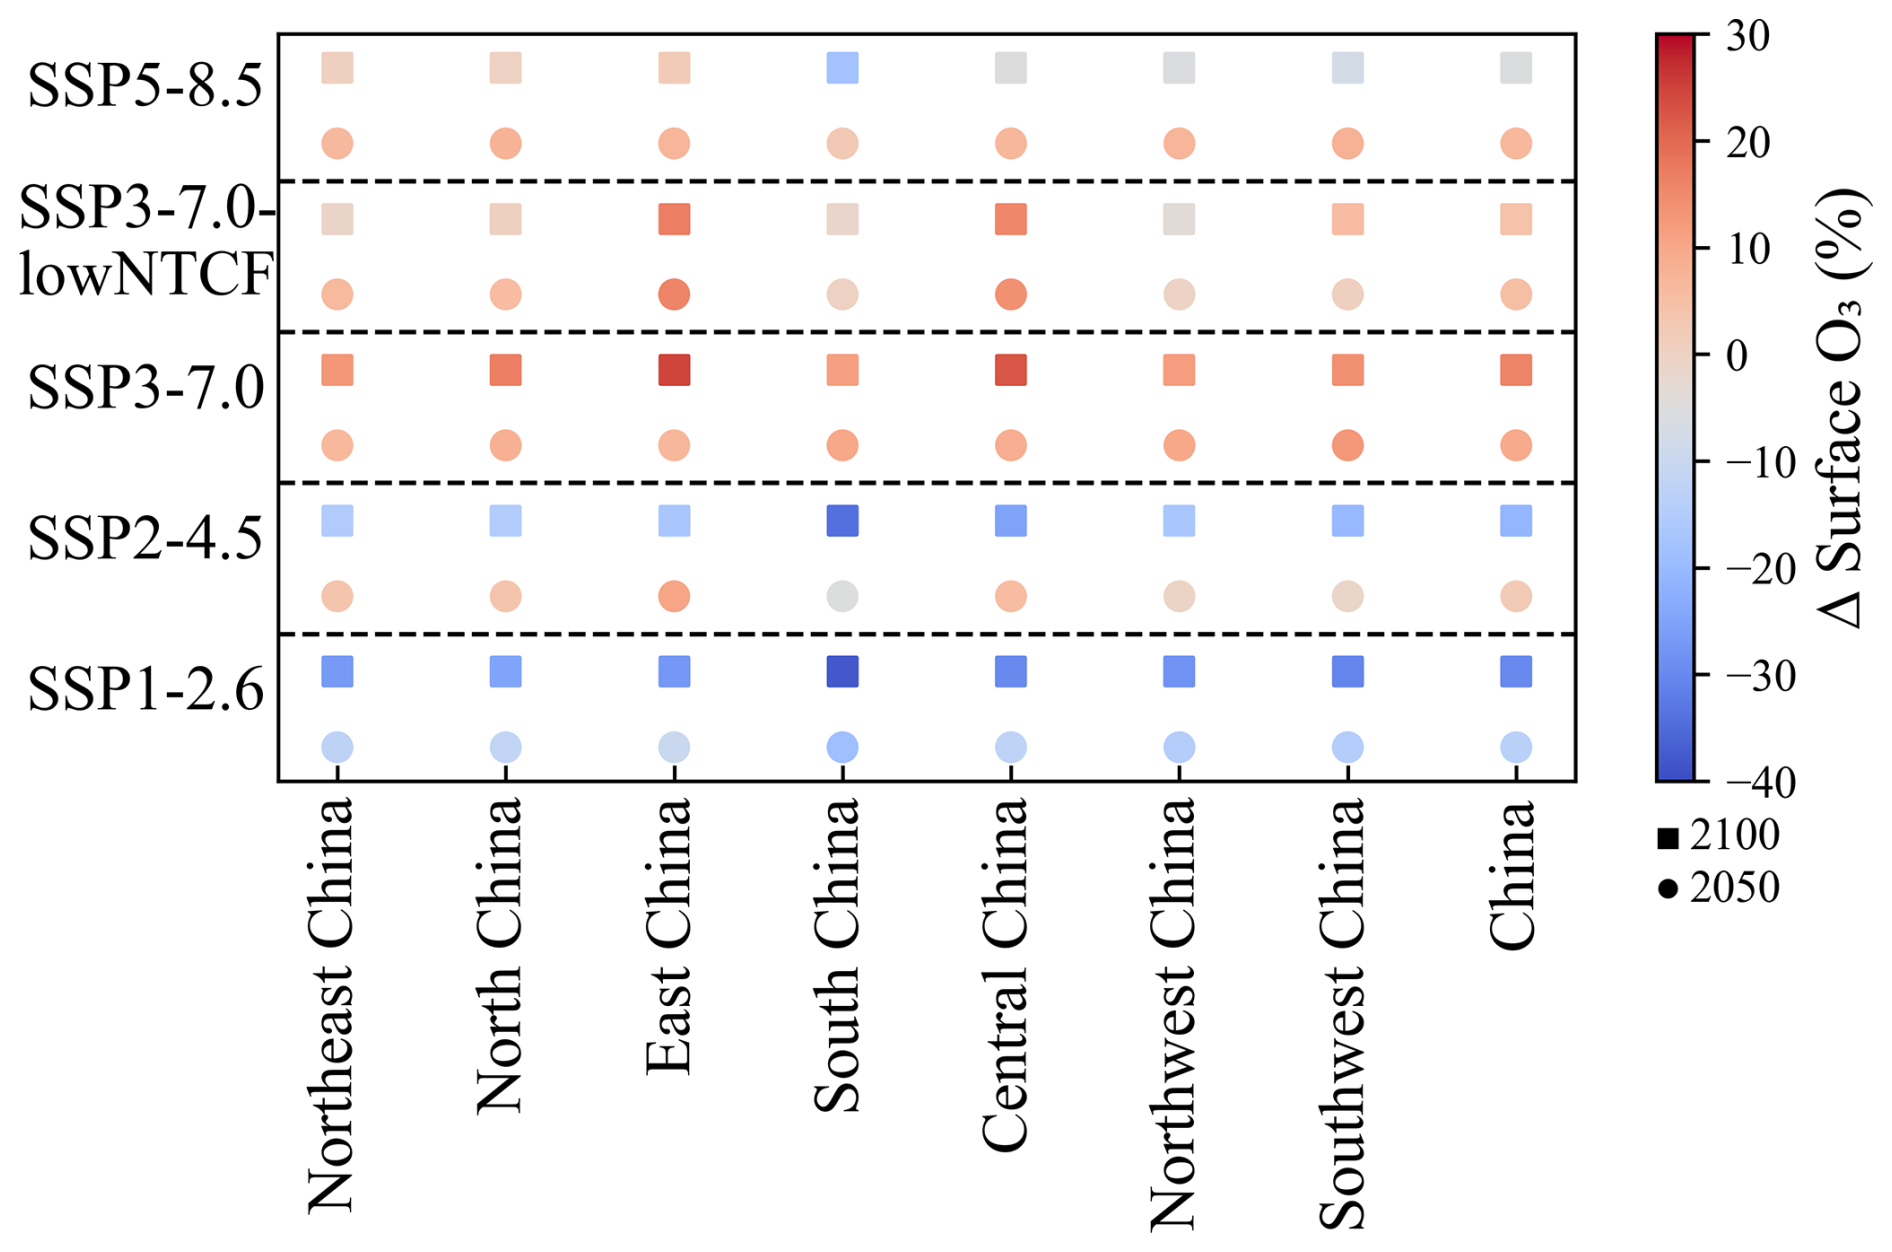
Figure 12Percentage change in 2050 (circles) and 2100 (squares), relative to 2015, for annual mean of O3 across China and sub-regions in the four Tier 1 future CMIP6 scenarios and the SSP3-7.0-lowNTCF scenario.
For the medium forcing SSP2-4.5 scenario, it is projected that by 2100, the annual mean surface O3 concentration in China will decrease by 13.6 ± 7.2 µg m−3, corresponding to a reduction of 17 %. Meanwhile, the projections indicate that the annual mean surface O3 concentrations in all sub-regions of China will experience a slight increase around 2055 relative to the 2015–2023 mean, after which they begin to decrease. The most significant decrease occurs in South China, where it may reach 24.5 µg m−3 by 2100. This behavior is primarily driven by enhanced control of precursor emissions, relatively moderate climate changes, and variations in CH4 concentrations. This mid-century rise is consistent with previous CMIP6 assessments, which show that under SSP2-4.5, precursor emissions decline only gradually while climate warming and photochemical activity increase rapidly before mid-century. As a result, climate-driven O3 enhancement can temporarily offset emission-driven declines, leading to a short-term increase around 2055 (Gidden et al., 2019; Turnock et al., 2020).
In the SSP3-7.0 scenario, due to weak climate mitigation and weak air pollutant reduction, the annual mean surface O3 concentration in China is projected to increase by 8.4 ± 2.0 µg m−3 by 2050, and increase by 13.9 ± 4.0 µg m−3 by 2100, with an increase of 17 %. In this scenario, the annual mean surface O3 concentrations in all seven sub-regions show an upward trend, with the largest increase in East China, where the concentration is expected to rise by 19.3 ± 6.9 µg m−3 by 2100, with an increase of 27 %. Although emissions of O3 precursors such as NOx are projected to start decreasing around 2040 (Fig. S3), the surface O3 concentrations in all sub-regions continue to increase, indicating the importance of changes in chemical composition, increasing CH4 concentrations, and climate change in the simulation of surface O3 under the SSP3-7.0 scenario (Turnock et al., 2020; Young et al., 2013; Li et al., 2019). Additionally, the projected differences among CMIP6 models are most pronounced over Central and East China, with secondary hotspots of model spread also evident over Southwest and South China, indicating some divergence in the model simulations of O3 across these regions.
In the SSP3-7.0-lowNTCF scenario, additional measures targeting non-methane short-lived climate forcers (SLCFs), including aerosols and O3 precursors, are implemented on top of the baseline SSP3-7.0 scenario. These measures are primarily aimed at improving air quality, without additional CO2 or long-lived greenhouse gas mitigation (Allen et al., 2020). Reductions in SLCFs may slightly affect climate through changes in aerosol radiative effects. Consequently, the projections show that under the SSP3-7.0-lowNTCF scenario, the increase in surface O3 concentrations in China is slower than in the SSP3-7.0 scenario, with relatively lower concentrations. By 2050, the annual mean surface O3 concentration in China is projected to increase by only 5.8 ± 1.5 µg m−3, and by 2100, it will increase by 4.9 ± 2.0 µg m−3, representing a 6 % increase. In this scenario, by 2100, surface O3 concentrations in China and most of its sub-regions are expected to return to or be close to the 2015–2023 levels (especially in Northwest China), showing a significant improvement in surface O3 pollution compared to the SSP3-7.0 scenario. However, compared to other regions of the world, the additional reduction in precursor emissions under the SSP3-7.0-lowNTCF scenario has a relatively small impact on improving surface O3 pollution in China. This is mainly due to the increase in surface O3 concentrations in eastern China (especially in Central and Eastern China). This increase is caused by a slight rise in NMVOC emissions and a reduction in O3 titration due to a significant decrease in NOx emissions (Turnock et al., 2020). Additionally, the decrease in PM2.5 concentrations under the SSP3-7.0-lowNTCF scenario leads to a reduction in the heterogeneous loss of free radicals, which may also contribute to the rise in surface O3 concentrations (Li et al., 2019).
In the SSP5-8.5 scenario, characterized by high radiative forcing, weak climate mitigation, and only limited air pollutant controls (Rao et al., 2017), the annual mean surface O3 concentration in China is projected to increase by 6.3 ± 1.6 µg m−3 by 2050. However, by 2100, the surface O3 concentration is expected to decrease by 3.4 ± 2.9 µg m−3 relative to the 2013–2024 mean, a reduction of approximately 4.2 %. The projected changes in surface O3 concentrations for the sub-regions in this scenario are similar to those in the SSP3-7.0-lowNTCF scenario (with a correlation of up to 0.7), despite differences in the underlying emissions and radiative forcing between the scenarios. By 2050, the surface O3 concentration in most sub-regions will increase slightly faster in the SSP5-8.5 scenario than in the SSP3-7.0-lowNTCF scenario (except for Northeast and North China), but slower than in the SSP3-7.0 scenario (except for Central and East China). This may be attributed to the different changes in CH4 emissions under different scenarios. Additionally, more CMIP6 model data are available for the SSP3-7.0 scenario (9 models) compared to the SSP5-8.5 scenario (4 models), which may also influence the MME response.
Under the Tier 2 experiment, the SSP1-1.9 scenario, characterized by the strongest climate mitigation and the most stringent air pollutant controls, leads to substantial reductions in surface O3 levels over China. By 2050, the annual mean surface O3 concentration is projected to decrease by 16.6 ± 7.1 µg m−3, and further decline to 25.3 ± 9.5 µg m−3 by 2100, corresponding to an overall reduction of approximately 32 %. This pronounced decline is primarily driven by the large-scale and coordinated reductions in NOx and VOCs under this scenario, which markedly suppress the photochemical production of O3. Meanwhile, although climate-induced changes and concurrent PM2.5 reductions can also influence O3 through complex atmospheric chemical and physical processes, the dominant effect of precursor emission reductions ultimately leads to a substantial overall improvement in surface O3 air quality under SSP1-1.9.
Under the SSP4-3.4 and SSP4-6.0 scenarios, which are characterized by regionally uneven climate mitigation and air pollutant reductions, the surface O3 concentration in China is projected to increase by 13.5 ± 1.3 and 18.3 ± 1.4 µg m−3 by 2050, respectively. By 2100, the concentrations under these scenarios are expected to decrease by 9.2 ± 8.3 and 1.6 ± 5.9 µg m−3, respectively. In contrast, SSP5-3.4-OS is an overshoot scenario, its radiative forcing pathway is designed to temporarily exceed the 3.4 W m−2 level mid-century before declining back to that target by 2100. This pathway involves substantial late-century mitigation efforts, which also lead to reductions in air pollutant emissions as part of the broader deep-decarbonization strategy. Under this scenario, surface O3 increases by 12.6 ± 1.6 µg m−3 by 2050, comparable to the responses under the moderate-mitigation pathways. However, following the overshoot and the subsequent implementation of stringent mitigation, O3 concentrations decline markedly by 2100, with a projected reduction of 13.9 ± 11.7 µg m−3, the largest decrease among the three scenarios. This comparison highlights that although near-term O3 increases across all three scenarios due to climate change and evolving precursor emissions, sustained and ambitious emission controls, particularly those implemented after an overshoot, as in SSP5-3.4-OS, can ultimately produce substantial long-term reductions in surface O3, improving air quality and mitigating associated climate impacts.
In summary, projections from the CMIP6 models suggest that mitigating surface O3 pollution across China will require not only reducing greenhouse gas emissions to moderate future climate change but also implementing enhanced controls on O3 precursor emissions (including CH4). Under scenarios with pronounced climate change impacts, such as SSP3-7.0 and SSP5-8.5, the stringency of controls on key O3 precursors, particularly NMVOCs and NOx, beyond 2050 is expected to lead to divergent regional responses in long-term surface O3 trends.
5.2 Model spread and its drivers under the SSP3-7.0 scenario
Since the number of available CMIP6 models is the greatest under the SSP3-7.0 scenario (Table 1), this paper conducts a comparative analysis of the changes in surface O3 concentrations across China and its sub-regions under the SSP3-7.0 scenario, aiming to identify the potential causes of model discrepancies. Figure 13 illustrates the changes in the annual mean and seasonal mean surface O3 concentrations in China and its sub-regions for the years 2050 (2045–2055 mean) and 2095 (2090–2100 mean) relative to the 2015–2023 mean baseline, based on different CMIP6 models under the SSP3-7.0 scenario. O3 is not directly emitted into the troposphere but is produced through photochemical oxidation of CO, CH4, and NMVOCs in the presence of NO and NO2. The abundance of tropospheric O3 is determined by its budget, which includes chemical production, stratospheric transport, chemical loss, and deposition to the surface (Lelieveld and Dentener, 2000), and the intensity of these processes is highly sensitive to current climate conditions and the emissions and distribution of O3 precursors (including NOx, NMVOCs, CH4, etc.). Therefore, this study further analyzes the correlation between future annual mean surface O3 concentrations under the SSP3-7.0 scenario and other variables, including CH4 concentrations, Near-Surface Air Temperature (TAS), NOx concentrations, total emissions of NMVOCs and BVOCs (Fig. 14).
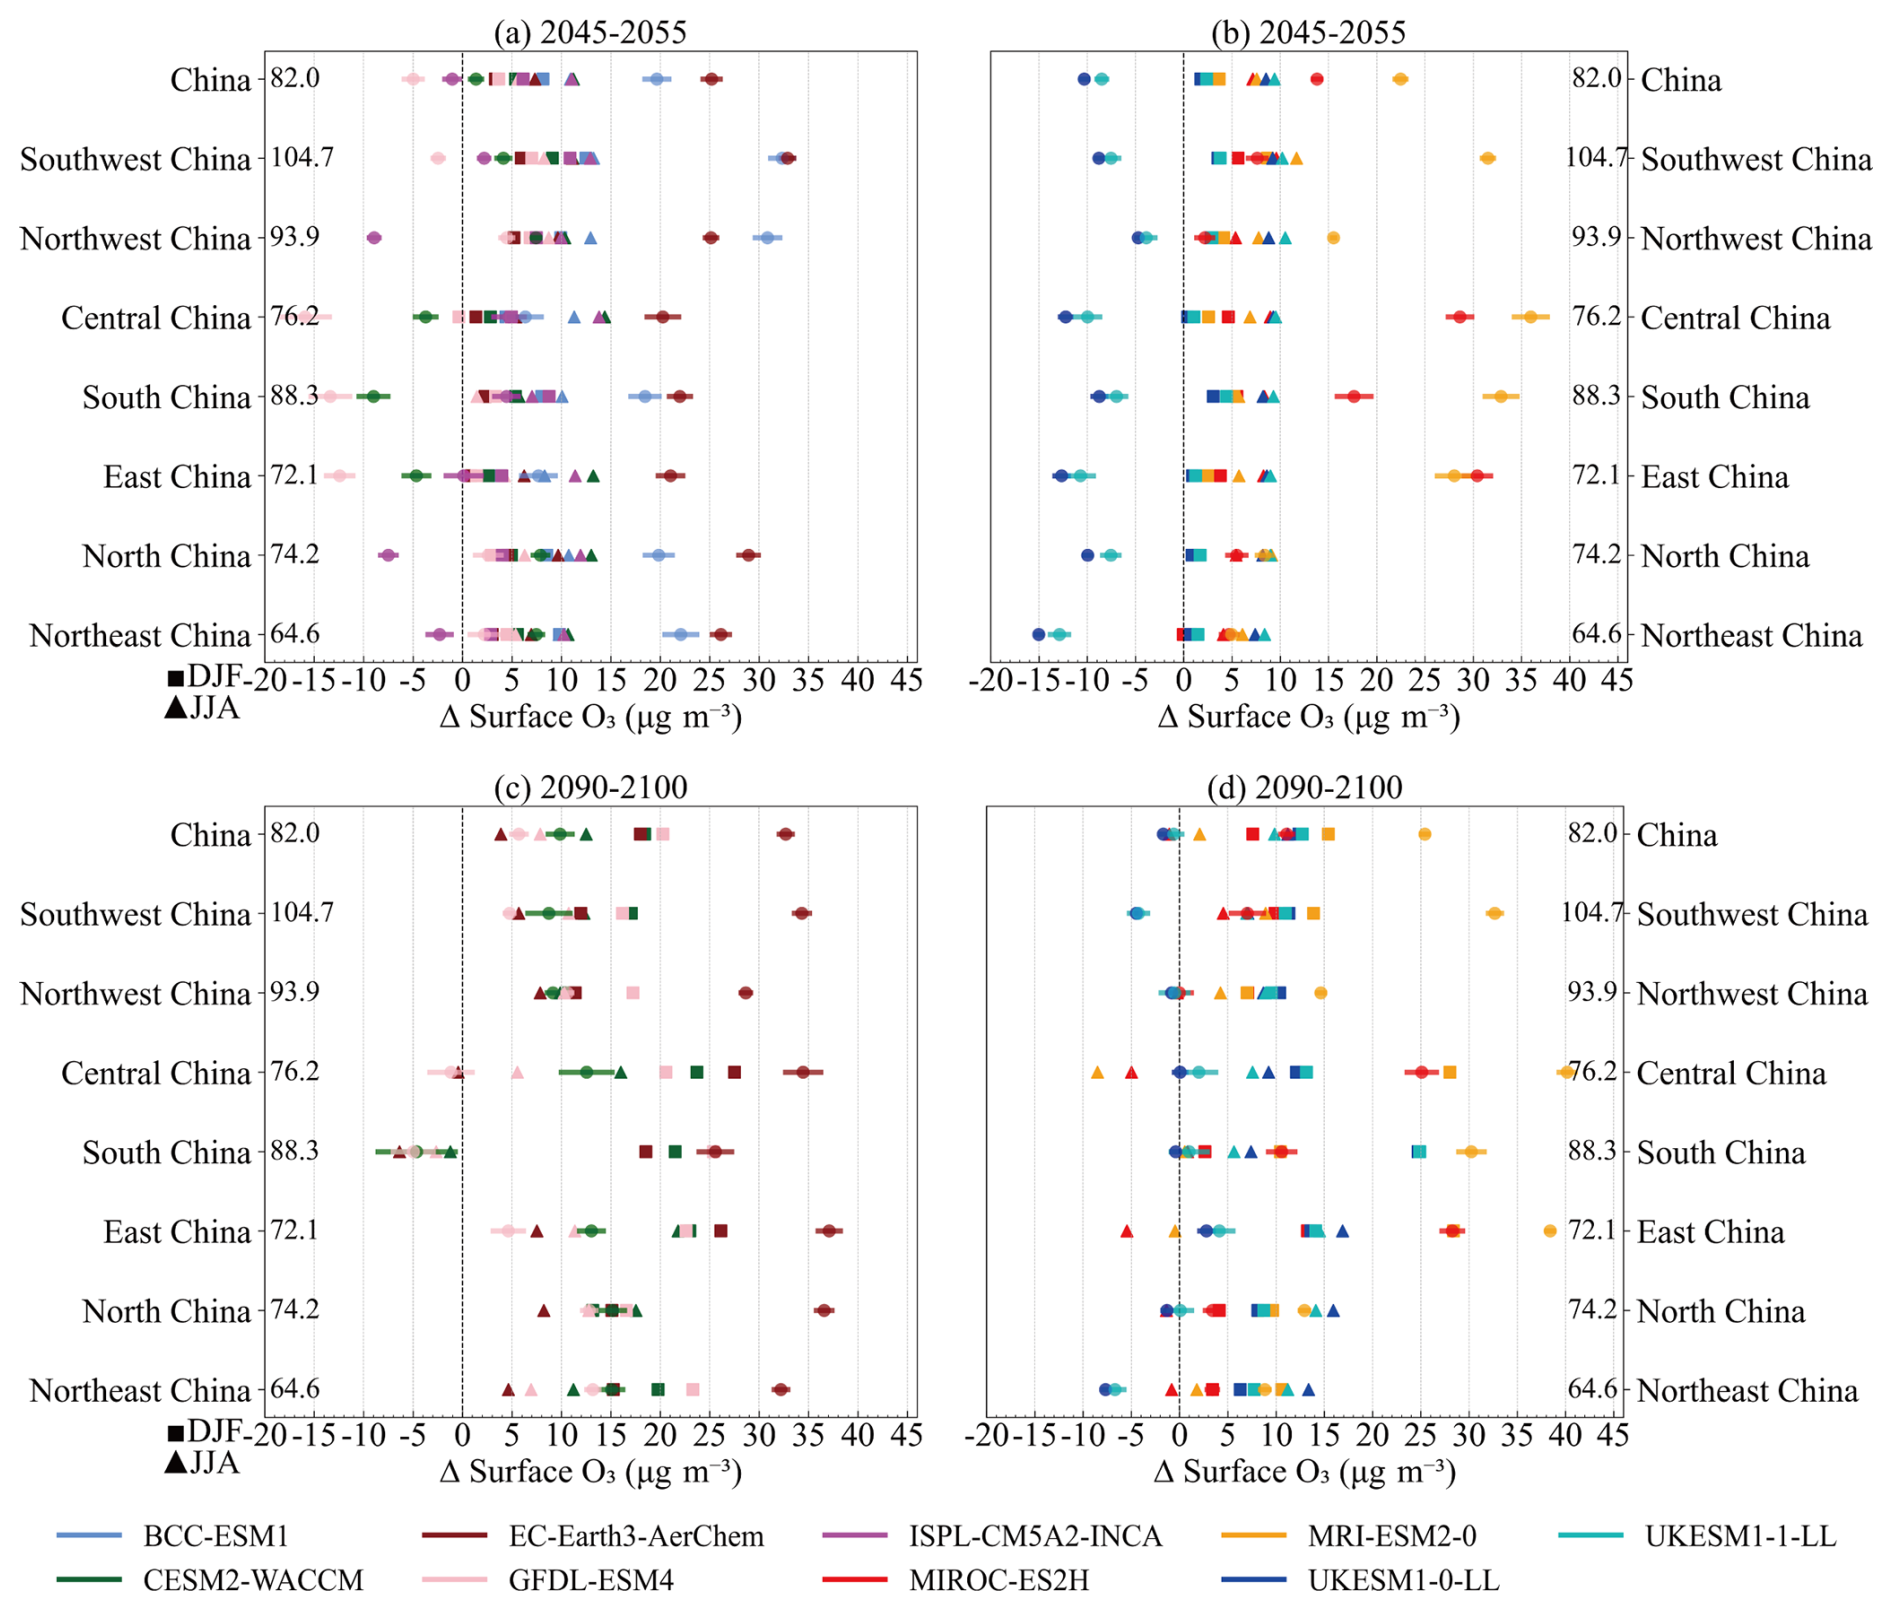
Figure 13Changes in the annual and seasonal mean surface O3 in China and its sub-regions, relative to the 2015–2023 mean, for the SSP3-7.0 scenario used in CMIP6. Each coloured circle represents the annual mean response for an individual model in (a) and (b) for 2045–2055, and in (c) and (d) for 2090–2100, with the coloured bars showing the SD across the annual mean. The seasonal mean responses for DJF and JJA, averaged over the relevant 10-year periods, are shown by squares and triangles, respectively. The multi-model regional mean for the 2015–2023 period is shown on the left of each panel.
It can be observed that surface O3 concentrations predicted by different CMIP6 models under the SSP3-7.0 scenario exhibit significant regional discrepancies. In particular, in Central China, the O3 concentrations predicted by MRI-ESM2-0 and EC-Earth3-AerChem are nearly twice as high as those predicted by UKESM1-0-LL and GFDL-ESM4 (Fig. S2). The lower annual mean O3 concentrations in Central China for UKESM1-0-LL and GFDL-ESM4 are primarily attributed to higher NOx emissions under the SSP3-7.0 scenario. In this region, NOx emissions are approximately 2–3 times higher than those in the other two models (Fig. S2), which likely triggers NOx titration and results in lower simulated surface O3 concentrations. These inter-model differences in NOx emissions arise because CMIP6 models use emission inputs derived from different source datasets and processing chains. Each modeling center applies its own downscaling, sectoral allocation, and harmonization procedures to the SSP scenarios, which can lead to notable regional discrepancies even when following the same narrative. In contrast, in MRI-ESM2-0 and EC-Earth3-AerChem, NOx titration is rare during DJF. In addition, EC-Earth3-AerChem exhibits higher simulated CH4 concentrations (Fig. S4). Although CH4 forcing is prescribed and harmonized across CMIP6 models, inter-model differences in simulated CH4 concentrations and their impacts on surface O3 can still arise from differences in chemical mechanisms, particularly the representation of OH radical fields that control CH4 lifetime. Higher CH4 levels in EC-Earth3-AerChem therefore enhance tropospheric background O3 production, contributing to its relatively higher simulated O3 concentrations in Central China. These discrepancies highlight that, although the driving factors related to O3 changes (such as climate change and pollutant emissions) are crucial in all models (Fig. 14), the differences in precursor emissions (NOx and CH4) and chemical process responses between models in future scenarios with significant climate change have a substantial impact on regional O3 concentration predictions.
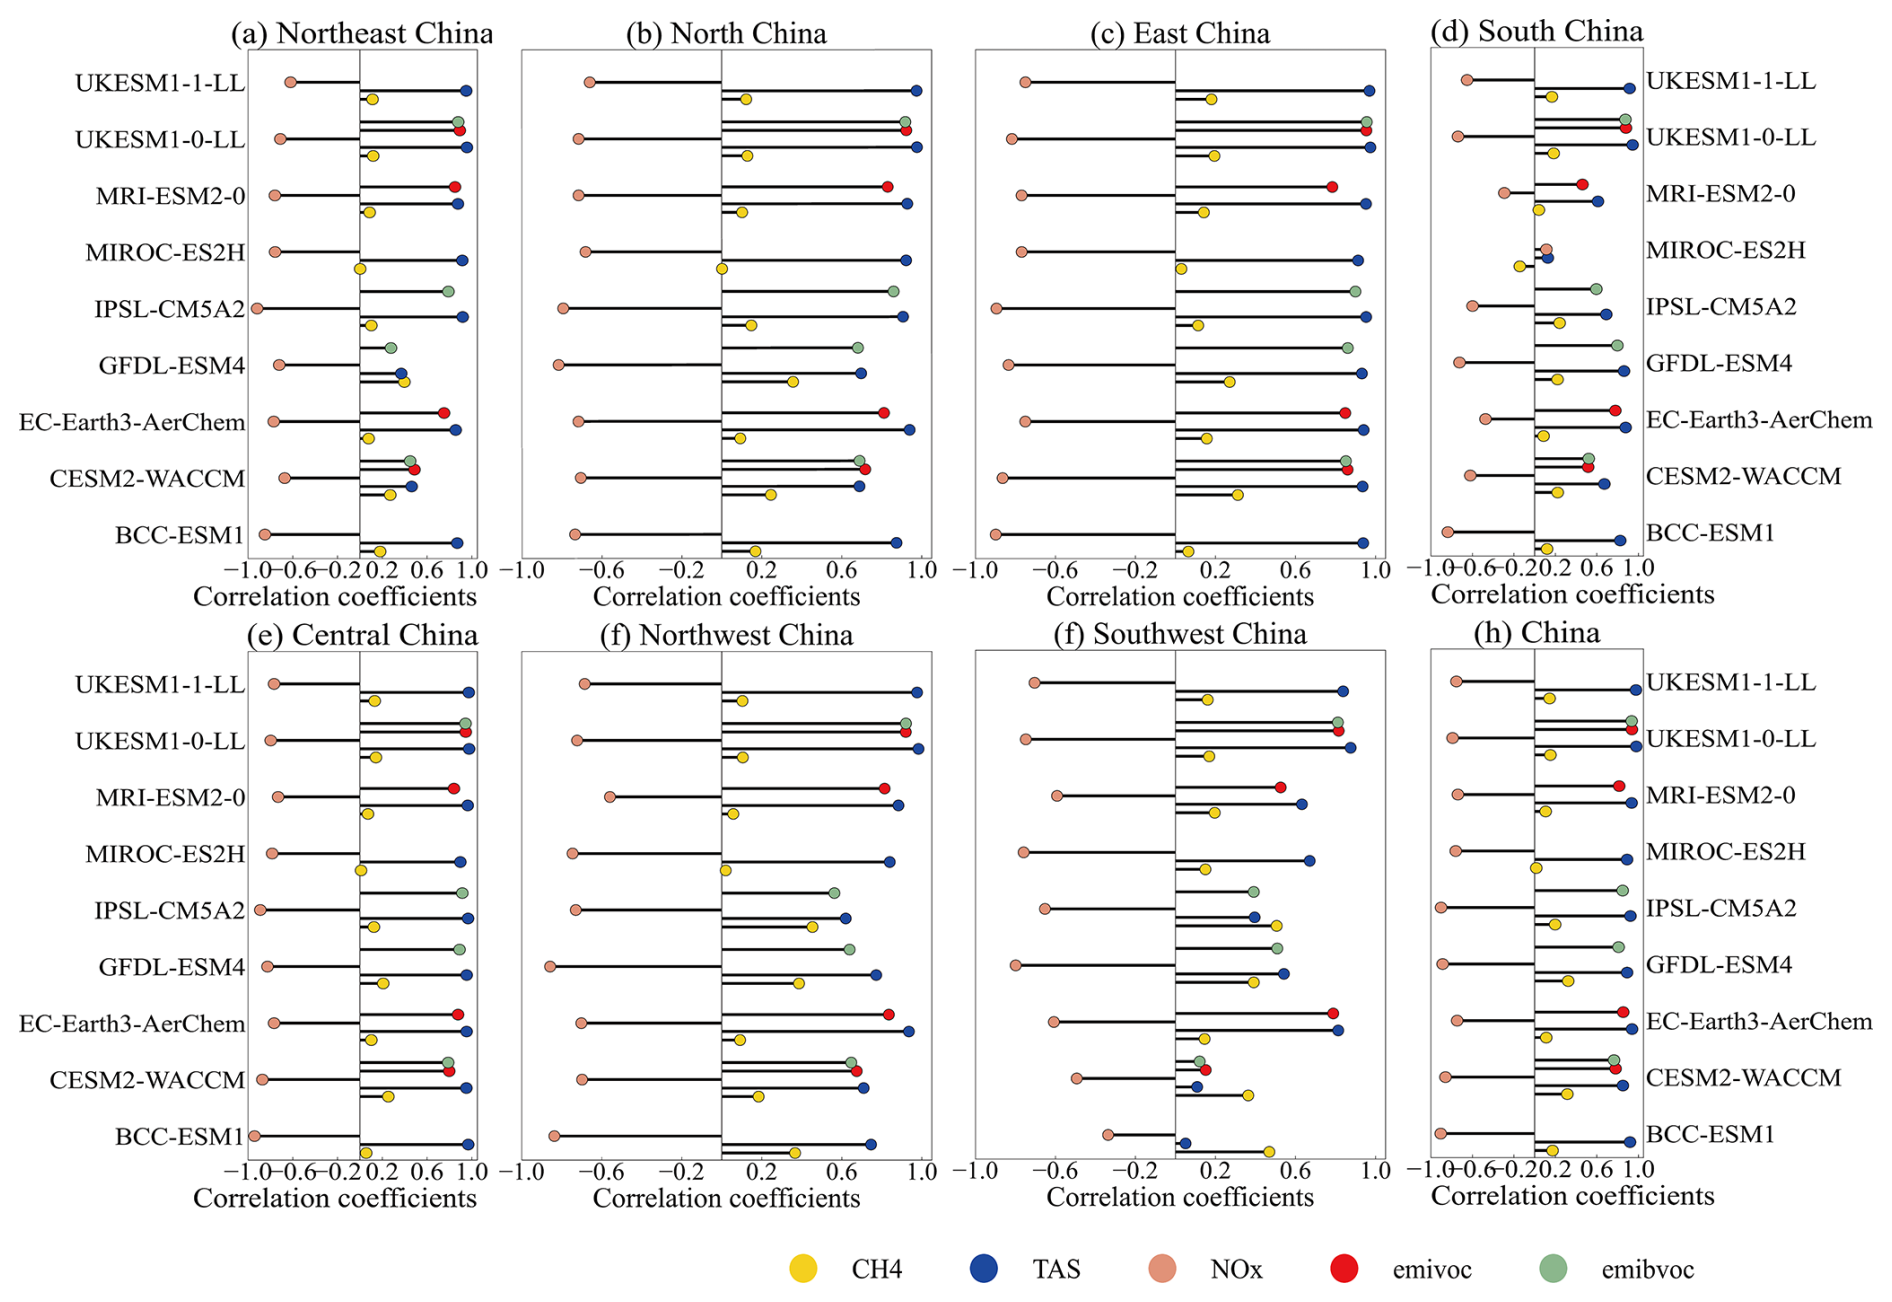
Figure 14Correlation coefficients calculated when comparing future annual mean surface O3 concentrations against individual variables of surface CH4 concentrations, temperature at Surface (TAS), emissions of NMVOCs and BVOCs, NOx (NO + NO2) concentrations and from individual CMIP6 models over the period 2015 to 2100 in the SSP3-7.0 scenario.
IPSL-CM5A2-INCA (predictions extending only to 2055) under the370 scenario, which projects that by 2050, surface O3 concentrations in northern China (including Northeast, North, and Northwest China) will be lower than the 2015–2023 mean, with the most significant decrease expected in North China, where O3 concentrations are projected to drop by approximately 10 %. IPSL-CM5A2-INCA (ECS; 3.6 K) is a model with moderate equilibrium climate sensitivity, showing a moderate response to global temperature increases caused by greenhouse gases. The model simulates relatively high BVOC emissions during the 2015–2023 period (covering a broader range of BVOC types), with emissions approximately 4–8 times higher than those of other models (Fig. S5), and these emissions have shown a consistent upward trend. However, despite the increase in BVOC emissions, this model simulates relatively low NOx concentrations and surface TAS, resulting in a smaller increase in O3 concentrations, and even a decrease in some regions. This indicates that differences in the magnitude of climate change and O3 precursor (NOx) variations, as well as the different ways these factors are coupled in different CMIP6 models, lead to significant differences in the response of the models to BVOC emissions. Such differences could directly influence future surface O3 changes, particularly in localized regions.
CESM2-WACCM and GFDL-ESM4 under the SSP3-7.0 scenario, on the other hand, predict that by 2050, surface O3 concentrations in southern China (including East, Central, and South China) will be lower than the 2015–2023 annual mean, with the most significant decrease observed in South China, where O3 concentrations are projected to drop by 9 % and 13 % in the two models, respectively. Firstly, CESM2-WACCM (ECS; 4.7 K) and GFDL-ESM4 (ECS; 4.4 K) exhibit higher climate sensitivity, meaning that their projected temperature increase and water vapor increase are more significant. Higher temperatures and water vapor content facilitate the generation of OH radicals, which in turn accelerate O3 destruction reactions (Wild et al., 2020). In tropical and subtropical regions, where both temperature and water vapor are already high, the presence of these factors may further enhance the consumption of O3 by OH radicals, a phenomenon particularly evident in South China. Secondly, both models tend to simulate lower BVOC emissions (Fig. S5), with GFDL-ESM4 showing the lowest and virtually unchanged BVOC emissions under the SSP3-7.0 scenario, which may reduce the formation of O3. Furthermore, the pollutant emissions and atmospheric chemical processes in southern China differ from those in the north. The southern regions are likely more dependent on photochemical reactions, which are more active under higher temperatures and stronger solar radiation conditions. Therefore, CESM2-WACCM and GFDL-ESM4 may simulate a greater number of photochemical reactions, further accelerating O3 decomposition.
Under the SSP3-7.0 scenario, both UKESM1-0-LL and UKESM1-1-LL project decreases in surface O3 concentrations across China and its sub-regions by 2050 relative to the 2015–2023 annual mean, with the largest reductions of 23 % and 20 % respectively occurring in Northeast China. Although a moderate increase is projected by 2095, O3 concentrations remain below the 2015–2023 baseline in most regions, except East China. Compared to other CMIP6 models, UKESM1-0-LL (ECS; 5.4 K) and UKESM1-1-LL (ECS; 4.2 K) exhibit higher climate sensitivities. The elevated temperatures (Fig. S7) and altered climatic conditions in these models likely enhance O3 degradation, contributing to the generally lower O3 concentrations in their simulations. Moreover, UKESM1-0-LL simulates higher atmospheric NOx levels, promoting NOx titration that suppresses O3 formation. This model also projects higher NMVOC emissions (Fig. S6). Under high-NOx conditions, the interplay between NOx and NMVOCs can modify photochemical O3 production pathways, further inhibiting net O3 formation (Jiménez and Baldasano, 2004; Xing et al., 2011). To further investigate this mechanism, we constructed a two-dimensional framework based on ground observations, analyzing O3 distribution across China within the NO2-NMVOCs space (Fig. 15). Results indicate that the highest O3 levels occur under moderate NO2 (20–40 µg m−3) and elevated NMVOCs (> 500 t month−1) conditions, reflecting a typical VOC-limited O3 formation regime. In such environments, abundant NMVOCs coupled with relatively low NOx levels promote efficient photochemical O3 production. However, when NO2 concentrations reach 60–120 µg m−3, O3 decreases significantly even at intermediate-to-high NMVOCs, indicating strong inhibition of O3 formation by excess NOx. It is important to note that the O3 formation regime depicted in Fig. 15 is derived from present-day observations and should be regarded as a diagnostic reference rather than a fixed projection of future atmospheric chemistry. CMIP6 multi-model simulations under SSP3-7.0 project that NOx emissions increase from 2015 and peak around 2035 before gradually declining to near 2015 levels by 2065 (Fig. S3), while NMVOC emissions continue a modest upward trend throughout the century (Fig. S6). These projections suggest that many regions in China could remain in or near the high-NOx suppression regime during the first half of the 21st century (around the NOx emission peak), where O3 formation could be inhibited by excessive NOx. As NOx emissions decline thereafter, the chemical environment is projected to gradually shift towards a regime more sensitive to NMVOCs, potentially approaching VOC-limited conditions, where O3 production becomes increasingly dependent on NMVOCs levels. Regional variations in the relative reduction rates of NOx and NMVOCs are expected to further influence these transitions. These potential shifts highlight the need for adaptive, region-specific emission-control strategies that account for evolving chemical environments.
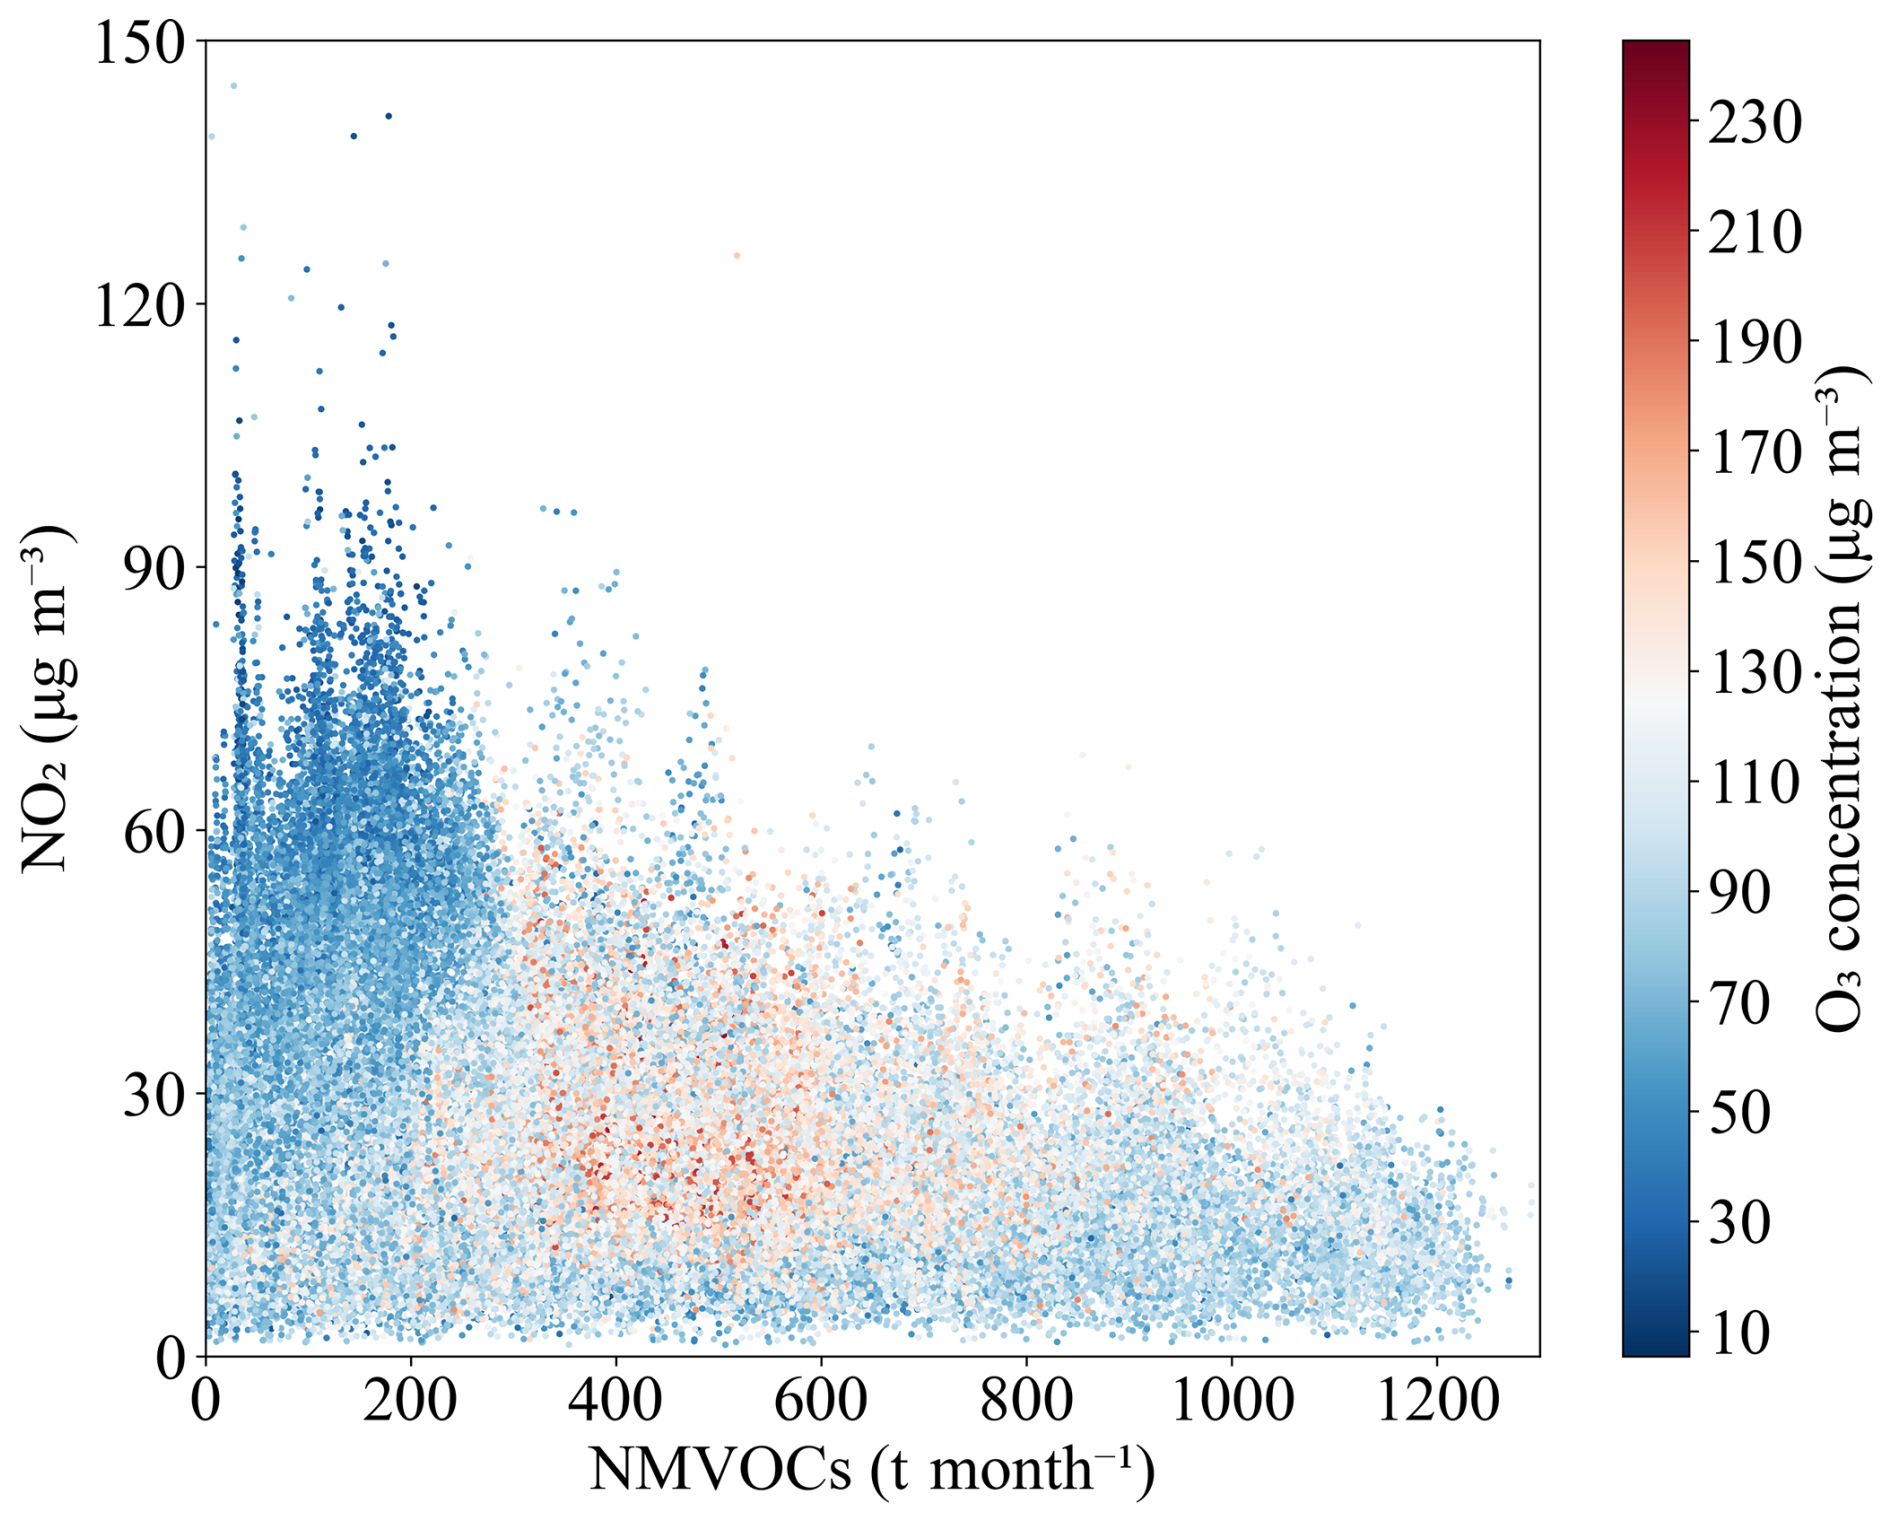
Figure 15Distribution of O3 concentration in the NO2-NMVOCs coordinate over China, based on 2015–2023 surface observations of NO2 and O3 and MME NMVOCs under the SSP3-7.0 scenario.
The projections of annual mean surface O3 concentrations for China and its sub-regions under the SSP3-7.0 scenario by BCC-ESM1 (ECS; 4.0 K, predictions extending only to 2055), EC-Earth3-AerChem (ECS; 3.0 K), MIROC-ES2H (ECS; 3.6 K), and MRI-ESM2-0 (ECS; 5.4 K) show significant consistency, with O3 concentrations in 2050 and 2095 both being higher than the 2015–2023 mean. Among these models, MIROC-ES2H and MRI-ESM2-0 exhibit higher climate sensitivity, although their projected NOx and CH4 concentrations are relatively low (Figs. S3–S4), they still tend to predict larger increases in O3 compared to the other models, with the most significant O3 increase observed in southern China (including East China, Central China, and South China). In contrast, BCC-ESM1 and EC-Earth3-AerChem predict more noticeable increases in O3 concentrations in northern China (including Northeast, North, Northwest, and Southwest China). EC-Earth3-AerChem, with a relatively low ECS, simulates lower NOx concentrations in China and its sub-regions, while its CH4 concentrations are the highest among the models (Fig. S4). Under low NOx conditions and a weak NOx titration effect, an increase in CH4 promotes O3 formation, leading to O3 accumulation and a more pronounced increase in simulated O3 concentrations in the model. BCC-ESM1, on the other hand, tends to simulate higher NOx concentrations and lower TAS (Figs. S3 and S7), which contributes to the more noticeable O3 increase predicted by this model.
The seasonal responses of different models under the SSP3-7.0 scenario also show variations across sub-regions. Most models predict that surface O3 concentrations increase more in JJA than in DJF. However, some regions exhibit a decreasing trend in O3 concentrations during JJA, which aligns with the findings of Turnock et al. (2020).
Figure 14 reveals that under the SSP3-7.0 scenario, the correlations between surface O3 and its driving variables show both consistent patterns across CMIP6 models and region-dependent variability. The robust negative O3–NOx correlation across all models provides quantitative evidence for the dominance of NOx titration in China over the study period (2015–2100). However, the magnitude of this correlation varies substantially (r= −0.92 in BCC-ESM1 over Central China and −0.11 in MIROC-ES2H over South China). This spectrum of correlation strengths is a key diagnostic of inter-model differences in representing O3 photochemistry. Specifically, the stronger negative correlations indicate that these models simulate a more extensive or persistent VOC-limited chemical regime under the SSP3-7.0 pathway. Consequently, the projected NOx declines within these models trigger a more complete relaxation of titration, resulting in a larger O3 increase.
The consistently strong positive O3-TAS correlation, with all models exceeding 0.85 over China as a whole and in most sub-regions, underscores climate warming as a dominant driver of future O3 trends. A clear exception is Southwest China, where most models simulate lower correlations, reinforcing the interpretation that non-thermal controls (e.g., the complex terrain of the Tibetan Plateau and international transport) play a unique role there. Against this backdrop of high consensus, models like UKESM1-0-LL, which sustain correlations > 0.9 across nearly all regions, likely simulate particularly efficient temperature-dependent processes (e.g., in BVOC emissions or peroxy radical chemistry), thereby projecting an amplified warming effect on O3.
Although a positive O3–CH4 correlation is a common feature across models, its highly variable strength highlights key uncertainties in how they represent methane's role. The MIROC-ES2H is a prominent outlier, simulating consistently weak and, in some regions, even negative correlations (r= −0.14 in South China). This, coupled with its atypical weak (or even positive) O3–NOx correlation in the same region, strongly suggests that O3 production in MIROC-ES2H is predominantly governed by the local interplay of NOx and VOCs, whose strong control effectively masks the influence of the global CH4 background. In contrast, model such as IPSL-CM5A2 (r= 0.51 in China) simulate a clear positive correlation, indicating that their frameworks allow methane oxidation chemistry to play a substantive and detectable role in future O3 production.
The strong but model-dependent O3-VOCs positive correlations provide further diagnosis of chemical regime representations. Models such as EC-Earth3-AerChem and UKESM1-0-LL show high sensitivity to both NMVOCs and BVOC emissions (with correlations often > 0.8), which is characteristic of a VOC-limited chemical regime. A particularly telling diagnostic is that in these models, O3 correlates more strongly with VOC emissions than with near-surface NOx concentrations. This pattern potentially reflects differences in the nonlinear chemistry of the VOCs-NOx-O3 system, as well as variations in the atmospheric lifetimes and transport of precursor species.
The differences in simulations between different CMIP6 models highlight the importance of further understanding how future O3 concentrations will be influenced by the combined effects of pollutant emissions (especially with regard to the differences in how O3 precursors, PM2.5, and other factors are coupled and how chemical processes respond across models) and climate change. For example, in the Central China region, the prediction differences between models are highly significant, with some models predicting O3 concentrations that could be twice as high as those of others. This discrepancy reflects the need for future research to focus more on model uncertainty in order to improve the reliability of future air quality projections.
This study provides a comprehensive evaluation of surface O3 over China using the CMIP6 multi-model ensemble, spanning present-day performance, historical evolution (1850–2014), and future projections under diverse scenarios. By synthesizing findings across these temporal scales, we offer an integrated perspective on model capabilities, key sources of uncertainty, and the implications for understanding past changes and future air quality. The principal insights are discussed below.
-
The CMIP6 MME reproduces the observed spatial and seasonal pattern of surface O3, with maxima in summer and over central China. However, a systematic underestimation prevails across most models and regions, particularly in eastern China. This bias is not random; rather, it tends to be modulated by environmental conditions: model error generally increases over urban surfaces and under high PM2.5 concentrations, revealing a complex, non-linear relationship especially in winter. Critically, these identified present-day biases are instructive for interpreting simulations of other periods. They point to persistent structural model limitations in key processes, particularly photochemical mechanisms and aerosol-chemistry interactions. Consequently, historical or future periods characterized by environmental conditions analogous to those linked with high bias today are likely subject to similar directional biases in simulated O3. Acknowledging and accounting for this transferable understanding of model bias can therefore help advance a more robust interpretation of both past changes and future projections.
-
The MME indicates a substantial increase of 39.3 ± 14.4 µg m−3 in China's annual mean surface O3 since 1850, with a marked acceleration post 1950. The large inter-model spread in this trend originates primarily from two factors highlighted in the literature: (i) differences in the simulated pre-industrial (1850) baseline concentrations, and (ii) divergent chemical sensitivities of O3 production to emission changes. This spectrum of sensitivity is clearly evident in our results: MIROC-ES2H exhibits high sensitivity and simulates the largest historical trend, whereas UKESM1-0-LL shows lower sensitivity, producing a trend most consistent with a direct, emission-driven response. The fact that the greatest model disparity occurs in Central China, a region also undergoing significant aerosol changes, further highlights the contribution of aerosol-chemistry interactions to the overall projection uncertainty.
-
Future surface O3 levels over China are governed by the complex interplay between air pollution control and climate mitigation. A pronounced decrease occurs under the strong co-mitigation scenario SSP1-2.6. In stark contrast, the high-forcing SSP3-7.0 pathway projects continuous O3 increases in many regions. Our analysis reveals that the common projection of a mid-century O3 peak followed by a decline can arise from two fundamentally different policy dominances: pathways where climate mitigation objectives are central (SSP2-4.5), and pathways where improvements are primarily driven by stringent air quality controls even under high climate forcing (SSP5-8.5). This underscores a critical insight: substantial O3 reductions are achievable under divergent socioeconomic futures, but they demand either deep coupled climate-air quality governance or, alternatively, exceptionally strong dedicated air pollution policies in the absence of climate action.
-
This uncertainty arises from fundamental differences in how models represent key chemical and climatic processes. Under SSP3-7.0, while models generally agree on the positive roles of climate warming (TAS), global background chemistry (CH4), and precursors (NMVOCs), they diverge sharply in simulating the local efficacy of NOx control, as indicated by inconsistent O3–NOx correlations. Such divergence underscores that the simulated O3 response is not merely a function of emission inputs but is critically dependent on each model's representation of complex, non-linear transition between chemical regimes (e.g., VOC-limited vs. NOx-saturated), which can be further modulated by model-specific climate sensitivities and background emission levels. Consequently, the optimal strategy for future O3 abatement, specifically, the relative priority and expected benefit of controlling NOx versus managing other drivers like CH4 or NMVOCs under a warming climate, remains highly model-dependent. This poses a fundamental challenge for deriving robust, model-consistent policy insights, highlighting the need to interpret projections within the context of these underlying chemical mechanisms.
Overall, the results of this study are broadly consistent with conclusions from CMIP6-based global-scale analyses (Turnock et al., 2020; Griffiths et al., 2021; Zeng et al., 2022), while further revealing more pronounced regional heterogeneity. Consistent with global studies, surface O3 concentrations over China decrease markedly under the strong mitigation scenario (SSP1-2.6), but exhibit overall or episodic increases under high-emission scenarios (SSP3-7.0 and SSP5-8.5). However, under the SSP3-7.0-lowNTCF scenario, which emphasizes reductions in short-lived climate forcers, surface O3 over China still shows an increasing tendency, in clear contrast to the global mean response. This discrepancy highlights the important role of regional chemical processes and emission structures in modulating O3 changes. Furthermore, this study finds that the magnitude of O3 changes over China is generally larger than the global average, accompanied by more pronounced spatial heterogeneity (Table S5). In terms of chemical mechanisms, the significant negative correlation between O3 and NOx over China – indicating the dominance of NOx titration – is consistent with established understanding for East Asia, whereas global-scale analyses suggest substantial regional heterogeneity in this relationship (Turnock et al., 2020). The positive correlations between surface O3, CH4, and TAS are also consistent with CMIP6-based global studies. In contrast, the relationships between O3 and NMVOCs and BVOCs exhibit pronounced complexity and substantial inter-model variability, which is consistent with findings from global multi-model analyses identifying O3-VOC sensitivity as one of the key sources of uncertainty in future O3 projections. Consequently, this study not only confirms the applicability of the global scenario framework to China but also quantitatively characterizes the magnitude and uncertainty of O3 changes in high-emission regions, underscoring the importance of regionally refined process-based analyses in future air quality assessments.
This study is based on the CMIP6 multi-model ensemble mean. The MME approach integrates information from different models and mitigates the influence of individual model biases, yet it carries certain limitations. First, the CMIP6 global models operate at coarse spatial resolutions (> 100 km), which limits their ability to resolve fine-scale urban features, emission heterogeneity, and local pollution hotspots. Consequently, peak pollutant concentrations in highly urbanized regions may be underestimated, and the results are therefore more suitable for analyzing regional-scale trends rather than city-scale exposure assessments.
Second, the MME was calculated using an equal-weighted scheme, following the common “one-model-one-vote” approach in model intercomparison studies. This method inherently assumes model independence. It should be noted that some models (e.g., UKESM1-0-LL and UKESM1-1-LL) share similar atmospheric chemistry schemes, which may bias the ensemble toward specific model families. Third, due to the varying data availability for different CMIP6 scenarios, the number of contributing models differs across scenarios. Consequently, the uncertainty ranges (e.g., SD) of the MME are not strictly comparable between scenarios. Despite these limitations, the main qualitative conclusions of this study are robust, and the primary trends are not dominated by any single model. Future work could consider employing performance-based or independence-weighted ensemble methods or utilizing more comprehensive and balanced model ensembles, to better quantify uncertainties arising from inter-model structural differences.
The CMIP6 data can be accessed and downloaded at https://aims2.llnl.gov/search/cmip6/ (last access: 8 September 2024). TAP data can be accessed and downloaded at http://tapdata.org.cn/ (last access: 22 July 2024).
The supplement related to this article is available online at https://doi.org/10.5194/acp-26-3669-2026-supplement.
SL, HZ, QC, YC, ZW, QA and XW designed the study. XW and QA carried out the data collection. SL, QC and YC carried out the data processing and analysis. SL, HZ, and ZW assisted with the interpretation of results. All co-authors contributed to writing and reviewing the paper.
The contact author has declared that none of the authors has any competing interests.
Publisher's note: Copernicus Publications remains neutral with regard to jurisdictional claims made in the text, published maps, institutional affiliations, or any other geographical representation in this paper. The authors bear the ultimate responsibility for providing appropriate place names. Views expressed in the text are those of the authors and do not necessarily reflect the views of the publisher.
We are grateful to the the Earth System Grid Federationr for CMIP6 data support. We further acknowledge the Tsinghua University for TAP data support. We thank the editors and anonymous reviewers, whose comments and suggestions improved the utility and readability of this paper.
This work was financially supported by the National Key Research and Development Program of China (grant nos. 2022YFC3701202 and 2017YFA0603502), the National Natural Science Foundation of China (grant no. 42275039), and the Science and Technology Development Fund of CAMS (fund no. 2024KJ021).
This paper was edited by Tim Butler and reviewed by two anonymous referees.
Allen, R. J., Turnock, S., Nabat, P., Neubauer, D., Lohmann, U., Olivié, D., Oshima, N., Michou, M., Wu, T., Zhang, J., Takemura, T., Schulz, M., Tsigaridis, K., Bauer, S. E., Emmons, L., Horowitz, L., Naik, V., van Noije, T., Bergman, T., Lamarque, J.-F., Zanis, P., Tegen, I., Westervelt, D. M., Le Sager, P., Good, P., Shim, S., O'Connor, F., Akritidis, D., Georgoulias, A. K., Deushi, M., Sentman, L. T., John, J. G., Fujimori, S., and Collins, W. J.: Climate and air quality impacts due to mitigation of non-methane near-term climate forcers, Atmos. Chem. Phys., 20, 9641–9663, https://doi.org/10.5194/acp-20-9641-2020, 2020.
An, Q. , Zhang, H., Zhao, S. ,Wang, T., Liu, Q., Wang, Z., Gong, S., Xie, B., and Liu, Y.: Updated Simulation of Tropospheric Ozone and Its Radiative Forcing over the Globe and China Based on a Newly Developed Chemistry-Climate Model, J. Meteorol. Res., 36, 553–573, https://doi.org/10.1007/s13351-022-1187-2, 2022.
Ashworth, K., Folberth, G., Hewitt, C. N., and Wild, O.: Impacts of near-future cultivation of biofuel feedstocks on atmospheric composition and local air quality, Atmos. Chem. Phys., 12, 919–939, https://doi.org/10.5194/acp-12-919-2012, 2012.
Avnery, S., Mauzerall, D. L., Liu, J., and Horowitz, L. W.: Global crop yield reductions due to surface ozone exposure: 1. Year 2000 crop production losses and economic damage, Atmos Environ., 45, 2284–2296, https://doi.org/10.1016/j.atmosenv.2010.11.045, 2011.
Chen, Y., Beig, G., Archer-Nicholls, S., Monks, S. A., Archibald, A. T., Shallcross, D. E., Lee, J. D., Heinold, B., Brühl, C., Telford, P. J., Abraham, N. L., and Pyle, J. A.: Avoiding high ozone pollution in Delhi, India, Faraday Discuss., 226, 502–514, https://doi.org/10.1039/D0FD00079E, 2021.
Coates, J., Mar, K. A., Ojha, N., and Butler, T. M.: The influence of temperature on ozone production under varying NOx conditions – a modelling study, Atmos. Chem. Phys., 16, 11601–11615, https://doi.org/10.5194/acp-16-11601-2016, 2016.
Collins, W. J., Lamarque, J.-F., Schulz, M., Boucher, O., Eyring, V., Hegglin, M. I., Maycock, A., Myhre, G., Prather, M., Shindell, D., and Smith, S. J.: AerChemMIP: quantifying the effects of chemistry and aerosols in CMIP6, Geosci. Model Dev., 10, 585–607, https://doi.org/10.5194/gmd-10-585-2017, 2017.
Dai, H. B., Zhu, J., Liao, H., Li, J. D., Liang, M. X., Yang, Y., and Yue, X.: Co-occurrence of ozone and PM2.5 pollution in the Yangtze River Delta over 2013–2019: spatiotemporal distribution and meteorological conditions, Atmos. Res., 249, 105363, https://doi.org/10.1016/j.atmosres.2020.105363, 2020.
Emmons, L. K., Schwantes, R. H., Orlando, J. J., Tyndall, G., Kinnison, D., Lamarque, J., Marsh, D., Mills, M. J., Tilmes, S., Bardeen, C., Buchholz, R. R., Conley, A., Gettelman, A., Garcia, R., Simpson, I., Blake, D. R., Meinardi, S., and Pétron, G.: The Chemistry Mechanism in the Community Earth System Model Version 2 (CESM2), J. Adv. Model. Earth Sy., 12, 1–21, https://doi.org/10.1029/2019ms001882, 2020.
Eyring, V., Bony, S., Meehl, G. A., Senior, C. A., Stevens, B., Stouffer, R. J., and Taylor, K. E.: Overview of the Coupled Model Intercomparison Project Phase 6 (CMIP6) experimental design and organization, Geosci. Model Dev., 9, 1937–1958, https://doi.org/10.5194/gmd-9-1937-2016, 2016.
Feng, Z. Z., Calatayud V., Zhu J. G., and Kobayashi, K.: Ozone exposure-and flux-based response relationships with photosynthesis of winter wheat under fully open air condition, Sci. Total Environ., 619/620, 1538–1544, https://doi.org/10.1016/j.scitotenv.2017.10.089, 2018.
Fiore, A. M., Dolwick, P. D., Hogrefe, C., Lefohn, A. S., West, J. J., Gilliland, A. B., Rosenzweig, C., Racherla, P. N., Avise, J., Faluvegi, G., Hess, P., Sanderson, M. G., Schultz, M. G., and Zuber, A.: Multimodel Estimates of Intercontinental Source–Receptor Relationships for Ozone Pollution. J. Geophys. Res., 114, D04301, https://doi.org/10.1029/2008JD010816, 2009.
Gidden, M. J., Riahi, K., Smith, S. J., Fujimori, S., Luderer, G., Kriegler, E., van Vuuren, D. P., van den Berg, M., Feng, L., Klein, D., Calvin, K., Doelman, J. C., Frank, S., Fricko, O., Harmsen, M., Hasegawa, T., Havlik, P., Hilaire, J., Hoesly, R., Horing, J., Popp, A., Stehfest, E., and Takahashi, K.: Global emissions pathways under different socioeconomic scenarios for use in CMIP6: a dataset of harmonized emissions trajectories through the end of the century, Geosci. Model Dev., 12, 1443–1475, https://doi.org/10.5194/gmd-12-1443-2019, 2019.
Griffiths, P. T., Murray, L. T., Zeng, G., Shin, Y. M., Abraham, N. L., Archibald, A. T., Deushi, M., Emmons, L. K., Galbally, I. E., Hassler, B., Horowitz, L. W., Keeble, J., Liu, J., Moeini, O., Naik, V., O'Connor, F. M., Oshima, N., Tarasick, D., Tilmes, S., Turnock, S. T., Wild, O., Young, P. J., and Zanis, P.: Tropospheric ozone in CMIP6 simulations, Atmos. Chem. Phys., 21, 4187–4218, https://doi.org/10.5194/acp-21-4187-2021, 2021.
Guenther, A. B., Jiang, X., Heald, C. L., Sakulyanontvittaya, T., Duhl, T., Emmons, L. K., and Wang, X.: The Model of Emissions of Gases and Aerosols from Nature version 2.1 (MEGAN2.1): an extended and updated framework for modeling biogenic emissions, Geosci. Model Dev., 5, 1471–1492, https://doi.org/10.5194/gmd-5-1471-2012, 2012.
Haase, S. and Matthes, K.: The importance of interactive chemistry for stratosphere–troposphere coupling, Atmos. Chem. Phys., 19, 3417–3432, https://doi.org/10.5194/acp-19-3417-2019, 2019.
Hajima, T., Watanabe, M., Yamamoto, A., Tatebe, H., Noguchi, M. A., Abe, M., Ohgaito, R., Ito, A., Yamazaki, D., Okajima, H., Ito, A., Takata, K., Ogochi, K., Watanabe, S., and Kawamiya, M.: Development of the MIROC-ES2L Earth system model and the evaluation of biogeochemical processes and feedbacks, Geosci. Model Dev., 13, 2197–2244, https://doi.org/10.5194/gmd-13-2197-2020, 2020.
Han, Y. Q. and Cong, C. H.: Analysis and validation of FY-2E total cloud amount productions in north China and Huanghuai area, J. Meteor. Environ., 31, 153–158, http://www.jme1984.net.cn/article/id/qxyhjxb_3404 (last access: 1 December 2024), 2015 (in Chinese with English abstract).
Helmig, D., Ganzeveld, L., Butler, T., and Oltmans, S. J.: The role of ozone atmosphere-snow gas exchange on polar, boundary-layer tropospheric ozone – a review and sensitivity analysis, Atmos. Chem. Phys., 7, 15–30, https://doi.org/10.5194/acp-7-15-2007, 2007.
Horowitz, L. W., Naik, V., Paulot, F., Ginoux, P. A., Dunne, J. P., Mao, J., Schnell, J., Chen, X., He, J., John, J. G., Lin, M., Lin, P., Malyshev, S., Paynter, D., Shevliakova, E., and Zhao, M.: The GFDL Global Atmospheric ChemistryClimate Model AM4.1: Model Description and Simulation Characteristics, J. Adv. Model. Earth Sy., 12, e2019MS002032, https://doi.org/10.1029/2019MS002032, 2020.
Hubert, D., Heue, K.-P., Lambert, J.-C., Verhoelst, T., Allaart, M., Compernolle, S., Cullis, P. D., Dehn, A., Félix, C., Johnson, B. J., Keppens, A., Kollonige, D. E., Lerot, C., Loyola, D., Maata, M., Mitro, S., Mohamad, M., Piters, A., Romahn, F., Selkirk, H. B., da Silva, F. R., Stauffer, R. M., Thompson, A. M., Veefkind, J. P., Vömel, H., Witte, J. C., and Zehner, C.: TROPOMI tropospheric ozone column data: geophysical assessment and comparison to ozonesondes, GOME-2B and OMI, Atmos. Meas. Tech., 14, 7405–7433, https://doi.org/10.5194/amt-14-7405-2021, 2021.
Ivanciu, I., Matthes, K., Wahl, S., Harlaß, J., and Biastoch, A.: Effects of prescribed CMIP6 ozone on simulating the Southern Hemisphere atmospheric circulation response to ozone depletion, Atmos. Chem. Phys., 21, 5777–5806, https://doi.org/10.5194/acp-21-5777-2021, 2021.
Jacob, D. J. and Winner, D. A.: Effect of climate change on air quality, Atmos. Environ., 43, 51–63, https://doi.org/10.1016/j.atmosenv.2008.09.051, 2009.
Jiménez, P. and Baldasano, J. M.: Ozone response to precursor controls in very complex terrains: Use of photochemical indicators to assess O3–NOx-VOC sensitivity in the northeastern Iberian Peninsula, J. Geophys. Res.-Atmos., 109, D20309, https://doi.org/10.1029/2004JD004985, 2004.
Lelieveld, J. and Dentener, F. J.: What controls tropospheric ozone? J. Geophys. Res., 105, 3531–3551, https://doi.org/10.1029/1999JD901011, 2000.
Levy, H.: Normal atmosphere: large radical and formaldehyde concentrations predicted, Science, 173, 141–143, https://doi.org/10.1126/science.173.3992.141, 1971.
Li, C., Chen, X., Wang, H., Zhai, T., Ma, X., Yang, X., Chen, S., Zhou, M., Lou, S., Li, X., Zeng, L., and Lu, K.: The impact of organic nitrates on summer ozone formation in Shanghai, China, Atmos. Chem. Phys., 25, 3905–3918, https://doi.org/10.5194/acp-25-3905-2025, 2025.
Li, J., Chen, X. S., Wang, Z. F., Du, H. Y., Yang, W. Y., Sun, Y. L., Hu, B., Li, J. J., Wang, W., Wang, T., Fu, P. Q., and Huang, H. L.: Radiative and heterogeneous chemical effects of aerosols on ozone and inorganic aerosols over East Asia, Sci. Total Environ., 622–623, 1327–1342, https://doi.org/10.1016/j.scitotenv.2017.12.041, 2018.
Li, J., Nagashima, T., Kong, L., Ge, B., Yamaji, K., Fu, J. S., Wang, X., Fan, Q., Itahashi, S., Lee, H.-J., Kim, C.-H., Lin, C.-Y., Zhang, M., Tao, Z., Kajino, M., Liao, H., Li, M., Woo, J.-H., Kurokawa, J., Wang, Z., Wu, Q., Akimoto, H., Carmichael, G. R., and Wang, Z.: Model evaluation and intercomparison of surface-level ozone and relevant species in East Asia in the context of MICS-Asia Phase III – Part 1: Overview, Atmos. Chem. Phys., 19, 12993–13015, https://doi.org/10.5194/acp-19-12993-2019, 2019.
Li, K., Jacob, D. J., Liao, H., Shen, L., Zhang, Q., and Bates, K. H.: Anthropogenic drivers of 2013–2017 trends in summer surface ozone in China, P. Natl. Acad. Sci. USA, 116, 422–427, https://doi.org/10.1073/pnas.1812168116, 2019.
Li, M. G., Wang, L. L., Liu, J. D., Gao, W. K., Song, T., Sun, Y., Li, L., Li, X. R., Wang, Y. H., Liu, L. L., Daellenbach, K. R., Paasonen, P. J., Kerminen,V., Kulmala, M., and Wang, Y. S.: Exploring the regional pollution characteristics and meteorological formation mechanism of PM2.5 in North China during 2013–2017, Environ. Int., 134, 105283, https://doi.org/10.1016/j.envint.2019.105283, 2020.
Lin, P. and Ming, Y.: Enhanced climate response to ozone depletion from ozone-circulation coupling, J. Geophys. Res.-Atmos., 126, 1–14, https://doi.org/10.1029/2020jd034286, 2021.
Li, X., Liu, J., Mauzerall, D. L., Emmons, L. K., Walters, S., Horowitz, L. W., and Tao, S.: Effects of trans-Eurasian transport of air pollutants on surface ozone concentrations over Western China. J. Geophys. Res.-Atmos., 119, 12338–12354, https://doi.org/10.1002/2014JD021936, 2014.
Lin, Y. Y., Jiang, F., Zhao, J., Zhu, G., He, X. J., Ma, X. L., Li, S., Sabel, C. E., and Wang, H. K.: Impacts of O3 on premature mortality and crop yield loss across China, Atmos. Environ., 194, 41–47, https://doi.org/10.1016/j.atmosenv.2018.09.024, 2018.
Liu, N. W., Ma, J. Z., An, X. Q., Lin, W. L., Xu, W. Y., Xu, X. B., Li, D. Q., and Li, R. P.: Source contributions and regional representativeness of surface ozone at atmospheric background stations in China, Trans. Atmos. Sci., 45, 728–733, http://dqkxxb.cnjournals.org/dqkxxb/article/abstract/20220507?st=search (last access: 1 December 2024), 2022 (in Chinese with English abstract).
Liu, Q., Liu, T. Q., Chen, Y. H., Xu, J. M., Gao, W., Zhang, H., and Yao, Y. F.: Effects of aerosols on the surface ozone generation via a study of the interaction of ozone and its precursors during the summer in Shanghai, China, Sci. Total Environ., 675, 235–246, https://doi.org/10.1016/j.scitotenv.2019.04.121, 2019.
Liu, Z., Doherty, R. M., Wild, O., O'Connor, F. M., and Turnock, S. T.: Correcting ozone biases in a global chemistry–climate model: implications for future ozone, Atmos. Chem. Phys., 22, 12543–12557, https://doi.org/10.5194/acp-22-12543-2022, 2022.
Lou, S. J., Liao, H., and Zhu, B.: Impacts of aerosols on surface-layer ozone concentrations in China through heterogeneous reactions and changes in photolysis rates, Atmos Environ., 85, 123–138, https://doi.org/10.1016/j.atmosenv.2013.12.004, 2014.
Lu, X., Hong, J. Y., Zhang, L., Cooper, O. R., Schultz, M. G., Xu, X .B., Wang, T., Gao, M., Zhao, Y. H., and Zhang, Y. H.: Severe surface ozone pollution in China: a global perspective, Environ. Sci. Tech. Let., 5, 487–494, https://doi.org/10.1021/acs.estlett.8b00366, 2018.
Lu, X., Zhang, L., Wu, T., Long, M. S., Wang, J., Jacob, D. J., Zhang, F., Zhang, J., Eastham, S. D., Hu, L., Zhu, L., Liu, X., and Wei, M.: Development of the global atmospheric chemistry general circulation model BCC-GEOS-Chem v1.0: model description and evaluation, Geosci. Model Dev., 13, 3817–3838, https://doi.org/10.5194/gmd-13-3817-2020, 2020.
Maji, K. J., Ye, W. F., Arora, M., and Shiva Nagendra, S. M.: PM2.5 related health and economic loss assessment for 338 Chinese cities, Environ. Int., 121, 392–403, https://doi.org/10.1016/j.envint.2018.09.024, 2018.
Monks, P. S., Archibald, A. T., Colette, A., Cooper, O., Coyle, M., Derwent, R., Fowler, D., Granier, C., Law, K. S., Mills, G. E., Stevenson, D. S., Tarasova, O., Thouret, V., von Schneidemesser, E., Sommariva, R., Wild, O., and Williams, M. L.: Tropospheric ozone and its precursors from the urban to the global scale from air quality to short-lived climate forcer, Atmos. Chem. Phys., 15, 8889–8973, https://doi.org/10.5194/acp-15-8889-2015, 2015.
Morgenstern, O.: The Southern Annular Mode in 6th Coupled Model Intercomparison Project Model., J. Geophys. Res.-Atmos., 126, e2020JD034161, https://doi.org/10.1029/2020JD034161, 2021.
Mulcahy, J. P., Jones, C. G., Rumbold, S. T., Kuhlbrodt, T., Dittus, A. J., Blockley, E. W., Yool, A., Walton, J., Hardacre, C., Andrews, T., Bodas-Salcedo, A., Stringer, M., de Mora, L., Harris, P., Hill, R., Kelley, D., Robertson, E., and Tang, Y.: UKESM1.1: development and evaluation of an updated configuration of the UK Earth System Model, Geosci. Model Dev., 16, 1569–1600, https://doi.org/10.5194/gmd-16-1569-2023, 2023.
Neal, L. S., Dalvi, M., Folberth, G., McInnes, R. N., Agnew, P., O'Connor, F. M., Savage, N. H., and Tilbee, M.: A description and evaluation of an air quality model nested within global and regional composition-climate models using MetUM, Geosci. Model Dev., 10, 3941–3962, https://doi.org/10.5194/gmd-10-3941-2017, 2017.
O'Neill, B. C., Tebaldi, C., van Vuuren, D. P., Eyring, V., Friedlingstein, P., Hurtt, G., Knutti, R., Kriegler, E., Lamarque, J.-F., Lowe, J., Meehl, G. A., Moss, R., Riahi, K., and Sanderson, B. M.: The Scenario Model Intercomparison Project (ScenarioMIP) for CMIP6, Geosci. Model Dev., 9, 3461–3482, https://doi.org/10.5194/gmd-9-3461-2016, 2016.
Qin, Y., Li, J. Y., Gong, K. J., Wu, Z. J., Chen, M. D., Qin, M. M., Huang, L., and Hu, J. L.: Double high pollution events in the Yangtze River Delta from 2015 to 2019: Characteristics, trends, and meteorological situations, Sci. Total Environ., 792, 148349, https://doi.org/10.1016/j.scitotenv.2021.148349, 2021.
Qiu, X. H., Duan, L., Chai, F. H., Wang, S. X., Yu, Q., and Wang, S. L.: Deriving high-resolution emission inventory of open biomass burning in China based on satellite observations, Environ. Sci. Technol., 50, 11779–11786, https://doi.org/10.1021/acs.est.6b02705, 2016.
Qu, Y., Voulgarakis, A., Wang, T., Kasoar, M., Wells, C., Yuan, C., Varma, S., and Mansfield, L.: A study of the effect of aerosols on surface ozone through meteorology feedbacks over China, Atmos. Chem. Phys., 21, 5705–5718, https://doi.org/10.5194/acp-21-5705-2021, 2021.
Rao, S., Klimont, Z., Smith, S. J., Van Dingenen, R., Dentener, F., Bouwman, L., Riahi, K., Amann, M., Leon Bodirsky, B., van Vuuren, D. P., Reis, L. A., Calvin, K., Drouet, L., Fricko, O., Fujimori, S., Gernaat, D., Havlik, P., Harmsen, M., Hasegawa, T., Heyes, C., and Tavoni, M.: Future air pollution in the Shared Socio-economic Pathways, Global Environ. Chang., 42, 346–358, https://doi.org/10.1016/j.gloenvcha.2016.05.012, 2017.
Sahu, S. K., Liu, S. C., Liu, S., Ding, D., and Xing, J.: Ozone pollution in China: Background and transboundary contributions to ozone concentration & related health effects across the country, Sci. Total Environ., 761, 144131, https://doi.org/10.1016/j.scitotenv.2020.144131, 2021.
Sellar, A. A., Jones, C. G., Mulcahy, J., Tang, Y., Yool, A., Wiltshire, A., Connor, F. M., Stringer, M., Hill, R., Palmieri, J., Woodward, S., Mora, L., Kuhlbrodt, T., Rumbold, S., Kelley, D. I., Ellis, R., Johnson, C. E., Walton, J., Abraham, N. L., Andrews, M. B., Andrews, T., Archibald, A. T., Berthou, S., Burke, E., Blockley, E., Carslaw, K., Dalvi, M., Edwards, J., Folberth, G. A., Gedney, N., Griffiths, P. T., Harper, A. B., Hendry, M. A., Hewitt, A. J., Johnson, B., Jones, A., Jones, C. D., Keeble, J., Liddicoat, S., Morgenstern, O., Parker, R. J., Predoi, V., Robertson, E., Siahaan, A., Smith, R. S., Swaminathan, R., Woodhouse, M. T., Zeng, G., and Zerroukat, M.: UKESM1: Description and evaluation of the UK Earth System Model, J. Adv. Model. Earth Sy., 11, 4513–4558, https://doi.org/10.1029/2019MS001739, 2019.
Sepulchre, P., Caubel, A., Ladant, J.-B., Bopp, L., Boucher, O., Braconnot, P., Brockmann, P., Cozic, A., Donnadieu, Y., Dufresne, J.-L., Estella-Perez, V., Ethé, C., Fluteau, F., Foujols, M.-A., Gastineau, G., Ghattas, J., Hauglustaine, D., Hourdin, F., Kageyama, M., Khodri, M., Marti, O., Meurdesoif, Y., Mignot, J., Sarr, A.-C., Servonnat, J., Swingedouw, D., Szopa, S., and Tardif, D.: IPSL-CM5A2 – an Earth system model designed for multi-millennial climate simulations, Geosci. Model Dev., 13, 3011–3053, https://doi.org/10.5194/gmd-13-3011-2020, 2020.
Shang, L., Luo, J. L., and Wang, C. X.: Ozone Variation Trends under Different CMIP6 Scenarios, Atmosphere, 12, 112, https://doi.org/10.3390/atmos12010112, 2021.
Shindell, D., Kuylenstierna, J. C. I., Vignati, E., Dingenen, R. V., Amann, M., Klimont, Z., Anenberg, S. C., Muller, N., Janssens-maenhout, G., Raes, Schwartz, J., Faluvegi, G., Pozzoli, L., Kupiainen, K., Höglund-isaksson, L., Emberson, L., Streets, D., Ramanathan, V., Hicks, K., Oath, N. T. K., Milly, G., Williams, M., Demkine, V., and Fowler, D.: Simultaneously mitigating near-term climate change and improving human health and food security, Science, 335, 183–189, https://doi.org/10.1126/science.1210026, 2012.
Su, X. L., Wu, T. W., Zhang, J., Zhang, Y., Jin, J. L., Zhou, Q., Zhang, F., Liu, Y .M., Zhou, Y. M., Zhang, L., Turnock, S. T., and Furtado, K.: Present-day PM2.5 over Asia: Simulation and uncertainty in CMIP6 ESMs, J. Meteorol. Res., 36, 429–449, https://doi.org/10.1007/s13351-022-1202-7, 2022.
Sun, Z. and Archibald, A. T.: Multi-stage Ensemble-learning-based Model Fusion for Surface Ozone Simulations: A Focus on CMIP6 Models, Environ. Sci. Technol., 8, 100124, https://doi.org/10.1016/j.ese.2021.100124, 2021.
Turnock, S. T., Allen, R. J., Andrews, M., Bauer, S. E., Deushi, M., Emmons, L., Good, P., Horowitz, L., John, J. G., Michou, M., Nabat, P., Naik, V., Neubauer, D., O'Connor, F. M., Olivié, D., Oshima, N., Schulz, M., Sellar, A., Shim, S., Takemura, T., Tilmes, S., Tsigaridis, K., Wu, T., and Zhang, J.: Historical and future changes in air pollutants from CMIP6 models, Atmos. Chem. Phys., 20, 14547–14579, https://doi.org/10.5194/acp-20-14547-2020, 2020.
Val Martin, M., Heald, C. L., and Arnold, S. R.: Coupling dry deposition to vegetation phenology in the Community Earth System Model: Implications for the simulation of surface O3, Geophys. Res. Lett., 41, 2988–2996, https://doi.org/10.1002/2014GL059651, 2014.
van Noije, T., Bergman, T., Le Sager, P., O'Donnell, D., Makkonen, R., Gonçalves-Ageitos, M., Döscher, R., Fladrich, U., von Hardenberg, J., Keskinen, J.-P., Korhonen, H., Laakso, A., Myriokefalitakis, S., Ollinaho, P., Pérez García-Pando, C., Reerink, T., Schrödner, R., Wyser, K., and Yang, S.: EC-Earth3-AerChem: a global climate model with interactive aerosols and atmospheric chemistry participating in CMIP6, Geosci. Model Dev., 14, 5637–5668, https://doi.org/10.5194/gmd-14-5637-2021, 2021.
Wang, C. L., Wang, Y. Y., Shi, Z. H., Sun, J. J, Gong, K. J., and Hu, J. L.: Assessment of surface ozone pollution change and its health effect in China from 2014 to 2018 based on multi-source fusion data, Trans. Atmos. Sci., 44, 737–745, 2021, http://dqkxxb.cnjournals.org/dqkxxb/article/abstract/20210511?st=search (last access: 1 December 2024), 2021 (in Chinese with English abstract).
Wang, F. Y, Qiu X. H, Cao J. Y, Peng, L., Zhang, N. N., Yan ,Y. L., and Li, R. M.: Policy-driven changes in the health risk of PM2.5 and O3 exposure in China during 2013–2018, Sci. Total Environ., 757, 143775, https://doi.org/10.1016/j.scitotenv.2020.143775, 2020.
Weichenthal, S., Pinault, L. L., and Burnett, R. T.: Impact of oxidant gases on the relationship between outdoor fine particulate air pollution and nonaccidental, cardiovascular, and respiratory mortality, Sci. Rep., 7, 1–10, https://doi.org/10.1038/s41598-017-16770-y, 2017.
Wang, W., Li, X., Shao, M., Hu, M., Zeng, L., Wu, Y., and Tan, T.: The impact of aerosols on photolysis frequencies and ozone production in Beijing during the 4-year period 2012–2015, Atmos. Chem. Phys., 19, 9413–9429, https://doi.org/10.5194/acp-19-9413-2019, 2019.
Wesely, M. L., Cook, D. R., and Williams, R. M.: Field measurement of small ozone fluxes to snow, wet bare soil, and lake water, Bound.-Lay. Meteorol., 20, 459–471, https://doi.org/10.1007/BF00122295, 1981.
Wild, O., Voulgarakis, A., O'Connor, F., Lamarque, J.-F., Ryan, E. M., and Lee, L.: Global sensitivity analysis of chemistry–climate model budgets of tropospheric ozone and OH: exploring model diversity, Atmos. Chem. Phys., 20, 4047–4058, https://doi.org/10.5194/acp-20-4047-2020, 2020.
Wu, H., Xu, X., Luo, T., Yang, Y., Xiong, Z., and Wang, Y.: Variation and comparison of cloud cover in MODIS and four reanalysis datasets of ERA-interim, ERA5, MERRA-2 and NCEP, Atmos. Res., 281, 106477, https://doi.org/10.1016/j.atmosres.2022.106477, 2023.
Wu, T., Zhang, F., Zhang, J., Jie, W., Zhang, Y., Wu, F., Li, L., Yan, J., Liu, X., Lu, X., Tan, H., Zhang, L., Wang, J., and Hu, A.: Beijing Climate Center Earth System Model version 1 (BCC-ESM1): model description and evaluation of aerosol simulations, Geosci. Model Dev., 13, 977–1005, https://doi.org/10.5194/gmd-13-977-2020, 2020.
Xiao, Q., Geng, G., Xue, T., Liu, S., Cai, C., He, K., and Zhang, Q.: Tracking PM2.5 and O3 Pollution and the Related Health Burden in China 2013–2020, Environ. Sci. Technol., 56, 6922–6932, https://pubs.acs.org/doi/10.1021/acs.est.1c04548, 2022.
Xie, B. and Zhang, H.: Main progresses in the research on Ozone, Sci. Tech. Eng., 14, 106–114, http://www.stae.com.cn/jsygc/article/abstract/1308589?st=advanced_search (last access: 1 December 2024), 2014 (in Chinese with English abstract).
Xie, F., Li, J. P., Zhang, J. K., Tian, W. S., Hu,Y. Y., Zhao, S., Sun, C., Ding, R. Q., Feng, J., and Yang, Y.: Variations in North Pacific sea surface temperature caused by Arctic stratospheric ozone anomalies, Environ. Res. Lett., 12, 114023, https://doi.org/10.1088/1748-9326/aa9005, 2017.
Xing, J., Wang, S. X., Jang, C., Zhu, Y., and Hao, J. M.: Nonlinear response of ozone to precursor emission changes in China: a modeling study using response surface methodology, Atmos. Chem. Phys., 11, 5027–5044, https://doi.org/10.5194/acp-11-5027-2011, 2011.
Xue, T., Zheng, Y. X., Geng, G. N., Xiao, Q. Y., Meng, X., Wang, M., Li, X., Wu, N. N., Zhang, Q., and Zhu, T.: Estimating Spatiotemporal Variation in Ambient Ozone Exposure during 2013–2017 Using a Data-Fusion Model, Environ. Sci. Technol., 54, 14877–14888, https://doi.org/10.1021/acs.est.0c03098, 2020.
Yang, X. Y., Zeng, G., Iyakaremye, V., and Zhu, B.: Effects of different types of heat wave days on ozone pollution over Beijing-Tianjin-Hebei and its future projection, Sci. Total Environ., 837, 155762, https://doi.org/10.1016/j.scitotenv.2022.155762, 2022.
Yin, X., Rupakheti, D., Zhang, G., Luo, J., Kang, S., de Foy, B., Yang, J., Ji, Z., Cong, Z., Rupakheti, M., Li, P., Hu, Y., and Zhang, Q.: Surface ozone over the Tibetan Plateau controlled by stratospheric intrusion, Atmos. Chem. Phys., 23, 10137–10143, https://doi.org/10.5194/acp-23-10137-2023, 2023.
Yin, Z., Cao, B., and Wang, H.: Dominant patterns of summer ozone pollution in eastern China and associated atmospheric circulations, Atmos. Chem. Phys., 19, 13933–13943, https://doi.org/10.5194/acp-19-13933-2019, 2019.
Young, P. J., Archibald, A. T., Bowman, K. W., Lamarque, J.-F., Naik, V., Stevenson, D. S., Tilmes, S., Voulgarakis, A., Wild, O., Bergmann, D., Cameron-Smith, P., Cionni, I., Collins, W. J., Dalsøren, S. B., Doherty, R. M., Eyring, V., Faluvegi, G., Horowitz, L. W., Josse, B., Lee, Y. H., MacKenzie, I. A., Nagashima, T., Plummer, D. A., Righi, M., Rumbold, S. T., Skeie, R. B., Shindell, D. T., Strode, S. A., Sudo, K., Szopa, S., and Zeng, G.: Pre-industrial to end 21st century projections of tropospheric ozone from the Atmospheric Chemistry and Climate Model Intercomparison Project (ACCMIP), Atmos. Chem. Phys., 13, 2063–2090, https://doi.org/10.5194/acp-13-2063-2013, 2013.
Young, P. J., Naik, V., Fiore, A. M., Gaudel, A., Guo, J., Lin, M. Y., Neu, J. L., Parrish, D. D., Rieder, H. E., Schnell, J. L., Tilmes, S., Wild, O., Zhang, L., Ziemke, J. R., Brandt, J., Delcloo, A., Doherty, R. M., Geels, C., Hegglin, M. I., Hu, L., Im, U., Kumar, R., Luhar, A., Murray, L., Plummer, D., Rodriguez, J., Saiz-Lopez, A., Schultz, M. G., Woodhouse, M. T. and Zeng, G.: Tropospheric Ozone Assessment Report: Assessment of global-scale model performance for global and regional ozone distributions, variability, and trends, Elem. Sci. Anth., 6, 10, https://doi.org/10.1525/elementa.265, 2018.
Yukimoto, S., Kawai, H., Koshiro, T., Oshima, N., Yoshida, K., Urakawa, S., Tsujino, H., Deushi, M., Tanaka, T., Hosaka, M., Yabu, S., Yoshimura, H., Shindo, E., Mizuta, R., Obata, A., Adachi, Y., and Ishii, M.: The meteorological research institute Earth system model O' version 2.0, MRI-ESM2.0: Description and basic evaluation of the physical component, J. Meteorol. Soc. Jpn., 97, 931–965, https://doi.org/10.2151/jmsj.2019-051, 2019.
Zeng, G., Morgenstern, O., Williams, J. H. T., O' Connor, F. M., Griffiths, P. T., Keeble, J., Deushi, M., Horowitz, L. W., Naik, V., Emmons, L. K., Abraham, N. L., Archibald, A. T., Bauer, S. E., Hassler, B., Michou, M., Mills, M. J., Murray, L. T., Oshima, N., Sentman, L. T., Tilmes, S., Tsigaridis, K., and Young, P. J.: Attribution of stratospheric and tropospheric ozone changes between 1850 and 2014 in CMIP6 models. J. Geophys. Res.-Atmos., 127, e2022JD036452, https://doi.org/10.1029/2022JD036452, 2022.
Zhan, C. C., Xie, M., Liu, J., Wang, T. J., Xu, M., Chen, B., Li, S., Zhuang, B. L., and Li, M. M.: Surface ozone in the Yangtze River Delta, China: A synthesis of basic features, meteorological driving factors, and health impacts, J. Geophys. Res.-Atmos., 126, e2020JD033600, https://doi.org/10.1029/2020JD033600, 2021.
Zhao, S. H., Yang, X. Y., Li, Z. Q., Wang, Z. T., Zhang, Y. H., Wang, Y., Zhou, C. Y., and Ma, P. F.: Advances of ozone satellite remote sensing in 60 years, Nat. Remote Sens. Bull., 26, 817–833, https://doi.org/10.11834/jrs.20221632, 2022 (in Chinese with English abstract).
Zhao, S. P.,Yin, D. Y., Yu, Y., Kang, S. C., Qin, D. H., and Dong, L. X.: PM2.5 and O3 pollution during 2015−2019 over 367 Chinese cities: Spatiotemporal variations, meteorological and topographical impacts, Environ. Pollut., 264, 114694, https://doi.org/10.1016/j.envpol.2020.114694, 2020.
Zhang, F., Hou, C., Li, J. N., Liu, R. Q., and Liu, C. P.: A simple parameterization for the height of maximum ozone heating rate, Infrared Phys. Techn., 87, 104–112, https://doi.org/10.1016/j.infrared.2017.09.002, 2017.
Zhang, J., Gao, Y., Luo, K., Leung, L. R., Zhang, Y., Wang, K., and Fan, J.: Impacts of compound extreme weather events on ozone in the present and future, Atmos. Chem. Phys., 18, 9861–9877, https://doi.org/10.5194/acp-18-9861-2018, 2018.
Zhou, T. J., Zou, L. W., and Chen, X. L.: Commentary on the Coupled Model Intercomparison Project Phase 6 (CMIP6), Clim. Change Res., 15, 445–456, https://doi.org/10.12006/j.issn.1673-1719.2019.193, 2019 (in Chinese with English abstract).
Zhu, C., He, Q., Zhao, Z., Liu, X., and Pu, Z.: Comparative analysis of ozone pollution characteristics between urban area and southern mountainous area of Urumqi, China, Atmosphere, 14, 1387, https://doi.org/10.3390/atmos14091387, 2023.
- Abstract
- Introduction
- Research data and methods
- Present-Day surface O3 simulations and uncertainties
- O3 from the pre-industrial period to present day
- O3 from present day to 2100
- Summary and discussion
- Data availability
- Author contributions
- Competing interests
- Disclaimer
- Acknowledgements
- Financial support
- Review statement
- References
- Supplement