the Creative Commons Attribution 4.0 License.
the Creative Commons Attribution 4.0 License.
 | 05 Mar 2026
Measurement report: Impact of domestic heating on dust deposition sources in hyper-arid Qaidam Basin, northern Qinghai-Xizang Plateau
Haixia Zhu
Lufei Zhen
Suping Zhao
Xiying Zhang
Given the unique energy structure of the Qaidam Basin (QDB), this study systematically reveals the spatiotemporal variations in the chemical composition of atmospheric dust deposition and clarifies the key contributions of coal and biomass burning to carbonaceous aerosols, as well as their potential impacts on the Qinghai-Xizang Plateau (QXP) and global atmospheric systems. Monthly dust deposition samples were collected at six sites in the southern QDB between 2020 and 2023. Results indicated heightened carbon emissions and the higher ratio during the heating period (HP, 5.06 ± 4.08) than the non-heating period (NHP, 4.42 ± 3.09), indicating intensified seasonal solid fuel consumption. Spatially, the organic carbon (OC) and elemental carbon (EC) ratio was significantly lower in urban (3.97 ± 2.04) than that in rural areas (10.99 ± 10.00). Char-EC dominated EC (80.44 %), especially in urban areas (85.00 %), while secondary organic carbon (SOC) dominated OC (72.61 %), particularly in rural areas (87.32 %). The coal combustion (15.19 %) and biomass burning (33.55 %) as major contributors in rural areas, strongly associated with domestic heating, whereas urban dust predominantly originated from traffic (46.83 %) and industrial emissions (16.41 %). Coal consumption in QDB was greater during the HP relative to other dust sources on the QXP leads to increased atmospheric pollutant emissions, which may accelerate regional glacier melting. Consequently, integrating QDB carbonaceous aerosols into future environmental policies and climate models for the QXP is essential. This study provides a reference for investigating carbonaceous aerosols in climatically similar hyper-arid basins with intensive human activity and salt lake regions.
- Article
(5140 KB) - Full-text XML
-
Supplement
(6666 KB) - BibTeX
- EndNote


- 1.
The spatiotemporal distribution of carbonaceous aerosols in the basin's atmospheric dust deposition was analyzed using various carbon indicators.
- 2.
Domestic heating significantly increased associated pollutants in rural atmospheric dust deposition.
- 3.
The basin's unique energy structure suggests its emissions and deposition could affect regional glaciers on the Qinghai-Xizang Plateau.
Atmospheric dust, a key component of particulate matter (PM), comprises solid particles, typically ranging in size from below 1 to 100 µm, which may become airborne depending on their origin, physical characteristics and ambient conditions (Xu, 2014). Within this size spectrum, larger particles (10–100 µm) that settle under gravity are defined as atmospheric dust deposition. Notably, during long-distance transport, these coarse particles can undergo fragmentation into fine particles (PM2.5) and subsequently actively participate in atmospheric chemical and climatic processes (Noll and Fang, 1989). As the dominant natural component of PM, atmospheric dust deposition serves not only a crucial indicator of regional air quality but also a key biogeochemical process linking the atmosphere, cryosphere, hydrosphere, and biosphere, with global-scale influences that significantly shape environmental and climate systems (Feng et al., 2019).
Arid and semi-arid regions are the primary global sources of atmospheric dust (Griffin et al., 2002; Schepanski, 2018). Long-distance transport of this dust via wind currents exerts multi-faceted impacts on the environment and human society. A particularly critical effect is the alteration of the cryosphere: dust deposition on snow and ice lowers surface albedo and modifies ice crystal structure, thereby accelerating glacier and snowpack melt (Tuzet et al., 2017). This process disrupts regional snow energy balance, which is directly linked to glacier retreat and water resource security. Dust deposition also influences the atmospheric energy budget by attenuating solar radiation reaching the surface and participates in the global carbon cycle through biogeochemical pathways, such as delivering nutrients to oceans and affecting marine primary productivity (Mahowald et al., 2009; Parajuli et al., 2022). For human health, harmful components associated with dust can induce respiratory and cardiovascular diseases and even damage cellular DNA (Shahram et al., 2016). For terrestrial ecosystems, the shading effect of dust on leaves can inhibit plant photosynthesis and reduce biological productivity.
Given the complexity and regional variability of atmospheric dust impacts, identifying dust sources (source apportionment) is fundamental for understanding its environmental behavior and effects. Recent advancements in understanding PM characteristics, particularly chemical composition (e.g. water-soluble ions, carbonaceous components, and trace elements) and source apportionment, have been driven by the integrated application of methodological tools. These receptor models include principal component analysis (PCA), chemical mass balance (CMB), and positive matrix factorization (PMF) models, are used to quantify source contributions. Specifically, the PMF model mathematically deconstructs the chemical composition matrix of ambient samples to achieve this. Additionally, multivariate statistical approaches like backward trajectory simulations (e.g., the HYSPLIT model) trace air mass transport pathways to identify potential source regions (Lai et al., 2016; Yao et al., 2016; Zhang et al., 2015a). This multi-method approach has greatly enhanced the precision of dust deposition source analysis. For instance, PMF analysis of atmospheric dust in urban areas such as Lanzhou, Taiyuan, and Jinan have identified diverse sources, including coal combustion, industrial emissions, construction dust, windblown dust, vehicle emissions, and resuspended road dust. Seasonal variations indicate that coal combustion during the domestic heating period and regional meteorological conditions significantly influence dust deposition (Hu and Liu, 2022; Chen et al., 2024; Yang et al., 2024; Zhang et al., 2022b). These findings underscore the urgency of region-specific pollution control strategies. When considering the global scale, arid and semi-arid regions are unequivocally the dominant sources, contributing over 60 % of the global atmospheric dust flux (Zan et al., 2025). Therefore, a comprehensive investigation of atmospheric dust processes in these key regions, encompassing emission intensity, physicochemical properties, transport pathways, and environmental effects, is indispensable for elucidating global dust cycle mechanisms and assessing their profound impacts on the cryosphere (e.g., glacial melting) and regional climate.
The Qinghai-Xizang Plateau (QXP) often referred to as the “Roof of the World” due to its immense elevation, plays a crucial role in regulating the regional and global climate by altering large-scale atmospheric circulation. Its vast glaciers and snow cover influence regional energy balance through the albedo effect, and as the source of many major Asian rivers, it is known as the “Asian Water Tower” (Liu et al., 2019, 2020b). However, rapid glacier retreat on the plateau poses risks to the Asian hydrological cycle and the monsoon system, with potential adverse impacts if unchecked (Luo et al., 2020). Beyond climate warming and moistening, black carbon (BC), a light-absorbing carbonaceous aerosol component emitted from incomplete combustion processes of solid and liquid fuels during household cooking, heating, and coke production (Bond et al., 2013), significantly accelerates glacial melt. By depositing on ice, BC reduces surface albedo, enhances radiative absorption and thus raises it temperatures, promoting glacial melt (Bond and Bergstrom, 2006; Chen et al., 2015). Notably, biomass burning in South and Central Asia during winter serves as a major source of BC, further exacerbating glacier decline on the plateau (Zhang et al., 2015b; Zheng et al., 2017; Xu et al., 2018). In addition to these external sources, local dust sources within the QXP itself remain significant. Among these, the Qaidam Basin (QDB) in the northeastern plateau is a particularly important contributor, identified as a key dust source for the plateau (Wei et al., 2017; Zheng et al., 2021) and a critical, unique arid dust source area.
The QDB, known as the “Treasure Basin” of the QXP, is rich in mineral resources (e.g., copper, iron, and tin) as well as abundant oil and gas reserves. It serves as a key economic development zone in northwest China, accounting for approximately 30 % of the plateau's industrial and agricultural output despite comprising only about 8 % of its registered population (Fu, 2023). Extensive resource extraction has rendered its ecosystem fragile (Li and Sha, 2022), exacerbating the impact of atmospheric pollution. The region is also highly sensitive and vulnerable to climate change, with severe and extreme vulnerability zones covering 45.98 % of its area (Xu et al., 2024). Unlike South Asia, Central Asia, and Xizang, where biomass fuels dominate, the QDB relies primarily on distinct mix of coal (about 60 %) and biomass fuels like yak dung, firewood (about 35 %) for winter domestic heating, reflecting a unique energy structure (Liu et al., 2008; Xiao et al., 2015; Behera et al., 2015; Kerimray et al., 2018; Jiang et al., 2020; Shen et al., 2021a). The combustion of coal releases significant pollutants, including light-absorbing aerosols like BC and brown carbon (BrC) (Munawer, 2018; Ye et al., 2020; Zhou et al., 2025). Brown carbon refers to organic compounds that can absorb light, particularly at shorter wavelengths, resulting in a reddish orange or brown appearance (Donahue, 2018). Both BC and BrC can influence solar radiation absorption and cloud properties, exerting a positive radiative forcing on climate (Ramanathan and Carmichael, 2008; Bond et al., 2013). When deposited on snow and ice, they further accelerate glacial melt (Qian et al., 2015; Kang et al., 2020). Additionally, BC and BrC are significant contributors to global warming and can exacerbate adverse health effects by carrying toxic components (Ramanathan and Carmichael, 2008; Shrivastava et al., 2017). Notably, QDB's widespread use of yak dung as a fuel, a practice less common in other coal-intensive heating regions of northern China, releases pollutants like carbon monoxide (CO), volatile organic compounds (VOCs), and polycyclic aromatic hydrocarbons (PAHs), further affecting local air quality and health (Zhang et al., 2022a). Consequently, we posit that seasonal carbon emissions in QDB, particularly during winter domestic heating, could exert a unique influence on the climate and ecological stability of the QXP.
The QDB, as a representative arid region with intensive human activity, exhibits climatic and environmental conditions comparable to other hyper-arid basins (e.g., the Tarim and Junggar Basins in Xinjiang, the Great Basin in the United States) and high-altitude salt lake regions (e.g., Uyuni in Bolivia, Atacama in Chile). These regions are characterized by low precipitation, rich mineral resources subject to significant anthropogenic impact, and abundant salt lakes. Research in the Tarim and Junggar Basins has predominantly focused on dust events, their sources, and associated gas emissions (Gao and Washington, 2010; Liu et al., 2016b; Filonchyk et al., 2018; Yu et al., 2019; Zhou et al., 2023). In the Great Basin, studies largely address ozone and dust sources (Hahnenberger and Nicoll, 2012; VanCuren and Gustin, 2015; Miller et al., 2015). Research on salt lake atmospheres has predominantly focused on high-salinity dust emissions resulting from lakebed desiccation due to resource extraction (Löw et al., 2013; Gholampour et al., 2015; Moravek et al., 2019; Christie et al., 2025), with limited research on atmospheric carbon components, their sources, and environmental impacts. Therefore, this research aims to investigate atmospheric carbonaceous aerosols in arid basins with intensive human activity and climates comparable to the QDB, as well as in salt lakes environments.
From January 2020 to March 2023, monthly dust deposition samples were collected at six urban and rural monitoring sites in the southern QDB. Samples were categorized into two seasonal periods: the domestic heating period (HP) and the non-domestic heating period (NHP). Measured parameters included dust deposition flux, soluble ions, trace elements, and key carbonaceous components. The objectives of this study were: (1) to clarify the variation trends of carbonaceous components in atmospheric dust deposition under the unique energy structure of the QDB, and to quantify the contribution of domestic heating; and (2) to identify the major sources of atmospheric dust deposition in the basin and to evaluate their associated environmental impacts. To achieve these aims, we applied and ratios, the HYSPLIT trajectory, and PMF model for source apportionment. Furthermore, these findings offer a scientific basis and reference for examining atmospheric carbonaceous aerosols in arid basins with similar climates and human activities to the QDB, as well as in salt lake regions.
2.1 Sampling
The QDB, situated in the northeastern part of the QXP, is bordered by the Altyn-Tagh, Kunlun, and Qilian mountains, making it one of China's largest intermontane basins (Zhang, 1987). With an average elevation of 3000 m, the basin features an extremely arid climate characterized by less than 20 mm of annual precipitation in the northwestern region, while evaporation rates exceed 2000 mm (Feng et al., 2022). The QDB is rich in salt lakes, non-ferrous metals, and hydrocarbon resources, with significant coal deposits. As a major salt lake resource area, it hosts 33 lakes, including Qarhan, Dachaidan, and Caka Salt Lake, and faces notable conflicts between resource extraction and ecological preservation. Agriculturally, it cultivates crops like goji berries, quinoa, and forage grass, and hosts China's largest resource-rich circular economy pilot zone. The permanent population of the basin is approximately 400 000, primarily using coal, yak dung, and firewood for domestic heating (Jiang et al., 2020). Additionally, annual tourism peaks from May to September, attracting around 17 million visitors (Qinghai Provincial Bureau of Statistics, 2024a), which likely amplifies atmospheric pollutant emissions.
From January 2020 to March 2023, monthly dust deposition samples were collected from six monitoring stations in the southern QDB. The stations included Xiao Zaohuo (XZH), Golmud (GEM), Da Gele (LTC), Nuo Muhong (NMH), Balong (BLX), and Dulan station (DLX) (Fig. 1). Dry deposition collection employed the glass ball method using Marble dust collector (MDCO) designed dust collection cylinders (Sow et al., 2006). The MDCO sampler operates on the principle of gravitational settling. It uses a collection vessel with a known opening to capture particulate matter that settles naturally from the air. In field measurements, surrogate surfaces or deposition traps are commonly employed to better quantify atmospheric deposition. These surfaces mimic the original ground surface, are easy to deploy, and can be integrated without significantly disturbing airflow. Examples include glass beads (Ganor, 1975; Offer et al., 1992), moist filter paper (Goossens and Offer, 1993), plastic surfaces (Gregory, 1961), and water or antifreeze solutions (Smith and Twiss, 1965). The MDCO deposition vessel is based on the original concept of Ganor (1975), using glass beads as a surrogate collection surface. Due to their very low microscopic roughness, the beads help prevent the resuspension of particles once they have been captured (Goossens and Offer, 1993).
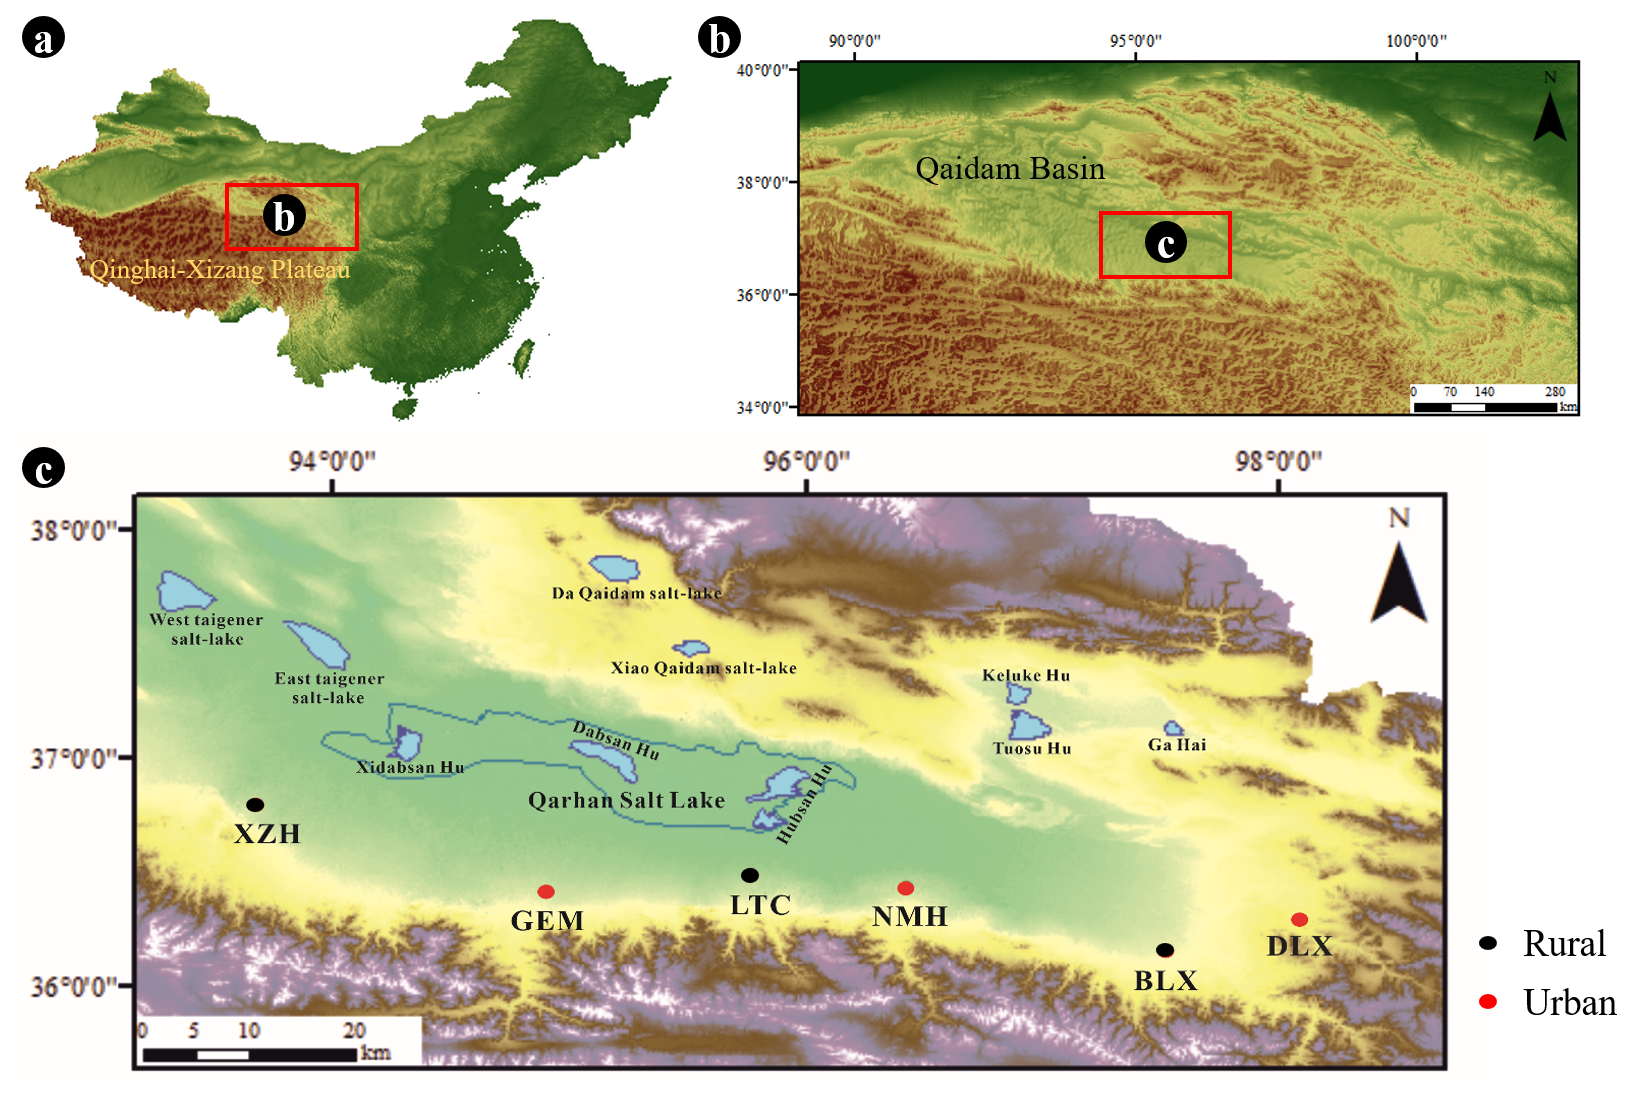
Figure 1Spatial distribution of monitoring stations in the southern Qaidam Basin. Urban stations (red) and rural stations (black) are labeled as follows: XZH (Xiao Zaohuo), GEM (Golmud), LTC (Da Gele), NMH (Nuo Muhong), BLX (Balong), DLX (Dulan).
The stainless steel collection device (50 × 30 × 30 cm) contained a plastic sieve container of identical dimensions, with the sieve base positioned 10 cm above the opening and perforated with 0.5 cm diameter holes (Fig. S1 in the Supplement). To minimize dust resuspension during high wind events (Qian and Dong, 2004), two layers of 16 mm glass balls were placed within the sieve container. A high-density polyethylene bag was attached to the base for sample collection. According to Sow et al. (2006), the collection efficiency of the MDCO decreases with increasing wind speed, dropping below 20 % when wind speed exceeds 3 m s−1, and it preferentially collects the finer fraction of atmospheric dust particles ranging from 10 to 31 µm in size (Chow, 1995). Furthermore, collection efficiency decreases significantly as the size of dust-fall increases. Based on our findings, more than 50 % of the collected dust particles are below 40 µm (Fig. S2), whereas the mean particle size of atmospheric dust deposition reported in other studies is approximately 80 µm (Lin et al., 2022a, b). This confirms that the MDCO sampler preferentially collects relatively finer particles. Consequently, this study may place greater emphasis on analyzing the chemical activity of the finer fraction of atmospheric dust, thereby enhancing the detection sensitivity for components such as secondary ions and carbonaceous species in deposited dust. However, this particle-size selectivity introduces a sampling bias that can amplify inter-site differences in deposition flux between sites, complicate local source apportionment, strengthen signals from distant sources (e.g., combustion and vehicle emissions), and weaken the contribution from local, coarse-particle-dominated sources (e.g., resuspended dust and construction dust). These factors may affect the accuracy of both deposition flux estimates and source apportionment. Future research should enhance data comparability and the reliability of ecological assessments through efficiency correction and the combined application of multiple methods. The collection efficiency at each site was calculated based on local dust grain-size distribution and wind speed; details are provided in Sect. S1 in the Supplement. This type of collector has been widely used in many studies to evaluate local dust conditions (Abdollahi et al., 2021; Barjoee et al., 2021; Alzahrani et al., 2024).
In this study, dust samples were collected monthly, with each sampling period lasting 30 or 31 d. The installation height and environment of the samplers are provided in Table S1 in the Supplement. To ensure only dry dust was collected, collection devices were manually-operated covered during rain or snowfall. A total of 37, 39, 23, 30, 16, and 29 samples were obtained from XZH, GEM, LTC, NMH, BLX, and DLX stations, respectively, and no duplicate samples were collected during the sampling period. Laboratory protocols incorporated biannual analyses with negative controls and appropriate control samples. As continuous dust monitoring commenced in 2020, site blanks were evaluated during initial sampling. Stations were classified as Urban (GEM, NMH, DLX) and Rural (XZH, LTC, BLX) based on location characteristics. Consistent with the cold-arid climate in QDB, the HP was defined as October–April, while the NHP spanned May–September.
Materials such as plant remnants, microfauna, and bird droppings were removed from the sample bags with tweezers. The samples were then measured on a balance (0.0001 g) to determine the total dust deposition flux (DF) (Eq. 1) (Yu et al., 2016):
where M is dust deposition [g (m2 30 d)−1]; m is the sample mass (g); S is the area of the dust collection device (m2); and K is the actual number of sampling days per month (d).
2.2 Water-soluble inorganic ions
A 100 mg sample was weighed and transferred into a 250 mL bottle. The mixture underwent ultrasonic extraction for 20 min to ensure complete solubilization. The resulting supernatant was then filtered through a 0.45 µm filter for analysis. Based on preliminary experimental results, the concentrations of major ions (K+, Na+, Mg2+, and Ca2+) were measured using Inductively Coupled Plasma Optical Emission Spectrometer (ICP-OES, NexIon 2000). Anions (Cl−, SO, and NO) were quantified using ion chromatography (IC). To ensure measurement accuracy, samples were organized in sets of twenty, with one randomly selected sample from each group serving as a replicate, achieving an error margin of less than 10 %. The detection limits for the various components were as follows: K+ (0.0560 mg L−1), Na+ (0.0100 mg L−1), Ca2+ (0.0037 mg L−1), Mg2+ (0.0390 mg L−1), SO (0.0090 mg L−1), NO (0.0125 mg L−1), Cl− (0.0100 mg L−1). All standard solutions employed in the analysis were sourced from the National Standard Material Center.
2.3 Trace element analysis
According to the Chinese State Standard “Ambient air and waste gas from stationary sources emission-determination of metal elements in ambient particles” (HJ 777-2015), the concentrations of elements such as iron (Fe), aluminum (Al), silicon (Si), titanium (Ti), copper (Cu), cadmium (Cd), chromium (Cr), manganese (Mn), nickel (Ni), zinc (Zn), lead (Pb), and vanadium (V) were quantified using Inductively Coupled Plasma Mass Spectrometry (ICP-MS) and ICP-OES. A dust sample weighing 0.100 g was placed in a Teflon cup, to which 20.0 mL of a nitric acid-hydrochloric acid digestion solution was added. The sample was heated to reflux at 100 ± 5 °C for 2 h under a watch glass, then cooled. Following this, the inner walls of the cup were rinsed with water, and approximately 10 mL of water was added, allowing the mixture to stand for 30 min for extraction. The extract was then filtered into a 100 mL volumetric flask and diluted to volume with distilled water for analysis. In cases where organic matter content was high, an appropriate amount of hydrogen peroxide was introduced during digestion to decompose the organic materials. Prior to sample analysis, the system was flushed with a rinse solution until the blank intensity value reached a minimum, and samples were analyzed only after the signal stabilized. If the concentration of any element exceeded the calibration range, the sample was diluted and reanalyzed.
2.4 Carbon analysis
This study utilized a combination of wet chemical treatment and thermal/optical reflection (TOR) to analyze carbon elements in dust deposition (Han et al., 2007a, b, 2016). Dust samples were digested stepwise to remove inorganic materials: first samples were treated with 10 mL of 2 N hydrochloric acid (HCl) for 24 h at room temperature to dissolve carbonates and partial metals, followed by centrifugation (4500 rpm, 12 min) to separate the residue; then with 15 mL of a 1 : 2 () mixture of 6 N HCl and 48 % hydrofluoric acid (HF) for 24 h at room temperature to dissolve silicates and residual metals; and finally with 15 mL of 4 N HCl for 24 h at 60 °C to remove minerals such as fluorite formed during demineralization. After each step, the mixture was centrifuged, and the supernatant was collected. The solid residue was diluted with 200 mL of deionized water and filtered through a pre-combusted quartz fiber filter (Whatman, 450 °C for 4 h, diameter 47 mm) (Han et al., 2007a). This method has been widely applied to measure OC and EC contents in lake sediments and urban soils (Han et al., 2009b; Khan et al., 2009; Han et al., 2011). Studies have shown that the EC collection efficiency of this method is approximately 99.6 % (Zhan et al., 2013). However, because OC includes polar, basic, and mineral-bound compounds that may dissolve in and be lost during filtration, the supernatant from all three acid-digestion steps was collected and analyzed for water-soluble OC using a carbon-nitrogen analyzer (Shimadzu, TOCN-4200, Japan). Total OC was obtained by summing the dissolved OC and the particulate OC measured by TOR.
The filtered samples were air-dried and analyzed for carbon content using a DRI 2001 thermal/optical carbon analyzer (Atmoslytic Inc., Calabasas, CA) at the Institute of Earth Environment, Chinese Academy of Sciences, adhering to the Interagency Monitoring of Protected Visual Environments (IMPROVE) protocol. A 0.544 cm2 disc was extracted from the filter and placed in a quartz boat for analysis. During the carbon analysis, the samples were initially heated in a 100 % helium atmosphere, resulting in the production of four organic carbon (OC) fractions (OC1, OC2, OC3, and OC4) at four different temperature levels (140, 280, 480, and 580 °C). The atmosphere was subsequently changed to 2 % O2 98 % He, generating three elemental carbon (EC) fractions (EC1, EC2, and EC3) at three temperatures (580, 740, and 840 °C). Volatile carbon underwent carbonization in an anaerobic environment, indicated by a decrease in laser reflectance, and is referred to as pyrolyzed organic carbon (OPC). In the oxidative atmosphere, OPC was emitted along with the original EC from the filter. The amount of OPC is defined as the carbon evolved until the laser reflectance returned to its baseline value (Han et al., 2007b). According to the IMPROVE protocol, EC is calculated as the total of the three EC subfractions minus OPC (i.e., EC is defined as the sum of EC1, EC2, and EC3, with OPC subtracted). The method enables differentiation between soot and char, as determined by the gradual oxidation of these black carbon subtypes in standard reference materials during the EC1 and the EC2 plus EC3 steps, where char is defined as EC1 minus OPC and soot as the sum of EC2 and EC3 (Han et al., 2007a, 2016).
Please note that in this manuscript, we interchangeably use the terms “EC” and “BC”. While these terms do not strictly refer to the same component, they serve as an adequate approximation within the scope of this study (Seinfeld et al., 1998; Bond et al., 2004). We use “EC” when discussing emissions and modeling components, reserving “BC” for climate-related discussions. Throughout this manuscript, the term “OC” refers to the total organic carbon (sum of the dissolved OC and the particulate OC).
2.5 The particle size analysis
The grain size of dust-fall samples was measured using a laser particle analyzer (Malvern Mastersizer 2000, UK). The particle size distribution was calculated for 100 grain size classes within a range of 0.02–2000 µm. Sample preparation for grain size analysis included wet oxidation of organic matter by adding 10 mL of 30 % hydrogen peroxide (H2O2) per 1.5 g dry sample. Carbonates were dissolved by boiling with 10 mL (10 % HCl) over 10 min. The glass beakers were filled with 150 mL distilled water and suspended particles were left to deposit. After siphoning the supernatant water, 10 mL of 0.05 N sodium hexametaphosphat [(NaPO3)6] were added, and the residue was dispersed for 5 min in an ultrasonic bath before measurement (Lu and An, 1997), the results are expressed as volume percentages.
2.6 Collection of Meteorological Factors
Meteorological data used in this study were obtained from the Qinghai Meteorological Bureau during the sampling period. Monthly meteorological parameters, including wind speed (WS), wind direction (WD), temperature (Temp), relative humidity (RH), Precipitation (RF), sunshine duration (SUN), and the frequency of visibility ≤ 10 km (VIS), were collected from four national-level meteorological stations: XZH, GEM, DLX, and NMH. All of these stations are standard meteorological observatories established by the state, equipped with standardized monitoring capabilities, and provided continuous and reliable data for this study (https://data.cma.cn, last access: 13 January 2026). In addition, two atmospheric dust deposition sampling sites (LTC and BLX) were established specifically for collecting dust samples. Due to field-monitoring constraints and research-budget limitations, no meteorological instruments were deployed at these two sites.
2.7 Statistical analysis
2.7.1 Estimation of Secondary Organic Carbon
Organic carbon consists of primary organic carbon (POC) and secondary organic carbon (SOC). Due to the intricate physical and chemical processes involved, SOC in urban atmospheres cannot be directly measured. Therefore, an indirect estimation method, known as the EC tracer method, has been developed (Turpin and Huntzicker, 1991). If the concentrations of OC and EC are available and primary OC from non-combustion sources (OCnon-comb) can be disregarded, EC can be utilized as a tracer for POC from combustion sources, facilitating the estimation of SOC (Turpin and Huntzicker, 1995):
where OCtotal represents total organic carbon.
Traditional methods for determining ()pri involve regressing OC and EC within a fixed percentile range of the lowest () ratio data (typically 5 %–20 %) or relying on sampling days characterized by low photochemical activity and local emissions (Castro et al., 1999; Lim and Turpin, 2002). However, these approaches are limited by their empirical nature, lacking clear quantitative criteria for selecting the data subsets used to establish ()pri, defined as the hypothetical primary ratio. In this study, we employed the minimum R squared (MRS) method (Millet et al., 2005; Wu and Yu, 2016; Wu et al., 2018) to determine ()pri. This method calculates a set of hypothetical ()pri and SOC values to identify the minimum correlation coefficient (R2) between SOC and EC, allowing for the accurate derivation of ()pri. The computational procedure followed the algorithm developed by Wu and Yu (2016) (available at: https://sites.google.com/site/wuchengust, last access: 6 January 2026), implemented within the Igor Pro environment (WaveMetrics, Inc., Lake Oswego, OR, USA). Due to the limited dataset size and low temporal resolution, the MRS analysis was performed collectively across all sampling sites. In this approach, the R2 between SOC and EC was calculated iteratively for a range of ()pri values spanning 0 to 10. The minimum R2 value of 1.33 (Fig. S3) identified the optimal ()pri representative of the true primary ratio.
2.7.2 Quantifying the contributions of playa salt (ps) and non-playa salt (nps) sources
To differentiate the contributions of salt lake sources to water-soluble ions in atmospheric deposition, we adopted a methodology similar to that used for marine aerosols. This approach relies on the ratio of water-soluble ions (SO, Ca2+, K+, Mg2+, Cl−) to Na+ in the salt lakes of the QDB, enabling us to assess the contribution of ps-Na+ components to nps (Zhang, 1987); details in Zhu et al. (2025).
This was accomplished using equations that incorporate total Na+, total Ca2+, the average crustal ratio ()crust = 0.56 (Bowen, 1979), and the average () ratio for Qaidam salt lakes, ()salt lake = 0.06 (Zhang, 1987). Among these, the mass concentration of [SO], [Ca2+], [K+], [Mg2+], [Na+] and [Cl−] were identified as constituents of dust-fall.
2.7.3 HYSPLIT backward trajectory model
Backward trajectory clustering analysis was conducted on sampling points using the TrajStat plugin within Meteoinfo software. Daily backward trajectories for 48 h were calculated from January 2020 to March 2023 and classified monthly based on differences in the horizontal movement direction and velocity of air masses. The trajectories were initiated at Universal Time (UTC) 00:00, with a 6 h increment, originating from 500 m above sea level (Yang, 2014). Meteorological data utilized in this research were obtained from the Global Data Assimilation System (GDAS) provided by the U.S. National Centers for Environmental Prediction (NCEP), covering the period from December 2019 to February 2023 (Meteoinfo software website: http://meteothink.org, last access: 13 February 2025).
2.7.4 PMF model
The PMF is a multivariate factor analysis tool that decomposes a matrix of speciated sample data into two matrices: factor contributions (G) and factor profiles (F). The goal of the PMF model is to solve the chemical mass balance between measured species concentrations and the respective source profiles, with the purpose of minimizing the objective function Q (Eq. 13) based upon the uncertainties (uij) of measured species (Paatero and Tapper, 1994).
where xij is the measured concentration of the jth species in the ith sample at receptor sites. fkj is the source profile of the jth species in the kth factor and gik is the mass contribution of the kth factor in the ith sample. eij is the difference between modeled concentrations and measured concentrations.
The uncertainty for individual species (uij) was defined as the sum of two components: the xij multiplied by an error fraction, and one-third of the method detection limit (MDL). For data below the MDL, concentrations were replaced by MDL and the corresponding uncertainty was set to MDL (Reff et al., 2007). An extended description of the PMF parameters used in this study and error estimate based on the model's Q value, displacement (DISP), and bootstrapping (BS) tests (DISP-BS) are provided in the Supplement. The error assessment and uncertainty data for the PMF source apportionment can be found in Tables S2 and S3, respectively.
2.7.5 Statistical Analysis
A one-way analysis of variance (One-Way ANOVA) was performed to examine the differences in dust deposition flux, soluble ions, carbonaceous components, and trace elements among various monitoring sites and periods. All statistical analyses were conducted in SPSS (IBM SPSS Statistics 26.0.0), with the significance level (P) set at 0.05. Prior to ANOVA, the normality and homogeneity of variance were tested for each dataset. The Shapiro-Wilk test was used to assess normality. If the data met the normality assumption (P>0.05), parametric ANOVA was applied directly. If not, the data were log-transformed and retested; if the transformed data still violated this assumption, the non-parametric Kruskal-Wallis H test was used instead. In this study, all datasets were confirmed to follow a normal distribution. Homogeneity of variance was verified using Levene's test; meeting this assumption (P<0.05) is a prerequisite for conducting ANOVA. When the overall ANOVA result was significant (P<0.05), indicating that at least two group means differed statistically, a post-hoc test was performed. Given the potentially unequal sample sizes among groups, Tukey's Honestly Significant Difference test was used for pairwise comparisons to identify specific inter-group differences. Data in this study are presented as mean ± 1 standard deviation (Mean ± 1 SD).
Furthermore, to investigate the influence of meteorological conditions on the chemical composition of atmospheric dust, Pearson correlation analysis was applied to quantitatively assess the linear relationships between meteorological factors (e.g., wind speed and direction, relative humidity) and chemical components in dust (e.g., OC, EC, water-soluble ions). The underlying assumptions of the Pearson correlation (continuous variables, bivariate normal distribution, and linearity) were verified. All variables were tested for normality using the Shapiro-Wilk test and screened for outliers. For data that did not meet the normality assumption, log transformation was applied. The significance of correlation coefficients was tested using the t-test, with P<0.05 considered statistically significant.
3.1 Atmospheric dust deposition flux and water soluble ions concentration
The DF in the southern QDB is 5.41 ± 5.33 g m−2 30 d, slightly lower than that of the Lake Aibi Basin (10.77 g m−2 30 d) (Li et al., 2022), but higher than the surrounding areas of Akatama Salt Lake (2.93 g m−2 30 d) (Wang et al., 2014). Specifically, DF was 4.67 ± 4.96 g m−2 30 d in rural and 5.97 ± 5.73 g m−2 30 d in urban areas. During the HP, DF in rural and urban areas were 4.62 ± 4.15 and 4.95 ± 5.25 g m−2 30 d, respectively. In contrast, NHP showed increased DF values of 4.77 ± 4.42 g m−2 30 d (rural) and 7.66 ± 6.09 g m−2 30 d (urban) (Fig. 2). Notably, Urban DF during NHP demonstrated a 54.6 % increase relative to HP, while rural DF rose by 7.1 % (not statistically significant), contrasting previous findings that associated elevated DF with HP coal combustion (Cheng and Lin, 2009; Gao et al., 2013; Guo et al., 2010; Qi et al., 2018). We hypothesize that the increase in DF during the NHP is attributed to seasonal meteorological variations such as wind speed (Yang et al., 2024), and heightened anthropogenic emissions associated with tourism (Zhang et al., 2011). The NHP coincides with the peak tourist season (May–September) in the QDB, which receives about 17 million visitors annually, a number that continues to rise (Qinghai Provincial Bureau of Statistics, 2024a). This elevated human activity likely enhances local emissions, contributing to increased dust deposition during this period. The influence of meteorological factors on dust deposition will be further examined in Sect. 3.5.
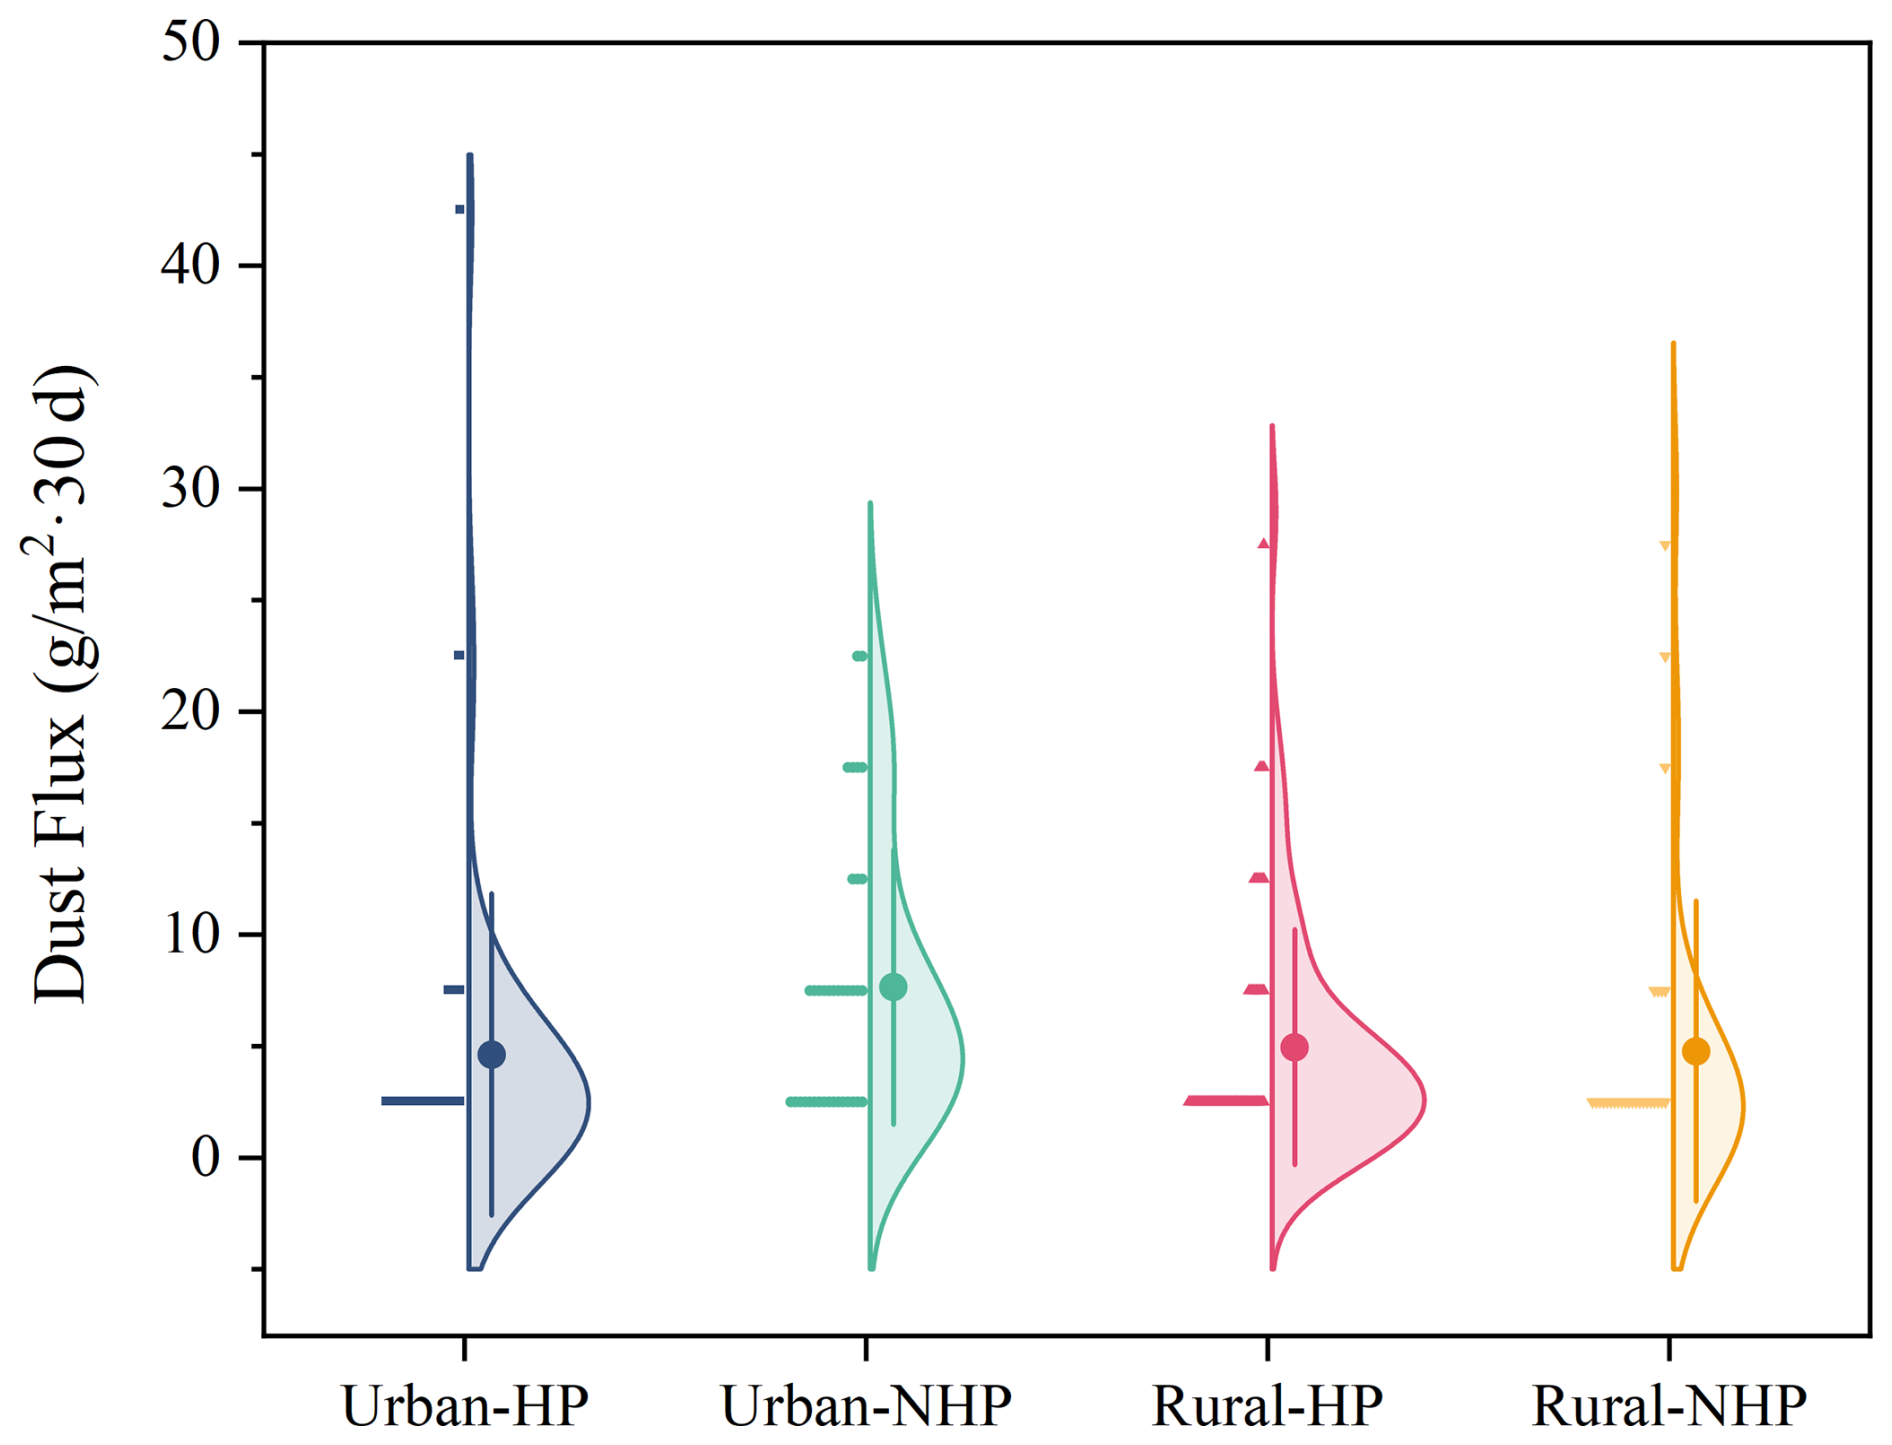
Figure 2Dust flux distribution in urban and rural. The distribution of dust flux in four contexts: Urban with domestic heating period (Urban-HP), Urban with non-HP (Urban-NHP), Rural with domestic heating period (Rural-HP), and Rural with non-HP (Rural-NHP). Each violin plot illustrates the density distribution of dust flux values, with the central dot representing the mean, and the vertical lines indicating the interquartile range.
Water-soluble ion concentrations differed between rural (115.31 mg g−1) and urban (72.81 mg g−1) areas (not statistically significant). In rural, water-soluble ion content was greater during the HP than in the NHP, while the opposite trend was observed in urban areas (not statistically significant) (Figs. 3 and S5). We categorized the water-soluble ions in dust deposits into ps and nps based on their sources, following the model of marine aerosols (Zhu et al., 2025). Playa salt content consistently surpassed nps in rural areas across both periods, while urban areas showed the opposite trend (not statistically significant). Notably, during the NHP, ps content in urban and rural increased by 54.46 % and 36.86 % respectively (not statistically significant). Backward trajectory analysis indicated that airflow in both rural and urban areas primarily originated from the northwest QDB and the eastern Tarim Basin during the HP, while during the NHP, it was influenced more broadly by the salt lake of the QDB (Figs. S6 and S7), aligning with the observed variations in ps content. A similar increase in summer sea salt and non-sea salt ions has been reported in Rajkot, India, attributed to ocean wind direction (Gupta and Dhir, 2022).
The ratio of in soluble ions is used to differentiate between coal combustion (fixed sources) and vehicular emissions (mobile sources) (Arimoto et al., 1996; Shen et al., 2008). The higher ratio in urban areas compared to rural areas (Fig. S8) indicates that during the study period, stationary sources (e.g., industrial emissions, coal, and biomass combustion) contributed more significantly to the ionic composition of urban dust-fall (Pipal et al., 2019). In contrast, the ratio was considerably lower during the NHP than during HP, suggesting that mobile sources likely played a more important role in the dust ionic composition during the NHP. Generally, emissions from coal combustion and biomass burning was intensified in northern China during the HP (Liu et al., 2016a), while vehicle emissions dominate during the NHP (Xu et al., 2012), supporting the reliability of this analysis. Nevertheless, further investigation integrating atmospheric emission inventories, source tracers, aerosol physicochemical processes, and meteorological conditions is warranted.
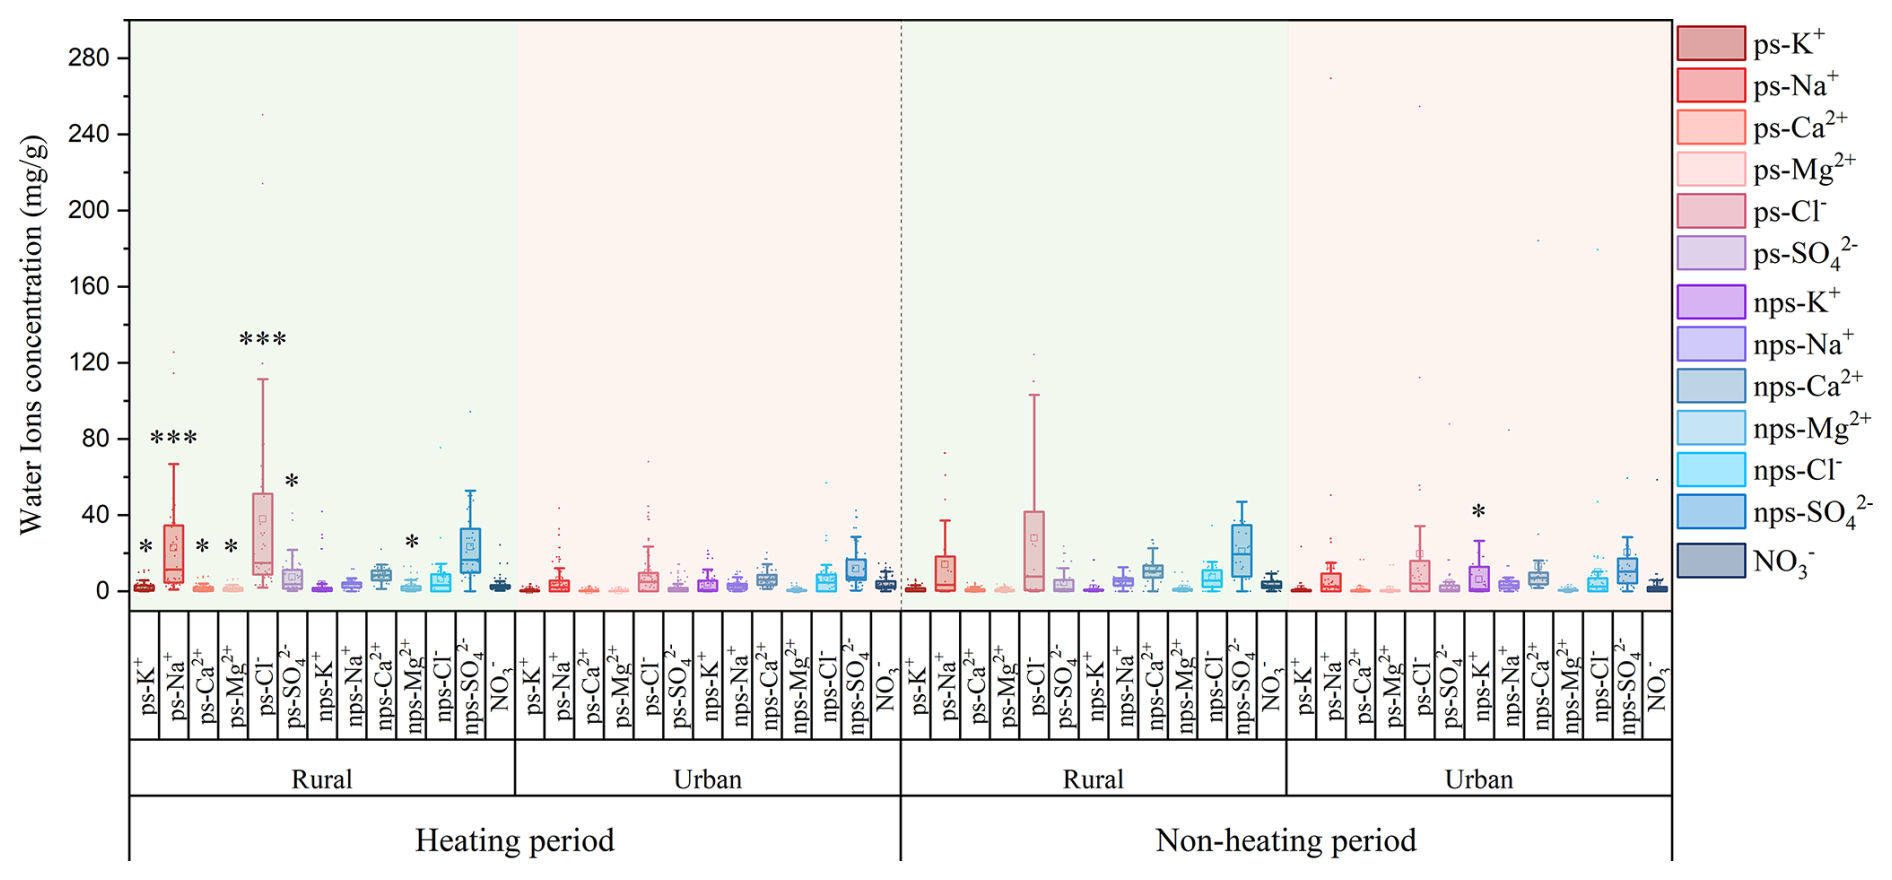
Figure 3Concentrations of water ions in rural and urban across different seasonal periods (domestic heating and non-domestic heating periods). Asterisks indicate statistically significant differences between sites, with * P<0.05; P<0.01; P<0.001.
3.2 Carbonaceous element compositions
3.2.1 Organic carbon and elemental carbon
The average total carbon (TC) concentration in the southern QDB was 4.87 ± 4.18 mg g−1, significantly lower than that of Huangshi, Hubei province (25.15 ± 11.79 mg g−1) and Washington (157 ± 3.2 mg g−1), Kumasi in West Africa (28 mg g−1) and Xi'an (14.6 ± 5.8 mg g−1) (Han et al., 2007a, 2009b; Zhan et al., 2016; Bandowe et al., 2019), suggesting relatively low carbon emissions in the southern QDB. Average OC and EC levels in QDB (3.48 and 1.41 mg g−1, respectively) are markedly lower than those in Xi'an (7.4 and 7.2 mg g−1, respectively), Wuhu (33.26 and 22.49 mg g−1, respectively), and Nanchang (25.15 and 11.46 mg g−1, respectively) (Han et al., 2009a; Deng et al., 2014; Zhang, 2014), but significantly higher, particularly for EC, than in Nam Co (0.35 mg g−1) (Chen et al., 2015).
In urban, TC content (4.75 ± 4.47 mg g−1) was marginally lower than the rural level (5.02 ± 3.79 mg g−1), although this difference was not statistically significant. Contrasting spatial patterns emerged for carbon components: EC dominated urban areas (1.46 ± 1.60 mg g−1), while OC prevailed in rural (2.25 ± 1.92 mg g−1) (not statistically significant) (Figs. 4 and S9). This disparity may be attributed to the long-term combustion of biomass, coal, and wood in rural settings (Na et al., 2004). It may also be associated with meteorological conditions, particularly heightened solar radiation resulting from reduced primary emissions in rural areas, which facilitates the formation of SOC (Xu et al., 2018; Wang et al., 2019). Overall, the contents of OC and EC showed small difference between rural (3.73 and 1.33 mg g−1, respectively) and urban aeras (3.28 and 1.47 mg g−1, respectively).
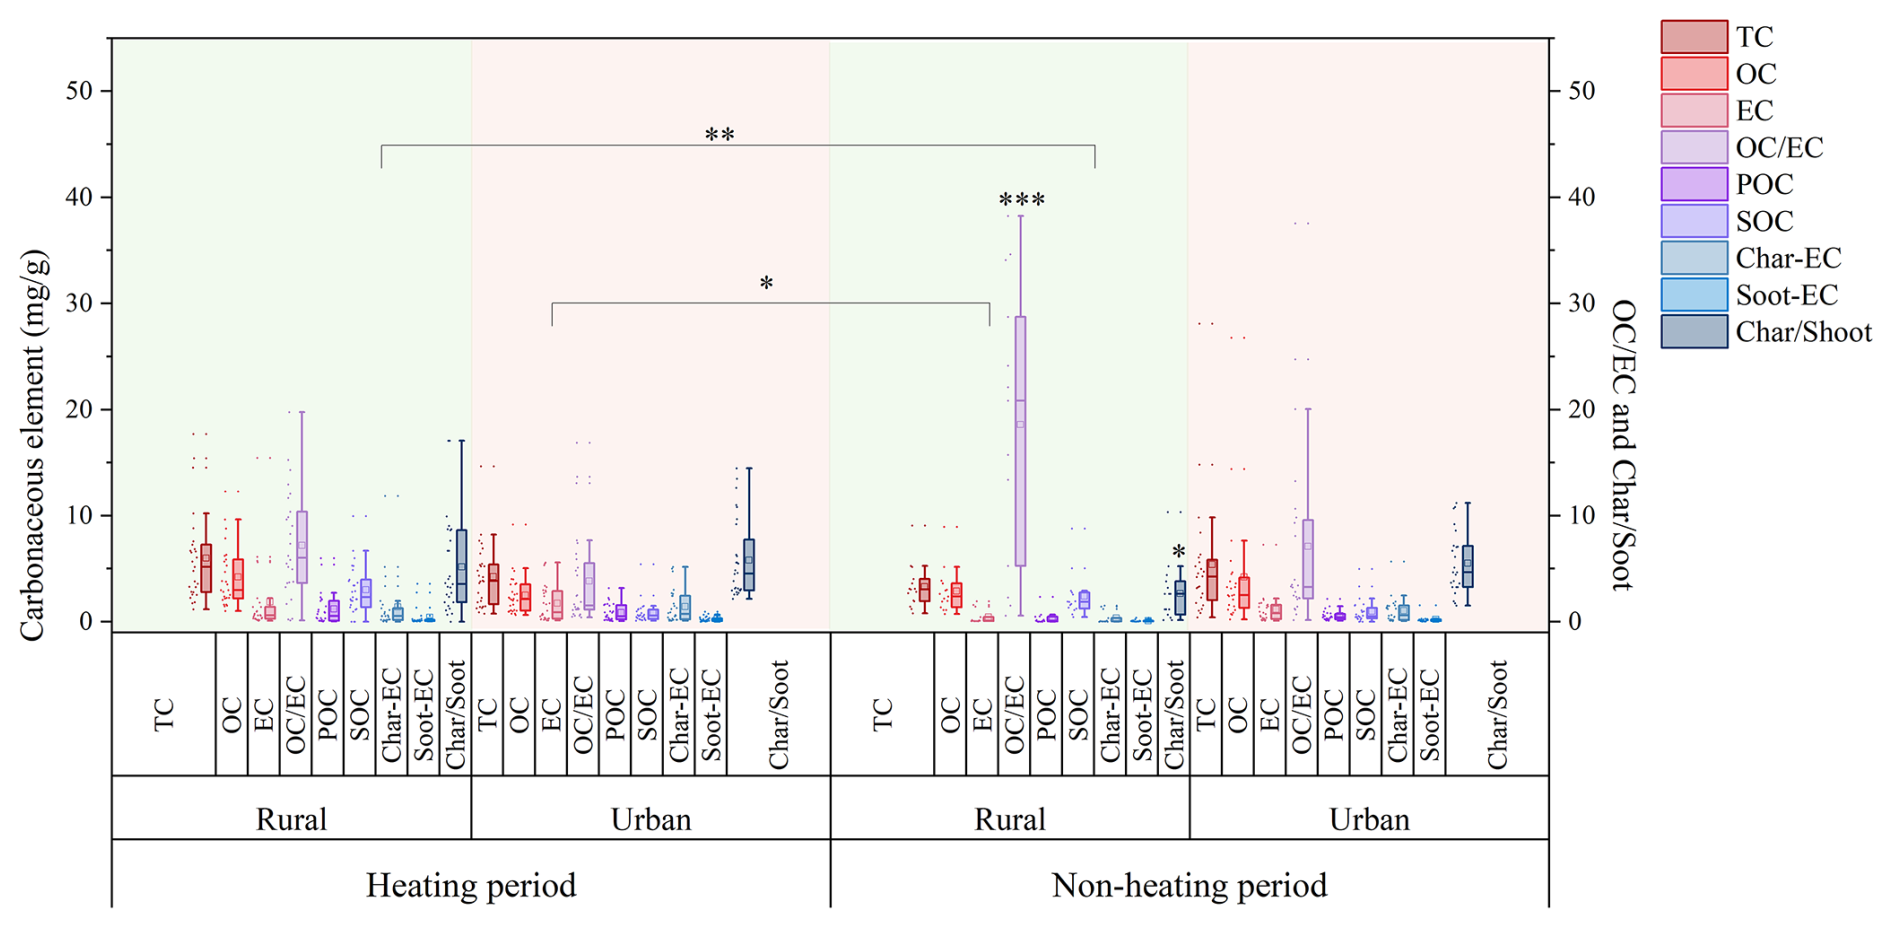
Figure 4Concentrations of organic carbon (OC), elemental carbon (EC), secondary organic carbon (SOC), primary organic carbon (POC), char-EC, soot-EC and , ratios in different sites (Rural, Urban) and seasonal variations (domestic heating and non-domestic heating period). Significant differences are indicated by asterisks (* P<0.05; P<0.01; P<0.001).
Seasonal analysis revealed elevated carbonaceous compound concentrations, specifically OC and EC, during the HP (not statistically significant). This increase is primarily due to local domestic heating activities coupled with adverse meteorological conditions, such as low temperature, weak winds (Oliveira et al., 2007; Gong et al., 2017), weak atmospheric turbulence, and frequent atmospheric inversions (Guo et al., 2016). Rural emissions primarily stem from coal and biomass burning for heating and cooking (Zhang et al., 2000; He et al., 2004), contributing to reduced OC and EC content in the NHP, whereas elevated EC levels in urban areas are primarily linked to vehicular and industrial sources. Spatiotemporal transport dynamics show EC depletion during rural ward pollutant migration due to atmospheric dispersion, particularly affecting coarse particulate fractions.
Notably, rural carbon emissions exceed urban levels in the southern basin, potentially attributable to extended HP duration (7 months) compelling low-grade fuel (crop residues, wood, raw coal and yak dung) utilization (Na et al., 2004). In contrast, urban areas benefit from solar/wind energy infrastructure and government-led clean heating initiatives (suitable electricity for electricity policy), achieving 66.63 % clean heating penetration (Qinghai Provincial Bureau of Statistics, 2024b), leading to a comparatively lower TC content.
The ratio is a valuable indicator of carbonaceous aerosol sources. In this study, Urban areas exhibited stable ratios ranging from 0.15 to 16.89 (mean = 3.97), whereas rural areas showed significantly higher ratios during NHP (18.58 ± 12.80) compared to HP (7.20 ± 4.99) (P<0.001) (Figs. 4 and S11). Typically, the ratio for vehicle emissions ranges from 0.7 to 2.4, for coal combustion emissions from 0.3 to 7.6, and for biomass burning from 3.8 to 14.5 (Schmidl et al., 2008; Gonçalves et al., 2010; Pio et al., 2011; Popovicheva et al., 2016).
These findings suggest that urban ratios (0.15–16.89) are primarily associated with vehicle and coal combustion, while rural ratios (0.14–38.25) are predominantly linked to coal and biomass burning. The rural ratios are significantly higher than those in urban areas (P<0.001), which is consistent with the general distribution pattern of carbonaceous aerosols and reflects a greater contribution of SOC (Zhang et al., 2008; Sandrini et al., 2014). The higher ratio typically indicates a greater contribution from biomass combustion; in this study, the ratio of rural was 10.99 ± 10.00, which is significantly lower than values recorded in Nam Co in Xizang (16.3 ± 4.4) (Chen et al., 2015), yet higher than those observed in India (8.47) and Shanxi (0.7–1.6), Beijing (1.9–2.7), and Tianjin rural (2.66) (Zhang et al., 2007; Saud et al., 2013; Cheng et al., 2015; Wang et al., 2021). This finding indicates that carbonaceous aerosols in rural QDB derive from both fossil fuel combustion and biomass burning, with a pronounced influence from the burning of wood, yak dung, and similar biomass fuels, suggesting source specificity.
3.2.2 Char-EC and Soot-EC
Elemental carbon is classified into soot and char (Han et al., 2009b), with char-EC and soot-EC defined as EC1 minus OPC and the sum of EC2 and EC3, respectively (Han et al., 2007a). Char-EC is typically produced from biomass burning at relatively low temperatures, whereas soot-EC originates from high-temperature coal combustion and automotive emissions (Zhu et al., 2010; Cao et al., 2013). The ratio, like the ratio, serves as an indicator of carbon aerosol sources. Since char and soot are mainly generated through combustion processes, their ratio is typically influenced by two key factors: the primary emission source and the deposition removal efficiency. For localized PM, such as in urban areas, the removal rate is generally negligible (Han et al., 2009a).
Char-EC constitutes 75.88 % of rural EC (74.71 % HP; 78.84 % NHP) and 85.00 % of urban EC (85.58 % HP; 84.11 % NHP) (Figs. 4 and S10), demonstrating its dominance across spatial and temporal scales (not statistically significant). Research suggests that char-EC constitutes a larger proportion of coarse PM, while soot-EC is more predominant in fine particles, resulting in extended atmospheric residence times for soot-EC due to reduced deposition velocities (Han et al., 2009b). The increased levels of char-EC during the urban HP are linked to complex sources, including biomass fuel usage and transportation emissions, resulting in elevated char concentrations in urban areas and along busy roadways (Kim et al., 2011).
The ratios for automobile emissions, coal combustion, and biomass burning are 0.60, 1.9, and 11.6, respectively (Chow et al., 2004; Chuang et al., 2014). Generally, high-temperature combustion (e.g., vehicle and industrial processes) yields lower char and soot concentrations, while low-temperature combustion (e.g., household cooking and biomass burning) results in higher ratios (Han et al., 2009a, 2016). Differences in ratios between urban and rural areas across seasons may be linked to wheat straw burning, contrasting with minimal vegetation combustion impacts in cities like Xi'an (Cao et al., 2005). The ratio for dust-fall observed in this study (4.97; Figs. 4 and S11) is slightly higher than those recorded in Jinchang (3.84) (Han et al., 2009a) and Daheihe, Inner Mongolia (3.2) (Han et al., 2008). The relatively stable concentration of soot-EC in this study, along with the elevated ratio, suggests a correlation with higher coal consumption among local residents and industries. This indicates that, in comparison to other regions, carbon emissions in the remote QDB are predominantly sourced from coal and biomass burning, supporting ratio findings. Furthermore, the ratio is elevated during HP (not statistically significant), highlighting the predominant influence of coal and biomass burning in rural areas during HP, while fossil fuel impacts are more pronounced in NHP.
3.2.3 Primary and secondary organic carbon
Aerosol samples with low ratios typically exhibit low concentrations of POC, which mainly comprises primary carbonaceous compounds. The MRS method enables discrimination of OC into POC and SOC (Sect. 2.7.1) (Yoo et al., 2022; Liu et al., 2023a). Secondary organic carbon constitutes a dominant fraction of OC in atmospheric aerosols. Research on carbonaceous aerosols in various Chinese cities indicates that SOC contributes 67 % (53 %–83 %) and 57 % (48 %–62 %) to rural and urban OC, respectively (Zhang et al., 2008), marginally lower than the 72.61 % observed in this study (Figs. 4 and S12). This is likely because SOC formation relies on solar radiation, the QDB experiences high levels of solar energy (Liu et al., 2017), which may facilitate photochemical oxidation of VOCs into SOC (Hama et al., 2022).
During the NHP, rural areas exhibit the highest ratio of 87.32 % (Fig. S13), while urban areas record the lowest ratio of 52.94 % during the HP. This trend reflects elevated potential for photochemical activity and reduced contributions from POC, likely due to local emission sources, such as traffic and coal combustion (Mbengue et al., 2018). The high ratio suggests that SOC largely displaces OC. Our findings indicate that SOC levels are greater in rural areas (78.44 %) compared to urban regions (67.78 %) (not statistically significant), which consistent with the observation of higher ratios in rural areas likely attributable to significant coal consumption for domestic heating, which enhances emissions of semi-volatile organic compounds and organic gases (Dan, 2004). As for seasonal variations, studies in California show an increase in SOC levels during warmer months, which is consistent with our results (Na et al., 2004). This contrasts with the broader observation that higher temperatures typically lead to lower SOC concentrations (Strader et al., 1999; Sheehan and Bowman, 2001). This discrepancy may stem from varying sources of SOC emissions throughout the seasons, necessitating further investigation in conjunction with other carbonaceous indicators.
This study conducted a comparative analysis of carbonaceous element concentrations in atmospheric dust-fall and road dust between the QDB and other global regions (Table S4). To ensure data comparability, the selected road dust samples consisted of directly collected in-situ dust without resuspension treatment. The results revealed that the concentrations of TC, OC, and EC in QDB (4.87, 3.48, and 1.41 mg g−1, respectively) were significantly lower than those in industrial or urban areas such as Bolu, Turkey; New Delhi, India; and Ezhou, China, and were even lower than many other Chinese cities (Table S4). The low concentrations of OC and EC in QDB indicate minimal anthropogenic pollution influence in this region, and the data can represent the regional background values of carbonaceous components in atmospheric dust-fall in the arid inland areas of East Asia (Chen et al., 2019a). This is crucial for global models assessing the emission fluxes of carbonaceous aerosols from dust source regions. In contrast, extremely high values of carbonaceous elements were found primarily in urban road dust from locations like Bolu, Turkey (TC: 605.2 mg g−1), Gwangju, South Korea (TC: 31.97 mg g−1), and Xi'an, China (TC: 36.53 mg g−1), indicating strong influences from traffic emissions (mainly non-exhaust emissions) (Wei et al., 2015; Lee et al., 2018; Demir et al., 2022). For atmospheric dust-fall in major cities like New Delhi, India, and Wuhan, China, the carbonaceous components are affected by the combination of traffic emissions (diesel vehicle emissions being a major source of EC), industrial activities, and emissions from dense populations (Deng et al., 2014; Zhang, 2014; Zhan et al., 2016; Mishra and Kulshrestha, 2017).
The ratio in QDB (7.09) is an intermediate level. It is much lower than that in regions dominated by biomass burning, such as Kumasi, West Africa (17.07) and Huainan, China (21.4), but is higher to ratios found in cities like Gwangju, South Korea (5.63) and Ulaanbaatar, Mongolia (5.69) (Lee et al., 2018; Bandowe et al., 2019; Liu et al., 2020b). We primarily analyzed the ratios in cities across different regions of China to reveal the influence of varying economic development levels.
Figure 5 presents spatial variations in urban ratios across China. The findings reveal that the Northwest region, represented by QDB urban and Xi'an (XA) (Han et al., 2009b), exhibits a significantly lower ratio (2.50 ± 1.47) compared to central regions, including Nanchang (NC) (Zhang, 2014), Huangshi (HS) (Zhan et al., 2016), Wuhu (WH) (Deng et al., 2014), Xiaogan (XG) (Zhan et al., 2022), and Huainan (HN) (Liu et al., 2020a), where the ratio is 5.86 ± 7.81. This ratio is also lower than that observed in eastern cities such as Beijing (BJ) (Tang et al., 2013), Tianjin (TJ) (Ma et al., 2019), and Shijiazhuang (SJZ) (Guo et al., 2018), which have a ratio of 6.83 ± 2.77. This pattern is consistent with the trends in atmospheric PM ratios (Xie et al., 2023), suggesting that the carbon in the dust of the QDB urban primarily results from coal combustion and industrial emissions, leading to elevated EC concentrations and lower ratios (Liu et al., 2022a). Conversely, cities with higher economic development, such as Beijing and Tianjin, characterized by greater population density and income levels, typically experience secondary pollution, resulting in higher ratios.
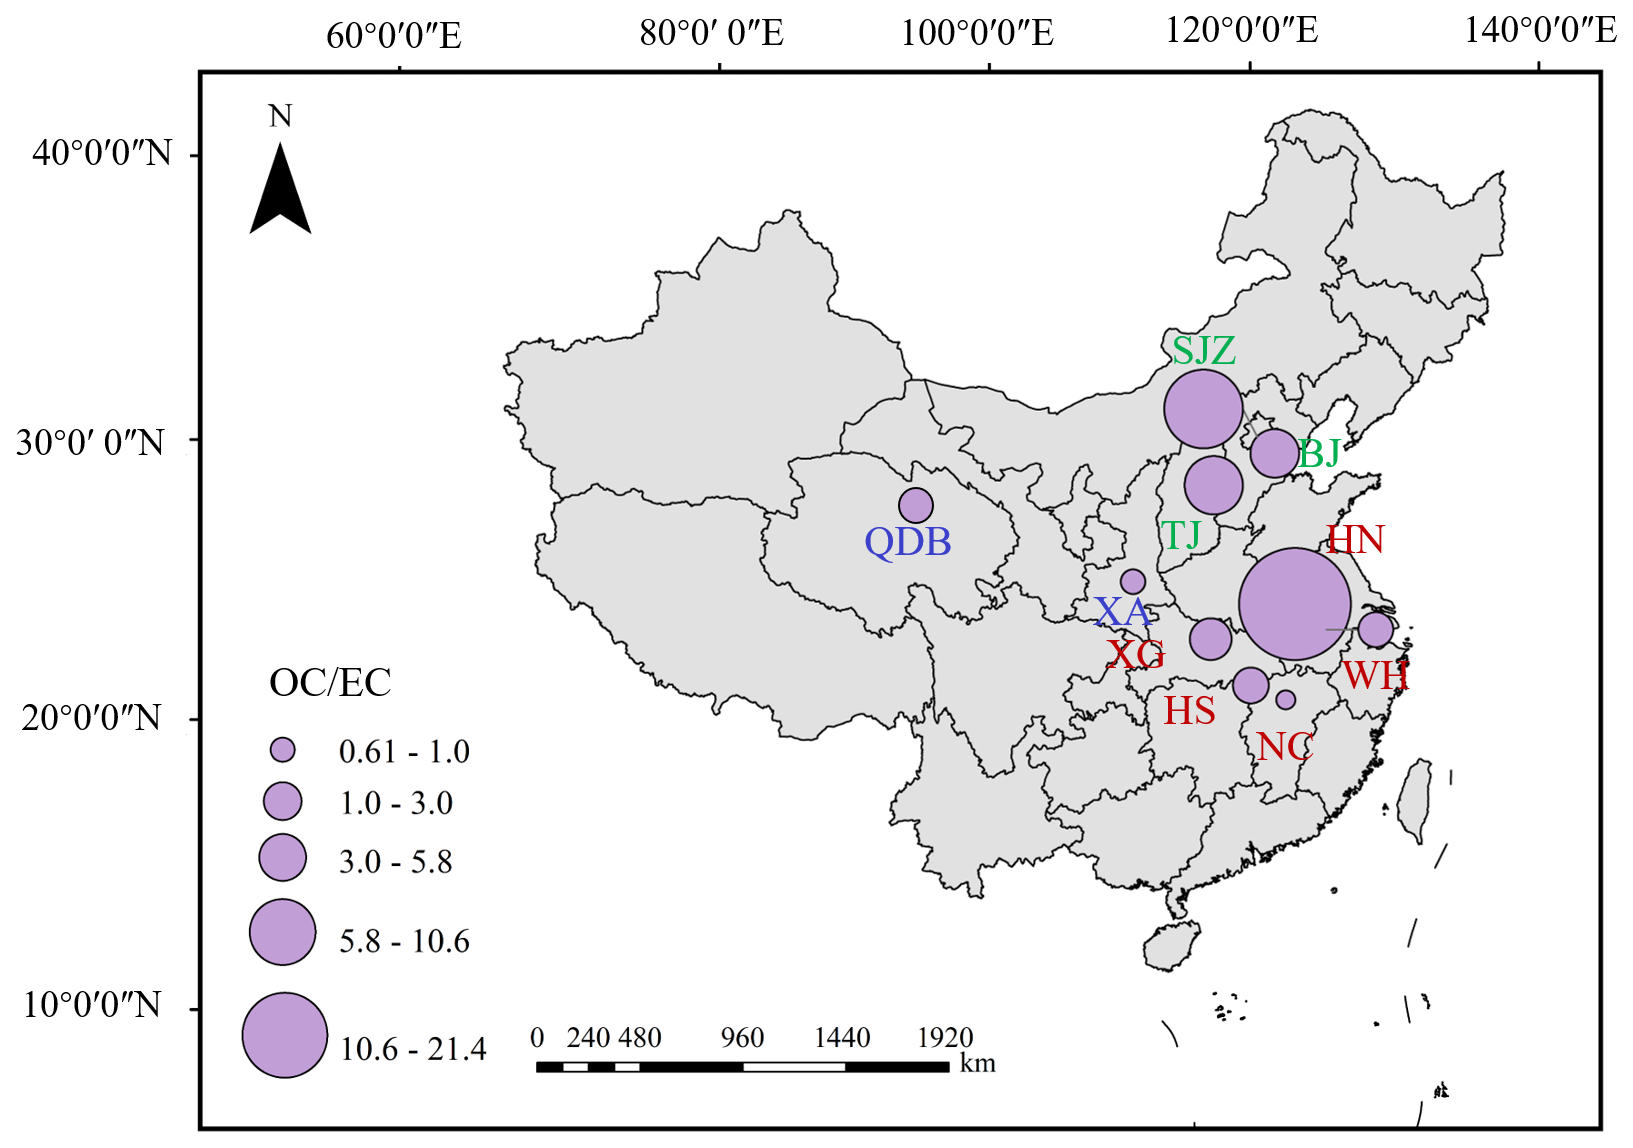
Figure 5Distribution of ratios across various regions of China. Blue designations represent the Northwest region, red indicates the Central region, and green denotes the Eastern region. The circle size reflects the magnitude of the ratios.
While the MDCO sampler effectively captures dry deposition flux, the reported OC and EC values must be interpreted with specific limitations in mind. First, passive sampling is governed by aerodynamic drag and gravitational settling; therefore, the collected OC is likely skewed toward the coarse fraction (e.g., re-suspended soil, biological debris) while potentially under-representing fine-mode anthropogenic combustion aerosols which have negligible settling velocities. This implies that the OC fluxes reported here should be interpreted as fluxes of deposited particulate OC, not as a direct surrogate for total atmospheric OC. Second, the extended exposure period inherent to passive sampling may lead to negative artifacts due to volatilization. Semi-volatile organic compounds may partition from the particulate to the gas phase, a process accelerated in environments with high solar radiation and ambient temperatures (Turpin et al., 1994). Consequently, the OC fluxes reported here likely represent a conservative lower limit. Finally, environmental factors such as wind speed and humidity affect collection efficiency. High wind speeds can induce turbulence leading to the resuspension of lighter organic particles from the collector, while high humidity may facilitate chemical or biological degradation of the organic fraction prior to laboratory analysis (Chow et al., 2011). Taken together, these processes imply that the OC collection efficiency of the MDCO sampler is not a fixed quantity but varies with temperature, relative humidity, precipitation, wind direction and other environmental factors. The role of these meteorological factors in atmospheric dust deposition is examined in detail in Sect. 3.5.
The ratio in QDB is notably high at 5.04, significantly exceeding that of other regions such as Xi'an (0.99) and Wuhan (0.09) (Wei et al., 2015; Liu et al., 2021). Char-EC primarily originates from incomplete combustion processes like biomass burning and coal combustion. Soot-EC mainly derives from high-temperature combustion sources such as fuel oil and diesel vehicle exhaust (Han et al., 2009a). The exceptionally high ratio in QDB strongly indicates that its limited carbonaceous components predominantly originated from relatively inefficient combustion sources. These potentially included coal or small-scale biomass burning for local residential/expedition activities (e.g., heating, cooking) and possibly long-range transported biomass burning products (e.g., from forest/agricultural fires in South or Southeast Asia) (Han et al., 2009a, 2016). In contrast, the very low ratios observed in cities like Wuhan and Xi'an clearly point to traffic source emissions as their primary contributor, a finding likely influenced by the specific focus of those studies on road dust.
However, we fully recognize the fundamental differences in sources and composition between road dust and atmospheric dust-fall. Road dust is primarily secondary dust formed from traffic activities, construction dust, soil particles, and resuspended deposited atmospheric particles, with its carbonaceous composition strongly reflecting intense local anthropogenic emissions (Casotti Rienda and Alves, 2021). In contrast, atmospheric dust-fall integrates contributions from local sources, regional transport, and even long-range transport. Therefore, direct comparison between these two may introduce bias when interpreting regional pollution characteristics and the degree of anthropogenic influence, which cannot be overlooked. Building on this analysis, the next phase of this research will focus on the sampling and analysis of fine atmospheric particulate matter (PM2.5 and PM1) to more accurately elucidate the emission levels and environmental and climatic impacts of carbonaceous aerosols in the QDB.
3.3 Trace elements concentration
The total concentration of major (Fe, Si, Al) and trace elements (Ti, Cr, Cd, Cu, Mn, Ni, Pb, V, Zn) was determined to be 8.74 ± 5.82 mg g−1, while arsenic (As) remained below the detection limit in all analyzed samples. Crustally derived elements – Fe, Al, Si, and Ti – dominated the elemental profile, aligning with dust composition patterns reported in Ira, Singapore, and Beijing-Hebei regions, China (Joshi et al., 2009; Qiao et al., 2013; Eivazzadeh et al., 2021). In comparison to cities such as Beijing, Shanghai, Xi'an, and Lanzhou, and Junggar Basin the levels of heavy metals in dust from the QDB are relatively low (Jiang et al., 2018) (Table S5).
The low heavy metal content in dust deposition within the QDB can be attributed to the following factors. The region has sparse human activity, lacks heavy industrial zones and dense urban clusters, resulting in low total anthropogenic emissions of heavy metals. Furthermore, the surface soil in the QDB itself has a low background level of heavy metals, primarily derived from natural sources with relatively weak influence from human activities (Nuralykyzy et al., 2021; Chen et al., 2021). From the meteorological perspectives, the basin's high altitude, strong winds, and arid conditions with minimal precipitation favor the dispersion of atmospheric pollutants. This makes the formation of prolonged stagnant weather conditions unlikely, thereby preventing the accumulation of pollutants and the occurrence of high concentrations near the ground. A particularly unique aspect of the QDB is its role as a significant source of salt dust. The recent study indicates that salt dust emitted from the playa lakes within the basin contributes substantially to atmospheric dust deposition (Zhu et al., 2025). These salt dust particles, composed mainly of soluble salts like NaCl and gypsum, may dilute the relative concentration of non-salt components, such as heavy metals, when released into the atmosphere in large quantities. The combined effect of these factors leads to the observed low heavy metal content in dust deposition in this region.
Throughout both the HP and NHP, trace elements concentrations in urban areas were consistently higher than in rural areas (not statistically significant), with the exception of Ti (Figs. 6 and S14). During the HP, urban levels of Zn, Pb, and Cu were significantly elevated compared to rural areas (P<0.05), and Pb also demonstrated a significant increase in urban during the NHP (P<0.01). In rural, the differences in metal concentrations between HP and NHP were minimal. In contrast, urban areas exhibited higher concentrations of all elements except for Ti, Cd, and Cr during the HP, with Fe and V showing notably elevated levels compared to other regions (not statistically significant). These variations in average concentrations indicate that coal combustion for domestic heating in urban areas contributes to increased atmospheric heavy metal levels (Duan and Tan, 2013; Meng et al., 2017). In contrast, Cd and Cr exhibited mixed anthropogenic sources with limited coal combustion contributions, while Ti concentrations remained stable across seasons, reflecting minimal anthropogenic influence.
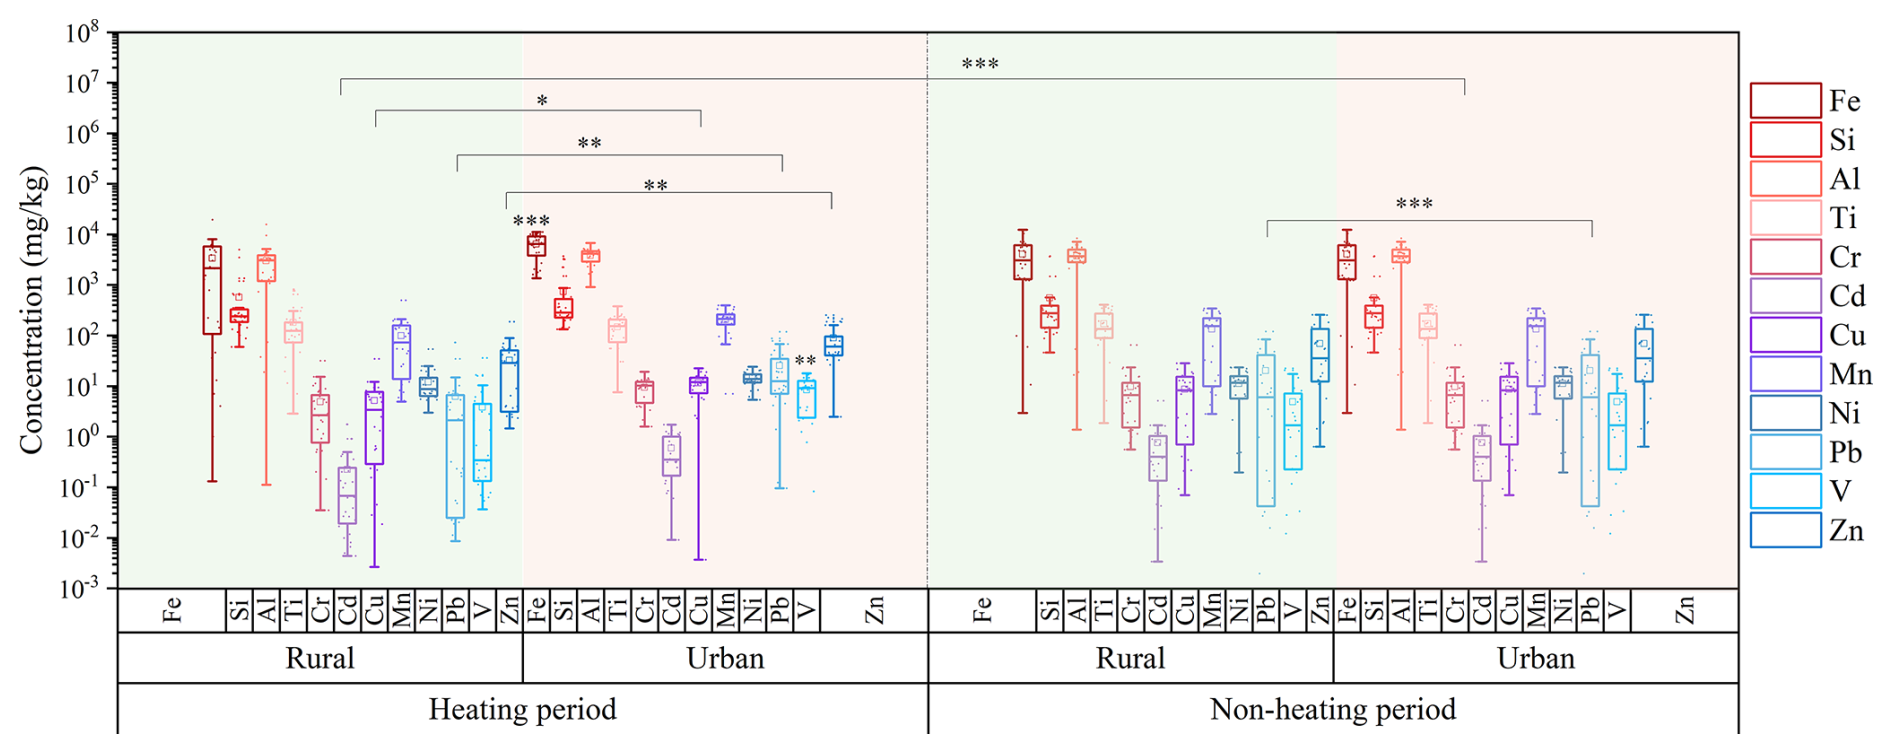
Figure 6Concentration of heavy metals by rural and urban settings during domestic heating and non-domestic heating periods. Significant differences are indicated by asterisks (* P<0.05; P<0.01; P < 0.001).
Analysis of the carbonaceous components in QDB dust deposition reveals more intensive coal combustion in rural areas, yet the heavy metal concentrations in atmospheric deposition are lower than in urban area (not statistically significant). This observation can be explained by the following factors. First, pollution sources in rural areas are relatively singular, whereas urban areas are influenced by more complex heavy metal sources. During the heating period, heavy metals in the rural atmosphere of the QDB mainly originate from coal and biomass combustion. In contrast, urban areas are affected by a wider range of sources, including industrial activities, traffic emissions, and others (Liu et al., 2021; Huang et al., 2021a). Additionally, the dense building layout in urban areas hinders pollutant dispersion, leading to accumulation, while the open terrain in rural areas facilitates dilution and diffusion. This pattern, where rural heavy metal concentrations (particularly Pb, Cr, Cd, As, and other elements associated with coal combustion) are lower than those in urban areas during the heating season, has also been observed in studies conducted in Northeast China, Shanghai, Taiyuan, the Yangtze River Delta, and Southern Nigeria (Shi et al., 2012; Liu et al., 2021; Huang et al., 2021a; Liu et al., 2023b; Hilary et al., 2025).
3.4 Source apportionment
We conducted a PMF source apportionment analysis on soluble ions, trace and carbonaceous elements present in dust, specifically focusing on ps-SO, ps-Ca2+, ps-K+, ps-Mg2+, ps-Cl−, ps-Na+, nps-SO, nps-Ca2+, nps-K+, nps-Mg2+, nps-Cl−, nps-Na+, Fe, Si, Al, Ti, Cr, Cd, Cu, Mn, Ni, Pb, V, Zn, SOC, POC and char-EC, soot-EC. Seven source factors were identified based on prior research and an understanding of potential local sources: salt lakes, soil, traffic emissions, secondary inorganics, biomass and coal burning, and industrial activities (Figs. 7 and S15). A plot of the time series is provided in Fig. S16. The generation of Fig. 7a involved extracting factors identified as the same source from the PMF factor profiles of each site (Urban and Rural) and each heating season (HP and NHP) shown in Fig. S15. The arithmetic mean of the contributions from characteristic species (elements and ions) corresponding to each factor was calculated. Species with average contributions exceeding 20 % were defined as characteristic species of that source in atmospheric dust over the QDB.
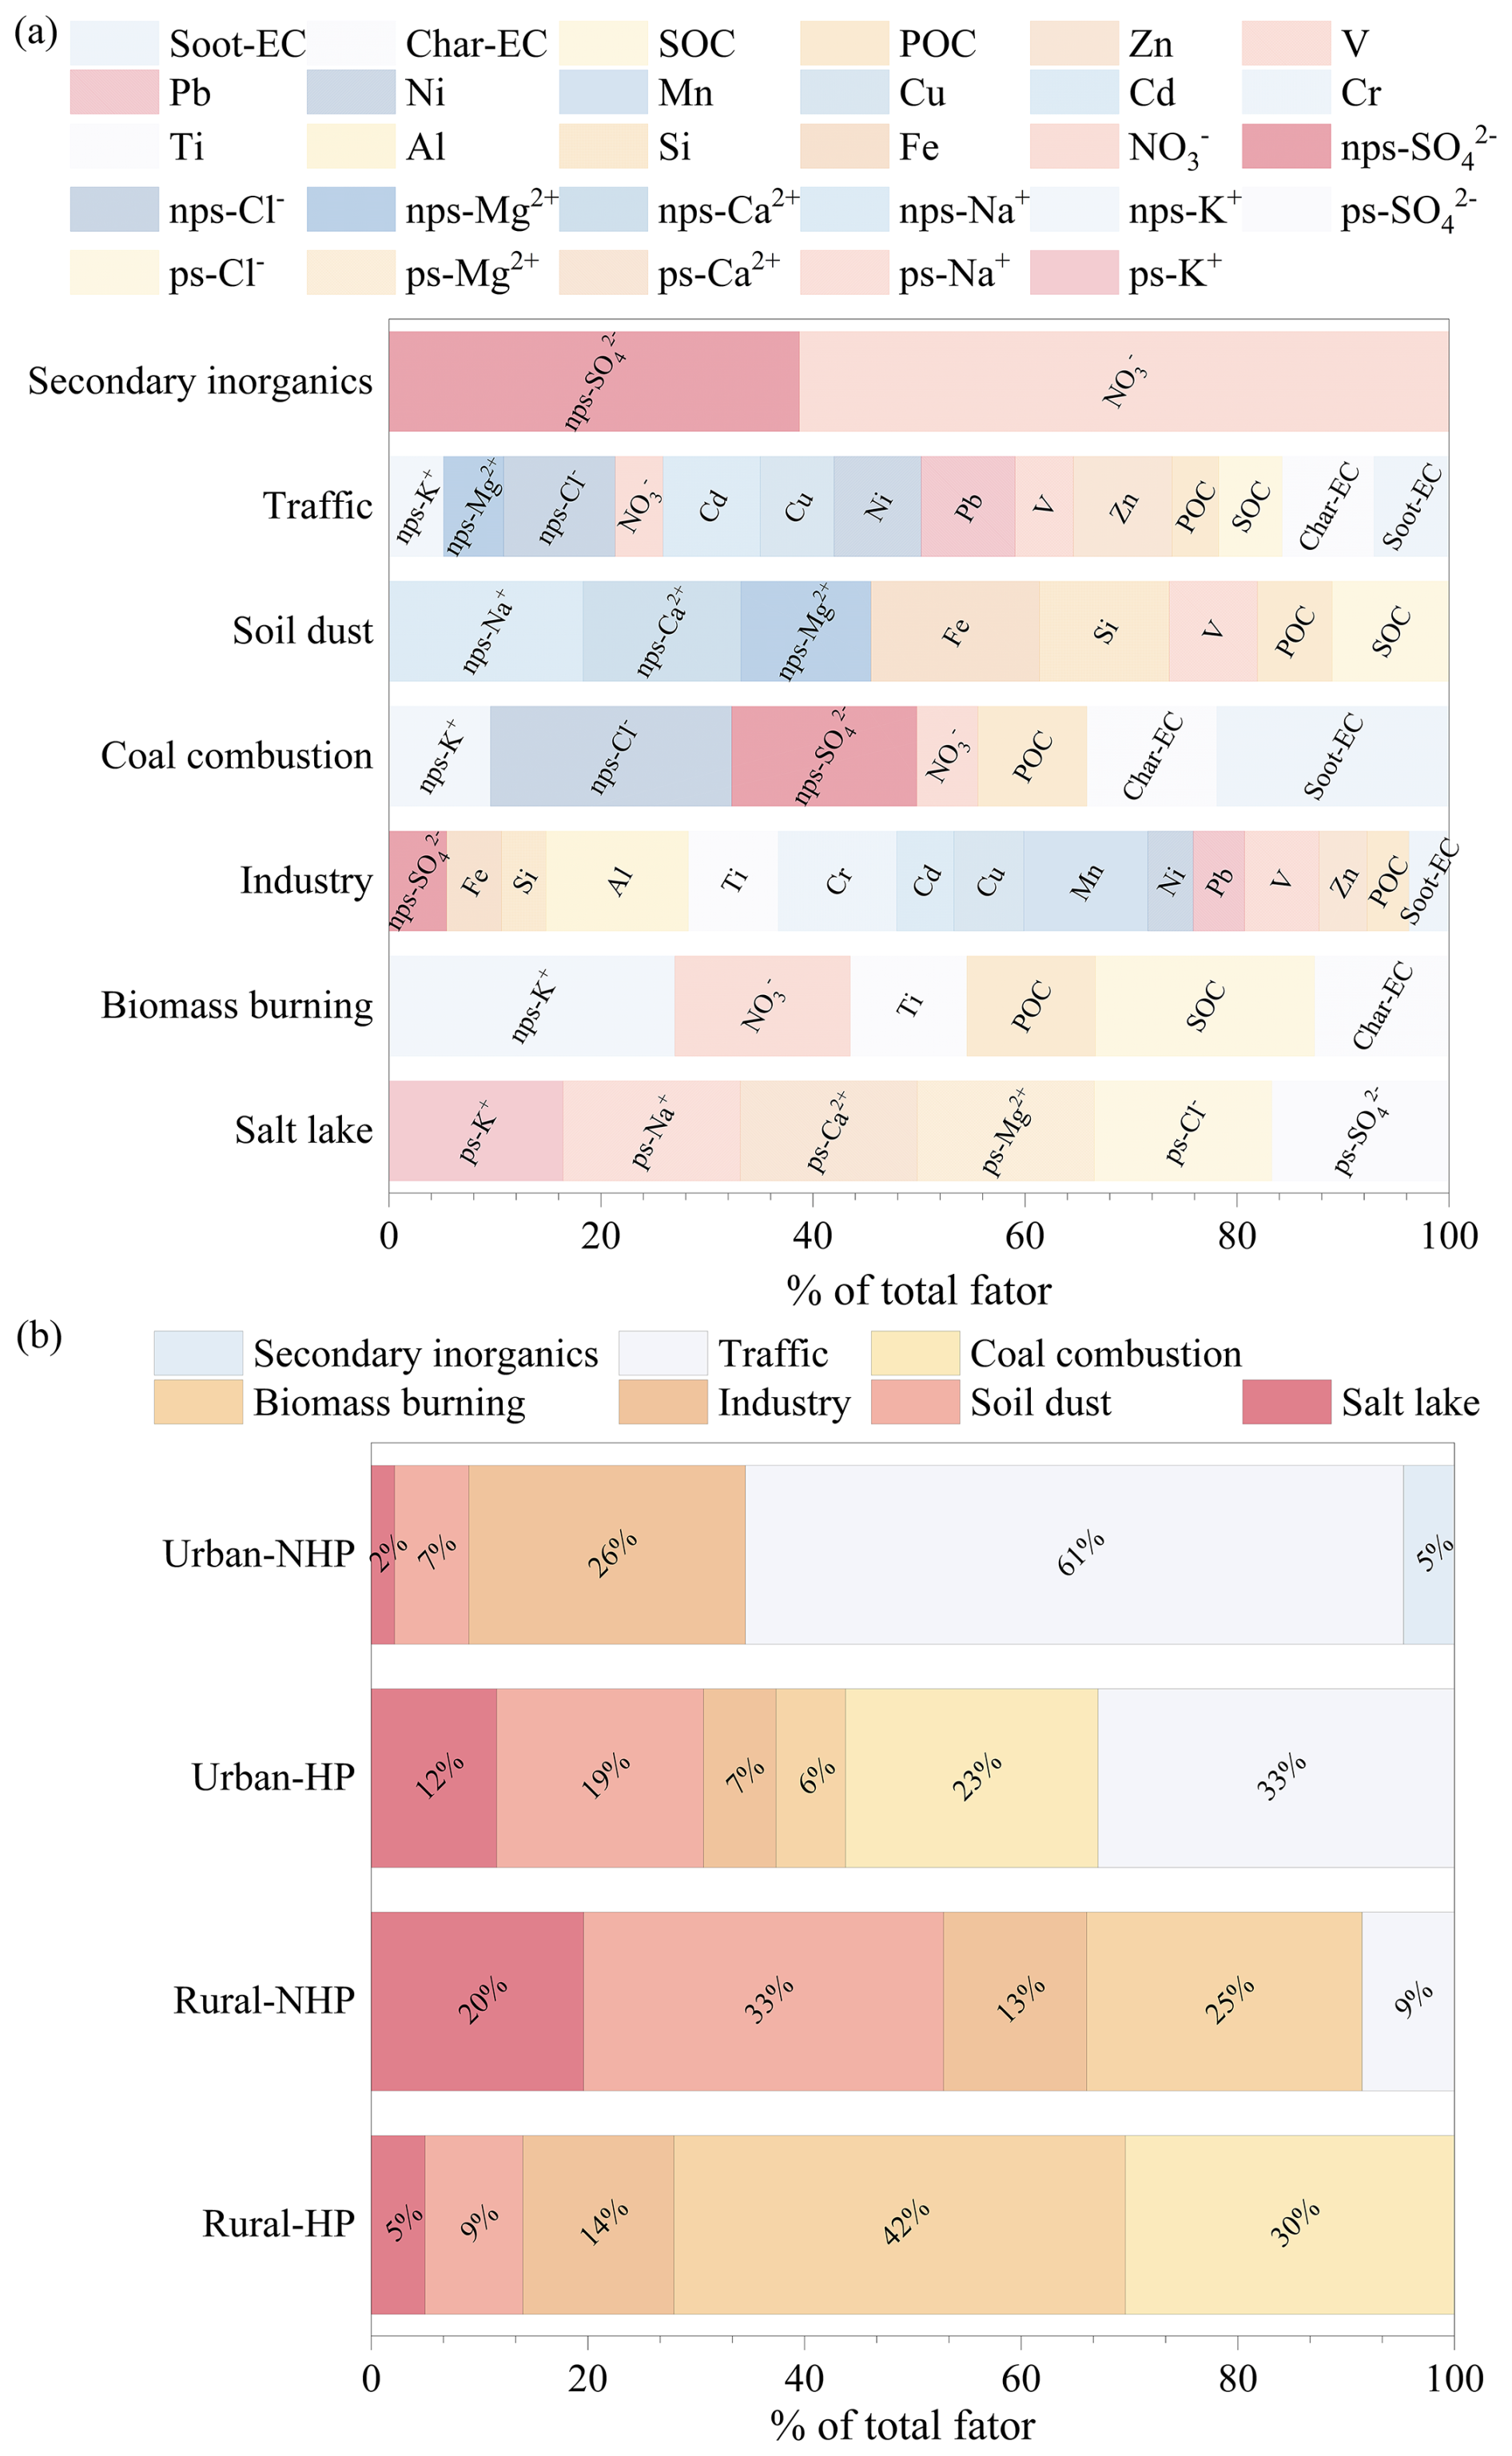
Figure 7Factor profile and contributions in urban and rural area. Panel (a) presents the factor profiles, represented as the arithmetic mean of individual elements across various locations, highlighting only those elements that constitute more than 20 % of each profile. Panel (b) illustrates the contributions of different sources at each location. [HP, domestic heating period; NHP, non-domestic heating period].
The factor profiles for each element in these source categories represent the arithmetic mean of profiles from six stations, with detailed operational methods provided in Sect. S2. The uncertainty of the source contributions was calculated directly from the standard error of the multiple regression coefficients between the deposition flux (independent variable) and the source contribution (dependent variable) at different monitoring sites (Belis et al., 2015; Manousakas et al., 2017). The regression method assumes that all factors explaining the mass have been identified; however, if a significant portion of the mass not directly related to the species in the PMF analysis is omitted, the source contributions may be overestimated, which could be an important additional source of uncertainty. The results are shown in Table S6. It must be noted that this method captures only a portion of the total uncertainty, as it does not include errors from profile uncertainty or rotational ambiguity. The low errors calculated by this method indicate a good model fit. In this study, the sample numbers used for PMF source apportionment were 690, 780, 480, and 750 for the Urban-NHP, Urban-HP, Rural-NHP, and Rural-HP groups, respectively. Limited sample number can increase the risk of model overfitting, reduce the representativeness of source profiles, and potentially lead to the merging of multiple sources into a mixed factor (Norris et al., 2014). Future research will extend the observation period and increase the sample number to further enhance the reliability of the source apportionment results.
The ions ss-Na+, ss-Cl−, ss-SO, ss-Ca2+, ss-K+, and ss-Mg2+ are widely acknowledged as indicators of sea salt (Ambade et al., 2022; Aswini et al., 2022; Gluscic et al., 2023). In this study, we identified ps-Cl− (83.96 %), ps-Ca2+ (83.71 %), and ps-SO (83.71 %), ps-Na+ (83.70 %), ps-Mg2+ (83.66 %), ps-K+ (82.35 %) as key markers of salt lake sources. The contribution of salt lake sources in rural (12.29 %) was higher than in urban (6.87 %). During the HP, the proportion of salt lake sources in rural areas was 4.97 %, compared to 19.61 % in the NHP; urban showed contributions of 2.16 % during the HP and 11.58 % in the NHP, showing opposite seasonal trends. Backward trajectory simulations indicated that during the HP, air mass in both urban and rural areas mainly originated from the northwestern part of the basin and the eastern Tarim Basin, whereas during the NHP, they were broadly influenced by the salt lake regions within the basin (Fig. S6). The minor wind direction differences and the inter-distributed sampling points (Fig. 1), suggests no substantial geographical disparity between urban and rural sites. Additionally, the ion content derived from playa salts in dust deposits increased during the NHP in both areas. Therefore, we propose that the anomalous increase in salt lake contribution during the urban HP may be closely related to human activities. The enhanced Urban Heat Island (UHI) effect and temperature inversion structures during the HP can alter boundary layer height, turbulence, and deposition conditions, thereby increasing the residence time of externally transported particles within the urban boundary layer and elevating their measured contribution (Cichowicz and Bochenek, 2024). Urban heat sources and heating emissions may also modify local transport pathways, leading to more concentrated deposition of dust originating from playa regions over urban areas. Furthermore, dry road surfaces, increased traffic, and construction activities during the HP can promote the resuspension of previously deposited playa dust. The use and subsequent resuspension of road de-icing salts (e.g., NaCl, CaCl2) may further amplify the contribution of tracer ions indicative of playa salts (Gertler et al., 2006; Casotti Rienda and Alves, 2021).
The second factor pertains to soil dust, characterized by trace element such as Fe (47.03 %) and Si (36.22 %), along with ions such as nps-Na+ (54.21 %), nps-Ca2+ (44.05 %), nps-Mg2+ (32.30 %) (Pervez et al., 2018; Tian et al., 2021). Additionally, the proportions of elements such as SOC (32.58 %) and POC (20.84 %) suggest that the dust is likely mixed with fossil fuel emissions. Furthermore, V (24.62 %) was detected at multiple sampling sites, indicating contributions from both soil dust and traffic emissions. Mg, Ca2+, Al, Si, and Fe are typical tracers for soil dust (Liu et al., 2003; Heo et al., 2009). Notably, the contribution of soil dust in rural areas (21.14 %) exceeded that in urban areas (12.97 %), indicating that soil dust is a major source of atmospheric deposition. In urban areas, the contribution during the NHP was relatively low (6.84 %), likely due to higher wind speeds and the effectiveness of frequent summer precipitation (Zhang et al., 2015a).
The third factor is traffic emissions, which are particularly pronounced in urban areas. Key characteristic elements and ions include nps-Cl− (56.71 %), Zn (50.13 %), Cd (49.41 %), Pb (47.84 %), Ni(44.22 %), Cu(37.61 %), nps-Mg2+ (30.54 %), V (29.63 %), nps-K+ (27.74 %), NO (24.35 %) and char-EC (46.71 %), soot-EC (38.12 %), SOC (32.25 %), POC (23.72 %) (Adeniran et al., 2017). In rural areas, traffic emissions contributed 8.52 % to atmospheric deposition during the NHP, whereas in urban areas, the contribution was significantly higher at 46.83 %, with 32.91 % during the HP and 60.75 % in the NHP. These findings correlate with previous studies on and ratios, suggesting that carbonaceous elements in the NHP primarily derive from traffic emissions. The traffic emission factor in the QDB represents a mixture of vehicle exhaust and non-exhaust sources (e.g., tire and brake wear, and resuspended road dust). Elements and ions including V, NO, Ni, and carbonaceous components primarily associated with vehicle exhaust (Cong et al., 2011; Zhang et al., 2012). For instance, Ni can be emitted from fuel combustion and vehicle exhaust (Pacyna and Pacyna, 2001). In contrast, elements such as Cu, Zn, nps-Mg2+, and nps-K+ originate from non-exhaust vehicle emissions, including brake and tire wear, as well as the resuspension of road dust (Amato et al., 2014). For example, Zn may derive from the wear of rubber tires on roads (Rogge et al., 1993), Pb emissions may be related to wear (tires/brakes) (Smichowski et al., 2007), and Cu is associated with brake wear (Lin et al., 2015). Furthermore, the presence of crustal elements and ions such as Fe, Si, and nps-Mg2+ in the traffic emission factor for Urban-NHP, Urban-HP, and Rural-NHP suggests an additional contribution from resuspended road dust (Chen et al., 2019b).
The fourth factor is coal combustion, characterized by high concentrations of nps-Cl− (75.40 %), nps-SO (57.87 %), nps-K+ (31.75 %), NO (19.10 %), and soot-EC (72.54 %), char-EC (40.63 %), POC (34.10 %) (Kundu and Stone, 2014; Contini et al., 2016). Zhang et al. (2023) found that coal combustion emits particles rich in Cl−. Coal combustion was more intense at site LTC in rural areas and at site DLX in urban areas. Coal combustion occurs exclusively during the HP, contributing 30.38 % in rural areas and 23.31 % in urban areas. These results align with earlier studies on carbonaceous aerosols, indicating that the carbon content from coal combustion emissions is higher in rural than in urban aeras. Consistent with northern China, air pollution in QDB urban has declined due to the adoption of clean heating technologies (Zhang et al., 2021; Xue et al., 2023). However, rural coal combustion remains a major source of carbonaceous aerosols during the HP.
The fifth factor, biomass burning, is characterized by significant concentrations of non-precipitating species, including nps-K+ (56.99 %), NO (34.97 %), Ti (23.26 %) and SOC (43.68 %), char-EC (26.78 %), POC (25.60 %) (Simoneit, 2002; Sulong et al., 2019). K+ serves as an important tracer for biomass burning (Cachier and Ducret, 1991). Biomass burning contributes 33.55 % to rural atmospheric dust deposition, with a higher proportion during the HP (41.67 %) compared to NHP (25.43 %). In urban, biomass burning is primarily observed during the HP, contributing only 6.41 %. These findings underscore biomass burning as a major source of carbon emissions in rural settings, aligning with the prevalent use of biomass fuels for cooking and domestic heating in Northern China's rural areas (Meng et al., 2019), where 70 % to 80 % of energy demand are fulfilled by materials such as dung cakes, firewood, charcoal, and crop residues (Tao et al., 2018; Shi et al., 2019). Furthermore, increased biomass burning is also associated with the autumn harvest period (Chen et al., 2017; Li et al., 2021).
The sixth factor pertains to industrial emissions, which are characterized by high concentrations of Mn (61.98 %), Cr (59.22 %), Ti (44.90 %), V (37.17 %), Cu (34.95 %), Cd (28.63 %), Fe (27.47 %) Pb (25.75 %) and Zn (24.03 %) (Almeida et al., 2015; Yao et al., 2016). These elements were consistently detected across all sampling sites, alongside Al (71.17 %), nps-SO (28.84 %), Si (22.24 %) and POC (20.95 %), soot-EC (19.97 %), which indicate potential contributions from soil dust. Zn, Cu, Fe, and Mn are major chemical components in industrial emission profiles; Cd is a trace element found in metallurgical industries (Xu et al., 2022), while Zn and Mn emitte from oil combustion, metallurgy, and steel manufacturing processes (You et al., 2017). Pb and Cd are associated with metal smelting and processing (Fang et al., 2021). Industrial emissions showed greater contributions during the HP at XZH and at DLX. In rural areas, industrial emissions constitute 13.57 % of carbon output, with contributions of 13.95 % during the HP and 23.20 % during the NHP. In urban areas, industrial emissions account for 16.12 % overall, with 6.69 % during the HP and 25.55 % in the NHP. Due to the abundance of non-ferrous metal resources (e.g., lead-zinc ores), oil, natural gas, and saline minerals (e.g., potassium, lithium) in the QDB, the primary industrial activities are mining and associated chemical industries. Particularly around the GEM and DLX sites, the presence of numerous Pb-Zn, Fe, and Cu mining enterprises leads to significant contributions from industrial emissions to urban dust fallout, making it one of the major sources of air pollution in the basin.
The seventh factor is secondary inorganic aerosols, primarily composed of NO (72.46 %), nps- SO (45.79 %) (Liu et al., 2015, 2016a). High mass loadings of NO and SO are characteristic of typical secondary inorganic aerosols (Huang et al., 2021b). Research indicates that NO and SO primarily result from the conversion of gaseous precursors, such as SO2 and NOx, through photochemical reactions, predominantly sourced from local and regional emission (Liu et al., 2015; Tao et al., 2013). Secondary inorganic aerosols are predominantly observed in urban areas during the NHP, where they contribute 4.70 % to total aerosol sources. This increase is likely due to elevated temperatures and enhanced solar radiation during this period, which promote photochemical activity (Pandolfi et al., 2010).
Dust deposition sources exhibit significant seasonal and spatial variations. In the QDB, coal combustion (26.85 %) and biomass burning (24.04 %) dominate during HP, transitioning to traffic emissions (34.64 %), soil dust (20.04 %) and industry emission (19.37 %) as the primary contributor in NHP. Rural areas predominantly contribute to dust through biomass burning and coal combustion, as well as natural sources like windblown dust and salt lake emissions. This pattern aligns with increased coal usage for winter domestic heating and heightened biomass burning for cooking and heating in rural areas. In urban, dust deposition is briefly influenced by anthropogenic activities, including traffic and industrial emissions, with minimal contributions from domestic heating. Such differences can be attributed to varying economic development models, industrial and energy structures, and levels of human activity (Kataki et al., 2016).
Time series analysis (Fig. S16) indicates that atmospheric dust deposition in rural areas primarily originates from natural processes and dispersed anthropogenic combustion due to sparse human activities. During the NHP, the contribution of salt-lake emissions increases in May and June. Strong winds in spring and summer in southern QDB transport saline soil particles, making them a key source of dust deposition (Zhu et al., 2025). Soil-derived dust shows variations highly synchronized with the salt-lake source, with elevated contributions also occurring in May and June, reflecting the natural erosion of exposed surfaces under high wind conditions (Zhang, 2010). Traffic contributions rise noticeably in July and August, likely linked to increased summer tourism and transportation. During the HP, contributions from biomass and coal combustion increase, peaking from November to January. This peak is attributed to the widespread use of biomass fuels such as livestock dung for decentralized heating in rural areas, leading to increased particulate matter emissions (Chen et al., 2023). In contrast, contributions from salt lakes and wind-blown dust decrease significantly, likely due to lower wind speeds and reduced natural source emissions in winter (Jiménez et al., 2018; Li et al., 2019a; Yang et al., 2024).
In urban areas, where human activities are more concentrated, pollution sources are dominated by centralized anthropogenic emissions (industry, traffic, and centralized heating), with temporal trends driven by both industrial activity and the heating cycle. During the NHP, industrial contributions increase, especially in towns such as GEM and DLX, where surrounding mining operations constitute a major anthropogenic source (Zhu et al., 2016). Traffic-related contributions follow a trend similar to that in rural NHP, also peaking in July and August, reflecting the common influence of increased vehicle flow during the tourism season. Meanwhile, precursors such as SO2 and NOx from industrial and traffic emissions undergo photochemical and gas-to-particle conversion under summer sunlight, enhancing the formation of secondary inorganic aerosols (e.g., SO, NO) (Zhang et al., 2013; Ma et al., 2017). During the HP, trends in salt-lake emissions, soil dust, and coal/biomass combustion are generally similar to those in rural areas. However, unlike in rural regions, traffic contributions in urban areas continue to increase during the HP, highlighting the higher intensity and less seasonally-variable nature of human activities in towns (Peng et al., 2021).
This study observed that the contribution of biomass burning to atmospheric dust deposition in rural areas of the QDB during the HP was higher than that of soil dust. Given that the collected dust samples had particle sizes >10 µm, while biomass burning typically emits aerosols in the submicron range, we propose several potential explanations. Firstly, during the HP, factors such as increased soil moisture and snow cover significantly suppress soil dust emission, resulting in a lower intensity than in other seasons (An et al., 2018; Yang et al., 2019). Simultaneously, biomass and coal burning for heating increases substantially, leading to intense, short-term emissions of fine particles. Although it was fine initially, these high-concentration ultrafine particles can undergo coagulation or coalescence, aggregating with each other or onto pre-existing coarse particles, thereby increasing their size (Butler and Mulholland, 2004; Kulmala et al., 2004; Li et al., 2020). Furthermore, fine particles from biomass burning (e.g., carbonaceous materials) may mix internally with coarse particles like soil dust or salt dust from the QDB, forming internally mixed particles (Li et al., 2003; Hand et al., 2010). During source apportionment, such coarse particles are more likely to be attributed to the biomass burning source. Additionally, the QDB is a significant source of salt dust (Zhu et al., 2025). Salt dust particles (e.g., halite, gypsum) provide excellent condensation nuclei for soluble substances emitted from biomass burning, greatly promoting hygroscopic growth (Li et al., 2003; Kumar, 2010; Wang, 2013). The basin's topography also favors stable inversion layers, inhibiting pollutant dispersion and allowing particles more time to grow, mix, and age in the atmosphere. Prevailing wintertime winds may also transport pollutants from surrounding regions into the basin.
Moreover, the dust in this study was collected using a passive sampler. Over 90 % of the collected dust particles were smaller than 100 µm, with approximately 25 % less than 10 µm (Fig. S2), indicating the presence of fine particles (<10 µm), albeit in a relatively small proportion. The particle size distribution of atmospheric dust deposition is similar to that of TSP, with both primarily consisting of particles smaller than 100 µm. Using PMF source apportionment, this study identified a notably high contribution from biomass burning in rural areas, particularly during the heating period. Similarly, studies on atmospheric TSP in Iran (Ashrafi et al., 2018), the QXP (Lulang) (Zhao et al., 2013), Northeast China (Jia et al., 2024), and Qingdao (Liu et al., 2022b) have also reported significant contributions from biomass and coal combustion. This suggests that contributions from biomass and coal combustion can indeed be observed in particles larger than 10 µm. Finally, the PMF model may have uncertainties in resolving sources with similar chemical profiles. If the chemical compositions of local soil dust and biomass burning particles overlap after long-range transport and complex atmospheric reactions, the model might not fully separate them (Cesari et al., 2016).
3.5 Influence of meteorological factors
Meteorological parameters critically influence the accumulation and dispersion of airborne pollutants. To examine their impact on the chemical composition of dust deposition in this study, monthly data for temperature, humidity, precipitation, wind speed and direction, sunshine duration, frequency of visibility ≤ 10 km were obtained from four monitoring stations (XZH, GEM, NMH, DLX) during the study period (Table 1 and Fig. S17). Data from the LTC and BLX sites were excluded from this analysis due to a lack of on-site meteorological instrumentation.
Table 1Meteorological conditions at the monitoring stations during the sampling periods.
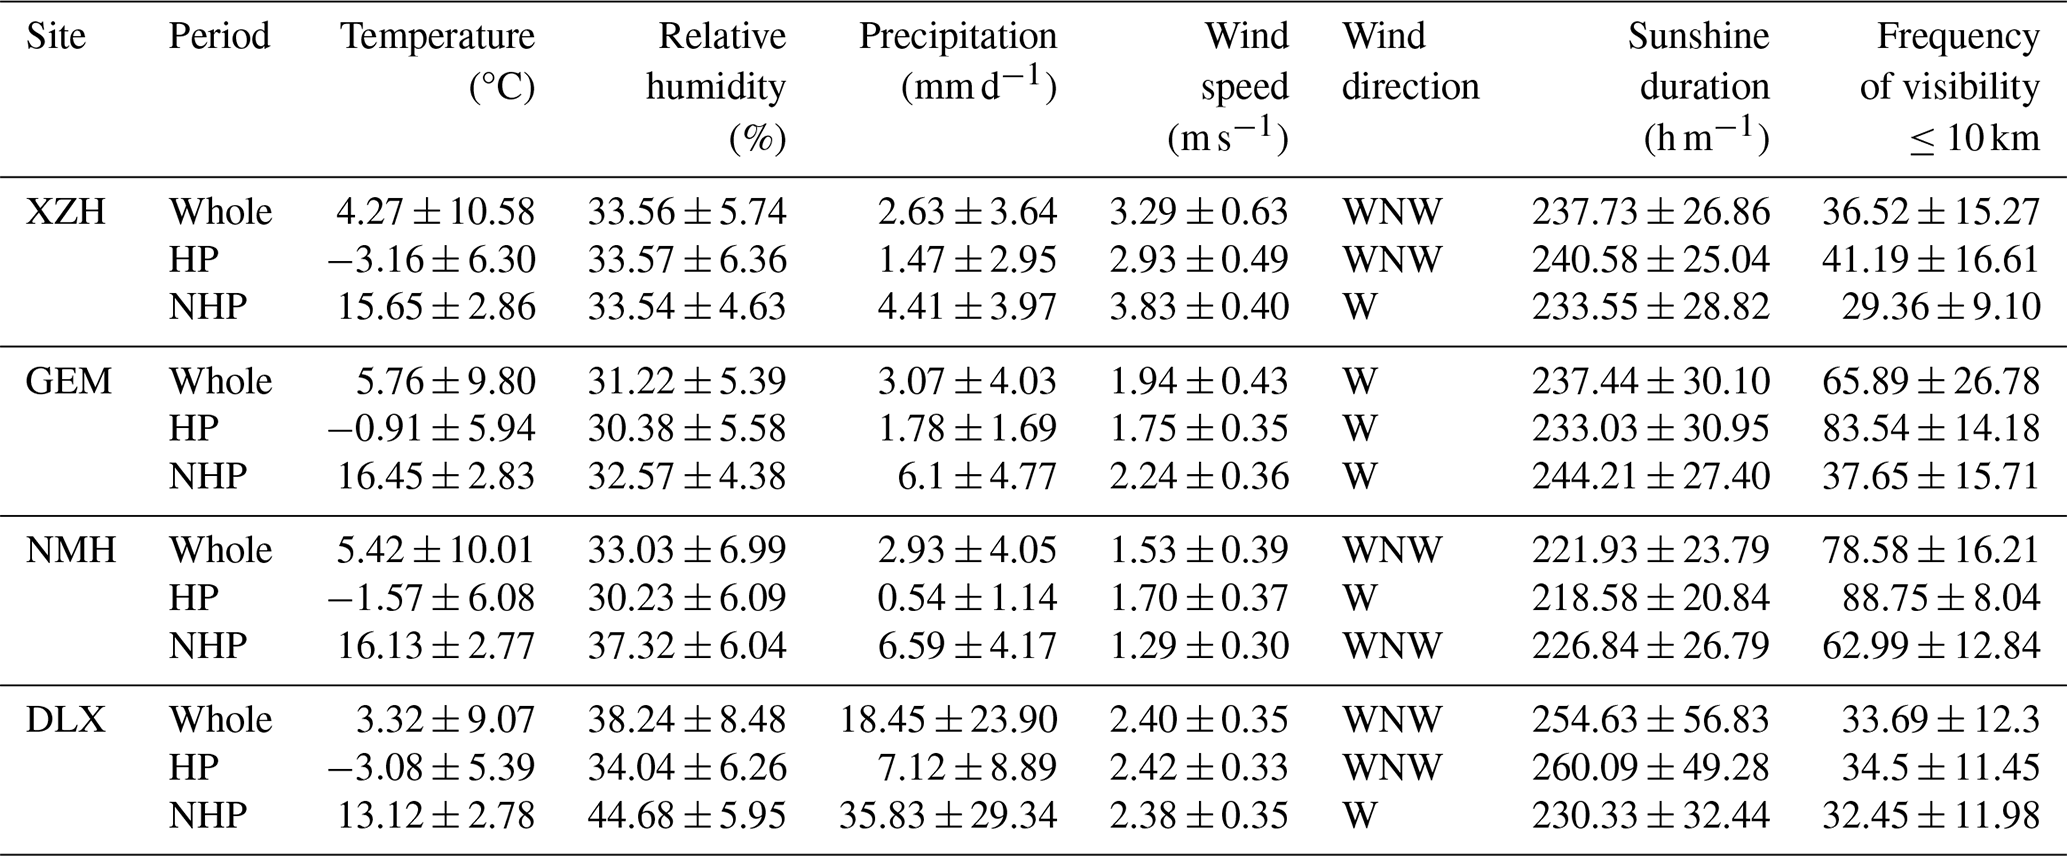
Note: HP = heating period; NHP = non-heating period.
Based on ANOVA results, wind speed and temperature were significantly higher during the NHP (P<0.05), promoting dust emission and consequently increasing atmospheric dust flux (Jiménez et al., 2018; Li et al., 2019b; Yang et al., 2024). However, at DLX, wind speed showed no significant seasonal difference, while precipitation and relative humidity were significantly higher in the NHP (P<0.05). Since precipitation is a known suppressor of dust deposition (Li et al., 2019b), meteorological factors were not the primary driver of the elevated dust flux at DLX during the NHP (Fig. S18); other factors, such as increased tourism, likely played a more important role. Additionally, correlation analysis revealed that dust and salt dust flux were positively correlated with the frequency of visibility ≤10 km and wind speed (P<0.05) and negatively correlated with relative humidity (P<0.05), consistent with previous findings (Wei et al., 2023).
Pearson correlation analysis further elucidated the relationships between dust chemical components and meteorological parameters. Ions derived from salt lake (ps ions) and crustal elements (e.g., Al) showed significant correlations with wind direction and speed (P<0.05, Fig. S19), indicating the dominant control of wind on the emission and transport of both playa salt and soil dust. During the HP in both rural and urban areas, relative humidity was negatively correlated with ps ions and crustal elements (P<0.05), suggesting that higher humidity promotes the removal of airborne particles (Deshmukh et al., 2011). Playa salt ions are hygroscopic, so higher relative humidity facilitates their deliquescence (Rörig-Dalgaard, 2021). The mean annual relative humidity in the QDB (about 34 % RH) is notably lower than Wuhan (75.4 % RH) (Zang et al., 2021), Handan (63.35 % RH) (Meng et al., 2016), Pearl River Delta region (67.05 % RH) (Yue et al., 2015), Jorhat, India (80.29 % RH) (Rabha et al., 2021) and other regions, providing favorable conditions for the long-range transport of salt-lake-derived particles.
For nps ions, nps-Cl− (a tracer of coal combustion) during the HP was positively correlated with wind direction (P<0.05, Fig. S19), indicating downwind transport. In contrast, nps-K+ (a tracer of biomass burning) was negatively correlated with wind speed and solar radiation (P<0.05), consistent with the observed peak in combustion contributions during winter when solar radiation is the lowest. Increased wind speed may suppress biomass-burning intensity (Zhang, 2024), while higher solar radiation can reduce smoldering-phase nps-K+ emissions and enhance photochemical removal of aerosols (Kuang et al., 2020; Huang and Gao, 2021).
For carbonaceous components (Fig. S20), in the rural NHP, soot-EC, OC, and the ratio were positively correlated with precipitation and negatively with the frequency of visibility ≤10 km (P<0.05). In the rural HP, the ratio was positively correlated with precipitation. In the urban NHP, char-EC, soot-EC, and their ratios showed positive correlations with humidity and precipitation (P<0.01), while POC was positively correlated with the frequency of visibility ≤10 km (P<0.01). Total carbon, OC, and SOC were negatively correlated with wind speed (P<0.05). In the urban HP, EC and char-EC were negatively correlated with the frequency of visibility ≤10 km; POC was positively correlated with wind speed and solar radiation but negatively with the frequency of visibility ≤10 km (P<0.05); and the ratio was positively correlated with wind speed and negatively with the frequency of visibility ≤10 km (P<0.01).
Overall, wind speed was negatively correlated with TC, OC, SOC, POC, and the ratio (P<0.05). This pattern aligns with findings from Xi'an (Cao et al., 2009), New Delhi (Tiwari et al., 2015), and Karachi (Bibi et al., 2017), although it was not observed in rural areas (Sharma et al., 2002). Increased wind speed enhances ventilation, promoting aerosol dispersion and reducing carbonaceous aerosol concentrations (Saha and Despiau, 2009). The low mean wind speed (about 2.30 m s−1) may also indicate that carbon emissions are predominantly local rather than distant sources (Shen et al., 2021b). Positive correlations of precipitation and relative humidity with soot-EC, char-EC, OC, and the ratio likely reflect the hygroscopic nature of carbonaceous aerosols: under humid conditions, particles absorb water, increase in mass, and undergo accelerated dry deposition. For instance, PM2.5 deposition rates can increase 2–3 fold as relative humidity rises from 30 % to 70 %, thereby shortening their atmospheric residence time (Wu et al., 2016). The negative correlations of EC, char-EC, and POC with the frequency of visibility ≤10 km align with findings in cities such as Suzhou (Zhang et al., 2010) and Beijing (Kong et al., 2021), attributable to the strong light-absorbing (EC) and light-scattering (OC) properties of these components, which jointly enhance atmospheric extinction and reduce visibility (Zhang et al., 2010; Kong et al., 2021). Weaker correlations in rural areas indicate that carbonaceous components are less influenced by local meteorological dilution and removal processes, pointing to more complex source influences.
In summary, seasonal variations in atmospheric dust deposition result from the combined effects of meteorological conditions and anthropogenic emissions. In urban areas, meteorological factors, especially wind speed and relative humidity, play a dominant role in the dispersion and removal of local anthropogenic pollutants. In rural areas, dust composition is more strongly influenced by large-scale wind-driven dust transport and regional combustion activities.
Wind direction analysis provides a valuable supplement to the PMF model (Watson et al., 2008). Studies have shown that emissions from sources such as traffic, biomass burning, coal combustion, and salt lakes exhibit significant directional patterns, which can be effectively visualized using polar plots (Saraga et al., 2021). In this study, bivariate polar plots were generated for the concentrations of POC, SOC, char-EC, soot-EC, and selected ions/elements (Figs. S21–S24), as well as for the source contributions resolved by the PMF model (Figs. S25 and S26), to illustrate their directional provenance. Notably, the directional patterns of the various aerosol components exhibited distinct differences and did not fully align with the local prevailing wind directions.
The polar plots of key tracer ions and elements (Figs. S21–S24) showed patterns consistent with the corresponding PMF-resolved source factors (Figs. S25 and S26), supporting the validity of the source apportionment. Specifically, the following pairs showed similar directional distributions: Total-ps and the salt-lake source; nps-K+, POC, and char-EC with biomass burning; nps-Ca2+ and Si with soil dust; nps-SO, nps-Cl−, and SOC with coal combustion; Fe and Cd with industry; Ni and Zn with traffic emissions; Fe and Al with industry; and nps-SO together with NO with secondary inorganic aerosols. These spatial consistencies reinforce that the selected chemical tracers are associated with their respective PMF-identified sources.
Wind speeds in rural areas are generally higher than those in urban environments, with predominant wind directions between west (W) and north (N), indicating the potential long-distance transport of pollutants. Specifically, emissions from saline lakes primarily originate from the west-northwest (WNW) direction. Back trajectory modeling suggests that HP levels are mainly attributed to salt lake emissions from the northwestern QDB, while in NHP, sources include long-distance transport from salt lakes in the Tarim Basin (Figs. S6, S7). For industrial emissions during the HP, sources primarily originate from medium- to short-distance transport in the W direction, with NHP periods showing contributions from both the W and northwest-northwest (NNW) directions. In contrast, soil dust in HP is predominantly sourced from long-distance transport from the W direction, whereas in NHP, it is largely of local origin. Biomass burning during HP mainly arises from local sources, while its contribution during NHP is minimal and comes from both local and long-distance transport, consistent with PMF results.
In urban areas, lower wind speeds and varying dominant wind directions between the HP and NHP lead to different sources of pollutants. During HP, emissions from saline lakes and coal combustion primarily originate from short-distance transport in the WNW direction, while biomass burning is sourced from the W. In contrast, industrial, traffic emissions, and soil dust are predominantly attributed to local sources. In NHP, pollutants demonstrate a dispersion trend from their sources to urban areas. Industrial emissions primarily come from the WNW to north-northeast (NNE) directions, soil dust from the southwest (SW), and vehicle emissions from the W direction. Notably, both salt lake and secondary inorganic sources exhibit similar directional patterns, indicating a common origin from the SW direction. The presence of processing enterprises near salt lakes suggests that secondary aerosols may form from emitted SO2 and NO2 (Hewitt, 2001). These findings align with previous analyses showing that urban industrial and traffic emissions mainly derive from local sources, while coal and biomass burning predominantly originate from surrounding rural areas, corroborating the role of nearby soil sources in salt lake and soil emissions.
3.6 Environmental implication
The source apportionment analysis using the PMF model indicates that in the QDB, rural dust-fall predominantly originates from the combustion of solid fuels, including firewood, yak dung, and coal, accounting for approximately 72.05 % of the total contribution. This proportion significantly exceeds contributions reported for rural areas in Beijing (41 %) (Hua et al., 2018), Agra (54.3 %) (Agarwal et al., 2020), and Beihai, Guangxi Province (66.7 %) (Zhang et al., 2019).
The higher contribution in this study likely reflects the local energy profile, as the sampling site in Haixi Mongol and Xizang Autonomous Prefecture, Qinghai Province, primarily relies on coal, yak dung, and firewood, constituting 58 %, 23.5 %, and 13 % of rural energy consumption, respectively (Jiang et al., 2020; Shen et al., 2021a). In contrast, solid biomass fuels, including wood and yak dung, account for over 70 % of rural household energy consumption in Xizang, with yak dung alone representing 53 % (Liu et al., 2008; Xiao et al., 2015). Similar patterns emerge in South and Central Asia, where biomass fuels dominate residential heating (firewood: 39 %; dung: 29 %) (Amacher et al., 1999; Heltberg et al., 2000; Hoeck et al., 2007; Foysal et al., 2012; Behera et al., 2015; Kerimray et al., 2018). In northern China, rural domestic heating primarily relies on coal (46 %), firewood (23.8 %), and electricity (15.1 %) (Tao et al., 2018), further highlighting the unique energy composition of QDB.
Recent studies have shown that South Asia, Central Asia, and Xizang contribute significantly to high concentrations of atmospheric PM, particularly BC, which accelerates glacier melting in the QXP (Ming et al., 2010; Xia et al., 2011; Chen et al., 2015). The QDB is recognized as a significant dust source affecting the glacier surfaces on the QXP, although it is often overlooked (Dong et al., 2014; Wei et al., 2017; Zheng et al., 2021). Compared to other dust sources, the QDB exhibits higher emissions from coal combustion, giving it a unique influence on the QXP. The organic matter and pollutants, such as PAHs, released from household solid fuel combustion, particularly coal (98 %) and dung (94 %), are substantially higher than those from firewood (Leavey et al., 2017; Secrest et al., 2017; Ye et al., 2020). Consequently, the impact of PM from coal combustion in the QDB on the QXP is significant. Specifically, the presence of BC in PM increases glacier albedo, accelerating the melting of glaciers and snow in the region (Kang et al., 2020) and impacting global freshwater resources (Huss and Hock, 2018). Additionally, BC enhances cloud condensation nuclei, ice number concentration, and cloud cover (Zhou et al., 2025), thereby influencing global climate change. Furthermore, coal combustion releases harmful emissions, including CO2, NOx, CO, SO2 and sulfur trioxide (Munawer, 2018), adversely affecting local human health and exacerbating climate warming on the QXP (Liu et al., 2006; Li et al., 2023), with broader implications for global climate. Therefore, the atmospheric pollutants emission of the QDB deserves considerable attention. However, this study focuses primarily on larger particles, indicating a need for further research on the environmental impacts of carbonaceous aerosols in atmospheric PM within the QDB.
In addition to the distinctive energy consumption structure in the rural QDB, which leads to significant contributions from coal and biomass burning during HP, atmospheric dust deposition in the QDB during the NHP primarily originates from traffic and industrial emissions. The contribution from traffic emissions during the NHP was twice that during the HP. Considering the larger particle size of the dust samples collected in this study, the traffic-related dust is likely derived mainly from vehicle non-exhaust emissions, such as road dust (Gondwal and Mandal, 2021). This indicates that NHP atmospheric conditions are significantly influenced by resource development and tourism. Sampling sites, such as Qarhan Salt Lake, along with GEM and LTC stations within approximately 100 km (Fig. 1), suggest that salt lake resource extraction has a lower impact on regional aerosols than traffic emissions, despite salt lakes being the primary resource. This is likely because salt lake development mainly involves solar evaporation and chemical processes like extraction and adsorption, which emit fewer pollutants compared to other mining methods (Zhen, 2010). Consequently, salt lake resource exploitation exerts a relatively minor effect on local atmospheric carbonaceous aerosol.
Similar salt lakes with comparable environments to QDB, such as Salar de Uyuni in Bolivia, the Atacama Salt Lake in Chile, and Ombre Muerto in Argentina, are rich in lithium resources (Li et al., 2014), making them focal points for resource development. Additionally, Salar de Uyuni, the Atacama Salt Lake, Junggar Basin, and the Great Salt Lake are renowned tourist destinations. This suggests that, in arid basin salt lakes with similar climates and intensive human activity, atmospheric carbonaceous aerosols are likely influenced by resource exploitation and tourism, especially tourism. The study's findings can inform policy decisions regarding unexploited salt lakes in South America, such as Ombre Muerto and Salar de Uyuni. However, while QDB also hosts mineral resources such as copper, iron, and tin, this research focused on larger particles (>100 µm), which are more indicative of local sources. Given that sampling was conducted around the salt lakes, potential impacts from other mineral resource developments may have been underestimated. Further research is necessary to fully assess the environmental effects of carbonaceous aerosols in QDB atmospheric particles.
In conclusion, the localized source profiles developed in this study, such as ratios for heating-period emissions and key heavy-metal tracers, provide critical input parameters for regional climate and air quality models. This enables more accurate simulation of the emission, transport, and deposition of carbonaceous aerosols in the QDB and supports quantitative assessment of their contribution to glacier retreat on the QXP. Based on that rural areas in arid and semi-arid basins such as QDB rely heavily on solid fuels for heating, with associated environmental impacts, we recommend that local governments implement targeted clean-energy transition policies. These should prioritize promoting clean heating alternatives (e.g., solar and electric heating) in rural regions, supported by financial subsidies and technical assistance. Simultaneously, the adoption of clean stoves and upgraded biomass fuels should be encouraged to reduce emissions from traditional biomass and coal combustion (Dickinson et al., 2015; Li et al., 2011; Shen et al., 2017). Given the close climatic and environmental linkage between QDB and QXP, we further propose integrating air pollution control in QDB into the broader environmental protection framework of QXP. Establishing a joint regional air pollution prevention and control mechanism for the “QDB–QXP” system would help align emission reduction in the basin with glacier protection goals on the plateau. To strengthen the scientific foundation of such a mechanism, future studies should focus on clarifying the key transport pathways, transformation processes, and quantitative impacts of air pollutants from QDB to QXP glaciers.
This study analyzed the composition of dust deposition at six sampling sites in the southern QDB from January 2020 to March 2023 and examined DF, soluble ions, trace and carbonaceous element content in urban and rural samples during both domestic heating and non-domestic heating periods. Through integrated application of backward trajectory modeling, PMF, and carbon speciation indices, we identified dominant dust sources and evaluated domestic heating impacts on atmospheric processes in remote regions.
The findings revealed that DF and carbon emissions were significantly higher in rural than in urban areas. Among carbon indicators, urban areas exhibited elevated EC levels (1.46 ± 1.60 mg g−1), while OC levels were higher in rural (3.73 ± 2.61 mg g−1). Economic development increase ratios, but they are driven by different intrinsic factors. Char-EC was the dominant contributor to EC (80.44 %), with urban char-EC levels (85.00 %) showing a notable increase compared to rural levels (75.88 %). Secondary organic carbon was the principal contributor to OC (72.61 %), with rural SOC levels surpassing (78.44 %) those in urban areas (67.78 %). The and ratios, along with PMF results, indicated that during HP, dust deposition in the QDB was primarily derived from coal combustion (26.85 %) and biomass burning (24.04 %), while traffic emissions accounted for 34.64 % of dust during NHP. Coal and biomass burning were the main contributors to rural dust, strongly influenced by domestic heating, whereas urban dust predominantly originated from traffic (46.83 %) and industrial emissions (16.12 %). Compared to other dust sources in the QXP, coal consumption in the QDB is higher during the domestic heating period. The resulting emissions of BC and greenhouse gases may exacerbate glacier melting in the region, warranting increased attention. Given the distinctive carbonaceous aerosol signatures identified in the QDB, we recommend prioritizing their radiative forcing effects in regional environmental policymaking and climate modeling frameworks. Furthermore, findings of this study offer a valuable scientific basis for understanding atmospheric carbonaceous aerosols in arid basins and salt lake regions with climates similar to QDB. They can particularly inform policy decisions regarding unexploited salt lakes in South America, such as Ombre Muerto and Salar de Uyuni.
However, this study primarily focused on larger-scale PM and examined the effects of heating on carbonaceous aerosols in the QDB. It lacks an investigation of aerosols with smaller particle sizes (e.g., PM10, PM2.5, PM1), which is essential for a comprehensive understanding of carbonaceous aerosol characteristics in this unique region. Furthermore, in addition to offline observations, future research should incorporate online observations with high spatiotemporal resolution and utilize numerical air quality models such as CMAQ, CAMx, WRF-CHEM, and NAQPMS to analyze the spatiotemporal distribution and future trends of carbon aerosols in the QDB.
Datasets for this research has been uploaded in Zenodo and is available at https://doi.org/10.5281/zenodo.14382853 (Zhu, 2024).
The supplement related to this article is available online at https://doi.org/10.5194/acp-26-3357-2026-supplement.
HZ: Conceptualization, data curation, formal analysis, funding acquisition, investigation, methodology, project administration, validation, writing – original draft.
LZ: Data curation, formal analysis, methodology.
SZ: funding acquisition, validation, writing – review & edited.
XZ: Supervision, conceptualization, funding acquisition, writing – review & edited.
The contact author has declared that none of the authors has any competing interests.
Publisher's note: Copernicus Publications remains neutral with regard to jurisdictional claims made in the text, published maps, institutional affiliations, or any other geographical representation in this paper. The authors bear the ultimate responsibility for providing appropriate place names. Views expressed in the text are those of the authors and do not necessarily reflect the views of the publisher.
This research was funded by Major Science and Technology Project of Gansu Province (24ZD13FA003), and by Qinghai Provincial Innovation Platform Construction Special Program (Project No. 2024-ZJ-J03), and supported by Qinghai Provincial Key Laboratory of Geology and Environment of Salt Lakes (The Science and Technology Plan Project of Qinghai Province Incentive Fund 2024).
This paper was edited by Dantong Liu and reviewed by five anonymous referees.
Abdollahi, S., Karimi, A., Madadi, M., Eslamian, S., Ostad-Ali-Askari, K., and Singh, V. P.: Lead concentration in dust fall in Zahedan, Sistan and Baluchistan Province, Iran, Journal of Geography and Cartography, 4, 6, https://doi.org/10.24294/jgc.v4i2.601, 2021.
Adeniran, J. A., Yusuf, R. O., and Olajire, A. A.: Exposure to coarse and fine particulate matter at and around major intra-urban traffic intersections of Ilorin metropolis, Nigeria, Atmos. Environ., 166, 383–392, https://doi.org/10.1016/j.atmosenv.2017.07.041, 2017.
Agarwal, A., Satsangi, A., Lakhani, A., and Kumari, K. M.: Seasonal and spatial variability of secondary inorganic aerosols in PM2.5 at Agra: Source apportionment through receptor models, Chemosphere, 242, 125132, https://doi.org/10.1016/j.chemosphere.2019.125132, 2020.
Almeida, S. M., Lage, J., Fernández, B., Garcia, S., Reis, M. A., and Chaves, P. C.: Chemical characterization of atmospheric particles and source apportionment in the vicinity of a steelmaking industry, Sci. Total Environ., 521–522, 411–420, https://doi.org/10.1016/j.scitotenv.2015.03.112, 2015.
Alzahrani, A. J., Alghamdi, A. G., and Ibrahim, H. M.: Assessment of soil loss due to wind erosion and dust deposition: Implications for sustainable management in arid regions, Appl. Sci., 14, 10822, https://doi.org/10.3390/app142310822, 2024.
An, L., Che, H., Xue, M., Zhang, T., Wang, H., Wang, Y., Zhou, C., Zhao, H., Gui, K., Zheng, Y., Sun, T., Liang, Y., Sun, E., Zhang, H., and Zhang, X.: Temporal and spatial variations in sand and dust storm events in East Asia from 2007 to 2016: Relationships with surface conditions and climate change, Sci. Total Environ., 633, 452-462, https://doi.org/10.1016/j.scitotenv.2018.03.068, 2018.
Amacher, G. S., Hyde, W. F., and Kanel, K. R.: Nepali fuelwood production and consumption: Regional and household distinctions, substitution and successful intervention, J. Dev. Stud., 35, 138–163, https://doi.org/10.1080/00220389908422584, 1999.
Ambade, B., Sankar, T. K., Sahu, L. K., and Dumka, U. C.: Understanding sources and composition of black carbon and PM2.5 in urban environments in East India, Urban Science, 6, 60, https://doi.org/10.3390/urbansci6030060, 2022.
Amato, F., Alastuey, A., de la Rosa, J., Gonzalez Castanedo, Y., Sánchez de la Campa, A. M., Pandolfi, M., Lozano, A., Contreras González, J., and Querol, X.: Trends of road dust emissions contributions on ambient air particulate levels at rural, urban and industrial sites in southern Spain, Atmos. Chem. Phys., 14, 3533–3544, https://doi.org/10.5194/acp-14-3533-2014, 2014.
Arimoto, R., Duce, R. A., Savoie, D. L., Prospero, J. M., Talbot, R., Cullen, J. D., Tomza, U., Lewis, N. F., and Ray, B. J.: Relationships among aerosol constituents from Asia and the North Pacific during PEM-West A, J. Geophys. Res.-Atmos., 101, 2011–2023, https://doi.org/10.1029/95JD01071, 1996.
Ashrafi, K., Fallah, R., Hadei, M., Yarahmadi, M., and Shahsavani, A.: Source apportionment of Total Suspended Particles (TSP) by Positive Matrix Factorization (PMF) and Chemical Mass Balance (CMB) modeling in Ahvaz, Iran, Arch. Environ. Con. Tox., 75, 278–294, https://doi.org/10.1007/s00244-017-0500-z, 2018.
Aswini, M. A., Tiwari, S., Singh, U., Kurian, S., Patel, A., Gunthe, S. S., and Kumar, A.: Aeolian dust and sea salt in marine aerosols over the Arabian Sea during the Southwest Monsoon: Sources and spatial variability, ACS Earth Space Chem., 6, 1044–1058, https://doi.org/10.1021/acsearthspacechem.1c00400, 2022.
Bandowe, B. A. M., Nkansah, M. A., Leimer, S., Fischer, D., Lammel, G., and Han, Y.: Chemical (C, N, S, black carbon, soot and char) and stable carbon isotope composition of street dusts from a major West African metropolis: Implications for source apportionment and exposure, Sci. Total Environ., 655, 1468–1478, https://doi.org/10.1016/j.scitotenv.2018.11.089, 2019.
Barjoee, S. S., Abadi, S. Z. M., Elmi, M. R., Varaoon, V. T., and Nikbakht, M.: Evaluation of trace elements pollution in deposited dust on residential areas and agricultural lands around Pb/Zn mineral areas using modified pollution indices, J. Environ. Health Sci., 19, 753–769, https://doi.org/10.1007/s40201-021-00643-8, 2021.
Behera, B., Rahut, D. B., Jeetendra, A., and Ali, A.: Household collection and use of biomass energy sources in South Asia, Energy, 85, 468–480, https://doi.org/10.1016/j.energy.2015.03.059, 2015.
Belis, C. A., Pernigotti, D., Karagulian, F., Pirovano, G., Larsen, B. R., Gerboles, M., and Hopke, P. K.: A new methodology to assess the performance and uncertainty of source apportionment models in intercomparison exercises, Atmos. Environ., 119, 35–44, https://doi.org/10.1016/j.atmosenv.2015.08.002, 2015.
Bibi, S., Alam, K., Chishtie, F., Bibi, H., and Rahman, S.: Temporal variation of Black Carbon concentration using Aethalometer observations and its relationships with meteorological variables in Karachi, Pakistan, J. Atmos. Sol.-Terr. Phy., 157–158, 67–77, https://doi.org/10.1016/j.jastp.2017.03.017, 2017.
Bond, T. C. and Bergstrom, R. W.: Light absorption by carbonaceous particles: An investigative review, Aerosol Sci. Tech., 40, 27–67, https://doi.org/10.1080/02786820500421521, 2006.
Bond, T. C., Streets, D. G., Yarber, K. F., Nelson, S. M., Woo, J. H., and Klimont, Z.: A technology-based global inventory of black and organic carbon emissions from combustion, J. Geophys. Res.-Atmos., 109, https://doi.org/10.1029/2003JD003697, 2004.
Bond, T. C., Doherty, S. J., Fahey, D. W., Forster, P. M., Berntsen, T., DeAngelo, B. J., Flanner, M. G., Ghan, S., Kärcher, B., Koch, D., Kinne, S., Kondo, Y., Quinn, P. K., Sarofim, M. C., Schultz, M. G., Schulz, M., Venkataraman, C., Zhang, H., Zhang, S., Bellouin, N., Guttikunda, S. K., Hopke, P. K., Jacobson, M. Z., Kaiser, J. W., Klimont, Z., Lohmann, U., Schwarz, J. P., Shindell, D., Storelvmo, T., Warren, S. G., and Zender, C. S.: Bounding the role of black carbon in the climate system: A scientific assessment, J. Geophys. Res.-Atmos., 118, 5380–5552, https://doi.org/10.1002/jgrd.50171, 2013.
Bowen, H. J. M.: Environmental chemistry of the elements, Academic Press, https://doi.org/10.1002/9780470140451, 1979.
Butler, K. M. and Mulholland, G. W.: Generation and transport of smoke components, Fire Technol., 40, 149–176, https://doi.org/10.1023/B:FIRE.0000016841.07530.64, 2004.
Cachier, H. and Ducret, J.: Influence of biomass burning on equatorial African rains, Nature, 352, 228–230, https://doi.org/10.1038/352228a0, 1991.
Cao, J. J., Wu, F., Chow, J. C., Lee, S. C., Li, Y., Chen, S. W., An, Z. S., Fung, K. K., Watson, J. G., Zhu, C. S., and Liu, S. X.: Characterization and source apportionment of atmospheric organic and elemental carbon during fall and winter of 2003 in Xi'an, China, Atmos. Chem. Phys., 5, 3127–3137, https://doi.org/10.5194/acp-5-3127-2005, 2005.
Cao, J. J., Zhu, C. S., Chow, J. C., Watson, J. G., Han, Y. M., Wang, G. H., Shen, Z. X, and An, Z. S.: Black carbon relationships with emissions and meteorology in Xi'an, China, Atmos. Res., 94, 194–202, https://doi.org/10.1016/j.atmosres.2009.05.009, 2009.
Cao, J.-J., Zhu, C.-S., Tie, X.-X., Geng, F.-H., Xu, H.-M., Ho, S. S. H., Wang, G.-H., Han, Y.-M., and Ho, K.-F.: Characteristics and sources of carbonaceous aerosols from Shanghai, China, Atmos. Chem. Phys., 13, 803–817, https://doi.org/10.5194/acp-13-803-2013, 2013.
Casotti Rienda, I. and Alves, C. A.: Road dust resuspension: A review, Atmos. Res., 261, 105740, https://doi.org/10.1016/j.atmosres.2021.105740, 2021.
Castro, L. M., Pio, C. A., Harrison, R. M., and Smith, D. J. T.: Carbonaceous aerosol in urban and rural European atmospheres: Estimation of secondary organic carbon concentrations, Atmos. Environ., 33, 2771–2781, https://doi.org/10.1016/S1352-2310(98)00331-8, 1999.
Cesari, D., Amato, F., Pandolfi, M., Alastuey, A., Querol, X., and Contini, D.: An inter-comparison of PM10 source apportionment using PCA and PMF receptor models in three European sites, Environ. Sci. Pollut. R., 23, 15133–15148, https://doi.org/10.1007/s11356-016-6599-z, 2016.
Chen, L., Zhang, X. Y., Tang, Q. L., Geng, Y., Wang, E. L., and Li, J. Y.: Heavy metal pollution and source analysis of surface soil in the Qaidam Basin, Environ. Sci., 42, 4880–4888, https://doi.org/10.13227/j.hjkx.202101052, 2021 (in Chinese).
Chen, M., Li, M.-Y., Zhou, J. Y., Fu, R.-B., Wang, X. F., and Shen Z.: Characteristics and source analysis of heavy metal pollution in dust in a heavy industrial area of Northwest China, Environ. Sci. Technol., 47, 155–164, https://doi.org/10.19672/j.cnki.1003-6504.1004.23.338, 2024 (in Chinese).
Chen, P., Kang, S., Bai, J., Sillanpää, M., and Li, C.: Yak dung combustion aerosols in the Tibetan Plateau: Chemical characteristics and influence on the local atmospheric environment, Atmos. Res., 156, 58–66, https://doi.org/10.1016/j.atmosres.2015.01.001, 2015.
Chen, P., Kang, S., Li, C., Zhang, Q., Guo, J., Tripathee, L., Zhang, Y., Li, G., Gul, C., Cong, Z., Wan, X., Niu, H., Panday, A. K., Rupakheti, M., and Ji, Z.: Carbonaceous aerosol characteristics on the Third Pole: A primary study based on the Atmospheric Pollution and Cryospheric Change (APCC) network, Environ. Pollut., 253, 49–60, https://doi.org/10.1016/j.envpol.2019.06.112, 2019a.
Chen, P., Li, Y., Zhang, Y., Xue, C., Hopke, P. K., and Li, X.: Dynamic changes of composition of particulate matter emissions during residential biomass combustion, Environ. Sci. Technol., 57, 15193–15202, https://doi.org/10.1021/acs.est.3c05412, 2023.
Chen, S., Zhang, X., Lin, J., Huang, J., Zhao, D., Yuan, T., Huang, K., Luo, Y., Jia, Z., Zang, Z., Qiu, Y. A., and Xie, L.: Fugitive road dust PM2.5 emissions and their potential health impacts, Environ. Sci. Technol., 53, 8455–8465, https://doi.org/10.1021/acs.est.9b00666, 2019b.
Chen, W., Tong, D. Q., Dan, M., Zhang, S., Zhang, X., and Pan, Y.: Typical atmospheric haze during crop harvest season in northeastern China: A case in the Changchun region, J. Environ. Sci., 54, 101–113, https://doi.org/10.1016/j.jes.2016.03.031, 2017.
Cheng, N., Peng, L., Mou, L., Ji, H. D., Liu, X. F., Bai, H. L., and Zhao, Y. J.: Characterization of atmospheric organic and elemental carbon of PM10 in coal spontaneous combustion zone, Shanxi, Chinese Environmental Science, 35, 40–44, http://www.zghjkx.com.cn/CN/Y2015/V35/I1/40 (last access: 28 February 2026), 2015 (in Chinese).
Cheng, X. and Lin, X.: Temporal and spatial distribution characteristics of dust in Shenyang and analysis of influencing factors, Environmental Protection Science, 35, 1–3 + 58, https://doi.org/10.16803/j.cnki.issn.1004-6216.2009.06.001, 2009 (in Chinese).
Chow, J. C.: Measurement methods to determine compliance with ambient air quality standards for suspended particles, JAPCA J. Air Waste Ma., 45, 320–382, https://doi.org/10.1080/10473289.1995.10467369, 1995.
Chow, J. C., Watson, J. G., Kuhns, H., Etyemezian, V., Lowenthal, D. H., Crow, D., Kohl, S. D., Engelbrecht, J. P., and Green, M. C.: Source profiles for industrial, mobile, and area sources in the Big Bend Regional Aerosol Visibility and Observational study, Chemosphere, 54, 185–208, https://doi.org/10.1016/j.chemosphere.2003.07.004, 2004.
Chow, J. C., Watson, J. G., Robles, J., Wang, X., Chen, L. W. A., Trimble, D. L., Kohl, S. D., Tropp, R. J., and Fung, K. K.: Quality assurance and quality control for thermal/optical analysis of aerosol samples for organic and elemental carbon, Anal. Bioanal. Chem., 401, 3141–3152, https://doi.org/10.1007/s00216-011-5103-3, 2011
Christie, J. A., Elliott, H. E., O'Connell-Lopez, S. M. O., Perry, K., Pratt, K. A., Hallar, A. G., Hrdina, A., Murphy, J. G., Riedel, T. P., Long, R. W., Mitroo, D., Haskins, J. D., and Gaston, C. J.: Halogen production from playa dust emitted from the Great Salt Lake: Implications of the shrinking Great Salt Lake on regional air quality, ACS Earth Space Chem., 9, 480–493, https://doi.org/10.1021/acsearthspacechem.4c00258, 2025.
Chuang, M. T., Lee, C. T., Chou, C. C. K., Lin, N.-H., Sheu, G. R., Wang, J. L., Chang, S. C., Wang, S.MH., Chi, K. H., Young, C. Y., Huang, H., Chen, H. W., Weng, G -H., Lai, S. Y., Hsu, S. P., Chang, Y. J., Chang, J. H., and Wu, X. C.: Carbonaceous aerosols in the air masses transported from Indochina to Taiwan: Long-term observation at Mt. Lulin, Atmos. Environ., 89, 507–516, https://doi.org/10.1016/j.atmosenv.2013.11.066, 2014.
Cichowicz, R. and Bochenek, A. D.: Assessing the effects of urban heat islands and air pollution on human quality of life, Anthropocene, 46, 100433, https://doi.org/10.1016/j.ancene.2024.100433, 2024.
Cong, Z., Kang, S., Luo, C., Li, Q., Huang, J., Gao, S., and Li, X.: Trace elements and lead isotopic composition of PM10 in Lhasa, Tibet, Atmos. Environ., 45, 6210–6215, https://doi.org/10.1016/j.atmosenv.2011.07.060, 2011.
Contini, D., Cesari, D., Conte, M., and Donateo, A.: Application of PMF and CMB receptor models for the evaluation of the contribution of a large coal-fired power plant to PM10 concentrations, Sci. Total Environ., 560–561, 131–140, https://doi.org/10.1016/j.scitotenv.2016.04.031, 2016.
Dan, M.: The characteristics of carbonaceous species and their sources in PM2.5 in Beijing, Atmos. Environ., 38, 3443–3452, https://doi.org/10.1016/j.atmosenv.2004.02.052, 2004.
Demir, T., Karakaş, D., and Yenisoy-Karakaş, S.: Source identification of exhaust and non-exhaust traffic emissions through the elemental carbon fractions and Positive Matrix Factorization method, Environ. Res., 204, 112399, https://doi.org/10.1016/j.envres.2021.112399, 2022.
Deng, Z. W., Fang, F. M., Jiang, P. L., Zhang J. Q., and Lin, Y. S.: Distribution characteristics of black carbon content in surface dust in Wuhu city, Journal of Anqing Normal University (Natural Science Edition), 37, 58–62, https://doi.org/10.14182/j.cnki.1001-2443.2014.01.009, 2014 (in Chinese).
Deshmukh, D. K., Deb, M. K., Tsai, Y. I., and Mkoma, S. L.: Water soluble ions in PM2.5 and PM1 aerosols in Durg City, Chhattisgarh, India, Aerosol Air Qual. Res., 11, 696–708, https://doi.org/10.4209/aaqr.2011.03.0023, 2011.
Dickinson, K. L., Kanyomse, E., Piedrahita, R., Coffey, E., Rivera, I. J., Adoctor, J., Alirigia, R., Muvandimwe, D., Dove, M., Dukic, V., Hayden, M. H., Diaz-Sanchez, D., Abisiba, A. V., Anaseba, D., Hagar, Y., Masson, N., Monaghan, A., Titiati, A., Steinhoff, D. F., Hsu, Y. Y., Kaspar, R., Brooks, B. A., Hodgson, A., Hannigan, M., Oduro, A. R., and Wiedinmyer, C.: Research on emissions, air quality, climate, and cooking technologies in Northern Ghana (Reaccting): study rationale and protocol, BMC Public Health, 15, 126, https://doi.org/10.1186/s12889-015-1414-1, 2015.
Donahue, N. M.: Chapter 3.2 – Air pollution and air quality, in: Green chemistry, Elsevier, 151–176, https://doi.org/10.1016/B978-0-12-809270-5.00007-8, 2018.
Dong, Z., Qin, D., Kang, S., Ren, J., Chen, J., Cui, X., Du, Z., and Qin, X.: Physicochemical characteristics and sources of atmospheric dust deposition in snow packs on the glaciers of western Qilian Mountains, China, Tellus B, 66, 20956, https://doi.org/10.3402/tellusb.v66.20956, 2014.
Duan, J. and Tan, J.: Atmospheric heavy metals and Arsenic in China: Situation, sources and control policies, Atmos. Environ., 74, 93–101, https://doi.org/10.1016/j.atmosenv.2013.03.031, 2013.
Eivazzadeh, M., Hassanvand, M. S., Faridi, S., and Gholampour, A.: Source apportionment and deposition of dustfall-bound trace elements around Tabriz, Iran, Environ. Sci. Pollut. R., 28, 59403–59415, https://doi.org/10.1007/s11356-020-12173-1, 2021.
Fang, B., Zeng, H., Zhang, L., Wang, H., Liu, J., Hao, K., Zheng, G., Wang, M., Wang, Q., and Yang, W.: Toxic metals in outdoor/indoor airborne PM2.5 in port city of Northern, China: Characteristics, sources, and personal exposure risk assessment, Environ. Pollut., 279, 116937, https://doi.org/10.1016/j.envpol.2021.116937, 2021.
Feng, W., Guo, Z., Xiao, X., Peng, C., Shi, L., Ran, H., and Xu, W.: Atmospheric deposition as a source of cadmium and lead to soil-rice system and associated risk assessment, Ecotox. Environ. Safe., 180, 160–167, https://doi.org/10.1016/j.ecoenv.2019.04.090, 2019.
Feng, Y., Du, S., Fraedrich, K., and Zhang, X.: Fine-Grained Climate Classification for the Qaidam Basin, Atmosphere, 13, 913, https://doi.org/10.3390/atmos13060913, 2022.
Filonchyk, M., Yan, H., Yang, S., and Lu, X.: Detection of aerosol pollution sources during sandstorms in Northwestern China using remote sensed and model simulated data, Adv. Space Res., 61, 1035–1046, https://doi.org/10.1016/j.asr.2017.11.037, 2018.
Foysal, M., Hossain, M., Rubaiyat, A., Sultana, S., Uddin, M. K., Sayem, M., and Akhter, J.: Household energy consumption pattern in rural areas of Bangladesh, Indian Journal of Energy, 1, 72–85, 2012.
Fu, B.: Socio-economic data set of Qinghai-Tibet Plateau (1982–2018), National Tibetan Plateau/Third Pole Environment Data Center, https://data.tpdc.ac.cn/zh-hans/data/d175e9d4-89d3-41b1-a568-dc9870f6f109 (last access: 17 February 2026), 2023.
Ganor, E.: Atmospheric dust in Israel. Sedimentological and meteorological analysis of dust deposition, PhD thesis, Hebrew University of Jerusalem, Israel, 1975.
Gao, G. S., Song, L. M., and Ma, Z. T.: Temporal and spatial distribution of dust-fall in Qinghai Province and analysis of its influencing factors, Chinese Journal of Desert Research, 33, 1124–1130, https://doi.org/10.7522/j.issn.1000-694X.2013.00159, 2013 (in Chinese).
Gao, H. and Washington, R.: Arctic oscillation and the interannual variability of dust emissions from the Tarim Basin: a TOMS AI based study, Clim. Dynam., 35, 511–522, https://doi.org/10.1007/s00382-009-0687-4, 2010.
Gertler, A., Kuhns, H., Abu-Allaban, M., Damm, C., Gillies, J., Etyemezian, V., Clayton, R., and Proffitt, D.: A case study of the impact of Winter road sand/salt and street sweeping on road dust re-entrainment, Atmos. Environ., 40, 5976–5985, https://doi.org/10.1016/j.atmosenv.2005.12.047, 2006.
Gholampour, A., Nabizadeh, R., Hassanvand, M. S., Taghipour, H., Nazmara, S., and Mahvi, A. H.: Characterization of saline dust emission resulted from Urmia Lake drying, J. Environ. Health Sci., 13, 82, https://doi.org/10.1186/s40201-015-0238-3, 2015.
Gluscic, V., Zuzul, S., Pehnec, G., Jakovljevic, I., Smoljo, I., Godec, R., Beslic, I., Milinkovic, A., Alempijevic, S. B., and Frka, S.: Sources, ionic composition and acidic properties of bulk and wet atmospheric deposition in the Eastern Middle Adriatic Region, Toxics, 11, https://doi.org/10.3390/toxics11070551, 2023.
Gonçalves, C., Alves, C., Evtyugina, M., Mirante, F., Pio, C., Caseiro, A., Schmidl, C., Bauer, H., and Carvalho, F.: Characterisation of PM10 emissions from woodstove combustion of common woods grown in Portugal, Atmos. Environ., 44, 4474–4480, https://doi.org/10.1016/j.atmosenv.2010.07.026, 2010.
Gondwal, T. K. and Mandal, P.: Review on classification, sources and management of road dust and determination of uncertainty associated with measurement of particle size of road dust, Mapan, 36, 909–924, https://doi.org/10.1007/s12647-021-00501-w, 2021.
Gong, M., Yin, S., Gu, X., Xu, Y., Jiang, N., and Zhang, R.: Refined 2013-based vehicle emission inventory and its spatial and temporal characteristics in Zhengzhou, China, Sci. Total Environ., 599–600, 1149–1159, https://doi.org/10.1016/j.scitotenv.2017.03.299, 2017.
Goossens, D. and Offer, Z.: Eolian deposition of dust over symmetrical hills: an evaluation of wind-tunnel data by means of terrain measurement, Zeitschrift für Geomorphologie, 37, 103–111, https://doi.org/10.1127/zfg/37/1993/103, 1993.
Gregory, P. H.: The Microbiology of the Atmosphere, Leonard Hill, London, https://doi.org/10.1007/BF01976673, 1961.
Griffin, D. W., Kellogg, C. A., Garrison, V. H., and Shinn, E. A.: The global transport of dust: An Intercontinental river of dust, microorganisms and toxic chemicals flows through the Earth's atmosphere, Am. Sci., 90, 228–235, https://www.jstor.org/stable/27857658 (last access: January 2026), 2002.
Guo, J., Miao, Y., Zhang, Y., Liu, H., Li, Z., Zhang, W., He, J., Lou, M., Yan, Y., Bian, L., and Zhai, P.: The climatology of planetary boundary layer height in China derived from radiosonde and reanalysis data, Atmos. Chem. Phys., 16, 13309–13319, https://doi.org/10.5194/acp-16-13309-2016, 2016.
Guo, S., Wang, L., Zhou, P., Guo, S., Qin, W., An, S., Xiao, J. Y., Liu, J., and Ji, Y.: Characteristics and sources of organic carbon and elemental carbon in summer road dust in Shijiazhuang, Environ. Eng., 36, 122–126, https://doi.org/10.13205/j.hjgc.201804025, 2018 (in Chinese).
Guo, W. T., Zhao, F. Q., and Chang, H. L.: Analysis of the trend of environmental air quality changes in the main urban area of Changzhi City, Proceedings of Shanghai, China, 3, 409–411, 2010 (in Chinese).
Gupta, A. and Dhir, A.: Assessment of air quality and chemical fingerprints for atmospheric fine aerosols in an Indian smart city, Environmental Pollutants and Bioavailability, 34, 21–33, https://doi.org/10.1080/26395940.2021.2024091, 2022.
Hahnenberger, M. and Nicoll, K.: Meteorological characteristics of dust storm events in the eastern Great Basin of Utah, U.S.A., Atmos. Environ., 60, 601–612, https://doi.org/10.1016/j.atmosenv.2012.06.029, 2012.
Hama, S., Ouchen, I., Wyche, K. P., Cordell, R. L., and Monks, P. S.: Carbonaceous aerosols in five European cities: Insights into primary emissions and secondary particle formation, Atmos. Res., 274, https://doi.org/10.1016/j.atmosres.2022.106180, 2022.
Han, Y., Cao, J., An, Z., Chow, J. C., Watson, J. G., Jin, Z., Fung, K., and Liu, S.: Evaluation of the thermal/optical reflectance method for quantification of elemental carbon in sediments, Chemosphere, 69, 526–533, https://doi.org/10.1016/j.chemosphere.2007.03.035, 2007a.
Han, Y., Cao, J., Chow, J. C., Watson, J. G., An, Z., Jin, Z., Fung, K., and Liu, S.: Evaluation of the thermal/optical reflectance method for discrimination between char- and soot-EC, Chemosphere, 69, 569–574, https://doi.org/10.1016/j.chemosphere.2007.03.024, 2007b.
Han, Y. M., Han, Z. W., Cao, J. J., Chow, J. C., Watson, J. G., An, Z. S., Liu, S. X., and Zhang, R. J.: Distribution and origin of carbonaceous aerosol over a rural high-mountain lake area, Northern China and its transport significance, Atmos. Environ., 42, 2405–2414, https://doi.org/10.1016/j.atmosenv.2007.12.020, 2008.
Han, Y. M., Lee, S. C., Cao, J. J., Ho, K. F., and An, Z. S.: Spatial distribution and seasonal variation of char-EC and soot-EC in the atmosphere over China, Atmos. Environ., 43, 6066–6073, https://doi.org/10.1016/j.atmosenv.2009.08.018, 2009a.
Han, Y. M., Cao, J. J., Chow, J. C., Watson, J. G., An, Z. S., and Liu, S. X.: Elemental carbon in urban soils and road dusts in Xi'an, China and its implication for air pollution, Atmos. Environ., 43, 2464–2470, https://doi.org/10.1016/j.atmosenv.2009.01.040, 2009b.
Han, Y. M., Cao, J. J., Yan, B. Z., Kenna, T. C., Jin, Z. D., Cheng, Y., Chow, J. C., and An, Z. S.: Comparison of elemental carbon in lake sediments measured by three different methods and 150-year pollution history in Eastern China, Environ. Sci. Technol., 45, 5287–5293, https://doi.org/10.1021/es103518c, 2011.
Han, Y. M., Chen, L. W. A., Huang, R. J., Chow, J. C., Watson, J. G., Ni, H. Y., Liu, S. X., Fung, K. K., Shen, Z. X., Wei, C., Wang, Q. Y., Tian, J., Zhao, Z. Z., Prévôt, A. S. H., and Cao, J. J.: Carbonaceous aerosols in megacity Xi'an, China: Implications of thermal/optical protocols comparison, Atmos. Environ., 132, 58–68, https://doi.org/10.1016/j.atmosenv.2016.02.023, 2016.
Hand, V. L., Capes, G., Vaughan, D. J., Formenti, P., Haywood, J. M., and Coe, H.: Evidence of internal mixing of African dust and biomass burning particles by individual particle analysis using electron beam techniques, J. Geophys. Res.-Atmos., 115, https://doi.org/10.1029/2009JD012938, 2010.
He, L. Y., Hu, M., Huang, X. F., Yu, B. D., Zhang, Y. H., and Liu, D. Q.: Measurement of emissions of fine particulate organic matter from Chinese cooking, Atmos. Environ., 38, 6557–6564, https://doi.org/10.1016/j.atmosenv.2004.08.034, 2004.
Heltberg, R., Arndt, T. C., and Sekhar, N. U.: Fuelwood consumption and forest degradation: A household model for domestic energy substitution in rural India, Land Econ., 76, 213–232, https://doi.org/10.2307/3147225, 2000.
Heo, J.-B., Hopke, P. K., and Yi, S.-M.: Source apportionment of PM2.5 in Seoul, Korea, Atmos. Chem. Phys., 9, 4957–4971, https://doi.org/10.5194/acp-9-4957-2009, 2009.
Hewitt, C. N.: The atmospheric chemistry of sulphur and nitrogen in power station plumes, Atmos. Environ., 35, 1155–1170, https://doi.org/10.1016/S1352-2310(00)00463-5, 2001.
Hilary, U., Efeoghene, E. A., Issac, A. O., Sami, R., Baakdah, F., and Pareek, S.: Exposure to airborne pollutants in urban and rural areas: levels of metals and microorganisms in PM10 and gaseous pollutants in ambient air, Air Qual. Atmos. Hlth., 18, 317–332, https://doi.org/10.1007/s11869-024-01644-w, 2025.
Hoeck, T., Droux, R., Breu, T., Hurni, H., and Maselli, D.: Rural energy consumption and land degradation in a post-Soviet setting – an example from the west Pamir mountains in Tajikistan, Energy Sustain. Dev., 11, 48–57, https://doi.org/10.1016/S0973-0826(08)60563-3, 2007.
Hu, Y. N. and Liu, Y. L.: Characteristics and source analysis of heavy metal pollution in indoor dust in Jinan, Environ. Sci. Technol., 45, 179–184, https://doi.org/10.19672/j.cnki.1003-6504.0043.22.338, 2022 (in Chinese).
Hua, Y., Wang, S., Jiang, J., Zhou, W., Xu, Q., Li, X., Liu, B., Zhang, D., and Zheng, M.: Characteristics and sources of aerosol pollution at a polluted rural site southwest in Beijing, China, Sci. Total Environ., 626, 519–527, https://doi.org/10.1016/j.scitotenv.2018.01.047, 2018.
Huang, H., Xu, Z. Q., Yan, J. X., Zhao, X. G., and Wang, D. L.: Characteristics of heavy metal pollution and ecological risk evaluation of indoor dust from urban and rural areas in Taiyuan City during the heating season, J. Environ. Sci., 42, 2143–2152, https://doi.org/10.13227/j.hjkx.202008045, 2021a (in Chinese).
Huang, X. and Gao, J.: A review of near-limit opposed fire spread, Fire Safety J., 120, 103141, https://doi.org/10.1016/j.firesaf.2020.103141, 2021.
Huang, X., Tang, G., Zhang, J., Liu, B., Liu, C., Zhang, J., Cong, L., Cheng, M., Yan, G., Gao, W., Wang, Y., and Wang, Y.: Characteristics of PM2.5 pollution in Beijing after the improvement of air quality, J. Environ. Sci., 100, 1–10, https://doi.org/10.1016/j.jes.2020.06.004, 2021b.
Huss, M. and Hock, R.: Global-scale hydrological response to future glacier mass loss, Nat. Clim. Change, 8, 135–140, https://doi.org/10.1038/s41558-017-0049-x, 2018.
Jia, S. M., Chen, M. H., Yang, P. F., Wang, L., Wang, G. Y., Liu, L. Y., and Ma, W. L.: Seasonal variations and sources of atmospheric EPFRs in a megacity in severe cold region: Implications for the influence of strong coal and biomass combustion, Environ. Res., 252, https://doi.org/10.1016/j.envres.2024.119067, 2024.
Jiang, L., Xue, B., Xing, R., Chen, X., Song, L., Wang, Y., Coffman, D. M., and Mi, Z.: Rural household energy consumption of farmers and herders in the Qinghai-Tibet Plateau, Energy, 192, https://doi.org/10.1016/j.energy.2019.116649, 2020.
Jiang, Y., Shi, L., Guang, A. L., Mu, Z., Zhan, H., and Wu, Y.: Contamination levels and human health risk assessment of toxic heavy metals in street dust in an industrial city in Northwest China, Environ. Geochem. Hlth., 40, 2007–2020, https://doi.org/10.1007/s10653-017-0028-1, 2018.
Jiménez, L., Rühland, K. M., Jeziorski, A., Smol, J. P., and Pérez-Martínez, C.: Climate change and Saharan dust drive recent cladoceran and primary production changes in remote alpine lakes of Sierra Nevada, Spain, Glob. Change Biol., 24, e139–e158, https://doi.org/10.1111/gcb.13878, 2018.
Joshi, U. M., Vijayaraghavan, K., and Balasubramanian, R.: Elemental composition of urban street dusts and their dissolution characteristics in various aqueous media, Chemosphere, 77, 526–533, https://doi.org/10.1016/j.chemosphere.2009.07.043, 2009.
Kang, S., Zhang, Y., Qian, Y., and Wang, H.: A review of black carbon in snow and ice and its impact on the cryosphere, Earth-Sci. Rev., 210, https://doi.org/10.1016/j.earscirev.2020.103346, 2020.
Kataki, R., Goswami, K., Bordoloi, N. J., Narzari, R., Saikia, R., Sut, D., and Gogoi, L.: Biomass resources for biofuel production in Northeast India, in: Bioprospecting of indigenous bioresources of North-East India, Springer Singapore, Singapore, 127–151, https://doi.org/10.1007/978-981-10-0620-3_8, 2016.
Kerimray, A., Suleimenov, B., De Miglio, R., Rojas-Solórzano, L., Amouei Torkmahalleh, M., and Ó Gallachóir, B. P.: Investigating the energy transition to a coal free residential sector in Kazakhstan using a regionally disaggregated energy systems model, J. Clean. Prod., 196, 1532–1548, https://doi.org/10.1016/j.jclepro.2018.06.158, 2018.
Khan, A. J., Swami, K., Ahmed, T., Bari, A., Shareef, A., and Husain, L.: Determination of elemental carbon in lake sediments using a thermal–optical transmittance (TOT) method, Atmos. Environ., 43, 5989–5995, https://doi.org/10.1016/j.atmosenv.2009.08.030, 2009.
Kim, K. H., Sekiguchi, K., Kudo, S., and Sakamoto, K.: Characteristics of atmospheric elemental carbon (Char and Soot) in ultrafine and fine particles in a roadside environment, Japan, Aerosol Air Qual. Res., 11, 1–12, https://doi.org/10.4209/aaqr.2010.07.0061, 2011.
Kong, L., Xin, J., Gao, W., Tang, G., Wang, X., Wang, Y., Zhang, W., Chen, W., and Jia, S.: A comprehensive evaluation of aerosol extinction apportionment in Beijing using a high-resolution time-of-flight aerosol mass spectrometer, Sci. Total Environ., 783, 146976, https://doi.org/10.1016/j.scitotenv.2021.146976, 2021.
Kuang, Y., He, Y., Xu, W., Yuan, B., Zhang, G., Ma, Z., Wu, C., Wang, C., Wang, S., Zhang, S., Tao, J., Ma, N., Su, H., Cheng, Y., Shao, M., and Sun, Y.: Photochemical aqueous-phase reactions induce rapid daytime formation of oxygenated organic aerosol on the North China Plain, Environ. Sci. Technol., 54, 3849–3860, https://doi.org/10.1021/acs.est.9b06836, 2020.
Kulmala, M., Vehkamäki, H., Petäjä, T., Dal Maso, M., Lauri, A., Kerminen, V. M., Birmili, W., and McMurry, P. H.: Formation and growth rates of ultrafine atmospheric particles: a review of observations, J. Aerosol Sci., 35, 143–176, https://doi.org/10.1016/j.jaerosci.2003.10.003, 2004.
Kumar, A.: Chemical characterization of mineral aerosols: Sources, transport and atmospheric transformations, Mohanlal Sukhadia University Udaipur, https://www.prl.res.in/~library/gpdf/prl-theses/ashwini_k_2010.pdf#page=131.47 (last access: 28 February 2026), 2010.
Kundu, S. and Stone, E. A.: Composition and sources of fine particulate matter across urban and rural sites in the Midwestern United States, Environmental Science and Process Impacts, 16, 1360–1370, https://doi.org/10.1039/c3em00719g, 2014.
Lai, S., Zhao, Y., Ding, A., Zhang, Y., Song, T., Zheng, J., Ho, K. F., Lee, S. C., and Zhong, L.: Characterization of PM2.5 and the major chemical components during a 1-year campaign in rural Guangzhou, Southern China, Atmos. Res., 167, 208–215, https://doi.org/10.1016/j.atmosres, 2016.
Leavey, A., Patel, S., Martinez, R., Mitroo, D., Fortenberry, C., Walker, M., Williams, B., and Biswas, P.: Organic and inorganic speciation of particulate matter formed during different combustion phases in an improved cookstove, Environ. Res., 158, 33–42, https://doi.org/10.1016/j.envres.2017.05.025, 2017.
Lee, K. Y., Batmunkh, T., Joo, H. S., and Park, K.: Comparison of the physical and chemical characteristics of fine road dust at different urban sites, JAPCA J. Air Waste Ma., 68, 812–823, https://doi.org/10.1080/10962247.2018.1443855, 2018.
Li, J., Anderson, J. R., and Buseck, P. R.: TEM study of aerosol particles from clean and polluted marine boundary layers over the North Atlantic, J. Geophys. Res. Atmos., 108, https://doi.org/10.1029/2002JD002106, 2003.
Li, J. K., Liu, X. F., and Wang, D. H.: Overview of mineralization laws of lithium deposits in China, Acta Geol. Sin., 88, 2269–2283, https://doi.org/10.19762/j.cnki.dizhixuebao.2014.12.009, 2014 (in Chinese).
Li, M., Liu, Z., Chen, J., Huang, X., Liu, J., Xie, Y., Hu, B., Xu, Z., Zhang, Y., and Wang, Y.: Characteristics and source apportionment of metallic elements in PM2.5 at urban and suburban sites in Beijing: Implication of emission reduction, Atmosphere, 10, https://doi.org/10.3390/atmos10030105, 2019a.
Li, Q. L. and Sha, Z. J.: Remote sensing monitoring of ecological environment quality in the Qaidam Basin under climate warming, Ecol. Sci., 41, 92–99, https://doi.org/10.14108/j.cnki.1008-8873.2022.06.011, 2022 (in Chinese).
Li, R., Li, C., Zhuang, J., Zhu, H., Fang, L., and Sun, D.: Mechanistic influence of chemical agglomeration agents on removal of inhalable particles from coal combustion, ACS Omega, 5, 25906–25912, https://doi.org/10.1021/acsomega.0c03263, 2020.
Li, Y., Song, Y., Kaskaoutis, D. G., Chen, X., Mamadjanov, Y., and Tan, L.: Atmospheric dust dynamics in southern Central Asia: Implications for buildup of Tajikistan loess sediments, Atmos. Res., 229, 74–85, https://doi.org/10.1016/j.atmosres.2019.06.013, 2019b.
Li, Y., Ma, L., Ge, Y., and Abuduwaili, J.: Health risk of heavy metal exposure from dustfall and source apportionment with the PCA-MLR model: A case study in the Ebinur Lake Basin, China, Atmos. Environ., 272, 118950, https://doi.org/10.1016/j.atmosenv.2022.118950, 2022.
Li, Z., Sjödin, A., Romanoff, L. C., Horton, K., Fitzgerald, C. L., Eppler, A., Aguilar-Villalobos, M., and Naeher, L. P.: Evaluation of exposure reduction to indoor air pollution in stove intervention projects in Peru by urinary biomonitoring of polycyclic aromatic hydrocarbon metabolites, Environ. Int., 37, 1157–1163, https://doi.org/10.1016/j.envint.2011.03.024, 2011.
Li, Z., Yue, Z., Yang, D., Wang, L., Wang, X., Li, Z., Wang, Y., Chen, L., Guo, S., Yao, J., Lou, X., Xu, X., and Wei, J.: Levels, chemical compositions, and sources of PM2.5 of rural and urban area under the impact of wheat harvest, Aerosol Air Qual. Res., 21, https://doi.org/10.4209/aaqr.210026, 2021.
Li, Z., Liu, J., Zhai, Z., Liu, C., Ren, Z., Yue, Z., Yang, D., Hu, Y., Zheng, H., and Kong, S.: Heterogeneous changes of chemical compositions, sources and health risks of PM2.5 with the “Clean Heating” policy at urban/suburban/industrial sites, Sci. Total Environ., 854, 158871, https://doi.org/10.1016/j.scitotenv.2022.158871, 2023.
Lim, H. J. and Turpin, B. J.: Origins of primary and secondary organic aerosol in Atlanta: Results of time-resolved measurements during the Atlanta Supersite Experiment, Environ. Sci. Technol., 36, 4489–4496, https://doi.org/10.1021/es0206487, 2002.
Lin, Y., Mu, G., Chen, L., Wu, C., and Xu, L.: Sorting characteristics and implications indicated by the grain size of near-surface atmospheric dust fall in the Qira Oasis, Journal of Desert Research, 42, 139–146, http://www.desert.ac.cn/CN/10.7522/j.issn.1000-694X.2021.00140 (last access: December 2025), 2022a (in Chinese).
Lin, Y., Mu, G., and Xu, L.: Grain size and sedimentary sorting characteristics of atmospheric dust in the Cele Oasis, Southern Margin of Taklimakan Desert, 14, 8093, https://doi.org/10.3390/su14138093, 2022b.
Lin, Y.-C., Tsai, C.-J., Wu, Y.-C., Zhang, R., Chi, K.-H., Huang, Y.-T., Lin, S.-H., and Hsu, S.-C.: Characteristics of trace metals in traffic-derived particles in Hsuehshan Tunnel, Taiwan: size distribution, potential source, and fingerprinting metal ratio, Atmos. Chem. Phys., 15, 4117–4130, https://doi.org/10.5194/acp-15-4117-2015, 2015.
Liu, B., Song, N., Dai, Q., Mei, R., Sui, B., Bi, X., and Feng, Y.: Chemical composition and source apportionment of ambient PM2.5 during the non-heating period in Taian, China, Atmos. Res., 170, 23–33, https://doi.org/10.1016/j.atmosres, 2016a.
Liu, G., Lucas, M., and Shen, L.: Rural household energy consumption and its impacts on eco-environment in Tibet: Taking Taktse county as an example, Renew. Sust. Energ. Rev., 12, 1890–1908, https://doi.org/10.1016/j.rser.2007.03.008, 2008.
Liu, G., Li, J., Wu, D., and Xu, H.: Chemical composition and source apportionment of the ambient PM2.5 in Hangzhou, China, Particuology, 18, 135–143, https://doi.org/10.1016/j.partic.2014.03.011, 2015.
Liu, G., Yin, G., Kurban, A., Aishan, T., and You, H.: Spatiotemporal dynamics of land cover and their impacts on potential dust source regions in the Tarim Basin, NW China, Environ. Earth Sci., 75, 1477, https://doi.org/10.1007/s12665-016-6269-y, 2016b.
Liu, H., Hu, B., Zhang, L., Zhao, X. J., Shang, K. Z., Wang, Y. S., and Wang, J.: Ultraviolet radiation over China: Spatial distribution and trends, Renew. Sust. Energ. Rev., 76, 1371–1383, https://doi.org/10.1016/j.rser.2017.03.102, 2017.
Liu, H., Jia, M., Tao, J., Yao, D., Li, J., Zhang, R., Li, L., Xu, M., Fan, Y., Liu, Y., and Cheng, K.: Elucidating pollution characteristics, temporal variation and source origins of carbonaceous species in Xinxiang, a heavily polluted city in North China, Atmos. Environ., 298, 119626, https://doi.org/10.1016/j.atmosenv.2023.119626, 2023a.
Liu, P., Zhou, H., Chun, X., Wan, Z., Liu, T., Sun, B., Wang, J., and Zhang, W.: Characteristics of fine carbonaceous aerosols in Wuhai, a resource-based city in Northern China: Insights from energy efficiency and population density, Environ. Pollut., 292, 118368, https://doi.org/10.1016/j.envpol.2021.118368, 2022a.
Liu, T., Zhao, C., Chen, Q., Li, L., Si, G., Li, L., and Guo, B.: Characteristics and health risk assessment of heavy metal pollution in atmospheric particulate matter in different regions of the Yellow River Delta in China, Environ. Geochem. Hlth., 45, 2013–2030, https://doi.org/10.1007/s10653-022-01318-5, 2023b.
Liu, W., Hopke, P. K., Han, Y. J., Yi, S. M., Holsen, T. M., Cybart, S., Kozlowski, K., and Milligan, M.: Application of receptor modeling to atmospheric constituents at Potsdam and Stockton, NY, Atmos. Environ., 37, 4997–5007, https://doi.org/10.1016/j.atmosenv.2003.08.036, 2003.
Liu, X., Wang, Y., Liu, R., Zhang, Y., Shao, L., Han, K., and Zhang, Y.: Pollution characteristics, source identification and potential ecological risk of 50 elements in atmospheric particulate matter during winter in Qingdao, Arab. J. Geosci., 15, https://doi.org/10.1007/s12517-022-09521-5, 2022b.
Liu, Y., Wu, G., Duan, A., and Zhang, Q.: New evidence that climate warming in the Tibetan Plateau is a result of intensified greenhouse gas emissions, Chinese Sci. Bull., 51, 989–992, https://doi.org/10.1360/csb2006-51-8-989, 2006 (in Chinese).
Liu, Y., Zhu, Q., Huang, J., Hua, S., and Jia, R.: Impact of dust-polluted convective clouds over the Tibetan Plateau on downstream precipitation, Atmos. Environ., 209, 67–77, https://doi.org/10.1016/j.atmosenv.2019.04.001, 2019.
Liu, Y., Liu, G., Yousaf, B., Zhang, J., and Zhou, L.: Carbon fractionation and stable carbon isotopic fingerprint of road dusts near coal power plant with emphases on coal-related source apportionment, Ecotox. Environ. Safe., 202, 110888, https://doi.org/10.1016/j.ecoenv.2020.110888, 2020a.
Liu, Y., Zhu, Q., Hua, S., Alam, K., Dai, T., and Cheng, Y.: Tibetan Plateau driven impact of Taklimakan dust on northern rainfall, Atmos. Environ., 234, 117583, https://doi.org/10.1016/j.atmosenv.2020.117583, 2020b.
Liu, Z. Y., Cheng, J. L., Li, C. Y., Gao, Y., Zhan, C. L., Liu, S., Zhang, J. Q., and Liu, H. X.: Pollution characteristics and source analysis of carbon components in road dust from Qingshan District, Wuhan, Environ. Chem., 40, 772–778, https://doi.org/10.7524/j.issn.0254-6108.2020061305, 2021 (in Chinese).
Löw, F., Navratil, P., Kotte, K., Schöler, H. F., and Bubenzer, O.: Remote-sensing-based analysis of landscape change in the desiccated seabed of the Aral Sea – a potential tool for assessing the hazard degree of dust and salt storms, Environ. Monit. Assess., 185, 8303–8319, https://doi.org/10.1007/s10661-013-3174-7, 2013.
Lu, H. and An, Z. S.: An experimental study on the impacts on measurement of the grain size of loess sediment from pretreatment, Chinese Science Bulley, 42, 96–101, https://doi.org/10.1360/csb1997-42-23-2535, 1997
Luo, M., Liu, Y., Zhu, Q., Tang, Y., and Alam, K.: Role and mechanisms of black carbon affecting water vapor transport to Tibet, Remote Sensing, 12, 0231, https://doi.org/10.3390/rs12020231, 2020.
Ma, Q., Wu, Y., Tao, J., Xia, Y., Liu, X., Zhang, D., Han, Z., Zhang, X., and Zhang, R.: Variations of chemical composition and source apportionment of PM2.5 during winter haze episodes in Beijing, Aerosol Air Qual. Res., 17, 2791–2803, https://doi.org/10.4209/aaqr.2017.10.0366, 2017.
Ma, Y., Ji, Y. Q., Guo, J. J., Zhao, J. Q., Li, Y. Y., Wang, S. B., and Zhang, L.: Characteristics of carbon components and source analysis of road dust during spring in Tianjin, Acta Scientiae Circumstantiae 40, 2540–2545, https://doi.org/10.13227/j.hjkx.201811259, 2019 (in Chinese).
Mahowald, N. M., Engelstaedter, S., Luo, C., Sealy, A., Artaxo, P., Benitez-Nelson, C., Bonnet, S., Chen, Y., Chuang, P. Y., Cohen, D. D., Dulac, F., Herut, B., Johansen, A. M., Kubilay, N., Losno, R., Maenhaut, W., Paytan, A., Prospero, J. M., Shank, L. M., and Siefert, R. L.: Atmospheric iron deposition: Global distribution, variability, and human perturbations, Annu. Rev. Mar. Sci., 1, 245–278, https://doi.org/10.1146/annurev.marine.010908.163727, 2009.
Manousakas, M., Papaefthymiou, H., Diapouli, E., Migliori, A., Karydas, A. G., Bogdanovic-Radovic, I., and Eleftheriadis, K.: Assessment of PM2.5 sources and their corresponding level of uncertainty in a coastal urban area using EPA PMF 5.0 enhanced diagnostics, Sci. Total Environ., 574, 155–164, https://doi.org/10.1016/j.scitotenv.2016.09.047, 2017.
Mbengue, S., Fusek, M., Schwarz, J., Vodička, P., Šmejkalová, A. H., and Holoubek, I.: Four years of highly time resolved measurements of elemental and organic carbon at a rural background site in Central Europe, Atmos. Environ., 182, 335–346, https://doi.org/10.1016/j.atmosenv.2018.03.056, 2018.
Meng, C. C., Wang, L. T., Zhang, F. F., Wei, Z., Ma, S. M., Ma, X., and Yang, J.: Characteristics of concentrations and water-soluble inorganic ions in PM2.5 in Handan City, Hebei province, China, Atmos. Res., 171, 133–146, https://doi.org/10.1016/j.atmosres.2015.12.013, 2016.
Meng, J. H., Shi, X. F., Xiang, Y., and Ren, Y. F.: Current status and sources of heavy metal pollution in the atmosphere, Environ. Sci. Manage., 42, 51–53, https://doi.org/10.3969/j.issn.1673-1212.2017.08.011, 2017 (in Chinese).
Meng, W., Zhong, Q., Chen, Y., Shen, H., Yun, X., Smith, K. R., Li, B., Liu, J., Wang, X., Ma, J., Cheng, H., Zeng, E. Y., Guan, D., Russell, A. G., and Tao, S.: Energy and air pollution benefits of household fuel policies in northern China, P. Natl. Acad. Sci. USA, 116, 16773–16780, https://doi.org/10.1073/pnas.1904182116, 2019.
Miller, M. B., Fine, R., Pierce, A. M., and Gustin, M. S.: Identifying sources of ozone to three rural locations in Nevada, USA, using ancillary gas pollutants, aerosol chemistry, and mercury, Sci. Total Environ., 530–531, 483–492, https://doi.org/10.1016/j.scitotenv.2015.03.146, 2015.
Millet, D. B., Donahue, N. M., Pandis, S. N., Polidori, A., Stanier, C. O., Turpin, B. J., and Goldstein, A. H.: Atmospheric volatile organic compound measurements during the Pittsburgh Air Quality Study: Results, interpretation, and quantification of primary and secondary contributions, J. Geophys. Res.-Atmos., 110, https://doi.org/10.1029/2004JD004601, 2005.
Ming, J., Xiao, C., Sun, J., Kang, S., and Bonasoni, P.: Carbonaceous particles in the atmosphere and precipitation of the Nam Co region, central Tibet, J. Environ. Sci., 22, 1748–1756, https://doi.org/10.1016/S1001-0742(09)60315-6, 2010.
Mishra, M. and Kulshrestha, U.: Chemical characteristics and deposition fluxes of dust-carbon mixed coarse aerosols at three sites of Delhi, NCR, J. Atmos. Chem., 74, 399–421, https://doi.org/10.1007/s10874-016-9349-1, 2017.
Moravek, A., Murphy, J. G., Hrdina, A., Lin, J. C., Pennell, C., Franchin, A., Middlebrook, A. M., Fibiger, D. L., Womack, C. C., McDuffie, E. E., Martin, R., Moore, K., Baasandorj, M., and Brown, S. S.: Wintertime spatial distribution of ammonia and its emission sources in the Great Salt Lake region, Atmos. Chem. Phys., 19, 15691–15709, https://doi.org/10.5194/acp-19-15691-2019, 2019.
Munawer, M. E.: Human health and environmental impacts of coal combustion and post-combustion wastes, Journal of Sustainable Mining, 17, 87–96, https://doi.org/10.1016/j.jsm.2017.12.007, 2018.
Na, K., Sawant, A. A., Song, C., and Cocker, D. R.: Primary and secondary carbonaceous species in the atmosphere of Western Riverside County, California, Atmos. Environ., 38, 1345–1355, https://doi.org/10.1016/j.atmosenv.2003.11.023, 2004.
Noll, K. E. and Fang, K. Y. P.: Development of a dry deposition model for atmospheric coarse particles, Atmos. Environ., 23, 585–594, https://doi.org/10.1016/0004-6981(89)90007-3, 1989.
Norris, G., Duvall, R., Brown, S., and Bai, S.: EPA Positive Matrix Factorization (PMF) 5.0 fundamentals and user guide, The United States Environmental Protection Agency, https://www.epa.gov (last access: 11 February 2026), 2014.
Nuralykyzy, B., Wang, P., Deng, X., An, S., and Huang, Y.: Heavy metal contents and assessment of soil contamination in different land-use types in the Qaidam Basin, Sustainability, 13, 12020, https://doi.org/10.3390/su132112020, 2021.
Offer, Z. Y., Goossens, D., and Shachak, M.: Aeolian deposition of nitrogen to sandy and loessial ecosystems in the Negev Desert, J. Arid Environ., 23, 355–363, https://doi.org/10.1016/S0140-1963(18)30609-8, 1992.
Oliveira, T., Pio, C., Alves, C., Silvestre, A., Evtyugina, M., Afonso, J., Caseiro, A., and Legrand, M.: Air quality and organic compounds in aerosols from a coastal rural area in the Western Iberian Peninsula over a year long period: Characterisation, loads and seasonal trends, Atmos. Environ., 41, 3631–3643, https://doi.org/10.1016/j.atmosenv.2006.12.046, 2007.
Paatero, P. and Tapper, U.: Positive matrix factorization: A non-negative factor model with optimal utilization of error estimates of data values, Environmetrics, 5, 111–126, https://doi.org/10.1002/env.3170050203, 1994.
Pacyna, J. M. and Pacyna, E. G.: An assessment of global and regional emissions of trace metals to the atmosphere from anthropogenic sources worldwide, Environmen. Rev., 9, 269–298, https://doi.org/10.1139/a01-012, 2001.
Pandolfi, M., Gonzalez-Castanedo, Y., Alastuey, A., de la Rosa, J. D., Mantilla, E., de la Campa, A. S., Querol, X., Pey, J., Amato, F., and Moreno, T.: Source apportionment of PM10 and PM2.5 at multiple sites in the strait of Gibraltar by PMF: impact of shipping emissions, Environ. Sci. Pollut. R., 18, 260–269, https://doi.org/10.1007/s11356-010-0373-4, 2010.
Parajuli, S. P., Stenchikov, G. L., Ukhov, A., Mostamandi, S., Kucera, P. A., Axisa, D., Gustafson Jr., W. I., and Zhu, Y.: Effect of dust on rainfall over the Red Sea coast based on WRF-Chem model simulations, Atmos. Chem. Phys., 22, 8659–8682, https://doi.org/10.5194/acp-22-8659-2022, 2022.
Peng, T., Sun, C., Zhang, Y., and Fan, F.: Spatiotemporal variation of anthropogenic heat emission landscape pattern in the central urban area of Guangzhou, Journal of South China Normal University (Natural Science Edition), 53, 92–102, https://doi.org/10.6054/j.jscnun.2021080, 2021.
Pervez, S., Bano, S., Watson, J. G., Chow, J. C., Matawle, J. L., Shrivastava, A., Tiwari, S., and Pervez, Y. F.: Source profiles for PM10−2.5 resuspended dust and vehicle exhaust emissions in Central India, Aerosol Air Qual. Res., 18, 1660–1672, https://doi.org/10.4209/aaqr, 2018.
Pio, C., Cerqueira, M., Harrison, R. M., Nunes, T., Mirante, F., Alves, C., Oliveira, C., Sanchez de la Campa, A., Artíñano, B., and Matos, M.: OC/EC ratio observations in Europe: Re-thinking the approach for apportionment between primary and secondary organic carbon, Atmos. Environ., 45, 6121–6132, https://doi.org/10.1016/j.atmosenv.2011.08.045, 2011.
Pipal, A. S., Singh, S., and Satsangi, G. P.: Study on bulk to single particle analysis of atmospheric aerosols at urban region, Urban Climate, 27, 243–258, https://doi.org/10.1016/j.uclim.2018.12.008, 2019.
Popovicheva, O. B., Engling, G., Diapouli, E., Saraga, D., Persiantseva, N. M., Timofeev, M. A., Kireeva, E. D., Shonija, N. K., Chen, S. H., Nguyen, D. L., Eleftheriadis, K., and Lee, C. T.: Impact of smoke intensity on size-resolved aerosol composition and microstructure during the biomass burning season in Northwest Vietnam, Aerosol Air Qual. Res., 16, 2635–2654, https://doi.org/10.4209/aaqr, 2016.
Qi, D. L., Zhao, Q. N., Zhao, H. F., Han, T. F., and Su, W. J.: Temporal and spatial characteristics and regional differences of dust-fall in Qinghai Province from 2004 to 2017, Arid Meteorology, 36, 927–935, http://www.ghqx.org.cn/CN/Y2018/V36/I6/927 (last access: March 2025), 2018 (in Chinese).
Qian, G. Q. and Dong, Z. B.: Discussions on Different Dust Trapping Methods and on Some Related Topics, Journal of Desert Research, 24, 779–782, http://www.desert.ac.cn/CN/Y2004/V24/I6/779 (last access: 28 February 2026), 2004 (in Chinese).
Qian, Y., Yasunari, T. J., Doherty, S. J., Flanner, M. G., Lau, W. K. M., Ming, J., Wang, H., Wang, M., Warren, S. G., and Zhang, R.: Light-absorbing particles in snow and ice: Measurement and modeling of climatic and hydrological impact, Adv. Atmos. Sci., 32, 64–91, https://doi.org/10.1007/s00376-014-0010-0, 2015.
Qiao, Q., Huang, B., Zhang, C., Piper, J. D. A., Pan, Y., and Sun, Y.: Assessment of heavy metal contamination of dustfall in northern China from integrated chemical and magnetic investigation, Atmos. Environ., 74, 182–193, https://doi.org/10.1016/j.atmosenv.2013.03.039, 2013.
Qinghai Provincial Bureau of Statistics: 2023 Qinghai Statistical Yearbook, http://tjj.qinghai.gov.cn/nj/2023/indexch.htm (last access: 26 October 2025), 2024a.
Qinghai Provincial Bureau of Statistics: 2023 Statistical Yearbook of Qinghai Haixi Xizang Autonomous Prefecture Statistical Yearbook, http://tjj.qinghai.gov.cn/tjData/cityBulletin/202408/t20240807_240973.html (last access: 26 October 2025), 2024b.
Rabha, S., Saikia, B. K., Singh, G. K., and Gupta, T.: Meteorological influence and chemical compositions of atmospheric particulate matters in an Indian Urban Area, ACS Earth Space Chem., 5, 1686–1694, https://doi.org/10.1021/acsearthspacechem.1c00037, 2021.
Ramanathan, V. and Carmichael, G.: Global and regional climate changes due to black carbon, Nat. Geosci., 1, 221–227, https://doi.org/10.1038/ngeo156, 2008.
Reff, A., Eberly, S. I., and Bhave, P. V.: Receptor modeling of ambient particulate matter data using Positive Matrix Factorization: Review of existing methods, JAPCA J. Air Waste Ma., 57, 146–154, https://doi.org/10.1080/10473289.2007.10465319, 2007.
Rogge, W. F., Hildemann, L. M., Mazurek, M. A., Cass, G. R., and Simoneit, B. R. T.: Sources of fine organic aerosol. 3. Road dust, tire debris, and organometallic brake lining dust: roads as sources and sinks, Environ. Sci. Technol., 27, 1892–1904, https://doi.org/10.1021/es00046a019, 1993.
Rörig-Dalgaard, I.: Direct measurements of the deliquescence relative humidity in salt mixtures including the contribution from metastable phases, ACS Omega, 6, 16297–16306, https://doi.org/10.1021/acsomega.1c00538, 2021.
Saha, A. and Despiau, S.: Seasonal and diurnal variations of black carbon aerosols over a Mediterranean coastal zone, Atmos. Res., 92, 27–41, https://doi.org/10.1016/j.atmosres.2008.07.007, 2009.
Sandrini, S., Fuzzi, S., Piazzalunga, A., Prati, P., Bonasoni, P., Cavalli, F., Bove, M. C., Calvello, M., Cappelletti, D., Colombi, C., Contini, D., de Gennaro, G., Di Gilio, A., Fermo, P., Ferrero, L., Gianelle, V., Giugliano, M., Ielpo, P., Lonati, G., Marinoni, A., Massabò, D., Molteni, U., Moroni, B., Pavese, G., Perrino, C., Perrone, M. G., Perrone, M. R., Putaud, J.-P., Sargolini, T., Vecchi, R., and Gilardoni, S.: Spatial and seasonal variability of carbonaceous aerosol across Italy, Atmos. Environ., 99, 587–598, https://doi.org/10.1016/j.atmosenv.2014.10.032, 2014.
Saraga, D., Maggos, T., Degrendele, C., Klánová, J., Horvat, M., Kocman, D., Kanduč, T., Garcia Dos Santos, S., Franco, R., Gómez, P. M., Manousakas, M., Bairachtari, K., Eleftheriadis, K., Kermenidou, M., Karakitsios, S., Gotti, A., and Sarigiannis, D.: Multi-city comparative PM2.5 source apportionment for fifteen sites in Europe: The ICARUS project, Sci. Total Environ., 751, 141855, https://doi.org/10.1016/j.scitotenv.2020.141855, 2021.
Saud, T., Saxena, M., Singh, D. P., Saraswati, Dahiya, M., Sharma, S. K., Datta, A., Gadi, R., and Mandal, T. K.: Spatial variation of chemical constituents from the burning of commonly used biomass fuels in rural areas of the Indo-Gangetic Plain (IGP), India, Atmos. Environ., 71, 158–169, https://doi.org/10.1016/j.atmosenv.2013.01.053, 2013.
Schepanski, K.: Transport of mineral dust and its impact on climate, Geosciences, 8, 151, https://doi.org/10.3390/geosciences8050151, 2018.
Schmidl, C., Marr, I. L., Caseiro, A., Kotianová, P., Berner, A., Bauer, H., Kasper-Giebl, A., and Puxbaum, H.: Chemical characterisation of fine particle emissions from wood stove combustion of common woods growing in mid-European Alpine regions, Atmos. Environ., 42, 126–141, https://doi.org/10.1016/j.atmosenv.2007.09.028, 2008.
Secrest, M. H., Schauer, J. J., Carter, E. M., and Baumgartner, J.: Particulate matter chemical component concentrations and sources in settings of household solid fuel use, Indoor Air, 27, 1052–1066, https://doi.org/10.1111/ina.12389, 2017.
Seinfeld, J. H., Pandis, S. N., and Noone, K. J. J. P. T.: Atmospheric chemistry and physics: From air pollution to climate change, Phys. Today, 51, 88–90, 1998.
Shahram, N., Majid, K., Mehdi, F., Soodabeh, M., and Ahmad, Y.: The origins and sources of dust particles, their effects on environment and health, and control strategies: A review, Journal of Air Pollution and Health, 1, 137–152, https://api.semanticscholar.org/CorpusID:56256748 (last access: December 2024), 2016.
Sharma, S., Brook, J. R., Cachier, H., Chow, J., Gaudenzi, A., and Lu, G.: Light absorption and thermal measurements of black carbon in different regions of Canada, J. Geophys. Res.-Atmos., 107, AAC 11-11, https://doi.org/10.1029/2002JD002496, 2002.
Sheehan, P. E. and Bowman, F. M.: Estimated effects of temperature on secondary organic aerosol concentrations, Environ. Sci. Technol., 35, 2129–2135, https://doi.org/10.1021/es001547g, 2001.
Shen, G. F., Xiong, R., Cheng, H. F., and Tao, S.: Estimation of residential energy structure and primary PM2.5 emissions in rural Tibet, Sci. Bull., 66, 1900–1911, https://doi.org/10.1360/TB-2020-0408, 2021a (in Chinese).
Shen, L., Wang, H., Kong, X., Zhang, C., Shi, S., and Zhu, B.: Characterization of black carbon aerosol in the Yangtze River Delta, China: Seasonal variation and source apportionment, Atmos. Pollut. Res., 12, 195–209, https://doi.org/10.1016/j.apr.2020.08.035, 2021b.
Shen, Z., Arimoto, R., Cao, J., Zhang, R., Li, X., Du, N., Okuda, T., Nakao, S., and Tanaka, S.: Seasonal variations and evidence for the effectiveness of pollution controls on water-soluble inorganic species in total suspended particulates and fine particulate matter from Xi'an, China, JAPCA J. Air Waste Ma., 58, 1560–1570, https://doi.org/10.3155/1047-3289.58.12.1560, 2008.
Shen, Z., Zhang, Q., Cao, J., Zhang, L., Lei, Y., Huang, Y., Huang, R. J., Gao, J., Zhao, Z., Zhu, C., Yin, X., Zheng, C., Xu, H., and Liu, S.: Optical properties and possible sources of brown carbon in PM2.5 over Xi'an, China, Atmos. Environ., 150, 322–330, https://doi.org/10.1016/j.atmosenv.2016.11.024, 2017.
Shi, G., Chen, Z., Teng, J., Bi, C., Zhou, D., Sun, C., Li, Y., and Xu, S.: Fluxes, variability and sources of cadmium, lead, arsenic and mercury in dry atmospheric depositions in urban, suburban and rural areas, Environ. Res., 113, 28–32, https://doi.org/10.1016/j.envres.2012.01.001, 2012.
Shi, Z., Vu, T., Kotthaus, S., Harrison, R. M., Grimmond, S., Yue, S., Zhu, T., Lee, J., Han, Y., Demuzere, M., Dunmore, R. E., Ren, L., Liu, D., Wang, Y., Wild, O., Allan, J., Acton, W. J., Barlow, J., Barratt, B., Beddows, D., Bloss, W. J., Calzolai, G., Carruthers, D., Carslaw, D. C., Chan, Q., Chatzidiakou, L., Chen, Y., Crilley, L., Coe, H., Dai, T., Doherty, R., Duan, F., Fu, P., Ge, B., Ge, M., Guan, D., Hamilton, J. F., He, K., Heal, M., Heard, D., Hewitt, C. N., Hollaway, M., Hu, M., Ji, D., Jiang, X., Jones, R., Kalberer, M., Kelly, F. J., Kramer, L., Langford, B., Lin, C., Lewis, A. C., Li, J., Li, W., Liu, H., Liu, J., Loh, M., Lu, K., Lucarelli, F., Mann, G., McFiggans, G., Miller, M. R., Mills, G., Monk, P., Nemitz, E., O'Connor, F., Ouyang, B., Palmer, P. I., Percival, C., Popoola, O., Reeves, C., Rickard, A. R., Shao, L., Shi, G., Spracklen, D., Stevenson, D., Sun, Y., Sun, Z., Tao, S., Tong, S., Wang, Q., Wang, W., Wang, X., Wang, X., Wang, Z., Wei, L., Whalley, L., Wu, X., Wu, Z., Xie, P., Yang, F., Zhang, Q., Zhang, Y., Zhang, Y., and Zheng, M.: Introduction to the special issue “In-depth study of air pollution sources and processes within Beijing and its surrounding region (APHH-Beijing)”, Atmos. Chem. Phys., 19, 7519–7546, https://doi.org/10.5194/acp-19-7519-2019, 2019.
Shrivastava, M., Lou, S., Zelenyuk, A., Easter, R. C., Corley, R. A., Thrall, B. D., Rasch, P. J., Fast, J. D., Massey Simonich, S. L., Shen, H., and Tao, S.: Global long-range transport and lung cancer risk from polycyclic aromatic hydrocarbons shielded by coatings of organic aerosol, P. Natl. Acad. Sci. USA, 114, 1246–1251, https://doi.org/10.1073/pnas.1618475114, 2017.
Simoneit, B. R. T.: Biomass burning – a review of organic tracers for smoke from incomplete combustion, Appl. Geochem., 17, 129–162, https://doi.org/10.1016/S0883-2927(01)00061-0, 2002.
Smichowski, P., Gómez, D., Frazzoli, C., and Caroli, S.: Traffic-related elements in airborne particulate matter, Appl. Spectrosc. Rev., 43, 23–49, https://doi.org/10.1080/05704920701645886, 2007.
Smith, R. M. and Twiss, P. C.: Extensive gaging of dust deposition rates, Kansas Acad., 68, 2, https://doi.org/10.2307/3626489, 1965.
Sow, M., Goossens, D., and Rajot, J. L.: Calibration of the MDCO dust collector and of four versions of the inverted frisbee dust deposition sampler, Geomorphology, 82, 360–375, https://doi.org/10.1016/j.geomorph.2006.05.013, 2006.
Strader, R., Lurmann, F., and Pandis, S. N.: Evaluation of secondary organic aerosol formation in winter, Atmos. Environ., 33, 4849–4863, https://doi.org/10.1016/S1352-2310(99)00310-6, 1999.
Sulong, N. A., Latif, M. T., Sahani, M., Khan, M. F., Fadzil, M. F., Tahir, N. M., Mohamad, N., Sakai, N., Fujii, Y., Othman, M., and Tohno, S.: Distribution, sources and potential health risks of polycyclic aromatic hydrocarbons (PAHs) in PM2.5 collected during different monsoon seasons and haze episode in Kuala Lumpur, Chemosphere, 219, 1–14, https://doi.org/10.1016/j.chemosphere.2018.11.195, 2019.
Tang, Y., Han, G. L., and Xu, Z. F.: Characteristics of black carbon content in atmospheric dust in Beijing and its northern regions, Acta Scientiae Circumstantiae, 33, 332–338, https://doi.org/10.13671/j.hjkxxb.2013.02.033, 2013 (in Chinese).
Tao, J., Cheng, T., Zhang, R., Cao, J., Zhu, L., Wang, Q., Luo, L., and Zhang, L.: Chemical composition of PM2.5 at an urban site of Chengdu in southwestern China, Adv. Atmos. Sci., 30, 1070–1084, https://doi.org/10.1007/s00376-012-2168-7, 2013.
Tao, S., Ru, M. Y., Du, W., Zhu, X., Zhong, Q. R., Li, B. G., Shen, G. F., Pan, X. L., Meng, W. J., Chen, Y. L., Shen, H. Z., Lin, N., Su, S., Zhuo, S. J., Huang, T. B., Xu, Y., Yun, X., Liu, J. F., Wang, X. L., Liu, W. X., Cheng, H. F., and Zhu, D. Q.: Quantifying the rural residential energy transition in China from 1992 to 2012 through a representative national survey, Nature Energy, 3, 567–573, https://doi.org/10.1038/s41560-018-0158-4, 2018.
Tian, M., Gao, J., Zhang, L., Zhang, H., Feng, C., and Jia, X.: Effects of dust emissions from wind erosion of soil on ambient air quality, Atmos. Pollut. Res., 12, https://doi.org/10.1016/j.apr.2021.101108, 2021.
Tiwari, S., Pandithurai, G., Attri, S. D., Srivastava, A. K., Soni, V. K., Bisht, D. S., Anil Kumar, V., and Srivastava, M. K.: Aerosol optical properties and their relationship with meteorological parameters during wintertime in Delhi, India, Atmos. Res., 153, 465–479, https://doi.org/10.1016/j.atmosres.2014.10.003, 2015.
Turpin, B. J. and Huntzicker, J. J.: Secondary formation of organic aerosol in the Los Angeles basin: A descriptive analysis of organic and elemental carbon concentrations, Atmos. Environ., 25, 207–215, https://doi.org/10.1016/0960-1686(91)90291-E, 1991.
Turpin, B. J. and Huntzicker, J. J.: Identification of secondary organic aerosol episodes and quantitation of primary and secondary organic aerosol concentrations during SCAQS, Atmos. Environ., 29, 3527–3544, https://doi.org/10.1016/1352-2310(94)00276-Q, 1995.
Turpin, B. J., Huntzicker, J. J., and Hering, S. V.: Investigation of organic aerosol sampling artifacts in the los angeles basin, Atmos. Environ., 28, 3061–3071, https://doi.org/10.1016/1352-2310(94)00133-6, 1994.
Tuzet, F., Dumont, M., Lafaysse, M., Picard, G., Arnaud, L., Voisin, D., Lejeune, Y., Charrois, L., Nabat, P., and Morin, S.: A multilayer physically based snowpack model simulating direct and indirect radiative impacts of light-absorbing impurities in snow, The Cryosphere, 11, 2633–2653, https://doi.org/10.5194/tc-11-2633-2017, 2017.
VanCuren, R. and Gustin, M. S.: Identification of sources contributing to PM2.5 and ozone at elevated sites in the western U.S. by receptor analysis: Lassen Volcanic National Park, California, and Great Basin National Park, Nevada, Sci. Total Environ., 530–531, 505–518, https://doi.org/10.1016/j.scitotenv.2015.03.091, 2015.
Wang, F.: The mechanism and timescales of soil formation in the hyper-arid Atacama Desert, Chile, Purdue University, 2013.
Wang, F., Michalski, G., Seo, J.-H., and Ge, W.: Geochemical, isotopic, and mineralogical constraints on atmospheric deposition in the hyper-arid Atacama Desert, Chile, Geochim. Cosmochim. Ac., 135, 29–48, https://doi.org/10.1016/j.gca.2014.03.017, 2014.
Wang, H., Ding, J., Xu, J., Wen, J., Han, J., Wang, K., Shi, G., Feng, Y., Ivey, C. E., Wang, Y., Nenes, A., Zhao, Q., and Russell, A. G.: Aerosols in an arid environment: The role of aerosol water content, particulate acidity, precursors, and relative humidity on secondary inorganic aerosols, Sci. Total Environ., 646, 564–572, https://doi.org/10.1016/j.scitotenv.2018.07.321, 2019.
Wang, Z. Y., Xue, D., Jia, H. Y., Liu, J., Mao, T. Y., Song, S. J., and Li, P. H.: Characteristics of carbon components carried by atmospheric fine particles in Tianjin Binhai New Area, Environ. Chem., 40, 1871–1876, https://doi.org/10.7524/j.issn.0254-6108.2020011501, 2021.
Watson, J. G., Antony Chen, L. W., Chow, J. C., Doraiswamy, P., and Lowenthal, D. H.: Source apportionment: Findings from the U.S. supersites program, JAPCA J. Air Waste Ma., 58, 265–288, https://doi.org/10.3155/1047-3289.58.2.265, 2008.
Wei, C., Bandowe, B. A. M., Han, Y., Cao, J., Zhan, C., and Wilcke, W.: Polycyclic aromatic hydrocarbons (PAHs) and their derivatives (alkyl-PAHs, oxygenated-PAHs, nitrated-PAHs and azaarenes) in urban road dusts from Xi'an, Central China, Chemosphere, 134, 512–520, https://doi.org/10.1016/j.chemosphere.2014.11.052, 2015.
Wei, T., Dong, Z., Kang, S., Qin, X., and Guo, Z.: Geochemical evidence for sources of surface dust deposited on the Laohugou glacier, Qilian Mountains, Appl. Geochem., 79, 1–8, https://doi.org/10.1016/j.apgeochem.2017.01.024, 2017.
Wei, Y., Xie, Y., Dang, X., Guo, J., Liu, M., and Wu, H.: Characteristics of atmospheric dust deposition and influencing factors in different protection functional areas of the Jilantai Salt Lake Protection system, Research of Soil and Water Conservation, 30, 201–208, https://doi.org/10.13869/j.cnki.rswc.2023.05.027, 2023.
Wu, C. and Yu, J. Z.: Determination of primary combustion source organic carbon-to-elemental carbon () ratio using ambient OC and EC measurements: secondary OC-EC correlation minimization method, Atmos. Chem. Phys., 16, 5453–5465, https://doi.org/10.5194/acp-16-5453-2016, 2016.
Wu, C., Wu, D., and Yu, J. Z.: Quantifying black carbon light absorption enhancement with a novel statistical approach, Atmos. Chem. Phys., 18, 289–309, https://doi.org/10.5194/acp-18-289-2018, 2018.
Wu, Y., Zhang, R., Tian, P., Tao, J., Hsu, S. C., Yan, P., Wang, Q., Cao, J., Zhang, X., and Xia, X.: Effect of ambient humidity on the light absorption amplification of black carbon in Beijing during January 2013, Atmos. Environ., 124, 217–223, https://doi.org/10.1016/j.atmosenv.2015.04.041, 2016.
Xia, X., Zong, X., Cong, Z., Chen, H., Kang, S., and Wang, P.: Baseline continental aerosol over the central Tibetan plateau and a case study of aerosol transport from South Asia, Atmos. Environ., 45, 7370–7378, https://doi.org/10.1016/j.atmosenv.2011.07.067, 2011.
Xiao, Q., Saikawa, E., Yokelson, R. J., Chen, P., Li, C., and Kang, S.: Indoor air pollution from burning yak dung as a household fuel in Tibet, Atmos. Environ., 102, 406–412, https://doi.org/10.1016/j.atmosenv.2014.11.060, 2015.
Xie, F., Guo, L., Wang, Z., Tian, Y., Yue, C., Zhou, X., Wang, W., Xin, J., and Lu, C.: Geochemical characteristics and socioeconomic associations of carbonaceous aerosols in coal-fueled cities with significant seasonal pollution pattern, Environ. Int., 179, 108179, https://doi.org/10.1016/j.envint.2023.108179, 2023.
Xu, L., Chen, X., Chen, J., Zhang, F., He, C., Zhao, J., and Yin, L.: Seasonal variations and chemical compositions of PM2.5 aerosol in the urban area of Fuzhou, China, Atmos. Res., 104–105, 264–272, https://doi.org/10.1016/j.atmosres, 2012.
Xu, M., Liu, Z., Hu, B., Yan, G., Zou, J., Zhao, S., Zhou, J., Liu, X., Zheng, X., Zhang, X., Cao, J., Guan, M., Lv, Y., and Zhang, Y.: Chemical characterization and source identification of PM2.5 in Luoyang after the clean air actions, J. Environ. Sci., 115, 265–276, https://doi.org/10.1016/j.jes.2021.06.021, 2022.
Xu, R., Tie, X., Li, G., Zhao, S., Cao, J., Feng, T., and Long, X.: Effect of biomass burning on black carbon (BC) in South Asia and Tibetan Plateau: The analysis of WRF-Chem modeling, Sci. Total Environ., 645, 901–912, https://doi.org/10.1016/j.scitotenv.2018.07.165, 2018.
Xu, Z.: Airborne particles in outdoor air: Atmospheric dust, in: Fundamentals of air cleaning technology and its application in cleanrooms, Springer Berlin Heidelberg, 47–132, https://doi.org/10.1007/978-3-642-39374-7_2, 2014.
Xu, Z., Wang, J., and Han, J.: Ecological vulnerability assessment of the Qaidam Basin based on the SRP Model, Salt Lake Research, 32, 53–60, https://doi.org/10.3724/j.yhyj.2024009, 2024.
Xue, W., Wang, L., Yang, Z., Xiong, Z., Li, X., Xu, Q., and Cai, Z.: Can clean heating effectively alleviate air pollution: An empirical study based on the plan for cleaner winter heating in northern China, Appl. Energ., 351, 121923, https://doi.org/10.1016/j.apenergy.2023.121923, 2023.
Yang, Q. L., Wang, J. X., and Zhao, Z. X.: Temporal and spatial distribution characteristics and source analysis of heavy metals in atmospheric dust in typical industrial cities in Northeast China during winter and spring, Acta Scientiae Circumstantiae, 1–9, https://doi.org/10.13671/j.hjkxxb.2024.0254, 2024 (in Chinese).
Yang, X., Zhou, C., Huo, W., Yang, F., Liu, X., and Mamtimin, A.: A study on the effects of soil moisture, air humidity, and air temperature on wind speed threshold for dust emissions in the Taklimakan Desert, Natural Hazards, 97, 1069–1081, https://doi.org/10.1007/s11069-019-03686-1, 2019.
Yang, X. Y.: Analysis and research on the current situation of atmospheric environment in Northwestern China (Gansu, Qinghai, Xinjiang), Master's thesis, Lanzhou University, 2014.
Yao, L., Yang, L., Yuan, Q., Yan, C., Dong, C., Meng, C., Sui, X., Yang, F., Lu, Y., and Wang, W.: Sources apportionment of PM2.5 in a background site in the North China Plain, Sci. Total Environ., 541, 590–598, https://doi.org/10.1016/j.scitotenv.2015.09.123, 2016.
Ye, W., Saikawa, E., Avramov, A., Cho, S. H., and Chartier, R.: Household air pollution and personal exposure from burning firewood and yak dung in summer in the eastern Tibetan Plateau, Environ. Pollut., 263, 114531, https://doi.org/10.1016/j.envpol.2020.114531, 2020.
Yoo, H. Y., Kim, K. A., Kim, Y. P., Jung, C. H., Shin, H. J., Moon, K. J., Park, S. M., and Lee, J. Y.: Validation of SOC estimation using OC and EC concentration in PM2.5 measured at Seoul, Aerosol Air Qual. Res., 22, 210388, https://doi.org/10.4209/aaqr.210388, 2022.
You, S., Yao, Z., Dai, Y., and Wang, C. H.: A comparison of PM exposure related to emission hotspots in a hot and humid urban environment: Concentrations, compositions, respiratory deposition, and potential health risks, Sci. Total Environ., 599–600, 464–473, https://doi.org/10.1016/j.scitotenv.2017.04.217, 2017.
Yu, H., Yang, W., Wang, X., Yin, B., Zhang, X., Wang, J., Gu, C., Ming, J., Geng, C., and Bai, Z.: A seriously sand storm mixed air-polluted area in the margin of Tarim Basin: Temporal-spatial distribution and potential sources, Sci. Total Environ., 676, 436–446, https://doi.org/10.1016/j.scitotenv.2019.04.298, 2019.
Yu, L. P., Li, D., Meng, L., Du, C. Y., and Zhao, P.: Observation and data processing methods for atmospheric dust deposition, Anhui Agricultural Sciences, 44, 185–186, https://doi.org/10.13989/j.cnki.0517-6611.2016.31.064, 2016 (in Chinese).
Yue, D., Zhong, L., Zhang, T., Shen, J., Zhou, Y., Zeng, L., Dong, H., and Ye, S.: Pollution properties of water-soluble secondary inorganic ions in atmospheric PM2.5 in the Pearl River Delta Region, Aerosol Air Qual. Res., 15, 1737–1747, https://doi.org/10.4209/aaqr.2014.12.0333, 2015.
Zan, J., Maher, B. A., Fang, X., Stevens, T., Ning, W., Wu, F., Yang, Y., Kang, J., and Hu, Z.: Global dust impacts on biogeochemical cycles and climate, Nature Reviews Earth & Environment, 6, 789–807, https://doi.org/10.1038/s43017-025-00734-2, 2025.
Zang, L., Zhang, Y., Zhu, B., Mao, F., Zhang, Y., and Wang, Z.: Characteristics of water-soluble inorganic aerosol pollution and its meteorological response in Wuhan, Central China, Atmos. Pollut. Res., 12, 362–369, https://doi.org/10.1016/j.apr.2021.01.003, 2021.
Zhan, C., Han, Y., Cao, J., Wei, C., Zhang, J., and An, Z.: Validation and application of a thermal–optical reflectance (TOR) method for measuring black carbon in loess sediments, Chemosphere, 91, 1462–1470, https://doi.org/10.1016/j.chemosphere.2012.12.011, 2013.
Zhan, C. L., Zhang, J. Q., Zheng, J. G., Yao, R. Z., Xiao, W. S., and Cao, J. J.: Pollution characteristics and source analysis of black carbon in atmospheric dust along National Highway 316, Environ. Sci. Technol., 39, 154–160, https://fjks.chinajournal.net.cn/WKB2/WebPublication/paperDigest.aspx?paperID=bf804cde-1a4e-4f15-8789-d1970b615c8f (last access: December 2025), 2016 (in Chinese).
Zhan, C. L., Zhan, J. W., Ke, Z. D., Liu, S., Zhang, J. Q., and Liu, H. X.: Pollution characteristics and source analysis of black carbon in different types of dust in Xiaogan, Hubei, Environmental Pollution and Control, 44, 14–19 + 26, https://doi.org/10.15985/j.cnki.1001-3865.2022.01.003, 2022 (in Chinese).
Zhang, B., Shen, Z., Sun, J., He, K., Zou, H., Zhang, Q., Li, J., Xu, H., Liu, S., Ho, K.-F., and Cao, J.: County-level of particle and gases emission inventory for animal dung burning in the Qinghai–Tibetan Plateau, China, J. Clean. Prod., 367, https://doi.org/10.1016/j.jclepro.2022.133051, 2022a.
Zhang, C., Qiao, Q., Appel, E., and Huang, B.: Discriminating sources of anthropogenic heavy metals in urban street dusts using magnetic and chemical methods, J. Geochem. Explor., 119–120, 60–75, https://doi.org/10.1016/j.gexplo.2012.06.014, 2012.
Zhang, F.: Study on the dry deposition of organic carbon and elemental carbon in the atmosphere of Nanchang, Master's Thesis, 2014 (in Chinese).
Zhang, F., Wang, Z. W., Cheng, H. R., Lv, X. P., Gong, W., Wang, X. M., and Zhang, G.: Seasonal variations and chemical characteristics of PM2.5 in Wuhan, central China, Sci. Total Environ., 518–519, 97–105, https://doi.org/10.1016/j.scitotenv.2015.02.054, 2015a.
Zhang, J., Smith, K. R., Ma, Y., Ye, S., Jiang, F., Qi, W., Liu, P., Khalil, M. A. K., Rasmussen, R. A., and Thorneloe, S. A.: Greenhouse gases and other airborne pollutants from household stoves in China: a database for emission factors, Atmos. Environ., 34, 4537–4549, https://doi.org/10.1016/S1352-2310(99)00450-1, 2000.
Zhang, J., Liu, H. N., Zheng, Q. P., and Tang, L. J.: Correlation study between particulate matter and visibility in Suzhou, Proceedings of the 7th Annual Conference of Chinese Society of Particuology cum Symposium on Particle Technology across Taiwan Straits, Xi'an, Shaanxi, China, 1, 2010.
Zhang, J., Huang, X., Li, J., Chen, L., Zhao, R., Wang, R., Sun, W., Chen, C., Su, Y., Wang, F., Huang, Y., and Lin, C.: Chemical composition, sources and evolution of PM2.5 during wintertime in the city cluster of southern Sichuan, China, Atmos. Pollut. Res., 14, 101635, https://doi.org/10.1016/j.apr.2022.101635, 2023.
Zhang, K., Shang, X., Herrmann, H., Meng, F., Mo, Z., Chen, J., and Lv, W.: Approaches for identifying PM2.5 source types and source areas at a remote background site of South China in spring, Sci. Total Environ., 691, 1320–1327, https://doi.org/10.1016/j.scitotenv.2019.07.178, 2019.
Zhang, P. X.: Salt lakes in the Qaidam Basin, Beijing, Science Press, ISBN 130313463, 1987 (in Chinese).
Zhang, R., Jing, J., Tao, J., Hsu, S.-C., Wang, G., Cao, J., Lee, C. S. L., Zhu, L., Chen, Z., Zhao, Y., and Shen, Z.: Chemical characterization and source apportionment of PM2.5 in Beijing: seasonal perspective, Atmos. Chem. Phys., 13, 7053–7074, https://doi.org/10.5194/acp-13-7053-2013, 2013.
Zhang, R., Wang, H., Qian, Y., Rasch, P. J., Easter, R. C., Ma, P.-L., Singh, B., Huang, J., and Fu, Q.: Quantifying sources, transport, deposition, and radiative forcing of black carbon over the Himalayas and Tibetan Plateau, Atmos. Chem. Phys., 15, 6205–6223, https://doi.org/10.5194/acp-15-6205-2015, 2015b.
Zhang, R. J., Cao, J. J., Lee, S. C., Shen, Z. X., and Ho, K. F.: Carbonaceous aerosols in PM10 and pollution gases in winter in Beijing, J. Environ. Sci., 19, 564-571, https://doi.org/10.1016/S1001-0742(07)60094-1, 2007.
Zhang, S.: Spatial and temporal variation characteristics of atmospheric dust deposition flux in Hebei Province over the Recent 20 Years, Master's thesis, Hebei Normal University, 2010.
Zhang, T., Cao, J. J., Tie, X. X., Shen, Z. X., Liu, S. X., Ding, H., Han, Y. M., Wang, G. H., Ho, K. F., Qiang, J., and Li, W. T.: Water-soluble ions in atmospheric aerosols measured in Xi'an, China: Seasonal variations and sources, Atmos. Res., 102, 110–119, https://doi.org/10.1016/j.atmosres.2011.06.014, 2011.
Zhang, X. Y., Wang, Y. Q., Zhang, X. C., Guo, W., and Gong, S. L.: Carbonaceous aerosol composition over various regions of China during 2006, J. Geophys. Res.-Atmos., 113, https://doi.org/10.1029/2007jd009525, 2008.
Zhang, Y.: Satellite Observation and ground validation of volatile organic compounds emissions from biomass combustion, Master's thesis, Yunnan University, https://doi.org/10.27456/d.cnki.gyndu.2024.002784, 2024.
Zhang, Z., Zhou, Y., Zhao, N., Li, H., Tohniyaz, B., Mperejekumana, P., Hong, Q., Wu, R., Li, G., Sultan, M., Zayan, A. M. I., Cao, J., Ahmad, R., and Dong, R.: Clean heating during winter season in Northern China: A review, Renew. Sust. Energ. Rev., 149, 111339, https://doi.org/10.1016/j.rser.2021.111339, 2021.
Zhang, Z. C., Xie, Y. Q., Zhang, Z. J., Gao, G. S., Xu, B., Tian, X., Xu, H., Wie, Y. T., Shi, G. L., and Feng, Y. C.: Source analysis and seasonal variation characteristics of atmospheric dust deposition in Taiyuan City based on two receptor models, China Environmental Science, 42, 2577–2586, https://doi.org/10.3969/j.issn.1000-6923, 2022b (in Chinese).
Zhao, Z., Cao, J., Shen, Z., Xu, B., Zhu, C., Chen, L. W. A., Su, X., Liu, S., Han, Y., Wang, G., and Ho, K.: Aerosol particles at a high-altitude site on the Southeast Tibetan Plateau, China: Implications for pollution transport from South Asia, J. Geophys. Res.-Atmos., 118, https://doi.org/10.1002/jgrd.50599, 2013.
Zhen, M. P.: Salt lake resources and ecological environment in China, Acta Geol. Sin., 84, 1613–1622, https://doi.org/10.19762/j.cnki.dizhixuebao.2010.11.007, 2010.
Zheng, J., Hu, M., Du, Z., Shang, D., Gong, Z., Qin, Y., Fang, J., Gu, F., Li, M., Peng, J., Li, J., Zhang, Y., Huang, X., He, L., Wu, Y., and Guo, S.: Influence of biomass burning from South Asia at a high-altitude mountain receptor site in China, Atmos. Chem. Phys., 17, 6853–6864, https://doi.org/10.5194/acp-17-6853-2017, 2017.
Zheng, K., Li, Y., Li, Z., and Huang, J.: Provenance tracing of dust using rare earth elements in recent snow deposited during the pre-monsoon season from mountain glaciers in the central to northern Tibetan Plateau, Environmental Science and Pollution Research, 28, 45765–45779, https://doi.org/10.1007/s11356-021-13561-x, 2021.
Zhou, Y., Gao, X., and Lei, J.: Characteristics of dust weather in the Tarim Basin from 1989 to 2021 and its impact on the atmospheric environment, Remote Sens., 15, 1804, https://doi.org/10.3390/rs15071804, 2023.
Zhou, Y., Yang, J., Kang, S., Hu, Y., Chen, X., Xu, M., and Ma, M.: Black carbon aerosols impact snowfall over the Tibetan Plateau, Geosci. Front., 16, 101978, https://doi.org/10.1016/j.gsf.2024.101978, 2025.
Zhu, C. S., Chen, C. C., Cao, J. J., Tsai, C. J., Chou, C. C. K., Liu, S. C., and Roam, G. D.: Characterization of carbon fractions for atmospheric fine particles and nanoparticles in a highway tunnel, Atmos. Environ., 44, 2668–2673, https://doi.org/10.1016/j.atmosenv.2010.04.042, 2010.
Zhu, H., Li, W., Kong, X., and Zhang, X.: Overlooked contribution of salt lake emissions: A case study of dust deposition from the Qinghai-Xizang Plateau, J. Geophys. Res.-Atmos., 130, e2024JD042693, https://doi.org/10.1029/2024JD042693, 2025.
Zhu, H. X.: The dust deposition data of the Qaidam Basin, Zenodo [data set], https://doi.org/10.5281/zenodo.14382853, 2024.
Zhu, X., Zhu, K., Xie, M., Huang, A., Ouyang, Y., Chen, F., and Zhao, W.: Analysis of current situation and future trend of anthropogenic heat emissions in Jiangsu Province, Climatic and Environmental Research, 21, 306–312, https://doi.org/10.3878/j.issn.1006-9585.2016.15171, 2016.
This study collected dust samples from six sites in the Qaidam Basin over three years to investigate the impact of domestic heating on atmospheric dust in hyper-arid region. Our results indicate that rural dust is significantly influenced by heating, particularly from coal and biomass burning, which accounts for over 70% of total sources. The unique energy structure here has resulted in distinct environmental effects from the emitted carbonaceous aerosols and useful for similar dry areas.
This study collected dust samples from six sites in the Qaidam Basin over three years to...