the Creative Commons Attribution 4.0 License.
the Creative Commons Attribution 4.0 License.
 | 02 Mar 2026
In-tandem multi-waveband particulate absorption and size observations yield substantial changes in radiative forcing over industrial Central China
Luoyao Guan
Shuo Wang
Pravash Tiwari
Zhewen Liu
Zhengqiang Li
Coal-based industry in Shanxi, China, including power generation, steel, coke, and chemical manufacturing, emits large quantities of black carbon (BC), contributing significantly to regional aerosol radiative forcing. However, there are substantial scientific uncertainties in the radiative properties of the aerosols in these types of regions due to multiple sources of BC and high emissions of co-emitted aerosol precursors, producing mixed aerosols of different ages, sizes, and morphologies. This study combined optical particle size and multi-band in-situ BC mass and column aerosol optical depth, with MIE modeling to simulate optical properties per particle and over the atmospheric column for absorbing aerosols. These results are applied in a radiative transfer model to constrain regional radiative forcing. First, BC shows a trimodal fine-mode (size < 2.5 µm) size distribution, substantially differing from current assumptions of aerosol size made by satellite and atmospheric modeling communities. Second, the coating ratio between absorbing-core and refractive-shell varies dynamically, challenging the widely used fixed mixing ratio assumption. Thirdly, absorbed solar radiation under 500 nm is weaker than from 500 to 700 nm, and weaker still than above 800 nm, challenging assumptions of flat or decreasing absorption with radiative band. The results yield substantial changes in single scattering albedo (0.008 to 0.049), column number ( to 5.74×10¹⁰ # m−2), and radiative forcing (−3.0 to −0.3 W m−2), surpassing local CO2 and CH4 forcing. This work provides a realistic probabilistic framework to quantify BC aging and mixing induced optical properties in industrial regions.
- Article
(6130 KB) - Full-text XML
-
Supplement
(8498 KB) - BibTeX
- EndNote


Aerosols are among the most important forcing agents contributing to anthropogenic global change, producing direct, semi-direct and indirect radiative effects that alter Earth's energy balance (Jacobson, 2001; Bond et al., 2013; Garrett and Zhao, 2006; Chen et al., 2024). The chemical composition, optical and microphysical properties of aerosols vary widely due to factors such as source type and magnitude, in-situ processing, and interaction with the environment, leading to a broad range of properties with considerable uncertainty in terms of their climate effects (Bellouin et al., 2020; Li et al., 2025). A subset of aerosols strongly absorbs incoming solar radiation (Ramanathan et al., 2001; Chen et al., 2022a; Pei et al., 2025), and therefore have a further impact on the atmospheric energy balance. The most important of these absorbing aerosols (AA) from the perspective of the net absorption of solar radiation across the spectrum on a per particle basis is black carbon aerosol (BC) (Wang et al., 2021a; Tiwari et al., 2023).
BC arises from both anthropogenic and natural sources of combustion (including but not limited to fossil-fuel use, biomass burning, and wildfires). In the industrial regions (such as examined in this study), incomplete combustion and high-temperature processes co-emit diverse carbonaceous particles and semi-volatile species. These carbonaceous particles contain BC and BC like species (including coal dust produced during coal mining, transport and storage), spanning various sizes, although possessing intrinsic set of Mie absorption coefficients (Khan et al., 2017). However, the co-emitted semi-volatile species condense upon the BC, leading to transformation of the in-situ particles, turn influencing their microphysical and hence optical properties. Key microphysical properties including size and mixing state of these emitted BC aerosols varies significantly with the fuel type, combustion technologies, in-situ processing after emissions and before observation, and other environmental factors (Bond et al., 2013). This intrinsic variability directly controls BC optical behavior and absorption efficiency, underscoring why explicit consideration of particle size and mixing state is physically essential for assessing BC radiative effects in industrial environments.
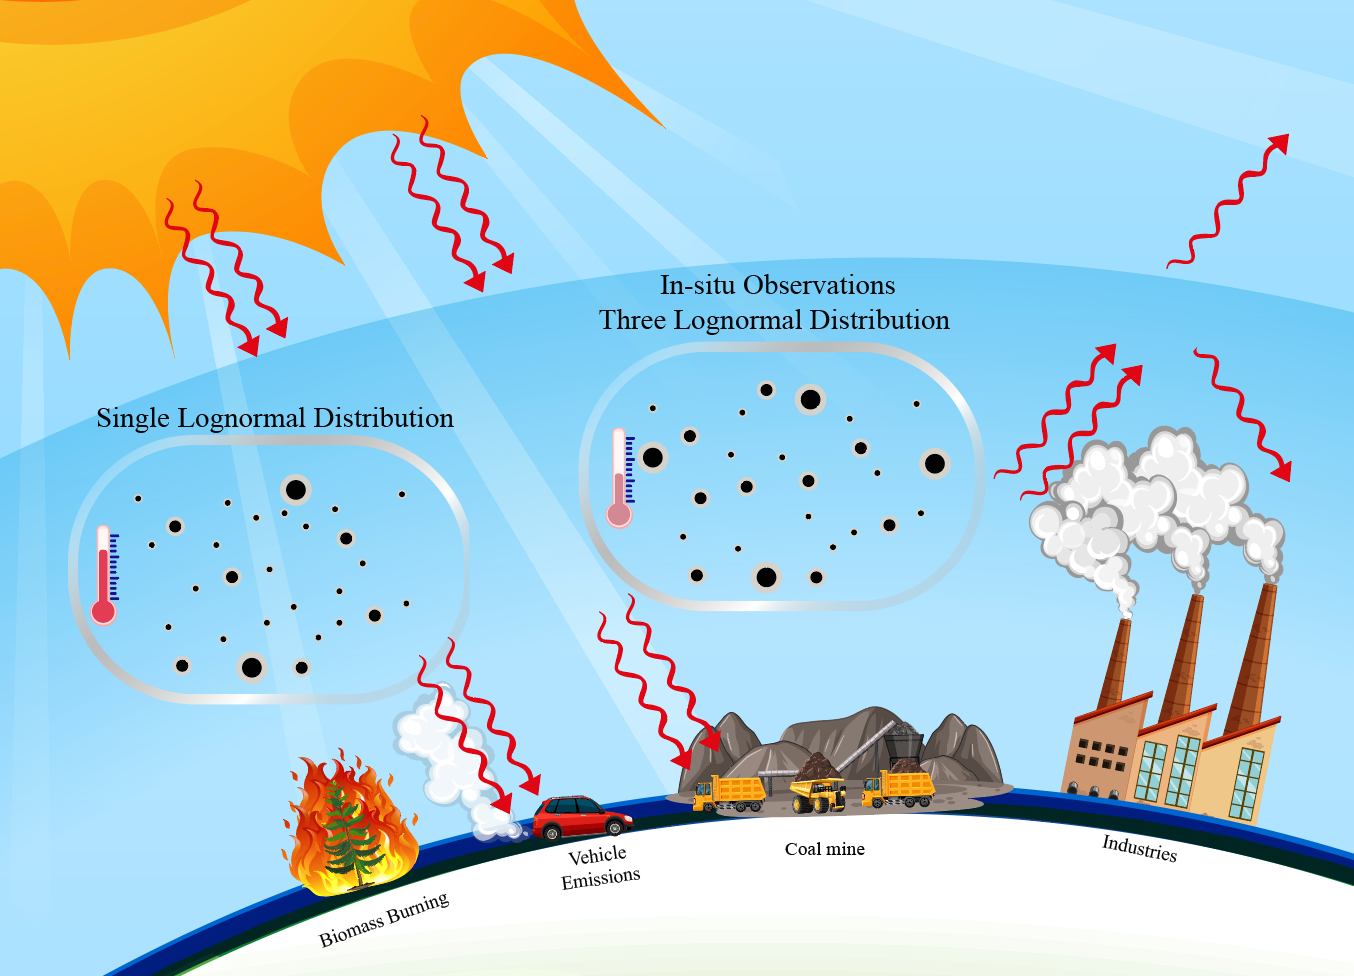
Ground-based studies often prioritize matching aerosol optical depth (AOD) observations (Holben et al., 1998; Wei et al., 2024) or use the measured mass concentration (Savadkoohi et al., 2024; Saarikoski et al., 2021) or single particle properties after altering their shape through heating or chemistry (Wang et al., 2021b; Romshoo et al., 2022) to derive optical properties like single-scattering albedo (SSA) and asymmetry parameter (ASY). In parallel, remote sensing studies and chemical transport models commonly represent aerosol size using simplified parameterizations, most often a single lognormal fine mode distribution (Reddington et al., 2013; Shen et al., 2019) or other simplified distributions such as gamma (Hansen and Travis, 1974), which can deviate substantially from observed distributions and introduce systematic biases. While in-situ measurements provide more precise size information, they typically rely on a single waveband (Wang et al., 2023a; Huang et al., 2024) and even multi-band observations currently apply a fixed size distribution across wavelengths (Prats et al., 2011; Yu et al., 2012). These simplifications become especially limiting in industrial basins, where high levels of co-emitted oxidants (e.g., SO2, NOx, NH3) and water vapor promote rapid atmospheric aging of BC and other primary AA (Guo et al., 2024; Qin et al., 2023; Lu et al., 2025b; Wang et al., 2025), driving particles toward internally mixed, core-shell structures that are not captured by commonly used external mixture (Lesins et al., 2002; Moosmüller et al., 2011) or idealized fractal approximation (Yuan et al., 2019; Loh et al., 2012).
Existing tools to account for total column properties of aerosols rely on iterative tools like the Optical Properties of Aerosols and Clouds (OPAC) framework (Srivastava et al., 2012; Bibi et al., 2017). However, OPAC's rigid parameterization lacks flexibility to represent realistic variations in particle size and mixing states, as well as adversely producing non-unique outputs – critical factors influencing and adding uncertainty to the aerosol radiative effects associated with BC in general. Other approaches assume a fixed core size or property and then assimilate ground and satellite observations of total extinction (i.e., AOD), typically through the use of a fixed Mass Absorption Cross-section (MAC) of ∼7.5 m2 g−1 at 550 nm (Randles et al., 2017). Even more recent studies which use a somewhat varying MAC (Brown et al., 2021) neglect the range of observed enhanced absorption and simultaneous changes in scattering from internal mixing and lensing, which can theoretically impact absorption by 50 %–100 % (Bond and Bergstrom, 2006; Lack et al., 2009).
Since BC tends to be distributed throughout the lower and middle troposphere (Bond et al., 2013; Liu et al., 2015; Cohen et al., 2018; Wang et al., 2020b), where it efficiently contributes to atmospheric warming (Tian et al., 2020). Quantification of radiative forcing is widely used to assess BC-radiation interactions and climatic impacts (Myhre et al., 2014; Bond et al., 2013). However, existing model-based studies contain significant uncertainties, with studies reporting a broad range of radiative effects, from slightly cooling −0.1 to substantial warming 2.0 W m−2 (Tiwari et al., 2023; Cohen and Wang, 2014; Chen et al., 2022b; Chung and Seinfeld, 2005). One of the major issues surrounding these uncertainties is, with it being essential to elucidate both per-particle properties and column number loadings in tandem, in order to match observed variability both at the surface and through the column of aerosol absorption (Liu et al., 2024b; Bao et al., 2020; Kahn et al., 2023). Recent studies have further shown that rigid assumptions regarding particle morphology and mixing state can bias radiative forcing estimates, and that incorporating flexible core-shell structures constrained by multi-waveband SSA observations can substantially alter inferred top-of-atmosphere (TOA) forcing (Peng et al., 2016; Matsui et al., 2018; Tiwari et al., 2023). Similar limitations affect global reanalysis products such as MERRA-2 and CAMS, which rely on simplified optical, physical parameterizations and column loadings (Fu et al., 2022).
To address the aforementioned challenges, this work employs measurements of particle number and multi-band in-situ measurements of BC mass and column AOD, over a coal-based industrial region in Shanxi Province, China, which is representative of several rapidly industrializing regions in the Global South, such as those in India, Indonesia, South Africa, and Bangladesh. Using MIE scattering, we quantify how dynamic variability of aerosol size distribution and mixing state affect per-particle optical properties. Then we use these derived microphysical solutions to invert corresponding BC column number, mixing, and mass concentrations. Finally, the derived suite of observationally constrained probabilistically determined solution of size and mixing state and corresponding optical properties are used to drive a radiative transfer model to estimate local radiative forcing contributions. This integrated approach establishes a physically grounded framework for quantifying BC-climate direct effect in complex emission environments and informs improved parameterization for AA processes in terms of both their regional and global climate impact.
This work is based on an extensive suite of observations made in an intensive coal-based production and industrial use region in Shanxi province (36.07° N, 112.88° E) in August 2022 (Fig. 1). This location was selected for its proximity to a rapidly evolving industrial landscape characterized by intensive coal mining (more than 200 coal mines) and a wide range of coal-consuming industries, including power generation, coking, steel, and chemical manufacturing, alongside traditional agricultural activity and various small industries such as brick making. Additionally, the basin-like topography of the region promotes the accumulation and prolonged atmospheric residence of BC, facilitating complex interactions between primary aerosols and secondary aerosol precursors and hence aging of BC aerosols. This combination of multiple sources within a confined spatial domain makes the region highly representative of many rapidly developing industrial areas across the Global South (Tiwari et al., 2025; Ramachandran et al., 2023).
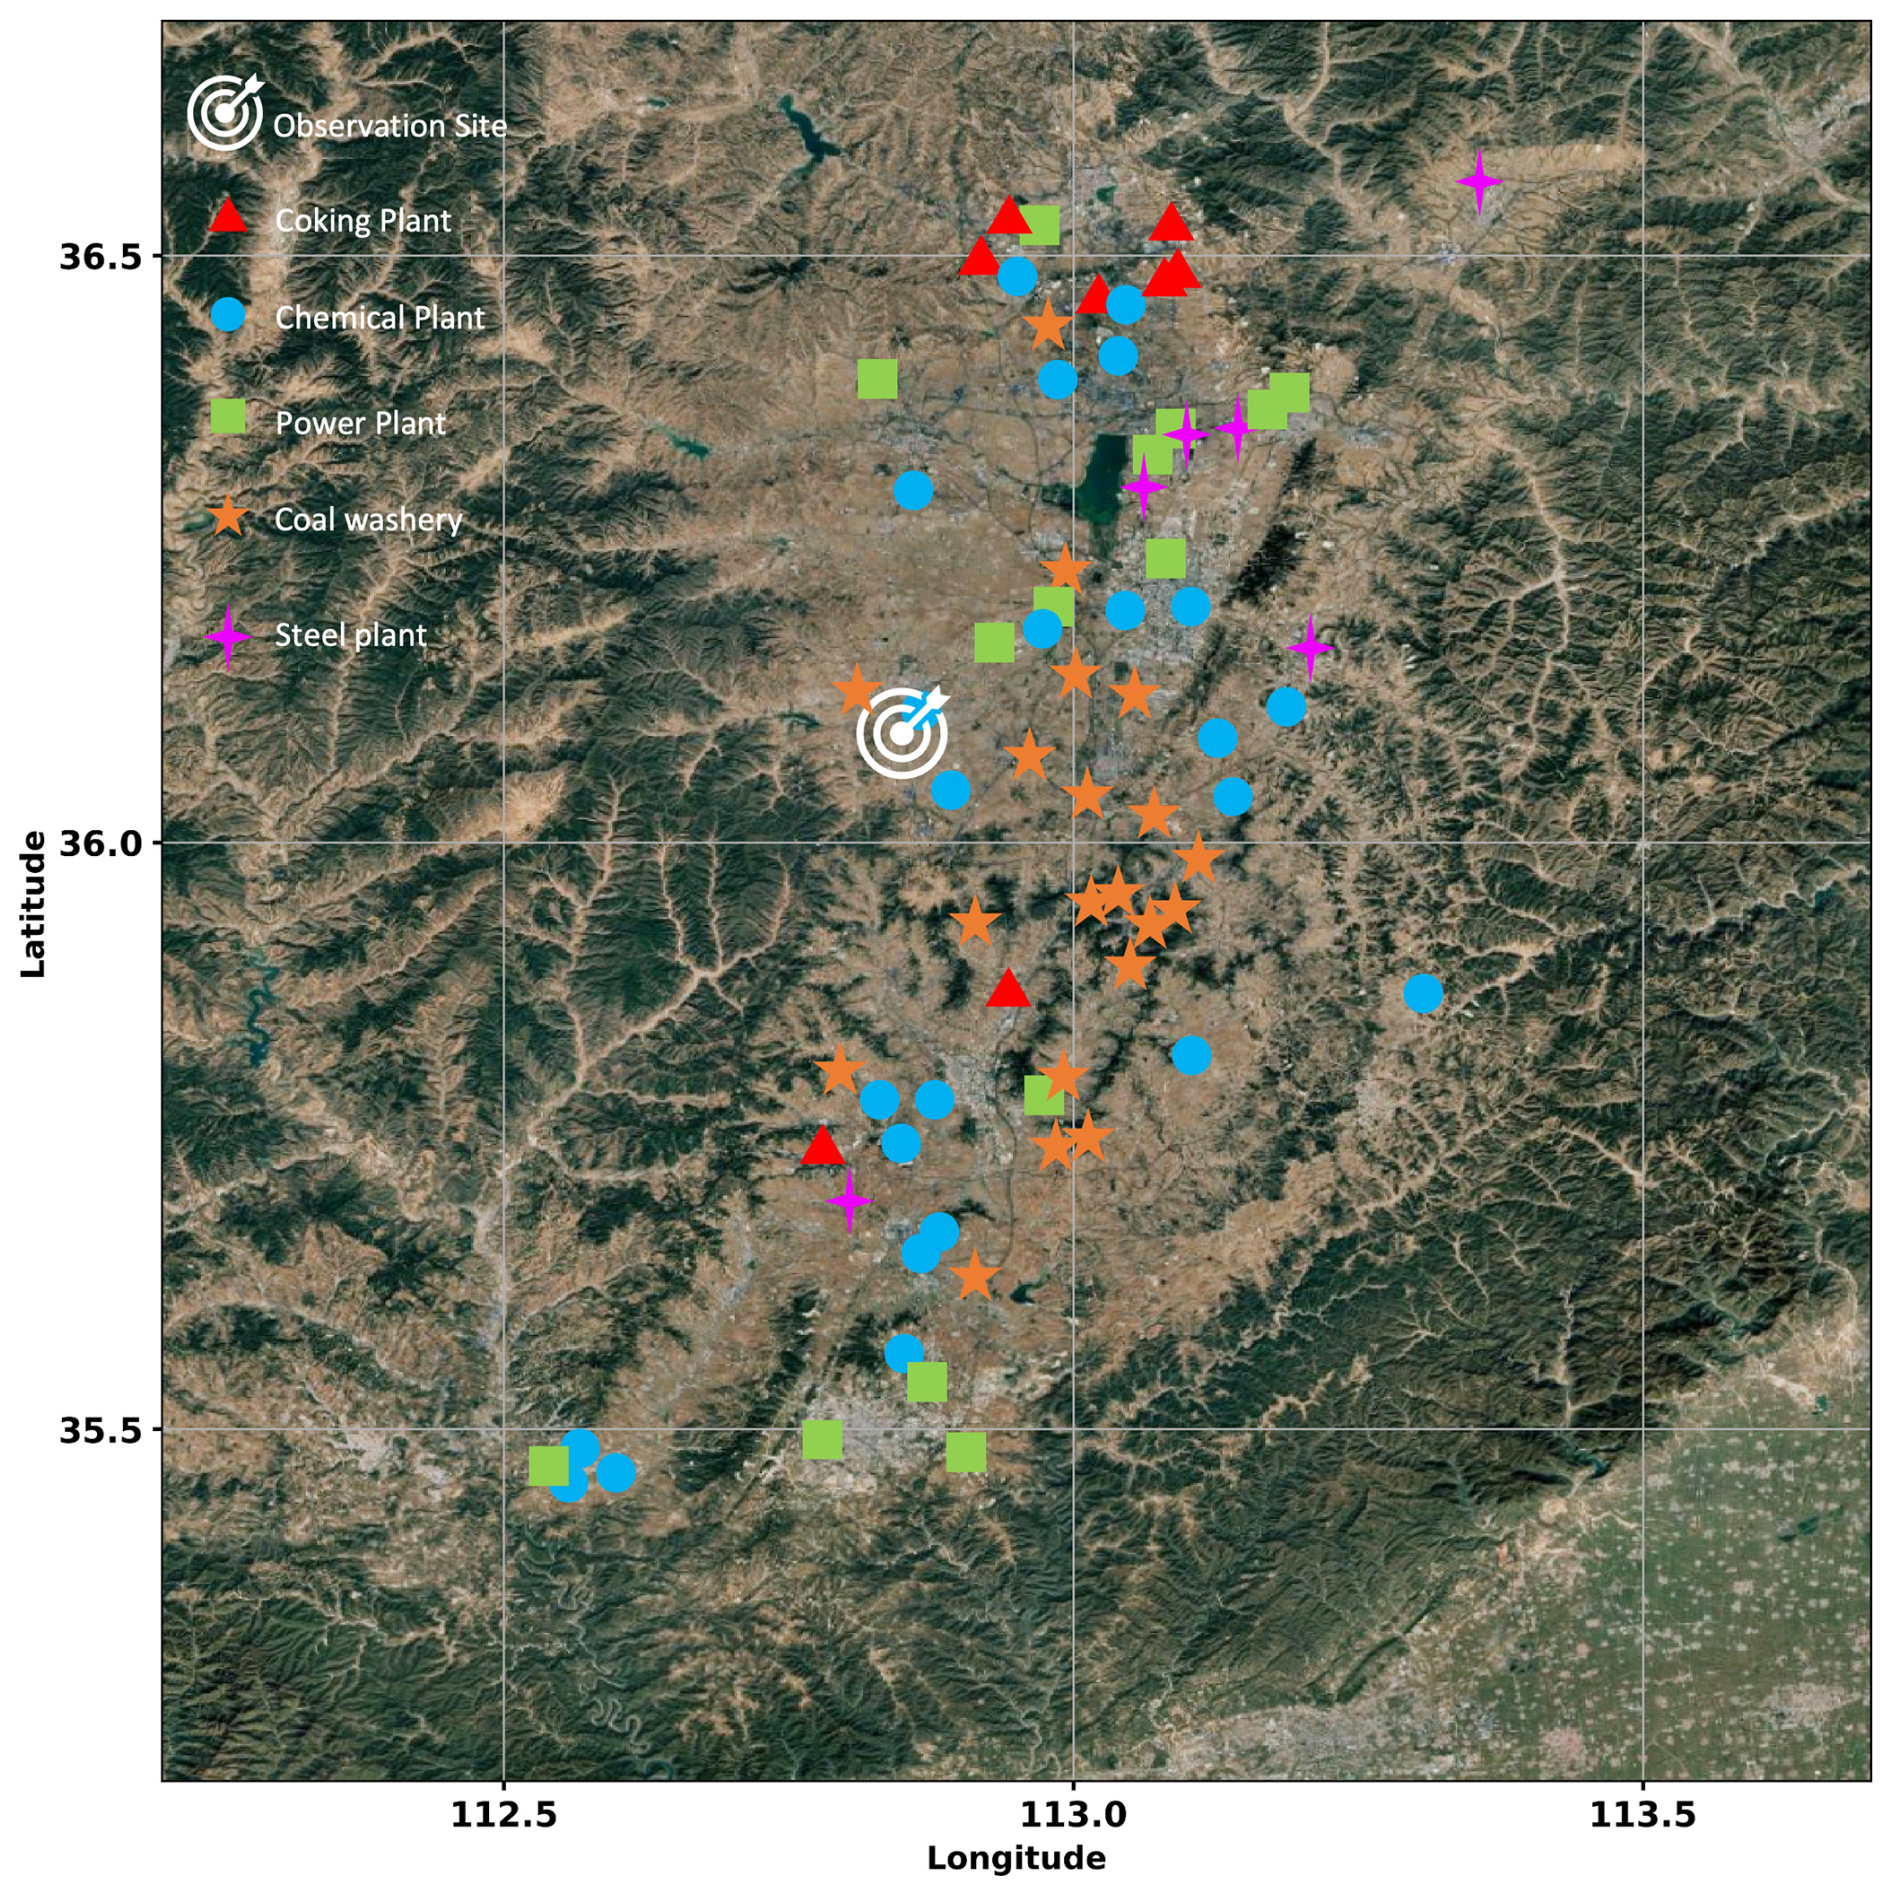
Figure 1The map of the geographical region of industrial covered in this study (base map data © Google Earth, Maxar Technologies).
2.1 Ground-based observations
This study employs a suite of ground-based instruments to quantify the mass concentration, size distribution, and optical properties of aerosols (Fig. S1 in the Supplement). These synchronized, multi-parameter observations form the basis for characterizing black carbon (BC) and AA properties across both physical and optical domains.
A multiwavelength Aethalometer (AE-31) was utilized to compute BC mass information based on in-situ environmental conditions, where it has broadband absorption but with some non-linear wavelength-dependence in absorption across the spectrum from the ultraviolet (UV) to the near-infrared (Yang et al., 2009; Bond and Bergstrom, 2006), specifically observed at 370, 470, 520, 590, 660, 880, and 950 nm. The instrument operates using optical attenuation and time-differential techniques, providing 5 min resolution data in ng m−3. In conjunction with the Aethalometer, the study also incorporates the GRIMM-180, which continuously measures particle size distribution using a light scattering technique (Liu et al., 2018). This instrument provides size information (# L−1) across 32 size bins, ranging from 0.25 to 32 µm in diameter. For this work, we focus on the number concentration measurements in the fine mode (Dubovik et al., 2000) over 14 size bins from 0.25 to 2.0 µm in diameter, while maintaining a temporal resolution of 5 min. Additionally, a portable solar photometer (Microtops II) is employed to measure column AOD and precipitable water vapor from direct-sun measurements based on the Beer–Lambert law (Ichoku et al., 2002). This approach is a single-scattering approximation that neglects multiple scattering and surface-atmosphere coupling, and it is most reliable under conditions which have a single and thin aerosol layer, which is mostly true in heavily industrial areas where there is a very large emissions source near the surface, compared with what may advect in at higher elevation. This device operates at five specific wavebands (440, 500, 675, 870, and 936 nm) and is used to capture the temporal variation of AOD at different wavelengths. By integrating data from these three instruments, this study is able to utilize information of mass concentration, size distribution and aerosol optical properties in tandem.
To ensure data reliability, a strict quality control protocol was applied. First, all physically unrealistic values were removed. Second, data points were removed if they were two or more standard deviations away from the set of five data points including the value in question as well as the two preceding and following measurements, ensuring temporal continuity and consistency in the dataset (Wang et al., 2023b). Following filtering, a total of 1410 quality-controlled, time-synchronized measurements were obtained for BC mass concentration at all five wavelengths as well as particle size distribution diameter range from 0.25–2.0 µm. These datasets were then merged with direct sun observations of AOD, so as to provide a consistent set of measurements to robustly analyze and assess aerosol optical, mixing, size, and number properties in tandem, and their impacts on aerosol loading and radiative forcing, in a complex environment. Although the observation period is limited in duration, the dataset captures substantial variability in BC mass concentration and aerosol loading, encompassing both relatively low- and high-pollution conditions that are characteristic of coal-dependent industrial regions.
2.2 Parameterization of AA mixing state
To represent the mixing state of AA in the industrial region, this work adopted two contrasting assumptions for allocate observed BC mass, intended to bracket the physically plausible realistic range of atmospheric mixing states (Kim et al., 2008). Under the uniform assumption, the same BC mass is assigned to each particle size bin, representing an initial mixing state for AA shortly after emission into an air parcel containing contributions from diverse sources which has not yet had time to undergo in-situ atmospheric processing. This is used as a major assumption by most of the current generation of chemical transport models, including but not limited to (Croft et al., 2024; Gaydos et al., 2007), as well as most optical aerosol models currently used by the satellite community (Wang and Martin, 2007) as well as the OPAC modeling system (Fillmore et al., 2022). In contrast, the non-uniform assumption means the mass ratio of BC-to-particulate mass across all size bins is the same. This assumption implies that aerosols of all 14 size bins are composed of the same components, and are in a current state of complete internal mixing, which is relevant for aerosols which have been in the atmosphere long enough to undergo condensation- and coagulation-based growth and atmospheric in-situ chemical, physical, and water-based processing. This is the assumption currently adopted by most sun-photometer networks AERONET (Kayetha et al., 2022; Schuster et al., 2005) and SONET (Wang et al., 2013) as well as a small number of research-based chemical transport models (Kim et al., 2008; Wang et al., 2023a). These two assumptions are not meant to represent the true atmospheric mixing state, but instead define a reasonable range of boundaries by which to constrain the resulting optical properties and subsequent radiative forcing variation (Fig. S2).
Due to the fact that the fineness of the sizes observed is at a higher resolution compared with existing regional and global transport and climate models (Vignati et al., 2004; Randles et al., 2013; Kokkola et al., 2018), we introduce a commonly used set of assumptions to reduce the data of the size into a set of analytical functions that still allow for comprehensive analysis which is comparable with existing assumptions and standards, following (Cohen et al., 2011; Wang et al., 2023b). In specific, this study employed three different particle size distributions: (1) ISSIZE, which used the observed in-situ size distribution data; and the two analytical approaches, which were fitted based on the observed size distributions (2) Log1, which represents the best-fitting single-peak lognormal (Seinfeld et al., 2003); and (3) Log123, which represents the best-fitting set of three single-peaked lognormal distributions summed in tandem. By integrating these two mixing assumptions and three size distribution schemes, this study establishes a flexible and observation-constrained framework to evaluate how assumptions about particle morphology influence derived aerosol optical properties including the extinction, scatter, asymmetry, and single scatter albedo (SSA) per particle as well as resulting net top of atmosphere (TOA) radiative forcing.
2.3 MIE model
MIE scattering theory provides an exact solution for the interaction of a plane electromagnetic wave with a uniformly sized spherical particle in a homogeneous medium, enabling precise quantification of light absorption and scattering (Wang et al., 2021a). The MIE model has been extensively validated for key atmospheric aerosols, such as sulphate and black carbon, which often assume spherical or nearly spherical shapes after equilibrating with the in-situ environment (Liu et al., 2020). In addition, when very fresh such particles are observed to be non-spherical, they can still be estimated by a spherical MIE model, just yielding a slightly different set of core and shell size parameters (Mishchenko et al., 1997). Its applicability for particles whose sizes are comparable to the wavelength of light ensures the reliability of computing parameters like SSA, as observed in previous remote sensing research (Dubovik and King, 2000).
In this study, the MIE model was employed based on the core-shell assumption, where strong absorbing substances such as BC and coal dust (this area only includes these two absorbing sources in any significant amount) due to their higher density, were assumed to be the core, and non-absorbing substances such as sulphate, nitrate, ammonium, and aqueous aerosol water were assumed to be the shell. This configuration reflects the dominant emission composition from surrounding coal-producing and coal-consuming industries, including SO2, NOx, water vapor, and methane (Li et al., 2023; Hu et al., 2024).
The size information of core and shell was obtained by calculating the proportion of specific BC mass observed at each wavelength i (470, 520, 660, 880, and 950 nm) in each size bin. The observations of AOD at each wavelength j (440, 500, 675, 870, and 936 nm) were used as inputs in the model. The refractive indices of the core () and the shell () were applied in the MIE model to compute key optical parameters: extinction (EXTij), absorption (ABSij), scattering (SCAij), and asymmetry parameter (ASYij) on a per particle basis, considering the size, observed wavelength of the BC(i) and observed wavelength of the AOD(j), providing a full representation of the range of possible values of AA in the area observed.
To ensure consistency, we only analyze combinations of i and j in which the wavelength of the AOD and BC mass concentrations are closest, ensuring consistency in the calculations. For example, the AOD observed at j=440 nm is paired with BC mass observed at i=470 nm, hereafter labeled as AOD440BC470 or λ=470. This combination of values allows consistency across all of the different observational platforms.
2.4 Calculation of aerosol column number loading
The particle column loading (# m−2) is computed following Eqs. (1) and (2) following (Cohen and Wang, 2014):
where εk,λ is the extinction coefficient (µm−2) per particle in each size bin k, based on the value computed at the matched waveband λ (as defined in Sect. 2.3) nk is the concentration (# L−1) of particles in each size bin k, εw is the weighted extinction coefficient per unit volume, AOD is the observed aerosol extinction per band j (as defined in Sect. 2.3), and Nλ is the column number loading of particles per matched band λ.
2.5 Santa Barbara DISORT Atmosphere Radiative Transfer (SBDART)
SBDART is employed to simulate atmospheric solar irradiance under two scenarios: with and without the presence of aerosols (Ricchiazzi et al., 1998; Tiwari et al., 2023). Given that the majority of incoming solar radiation falls within the spectral range of 0.25 to 4.0 µm, this work follows the general community and focuses its analysis over this specific region of the electromagnetic spectrum (Ma et al., 2021).
To perform irradiance calculations, SBDART requires several key input parameters. These include column AOD (as observed), per particle SSA and ASY (as derived from the MIE model), and additional data of precipitable water, surface spectral albedo, and column ozone data, all of which are sourced from ERA-5 reanalysis (Hersbach et al., 2020). Meteorological data, such as temperature, pressure, and ozone profiles at various pressure levels required to setup the model atmosphere is also sourced and prepared from the ERA-5 reanalysis.
The calculations for aerosol direct radiative forcing (DRF) using SBDART model are well-established in the literature (Ricchiazzi et al., 1998). Specifically, the upward and downward irradiances are determined at both the top of the atmosphere and the surface. From these values, the differences between the irradiances with and without aerosol effects on a diurnal basis are retained as TOA and BOA (at the surface). Finally, the net atmospheric forcing is derived as the difference between TOA and BOA. Detailed formulations of these calculations can be found in previous studies (Tiwari et al., 2023; Wang et al., 2020b).
The net TOA is simulated separately for the two mixing assumptions, based on the various amounts and properties of BC estimated across the different spectral observations. By analyzing the radiative forcing across all of these scenarios, the impacts of how different aerosol mixing and different optical observational states impact the overall energy balance of the atmosphere is explored.
2.6 Statistics and fitting
The efficacy of the for rapid radiative forcing correction least squares modeling fits are computed based on a combination of three statistics: R2 (p<0.05), which represents the point-by-point reproducibility; RMSE (W m−2), which is a measure of the radiative forcing uncertainty between the observations and the model; and the range of values reproduced (ratio of the range of calculated average observed radiative forcing to the range of each individual size bin observed radiative forcing), which indicates the precision of the total range of the values reproduced. Statistical comparisons of differences between observed datasets are quantified using a two-tailed student-t test with two different statistical levels of certainty (p<0.05) and (p<0.10). Table S1 in the Supplement provides a summary of the statistical metrics used in this study and their physical interpretations.
3.1 Analysis of AA physical properties
More than 95 % of size observations contain a three-peaked size distribution, located around 0.25–0.28, 0.58–0.65, and 0.7–0.8 µm respectively, as shown in Fig. 2. To analyze the variability in the three-peaked size distribution, we categorized the ratio between the first and second peaks using statistical percentiles. The maximum ratio represents extreme cases where the first peak dominates, whereas the 25th, 50th, and 75th percentiles capture the progressive shift in dominance between the first and second peaks. This approach allows for a more comprehensive representation of different tri-modal distribution patterns observed in the dataset. This approach also forms a basis by which it can clearly be observed that there are different contributing factors to the BC emissions in the area including but not limited to high temperature combustion for power and steel factories, low temperature combustion for chemical factories and local heating systems, and coal dust due to the thousands of coal trucks daily plying the roads (Li et el., 2023; Qin et al., 2023).
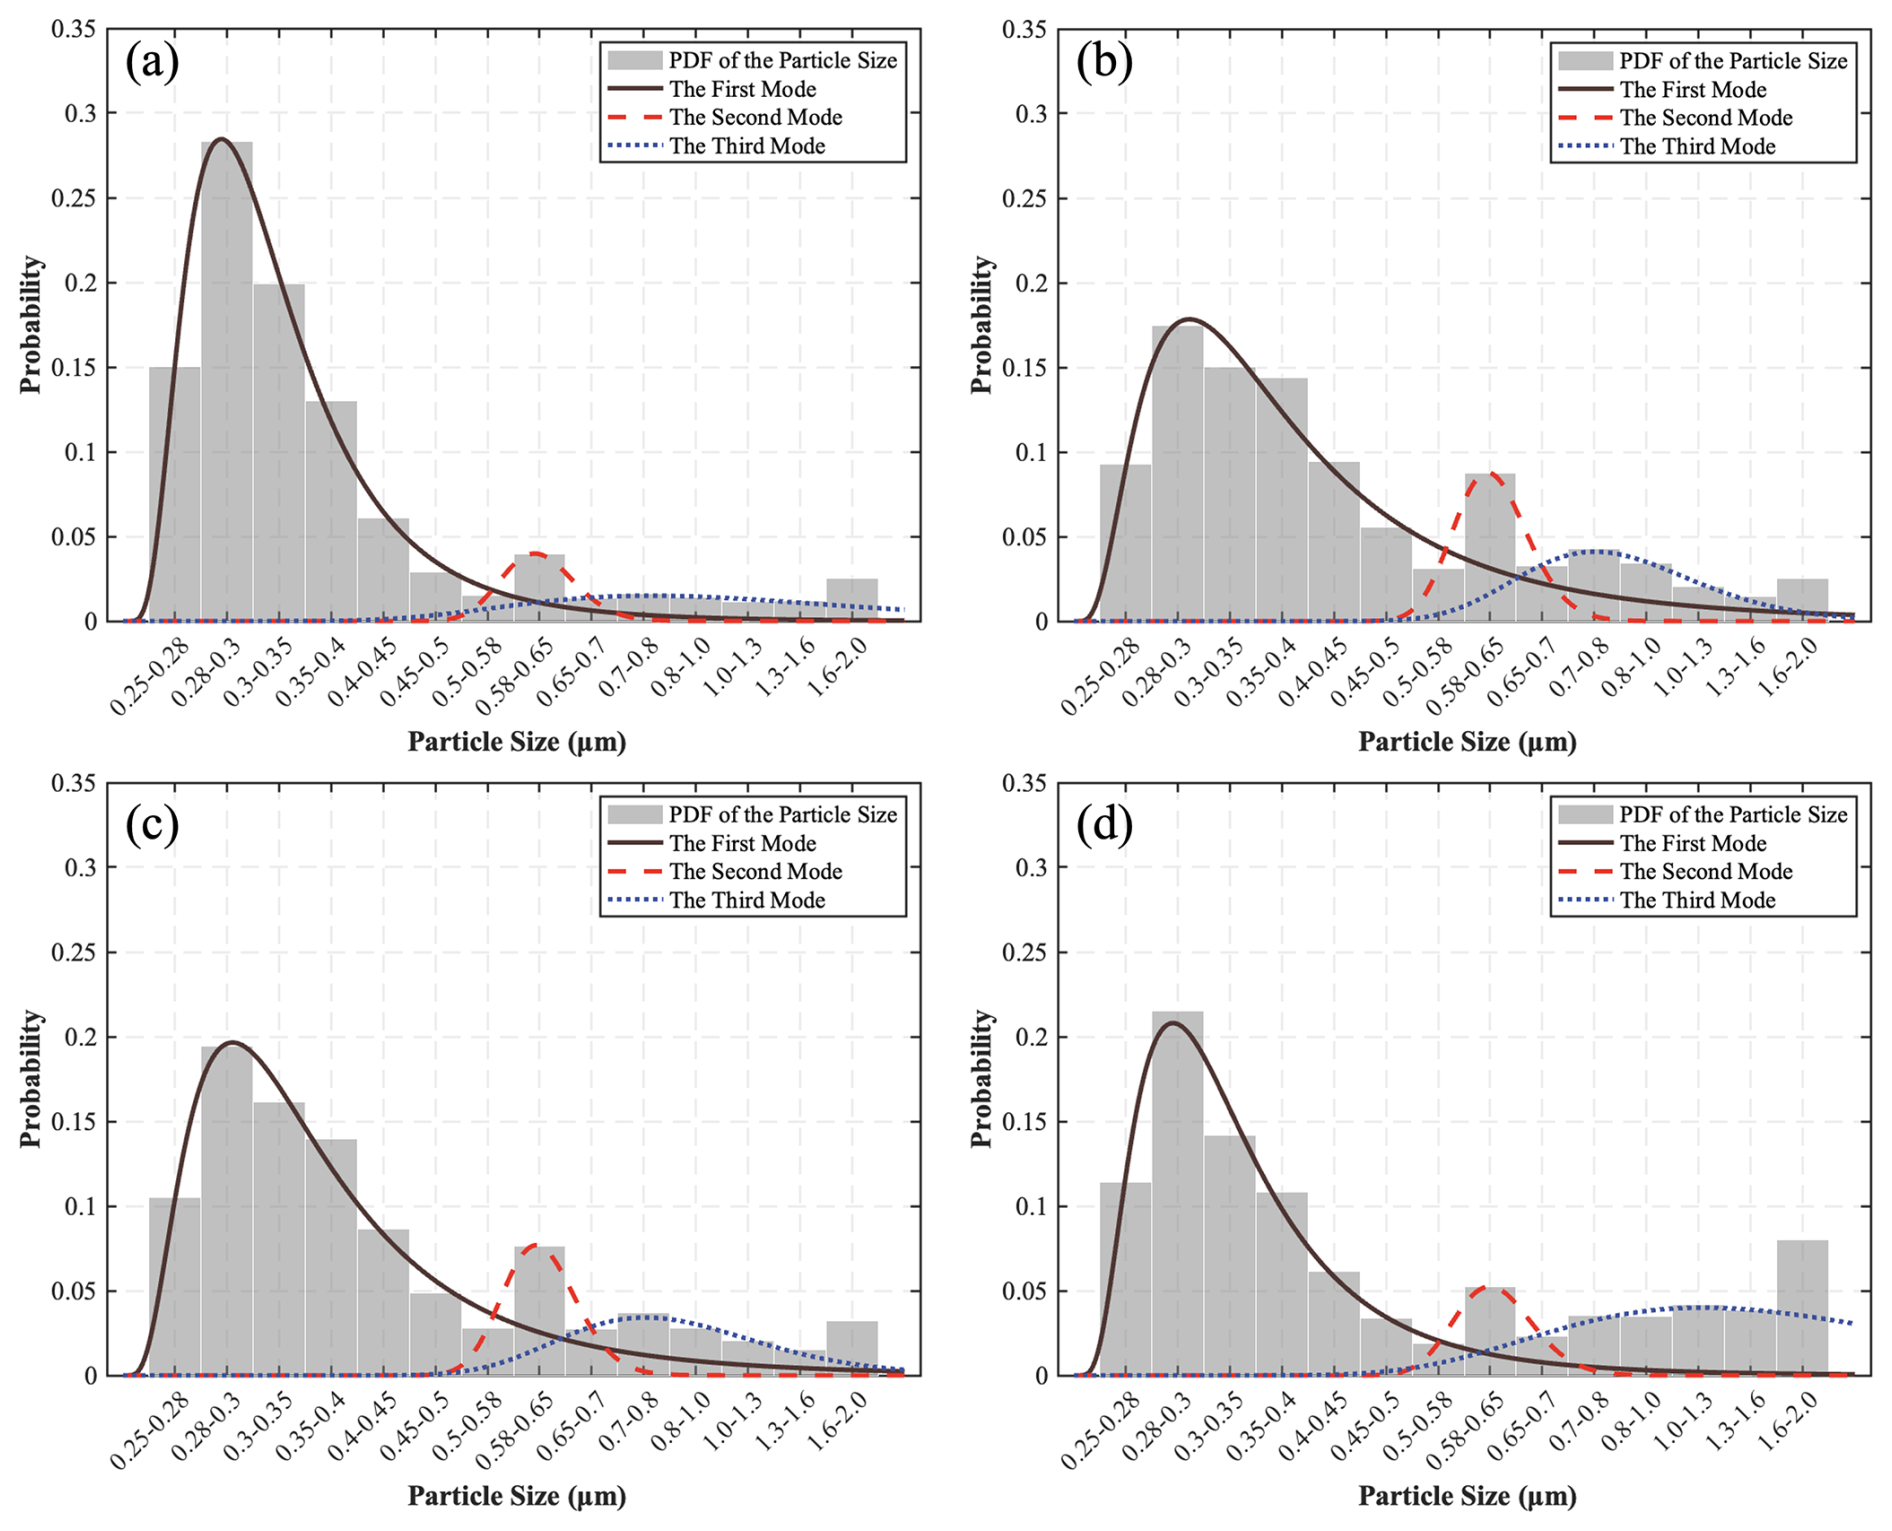
Figure 2Variability in the size distribution across all 14 bins at different times, categorized based on the ratio between the first and second peaks in the tri-modal distribution. (a) Maximum ratio between the first and second peak; (b) 25th percentile ratio between the first and second peak; (c) 50th percentile ratio between the first and second peak; (d) 75th percentile ratio between the first and second peak.
To provide consistency with past methods, a set of three lognormal fits of the distribution are made. The first mode (FM) captures details from 0.25 to 0.5 µm, the second mode (SM) captures details from 0.5 to 0.7 µm, whereas the third mode (TM) captures details from 0.7 to 1.6 µm. There are multiple sources of emissions associated with coal mining, production, transportation, and utilization processes, which can plausibly contribute to different portions of the observed size distribution (Fig. S3). Aerosols in FM are plausibly associated with high efficiency combustion process, such as power and steel production, aerosols in the SM are more likely due to lower efficiency combustion associated with boilers, chemicals, and coking, whereas aerosols in the TM are more likely due to coal production and dust. These associations are intended as qualitative interpretations based on particle size characteristics rather than definitive source attribution. As observed herein, a single sub-PM2.5 size distribution with simple source type is never adequate to capture the observed size distribution pattern.
3.2 AA optical properties
The MIE model is used to compute the observationally constrained per-particle SSA and its dependence on wavelength, size distribution, and mixing state (Fig. 3), illustrating these effects through vertical comparisons of different size distributions and horizontal comparisons of mixing state assumptions. While it may be possible to use a common absorbing angstrom exponent (AAE) to fit SSA over specific wavebands and subsets of size (Helin et al., 2021), the results break down across both the entire size range of interest, as well as across wavebands even in the same size range solution set, as described in Fig. S4. This finding lends further credence to the results outlined in this work, since the majority of present models and observations make the assumption that the AAE is a valid approximation across different wavebands (Wang et al., 2020a).
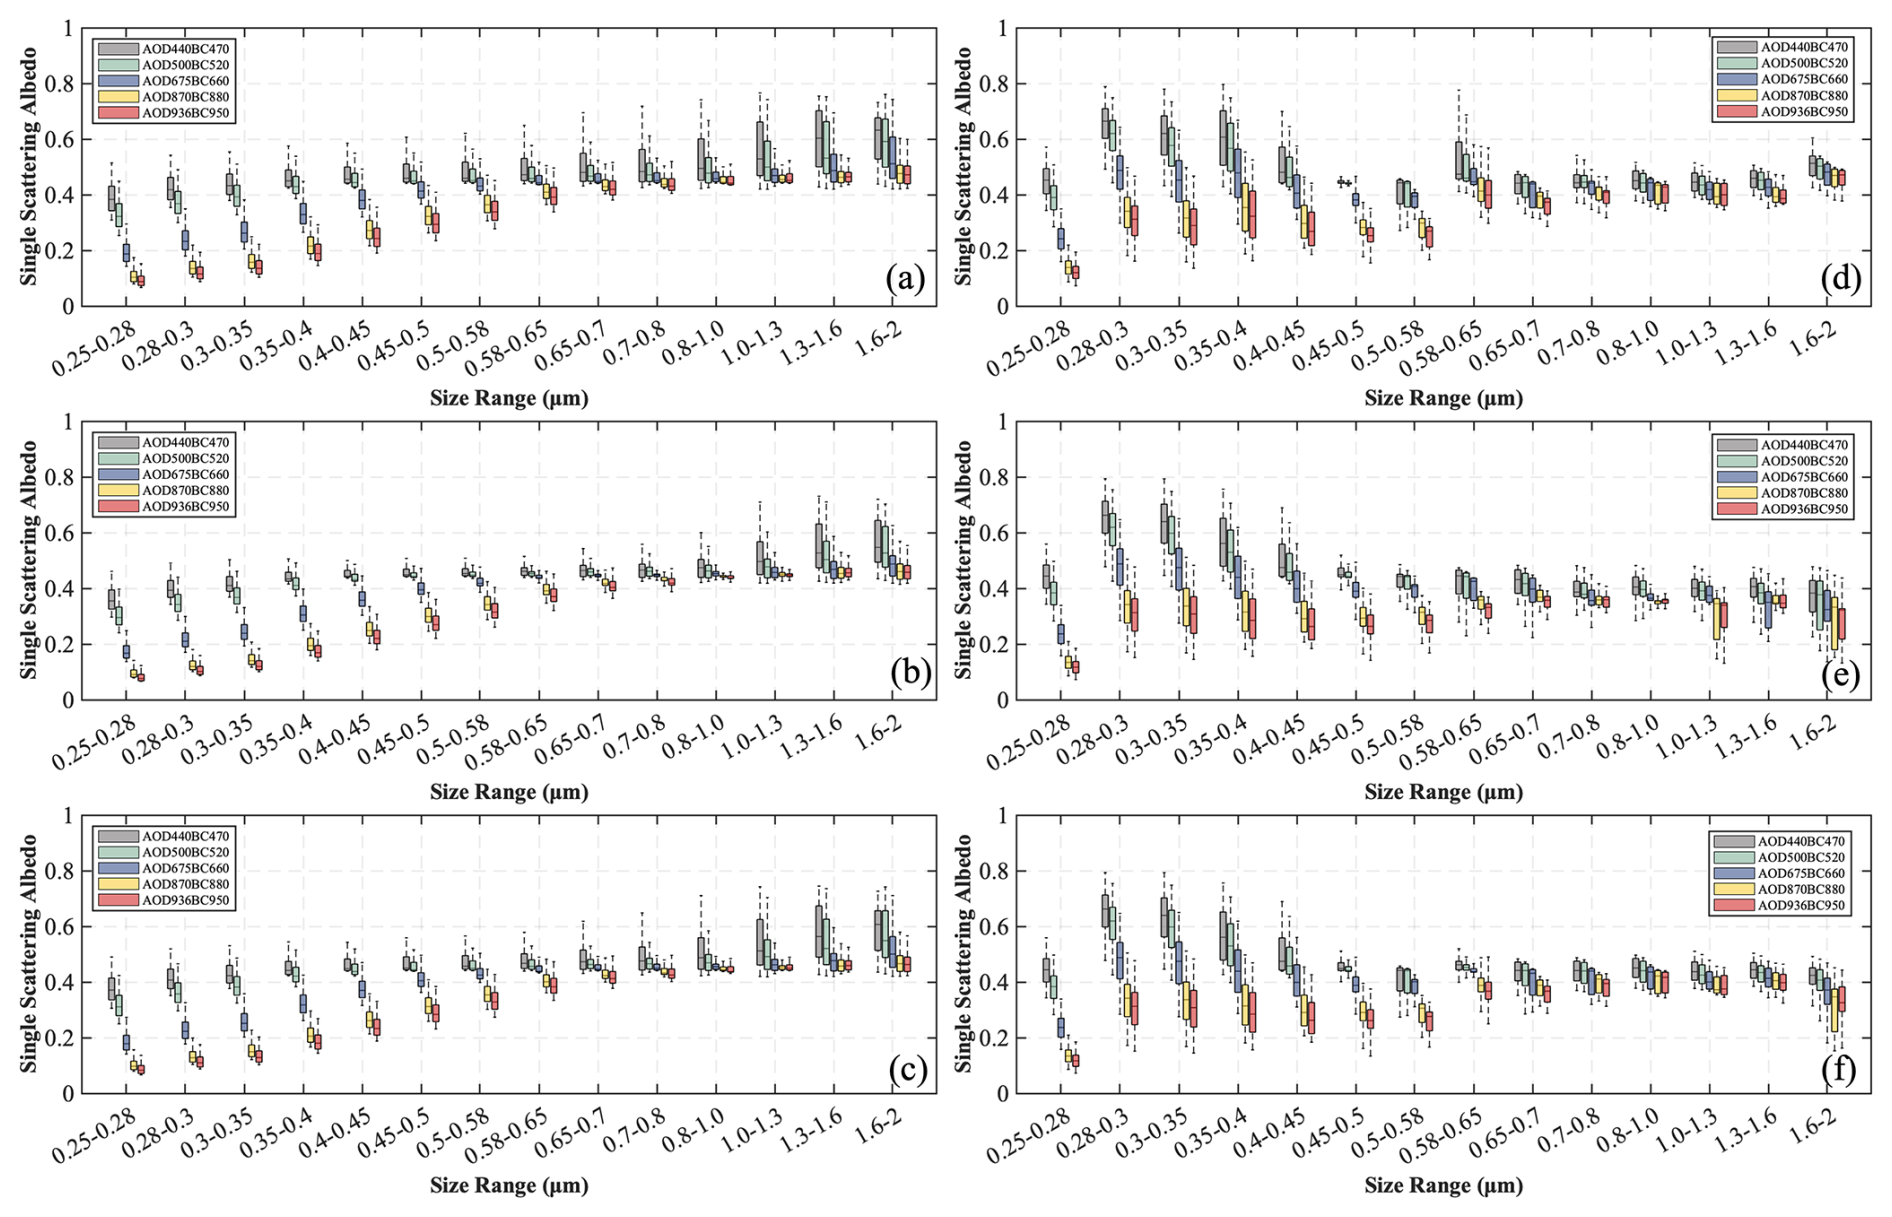
Figure 3Multi-wavelength SSA simulation results under different assumptions and particle size distributions. (a) Non-uniform assumption with ISSIZE distribution; (b) non-uniform assumption with Log1; (c) non-uniform assumption with Log123; (d) uniform assumption with ISSIZE distribution; (e) uniform assumption with Log1; (f) uniform assumption with Log123.
Longer wavelengths (880, 950 nm) show a stronger per-particle absorption than shorter wavelengths (470, 520 nm), with observations at 660 nm usually in the middle for smaller sized particles. Although the 1-standard-deviation ranges of SSA start to overlap for 0.65 µm and larger particles, the results still show a consistent per-particle negative SSA bias relative to the ISSIZE reference, with SSA values from the alternative mixing-state and size assumptions remaining systematically lower than ISSIZE at higher wavelengths.
In term of the size distribution, per-particle SSA is consistently and slightly lower for the Log123 approximation as compared to ISSIZE, and lower still for the Log1 approximation (Fig. 3). ISSIZE consistently shows a one-standard-deviation over the mean per-particle absorption which is the least across all assumptions, especially at 470 nm.
The difference of simulated multiband SSA under different assumptions across all sizes are shown in Fig. S5, demonstrating that all simplifying assumptions of particle size or single waveband yield stronger per-particle absorption compared to the observations. Furthermore, the results also indicate that this underestimation becomes more pronounced at larger particle sizes. Therefore, applying Log123 yields a less biased approximation of the actual size distribution's results compared with applying the Log1 assumption, especially when considering aerosol mass. Specifically, when considering the non-uniform assumption, at 440 nm, Log1 and Log123 have bias compared to ISSIZE in FM of 0.20 and 0.10, respectively, which increase in SM and TM to 0.29 and 0.14, respectively. This suggests that the underestimation of SSA is more significant for larger particle sizes (still within the fine mode). Therefore, it is essential to effectively model particles with diameters ranging from 0.65–1.30 µm to reduce the per-particle absorption bias, and supports that a trimodal simplifying assumption is more realistic than the single mode.
3.3 Column properties and TOA radiative forcing of AA
Seven days of AOD observations at 440, 500, 675, 870, and 936 nm are made using Microtops II. The differences in AA assumptions lead to non-negligible differences from 4.8×10¹² to 3.3×10¹³ m−2 and from 1.1×10⁸ to 9.2×10⁸ ng m−2 of in-situ number and mass column loading. These changes are larger than the range of simulation ability that current chemical transport models have derived as demonstrated by reanalysis products (Tiwari et al., 2025; Liu et al., 2024a, b) and model studies using common emissions inventories and standard aerosol processing and radiation packages (Gaydos et al., 2007; Croft et al., 2024). This range is consistent with one or more issues still to be addressed by the aerosol modeling community: insufficient knowledge or assumptions about in-situ aerosol size distribution, unclear mechanisms of in-situ processing including but not limited to aerosol mixing and long-range transport, and inaccurate estimation of emission magnitude and location.
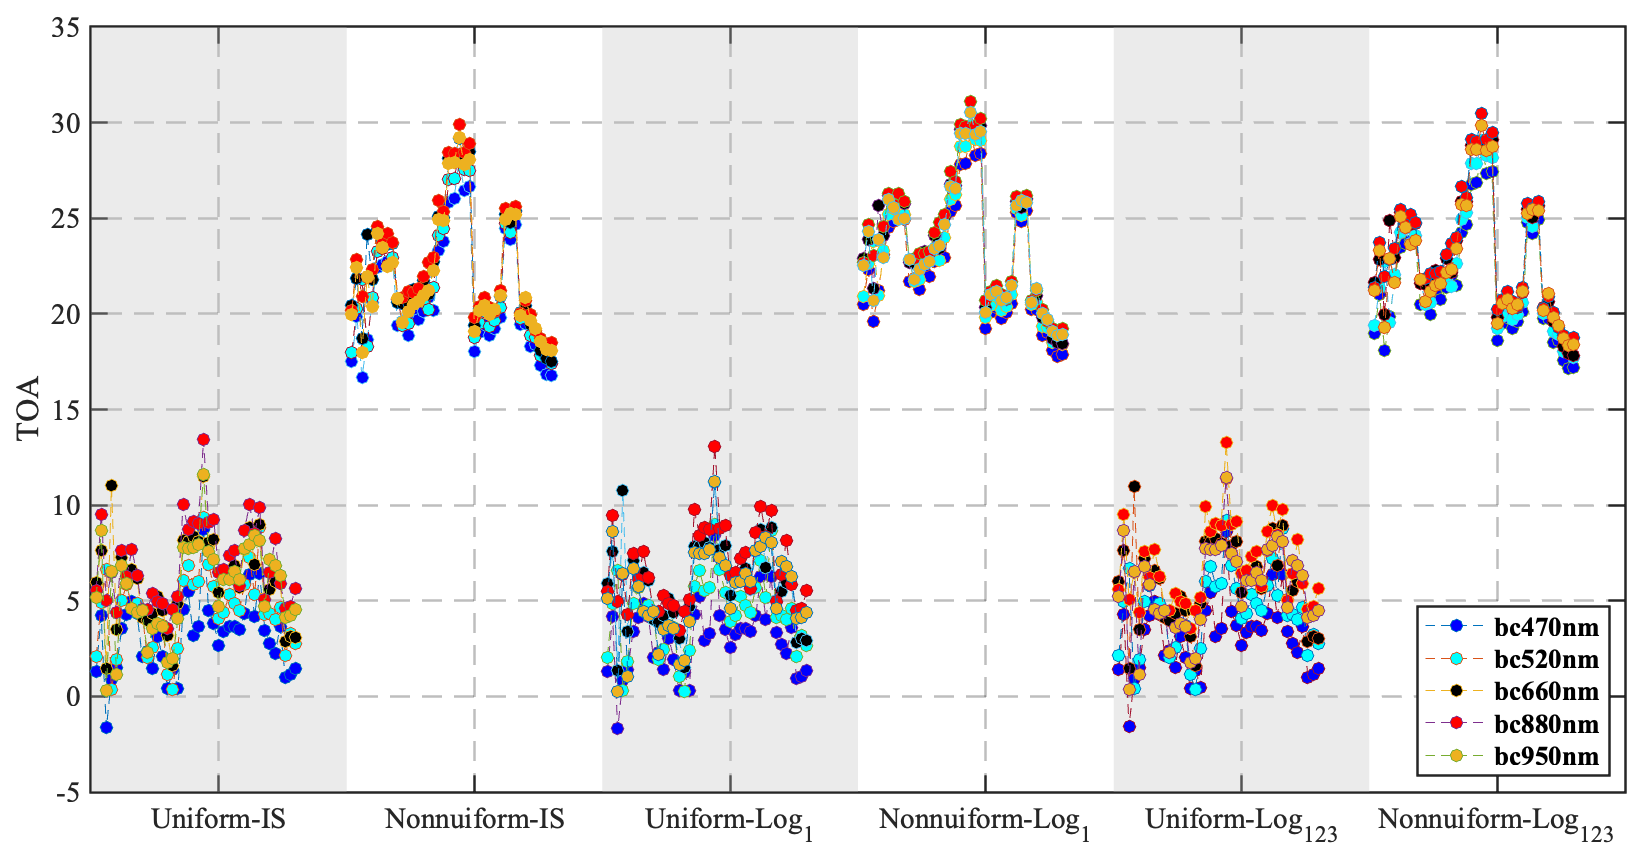
Figure 4Temporal variability of radiative forcing under different assumptions from Santa Barbara radiative transfer (SBDART). The first column is ISSIZE distribution with uniform assumption. The second column is INSIZE distribution with non-uniform assumption. The third column is Log1 distribution with uniform assumption. The fourth column is Log1 distribution with non-uniform assumption. The fifth column is Log123 distribution with uniform assumption. The sixth column is Log123 distribution with non-uniform assumption.
The radiative forcing of AA with different mixing states and assumption at TOA are calculated based on the weighted number concentration for each size bin, as shown in Fig. 4. The range of radiative forcing with internal mixing varies from 18.3–29.9 W m−2 (ISSIZE), 18.5–30.5 W m−2 (Log123), and 19.0–31.1 W m−2 (Log1) as compared to the respective ranges of externally mixed aerosol which range from 3.6–13.4 W m−2 (ISSIZE), 3.5–13.3 W m−2 (Log123), and 3.4–13.1 W m−2 (Log1) when computed at 880 nm. The systematically higher radiative forcing obtained under the internal mixing assumption arises from a coupled effect of how BC mass is distributed across particle sizes and how efficiently those particles absorb radiation. The lensing effect increases the absorption of light by aerosols on a per-particle basis, leading to stronger positive radiative forcing. Crucially, this absorption enhancement does not affect all particle sizes equally. In the Mie scattering regime relevant to these sizes, absorption efficiency remains sensitive to both particle size and composition. As a result, under the non-uniform case, assigning more BC mass to smaller particles within this range enhances column absorption efficiency, contributing to higher AAOD, lower SSA, and stronger positive TOA radiative forcing. Since internally mixed aerosols are more commonly observed in-situ where our observations are made, due to high pollution levels and low rainfall, allowing secondary production and aging in-situ to occur, all computations of radiative forcing hereafter only consider this mixing assumption.
The variations in radiative forcing across different wavelengths exhibit noticeably different values between λ=470 and λ=520, and statistically significant differences between λ=470 and λ=660 (p<0.05), between λ=470 and λ=880 (p<0.05) and between λ=470 and λ=950 (p<0.10). First, near-infrared wavelength derived products generally overestimate TOA forcing, especially for 880 nm, whereas the near-ultraviolet wavelength always yields the lowest value. However, there are still some interesting exceptions where TOA forcing shows a higher value at near-ultraviolet wavelengths, in particular, when the raw data has a higher number concentration of BC overall, and a higher number fraction at small sizes. This finding is consistent with the recent idea that uses UV spectroscopy from OMI and TROPOMI in connection with visible spectroscopy to improve aerosol in-situ loading (Liu et al., 2024a; Liu et al., 2024b).
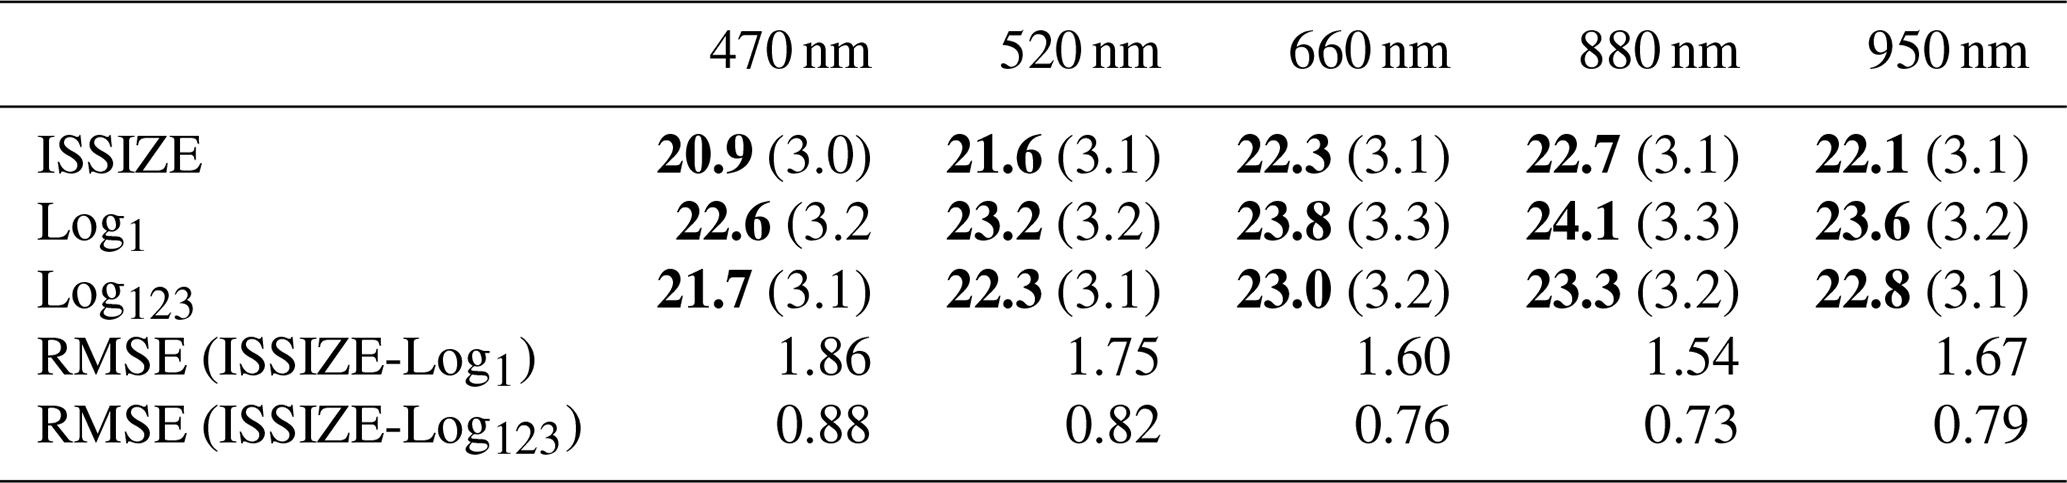
Table 1The statistic of radiative forcing through all five bands with non-uniform assumption, the mean values of RF are given in bold, the standard deviations are given in parentheses, the last two rows are RMSE between different size distribution.
The difference in TOA radiative forcing based on the particle size assumption across different wavelengths from 470 to 950 nm are larger in the case of ISSIZE-Log1 (−1.70, −1.58, −1.45, −1.38, and −1.49 W m−2) respectively, than in the case of ISSIZE-Log123 (−0.78, −0.73, −0.67, −0.64, and −0.69 W m−2) respectively (Fig. 5). These discrepancies are robust across different wavelengths and all times of day, indicating a consistent bias relative to the ISSIZE results, with radiative forcing derived from alternative size distributions remaining higher than the ISSIZE-based results within this wavelength range. Other results are shown in the supplementary materials (Fig. S6) for completeness.
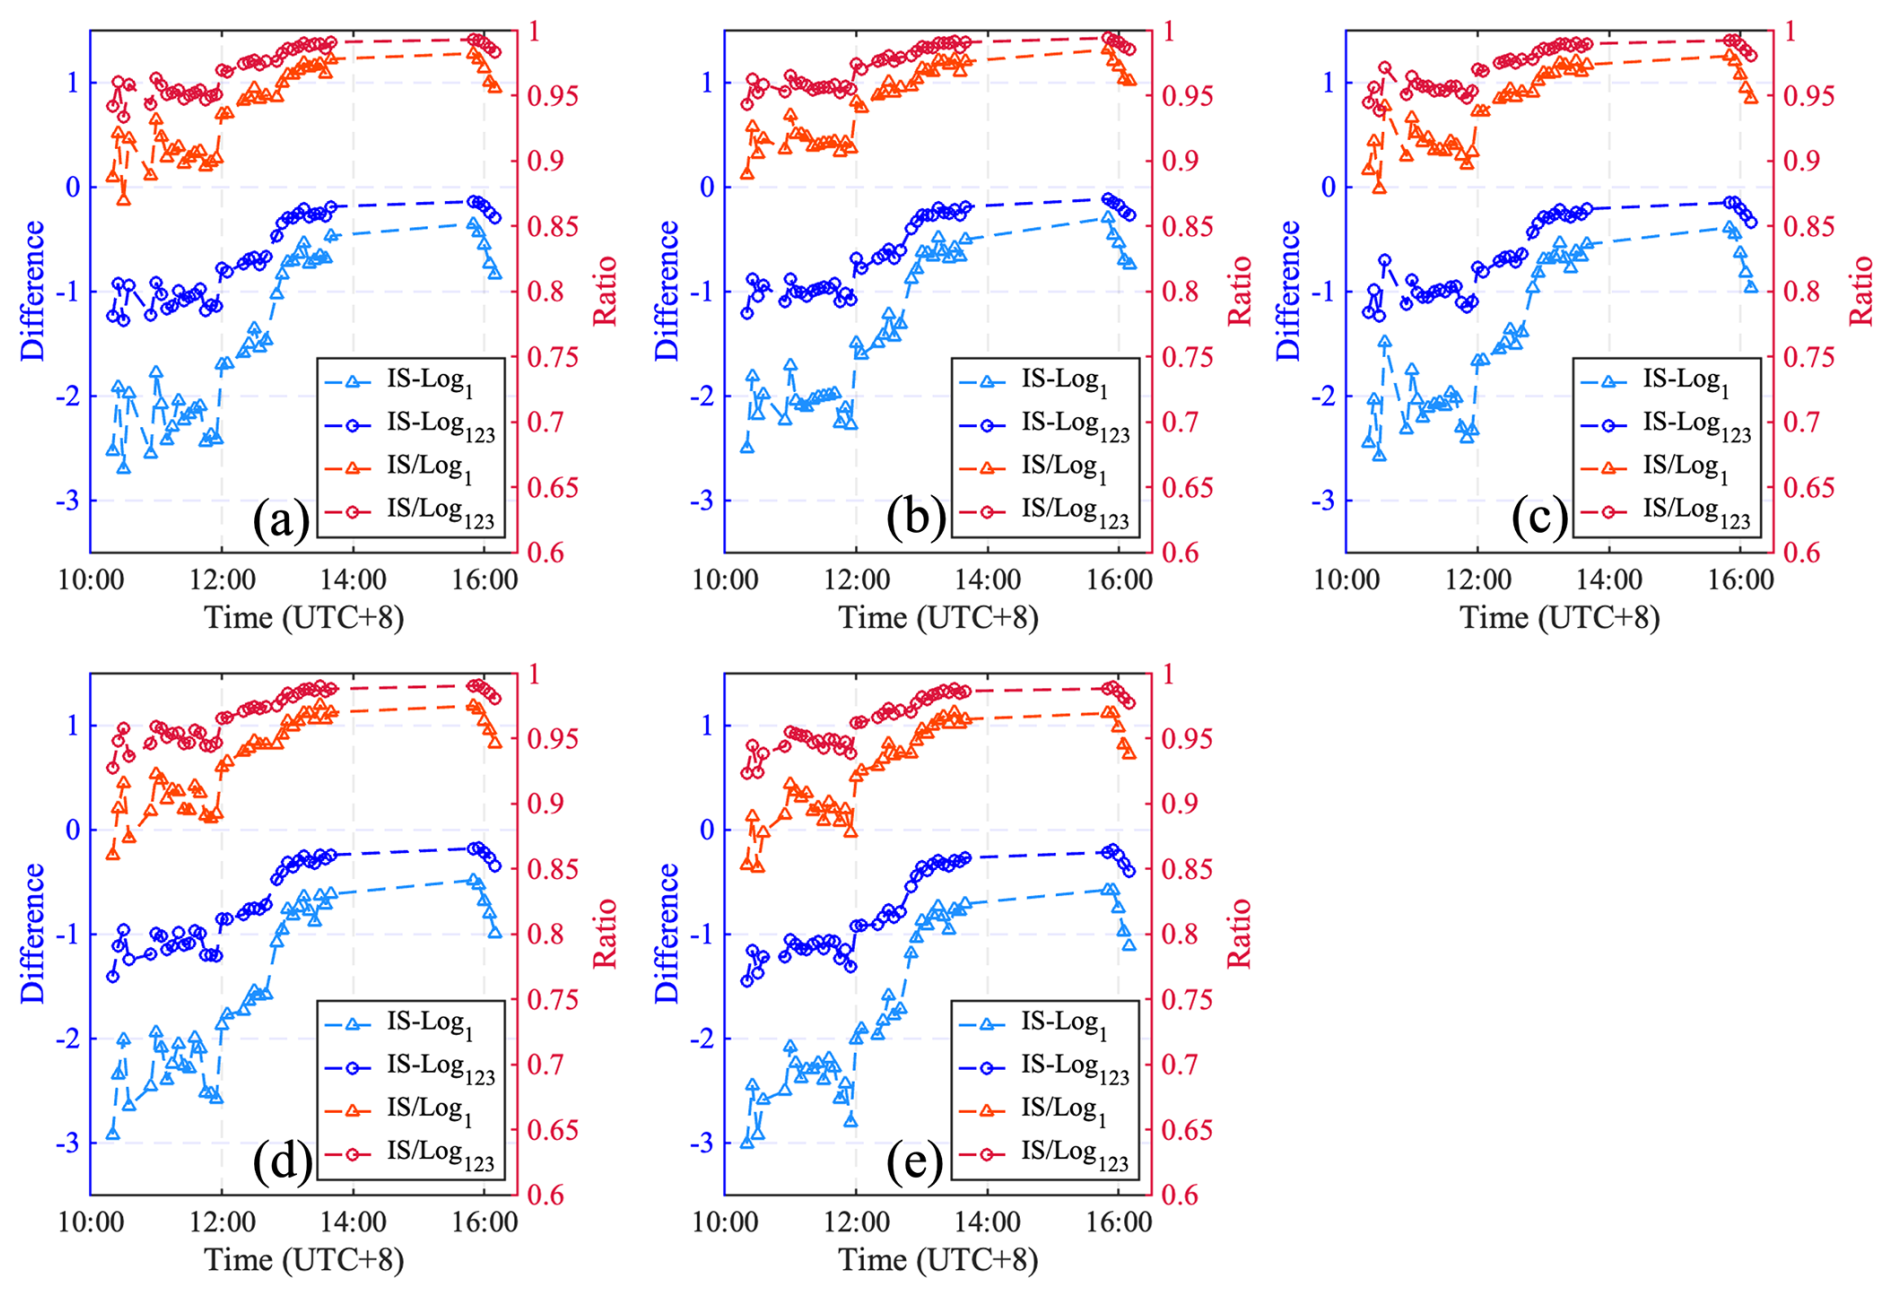
Figure 5Differences of multiband radiative forcing and ratio with non-uniform assumption between different size distributions. (a) 470 nm; (b) 520 nm; (c) 660 nm; (d) 880 nm; (e) 950 nm.
Although the difference is smaller in the case trimodal approximation (from −1.5 to −0.2 W m−2) than in the single modal assumption (from −3.0 to −0.3 W m−2), under non-uniform assumption. In this mixing case assumption, the trimodal distribution always aligns better with the true results, as evidenced by the RMSE results in Table 1 (Corresponding uniform-mixing results are provided in Table S3). It is important to note that there still is some bias included in all cases, however the improvement in AA radiative forcing uncertainty obtained by improving size representation can have a substantial impact on the net radiative forcing over the area of interest.
3.4 Rapid radiative forcing correction
To extend the impact of this local work to other coal mining and use sites around the world, a set of first-order linear and non-linear models of radiative forcing are built from our observations of SSA, AOD, and particle size. The point of this approach is to use the breadth of observed values across their entire range of observation to create a fast approximation grounded in the underling physics, optics, and sized measured herein, are observable in other parts of the world using similar or other platforms, and the non-linear processing of SBDART computed radiative forcing, in a way which is more realistic than the current approaches which rely upon fewer observed values (Mehrotra et al., 2024). While the observed values may not sufficiently explain all such mining and use areas, they are far more representative than no approximation, and may also find use in other more polluted or energy intensive areas in the rapidly developing Global South (Ramachandran et al., 2023). The resulting approximations can be used in global models with high efficiency, as existing models' use of external mixing can be adjusted following the approach herein to account for the improved representativeness of mixing and size on the radiative forcing (Table S4, Fig. S7).
Table 2The statistic of two first-order linear/non-linear models with non-uniform assumption through all five wavelengths, the coefficient of determination is given in bold, the RMSE, and weighted RMSE are given in parentheses (W m−2).
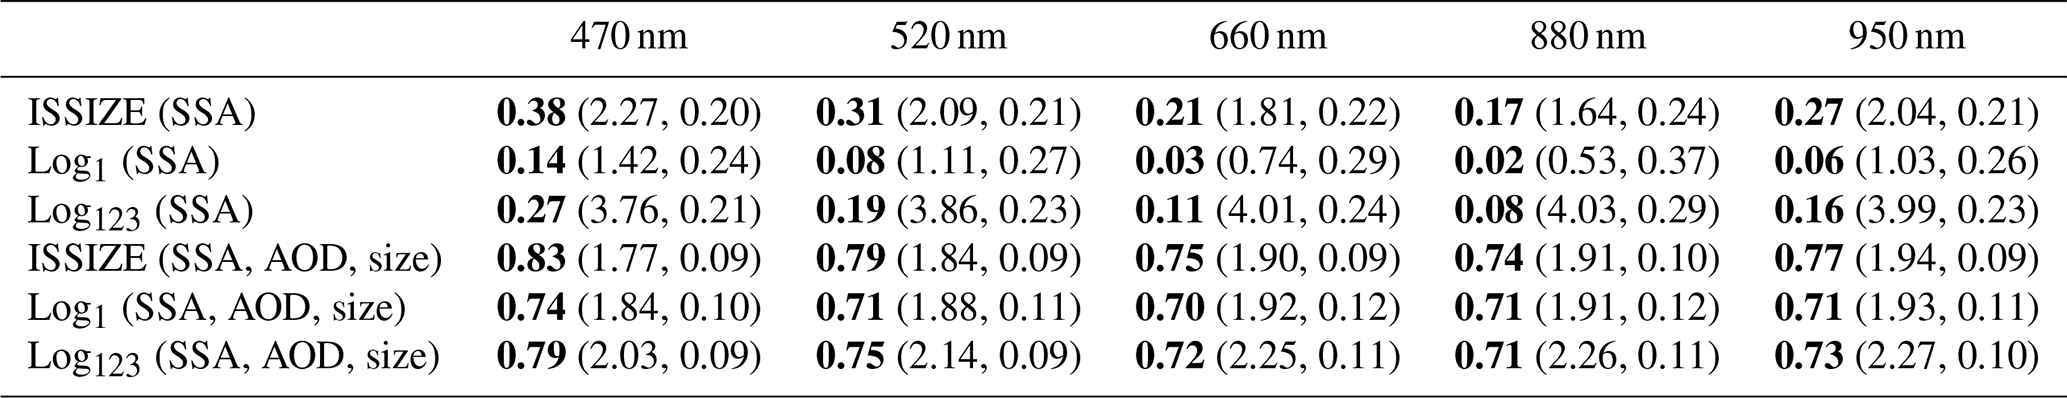
In all cases (Fig. 6), a more precise fit is obtained when considering the non-linear relationship driven by SSA, AOD, and particle size in tandem. In specific, we find that there is a reduction in the RMSE and simultaneous increase in the R2 at 470 nm, from 2.27 to 1.77 W m−2 and from 0.38 to 0.83 respectively (Table 2). Furthermore, using ISSIZE leads to a further improvement in the fitting, bringing the range of the RMSE of the rapid forcing correction from 1.77 to 1.94 W m−2 (Table 2), which is lower than that of Log1 (1.84–1.93 W m−2) and significantly better than Log123 (2.03–2.27 W m−2). Both cases are always within 10 % of the full model results in Fig. 3.
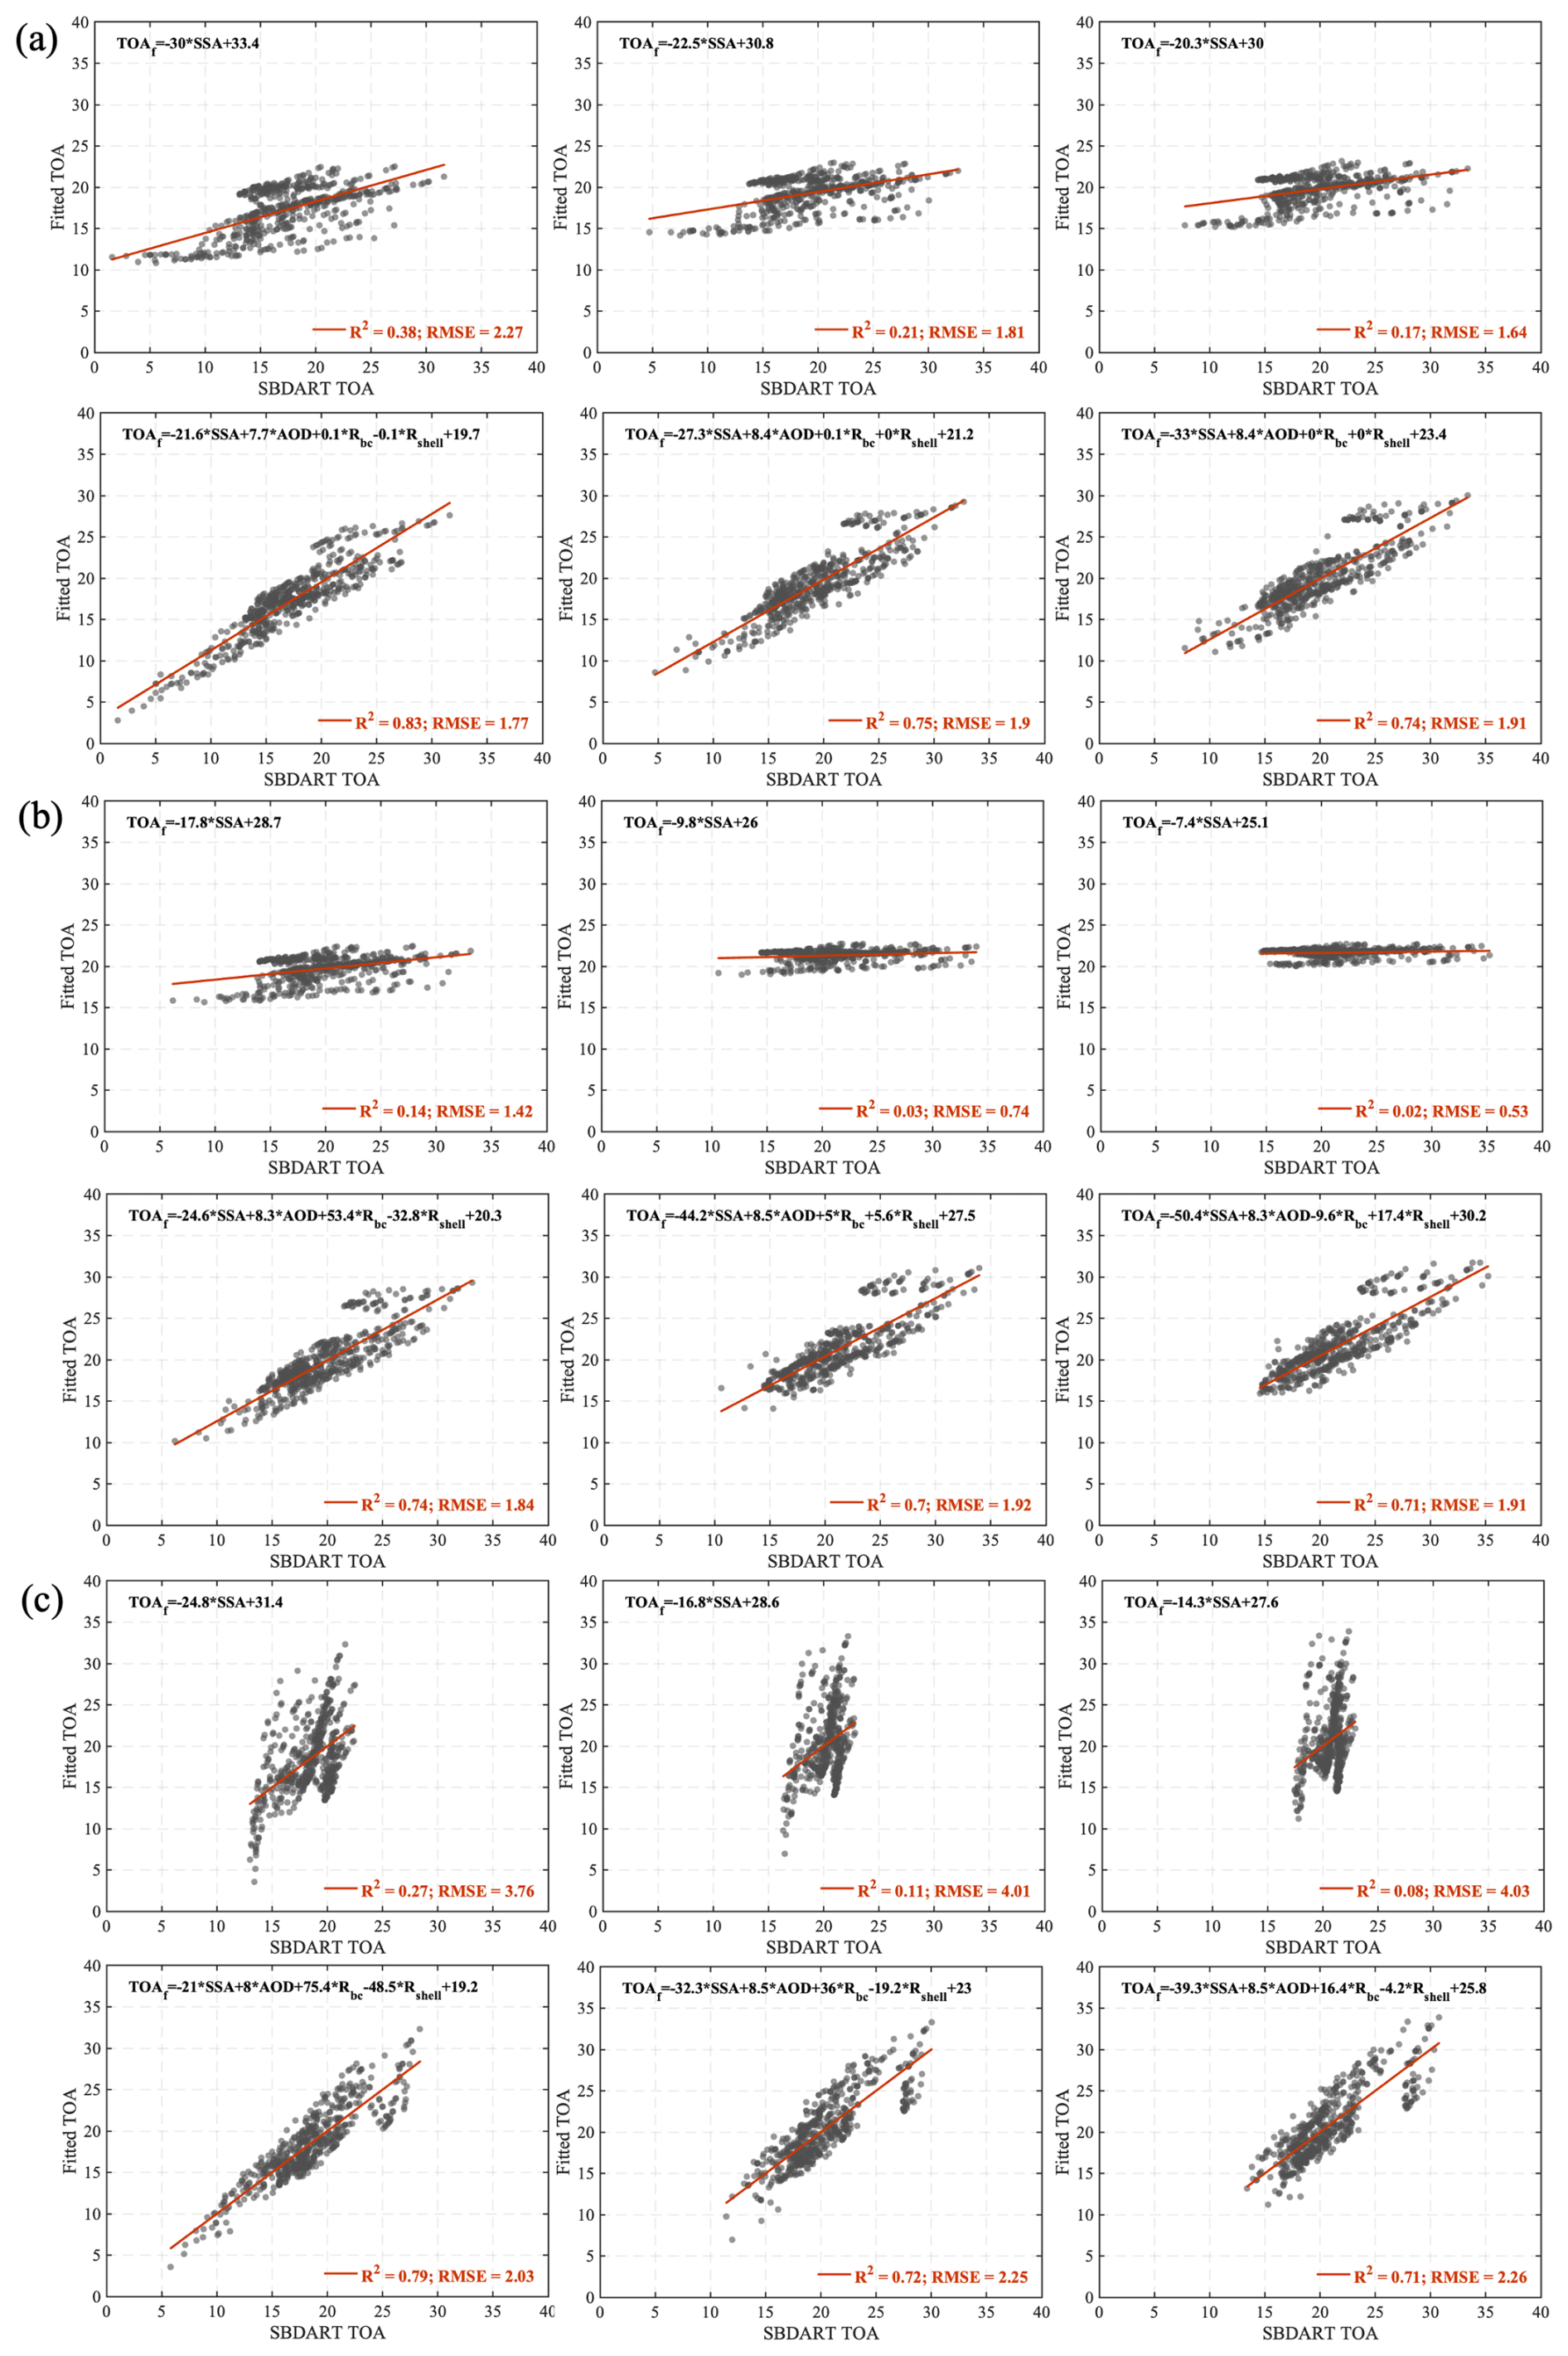
Figure 6Deriving adjusted TOA forcing using two different linear models with non-uniform assumption, the first row in each subfigure is linear model only including SSA, the second row is linear model including the effects of BC core, sulphate shell and AOD as additional variables, the first to the third column for each subfigure is 470, 660 and 880 nm. (a) ISSIZE measurements; (b) Log1 distribution; (c) Log123 distribution.
The results herein are a first attempt using a suite of surface observations in tandem to analyze the impacts that the multi-wavelength, multi-size, and multi-mixing assumptions have on physically realistic combinations of SSA, particle number, particle size, particle mixing, and ultimately radiative forcing in a typical industrial area having large amounts of emissions of BC and secondary aerosol precursors from multiple sources. By enforcing consistency of per-particle absorbance across multiple observed wavelengths, this framework explicitly captures the nonlinear interactions due to dynamic size and mixing state, thereby reducing biases in per-particle optical properties. A central finding is that commonly used simplification, including fixed mass absorption coefficient or single lognormal distribution systematically underestimation of per-particle SSA in particular for larger particles, which in turn dominate the impact on mass, therefore leading to too low of a BC number concentration to match observed AAOD. The results demonstrate that the total column number loading of AA is the major observational unit that the community must strive to match, in order to successfully compute the radiative effects of AA, in contradiction to studies which change per-particle SSA but do not simultaneously change BC emissions in tandem (Huang et al., 2024).
The analysis further indicates a pronounced wavelength dependence in inferred radiative forcing. Estimates based on near-infrared observations (e.g., 880 nm) tend to overestimate radiative forcing relative to visible wavelengths, while near the UV range can yield higher radiative forcing when aerosol number loading is dominated by smaller particles. This finding is consistent with new approaches in the literature which use UV observations from TROPOMI and OMI to improve the overall fit of aerosols (Tiwari et al., 2025; Liu et al., 2024a) to further support that using multiple waveband observations in tandem to disentangle non-linearities in AA's impact on radiative forcing. Reducing uncertainty in radiative forcing also requires improved representation of aerosol size distributions. Similarly, the radiative forcing low bias computed using a three-modal distribution is smaller than the radiative forcing low bias computed using a more standard log-normal distribution, indicating that increasing the resolution of AA size distribution is essential to reducing radiative forcing uncertainty. Differences caused by applying an intermediate complexity tri-modal size distribution leads to radiative forcing uncertainties in the range from 0.73 to 0.88 W m−2, which is similar to impact of methane on radiative forcing over the region (Lu et al., 2025a; Hu et al., 2024). For this reason, adapting a trimodal approximation will yield a result which is does not fully reproduce the full observational variability and is consistently too high, but nonetheless provides a quantitatively improved and more physically consistent representation than when a commonly used single lognormal size distribution is applied.
Finally, the regression-based rapid fitting approach developed here provides an efficient pathway to approximate radiative forcing sensitivities using a reduced set of observational constraints. Since there are many widely used and readily available multi-waveband AOD and SSA observations available from satellite, it is hoped that this can lead to a rapid way for existing models to better capture these effects, especially so in regions of the world where pollution is more significant. These findings highlight the need for future models to explicitly account for these factors to better capture aerosol behavior. While the observation period is not long enough to encompass different seasons of the year, although the observations times do capture different meteorological conditions including both inter-basin and intra-basin atmospheric transport. A second caveat is that the observations were made only made at one location within the basin, although the overall range of values observed are representative of industrial regions around the globe with SSA from 0.4–0.78 and AOD from 0.2–1.4 (at 936 nm) and from 0.8–2.2 (at 440 nm). Future work using additional observations to analyzing the components of the aerosol shell (i.e., nitrate, sulfate, ammonium, water, and secondary organic aerosols) in more detail would aid interpretation and knowledge of how the atmosphere behaves in similar regions, although the current size information of the shell could be used by existing modeling studies to constrain the total sum of these species. Given the substantial differences in constrained SSA and aerosol column number concentration, and resulting increase in radiative forcing, it is hoped that even given the limitations herein, that these results can form the basis of comparison for existing studies, as well as a set of future approaches that other studies can adopt.
The ERA-5 datasets are available at https://doi.org/10.24381/cds.bd0915c6 (Copernicus Climate Change Service, Climate Data Store, 2023). Codes is available at https://doi.org/10.6084/m9.figshare.26335159 (Guan and Cohen, 2026). All data are freely available for download at https://doi.org/10.6084/m9.figshare.26335159 (Guan and Cohen, 2026).
The supplement related to this article is available online at https://doi.org/10.5194/acp-26-3107-2026-supplement.
LYG was responsible for data curation, formal analysis, software, visualization, and writing the original draft. JBC was responsible for conceptualization, funding acquisition, investigation, methodology, scientific interpretation, writing the original draft, reviewing and editing. SW was responsible for data curation, investigation, and software. PT and ZWL were responsible for investigation, validation and writing the original draft. ZQL and KQ was responsible for reviewing and editing.
At least one of the (co-)authors is a member of the editorial board of Atmospheric Chemistry and Physics. The peer-review process was guided by an independent editor, and the authors also have no other competing interests to declare.
Publisher's note: Copernicus Publications remains neutral with regard to jurisdictional claims made in the text, published maps, institutional affiliations, or any other geographical representation in this paper. The authors bear the ultimate responsibility for providing appropriate place names. Views expressed in the text are those of the authors and do not necessarily reflect the views of the publisher.
This article is part of the special issue “Sun-photometric measurements of aerosols: harmonization, comparisons, synergies, effects, and applications”. It is not associated with a conference.
We would also like to thank Chien Wang (Laboratoire d'Aérologie, University of Toulouse III – Paul Sabatier, Toulouse, France) and Ralph Kahn (Laboratory for Atmospheric & Space Physics, University of Colorado, Boulder, Colorado, USA) for their assistance reading through the paper and providing many insightful comments and suggestions.
This study was funded by the Jiangsu Provincial Science and Technology Program (BZ2024060).
This paper was edited by Matthew Toohey and reviewed by two anonymous referees.
Bao, F., Li, Y., Cheng, T., Gao, J., and Yuan, S.: Estimating the columnar concentrations of black carbon aerosols in China using MODIS products, Environ. Sci. Technol., 54, 11025–11036, 2020.
Bellouin, N., Quaas, J., Gryspeerdt, E., Kinne, S., Stier, P., Watson-Parris, D., Boucher, O., Carslaw, K. S., Christensen, M., Daniau, A. L., Dufresne, J. L., Feingold, G., Fiedler, S., Forster, P., Gettelman, A., Haywood, J. M., Lohmann, U., Malavelle, F., Mauritsen, T., McCoy, D. T., Myhre, G., Mülmenstädt, J., Neubauer, D., Possner, A., Rugenstein, M., Sato, Y., Schulz, M., Schwartz, S. E., Sourdeval, O., Storelvmo, T., Toll, V., Winker, D., and Stevens, B.: Bounding Global Aerosol Radiative Forcing of Climate Change, Rev. Geophys., 58, e2019RG000660, https://doi.org/10.1029/2019RG000660, 2020.
Bibi, S., Alam, K., Chishtie, F., Bibi, H., and Rahman, S.: Observations of black carbon aerosols characteristics over an urban environment: Radiative forcing and related implications, Sci. Total Environ., 603–604, 319–329, https://doi.org/10.1016/j.scitotenv.2017.06.082, 2017.
Bond, T. C. and Bergstrom, R. W.: Light absorption by carbonaceous particles: An investigative review, Aerosol Sci. Tech., 40, 27–67, 2006.
Bond, T. C., Doherty, S. J., Fahey, D. W., Forster, P. M., Berntsen, T., DeAngelo, B. J., Flanner, M. G., Ghan, S., Kärcher, B., and Koch, D.: Bounding the role of black carbon in the climate system: A scientific assessment, J. Geophys. Res.-Atmos., 118, 5380–5552, 2013.
Brown, H., Liu, X., Pokhrel, R., Murphy, S., Lu, Z., Saleh, R., Mielonen, T., Kokkola, H., Bergman, T., Myhre, G., Skeie, R. B., Watson-Paris, D., Stier, P., Johnson, B., Bellouin, N., Schulz, M., Vakkari, V., Beukes, J. P., van Zyl, P. G., Liu, S., and Chand, D.: Biomass burning aerosols in most climate models are too absorbing, Nat. Commun., 12, 277, https://doi.org/10.1038/s41467-020-20482-9, 2021.
Chen, A., Zhao, C., and Fan, T.: Spatio-temporal distribution of aerosol direct radiative forcing over mid-latitude regions in north hemisphere estimated from satellite observations, Atmos. Res., 266, 105938, https://doi.org/10.1016/j.atmosres.2021.105938, 2022a.
Chen, A., Zhao, C., Zhang, H., Yang, Y., and Li, J.: Surface albedo regulates aerosol direct climate effect, Nat. Commun., 15, 7816, https://doi.org/10.1038/s41467-024-52255-z, 2024.
Chen, C., Dubovik, O., Schuster, G. L., Chin, M., Henze, D. K., Lapyonok, T., Li, Z., Derimian, Y., and Zhang, Y.: Multi-angular polarimetric remote sensing to pinpoint global aerosol absorption and direct radiative forcing, Nat. Commun., 13, 7459, https://doi.org/10.1038/s41467-022-35147-y, 2022b.
Chung, S. H. and Seinfeld, J. H.: Climate response of direct radiative forcing of anthropogenic black carbon, J. Geophys. Res.-Atmos., 110, https://doi.org/10.1029/2004JD005441, 2005.
Cohen, J. B. and Wang, C.: Estimating global black carbon emissions using a top-down Kalman Filter approach, J. Geophys. Res.-Atmos., 119, 307–323, 2014.
Cohen, J. B., Prinn, R. G., and Wang, C.: The impact of detailed urban-scale processing on the composition, distribution, and radiative forcing of anthropogenic aerosols, Geophys. Res. Lett., 38, L10808, https://doi.org/10.1029/2011GL047417, 2011.
Cohen, J. B., Ng, D. H. L., Lim, A. W. L., and Chua, X. R.: Vertical distribution of aerosols over the Maritime Continent during El Niño, Atmos. Chem. Phys., 18, 7095–7108, https://doi.org/10.5194/acp-18-7095-2018, 2018.
Copernicus Climate Change Service, Climate Data Store: ERA5 hourly data on pressure levels from 1940 to present, Copernicus Climate Change Service (C3S) Climate Data Store (CDS) [data set], https://doi.org/10.24381/cds.bd0915c6, 2023.
Croft, B., Martin, R. V., Chang, R. Y. W., Bindle, L., Eastham, S. D., Estrada, L. A., Ford, B., Li, C., Long, M. S., and Lundgren, E. W.: Toward fine horizontal resolution global simulations of aerosol sectional microphysics: Advances enabled by GCHP-TOMAS, J. Adv. Model. Earth Syst., 16, e2023MS004094, https://doi.org/10.1029/2023ms004094, 2024.
Dubovik, O. and King, M. D.: A flexible inversion algorithm for retrieval of aerosol optical properties from Sun and sky radiance measurements, J. Geophys. Res.-Atmos., 105, 20673–20696, https://doi.org/10.1029/2000JD900282, 2000.
Dubovik, O., Smirnov, A., Holben, B., King, M., Kaufman, Y., Eck, T., and Slutsker, I.: Accuracy assessments of aerosol optical properties retrieved from Aerosol Robotic Network (AERONET) Sun and sky radiance measurements, J. Geophys. Res.-Atmos., 105, 9791–9806, 2000.
Fillmore, D. W., Rutan, D. A., Kato, S., Rose, F. G., and Caldwell, T. E.: Evaluation of aerosol optical depths and clear-sky radiative fluxes of the CERES Edition 4.1 SYN1deg data product, Atmos. Chem. Phys., 22, 10115–10137, https://doi.org/10.5194/acp-22-10115-2022, 2022.
Fu, D., Liu, M., Yang, D., Che, H., and Xia, X.: Influences of atmospheric reanalysis on the accuracy of clear-sky irradiance estimates: Comparing MERRA-2 and CAMS, Atmos. Environ., 277, 119080, https://doi.org/10.1016/j.atmosenv.2022.119080, 2022.
Garrett, T. J. and Zhao, C.: Increased Arctic cloud longwave emissivity associated with pollution from mid-latitudes, Nature, 440, 787–789, https://doi.org/10.1038/nature04636, 2006.
Gaydos, T. M., Pinder, R., Koo, B., Fahey, K. M., Yarwood, G., and Pandis, S. N.: Development and application of a three-dimensional aerosol chemical transport model, PMCAMx, Atmos. Environ., 41, 2594–2611, 2007.
Guan, L. and Cohen, J. B.: In-Tandem Multi-Waveband Particulate Absorption and Size Observations Yield Substantial Changes in Radiative Forcing over Industrial Central China, figshare [code and data set], https://doi.org/10.6084/m9.figshare.26335159, 2026.
Guo, Y., Zhang, L., Winiwarter, W., van Grinsven, H. J. M., Wang, X., Li, K., Pan, D., Liu, Z., and Gu, B.: Ambitious nitrogen abatement is required to mitigate future global PM2.5 air pollution toward the World Health Organization targets, One Earth, 7, 1600–1613, https://doi.org/10.1016/j.oneear.2024.08.007, 2024.
Hansen, J. E. and Travis, L. D.: Light scattering in planetary atmospheres, Space Sci. Rev., 16, 527–610, 1974.
Helin, A., Virkkula, A., Backman, J., Pirjola, L., Sippula, O., Aakko-Saksa, P., Väätäinen, S., Mylläri, F., Järvinen, A., and Bloss, M.: Variation of absorption Ångström exponent in aerosols from different emission sources, J. Geophys. Res.-Atmos., 126, e2020JD034094, https://doi.org/10.1029/2020JD034094, 2021.
Hersbach, H., Bell, B., Berrisford, P., Hirahara, S., Horányi, A., Muñoz-Sabater, J., Nicolas, J., Peubey, C., Radu, R., Schepers, D., Simmons, A., Soci, C., Abdalla, S., Abellan, X., Balsamo, G., Bechtold, P., Biavati, G., Bidlot, J., Bonavita, M., De Chiara, G., Dahlgren, P., Dee, D., Diamantakis, M., Dragani, R., Flemming, J., Forbes, R., Fuentes, M., Geer, A., Haimberger, L., Healy, S., Hogan, R. J., Hólm, E., Janisková, M., Keeley, S., Laloyaux, P., Lopez, P., Lupu, C., Radnoti, G., de Rosnay, P., Rozum, I., Vamborg, F., Villaume, S., and Thépaut, J.-N.: The ERA5 global reanalysis, Q. J. Roy. Meteorol. Soc., 146, 1999–2049, https://doi.org/10.1002/qj.3803, 2020.
Holben, B. N., Eck, T. F., Slutsker, I., Tanré, D., Buis, J. P., Setzer, A., Vermote, E., Reagan, J. A., Kaufman, Y. J., Nakajima, T., Lavenu, F., Jankowiak, I., and Smirnov, A.: AERONET – A Federated Instrument Network and Data Archive for Aerosol Characterization, Remote Sens. Environ., 66, 1–16, https://doi.org/10.1016/S0034-4257(98)00031-5, 1998.
Hu, W., Qin, K., Lu, F., Li, D., and Cohen, J. B.: Merging TROPOMI and eddy covariance observations to quantify 5-years of daily CH4 emissions over coal-mine dominated region, Int. J. Coal Sci. Technol., 11, 56, https://doi.org/10.1007/s40789-024-00700-1, 2024.
Huang, X.-F., Peng, Y., Wei, J., Peng, J., Lin, X.-Y., Tang, M.-X., Cheng, Y., Men, Z., Fang, T., and Zhang, J.: Microphysical complexity of black carbon particles restricts their warming potential, One Earth, 7, 136–145, 2024.
Ichoku, C., Levy, R., Kaufman, Y. J., Remer, L. A., Li, R.-R., Martins, V. J., Holben, B. N., Abuhassan, N., Slutsker, I., Eck, T. F., and Pietras, C.: Analysis of the performance characteristics of the five-channel Microtops II Sun photometer for measuring aerosol optical thickness and precipitable water vapor, J. Geophys. Res.- Atmos., 107, AAC 5-1–AAC 5-17, https://doi.org/10.1029/2001JD001302, 2002.
Jacobson, M. Z.: Strong radiative heating due to the mixing state of black carbon in atmospheric aerosols, Nature, 409, 695–697, 2001.
Kahn, R. A., Andrews, E., Brock, C. A., Chin, M., Feingold, G., Gettelman, A., Levy, R. C., Murphy, D. M., Nenes, A., and Pierce, J. R.: Reducing aerosol forcing uncertainty by combining models with satellite and within-the-atmosphere observations: a three-way street, Rev. Geophys., 61, e2022RG000796, https://doi.org/10.1029/2022RG000796, 2023.
Kayetha, V., Torres, O., and Jethva, H.: Retrieval of UV–visible aerosol absorption using AERONET and OMI–MODIS synergy: spatial and temporal variability across major aerosol environments, Atmos. Meas. Tech., 15, 845–877, https://doi.org/10.5194/amt-15-845-2022, 2022.
Khan, A. L., Dierssen, H., Schwarz, J. P., Schmitt, C., Chlus, A., Hermanson, M., Painter, T. H., and McKnight, D. M.: Impacts of coal dust from an active mine on the spectral reflectance of Arctic surface snow in Svalbard, Norway, J. Geophys. Res.-Atmos., 122, 1767–1778, https://doi.org/10.1002/2016JD025757, 2017.
Kim, D., Wang, C., Ekman, A. M., Barth, M. C., and Rasch, P. J.: Distribution and direct radiative forcing of carbonaceous and sulfate aerosols in an interactive size-resolving aerosol–climate model, J. Geophys. Res.-Atmos., 113, D16309, https://doi.org/10.1029/2007JD009756, 2008.
Kokkola, H., Kühn, T., Laakso, A., Bergman, T., Lehtinen, K. E. J., Mielonen, T., Arola, A., Stadtler, S., Korhonen, H., Ferrachat, S., Lohmann, U., Neubauer, D., Tegen, I., Siegenthaler-Le Drian, C., Schultz, M. G., Bey, I., Stier, P., Daskalakis, N., Heald, C. L., and Romakkaniemi, S.: SALSA2.0: The sectional aerosol module of the aerosol–chemistry–climate model ECHAM6.3.0-HAM2.3-MOZ1.0, Geosci. Model Dev., 11, 3833–3863, https://doi.org/10.5194/gmd-11-3833-2018, 2018.
Lack, D. A., Cappa, C. D., Cross, E. S., Massoli, P., Ahern, A. T., Davidovits, P., and Onasch, T. B.: Absorption Enhancement of Coated Absorbing Aerosols: Validation of the Photo-Acoustic Technique for Measuring the Enhancement, Aerosol Sci. Tech., 43, 1006–1012, https://doi.org/10.1080/02786820903117932, 2009.
Lesins, G., Chylek, P., and Lohmann, U.: A study of internal and external mixing scenarios and its effect on aerosol optical properties and direct radiative forcing, J. Geophys. Res.-Atmos., 107, AAC 5-1–AAC 5-12, 2002.
Li, J., Zhao, C., Sun, Y., Zhao, X., Yang, J., Yang, Y., Chen, A., and Zhou, Y.: Distinct aerosol impacts on local scale convective rainfall between Sichuan basin and north China plain regions in China, J. Geophys. Res.-Atmos., 130, e2024JD042649, https://doi.org/10.1029/2024JD042649, 2025.
Li, X., Cohen, J. B., Qin, K., Geng, H., Wu, X., Wu, L., Yang, C., Zhang, R., and Zhang, L.: Remotely sensed and surface measurement- derived mass-conserving inversion of daily NOx emissions and inferred combustion technologies in energy-rich northern China, Atmos. Chem. Phys., 23, 8001–8019, https://doi.org/10.5194/acp-23-8001-2023, 2023.
Liu, B., Gong, W., Ma, Y., Zhang, M., Yang, J., and Zhang, M.: Surface aerosol optical properties during high and low pollution periods at an urban site in central China, Aerosol Air Qual. Res., 18, 3035–3046, 2018.
Liu, D., He, C., Schwarz, J. P., and Wang, X.: Lifecycle of light-absorbing carbonaceous aerosols in the atmosphere, npj Clim. Atmos. Sci., 3, 40, https://doi.org/10.1038/s41612-020-00145-8, 2020.
Liu, J., Scheuer, E., Dibb, J., Diskin, G. S., Ziemba, L. D., Thornhill, K. L., Anderson, B. E., Wisthaler, A., Mikoviny, T., Devi, J. J., Bergin, M., Perring, A. E., Markovic, M. Z., Schwarz, J. P., Campuzano-Jost, P., Day, D. A., Jimenez, J. L., and Weber, R. J.: Brown carbon aerosol in the North American continental troposphere: sources, abundance, and radiative forcing, Atmos. Chem. Phys., 15, 7841–7858, https://doi.org/10.5194/acp-15-7841-2015, 2015.
Liu, J., Cohen, J. B., Tiwari, P., Liu, Z., Yim, S. H.-L., Gupta, P., and Qin, K.: New top-down estimation of daily mass and number column density of black carbon driven by OMI and AERONET observations, Remote Sens. Environ., 315, 114436, https://doi.org/10.1016/j.rse.2024.114436, 2024a.
Liu, Z., Cohen, J. B., Wang, S., Wang, X., Tiwari, P., and Qin, K.: Remotely sensed BC columns over rapidly changing Western China show significant decreases in mass and inconsistent changes in number, size, and mixing properties due to policy actions, npj Clim. Atmos. Sci., 7, 124, https://doi.org/10.1038/s41612-024-00663-9, 2024b.
Loh, N., Hampton, C. Y., Martin, A. V., Starodub, D., Sierra, R. G., Barty, A., Aquila, A., Schulz, J., Lomb, L., and Steinbrener, J.: Fractal morphology, imaging and mass spectrometry of single aerosol particles in flight, Nature, 486, 513–517, 2012.
Lu, F., Qin, K., Cohen, J. B., He, Q., Tiwari, P., Hu, W., Ye, C., Shan, Y., Xu, Q., Wang, S., and Tu, Q.: Surface-observation-constrained high-frequency coal mine methane emissions in Shanxi, China, reveal more emissions than inventories, consistent with satellite inversion, Atmos. Chem. Phys., 25, 5837–5856, https://doi.org/10.5194/acp-25-5837-2025, 2025a.
Lu, L., Cohen, J. B., Qin, K., Li, X., and He, Q.: Identifying missing sources and reducing NOx emissions uncertainty over China using daily satellite data and a mass-conserving method, Atmos. Chem. Phys., 25, 2291–2309, https://doi.org/10.5194/acp-25-2291-2025, 2025b.
Ma, Y., Xin, J., Zhang, W., Gong, C., Wen, T., Wu, X., Wang, Y., Wang, L., Wu, F., and Ding, X.: Uncertainties of Simulated Aerosol Direct Radiative Effect Induced by Aerosol Chemical Components: A Measurement-Based Perspective From Urban-Forest Transition Region in East China, J. Geophys. Res.-Atmos., 126, e2020JD033688, https://doi.org/10.1029/2020JD033688, 2021.
Matsui, H., Hamilton, D. S., and Mahowald, N. M.: Black carbon radiative effects highly sensitive to emitted particle size when resolving mixing-state diversity, Nat. Commun., 9, 3446, https://doi.org/10.1038/s41467-018-05635-1, 2018.
Mehrotra, B. J., Srivastava, A. K., Singh, A., Parashar, D., Majumder, N., Singh, R., Choudhary, A., and Srivastava, M. K.: Long-term trend in Black Carbon mass concentration over Central Indo-Gangetic Plain location: Understanding the implied change in radiative forcing, J. Geophys. Res.-Atmos., 129, e2024JD040754, https://doi.org/10.1029/2024JD04075, 2024.
Mishchenko, M. I., Travis, L. D., Kahn, R. A., and West, R. A.: Modeling phase functions for dustlike tropospheric aerosols using a shape mixture of randomly oriented polydisperse spheroids, J. Geophys. Res.-Atmos., 102, 16831–16847, https://doi.org/10.1029/96JD02110, 1997.
Moosmüller, H., Chakrabarty, R. K., Ehlers, K. M., and Arnott, W. P.: Absorption Ångström coefficient, brown carbon, and aerosols: basic concepts, bulk matter, and spherical particles, Atmos. Chem. Phys., 11, 1217–1225, hthttps://doi.org/10.5194/acp-11-1217-2011, 2011.
Myhre, G., Shindell, D., Bréon, F.-M., Collins, W., Fuglestvedt, J., Huang, J., Koch, D., Lamarque, J.-F., Lee, D., Mendoza, B., Nakajima, T., Robock, A., Stephens, G., Takemura, T., and Zhang, H.: Anthropogenic and Natural Radiative Forcing, in: Climate Change 2013 – The Physical Science Basis, Cambridge University Press, Cambridge, 659–740, https://doi.org/10.1017/CBO9781107415324.018, 2014.
Pei, Q., Zhao, C., Yang, Y., Chen, A., Cong, Z., Wan, X., Zhang, H., and Wu, G.: Wildfires heat the middle troposphere over the Himalayas and Tibetan Plateau during the peak of fire season, Atmos. Chem. Phys., 25, 10443–10456, https://doi.org/10.5194/acp-25-10443-2025, 2025.
Peng, J., Hu, M., Guo, S., Du, Z., Zheng, J., Shang, D., Levy Zamora, M., Zeng, L., Shao, M., Wu, Y.-S., Zheng, J., Wang, Y., Glen, C. R., Collins, D. R., Molina, M. J., and Zhang, R.: Markedly enhanced absorption and direct radiative forcing of black carbon under polluted urban environments, P. Natl. Acad. Sci. USA, 113, 4266–4271, https://doi.org/10.1073/pnas.1602310113, 2016.
Prats, N., Cachorro, V. E., Berjón, A., Toledano, C., and De Frutos, A. M.: Column-integrated aerosol microphysical properties from AERONET Sun photometer over southwestern Spain, Atmos. Chem. Phys., 11, 12535–12547, https://doi.org/10.5194/acp-11-12535-2011, 2011.
Qin, K., Lu, L., Liu, J., He, Q., Shi, J., Deng, W., Wang, S., and Cohen, J. B.: Model-free daily inversion of NOx emissions using TROPOMI (MCMFE-NOx) and its uncertainty: Declining regulated emissions and growth of new sources, Remote Sens. Environ., 295, 113720, https://doi.org/10.1016/j.rse.2023.113720, 2023.
Ramachandran, S., Rupakheti, M., Cherian, R., and Lawrence, M. G.: Aerosols heat up the Himalayan climate, Sci. Total Environ., 894, 164733, https://doi.org/10.1016/j.scitotenv.2023.164733, 2023.
Ramanathan, V., Crutzen, P. J., Kiehl, J. T., and Rosenfeld, D.: Aerosols, Climate, and the Hydrological Cycle, Science, 294, 2119–2124, https://doi.org/10.1126/science.1064034, 2001.
Randles, C., Colarco, P., and Da Silva, A.: Direct and semi-direct aerosol effects in the NASA GEOS-5 AGCM: Aerosol-climate interactions due to prognostic versus prescribed aerosols, J. Geophys. Res.-Atmos., 118, 149–169, 2013.
Randles, C. A., da Silva, A. M., Buchard, V., Colarco, P. R., Darmenov, A., Govindaraju, R., Smirnov, A., Holben, B., Ferrare, R., Hair, J., Shinozuka, Y., and Flynn, C. J.: The MERRA-2 Aerosol Reanalysis, 1980 Onward. Part I: System Description and Data Assimilation Evaluation, J. Climate, 30, 6823–6850, https://doi.org/10.1175/JCLI-D-16-0609.1, 2017.
Reddington, C. L., McMeeking, G., Mann, G. W., Coe, H., Frontoso, M. G., Liu, D., Flynn, M., Spracklen, D. V., and Carslaw, K. S.: The mass and number size distributions of black carbon aerosol over Europe, Atmos. Chem. Phys., 13, 4917–4939, https://doi.org/10.5194/acp-13-4917-2013, 2013.
Ricchiazzi, P., Yang, S., Gautier, C., and Sowle, D.: SBDART: A research and teaching software tool for plane-parallel radiative transfer in the Earth's atmosphere, B. Am. Meteorol. Soc., 79, 2101–2114, 1998.
Romshoo, B., Pöhlker, M., Wiedensohler, A., Pfeifer, S., Saturno, J., Nowak, A., Ciupek, K., Quincey, P., Vasilatou, K., Ess, M. N., Gini, M., Eleftheriadis, K., Robins, C., Gaie-Levrel, F., and Müller, T.: Importance of size representation and morphology in modelling optical properties of black carbon: comparison between laboratory measurements and model simulations, Atmos. Meas. Tech., 15, 6965–6989, https://doi.org/10.5194/amt-15-6965-2022, 2022.
Saarikoski, S., Niemi, J. V., Aurela, M., Pirjola, L., Kousa, A., Rönkkö, T., and Timonen, H.: Sources of black carbon at residential and traffic environments obtained by two source apportionment methods, Atmos. Chem. Phys., 21, 14851–14869, https://doi.org/10.5194/acp-21-14851-2021, 2021.
Savadkoohi, M., Pandolfi, M., Favez, O., Putaud, J.-P., Eleftheriadis, K., Fiebig, M., Hopke, P. K., Laj, P., Wiedensohler, A., Alados-Arboledas, L., Bastian, S., Chazeau, B., María, Á. C., Colombi, C., Costabile, F., Green, D. C., Hueglin, C., Liakakou, E., Luoma, K., Listrani, S., Mihalopoulos, N., Marchand, N., Močnik, G., Niemi, J. V., Ondráček, J., Petit, J.-E., Rattigan, O. V., Reche, C., Timonen, H., Titos, G., Tremper, A. H., Vratolis, S., Vodička, P., Funes, E. Y., Zíková, N., Harrison, R. M., Petäjä, T., Alastuey, A., and Querol, X.: Recommendations for reporting equivalent black carbon (eBC) mass concentrations based on long-term pan-European in-situ observations, Environ. Int., 185, 108553, https://doi.org/10.1016/j.envint.2024.108553, 2024.
Schuster, G. L., Dubovik, O., Holben, B. N., and Clothiaux, E. E.: Inferring black carbon content and specific absorption from Aerosol Robotic Network (AERONET) aerosol retrievals, J. Geophys. Res.-Atmos., 110, https://doi.org/10.1029/2004JD004548, 2005.
Seinfeld, J. H., Kleindienst, T. E., Edney, E. O., and Cohen, J. B.: Aerosol Growth in a Steady-State, Continuous Flow Chamber: Application to Studies of Secondary Aerosol Formation, Aerosol Sci. Tech., 37, 728–734, https://doi.org/10.1080/02786820300915, 2003.
Shen, Y., Virkkula, A., Ding, A., Luoma, K., Keskinen, H., Aalto, P. P., Chi, X., Qi, X., Nie, W., Huang, X., Petäjä, T., Kulmala, M., and Kerminen, V. M.: Estimating cloud condensation nuclei number concentrations using aerosol optical properties: role of particle number size distribution and parameterization, Atmos. Chem. Phys., 19, 15483–15502, https://doi.org/10.5194/acp-19-15483-2019, 2019.
Srivastava, A. K., Ram, K., Pant, P., Hegde, P., and Joshi, H.: Black carbon aerosols over Manora Peak in the Indian Himalayan foothills: implications for climate forcing, Environ. Res. Lett., 7, 014002, https://doi.org/10.1088/1748-9326/7/1/014002, 2012.
Tian, P., Liu, D., Zhao, D., Yu, C., Liu, Q., Huang, M., Deng, Z., Ran, L., Wu, Y., Ding, S., Hu, K., Zhao, G., Zhao, C., and Ding, D.: In situ vertical characteristics of optical properties and heating rates of aerosol over Beijing, Atmos. Chem. Phys., 20, 2603–2622, https://doi.org/10.5194/acp-20-2603-2020, 2020.
Tiwari, P., Cohen, J. B., Wang, X., Wang, S., and Qin, K.: Radiative forcing bias calculation based on COSMO (Core-Shell Mie model Optimization) and AERONET data, npj Clim. Atmos. Sci., 6, 193, https://doi.org/10.1038/s41612-023-00520-1, 2023.
Tiwari, P., Cohen, J. B., Lu, L., Wang, S., Li, X., Guan, L., Liu, Z., Li, Z., and Qin, K.: Multi-platform observations and constraints reveal overlooked urban sources of black carbon in Xuzhou and Dhaka, Commun. Earth Environ., 6, 38, https://doi.org/10.1038/s43247-025-02012-x, 2025.
Vignati, E., Wilson, J., and Stier, P.: M7: An efficient size-resolved aerosol microphysics module for large-scale aerosol transport models, J. Geophys. Res.-Atmos., 109, D22202, https://doi.org/10.1029/2003JD004485, 2004.
Wang, J. and Martin, S. T.: Satellite characterization of urban aerosols: Importance of including hygroscopicity and mixing state in the retrieval algorithms, J. Geophys. Res.-Atmos., 112, D17203, https://doi.org/10.1029/2006JD008078, 2007.
Wang, J., Wang, J., Cai, R., Liu, C., Jiang, J., Nie, W., Wang, J., Moteki, N., Zaveri, R. A., and Huang, X.: Unified theoretical framework for black carbon mixing state allows greater accuracy of climate effect estimation, Nat. Commun., 14, 2703, https://doi.org/10.1038/s41467-023-38330-x, 2023a.
Wang, L., Li, Z., Tian, Q., Ma, Y., Zhang, F., Zhang, Y., Li, D., Li, K., and Li, L.: Estimate of aerosol absorbing components of black carbon, brown carbon, and dust from ground-based remote sensing data of sun-sky radiometers, J. Geophys. Res.-Atmos., 118, 6534–6543, 2013.
Wang, Q., Liu, H., Ye, J., Tian, J., Zhang, T., Zhang, Y., Liu, S., and Cao, J.: Estimating Absorption Ångström Exponent of Black Carbon Aerosol by Coupling Multiwavelength Absorption with Chemical Composition, Environ. Sci. Technol. Lett., 8, 121–127, 2020a.
Wang, S., Cohen, J. B., Lin, C., and Deng, W.: Constraining the relationships between aerosol height, aerosol optical depth and total column trace gas measurements using remote sensing and models, Atmos. Chem. Phys., 20, 15401–15426, https://doi.org/10.5194/acp-20-15401-2020, 2020b.
Wang, S., Wang, X., Cohen, J. B., and Qin, K.: Inferring polluted Asian absorbing aerosol properties using decadal scale AERONET measurements and a MIE model, Geophys. Res. Lett., 48, e2021GL094300, https://doi.org/10.1029/2021GL094300, 2021a.
Wang, S., Cohen, J. B., Wang, X., Chen, W., Deng, W., Tiwari, P., Yang, Y., and Lolli, S.: Observationally constrained mass balance box model analysis of aerosol mitigation potential using fan powered filters, Environ. Res. Commun., 5, 125012, https://doi.org/10.1088/2515-7620/ad1422, 2023b.
Wang, S., Cohen, J. B., Guan, L., Lu, L., Tiwari, P., and Qin, K.: Observationally constrained global NOx and CO emissions variability reveals sources which contribute significantly to CO2 emissions, npj Clim. Atmos. Sci., 8, 87, https://doi.org/10.1038/s41612-025-00977-2, 2025.
Wang, Y., Pang, Y., Huang, J., Bi, L., Che, H., Zhang, X., and Li, W.: Constructing Shapes and Mixing Structures of Black Carbon Particles With Applications to Optical Calculations, J. Geophys. Res.-Atmos., 126, e2021JD034620, https://doi.org/10.1029/2021JD034620, 2021b.
Wei, X., Cui, Q., Ma, L., Zhang, F., Li, W., and Liu, P.: Global aerosol-type classification using a new hybrid algorithm and Aerosol Robotic Network data, Atmos. Chem. Phys., 24, 5025–5045, https://doi.org/10.5194/acp-24-5025-2024, 2024.
Yang, M., Howell, S. G., Zhuang, J., and Huebert, B. J.: Attribution of aerosol light absorption to black carbon, brown carbon, and dust in China – interpretations of atmospheric measurements during EAST-AIRE, Atmos. Chem. Phys., 9, 2035–2050, https://doi.org/10.5194/acp-9-2035-2009, 2009.
Yu, F., Luo, G., and Ma, X.: Regional and global modeling of aerosol optical properties with a size, composition, and mixing state resolved particle microphysics model, Atmos. Chem. Phys., 12, 5719–5736, https://doi.org/10.5194/acp-12-5719-2012, 2012.
Yuan, Q., Xu, J., Wang, Y., Zhang, X., Pang, Y., Liu, L., Bi, L., Kang, S., and Li, W.: Mixing state and fractal dimension of soot particles at a remote site in the southeastern Tibetan Plateau, Environ. Sci. Technol., 53, 8227–8234, 2019.