the Creative Commons Attribution 4.0 License.
the Creative Commons Attribution 4.0 License.
 | 26 Feb 2026
Measurement report: Emission factors and organic aerosol source apportionment of shipping emissions in the coastal city of Toulon, France
Benjamin Chazeau
Brice Temime-Roussel
Irène Xueref-Remy
Alexandre Armengaud
Henri Wortham
Maritime transport exerts a substantial influence on local air quality, particularly in port cities. Ship emissions are recognized as major contributors to air pollution, with comparable magnitude to those of road transport. This study, conducted in 2021 in Toulon, a port city on the French Mediterranean coast, assessed ship emissions one year after the implementation of IMO2020 sulfur regulations. Emission factors (EFs) were determined for key pollutants such as SO2, NOx, CO, NO, CH4 and particulate matter (PM), including black carbon (BC), organics (Org), sulfate (SO), nitrate (NO), ammonium (NH), and polycyclic aromatic hydrocarbons (PAHs), as well as the particle number concentration (PN). The IMO2020 regulation led to a marked reduction in sulfur-related emissions, whereas pollutants such as BC, Org, and PAHs remained at pre-regulation levels. Positive Matrix Factorization (PMF) analysis of PM1 organic aerosol (OA) measured by a High-Resolution Time-of-Flight Aerosol Mass Spectrometer (HR-ToF-AMS) was used to investigate shipping contribution to local air quality. PMF successfully distinguished between road and marine transport emissions, revealing a shipping contribution to the total OA of 11.2 %. Eight factors were resolved: three shipping-related OA, a Hydrocarbon-like OA (HOA), a Cooking-like OA (COA), an Oxidized Hydrocarbon-like OA (OxHOA), a Less Oxidized OA (LOOA), and a More Oxidized OA (MOOA). Shipping and HOA factors were the dominant contributors to ultrafine particles, accounting together for 51.9 % of the alkylated PAHs (APAHs). These findings highlight the persistent influence of shipping emissions in port areas and demonstrate the effectiveness of advanced source apportionment methods to improve emission monitoring strategies, particularly as the Mediterranean region prepares for the implementation of Emission Control Area (ECA) regulations in 2025.
- Article
(6500 KB) - Full-text XML
-
Supplement
(13080 KB) - BibTeX
- EndNote


Maritime transport is the primary mode for European imports and exports globally, accounting for 80 % of the EU's external freight trade (Eurostat, 2023; EEA, 2018; Merico et al., 2017; EEA, 2016). Forecasts indicate that freight volumes will double by 2030 compared with 2020 levels (United Nations Conference on Trade and Development, 2023). While this mode of transport is a key contributor to social and economic development worldwide (Bagoulla and Guillotreau, 2020; Eyring et al., 2010), it negatively impacts air quality in coastal areas and global climate (Toscano, 2023; Viana et al., 2014; EEA, 2013a).
Ship engines are well-known sources of various pollutants such as nitrogen oxides (NOx), sulfur dioxide (SO2), carbon monoxide (CO), volatile organic compounds (VOCs), and greenhouse gases including carbon dioxide (CO2) and methane (CH4) (Aakko-Saksa et al., 2023; Celik et al., 2020; Lou et al., 2019). Globally, shipping accounts for approximately 15 % of NOx, 5 %–8 % of SO2, and about 3 % of CO2 emissions (International Maritime Organization, 2020). In coastal cities, shipping constitutes a major source of fine and ultrafine particles (PM1 and PM0.1), where PM1 refers to particulate matter with an aerodynamic diameter ≤ 1 µm and PM0.1 (also referred to as ultrafine particles, UFP) to particles with a diameter ≤ 0.1 µm (Garcia-Marlès et al., 2024; Eger et al., 2023). These particles often contain toxic substances such as heavy metals, polycyclic aromatic hydrocarbons (PAHs), and black carbon (BC) (Heikkilä et al., 2024; Zhao et al., 2020; Muñoz et al., 2018; Betha et al., 2016) and are associated with cardiovascular and respiratory diseases (Kiihamäki et al., 2024; Sofiev et al., 2018). UFP are particularly hazardous, as they can penetrate deep into the pulmonary epithelium and reach other organs (Schraufnagel, 2020). Recent research by Allouche et al. (2022) has linked pollutant exposure to weakened antiviral cellular response. Additionally, several studies suggest that long-term exposure to air pollution and living near high-traffic roadways are associated with increased risks of Alzheimer's disease, Parkinson's disease, and vascular dementia (Calderón-Garcidueñas and Ayala, 2022; Grande et al., 2020; Chen et al., 2017; Jung et al., 2015).
Approximately 70 % of ship emissions occur within 400 km of coastlines (Eyring et al., 2010) emphasizing their local impact. Moreover, the longer the average turnaround time for ships, the greater the risks for population health and the environment (Ducruet et al., 2024). Air quality measurements in port cities reveal that ship emissions are quantitatively comparable to road transport emissions, contributing substantially to air quality degradation (Tang et al., 2020; Air PACA, 2017; Viana et al., 2014; EEA, 2013b) and to severe health impacts, causing up to 0.5 % of global premature mortality (Mueller et al., 2023).
Since 1973, the International Maritime Organization (IMO) has implemented the International Convention for the Prevention of Pollution from Ships (MARPOL Convention) to regulate maritime pollutant emissions (International Maritime Organization, 2021). These regulations include restrictions on NOx, CO2 and SO2 emissions as well as fine particles in designated Emission Control Areas (ECAs). On 1 January 2020, the IMO introduced new regulations reducing the maximum sulfur content in marine fuels from 3.5 % to 0.5 % globally, with stricter limits of 0.1 % within Sulfur Emission Control Areas (SECA). Following negotiations that began in 2016, the Mediterranean states have jointly adopted a SECA. Called SECA-Med, it will cover the entire Mediterranean by May 2025.
In addition to the limits on fuel-sulfur content, MARPOL Annex VI also establishes progressive NOx emission standards, referred to as Tier I, Tier II, and Tier III. These tiers set maximum allowable NOx emissions per unit of engine power as a function of the engine's rated speed.
To comply with these new requirements, the use of exhaust gas cleaning systems has become increasingly widespread (Heikkilä et al., 2024). Exhaust Gas Recirculation (EGR) technologies recirculate a portion of the cooled exhaust gas back into the engine cylinder lowering combustion temperature and reducing NOx formation. The Selective Catalytic Reduction (SCR) systems inject urea into the exhaust stream that decomposes to ammonia promoting the catalytic conversion of NOx into nitrogen and water (Napolitano et al., 2022). These technologies enable compliance with environmental regulations for vessels running on Heavy Fuel Oil (HFO) that contains sulfur levels exceeding 0.5 % (Laasma et al., 2022). Alternatively, cleaner fuels such as Marine Diesel Oil (MDO) or Marine Gas Oil (MGO) can be used without scrubbers. The implementation of low-sulfur fuels in maritime transport significantly reduces exposure to fine and ultrafine particle emissions (Mwase et al., 2020), leading to an estimated global reduction of approximately 2.6 % in fatalities from cardiovascular diseases and lung cancer associated with PM2.5. Nevertheless, in spite of these improvements, the use of these new marine fuels is anticipated to result in approximately 250 000 deaths annually (Sofiev et al., 2018).
In 2021, the shipping activity in Toulon showed signs of gradual recovery, especially for ferry connections linking France, Corsica, and Sardinia, although overall traffic had not yet returned to pre-pandemic values. Local inventories from CIGALE database (AtmoSud, 2024) estimated local NOx emissions from shipping accounting for 40 % of the total emitted 1200 t. Primary PM2.5 and PM10 emissions are evaluated at 140 and 175 t, respectively, with a contribution of shipping between 5 %–6 %. While SO2 and CO2 emissions were estimated at 34.8 and 650 000 t, with maritime contributions of 35.2 % and 4.2 %, respectively. These data highlight the substantial impact of maritime activities on local air quality and underscore the need for more detailed assessment of pollutants from shipping relative to other pollution sources.
Positive Matrix Factorization (PMF) analysis of Aerosol Mass Spectrometry (AMS) measurements has been extensively used to apportion particulate matter (PM) across various environments (Bozzetti et al., 2017; Dall'Osto et al., 2015; Zhang et al., 2011; Ng et al., 2010). However, the differentiation of primary sources within organic aerosol (OA) remains a key challenge in PMF. Yuan et al. (2012) suggested that PMF factors might reflect different stages of photochemical processing rather than entirely independent sources. In heavily polluted areas, Aiken et al. (2009) noted that AMS-PMF analysis often merges multiple sources into a single factor due to overlapping emission patterns caused by hard ionization. This observation was corroborated by Brinkman et al. (2006), who found that highly correlated sources, such as diesel and gasoline exhaust, were frequently grouped into a single PMF factor. Although PMF techniques have significantly improved source identification, differentiating combustion sources (Hydrocarbon-like OA or HOA) remains a challenge when using High-Resolution Time-of-Flight AMS (HR-ToF-AMS) data, due to extensive molecular fragmentation induced by electron impact ionization, which produces overlapping mass spectral patterns and limits the resolution of HOA signatures.
This study overcomes previous limitations through several methodological improvements designed to enhance the separation of closely related combustion sources. First, HR-ToF-AMS data were analyzed at 1 min temporal resolution to capture transient ship plumes before they mixed with background urban emissions, minimizing temporal averaging effects, typical of 10–15 min datasets. Second, by incorporating PAH-related ions up to 256, the high-resolution OA matrix provided additional spectral features that improved the separation of shipping emissions from those associated with road traffic emissions. Third, reference spectra from locally sampled ship plumes were used to provide a representative chemical fingerprint of maritime emissions specific to the Toulon port area. Finally, a particle number size-distribution analysis (2 min resolution) was conducted to verify the physical consistency of each PMF factor through their association with characteristic particle-size modes. These combined methodological advances improved the distinction of related combustion sources and enabled an unprecedented characterization of PM1 sources in a near-field port environment.
The present study offers a comprehensive insight into shipping emissions by quantitatively assessing emission factors (EFs) of SO2, NOx, CO, NO, CH4, and particle chemical components such as BC, organics (Org), sulfate (SO), nitrate (NO), ammonium (NH), and PAHs. Furthermore, particle number concentration and size distribution, along with PMF analysis of the non-refractory PM1 (NR-PM1) OA fraction, provide an improved understanding of the impact of shipping activities on air quality in the port area. This study successfully distinguishes maritime emissions from road transport emissions, offering a robust framework for targeted source apportionment and supporting the development of more effective air quality management and regulatory strategies.
2.1 Site Description and Instrumentation
From 24 August to 21 September 2021, a measurement campaign was conducted in the port of Toulon, a Mediterranean port city in southeastern France, as part of the AER-NOSTRUM project. The reference stations of AtmoSud and the Massalya mobile air analysis laboratory, operated by the Laboratory of Environmental Chemistry of Marseille (LCE) and equipped with state-of-the-art instruments (listed in Table 1), were deployed at the Toulon TCA terminal (43°7′1′′ N, 5°56′5.2′′ E).
Table 1Summary of the instruments deployed during the Toulon campaign.
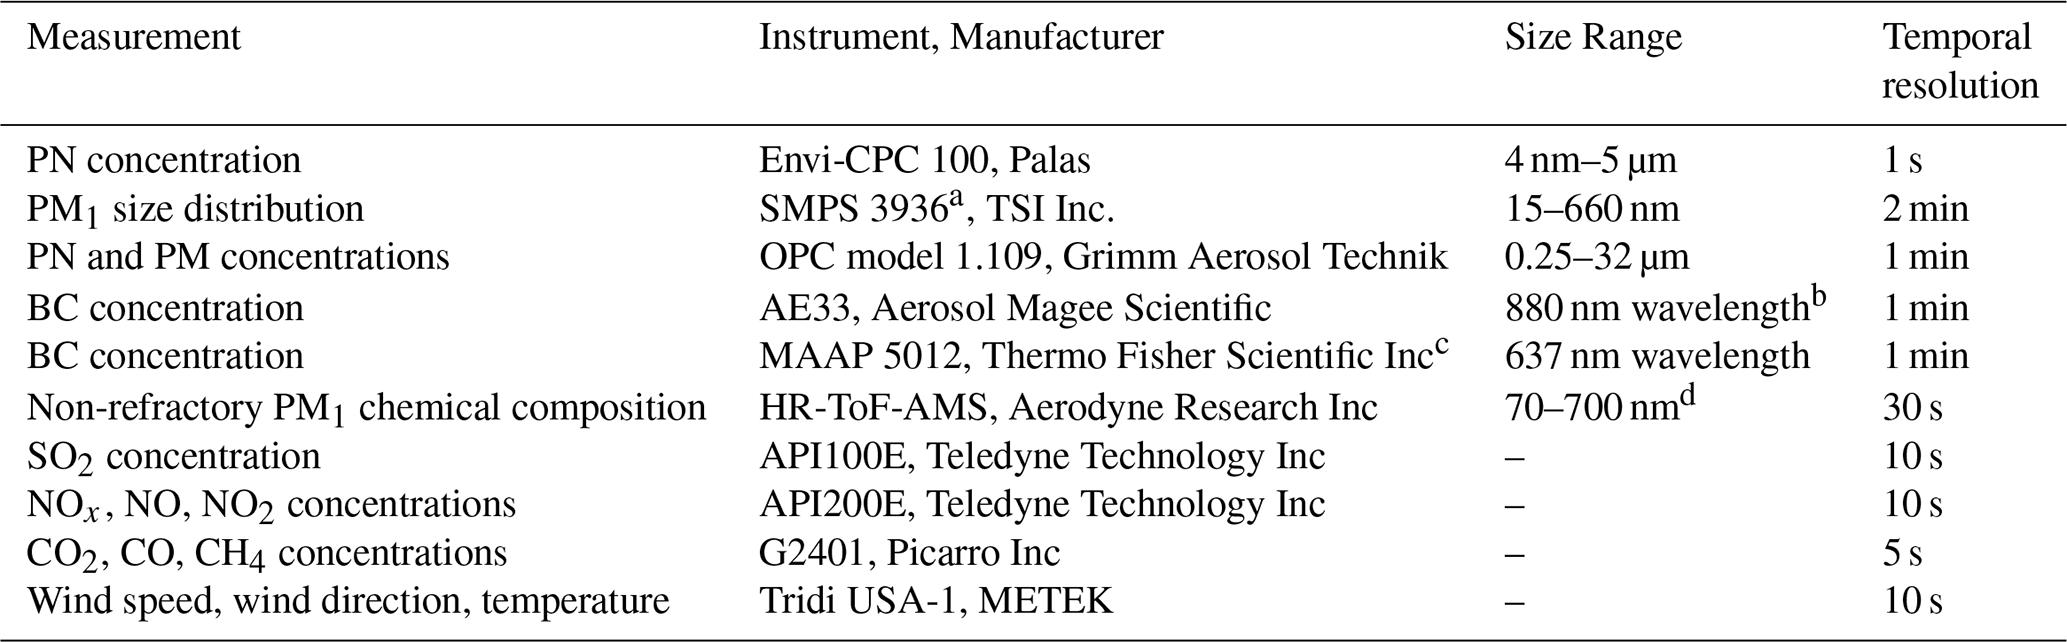
a Coupled with CPC model 3775, Classifier model 3080 and DMA model 3081 from TSI Inc. b AE33 measured wavelengths are 370, 470, 520, 590, 660, 880 and 950 nm; only 880 nm wavelength data were used in this paper. c Used solely for CE calculation. d Size range of transmission efficiency of aerodynamic lens system of Aerodyne HR-ToF-AMS (Liu et al., 2007).
This location is representative of areas where shipping emissions directly affect the local population living in cities with important maritime activities, as the city center is located near ferry terminals, major roads, and residential areas (Figs. S1 and S2 in the Supplement). Figure S3 shows the schedule of ferry arrivals and departures provided by the Toulon Port Authority. Most departures occur around 07:00 a.m., and arrivals around 10:00 p.m. (local time). Increased road transport was observed before arrivals and after departures of ferries. Military ship activity in Toulon was very limited during the campaign. A wind-direction analysis showed that air masses from the military base sector represented less than 3 % of the total air masses collected, suggesting that the influence of the naval area on the measured aerosol composition was negligible.
The distribution of submicron particles between 15 and 661.2 nm, across 106 size channels, was measured using a Scanning Mobility Particle Sizer (SMPS). The measurements were conducted with a 2 min time step using a TSI model 3936 SMPS, which combines a 3080 Electrostatic Classifier with an 85Kr neutralizer, a Differential Mobility Analyzer (DMA 3081), and a Condensation Particle Counter (CPC 3775). CO2, CO, and CH4 were measured by a Picarro analyzer, calibrated following the procedure described in Xueref-Remy et al. (2023). Black carbon was sampled using a Thermo Fisher multi-angle absorption photometer (MAAP) and an Aerosol Magee Scientific aethalometer AE33, with a 1 min time step for both instruments. The non-refractory submicron fraction of aerosol was measured using a HR-ToF-AMS (Aerodyne). A detailed description of the HR-ToF-AMS is available in Canagaratna et al. (2007) and DeCarlo et al. (2006). Data analysis was performed using Squirrel version 1.65B and Pika version 1.25B software (DeCarlo et al., 2006). The vaporizer temperature was set at 600–650 °C and the tungsten filament for electron ionization was run at an accelerating voltage of 70 eV. The sampling time resolution was set to 30 s in V-mode and ratios for analyses ranged from 12 to 256. Calibration was carried out before the campaign using ammonium nitrate and ammonium sulfate, yielding a nitrate Ionization Efficiency (IE) of 5.07 × 10⁸ and Relative Ionization Efficiencies (RIE) of 3.91 for ammonium and 1.7 for sulfate. Default RIE values of 1.1, 1.3, and 1.4 were applied for nitrate, chloride, and organic fractions, respectively (Xu et al., 2018; Canagaratna et al., 2007). An average Collection Efficiency (CE) of 0.63 was calculated to correct HR-ToF-AMS concentrations. During intense ship plume events, a unit CE value was determined based on comparisons between SMPS, HR-ToF-AMS, and MAAP measurements, a behavior also reported in the literature (Voliotis et al., 2021; Quinn et al., 2006). The standard deviation of the CE was estimated at 14 %, consistent with the 20 % uncertainty reported in previous studies (Bahreini et al., 2009; Matthew and Onasch, 2008). A comprehensive description of the HR-ToF-AMS operation, calibration and validation is available in Sect. S1 in the Supplement.
2.2 Emission Factors and Fuel Sulfur Content Calculations
To determine the EFs of pollutants from shipping, a carbon mass balance approach was applied. This method involves measuring pollutant concentrations, particularly CO2, at a receptor site, i.e., a location where ship plumes are intercepted. The measured concentrations include both atmospheric background and pollution introduced by the plume. We used linear fit-based EFs that interpolate background concentrations between the levels before and after the plume (Volent et al., 2026; Diesch et al., 2013). This technique specifically addresses the Toulon area, where other sources affect the accurate evaluation of background concentration across an extended period. The concentrations of various pollutants within the plume are then correlated to fuel consumption, which is quantified based on the plume's CO2 concentration (Celik et al., 2020; Ausmeel et al., 2019; Ježek et al., 2015; Lack et al., 2009).
Where EFx represents the emission factor of substance X expressed in grams of pollutant emitted per kilogram of fuel consumed (g kg), the constant term corresponds to the inverse of the mass fraction of carbon in CO2, ωc denotes the mass fraction of carbon in ship fuel, [x] is the excess concentration of the substance x after subtracting the background level, expressed in particles per cubic meter or µg per cubic meter, and [CO2] is the excess concentration of CO2 after background subtraction, expressed in mg m−3. E and G mark the start and the end of the plume, respectively. Since most ferries are powered by diesel engines, the ωc value has been set to 0.865 kg of carbon per kg of fuel, corresponding to the mass fraction of carbon in marine diesel fuel (Diesch et al., 2013).
The fuel sulfur content (FSC) is derived from the ratio of excess SO2 to CO2 concentrations in the plume, assuming complete conversion of fuel sulfur to SO2 (Volent et al., 2026; Van Roy et al., 2022; Pirjola et al., 2014). This yields the following expression:
Here, FSC is the fuel sulfur content in %, is the sulfur emission factor in (g kg). This method provides a lower-limit estimate of FSC, since a small portion of sulfur can be emitted as SO3 or converted to H2SO4 in the atmosphere (Pirjola et al., 2014; Alföldy et al., 2013; Moldanová et al., 2013).
In this study, a plume was defined as a transient enhancement in particle number concentration (CPC) exceeding at least twice the local background, observed under a mean wind direction between 130 and 290° (from southeast to northwest) and a wind direction standard deviation below 30°. The start and end times were determined based on concurrent increases in PN and CO2 concentration, adjusted to the instrumental time resolution. Plume durations ranged from a few minutes to approximately 20 min, depending on the ship's distance from site and the prevailing meteorological conditions.
Each emission factor (EF) was automatically calculated using an emission factor calculation tool (Le Berre et al., 2025), based on the carbon mass balance method, and subsequently manually validated to ensure that only genuine ship plumes were retained, with clearly defined start and end times for each event. The plume boundaries were individually adjusted for each pollutant to account for slight desynchronization between instruments, thereby ensuring accurate integration of excess concentrations. This combination of automatic and manual validation ensures that each EF corresponds to a well-defined transient emission event. An illustrative example of a plume, including the background interpolation and pollutant variability, is provided in Fig. S5.
2.3 Theta angle
The theta angle, or cosine similarity, is a method increasingly used to calculate the correlation or similarity between mass spectra (Bougiatioti et al., 2014; Kostenidou et al., 2009). A mass spectrum with a dimension n (representing the number of fragments that compose the mass spectrum) and αi the intensity of the fragment, is treated as an n-dimensional vector. Thus, a mass spectrum A can be expressed as:
Then, the cosine between two mass spectra A and B can be calculated:
Bougiatioti et al. (2014) define the similarity of two mass spectra as follows: a theta angle between 0 and 15° indicates that the two mass spectra are similar, an angle between 15 and 30° suggests a weak correlation, and an angle greater than 30° indicates that the two mass spectra are different. That is why Kostenidou et al. (2009) assumes cos (θ) as analogous to Pearson's coefficient correlation (R) when comparing mass spectra.
2.4 Spectral Relative Predominance
A Spectral Relative Predominance (SRP) is a metric developed to evaluate the relative differences in ion intensities between two mass spectra, highlighting which mass spectrum predominantly produces specific ions. For two mass spectra A and B, that can be expressed as a n-dimensional vector as in Eq. (2), with intensities αi and βi for ion i, the SRP is defined as:
Positive SRP values indicate predominant ions in spectrum A, while negative values correspond to those predominant in B. Unlike the theta angle, which compares entire spectra, SRP provides an ion-specific measure of spectral differences.
2.5 Positive Matrix Factorization
The PMF model developed by Paatero and Tapper (1994) is an analytical tool based on decomposing a positive matrix X, into two non-negative matrices, G and F such that their product best approximates the original matrix while minimizing the residual matrix E:
where X is a n×m matrix representing chemical concentration measurements at different time points m and for different chemical species n, G is a n×p matrix, where p is the number of potential profiles. Each column of G represents the temporal concentration series of a factor. F is a p×m matrix describing the chemical profiles of the factors. E is a n×m matrix representing the difference between X and the product G×F. Minimizing the residual matrix E constitutes a fundamental aspect in solving Eq. (4), where the model endeavors to optimize the function Q:
where ei,j represents the model residuals for species j at time i and σi,j represents the estimated uncertainty for species j at time i. It is noteworthy that there are no unique solutions for a given value of Q, and a lower value of Q does not necessarily lead to a better deconvolution. This drawback may be caused by rotational ambiguity. To mitigate this ambiguity, it is possible to constrain the matrices F and/or G with external constraints. The ME-2 solver (Paatero, 1999) allows the constraint of chemical profiles or temporal evolution of factors, notably with an “a-value” approach, i.e. a degree of freedom (defined by the scalar a), corresponding to the extent to which the factor profile can deviate from the provided constraint. This approach helps avoid unrealistic solutions and enables the separation of sources with similar chemical signatures (Canonaco et al., 2013; Lanz et al., 2008).
3.1 Campaign Overview
An overview of the measurement campaign is provided in Fig. 1, including meteorological data (wind speed and direction), aerosol composition (HR-ToF-AMS species and black carbon), as well as PN, PM, and gases (NOx and SO2). The pie chart representing the median PM1 chemical composition shows the following proportions (median ± standard deviation): 53 ± 13 % organics, 16 ± 9 % sulfate, 7 ± 4 % ammonium, 2 ± 1 % nitrate, and 21 ± 14 % BC. This indicates that organics and BC are the dominant and most variable components of PM1, while sulfate, nitrate, and ammonium remain relatively stable. Chloride represented a negligible fraction of PM1 (< 1 %) and was therefore not included in Fig. 1 for clarity. The most intense PM1 peaks occurred during ship arrivals and departures, when the wind originated from the sea (130–290°). When comparing the plume median to the maximum concentration reached during the most intense events, PM1 increased by a factor of about 3.1 (≈ +21 µg m−3), PN by 3.4 (≈ +2.4 × 104 cm−3), Org by 5.1 (≈ +97 µg m−3), BC by 3.6 (≈ +11 µg m−3), and NOx by 3.3 (≈ +123 µg m−3). In contrast, sulfate increased only by a factor of about 1.2 (≈ +0.27 µg m−3), confirming its much weaker variability during peak plumes.
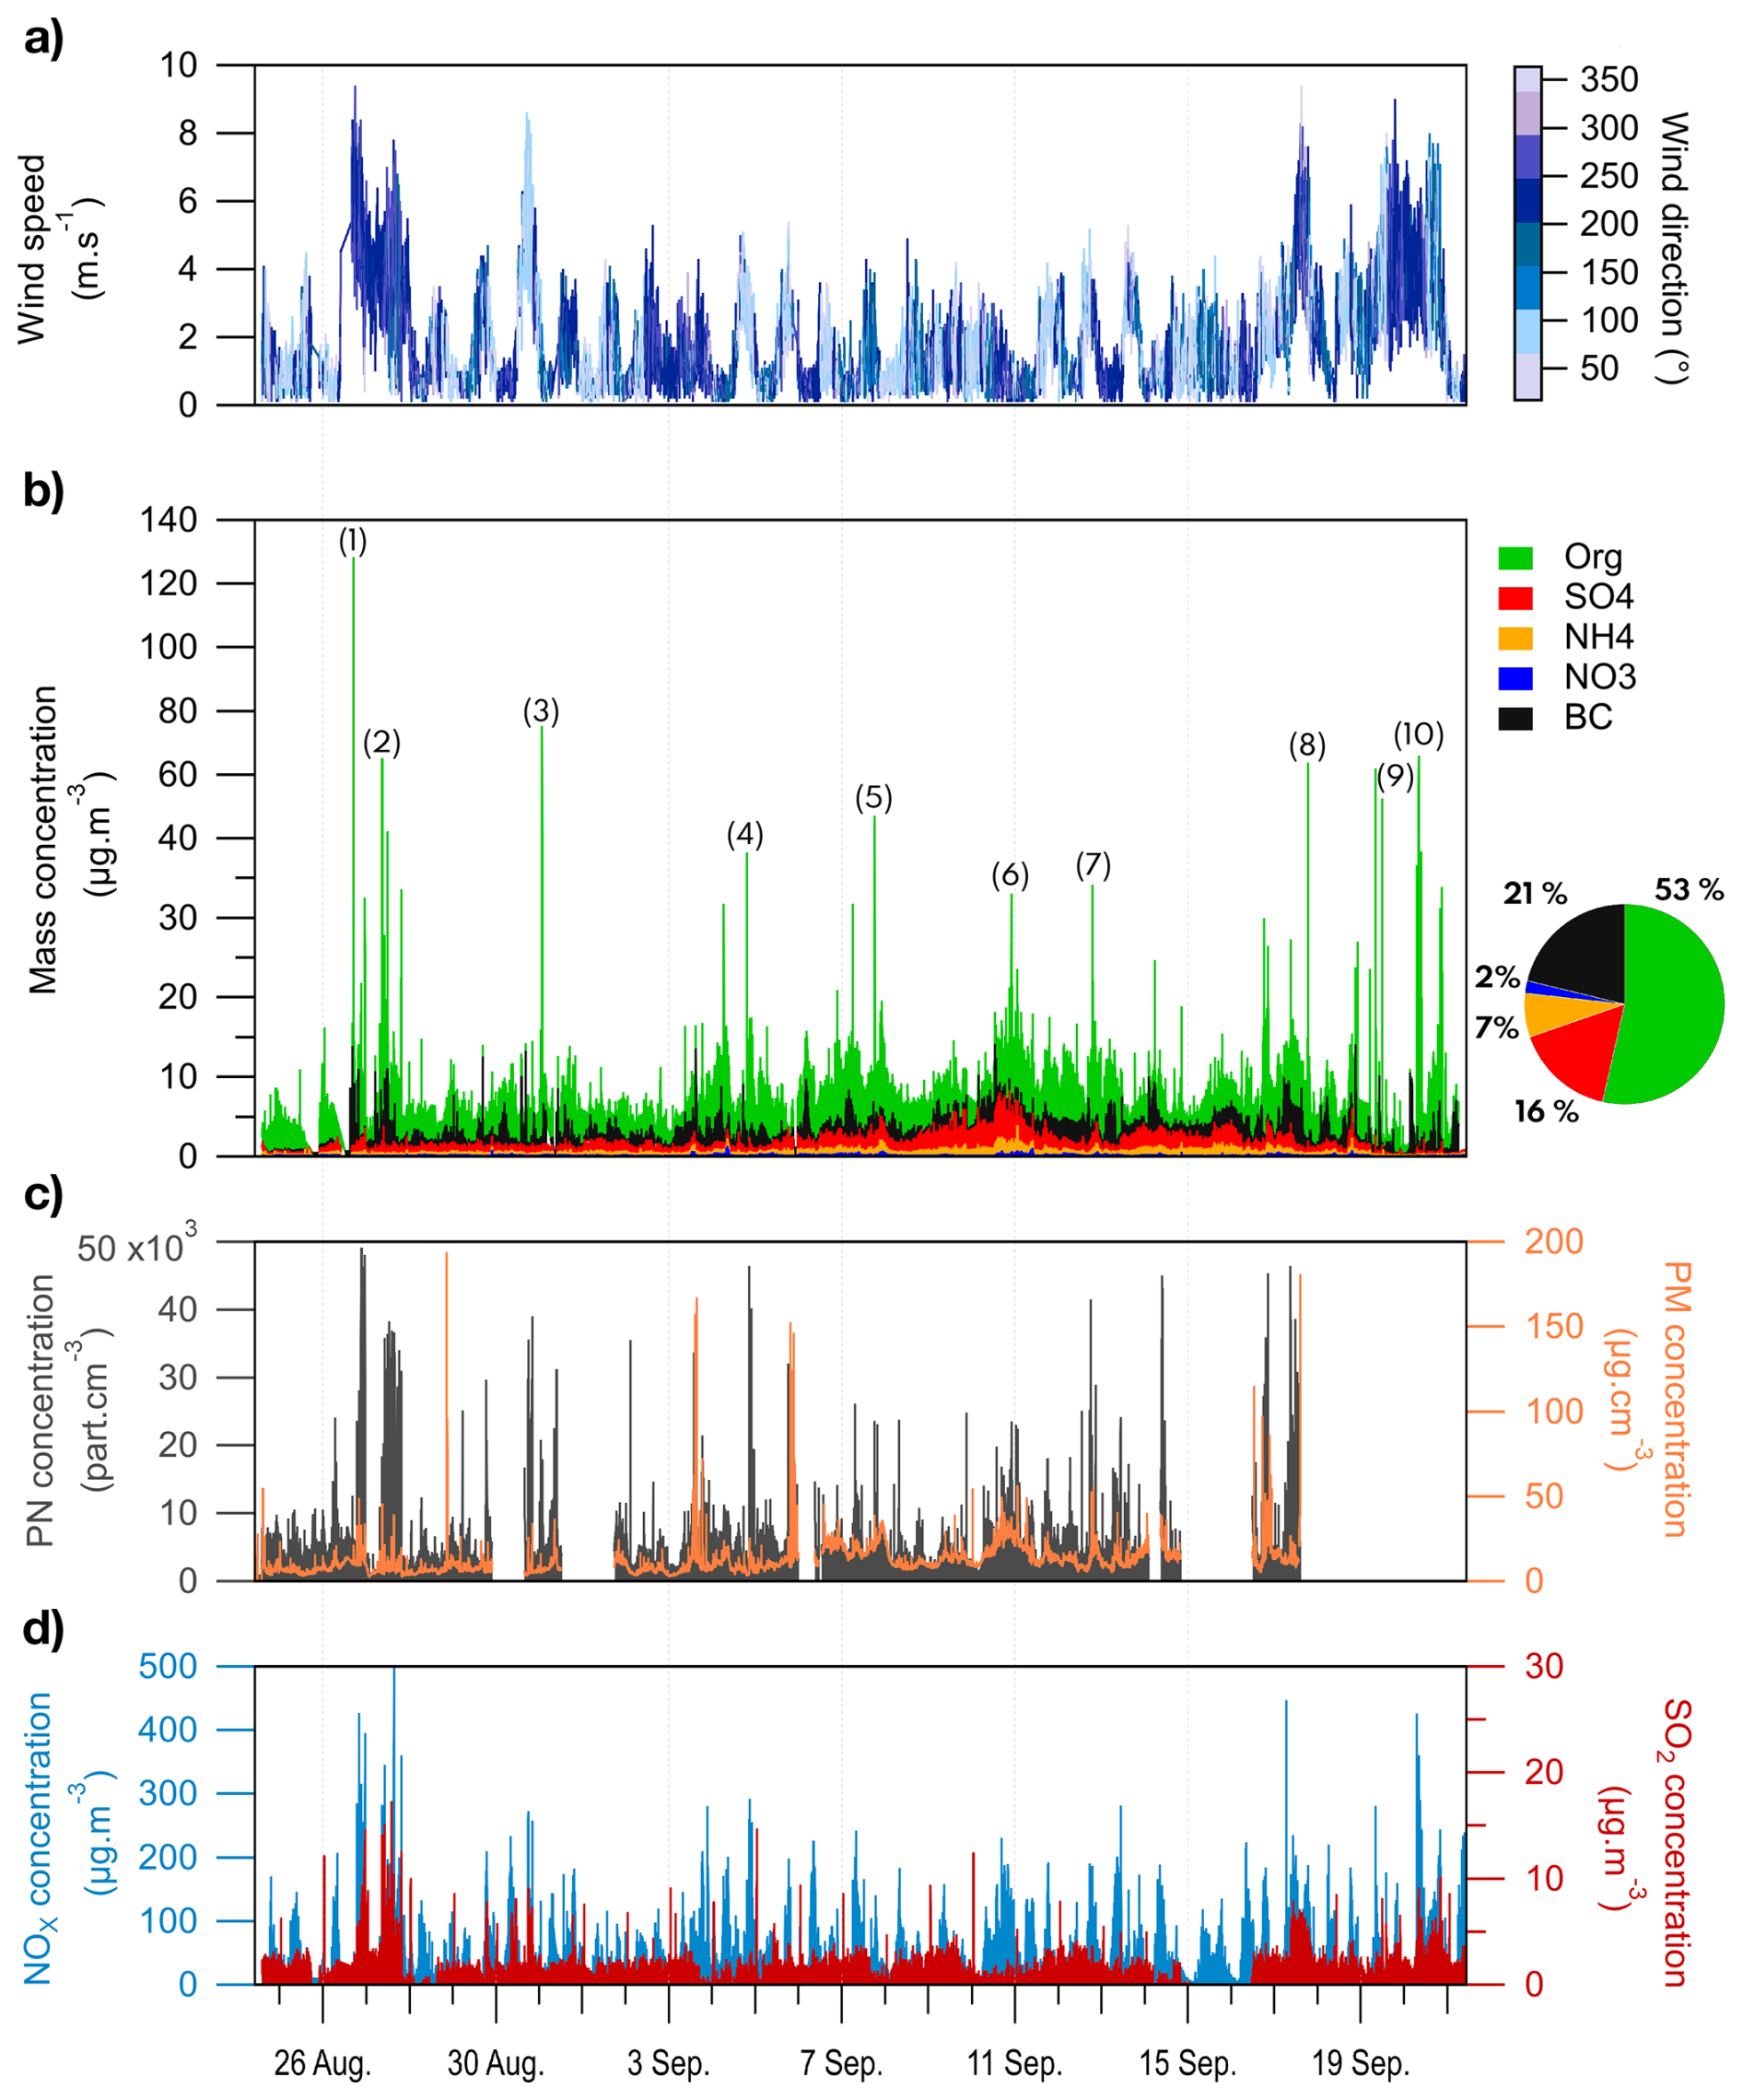
Figure 1Overview of meteorological parameters and pollutants: (a) wind speed and direction; (b) PM chemical composition (organics, nitrate, sulfate, ammonium and chloride) and BC concentrations; (c) particle number (PN) and mass (PM1) concentrations; (d) NOx and SO2 concentrations. Unit CE applied to HR-ToF-AMS data. Pie chart represents the median PM1 chemical composition. The numbers above the organic peaks indicate the ten most intense organic plumes discussed in Sect. 3.2.3. after applying a Middlebrook et al. (2012) collection efficiency correction.
Overall, shipping plumes were characterized by marked increases in PN, PM (Org, BC), and NOx, whereas sulfate remained primarily influenced by regional background levels. The diurnal profiles of the measured pollutants are shown in Fig. S4, where two distinct patterns can be observed. The first is linked to the change in breeze direction, where the onshore breeze leads to high concentrations of gas tracers such as CO, CO2, and CH4. In contrast, although to a lesser extent, SO2, particle (PN and PM), Org, and BC show higher levels during ship arrivals and departures, particularly between 07:00–09:00 a.m. and 06:00–09:00 p.m. LT, emphasizing the port's significant contribution to local pollution.
Table S1 in the Supplement provides a breakdown of vessel types and their respective proportions, with ferries constituting the majority of the fleet (78.5 %), followed by smaller shares of cruise ships, tankers, yachts, and other vessel categories, which together account for 17.1 %. The remaining 4.4 % of the vessels could not be identified.
3.2 Emission factors
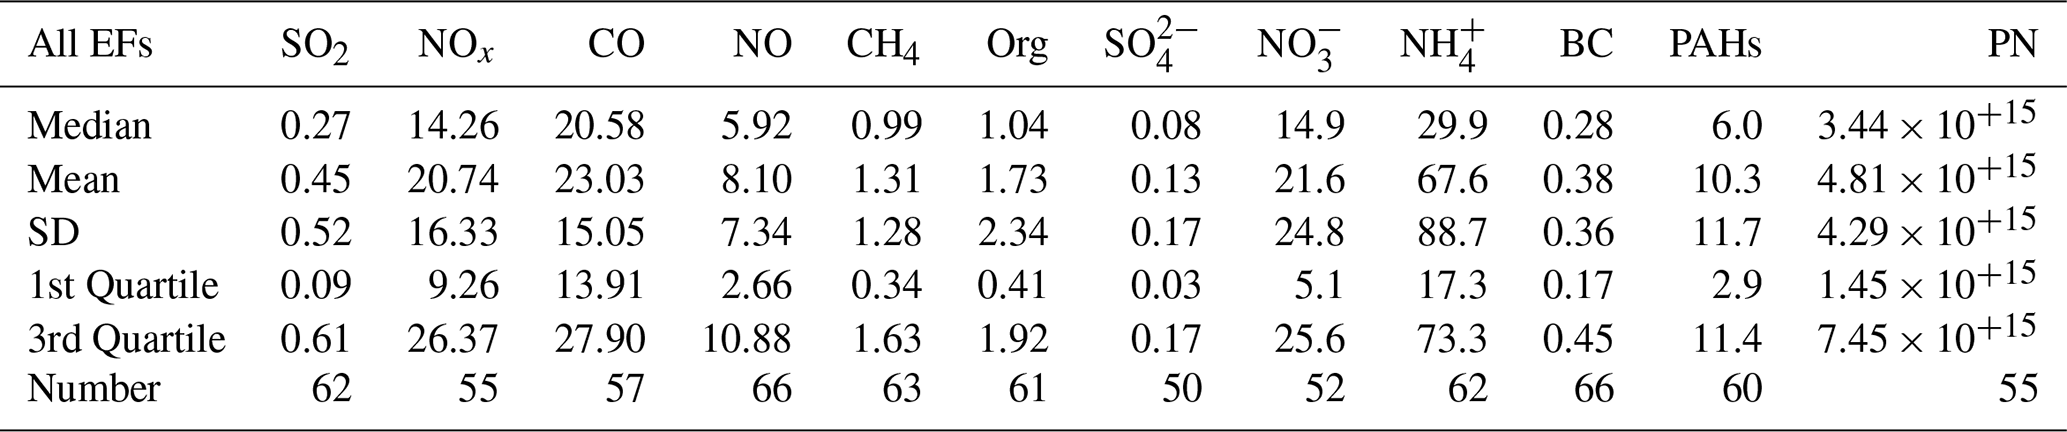
Out of 69 detected plumes, ferries contributed to 63 % (45 plumes), followed by cruise ships and yachts, each accounting for 6 % (4 plumes), while 25 % (18 plumes) were classified as “Unknown” due to insufficient identification. Some plumes were attributed to specific ferries, and ferries identified multiple times during arrivals and departures were labeled A, B, C, D, and E. The vessel characteristics (tier, number of engines, fuel types, tonnage) and the ferries EFs are listed in Tables S2 and S3. Figures 2 and 3 present the EFs for major gaseous pollutants (SO2, NOx, CO, and CH4), PN, and particulate chemical families (BC, Org, PAHs, and SO), respectively. The two figures additionally compare the different EFs across vessel types and operational modes. Table 2 provides the calculated EFs for all identified ship plumes of gaseous (SO2, NOx, CO, NO, CH4), particle chemical composition (Org, NO, NH, SO, BC, and PAHs), as well as PN concentrations. A compilation of literature emission factors used for comparison is provided in Table S5.
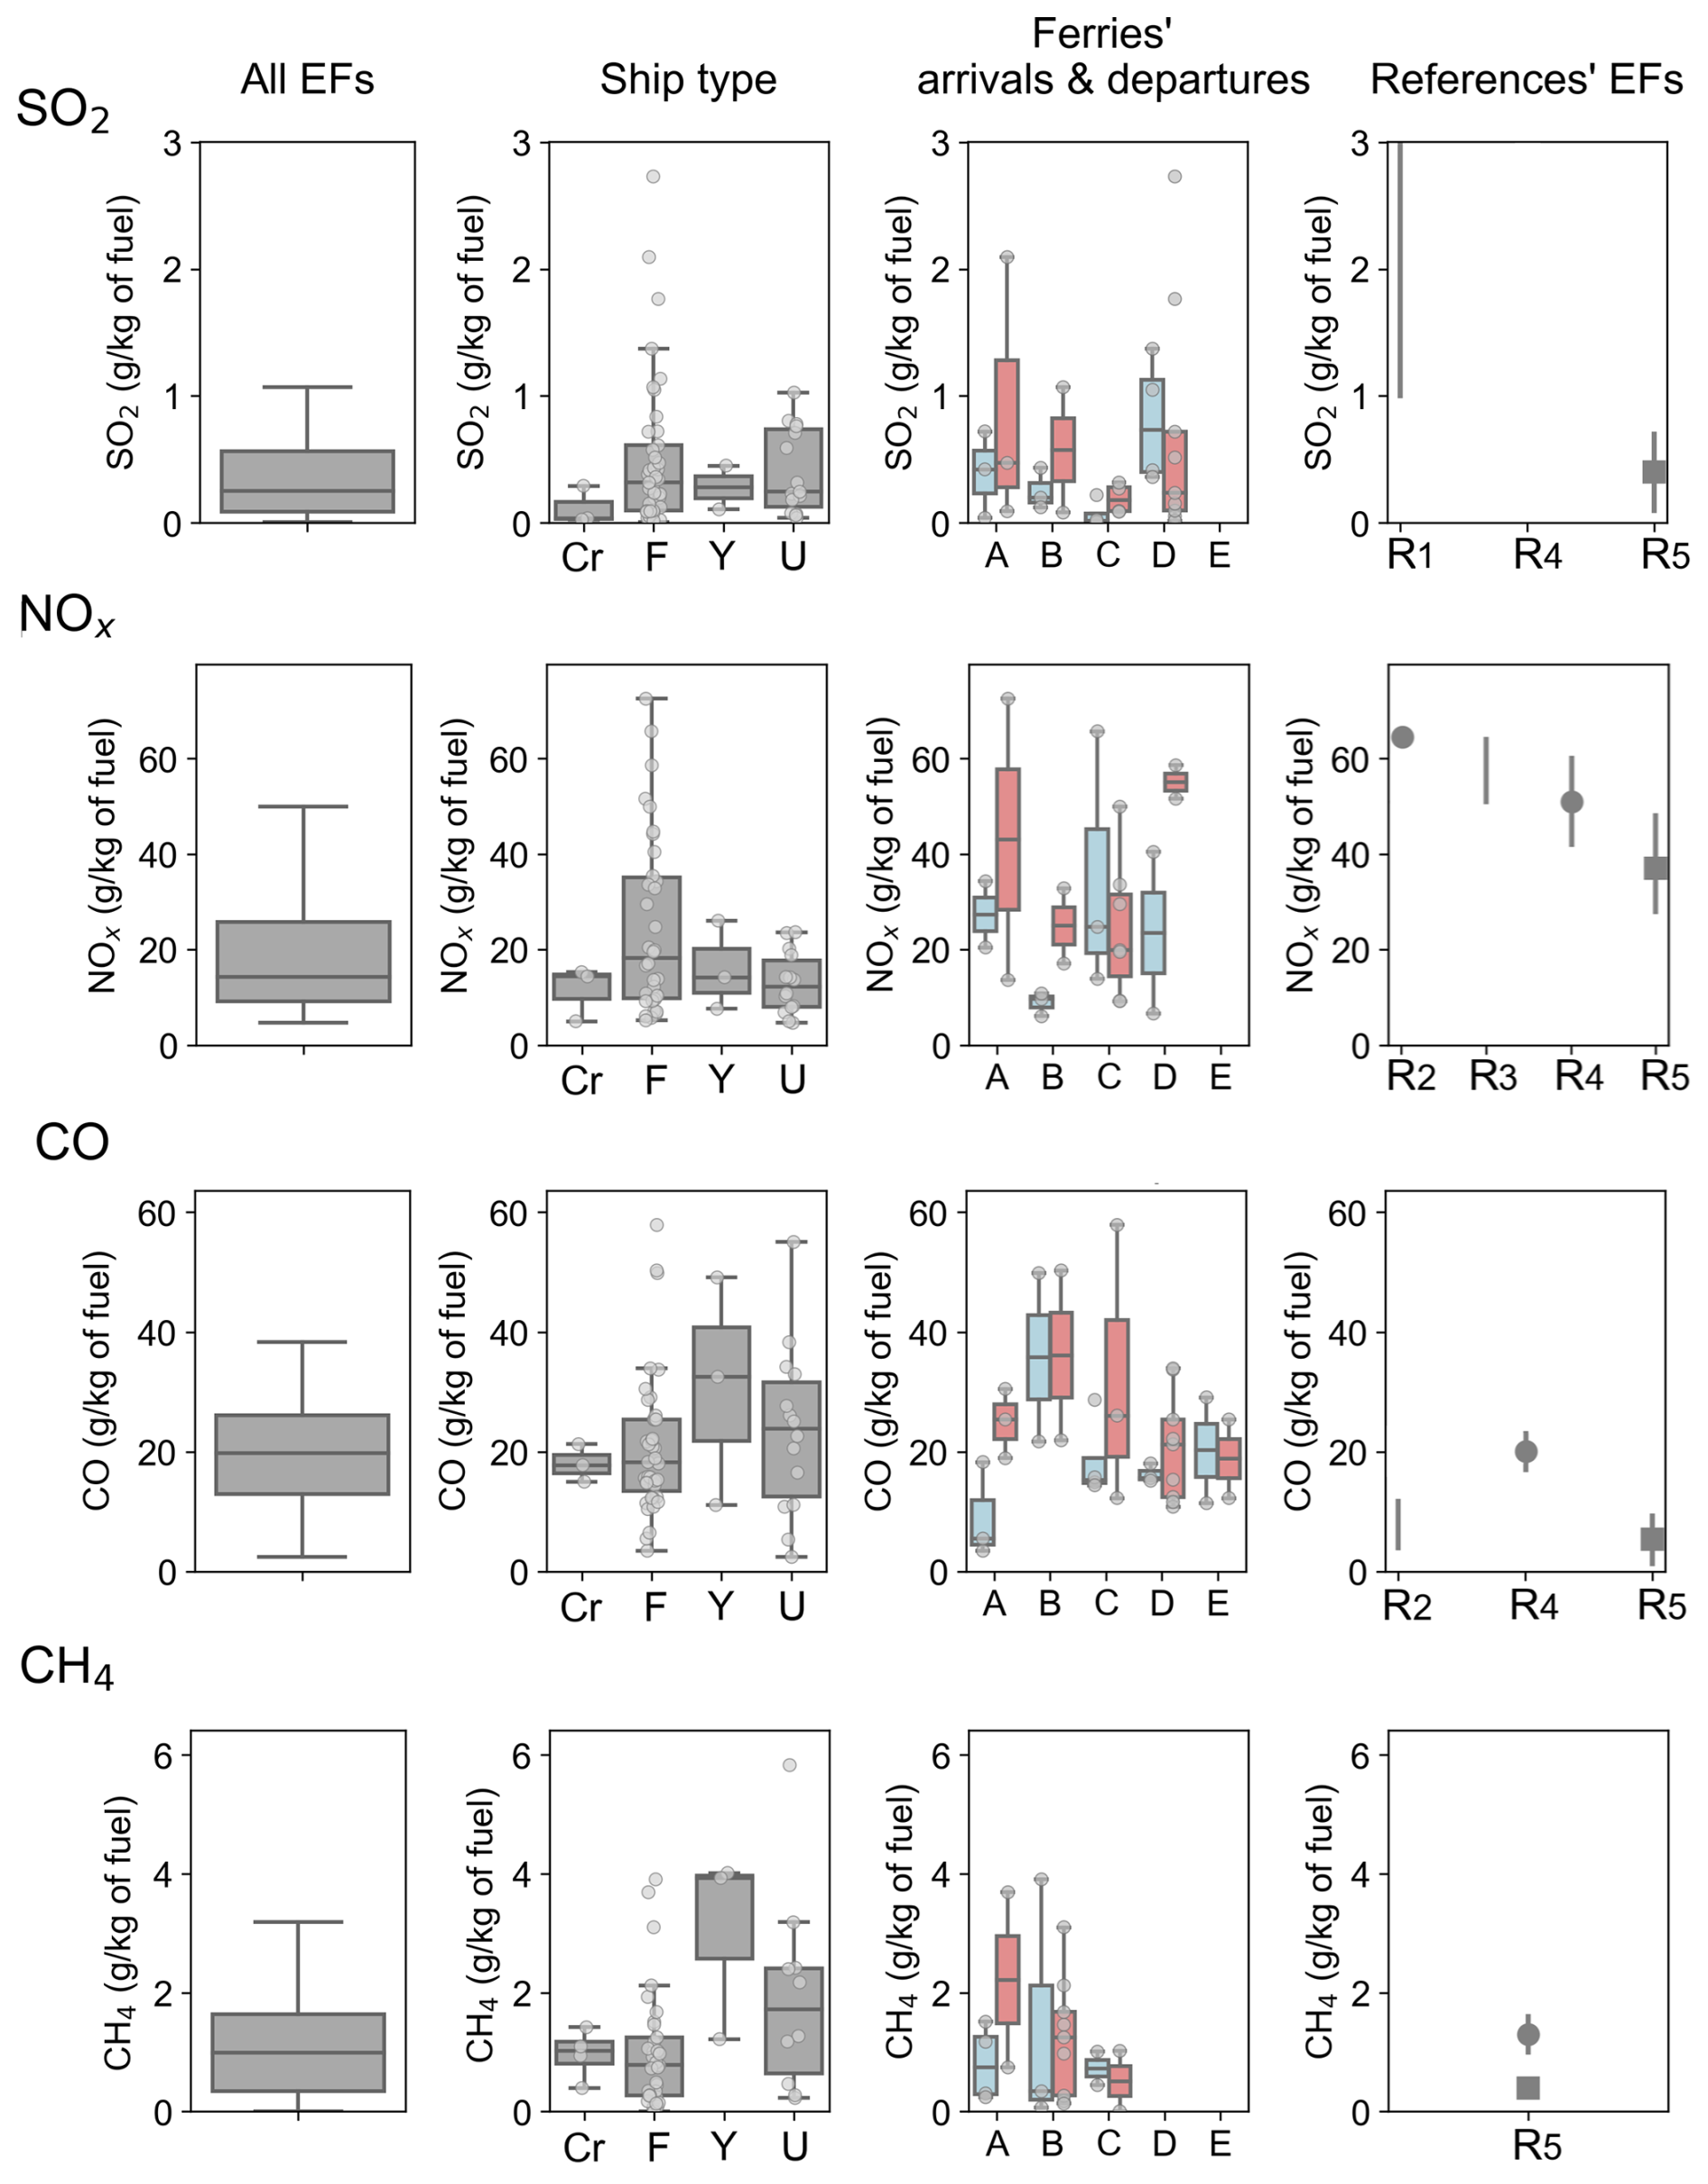
Figure 2Emission factors of major gaseous pollutants (gray dots) for all vessels and for specific categories (Cr, F, Y and U refer to cruise ships, ferries, yachts, and unknown, respectively). A, B, C, D, and E refer to specific ferries whose arrivals (light-blue colored) and departures (light-coral colored) are depicted. In reference EFs, squares represent medians while dots refer to mean EFs, with vertical lines representing standard deviation or first-to-third quartiles. R1, R2, R3, R4, and R5 correspond to Diesch et al. (2013), Betha et al. (2016), Winnes et al. (2016), Celik et al. (2020), and Le Berre et al. (2025), respectively.
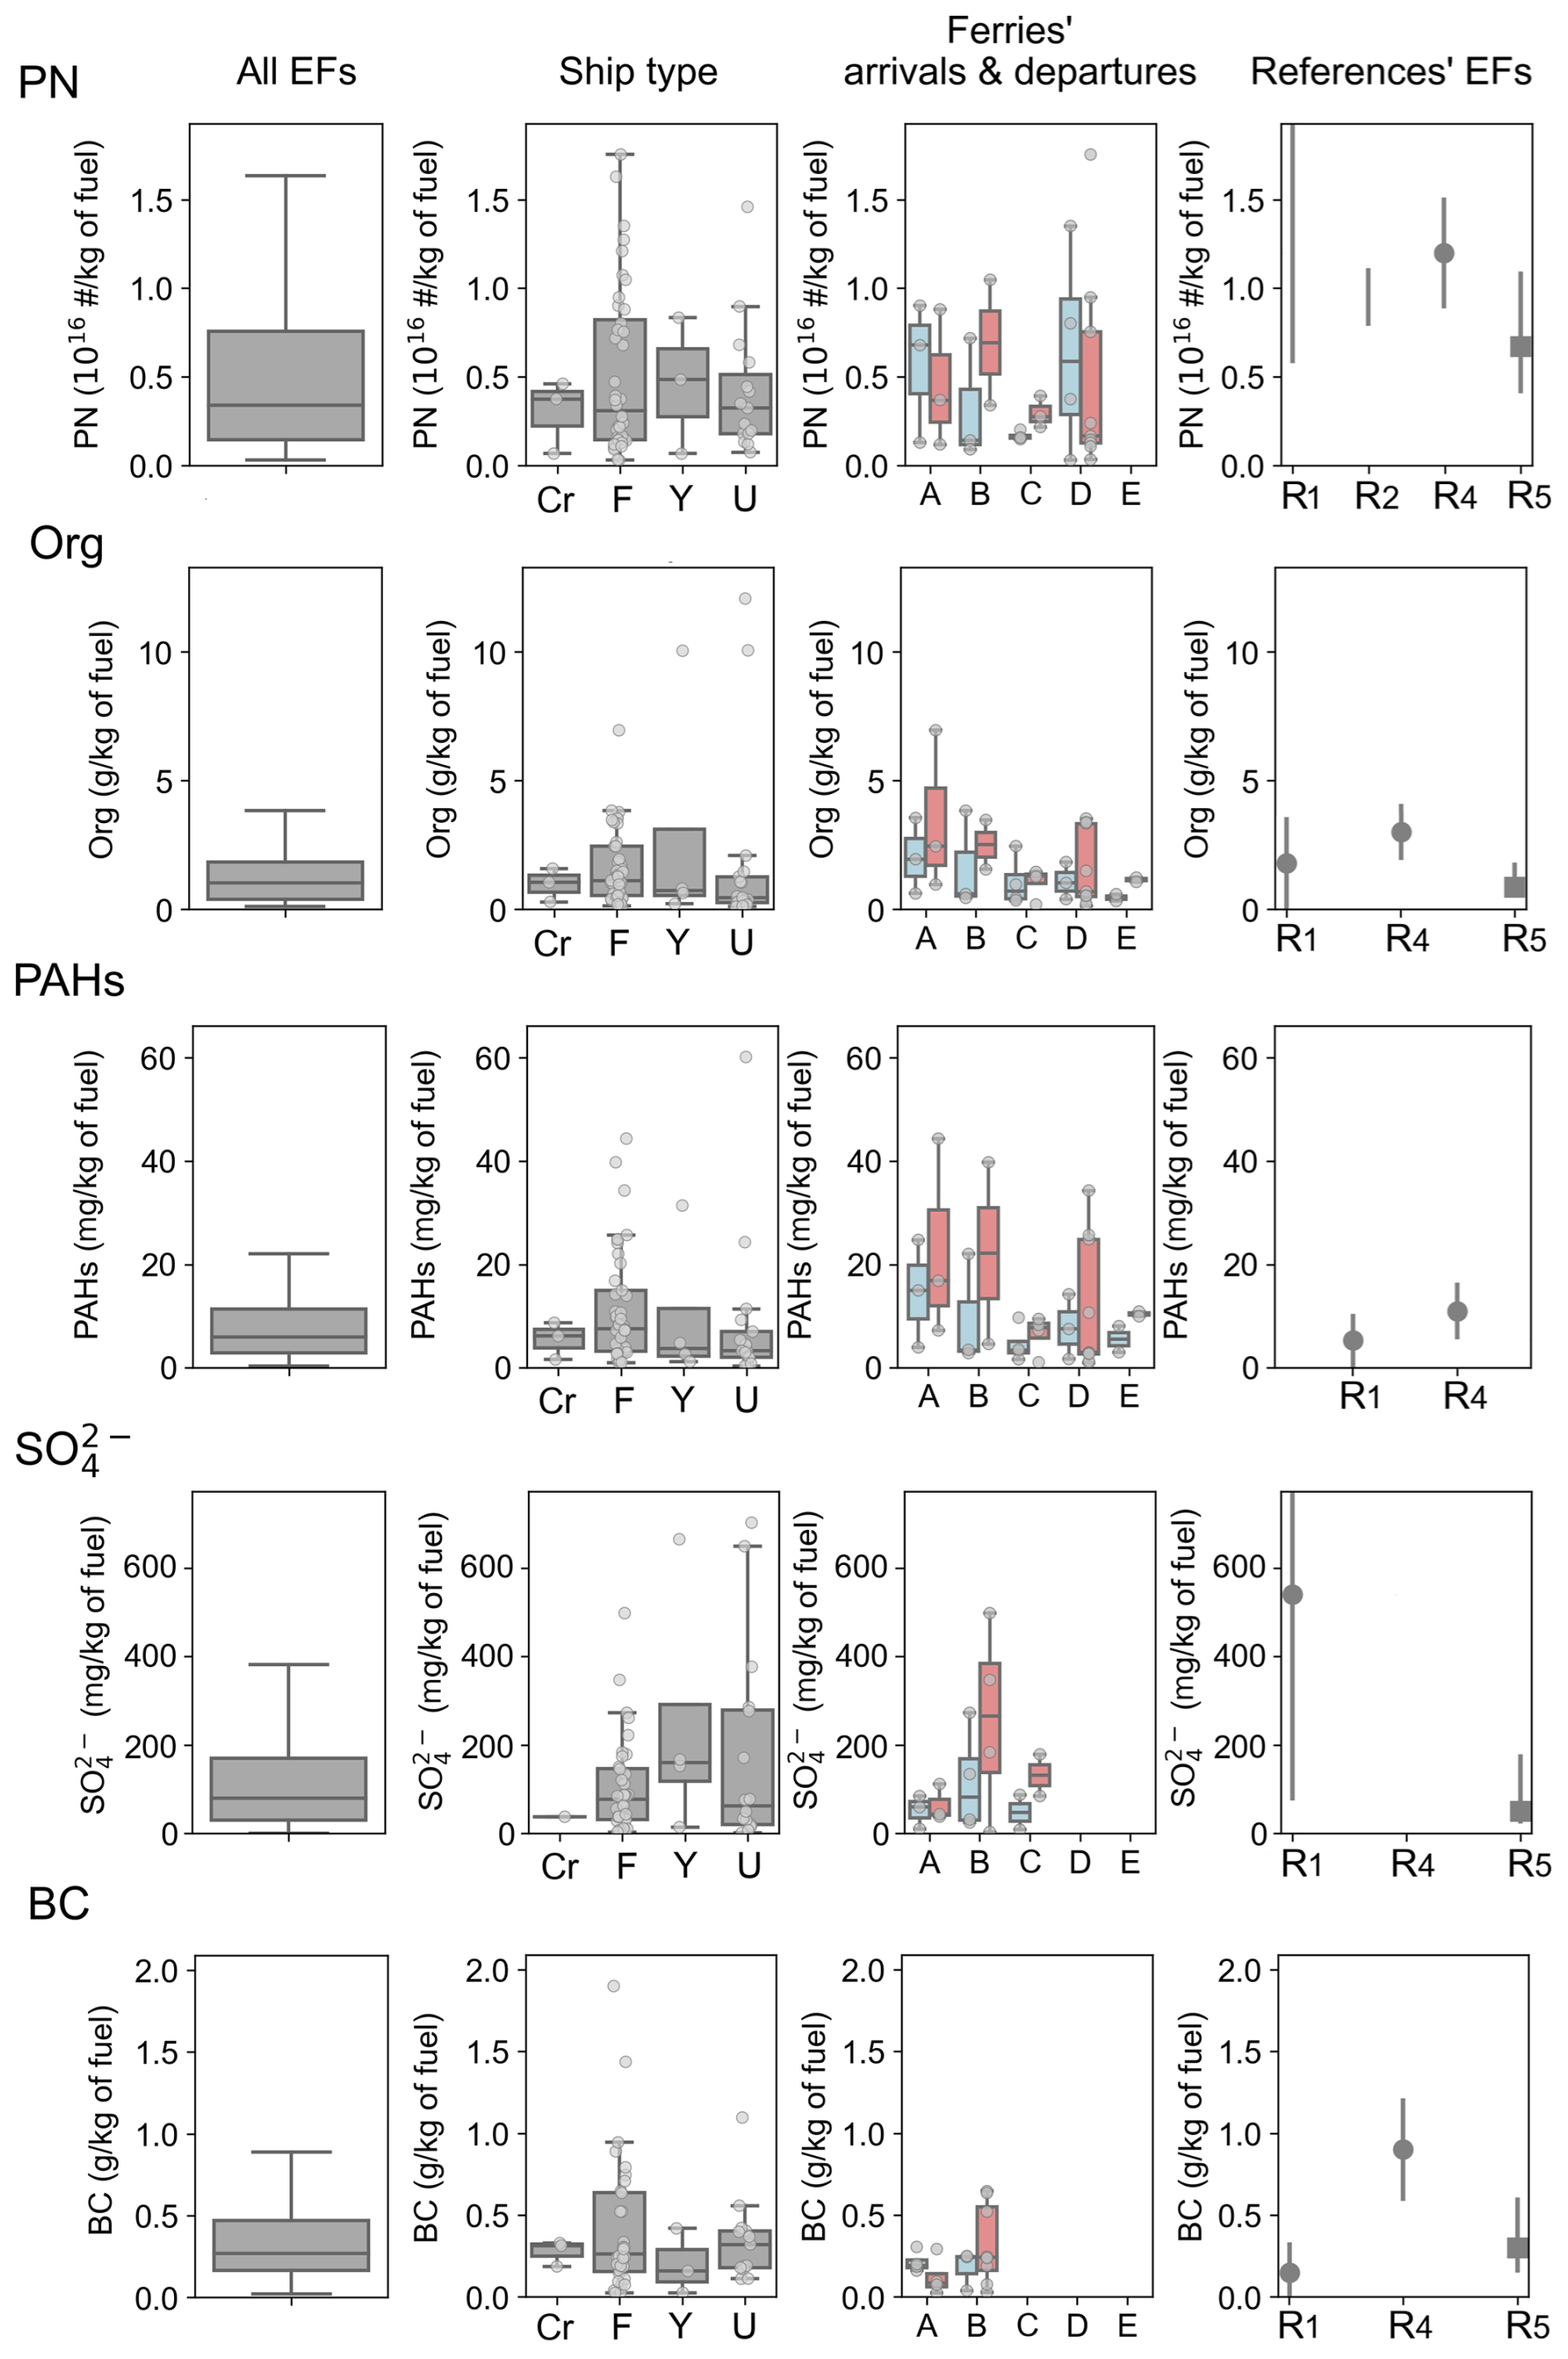
Figure 3Emission factors of particle number and major particulate pollutants (gray dots) for all vessels and for specific categories (Cr, F, Y and U refer to cruise ships, ferries, yachts, and unknown, respectively). A, B, C, D, and E refer to specific ferries whose arrivals (light-blue colored) and departures (light-coral colored) are depicted. In reference EFs, squares represent medians while dots refer to mean EFs, with vertical lines representing standard deviation or first-to-third quartiles. R1, R2, R3, R4, and R5 correspond to Diesch et al. (2013), Betha et al. (2016), Winnes et al. (2016), Celik et al. (2020), and Le Berre et al. (2025), respectively.
Table 2Emission factors of all identified ship plumes. SO2, NOx, CO, NO, CH4, Org, SO and BC in g kg. NO, NH and PAHs in mg kg, and PN in particles kg.
3.2.1 Sulfur Dioxide
During the campaign, the mean FSC of ship fuels was 0.03 %, well below the IMO2020 requirements of 0.5 %. The mean SO2 EF is 0.45 ± 0.52 g kg, significantly lower than most reported values prior to the implementation of the IMO2020 regulation. This value is nearly 50 times lower than reports from Celik et al. (2020) in the Mediterranean Sea and around the Arabian Peninsula (26 ± 6 g kg), 17 times lower than those published by Diesch et al. (2013) in the Elbe River in Northern Germany (7.7 ± 6.7 g kg), and 6 times lower than measurements from a MDO-fueled tanker with 0.1 % sulfur content (2.9 ± 0.2 g kg) (Sinha et al., 2003). Nevertheless, the SO2 EF observed in Toulon is comparable to recent values reported after the implementation of the IMO2020-regulation, such as 0.4 g kg in Marseille (Le Berre et al., 2025), and 1.5 g kg on an MGO-powered ferry (Timonen et al., 2022).
The mean SO2 EF is lower for cruise ships, 0.13 g kg, likely due to the use of after-treatment systems, as indicated on cruise line websites. The yachts have engines designed to run on ultra-low sulfur diesel (ULSD), in agreement with a mean SO2 EF of 0.28 g kg. Examining the arrivals and departures of ferries reveals a high variability in EFs across the different vessels. Notably, ferry C exhibits significantly lower emissions compared to the other ferries, possibly due to its less powerful auxiliary engines (3 × 1680 kW; see Table S3), while ferries A, B, and D have more powerful auxiliary engines (more than 6000 kW) and exhibit the highest EFs. The median SO2 EFs exhibited a moderate correlation with auxiliary engine power across maneuvering (R2 = 0.35). This relationship was stronger during departures (R2 = 0.60) and weaker during arrivals (R2 = 0.15). During departure, an increase of 1000 kW in auxiliary engine power was associated with an average rise of approximately 0.15 g kg in SO2 EF. Correlations with main and total engine power were somehow weaker (R2 < 0.4) suggesting that auxiliary engines are the primary contributors to SO2 emissions during maneuvering phases. Regression statistics for arrivals, departures, and combined maneuvers are summarized in Table S4, and the corresponding relationships are illustrated in Fig. S6.
The recently calculated SO2 EFs in Toulon and Marseille are approximately half the value reported in the regional inventory (2 g kg). This discrepancy highlights the importance of continuous monitoring to refine regional inventories in response to regulatory updates and evolution of the fleet characteristics.
3.2.2 Nitrogen oxides
The mean NOx EF is 20.7 ± 16.3 g kg, representing a reduction of approximately 44 %–68 % compared to values documented by Le Berre et al. (2025) (median 37 g kg), Celik et al. (2020) (mean 51 g kg), Betha et al. (2016) (51–64 g kg for ULSD), and Winnes et al. (2016) (64.5 g kg for MGO). This decrease likely reflects a combination of factors, including engine optimization, engine loads, and operational practices (Sugrue et al., 2022; Grigoriadis et al., 2021; Peng et al., 2020). The NOx EFs from ferries exhibited significant variability, ranging from 5.2 to 72.5 g kg (mean 25 g kg), consistent with the findings of Zhang et al. (2024), who reported median values of 22.3 g kg for auxiliary engines at 50 % load during ferry maneuvers. During these maneuvers (arrivals and departures), ferries rely more frequently on auxiliary engines, leading to elevated NOx emissions – particularly during departures, when cold engines result in less efficient combustion. Only ferry C presented an outlier of 60 g kg during an arrival, likely due to its lower auxiliary power (3 × 1680 kW) and specific conditions such as lower engine load. Cruise ships exhibit the lowest mean EF (15.3 g kg), likely due to the use of catalytic converters. The current regional inventory of NOx from shipping reports an average of 80.0 g kg, highlighting, similarly to SO2, the need for updated measurements.
3.2.3 Carbon monoxide
The mean CO EF was 23 ± 15.1 g kg, consistent with a previously reported value of 20 ± 3 g kg (Celik et al., 2020), and representative of typical emissions from ship engines using fuels such as low-sulfur HFO (LSHFO), very low-sulfur fuel oil (VLSFO), MGO, and MDO. However, this value is approximately four times higher than the median EF of 5.4 g kg reported in Marseille by Le Berre et al. (2025), and three times higher than regional inventories (7.5 g kg). This discrepancy likely stems from operational conditions, such as low-speed maneuvering. Low engine loads can increase CO emissions, as reported by Bai et al. (2020). The EFs of CO vary from 2.43 to 57.87 g kg (median 20.6 g kg), underscoring the strong influence of engine start-up and auxiliary engine use during port operations on CO emissions due to possible incomplete combustion. Excluding outliers – such as the lowest value of 2.43 g kg for ferry A and the highest value of 57.87 g kg for ferry C – the CO EFs show minimal differences between arrivals and departures, suggesting stable combustion under typical operating conditions. Nonetheless, engine design (Tier I for D; Tier II for A, B, C, and E) and fuel type (LSHFO, VLSFO, MGO, MDO) also contribute to the observed variability.
3.2.4 Methane
The median CH4 EF of 1.0 ± 1.3 g kg is slightly higher than the median value of 0.4 g kg reported from Marseille in 2021 (Le Berre et al., 2025) but similar to the median value of 0.99 g kg reported by Volent et al. (2026). This EF is considerably higher than other studies with EFs of 0.02 g kg (Cooper, 2003) and 0.05 g kg (Timonen et al., 2022). None of the identified ships were LNG-fueled, but the yachts exhibited the highest CH4 EFs, with values up to 3.9 g kg. Methane emissions arise from the incomplete combustion of hydrocarbons in fuels and depend on fuel composition, engine design, and possible slip of unburned fuel occurring at low speed or idle in untuned engines (Penman et al., 2001). Inadequately tuned engines, such as those on yachts, tend to emit much more methane, in line with a reported EF of 5.2 g kg for small vessels (Wang et al., 2022).
3.2.5 Particle number
The mean EF of PN (Fig. 3), measured with a CPC, is approximately 4.8 ± 4.3 × 10¹⁵ particles kg, a value slightly lower than those found in the literature. This EF is consistent with previous reports for vessels using low-sulfur fuels by Betha et al. (2016) (8.0 × 10¹⁵ to 1.1 × 10¹⁶ particles kg) and Le Berre et al. (2025) (median 6.7 × 10¹⁵ particles kg), possibly reflecting a decrease in particle formation due to reduced sulfur fuel content. The highest PN EF of 1.63 × 10¹⁶ particles kg is observed during ferry departures. However, no significant difference is found between arrivals and departures for the same vessel, suggesting stable particle emissions under different operational conditions, although engine design and fuel quality play a critical role.
3.2.6 Black carbon
The mean BC EF is 0.38 ± 0.36 g kg, consistent with reported BC EFs of 0.48 g kg for maneuvering ships in Marseille in 2021 (Le Berre et al., 2025) and for cargo vessels (Huang et al., 2018), reflecting typical emissions from diesel marine engines using low-sulfur fuels. The BC EFs exhibit a broad range of values (0.03 to 1.90 g kg), primarily due to a few isolated plumes characterized by unusually high values. These outliers are likely linked to transient conditions such as low engine load or incomplete combustion, rather than systematic differences among ship types or vessel sizes. When excluding these extreme points, the interquartile range (0.09–0.42 g kg) suggests that most of the plumes fall within a relatively consistent range across vessels under typical operating conditions. BC formation is primarily driven by engine load and the combustion regime (lean or rich) (Le Berre et al., 2025; Mueller et al., 2023). Consequently, this pollutant remains of major interest due to its significant contribution to air pollution, climate, and possible adverse health effects.
3.2.7 Organic fraction and polycyclic aromatic hydrocarbons
The mean and median Org EFs are 1.73 ± 2.34 and 1.04 g kg, respectively, in good agreement with literature values reported by Le Berre et al. (2025) (median 0.86 g kg), Celik et al. (2020) (mean 3.0 g kg), and Diesch et al. (2013) (mean 1.8 g kg). The EFs range from 0.13 to 12.1 g kg; this variability can be explained by differences in engine type, fuel quality, and operational conditions, particularly for ferries. The Org EFs are generally higher during departures than arrivals for all identified ferries. The highest values are observed for ferries A, B, and D, characterized by powerful auxiliary engines (more than 6000 kW combined for each ferry). However, no significant correlation was found between Org EFs and auxiliary, main, or total engine power (R2 < 0.20), indicating that fuel composition, combustion efficiency, and transient operating conditions exert a stronger influence than engine size. Regression statistics for arrivals, departures, and combined maneuvers are summarized in Table S4, and the corresponding relationships are illustrated in Fig. S6.
The EF of PAHs, corresponding to the sum of all PAH families defined by Herring et al. (2015), exhibits a mean value of 10.3 ± 11.7 mg kg, aligning closely with reported mean values of 11 mg kg (Celik et al., 2020) and 5.3 mg kg (Diesch et al., 2013). Similar to Org EFs, PAH EFs are generally higher during departures than arrivals, with peaks reaching 60 mg kg (e.g., for ferries with higher engine loads). This pattern underscores the impact of operational practices such as cold engines, low-speed operations, and fuel switching.
3.2.8 Sulfate
The mean EF for SO is 0.13 ± 0.17 g kg, approximately 4–30 times lower than the SO EF values reported by Diesch et al. (2013) and Celik et al. (2020), but consistent with a more recent study that found a median SO EF of 0.05 g kg (Le Berre et al., 2025), and reflects the impact of reduced sulfur content in marine fuels. Similar to the trends of Org and SO2 EFs, SO EFs are generally higher during departures than arrivals for all identified ferries, with values ranging from 0.003 to 0.65 g kg, likely due to increased engine loads and use of auxiliary engines while maneuvering. This variability underscores the strong influence of operational practices on sulfate emissions and highlights the need for further investigation into engine design and fuel management strategies to maintain low SO emission levels.
3.2.9 Key insights and implications
The analysis of emissions as a function of the operational phase shows that several pollutants, such as sulfates, organics, PAHs, and NOx exhibit higher levels during departures, reflecting the impact of cold engines and low engine loads causing incomplete combustion. Most of the identified ferries operate on marine diesel oil (MDO), marine gas oil (MGO), or low-sulfur fuels (LSHFO or VLSFO), complying with sulfur limits (below 0.5 % for LSHFO/VLSFO and < 0.01 % for MDO/MGO). Fuel regulation after 2020 and dual-fuel usage significantly influenced EFs. Only cruise ships equipped with scrubbers were associated with lower SO2, NOx, and SO EFs. Among PM1 chemical components, organics represented the dominant contribution, particularly during departures. Unlike sulfur-related emissions (SO2, SO), which have significantly decreased following IMO 2020 regulations due to the adoption of low-sulfur fuels, organic EFs have remained comparable to pre-regulation levels (Celik et al., 2020; Diesch et al., 2013). This persistence highlights the pertinence of positive matrix factorization (PMF) analysis of the organic fraction to better assess the impact of shipping on air quality in coastal cities.
3.3 PMF optimization
3.3.1 Input matrix and error weighting
The PMF model was populated with organic aerosol data from the HR-ToF-AMS, covering 290 ions with ratios ranging from 12 to 256 (including 218 compounds between 12 and 150, and 72 PAHs from alkylated PAHs (APAHs), unsubstituted (non-functionalized) PAHs (UnSubPAHs), and oxygenated PAHs (OPAHs) families). For the sake of readability, ion masses presented here have been rounded to the nearest nominal mass. The complete list of values and associated ions is provided in Table S6. The selected PAHs included both the parent ion [M]+ and the associated [M–H]+ ion, following the identification approach described by Herring et al. (2015) and Dzepina et al. (2007).
The dataset comprised 37 562 time points with a 1 min time step, enabling the distinction of short-lived organic peaks associated with ship emissions, which typically persist for only a few minutes. Historically, the HR-ToF-AMS two-dimensional matrix is exported by the Pika software with unit CE and does not apply RIE corrections; therefore, the CE corrections were applied to the PMF results afterward. Ancillary instruments were used to assess correlations among measured species and PMF factors, in order to identify distinct pollution sources.
The error matrix was down-weighted using a cell-wise signal-to-noise ratio (Brown et al., 2015), calculated at each time step to account for the short-lived nature of ship plumes, which are typically sampled for only a few minutes. Variables derived from 44 (CO) were excluded from the PMF analysis ( 16, 17, 18, and 28) and reintroduced during post-processing.
As shown in Fig. 1, organic peaks were rarely associated with sulfate enhancement, as the latter appeared to be mainly influenced by background levels. To test this hypothesis, a preliminary PMF analysis was conducted including nine sulfur-containing ion fragments (SO+, SO, HSO, SO, HSO, H2SO, SO, HSO, and H2SO) into the input matrix. Five unconstrained PMF runs were conducted, testing solutions ranging from five to nine factors, to assess whether any factors were associated with sulfate fragments.
Contrary to the findings of Fossum et al. (2024) at Dublin Port, the model did not identify any sulfate-rich ship factor. In the nine-factor solution, 96 % of the sulfate signal was associated with secondary factors (displayed in Fig. S7). As a result, sulfate was not further considered in the PMF analysis.
3.3.2 PMF constraints
To better identify the optimal mass spectral combinations representing shipping emission sources, we developed a method based on the combination of mass spectra of the highest organic peaks associated with ships (as numbered in Fig. 1). We then used a multi-linear regression model to evaluate how well these combinations could reconstruct the measured mass spectra through linear combination. The model performance was evaluated using two metrics: Pearson R2 score, which quantifies the proportion of variance explained, and the theta angle, which measures the angular deviation (in degrees) between the measured and predicted mass spectra. Combinations were considered optimal when they achieved an R2 score of at least 0.95 and an angular distance of 5° or less.
As shipping-related mass spectra were selected based on the most intense ship plumes, the influence of background noise was minimized. A combination of three specific mass spectra provided the best overall fit, with an average R2 of 0.99, and an average angular distance of 1.20°. Consequently, these three mass spectra were selected as constraints for shipping emissions in the PMF analysis (Fig. S8).
Two additional constraints were applied: a HOA mass spectrum from Hayes et al. (2013), measured using an HR-ToF-AMS in Pasadena in 2010, and a COA mass spectrum from Elser et al. (2016), measured in China using an HR-ToF-AMS. There was no significant difference between the HOA mass spectrum measured in Pasadena in 2010, and other mass spectra measured in Europe more recently (theta angle greater than 0.93 during a campaign conducted in the center of Rome in spring 2014; Struckmeier et al., 2016). The mass spectrum from Hayes et al. (2013) was selected because it included PAH ions used in our PMF analysis. In total, five mass spectra were used to constrain the PMF analysis, corresponding to the three ship mass spectra, named Shipping 1, Shipping 2, and Shipping 3, as well as one HOA and one COA.
The full list of constrained factors and related ions used in the PMF analysis is provided in Table S6.
3.3.3 Number of factors
A common approach for determining the optimal number of factors n in PMF analysis is to examine the variation in the ratio and select the solution that exhibits the most pronounced change compared to the run with n−1 factors. A significant change in ratio indicates a substantial decrease in residuals and improves the explained variability of the model. To determine the appropriate number of factors, five runs were conducted with factor numbers ranging from 6 to 10, using the aforementioned constraints. The resulting values for solutions with six, seven, eight, nine, and ten factors were 1.92, 1.33, 1.20, 1.14, and 1.09, respectively. An eight-factor solution was considered the best PMF solution.
3.3.4 Sensitivity analysis of the a-values
The a-value represents the relative uncertainty applied to a constrained factor in the PMF model, defining the allowed variability of a given profile compared to its reference. A range of 0–0.5 is typically used to avoid overconstraining the solution (Canonaco et al., 2013). In this work, a-values between 0 and 1 were tested for HOA and COA to allow greater flexibility for factors not directly identified on-site, whereas a narrower range of 0–0.3 was applied to shipping-related factors empirically derived from isolated ship-plume spectra to preserve their chemical representativeness.
A sensitivity analysis was conducted by scanning possible a-values for all constrained factors. For the three shipping constraints, a-values ranging from 0 to 0.3, with a step of 0.1, were examined (Drosatou et al., 2019; Chen et al., 2022). The selected a-value of 0.2 allowed the recovery of the most intense and frequent plumes observed.
Since HOA and COA sources tended to mix, a sensitivity analysis was carried out with a-values ranging from 0 to 1, with a step of 0.1 (Wang et al., 2024; Chazeau et al., 2022; Bozzetti et al., 2017; Elser et al., 2016), yielding 121 different a-value combinations. These combinations were evaluated based on the identification of road transport plumes, specifically between 08:00 and 09:00 a.m. LT, and between 12:00 and 01:00 p.m. LT, using correlations with external tracers such as BC, NOx, and CO. The final solution, with a-values of 0.3 for both mass spectra, was retained.
3.3.5 Residuals and factor uncertainties
Rotational ambiguity was assessed using a bootstrap approach (Efron, 1979). Bootstraps randomly resampled time points from the input matrix to generate new matrices, which were then subjected to PMF analysis using the selected constraints. A total of 100 bootstrap runs were performed to estimate the uncertainty associated with the PMF solutions.
The residuals of the bootstrap-averaged solution were examined to identify any significant deviations from the mean, which could indicate systematic model overestimation or underestimation. Scaled residual values typically ranging between -3 and 3 confirm the validity of the PMF (Canonaco et al., 2021; Paatero and Hopke, 2003). In our case, only 1.7 % of residuals fell outside this interval (Fig. S9). Typically, the uncertainties for each factor are defined as the center of the lognormal distribution of variability across time points (Canonaco et al., 2021; Tobler et al., 2021) for the 100 bootstrap runs. Figure S10 depicts the log-probability density function used to estimate factor uncertainties. These uncertainties were 2.2 %, 2.2 %, 0.8 %, 1.8 %, 1.6 %, 1.3 %, 0.3 %, and 1.1 % for the Shipping 1, Shipping 2, Shipping 3, HOA, COA, OxHOA, MOOA (More Oxidized Organic Aerosol), and LOOA (Less Oxidized Organic Aerosol) factors, respectively.
3.4 Interpretation of PMF solutions
3.4.1 Shipping factors
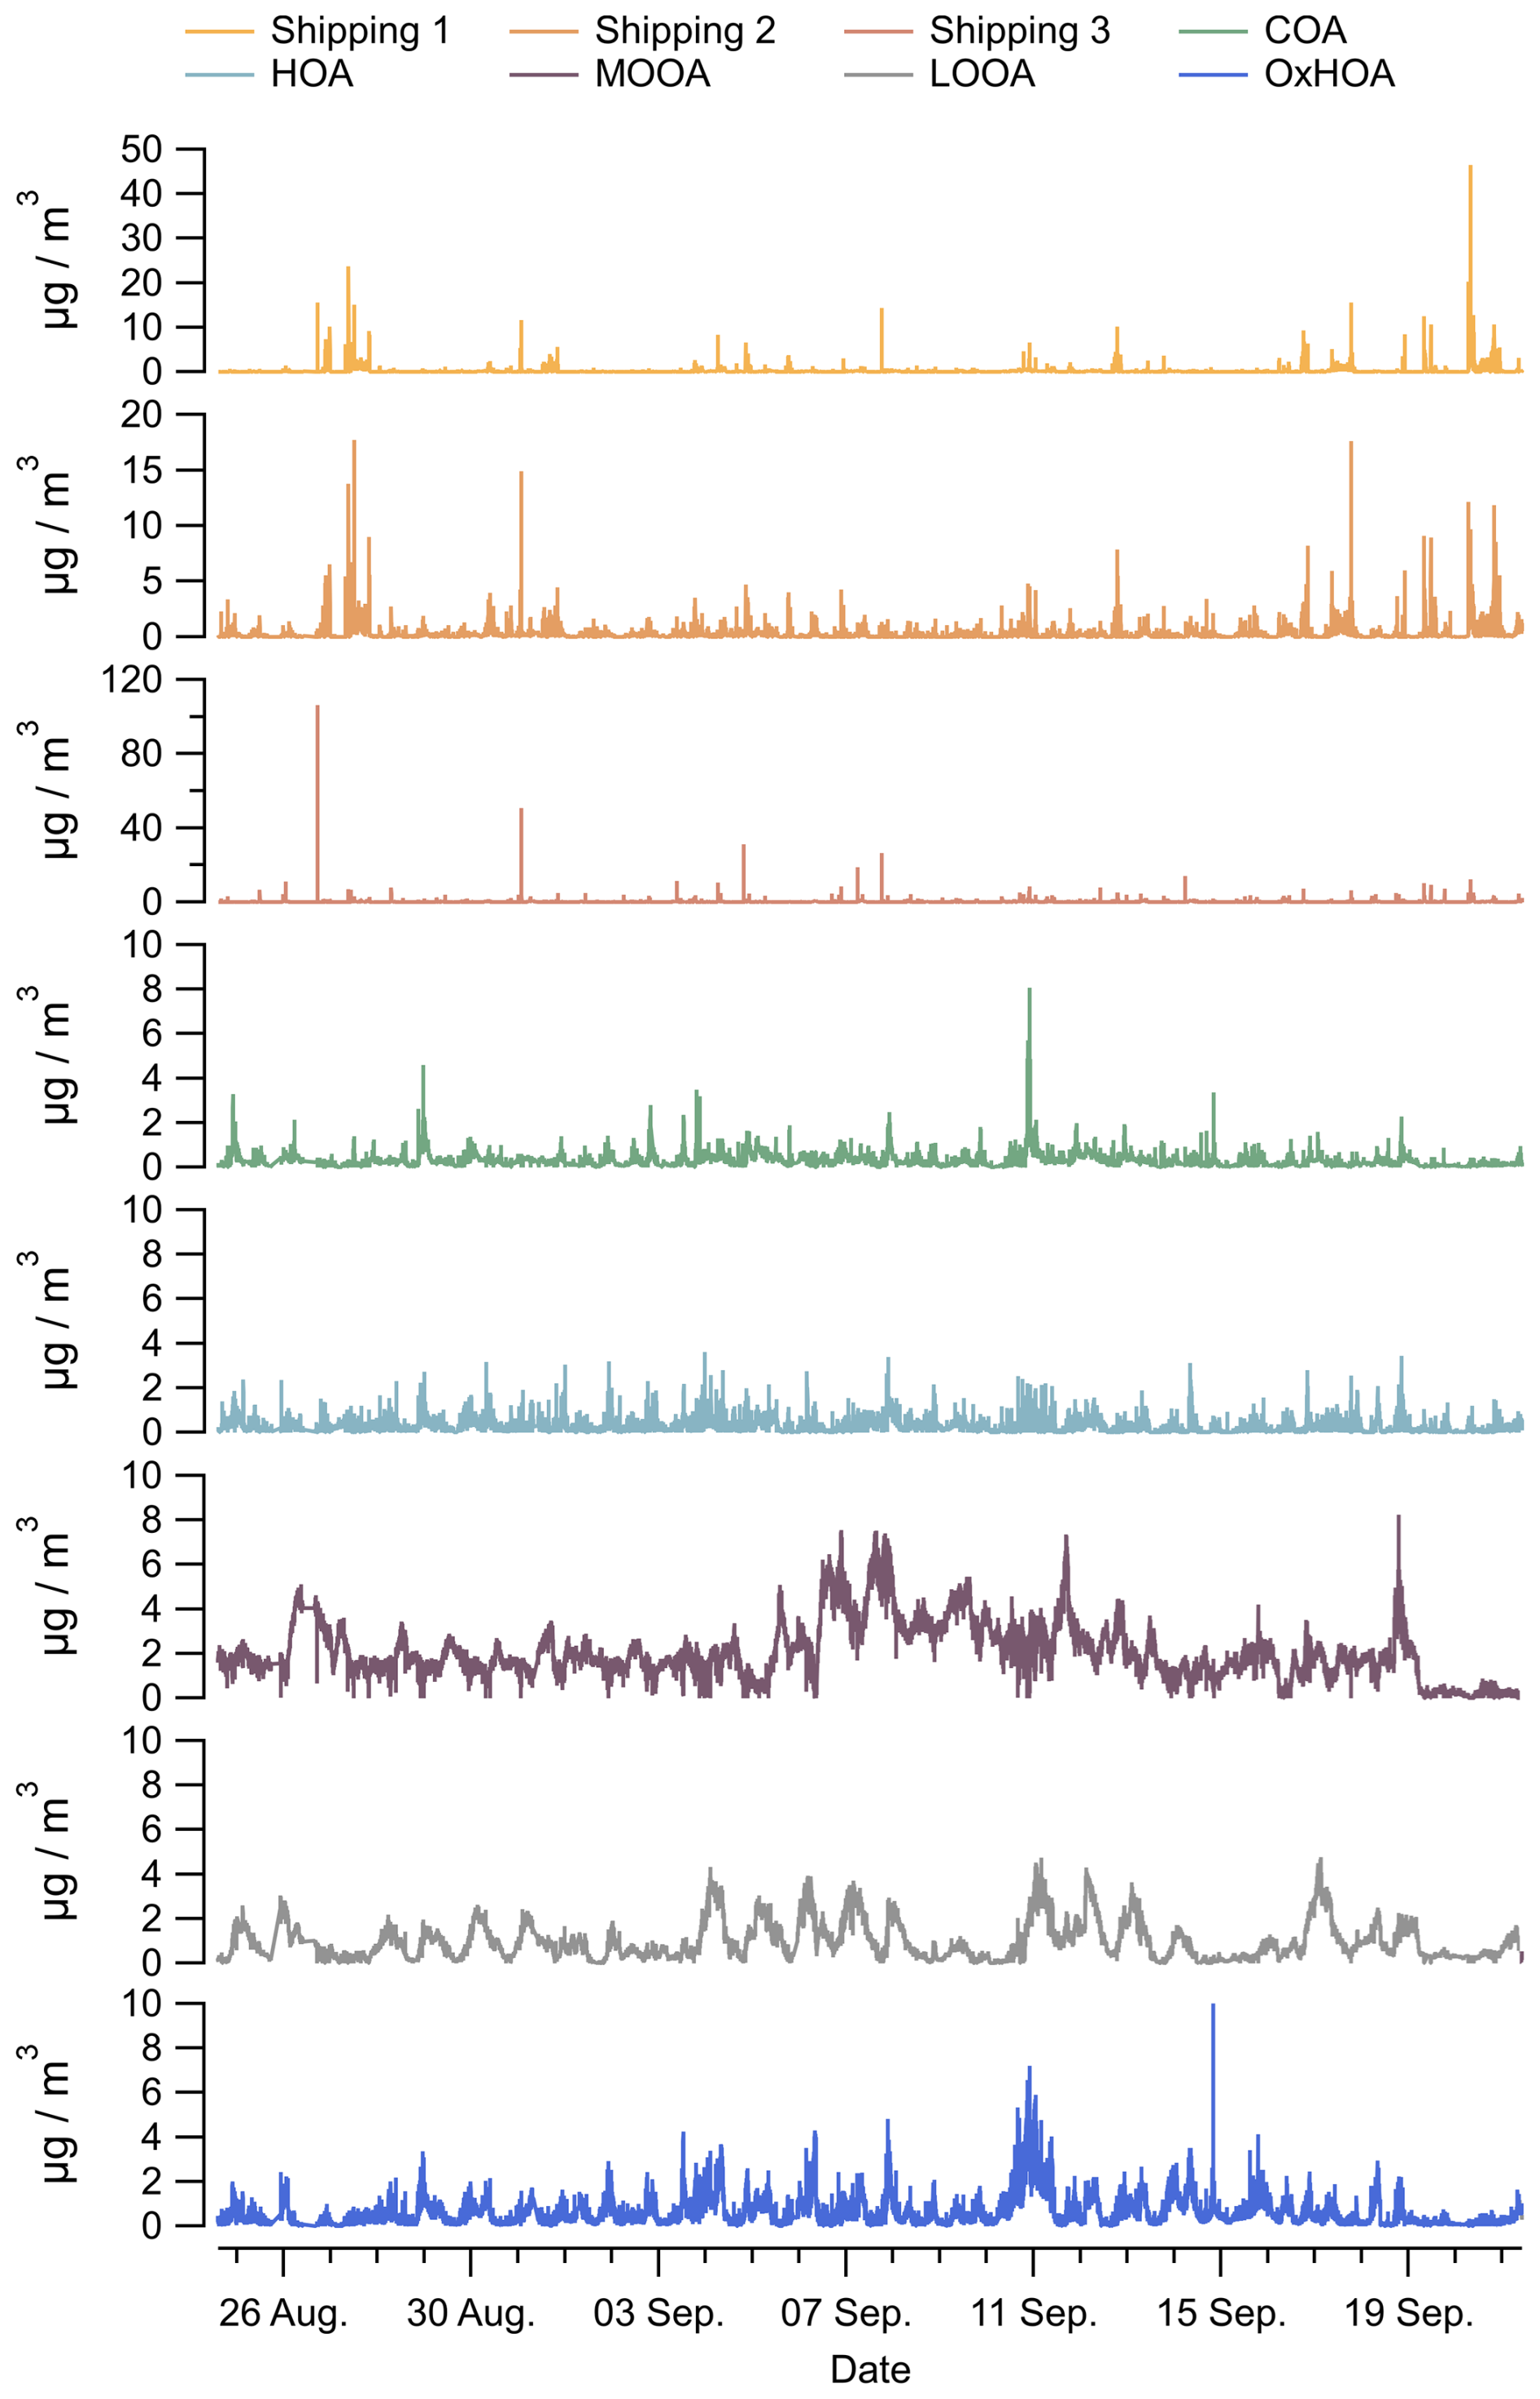
The selected PMF solutions are shown in terms of mass spectra (Figs. 4 and 5) and time evolution (Fig. 6).
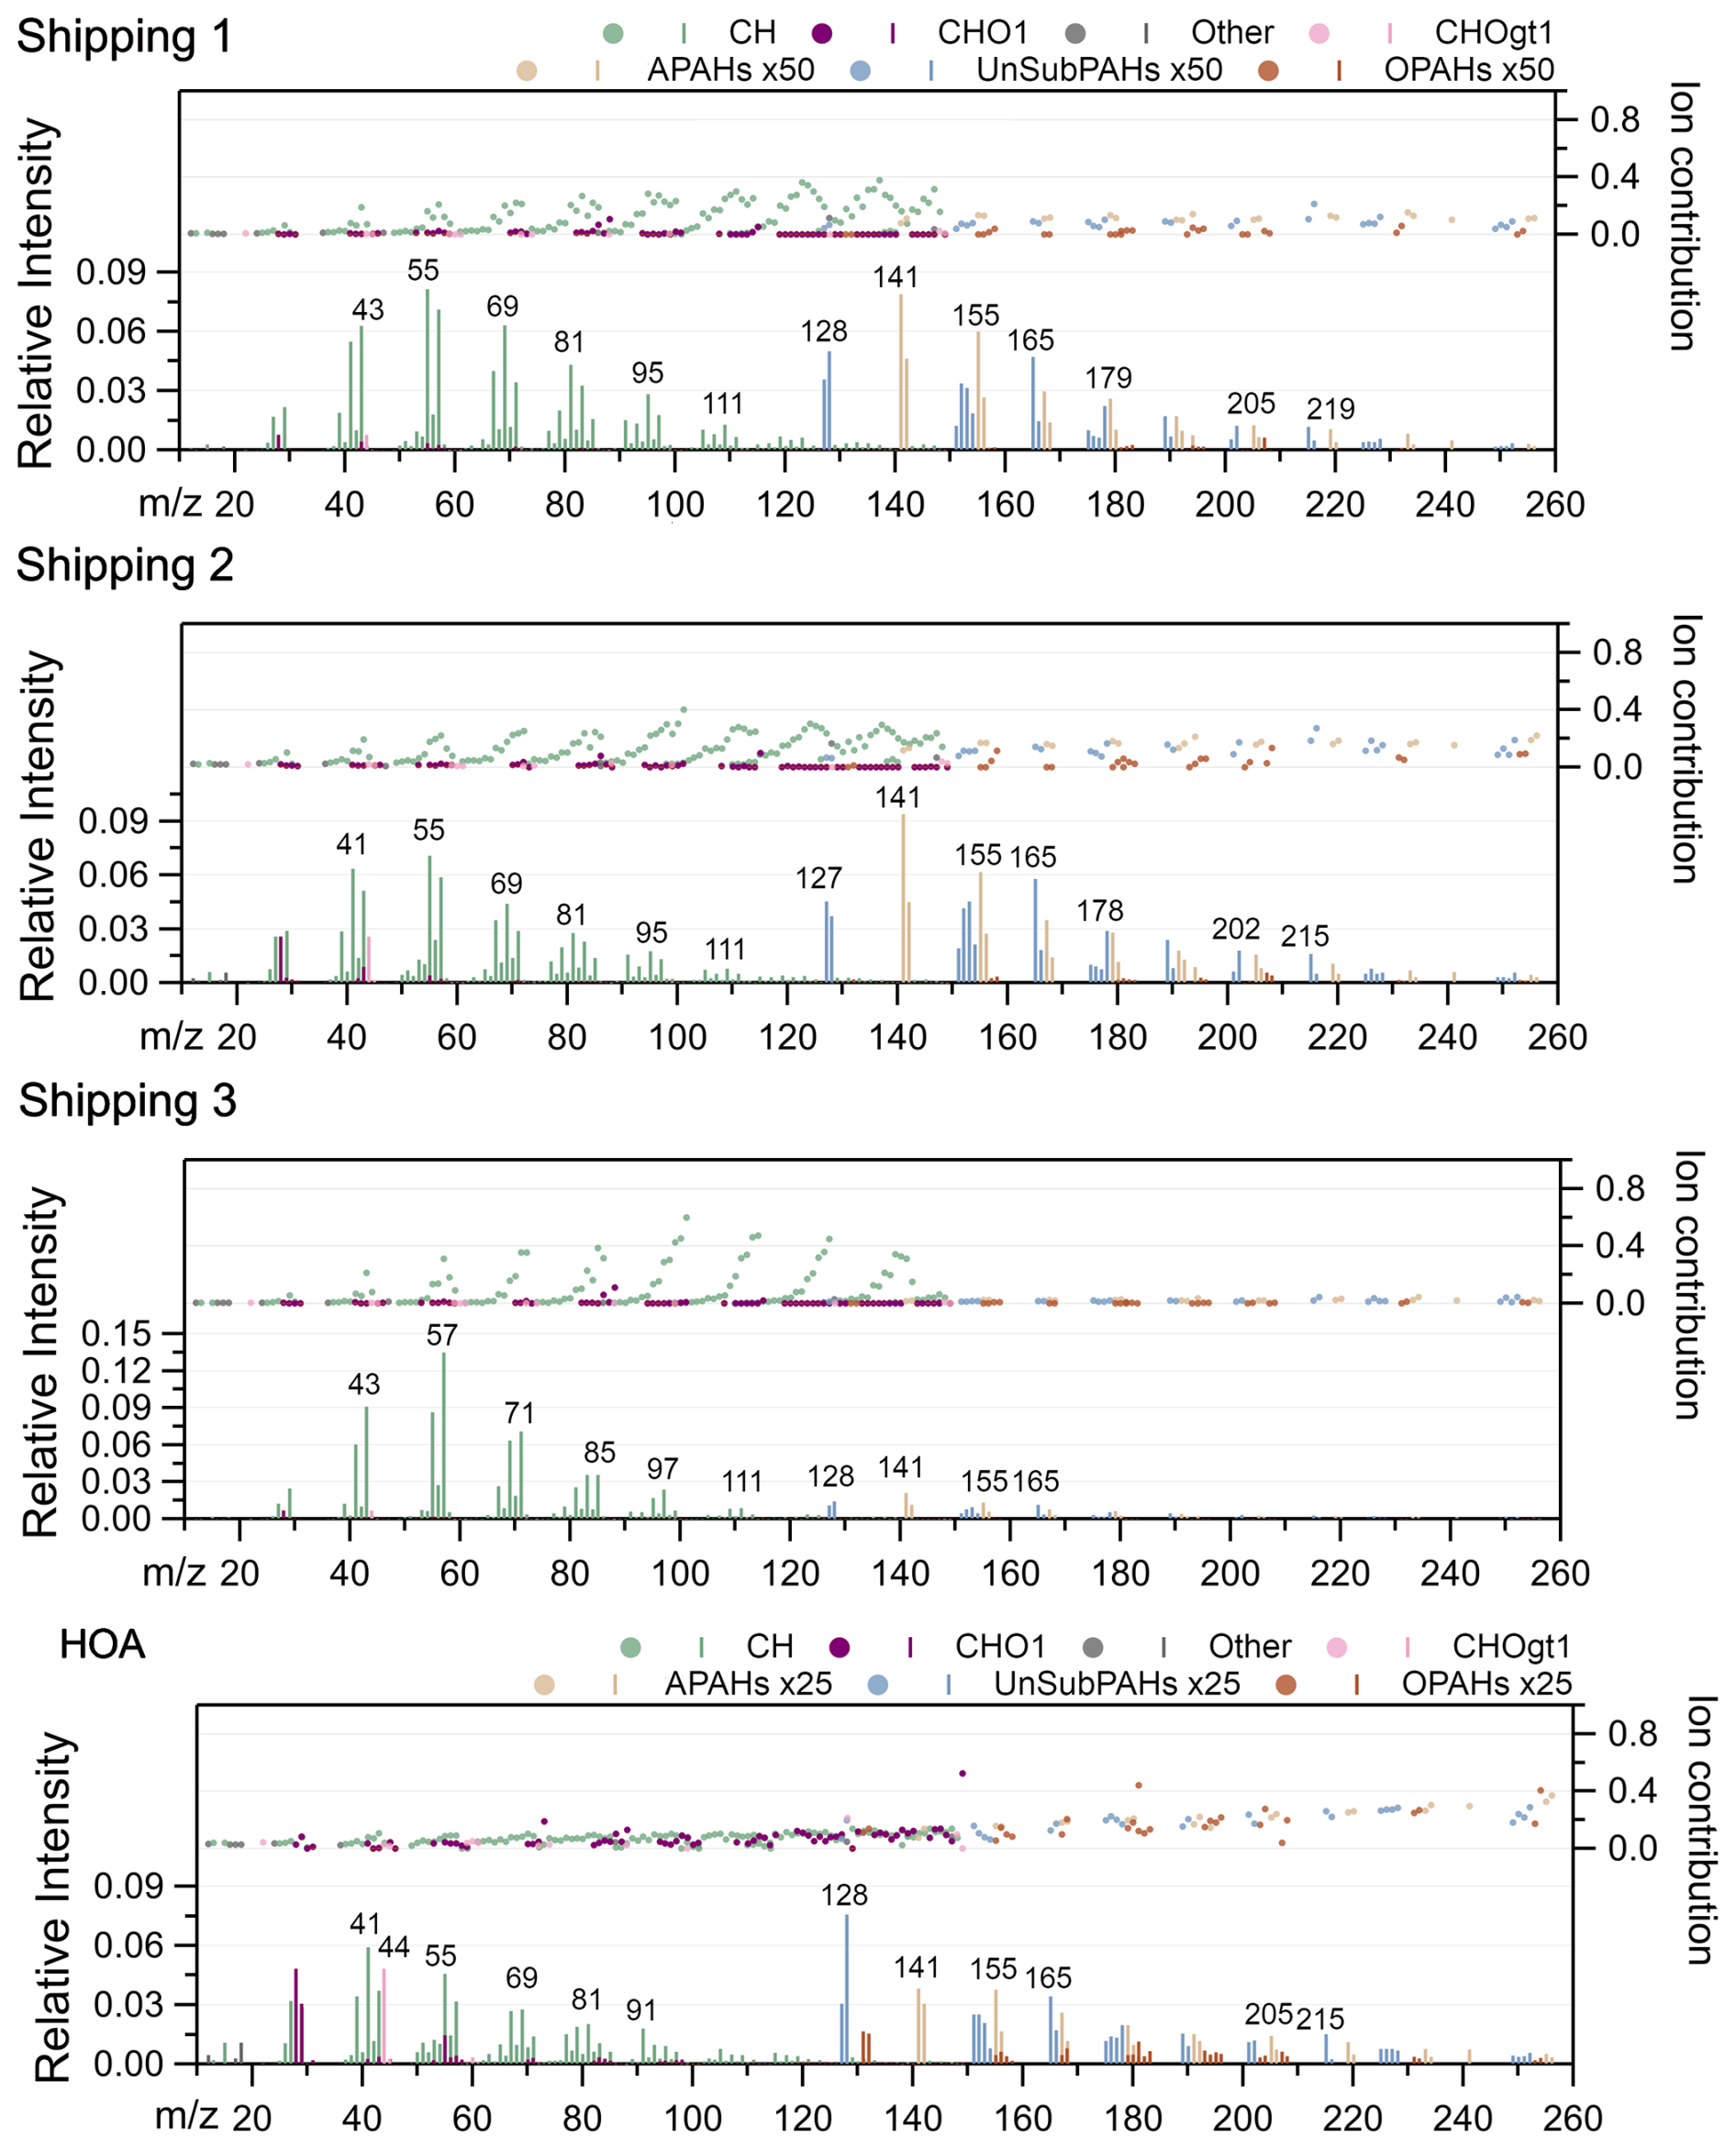
Figure 4Mass spectra of Shipping 1, 2, 3 and HOA factors. PAHs signals were multiplied by 50 for all factors except HOA, for which they were multiplied by 25. Factor contribution to the total signal is represented by family-colored dots for each ion, with unit CE for each factor.
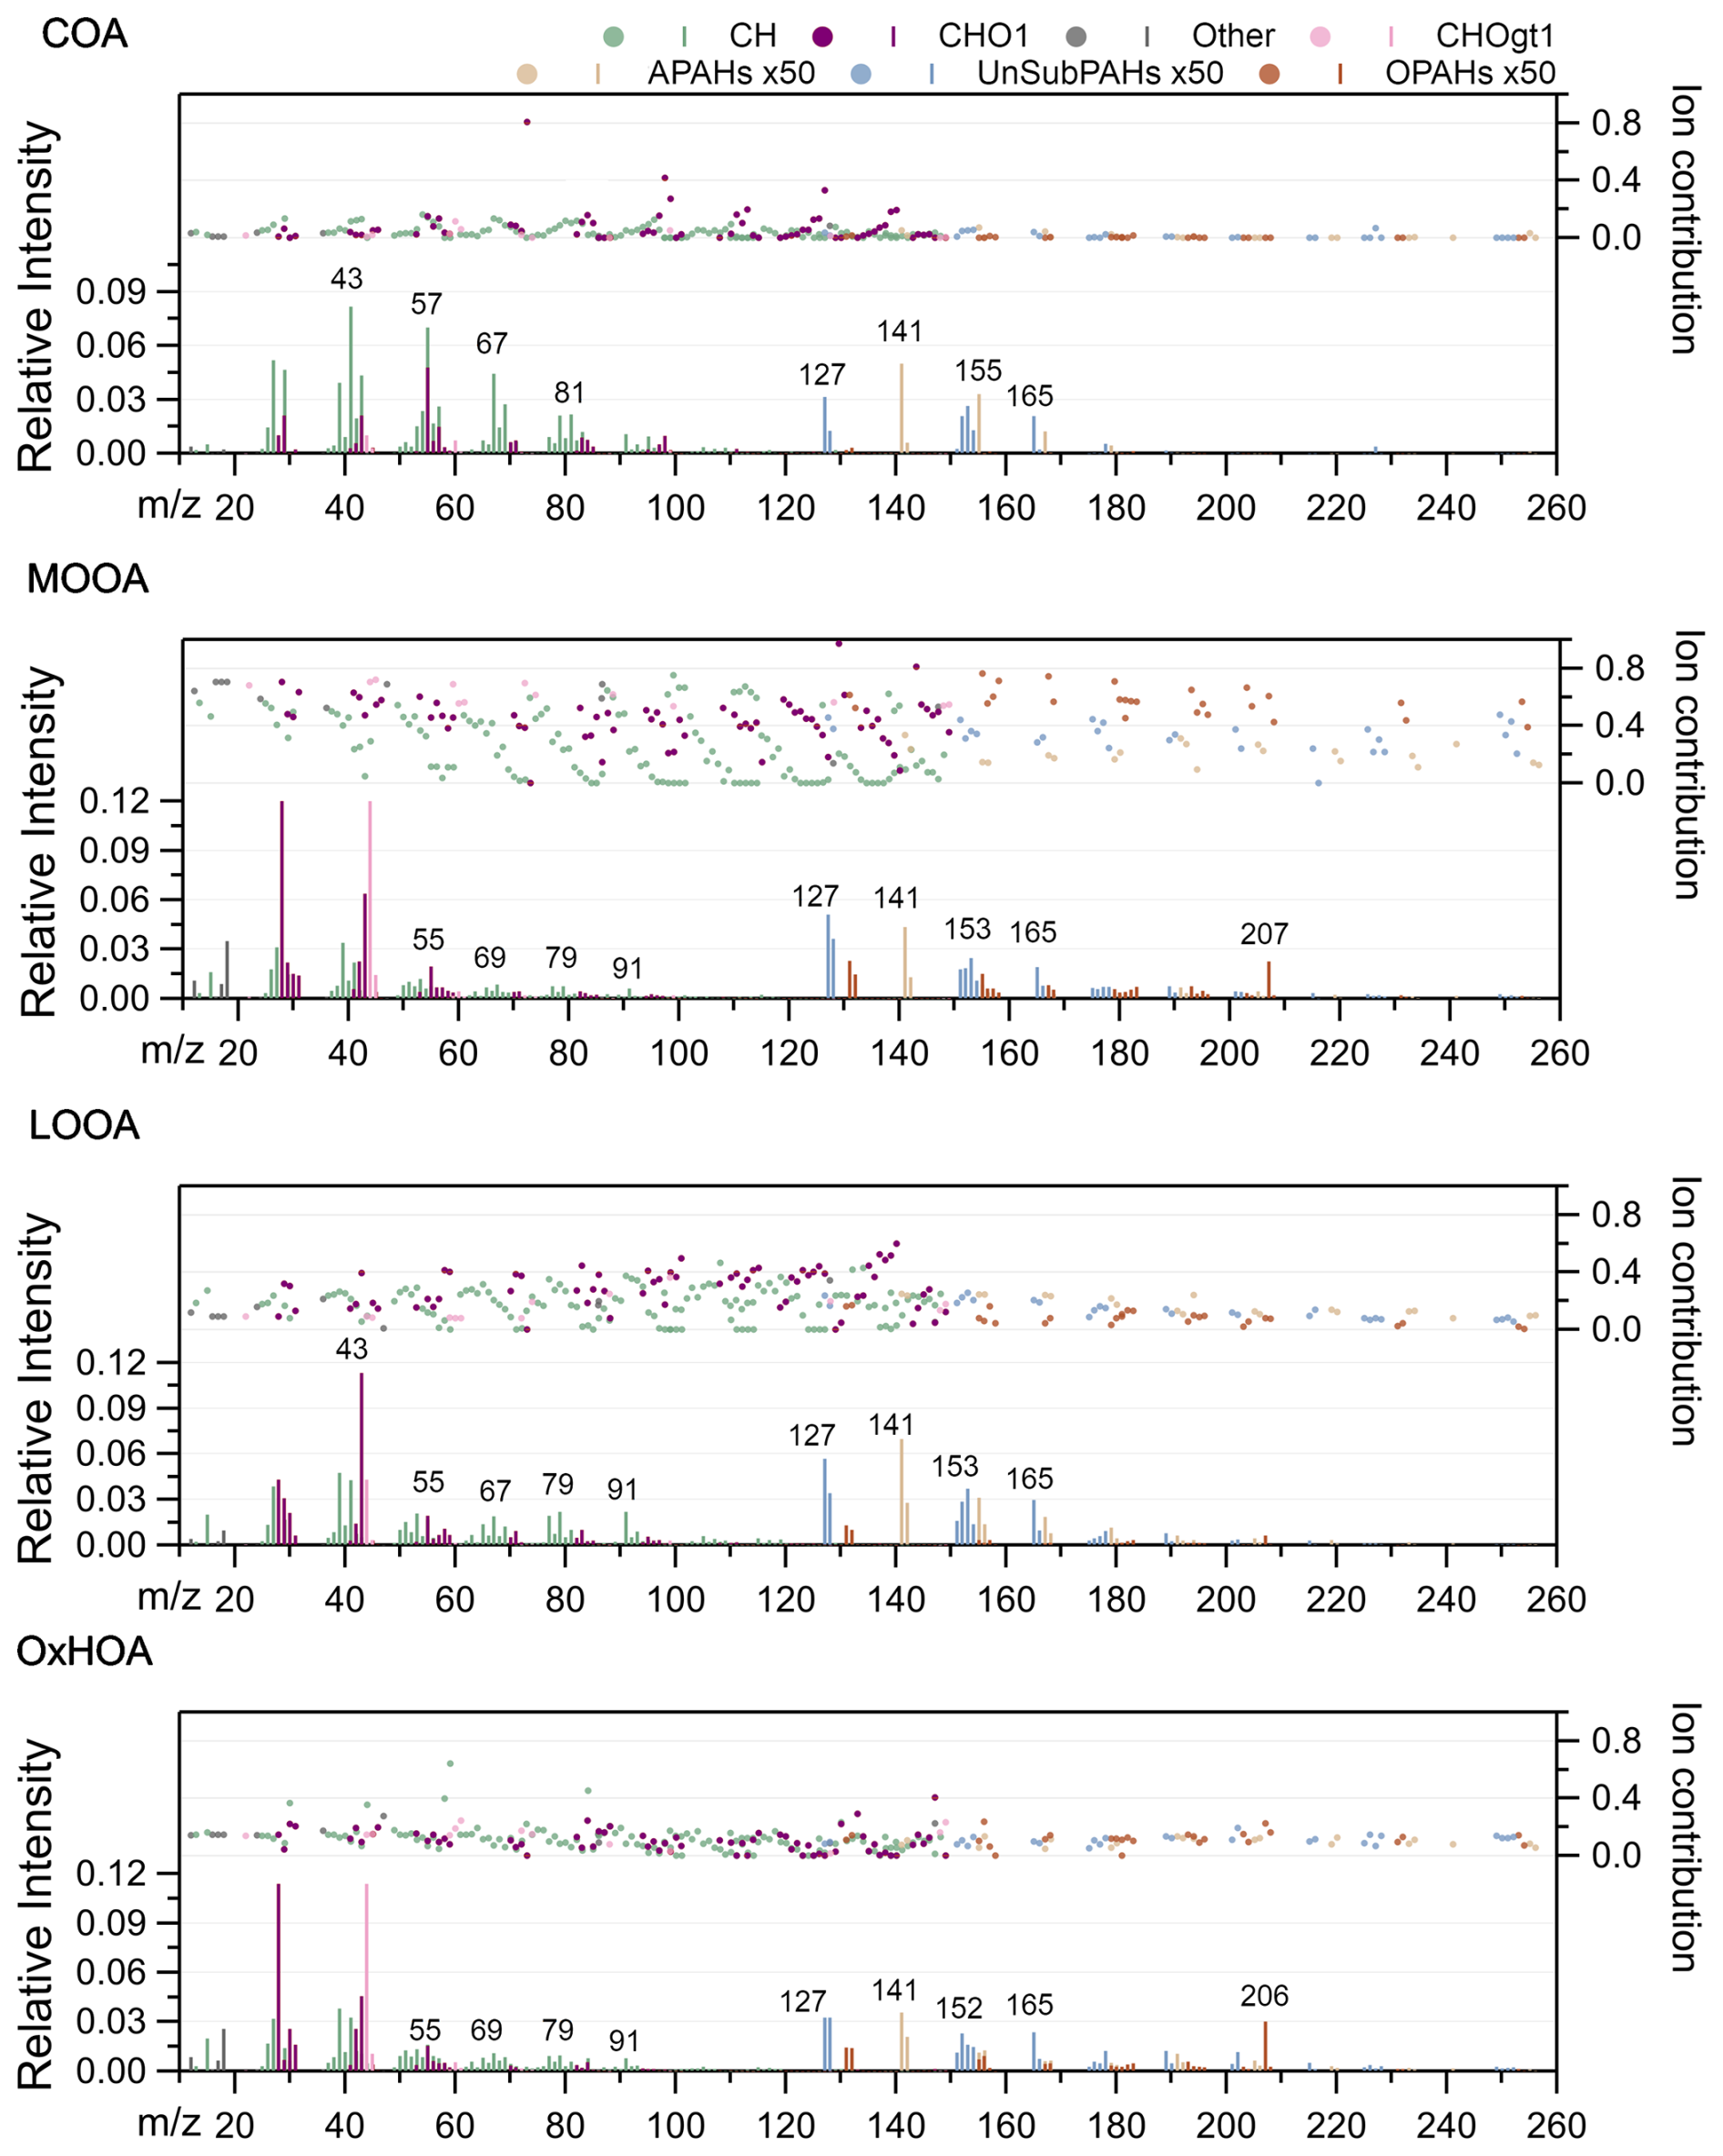
Figure 5Mass spectra of COA, OxHOA, MOOA and LOOA factors. PAHs signals were multiplied by 50. Factor contribution to the total signal is represented by family-colored dots for each ion, with unit CE for each factor.
The mass spectra of the three shipping factors are all dominated by hydrocarbon fragments (Fig. 4), such as C3H ( 41), C3H ( 43), C4H ( 55), C4H ( 57), C5H ( 69), and C5H ( 71), along with ions at 81 (C6H), 95 (C7H), 97 (C7H), and 111 (C8H). CnH fragments are typical of unsaturated aliphatic compounds, CnH are linked to saturated alkyl compounds, and CnH are linked to bicycloalkanes and alkynes. All these mass spectra are typical of various combustion source emissions (McLafferty and Tureček, 1993), including shipping emissions (Fossum et al., 2024; Sun et al., 2023). The O : C ratios of shipping factors are very low, varying from 0.01 to 0.05, and H : C ratios from 1.8 to 2.1 (Table S9).
Shipping factors 1 and 2 also present an important contribution of PAHs, with fragments at 128 (C10H) associated with naphthalene, 141 (C11H), 155 (C12H), 165 (C13H), 178 (C14H) corresponding to anthracene or its isomer phenanthrene, predominant in ship emissions, 179 (C14H), 202 (C16H) associated with pyrene and its isomers fluoranthene and acephenanthrylene, 205 (C16H), and 219 (C17H). In agreement with Anders et al. (2023, 2024), we observe PAH mass spectra dominated by a signal series in sequences of 14 Da, corresponding to the addition of a CH2 moiety. In our observations, the sequence starts for alkylated naphthalene at 141–142 and 155–156, as well as for fluorene at 165–166 and 179–180, reflecting the typical PAH alkylation of ship emissions, while in Anders et al. (2023, 2024) and Sippula et al. (2014), phenanthrene alkylated compounds were predominant. The combustion temperature can explain both the number of rings and the degree of substitution, e.g., alkylation (Frenklach, 2002), and it has been shown that large diesel engines promote high alkylation degrees resulting from higher amounts of unburnt fuel (Sippula et al., 2014).
Shipping factor 3 exhibits a distinct mass spectrum, with relatively high contributions of unsaturated aliphatic ions ( 43, 55, 71) and very low PAH contribution. As shown in Fig. S11, the SRP between Shipping 3 and Shipping 1 mass spectra reveals clear differences, with the predominance of a 14 Da sequence linked to the addition of a CH2 group in the Shipping 3 factor (ions at 57–58, 71–72, 85–86, 99–100, 113, 127, and 141). Correlations between factors mass spectra profiles and an HR-ToF-AMS mass spectral database (MARMOT v3.5A; Jeon et al., 2023; Ulbrich et al., 2009) are presented in Tables S10 to S17. As expected, the profiles of ship factors show strong correlations with mass spectra from combustion sources such as HOA factors, and similarity with dioctyl sebacate, known as an additive in engine oils (Kamal et al., 2023; Yu et al., 2021; Shah et al., 2018; Elser et al., 2016; Hu et al., 2016; Crippa et al., 2013; Mohr et al., 2012; Docherty et al., 2011; Aiken et al., 2009), but no information was found on the actual use of these oils in ship fuels.
Table S7 presents Pearson correlation coefficients (R) between factors and external variables. Shipping factors 1 and 2 present some temporal correlation with SO2 (0.26–0.34), CO (0.12–0.27), BC (0.37–0.56), and NOx (0.54–0.73), and very good correlation with particle number (0.59–0.78) in the nucleation and Aitken modes (15–70 nm). Shipping factor 3 shows some correlation with CO (0.43), BC (0.40), NOx (0.52), and with particles in the accumulation mode (100–200 nm) (0.30). It is identified for south-westerly winds at higher speeds (above 6 m s−1), suggesting that these plumes come from ships at the cruise terminal, as suggested by the Non-parametric Wind Regression (NWR) analysis in Fig. S14. Wind-sector statistics were computed using the ZeFiR module integrated into SoFi (Petit et al., 2017), which enabled the generation of factor-conditioned wind and pollution roses supporting this interpretation. The low levels of PAHs, the lack of correlation with SO2, and the absence of nucleating particles for Shipping factor 3 suggest that this factor is related to ships equipped with after-treatment devices such as scrubbers, in line with Kuittinen et al. (2024).
The diurnal trends of the shipping factors are presented in Fig. S16 and show intense peaks between 07:00 and 10:00 a.m. LT and between 06:00 and 08:00 p.m. LT, corresponding to ferry arrivals and departures. It is interesting to note that the baseline of these factors is almost zero when there are no shipping events, which is not the case for the other factors, highlighting the good deconvolution of the shipping sources (Fig. 6).
3.4.2 Hydrocarbon-like Organic Aerosol (HOA)
The predominant ions in the HOA mass spectrum are hydrocarbon fragments (Fig. 4) at 39 (C3H), 41 (C3H), 57 (C4H), 67 (C5H), 69 (C5H), 79 (C6H), and 81 (C6H), along with oxygenated ions at 28 (CO+), 29 (CHO+), and 55 (C3H3O+), all associated with combustion processes (Marimuthu et al., 2020; Goodings et al., 1979). The calculated O : C ratio is 0.12, while shipping factors present O : C ratios below 0.05 (Table S9). The PAH distribution is quite similar to that observed for shipping factors 1 and 2, with the highest relative intensities at 128 (C10H), followed by 141 (C11H), 142 (C11H), 155 (C12H), 165 (C13H), 205 (C16H), and 215 (C17H). These PAHs have been previously reported in road transport emissions (Kostenidou et al., 2021; Muñoz et al., 2018; de Souza and Corrêa, 2016). The HOA mass spectrum also contains an important fraction of oxygenated ions, such as at 149 (C10H13O+), as well as oxygenated PAHs ( 180, 182, 254), tentatively assigned to fluorenone, benzopyran, and benzo[cd]pyrenone, following previous reports from vehicle emissions by HR-ToF-AMS (Kostenidou et al., 2021). These OPAHs have been associated with after-treatment devices, such as oxidation catalysts of modern engines (Moldanová, 2026; Kostenidou et al., 2021). The mass spectral discrimination between HOA and shipping factors is illustrated in Fig. S12. Spectral Relative Predominance (SRP) highlights similarities and differences across these factors. Major differences are related to oxygenated ion fragments (CxHyO), predominant in HOA, such as at 29 (CHO+), 99 (C6H11O+), 110 (C7H10O+), 112 (C7H12O+), 120 (C8H8O+), 122 (C8H10O+), 146 (C10H10O+), and 149 (C10H13O+), and also to OPAHs, while shipping factors contain specific and intense aliphatic fragments at 72, 86, 100, 114, 128, and 140.
As expected, HOA shows good correlation with combustion tracers such as CO (0.51), NOx (0.28), and BC (0.26), and with PN in the diameter range between 70 and 200 nm (0.34–0.45) (Table S7), in accordance with the literature (Chazeau et al., 2022; Marques et al., 2022; Kostenidou et al., 2021; Jaikumar et al., 2017). The HOA mass spectrum correlates well with other published HOA, as well as with a COA factor; the theta angle varies between 15 and 23° (Hayes et al., 2013; Hu et al., 2013; Saarikoski et al., 2012), and also with a source of coal combustion (Table S16). The HOA mass loading (Fig. 6) shows maxima in the range 2–3 µg m−3, while shipping factors display maxima often exceeding 10 µg m−3. Furthermore, the HOA factor is observed under all wind directions (Fig. S14), with the highest contribution in the proximity of the measurement site, which was surrounded by busy roads, while a minor contribution is associated with air masses coming from the west and southwest for wind speeds exceeding 4 m s−1, possibly due to roads behind the cruise terminal. The diurnal profile shows a maximum between 07:00 and 10:00 a.m. LT, then increases again around 06:00 p.m. LT, peaks at 10:00 p.m. LT, and slowly decreases until 05:00 a.m. LT, while shipping factors are characterized by sharp maxima in the morning and evening but are not observed during nighttime. As HOA maxima (rush hours) occur at the same hours as ship arrivals and departures (Fig. S16), some mixing between HOA and shipping factors can occur for air masses coming from west and southwest directions (Fig. S14).
3.4.3 Cooking-like Organic Aerosol (COA)
The major ions in the COA mass spectrum are hydrocarbon fragments at 41 (C3H), 67 (C5H), 69 (C5H), 79 (C6H), and 81 (C6H), along with oxygenated ions at 29 (CHO+), 43 (C2H3O+), and 57 (C3H5O+) (Fig. 4). The COA mass spectrum exhibits a higher contribution, compared to other factors, of oxygenated ions at 73 (C4H9O+), and contributes around 40 % to ions with 98 (C6H10O+) and 127 (C8H15O+). The COA factor exhibited an 55 to 57 ratio of 2.9 and an 67 to 69 ratio of 1.6, consistent with the ranges of 2.3–4.5 and 1.1–1.6 reported for cooking aerosol enriched in polyunsaturated fatty acids (Pikmann et al., 2024; Xu et al., 2020; Mohr et al., 2012). Conversely, the HOA factor showed an 55 to 57 ratio of 1.67 and an 67 to 69 ratio of 0.96, near the average value of 0.63 ± 0.30 reported for HOA (Pikmann et al., 2024). These distinct ratios indicate that COA and HOA have been well separated by the PMF analysis. The COA factor has an O : C ratio of 0.12 and correlates well with reference COA and oleic acid mass spectra (Table S13), with theta angle between 8 and 16° (Hu et al., 2018; Shah et al., 2018; Elser et al., 2016; Struckmeier et al., 2016; Crippa et al., 2013). The PAH contribution to this factor is low; nonetheless, some PAHs signals previously reported in COA factors (Cash et al., 2021; Singh et al., 2016) including 127 (C10H) and 128 (C10H) corresponding to naphthalene, 141 (C11H) and 142 (C11H) associated with methyl-naphthalene, 151 (C12H) and 152 (C12H) for acenaphthylene, and fluorene at 165 (C13H) are observed.
The COA factor has a local origin and is observed for low wind speeds (Fig. S14). It also shows good temporal correlations with CO (0.39) and PN between 100 and 200 nm (0.35) (Table S7). Its diurnal profile is quite flat during the day and shows a maximum around 09:00 p.m. LT, then decreases until 03:00 a.m. LT.
The muted lunchtime COA signal results from the site being systematically upwind of the restaurant district, located to the north-northwest of the station. During 11:00 a.m.–02:00 p.m. LT, winds predominantly originated from the south to southwest (port and sea sectors), preventing the transport of cooking emissions to the site. A slight evening enhancement is nonetheless observed, consistent with the higher occurrence of northerly and northwesterly winds during 06:00–09:00 LT, which intermittently place the site downwind of the restaurant area. Wind roses restricted to meal-time periods (Fig. S15) confirm this interpretation, with only 0.78 % of lunchtime winds and 2.05 % of evening winds originating from the restaurant sector. These conditions explain both the absence of a mid-day peak and the weak but detectable evening COA contribution.
3.4.4 Secondary Organic Aerosol (MOOA and LOOA)
Secondary organic aerosol (SOA) factors are characterized by a high abundance of oxygenated ion fragments and are commonly differentiated based on the relative intensity of ions at 44 (CO) and 43 (C2H3O+). The factor with the highest relative intensity for 44 is defined as MOOA (More-Oxidized OA), whereas the one with the highest intensity for 43 is defined as LOOA (Less-Oxidized OA). The MOOA and LOOA factors present O : C ratios of 0.52 and 0.23, respectively (Table S9). The apparently low O : C ratios for these two factors can be explained by the contribution of hydrocarbon ions above 120. Indeed, when considering an upper limit at 120, as in many previous PMF studies (Elser et al., 2016; Struckmeier et al., 2016; Saarikoski et al., 2012; Mohr et al., 2012; Docherty et al., 2011), the O : C ratios for MOOA and LOOA increase to 0.72 and 0.33, respectively (Table S9), in agreement with the literature (Tables S16 and S17).
The MOOA mass spectrum in Fig. 5 is characterized by intense signals at 44 (CO) and 28 (CO+), as well as ions associated with OPAHs. In contrast, the LOOA mass spectrum shows the highest intensity at 43 (C2H3O+) and a notable contribution from oxygenated ions, as highlighted by the SRP comparison in Fig. S13a. The pronounced contribution of 43 has been tentatively explained by the sunny Mediterranean summer climate and the photochemical activity forming oxygenated OA (Struckmeier et al., 2016).
The MOOA factor shows a predominant contribution from air masses originating from the sea, reflecting regional transport of marine or bay air masses under wind speeds exceeding 2 m s−1. Consistent with a previous study by Chazeau et al. (2022) in Marseille, the LOOA factor exhibits a strong correlation with nitrate (0.79), despite nitrate being a very minor component of PM1. The MOOA correlates with the temporal evolution of SO (0.51) and NH (0.46), which are often used as tracers of secondary processes. Moreover, the two factors are associated with particles of different diameters, with MOOA showing preferential diameters above 100 nm and LOOA between 70 and 200 nm (Table S7).
3.4.5 Oxygenated Hydrocarbon-like Organic Aerosol (OxHOA)
The OxHOA mass spectrum (Fig. 5) is characterized by intense oxygenated ion fragments at 28 (CO+) and 44 (CO), and by minor contributions from hydrocarbon ion fragments such as 27 (C2H), 39 (C3H), and 41 (C3H). Its mass spectrum correlates well with oxygenated factors such as MOOA and LOOA from the AMS database (Hu et al., 2016; Crippa et al., 2013; Setyan et al., 2012) (Table S17), but its O : C ratio of 0.34 suggests an intermediate oxidation degree positioning the factor between primary and secondary factors (Table S9), as can be observed in Fig. S17, which depicts the Ng et al. (2010) triangle for all observed factors. This triangle delineates the region where ambient organic aerosol components typically fall, based on the fractions of ions 43 and 44. The MOOA and LOOA factors clearly lie within this triangle, while OxHOA is positioned just to its left, indicating an intermediate oxidation degree. The remaining primary sources (shipping, HOA, and COA) cluster in the lower-left corner, consistent with non-oxidized factors. The mass spectra of OxHOA and MOOA factors are very similar (cosine similarity of 0.98, Table S8). The SRP comparison in Fig. S13b indicates that PAHs and hydrocarbon fragments are enhanced in the OxHOA factor, while oxygenated ion fragments are generally more prominent in MOOA. Similarly, the SRP comparison between HOA and OxHOA in Fig. S13c shows that the primary factor, HOA, is enriched in hydrocarbon ion fragments and PAHs, while OxHOA shows higher contribution of small oxygenated fragments such as 28 (CO+) and 44 (CO).
The temporal evolution of the OxHOA factor is highly correlated with that of the HOA factor, with a Pearson R value of 0.96 (Table S18). The OxHOA factor also shows quite good temporal correlations with CO (0.64), NOx (0.37), NO (0.7), and PN between 100 and 200 nm (0.5) (Table S9). The wind rose of this factor indicates a predominantly local origin, similar to the HOA and COA factors, with enhanced contributions from air masses arriving from the northwest and south (Figs. S15 and S18).
3.4.6 Summary and contribution of PAHs
Figure 7 offers an overview of the measured OA factors. The three shipping factors, the HOA, the COA, and the OxHOA factors represent 11.2 %, 5.6 %, 5.9 %, and 12.4 % of the OA mass, respectively. The overall fraction of OA related to transport (road and maritime) accounts for 29.2 % of total OA. Broader receptor-model studies including both organic and inorganic species generally estimate 5 %–20 % of PM2.5 or PM10 from maritime sources (Wu et al., 2019; Bove et al., 2016; Pandolfi et al., 2011; Minguillón et al., 2008). In this study, the secondary fraction of OA reaches 78 % of the OA when including the OxHOA factor.
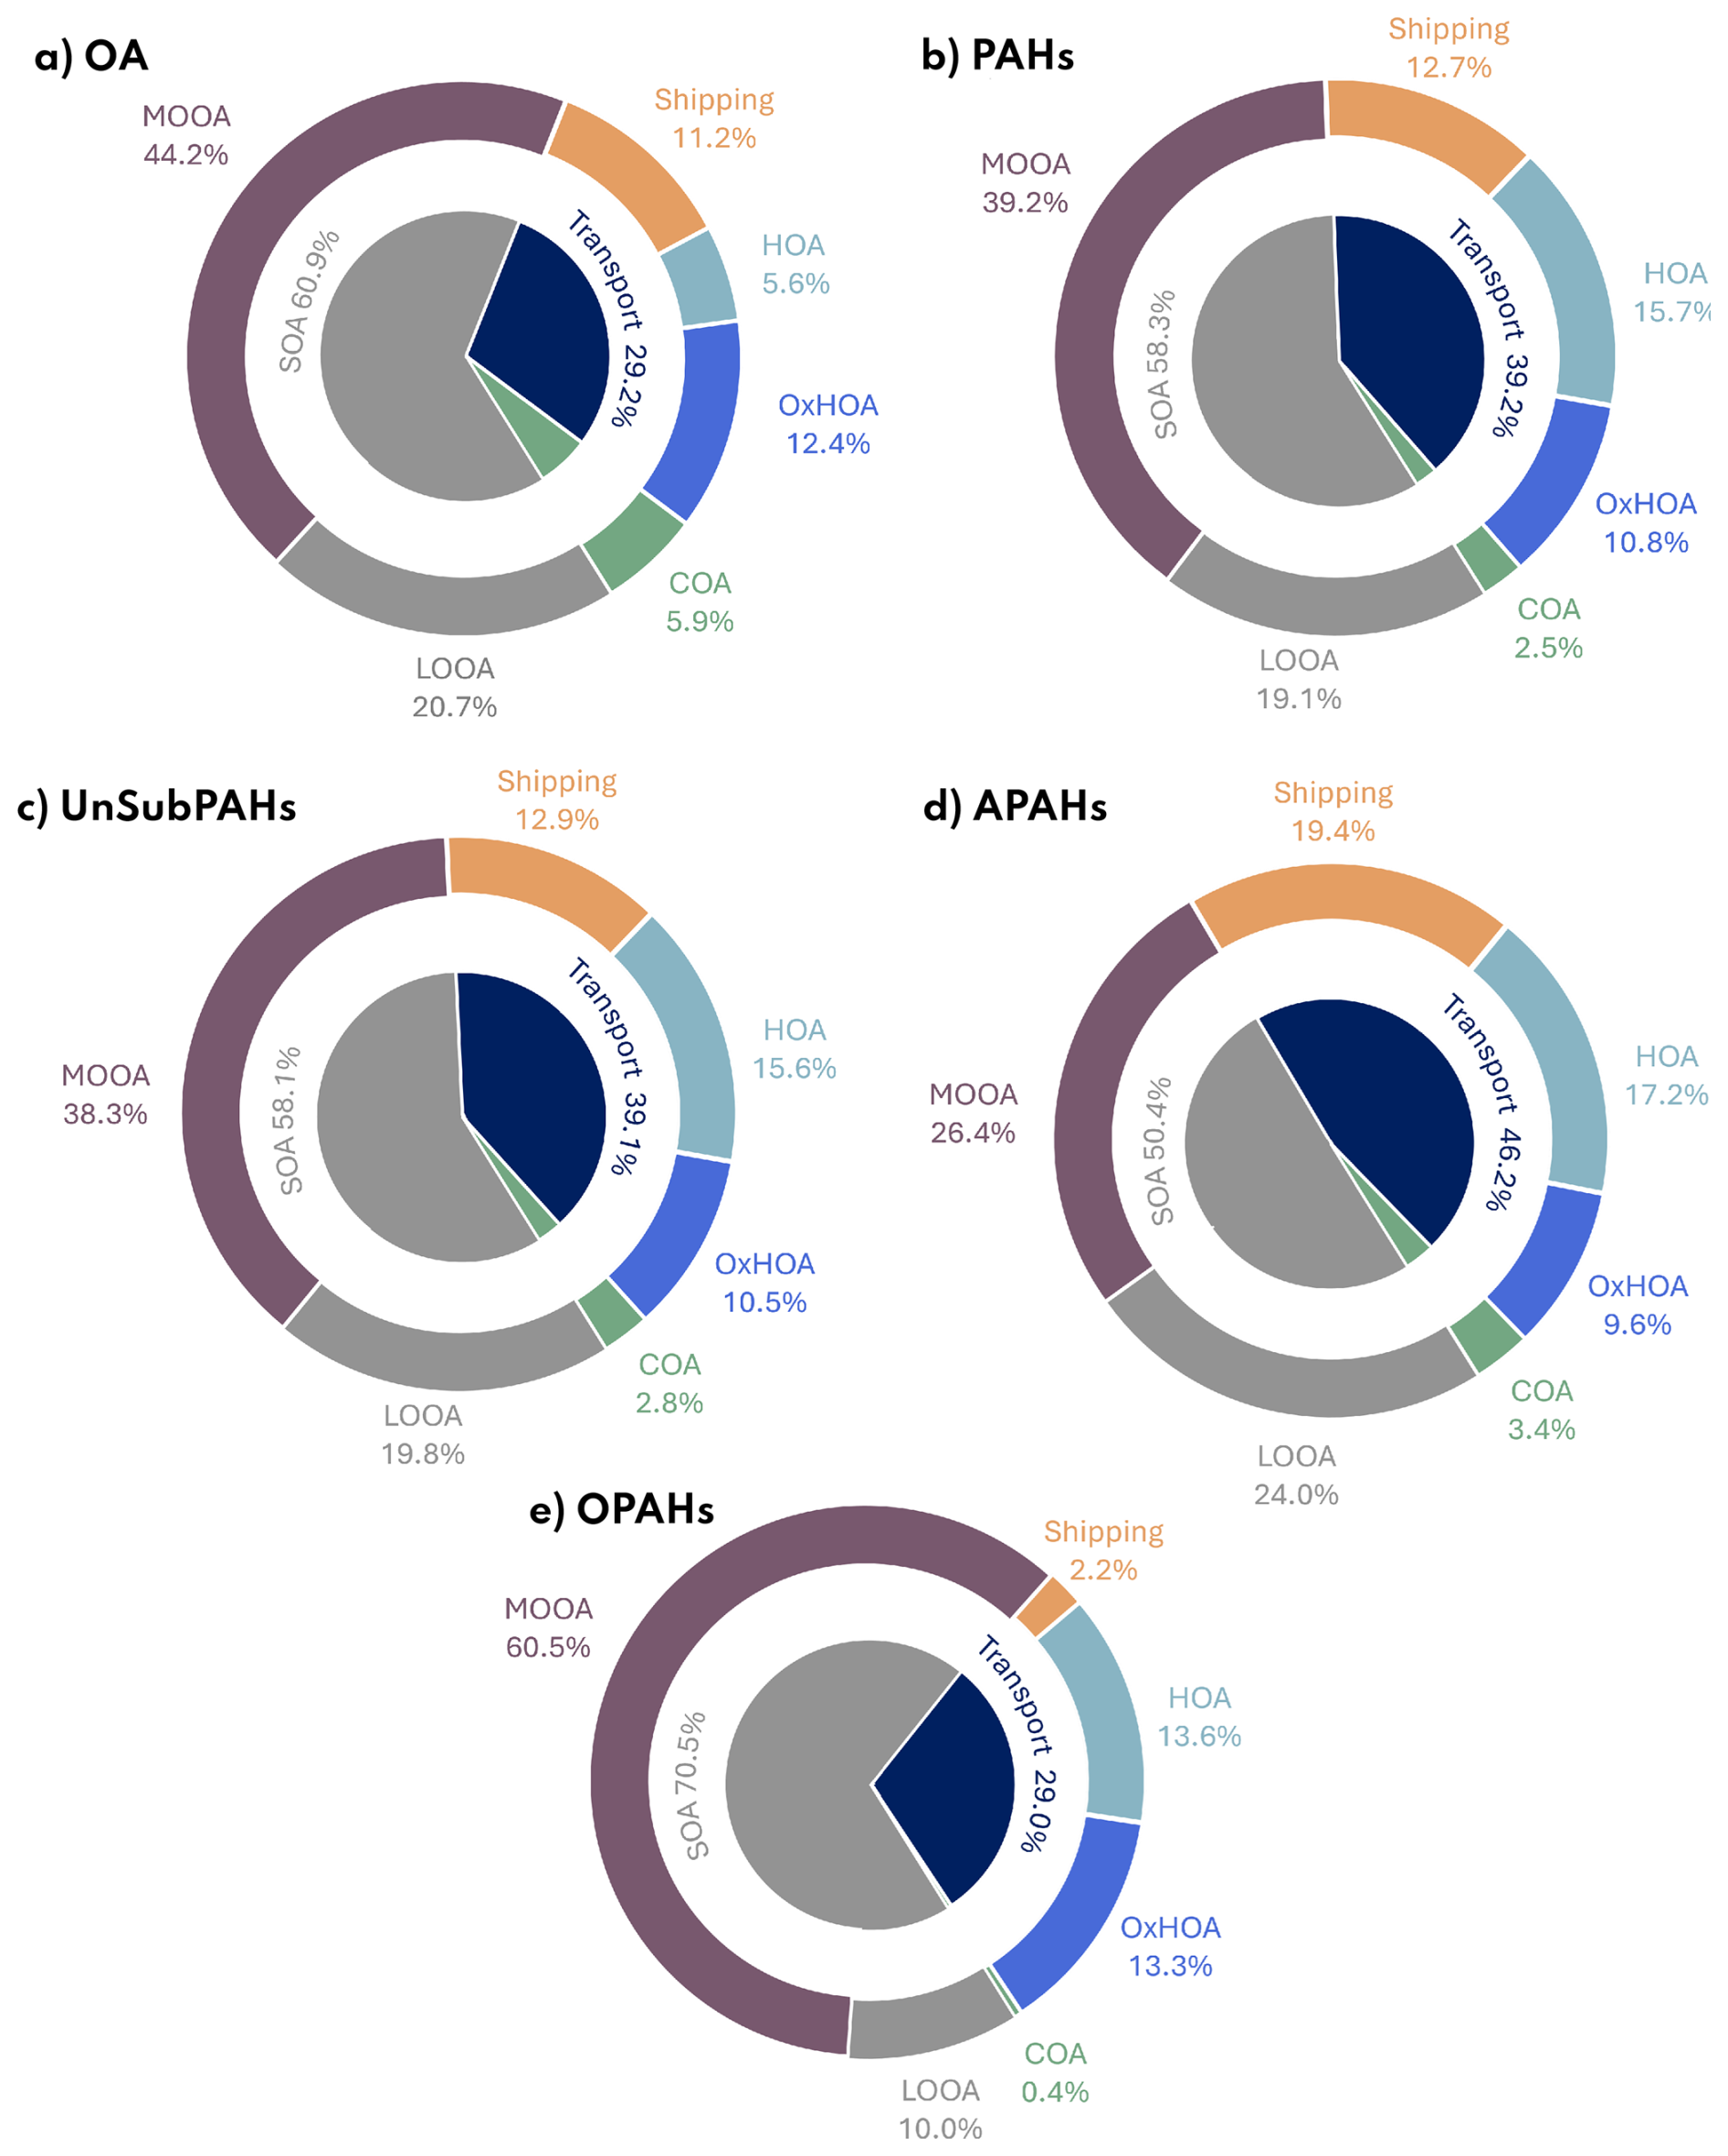
Figure 7Pie chart of (a) OA, (b) total PAHs and PAH contributions for the three PAH families, (c) APAHs, (d) UnSubPAHs, and (e) OPAHs, across the PMF factors.
High-resolution data analysis allowed the identification of various PAHs, of which 58.3 % are found in LOOA and MOOA (19.1 % and 39.2 %, respectively), 12.7 % in shipping factors (4.8 % for Shipping 1, 7.0 % for Shipping 2, and 0.9 % for Shipping 3), followed by HOA (15.7 %), OxHOA (10.8 %), and COA (2.5 %).
Altogether, combustion-related sources account for 46.2 % of total APAHs (19.4 % from shipping factors, 17.2 % from HOA, and 9.6 % from OxHOA), while the remaining 50.4 % is associated with the LOOA and MOOA factors, highlighting the persistence of anthropogenic signatures in aged aerosols. The OA factors related to transport account for 37.8 % of the UnSubPAHs, mostly associated with naphthalene, acenaphthylene, and fluorene. The cooking factor, LOOA, and MOOA account for 2.8 %, 19.8 %, and 38.3 % of the remaining UnSubPAHs. Finally, the OPAHs are more abundant in the MOOA factor (∼ 60.5 %), followed by HOA and OxHOA (13.6 % and 13.3 %), LOOA (10.0 %), and shipping factors (2.2 %), suggesting that a considerable fraction of OPAHs can be formed during photo-oxidative processes in the atmosphere. Overall, PAHs account for 12.0 ‰ of the total OA mass (5.8 ‰ for UnSubPAHs, 3.7 ‰ for APAHs, and 2.4 ‰ for OPAHs), while hydrocarbon ion fragments represent 54.5 % and oxygenated ions 43.3 % of the total OA measured in Toulon.
3.5 Particle number size distribution of PMF factors
The particle number size distribution (PNSD) associated with each factor was investigated by selecting the ten most intense peaks of each factor. Only data points having at least 10 min separation from each other were considered representative of distinct events. The average PNSD and its standard deviation for each factor are shown in Fig. 8. The pie charts corresponding to the average PM1 composition (OA, inorganic ions, and BC) are depicted in Fig. 8. Ship emissions are known to contribute significantly to ultrafine particle number concentrations. Studies have shown that the combustion of marine fuels, especially in large ships, leads to high emissions of fine and ultrafine particles (Fossum et al., 2024; Grigoriadis et al., 2024; Le Berre et al., 2025; Aakko-Saksa et al., 2023; Karjalainen et al., 2022; Anderson et al., 2015).
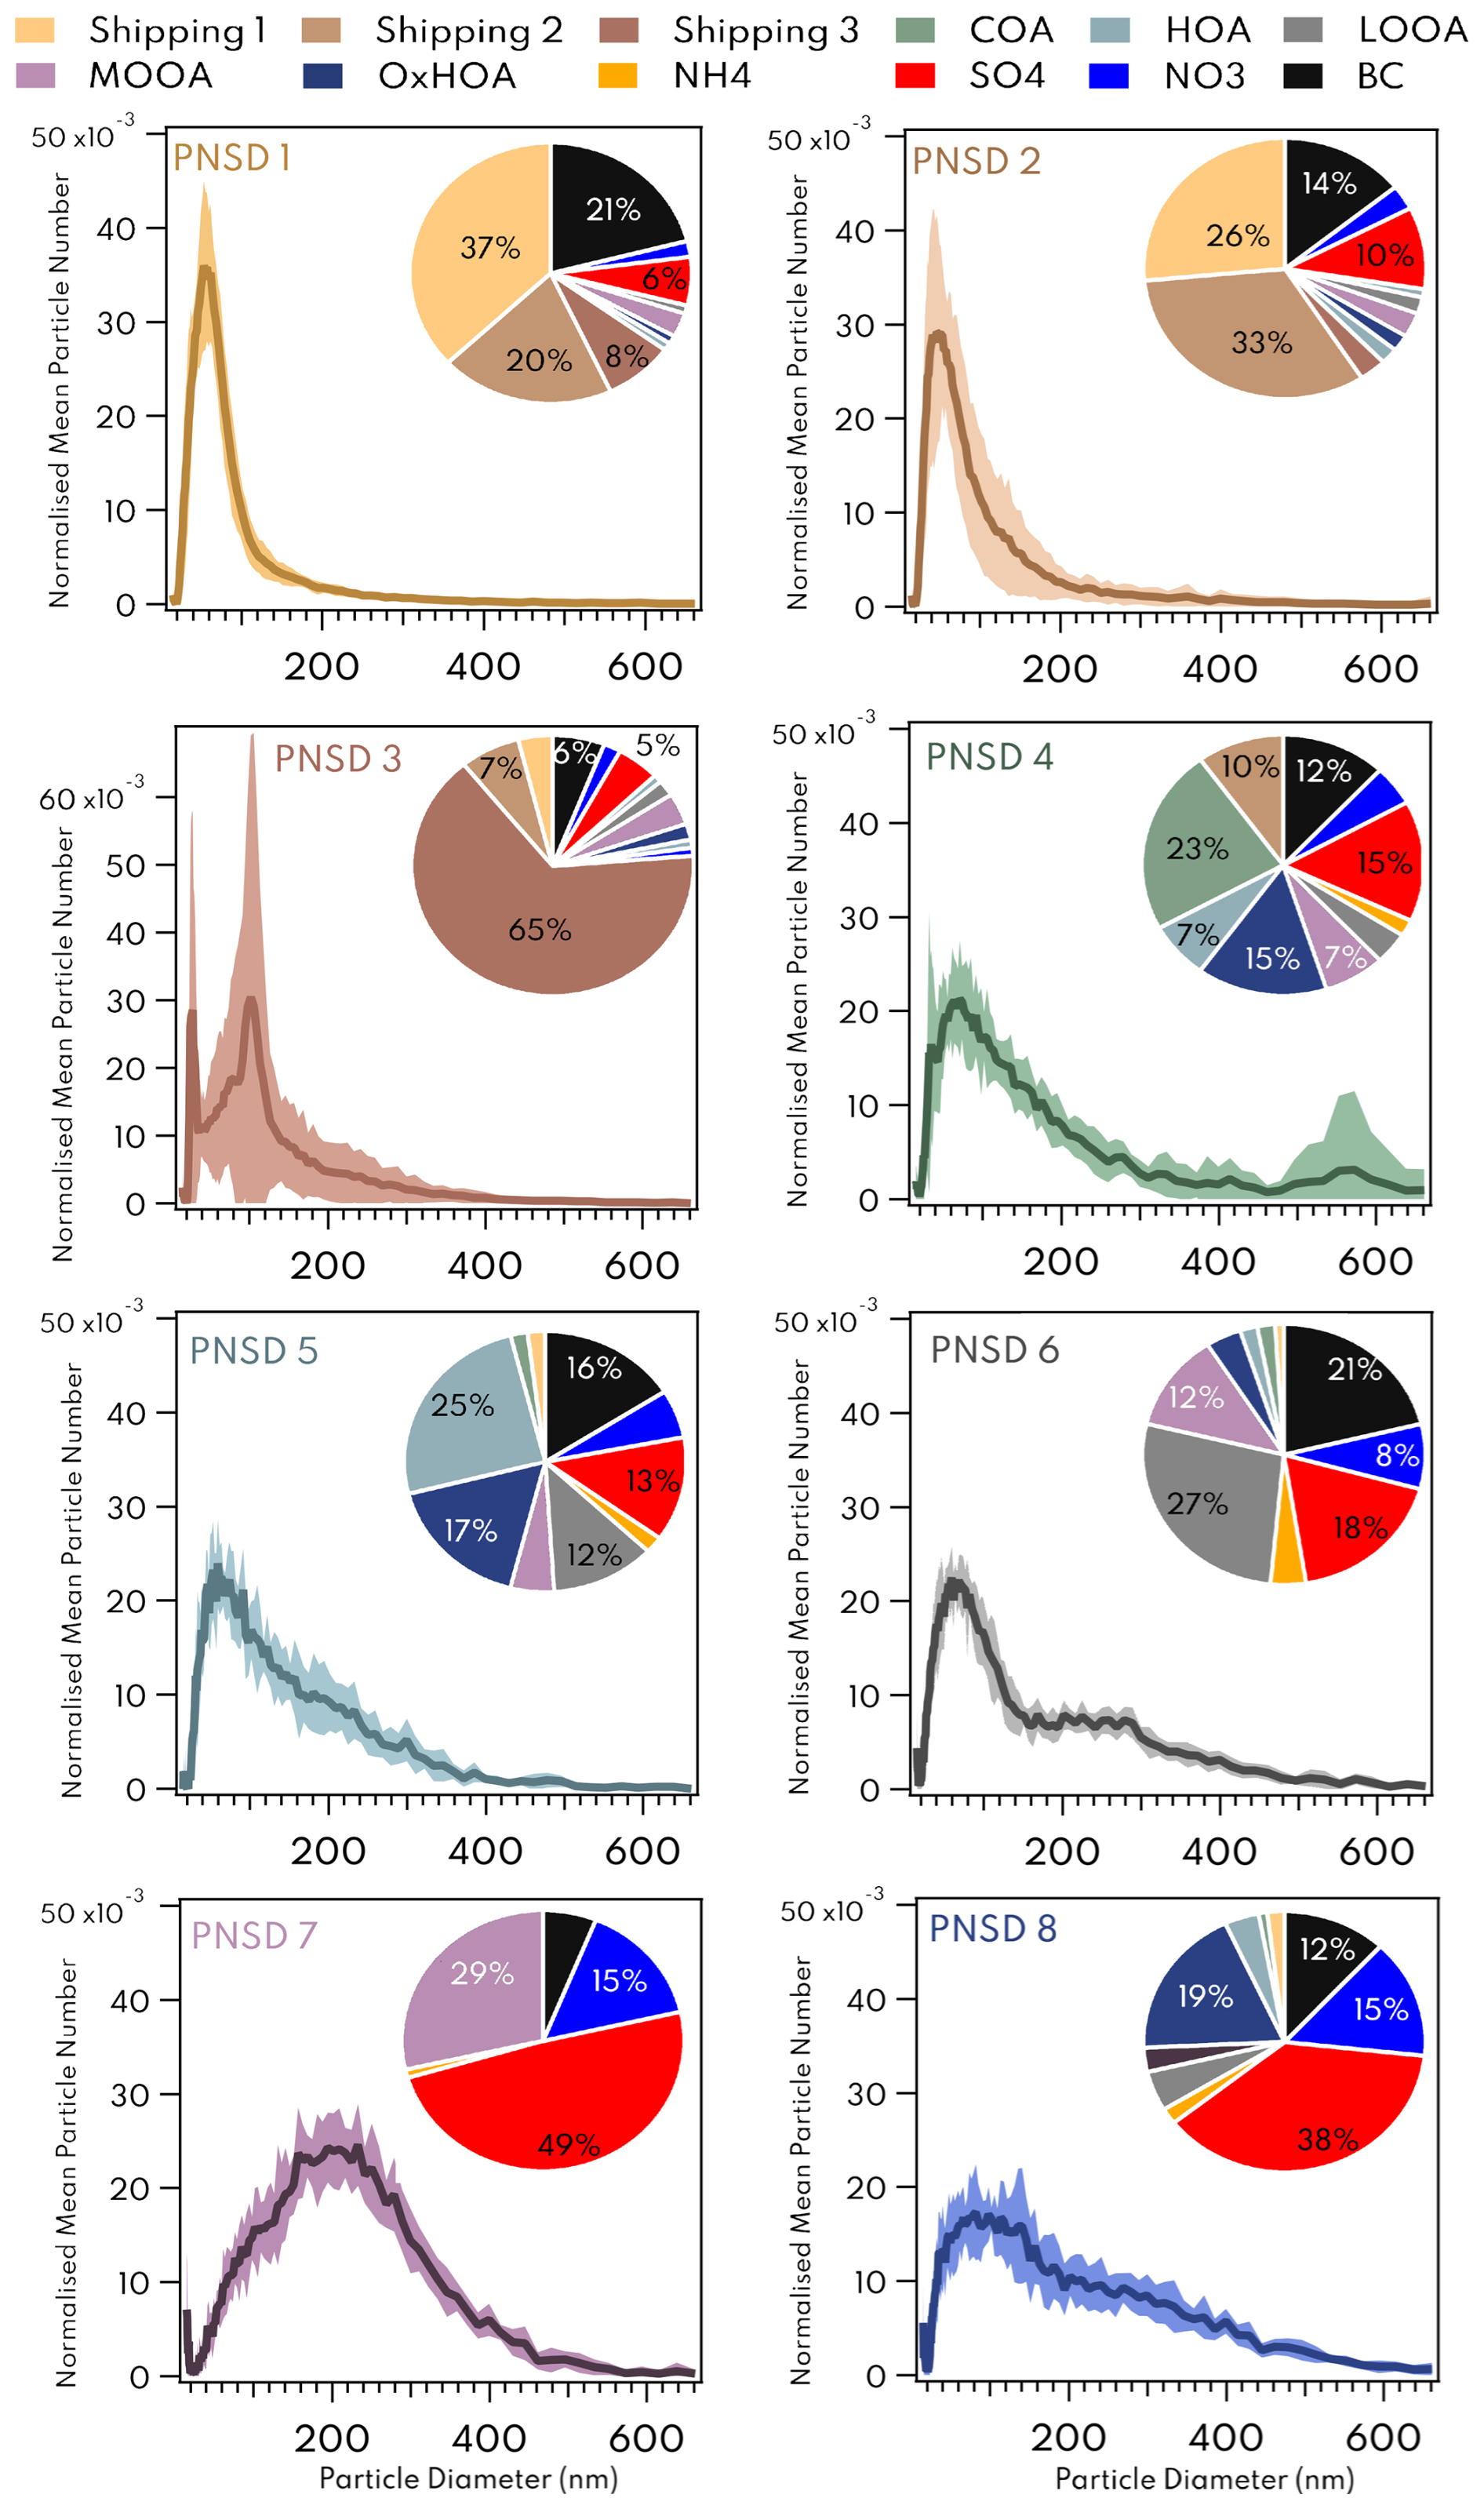
Figure 8PNSD associated with PMF factors, sampled by SMPS, with standard deviation in shaded background. Pie charts represent the mass contribution of PMF factors (OA), inorganic species, and BC during the 10 most-contributing time-points of each factor.
Our results, shown in Fig. 8, align well with the literature and reveal two typical distributions associated with the identified shipping factors. PNSD 1 and 2 are both associated with UFP, exhibiting modes around 40–50 nm, and show strong correlations with Shipping 1 and Shipping 2 factors. PNSD 1 is primarily driven by Shipping Factors 1, 2, and 3 (37 %, 20 %, and 8 %, respectively), BC (21 %), and sulfate (6 %), indicating a relatively low contribution of sulfur to shipping-related emissions. PNSD 2 is mainly associated with Shipping Factors 1 and 2 (26 % and 33 %, respectively), BC (14 %), and SO (10 %). The very similar size distributions and compositions of PNSD 1 and 2 suggest that Shipping 1 and Shipping 2 likely represent two combustion modes from the same vessel, rather than emissions from two distinct ships. This interpretation is further supported by the near-synchronous timing of their emissions. PNSD 3 presents a bimodal distribution with modes at 25 and 91 nm. It can be explained by Shipping 3 (65 %), with additional contributions from Shipping factors 1 and 2 (13 %), BC (6 %), and SO (5 %), while the remaining chemical components account for 11 % of the mass associated with this PNSD. Bimodal distributions featuring a nucleation mode around 15–20 nm and an Aitken mode around 60–100 nm have been reported for vessels operating on HFO and equipped with exhaust cleaning systems or scrubbers (Fischer et al., 2024; Kuittinen et al., 2024, 2021). Kuittinen et al. (2024) further highlighted that the use of scrubbers effectively reduced PN below 50 nm and PAH concentrations, whereas particles above 50 nm, typically comprising black carbon (BC), remained largely unaffected. Considering the chemical composition and wind analyses of PNSD 3 (Fig. S14), it is reasonable to attribute this factor to emissions from vessels equipped with scrubbers.
PNSD 4 is associated with COA and PNSD 5 is associated with HOA factors. These distributions are consistent with literature reports, with modes at 71 and 64 nm, respectively (Nursanto et al., 2023; Sowlat et al., 2016), although the two modes partially overlap. PNSDs of these factors are strongly influenced by other chemical components, as illustrated in Fig. 8. PNSD 4 is primarily explained by COA (23 %), OxHOA and SO (15 %), BC (12 %), and Shipping 2 (10 %). The PNSD 5 is related to HOA (25 %), OxHOA (17 %), BC (16 %), SO (13 %), and LOOA (12 %). Notably, the PNSD 5 is not affected by COA contribution, underscoring the effective source separation achieved by the PMF analysis.
The PNSD 6 exhibits a mode at 82 nm, slightly larger than that of HOA. This distribution is associated with LOOA (27 %), SO (18 %), BC (21 %), MOOA (12 %), and NO (8 %). The PNSD 7 represents the largest mode, centered around 200 nm, and is dominated by oxidized species such as SO (49 %), MOOA (29 %), NO (15 %), along with BC (12 %). Finally, the PNSD 8 displays a bimodal distribution, with a dominant mode around 60 nm and a secondary shoulder around 233 nm, explained by SO (38 %), OxHOA (19 %), NO (15 %), and BC (12 %).
Since several PMF factors contributed only to 20 %–30 % of the total OA, applying a fixed mass-fraction threshold would have introduced bias in the PNSD selection, biasing toward overlapping or mixed-source events. To avoid this, the ten most intense events (top ten peaks) were selected for each factor. These events represent locally dominant periods that are minimally influenced by other sources and separated by at least 10 min. This selection criterion is consistent with the temporal resolution of the SMPS (2 min per scan), which constrains its ability to resolve short-lived plumes often captured by the AMS. The use of higher time-resolution instruments, such as the EEPS (1 s resolution), would allow direct incorporation of particle number size distributions into the PMF framework. This is a direction we intend to pursue in future work to enhance the characterization of source-specific temporal and size-dependent variability.
This study, conducted in 2021 in Toulon, a major port city on the French Mediterranean coast, evaluated emissions from shipping one year after the implementation of the IMO2020 sulfur regulations. EFs for both regulated and non-regulated pollutants were determined across multiple vessel types and, when possible, for various operational phases. The low EF values observed for SO2 (0.45 g kg), sulfates (0.13 g kg), and NOx (20.7 g kg), demonstrate the effectiveness of successive regulatory measures in mitigating key emissions, in line with global efforts to improve air quality in coastal regions. In contrast, the relatively unchanged levels of BC (0.38 g kg), organics (1.73 g kg), and PAHs (6 mg kg), which remain comparable to pre-IMO2020 values, underscore the limitations of current sulfur-focused regulations in addressing other important shipping-related pollutants.
PMF analysis of the submicron OA fraction was resolved in an eight-factor solution, distinguishing five primary sources and three aged factors. Overall, shipping sources accounted for 11.2 % of the OA (3.7 % from Shipping 1, 4.6 % from Shipping 2, and 2.9 % from Shipping 3). Other primary sources were COA (5.9 %) and HOA (5.6 %). Three secondary or aged factors were also identified: OxHOA (12.4 %), LOOA (20.7 %), and MOOA (44.2 %). When both primary and partially oxidized transport-related factors were considered, the transport sector accounted for nearly 30 % of the total OA mass, as well as approximately 52 % of the APAHs, 43.6 % of the UnSubPAHs, and 30 % of the OPAHs. The three shipping factors contributed to 28 % of total PAHs, emerging as the largest source of APAHs (28 %) and significant contributors to UnSubPAHs (19.3 %), while their OPAH fraction remains limited (3.5 %), consistent with limited secondary processing near the emission source. HOA and OxHOA factors exhibited comparable contributions to PAHs, accounting for 15.3 % and 14.5 % for APAHs, 14.5 % and 9.8 % for UnSubPAHs, and 13.4 % and 13.2 % for OPAHs, respectively.
The PNSD analysis underscores that shipping activities represent a major source of UFP in the city of Toulon. Shipping emissions displayed either monomodal distributions centered around 50 nm or bimodal distributions (at 25 and 91 nm), with the latter being characteristic of vessels equipped with scrubbers. Considering the quantity of UFP emitted by ships, with a mean PN EF of 4.8 × 10¹⁵ particles kg, along with their high PAH content, and their ability to penetrate deeply into the human respiratory system due to their small size, these findings emphasize the potential health hazards associated with maritime activities, particularly in densely populated port cities like Toulon.
These results also highlight the importance of advanced source apportionment methods, which enable the differentiation between road transport and shipping transport emissions, thereby improving our understanding of their respective contributions to air quality.
Overall, this study demonstrates that although sulfur regulations have significantly reduced SO2 and sulfate emissions, the levels of organic and soot components have largely remained unchanged. Targeted measures addressing these non-sulfur pollutants, including BC, organics, and PAHs, will be essential to achieve substantial improvements in air quality and human health in coastal urban environments.
These findings are therefore critical for shaping future air quality policies, as the Mediterranean SECA comes into force in 2025.
Data from the study are available at https://doi.org/10.7910/DVN/S9KF6K (Gunti et al., 2025). More details are available upon request to the corresponding authors.
The supplement related to this article is available online at https://doi.org/10.5194/acp-26-2893-2026-supplement.
BD'A conducted the field measurements with the support of BT-R and IX-R. QG performed the analysis and wrote the paper. BD'A and AA designed the research and assured the financial support for the field campaign and the PhD scholarship. All the authors reviewed and commented on the paper.
The contact author has declared that none of the authors has any competing interests.
Publisher's note: Copernicus Publications remains neutral with regard to jurisdictional claims made in the text, published maps, institutional affiliations, or any other geographical representation in this paper. The authors bear the ultimate responsibility for providing appropriate place names. Views expressed in the text are those of the authors and do not necessarily reflect the views of the publisher.
We thank Lise Le Berre for sharing her emission factor calculation tool. We are also grateful to Sonia Culi for her valuable assistance in analyzing ship behavior at the port of Toulon.
During the writing process of this work, the authors used ChatGPT (GPT-5, OpenAI, San Francisco, CA, USA) to improve the readability and clarity of the text. The authors reviewed and edited the content to ensure the accuracy and scientific integrity of the manuscript.
This research has been supported by the Agence Nationale de la Recherche (grant no. ANR21-CE22-0015), and the Agence de la transition écologique (grant no. 2166D0028) and the Association Nationale de la Recherche et de la Technologie (grant no. 2022/0244).
This paper was edited by Allison C. Aiken and reviewed by two anonymous referees.
Aakko-Saksa, P. T., Lehtoranta, K., Kuittinen, N., Järvinen, A., Jalkanen, J.-P., Johnson, K., Jung, H., Ntziachristos, L., Gagné, S., Takahashi, C., Karjalainen, P., Rönkkö, T., and Timonen, H.: Reduction in greenhouse gas and other emissions from ship engines: Current trends and future options, Progress in Energy and Combustion Science, 94, 101055, https://doi.org/10.1016/j.pecs.2022.101055, 2023. a, b
Aiken, A. C., Salcedo, D., Cubison, M. J., Huffman, J. A., DeCarlo, P. F., Ulbrich, I. M., Docherty, K. S., Sueper, D., Kimmel, J. R., Worsnop, D. R., Trimborn, A., Northway, M., Stone, E. A., Schauer, J. J., Volkamer, R. M., Fortner, E., de Foy, B., Wang, J., Laskin, A., Shutthanandan, V., Zheng, J., Zhang, R., Gaffney, J., Marley, N. A., Paredes-Miranda, G., Arnott, W. P., Molina, L. T., Sosa, G., and Jimenez, J. L.: Mexico City aerosol analysis during MILAGRO using high resolution aerosol mass spectrometry at the urban supersite (T0) – Part 1: Fine particle composition and organic source apportionment, Atmos. Chem. Phys., 9, 6633–6653, https://doi.org/10.5194/acp-9-6633-2009, 2009. a, b
Air PACA: Impact des émissions du transport maritime sur la qualité de l'air, Tech. rep., Air PACA, https://www.observatoire-portuaire.fr/telechargement/2017-etude-bibliographique-air-et-activites-maritimes-et-portuaires-Echelle-mondiale-ilovepdf-compressed.pdf (last access: 22 February 2026), 2017. a
Alföldy, B., Lööv, J. B., Lagler, F., Mellqvist, J., Berg, N., Beecken, J., Weststrate, H., Duyzer, J., Bencs, L., Horemans, B., Cavalli, F., Putaud, J.-P., Janssens-Maenhout, G., Csordás, A. P., Van Grieken, R., Borowiak, A., and Hjorth, J.: Measurements of air pollution emission factors for marine transportation in SECA, Atmos. Meas. Tech., 6, 1777–1791, https://doi.org/10.5194/amt-6-1777-2013, 2013. a
Allouche, J., Cremoni, M., Brglez, V., Graça, D., Benzaken, S., Zorzi, K., Fernandez, C., Esnault, V., Levraut, M., Oppo, S., Jacquinot, M., Armengaud, A., Pradier, C., Bailly, L., and Seitz-Polski, B.: Air pollution exposure induces a decrease in type II interferon response: A paired cohort study, eBioMedicine, 85, https://doi.org/10.1016/j.ebiom.2022.104291, 2022. a
Anders, L., Schade, J., Rosewig, E. I., Kröger-Badge, T., Irsig, R., Jeong, S., Bendl, J., Saraji-Bozorgzad, M. R., Huang, J.-H., Zhang, F.-Y., Wang, C. C., Adam, T., Sklorz, M., Etzien, U., Buchholz, B., Czech, H., Streibel, T., Passig, J., and Zimmermann, R.: Detection of ship emissions from distillate fuel operation via single-particle profiling of polycyclic aromatic hydrocarbons, Environ. Sci.: Atmos., 3, 1134–1144, https://doi.org/10.1039/D3EA00056G, 2023. a, b
Anders, L., Schade, J., Rosewig, E. I., Schmidt, M., Irsig, R., Jeong, S., Käfer, U., Gröger, T., Bendl, J., Saraji-Bozorgzad, M. R., Adam, T., Etzien, U., Czech, H., Buchholz, B., Streibel, T., Passig, J., and Zimmermann, R.: Polycyclic aromatic hydrocarbons as fuel-dependent markers in ship engine emissions using single-particle mass spectrometry, Environ. Sci.: Atmos., 4, 708–717, https://doi.org/10.1039/D4EA00035H, 2024. a, b
Anderson, M., Salo, K., Åsa M. Hallquist, and Fridell, E.: Characterization of particles from a marine engine operating at low loads, Atmospheric Environment, 101, 65–71, https://doi.org/10.1016/j.atmosenv.2014.11.009, 2015. a
AtmoSud: Cigale by AtmoSud: geolocalized air-climate-energy inventory, https://cigale.atmosud.org (last access: September 2024), 2024. a
Ausmeel, S., Eriksson, A., Ahlberg, E., and Kristensson, A.: Methods for identifying aged ship plumes and estimating contribution to aerosol exposure downwind of shipping lanes, Atmos. Meas. Tech., 12, 4479–4493, https://doi.org/10.5194/amt-12-4479-2019, 2019. a
Bagoulla, C. and Guillotreau, P.: Maritime transport in the French economy and its impact on air pollution: An input-output analysis, Marine Policy, 116, 103818, https://doi.org/10.1016/j.marpol.2020.103818, 2020. a
Bahreini, R., Ervens, B., Middlebrook, A. M., Warneke, C., de Gouw, J. A., DeCarlo, P. F., Jimenez, J. L., Brock, C. A., Neuman, J. A., Ryerson, T. B., Stark, H., Atlas, E., Brioude, J., Fried, A., Holloway, J. S., Peischl, J., Richter, D., Walega, J., Weibring, P., Wollny, A. G., and Fehsenfeld, F. C.: Organic aerosol formation in urban and industrial plumes near Houston and Dallas, Texas, Journal of Geophysical Research: Atmospheres, 114, https://doi.org/10.1029/2008JD011493, 2009. a
Bai, C., Li, Y., Liu, B., Zhang, Z., and Wu, P.: Gaseous Emissions from a Seagoing Ship under Different Operating Conditions in the Coastal Region of China, Atmosphere, 11, https://doi.org/10.3390/atmos11030305, 2020. a
Betha, R., Russell, L., Sanchez, K., Liu, J., Price, D., Lamjiri, M., Chen, C.-L., Kuang, X., Da Rocha, G., Paulson, S., Miller, J., and Cocker, D.: Lower NOx but Higher Particle and Black Carbon Emissions from Renewable Diesel compared to Ultra Low Sulfur Diesel in At-Sea Operations of a Research Vessel, Aerosol Science and Technology, 51, https://doi.org/10.1080/02786826.2016.1238034, 2016. a, b, c, d, e
Bougiatioti, A., Stavroulas, I., Kostenidou, E., Zarmpas, P., Theodosi, C., Kouvarakis, G., Canonaco, F., Prévôt, A. S. H., Nenes, A., Pandis, S. N., and Mihalopoulos, N.: Processing of biomass-burning aerosol in the eastern Mediterranean during summertime, Atmos. Chem. Phys., 14, 4793–4807, https://doi.org/10.5194/acp-14-4793-2014, 2014. a, b
Bove, M., Brotto, P., Calzolai, G., Cassola, F., Cavalli, F., Fermo, P., Hjorth, J., Massabò, D., Nava, S., Piazzalunga, A., Schembari, C., and Prati, P.: PM10 source apportionment applying PMF and chemical tracer analysis to ship-borne measurements in the Western Mediterranean, Atmospheric Environment, 125, 140–151, https://doi.org/10.1016/j.atmosenv.2015.11.009, 2016. a
Bozzetti, C., El Haddad, I., Salameh, D., Daellenbach, K. R., Fermo, P., Gonzalez, R., Minguillón, M. C., Iinuma, Y., Poulain, L., Elser, M., Müller, E., Slowik, J. G., Jaffrezo, J.-L., Baltensperger, U., Marchand, N., and Prévôt, A. S. H.: Organic aerosol source apportionment by offline-AMS over a full year in Marseille, Atmos. Chem. Phys., 17, 8247–8268, https://doi.org/10.5194/acp-17-8247-2017, 2017. a, b
Brinkman, G., Vance, G., Hannigan, M. P., and Milford, J. B.: Use of Synthetic Data to Evaluate Positive Matrix Factorization as a Source Apportionment Tool for PM2.5 Exposure Data, Environmental Science & Technology, 40, 1892–1901, https://doi.org/10.1021/es051712y, 2006. a
Brown, S. G., Eberly, S., Paatero, P., and Norris, G. A.: Methods for estimating uncertainty in PMF solutions: Examples with ambient air and water quality data and guidance on reporting PMF results, Science of The Total Environment, 518–519, 626–635, https://doi.org/10.1016/j.scitotenv.2015.01.022, 2015. a
Calderón-Garcidueñas, L. and Ayala, A.: Air Pollution, Ultrafine Particles, and Your Brain: Are Combustion Nanoparticle Emissions and Engineered Nanoparticles Causing Preventable Fatal Neurodegenerative Diseases and Common Neuropsychiatric Outcomes?, Environmental Science & Technology, 56, 6847–6856, https://doi.org/10.1021/acs.est.1c04706, 2022. a
Canagaratna, M., Jayne, J., Jimenez, J., Allan, J., Alfarra, M., Zhang, Q., Onasch, T., Drewnick, F., Coe, H., Middlebrook, A., Delia, A., Williams, L., Trimborn, A., Northway, M., DeCarlo, P., Kolb, C., Davidovits, P., and Worsnop, D.: Chemical and microphysical characterization of ambient erosols with the aerodyne aerosol mass spectrometer, Mass Spectrometry Reviews, 26, 185–222, https://doi.org/10.1002/mas.20115, 2007. a, b
Canonaco, F., Crippa, M., Slowik, J. G., Baltensperger, U., and Prévôt, A. S. H.: SoFi, an IGOR-based interface for the efficient use of the generalized multilinear engine (ME-2) for the source apportionment: ME-2 application to aerosol mass spectrometer data, Atmos. Meas. Tech., 6, 3649–3661, https://doi.org/10.5194/amt-6-3649-2013, 2013. a, b
Canonaco, F., Tobler, A., Chen, G., Sosedova, Y., Slowik, J. G., Bozzetti, C., Daellenbach, K. R., El Haddad, I., Crippa, M., Huang, R.-J., Furger, M., Baltensperger, U., and Prévôt, A. S. H.: A new method for long-term source apportionment with time-dependent factor profiles and uncertainty assessment using SoFi Pro: application to 1 year of organic aerosol data, Atmos. Meas. Tech., 14, 923–943, https://doi.org/10.5194/amt-14-923-2021, 2021. a, b
Cash, J. M., Langford, B., Di Marco, C., Mullinger, N. J., Allan, J., Reyes-Villegas, E., Joshi, R., Heal, M. R., Acton, W. J. F., Hewitt, C. N., Misztal, P. K., Drysdale, W., Mandal, T. K., Shivani, Gadi, R., Gurjar, B. R., and Nemitz, E.: Seasonal analysis of submicron aerosol in Old Delhi using high-resolution aerosol mass spectrometry: chemical characterisation, source apportionment and new marker identification, Atmos. Chem. Phys., 21, 10133–10158, https://doi.org/10.5194/acp-21-10133-2021, 2021. a
Celik, S., Drewnick, F., Fachinger, F., Brooks, J., Darbyshire, E., Coe, H., Paris, J.-D., Eger, P. G., Schuladen, J., Tadic, I., Friedrich, N., Dienhart, D., Hottmann, B., Fischer, H., Crowley, J. N., Harder, H., and Borrmann, S.: Influence of vessel characteristics and atmospheric processes on the gas and particle phase of ship emission plumes: in situ measurements in the Mediterranean Sea and around the Arabian Peninsula, Atmos. Chem. Phys., 20, 4713–4734, https://doi.org/10.5194/acp-20-4713-2020, 2020. a, b, c, d, e, f, g, h, i, j, k
Chazeau, B., El Haddad, I., Canonaco, F., Temime-Roussel, B., D'Anna, B., Gille, G., Mesbah, B., Prévôt, A. S., Wortham, H., and Marchand, N.: Organic aerosol source apportionment by using rolling positive matrix factorization: Application to a Mediterranean coastal city, Atmospheric Environment: X, 14, 100176, https://doi.org/10.1016/j.aeaoa.2022.100176, 2022. a, b, c
Chen, G., Canonaco, F., Slowik, J. G., Daellenbach, K. R., Tobler, A., Petit, J.-E., Favez, O., Stavroulas, I., Mihalopoulos, N., Gerasopoulos, E., El Haddad, I., Baltensperger, U., and Prévôt, A. S. H.: Real-Time Source Apportionment of Organic Aerosols in Three European Cities, Environmental Science & Technology, 56, 15290–15297, https://doi.org/10.1021/acs.est.2c02509, 2022. a
Chen, H., Kwong, J. C., Copes, R., Tu, K., Villeneuve, P. J., van Donkelaar, A., Hystad, P., Martin, R. V., Murray, B. J., Jessiman, B., Wilton, A. S., Kopp, A., and Burnett, R. T.: Living near major roads and the incidence of dementia, Parkinson's disease, and multiple sclerosis: a population-based cohort study, The Lancet, 389, 718–726, https://doi.org/10.1016/S0140-6736(16)32399-6, 2017. a
Cooper, D.: Exhaust emissions from ships at berth, Atmospheric Environment, 37, 3817–3830, https://doi.org/10.1016/S1352-2310(03)00446-1, 2003. a
Crippa, M., El Haddad, I., Slowik, J. G., DeCarlo, P. F., Mohr, C., Heringa, M. F., Chirico, R., Marchand, N., Sciare, J., Baltensperger, U., and Prévôt, A. S. H.: Identification of marine and continental aerosol sources in Paris using high resolution aerosol mass spectrometry, Journal of Geophysical Research: Atmospheres, 118, 1950–1963, https://doi.org/10.1002/jgrd.50151, 2013. a, b, c
Dall'Osto, M., Paglione, M., Decesari, S., Facchini, M., O'Dowd, C., Plass-Duellmer, C., and Harrison, R.: On the Origin of AMS “Cooking Organic Aerosol” at a Rural Site, Environmental Science and Technology, https://doi.org/10.1021/acs.est.5b02922, 2015. a
DeCarlo, P. F., Kimmel, J. R., Trimborn, A., Northway, M. J., Jayne, J. T., Aiken, A. C., Gonin, M., Fuhrer, K., Horvath, T., Docherty, K. S., Worsnop, D. R., and Jimenez, J. L.: Field-Deployable, High-Resolution, Time-of-Flight Aerosol Mass Spectrometer, Analytical Chemistry, 78, 8281–8289, https://doi.org/10.1021/ac061249n, 2006. a, b
de Souza, C. V. and Corrêa, S. M.: Polycyclic aromatic hydrocarbons in diesel emission, diesel fuel and lubricant oil, Fuel, 185, 925–931, https://doi.org/10.1016/j.fuel.2016.08.054, 2016. a
Diesch, J.-M., Drewnick, F., Klimach, T., and Borrmann, S.: Investigation of gaseous and particulate emissions from various marine vessel types measured on the banks of the Elbe in Northern Germany, Atmos. Chem. Phys., 13, 3603–3618, https://doi.org/10.5194/acp-13-3603-2013, 2013. a, b, c, d, e, f, g, h, i
Docherty, K. S., Aiken, A. C., Huffman, J. A., Ulbrich, I. M., DeCarlo, P. F., Sueper, D., Worsnop, D. R., Snyder, D. C., Peltier, R. E., Weber, R. J., Grover, B. D., Eatough, D. J., Williams, B. J., Goldstein, A. H., Ziemann, P. J., and Jimenez, J. L.: The 2005 Study of Organic Aerosols at Riverside (SOAR-1): instrumental intercomparisons and fine particle composition, Atmos. Chem. Phys., 11, 12387–12420, https://doi.org/10.5194/acp-11-12387-2011, 2011. a, b
Drosatou, A. D., Skyllakou, K., Theodoritsi, G. N., and Pandis, S. N.: Positive matrix factorization of organic aerosol: insights from a chemical transport model, Atmos. Chem. Phys., 19, 973–986, https://doi.org/10.5194/acp-19-973-2019, 2019. a
Ducruet, C., Polo Martin, B., Sene, M. A., Lo Prete, M., Sun, L., Itoh, H., and Pigné, Y.: Ports and their influence on local air pollution and public health: A global analysis, Science of The Total Environment, 915, 170099, https://doi.org/10.1016/j.scitotenv.2024.170099, 2024. a
Dzepina, K., Arey, J., Marr, L. C., Worsnop, D. R., Salcedo, D., Zhang, Q., Onasch, T. B., Molina, L. T., Molina, M. J., and Jimenez, J. L.: Detection of particle-phase polycyclic aromatic hydrocarbons in Mexico City using an aerosol mass spectrometer, International Journal of Mass Spectrometry, 263, 152–170, https://doi.org/10.1016/j.ijms.2007.01.010, 2007. a
EEA: Towards clean and smart mobility – transport and environment in Europe, Tech. rep., European Environment Agency, https://doi.org/10.2800/090074, 2016. a
EEA: Aviation and shipping – impacts on Europe's environment, TERM 2017: Transport and Environment Reporting Mechanism (TERM) report, Tech. Rep. 22/2017, European Environment Agency, https://doi.org/10.2800/4907, 2018. a
Efron, B.: Bootstrap Methods: Another Look at the Jackknife, The Annals of Statistics, 7, 1–26, 1979. a
Eger, P., Mathes, T., Zavarsky, A., and Duester, L.: Measurement report: Inland ship emissions and their contribution to NOx and ultrafine particle concentrations at the Rhine, Atmos. Chem. Phys., 23, 8769–8788, https://doi.org/10.5194/acp-23-8769-2023, 2023. a
Elser, M., Bozzetti, C., El-Haddad, I., Maasikmets, M., Teinemaa, E., Richter, R., Wolf, R., Slowik, J. G., Baltensperger, U., and Prévôt, A. S. H.: Urban increments of gaseous and aerosol pollutants and their sources using mobile aerosol mass spectrometry measurements, Atmos. Chem. Phys., 16, 7117–7134, https://doi.org/10.5194/acp-16-7117-2016, 2016. a, b, c, d, e
European Environment Agency (EEA): The impact of international shipping on European air quality and climate forcing, EEA Technical Report No. 4/2013, Publications Office of the European Union, Luxembourg, https://doi.org/10.2800/75763, 2013a. a
European Environment Agency (EEA): Environmental pressures from European consumption and production – A study in integrated environmental and economic analysis, Publications Office of the European Union, Luxembourg, https://doi.org/10.2800/70634, 2013b. a
Eurostat: International trade in goods by mode of transport, https://ec.europa.eu/eurostat/statistics-explained/index.php? (last access: 11 June 2024), 2023. a
Eyring, V., Isaksen, I. S., Berntsen, T., Collins, W. J., Corbett, J. J., Endresen, O., Grainger, R. G., Moldanova, J., Schlager, H., and Stevenson, D. S.: Transport impacts on atmosphere and climate: Shipping, Atmospheric Environment, 44, 4735–4771, https://doi.org/10.1016/j.atmosenv.2009.04.059, 2010. a, b
Fischer, D., Vith, W., and Unger, J. L.: Assessing particulate emissions of novel synthetic fuels and fossil fuels under different operating conditions of a marine engine and the impact of a closed-loop scrubber, J. Mar. Sci. Eng., 12, 1144, https://doi.org/10.3390/jmse12071144, 2024. a
Fossum, K. N., Lin, C., O'Sullivan, N., Lei, L., Hellebust, S., Ceburnis, D., Afzal, A., Tremper, A., Green, D., Jain, S., Byčenkienė, S., O'Dowd, C., Wenger, J., and Ovadnevaite, J.: Two distinct ship emission profiles for organic-sulfate source apportionment of PM in sulfur emission control areas, Atmos. Chem. Phys., 24, 10815–10831, https://doi.org/10.5194/acp-24-10815-2024, 2024. a, b, c
Frenklach, M.: Reaction mechanism of soot formation in flames, Phys. Chem. Chem. Phys., 4, 2028–2037, https://doi.org/10.1039/B110045A, 2002. a
Garcia-Marlès, M., Lara, R., Reche, C., Pérez, N., Tobías, A., Savadkoohi, M., Beddows, D., Salma, I., Vörösmarty, M., Weidinger, T., Hueglin, C., Mihalopoulos, N., Grivas, G., Kalkavouras, P., Ondráček, J., Zíková, N., Niemi, J. V., Manninen, H. E., Green, D. C., Tremper, A. H., Norman, M., Vratolis, S., Eleftheriadis, K., Gómez-Moreno, F. J., Alonso-Blanco, E., Wiedensohler, A., Weinhold, K., Merkel, M., Bastian, S., Hoffmann, B., Altug, H., Petit, J.-E., Favez, O., Dos Santos, S. M., Putaud, J.-P., Dinoi, A., Contini, D., Timonen, H., Lampilahti, J., Petäjä, T., Pandolfi, M., Hopke, P. K., Harrison, R. M., Alastuey, A., and Querol, X.: Inter-annual trends of ultrafine particles in urban Europe, Environment International, 185, 108510, https://doi.org/10.1016/j.envint.2024.108510, 2024. a
Goodings, J., Bohme, D., and Ng, C.-W.: Detailed ion chemistry in methane-oxygen flames. I. Positive ions, Combustion and Flame, 36, 27–43, https://doi.org/10.1016/0010-2180(79)90044-0, 1979. a
Grande, G., Ljungman, P. L. S., Eneroth, K., Bellander, T., and Rizzuto, D.: Association Between Cardiovascular Disease and Long-term Exposure to Air Pollution With the Risk of Dementia, JAMA Neurology, 77, 801–809, https://doi.org/10.1001/jamaneurol.2019.4914, 2020. a
Grigoriadis, A., Mamarikas, S., Ioannidis, I., Majamäki, E., Jalkanen, J.-P., and Ntziachristos, L.: Development of exhaust emission factors for vessels: A review and meta-analysis of available data, Atmospheric Environment: X, 12, 100142, https://doi.org/10.1016/j.aeaoa.2021.100142, 2021. a
Grigoriadis, A., Kousias, N., Raptopoulos-Chatzistefanou, A., Salberg, H., Moldanová, J., Hermansson, A.-L., Cha, Y., Kontses, A., Toumasatos, Z., Mamarikas, S., and Ntziachristos, L.: Particulate and Gaseous Emissions from a Large Two-Stroke Slow-Speed Marine Engine Equipped with Open-Loop Scrubber under Real Sailing Conditions, Atmosphere, 15, 845, https://doi.org/10.3390/atmos15070845, 2024. a
Gunti, Q., Chazeau, B., Temime-Roussel, B., Xueref-Remy, I., Armengaud, A., Wortham, H., and D'Anna, B.: Data for Emission factors and OA source apportionment for deconvoluating shipping sources in the coastal city of Toulon, France, Harvard Dataverse, V1 [data set], https://doi.org/10.7910/DVN/S9KF6K, 2025. a
Hayes, P. L., Ortega, A. M., Cubison, M. J., Froyd, K. D., Zhao, Y., Cliff, S. S., Hu, W. W., Toohey, D. W., Flynn, J. H., Lefer, B. L., Grossberg, N., Alvarez, S., Rappenglück, B., Taylor, J. W., Allan, J. D., Holloway, J. S., Gilman, J. B., Kuster, W. C., de Gouw, J. A., Massoli, P., Zhang, X., Liu, J., Weber, R. J., Corrigan, A. L., Russell, L. M., Isaacman, G., Worton, D. R., Kreisberg, N. M., Goldstein, A. H., Thalman, R., Waxman, E. M., Volkamer, R., Lin, Y. H., Surratt, J. D., Kleindienst, T. E., Offenberg, J. H., Dusanter, S., Griffith, S., Stevens, P. S., Brioude, J., Angevine, W. M., and Jimenez, J. L.: Organic aerosol composition and sources in Pasadena, California, during the 2010 CalNex campaign, Journal of Geophysical Research: Atmospheres, 118, 9233–9257, https://doi.org/10.1002/jgrd.50530, 2013. a, b, c
Heikkilä, M., Luoma, K., Mäkelä, T., and Grönholm, T.: The local ship speed reduction effect on black carbon emissions measured at a remote marine station, Atmos. Chem. Phys., 24, 8927–8941, https://doi.org/10.5194/acp-24-8927-2024, 2024. a, b
Herring, C. L., Faiola, C. L., Massoli, P., Sueper, D., Erickson, M. H., McDonald, J. D., Yost, C. D. S. M. G., Jobson, B. T., and VanReken, T. M.: New Methodology for Quantifying Polycyclic Aromatic Hydrocarbons (PAHs) Using High-Resolution Aerosol Mass Spectrometry, Aerosol Science and Technology, 49, 1131–1148, https://doi.org/10.1080/02786826.2015.1101050, 2015. a, b
Hu, W., Hu, M., Hu, W., Jimenez, J. L., Yuan, B., Chen, W., Wang, M., Wu, Y., Chen, C., Wang, Z., Peng, J., Zeng, L., and Shao, M.: Chemical composition, sources, and aging process of submicron aerosols in Beijing: Contrast between summer and winter, Journal of Geophysical Research: Atmospheres, 121, 1955–1977, https://doi.org/10.1002/2015JD024020, 2016. a, b
Hu, W., Day, D. A., Campuzano-Jost, P., Nault, B. A., Park, T., Lee, T., Croteau, P., Canagaratna, M. R., Jayne, J. T., Worsnop, D. R., and Jimenez, J. L.: Evaluation of the new capture vaporizer for aerosol mass spectrometers: Characterization of organic aerosol mass spectra, Aerosol Science and Technology, 52, 725–739, https://doi.org/10.1080/02786826.2018.1454584, 2018. a
Hu, W. W., Hu, M., Yuan, B., Jimenez, J. L., Tang, Q., Peng, J. F., Hu, W., Shao, M., Wang, M., Zeng, L. M., Wu, Y. S., Gong, Z. H., Huang, X. F., and He, L. Y.: Insights on organic aerosol aging and the influence of coal combustion at a regional receptor site of central eastern China, Atmos. Chem. Phys., 13, 10095–10112, https://doi.org/10.5194/acp-13-10095-2013, 2013. a
Huang, C., Hu, Q., Wang, H., Qiao, L., Jing, S., Wang, H., Zhou, M., Zhu, S., Ma, Y., Lou, S., Li, L., Tao, S., Li, Y., and Lou, D.: Emission factors of particulate and gaseous compounds from a large cargo vessel operated under real-world conditions, Environmental Pollution, 242, 667–674, https://doi.org/10.1016/j.envpol.2018.07.036, 2018. a
International Maritime Organization: Fourth IMO Greenhouse Gas Study, https://www.imo.org/en/OurWork/Environment/Pages/Fourth-IMO-Greenhouse-Gas-Study-2020.aspx (last access: May 2025), 2020. a
International Maritime Organization: Clause-by-Clause Analysis of MARPOL Annex VI, https://www.imo.org, (last access: May 2025), 2021. a
Jaikumar, R., Shiva Nagendra, S., and Sivanandan, R.: Modeling of real time exhaust emissions of passenger cars under heterogeneous traffic conditions, Atmospheric Pollution Research, 8, 80–88, https://doi.org/10.1016/j.apr.2016.07.011, 2017. a
Jeon, S., Walker, M. J., Sueper, D. T., Day, D. A., Handschy, A. V., Jimenez, J. L., and Williams, B. J.: A searchable database and mass spectral comparison tool for the Aerosol Mass Spectrometer (AMS) and the Aerosol Chemical Speciation Monitor (ACSM), Atmos. Meas. Tech., 16, 6075–6095, https://doi.org/10.5194/amt-16-6075-2023, 2023. a
Ježek, I., Drinovec, L., Ferrero, L., Carriero, M., and Močnik, G.: Determination of car on-road black carbon and particle number emission factors and comparison between mobile and stationary measurements, Atmos. Meas. Tech., 8, 43–55, https://doi.org/10.5194/amt-8-43-2015, 2015. a
Jung, C.-R., Lin, Y.-T., and Hwang, B.-F.: Ozone, Particulate Matter, and Newly Diagnosed Alzheimer's Disease: A Population-Based Cohort Study in Taiwan, Journal of Alzheimer's Disease, 44, 573–584, https://doi.org/10.3233/JAD-140855, 2015. a
Kamal, R. S., Badr, E. E., Mishrif, M. R., and AbdEl-Sattar, N. E.: Oleic acid-based compounds as lube oil additives for engine oil, Egyptian Journal of Petroleum, 32, 33–39, https://doi.org/10.1016/j.ejpe.2023.01.002, 2023. a
Karjalainen, P., Teinilä, K., Kuittinen, N., Aakko-Saksa, P., Bloss, M., Vesala, H., Pettinen, R., Saarikoski, S., Jalkanen, J.-P., and Timonen, H.: Real-world particle emissions and secondary aerosol formation from a diesel oxidation catalyst and scrubber equipped ship operating with two fuels in a SECA area, Environmental Pollution, 292, 118278, https://doi.org/10.1016/j.envpol.2021.118278, 2022. a
Kiihamäki, S.-P., Korhonen, M., Kukkonen, J., Shiue, I., and Jaakkola, J. J.: Effects of ambient air pollution from shipping on mortality: A systematic review, Science of The Total Environment, 945, 173714, https://doi.org/10.1016/j.scitotenv.2024.173714, 2024. a
Kostenidou, E., Lee, B.-H., Engelhart, G. J., Pierce, J. R., and Pandis, S. N.: Mass Spectra Deconvolution of Low, Medium, and High Volatility Biogenic Secondary Organic Aerosol, Environmental Science & Technology, 43, 4884–4889, https://doi.org/10.1021/es803676g, 2009. a, b
Kostenidou, E., Martinez-Valiente, A., R'Mili, B., Marques, B., Temime-Roussel, B., Durand, A., André, M., Liu, Y., Louis, C., Vansevenant, B., Ferry, D., Laffon, C., Parent, P., and D'Anna, B.: Technical note: Emission factors, chemical composition, and morphology of particles emitted from Euro 5 diesel and gasoline light-duty vehicles during transient cycles, Atmos. Chem. Phys., 21, 4779–4796, https://doi.org/10.5194/acp-21-4779-2021, 2021. a, b, c, d
Kuittinen, N., Jalkanen, J.-P., Alanen, J., Ntziachristos, L., Hannuniemi, H., Johansson, L., Karjalainen, P., Saukko, E., Isotalo, M., Aakko-Saksa, P., Lehtoranta, K., Keskinen, J., Simonen, P., Saarikoski, S., Asmi, E., Laurila, T., Hillamo, R., Mylläri, F., Lihavainen, H., Timonen, H., and Rönkkö, T.: Shipping Remains a Globally Significant Source of Anthropogenic PN Emissions Even after 2020 Sulfur Regulation, Environmental Science & Technology, 55, 129–138, https://doi.org/10.1021/acs.est.0c03627, 2021. a
Kuittinen, N., Timonen, H., Karjalainen, P., Murtonen, T., Vesala, H., Bloss, M., Honkanen, M., Lehtoranta, K., Aakko-Saksa, P., and Rönkkö, T.: In-depth characterization of exhaust particles performed on-board a modern cruise ship applying a scrubber, Science of The Total Environment, 946, 174052, https://doi.org/10.1016/j.scitotenv.2024.174052, 2024. a, b, c
Laasma, A., Otsason, R., Tapaninen, U., and Hilmola, O.-P.: Evaluation of Alternative Fuels for Coastal Ferries, Sustainability, 14, https://doi.org/10.3390/su142416841, 2022. a
Lack, D. A., Corbett, J. J., Onasch, T., Lerner, B., Massoli, P., Quinn, P. K., Bates, T. S., Covert, D. S., Coffman, D., Sierau, B., Herndon, S., Allan, J., Baynard, T., Lovejoy, E., Ravishankara, A. R., and Williams, E.: Particulate emissions from commercial shipping: Chemical, physical, and optical properties, Journal of Geophysical Research: Atmospheres, 114, https://doi.org/10.1029/2008JD011300, 2009. a
Lanz, V. A., Alfarra, M. R., Baltensperger, U., Buchmann, B., Hueglin, C., Szidat, S., Wehrli, M. N., Wacker, L., Weimer, S., Caseiro, A., Puxbaum, H., and Prevot, A. S. H.: Source Attribution of Submicron Organic Aerosols during Wintertime Inversions by Advanced Factor Analysis of Aerosol Mass Spectra, Environmental Science & Technology, 42, 214–220, https://doi.org/10.1021/es0707207, 2008. a
Le Berre, L., Temime-Roussel, B., Lanzafame, G. M., D'Anna, B., Marchand, N., Sauvage, S., Dufresne, M., Tinel, L., Leonardis, T., Ferreira de Brito, J., Armengaud, A., Gille, G., Lanzi, L., Bourjot, R., and Wortham, H.: Measurement report: In-depth characterization of ship emissions during operations in a Mediterranean port, Atmos. Chem. Phys., 25, 6575–6605, https://doi.org/10.5194/acp-25-6575-2025, 2025. a, b, c, d, e, f, g, h, i, j, k, l, m
Liu, P., Deng, R., Smith, K., Williams, L., Jayne, J., Canagaratna, M., Moore, K., Onasch, T., Worsnop, D., and Deshler, T.: Transmission Efficiency of an Aerodynamic Focusing Lens System: Comparison of Model Calculations and Laboratory Measurements for the Aerodyne Aerosol Mass Spectrometer, Aerosol Sci. Tech., 41, 721–733, https://doi.org/10.1080/02786820701422278, 2007. a
Lou, H., Hao, Y., Zhang, W., Su, P., Zhang, F., Chen, Y., Feng, D., and Li, Y.: Emission of intermediate volatility organic compounds from a ship main engine burning heavy fuel oil, Journal of Environmental Sciences, 84, 197–204, https://doi.org/10.1016/j.jes.2019.04.029, 2019. a
Marimuthu, A. N., Sundelin, D., Thorwirth, S., Redlich, B., Geppert, W. D., and Brünken, S.: Laboratory gas-phase vibrational spectra of [C3H3]+ isomers and isotopologues by IRPD spectroscopy, Journal of Molecular Spectroscopy, 374, 111377, https://doi.org/10.1016/j.jms.2020.111377, 2020. a
Marques, B., Kostenidou, E., Valiente, A. M., Vansevenant, B., Sarica, T., Fine, L., Temime-Roussel, B., Tassel, P., Perret, P., Liu, Y., Sartelet, K., Ferronato, C., and D'Anna, B.: Detailed speciation of non-methane volatile organic compounds in exhaust emissions from diesel and gasoline Euro 5 vehicles using online and offline measurements, Toxics, 10, 184, https://doi.org/10.3390/toxics10040184, 2022. a
Matthew, B. M., Middlebrook, A. M., and Onasch, T. B.: Collection Efficiencies in an Aerodyne Aerosol Mass Spectrometer as a Function of Particle Phase for Laboratory Generated Aerosols, Aerosol Science and Technology, 42, 884–898, https://doi.org/10.1080/02786820802356797, 2008. a
McLafferty, F. W. and Tureček, F.: Interpretation of mass spectra, 4th edn., University Science Books, Mill Valley (Calif.), ISBN 0935702253, 1993. a
Merico, E., Gambaro, A., Argiriou, A., Alebic-Juretic, A., Barbaro, E., Cesari, D., Chasapidis, L., Dimopoulos, S., Dinoi, A., Donateo, A., Giannaros, C., Gregoris, E., Karagiannidis, A., Konstandopoulos, A., Ivošević, T., Liora, N., Melas, D., Mifka, B., Orlić, I., Poupkou, A., Sarovic, K., Tsakis, A., Giua, R., Pastore, T., Nocioni, A., and Contini, D.: Atmospheric impact of ship traffic in four Adriatic-Ionian port-cities: Comparison and harmonization of different approaches, Transportation Research Part D: Transport and Environment, 50, 431–445, https://doi.org/10.1016/j.trd.2016.11.016, 2017. a
Middlebrook, A. M., Roya Bahreini, J. L. J., and Canagaratna, M. R.: Evaluation of Composition-Dependent Collection Efficiencies for the Aerodyne Aerosol Mass Spectrometer using Field Data, Aerosol Science and Technology, 46, 258–271, https://doi.org/10.1080/02786826.2011.620041, 2012. a
Minguillón, M. C., Arhami, M., Schauer, J. J., and Sioutas, C.: Seasonal and spatial variations of sources of fine and quasi-ultrafine particulate matter in neighborhoods near the Los Angeles–Long Beach harbor, Atmospheric Environment, 42, 7317–7328, https://doi.org/10.1016/j.atmosenv.2008.07.036, 2008. a
Mohr, C., DeCarlo, P. F., Heringa, M. F., Chirico, R., Slowik, J. G., Richter, R., Reche, C., Alastuey, A., Querol, X., Seco, R., Peñuelas, J., Jiménez, J. L., Crippa, M., Zimmermann, R., Baltensperger, U., and Prévôt, A. S. H.: Identification and quantification of organic aerosol from cooking and other sources in Barcelona using aerosol mass spectrometer data, Atmos. Chem. Phys., 12, 1649–1665, https://doi.org/10.5194/acp-12-1649-2012, 2012. a, b, c
Moldanová, J.: Measurement Campaign for Characterising and Monitoring of Emissions from Vessel with Alternative Fuels and NOx Emission Control, in preparation, 2026. a
Moldanová, J., Fridell, E., Winnes, H., Holmin-Fridell, S., Boman, J., Jedynska, A., Tishkova, V., Demirdjian, B., Joulie, S., Bladt, H., Ivleva, N. P., and Niessner, R.: Physical and chemical characterisation of PM emissions from two ships operating in European Emission Control Areas, Atmos. Meas. Tech., 6, 3577–3596, https://doi.org/10.5194/amt-6-3577-2013, 2013. a
Mueller, N., Westerby, M., and Nieuwenhuijsen, M.: Health impact assessments of shipping and port-sourced air pollution on a global scale: A scoping literature review, Environmental Research, 216, 114460, https://doi.org/10.1016/j.envres.2022.114460, 2023. a, b
Muñoz, M., Haag, R., Honegger, P., Zeyer, K., Mohn, J., Comte, P., Czerwinski, J., and Heeb, N. V.: Co-formation and co-release of genotoxic PAHs, alkyl-PAHs and soot nanoparticles from gasoline direct injection vehicles, Atmospheric Environment, 178, 242–254, https://doi.org/10.1016/j.atmosenv.2018.01.050, 2018. a, b
Mwase, N. S., Ekström, A., Jonson, J. E., Svensson, E., Jalkanen, J.-P., Wichmann, J., Molnár, P., and Stockfelt, L.: Health impact of air pollution from shipping in the Baltic Sea: effects of different spatial resolutions in Sweden, Int. J. Environ. Res. Public Health, 17, 7963, https://doi.org/10.3390/ijerph17217963, 2020. a
Napolitano, P., Liotta, L. F., Guido, C., Tornatore, C., Pantaleo, G., La Parola, V., and Beatrice, C.: Insights of Selective Catalytic Reduction Technology for Nitrogen Oxides Control in Marine Engine Applications, Catalysts, 12, https://doi.org/10.3390/catal12101191, 2022. a
Ng, N. L., Canagaratna, M. R., Zhang, Q., Jimenez, J. L., Tian, J., Ulbrich, I. M., Kroll, J. H., Docherty, K. S., Chhabra, P. S., Bahreini, R., Murphy, S. M., Seinfeld, J. H., Hildebrandt, L., Donahue, N. M., DeCarlo, P. F., Lanz, V. A., Prévôt, A. S. H., Dinar, E., Rudich, Y., and Worsnop, D. R.: Organic aerosol components observed in Northern Hemispheric datasets from Aerosol Mass Spectrometry, Atmos. Chem. Phys., 10, 4625–4641, https://doi.org/10.5194/acp-10-4625-2010, 2010. a, b
Nursanto, F. R., Meinen, R., Holzinger, R., Krol, M. C., Liu, X., Dusek, U., Henzing, B., and Fry, J. L.: What chemical species are responsible for new particle formation and growth in the Netherlands? A hybrid positive matrix factorization (PMF) analysis using aerosol composition (ACSM) and size (SMPS), Atmos. Chem. Phys., 23, 10015–10034, https://doi.org/10.5194/acp-23-10015-2023, 2023. a
Paatero, P.: The Multilinear Engine – A Table-Driven, Least Squares Program for Solving Multilinear Problems, Including the n-Way Parallel Factor Analysis Model, Journal of Computational and Graphical Statistics, 8, 854–888, https://doi.org/10.1080/10618600.1999.10474853, 1999. a
Paatero, P. and Hopke, P. K.: Discarding or downweighting high-noise variables in factor analytic models, Analytica Chimica Acta, 490, 277–289, https://doi.org/10.1016/S0003-2670(02)01643-4, 2003. a
Paatero, P. and Tapper, U.: Positive matrix factorization: A non-negative factor model with optimal utilization of error estimates of data values, Environmetrics, 5, 111–126, https://doi.org/10.1002/env.3170050203, 1994. a
Pandolfi, M., Gonzalez-Castanedo, Y., Alastuey, A., de la Rosa, J. D., Mantilla, E., de la Campa, A. S., Querol, X., Pey, J., Amato, F., and Moreno, T.: Source apportionment of PM10 and PM2.5 at multiple sites in the Strait of Gibraltar by PMF: Impact of shipping emissions, Environmental Science and Pollution Research, 18, 260–269, https://doi.org/10.1007/s11356-010-0373-4, 2011. a
Peng, W., Yang, J., Corbin, J., Trivanovic, U., Lobo, P., Kirchen, P., Rogak, S., Gagné, S., Miller, J. W., and Cocker, D.: Comprehensive analysis of the air quality impacts of switching a marine vessel from diesel fuel to natural gas, Environmental Pollution, 266, 115404, https://doi.org/10.1016/j.envpol.2020.115404, 2020. a
Penman, J., D, K., Galbally, I., Hiraishi, T., Nyenzy, B., Emmanul, S., Buendia, L., Hoppaus, R., Martinsen, T., Meijer, J., Miwa, K., and Tanabe, K.: IPCC Good Practise Guidance and Uncertainty Management in National Greenhouse Gas Inventories Chapter 5 (Waste), Good practice guidance and uncertainty management in national greenhouse gas inventories, Intergovernmental Panel on Climate Change (IPCC), ISBN 4-88788-000-6, 2001. a
Petit, J. E., Favez, O., Albinet, A., and Canonaco, F.: A user-friendly tool for comprehensive evaluation of the geographical origins of atmospheric pollution: Wind and trajectory analyses, Environmental Modelling & Software, 88, 183–187, https://doi.org/10.1016/j.envsoft.2016.11.022, 2017. a
Pikmann, J., Drewnick, F., Fachinger, F., and Borrmann, S.: Particulate emissions from cooking: emission factors, emission dynamics, and mass spectrometric analysis for different cooking methods, Atmos. Chem. Phys., 24, 12295–12321, https://doi.org/10.5194/acp-24-12295-2024, 2024. a, b
Pirjola, L., Pajunoja, A., Walden, J., Jalkanen, J.-P., Rönkkö, T., Kousa, A., and Koskentalo, T.: Mobile measurements of ship emissions in two harbour areas in Finland, Atmos. Meas. Tech., 7, 149–161, https://doi.org/10.5194/amt-7-149-2014, 2014. a, b
Quinn, P. K., Bates, T. S., Coffman, D., Onasch, T. B., Worsnop, D., Baynard, T., de Gouw, J. A., Goldan, P. D., Kuster, W. C., Williams, E., Roberts, J. M., Lerner, B., Stohl, A., Pettersson, A., and Lovejoy, E. R.: Impacts of sources and aging on submicrometer aerosol properties in the marine boundary layer across the Gulf of Maine, Journal of Geophysical Research: Atmospheres, 111, https://doi.org/10.1029/2006JD007582, 2006. a
Saarikoski, S., Carbone, S., Decesari, S., Giulianelli, L., Angelini, F., Canagaratna, M., Ng, N. L., Trimborn, A., Facchini, M. C., Fuzzi, S., Hillamo, R., and Worsnop, D.: Chemical characterization of springtime submicrometer aerosol in Po Valley, Italy, Atmos. Chem. Phys., 12, 8401–8421, https://doi.org/10.5194/acp-12-8401-2012, 2012. a, b
Schraufnagel, D. E.: The health effects of ultrafine particles, Experimental & Molecular Medicine, 52, 311–317, https://doi.org/10.1038/s12276-020-0403-3, 2020. a
Setyan, A., Zhang, Q., Merkel, M., Knighton, W. B., Sun, Y., Song, C., Shilling, J. E., Onasch, T. B., Herndon, S. C., Worsnop, D. R., Fast, J. D., Zaveri, R. A., Berg, L. K., Wiedensohler, A., Flowers, B. A., Dubey, M. K., and Subramanian, R.: Characterization of submicron particles influenced by mixed biogenic and anthropogenic emissions using high-resolution aerosol mass spectrometry: results from CARES, Atmos. Chem. Phys., 12, 8131–8156, https://doi.org/10.5194/acp-12-8131-2012, 2012. a
Shah, R. U., Robinson, E. S., Gu, P., Robinson, A. L., Apte, J. S., and Presto, A. A.: High-spatial-resolution mapping and source apportionment of aerosol composition in Oakland, California, using mobile aerosol mass spectrometry, Atmos. Chem. Phys., 18, 16325–16344, https://doi.org/10.5194/acp-18-16325-2018, 2018. a, b
Singh, A., Kamal, R., Mudiam, M. K. R., Gupta, M. K., Satyanarayana, G. N. V., Bihari, V., Shukla, N., Khan, A. H., and Kesavachandran, C. N.: Heat and PAHs Emissions in Indoor Kitchen Air and Its Impact on Kidney Dysfunctions among Kitchen Workers in Lucknow, North India, PLOS ONE, 11, 1–16, https://doi.org/10.1371/journal.pone.0148641, 2016. a
Sinha, P., Hobbs, P. V., Yokelson, R. J., Christian, T. J., Kirchstetter, T. W., and Bruintjes, R.: Emissions of trace gases and particles from two ships in the southern Atlantic Ocean, Atmospheric Environment, 37, 2139–2148, https://doi.org/10.1016/S1352-2310(03)00080-3, 2003. a
Sippula, O., Stengel, B., Sklorz, M., Streibel, T., Rabe, R., Orasche, J., Lintelmann, J., Michalke, B., Abbaszade, G., Radischat, C., Gröger, T., Schnelle-Kreis, J., Harndorf, H., and Zimmermann, R.: Particle Emissions from a Marine Engine: Chemical Composition and Aromatic Emission Profiles under Various Operating Conditions, Environmental Science & Technology, 48, 11721–11729, https://doi.org/10.1021/es502484z, 2014. a, b
Sofiev, M., Winebrake, J. J., Johansson, L., Carr, E. W., Prank, M., Soares, J., Vira, J., Kouznetsov, R., Jalkanen, J.-P., and Corbett, J. J.: Cleaner fuels for ships provide public health benefits with climate tradeoffs, Nature Communications, 9, 406, https://doi.org/10.1038/s41467-017-02774-9, 2018. a, b
Sowlat, M. H., Hasheminassab, S., and Sioutas, C.: Source apportionment of ambient particle number concentrations in central Los Angeles using positive matrix factorization (PMF), Atmos. Chem. Phys., 16, 4849–4866, https://doi.org/10.5194/acp-16-4849-2016, 2016. a
Struckmeier, C., Drewnick, F., Fachinger, F., Gobbi, G. P., and Borrmann, S.: Atmospheric aerosols in Rome, Italy: sources, dynamics and spatial variations during two seasons, Atmos. Chem. Phys., 16, 15277–15299, https://doi.org/10.5194/acp-16-15277-2016, 2016. a, b, c, d
Sugrue, R. A., Preble, C. V., Tarplin, A. G., and Kirchstetter, T. W.: In-Use Passenger Vessel Emission Rates of Black Carbon and Nitrogen Oxides, Environmental Science & Technology, 56, 7679–7686, https://doi.org/10.1021/acs.est.2c00435, 2022. a
Sun, Q., Liang, B., Cai, M., Zhang, Y., Ou, H., Ni, X., Sun, X., Han, B., Deng, X., Zhou, S., and Zhao, J.: Cruise observation of the marine atmosphere and ship emissions in South China Sea: Aerosol composition, sources, and the aging process, Environmental Pollution, 316, 120539, https://doi.org/10.1016/j.envpol.2022.120539, 2023. a
Tang, L., Ramacher, M. O. P., Moldanová, J., Matthias, V., Karl, M., Johansson, L., Jalkanen, J.-P., Yaramenka, K., Aulinger, A., and Gustafsson, M.: The impact of ship emissions on air quality and human health in the Gothenburg area – Part 1: 2012 emissions, Atmos. Chem. Phys., 20, 7509–7530, https://doi.org/10.5194/acp-20-7509-2020, 2020. a
Timonen, H., Teinilä, K., Barreira, L., Simonen, P., Dal Maso, M., Keskinen, J., Kalliokoski, J., Moldonova, J., Salberg, H., Merelli, L., D'Anna, B., Temime-Roussel, B., Lanzafame, G. M., and Mellqvist, J.: Ship on-board emissions characterisation, Technical report, The SCIPPER Project, https://www.scipper-project.eu/library/ (last access: 22 February 2026), 2022. a, b
Tobler, A. K., Skiba, A., Canonaco, F., Močnik, G., Rai, P., Chen, G., Bartyzel, J., Zimnoch, M., Styszko, K., Nęcki, J., Furger, M., Różański, K., Baltensperger, U., Slowik, J. G., and Prevot, A. S. H.: Characterization of non-refractory (NR) PM1 and source apportionment of organic aerosol in Kraków, Poland, Atmos. Chem. Phys., 21, 14893–14906, https://doi.org/10.5194/acp-21-14893-2021, 2021. a
Toscano, D.: The Impact of Shipping on Air Quality in the Port Cities of the Mediterranean Area: A Review, Atmosphere, 14, https://doi.org/10.3390/atmos14071180, 2023. a
Ulbrich, I. M., Canagaratna, M. R., Zhang, Q., Worsnop, D. R., and Jimenez, J. L.: Interpretation of organic components from Positive Matrix Factorization of aerosol mass spectrometric data, Atmos. Chem. Phys., 9, 2891–2918, https://doi.org/10.5194/acp-9-2891-2009, 2009. a
United Nations Conference on Trade and Development: Review of Maritime Transport 2023: Towards a green and just transition, United Nations, Geneva, ISBN 978-92-1-002886-8, 2023. a
Van Roy, W., Schallier, R., Van Roozendael, B., Scheldeman, K., Van Nieuwenhove, A., and Maes, F.: Airborne monitoring of compliance to sulfur emission regulations by ocean-going vessels in the Belgian North Sea area, Atmospheric Pollution Research, 13, 101445, https://doi.org/10.1016/j.apr.2022.101445, 2022. a
Viana, M., Hammingh, P., Colette, A., Querol, X., Degraeuwe, B., de Vlieger, I., and van Aardenne, J.: Impact of maritime transport emissions on coastal air quality in Europe, Atmospheric Environment, 90, 96–105, https://doi.org/10.1016/j.atmosenv.2014.03.046, 2014. a, b
Volent, E., Gunti, Q., D'Anna, B., Brito, J. F. D., Jamar, M., Temime-Roussel, B., Moldanova, J., Timonen, H., Hellen, H., Lanzafame, G., Maso, M. D., Rozé, S., Riffault, V., Tinel, L., and Sauvage, S.: Determining Volatile Organic Compounds and PM1 Emission Factors from land-based, high time-resolution observations in an Emission Control Area of northern France, in preparation, 2026. a, b, c
Voliotis, A., Wang, Y., Shao, Y., Du, M., Bannan, T. J., Percival, C. J., Pandis, S. N., Alfarra, M. R., and McFiggans, G.: Exploring the composition and volatility of secondary organic aerosols in mixed anthropogenic and biogenic precursor systems, Atmos. Chem. Phys., 21, 14251–14273, https://doi.org/10.5194/acp-21-14251-2021, 2021. a
Wang, L., Du, W., Shen, H., Chen, Y., Zhu, X., Yun, X., Shen, G., Chen, Y., Liu, J., Wang, X., and Tao, S.: Unexpected Methane Emissions From Old Small Fishing Vessels in China, Frontiers in Environmental Science, 10, https://doi.org/10.3389/fenvs.2022.907868, 2022. a
Wang, Q., Zhu, S., Wang, S., Huang, C., Duan, Y., and Yu, J. Z.: Short-term source apportionment of fine particulate matter with time-dependent profiles using SoFi Pro: exploring the reliability of rolling positive matrix factorization (PMF) applied to bihourly molecular and elemental tracer data, Atmos. Chem. Phys., 24, 475–486, https://doi.org/10.5194/acp-24-475-2024, 2024. a
Winnes, H., Moldanová, J., Anderson, M., and Fridell, E.: On-board measurements of particle emissions from marine engines using fuels with different sulphur content, Proceedings of the Institution of Mechanical Engineers, Part M: Journal of Engineering for the Maritime Environment, 230, 45–54, https://doi.org/10.1177/1475090214530877, 2016. a, b, c
Wu, S.-P., Xu, C., Dai, L.-H., Zhang, N., Wei, Y., Gao, Y., Yan, J.-P., and Schwab, J. J.: Source Apportionment of PM2.5 at Urban and Suburban Sites in a Port City of Southeastern China, Aerosol and Air Quality Research, 19, 2017–2031, https://doi.org/10.4209/aaqr.2019.01.0007, 2019. a
Xu, W., Lambe, A., Silva, P., Hu, W., Onasch, T., Williams, L., Croteau, P., Zhang, X., Renbaum-Wolff, L., Fortner, E., Jimenez, J., Jayne, J., and Worsnop, D.: Laboratory evaluation of species-dependent relative ionization efficiencies in the Aerodyne Aerosol Mass Spectrometer, Aerosol Science and Technology, 52, https://doi.org/10.1080/02786826.2018.1439570, 2018. a
Xu, W., He, Y., Qiu, Y., Chen, C., Xie, C., Lei, L., Li, Z., Sun, J., Li, J., Fu, P., Wang, Z., Worsnop, D. R., and Sun, Y.: Mass spectral characterization of primary emissions and implications in source apportionment of organic aerosol, Atmos. Meas. Tech., 13, 3205–3219, https://doi.org/10.5194/amt-13-3205-2020, 2020. a
Xueref-Remy, I., Milne, M., Zoghbi, N., Lelandais, L., Riandet, A., Armengaud, A., Gille, G., Lanzi, L., Oppo, S., Brégonzio-Rozier, L., Blanc, P.-E., Yohia, C., Piazzola, J., and Delmotte, M.: Analysis of atmospheric CO2 variability in the Marseille city area and the north-west Mediterranean basin at different time scales, Atmospheric Environment: X, 17, 100208, https://doi.org/10.1016/j.aeaoa.2023.100208, 2023. a
Yu, H., Chen, H., Zheng, Z., Ba, Z., Qiao, D., Feng, D., Gong, Z., and Dong, G.: Transformation mechanism between the frictional interface under dioctyl sebacate lubrication, Tribology International, 155, 106745, https://doi.org/10.1016/j.triboint.2020.106745, 2021. a
Yuan, B., Shao, M., de Gouw, J., Parrish, D. D., Lu, S., Wang, M., Zeng, L., Zhang, Q., Song, Y., Zhang, J., and Hu, M.: Volatile organic compounds (VOCs) in urban air: How chemistry affects the interpretation of positive matrix factorization (PMF) analysis, Journal of Geophysical Research: Atmospheres, 117, https://doi.org/10.1029/2012JD018236, 2012. a
Zhang, Q., Jimenez, J. L., Canagaratna, M. R., Ulbrich, I. M., Ng, N. L., Worsnop, D. R., and Sun, Y.: Understanding atmospheric organic aerosols via factor analysis of aerosol mass spectrometry: a review, Analytical and Bioanalytical Chemistry, https://doi.org/10.1007/s00216-011-5355-y, 2011. a
Zhang, Y., Heikkinen, L., Äijälä, M., Peräkylä, O., Graeffe, F., Mickwitz, V., Zhao, J., Daellenbach, K., Sueper, D., Worsnop, D., Riva, M., and Ehn, M.: Enhanced Aerosol Source Identification by Utilizing High Molecular Weight Signals in Aerosol Mass Spectra, ACS ES&T Air, https://doi.org/10.1021/acsestair.3c00102, 2024. a
Zhao, J., Zhang, Y., Yang, Z., Liu, Y., Peng, S., Hong, N., Hu, J., Wang, T., and Mao, H.: A comprehensive study of particulate and gaseous emissions characterization from an ocean-going cargo vessel under different operating conditions, Atmospheric Environment, 223, 117286, https://doi.org/10.1016/j.atmosenv.2020.117286, 2020. a