the Creative Commons Attribution 4.0 License.
the Creative Commons Attribution 4.0 License.
 | 26 Feb 2026
Implications of Sea Breeze Circulations on boundary layer aerosols in the southern coastal Texas region
Michael P. Jensen
Scott E. Giangrande
Mark C. Harvey
Ashish Singh
Maria Zawadowicz
Chongai Kuang
The Sea Breeze Circulation (SBC) influences atmospheric processes at multiple scales in coastal regions. Understanding how SBCs impact the aerosol number budget and aerosol–cloud interaction processes is essential. This study investigates sea breeze–aerosol interactions (SAIs) during 46 summertime SBC events using data from the TRacking Aerosol Convection Interactions Experiment (TRACER) field campaign across urban (main) and rural (supplemental) coastal sites in southern Texas. Weather Research and Forecasting model coupled with Chemistry (WRF-Chem) simulations complement observations to explore spatio-temporal meteorological controls on boundary layer aerosols. During the summertime, Sea Breeze Fronts (SBF) penetrating inland transported cool, moist air over the land, introducing air masses with distinct properties compared to the preexisting continental air. These SAIs cause variability in number concentrations of up to a factor of two, with events typically lasting ∼ 5 h before returning to background conditions. SAI impact on aerosols varies with site proximity to water and the preceding sea breeze (SB) history, primarily affecting the marine-influenced accumulation mode. The main site, influenced by both Galveston Bay and the Gulf of Mexico, reflects a stronger marine influence. In contrast, a supplemental site, at a similar shoreline distance but exposed only to the Gulf of Mexico and typically upstream of the urban core, samples SB air that has traversed land and partially regained continental characteristics. Simulations show that the regional SAIs extend ∼ 50 km inland and reach up to the boundary layer height. SAIs further decrease cloud condensation nuclei relevant aerosol number concentrations in ∼ 20 % of events during SBF passage.
- Article
(19387 KB) - Full-text XML
-
Supplement
(10404 KB) - BibTeX
- EndNote


A significant portion of the global population resides in coastal cities, including several megacities (Brown et al., 2013). Nearly half of the U.S. population faces environmental challenges associated with complexities tied to urban coastal atmospheres (Crossett et al., 2004; Hudson, 2012). Houston, located along the Southern Texas coastline, is one of the United States' most populated cities, while also one of its most polluted, with high aerosol concentrations (Yoon et al., 2021; Kleinman et al., 2002; Banta et al., 2011). Aerosol particles can negatively impact human health (Partanen et al., 2018; Mack et al., 2020), and influence Earth's energy balance. They exert direct effects by scattering and absorbing the incoming solar radiation, altering net radiative fluxes (Charlson et al., 1992; Bond et al., 2013; IPCC, 2021), and indirect effects by acting as cloud condensation nuclei (CCN) and ice nucleating particles (INP), thereby modulating cloud microphysical properties and precipitation processes (Twomey, 1974; Albrecht, 1989; Ramanathan et al., 2001; Rosenfeld et al., 2008; Ariya et al., 2009; Burkart et al., 2021).
In particular, the Houston region experiences highly complex aerosol processes due to elevated local emissions, diverse aerosol sources, and intricate atmospheric chemistry. One such process is new particle formation (NPF), which is a common aerosol microphysical process that impacts the overall aerosol number concentration (Kulmala et al., 2004; Kerminen et al., 2018; Kuang et al., 2012; IPCC, 2021). NPF events typically include a sudden burst of aerosols, i.e., the nucleation of gas molecules and formation of stable clusters of diameters “Dp” > 2 nm, followed by subsequent growth, firstly to a size range with Dp >50 nm and possibly growing to a size where the particles can act as a CCN (Dp > 100 nm) (Yu and Luo, 2009; Kerminen et al., 2018; Gordon et al., 2017). In addition, mesoscale meteorological phenomenon around Houston, such as sea breeze circulations (SBCs), further modulate these aerosol dynamics (e.g., Miller et al., 2003; Wang et al., 2024; Deng et al., 2025; Thompson et al., 2025). These SBCs develop regularly in the warm season along coastal regions (Miller et al., 2003). One key challenge for aerosol process studies common to coastal city environments is in determining the relative importance of aerosol microphysical versus mesoscale meteorological controls such as SBCs, in governing the aerosol number budget and aerosol impacts on that population center.
The summertime SBC is a thermally-driven feature tied to differential heating between the land and sea; this results in density gradients that cause the cooler marine air to propagate inland (Miller et al., 2003; di Bernardino et al., 2021). Daytime SBC formation can facilitate convective cloud and precipitation onset (Comin et al., 2015), influence boundary layer meteorology (Adaricheva et al., 2023), and has been associated with complex impacts on overall air quality (Simpson, 1994; Masselink and Pattiaratchi, 1998; Moorthy et al., 2003; Miller et al., 2003; Augustin, et al., 2020; Park et al., 2020; Parajuli et al., 2022; Wang et al., 2023). These circulations also influence transport of atmospheric gases (Gangoiti et al., 2001; Ahmadov et al., 2007; Hernández-Ceballos et al., 2016) and aerosol particles (Clappier et al., 1999; Borge et al., 2008; Papanastasiou et al., 2010). A sea breeze front (SBF), which is the boundary between that cooler, more moist marine air of the SBC flow and the warmer, drier air over the land, is often a focal point that facilitates the transport and dispersal of aerosols, as well as aiding in the formation of cumulus clouds (Miller et al., 2003). While low-level lapse rates are often more stable on the maritime side of the SBF, the conditional instability (Convective Available Potential Energy-CAPE) is often observed to be greater on the maritime side due to the higher moisture content in that air mass (Hanft and Houston, 2018; Sharma et al., 2024; Boyer et al., 2025). Convergence along these SBFs often results in enhanced upward air motion, allowing aerosols to ascend to higher altitudes ∼ 2 km (Iwai et al., 2011). Stronger wind shear along these SBFs also generates increased turbulence, as owing to Kelvin-Helmholtz instability occurring just behind this front (Linden and Simpson, 1986; Plant and Keith, 2007), while the aforementioned vertical air motions are important for convective cloud initiation (Rao and Fuelberg, 2000; Arrillaga et al., 2020).
The common conceptual model for SBCs is one where the marine air mass propagates inland, bringing with it different atmospheric and aerosol characteristics compared to the ambient land air mass conditions. In this study, the influence of these SBCs on regional aerosols is termed as “sea breeze–aerosol interaction” (SAI). Previous studies have shown that SAIs vary depending on complex interactions among emissions sources, boundary layer dynamics, and the strength and/or direction of the SBC (Miller et al., 2003; Boyouk et al., 2011; di Bernardino et al., 2021). For example, SBF passage has been found to trap aerosols at lower elevations within the boundary layer (Miller et al., 2003). In SBC environments, competing processes can yield opposite aerosol responses, as the formation of a shallow thermal boundary layer can confine particles near the surface and raise aerosol concentrations, whereas inland buoyant (convective) lifting within the convective boundary layer, can lift aerosols aloft (Simpson, 1994; Boyouk et al., 2011; di Bernardino et al., 2021). In addition, SBCs may replace the regional air mass with the cleaner marine air mass, leading to a decrease in surface aerosol concentration. This now-modified coastal environment can affect the generation and growth of aerosols, impacting the local aerosol number budget that further influences their direct and indirect effects.
Although several studies have investigated the overall change in the aerosol loading during SBC events, less is known about the role of SAI on the aerosol microphysical properties. Moorthy et al. (1993) observed that the passage of the SBF was associated with an increase in the concentration of smaller particles. Furthermore, since SBFs propagate inland, SBCs can have far-reaching impacts on aerosol properties (Iwai et al., 2011; Park and van den Heever, 2022). As an example, previous studies conducted in the Southeastern United States indicated that inland propagating SBFs are followed by air masses that often contrasted with regional air, having potential influence on distances 220 km from the Gulf of Mexico (Viner et al., 2021; Bao et al., 2023). In a similar case of these farther-reaching influences, Parajuli et al. (2020) found that the SBC influences the aerosol vertical distribution over the eastern coast of the Red Sea while lifting dust aerosols along the western slope of the Sarawat mountains, with the elevated dust at a height of ∼ 1.5 km over the mountains. Similarly, Talbot et al. (2007) observed that enhanced turbulent activity along the SBF facilitated vertical aerosol transport above the boundary layer top (∼ 1.1 km a.s.l) over a flat coastal area of the North Sea.
Finally, high aerosol concentrations in the Houston area are linked to strong surface emissions and meteorological conditions (Wert et al., 2003; Ryerson et al., 2003). This metro region is also home to numerous petrochemical factories that are one of the sources of anthropogenic emissions. Several studies have also shown that meteorological conditions around Houston are highly susceptible to the interaction between large-scale (background) geostrophic flows and mesoscale SBCs (Miller et al., 2003; Wang et al., 2024; Deng et al., 2025). Pinto et al. (2014) observed that wind direction reversals bring aged, aerosol laden plumes with high O3 and NOx levels back to the Houston area. They found that easterly winds, originating from the Houston Ship Channel (HSC), are most strongly associated with elevated levels of photochemically produced species. Similar conditions that promote O3 and NOx build-up also drive secondary particle formation, leading to increases in aerosol number concentrations. These particle-phase enhancements in total number concentration result in higher aerosol concentration in the air mass transported from the east. Occasional increases in aerosol concentrations around the greater Houston metropolitan area can also be associated with long-range transported aerosols. At the synoptic scales, the circulation patterns modulate regional meteorology over the Gulf coast. The Bermuda-Azores High helps trans-Atlantic transport of North African dust to the southeast coast (Perry et al., 1997; Bozlaker et al., 2013). Summertime conditions are notably influenced by episodic transboundary aerosol transport (Mao et al., 2020; Das et al., 2023), including dust events from the Sahara Desert (Aldhaif et al., 2020) and biomass burning events in Central America and its neighboring states. The biomass burning includes prescribed agricultural fires in Central America (Wang et al., 2018) and forest fires in surrounding states (Westenbarger and Morris, 2018). Central America biomass burning contributes to half of the biomass burning particulate matter concentrations in Houston (Das et al., 2023). The motivation of this study is to investigate the role of SAIs as observed over a complex urban megacity region, and specifically document SBC influence on aerosol microphysical properties. These efforts expand on previous air quality studies over Houston, including Li et al. (2020) who employed a K-Means clustering algorithm to study the relationship between Houston-region SBCs and the daily ozone variability during the DISCOVER-AQ (Deriving Information on Surface Conditions from Column and Vertically Resolved Observations Relevant to Air Quality) field campaign. While Li et al. (2020) focused on gas-phase chemistry, the same emissions and meteorological processes that drive ozone variability can also influence aerosol loading over the southern Texas region.
This study capitalizes on the TRacking Aerosol Convection Interactions ExpeRiment (TRACER) field campaign conducted by the US Department of Energy (DOE) Atmospheric Radiation Measurement (ARM) user facility (Mather and Voyles, 2013), which took place from 1 October 2021 to 30 September 2022 (Jensen et al., 2022, 2025). The main TRACER field site was placed at an urban coastal location in Houston. As in TRACER's overarching motivations, the Houston region is frequented by isolated convective clouds that interact with ambient aerosol conditions from the urban and industrial sources, potentially serving as a natural contrast to clouds that form in surrounding areas that exhibit significantly lower background aerosol concentrations (Banta et al., 2011; Parrish et al., 2009; Wang et al., 2024; Thompson et al., 2025). Additional observations were made at a rural coastal site (supplemental site) in southern Texas during an intensive observation period (IOP) from 1 June to 30 September 2022. Using these TRACER-IOP measurements, our study explores how these SBCs influence the aerosol environment at multiple ground sites. In addition, the Weather Research and Forecasting model coupled with Chemistry (WRF-Chem) is used to investigate the regional impacts of SAI over Southern Texas. A detailed description of the TRACER sites, instruments, measurements, and methodology, followed by the WRF-Chem model configuration details, are presented in Sect. 2. Section 3 presents campaign observational and simulated results. Our efforts will characterize the composite meteorological (Sect. 3.1) and aerosol (Sect. 3.2) observations during the IOP at the TRACER main and supplemental sites. This is followed by a composite analysis of the observed effects of the sea breeze on aerosol properties at the two ARM sites (Sect. 3.3), as well as a detailed case study examination of SAI influence for these locations (Sect. 3.4). The regional influence of SAI is further explored using model simulations, as demonstrated for the horizontal (Sect. 3.5) and vertical propagation of SAIs (Sect. 3.6), and SAI impact on cloud condensation nuclei over the southern Texas region (Sect. 3.7). The study concludes with our key findings summarized in Sect. 4.
2.1 Site description
The DOE ARM TRACER field campaign was centered on the deployment of the first ARM Mobile Facility (Mather and Voyles, 2013, herein AMF1) at the main instrument site (M1) (Fig. 1). The M1 is an urban coastal site located at the La Porte, Texas (TX) airport, to the southeast of Houston, TX. Given the high propensity for isolated convective cloud events during summertime months (Jensen et al., 2022, 2025), the TRACER IOP was conducted from 1 June to 30 September 2022, with a goal towards sampling a range of aerosol–cloud interactions during these convective events. Additional ARM and guest instruments were deployed to a supplemental site (S3) during the IOP as documented in Jensen et al. (2022). The S3 supplemental site is a rural coastal site in Guy, TX, located ∼ 70 km west from M1, upstream and periphery to the highly populated and commercial sectors of the Houston-Galveston-Brazoria region.
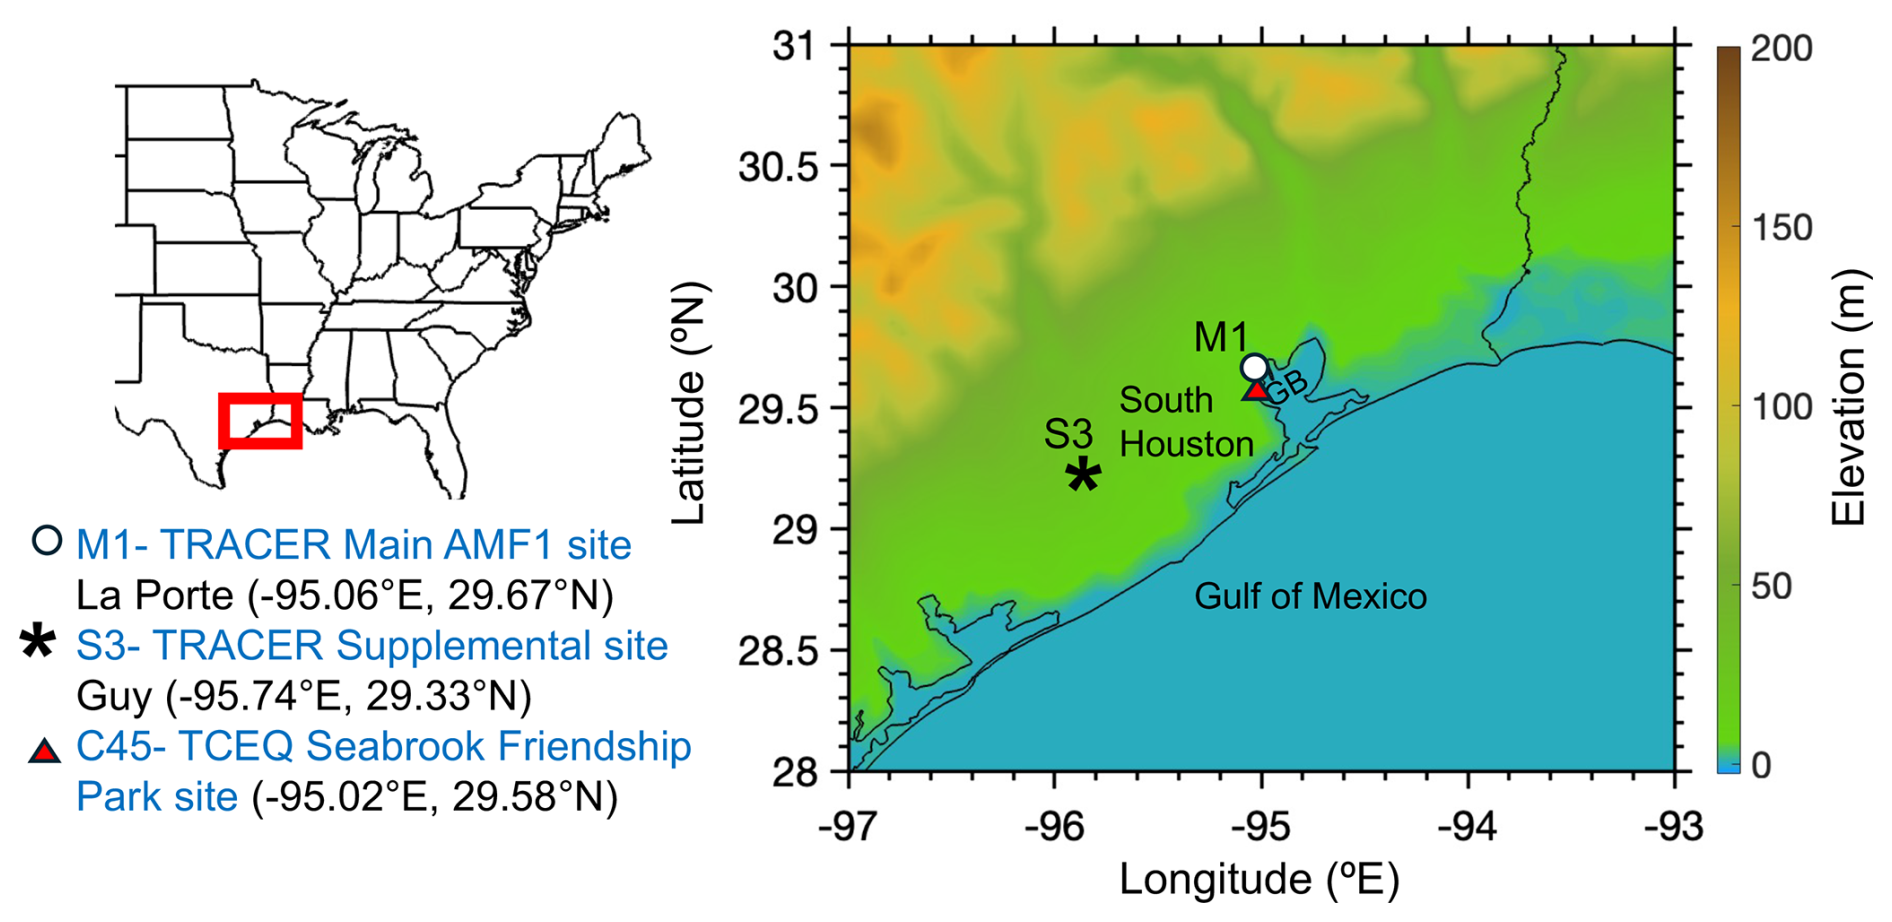
Figure 1Map showing the TRACER field campaign main site (M1) and supplemental site (S3), and the TCEQ Seabrook Friendship Park site (C45). Terrain elevation is shown in color. Here, “GB” corresponds to the Galveston Bay.
The southern Texas region is characterized by flat terrain with elevations < 50 m a.s.l. and a diversity of land cover/use, including urban, rural, grassland, and forested coastal environments (see Fig. 2a). Although both the M1 and S3 sites are a similar distance from the Gulf of Mexico, the M1 site is located near the western shore of Galveston Bay. This urban M1 site may experience different sea-breeze timing because of its location, the added influence of the Galveston Bay breeze, and urban heating that alters local circulations. The M1 site is expected to be strongly influenced by anthropogenic activities due to its proximity to the Houston urban core, large-scale industrial complexes and the HSC. The HSC is lined with dense clusters of industrial facilities, including major petrochemical complexes (Yoon et al., 2021), which can contribute to aerosol populations beyond those typically associated with an urban environment. Similarly, the Texas A&M University (TAMU) TRACER measurements also showed that short-lived ship emissions contributed to high aerosol concentrations (up to 34 000 cm−3) (Rapp et al., 2024; Thompson et al., 2025). The S3 site, while relatively less impacted by the emissions from the Greater Houston area, is not representative of a pristine rural location in terms of aerosol loading. Under typical south-southeasterly wind, this S3 site is located downstream of heavy industry along the southeast Texas coastline (Freeport, TX and Lake Jackson, TX) and can be influenced by upstream anthropogenic sources (Fig. 2b).
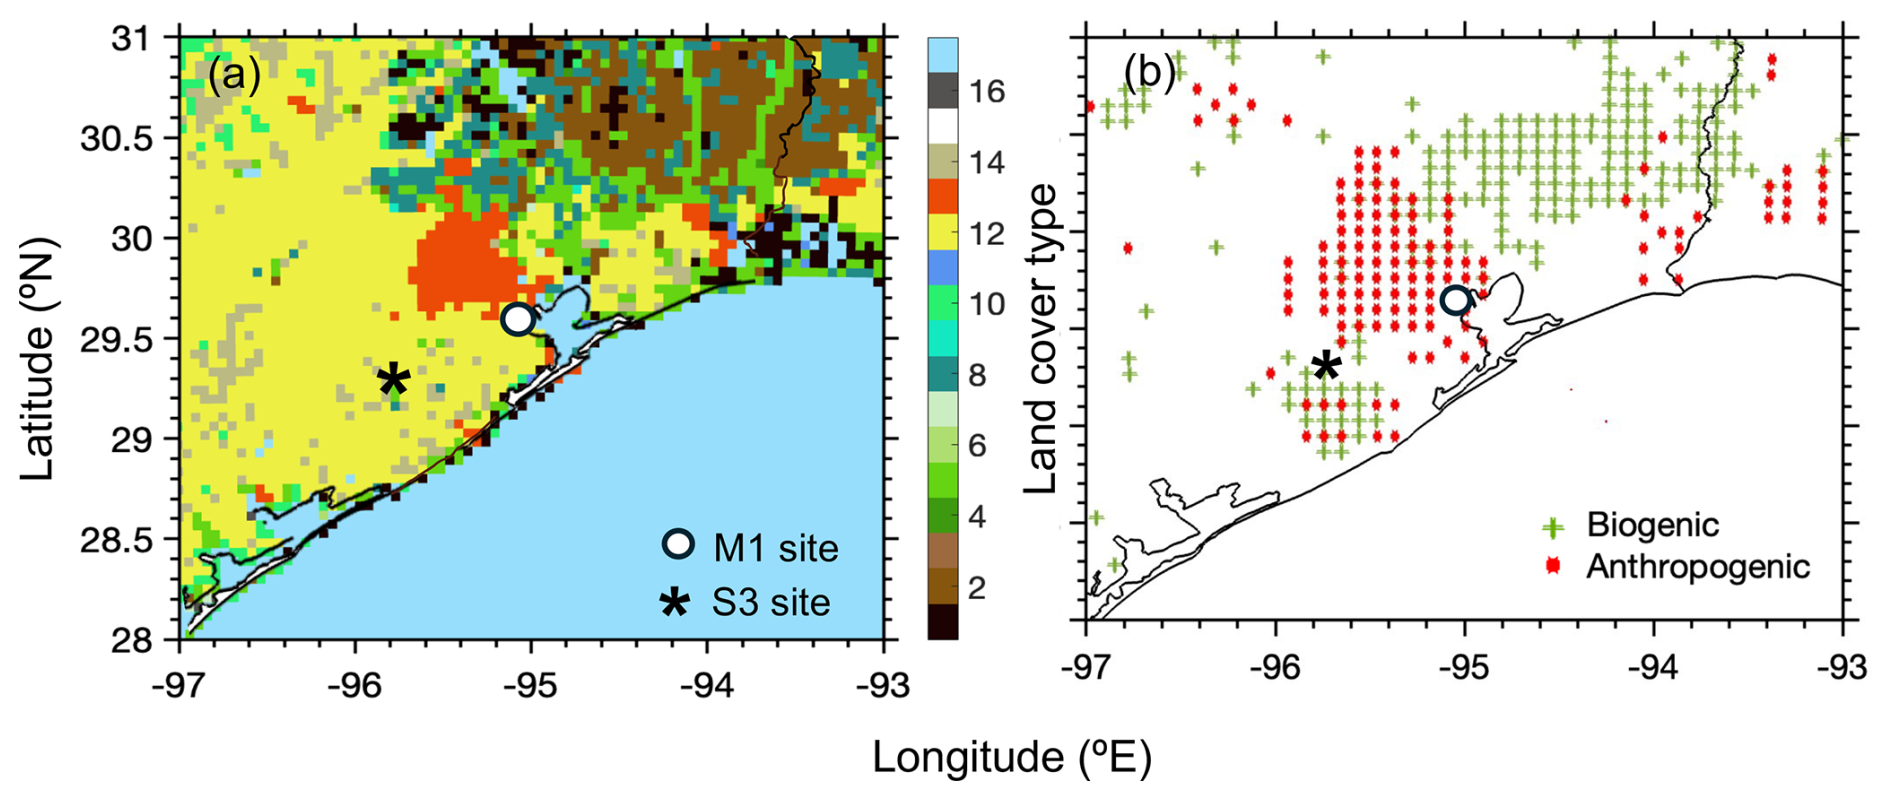
Figure 2Weather Research and Forecasting model coupled with Chemistry (WRF-Chem) simulation domain with (a) primary land cover types comprising of (1) Evergreen Needleleaf Forest, (2) Evergreen Broadleaf Forest, (3) Deciduous Needleleaf Forest, (4) Deciduous Broadleaf Forest, (5) Mixed Forest, (6) Closed Shrubland, (7) Open Shrubland, (8) Woody Savanna, (9) Savanna, (10) Grassland, (11) Permanent Wetlands, (12) Cropland, (13) Urban and Build-up, (14) Cropland/Natural Mosaic, (15) Snow and Ice, (16) Barren or Sparsely Vegetated, and (17) Water; (b) Anthropogenic (red dots) and biogenic (green dots) aerosol emission source points obtained using the National Emissions Inventory (NEI) data and Model of Emissions of Gases and Aerosols from Nature (MEGAN) modeling system, respectively.
2.2 Measurements of aerosols and meteorological properties
This study focuses on the enhanced aerosol and complementary observations available during the TRACER summertime IOP period. The key aerosol datasets available during this IOP include: (1) the aerosol number size distribution and total number concentration, (2) bulk aerosol chemical composition, and (3) state meteorological properties (e.g., surface temperature, humidity). Campaign availability of in situ observations at two contrasting sites provided an excellent opportunity to understand the regional aspects of SAI.
The aerosol number size distribution with diameter ranging from 10 to 500 nm was measured at M1 and S3 sites using Scanning Mobility Particle Sizer (SMPS) (Singh and Kuang, 2024). The aerosol number size distributions (aerosol number concentrations in different diameter bins) at different diameters (Dp) were added to calculate the total integrated aerosol number concentrations. Bulk aerosol chemical compositions consisting of total organics, sulfate, nitrate, ammonium, and chloride were measured at M1 and S3 sites using Aerosol Chemical Speciation Monitor (ACSM) (Watson, 2017). Surface meteorological variables: temperature, water vapor mixing ratio (w), wind direction and wind speed at M1 and S3 sites were taken from the meteorological instruments collocated with the aerosol instruments. All of these instruments are part of the ARM Aerosol Observing Systems (AOS), which is the platform for in situ aerosol measurements at Earth's surface (Uin et al., 2019). Missing data were excluded from this analysis. If more than 20 % of the data were missing during the 5 h before and after the passing of the SBF, the dataset was not used to study SAI processes. SMPS and ACSM sample data at 5 and ∼ 30 min intervals, respectively. State meteorological variables were observed at one second intervals. All datasets, except for the ACSM, were averaged over a 5 min interval, centered on the time of the SMPS sample.
To supplement the ARM observations, we use particulate matter of 2.5 µm or less in diameter (PM2.5) mass concentrations from the Texas Commission on Environmental Quality (TCEQ) database (Shrestha et al., 2023; sfcmetradaq-tceq ARM PI product). Although TCEQ operates a broad network of air quality monitoring stations throughout Texas, the Seabrook Friendship Park site (C45, −95.02° E, 29.58° N) was selected because it is the nearest monitor to the M1 site (∼ 6 km away) and provided continuous hourly PM2.5 data during the study period. PM2.5 was chosen as a representative aerosol to directly compare with the model simulations. For reference, this TCEQ C45 site location was added to the map displaying the TRACER sites (Fig. 1).
This study draws heavily from SBC synoptic-scale regime identification performed by Wang et al. (2024) to further inform on controls affecting SBC evolution and cloud formation at the two sites. Every SBC day identified by Wang et al. (2024) during the IOP period is considered to explore SAI during TRACER. A total of 46 SBC events at the M1 site, and 30 SB events at the S3 site were identified by Wang et al. (2024) during TRACER's IOP (Table 1). They explored Gulf breeze and bay breeze circulation characteristics using a suite of datasets, including ground-based measurements, satellite observations, and reanalysis datasets, using machine learning techniques, and Lagrangian cell tracking methods. Most IOP SBC events were classified as occurring during large-scale anticyclonic conditions, with the predominant occurrence of SBCs observed during southeasterly background surface wind directions. The SBF timing at both ARM sites was determined using surface wind and w mixing ratio time series.
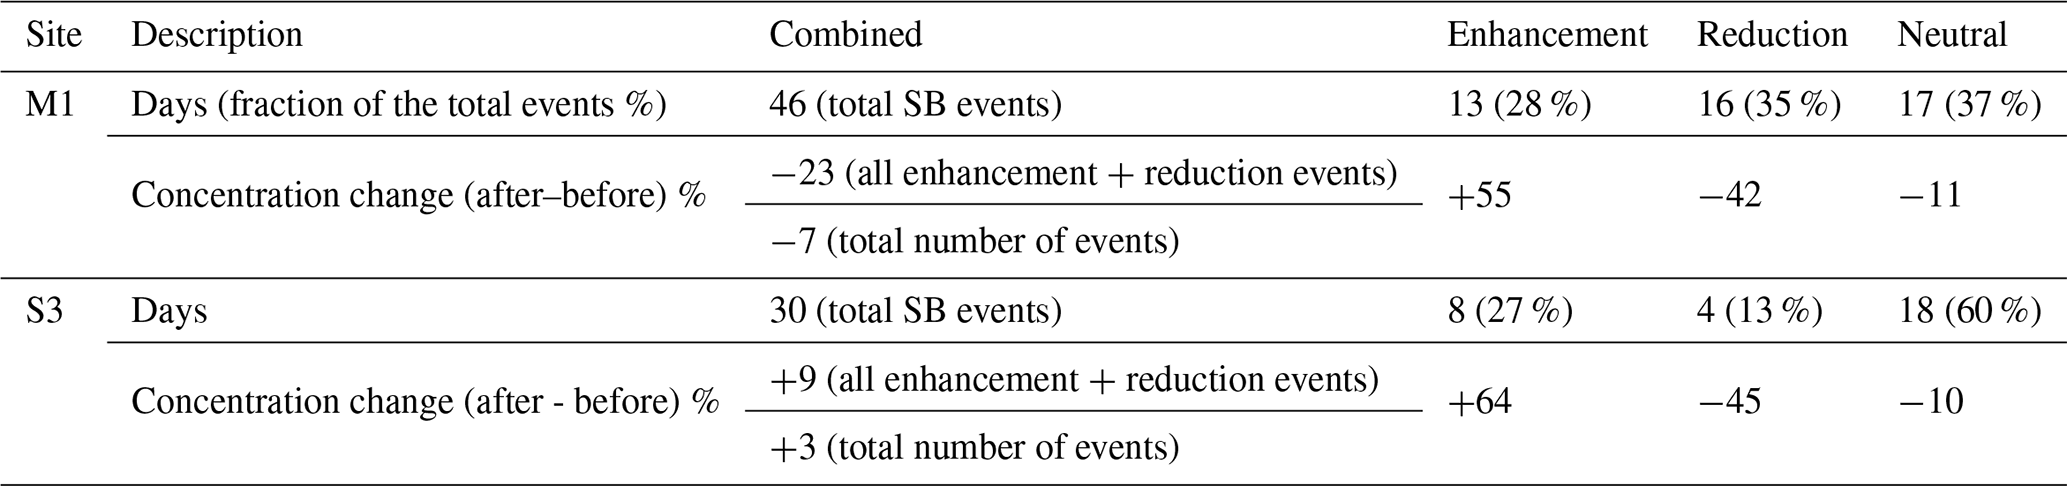
Table 1Summary of SBC influence on aerosol number concentration at the M1 and S3 sites. Events are classified into enhancement, reduction, and neutral categories.
Overall, Wang et al. (2024) found that the SBF typically arrived at the M1 site at 20:30 UTC (i.e., 15:30 LT), and at the S3 site at 20:50 UTC (i.e., 15:50 LT). The M1 site, situated along the western shore of the Galveston Bay, was also influenced by bay breeze circulations, frequently resulting in an earlier shift in the local meteorological state compared to that of the S3 site (only influenced by the Gulf SBC). The M1 site was shown to experience an additional bay breeze contribution during 22 out of 43 SBC events. Wang et al. (2024) also reported that M1 experienced higher intensity changes in the meteorological conditions associated with these SBFs as compared to S3, particularly when the background wind directions are southwesterly or westerly. At both the sites, these SBF passages were associated with a significant increase in w and wind speed, along with a decrease in surface temperature. The arrival of the fronts also typically increased the vertical wind speed within the boundary layer, with a mean speed of up to 2 m s−1 within the lowest 1 km. The enhanced updrafts associated with SBF low level convergence also was shown to promote short lived-isolated convective clouds and likely associated with vertical mixing of aerosols by diluting near-surface concentrations and redistributing aerosols aloft.
2.3 Model simulation setup
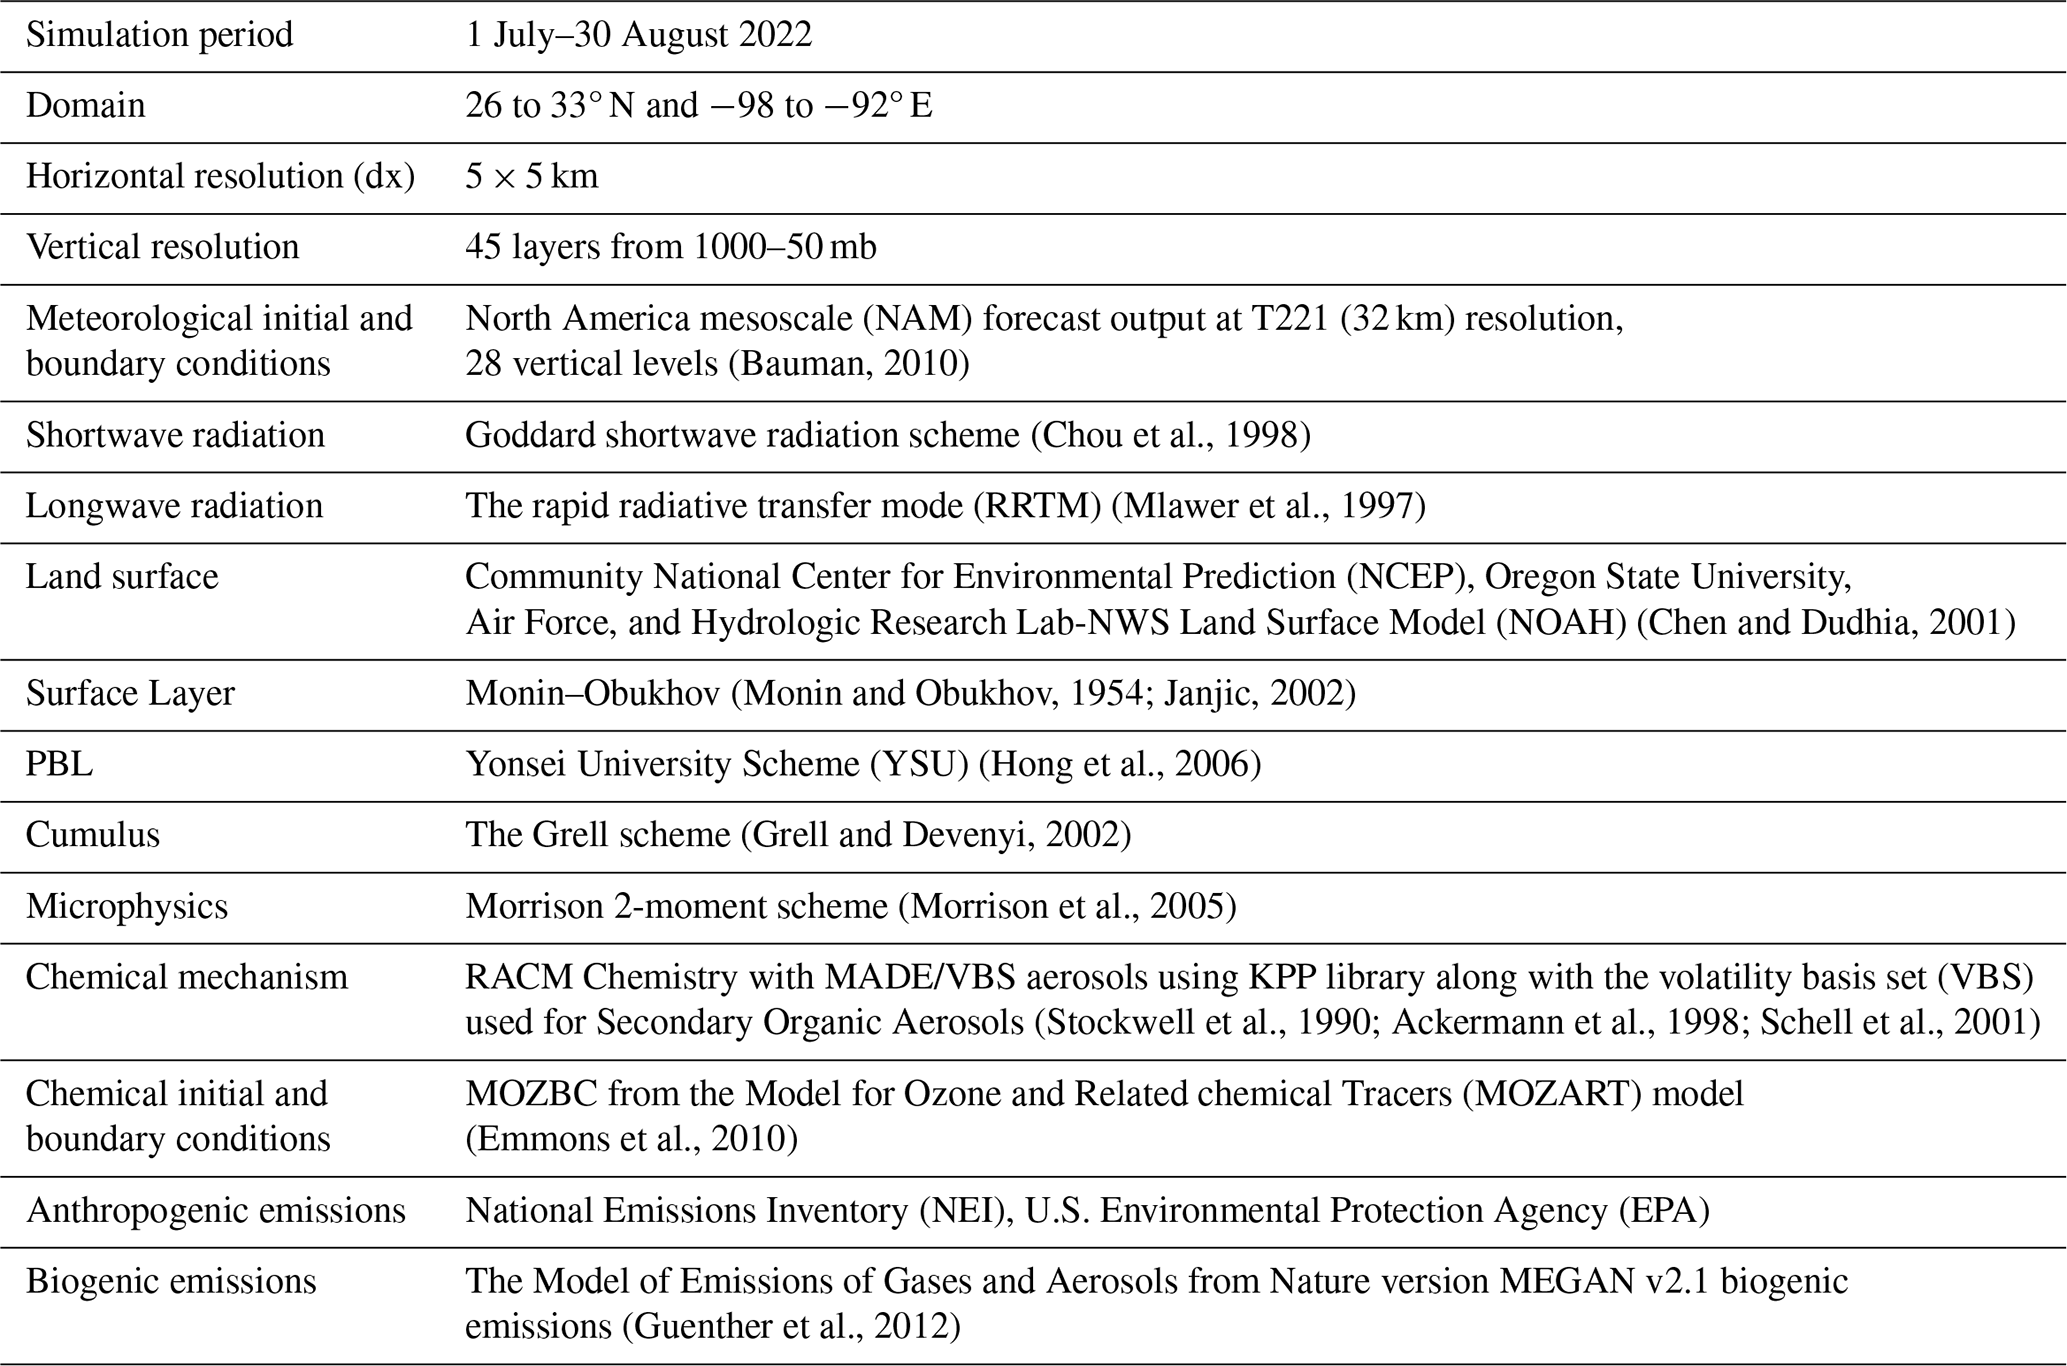
The WRF-Chem model (Grell et al., 2005; Skamarock et al., 2008) was used to simulate the multiscale interactions between aerosols and meteorology over the coastal region of southeast Texas. Figure 2 shows the model domain centered on the M1 site and extended from 26 to 33° N (∼ 770 km) in latitude and from −98.5 to −91.5° E (∼ 770 km) in longitude. The model simulations were performed for the period from 1 July to 30 August 2022, using a 5 × 5 km horizontal grid spacing with 45 vertical layers. A model spin-up time of 3 d was used, and the restart files were used for the remainder of the simulations. Initial and boundary conditions for meteorology were provided by the North American Mesoscale (NAM) model every 6 h. The model configuration was successfully set-up and is considered sufficient to resolve the key meteorological processes relevant to the aerosol chemistry examined in this study. To validate this assumption, simulated meteorological fields and aerosol variabilities are compared against observations. Similar model setups have been successfully applied in previous WRF-Chem studies over the continental US (e.g., Berg et al., 2015; Wang et al., 2021; Subba et al., 2023; Shrivastava et al., 2024), which demonstrate their suitability for representing aerosol–cloud interactions. The details of the configurations are shown in Table 2.
The model simulations were performed with (with aerosol-WA condition) and without (no aerosol-NA condition) full aerosol-gas chemistry, and land-atmosphere interactions enabled. Boundary conditions for gas-phase species and aerosols were provided by the Whole Atmosphere Community Climate Model (WACCM) (Gettelman et al., 2019). The WACCM output datasets, available on a horizontal grid resolution of 1° × 1° were spatially interpolated to our model domain every 6 h. Biogenic emissions were generated online by WRF-Chem model based on meteorology and land use data, using the Model of Emissions of Gases and Aerosols from Nature version 2.1 (MEGAN2.1) by Guenther et al. (2012). The U.S. Environmental Protection Agency National Emission Inventories (NEI, Ma and Tong, 2022) was used to provide anthropogenic emissions of trace gases and aerosols from diverse sources, including point, area, on-road mobile, non-road mobile, and other sectors. These emissions are incorporated to WRF-Chem at hourly intervals. The area surrounding the M1 site is characterized by urban infrastructure and cropland, whereas the S3 site is largely a mix of cropland, natural mosaic, and barren or sparsely vegetated land type. Both sites have cropland and grassland to the west and north, as well as evergreen, deciduous, and mixed forests from the north to east directions. The selected domain included both anthropogenic and biogenic aerosol sources, as indicated by NEI and MEGAN datasets (Fig. 2b). The M1 site is anticipated to be more influenced by anthropogenic sources due to its proximity to the Houston urban core, local industry and the HSC. The S3 site is expected to be more influenced by biogenic sources.
The role for these simulations is to provide a physically-reasonable spatial approximation for the meteorological and aerosol environments across the southern Texas region that are not captured by the point measurements during TRACER. Comparing the meteorological variables between the two sites helps identify the underlying factors that may influence the aerosol transport and transformation processes. The simulated meteorological time series show adequate agreement for the purposes of this study at both sites (Fig. S1 in the Supplement). We assessed model performance using metrics: mean bias (MBE), root mean square error (RMSE), and correlation coefficient (R) for the quantities of temperature, wind speed, and wind direction. In addition, we also considered Modern-Era Retrospective analysis for Research and Applications (MERRA-2) reanalysis products to further evaluate the model performance (Gelaro et al., 2017). Our model reproduces the measured temperature diurnal cycle at both sites with high correlation (r up to 0.87) and low MBE (< ±1°). Wind speed and wind directions show weaker correlation (r up to 0.65) and MBE of 0.76 m s−1 and 12.5°, respectively. Individual SBF events are further analysed to compare the measured and modeled variables in later sections.
We find a reasonable behavior in the heterogeneous spatial distribution of PM2.5, with higher values in the urban areas around the M1 site and lower values in the rural areas around the S3 site (Fig. 3b). The simulated hourly PM2.5 has been compared with the TCEQ measured values (Fig. 3a). The model reasonably captures the timings and magnitude of high and low aerosol concentrations. The model (mean ∼ 10.8 µg m−3, median ∼ 8.5 µg m−3) overestimates the observations (mean ∼ 8.2 µg m−3, median ∼ 7.0 µg m−3), with a correlation of r ∼ 0.6, corresponding to differences of ∼ 30 % in the mean and ∼ 23 % in the median. These model-measurement discrepancies are consistent with previously reported WRF-Chem biases. For example, Soni et al. (2022) reported that during dust storm events over the Indian sub-continent, WRF-Chem captured spatial aerosol patterns but underestimated concentrations in regions of high aerosol loading. Similarly, Tuccella et al. (2012) reported that WRF-Chem underestimated peak aerosol concentrations by 7.3 %. More recently, Georgiou et al. (2022) reported underestimation of background PM2.5 by 16 % and of industrial by ∼ 20 %.
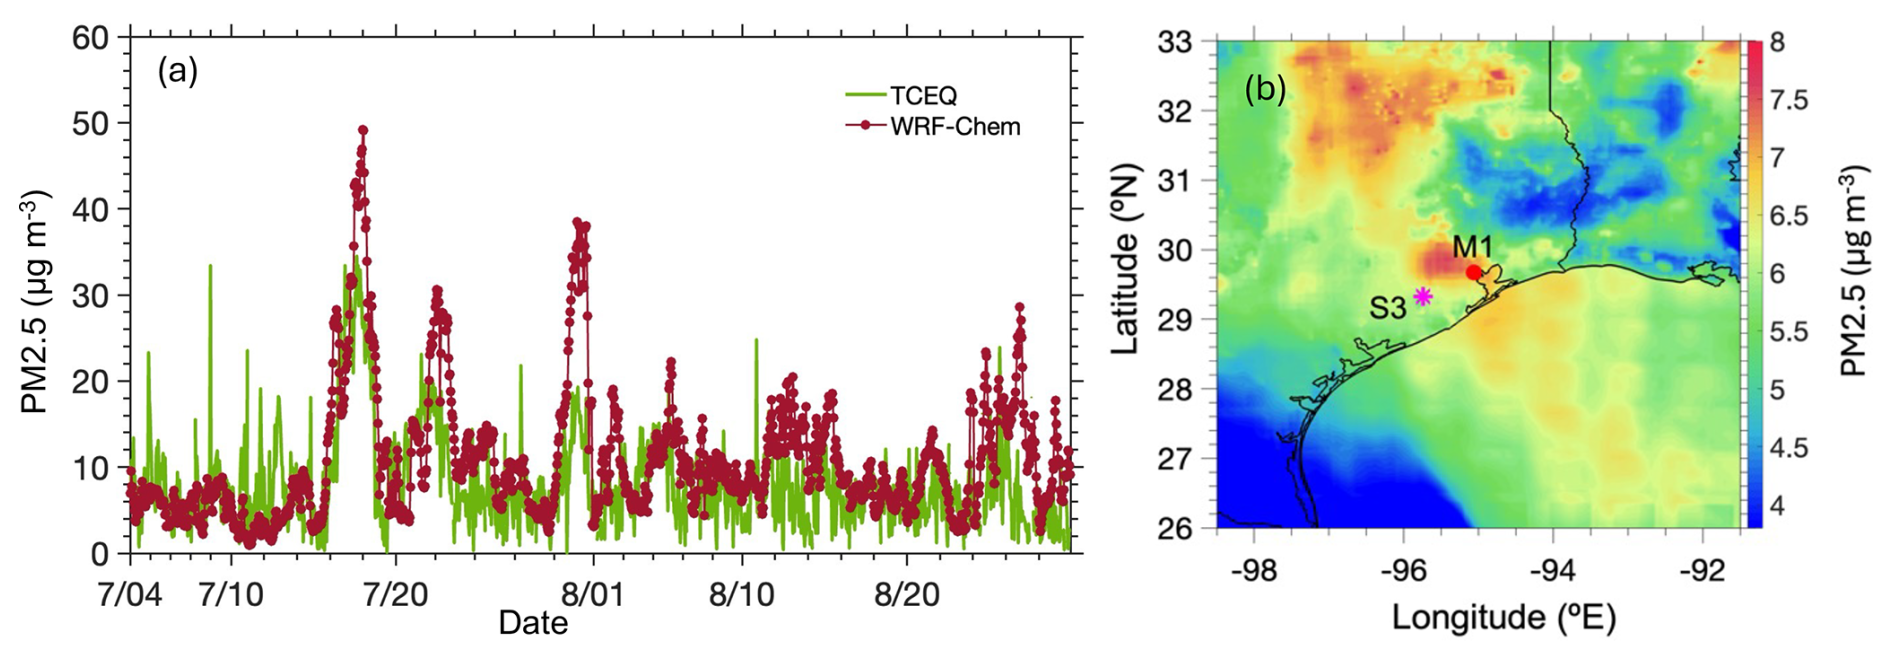
Figure 3(a) Comparison of daily averaged PM2.5 observed (green) at the TCEQ site, and WRF-Chem simulated (red) at the M1 site. (b) Spatial distribution of WRF-Chem simulated August 2022 mean PM2.5 (filled contours).
3.1 Composite IOP Meteorological Observations
Comparisons between the background summertime meteorology around the TRACER sites help to identify the underlying factors that may influence the aerosol transport and transformation processes. Figure 4 shows composite averaged diurnal variations of meteorological properties during the IOP period. When comparing meteorological variables between M1 and S3 sites, paired t-test results calculated a very low p value (< 0.0001) and a large negative or positive t statistic, indicating a statistically significant difference. M1 exhibits higher temperatures during the cooler parts of the day (early morning) and slightly lower temperatures during the warmest parts of the day (early afternoon). w is generally higher at M1 than at S3 for most hours of the day (Fig. 4b). At both sites the value stays near 17–18 g kg−1 for most of the day, with a common moistening pulse around 13:00–15:00 UTC that coincides with increased wind speed. At this time (13:00–15:00 UTC), the wind directions are similar at both the sites. Except in the morning, winds at M1 are typically 1–2 m s−1 stronger than at S3. The M1 site shows an increase in w near 20:00 UTC, likely tied to the SBC. S3 exhibits a larger shift in the wind directions compared to that of M1. The two sites have similar directions during the late night (00:00–05:00 UTC) and early morning (13:00–15:00 UTC) hours. During the dominant afternoon SBC period (around 20:00 UTC), winds are predominantly from the southeast at M1 and from the southwest at S3.
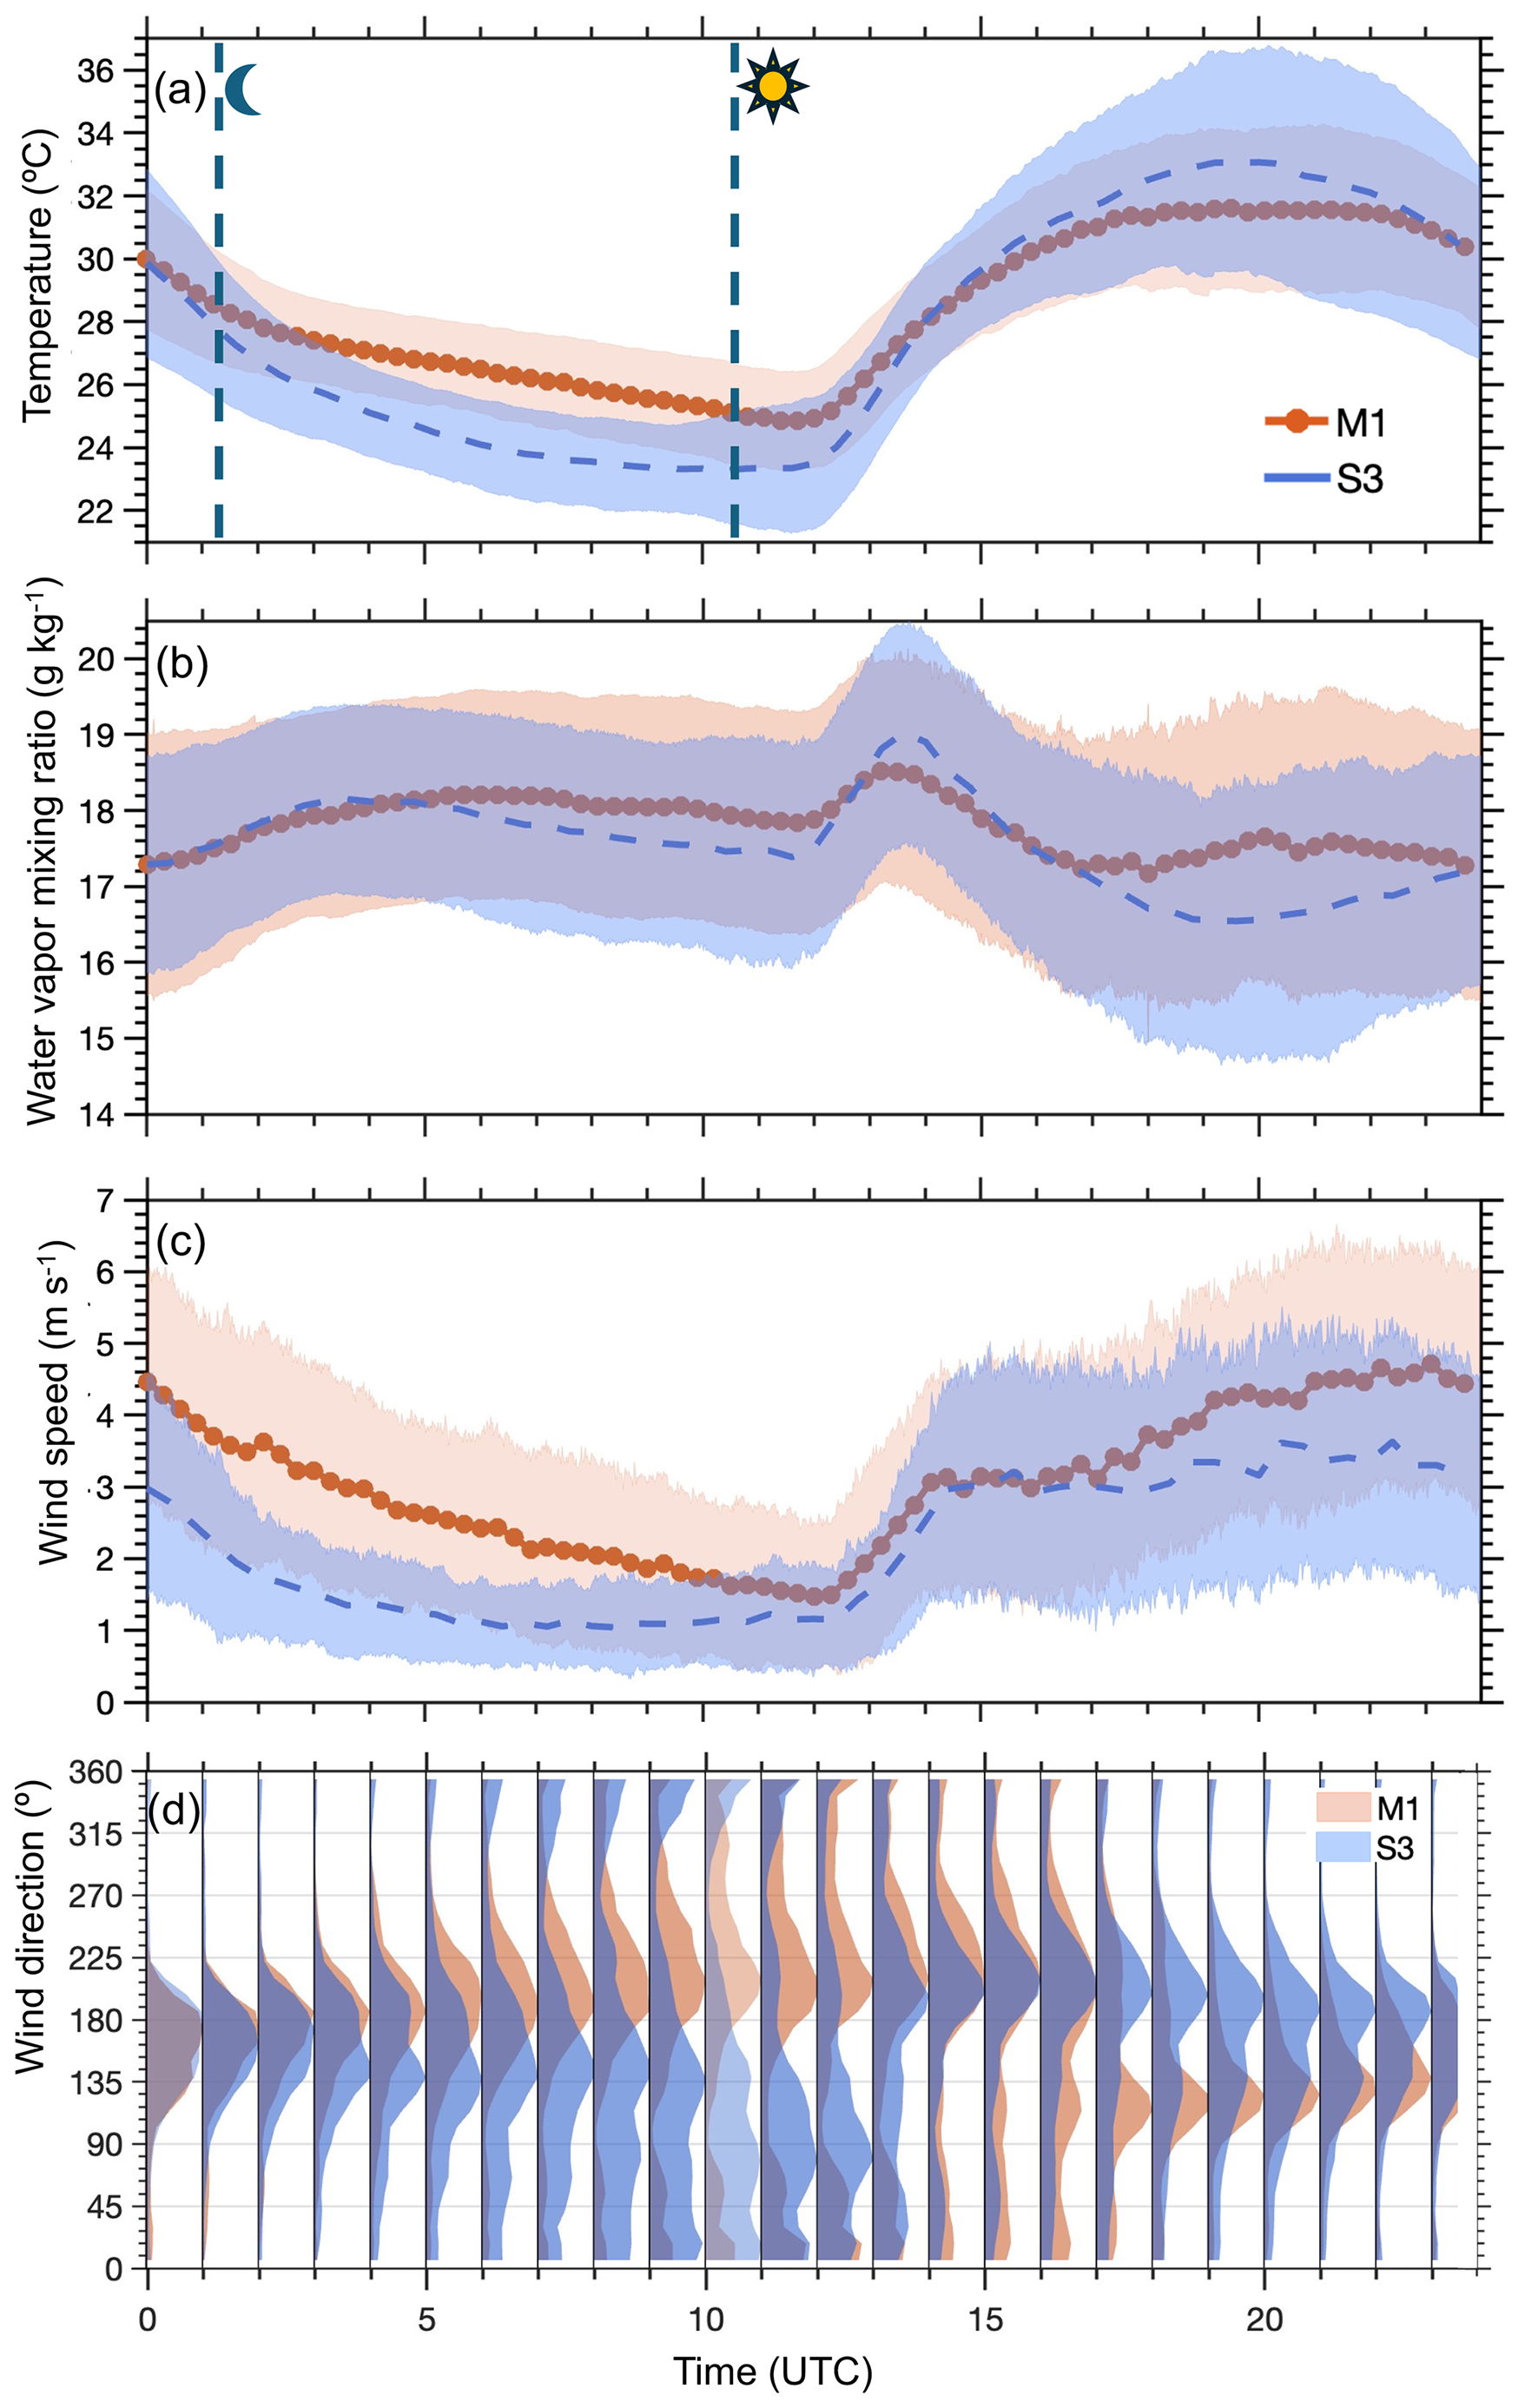
Figure 4Diurnal variation of meteorological variables (a) Temperature at 2 m, (b) water vapor mixing ratio (w) (c) wind speed at 10 m, and (d) wind direction waterfall diagram at 10 m measured at M1 (in orange) and S3 (in blue) sites averaged during IOP. The shaded color represents the standard deviation from the mean.
Although these sites are geographically close, their different proximities to water bodies and varying land cover types may account for the observed meteorological variations, such as differences in temperature modulation, humidity, and breeze development. M1 lies adjacent to both Galveston Bay and Gulf of Mexico, thus nearby water moderates temperature and promotes higher humidity, favoring sea- or bay- breeze circulations. In contrast, although S3 is at a similar distance from the Gulf as M1, it is more inland, separated from the shoreline by an intervening expanse of land, so it experiences stronger daytime heating and a weaker, more modified marine influence than M1. It has a land surface covered predominantly with vegetation and soil that cools faster at night than urban landscapes. However, urban landscapes retain heat, remaining warmer into the nighttime and potentially moderating temperatures during the subsequent daytime (Di Maria et al., 2013). These behaviors are consistent with the prior studies showing the coastal sites experienced moderate temperature and enhanced humidity (Hu, 2021; Subramanian et al., 2023), and that land-use influenced local temperature and boundary layer dynamics via evapotranspiration and surface heating (Fang et al., 2025).
3.2 Composite IOP Aerosol Observations
The southern Texas region is influenced by locally-generated (e.g., vehicular, industrial, construction and road dust, and sea spray) and long range transported aerosols (e.g., biomass burning, mineral dust, and sea spray) from anthropogenic and natural sources (Brown et al., 2013; Barrett and Sheesley, 2014; Karnae and John, 2019; Song et al., 2021; Das et al., 2023; Shrestha et al., 2023). In Fig. 5a, aerosol number concentration peaks around 17:00 UTC at M1 and around 20:00 UTC at S3. Both sites exhibit a tri-modal aerosol size distribution (Fig. 5b). Throughout the day, the aerosol concentrations are consistently higher at the M1 site when compared to those observed at the S3 site. At the M1 site, we observe a distinct nucleation mode that appears at diameter < 20 nm, and two additional modes at larger diameters ∼ 80 and ∼ 150 nm. This nucleation mode is less prominent at the S3 site, which more commonly exhibits similar modes at diameters ∼ 80 and ∼ 150 nm.
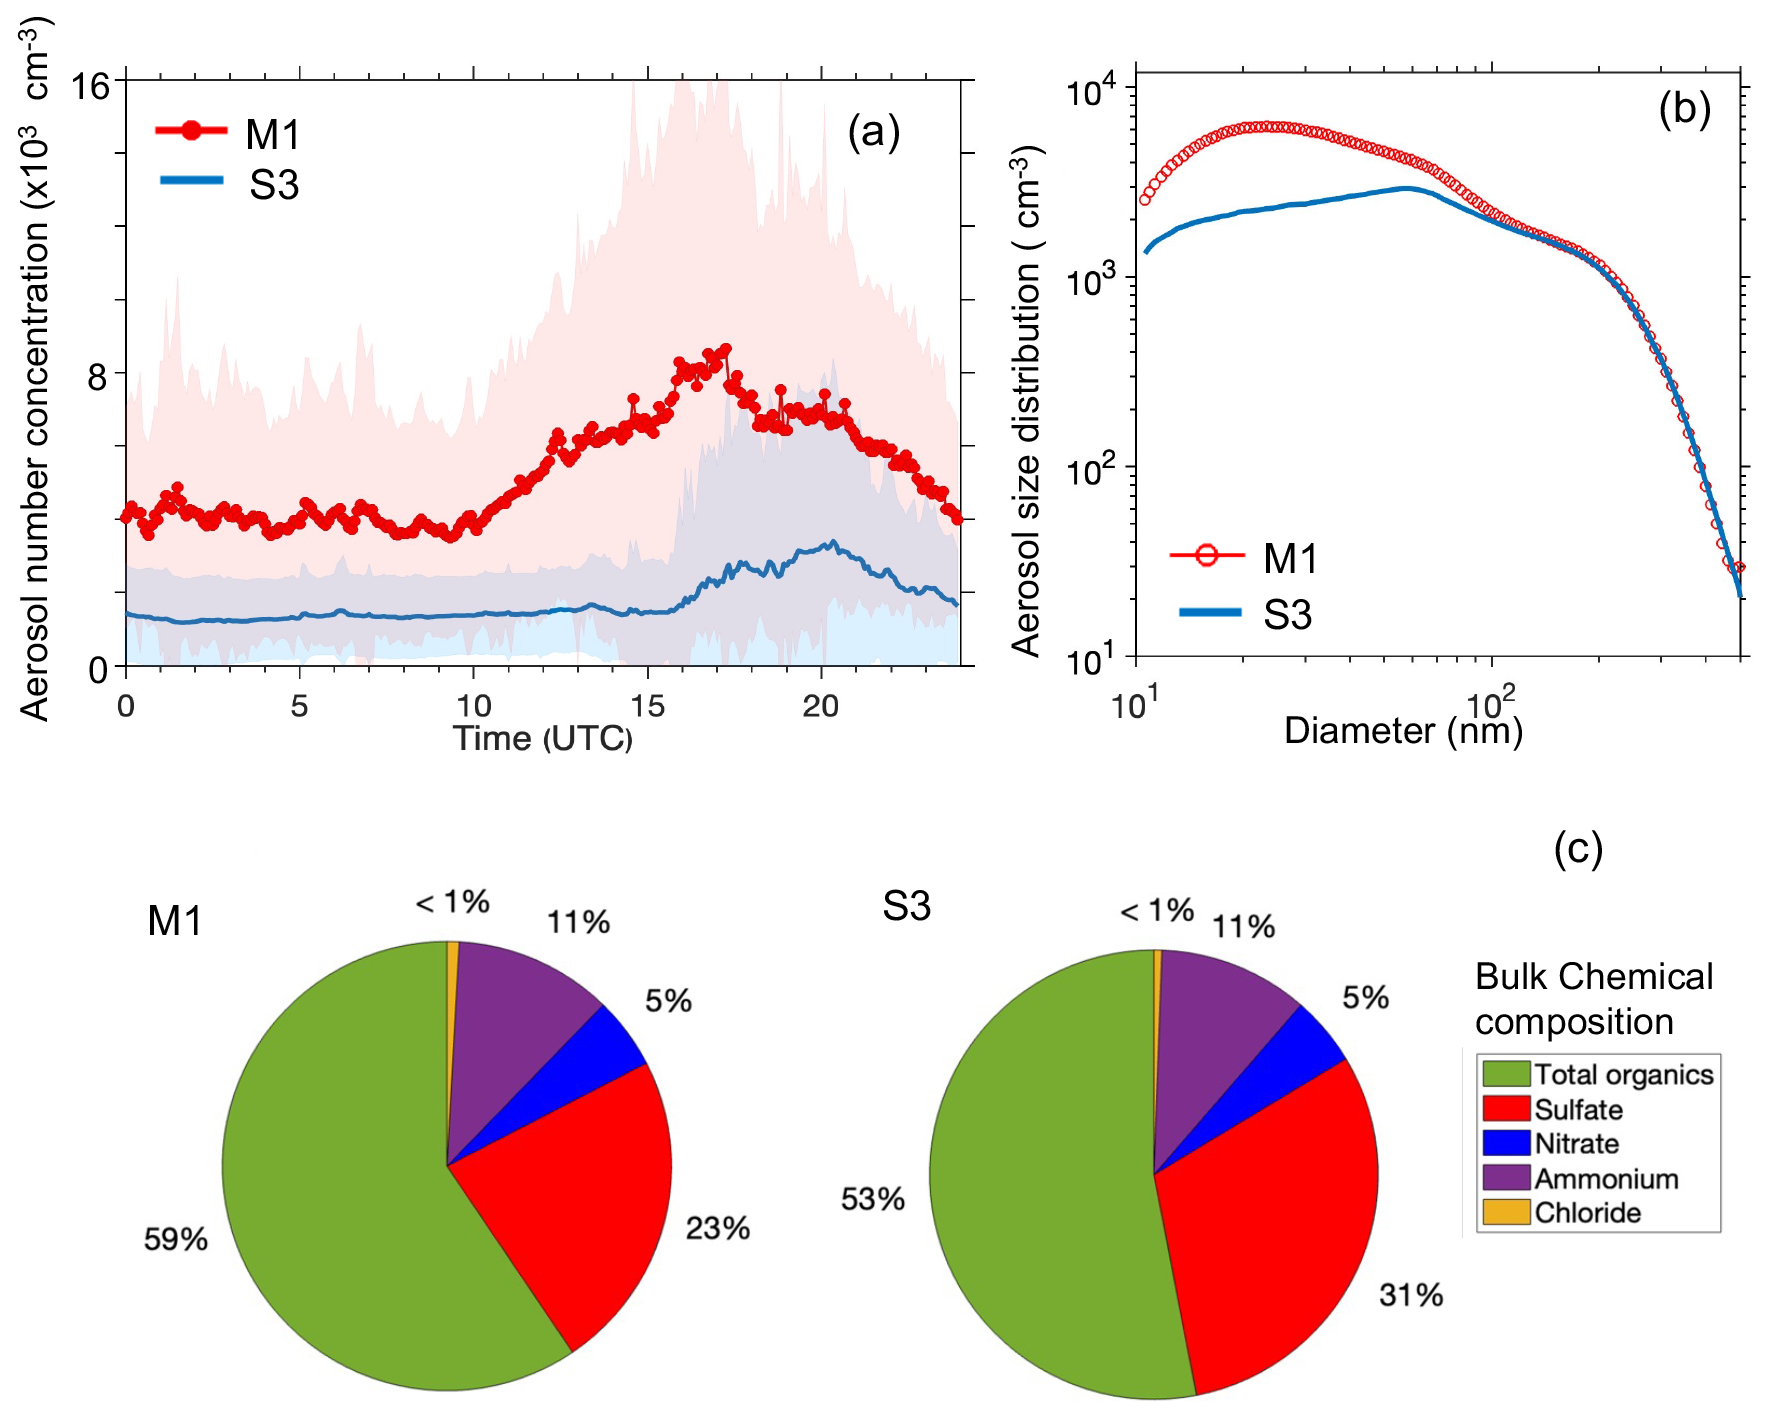
Figure 5Measured (a) diurnal distribution of aerosol number concentration, (b) aerosol size distribution, and (c) percentage contribution of bulk chemical composition at M1 and S3 sites averaged from June to September 2022.
The ACSM observations suggest a similar percentage contribution from various species, with organics having the highest concentration (59.2 % at M1 and 53.0 % at S3), followed by sulfate (23.3 % at M1 and 30.6 % at S3), ammonium (11.4 % at M1 and 10.8 % at S3), nitrate (5.2 % at M1 and 5.0 % at S3) and chloride (less than 0.9 % at M1, and less than 0.6 % at S3). Higher percentages of organics and sulfate were also measured at other urban (Minguillón et al., 2015; Huang et al., 2010; Qi et al., 2020) and rural locations (Crippa et al., 2014; Atabakhsh et al., 2025).
The NPF events are identified by analyzing the aerosol size distribution measured by the SMPS (Kuang et al., 2009; Dal Maso et al., 2002; Mikkonen et al., 2011). This is accomplished by designating characteristic features for NPF found in the size distribution behaviors in time, including the appearance of the nucleation mode at a diameter (Dp) < 25 nm, followed by distinct growth pattern (where the particles increase in size over several hours) forming the characteristic “banana-shaped” pattern in the aerosol number size distribution. NPF events were common at both the M1 and S3 sites. During summertime, NPF events were identified at both the M1 and S3 sites, finding 23 and 17 events, respectively. In approximately 35 % of cases, NPF events were observed simultaneously at the sites, implying a regional-scale behavior. These regional NPF nucleation modes appear at Dp < 25 nm and grow consistently across a broader region, covering a minimum radius of tens of kilometers. Recent study by Kasparoglu et al. (2024) also observed NPF events attributed to nucleation aloft with daytime turbulent mixing transporting the growing mode downward, consistent with unsteady ultrafine aerosol number concentrations, gradual increases, and absence of < 20 nm growth near the surface. The growing-mode hygroscopicity spanned 0.05–0.34, varied by wind sector, implicating changes in precursor chemistry across air masses. Thus, the differing characteristics of simultaneous NPF events are plausibly driven by mesoscale to large-scale meteorological controls on these processes (such as SBCs), the prevailing condensation sink from background aerosol, and/or the availability of precursors in each air mass.
3.3 Observed Sea Breeze aerosol interaction at the surface
Coastal regions have a mixture of urban, terrestrial, and marine aerosol regimes. The inland-penetrating SBF can have a complex influence on the aerosol populations over Houston and its surroundings depending on several coexisting factors including: (i) the pre-existing aerosol regime over the location, (ii) the aerosol regime of the air mass preceded by the SBF, (iii) the local to synoptic thermodynamic conditions resulting from convective boundary layer features such as horizontal convective rolls, and (iv) the characteristics of the SBF itself, including the lifting and mixing of the onshore flow with the ambient air, and wind anomalies near the surface. Three scenarios for the influence of an inland-penetrating SBF on aerosols within the region of influence are considered.
First, we consider a potential “reduction influence” that may occur when an air mass with higher aerosol concentration over a location is replaced by an air mass with lower aerosol concentration. In contrast, an “enhancement influence” may occur when an air mass with lower aerosol concentration over a location is replaced by an air mass with higher aerosol concentration. Otherwise, a “neutral influence” implies minimal change associated with the SBF, defined as a change in the aerosol concentration is less than 5 % in the pre-existing aerosol regime. This scenario indicates that the air mass following the SBF is similar to the existing conditions.
For example, these enhancement influence scenarios may be anticipated when long-range transported aerosols are present in the air mass downwind of the SBF, or when the SBF first advects over areas (marine or continental) with high local emissions. Similarly, neutral influence scenarios are anticipated when the entire region has relatively homogeneous (i.e., similar aerosol concentrations also belonging to the same aerosol regime) distribution of aerosols. Nevertheless, aerosol exchanges are complex, and TRACER also provided several examples of marine aerosols carried by the SBF that were associated with negligible influences on the ambient marine aerosol mode. Finally, TRACER site measurements may not always be representative of a broader air mass or regional conditions (e.g., intermittent local source interactions with smaller-scale SBC features). WRF-Chem modeling may help to bridge these spatial representativeness gaps and provide reference for the regional context of the potential impact of the SBC on aerosol distributions.
To investigate the influence of SAI, one approach employed in this study is to normalize the surface aerosol concentration at time T by the value measured immediately before the passing of the SBF (TSBF = 0 h). The timing of the SBF for each event is explicitly considered, using the passage times provided in Table A1 on Wang et al. (2024). The SBF passage at a site is defined as TSBF = 0. This approach allowed evaluation of aerosol number concentrations before and after the SBF passage while retaining the diurnal cycle context. Here, “just before” refers to the 5 min prior to the SBF passage, as previously identified by Wang et al. (2024). Figures S2 and S3 show the temporal variation of this normalized aerosol number concentration for all the SB events. At both the M1 and S3 sites, before-SBF aerosol concentrations can vary by up to a factor of two.
Example days with an “enhancement influence” in the aerosol concentration after TSBF are shown in Fig. 6, highlighting the 18 July event at the M1 site, and a 10 August event at the S3 site. In contrast, the 17 June (M1 site) and 10 July (S3 site) events in the same figure help illustrate a “reduction influence” in aerosol concentration after TSBF. While these example events are instructive, there is not a clear trend for TRACER events given the high level of variability in the duration or influence of SAIs. For example, the sharp increase we observe in aerosol concentration on the 10 August “enhancement” event quickly dissipates within an hour after TSBF at the S3 site. In contrast, the increase in the number concentration we observed on 18 July persisted for over an hour after TSBF. Considering all the SBF passages we collected (Figs. S2 and S3), we suggest T = TSBF ± 1 h often best represents the “before” (T− = TSBF − 1 h) and “after” – SBF (T+ = TSBF + 1 h) times over a location. The enhancement or reduction effects are most pronounced during the first hour following the passing of the SBF. Beyond this period, the observed changes may be influenced by additional factors, such as the secondary effects resulting from meteorological transitions induced by the SBF. Additionally, the intensity of the SBF's impact may begin to weaken or become less pronounced after the first hour. With that assumption, a percentage change of the aerosol number concentration can be further calculated. “Neutral influence” days with the change in aerosol concentration < 10 % are not considered in this analysis.
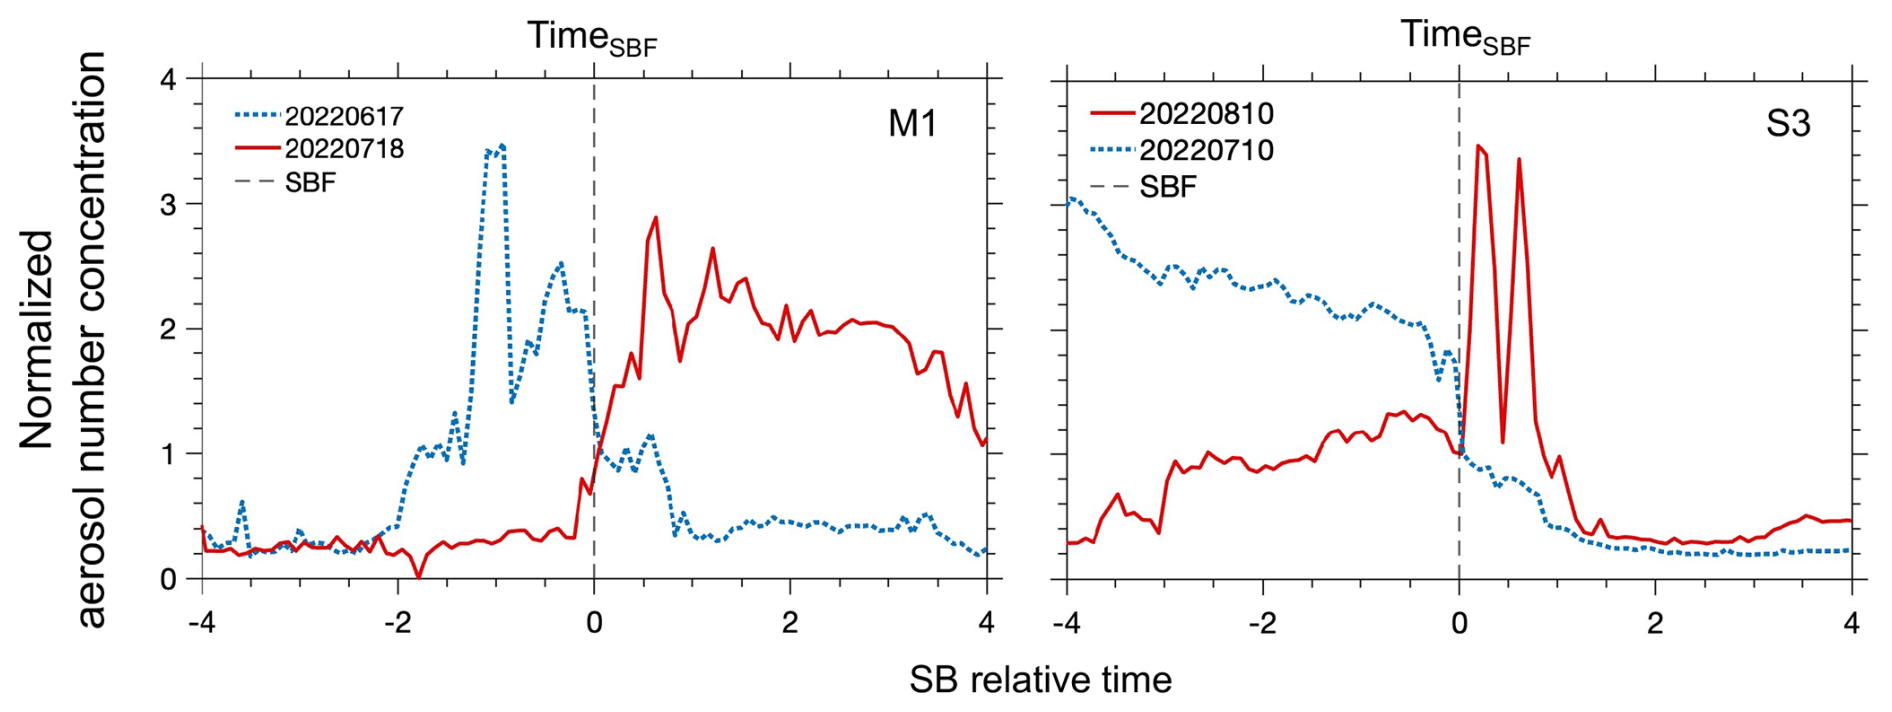
Figure 6Time series of the normalized aerosol number concentration, with the time centered at the time of the passing of the SBF (TSBF = 0) at the M1 site (1st column) and the S3 site (2nd column) during the individual SB event days.
Table 1 summarizes the total number of SBC events, along with number and percentage of days showing enhancement, reduction, or neutral influence on the aerosol number concentration at the M1 and S3 sites. Neutral days were excluded from the overall averages to focus solely on the cases with a clear aerosol response. Out of 46 SBC events at the M1 site, 29 events (∼ 63 %) showed an enhancement or reduction influence on total aerosol number concentration, while the remaining 17 events (∼ 37 %) were classified as having a neutral influence. In contrast to M1, at the S3 site, out of 30 SBC events, only 12 events (∼ 40 %) exhibited a detectable change in aerosol number concentration, with the remaining 18 d (∼ 60 %) considered neutral. At the M1 site, reduction events (16 events) slightly outnumbered enhancement events (13 events). In contrast, at S3, enhancements (8 events) were twice as common as reductions (4 events). This opposite pattern underscores the site-dependent nature of the sea-breeze influence.
During enhancement days, the M1 site shows an average increase in aerosol number concentration of ∼ 55 %, rising from 3.8 × 103 cm−3 during T− to 5.9 × 103 cm−3 during T+. In contrast, during the reduction days, the concentration decreases by ∼ 42 %, dropping from 13.2 × 103 cm−3 during T− to 7.6 × 103 cm−3 during T+. At the S3 site, the average changes are ∼ 64 % (from 2.4 × 103 cm−3 during T− to 3.9 × 103 cm−3 during T+) enhancement and ∼ 45 % (from 4.9 × 103 cm−3 during T− to 2.7 × 103 cm−3 during T+) reduction. When averaged across all events, the aerosol number concentration at M1 shows a net decrease of ∼ 23 %, from 8.9 × 103 cm−3 during T− to 6.8 × 103 cm−3 during T+, while S3 exhibits a net increase of ∼ 9 %, from 3.2 × 103 cm−3 during T− to 3.5 × 103 cm−3. These contrasting trends underscore the regional variability in aerosol responses associated with SAI events.
As previously mentioned, the geographical positioning of M1 and S3 sites could be one of the reasons for such variabilities. M1 is more influenced by the bay breeze coming from Galveston Bay and S3 is more likely influenced by Gulf breeze from Gulf of Mexico. Even if the SBF air mass initially contains lower aerosol concentrations, a longer inland transit to S3 can (a) increase mixing with the preexisting continental boundary layer and (b) increase acquisition of continental emissions along the over-land fetch, either of which can raise concentrations by the time the SBF reaches S3, and vice versa. The M1 site is influenced by the air masses and SBCs from both sources, whereas the S3 site is affected predominantly by those originating from the Gulf of Mexico. As discussed in detail by previous studies (Sharma et al., 2024; Wang et al., 2024), the SBFs originating from Galveston Bay and the Gulf of Mexico are often distinct at onset but tend to merge later in the afternoon or evening. Due to the M1 site's proximity to Galveston Bay, it is more directly influenced by maritime air masses that are heavily modified by Galveston Bay as the SBF originating from the Gulf of Mexico traverses the Bay. On the other hand, the Gulf-originating SBF must cross land before reaching S3. The difference in SBF pathways can lead to notable meteorological and aerosol contrasts between the two sites. In addition, as observed by Thompson et al. (2025), the maritime air masses near Galveston can deviate significantly from typical clean maritime conditions. As a result, bay breeze passages may not always lead to cleaner air but can, in fact, be more polluted. The consequences of this increased aerosol concentration in the modified maritime air mass are reflected in the enhancement aerosol response observed at the M1 site.
SAIs can also interfere with NPF events. On SB days, a total of 7 NPF events were observed at the M1 site and 4 at the S3 site, with 3 occurring simultaneously at both sites. Among these, 45 % (5 out of 11) events showed distinct changes in NPF characteristics during the SBF passage. For example, on 16 July an NPF event was observed at M1 prior to the SBF (Fig. S4). With the arrival of the SBF, particle growth abruptly ceased, and the elevated particle concentration (∼ 14 × 103 particles cm−3) rapidly decreased to ∼ 5 × 10³ particles cm−3 (Fig. S4). The normalized aerosol size distribution further shows that the NPF activity evident in the hours before the SBF period (T− = TSBF + 1 h) disappeared in the hour following the SBF (T+ = TSBF + 1 h). The low aerosol concentration air mass trailing the SBF passage thus led to a sharp reduction in the aerosol number concentrations in the after-SBF period.
The open-air polar plots summarize the relationship between aerosol number concentration, wind speed and wind direction within T = TSBF ± 1 h during enhancement and reduction events (Fig. 7). At M1, enhancement events reveal elevated aerosol concentrations when the prevailing winds emanate from the east and southeast, where the air mass is influenced by industry and shipping along Galveston Bay. During the reduction influence the pre-SBF aerosol loading is higher compared to that of the reduction events. These high concentrations are associated with the influence from the Houston urban core in the northwest and the other influences from the east as mentioned above. These are also apparent in the monthly plots shown in Fig. S5. After-SBF winds, particularly from the southeast and south, are associated with markedly lower aerosol loads, indicative of cleaner marine air intrusion.
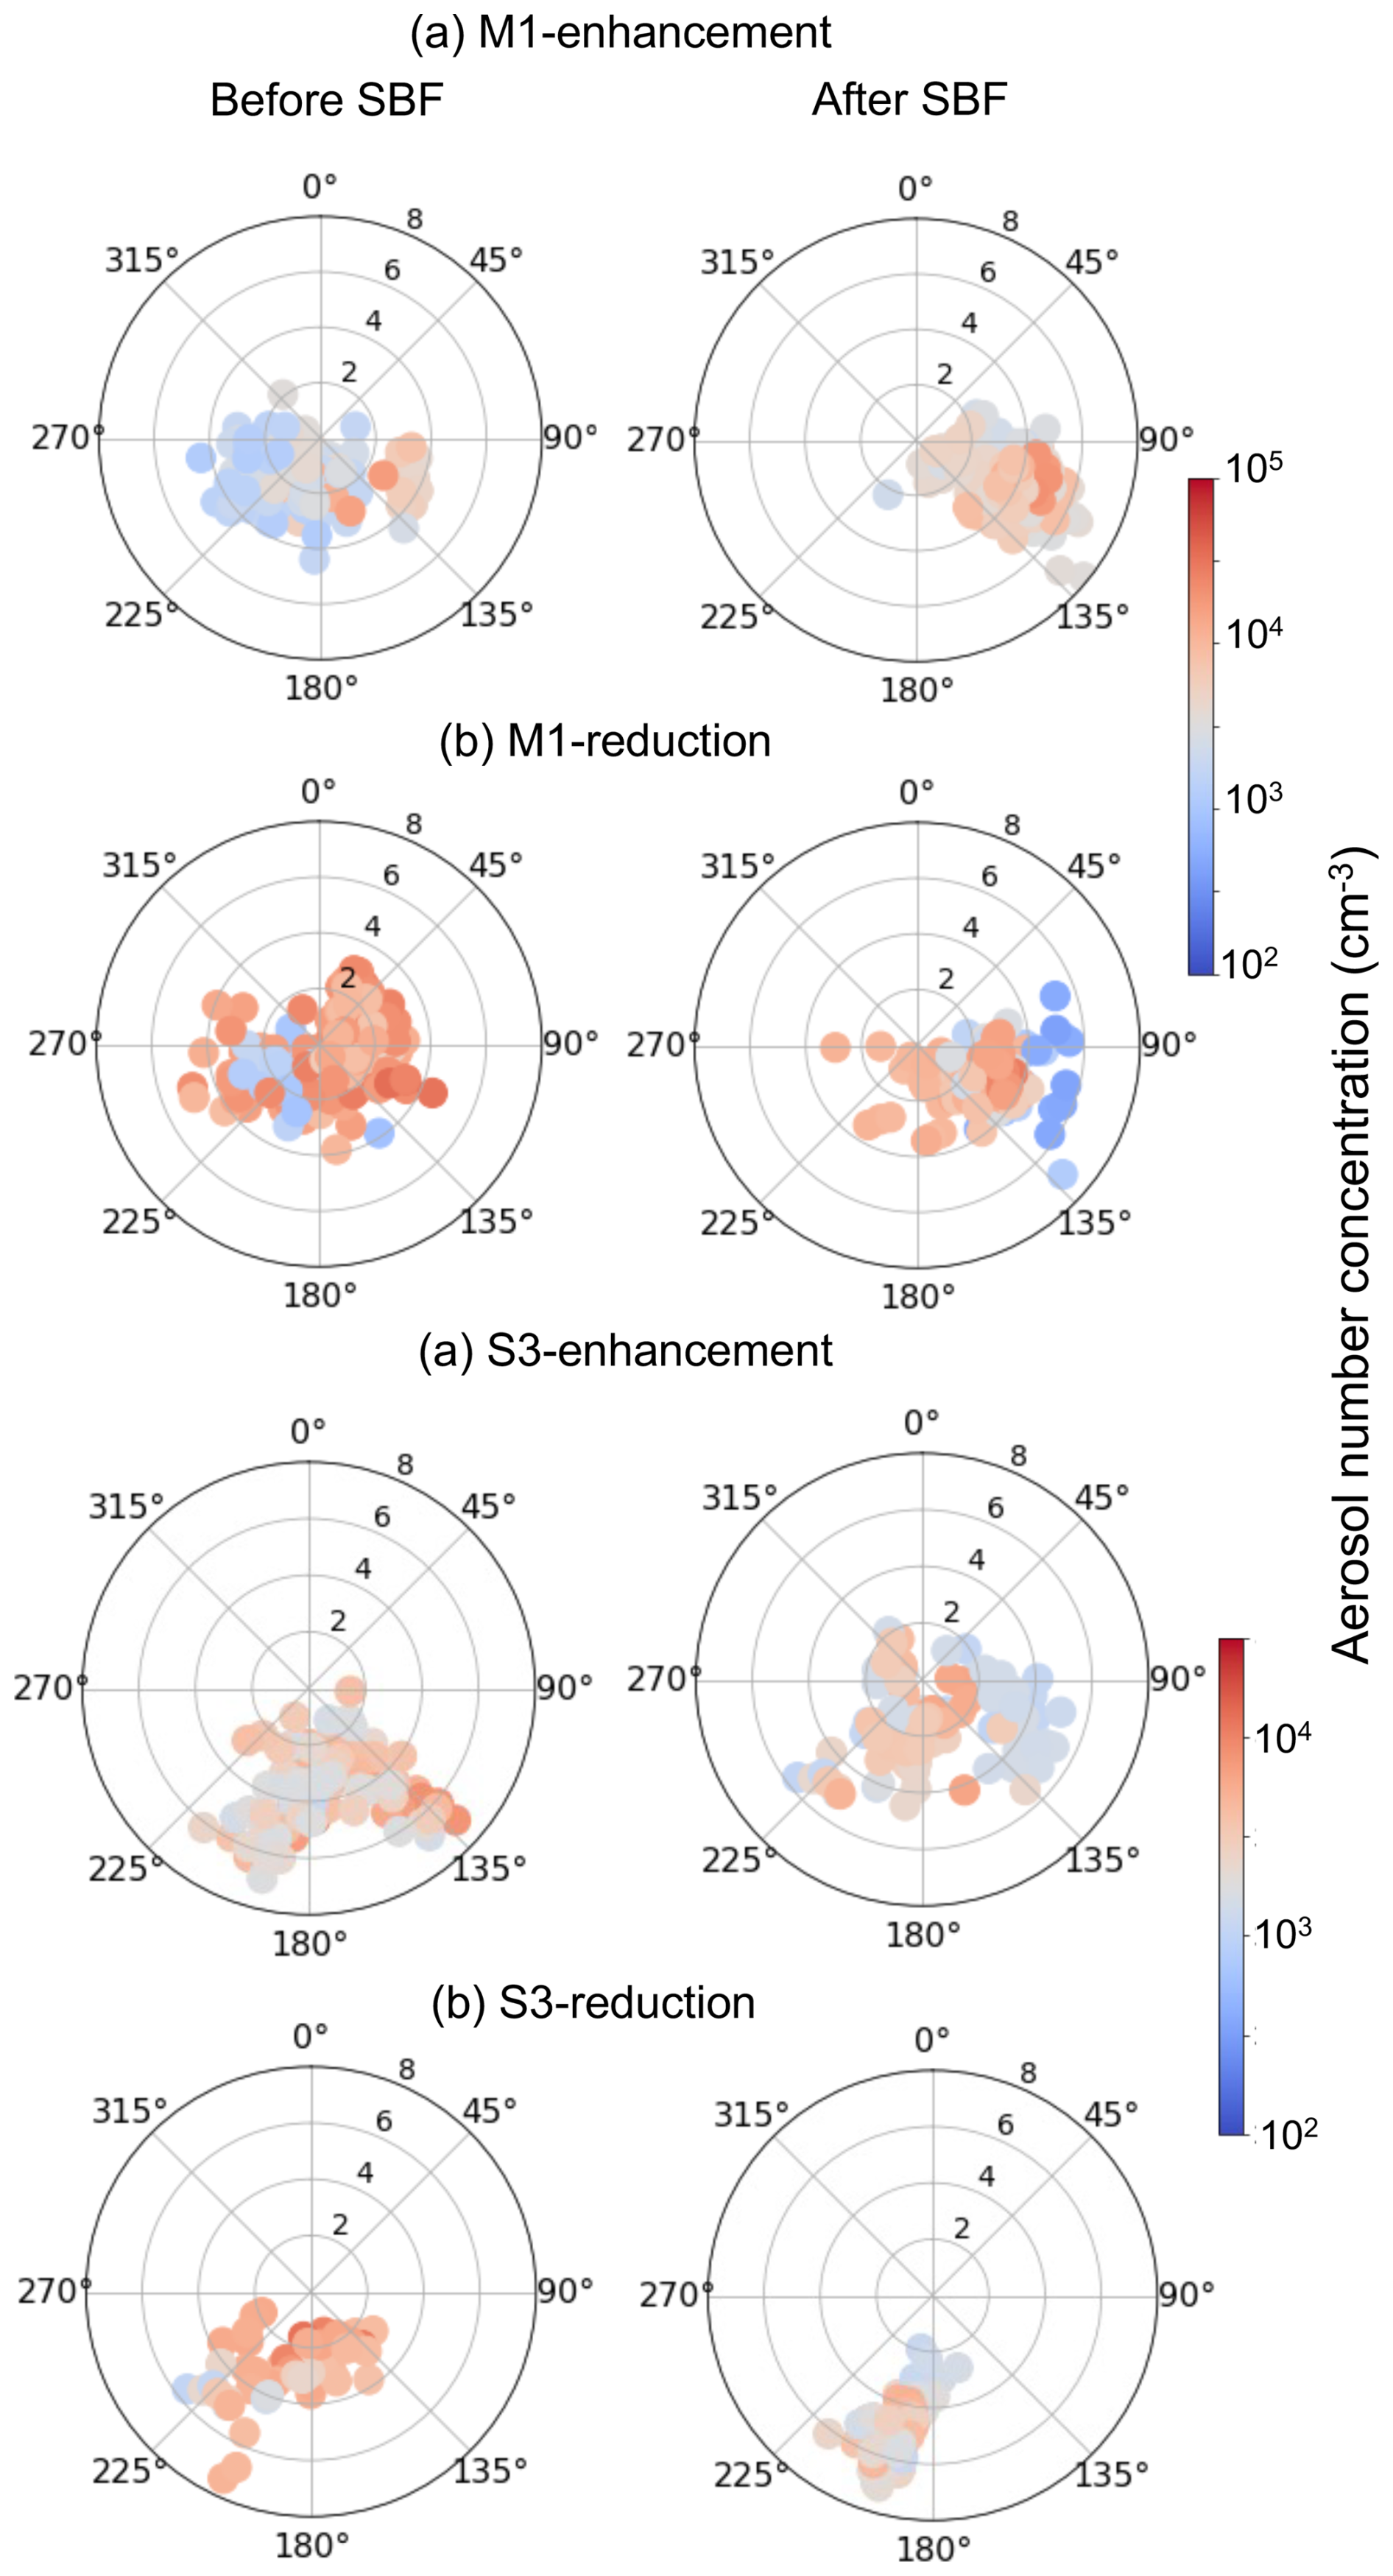
Figure 7Open-air polar plots for aerosol number concentration before and after the passing of the SBF (T = TSBF ± 1) during (a) enhancement and (b) reduction events at M1 and S3 sites. The wind speed (in m s−1) grid lines are presented with black circles; the color scales represent the concentrations observed with each wind speed and direction combinations.
Meanwhile at S3, enhancement scenarios also manifest somewhat higher concentrations when winds shift southeastward, though to a lesser extent, reflecting rural aerosol dynamics. In reduction scenarios at S3, aerosol levels decrease most notably under southerly and southwest flow, reinforcing the interpretation that sea breeze incursions generally replace continental aerosol-laden air with cleaner marine air at both sites, albeit with stronger source influence at M1. This wind-direction-dependent concentration pattern aligns with previous findings: northwesterly to easterly winds bring continental aerosols, while southerly to southwesterly flows usher in marine-influenced clean air that modulates aerosol number concentrations (Levy et al., 2013; Pinto et al., 2014). Recent study by Kasparoglu et al. (2024) observed that the cloud droplet number concentrations differed by a factor of ∼ 2–3 between northeasterly and southerly flows, highlighting strong wind-direction controls on cloud microphysics around southern Texas. However, as shown in Figs. S2 and S3, each SB event is unique in terms of the change in the aerosol concentrations.
3.4 Examples of sea breeze aerosol interaction at the TRACER sites
In Fig. 8, we provide an example of an aerosol reduction influence of SAI. Since M1 and S3 both experienced the passage of a SBF on 10 July, this day serves as a good example to investigate how SAIs evolve when simultaneously viewed at multiple sites. The SBF reached the M1 site in the afternoon at around 21:30 UTC, and the S3 site at around 23:45 UTC. In Fig. S6, we supplement these discussions with displays for the temporal variation of measured and model-simulated meteorological properties for this event. Both sites suggest the typical temperature decreases and surface wind speed increase associated with the SBF reaching the site. The wind direction changes from east to south at the M1 site and from southwest to south at the S3 site.
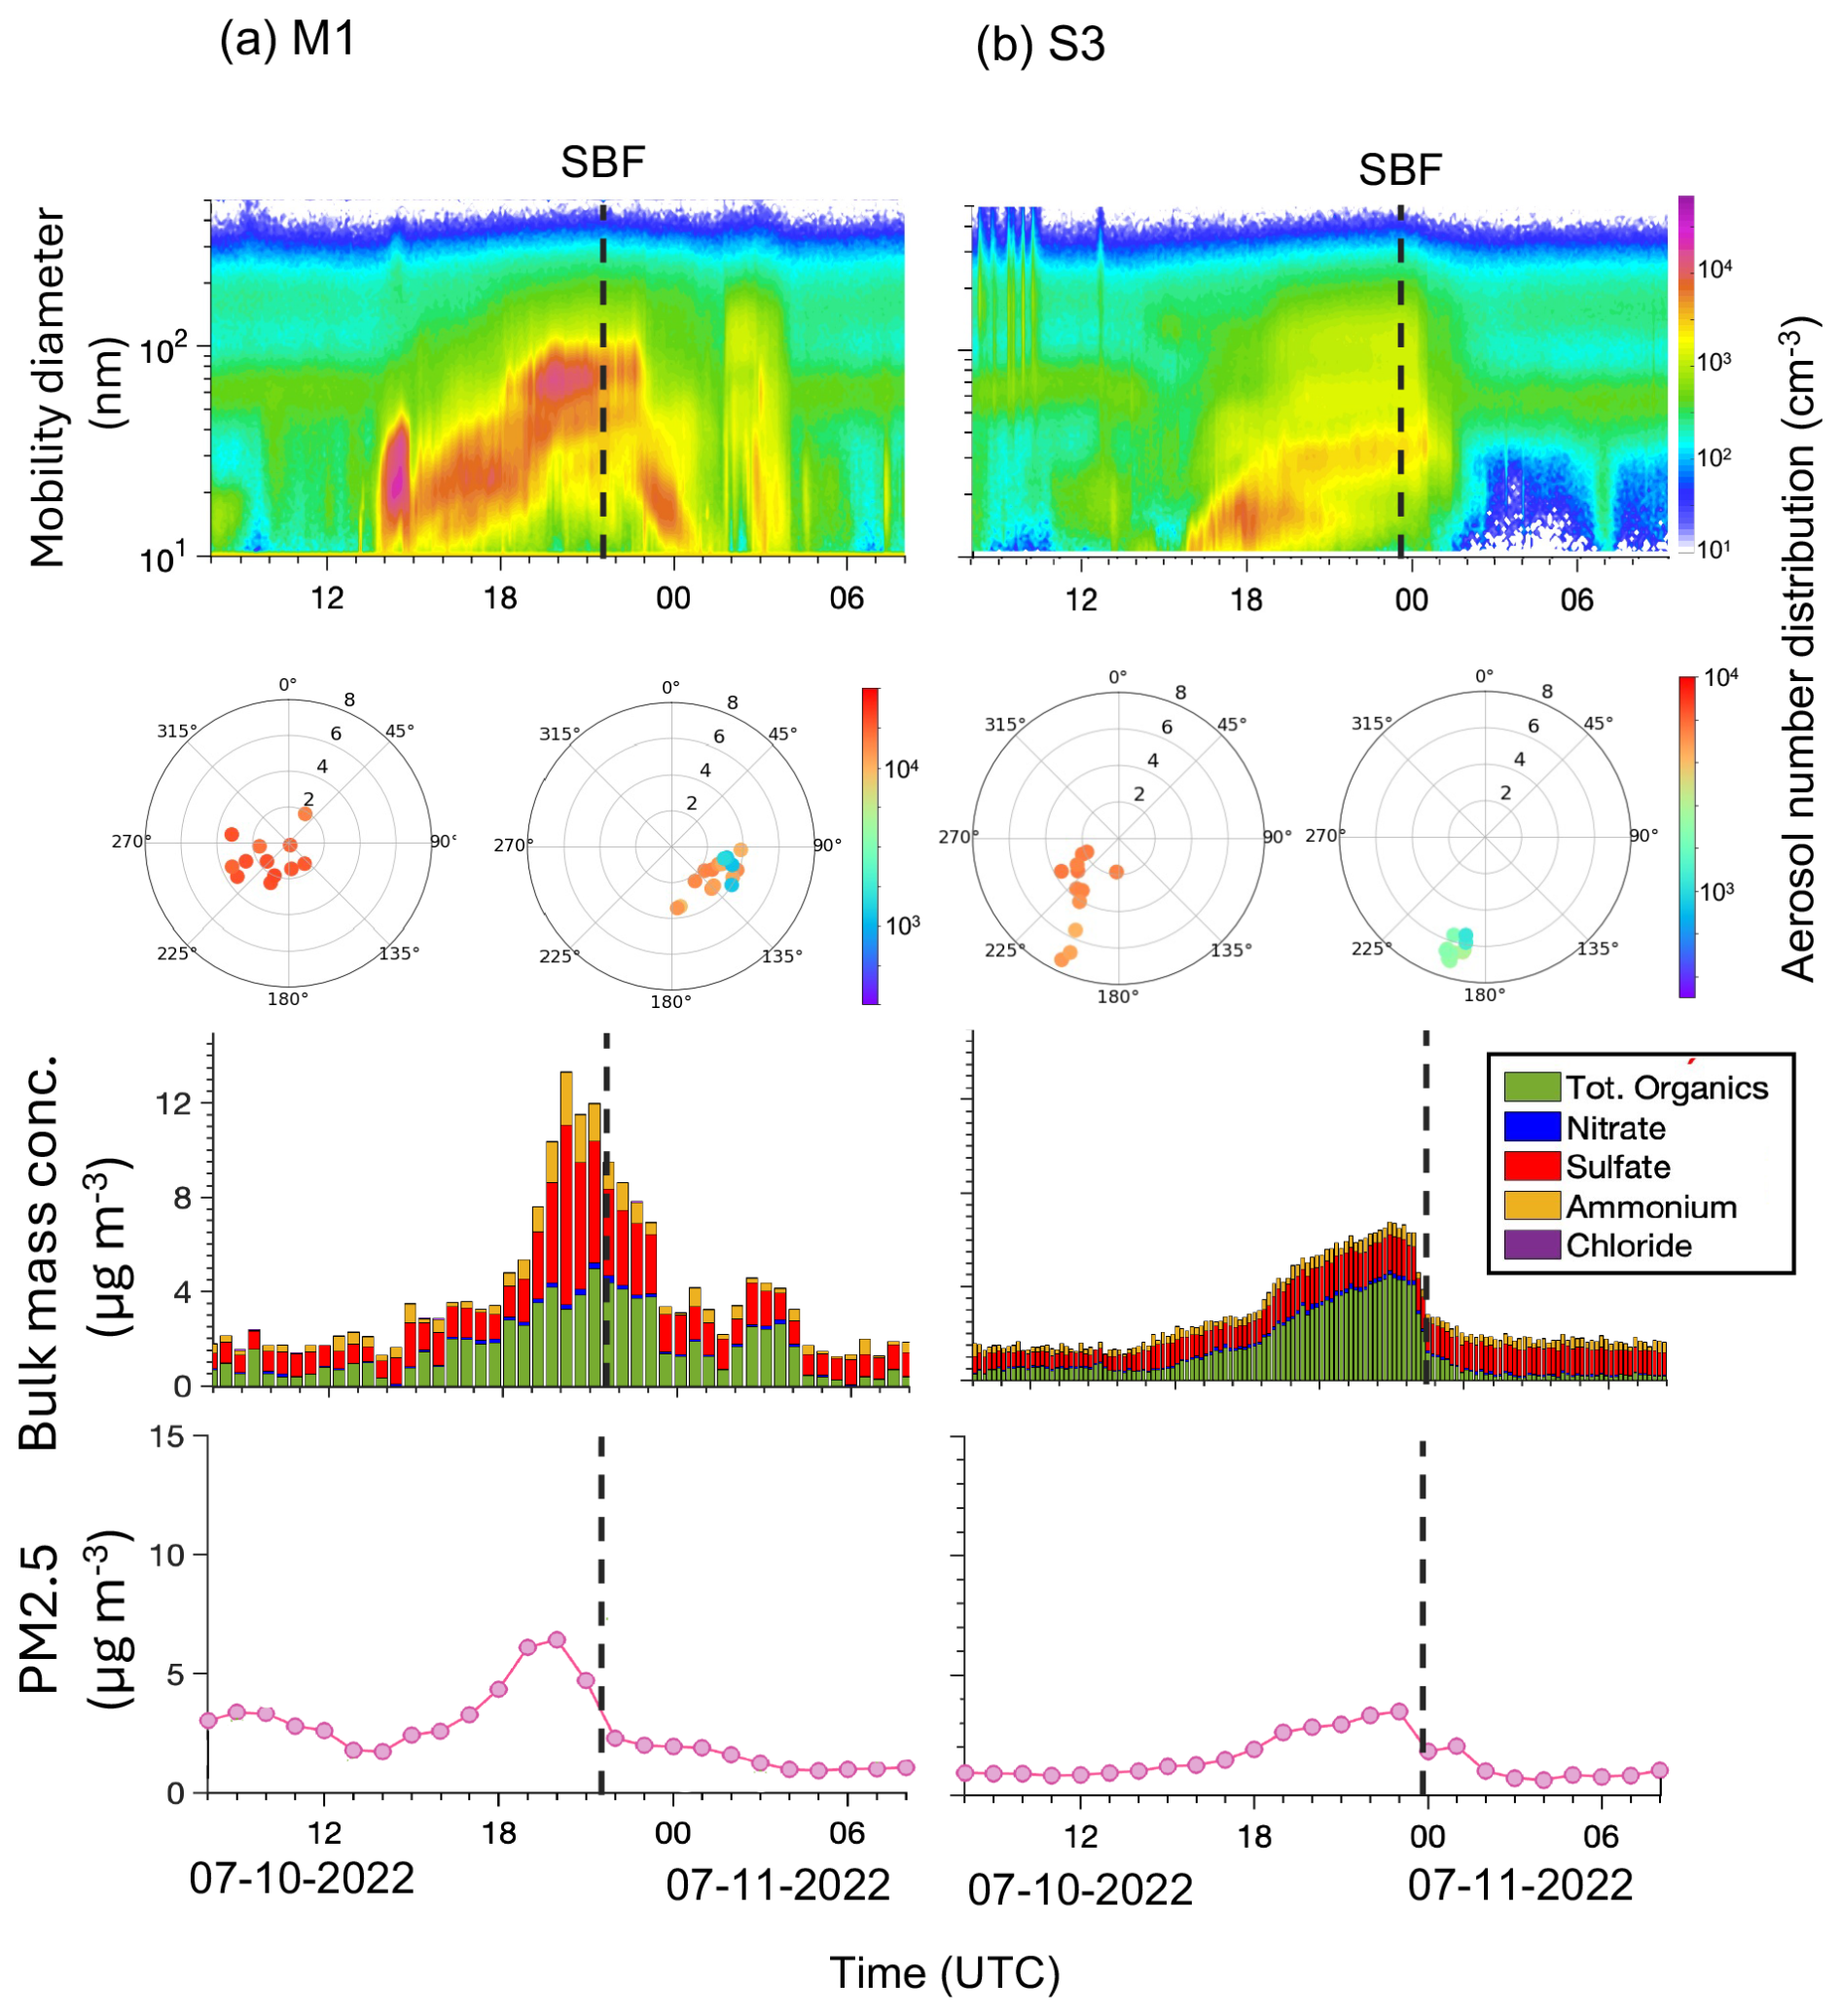
Figure 8Time series of measured aerosol size distribution (1st row), measured bulk chemical composition (3rd row), and modeled PM2.5 mass concentration (4th row) at (a) M1 and (b) S3 on 10 July 2022. Polar plot showing the measured integrated aerosol number concentration during 1 h before and after the passing of the SBF (2nd row). The black dashed line represents the time of the passing of the SBF (TSBF) at the respective sites.
The changes in aerosol size distribution, reduction in the bulk chemical composition, and simulated PM2.5 all suggest that the air mass following SBF passage contains lower aerosol concentration (Fig. 8.). This likely indicates that during the after-SBF period, the air mass is arriving from directions less influenced by the aerosol sources. The SBF acts as a leading edge of this cleaner marine air mass. The aerosol number concentration decreases by ∼ 5 % (5.2 × 102 cm−3) at the M1 site. At the M1 site, there was no significant change in the mean Dp (∼ 100 nm) during the first 45 min after TSBF, which is followed by a sharp decrease in the mean Dp (∼ 25 nm). This change in the aerosol number concentration is synchronous with the changes in wind directions. During the after-SBF period, the winds shift predominantly from the southeast and south, bringing in a more marine-influenced air mass.
Immediately after the passing of the SBF at the S3 site, the SAI also indicates a reduction of the aerosol number concentration by ∼ 62 % (3.3 × 103 cm−3) (Fig. 8b). However, the background aerosol mode persists at diameters ∼ 60 and 150 nm (aerosol size distribution plot in Fig. 8b). Note, we did not observe a profound change in the wind directions after the passing of the SBF at the S3 site. However, we suggest that the higher wind speed associated with the SBF dilutes the existing air mass with marine air with lower aerosol concentration. Higher wind speeds enhance near-surface shear, mechanically generate turbulence, deepen the boundary layer, and strengthen vertical transport, thereby accelerating dispersion and diluting aerosol and water-vapor concentrations (Kgabi and Mokgwetsi, 2009; Dueker et al., 2017; Liu et al., 2025). Conversely, low winds with a shallow boundary layer and weak turbulence promote accumulation and often worsen air quality due to limited dilution (Seinfeld and Pandis, 2006). The modified near-surface air mass at S3 persists overnight until convective mixing begins the following day. Under stable stratification, buoyant turbulence is suppressed, and shear-driven mixing becomes the primary dilution mechanism; although weaker than convective mixing, it can still substantially mitigate concentration build-up (Rodier et al., 2017).
The aerosol bulk chemical mass concentration at the M1 site shows a steady buildup through the day, peaking just before the passing of the SBF. Organics were the dominant species throughout, with sulfate and nitrate also contributing. After the passage of the SBF, concentrations dropped rapidly by about 1 to 3 µg m−3, with the drop being more apparent in sulfate and organics. Within a few hours, concentrations returned to the background levels. These concentrations remained higher than those at the rural S3 site. However, the more pronounced changes in aerosol properties were observed at the S3 site. The concentrations of all species, including organic, decreased by 2 to 3 µg m−3. This is consistent with the earlier discussion that the maritime air mass near Galveston Bay exhibits higher aerosol concentrations compared to the more pristine maritime air mass originating directly from the Gulf of Mexico.
In Figs. S7 and S8, we provide additional examples from TRACER SAI events. The first example is from the 17 July event where we observed an increased influence in the aerosol concentration that followed SBF passage. In Fig. S7, we present an example of an aerosol enhancement case associated with an SAI event on 17 July. The SBF reached the M1 site in the early afternoon (∼ 18:12 UTC), and at around 21:42 UTC at the S3 site. The aerosol size distribution displayed an enhancement of particles in the diameter range of 15–100 nm. Total organics, sulfate, and simulated PM2.5 also increased, suggesting that the post-SBF air mass contained higher aerosol concentrations, likely due to transport from more polluted source regions. Similar to the 10 July case, the SBF acted as the leading edge, but here it marked a more polluted marine-influenced air mass.
At M1, the aerosol number concentration also doubled (∼ 2.2 × 103 cm−3), accompanied by a significant shift in mean particle diameter (within 15–100 nm) during the first hour after SBF passage, with weaker changes thereafter. These responses were synchronous with shifts in wind direction from southwest to east. The easterly winds, influenced by emissions from the HSC, contributed to the observed increase. In contrast, at S3 the SAI did not produce distinct changes in aerosol size distribution or mass concentrations, and except for the increase in the wind speed, no substantial wind direction change occurred after SBF passage. The modified near-surface air mass at both sites persisted for only ∼ 2 h, after which background conditions returned. Notably, background aerosol modes at ∼ 60 and ∼ 150 nm persisted throughout (Fig. S7).
Figure S8 shows an example of a neutral SAI influence on 16 August. The SBF reached M1 at ∼ 17:05 UTC and S3 at ∼ 20:10 UTC. At M1, winds shifted from east to south, while no distinct directional change was observed at S3. Unlike the 10 and 17 July cases, M1 was already under high aerosol conditions, with particle concentrations consistently elevated at diameters < 80 nm. In contrast, S3 remained under low aerosol conditions for most of the day, except for a brief increase just prior to the SBF passage. The SAI did not produce notable changes in aerosol size distribution, bulk chemical composition, or simulated PM2.5, indicating that pre- and post-SBF aerosol concentrations were comparable at both sites. Although wind direction changed at M1, the marine-influenced air mass was also burdened by high aerosol loading, limiting its impact on conditions at the site. Similarly, S3 showed no discernible change, with concentrations remaining low before and after the SBF passage. Detailed discussions on these example events will be continued in the next section that expands this discussion to include regional removal and transport influences on these SAI events.
3.5 Regional influence of sea-breeze aerosol interaction
In Fig. 9, we provide the spatial distribution of modeled w, planetary boundary layer height (PBLH), surface-level wind vectors, PM2.5, and integrated aerosol number concentration (nucleation-nu0 + accumulation-ac0 mode) using WRF-Chem. Together, nu0 and ac0 concentrations reveal size-dependent aerosol changes that bulk PM2.5 mass or total number obscure, allowing SBF-driven redistribution to be attributed to specific aerosol modes and clarifying implications for microphysics, CCN/INP, and radiative effects. On 10 July, the observed SBF reached the M1 site at 21:30 UTC and reached the S3 site at 23:45 UTC. The simulation for this event accurately represents this timing for the SBF passage. The output for the time 20:00 UTC on 10 July corresponds to an example point in the simulation and daytime observations when the SBF had not reached either site. The 22:00 UTC examples correspond to a time when the modeled and observed SBF has recently passed the M1 site but not reached the S3 site. The 00:00 UTC examples (next day) correspond to a timing when the SBF has passed both TRACER field sites.
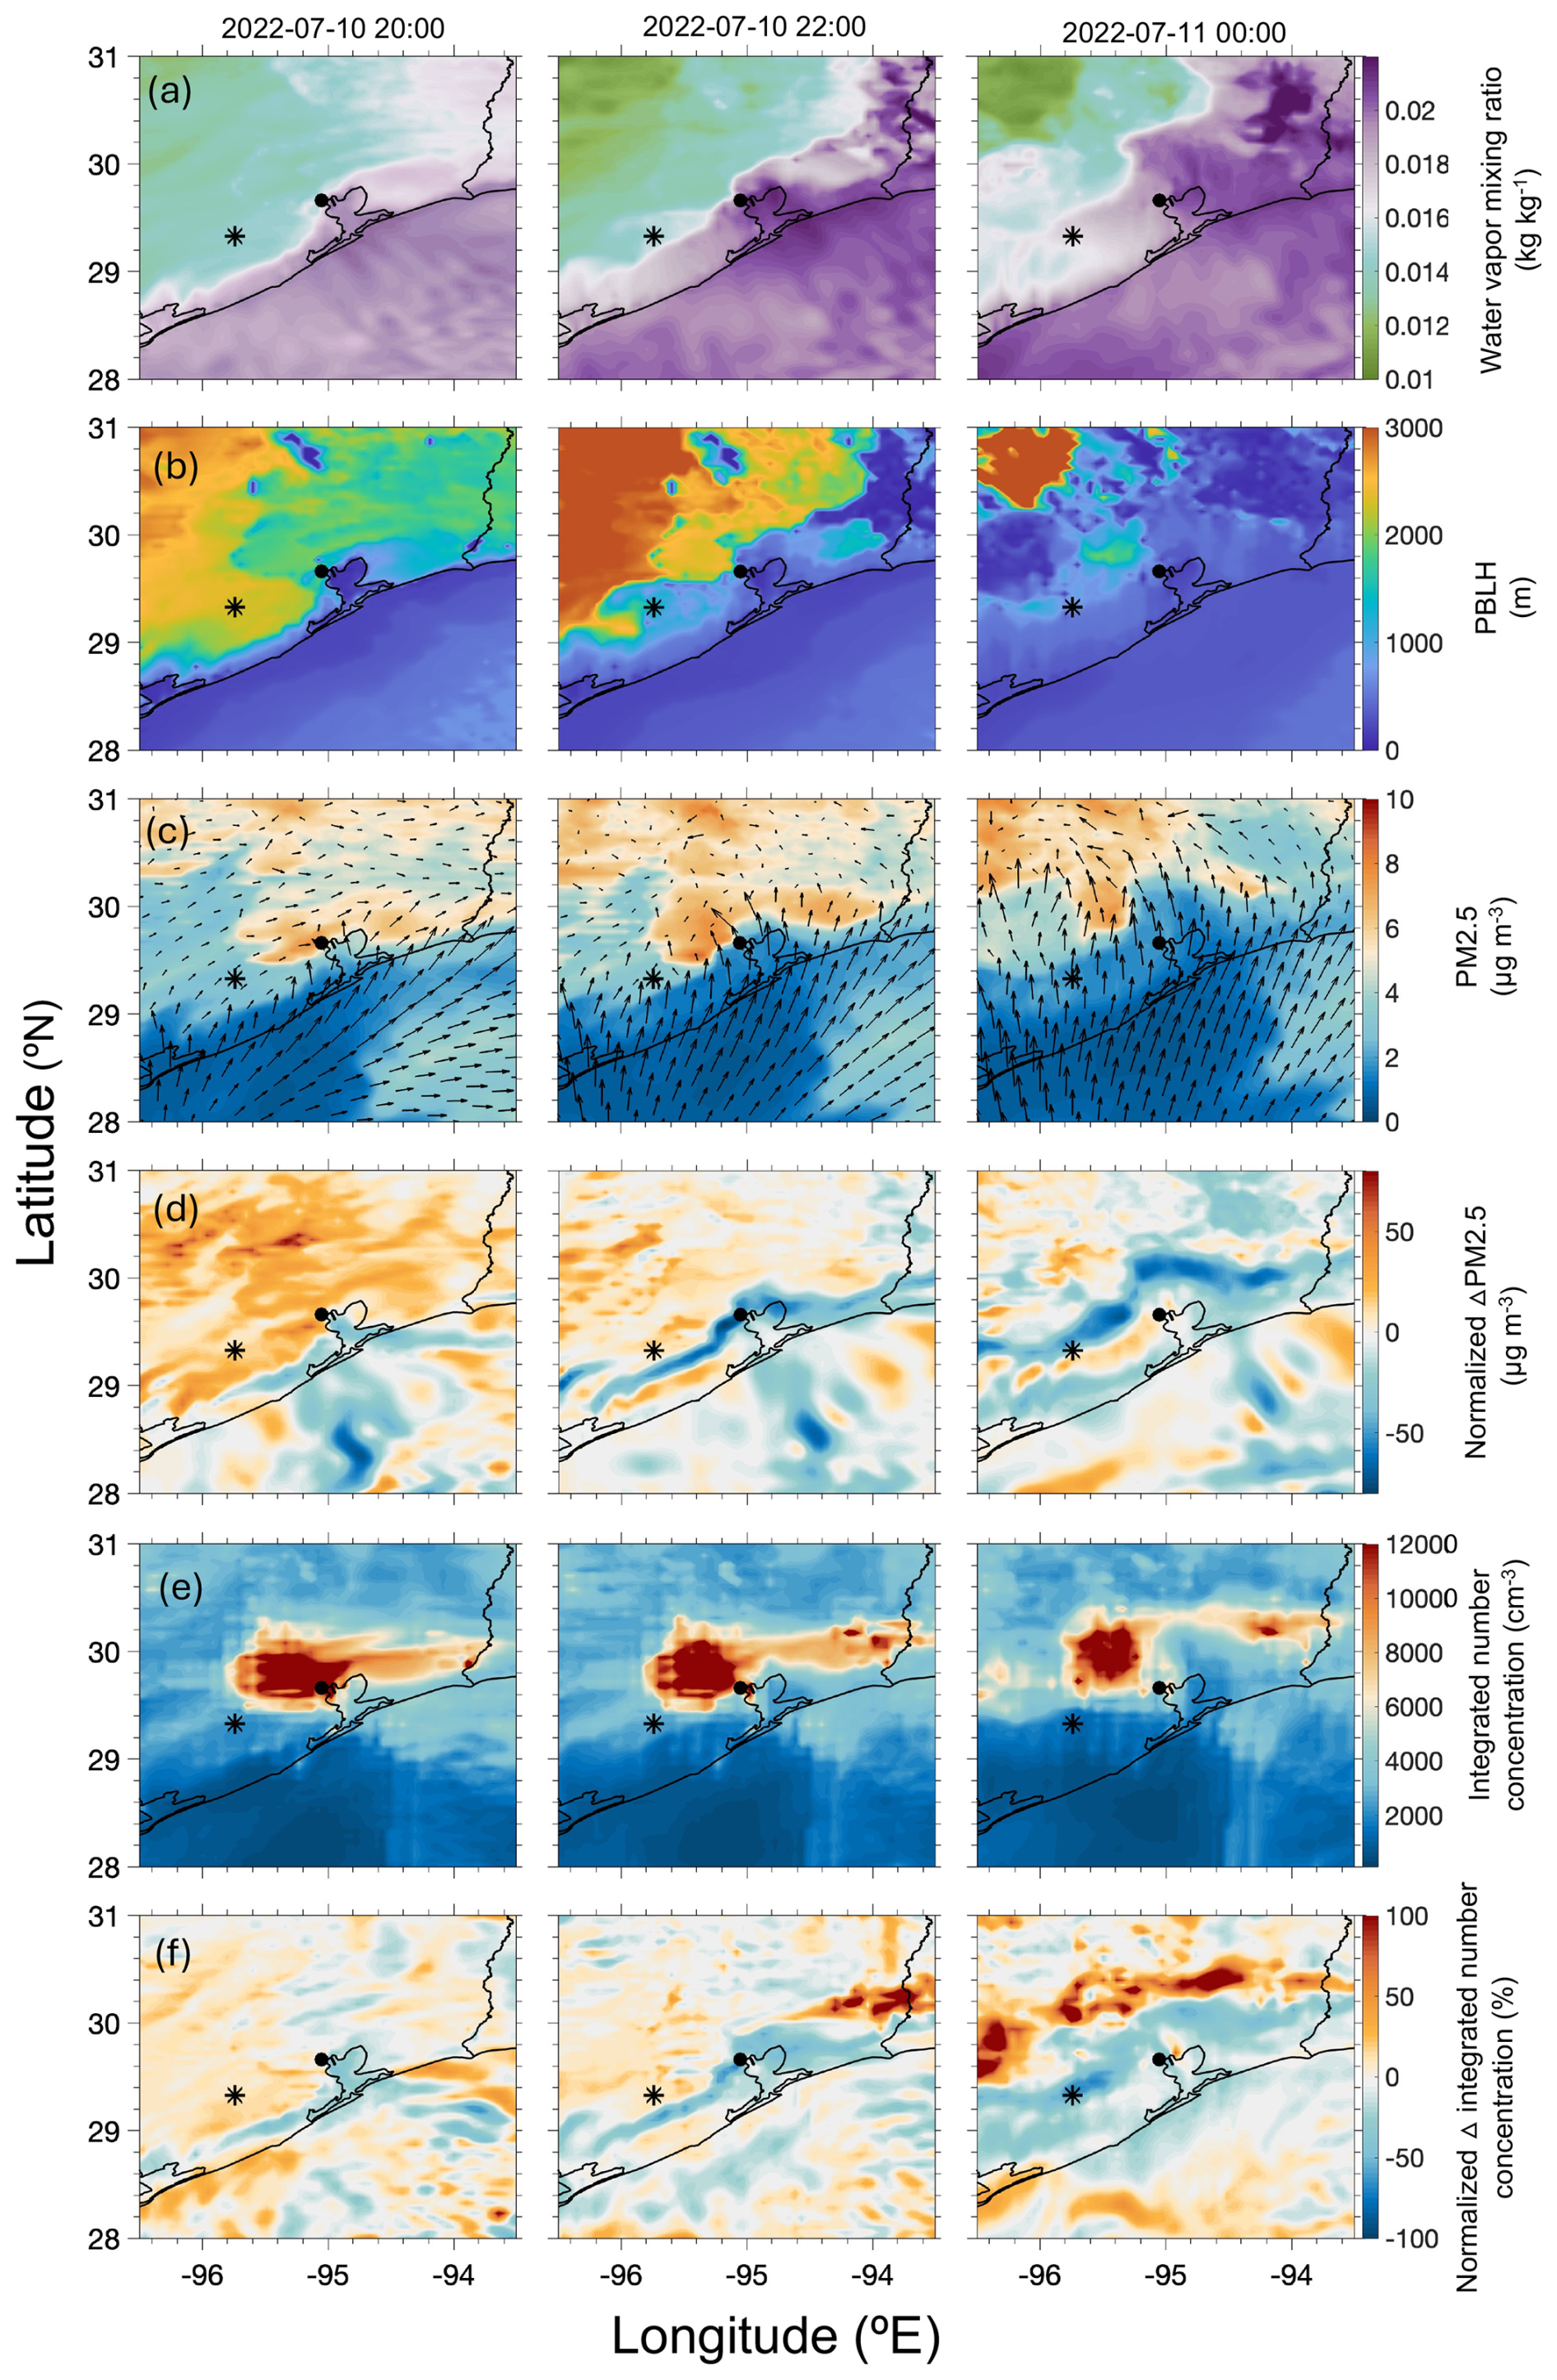
Figure 9Modeled surface distribution of (a) water vapor mixing ratio (w), (b) PBLH, (c) PM2.5, and wind vector (black arrows, at the surface), and (e) integrated aerosol number concentration (nucleation + accumulation mode) at three-time steps: 20:00 and 22:00 UTC on 10 July, and 00:00 UTC on 11 July. Panels (d) and (f) show the normalized changes, where Δ is the change from the previous time step. The filled-circle marker in the panels represent the M1 site, while the star represents the S3 site.
Behind the SBF in our simulations, south or southeast winds prevail, passing through from the Gulf of Mexico and blowing onshore at an average speed of 5 m s−1. There is an increase in w associated with the SBF passage. This transition in the air mass is also observed around the M1 site at timestep 22:00 UTC. A similar pattern in the w is observed at the S3 site at the timestep 00:00 UTC. This change at S3 is also accompanied by a decrease in the modeled PBLH.
The 10 July simulations help illustrate that while changes in aerosol and meteorological properties are more pronounced near the SBF, SBF influences may extend > 50 km inland associated with the path and extent of this feature. Along the convergence zone associated with the SBF, particle concentrations are higher ahead of the SBF and lower behind it, due to intrusion of cleaner marine air into the convergence zone. Consequently, SBF passage in the model creates a swath of reduced aerosol concentration (up to 50 %) parallel to the Galveston Bay or Gulf of Mexico coastline. Over time, a well-defined dipole pattern emerges, characterized by reduced concentrations over the coastal zone and enhanced concentrations farther inland, consistent with the inland penetration of the maritime air mass and displacement of pre-existing polluted air.
The additional example on 17 July (Fig. 10) is suggestive of an enhancement in aerosol concentration associated with the SBF event, while the 16 August event (Fig. 11) is indicative of a neutral influence from the SBF passage. Similar to 10 July, both days exhibit an increase in w associated with passage of the SBF, relative to inland areas not influenced by the front (Figs. 10a, 11a). The SBF passage was also accompanied by a decrease in modeled PBLH (Figs. 10b, 11b). On 17 July, the SBF had reached M1 and S3 by ∼ 19:00 and 21:00 UTC, respectively; winds were predominantly from southwest to east, with easterlies likely advecting emissions from the HSC and contributing to the observed enhancements.
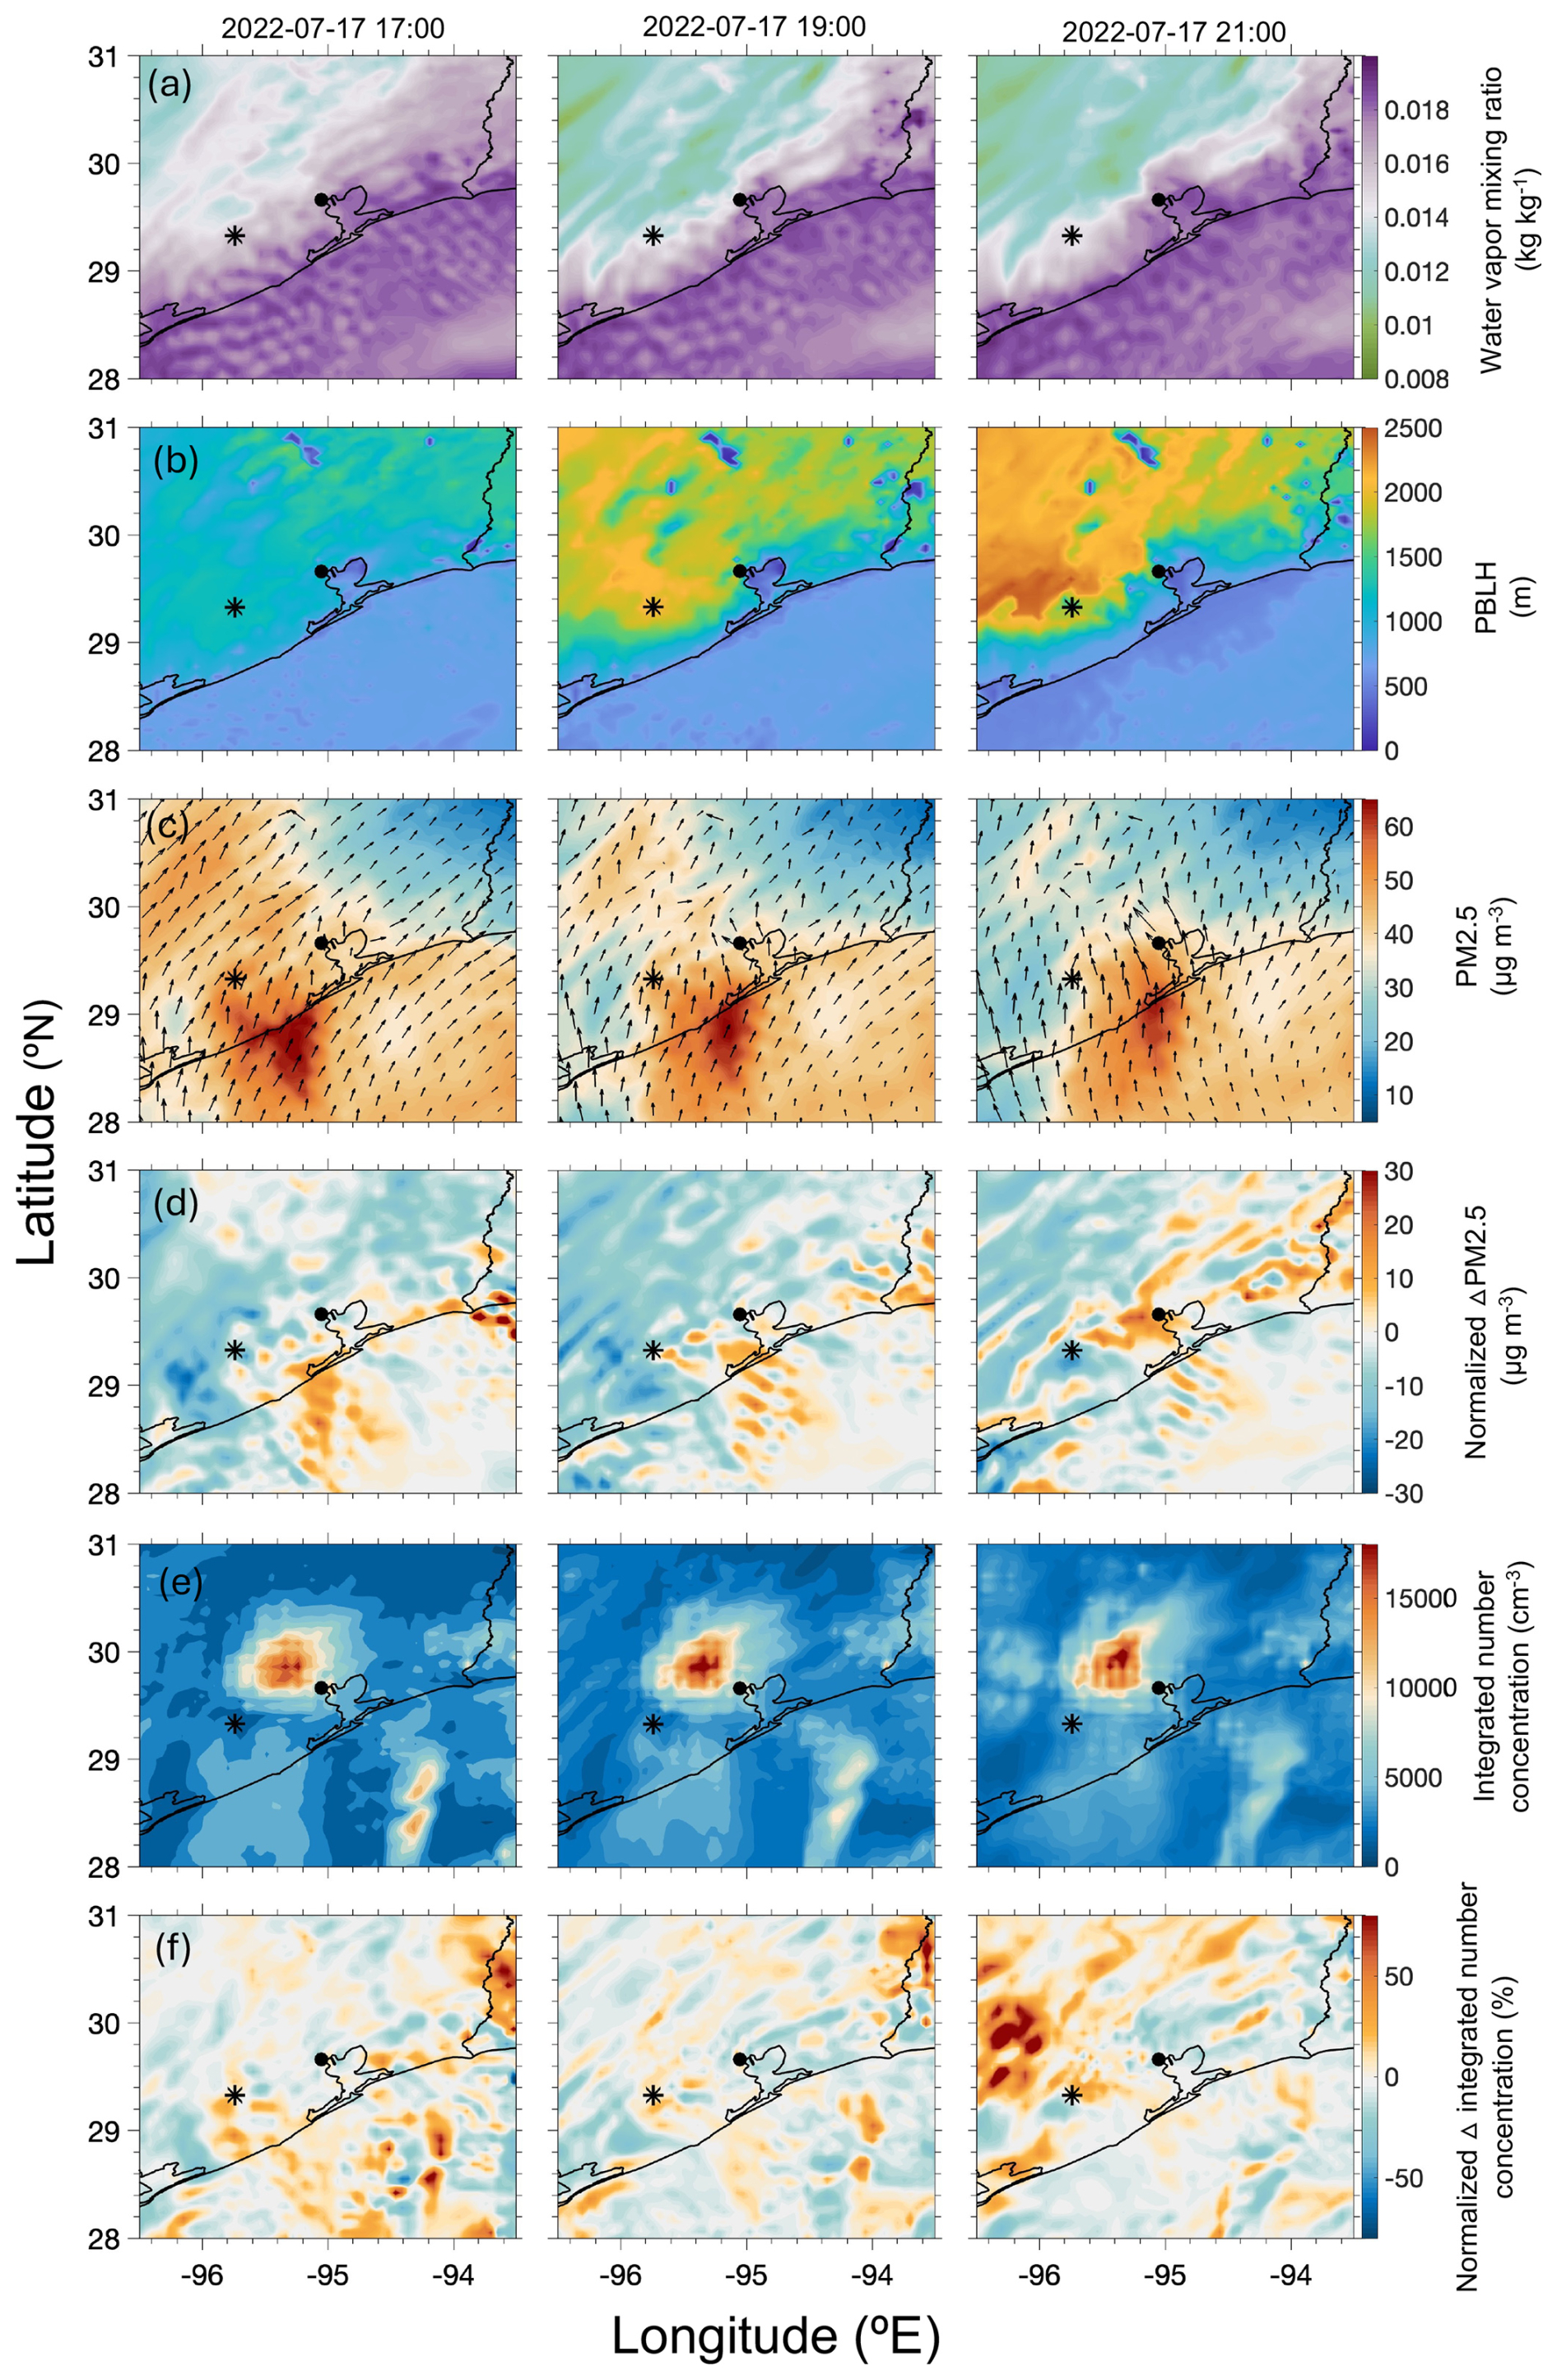
Figure 10Modeled surface distribution of (a) water vapor mixing ratio (w), (b) PBLH, (c) PM2.5, and wind vector (black arrows, at the surface), and (e) integrated aerosol number concentration (nucleation + accumulation mode) at three-time steps: 17:00, 19:00 and 21:00 UTC on 17 July. Panels (d) and (f) show the normalized changes, where Δ is the change from the previous time step. The filled-circle marker in the panels represent the M1 site, while the star represents the S3 site.
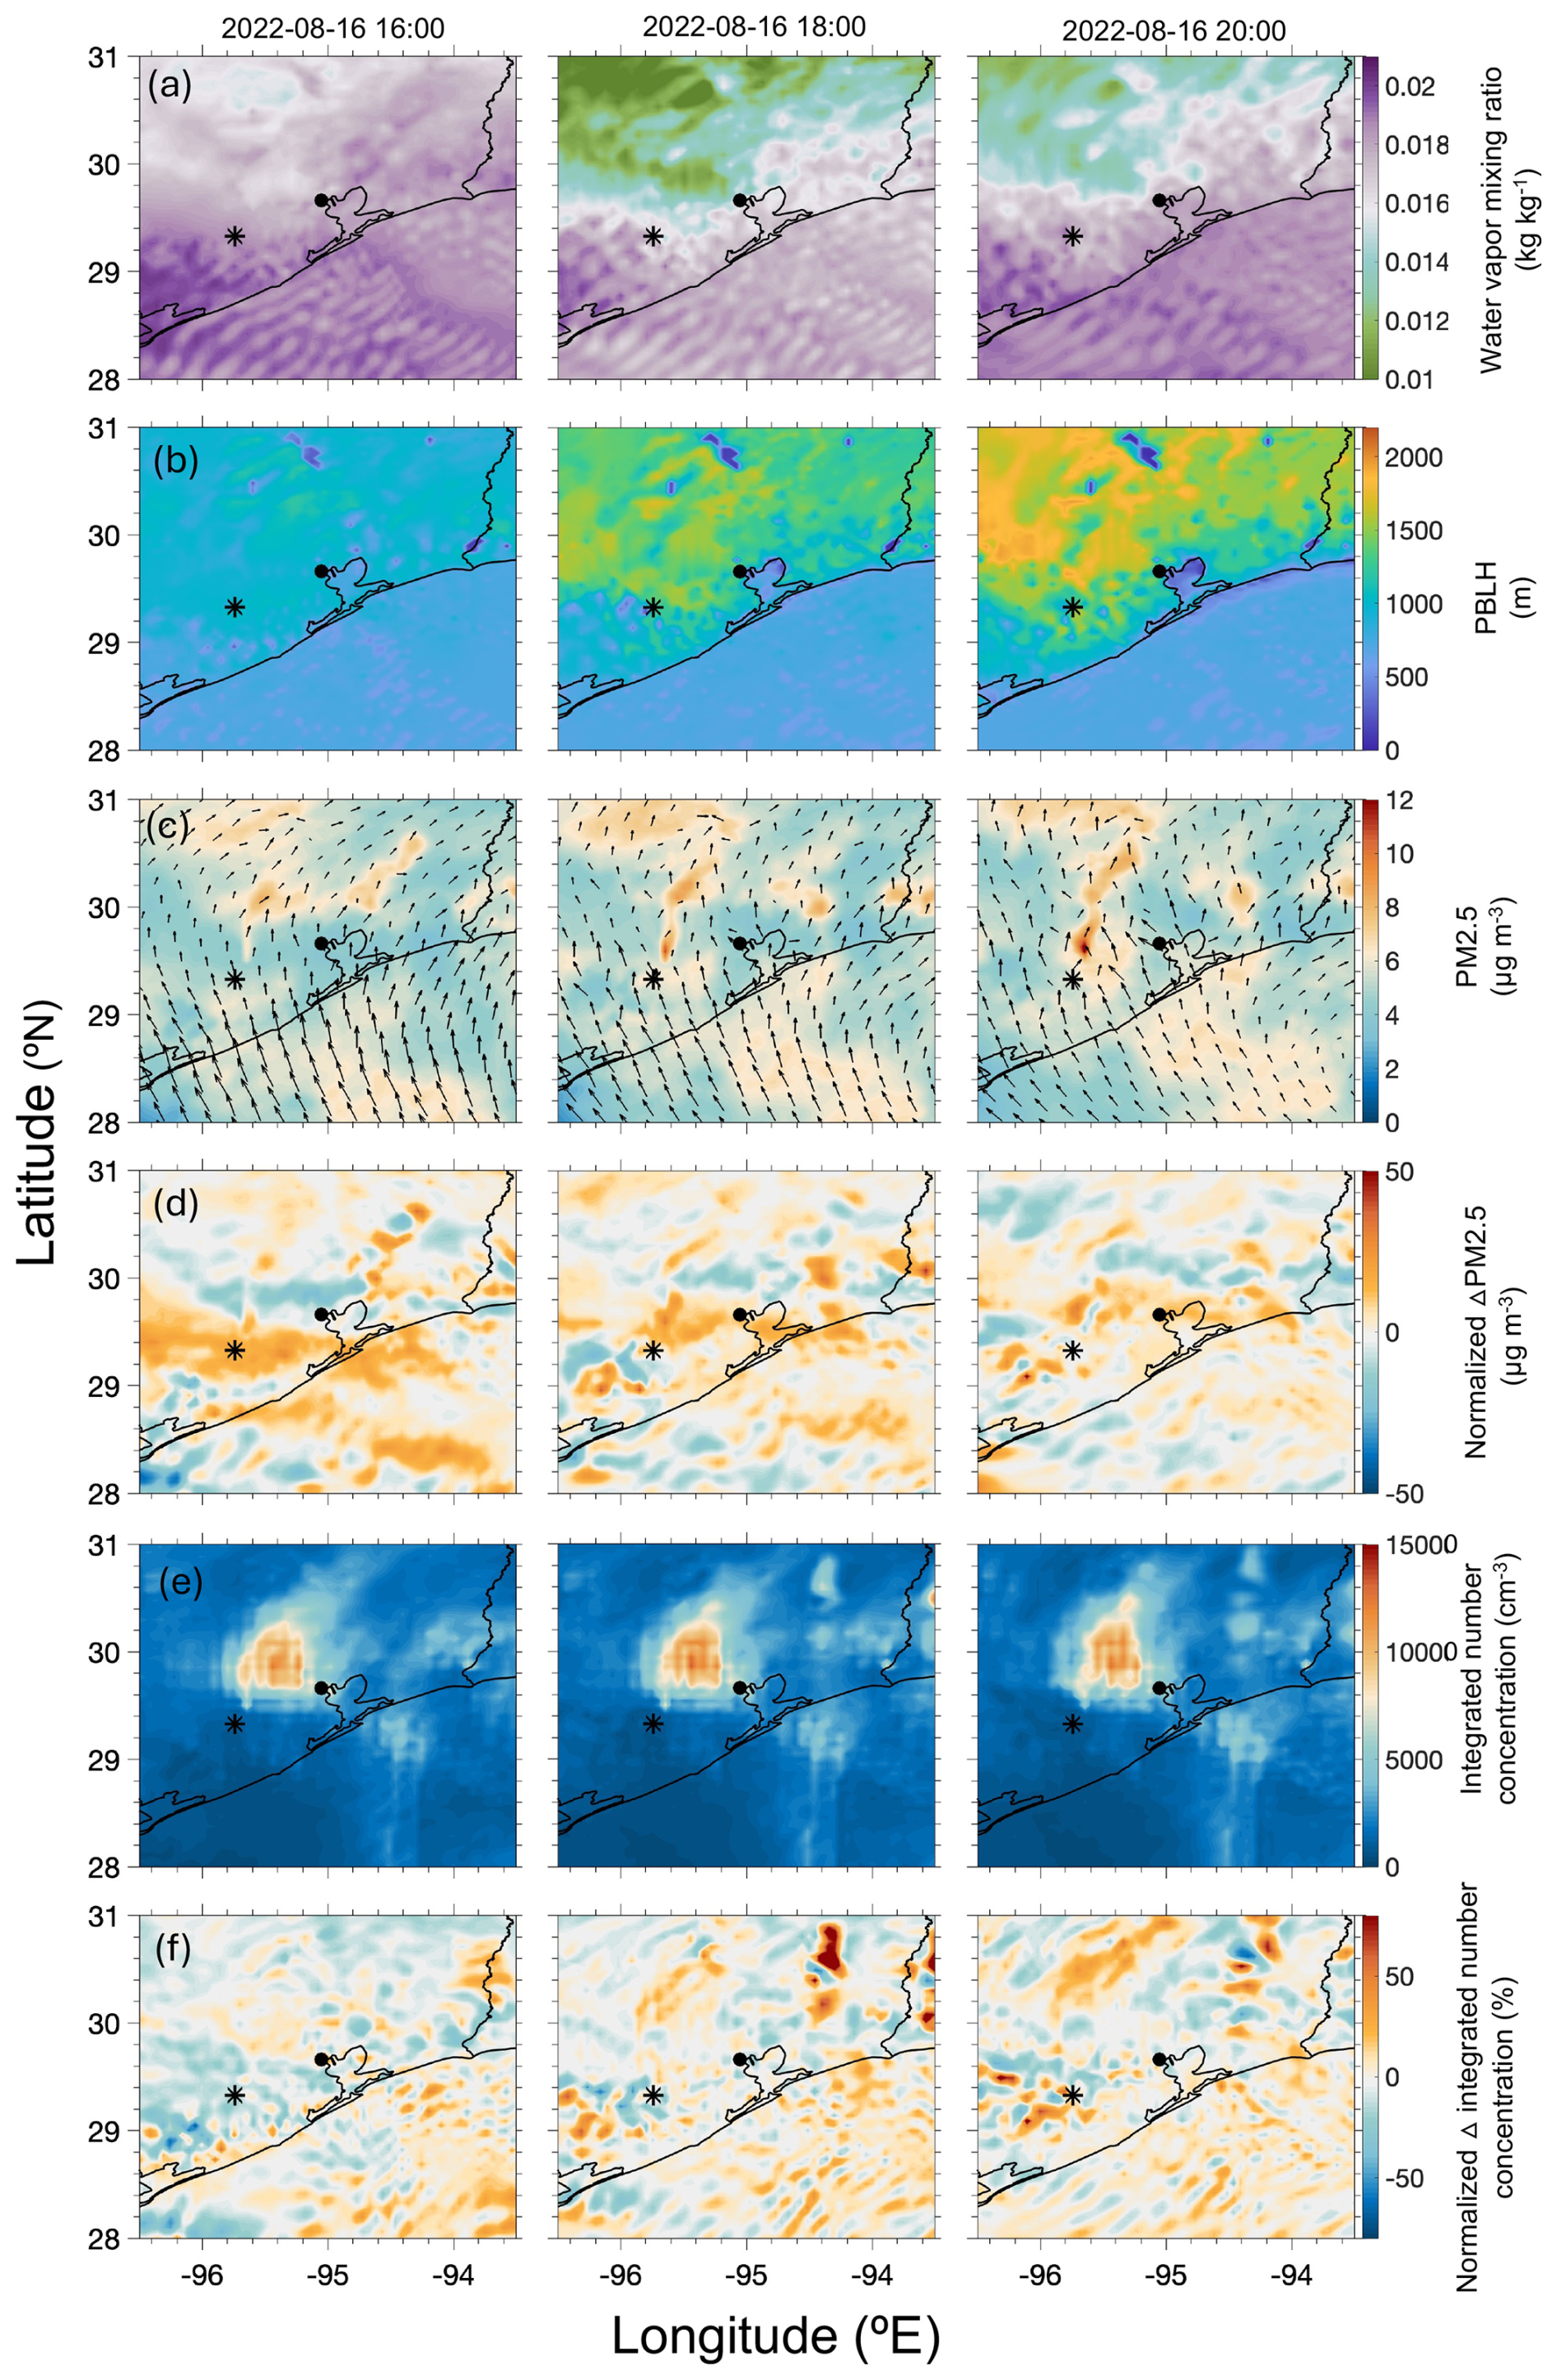
Figure 11Modeled surface distribution of (a) water vapor mixing ratio (w), (b) PBLH, (c) PM2.5, and wind vector (black arrows, at the surface), and (e) integrated aerosol number concentration (nucleation + accumulation mode) at three-time steps: 16:00, 18:00 and 20:00 UTC on 16 August. Panels (d) and (f) show the normalized changes, where Δ is the change from the previous time step. The filled-circle marker in the panels represent the M1 site, while the star represents the S3 site.
Notably, the 17 July event occurred in a different ambient aerosol environment than the 10 July event. MERRA-2 column dust mass concentrations (Fig. S9) indicate Saharan dust transport on this day, yielding elevated dust loading over the Gulf of Mexico and resulting in marine aerosol mass concentrations that exceeded those over land. The high concentrations are also observed to be more prominent to the southwest of the M1 site (Fig. 10c). Hence, as the SBF moves inland on 17 July, it transports this higher aerosol containing air mass, replacing the lower aerosol containing air over the site and causing an increased aerosol concentration at the M1 site. The onshore winds carry an air mass influenced by both local and long-range transport, originating from both land and sea. In contrast to the other two events, the 16 August event occurred under a transitional regime and likely influenced by the bay breeze. The aerosol environment was notably uniform over the wider regional air masses, thus SBF passage resulted in minimal changes to the aerosol distribution (Fig. 11c, d, f).
Overall, one implication from these simulations is that the effect of the inland-penetrating SBF on the aerosol environment appears highly dependent on the pre-existing aerosol condition over the location, as well as the air mass characteristics trailing the SBF. The wind anomaly associated with the Gulf breeze front can transport more (less) polluted, particle-laden air mass, leading to increased (decreased) aerosol concentration as it passes the site during the subsequent ∼ 5 h after the front passes. A study by Deng et al. (2025) using scanning radar data collected during TRACER reported similar findings during one of the SB events on 10 September 2022. They reported a reduced influence on the aerosol concentration immediately after the passing of the bay breeze front for the next few hours, due to the dominance of onshore flow consistent with the findings from this study (Fig. S2).
3.6 Sea breeze effects on the vertical distribution of aerosols
Figure 12 shows the modeled normalized PM2.5 at different elevations before and after the passage of the SBF. On 10 July, the cleaner marine air mass that follows the SBF led to a decrease in aerosol concentration below 1 km at the ARM sites. The model indicates surface convergence along the SBF (Fig. S10). The aerosol concentrations are redistributed horizontally and vertically. Two hours later, the SBF reaches the S3 site where its passage causes a similar change in the aerosol concentration. The varying extent of this air mass and its inland propagation redistributes the vertical PM2.5 profiles from urban to suburban regions as this SBF moves northwest from Houston. Similar to the changes in the aerosol mass concentrations, the changes in the vertical distributions of nu0 (Fig. 12b) and ac0 number concentration (Fig. 12c) are not homogeneous within these layers. The cleaner air mass following the SBF replaces the more polluted continental air, lowering aerosol number concentrations. The response is vertically inhomogeneous, reductions are most prominent around M1 and are strongest below ∼ 500 m. Within the 1.5 km, nu0 shows the largest negative anomalies (often > 80 %) immediately behind the SBF, consistent with marine air being relatively depleted in the smallest particles. A thin narrow yellow/orange area (∼ +70 % normalized changes) behind the front (within 1 to 1.5 km) reflects lifting, which can momentarily concentrate or mix in small particles. The ac0 exhibits a similar pattern but weaker signal. This reflects that accumulation-mode particles are less sensitive to the front, so the reductions are smaller and less uniform, with occasional localized decreases along the front. Overall, the inland-propagating SBF drives an exchange between cleaner marine and more polluted continental air masses, redistributing aerosols both horizontally and vertically.
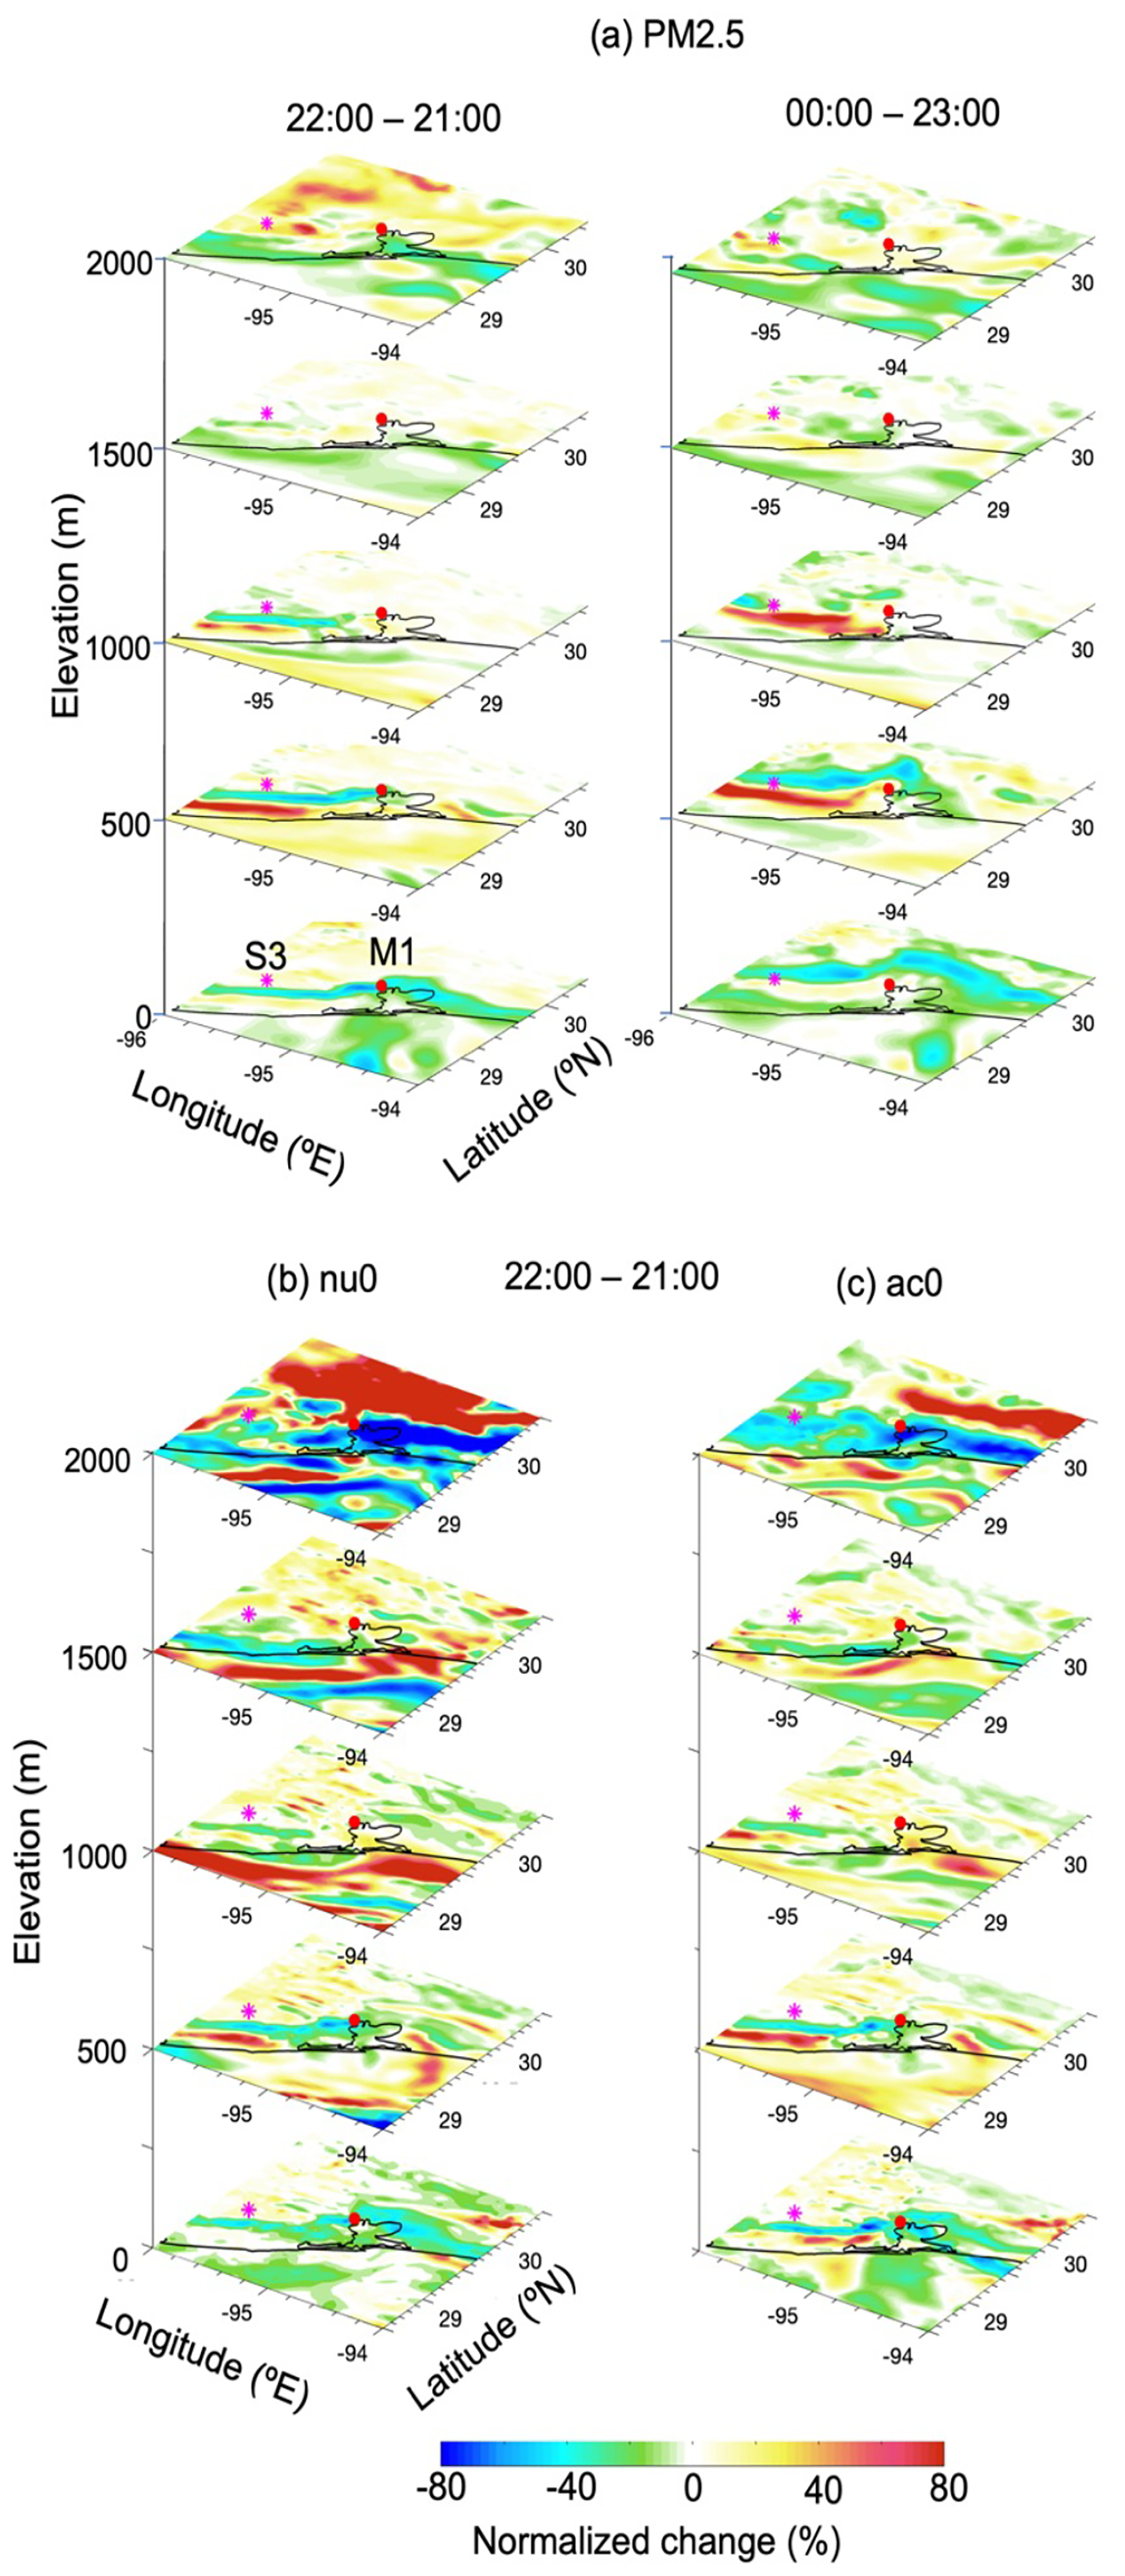
Figure 12First row: the spatial distribution of normalized PM2.5 at different elevations at timesteps (a) 21:00 and 22:00 UTC on 10 July, and 23:00 UTC on 10 July and 00:00 UTC on 11 July. Second row: the spatial distribution of normalized (b) nucleation mode (nu0) and (c) accumulation mode (ac0) aerosol number concentration at timesteps 21:00 and 22:00 UTC on 10 July.
These results complement those shown in SB simulations by Lu and Turco (1994), Verma et al. (2006), Igel et al. (2018), and Parajuli et al. (2022). Parajuli et al. (2022) observed that the SB pushes dust inland and upward along the mountain slopes, reaching heights of up to 1.5 km. During TRACER, the vertical influence of SAI extended up to ∼ 1.5 km (∼ PBLH). The region of SBC influence is shown to extend inland up to 50 km and vertically up to 2 km over a period of up to 5 h following the passage of the SBF. The model simulations supplement the observations by filling observational gaps and enabling the extrapolation of findings across a broader regional scale, an endeavor that would be challenging to achieve with limited in situ observational sites or standalone models.
3.7 Impacts of sea breeze aerosol interaction on cloud condensation nuclei
Figure 13 shows the time series of the normalized aerosol number concentration with Dp > 100 nm, N100 for the 10 July event. Due to the unavailability of measured CCN data at both M1 and S3, N100 serves as our proxy for the CCN (CCN proxy) concentration (Ahlm et al., 2013). Hence, the current analysis is limited to observational evidence of N100 variability. Similar to the changes in the overall aerosol number budget, the SBF passage and the air mass that follows induces simultaneous changes in the CCN budget. During this event, the CCN proxy concentration decreases by ∼ 35 % at the M1 site and ∼ 60 % at the S3 site, with these changes observed within an hour of the SBF passage.
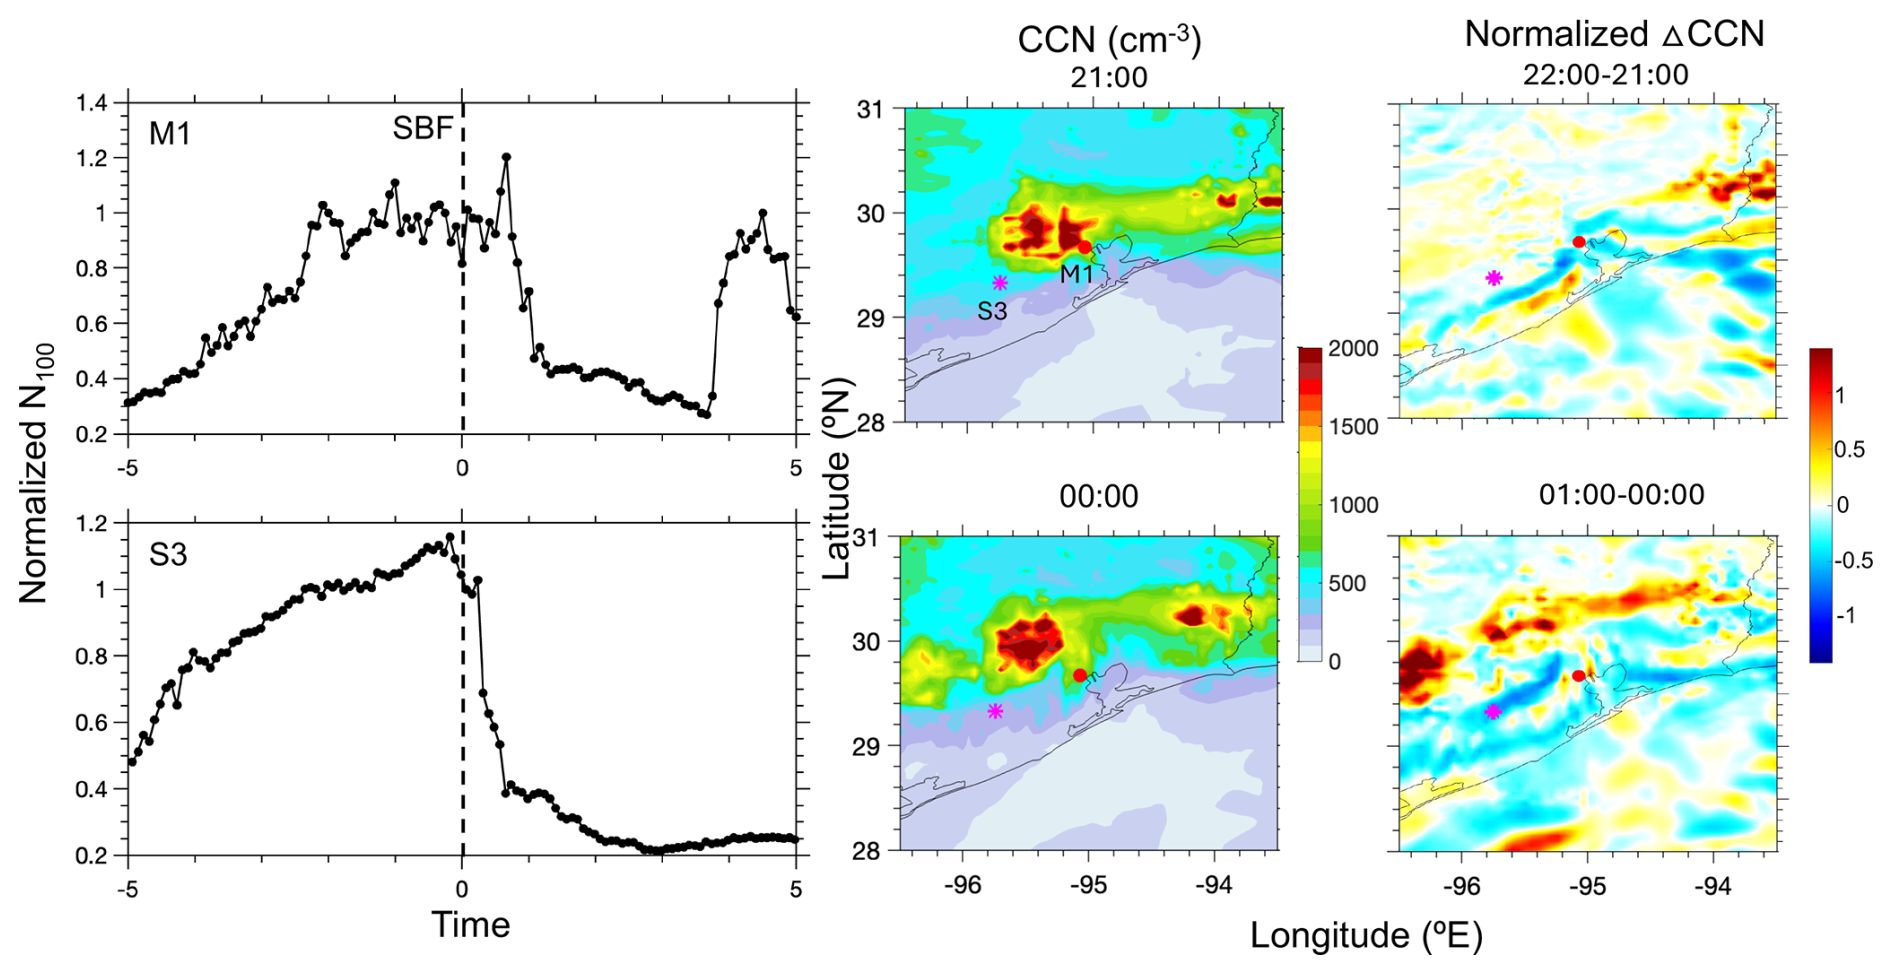
Figure 13Time series of the normalized measured N100 along the time of the SBF's passing through the M1 site (1st row) and the S3 site (2nd row) on 10 July 2022 (1st column). Spatial distribution of the modeled hourly averaged (2nd column) and normalized CCN (3rd column).
Simulations performed for this event also suggest similar changes in aerosol budget, indicating that the SBF brings in a cleaner air mass from directions consistent with a more marine environment. Model results suggest that the CCN concentration at the surface decreases by up to 60 %, consistent with the observations. In our supplemental Figs. S11. and S12, we include the temporal variation of the normalized N100 during all the other SB events during the TRACER IOP. The preexisting N100 is less frequently impacted by the SAI than previous examples we provided for SBF changes to the total number concentration, and these events show a decrease in N100 for ∼ 25 % of the SB events at both M1 and S3 site. This suggests that the influence of SAI is lesser over the marine influenced regional background aerosol larger than 100 nm in diameter.
Sea breezes influence multi-scale processes across the land–ocean–atmosphere interface within the region of influence of the SBC. The TRACER field campaign provided a unique opportunity to understand how aerosol and meteorological processes impact weather and climate in the urban and rural coastal environment of Houston, Texas. A total of 46 (M1) and 30 (S3) instances of SB passages were identified during the summertime TRACER IOP period. Summertime measurements from the ARM sites coupled with WRF-Chem model simulations (July and August 2022) help to quantify aerosol changes resulting from onshore transport of marine boundary layer air masses due to SBF passage and the associated atmospheric SBC impacts.
Understanding the spatial extent and duration of SAIs is crucial for assessing their environmental and meteorological impacts. For inland-penetrating SBFs, aerosol responses fall into one of the three types: reduction (clean marine air replacing more polluted continental air); enhancement (import of more polluted air), or neutral (similar air masses). The sign and magnitude of changes depend on proximity to the coast, the upwind air mass history prior to SBF arrival, and the antecedent airmass aerosol concentrations at each site.
TRACER measurements indicate that the urban M1 site, closer to both Galveston Bay and the Gulf of Mexico, experiences more frequent aerosol concentration changes (increase or decrease during 63 % of SB events) than the rural S3 site (increase or decrease during 40 % of SB days), which is primarily Gulf-breeze influenced and farther from urban/industrial sources. During IOP events, surface aerosol number changed by up to a factor of two. On average, SBF passages were associated with a decrease of ∼ 23 % at M1 and increase of ∼ 4 % at S3. SBF passages produce distinct aerosol responses depending on the type of SAI event. At M1, enhancement days (28 % of SB events) are associated with an average increase of aerosol concentration by ∼ 55 %, while reduction days (35 % of SB events) show an average decrease of ∼ 42 %. At S3, enhancement days (27 % of SB events) exhibit an average increase of ∼ 64 %, whereas reduction days (13 % of SB events) show a decrease of ∼ 45 %.
This study also provides support for how SAIs may interfere with aerosol microphysical processes, including NPF events, a key driver of the overall aerosol number budget. These changes occur with sharp meteorological shifts, including RH (+30 %) and wind speed (+4 m s−1) increases, and backing to southeasterly flow (Figs. 7 and 8). The relationship between wind and aerosol number concentrations showed that aerosol concentrations at the M1 site are higher when prevailing winds originate from the direction of the Houston urban core (northwest to north), compared to the winds coming from the sea (south) (Fig. S5). Recently, Rapp et al. (2024) emphasized using targeted mobile sampling that collecting measurements on both sides of SB boundaries are critical for disentangling aerosol from meteorological controls. These findings are complementary to the results in this study that boundary timing and air mass origin drive the different responses at M1 and S3.
WRF Chem simulations extend the site perspective regionally, indicating heterogeneous SAI footprints (Figs. 9, 10, 11, and 12). Across 18 simulated events, near surface PM2.5 tends to decrease by ∼ 15 % around the M1 site and increase by ∼ 3 % near the S3 site (Fig. S13). However, these responses vary with altitude (Fig. 12). The SBF may alter the vertical aerosol distribution in the boundary layer up to 2 km. Beyond thermodynamics, SB fronts also reshape convective environments (Wang et al., 2024). Thermodynamics and airmass across the maritime and continental sides of these fronts influence storm characteristics and evolution (Sharma et al., 2024).
With respect to cloud-relevant particles, both observations and simulations indicate that the surface CCN proxy concentrations decrease by up to 60 % following SBF passage (Fig. 13), although such changes are infrequent (∼ 25 % of the SB events at both M1 and S3 site), implying a weaker impact of SAI on marine influenced regional background accumulation mode. This aligns with Thompson et al. (2025), which showed that aerosol cloud-forming properties differ between polluted marine and continental air masses, with variability in size, hygroscopicity, and CCN efficiency across sites. Given the complex mix of marine, terrestrial, and urban sources, and the strong spatial heterogeneity revealed by both our analysis and prior TRACER studies, future studies should include direct CCN and INP measurements and size-resolved aerosol properties to better capture the role of SAI in aerosol–cloud interactions. It is important to remember that these effects are localized, occurring only during shorter timescales (∼ 5 h) associated with daily SBC cycles over these locations. But these SAI timings align with periods of peak solar radiation and elevated aerosol concentrations, potentially leading to significant impacts on the radiation budget over the coastal regions. During times in close proximity to SBF passage, changes in solar radiation and cloud formation may influence the aerosol formation and distribution, modify atmospheric chemical reactions, and affect cloud formation and properties, thereby impacting various atmospheric processes and interactions. Because many coastal cities have high aerosol loading with frequent SBCs, accounting for SAI when estimating direct aerosol radiative forcing is crucial. However, quantifying these changes is challenging, underscoring the need for detailed future studies across diverse coastal regions.
All ARM TRACER datasets are openly available to the user community and can be accessed via ARM Data Discovery at https://adc.arm.gov/discovery/#/results/s::TRACER (last access: 10 September 2025). The TCEQ data can be downloaded from https://www.tceq.texas.gov/agency/data (last access: 19 January 2026) and sfcmetradaq-tceq ARM PI product (https://doi.org/10.5439/2587278, ARM, 2022). The Weather Research and Forecasting Model with Chemistry model code is available from https://www2.mmm.ucar.edu/wrf/users/download/ (last access: 12 January 2026). WRF-Chem preprocessors are available on the website (https://www.acom.ucar.edu/wrf-chem, last access: 19 January 2026). The model output data is made available upon request. The primary tools to analyze the model output and generate figures are CDO (https://code.mpimet.mpg.de/projects/cdo/, last access: 19 January 2026), MATLAB (https://www.mathworks.com/products/, last access: 19 January 2026), and Jupyter Notebook platform (https://jupyter.org, last access: 17 January 2026).
The Supplement contains supplementary figures referred to in the main manuscript. The supplement related to this article is available online at https://doi.org/10.5194/acp-26-2853-2026-supplement.
TS and CK planned the study; TS conducted the analysis and wrote the manuscript; MH provided the aerosol data; MJ, MD, SG, MH, AS, DW, MZ and CK reviewed and edited the manuscript.
The contact author has declared that none of the authors has any competing interests.
Publisher’s note: Copernicus Publications remains neutral with regard to jurisdictional claims made in the text, published maps, institutional affiliations, or any other geographical representation in this paper. While Copernicus Publications makes every effort to include appropriate place names, the final responsibility lies with the authors. Views expressed in the text are those of the authors and do not necessarily reflect the views of the publisher.
We would like to acknowledge support from the Atmospheric System Research (ASR) program, the Atmospheric Radiation Measurement (ARM) user facility, and the ARM TRACER operation and science teams. This research was supported in part by resources provided by the National Energy Research Scientific Computing Center (NERSC), a DOE Office of Science User Facility under Contract No. DE-AC02-05CH11231, through NERSC award BER-ERCAP0026649. Additionally, the NE Linux Cluster (nlc) at Brookhaven National Laboratory was utilized for model simulations and output storage.
Contributions from Brookhaven National Laboratory coauthors were supported by the Atmospheric Radiation Measurement (ARM) facility and the SFA PASCCALS funded by the Atmospheric System Research (ASR) program of the Office of Biological and Environmental Research in the U.S. Department of Energy, Office of Science, through Contract No. DE-SC0012704. Contribution from M.C. Harvey was supported by Computational Modeling of Atmospheric Processes (CMAP), Research Development and Partnership Pilot (RDPP), Department of Energy, through the Contract No. DESC0023153 and Partnership for Fostering Graduate Training in Atmospheric Sciences at Texas Southern University through the Contract number DESC0024579.
This paper was edited by Markus Petters and reviewed by two anonymous referees.
Ackermann, I. J., Hass, H., Memmesheimer, M., Ebel, A., Binkowski, F. S., and Shankar, U.: Modal aerosol dynamics model for Europe: Development and first applications, Atmos. Environ., 32, 2981–2999, https://doi.org/10.1016/S1352-2310(98)00006-5, 1998.
Adaricheva, K., Bernhardt, J. E., Liu, W., and Schmidt, B.: Importance of overnight parameters to predict Sea Breeze on Long Island, arXiv [preprint], https://doi.org/10.48550/arXiv.2309.01803, 4 September 2023.
Ahlm, L., Julin, J., Fountoukis, C., Pandis, S. N., and Riipinen, I.: Particle number concentrations over Europe in 2030: the role of emissions and new particle formation, Atmos. Chem. Phys., 13, 10271–10283, https://doi.org/10.5194/acp-13-10271-2013, 2013.
Ahmadov, R., Gerbig, C., Kretschmer, R., Koerner, S., Neininger, B., Dolman, A. J., and Sarrat, C.: Mesoscale covariance of transport and CO2 fluxes: Evidence from observations and simulations using the WRF-VPRM coupled atmosphere-biosphere model, J. Geophys. Res.-Atmos., 112, https://doi.org/10.1029/2007JD008552, 2007.
Albrecht, B. A.: Aerosols, cloud microphysics, and fractional cloudiness, Science, 245, 1227–1230, 1989.
Aldhaif, A. M., Lopez, D. H., Dadashazar, H., and Sorooshian, A.: Sources, frequency, and chemical nature of dust events impacting the United States East Coast, Atmos. Environ., 231, https://doi.org/10.1016/j.atmosenv.2020.117456, 2020.
Ariya, P., Sun, J., Eltouny, N., Hudson, E. D., Hayes, C. T., and Kos, G.: Physical and chemical characterization of bioaerosols – Implications for nucleation processes, Int. Rev. Phys. Chem., 28, 1–32, https://doi.org/10.1080/01442350802597438, 2009.
Arrillaga, J. A., Jiménez, P., de Arellano, J. V.-G., Jiménez, M. A., Román-Cascón, C., Sastre, M., and Yagüe, C.: Analyzing the synoptic-, meso- and local-scale involved in sea breeze formation and frontal characteristics, J. Geophys. Res.-Atmos., 125, e2019JD031302, https://doi.org/10.1029/2019JD031302, 2020.
Atabakhsh, S., Poulain, L., Bigi, A., Coen, M. C., Pöhlker, M., and Herrmann, H.: Trends of PM1 aerosol chemical composition, carbonaceous aerosol, and source over the last 10 years at Melpitz (Germany), Atmos. Environ., 346, 121075, https://doi.org/10.1016/j.atmosenv.2025.121075, 2025.
Atmospheric Radiation Measurement (ARM): sfcmetradaq-tceq: cleaned 5-minute resolution air quality and meteorological data from nine TCEQ CAMS sites in Houston, Texas (Nov 2021–Oct 2022), ARM PI product, ARM [data set], https://doi.org/10.5439/2587278, 2022.
Augustin, P., Billet, S., Crumeyrolle, S., Deboudt, K., Dieudonné, E., Flament, P., Fourmentin, M., Guilbaud, S., Hanoune, B., Landkocz, Y., Méausoone, C., Roy, S., Schmitt, F. G., Sentchev, A., and Sokolov, A.: Impact of sea breeze dynamics on atmospheric pollutants and their toxicity in industrial and urban coastal environments, Remote Sensing, 12, 648, https://doi.org/10.3390/rs12040648, 2020.
Banta, R. M., Senff, C. J., Alvarez, R. J., Langford, A. O., Parrish, D. D., Trainer, M. K., Darby, L. S., Michael Hardesty, R., Lambeth, B., Andrew Neuman, J., Angevine, W. M., Nielsen-Gammon, J., Sandberg, S. P., and White, A. B.: Dependence of daily peak O3 concentrations near Houston, Texas on environmental factors: Wind speed, temperature, and boundary-layer depth, Atmos. Environ., 45, 162–173, https://doi.org/10.1016/j.atmosenv.2010.09.030, 2011.
Bao, S., Pietrafesa, L., Gayes, P., Noble, S., Viner, B., Qian, J. H., Werth, D., Mitchell, G., and Burdette, S.: Mapping the Spatial Footprint of Sea Breeze Winds in the Southeastern United States, J. Geophys. Res.-Atmos., 128, e2022JD037524, https://doi.org/10.1029/2022JD037524, 2023.
Barrett, T. E. and Sheesley, R. J.: Urban impacts on regional carbonaceous aerosols: Case study in central Texas, Journal of the Air and Waste Management Association, 64, 917–926, https://doi.org/10.1080/10962247.2014.904252, 2014.
Bauman, W. H.: Verify MesoNAM Performance. NASA Contractor Report CR-2010-216-287, Kennedy Space Center, FL, 31 pp., ENSCO, Inc., 1980 N. Atlantic Ave., Suite 830, Cocoa Beach, FL, 32931, http://science.ksc.nasa.gov/amu/final-reports/mesoNAMverify.pdf (last access: 2 Janaury 2026), 2010.
Berg, L. K., Shrivastava, M., Easter, R. C., Fast, J. D., Chapman, E. G., Liu, Y., and Ferrare, R. A.: A new WRF-Chem treatment for studying regional-scale impacts of cloud processes on aerosol and trace gases in parameterized cumuli, Geosci. Model Dev., 8, 409–429, https://doi.org/10.5194/gmd-8-409-2015, 2015.
Bond, T. C., Doherty, S. J., Fahey, D. W., Forster, P. M., Berntsen, T., Deangelo, B. J., Flanner, M. G., Ghan, S., Kärcher, B., Koch, D., Kinne, S., Kondo, Y., Quinn, P. K., Sarofim, M. C., Schultz, M. G., Schulz, M., Venkataraman, C., Zhang, H., Zhang, S., Bellouin, N., Guttikunda, S. K., Hopke, P. K., Jacobson, M. Z., Kaiser, J. W., Klimont, Z., Lohmann, U., Schwarz, J. P., Shindell, D., Storelvmo, T., Warren, S. G., and Zender, C. S.: Bounding the role of black carbon in the climate system: A scientificassessment, J. Geophys. Res.-Atmos., 118, 5380–5552, https://doi.org/10.1002/jgrd.50171, 2013.
Borge, R., Alexandrov, V., José del Vas, J., Lumbreras, J., and Rodríguez, E.: A comprehensive sensitivity analysis of the WRF model for air quality applications over the Iberian Peninsula, Atmos. Environ., 42, 8560–8574, https://doi.org/10.1016/j.atmosenv.2008.08.032, 2008.
Boyer, C. H., Keeler, J. M., and Rakoczy, B. C.: An Idealized Parameter Study of Destabilization and Convection Initiation in Coastal Regions. Part I: Calm or Offshore Synoptic-Scale Flow, J. Atmos. Sci., 82, 519–539, https://doi.org/10.1175/JAS-D-23-0180.1, 2025.
Boyouk, N., Léon, J. F., Delbarre, H., Augustin, P., and Fourmentin, M.: Impact of sea breeze on vertical structure of aerosol optical properties in Dunkerque, France, Atmos. Res., 101, 902–910, https://doi.org/10.1016/j.atmosres.2011.05.016, 2011.
Bozlaker, A., Prospero, J. M., Fraser, M. P., and Chellam, S.: Quantifying the contribution of long-range saharan dust transport on particulate matter concentrations in Houston, Texas, using detailed elemental analysis, Environ. Sci. Technol., 47, 10179–10187, https://doi.org/10.1021/es4015663, 2013.
Brown, S., Nicholls, R. J., Woodroffe, C. D., Hanson, S., Hinkel, J., Kebede, A. S., Neumann, B., and Vafeidis, A. T.: Sea-Level Rise Impacts and Responses: A Global Perspective, in: Coastal Hazards, edited by: Finkl, C. W., Dordrecht, Springer Netherlands, 117–149, https://doi.org/10.1007/978-94-007-5234-4_5, 2013.
Burkart, J., Gratzl, J., Seifried, T. M., Bieber, P., and Grothe, H.: Isolation of subpollen particles (SPPs) of birch: SPPs are potential carriers of ice nucleating macromolecules, Biogeosciences, 18, 5751–5765, https://doi.org/10.5194/bg-18-5751-2021, 2021.
Charlson, R. J., Schwartz, S. E., Hales, J. M., Cess, R. D., Coakley Jr., J. A., Hansen, J. E., and Hofmann, D. J.: Climate forcing by anthropogenic aerosols, Science, 255, 423–430, 1992.
Chen, F. and Dudhia, J.: Coupling an advanced land surface-hydrology model with the Penn State-NCAR MM5 modeling system. Part I: Model implementation and sensitivity, Mon. Weather Rev., 129, 569–585, https://doi.org/10.1175/1520-0493(2001)129<0569:CAALSH>2.0.CO;2, 2001.
Chou, M., Suarez, M. J., Ho, C., Yan, M. M., and Lee, K.: Parameterizations for cloud overlapping and shortwave single-scattering properties for use in general circulation and cloud ensemble models, J. Climate, 11, 202–214, https://doi.org/10.1175/1520-0442(1998)011<0202:PFCOAS>2.0.CO;2, 1998.
Clappier, A., Martilli, A., Grossi, P., Thunis, P., Pasi, F., Krueger, B. C., Calpini, B., Graziani, G., and van den Bergh, H.: Effect of Sea Breeze on Air Pollution in the Greater Athens Area. Part I: Numerical Simulations and Field Observations, J. Appl. Meteorol., 39, 546–562, https://doi.org/10.1175/1520-0450(2000)039<0546:EOSBOA>2.0.CO;2, 1999.
Comin, A. N., Miglietta, M. M., Rizza, U., Acevedo, O. C., and Degrazia, G. A.: Investigation of sea-breeze convergence in Salento Peninsula (southeastern Italy), Atmos. Res., 160, 68–79, https://doi.org/10.1016/j.atmosres.2015.03.010, 2015.
Crippa, M., Canonaco, F., Lanz, V. A., Äijälä, M., Allan, J. D., Carbone, S., Capes, G., Ceburnis, D., Dall'Osto, M., Day, D. A., DeCarlo, P. F., Ehn, M., Eriksson, A., Freney, E., Hildebrandt Ruiz, L., Hillamo, R., Jimenez, J. L., Junninen, H., Kiendler-Scharr, A., Kortelainen, A.-M., Kulmala, M., Laaksonen, A., Mensah, A. A., Mohr, C., Nemitz, E., O'Dowd, C., Ovadnevaite, J., Pandis, S. N., Petäjä, T., Poulain, L., Saarikoski, S., Sellegri, K., Swietlicki, E., Tiitta, P., Worsnop, D. R., Baltensperger, U., and Prévôt, A. S. H.: Organic aerosol components derived from 25 AMS data sets across Europe using a consistent ME-2 based source apportionment approach, Atmos. Chem. Phys., 14, 6159–6176, https://doi.org/10.5194/acp-14-6159-2014, 2014.
Crossett, K., Culliton, T., Wiley, P., and Goodspeed, T.: Population trends along the coastal United States, 1980–2008, National Oceanic and Atmospheric Administration, Coastal Trend s Report Series, https://repository.library.noaa.gov/view/noaa/1765 (last access: 3 February 2026), 2004.
Dal Maso, M., Kulmala, M., Lehtinen, K. E. J., Mäkelä, J. M., Aalto, P., and O'Dowd, C. D.: Condensation and coagulation sinks and formation of nucleation mode particles in coastal and boreal forest boundary layers, J. Geophys, Res.-Atmos., 107, https://doi.org/10.1029/2001JD001053, 2002.
Das, S., Prospero, J. M., and Chellam, S.: Quantifying international and interstate contributions to primary ambient PM2.5 and PM10 in a complex metropolitan atmosphere, Atmos. Environ., 292, 119415, https://doi.org/10.1016/j.atmosenv.2022.119415, 2023.
Deng, M., Jensen, M. P., Giangrande, S. E., Johnson, K., Wang, D., Chu, Y., Subba, T., Peña, J. C., Walter, P., Flynn, J., and Griggs, T.: A Closed Bay-Breeze Circulation and Its Lifecycle from TRACER with a New Orienteering Tape Recorder Diagram, A closed bay-breeze circulation and its lifecycle from TRACER with a new orienteering tape recorder diagram, J. Geophys. Res.-Atmos., 130, e2024JD043187, https://doi.org/10.1029/2024JD043187, 2025.
di Bernardino, A., Iannarelli, A. M., Casadio, S., Mevi, G., Campanelli, M., Casasanta, G., Cede, A., Tiefengraber, M., Siani, A. M., Spinei, E., & Cacciani, M.: On the effect of sea breeze regime on aerosols and gases properties in the urban area of Rome, Italy, Urban Climate, 37. https://doi.org/10.1016/j.uclim.2021.100842, 2021.
Di Maria, V. ,Rahman, M., Collins, P., Dondi, G., and Sangiorgi, C.: Urban Heat Island Effect: Thermal Response from Different Types of Exposed Paved Surfaces, International Journal of Pavement Research and Technology, 6, 414–422, https://doi.org/10.6135/ijprt.org.tw/2013.6(4).414, 2013.
Dueker, M. E., O'Mullan, G. D., Martínez, J. M., Juhl, A. R., and Weathers, K. C.: Onshore wind speed modulates microbial aerosols along an urban waterfront, Atmosphere, 8, 215, https://doi.org/10.3390/atmos8110215, 2017.
Emmons, L. K., Walters, S., Hess, P. G., Lamarque, J.-F., Pfister, G. G., Fillmore, D., Granier, C., Guenther, A., Kinnison, D., Laepple, T., Orlando, J., Tie, X., Tyndall, G., Wiedinmyer, C., Baughcum, S. L., and Kloster, S.: Description and evaluation of the Model for Ozone and Related chemical Tracers, version 4 (MOZART-4), Geosci. Model Dev., 3, 43–67, https://doi.org/10.5194/gmd-3-43-2010, 2010.
Fang, C., Li, X., Li, J., Tian, J., and Wang, J.: Research on the impact of land use and land cover changes on local meteorological conditions and surface ozone in the north China plain from 2001 to 2020, Scientific Reports, 15, 2001, https://doi.org/10.1038/s41598-025-85940-0, 2025.
Gangoiti, G., Millán, M. M., Salvador, R., and Mantilla, E.: Long-range transport and re-circulation of pollutants in the western Mediterranean during the project Regional Cycles of Air Pollution in the West-Central Mediterranean Area, Atmos. Environ., 35, 6267–6276, https://doi.org/10.1016/S1352-2310(01)00440-X, 2001.
Gelaro, R., McCarty, W., Suárez, M. J., Todling, R., Molod, A., Takacs, L., Randles, C. A., Darmenov, A., Bosilovich, M. G., Reichle, R., Wargan, K., Coy, L., Cullather, R., Draper, C., Akella, S., Buchard, V., Conaty, A., da Silva, A. M., Gu, W., Kim, G.-K., Koster, R., Lucchesi, R., Merkova, D., Nielsen, J. E., Partyka, G., Pawson, S., Putman, W., Rienecker, M., Schubert, S. D., Sienkiewicz, M., and Zhao, B: The Modern-Era Retrospective Analysis for Research and Applications, version 2 (MERRA-2), J. Climate, 30, 5419–5454, https://doi.org/10.1175/JCLI-D-16-0758.1, 2017.
Georgiou, G. K., Christoudias, T., Proestos, Y., Kushta, J., Pikridas, M., Sciare, J., Savvides, C., and Lelieveld, J.: Evaluation of WRF-Chem model (v3.9.1.1) real-time air quality forecasts over the Eastern Mediterranean, Geosci. Model Dev., 15, 4129–4146, https://doi.org/10.5194/gmd-15-4129-2022, 2022.
Gettelman, A., Mills, M. J., Kinnison,D. E., Garcia, R. R., Smith, A. K., Marsh, D. R., Tilmes, S., Vitt, F., Bardeen, C. G., McInerny, J., Liu, H.-L., Solomon, S. C., Polvani, L. M., Emmons, L. K., Lamarque, J.-F., Richter, J. H., Glanville, A. S., Bacmeister, J. T., Phillips, A. S., Neale, R. B., Simpson, I. R., DuVivier, A. K., Hodzic, A., and Randel, W. J.: The wholeatmosphere community climate modelversion 6 (WACCM6), J. Geophys. Res.-Atmos., 124, 12380–12403, https://doi.org/10.1029/2019JD030943, 2019.
Gordon, H., Kirkby, J., Baltensperger, U., Bianchi, F., Breitenlechner, M., Curtius, J., Dias, A., Dommen, J., Donahue, N. M., Dunne, E. M., Duplissy, J., Ehrhart, S., Flagan, R. C., Frege, C., Fuchs, C., Hansel, A., Hoyle, C. R., Kulmala, M., Kürten, A., Lehtipalo, K., Makhmutov, V., Molteni, U., Rissanen, M. P., Stozkhov, Y., Tröstl, J., Tsagkogeorgas, G., Wagner, R., Williamson, C., Wimmer, D., Winkler, P. M., Yan, C., and Carslaw, K. S.: Causes and importance of new particle formation in the present-day and preindustrial atmospheres, J. Geophys. Res.-Atmos., 122, 8739–8760, https://doi.org/10.1002/2017JD026844, 2017.
Yu, F. and Luo, G.: Simulation of particle size distribution with a global aerosol model: contribution of nucleation to aerosol and CCN number concentrations, Atmos. Chem. Phys., 9, 7691–7710, https://doi.org/10.5194/acp-9-7691-2009, 2009.
Grell, G. A. and Devenyi, D.: A generalized approach to parameterizing convection combining ensemble and data assimilation techniques, Geophys. Res. Lett., 29, 38-1–38-4, https://doi.org/10.1029/2002GL015311, 2002.
Grell, G. A., Peckham, S. E., Schmitz, R., McKeen, S. A., Frost, G., Skamarock, W. C., and Eder, B.: Fully coupled “online” chemistry within the WRF model, Atmos. Environ., 39, 6957–6975, https://doi.org/10.1016/j.atmosenv.2005.04.027, 2005.
Guenther, A. B., Jiang, X., Heald, C. L., Sakulyanontvittaya, T., Duhl, T., Emmons, L. K., and Wang, X.: The Model of Emissions of Gases and Aerosols from Nature version 2.1 (MEGAN2.1): an extended and updated framework for modeling biogenic emissions, Geosci. Model Dev., 5, 1471–1492, https://doi.org/10.5194/gmd-5-1471-2012, 2012.
Hanft, W. and Houston, A. L.: An Observational and Modeling Study of Mesoscale Air Masses with High Theta-E, Mon. Wea. Rev., 146, 2503–2524, https://doi.org/10.1175/MWR-D-17-0389.1, 2018.
Hernández-Ceballos, M. A., Sorribas, M., San Miguel, E. G., Cinelli, G., Adame, J. A., and Bolívar, J. P.: Impact of sea-land breezes on 210Pb in southern Iberian Peninsula – Feasibility study on using submicron-sized aerosol particles to analyze 210Pb hourly patterns, Atmos. Pollut. Res., 7, 1–8, https://doi.org/10.1016/j.apr.2015.06.011, 2016.
Hong, S. Y., Noh, Y., and Dudhia, J.: A new vertical diffusion package with an explicit treatment of entrainment processes, Mon. Weather Rev., 134, 2318–2341, https://doi.org/10.1175/MWR3199.1, 2006.
Hu, L.: A Global Assessment of Coastal Marine Heatwaves and Their Relation With Coastal Urban Thermal Changes, Geophys. Res. Lett., 48, e2021GL093260, https://doi.org/10.1029/2021GL093260, 2021.
Huang, X.-F., He, L.-Y., Hu, M., Canagaratna, M. R., Sun, Y., Zhang, Q., Zhu, T., Xue, L., Zeng, L.-W., Liu, X.-G., Zhang, Y.-H., Jayne, J. T., Ng, N. L., and Worsnop, D. R.: Highly time-resolved chemical characterization of atmospheric submicron particles during 2008 Beijing Olympic Games using an Aerodyne High-Resolution Aerosol Mass Spectrometer, Atmos. Chem. Phys., 10, 8933–8945, https://doi.org/10.5194/acp-10-8933-2010, 2010.
Hudson, B.: Coastal Land Loss and the Mitigation-Adaptation Dilemma: Between Scylla and Charybdis Repository Citation Coastal Land Loss and the Mitigation-Adaptation Dilemma: Between Scylla and Charybdis, Louisiana Law Review, Vol. 73, https://digitalcommons.law.lsu.edu/lalrev/vol73/iss1/3 (last access: 3 February 2026), 2012.
Igel, A. L., van den Heever, S. C., and Johnson, J. S.: Meteorological and Land Surface Properties Impacting Sea Breeze Extent and Aerosol Distribution in a Dry Environment, J. Geophys. Res.-Atmos., 123, 22–37, https://doi.org/10.1002/2017JD027339, 2018.
IPCC (Intergovernmental Panel on Climate Change): The Physical Science Basis. Contribution of Working Group I to the Sixth Assessment Report of the Intergovernmental Panel on Climate Change, edited by: Masson-Delmotte, V., Zhai, P., Pirani, A., Connors, S. L., Péan, C., Berger, S., Caud, N., Chen, Y., Goldfarb, L., Gomis, M. I., Huang, M., Leitzell, K., Lonnoy, E., Matthews, J. B. R., Maycock, T. K., Waterfield, T., Yelekçi, O., Yu, R., and Zhou, B., Cambridge University Press, https://doi.org/10.1017/9781009157896, 2021.
Iwai, H., Murayama, Y., Ishii, S., Mizutani, K., Ohno, Y., and Hashiguchi, T.: Strong Updraft at a Sea-Breeze Front and Associated Vertical Transport of Near-Surface Dense Aerosol Observed by Doppler Lidar and Ceilometer, Bound.-Lay. Meteorol., 141, 117–142, https://doi.org/10.1007/s10546-011-9635-z, 2011.
Janjic, Z. I.: Nonsingular implementation of the Mellor–Yamada level 2.5 scheme in the NCEP Meso model,Camp Springs, MD, National Centers for Environmental Prediction, Prince George's County, 437, 1-61, 2002.
Jensen, M. P., Flynn, J. H., Judd, L. M., Kollias, P., Kuang, C., Mcfarquhar, G., Nadkarni, R., Powers, H., and Sullivan, J.: A Succession of Cloud, Precipitation, Aerosol, and Air Quality Field Experiments in the Coastal Urban Environment, B. Am. Meteorol. Soc., 103, 103–105, https://doi.org/10.1175/BAMS-D-21-0104.1, 2022.
Jensen, M. P., Flynn, J. H., Gonzalez-Cruz, J. E., et al.: Studying Aerosol, Clouds, and Air Quality in the Coastal Urban Environment of Southeastern Texas, B. Am. Meteorol. Soc., https://doi.org/10.1175/bams-d-23-0331.1, 2025.
Karnae, S. and John, K.: Source apportionment of PM2.5 measured in South Texas near U.S.A. – Mexico border, Atmos. Pollut. Res., 10, 1663–1676, https://doi.org/10.1016/j.apr.2019.06.007, 2019.
Kasparoglu, S., Meskhidze, N., and Petters, M. D.: Aerosol mixing state, new particle formation, and cloud droplet number concentration in an urban environment, Sci. Total Environ., 951, 175307, https://doi.org/10.1016/j.scitotenv.2024.175307, 2024.
Kerminen, V. M., Chen, X., Vakkari, V., Petäjä, T., Kulmala, M., and Bianchi, F.: Atmospheric new particle formation and growth: review of field observations, Environ. Res. Lett., 13, 103003, https://doi.org/10.1088/1748-9326/aadf3c, 2018.
Kgabi, N. A. and Mokgwetsi, T.: Dilution and dispersion of inhalable particulate matter, WIT Transactions on Ecology and the Environment, 127, 229–238, https://doi.org/10.2495/RAV090201, 2009.
Kleinman, L. I., Daum, P. H., Imre, D. G., Lee, Y.-N., Nunnermacker, L. J., Springston, S. R., Weinstein-Lloyd, J., and Rudolph, J.: Ozone production rate and hydrocarbon reactivity in 5 urban areas: A cause of high ozone concentration in Houston, Geophys. Res. Lett., 29, 1467, https://doi.org/10.1029/2001GL014569, 2002.
Kuang, C., McMurry, P. H., and McCormick, A. V.: Determination of cloud condensation nuclei production from measured new particle formation events, Geophys. Res. Lett., 36, L09822, https://doi.org/10.1029/2009GL037584, 2009.
Kuang, C., Chen, M., Zhao, J., Smith, J., McMurry, P. H., and Wang, J.: Size and time-resolved growth rate measurements of 1 to 5 nm freshly formed atmospheric nuclei, Atmos. Chem. Phys., 12, 3573–3589, https://doi.org/10.5194/acp-12-3573-2012, 2012.
Kulmala, M., Laakso, L., Lehtinen, K. E. J., Riipinen, I., Dal Maso, M., Anttila, T., Kerminen, V.-M., Hõrrak, U., Vana, M., and Tammet, H.: Initial steps of aerosol growth, Atmos. Chem. Phys., 4, 2553–2560, https://doi.org/10.5194/acp-4-2553-2004, 2004.
Levy, M. E., Zhang, R., Khalizov, A. F., Zheng, J., Collins, D. R., Glen, C. R., Wang, Y., Yu, X. Y., Luke, W., Jayne, J. T., and Olaguer, E.: Measurements of submicron aerosols in Houston, Texas during the 2009 SHARP field campaign, J. Geophys. Res.-Atmos., 118, 10518–10534, https://doi.org/10.1002/jgrd.50785, 2013.
Li, W., Wang, Y., Bernier, C., and Estes, M.: Identification of Sea Breeze Recirculation and Its Effects on Ozone in Houston, TX, During DISCOVER-AQ 2013, J. Geophys. Res.-Atmos., 125, e2020JD033165, https://doi.org/10.1029/2020JD033165, 2020.
Linden, P. F. and Simpson, J. E.: Gravity-driven flows in a turbulent fluid, J. Fluid Mech., 172, 481–497, https://doi.org/10.1017/S0022112086001829, 1986.
Liu, H., Zhang, B., Moore, R. H., Ziemba, L. D., Ferrare, R. A., Choi, H., Sorooshian, A., Painemal, D., Wang, H., Shook, M. A., Scarino, A. J., Hair, J. W., Crosbie, E. C., Fenn, M. A., Shingler, T. J., Hostetler, C. A., Chen, G., Kleb, M. M., Luo, G., Yu, F., Vaughan, M. A., Hu, Y., Diskin, G. S., Nowak, J. B., DiGangi, J. P., Choi, Y., Keller, C. A., and Johnson, M. S.: Tropospheric aerosols over the western North Atlantic Ocean during the winter and summer deployments of ACTIVATE 2020: life cycle, transport, and distribution, Atmos. Chem. Phys., 25, 2087–2121, https://doi.org/10.5194/acp-25-2087-2025, 2025.
Lu, R. and Turco, R. P.: Air pollutant transport in a coastal environment. Part I: Two-dimensional simulations of sea-breeze and mountain effects, J. Atmos. Sci., 51, 2285–2308, https://doi.org/10.1175/1520-0469(1994)051<2285:APTIAC>2.0.CO;2, 1994.
Ma, S. and Tong, D. Q.: Neighborhood Emission Mapping Operation (NEMO): A 1-km anthropogenic emission dataset in the United States, Scientific Data, 9, 680, https://doi.org/10.1038/s41597-022-01790-9, 2022.
Mack, S. M., Madl, A. K., and Pinkerton, K. E.: Respiratory health effects of exposure to ambient particulate matter and bioaerosols, Compr. Physiol., 10, 1–20. https://doi.org/10.1002/cphy.c180040, 2020.
Mao, F., Zang, L., Wang, Z., Pan, Z., Zhu, B., and Gong, W.: Dominant synoptic patterns during wintertime and their impacts on aerosol pollution in Central China, Atmos. Res., 232, 104701, https://doi.org/10.1016/j.atmosres.2019.104701, 2020.
Masselink, G. and Pattiaratchi, C. B.: The effect of sea breeze on beach morphology, surf zone hydrodynamics and sediment resuspension, Mar. Geol., 146, 115–135, 1998.
Mather, J. H. and Voyles, J. W.: The Arm Climate Research Facility: A Review of Structure and Capabilities, B. Am. Meteorol. Soc., 94, 377–392, https://doi.org/10.1175/BAMS-D-11-00218.1, 2013.
Miller, S. T. K., Keim, B. D., Talbot, R. W., and Mao, H.: Sea breeze: Structure, forecasting, and impacts, Rev. Geophys., 41, 1011, https://doi.org/10.1029/2003RG000124, 2003.
Mikkonen, S., Romakkaniemi, S., Smith, J. N., Korhonen, H., Petäjä, T., Plass-Duelmer, C., Boy, M., McMurry, P. H., Lehtinen, K. E. J., Joutsensaari, J., Hamed, A., Mauldin III, R. L., Birmili, W., Spindler, G., Arnold, F., Kulmala, M., and Laaksonen, A.: A statistical proxy for sulphuric acid concentration, Atmos. Chem. Phys., 11, 11319–11334, https://doi.org/10.5194/acp-11-11319-2011, 2011.
Minguillón, M. C., Ripoll, A., Pérez, N., Prévôt, A. S. H., Canonaco, F., Querol, X., and Alastuey, A.: Chemical characterization of submicron regional background aerosols in the western Mediterranean using an Aerosol Chemical Speciation Monitor, Atmos. Chem. Phys., 15, 6379–6391, https://doi.org/10.5194/acp-15-6379-2015, 2015.
Mlawer, E. J., Taubman, S. J., Brown, P. D., Iacono, M., and Clough, S. A.: Radiative transfer for inhomogeneous atmospheres: RRTM, a validated correlated-k model for the longwave, J. Geophys. Res., 102, 16663–16682, https://doi.org/10.1029/97JD00237, 1997.
Monin, A. S. and Obukhov, A. M.: Basic laws of turbulent mixing in the surface layer of the atmosphere, Contributions of the Geophysical Institute of the Slovak Academy of Science, USSR, 151, 163–187, 1954.
Moorthy, K. K., Murthy, B. V. K., and Nair, P. R.: Sea-breeze front effects on boundary layer aerosols at a tropical station, J. Appl. Meteorol., 32, 1196–1205, 1993.
Moorthy, K. K., Pillai, P. S., and Suresh Babu, S.: Influence of changes in the prevailing synoptic conditions on the response of aerosol characteristics to land-and sea-breeze circulations at a coastal station, Bound.-Lay. Meteorol., 108, 145–161, https://doi.org/10.1023/A:1023073929115, 2003.
Morrison, H., Curry, J. A., and Khvorostyanov, V. I.: A new double-moment microphysics parameterization for application in cloud and climate models. Part I: Description, J. Atmos. Sci., 62, 1665–1677, https://doi.org/10.1175/jas3446.1, 2005.
Papanastasiou, D. K., Melas, D., Bartzanas, T., and Kittas, C.: Temperature, comfort and pollution levels during heat waves and the role of sea breeze, Int. J. Biometeorol., 54, 307–317, https://doi.org/10.1007/s00484-009-0281-9, 2010.
Parajuli, S. P., Stenchikov, G. L., Ukhov, A., Mostamandi, S., Kucera, P. A., Axisa, D., Gustafson Jr., W. I., and Zhu, Y.: Effect of dust on rainfall over the Red Sea coast based on WRF-Chem model simulations, Atmos. Chem. Phys., 22, 8659–8682, https://doi.org/10.5194/acp-22-8659-2022, 2022.
Parajuli, S. P., Stenchikov, G. L., Ukhov, A., Shevchenko, I., Dubovik, O., and Lopatin, A.: Aerosol vertical distribution and interactions with land/sea breezes over the eastern coast of the Red Sea from lidar data and high-resolution WRF-Chem simulations, Atmos. Chem. Phys., 20, 16089–16116, https://doi.org/10.5194/acp-20-16089-2020, 2020.
Park, J. M. and van den Heever, S. C.: Weakening of tropical sea breeze convective systems through interactions of aerosol, radiation, and soil moisture, Atmos. Chem. Phys., 22, 10527–10549, https://doi.org/10.5194/acp-22-10527-2022, 2022.
Park, J. M., van den Heever, S. C., Igel, A. L., Grant, L. D., Johnson, J. S., Saleeby, S. M., Miller, S. D., and Reid, J. S.: Environmental Controls on Tropical Sea Breeze Convection and Resulting Aerosol Redistribution, J. Geophys. Res.-Atmos., 125, e2019JD031699, https://doi.org/10.1029/2019JD031699, 2020.
Parrish, D. D., Allen, D. T., Bates, T. S., Estes, M., Fehsenfeld, F. C., Feingold, G., Ferrare, R., Hardesty, R. M., Meagher, J. F., Nielsen-Gammon, J. W., Pierce, R. B., Ryerson, T. B., Seinfeld, J. H., and Williams, E. J.: Overview of the second texas air quality study (TexAQS II) and the Gulf of Mexico atmospheric composition and climate study (GoMACCS), J. Geophys. Res.Atmos., 114, D00F13, https://doi.org/10.1029/2009JD011842, 2009.
Partanen, A. I., Landry, J. S., and Matthews, H. D.: Climate and health implications of future aerosol emission scenarios, Environ. Res. Lett., 13, 024028, https://doi.org/10.1088/1748-9326/aaa511, 2018.
Perry, K. D., Cahill, T. A., Eldred, R. A., Dutcher, D. D., and Gill, T. E.: Long-range transport of North African dust to the eastern United States. J. Geophys. Res.-Atmos., 102, 11225–11238, https://doi.org/10.1029/97jd00260, 1997.
Pinto, J. P., Dibb, J., Lee, B. H., Rappenglück, B., Wood, E. C., Levy, M., Zhang, R. Y., Lefer, B., Ren, X. R., Stutz, J., Tsai, C., Ackermann, L., Golovko, J., Herndon, S. C., Oakes, M., Meng, Q. Y., Munger, J. W., Zahniser, M., and Zheng, J.: Intercomparison of field measurements of nitrous acid (HONO) during the SHARP campaign, J. Geophys. Res., 119, 5583–5601, https://doi.org/10.1002/2013JD020287, 2014.
Plant, R. S. and Keith, G. J.: Occurrence of Kelvin-Helmholtz billows in sea-breeze circulations, Bound.-Lay. Meteorol., 122, 1–15, https://doi.org/10.1007/s10546-006-9089-x, 2007.
Qi, L., Vogel, A. L., Esmaeilirad, S., Cao, L., Zheng, J., Jaffrezo, J.-L., Fermo, P., Kasper-Giebl, A., Daellenbach, K. R., Chen, M., Ge, X., Baltensperger, U., Prévôt, A. S. H., and Slowik, J. G.: A 1-year characterization of organic aerosol composition and sources using an extractive electrospray ionization time-of-flight mass spectrometer (EESI-TOF), Atmos. Chem. Phys., 20, 7875–7893, https://doi.org/10.5194/acp-20-7875-2020, 2020.
Ramanathan, V., Crutzen, P. J., Kiehl, J. T., and Rosenfeld, D.: Aerosols, Climate, and the Hydrological Cycle, Science, 294, 5549, https://doi.org/10.1126/science.1064034, 2001.
Rao, P. A. and Fuelberg, H. E.: An Investigation of Convection behind the Cape Canaveral Sea-Breeze Front, Mon. Weather Rev., 128, 3437–3458, https://doi.org/10.1175/1520-0493(2000)128<3437:AIOCBT>2.0.CO;2, 2000.
Rapp, A. D., Brooks, S. D., Nowotarski, C. J., Sharma, M., Thompson, S. A., Chen, B., Matthews, B. H., Etten-Bohm, M., Nielsen, E. R., and Li, R.: TAMU TRACER: Targeted mobile measurements to isolate the impacts of aerosols and meteorology on deep convection, B. Am. Meteorol. Soc., 105, E1685–E1702, https://doi.org/10.1175/BAMS-D-23-0218.1, 2024.
Rodier, Q., Masson, V., Couvreux, F., and Paci, A.: Evaluation of a buoyancy and shear based mixing length for a turbulence scheme, Frontiers in Earth Science, 5, 65, https://doi.org/10.3389/feart.2017.00065, 2017.
Rosenfeld, D., Lohmann, U., Raga, G. B., O'Dowd, C. D., Kulmala, M., Fuzzi, S., Reissell, A., and Andreae, M. O.: Flood or drought: How do aerosols affect precipitation?, Science, 321, 1309–1313, 2008.
Ryerson, T. B., Trainer, M., Angevine, W. M., Brock, C. A., Dissly, R. W., Fehsenfeld, F. C., Frost, G. J., Goldan, P. D., Holloway, J. S., Hübler, G., Jakoubek, R. O., Kuster, W. C., Neuman, J. A., Nicks, D. K., Parrish, D. D., Roberts, J. M., Sueper, D. T., Atlas, E. L., Donnelly, S. G., Flocke, F., Fried, A., Potter, W. T., Schauffler, S., Stroud, V., Weinheimer, A. J., Wert, B. P., Wiedinmyer, C., Alvarez, R. J., Banta, R. M.,Darby, L. S., and Senff, C. J..: Effect of petrochemical industrial emissions of reactive alkenes and NOx on tropospheric ozone formation in Houston, Texas, J. Geophys. Res.-Atmos., 108, 4249, https://doi.org/10.1029/2002jd003070, 2003.
Schell, B., Ackerman, I. J., Hass, H., Binkowski, F. S., and Ebel, A.: Modelling the formation of secondary organic aerosol within a comprehensive air quality model system, J. Geophys. Res., 106, 28275–28293, https://doi.org/10.1029/2001JD000384, 2001.
Seinfeld, J. H. and Pandis, S. N.: Atmospheric Chemistry and Physics: From Air Pollution to Climate Change, 2nd edn., Wiley, Hoboken, NJ, USA, ISBN 978-0-471-72018-8, 2006.
Sharma, M., Rapp, A. D., Nowotarski, C. J., and Brooks, S. D.: Observed Variability in Convective Cell Characteristics and Near-Storm Environments across the Sea- and Bay-Breeze Fronts in Southeast Texas, Mon. Weather Rev., 152, 2419–2441, https://doi.org/10.1175/MWR-D-23-0243.1, 2024.
Shrestha, S., Zhou, S., Mehra, M., Guagenti, M., Yoon, S., Alvarez, S. L., Guo, F., Chao, C.-Y., Flynn III, J. H., Wang, Y., Griffin, R. J., Usenko, S., and Sheesley, R. J.: Evaluation of aerosol- and gas-phase tracers for identification of transported biomass burning emissions in an industrially influenced location in Texas, USA, Atmos. Chem. Phys., 23, 10845–10867, https://doi.org/10.5194/acp-23-10845-2023, 2023.
Shrivastava, M., Zhang, J., Zaveri, R. A., Zhao, B., Pierce, J. R., O'Donnell, S. E., Fast, J. D., Gaudet, B., Shilling, J. E., Zelenyuk, A., Murphy, B. N., Pye, H. O. T., Zhang, Q., Trousdell, J., and Chen, Q.: Anthropogenic extremely low volatility organics (ELVOCs) govern the growth of molecular clusters over the Southern Great Plains during the springtime, J. Geophys. Res.-Atmos., 129, e2024JD041212, https://doi.org/10.1029/2024JD041212, 2024.
Simpson, J. E.: Sea Breeze and Local Wind, Cambridge Univ. Press, New York, 234 pp., ISBN-0-521-45211-2, 1994.
Singh, A. and Kuang, C.: Scanning Mobility Particle Sizer (SMPS) Instrument Handbook, U.S. Department of Energy, Atmospheric Radiation Measurement user facility, Richland, Washington, DOE/SC-ARM-TR-147, https://doi.org/10.2172/1245993, 2024.
Skamarock, W. C., Klemp, J. B., Dudhia, J., Gill, D. O., Barker, D., Wang, W., and Powers, J. G.: A description of the Advanced Research WRF version 3. NCAR Tech. Note NCAR/TN-475+STR, 113 pp., https://doi.org/10.5065/D68S4MVH, 2008.
Song, S. K., Choi, Y. N., Choi, Y., Flynn, J., and Sadeghi, B.: Characteristics of aerosol chemical components and their impacts on direct radiative forcing at urban and suburban locations in Southeast Texas, Atmos. Environ., 246, https://doi.org/10.1016/j.atmosenv.2020.118151, 2021.
Soni, M., Verma, S., Mishra, M. K., Mall, R. K., and Payra, S.: Estimation of particulate matter pollution using WRF-Chem during dust storm event over India, Urban Climate, 44, https://doi.org/10.1016/j.uclim.2022.101202, 2022.
Stockwell, W. R., Middleton, P., Chang, J. S., and Tang, X.: The second generation regional acid deposition model chemical mechanism for regional air quality modeling, J. Geophys. Res., 95, 16343–16367, https://doi.org/10.1029/JD095iD10p16343, 1990.
Subba, T., Zhang, Y., and Steiner, A. L.: Simulating the transport and rupture of pollen in the atmosphere, J. Adv. Model. Earth Sy., 15, e2022MS003329, https://doi.org/10.1029/2022MS003329, 2023.
Subramanian, A., Nagarajan, A. M., Vinod, S., Chakraborty, S., Sivagami, K., Theodore, T., Sathyanarayanan, S. S., Tamizhdurai, P., and Mangesh, V. L.: Long-term impacts of climate change on coastal and transitional eco-systems in India: an overview of its current status, future projections, solutions, and policies, RSC Advances, 13, 12204–12228, https://doi.org/10.1039/d2ra07448f, 2023.
Talbot, C., Augustin, P., Leroy, C., Willart, V., Delbarre, H., and Khomenko, G.: Impact of a sea breeze on the boundary-layer dynamics and the atmospheric stratification in a coastal area of the North Sea, Bound.-Lay. Meteorol., 125, 133–154, 2007.
Thompson, S. A., Chen, B., Matthews, B. H., Li, R., Nowotarski, C. J., Rapp, A. D., and Brooks, S. D.: CharacterizingGreater Houston's aerosol by air massduring TRACER, J. Geophys. Res.-Atmos., 130, e2025JD043353, https://doi.org/10.1029/2025JD043353, 2025.
Tuccella, P., Curci, G., Visconti, G., Bessagnet, B., Menut, L., and Park, R. J.: Modeling of gas and aerosol with WRF/Chem over Europe: Evaluation and sensitivity study, J. Geophys. Res.-Atmos., 117, https://doi.org/10.1029/2011JD016302, 2012.
Twomey, S.: Pollution and the planetary albedo, Atmos. Environ., 8, 1251–1256, 1974.
Uin, J., Aiken, A. C., Dubey, M. K., Kuang, C., Pekour, M., Salwen, C., Sedlacek, A. J., Senum, G., Smith, S., Wang, J., Watson, T. B., and Springston, S. R.: Atmospheric radiation measurement (ARM) aerosol observing systems (AOS) for surface-based in situ atmospheric aerosol and trace gas measurements, J. Atmos. Ocean. Tech., 36, 2429–2447, https://doi.org/10.1175/JTECH-D-19-0077.1, 2019.
Verma, S., Boucher, O., Venkataraman, C., Reddy, M. S., Müller, D., Chazette, P., and Crouzille, B.: Aerosol lofting from sea breeze during the Indian Ocean Experiment, J. Geophys. Res., 111, 07208, https://doi.org/10.1029/2005JD005953, 2006.
Viner, B., Noble, S., Qian, J. H., Werth, D., Gayes, P., Pietrafesa, L., and Bao, S.: Frequency and characteristics of inland advecting sea breezes in the Southeast United States, Atmosphere, 12, https://doi.org/10.3390/atmos12080950, 2021.
Wang, B., Geddes, J. A., Adams, T. J., Lind, E. S., McDonald, B. C., He, J., Harkins, C., Li, D., and Pfister, G. G.: Implications of Sea Breezes on Air Quality Monitoring in a Coastal Urban Environment: Evidence From High Resolution Modeling of NO2 and O3, J. Geophys. Res.-Atmos., 128, https://doi.org/10.1029/2022jd037860, 2023.
Wang, D., Jensen, M. P., Taylor, D., Kowalski, G., Hogan, M., Wittemann, B. M., Rakotoarivony, A., Giangrande, S. E., and Park, J. M.: Linking Synoptic Patterns to Cloud Properties and Local Circulations Over Southeastern Texas, J. Geophys. Res.-Atmos., 127, https://doi.org/10.1029/2021JD035920, 2022.
Wang, D., Melvin, E. C., Smith, N., Jensen, M. P., Gupta, S., Abdullah-Smoot, A., Pszeniczny, N., and Hahn, T.: TRACER Perspectives on Gulf-Breeze and Bay-Breeze Circulations and Coastal Convection, Mon. Weather Rev., 152, 2207–2228, https://doi.org/10.1175/MWR-D-23-0292.1, 2024.
Wang, K., Zhang, Y., and Yahya, K.: Decadal application of WRF/Chem over the continental U.S.: Simulation design, sensitivity simulations, and climatological model evaluation, Atmos. Environ., 253, 118331, https://doi.org/10.1016/j.atmosenv.2021.118331, 2021.
Wang, S. C., Wang, Y., Estes, M., Lei, R., Talbot, R., Zhu, L., and Hou, P.: Transport of Central American Fire Emissions to the U.S. Gulf Coast: Climatological Pathways and Impacts on Ozone and PM2.5, J. Geophys. Res.-Atmos., 123, 8344–8361, https://doi.org/10.1029/2018JD028684, 2018.
Watson, T. B.: Aerosol Chemical Speciation Monitor (ACSM) Instrument Handbook, DOE/SC-ARM-TR-196, https://doi.org/10.2172/1375336, 2017.
Wert, B. P., Trainer, M., Fried, A., Ryerson, T. B., Henry, B., Potter, W., Angevine, W. M., Atlas, E., Donnelly, S. G., Fehsenfeld, F. C., Frost, G. J., Goldan, P. D., Hansel, A., Holloway, J. S., Hubler, G., Kuster, W. C., Nicks, D. K., Neuman, J. A., Parrish, D. D., Schauffler, S., Stutz, J., Sueper, D. T., Wiedinmyer, C., and Wisthaler, A.: Signatures of terminal alkene oxidation in airbone formaldehyde measurements during TexAQS 2000, J. Geophys. Res.-Atmos., 108, 4104, https://doi.org/10.1029/2002JD002502, 2003.
Westenbarger, D. A. and Morris, G. A.: Identifying biomass burning impacts on air quality in Southeast Texas 26–29 August 2011 using satellites, models and surface data, Atmos. Chem. Phys. Discuss. [preprint], https://doi.org/10.5194/acp-2017-1234, 2018.
Yoon, S., Ortiz, S. M., Clark, A. E., Barrett, T. E., Usenko, S., Duvall, R. M., Ruiz, L. H., Bean, J. K., Faxon, C. B., Flynn, J. H., Lefer, B. L., Leong, Y. J., Griffin, R. J., and Sheesley, R. J.: Apportioned primary and secondary organic aerosol during pollution events of DISCOVER-AQ Houston, Atmos. Environ., 244, 117954, https://doi.org/10.1016/j.atmosenv.2020.117954, 2021.