the Creative Commons Attribution 4.0 License.
the Creative Commons Attribution 4.0 License.
 | 24 Feb 2026
Gas-particle partitioning of pesticides in the atmosphere of the North China Plain
Liping Guo
Shuping Shi
Martin Brüggemann
Mingyu Zhao
Hongyu Mu
Daniel M. Figueiredo
Junxue Wu
Pesticide residues are ubiquitous in the atmosphere in the North China Plain (NCP), with concentrations largely determined by application patterns and physicochemical parameters such as persistence and volatility. However, knowledge of gas-particle partitioning of pesticides remains limited, hindering a comprehensive understanding of their abundance, transport, and health risks. Here, we aim to elucidate the underlying mechanism of gas-particle partitioning for pesticides. In this study, 14 pairs of air and particulate matter samples were collected simultaneously in Quzhou County, the NCP. A total of 19 pesticides were observed in both gas and particulate-phases. Average pesticide concentrations in particulate phase (2025.76±1048.83 pg m−3) were significantly higher than in gas phase (143.38±146.31 pg m−3), accounting for 93.4 % of the total atmospheric pesticide mass. Tebuconazole (662.49±448.52 pg m−3), pyraclostrobin (212.01±119.70 pg m−3), and carbendazim (158.68±86.54 pg m−3) exhibited the highest concentrations in the particulate phase, whereas pyrimethanil (93.00±79.18 pg m−3), pymetrozine (22.96±21.50 pg m−3), and imidacloprid (5.78±2.64 pg m−3) were predominant in the gas phase. A positive correlation between temperature and particulate-phase pesticide concentrations was found, as indicated by rising of logKp values which is likely attributable to an interplay of pesticide physicochemical properties, ambient relative humidity, particle phase state and pesticide use patterns. Gas-particle partitioning model simulations showed absorption as the main mechanism of gas-particle partitioning, indicating atmospheric pesticides are absorbed into the interior organic film of particulate matter.
- Article
(2639 KB) - Full-text XML
-
Supplement
(1007 KB) - BibTeX
- EndNote


Pesticides have been widely applied worldwide against pests in agriculture since dichlorodiphenyltrichloroethane (DDT) was discovered to have insecticidal properties in 1939 (Turusov et al., 2002). Pesticides play an important role in the development of agriculture by increasing the yield of agricultural products and improving their quality (Aktar et al., 2009). Pesticide usage in China reached 229 026 metric tons in 2023, accounting for around 6.14 % of global pesticide use (FAO, 2025). However, the pesticide utilization rate (the proportion of the pesticide deposited on the target per unit area to the total amount of pesticide used) for the three major cereal crops (i.e., wheat, maize and rice) in China was only about 41 % (Ministry of Agriculture and Rural Affairs of the People's Republic of China, 2021) meaning that more than half of the pesticides were not effectively absorbed by the target crops or pests and was instead lost to the environment (e.g., water, soil and atmosphere) (Tudi et al., 2022). While the fate of pesticides in soil and water has been studied extensively over the last decades, their behavior, distribution, and degradation in the atmosphere have only recently gained increasing interest (Brüggemann et al., 2024). There are mainly three ways for pesticides to enter the atmosphere: drift, volatilization, and wind erosion. In detail this means that a portion of applied pesticides reaches the atmosphere directly during application (e.g. spray drift and vapor drift) (Van den Berg et al., 1999). Later, after application, soil particles that have adsorbed pesticides may serve as a reservoir and release residues into the atmosphere through resuspension of soil particles, also referred to as wind erosion (Glotfelty et al., 1989). Furthermore, pesticides may volatilize from plants, soil, surface water, and the surfaces of old industrial sites under the influence of diffusive air-surface mass exchange (Cabrerizo et al., 2011). Atmospheric pesticides have been monitored globally. Yera and Vasconcellos analyzed concentrations of pesticides such as atrazine in the atmosphere of the São Paulo region, Brazil, ranging from 17–210 pg m−3 (Barredo Yera and Vasconcellos, 2021). In Costa Rican banana plantations, Solano Díaz et al. (2026) reported that the highest concentrations of the detected pesticides were for pyrimethanil (34.3 ng m−3), followed by fenpropidin (9.0 ng m−3) and terbufos (8.4 ng m−3). Tian et al. (2021) conducted observational analysis and quantification of organochlorine pesticides in the atmosphere across nine cities in the Pearl River Delta region of China, finding that concentrations of 16 organochlorine pesticides in summer (0.33–1431 pg m−3) were higher than 0.26–893 pg m−3 in winter. In a study on the North China Plain (NCP), ten organochlorine pesticides with concentrations ranging from 11.67 to 865.60 pg m−3 were observed in atmospheric PM2.5 in a rural area of Baoding City, Hebei Province (Sun et al., 2020). Another long-term monitoring study identified chlorpyrifos, carbendazim, and atrazine as the pesticides with the highest detection rates (≥87 %) in the NCP, with annual concentrations ranging from 1.71 to 16.05 pg m−3 (Zhao et al., 2023).
Upon entering the air, gas-particle partitioning occurs between the gas phase and particulate phase depending on the physicochemical properties of the pesticides (e.g., vapor pressure, octanol-air partition coefficient, Koa), the concentrations of total suspended particulate matter (TSP) and meteorological parameters (ambient temperature and relative humidity). Among these factors, vapor pressure (VP) is widely acknowledged as the main factor determining the effective volatilization rates. Pesticides with VP (at 20 °C) higher than Pa are predominantly present in the gas phase, while those with VP below Pa can be seen as completely present in the particulate phase (Yusà et al., 2009). The conventional Junge-Pankow model attributes gas-particle partitioning to surface adsorption, whereas the absorption model assumes that chemicals dissolve into particles coated by organic films (Harner and Bidleman, 1998). Since most pesticides are semi-volatile compounds with moderate vapor pressure, they are distributed in both the gas phase and particulate phase (Bedos et al., 2002; Wang et al., 2024). Pesticides in the gas phase can be directly absorbed into the lungs and participate in the blood circulation, potentially causing adverse effects on the cardiovascular system and almost all organs (Ngo et al., 2010). The pesticides in fine particulate matter are able to penetrate deeply into the respiratory system, causing a spectrum of health hazards (Woodrow et al., 2019). These pesticides have the potential to affect various systems, such as the respiratory, circulatory, immune, and endocrine systems, and may even contribute to carcinogenesis (Kaur et al., 2019). A previous study demonstrated that the half-lives in particulate phase of difenoconazole, tetraconazole, fipronil and 8 other pesticides were longer than the estimated half-lives in the gas phase allowing them to travel longer distances (Socorro et al., 2016). Because of the different behavior and effects of gas-phase and particulate-phase pesticides on human health and the environment, it is of great significance to study the gas-particle partitioning of atmospheric pesticides for further analysis of their health and ecotoxicological effects (Brüggemann et al., 2024).
In recent years, studies on the gas-particle partitioning of pesticides in the atmosphere mainly focused on traditional pesticides, such as organochlorine pesticides (Qiao et al., 2019). Sanli et al. studied the partitioning of organochlorine pesticides in gas phase and particulate phase at a semi-rural site in Bursa, Turkey, suggesting that the maximum annual mean gas-phase organochlorine pesticides concentration was β-hexachlorocyclohexane (β-HCH) with 176 pg m−3 while the maximum concentration in the particulate phase was β-Endosulfan at 67 pg m−3 (Sanlı and Tasdemir, 2020). However, due to their long lifetime in the environment, most of these pesticides are now prohibited in most countries. In contrast, modern substances exhibit significantly shorter degradation times in the environment. Still, data on gas-particle partitioning of such current-use pesticides are rarely available. Wang et al. (2021) measured the atmospheric concentrations of 36 current-use pesticides in gas phase and particulate phase samples in the Great Lakes basin and analyzed their gas-particle partitioning, suggesting that chemicals in particulate phase like metolachlor were negatively correlated with relative humidity. Nevertheless, there is limited evidence on the mechanism of pesticides gas-particle partitioning, which hinders our understanding of the atmospheric fate, transport and health risks of pesticides. Therefore, it is necessary to further research and understand the gas-particle partitioning of pesticides in the atmosphere.
Quzhou County is a typical agricultural county in the NCP, located in the northeastern part of Handan City, Hebei Province (geographical coordinates: 36°35′43′′–36°57′56′′ N, 114°50′22′′–115°13′27′′ E) (Yu et al., 2021). The total crop planting area in Hebei Province was around 8 million ha with the pesticide usage of approximately 50 000 t in 2023 (Hebei Provincial Bureau of Statistics, 2024). The pesticide utilization rate in Hebei Province is approximately 30 %, which is lower than 50 %–60 % observed in developed countries (Skevas et al., 2014). Given its representative agricultural setting in the NCP, Quzhou County serves as an ideal location for investigating the gas–particle partitioning of atmospheric pesticides in the NCP, thereby contributing to a more comprehensive understanding of pesticide distribution across the NCP (Feng et al., 2022). This study attempts to (1) analyze the concentrations of atmospheric pesticides in both gas and particulate phases; (2) assess the effect of meteorological factors on pesticide concentrations in the atmosphere, and (3) investigate gas-particle partitioning mechanisms using three different partitioning prediction models.
2.1 Air sampling
A high-volume air sampler (Sibata Scientific Technology Ltd, 080130-1203) fitted with a polyurethane foam plug (PUF, 90 mm in diameter ×50 mm in thickness) and a quartz fiber filter (QFF, 203 mm × 254 mm, pore size <0.3 µm) was used to capture pesticides in the gas phase and particulate phase (i.e. TSP), respectively. Air is first directed through the QFF for the collection of TSP, and subsequently through the PUF sampler for the collection of gaseous pesticides. Air samples were collected with a sampling period of 7 d (168 h) at a flow rate of 150 L min−1 from 17 February to 20 May in 2023 at the Quzhou Experiment Station (36°78′01′′ N, 114°94′51′′ E, 40 m above sea level) in Quzhou County, the NCP. Detailed sampling information is provided in Table S1 in the Supplement. In total, 14 gas phase samples and 14 particulate phase samples were collected. All samples were kept at −20 °C until analysis. Meteorological data (Table S2), including temperature, atmospheric pressure, precipitation, relative humidity, and wind speed, along with particulate matter (PM10 and PM2.5) concentrations, were obtained from the Air Quality Monitoring Platform of Handan City (http://111.62.17.169:8083/index.html#/map/HomeTianMap, last access: 9 September 2025) and the Quzhou Experimental Station. The mass of TSP was measured by gravimetry.
2.2 Sample treatment and instrumental analysis
The PUFs and QFFs were extracted with ultrasound-assisted extraction for 1 h with a 100 mL mixture of hexane and dichloromethane (1:1, v−v). The extracts (80 mL) were collected in flat-bottomed flasks and then concentrated to dryness using a rotary evaporator. Next, 1 mL acetonitrile was added to each flat-bottomed flask and transferred to the centrifuge tube after sonication, with this process repeated twice. After concentration, the extracts were subsequently purified on C18 SPE cartridges and the columns were eluted with 5 mL of acetonitrile. All fractions were rotary evaporated to dryness and adjusted to a volume of 800 µL with acetonitrile. Finally, they were vortexed using a vortex oscillator and filtered with syringe filters and transferred to vials for detection.
Target analytes in this study included 17 fungicides, 4 herbicides, and 17 insecticides for a total of 38 compounds purchased from Alta Scientific Co., Ltd (Tianjin, China) (Table S3). The selection of these 38 pesticides is based on their high detection frequency in both gas and particulate phases, as reported in previous studies conducted in the North China Plain by Zhao et al. (2023) and Mu et al. (2022). All solvents and chemicals used in this study were of high-performance liquid chromatography (HPLC) grade or higher. A Waters ACQUITY TQD ultra-high performance liquid chromatography system coupled with a triple-quadrupole mass spectrometer (UHPLC-MS/MS) was used to analyze the pesticides. The chromatographic and mass spectrometric conditions were consistent with Zhao et al. (2023). The UHPLC-MS/MS equipped with an ACQUITY BEH C18 column (1.7 µm, 100×2.1 mm i.d.). The mobile phase is increased from 5 % acetonitrile (A) and 95 % ultra-pure water with 0.1 % formic acid (B) at 0 min to 95 % acetonitrile over 6 min, then decreased to 5 % A over 0.5 min and held for 0.5 min. The flow rate was 0.2 mL min−1 and 2 µL of individual sample was injected. The column temperature was set at 40 °C. The mass spectrometer was operated in multiple reaction monitoring (MRM) mode. The calculation method for pesticide mass concentration in ambient air is provided in the Supplement (Sect. S1).
2.3 Quality assurance and quality control
To evaluate the accuracy and reliability of the data, laboratory blanks were analyzed following the same procedure as the samples, and the measured concentrations of the laboratory blank samples were very low, indicating minimal contamination during processing. The reproducibility of the spiked blanks was acceptable, yielding recoveries ranging from 45.10±3.36 % to 105.3±3.29 % for gas phase and 45.40±2.64 % to 122.50±12.51 % for particulate phase. Except for etoxazole in the gas phase (45.1 %) and cycloxaprid and thiophanate-methyl in the particulate phase (both 45.4 %), most pesticides showed good recovery extracted by dichloromethane and hexane. The average recoveries for 38 pesticides was 74.0±22.5 % in the particulate phase and 73.5±16.8 % in the gas phase. All concentration data of this study is not adjusted using the recoveries. The limit of detection (LOD) was estimated as the quantity of analyte with a signal to noise ratio of 3:1, ranging from 0.01 to 9.32 pg m−3 for gas phase samples and from to 5.89 pg m−3 for particulate phase samples (Table S4).
2.4 Gas-particle partitioning models
Partitioning of pesticides between the gas phase and particulate phase is often described using the gas-particle partitioning coefficient (KP, m3 µg−1) which defined by Harner and Bidleman (1998):
Where Cp and Cg are the concentrations of the pesticides (µg m−3) in the particulate phase and gas phase, respectively and CTSP is the concentration of the TSP in the air (µg m−3).
The measured particle-bound fraction (φm) can be calculated by the Eq. (2):
The gas-particle partitioning of soluble organic pollutants in the atmosphere is influenced by processes such as adsorption, absorption, as well as the removal of particulate matter through dry and wet deposition. To examine the dominant partitioning mechanisms, we tested three conceptual models, each representing a distinct hypothesis, by simulating relevant gas-particle partitioning parameters. For this purpose, we applied three established models that are widely used to simulate this process, namely the Junge-Pankow (J-P) adsorption model (Pankow, 1987; Iakovides et al., 2022), Harner-Bidleman (H-B) Koa absorption model (Iakovides et al., 2022; Harner and Bidleman, 1998; He and Balasubramanian, 2009), and L-M-Y model (Li et al., 2015).
The Junge-Pankow (J-P) adsorptive model assumes that the organic matter is adsorbed onto aerosol surface and relates the predicted particle-bound fraction (φp) to the aerosol surface area per air volume unit and the saturation vapor pressure of supercooled liquid (, Pa) values (Pankow, 1987). The φp can be calculated by the Eq. (3):
Where φ is the fraction of organic matter concentration that is adsorbed onto the aerosol surface. The parameter c is a constant with an empirical value of 17.2 Pa cm−1. θ represents the contaminated aerosol surface area per unit air volume (cm2 cm−3) with a series of representative values ( cm2 cm−3 for remote areas, cm2 cm−3 for rural areas, and cm2 cm−3 for urban areas). is subcooled liquid vapor pressure calculated according to the MPBPVP module in the Estimation Program Interface (EPI) suite (EPIWEB-4.1) of the U.S. Environmental Protection Agency (U.S.EPA) using the mean temperature (K) during each sampling period, for the pesticides atrazine, carbendazim, difenoconazole, prochloraz, tebuconazole, hexaconazole, propiconazole, pyrimethanil, and omethoate, the values at 25 °C were used as substitutes, since values at the actual temperature were unavailable in this module (Lohmann et al., 2004). Log values for the studied pesticides are presented in Table S5.
The Harner-Bidleman (H-B) Koa absorption model predicts KP as a function of Koa and the fraction of organic matter in the aerosols (fom), assuming that the organic matter is absorbed into a liquid-like organic film in the particulate matter under the influence of the absorption force, solubility and particle size (Harner and Bidleman, 1998; He and Balasubramanian, 2009):
Here, fom denotes the fraction of organic matter in aerosols. Four fom values (5 %, 10 %, 20 % and 30 %) were adopted following Jiang et al. (2020), and this range is highly consistent with the measured organic matter fraction of 9 % to 41 % for aerosols reported by Iakovides et al. (2022). This strong consistency also enhances the credibility of our simulation results. Koa was calculated according to the method in KOAWIN module of the EPI suite of the U.S.EPA and the equation is as follows (Baskaran et al., 2021):
where the Kow is the octanol-water partition coefficient, with the value at 25 °C acquired from the KOWWIN module in the EPI suite (EPIWEB-4.1) of the U.S.EPA. LogKoa values for the studied pesticides are presented in Table S6. R is the ideal gas constant (Pa mol K−1 m−3) with a value of 8.314. T is the mean temperature during each sampling period (K). HLC is Henry's law constant calculated according to the equation acquired from the HENRYWIN module in the EPI suite (EPIWEB-4.1) of the U.S. EPA:
where T is the mean temperature (K) during each sampling period. The An and Bn of each pesticide are different and the specific values were obtained in the HENRYWIN module.
Additionally, the φp can be predicted by:
The TSP values for each sampling period were used in this study and the typical values (5 %, 10 %, 20 % and 30 %) of fom were also inserted.
The L-M-Y model was a steady-state model established by Li et al. (2015), which considered the influences of dry and wet depositions of particles and introduced into a non-equilibrium parameter caused by dry and wet depositions, logα (McEachran Andrew et al., 2015). And the log and can be predicted according to the Eqs. (8) and (9) as follows:
The Log can be calculated by Eq. (4) and the logα can be calculated by
The values of fom and the empirical constant C relative to prevailing wind were cited from previous studies (fom=5 %, 10 %, 20 % and 30 %, C=5) in the above model (Iakovides et al., 2022).
Calculation of root mean square error (RMSE): RMSE for each φp of the pesticides detected in the gas phase and the particulate phase at the same time was calculated to statistically evaluate each partitioning model and the lower the RMSE value is, the closer is the φp to φm, indicating that the model has a better prediction of the gas-particle partitioning of the pesticides in the studied area. The RMSE can be calculated according to the equation as follows:
Where φmi is the measured particle fraction of each pesticide, φpi is the particle fraction predicted by each model, and N is the sample size.
3.1 Detection frequency of pesticides in ambient air
A total of 33 pesticides was observed in the gas phase and particulate phase samples of Quzhou County during the sampling period from February 2023 to May 2023, including 17 fungicides, 12 insecticides, and 4 herbicides. The detection frequencies of these pesticides varied from 7.14 % (thiacloprid) to 100 % (acetamiprid). The detection frequencies for all quantified pesticides are given in Table S7. Twenty individual pesticides were detected at least once in both gas and particle-phase samples, with acetamiprid, imidacloprid, difenoconazole, pymetrozine, and tebuconazole detected in >50 % samples. Notably, fipronil, a pyrazole insecticide banned in agricultural production in China since 2009 (Ministry of Agriculture and Rural Affairs of the People's Republic of China, 2009), was detected in particulate phase samples on 31 March for the first time and continued to be detected in subsequent particulate phase samples until the end of sampling on 20 May, which might be due to the use of fipronil as sanitary or seed coating agent of partial dryland crop in the vicinity of the sampling site, as well as its application in controlling household pests (Cui et al., 2016).
Compared with the detection frequencies of pesticides in gas phase (64.29 %–85.71 %), the detection frequencies in particulate phase were relatively high (71.43 %–92.86 %). The pesticides of clothianidin, chlorobenzuron, dimethomorph, fipronil, propamocarb, thiophanate-methyl, tribenuron-methyl, triadimenol, kresoxim-methyl, azoxystrobin, trifloxystrobin and pyraclostrobin were detected only in the particulate phase.
3.2 Concentrations of pesticides in ambient air
In total 33 pesticides were observed with the applied UHPLC-MS/MS method, including 12 insecticides, 4 herbicides and 17 fungicides (Fig. 1). The average concentrations of pesticide in particulate phase (2025.76±1048.83 pg m−3) were significantly higher than 143.38±146.31 pg m−3 in gas phase), constituting 93.4 % of the total atmospheric pesticide mass. In the particulate phase, the mean concentration of tebuconazole (a broad-spectrum triazole fungicide) in the 14 QFF samples was the highest with a value of 662.49 pg m−3, and the mean concentration of thiophanate-methyl (a thioureas fungicide) was the lowest with a value of 0.015 pg m−3. Among the gas-phase samples, pyrimethanil (an aminopyrimidine fungicide) showed the highest mean concentration at 93.00 µg m−3 across the 14 PUF samples, attributable to its high vapor pressure. In contrast, fenbuconazole (a triazole fungicide) with low vapor pressure had the lowest mean concentration of only 0.05 pg m−3. Research has found that the pesticides in atmospheric aerosol particles are very persistent because the particles shield the absorbed compounds from degradation by OH radicals (Socorro et al., 2016). In addition, atrazine, omethoate and pyrimethanil were detected in samples taken around 14 April and the samples taken later in the gas phase, probably owing to the application or the fact that with the temperature raised, there was re-volatilization of this pesticide from contaminated terrestrial surfaces (Gungormus et al., 2021). Moreover, the pesticide physicochemical properties, their environmental persistence and the pesticide application technique used may also influence the atmospheric concentrations of the pesticides (Degrendele et al., 2016). Detailed average concentration for individual pesticides in the 14 gas-phase and 14 particulate-phase samples collected during the sampling period from February 2023 to May 2023 are given in Table S8.
Neonicotinoid insecticides (NEOs) stand as the most extensively applied pesticides across agriculture, boasting versatile applications such as seed dressing, spraying, and soil application (Zhou et al., 2020). The average concentration of NEOs including acetamiprid, clothianidin, imidacloprid, thiamethoxam and thiacloprid in atmosphere was 241.18 pg m−3, while it was 232.03 pg m−3 for particulate phase and 9.15 pg m−3 for gas phase in our study. This is at the same level as the gaseous pesticides reported by Zhao et al. (2023) from their year-round monitoring in Quzhou County, the NCP (0.6–26 pg m−3). In comparison, the average concentration of NEOs in the particulate phase observed in this study was substantially higher than that associated with PM2.5 in an urban area of Beijing, China (35.8 pg m−3, March and October) and nearly three times greater than the PM2.5-bound concentration reported for a rural area of Zhengzhou City, China (80.9 pg m−3, March and October 2019) a conventional agricultural region, as reported by Zhou et al. (2020). Meanwhile. the concentration of individual NEOs for particulate phase (90.42, 20.63, 91.82 and 28.71 pg m−3 for imidacloprid, acetamiprid, thiamethoxam and clothianidin, respectively) in our study was higher than that in the rural area of Zhengzhou City, China (48.00, 17.70, 7.20 and 7.95 pg m−3, respectively, March and October 2019), probably due to that pesticides observed in our study were in the TSP samples (including particles with all sizes), whereas the particulate samples in the rural areas of Zhengzhou City, China were the PM2.5 fraction. In a study on the risk assessment of airborne agricultural pesticide exposure near fields in the grain-growing area of Liaocheng City, China, Hu et al. (2024) reported concentrations of acetaminprid, atrazine, imidacloprid, and nicosulfuron detected during the sampling period from March to October 2018. The measured concentrations were 4.88×10⁵, 2.17×10³, 4.11×10⁴, and 3.46×10⁴ pg m−3, respectively. The mean concentration of the above pesticides in our study (21.66, 114.72, 96.19 and 2.17 pg m−3) was lower than that of the research in Liaocheng City, China, which may be related to the low pesticide application near the sampling site during the sampling period in this study.
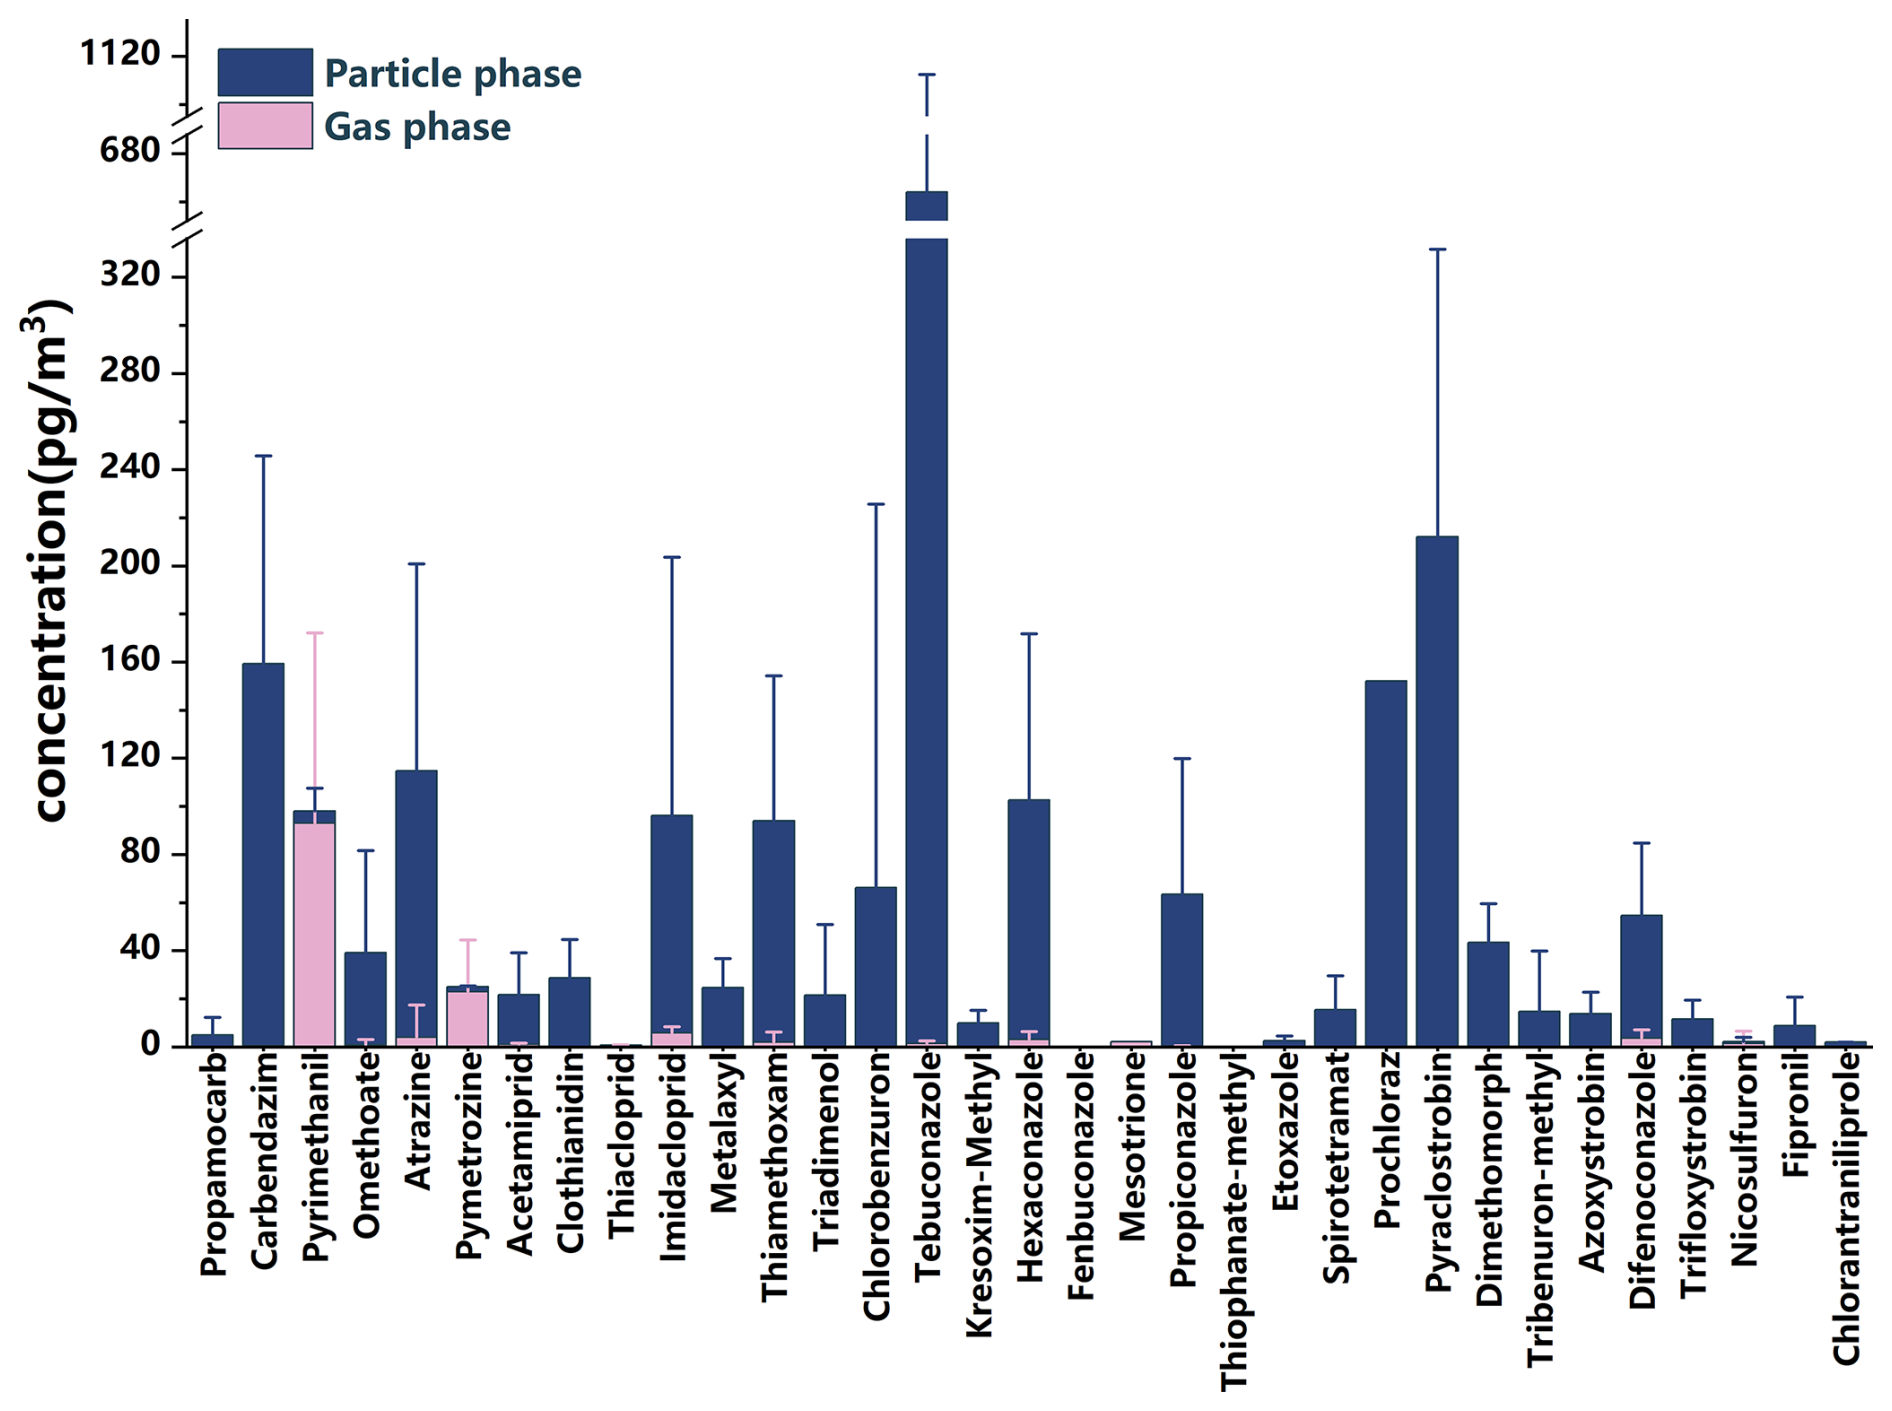
Figure 1The average concentration of individual pesticide in the 14 gas phase (pink) and 14 particulate phase (blue) samples collected during the sampling period from February 2023 to May 2023. In total 33 pesticides were observed with the applied UHPLC-MS/MS method.
3.3 Temporal variation of pesticide concentration
The concentrations of four typical fungicides (i.e., tebuconazole, prochloraz, pyraclostrobin, and propiconazole) and the insecticide imidacloprid increased in the particulate phase in mid-April and early May (Figs. 2, S1–S2). In the gas phase, imidacloprid, atrazine, tebuconazole, and propiconazole showed a similar trend but at lower concentrations than in the particulate phase, except for pyrimethanil, which had a higher concentration in the gas phase on 29 April. The concentration of hexaconazole in the gas phase and the particulate phase had a similar trend over time (Figs. S1–S2). This trend aligns with the application timing during the booting and heading stages of wheat (early April to mid-May), with peak concentrations coinciding with pesticide application. In addition, the concentrations of hexaconazole and imidacloprid in the gas phase were higher than particulate phase before April (the month of wheat booting stage), this might be caused by the volatilization of pesticides from the soil to the atmosphere. Although the temporal distribution patterns of other pesticides in the gas and particulate phases do not exhibit a high degree of consistency, a notable increase in particulate-phase concentrations was observed from April to mid-May (Figs. S1–S2). Notably, this period corresponds to the key pre-harvest window for pest and disease control in wheat, which coincides with the booting and heading stages (early April to mid-May).These findings suggest that pesticide applications near the sampling site resulted in emissions into the atmosphere and subsequent association with atmospheric particulate matter. Moreover, the temporal pattern indicates that local sources (e.g., pesticides application in the local fields) dominated atmospheric pesticide concentrations.
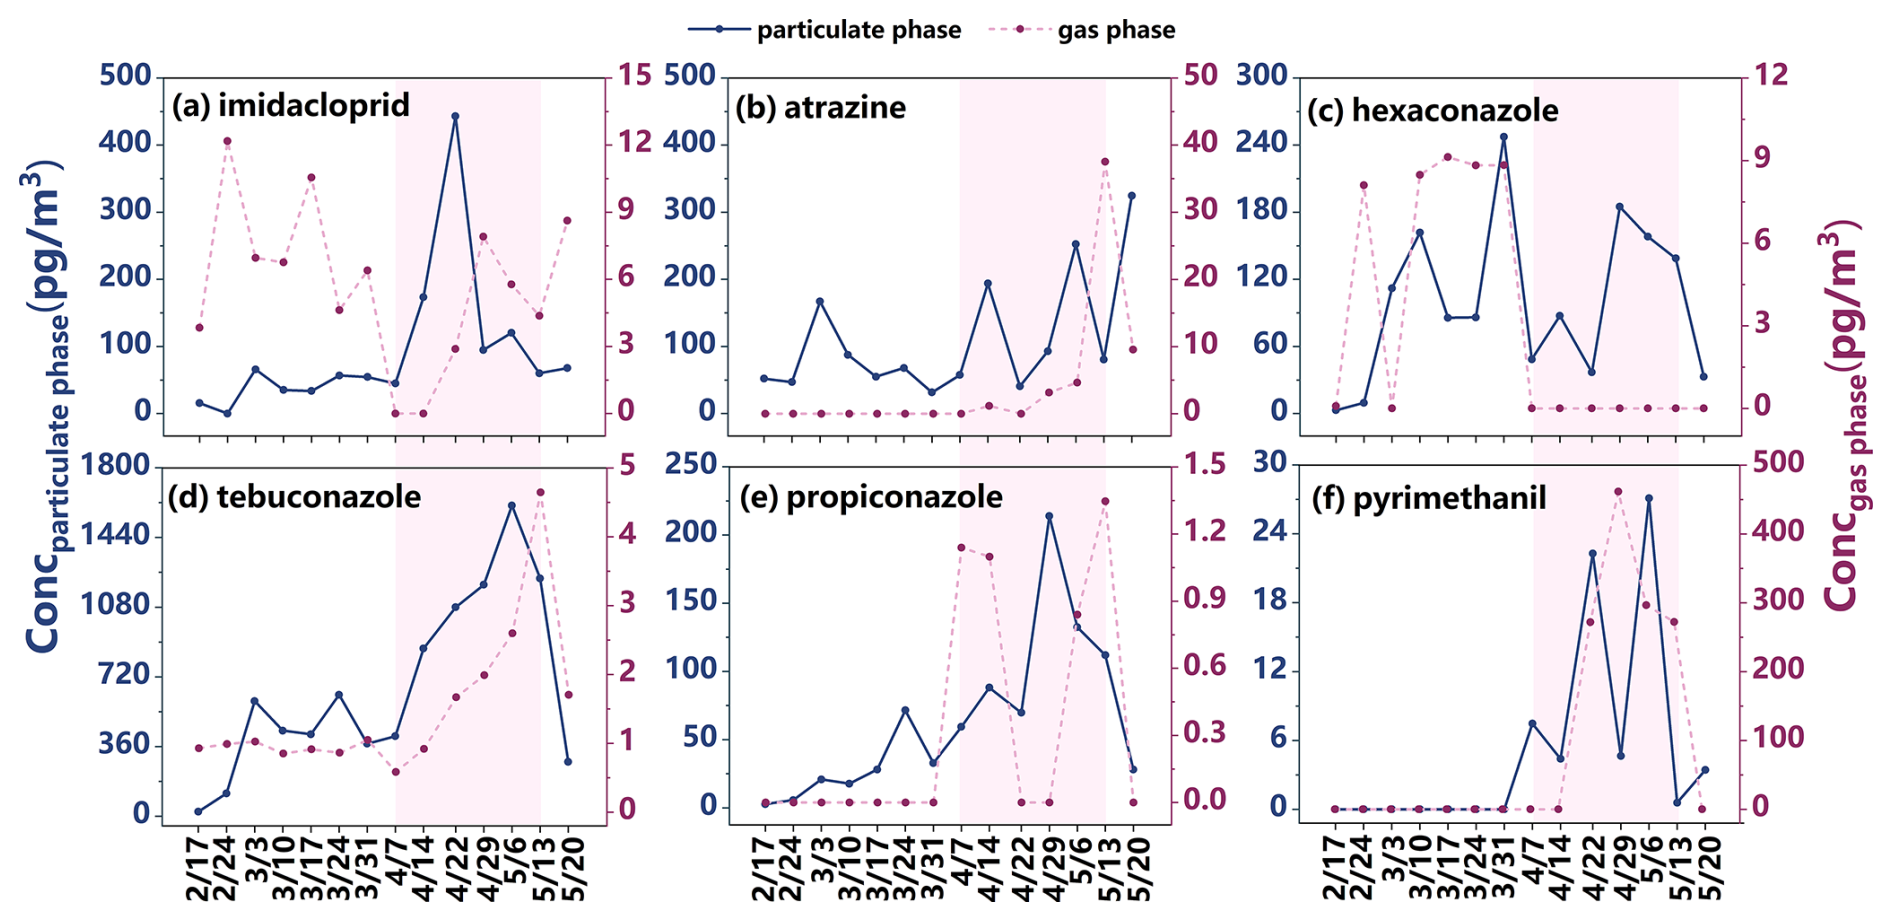
Figure 2The concentration trend of different pesticides with sampling dates in particulate phase (full line) and gas phase (dotted line) from February 2023 to May 2023. (a) imidacloprid. (b) atrazine. (c) hexaconazole. (d) tebuconazole. (e) propiconazole. (f) pyrimethanil. The left coordinate axis represents the concentration of pesticide in particulate phase and the right coordinate axis represents the concentration in gas phase. In the figure, the purple shadow denotes the wheat growth stages from booting to heading.
3.4 Effect of meteorology on pesticide concentrations in both particulate and gas phase
To elucidate major factors influencing pesticide distribution between the particulate and gas phases, we used a Pearson correlation matrix to visualize the relationships among total pesticide concentrations in both phases, meteorological parameters, and particulate matter (PM10, PM2.5 and TSP) concentrations (Fig. 3). A positive correlation with a correlation coefficient of 0.66 (p<0.01) between the particulate and gas-phase pesticide concentrations was observed, indicating that pesticides in both particulate and gas phase share common sources. A significant negative correlation was observed between the pesticide concentration in particulate + gas phase and reciprocal temperature (, p<0.01). In other words, rising temperature leads to an increase of the total concentration of pesticides in the atmosphere, including those in both gaseous and particulate phases. It can be explained by that more pesticides volatilized from the soil to the atmosphere with high temperature, which aligns with the finding by Iakovides et al. (2022). Figure 3 shows a lack of significant correlation between pesticide concentrations (both particulate and gaseous) and wind speed, suggesting that the pesticide concentration in the atmosphere in this study was dominated by local emission sources rather than long-distance sources by wind. In addition, a significant negative correlation was observed between reciprocal temperature and pesticide concentration in the particulate phase (, p<0.01), whereas no statistically significant correlation was found with the concentration in the gas phase. Thus, increasing temperatures were connected to an enrichment of pesticides in the particle phase. This finding is somewhat unexpected, as increased temperatures typically promotes the phase transition of semivolatile organic compounds from the particulate to the gaseous phase. This phenomenon deserves attention and requires further analysis of its underlying causes. Wang et al. (2024) identified temperature as the primary factor influencing the gas-particle partitioning of polycyclic aromatic hydrocarbons (PAHs). This provides a possible explanation, but further verification is needed in our study. Atmospheric pesticide concentrations showed no significant correlations with precipitation, relative humidity, or wind speed. Negative correlations ( to −0.32) were observed between pesticide concentrations (in both particulate and gas phases) and levels of PM10 or PM2.5.
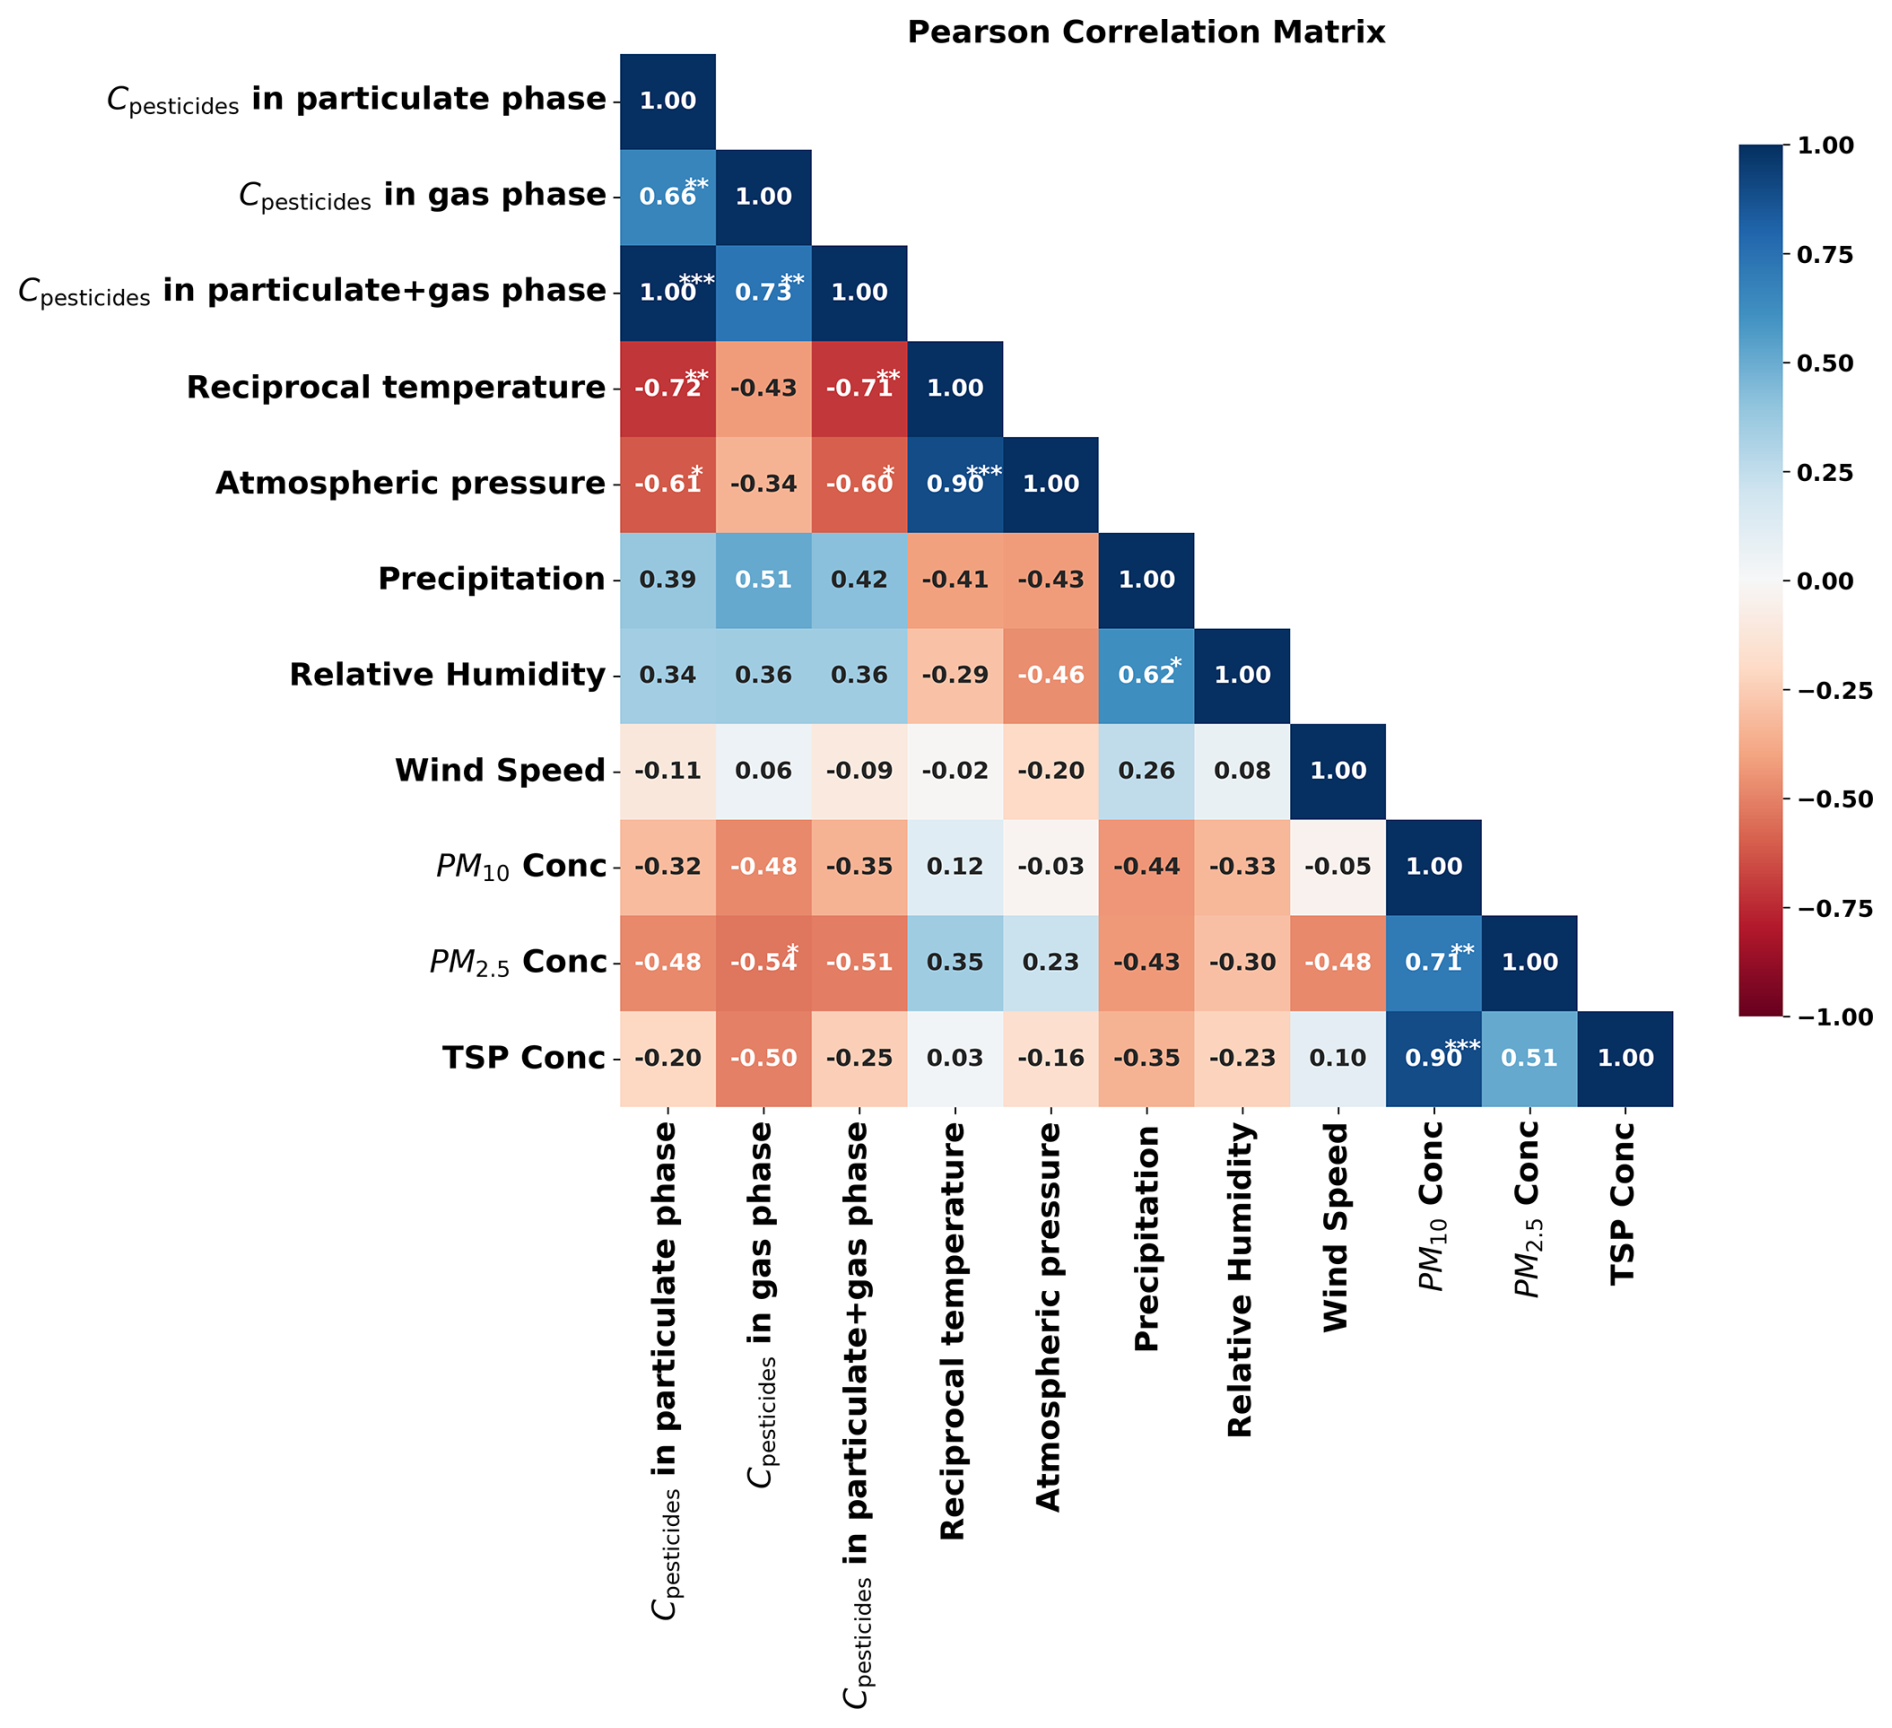
Figure 3Pearson correlation matrix of pesticide concentrations in particulate phase, gas phases and particulate + gas phase with meteorological parameters and particulate matter (PM10, PM2.5 and TSP) concentrations. The values in the cells represent Pearson correlation coefficients (r). Asterisks indicate statistical significance: * p<0.05, ** p<0.01, and *** p<0.001.
To further investigate the influence of temperature, we performed a correlation analysis between temperature and the log KP values of pesticides meeting the criterion of having more than five valid data points (i.e., acetamiprid, imidacloprid, difenoconazole, pymetrozine, tebuconazole, and hexaconazole), as shown in Fig. 4. The log KP values of all six pesticides increased with rising temperature. Notably, this correlation was statistically significant for acetamiprid, difenoconazole, and pymetrozine, indicating that higher temperatures were associated to their partitioning into the particulate phase. This pattern was mirrored by the relationship between temperature and the ratio of particulate-phase to gaseous-phase concentration () (Fig. S4). A study by Zhu et al. (2021) in Harbin City, China reported negative correlations between temperature and log KP for most 4–5 ring PAHs, whereas positive correlations were observed for the 3-ring PAHs (acenaphthylene and acenaphthene) (Zhu et al., 2021). This contrast highlights the pivotal role of physicochemical properties, which can lead to completely opposing temperature dependencies for log KP. Ulteriorly, the positive correlation between temperature and the particulate-phase fraction of pesticides, shown in Fig. S5, may be compounded by concurrent increases in relative humidity. Specifically, when temperatures exceed 290 K, relative humidity is consistently observed to be above 52 %. Under these conditions, elevated humidity can induce a phase transition in particulate matter, decreasing its viscosity and transforming it into a liquid-like state (Li and Shiraiwa, 2019). This physical change subsequently strengthens the particle's capacity to absorb and retain pesticides. Furthermore, agricultural activities (e.g., soil tillage) subsequent to pesticide application in spring can accelerate the release of fine soil particles containing pesticides to the atmosphere by wind erosion, resulting in the increase of pesticides in the particulate phase (Mayer et al., 2024).
Therefore, as temperature increased, elevated concentrations of pesticides in the particulate phase were observed in this study, accompanied by a rise in logKP values. This indicates an increase in the ratio with temperature. Pearson correlation and linear regression analyses suggest that this trend is likely not governed by a single factor, but rather results from multiple interacting drivers, including the physicochemical properties of pesticides, increasing relative humidity, the transition of particles to a liquid-like phase, and heightened pesticide application.
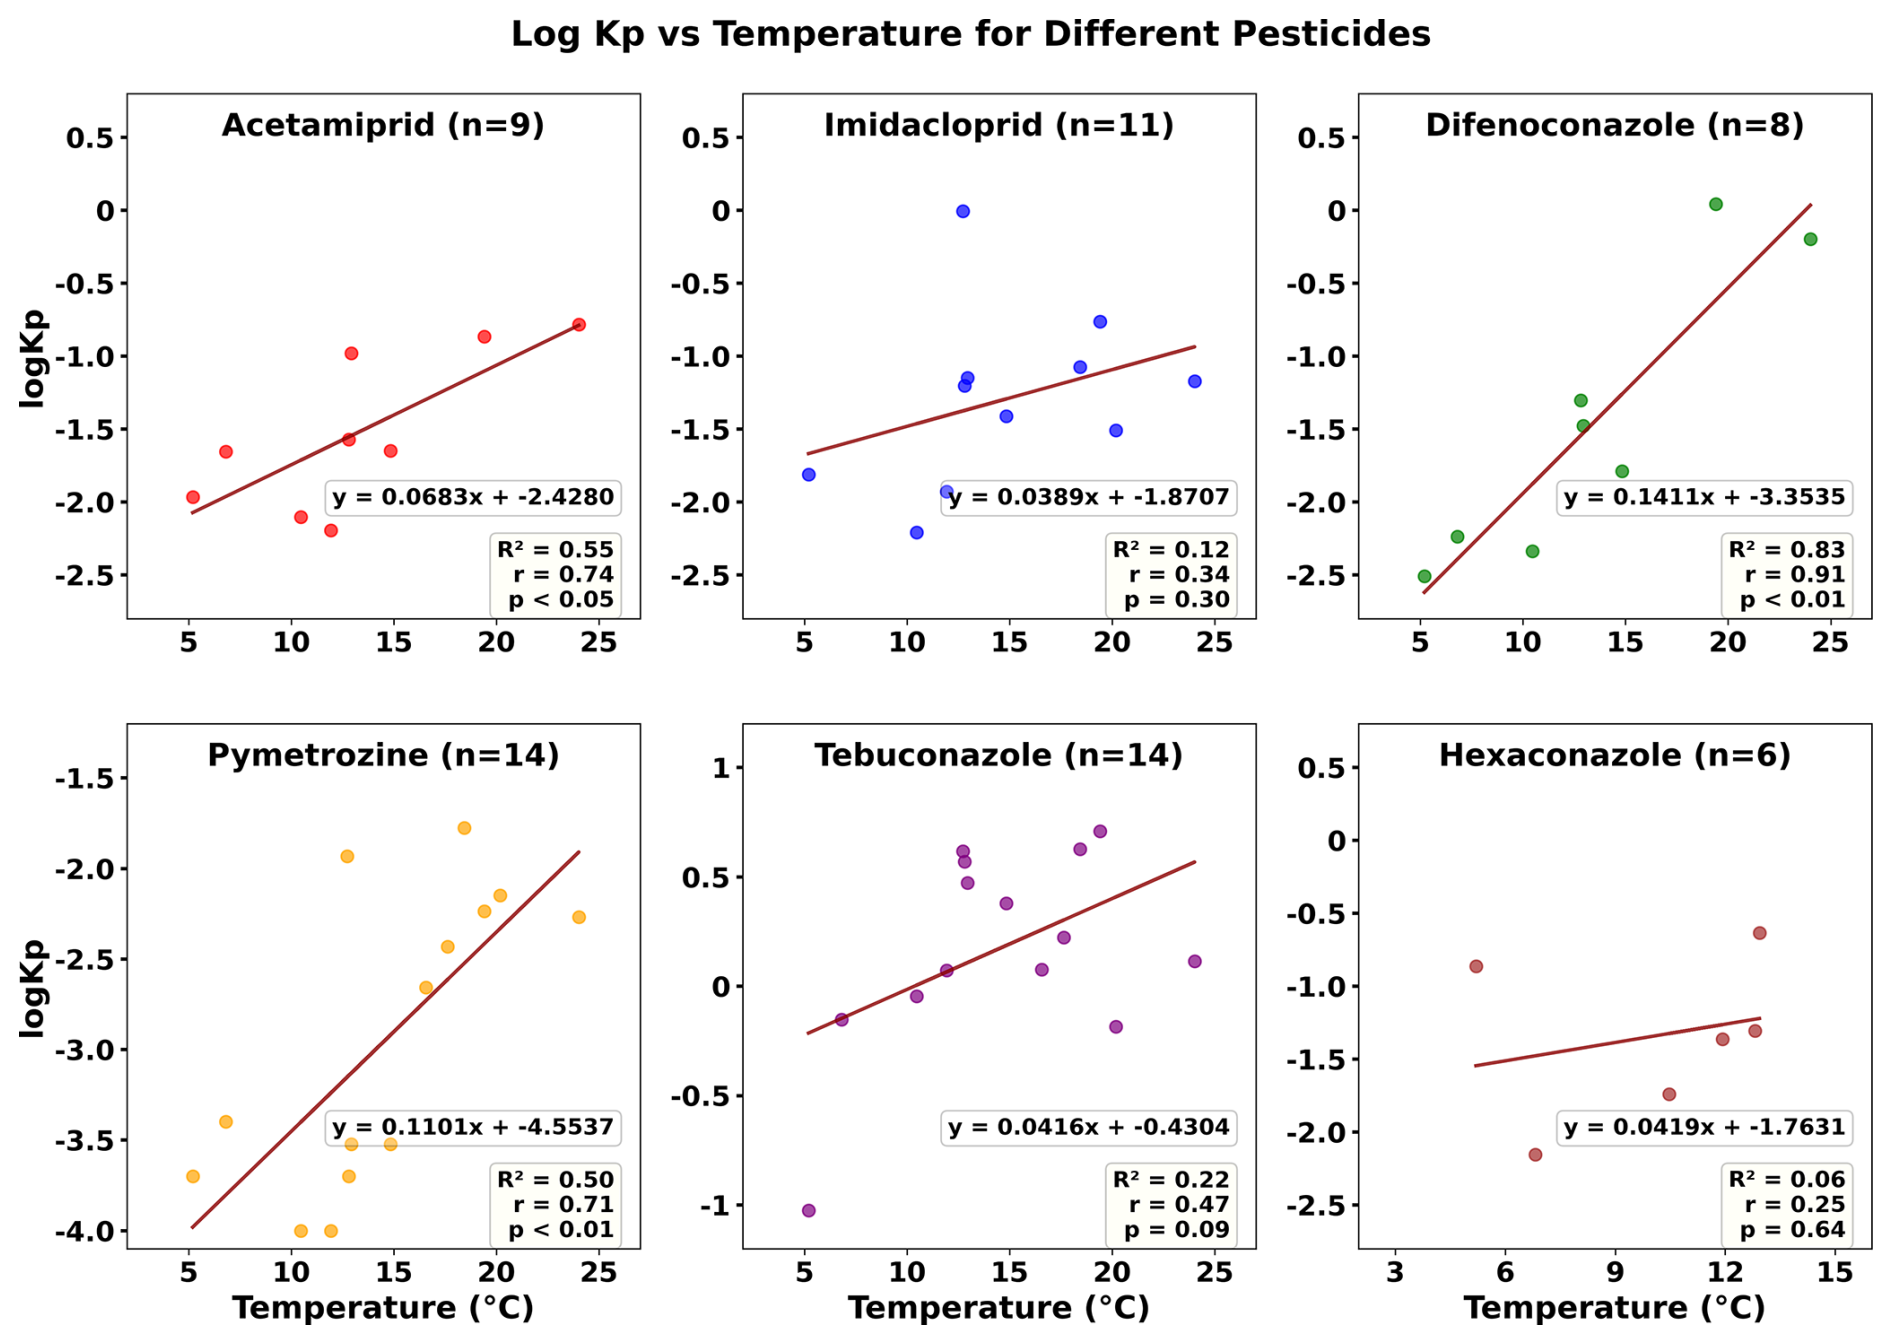
Figure 4The correlation between log KP for pesticides and temperature. The “n” in the figure represents the number of valid data points for each type of pesticide in the logKP measurement. Pearson correlation analysis was conducted between log KP and temperature for pesticides with more than five valid data points. R2 represents the coefficient of determination for Pearson correlation, r represents the correlation coefficient, and p represents the significance level.
3.5 Gas-Particle partitioning
In our study, the gas-particle partitioning coefficient KP calculated by Eq. (1) are summarized in Table S9. In general, tebuconazole exhibited the highest partition coefficient (Kp, 0.09–5.1 m3 pg−1) across all sampling periods, indicating a greater tendency for distribution in the particulate phase, likely due to its low saturation vapor pressure of supercooled liquid (). The KP of pymetrozine was markedly low from the 17 February to 31 March in 2023 and increased significantly from 7 April to 20 May in 2023, indicating an approximate tenfold variation. This phenomenon may be attributed to the progressive partitioning of pymetrozine into the particulate phase over time. Alternatively, the increased application of pesticides during the booting and heading stages of wheat could also be a contributing factor. During these stages, the elevated pesticide usage may lead to emission into the atmosphere, where the pesticides subsequently bind to atmospheric particulate matter. Other pesticides, including acetamiprid, imidacloprid and difenoconazole, also showed the same pattern of KP. In addition to pesticide application patterns, an extended sampling duration may lead to the redistribution or degradation of pesticides during the sampling process itself, which could consequently affect the measured partition coefficient (KP) values. However, a recent study by Solano Díaz et al. (2026) showed that the pesticide concentrations in PUF samplers collected in one week were consistent with that in three weeks, indicating no significant degradation or diffusion of pesticides in PUF samplers within three weeks. Therefore, the impact of redistribution and/or degradation process of pesticides during one-week sampling period on the gas-particle partitioning of pesticides is very limited.
Measured particle-bound fraction φ of 18 pesticides detected in the gas phase and the particulate phase were plotted against the corresponding and compared with theoretical curves at given θ representing remote, rural and urban areas. Overall, the results presented in Fig. 5 show that most φ values ranged from 0.7 to 1, suggesting a potential underestimation of φ and highlighting the limitations of the adsorptive model in accurately simulating φ for most pesticides. This also implies the possible involvement of additional absorption mechanisms beyond surface adsorption.
While gas-particle partitioning models mostly assume thermodynamic equilibrium, kinetic effects that lead to non-equilibrium states are not captured by the models. Under field conditions, several factors, such as pesticide source and transport (e.g., drift, volatilization after application and wind erosion of contaminated soil), the interval between application and sampling, the distance between application and sampling sites, and environmental conditions, might significantly affect gas-particle partitioning (Scheyer et al., 2008). Therefore, the underestimation may be due to pesticides, deposited on soil surfaces, that were resuspended into the atmosphere by wind erosion, and sampled before gas-particle partitioning reached an equilibrium state.
Furthermore, some uncertainties associated with sampling and analysis methods could also contribute to differences between theoretical and experimental data. For example, about half of the values used in predictive models were calculated at 25 °C by the U.S.EPA's EPI suite (v.4.1). In this study, however, samples were collected in winter and spring at temperatures considerably lower than 25 °C (i.e., 0.5–22 °C). Considering that of pesticides decreases with lower temperatures, partitioning into the particulate phase is favored. Consequently, there were more pesticides distributing in the particulate phase under actual conditions, which caused higher particle fraction (φm) of each pesticide and underestimation of the model. In addition, due to the lack of adequate field measurements, c and θ values were estimated from other studies. Since the constant c varies for different groups of compounds, the value of 17.2 Pa cm−1 may not always be appropriate for each pesticide. The value of θ was also affected by the heterogeneous composition of atmospheric aerosols (contents of organic and elemental carbon), introducing uncertainty into model predictions. Additionally, the results further confirmed that the surface area of particulate matter in China may differ from that in Western Europe and the United States (Fleagle, 1963; Harner and Bidleman, 1998). The air pollution in China is caused by the production of highly primary emissions and secondary aerosols, while the Great Smog of London and Los Angeles mainly resulted from coal combustion and photochemical oxidation of vehicle emissions, respectively (An et al., 2019). Therefore, the actual contaminated TSP surface area per unit of air volume in Quzhou County should be greater than cm2 cm−3, which was used in this model for the urban area.
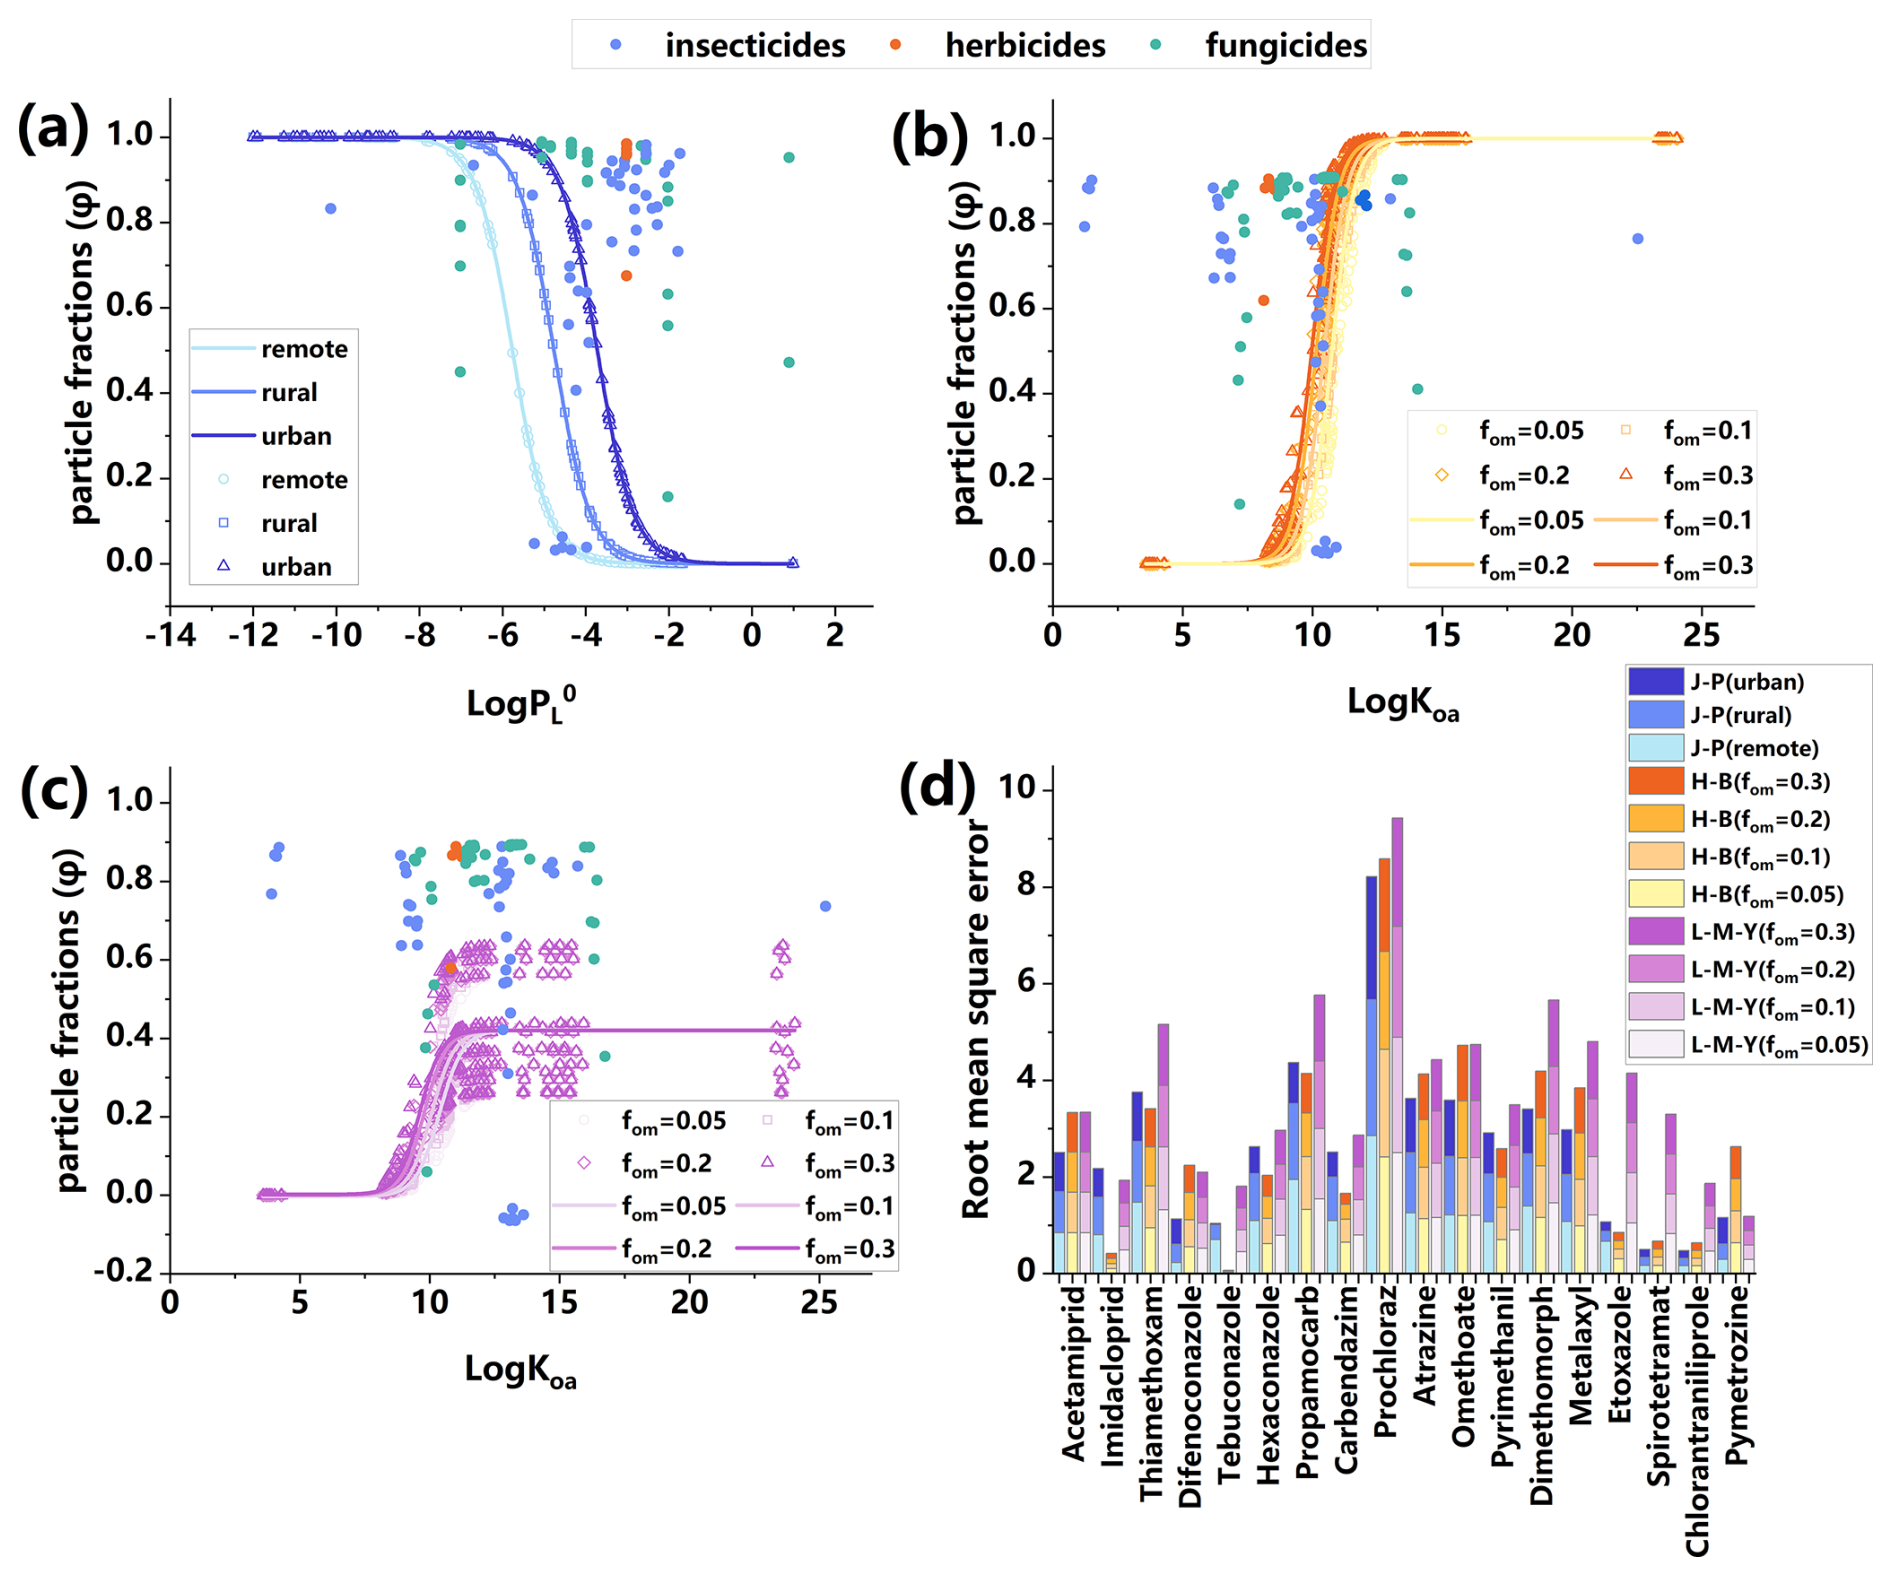
Figure 5Measured vs. predicted particle fractions (φ) by applying J-P model (a), H-B model (b) and L-M-Y model (c) for 18 major pesticides detected both in particulate phase and gas phase. (d) The root mean square error (RMSE) of the particle phase fractions of 18 pesticides predicted by the J-P model, H-B model and L-M-Y model. The empty dots of different colors represent the predicted φ values from three models, while the solid dots correspond to the measured φ values for various pesticides (insecticides, herbicides, and fungicides) examined in this study. The curves illustrate the predicted trends of φ values (represented by empty dots). In panel (a), the line colors indicate different levels of contaminated aerosol surface area per air volume unit across remote, rural, and urban areas. In panels (b) and (c), the colors correspond to different fractions of organic matter (fom) in the aerosols.
In addition to the J-P adsorption model (Fig. 5a), measured φ particle fractions for 18 pesticides detected in both the particulate phase and gas phase were plotted against their corresponding logKoa values and compared with theoretical partitioning curves at given fom values (0.05, 0.1, 0.2 and 0.3) based on the H-B absorptive model (Iakovides et al., 2022). As shown in Fig. 5b, the φ values predicted by the Koa absorption model exhibited greater alignment with theoretical values compared to those predicted by the J-P adsorption model. The fitting of the pesticides (atrazine, prochloraz, hexaconazole and imidacloprid) with LogKoa in the range of 9.98–12.10 was better, with prochloraz and hexaconazole exhibiting the most precise fitting. This indicates that, compared to the adsorption mechanism, the absorption mechanism was the main mechanism to describe the gas-particle partitioning of the pesticides, This might be related to the fact that the increase in temperature causes Koa to increase (Eq. 4), thereby facilitating the distribution of pesticides into the organic phase, which is consistent with the previous analysis of influencing factors.
For pesticides with LogKoa values less than 9.98 (omethoate, acetamiprid, propamocarb, metalaxyl and pyrimethanil), all four prediction curves were significantly underestimated. This discrepancy can be attributed to the calculation of Koa values in the model based on the KOW equation at 25 °C, while the samples were collected in winter and spring at temperatures lower than 25 °C. Considering that the Koa of pesticides increases with the decreasing temperature, this weakens the trend of the transformation into the gas phase, resulting in more pesticides distributing in the particulate phase under actual conditions, and caused higher φ values. However, for the pesticides with LogKoa bigger than 12.10 (difenoconazole, thiamethoxam, chlorantraniliprole and partial pymetrozine), there was overestimation in all of four curves, which may be related to the fact that the gas-particle partitioning of these pesticides did not reach the equilibrium state. Both Koa and model observations described above imply that adsorptive and absorptive partitioning are not strong standalone predictors for the pesticides in the studied atmosphere.
Measured φ particle fractions for the 18 pesticides mentioned above were also plotted against their corresponding logKoa values and associated with theoretical curves at given fom values (0.05, 0.1, 0.2 and 0.3) based on the L-M-Y steady-state model. As shown in Fig. 5c, the L-M-Y model underestimated the distribution in the particulate phase for almost all of the pesticides, and the fitting performance of the model was inferior to that of the H-B model, indicating that the distribution of pesticides on particulate matter was closer to the equilibrium state than that of the steady state. In addition, the farther the distance from the pesticide application sites to the sampling sites, the higher the proportion of pesticides that distribute in the particulate phase (Clymo et al., 2005). Therefore, in this model, the underestimation of φ values may stem from both local sources and long-range atmospheric transport of pesticides.
To better identify the prediction outputs of the three models, the RMSE for each φp of the pesticides detected in the gas phase and the particulate phase at the same time was calculated. As shown in Fig. 5d, for most of the pesticides, the RMSE values of the L-M-Y model were higher than those of the other two models, indicating that the L-M-Y model had poorer predictive performance. The RMSE values of the J-P and H-B models were comparable, with the H-B model yielding lower RMSE values for 8 pesticides and the J-P model yielding lower RMSE values with 10 pesticides. Although more pesticides fitted with the J-P model achieved lower RMSE values compared to the H-B model, the mean RMSE value of the H-B model was lower than that of J-P model, suggesting slightly stronger predictive capability of the H-B model for φ values.
Additionally, the trends of the logarithm of the measured gas-particulate partition coefficient (Kpm) to the predicted gas-particulat partition coefficient (Kpp) and Koa log-log relationships for the H-B model and L-M-Y model were also explored and the closer the slope derived from the fitting line to 0, the better the agreement between Kpm and Kpp and the results are shown in Fig. S3. Compared to the H-B model, the slope of LogKpm LogKpp and LogKoa fitting line predicted by L-M-Y model was closer to 0, indicating that the L-M-Y model may have better predictive performance. However, both two models produced lower R2, which might be due to excessive LogKpm LogKpp values for individual pesticides (pymetrozine, tebuconazole and imidacloprid). Therefore, this chapter considers the actual fitting performance of each model and the results calculated according to RMSE.
In general, the KP of tebuconazole was the highest in each sampling period, indicating that the pesticide was more likely to be distributed in particulate phase during the sampling period, likely due to its low . The KP values of pymetrozine, acetamiprid, imidacloprid and difenoconazole were very low in the first half of the entire sampling period and increased in the last half of the entire sampling period, owing to the fact that more pesticides distributing into the particulate phase as time went on or due to an increasing number of pesticides applied in the fields around sampling site. Compared with the other two models, the H-B model could better predict the gas-particle partitioning of pesticides in the atmosphere in Quzhou. The absorption mechanism was the main mechanism to describe the partitioning on particulate matter, but it was not an independent predictor, and other mechanisms were also controlling the gas-particle partitioning. In addition, the gas-particle partitioning in the atmosphere was closer to the equilibrium state rather than the steady state, but it still had not reached equilibrium state. However, field conditions may not be at equilibrium, a possible explanation is that the pollution in the study area primarily originated from local short-range emissions, as the sampling sites were located near farmland. High-intensity, close-range emissions could have established strong concentration gradients in the media surrounding the source, thereby dominating the short-term atmospheric partitioning behavior of pesticides near our sampling points and driving it rapidly toward local equilibrium. At the same time, regional atmospheric advection and long-range transport likely exerted a relatively weak influence given the spatial and temporal scales of this study. Therefore, although environmental systems are generally open and non-equilibrium on macroscopic and long-term scales, under specific localized and short-term conditions, equilibrium models may still serve as effective simulation tools.
This study has the following two limitations. Firstly, we estimated the gas-particle partitioning coefficient (Kp) using four assumed fractions of organic matter (fom) – 5 %, 10 %, 20 %, and 30 % – rather than measured organic matter content. Although the assumed range was informed by reported organic matter content in particulate matter (9 %–41 %; Iakovides et al., 2022), these values may still deviate from site-specific conditions. This approach could introduce uncertainty in predicting pesticide adsorption to the particulate phase. In addition, it is also important to note the limitation imposed by the sampling timeframe (March to May). Seasonal shifts can alter both pesticide usage and meteorological factors, leading to substantial differences in gas-particle partitioning across the year. Consequently, the findings may not fully represent year-round patterns. Future research should include year-round monitoring to address this temporal variation.
Utilizing UHPLC-MS/MS method and partitioning prediction models, this study focused on the gas-particle partitioning of pesticides in Quzhou County, the NCP. Our study demonstrates that pesticides were predominantly present in the particulate phase, accounting for up to 93.4 % of the total concentration in the atmosphere. The concentrations of most pesticides in the particulate phase and gas phase reach the maximum between mid-April and May suggesting that regional pesticide application patterns drive the temporal concentration trends. It was found that an increase in temperature significantly promoted the concentration of pesticides in the atmosphere. Moreover, a positive correlation between temperature and particulate-phase pesticide concentrations was observed, as indicated by rising logKp values. This pattern is likely driven by a combination of factors, including pesticide physicochemical properties, ambient relative humidity, particle phase state and pesticide use patterns. The H-B model could better predict the gas-particle partitioning of pesticides in the atmosphere, and the absorption mechanism is the main mechanism to describe the partitioning on particulate matter. In general, this study indicates that pesticides are mainly absorbed into the internal organic films of particulate matter in the NCP and advances the understanding of pesticide fate in the atmosphere of the NCP. To further elucidate pesticide behavior in particulate matter, future study should investigate the occurrence and transformation of pesticides across different particle size fractions, especially the fine particles.
The data sets generated in the current study are available at https://doi.org/10.5281/zenodo.17641894 (Guo et al., 2025). Figures were made with Matplotlib version 3.8.4 (https://doi.org/10.5281/zenodo.10916799; The Matplotlib Development Team, 2024), available under the Matplotlib license at https://matplotlib.org/ (last access: 21 February 2026).
The detailed description of calculation of the mass concentration of pesticides in ambient air (Sect. S1); the trend of different pesticide concentrations in particulate phase with time during the sampling period from February 2023 to May 2023 (Fig. S1); the trend of different pesticide concentrations in gas phase with time during the sampling period from February 2023 to May 2023 (Fig. S2); the slope of LogKpm LogKpp and LogKoa fitting line predicted by L-M-Y model and H-B model (Fig. S3); the correlation between for pesticides and temperature (Fig. S4); the correlation between particulate-phase pesticide concentration and temperature (Fig. S5); the information of the samples (Table S1); the information of the meteorological data in the sampling period (Table S2); the information of standard substance (Table S3); the limit of quantitation and limit of detection (Table S4); the log of each pesticide in each sampling period (Table S5); the log Koa of each pesticide in each sampling period (Table S6); the detection frequency of the pesticides in gas phase and particulate phase (Table S7); the concentration of the pesticides in gas phase and particulate phase (Table S8); the gas-particle partition coefficients of the pesticides (Table S9). The supplement related to this article is available online at https://doi.org/10.5194/acp-26-2797-2026-supplement.
KW contributed in designed the experiments and fundings for this work. LG was responsible for data analysis and manuscript preparation. SS is responsible for conducting the experiment. MZ and HM provided guidance for the experiment. YL provided guidance on the gas-particle partitioning model part. MB, DF and JW provided guidance on article writing.
The contact author has declared that none of the authors has any competing interests.
Publisher's note: Copernicus Publications remains neutral with regard to jurisdictional claims made in the text, published maps, institutional affiliations, or any other geographical representation in this paper. The authors bear the ultimate responsibility for providing appropriate place names. Views expressed in the text are those of the authors and do not necessarily reflect the views of the publisher.
Mingyu Zhao acknowledges the China Scholarship Council (grant no. 201913043).
This research has been supported by the National Natural Science Foundation of China (grant nos. 42207125 and 42475124), the China Agricultural University, and the Professor Station of China Agricultural University at Xinzhou Center for Disease Control and Prevention (grant no. 202505510311204).
This paper was edited by Ivan Kourtchev and reviewed by two anonymous referees.
Aktar, W., Sengupta, D., and Chowdhury, A.: Impact of pesticides use in agriculture: their benefits and hazards, Interdisciplinary toxicology, 2, 1, https://doi.org/10.2478/v10102-009-0001-7, 2009.
An, Z. S., Huang, R. J., Zhang, R. Y,, Tie, X. X., Li, G. H., Cao, J. J., Zhou, W. J., Shi, Z. G., Han, Y. M., and Gu, Z. L.: Severe haze in northern China: A synergy of anthropogenic emissions and atmospheric processes, P. Natl. Acad. Sci. USA, 116, 8657–8666, https://doi.org/10.1073/pnas.1900125116, 2019.
Barredo Yera, A. M. and Vasconcellos, P. C.: Pesticides in the atmosphere of urban sites with different characteristics, Process. Saf. Environ., 156, 559–567, https://doi.org/10.1016/j.psep.2021.10.049, 2021.
Baskaran, S., Lei, Y. D., and Wania, F.: Reliable Prediction of the Octanol-Air Partition Ratio, Environ. Toxicol. Chem., 40, 3166–3180, https://doi.org/10.1002/etc.5201, 2021.
Bedos, C., Cellier, P., Calvet, R., and Barriuso, E.: Occurrence of pesticides in the atmosphere in France, Agronomie, 22, 35–49, https://doi.org/10.1051/agro:2001004, 2002.
Brüggemann, M., Mayer, S., Brown, D., Terry, A., Rüdiger, J., and Hoffmann, T.: Measuring pesticides in the atmosphere: current status, emerging trends and future perspectives, Environmental Sciences Europe, 36, 39, https://doi.org/10.1186/s12302-024-00870-4, 2024.
Cabrerizo, A., Dachs, J., Jones, K. C., and Barceló, D.: Soil-Air exchange controls on background atmospheric concentrations of organochlorine pesticides, Atmos. Chem. Phys., 11, 12799–12811, https://doi.org/10.5194/acp-11-12799-2011, 2011.
Clymo, A. S., Shin, J. Y., and Holmén, B. A.: Herbicide Sorption to Fine Particulate Matter Suspended Downwind of Agricultural Operations: Field and Laboratory Investigations, Environ. Sci. Technol., 39, 421–430, https://doi.org/10.1021/es049210s, 2005.
Cui, J. K., Huang, W. K., Peng, H. Lv, Y., Kong, L. A., Li, H. X., Luo, S. J., Wang, Y., and Peng, D. L.: Efficacy Evaluation of Seed-Coating Compounds Against Cereal Cyst Nematodes and Root Lesion Nematodes on Wheat, Plant Disease, 101, 428–433, https://doi.org/10.1094/PDIS-06-16-0862-RE, 2016.
Degrendele, C., Okonski, K., Melymuk, L., Landlová, L., Kukučka, P., Audy, O., Kohoutek, J., Čupr, P., and Klánová, J.: Pesticides in the atmosphere: a comparison of gas-particle partitioning and particle size distribution of legacy and current-use pesticides, Atmos. Chem. Phys., 16, 1531–1544, https://doi.org/10.5194/acp-16-1531-2016, 2016.
FAO: Pesticides use and trade – 1990–2023, FAOSTAT Analytical Briefs, No. 109, Rome, https://doi.org/10.4060/cd5968en, 2025.
Feng, S. J., Xu, W., Cheng, M. M., Ma, Y. X., Wu, L. B., Kang, J. H., Wang, K., Tang, A. H., Jeffrey, L. C. J., Fang, Y. T., Keith, G., Liu, X. J., and Zhang F. S.: Overlooked Nonagricultural and Wintertime Agricultural NH3 Emissions in Quzhou County, North China Plain: Evidence from 15N-Stable Isotopes, Environ. Sci. Tech. Lett., 9, 127–133, https://doi.org/10.1021/acs.estlett.1c00935, 2022.
Fleagle, R. G.: Atmospheric processes, Science, 140, 653–654, https://doi.org/10.1126/science.140.3567.653.b, 1963.
Glotfelty, D. E., Leech, M. M., Jersey, J., and Taylor, A. W.: Volatilization and wind erosion of soil surface applied atrazine, simazine, alachlor, and toxaphene, Journal of agricultural and food chemistry, 37, 546–551, https://doi.org/10.1021/jf00086a059, 1989.
Gungormus, E., Sofuoglu, A., Celik, H., Gedik, K., Mulder, M. D., Lammel, G., Sofuoglu, S. C., Okten, E., Ugranli, T., and Birgul, A.: Selected persistent organic pollutants in ambient air in Turkey: Regional sources and controlling factors, Environ. Sci. Technol., 55, 9434–9443, https://doi.org/10.1021/acs.est.0c06272, 2021.
Guo, L., Shi, S., Li, Y., Martin, B., Zhao, M., Mu, H., Daniel, M. F., Wu, J., and Wang, K.: Gas-particle partitioning of pesticides in the atmosphere of the North China Plain, Zenodo [data set], https://doi.org/10.5281/zenodo.17641894, 2025.
Harner, T. and Bidleman, T. F.: Octanol–air partition coefficient for describing particle/gas partitioning of aromatic compounds in urban air, Environ. Sci. Technol., 32, 1494–1502, https://doi.org/10.1016/S1352-2310(97)00013-7, 1998.
He, J. and Balasubramanian, R.: A study of gas/particle partitioning of SVOCs in the tropical atmosphere of Southeast Asia, Atmos. Environ., 43, 4375–4383, https://doi.org/10.1016/j.atmosenv.2009.03.055, 2009.
Hebei Provincial Bureau of Statistics: Hebei statistical yearbook 2024, edited by: Yang, Z., Yin, F., and Tian, W., China Statistics Press, ISBN 978-7-5230-0633-7, 2024.
Hu, Y., Wu, S., Wu, C., Wei, Z., Ning, J., and She, D.: Risk assessment of airborne agricultural pesticide exposure in humans in rural China, Environ Geochem Health, 46, 117, https://doi.org/10.1007/s10653-024-01882-y, 2024.
Iakovides, M., Oikonomou, K., Sciare, J., and Mihalopoulos, N.: Evidence of stockpile contamination for legacy polychlorinated biphenyls and organochlorine pesticides in the urban environment of Cyprus (Eastern Mediterranean): influence of meteorology on air level variability and gas/particle partitioning based on equilibrium and steady-state models, J. Hazard. Mater., 439, 129544, https://doi.org/10.1016/j.jhazmat.2022.129544, 2022.
Jiang, L., Gao, W., Ma, X., Wang, Y., Wang, C., Li, Y., Yang, R., Fu, J., Shi, J., Zhang. Q. H., Wang, Y. W., and Jiang, G. B.: Long-term investigation of the temporal trends and gas/particle partitioning of short-and medium-chain chlorinated paraffins in ambient air of King George Island, Antarctica, Environ. Sci. Technol., 55, 230–239, https://doi.org/10.1021/acs.est.0c05964, 2020.
Kaur, R., Mavi, G. K., Raghav, S., and Khan, I.: Pesticides classification and its impact on environment, Int. J. Curr. Microbiol. Appl. Sci, 8, 1889–1897, https://doi.org/10.20546/ijcmas.2019.803.224, 2019.
Li, Y. and Shiraiwa, M.: Timescales of secondary organic aerosols to reach equilibrium at various temperatures and relative humidities, Atmos. Chem. Phys., 19, 5959–5971, https://doi.org/10.5194/acp-19-5959-2019, 2019.
Li, Y.-F., Ma, W.-L., and Yang, M.: Prediction of gas/particle partitioning of polybrominated diphenyl ethers (PBDEs) in global air: A theoretical study, Atmos. Chem. Phys., 15, 1669–1681, https://doi.org/10.5194/acp-15-1669-2015, 2015.
Lohmann, R., Jaward, F. M., Durham, L., Barber, J. L., Ockenden, W., Jones, K. C., Bruhn, R., Lakaschus, S., Dachs, J., and Booij, K.: Potential contamination of shipboard air samples by diffusive emissions of PCBs and other organic pollutants: Implications and solutions, Environ. Sci. Technol., 38, 3965–3970, https://doi.org/10.1021/es035005l, 2004.
Mayer, L., Degrendele, C., Šenk, P., Kohoutek, J., Přibylová, P., Kukučka, P., Melymuk, L., Durand, A., Ravier, S., Alastuey, A., Baker, A. R., Baltensperger, U., Baumann-Stanzer, K., Biermann, T., Bohlin-Nizzetto, P., Ceburnis, D., Conil, S., Couret, C., Degórska, A., Diapouli, E., Eckhardt, S., Eleftheriadis, K., Forster, G. L., Freier, K., Gheusi, F., Gini, M. I., Hellén, H., Henne, S., Herrmann, H., Holubová Šmejkalová, A., Hõrrak, U., Hüglin, C., Junninen, H., Kristensson, A., Langrene, L., Levula, J., Lothon, M., Ludewig, E., Makkonen, U., Matejovičová, J., Mihalopoulos, N., Mináriková, V., Moche, W., Noe, S. M., Pérez, N., Petäjä, T., Pont, V., Poulain, L., Quivet, E., Ratz, G., Rehm, T., Reimann, S., Simmons, I., Sonke, J. E., Sorribas, M., Spoor, R., Swart, D. P. J., Vasilatou, V., Wortham, H., Yela, M., Zarmpas, P., Zellweger Fäsi, C., Tørseth, K., Laj, P., Klánová, J., and Lammel, G.: Widespread Pesticide Distribution in the European Atmosphere Questions their Degradability in Air, Environ. Sci. Technol., 58, 3342–3352, https://doi.org/10.1021/acs.est.3c08488, 2024.
McEachran Andrew, D., Blackwell Brett, R., Hanson, J. D., Wooten Kimberly, J., Mayer Gregory, D., Cox Stephen, B., and Smith Philip, N.: Antibiotics, Bacteria, and Antibiotic Resistance Genes: Aerial Transport from Cattle Feed Yards via Particulate Matter, Environ. Health Perspect., 123, 337–343, https://doi.org/10.1289/ehp.1408555, 2015.
Ministry of Agriculture and Rural Affairs of the People's Republic of China: Ministry of Agriculture, Ministry of Industry and Information Technology, Ministry of Environmental Protection Announcement No. 1157, edited, https://www.moa.gov.cn/govpublic/ZZYGLS/201006/t20100606_1534288.htm (last access: 21 February 2026), 2009.
Ministry of Agriculture and Rural Affairs of the People's Republic of China: The goal of achieving zero growth in the usage of fertilizers and pesticides has been successfully accomplished, https://www.moa.gov.cn/xw/zwdt/202101/t20210117_6360031.htm (last access: 21 February 2026), 2021.
Mu, H. Y. Zhang, J. C. Yang, X. M., Wang, K., Xu, W., Zhang, H. Y., Liu, X. J., Ritsema, C. J., and Geissen., V.: Pesticide screening and health risk assessment of residential dust in a rural region of the North China Plain, Chemosphere, 303, 2, https://doi.org/10.1016/j.chemosphere.2022.135115, 2022.
Ngo, M., Pinkerton, K., Freeland, S., Geller, M., Ham, W., Cliff, S., Hopkins, L., Kleeman, M., Kodavanti, U., and Meharg, E.: Airborne particles in the San Joaquin Valley may affect human health, California Agriculture, 64, 12–16, https://doi.org/10.3733/ca.v064n01p12, 2010.
Pankow, J. F.: Review and comparative analysis of the theories on partitioning between the gas and aerosol particulate phases in the atmosphere, Atmos. Environ., 21, 2275–2283, https://doi.org/10.1016/0004-6981(87)90363-5, 1987.
Qiao, L. N., Zhang, Z. F., Liu, L. Y., Song, W. W., Ma, W. L., Zhu, N. Z., and Li, Y. F.: Measurement and modeling the gas/particle partitioning of organochlorine pesticides (OCPs) in atmosphere at low temperatures, Sci. Total Environ, 667, 318–324, https://doi.org/10.1016/j.scitotenv.2019.02.347, 2019.
Sanlı, G. E. and Tasdemir, Y.: Seasonal variations of organochlorine pesticides (OCPs) in air samples during day and night periods in Bursa, Turkey, Atmospheric Pollution Research, 11, 2142–2153, https://doi.org/10.1016/j.apr.2020.06.010, 2020.
Scheyer, A., Morville, S., Mirabel, P., and Millet, M.: Gas/particle partitioning of lindane and current-used pesticides and their relationship with temperature in urban and rural air in Alsace region (east of France), Atmos. Environ., 42, 7695–7705, https://doi.org/10.1016/j.atmosenv.2008.05.029, 2008.
Skevas, T., Stefanou, S. E., and Oude Lansink, A.: Pesticide use, environmental spillovers and efficiency: A DEA risk-adjusted efficiency approach applied to Dutch arable farming, Eur. J. Oper. Res., 237, 658–664, https://doi.org/10.1016/j.ejor.2014.01.046, 2014
Socorro, J., Durand, A., Temime-Roussel, B., Gligorovski, S., Wortham, H., and Quivet, E.: The persistence of pesticides in atmospheric particulate phase: An emerging air quality issue, Sci. Rep., 6, 33456, https://doi.org/10.1038/srep33456, 2016.
Solano Díaz, K., Ruepert, C., Ramírez Quesada, M. M., Hoppin, J. A., Wania, F., and van Wendel de Joode, B.: Evaluation of passive air sampling for monitoring Current-Use Pesticide pollution near large-scale banana plantations in Costa Rica, Environ. Sci. Technol., 60, 3384–3393, https://doi.org/10.1021/acs.est.5c11224, 2026.
Sun, H., Chen, H., Yao, L., Chen, J. P., Zhu, Z. H., Wei, Y. Q., Ding, X., and Chen, J. M.: Sources and health risks of PM2.5-bound polychlorinated biphenyls (PCBs) and organochlorine pesticides (OCPs) in a North China rural area, J. Environ. Sci., 95, 240–247, https://doi.org/10.1016/j.jes.2020.03.051, 2020.
The Matplotlib Development Team: Matplotlib: Visualization with Python (v3.8.4), Zenodo [software], https://doi.org/10.5281/zenodo.10916799, 2024.
Tian, L. L., Li, J, Zhao, S. Z., Tang, J., Li, J., Guo, H., Liu, X., Zhong, G. C., Xu, Y., Lin, T., Lyv, X. P., Chen, D. H., Li, K. C., Shen, J., and Zhang, G.: DDT, Chlordane, and Hexachlorobenzene in the Air of the Pearl River Delta Revisited: A Tale of Source, History, and Monsoon, Environ. Sci. Technol., 55, 9740–9749, https://doi.org/10.1021/acs.est.1c01045, 2021.
Tudi, M., Li, H. R., Li, H. Y., Wang, L., Lyu, J., Yang, L. S., Tong, S. M., Yu, Q. J., Ruan, H. D., Atabila, A., Phung, D. T., Sadler, R., and Connell, D.: Exposure routes and health risks associated with pesticide application, Toxics, 10, 335, https://doi.org/10.3390/toxics10060335, 2022.
Turusov, V., Rakitsky, V., and Tomatis, L.: Dichlorodiphenyltrichloroethane (DDT): ubiquity, persistence, and risks, Environ. Health Perspect., 110, 125–128, https://doi.org/10.1289/ehp.02110125, 2002.
Van den Berg, F., Kubiak, R., Benjey, W. G., Majewski, M. S., Yates, S. R., Reeves, G. L., Smelt, J. H., and van der Linden, A. M. A.: Emission of Pesticides into the Air, Water Air Soil Pollut., 115, 195–218, https://doi.org/10.1023/A:1005234329622, 1999.
Wang, D. Q., Jia, S. M., Yang, P. F., Zhu, F. J., and Ma, W. L.: Size-resolved gas-particle partitioning of polycyclic aromatic hydrocarbons in a large temperature range of 50 °C, J. Hazard. Mater., 479, 135607, https://doi.org/10.1016/j.jhazmat.2024.135607, 2024.
Wang, S. R., Salamova, A., and Venier, M.: Occurrence, Spatial, and Seasonal Variations, and Gas–Particle Partitioning of Atmospheric Current-Use Pesticides (CUPs) in the Great Lakes Basin, Environ. Sci. Technol., 55, 3539–3548, https://doi.org/10.1021/acs.est.0c06470, 2021.
Woodrow, J. E., Gibson, K. A., and Seiber, J. N.: Pesticides and related toxicants in the atmosphere, Reviews of Environmental Contamination and Toxicology, 247, 147–196, https://doi.org/10.1007/398_2018_19, 2019.
Yu, B. G., Liu, Y. M., Chen, X. X., Cao, W. Q., Ding, T. B., and Zou, C. Q.: Foliar Zinc Application to Wheat May Lessen the Zinc Deficiency Burden in Rural Quzhou, China, Frontiers in Nutrition, 8, https://doi.org/10.3389/fnut.2021.697817, 2021.
Yusà, V., Coscollà, C., Mellouki, W., Pastor, A., and De La Guardia, M.: Sampling and analysis of pesticides in ambient air, J. Chromatogr. A, 1216, 2972–2983, https://doi.org/10.1016/j.chroma.2009.02.019, 2009.
Zhao, M. Y., Wu, J. X., Figueiredo, D. M., Zhang, Y., Zou, Z. Y., Cao, Y. X., Li, J. J., Chen, X., Shi, S. P., Wei, Z. Y., Li, J. D., Zhang, H. Y., Zhao, E. C., Geissen, V., Ritsema, C. J., Liu, X. J., Han, J. J., and Wang, K.: Spatial-temporal distribution and potential risk of pesticides in ambient air in the North China Plain, Environ. Int., 182, 108342, https://doi.org/10.1016/j.envint.2023.108342, 2023.
Zhou, Y., Guo, J. Y., Wang, Z. K., Zhang, B. Y., Sun, Z., Yun, X., and Zhang, J. B.: Levels and inhalation health risk of neonicotinoid insecticides in fine particulate matter (PM2.5) in urban and rural areas of China, Environ. Int., 142, 105822, https://doi.org/10.1016/j.envint.2020.105822, 2020.
Zhu, F. J., Ma, W. L., Liu, L. Y., Zhang, Z. F., Song, W. W., Hu, P. T., Li, W. L., Qiao, L. N., and Fan, H. Z.: Temporal trends of atmospheric PAHs: Implications for the gas-particle partition, Atmos. Environ., 261, 118595, https://doi.org/10.1016/j.atmosenv.2021.118595, 2021.