the Creative Commons Attribution 4.0 License.
the Creative Commons Attribution 4.0 License.
 | 07 Jan 2026
Uncertainty in aerosol effective radiative forcing from anthropogenic and natural aerosol parameters in ECHAM6.3-HAM2.3
Duncan Watson-Parris
Leighton A. Regayre
Hailing Jia
David Neubauer
Carl Svenhag
Nick Schutgens
Athanasios Tsikerdekis
Athanasios Nenes
Muhammed Irfan
Bastiaan van Diedenhoven
Ardit Arifi
Guangliang Fu
Otto P. Hasekamp
Interactions between aerosols, clouds, and radiation remain a major source of uncertainty in effective radiative forcing (ERF), limiting the accuracy of climate projections. This study aims to quantify parametric uncertainties in aerosol–cloud and aerosol–radiation interactions using a perturbed parameter ensemble (PPE) of 221 simulations with the ECHAM6.3-HAM2.3 climate model, varying 23 aerosol-related parameters that control emissions, removal, chemistry, and microphysics.
The resulting global mean aerosol ERF is −1.24 W m−2 (5–95 percentile: −1.56 to −0.89 W m−2). Uncertainty in ERF is dominated by sulfate-related processes, biomass burning, aerosol size, and natural emissions. For aerosol-cloud interactions, dimethyl sulfide (DMS) and biomass burning emissions are key drivers, whereas sulfate chemistry and dry deposition exert the strongest influence on aerosol-radiation interactions. Structural uncertainty is difficult to characterize, and this study focuses primarily on evaluating parametric uncertainty. The leading sources of ERF parametric uncertainty identified here are consistent with those found in other PPE studies, highlighting common sensitivities across climate models.
Comparison with POLDER-3/PARASOL satellite retrievals reveals persistent model biases in aerosol optical depth (AOD), Ångström exponent (AE), and single-scattering albedo (SSA), many of which fall within the parametric uncertainty range. Sulfate-related processes account for over 40 % of AOD uncertainty, while AE and SSA are most sensitive to DMS, sea salt, and black carbon parameters. Correlation analysis between key parameters and observables indicates that several biases may be reduced by tuning through physically consistent parameter adjustments for bias reduction. Our results highlight the need for combined efforts in parameter optimization and structural model development to improve confidence in aerosol-forcing estimates and future climate projections.
- Article
(5500 KB) - Full-text XML
-
Supplement
(5930 KB) - BibTeX
- EndNote


Atmospheric aerosols play a critical role in Earth's radiative energy balance (Forster et al., 2021; Myhre et al., 2013; Boucher et al., 2013). Aerosols directly influence the scattering (which cools) and absorption (which warms) of solar radiation (Li et al., 2022; Bellouin et al., 2020). Additionally, aerosols indirectly affect the radiative properties of clouds (Boucher et al., 2013; Haywood et al., 2021). Since the start of the industrial period, human activities have perturbed aerosol production, leading to significant changes in both the direct and indirect effects on global effective radiative forcing (ERF; Bellouin et al., 2020; Forster et al., 2021; Carslaw et al., 2013).
Anthropogenic aerosol emissions have changed the global and regional aerosols, subsequently affecting clouds, precipitation, and thermodynamic properties (Carslaw et al., 2017; Karset et al., 2018; Bollasina et al., 2011; Deng et al., 2021). Despite their importance, the magnitude and variability of these aerosol effects remain significant sources of uncertainty in climate models. This uncertainty arises from the complex interactions between emissions, atmospheric processes, and cloud microphysics (Eidhammer et al., 2024; Yoshioka et al., 2019).
Aerosol-cloud interactions (ACI) are challenging to model due to the complex and nonlinear processes that govern cloud microphysics and aerosol activation (Morrison et al., 2020). For instance, increases in cloud condensation nuclei (CCN) from anthropogenic emissions leads to a higher cloud droplet number concentration (Nd), causing brighter clouds (Twomey effect; Twomey, 1974). These changes can trigger further adjustments in clouds, such as shifts in cloud fraction and liquid water path, all of which contribute to the effective radiative forcing from aerosol-cloud interactions (ERFaci; Bellouin et al., 2020; Albrecht, 1989). Despite its crucial role in climate forcing, ERFaci remains the most uncertain component of ERF, with significant variations in its magnitude across different climate models (Zelinka et al., 2014; Gryspeerdt et al., 2020).
With an ERF uncertainty from aerosols between −0.6 to −2 W m−2, aerosols are one of the largest sources of multi-model diversity when estimating climatic changes from the pre–industrial, as reported in IPCC Assessment report-6 (AR6) (Forster et al., 2021). Reducing this uncertainty would improve climate projections (e.g. Tsigaridis et al., 2014; Watson-Parris and Smith, 2022). Aerosol ERF estimates have improved since the Intergovernmental Panel for Climate Change (IPCC) Assessment Report 5 (AR5), in part due to improved observational studies (Myhre et al., 2013; Toll et al., 2019; Hasekamp et al., 2019b; Forster et al., 2021; Bellouin et al., 2020; Gryspeerdt et al., 2019; McCoy et al., 2020).
Aerosol and cloud uncertainty in climate models is caused by (a) how subgrid-scale processes such as cloud microphysics, convection, aerosol activation, and growth are represented using parameterizations (structural uncertainty), and (b) the values assigned to parameters within these parametrizations (parametric uncertainty). These parameters are often poorly constrained by observations, particularly for processes like sea-spray emissions, dimethyl sulfide emissions, and ice nucleation, which are highly differing among climate models (Morrison et al., 2020; Venugopal et al., 2025; Bhatti et al., 2023; Bock et al., 2021; Bhatti et al., 2022; Revell et al., 2021). This parameter uncertainty is partly an effect of prescribing global mean values to regionally varying processes, partly due to differences in other model structures like surface roughness and model dynamics, and partly caused by interactions and dependencies between model parameters. As a result, climate models have significant biases to present-day observations due to structural and parametric uncertainties (Regayre et al., 2023; Bhatti et al., 2024; Mortier et al., 2020). Furthermore, reconstructing pre–industrial aerosol conditions is challenging but critical for quantifying anthropogenic forcing (Carslaw et al., 2013, 2017; Hamilton et al., 2014).
Causes of model uncertainty must be comprehensively quantified alongside observational uncertainties that constrain parameter choices to ensure their individual and combined effects on aerosol ERF are well understood (Yoshioka et al., 2019; Carslaw et al., 2013; Lee et al., 2013a, 2011; Regayre et al., 2015, 2014). Perturbed parameter ensembles (PPEs) are a powerful tool for quantifying climate model parametric uncertainties, which have been performed with other models (e.g. UKESM1 and CESM2) (Eidhammer et al., 2024; Lee et al., 2013b; Regayre et al., 2018; Lee et al., 2011). Performing PPEs with various models is important to understand how structural differences in models affect ERF and present-day aerosol sensitivities. In this paper, we construct a PPE for the ECHAM6.3-HAM2.3 climate model and use machine learning statistical techniques to emulate a set of model variants, which we use to quantify the parametric uncertainty in model aerosol ERF. For this purpose, we perturb 24 parameters across 221 simulations, known to influence aerosol- and cloud properties, emissions, and processes. We determine the relative contribution of different parameters to the ERF uncertainty through a variance-based sensitivity analysis. We also evaluate ensemble performance against satellite measurements and attribute specific causes for model uncertainty and bias.
The primary aim of this study is to quantify parametric uncertainties in ERF and observable aerosol properties in ECHAM6-HAM, and to attribute the contributions of different aerosol and cloud parameters to these uncertainties. Based on this, we identify possible shared sources of uncertainty with other aerosol PPE studies, including both natural and anthropogenic emission parameters. In Sect. 2, we describe the ECHAM6.3-HAM2.3 climate model configuration used here, and the experimental setup of our perturbed parameter ensemble. Section 3.1 quantifies ERF uncertainties and attributes their respective causes, while Sect. 3.2 compares these PPE-based uncertainties against satellite observations to evaluate model performance and bias.
2.1 ECHAM6-HAM Model Simulations
The simulations used in this work were performed by the ECHAM6.3-HAM2.3 (hereafter referred to as “ECHAM6-HAM”) global aerosol–climate model. We use the default T63 horizontal resolution (1.875° × 1.875°) and 47 vertical layers (L47). We use the nudged configuration for which vorticity, divergence, and surface pressure are nudged towards the ERA-Interim reanalysis every 6, 48, and 24 h, respectively (Tegen et al., 2019; Zhang et al., 2012).
The ECHAM6 component, developed at the Max Planck Institute for Meteorology, simulates large-scale atmospheric dynamics (Stevens et al., 2013). The HAM2 module represents various aerosol life cycle processes, including emissions, transport, deposition, and microphysical transformations (Stier et al., 2005; Zhang et al., 2012). Aerosol emissions come from both natural (sea salt, dust, and DMS) and anthropogenic (sulfate, black carbon, and organic carbon) sources, where the natural emissions are computed online, outlined in Neubauer et al. (2019), and the anthropogenic and biomass burning emissions are taken from ACCMIP (Lamarque et al., 2013).
Aerosols are categorized into seven lognormal modes based on size and solubility, following the M7 scheme (Tegen et al., 2019; Vignati et al., 2004). Briefly, these modes include four soluble (nucleation, Aitken, accumulation, and coarse) and three insoluble (Aitken, accumulation, and coarse) categories. Each mode contains one or more aerosol species such as sulfate, black carbon, organic carbon, sea salt, and dust. Aerosols undergo microphysical processes such as nucleation, coagulation, condensation, and hygroscopic growth, influencing their size distribution and interactions with clouds (Schutgens and Stier, 2014).
Cloud microphysics in ECHAM6-HAM is represented by a two-moment scheme, which prognostically computes cloud droplet and ice crystal number concentrations and mass (Lohmann and Roeckner, 1996). The stratiform cloud scheme simulates key processes such as condensation, autoconversion, accretion, evaporation, and aerosol scavenging, while ice-phase processes include heterogeneous nucleation, depositional growth, and the Wegener–Bergeron–Findeisen mechanism (Sundqvist et al., 1989; Lohmann and Roeckner, 1996; Stevens et al., 2013; Neubauer et al., 2019). Ice crystals and snowflakes are treated separately, with snow precipitating while ice crystals sediment within and outside of clouds. Convective clouds interact with stratiform clouds through detrainment processes (Lohmann and Hoose, 2009; Lohmann et al., 2008).
Additional information regarding cloud microphysics, aerosol treatments, and process interactions can be found in Neubauer et al. (2019) and Tegen et al. (2019).
2.2 Simulations and Experimental Design
To create the PPE, we performed model runs for 221 different parameter combinations for present-day and pre-industrial aerosol emissions. For the present-day simulations, we selected 2010 to align with the AEROCOM phase-III-control experiment and the availability of polarimetric aerosol retrievals from PARASOL (Hasekamp et al., 2024). For the pre-industrial calculations, we used aerosol emissions for the year 1850. All simulations were nudged to 2010 meteorology (wind fields) and used the same prescribed sea surface temperature. Each simulation underwent a 6-month spin-up phase, which was excluded from the analysis. The 221 simulations were used as input to an emulator (Sect. 2.3) to generate ensemble members that sample combinations of parameter values across the full parameter space.
To calculate the total aerosol ERF and its components due to aerosol-cloud (ERFaci) and aerosol-radiation interactions (ERFari), we computed the radiative differences between these ensembles (2010 and 1850). We partition ERF into ARI and ACI by differencing all-sky and clear-sky top-of-atmosphere fluxes, such that ERFaci equals the PD–PI change in the shortwave cloud radiative effect and ERFari equals the PD–PI change in the clear-sky net flux. See Sect. S1 for more details on the calculation of ERF and the partitioning of ARI and ACI. This diagnostic approach provides a straightforward separation between cloud-mediated and clear-sky contributions. However, it may introduce biases relative to double-radiation-call or APRP decompositions (Taylor et al., 2007), which may be implemented for future work.
For regional analysis, each region is defined as in Jia et al. (2021), as shown in Fig. S1. Finally, through a variance-based sensitivity analysis, we quantified the relative importance of each parameter globally and regionally (Saltelli et al., 2000).
2.2.1 Perturbed Parameters
Both the Present-Day and Pre–Industrial simulation sets consist of 221 members, including the control run. Table 1 lists the 23 perturbed parameters along with the minimum and maximum values of their respective ranges.
Each of the 220 ensemble members is assigned parameter values using Maximin Latin Hypercube sampling, which optimizes coverage of parameter combinations across the parameter space (Lee et al., 2013a; McKay et al., 1979). This method divides the possible range of each parameter into bins, ensuring that each sampled value falls within a unique bin. Once a value is assigned, subsequent samples cannot select from previously used bins. This approach guarantees that the full range of each parameter is explored while maintaining uniformly distributed marginal distributions. Parameter combinations are progressively selected to optimize the minimum Euclidean distance between points. Fig. S2 shows the parameter ranges and their associated frequencies. The ranges were determined by “expert elicitation” based on the parameterization used. Their probability distribution frequencies were informed by a mixture of expert elicitation and prior PPE-constrained distributions in Yoshioka et al. (2019) and Eidhammer et al. (2024) estimates. These distributions are shown in Fig. S2.
The parameters that are chosen, outlined in Table 1, span several categories that capture different aspects of aerosol-climate interactions in ECHAM6-HAM. Emission parameters (e.g., fossil fuel, biomass burning, biofuel, DMS, sea salt, dust) control the magnitude and composition of primary and precursor aerosol sources, directly affecting the aerosol burden. Size-related emission parameters (e.g., geometric mean diameters for different sources) determine the initial size distribution of emitted particles. Dry and wet deposition rates represent removal processes. Optical parameters, such as the imaginary refractive indices of black carbon and dust, affect the absorption and scattering of radiation. Chemical and microphysical processes are represented by parameters including the sulfate reaction rates, nucleation rates, and cloud water pH, which modifies the acidity of cloud droplets and thus aqueous-phase reaction rates, controlling sulfate production. Finally, hygroscopicity parameters (KAPPA_SS and KAPPA_SO4) describe aerosol water uptake used for aerosol optical calculations via kappa-Köhler theory. In ECHAM6-HAM, cloud droplet activation is computed by the Abdul-Razzak and Ghan (2000) scheme, which uses its own internal equations to determine when aerosols activate into droplets. Therefore, changing KAPPA values mainly affects optical properties (like scattering and water uptake), rather than directly influencing the cloud activation process itself.
Across all 221 training simulation members, perturbing CDNCmin is also uniformly perturbed between 1 to 40 cm−3. After training the GP emulator to provide some insight into the model sensitivity to structural uncertainties, we set the CDNCmin parameter to the fixed sampling value of 40 cm−3, the default value in ECHAM6-HAM recommended by Neubauer et al. (2019), to quantify aerosol ERF uncertainty and the relative importance of the 23 parameters in Table 1. In some instances, where explicitly stated (Sect. 3.1.2), we also perturb CDNCmin, the minimum threshold for model cloud droplet concentrations, across 3 million model emulator-derived variants to highlight some of the structural and parametric uncertainties associated with clouds in ECHAM6-HAM. So, in Sect. 3.1.2 CDNCmin can be considered our 24th parameter, though we do not include it in Table 1 because its treatment is distinct from other parameters.
(Long et al., 2011; Sofiev et al., 2011)(Stier et al., 2005)(Croft et al., 2009, 2010)(Croft et al., 2009, 2010)(Feichter et al., 1996)(aging; Vignati et al., 2004)Table 1Table describing perturbed parameters used in this study, excluding the CDNCmin parameter. Control represents the value that is used for the control run. For the majority of parameters, a scaling factor compared to the control run values is applied, except the parameters indicated by 'Abs”, where the actual parameter values are indicated.

With 221 ensemble members and 23, or 24, perturbed parameters, our PPE has a simulation-to-parameter ratio of around 10, which is much larger than recent PPE studies (Regayre et al., 2018 and Eidhammer et al., 2024 both use a ratio of 6). We cautiously use a high ratio of simulations to parameters to increase the density of parameter combinations in the parameter space, thereby enhancing the skill of Gaussian Process emulators (see Sect. 2.3).
2.3 Gaussian Process Emulator
We use the Gaussian Process (GP) emulator from Earth System Emulator package (ESEm; Watson-Parris et al., 2021a). GP was chosen through its recommendation by Eidhammer et al. (2024) and other PPE studies (e.g. Yoshioka et al., 2019). GP emulator is a powerful statistical model used here to emulate climate model outputs to sample the parameter space properly, needed for robust uncertainty quantification. Using climate model outputs to emulate model variants can be generated quickly and efficiently, reducing the need for extensive CPU hours and storage. We use GP emulators to create model variants across the 24-dimensional parameter space, all bounded by their minimum and maximum limits. In this study, emulators are applied to produce annual mean data for each model grid cell (when comparing to observations, only taking into account co-located data in space and time). Thus, we evaluate model uncertainty in aerosol ERF and its components across our model variants at each of around 96 × 192 model grid cells. 3 million model variants are obtained for ERF calculations, and 200 000 model variants are created for all other analyses. These sets of model variants are large enough to enable us to use variance-based sensitivity analyses to quantify the parametric causes of variance of each component (Lee et al., 2011).
The uncertainties reported here are derived from the standard deviation and 5 %–95 % credible range across these model variants.
2.4 Observational Datasets
This study uses aerosol retrievals from the POLDER-3 instrument (Deschamps et al., 1994; Fougnie et al., 2007) aboard the PARASOL (Polarization and Anisotropy of Reflectances for Atmospheric Science coupled with Observations from a Lidar) satellite for 2010. POLDER-3 was the only Multi-Angle Polarimeter (MAP) instrument in space between 2005 and 2013, providing multi-year in-orbit multispectral and multiangle photopolarimetric measurements of intensity and polarization. Each native ground pixel (6 km × 6 km) is measured under up to 16 viewing angles and at 6 wavelengths (443, 490, 565, 670, 865, 1020 nm). Cloud screening has been performed using a neural network cloud fraction approach (Yuan et al., 2024).
The aerosol products derived from POLDER-3 measurements were retrieved by the Remote sensing of Trace gas and Aerosol Products (RemoTAP) algorithm (Hasekamp et al., 2024; Fu et al., 2025; Lu et al., 2022). While earlier aerosol retrieval studies with RemoTAP used a bi‐modal aerosol description (Hasekamp et al., 2011) or a five‐mode aerosol description (Fu et al., 2020; Fu and Hasekamp, 2018), the latest baseline in RemoTAP follows Lu et al. (2022), describing the aerosol size distribution by three log‐normal modes, made up of one fine mode and two coarse modes (insoluble and soluble). The RemoTAP explicitly retrieves the aerosol layer height and the aerosol microphysical properties of effective radius, effective variance, column number, spherical fraction, the fractions of chemical component refractive index (real part of fine mode inorganic aerosol; imaginary part of fine mode black carbon and brown carbon; imaginary part of coarse mode dust; coarse mode hydrated sea salt). Based on the retrieved aerosol microphysical properties, the aerosol optical properties of multispectral AOD, SSA, and Ångström Exponent are calculated using the Mie-T matrix-improved geometrical optics model (Dubovik et al., 2006) along with their proposed spheroid aspect ratio distribution for computing optical properties for a mixture of spheroids and spheres. Several studies have demonstrated RemoTAP delivers accurate aerosol properties from MAP instruments (Hasekamp et al., 2024; Fu and Hasekamp, 2018; Fu et al., 2025; Schutgens et al., 2021).
The data products used for evaluation are the Aerosol Optical Depth (AOD at 550 nm), Ångström Exponent (AE at 550–865 nm), and Single-Scattering Albedo (SSA at 550 nm). The dataset is aggregated on a 1° × 1° grid, which is publicly available from https://public.spider.surfsara.nl/project/spexone/others/PARASOL/DATA/POLDER_1.0x1.0_basedon0.1_NPge2/ (last access: February 2025). The AE and SSA retrieved for model comparison are filtered only including cases where AOD is greater than 0.20, to exclude measurement errors (Hasekamp et al., 2024).
3-hourly model outputs were used for comparison with satellite data. To effectively compare our model with the measurements, we co-locate the model with observations by picking the nearest grid cell for the model time closest to the satellite overpass. This will strongly mitigate temporal representation uncertainty, although the spatial representation uncertainty will still be present (Schutgens et al., 2016). Spatial uncertainties from POLDER are discussed in Sect. 3.2.
3.1 Uncertainty in effective radiative forcing
Figure 1 shows the global 1850–2010 aerosol ERF, ERFaci, and ERFari probability density functions for our ECHAM6-HAM PPE. The emulated ERF has a mean of −1.24 W m−2 with a 5–95 percentile credible range between −1.59 to −0.89 W m−2, representing an uncertainty range of 78 % with respect to the mean ERF (Fig. 1a). ERFaci has a mean of −1 W m−2 (−1.30 to −0.73 W m−2 5–95 percentile range; Fig. 1b). ERFari averages −0.27 W m−2, with a 5–95 percentile range between −0.48 and −0.09 W m−2 (Fig. 1c). Climate model PPE studies, (ECHAM6-HAM, CESM2-CAM6, HadGEM-UKCA; Yoshioka et al., 2019; Regayre et al., 2023; Eidhammer et al., 2024) and machine learning approaches (Albright et al., 2021; Smith et al., 2021) all sample different uncertainties based on their structural code base and the perturbations applied. For example, Regayre et al. (2018, 2023) sampled uncertainty in physical atmosphere model parameters in addition to aerosol parameters, so they have a wider range of aerosol ERF values than other approaches. Aerosol ERF in each study has a central tendency determined by the models that are used to create them, and the structural choices within these models. Summaries that additionally account for observational data uncertainties (e.g. IPCC, Forster et al., 2021; Bellouin et al., 2020) yield the largest ERF uncertainty. Aerosol ERF uncertainty is relatively low in the ECHAM6-HAM PPE, and falls fully within the Intergovernmental Panel on Climate Change’s Sixth Assessment Report (AR6) range of −2 to −0.6 W m−2 (Forster et al., 2021), shown in Fig. 1a. The relatively low uncertainty range may be caused by several factors, including (a) our PPE only includes parametric uncertainty related to aerosol emissions, properties, and processes and excludes parameters relevant for droplet activation (e.g. updraft) (b) aerosol ERF may be less responsive to aerosol perturbations within ECHAM6-HAM than other models and more dependent on cloud and radiation properties, or (c) there may be some cancellation of positive and negative regional responses to parameter perturbations in global mean aerosol ERF calculations that suppress the uncertainty, as demonstrated by Regayre et al. (2015).
.
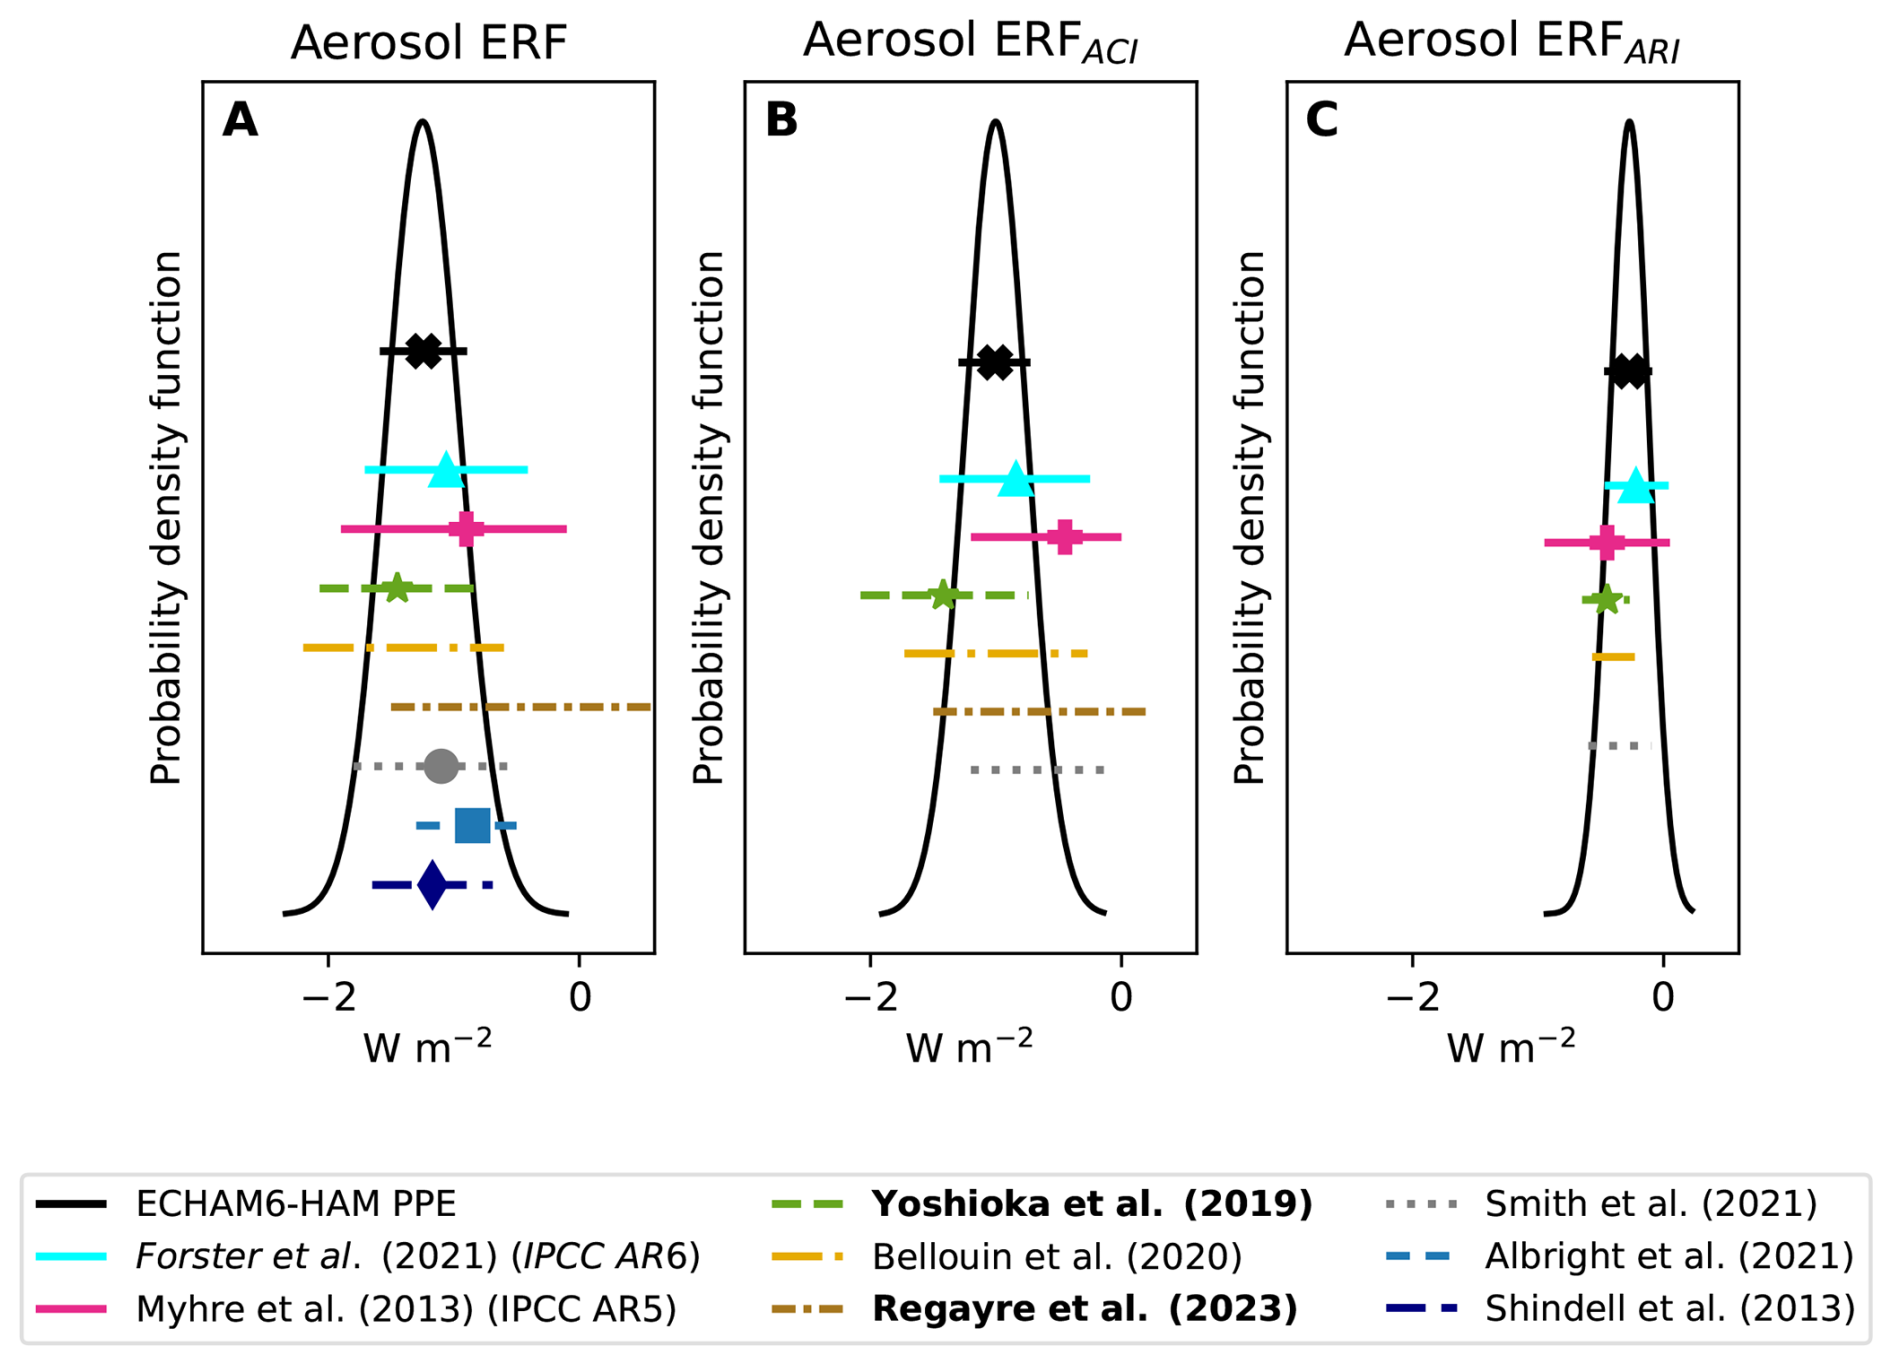
Figure 1Global annual mean probability density functions between 1850 to 2010 of (a) effective radiative forcing (ERF), (b) ERFaci, (c) ERFari from perturbing aerosol parameters. 3 million model emulator-derived variants are used. Our 90 % credible range is shown by the black line with the “X” marker presenting the median. Other estimations shown are using 90 % credible ranges, with their marker representing their respective medians (Myhre et al., 2013; Yoshioka et al., 2019; Bellouin et al., 2020; Regayre et al., 2018; Smith et al., 2021; Albright et al., 2021; Forster et al., 2021). The two perturbed parameter ensemble papers, key motivators here, are highlighted in bold. For Shindell et al. (2013), the 5th to 95th percentile values are calculated as multimodel mean plus and minus standard deviation times 1.645.
Figure 2 presents the global distributions of ERF, ERFaci, and ERFari, along with their associated uncertainties. Our results show broad agreement in magnitude and spatial patterns of ERF and ERFaci with previous HadGEM-UKCA PPE studies (Yoshioka et al., 2019; Regayre et al., 2018, 2023), which employed relatively similar parameter perturbations for aerosol. However, those studies also perturbed cloud activation parameters, which may contribute to the differences. As shown in Fig. 2b and d, the largest uncertainties in ERF correspond to regions with strong ERFaci signals. A notable distinction is that ECHAM6-HAM produces a stronger (more negative) ERF over land, whereas in HadGEM (Regayre et al., 2018), UKESM PPE (Regayre et al., 2023), and ACCMIP (Shindell et al., 2013, Fig. 18), the strongest ERF occurs over marine regions dominated by persistent stratocumulus clouds. This divergence is attributable to structural characteristics of ECHAM6-HAM. In particular, differences in sea salt emissions and aerosol water uptake and underestimated stratocumulus cloud cover all contribute to a weaker ERF over oceans compared to the other studies (Neubauer et al., 2019). Neubauer et al. (2019) showed a negative bias in shortwave (SW) radiation and net cloud radiative effects for ECHAM6-HAM, stemming from a pronounced negative stratocumulus bias over marine areas, particularly in the Pacific, which cannot be easily adjusted. Additionally, the stronger land-based ERF arises from enhanced aerosol water uptake, differences in activation scheme sensitivity, and autoconversion rates, all of which intensify cloud albedo and contribute to a stronger cooling effect over continental regions.
Regions of high anthropogenic activity since the pre-industrial era, such as Europe, Asia, and America, exhibit the strongest (most negative) ERF (Fig. 2a), as expected. In Europe, the PPE mean ERF is −3.96 W m−2, primarily driven by ACI due to a high anthropogenic sulfur emission, with minor ARI contributions. Notably, the uncertainty in the ERF over Europe is at 0.68 W m−2 (a 5–95 percentile range of 39 %). Asia also shows a substantial ERF, over −4 W m−2 on average, largely due to ACI in China, which alone averages over −9 W m−2. Furthermore, ARI has a significant contribution to the total ERF over China as well. The ERF uncertainty over Asia has an uncertainty of 110 %. Additionally, other regions characterized by high ERF values and significant uncertainty can be found in South America and Africa near industrialized anthropogenic and biomass burning emission sources (Fig. 2). Section 3.1.1 and 3.2 provide a more detailed examination of the factors contributing to these uncertainties.
The North Pacific Ocean exhibits the strongest regional mean ERF among ocean basins, at −5.8 W m−2, accompanied by a significant parametric uncertainty of 0.58 W m−2 (with a 5–95 percentile range of 147 %). The remaining ERFaci biases in ECHAM6-HAM in that region, which are not explained by parametric uncertainties (and hence are attributed to structural deficiencies), have an amplitude of approximately 4 W m−2 over the regions of persistent stratocumulus clouds (Neubauer et al., 2019). This bias differs somewhat from the models analyzed in Regayre et al. (2018); Smith et al. (2020) and Shindell et al. (2013). High-latitude marine regions demonstrate considerable parametric uncertainty in the ERF due to aerosol-cloud interactions, while tropical marine regions show comparatively smaller parametric uncertainties (Fig. 2d). The smaller uncertainties in the marine tropics could be partly attributed to either (a) the convective parameterization, which may hide part of the ERF uncertainty (Neubauer et al., 2019), or (b) the relatively small PI-PD aerosol change in this region. Southern Asia and the eastern Pacific exhibit high ERF values that are consistent with the projections of CMIP6 models. Smith et al. (2020) suggests those heightened ERF values are primarily driven by negative changes in cloud cover in the respective CMIP6 models. Although the structural cloud bias in ECHAM6-HAM reduces the extent of negative cloud cover change (Neubauer et al., 2019), thereby mitigating the ERF in our model compared to other PPEs, such as HadGEM (Regayre et al., 2018).

Figure 2Annual emulated mean (a) ERF, (c) ERFaci, (e) ERFari and 2 * standard deviation (2σ) (b) ERF, (d) ERFaci, (f) ERFari. 3 million model variants are used to calculate the mean and standard deviation.
The ERFari in the PPE of Yoshioka et al. (2019) has a 5 %–95 % percentile range of −0.16 to 0.11 W m−2, and hence our PPE shows a more negative ERFari with a larger uncertainty (5–95 percentile range between −0.48 and −0.09 W m−2 ). However, as noted by Mulcahy et al. (2020), the HadGEM and UKESM1 models have structural issues that may explain the differences from our ERFari estimates. For example, the UKESM1 has an underestimated black carbon mass contributing, which can partly contribute to these differences (Mulcahy et al., 2020). The PPE ERFari uncertainty range estimate here is within the AR6 range from Forster et al. (2021). The latest IPCC AR6 report indicates a very low likelihood of a positive ERFari. Our uncertainty range for the ERFari aligns closely with IPCC AR6.
3.1.1 Parametric Uncertainties in Aerosol ERF
It is important to evaluate the causes of aerosol ERF uncertainty at the global mean and regional scales. Figure 3 shows regional parameter contributions to the ERF uncertainty (Fig. 3a), ACI (Fig. 3b), and ARI (Fig. 3c). Additionally, Table 2 presents the percentage contribution of each parameter to the global ERF uncertainty depicted in Fig. 3a.
Among the top ten parameters contributing to ERF uncertainty, five are related to sulfate and two from biomass burning. The sources of uncertainty in aerosol ERF identified here, surprisingly, due to large differences in model choices, overlap closely with causes found in Yoshioka et al. (2019), Regayre et al. (2018), and Regayre et al. (2023). For example, natural aerosol emissions contribute significantly to both aerosol ERF and ERFaci uncertainty. The parameters of global importance are mostly consistent with Yoshioka et al. (2019), in that EMI_ANTH_SO2, EMI_DMS, and EMI_CMR_BB are all in the top 5 contributing parameters to ERF uncertainty. We find that ERF uncertainty (Fig. 3a) is largely determined by ACI uncertainty (Fig. 3b), with a few contributions from ARI (Fig. 3c). We also find that there are large regional variations in causes of uncertainty, similar to Regayre et al. (2014), such as EMI_BB, EMI_DMS, and EMI_FF, with these parameters contributing largely to global uncertainty as in Regayre et al. (2018). While we do not consider perturbation of cloud parameters, much of the HadGEM aerosol contributions to ERF uncertainty are consistent with our study. The considerable overlap in key causes of ERF uncertainty is surprising, as different models have large structural differences that distinctly affect the distribution of clouds and moisture. This presents strong motivation for a future multi-model PPE using similar parameters to better understand the structural uncertainties between more models with distinctly different model structures.
There are differences in the magnitude of ERF uncertainties between ECHAM6-HAM and HadGEM (Regayre et al., 2018) linked to natural aerosol parameters, such as sea salt emissions (Fig. 3a). These different sensitivities likely arise from the considerable structural differences between the two models. For instance, HadGEM uses the Gong (2003) parameterization, which lacks a sea temperature dependence. In contrast, ECHAM6-HAM uses the Long et al. (2011) parameterization, with a sea surface temperature dependence from Sofiev et al. (2011). This structural difference can produce very large differences in the spatial distribution of sea salt emission and therefore aerosol, as shown in Venugopal et al. (2025).
Most often, parameters that cause global mean uncertainty produce some levels of uncertainty across most regions. For example, EMI_CMR_BB produces a global ERF uncertainty of 13 % but varies region-to-region from 22 % to 4 %, which is consistent with Regayre et al. (2018). The largest contribution to the global ERF parametric uncertainty in ECHAM6-HAM comes from the fossil fuel emission parameter (EMI_FF), which accounts for 19 % (Table 2 and Fig. 3a) of the ERF uncertainty, and anthropogenic sulfate emissions (15 %). Other significant sources of uncertainty to ERF include emissions of carbonaceous materials by biomass burning (EMI_BB; 11 %; refer to Table 2) and the size of emitted biomass burning particles (EMI_CMR_BB, 13 %). In total, sulfate-related parameters (EMI_FF, SO2Reactions, EMI_ANTH_SO2, EMI_DMS, SO4_COATING, KAPPA_SO4, EMI_CMR_FF) contribute 57 % to the aerosol ERF uncertainty (Fig. 3a), whereas biomass burning related parameters (EMI_CMR_BB, EMI_BB, BC_RAD_NI) make up 27.5 % of the aerosol ERF uncertainty (Fig. 3a). Europe is particularly sensitive to sulfate parameters, which are the primary contributors to ERF uncertainty in this region (73 %; Figures 3a). These findings align with the conclusions of Thornhill et al. (2021), which highlight the substantial impact of SO2 emissions on the global ERF. Here, we also highlight the great importance of capturing sulfate parameters, including the sulfur chemistry cycle. Regayre et al. (2015) suggests that due to the relatively short lifespan of aerosols in the troposphere, the influence of aerosol parameters on uncertainties in aerosol radiative forcing is strongly regional.
Biomass burning contributes to a significant proportion of emissions in Africa, South America, and Australia (van Marle et al., 2017; Li et al., 2024) (Fig. 3). Over Africa, 50 % of the ERF uncertainty comes from biomass burning parameters, mostly from ACI (Fig. 3b). For the ARI uncertainty over Africa, 23 % is from the imaginary refractive index of black carbon (Fig. 3c). Although Tropical and South Atlantic Oceans have no biomass burning sources, they have a substantial contribution of biomass burning to the uncertainty in ERF (35 % and 25 %, respectively) related to outflow from (primarily) Africa (Fig. 3a and Fig. 2a). The regional dependence of ERF on these carbonaceous aerosol parameters is consistent with the findings of Regayre et al. (2018).
Natural aerosol emissions (EMI_DMS (10 %), EMI_SS (6 %), and EMI_CMR_BB (13 %)) are an important source of ERF uncertainty to ECHAM6-HAM. They contribute over 29 % to the total aerosol ERF uncertainty and cause even greater uncertainties to the ERFaci (36 %, Fig. 3b). The importance of these emission parameters to the ECHAM6-HAM ERF aligns with Carslaw et al. (2013), Regayre et al. (2018), and Regayre et al. (2023), though DMS causes more aerosol ERF uncertainty than sea salt in our PPE. The contribution of dust emissions to ERF uncertainty is minimal. This finding aligns with Thornhill et al. (2021), who also concluded that dust has a limited impact on ERF.

Figure 3200 000 model variants and their respective contribution of uncertainties from individual parameters in (a) ERF, (b) ERFaci, (c) ERFari. Only parameters causing at least 5 % of the total uncertainty are shown. No hatches represent parameters perturbing aerosol emissions. Diagonal hatching represents microphysics parameters, crossed hatches represent chemistry perturbing parameters, and horizontal hatches show the emitted diameter-sized parameters.
3.1.2 CDNC minimum as an example of Structural Uncertainty
Uncertainties shown in Figs. 2c and d include only parametric uncertainties and exclude structural model uncertainties. Structural limitations, such as missing or oversimplified aerosol-cloud processes, can introduce persistent biases and significantly alter simulated ERF (Regayre et al., 2023). One example is the minimum cloud droplet number concentration (CDNCmin=40 cm−3) used in ECHAM6-HAM to maintain a realistic top-of-atmosphere energy balance (Lohmann and Neubauer, 2018; Neubauer et al., 2019). The need for such a relatively large CDNCmin suggests that it compensates for structural deficiencies or missing processes in the model. Several mechanisms may explain the use of this large value for CDNCmin: (1) smaller CDNC concentrations were observed mostly in much smaller pockets of cloud or regions than the grid box (Terai et al., 2014; Wood et al., 2018). (2) The treatment of secondary organic aerosol is simplistic and may underestimate the organic aerosol concentration, in addition to a lack of representation of nitrate aerosol (Zhang et al., 2012). (3) The use of CDNCmin can cause a biased representation of liquid water pathway, stronger cloud phase feedback, and the entrainment rate for shallow convection (Lohmann and Neubauer, 2018; Neubauer et al., 2019). (4) There may be structural uncertainties in ice crystal nucleation in cirrus clouds or the stratocumulus cloud cover that can be tuned through CDNCmin (Neubauer et al., 2019). Together, these processes demonstrate how structural simplifications in cloud microphysics and subgrid dynamics can influence ERF estimates beyond the range captured by parameter perturbations alone (Neubauer et al., 2019).
If we treat CDNCmin as an uncertain parameter with a range between 1–40 cm−3, the mean ERF shifts more negative (strengthens by 29 %) and aerosol ERF uncertainty grows to between −2.22 to −1.08 W m−2. The reason for this shift is that all values of CDNCmin are lower than the default value of 40 cm−3. Hence, the enhanced effects of increased aerosol on CDNC, from anthropogenic emissions since the Pre-Industrial, will be larger in the present day as the baseline CDNC of 40 cm−3 will be less sensitive to anthropogenic aerosol than when CDNC is below 40 cm−3 (e.g. Hoose et al., 2009). So, the control ECHAM6-HAM ERF is kept artificially weaker by using the CDNCmin as a compensating adjustment for structural model inadequacies (Neubauer et al., 2019; Hoose et al., 2009; Zhang et al., 2012; Lohmann and Neubauer, 2018). The individual parameter contributions to ERF when CDNCmin is included in the variance-based sensitivity analysis are shown in Fig. S3.
For a future PPE, including a perturbation of parameters in the activation and cloud activation schemes, we propose to impose no (or a very small) limit on CDNCmin and constrain the PPE with observations of both CDNC and aerosol parameters (including proxy for CCN), to achieve observationally constrained aerosol ERF that may overcome the need to adjust for structural model features. We expect this future work will constrain natural emission parameters towards higher values, leading in-turn to a smaller PI-PD increase in CDNC and weaker aerosol ERF, in line with Regayre et al. (2023).
Table 2Percentage contribution to global annual mean ERF uncertainty by individual parameters over 200 000 model variants.

3.2 Comparison to observations and causes of present-day uncertainty and bias
The emulated PPE is co-located in time and space with the PARASOL satellite measurements, using 3-hourly means to mitigate spatial and temporal sampling bias (Schutgens et al., 2016). When directly comparing our PPE with the RemoTAP aerosol retrievals from the PARASOL satellite (Hasekamp et al., 2024), ECHAM6-HAM generally underestimates AOD (Fig. 4a), overestimates AE (Fig. 4b), and only slightly underestimates SSA (Fig. 4c). This suggests that the aerosols produced in ECHAM6-HAM are too few, too small, and slightly too scattering. Although the bias in scattering and absorption of aerosols varies significantly over different regions (Fig. 4c). Quantifying parametric uncertainties from the PPE may help identify parameters to mitigate this aerosol model bias. For example, Fig. 5 shows the high contribution of natural aerosol emissions to global uncertainties of AOD, AE, and SSA, which will be discussed further in Sect. 3.2.1–3.2.3. The PPE means, bias, and uncertainties for AOD, AE, and SSA are shown in Figs. 6, 7, 8. If a region of the model is biased but still within the uncertainty range, constraining parameters could be used to reduce the bias, as in (Regayre et al., 2023).
It is important to note that the POLDER data from the Arctic and Antarctic regions are biased and excluded from this comparison (Hasekamp et al., 2024). The uncertainties from POLDER are presented in the relevant sections when compared to the PPE, from Hasekamp et al. (2024). For this comparison, the model PPE has been co-located in space and time with the POLDER satellite observations. For more detail, Figures S4, S5, and S6 in the Supplementary Information show global maps with the contribution of each parameter to the model uncertainty in AOD, AE, and SSA, respectively.

Figure 4Regional direct comparison between the mean (a) Aerosol Optical Depth, (b) Ångström, and (c) Single Scattering Albedo observation from POLDER (red dot) with the box and whisker distribution from the PPE. The rectangular box represents the interquartile range (IQR; Q1 25th to 75th percentile of the PPE distribution), with the red vertical line representing the median of the PPE. The whiskers are defined by Q1 − 1.5 × IQR and Q3 + 1.5 × IQR. Ensemble members outside this defined statistical range (statistical outliers) are represented by black circles. Uncertainties from POLDER over land for (a) AOD is ±0.04, (b) AE is ±0.4, and (c) SSA is ±0.03. The uncertainties from POLDER over the ocean for (a) AOD is ±0.03, (b) AE is ±0.25, and (c) SSA is ±0.03. POLDER values taken over Antarctica, Antarctic Ocean, Arctic Land, Arctic Ocean are not considered in this work.

Figure 5200 000 model variants and their respective contribution of uncertainties from individual parameters in present-day (a) AOD, (b) AE, (c) SSA. Only parameters above 5 % are shown. No hatches represent parameters perturbing aerosol emissions. Diagonal hatching represents microphysics parameters, crossed hatches represent chemistry perturbing parameters, and horizontal hatches show the emitted diameter-sized parameters.
3.2.1 Present-day AOD
The PPE mean co-located global average AOD is 0.12 (Figs. 6b and 4a). The PPE has a 5 %–95 % percentile range between 0.09 and 0.16, whereas the POLDER mean of 0.15 (±0.04 over land; ±0.03 over ocean; Hasekamp et al., 2024) is close to the high end of the PPE range (see Figs. 6a and 4a). Global averages of AOD in the PPE are underestimated compared to observations (Figs. 6d and 4a). The largest statistical differences between the model and observations are primarily found over land, where the model tends to underestimate AOD (Fig. 6b). The few regions of positive bias over land are found over China and Northern Africa. Over the ocean, there are more regions with positive AOD bias (Fig. 6b), but at higher latitude oceans, there is a significant negative bias (Fig. 6b). Regions with high absolute AOD uncertainty correspond to areas with significant differences between the model and observational data, as shown in Fig. 6d. Some regions, such as central and northern Africa, and Southeast Asia, have a larger parametric uncertainty (Fig. 6d) than model bias (caused by combined structural and parametric uncertainties). This magnitude difference suggests it may be possible to constrain some of the model bias shown in Fig. 6b through parametric tuning. This observation is consistent with comparisons to MODIS AOD (Fig. S7).
Differences between the model and observations in Fig. 6b are most negative over Africa, India, and North America, which are major dust sources. Additionally, AOD over China/East Asia is positively biased in ECHAM6-HAM (Fig. 6b). Generally, marine regions have larger AOD values in the PPE than in observations, except the Southern Ocean, which is negatively biased.
Dust is a major source of uncertainty in our PPE, as shown in Fig. 5a. Dust is a known bias for larger aerosol particles in the ECHAM6-HAM model (Tegen et al., 2019). The uncertainty in Africa primarily arises from dust and biomass burning emissions (EMI_DUST and EMI_BB), as illustrated in Fig. 5a. Notably, the bias observed over Africa (Fig. 6b) is greater than the uncertainty indicated by our PPE (Fig. 6d). To address this bias, we would need to consider additional parameters, such as dust size, which are not included in this analysis.
Over East Asia, there is a positive bias in AOD (Fig. 6b), consistent with findings by Salzmann et al. (2022). This bias is attributed to a diverse range of aerosol species from anthropogenic sources, with sulfate parameters being the primary contributors (Yang et al., 2024). The substantial uncertainty in our PPE over China (Fig. 6d) may offset this bias, as the AOD uncertainty is comparable in magnitude to the bias. This uncertainty is mainly due to sulfate-related parameters, including EMI_ANTH_SO2, Kappa_SO4, SO2Reactions, EMI_FF, and DRYDEP_ACC (see Figs. 4 and 5a). The bias in this region has been previously identified by Tsikerdekis et al. (2023). Over this region, increasing the scale factors for SO2Reactions and KAPPA_SO4 enhances AOD uncertainty (Figs. 5a and S4) through increasing sulfate hygroscopicity and lifetime, exacerbating existing model overestimates in hydrophilic aerosol growth (Tsikerdekis et al., 2023). These parameters probably can compensate to some extent for the relative humidity bias found by Tsikerdekis et al. (2023) in structural uncertainty.
Oceanic regions that have high AOD uncertainty coincide with regions of positive AOD bias and are shown in Fig. 6c. Salzmann et al. (2022) attributes this bias to the lack of shallow convective clouds precipitating in ECHAM6-HAM, therefore resulting in a lack of wet removal of hydrophilic aerosol by these clouds, which are frequent in these regions. Our PPE also identifies this bias through parametric uncertainties (Fig. 6d), presenting a possibility which may compensate for this structural inadequacy related to the convective scheme (Salzmann et al., 2022). Additionally, Tsikerdekis et al. (2023) identified that the regions of heightened relative humidity bias coincide with the oceanic regions in our PPE that are both positively biased (Fig. 6c) and have notably large AOD uncertainty (Fig. 6e). As a result, excess modeled relative humidity enhances hygroscopic aerosol growth, increasing AOD without the important convective removal mechanism. Our PPE suggests that this growth primarily comes from sea salt aerosols, as shown in Fig. S4. Interestingly, these regions of high absolute uncertainty are not as prominent in the relative uncertainty field (Fig. 6e). This suggests that absolute uncertainty is more sensitive to the magnitude of AOD itself, whereas relative uncertainty highlights regions where uncertainty is large relative to AOD. This distinction indicates that different processes may control absolute and relative uncertainty, particularly over low AOD regions such as the Southern Ocean, emphasizing the need to assess both metrics when evaluating model uncertainty and observational constraints.

Figure 6Global annual mean Aerosol Optical Depth (AOD 550 nm) for (a) POLDER retrievals, (c) PPE (co-located in space/time at 3-hourly intervals), and (b) the difference between the co-located PPE and POLDER (panel c minus panel a). The spatial magnitude of parametric uncertainty is shown as (d) PPE absolute uncertainty (2σ across the ensemble members), and (e) PPE relative uncertainty (absolute uncertainty (panel d) divided by PPE mean (panel c) multiplied by 100). Stippling indicates where the difference is not statistically significant at the 95 % level of confidence student's t-test.
Figyre 5a shows that sea salt and DMS emissions cause the highest uncertainties in AOD (37 %). This is partly because sea salt and DMS emissions have much wider areas to emit and thus contribute to AOD uncertainty over most regions (Fig. S4). The parameters that control much of the AOD uncertainty over land (Asia and Europe) mostly are from anthropogenic activities (Fig. 3a). Depositional parameters, such as WETDEP_IC and DRYDEP_ACC, have a globally uniform contribution to the uncertainty (of around 11 % and 8 %, respectively) across all regions.
Figures 6c and 4 show a slightly lower emulated AOD than that observed over the Southern Ocean. The relative AOD uncertainty over the Southern Ocean is higher than any other region (Fig. 6e). The high relative importance of sea spray and DMS emissions aligns with Yoshioka et al. (2019) and Carslaw et al. (2013), which highlight the substantial uncertainty associated with natural aerosol emissions, also present spatially in the ECHAM6-HAM model. Excluding Antarctica, the relative uncertainty in AOD over the Southern Ocean is 33 %, higher than the global average of 23 %. Sea spray and DMS emissions cause around 45 % of the Southern Ocean AOD uncertainty.
Overall, our results reveal that present-day AOD (Fig. 5a) and ERF (Fig. 3a) have three common sources of uncertainty in the top seven uncertainties (EMI_DMS, EMI_SS, SO2Reactions). This is consistent with the work of Regayre et al. (2018), which suggests that although both AOD and aerosol forcing have some influence from common aerosol properties, their main sources of variability differ due to distinct processes, as found in Lee et al. (2016). For example, sea salt emissions cause significant perturbation to AOD uncertainty, whereas sea salt emissions only perturb ERF uncertainty by 6 %. Conversely, biomass burning-related parameters cause substantial perturbation to the ERF uncertainty (Fig. 3), but not so for AOD uncertainty (Fig. 5). Thus, observational constraints to match present-day AOD will not guarantee constraints on all parameters relevant to ERFaci.
3.2.2 Present-day Ångström Exponent
The global Ångström Exponent (AE) from the ECHAM6-HAM PPE exhibits an overestimation relative to PARASOL observations, particularly over oceanic regions and high latitudes (Figs. 7b and 4b). This suggests that particle sizes in the ECHAM6-HAM model are too small relative to observations. The model particularly underestimates AE over dust emissions in Northern Africa and over parts of East China, although it should be noted that POLDER AE has a positive bias over Dust regions (Hasekamp et al., 2024). Strong positive AE bias is found over the Southern Ocean, the Americas, and large parts of Asia and Australia.
Uncertainty attribution in Fig. 5b reveals that key parameters controlling AE uncertainty globally are mostly EMI_DMS, EMI_SS, SO2Reactions, and NUC_FT. Some parameters, such as SO2Reactions, NUC_FT and EMI_BF contribute almost uniformly to AE uncertainty in all regions. These drivers contrast with AOD uncertainty (Fig. 5a), which is primarily linked to perturbations in aerosol mass emissions, highlighting the distinct sensitivity of AE to processes affecting particle size and mixing state.
Regions with the largest AE biases, such as high latitudes, coincide with high parametric AE uncertainty (Fig. 7d). Over the regions of AE uncertainty larger than 0.1 (Fig. 7c), SO2Reactions, SO4_Coating, EMI_DMS, and EMI_SS collectively account for almost 50 % of the uncertainty (Fig. 5b). The dominance of sulfate-related parameters underscores the critical role of aerosol aging and growth related processes in modulating size distributions. Over land, SO4_Coating, EMI_DUST, and SO2Reactions drive uncertainty, whereas oceanic regions are influenced most by sea salt emissions (EMI_SS) and DMS oxidation pathways (SO2Reactions and EMI_DMS) (Figs. 5b; S5).

Figure 7As in Fig. 6, but showing Ångström Exponent. Global annual mean Ångström Exponent for (a) POLDER instrument measurement, (c) PPE (co-located in space/time at 3-hourly intervals), and (b) the difference between the co-located PPE and POLDER (panel c minus panel a). The spatial magnitude of parametric uncertainty is shown as (d) PPE absolute uncertainty (2σ across the ensemble members). Stippling indicates where the difference is not statistically significant at the (95 % level of confidence, Student's t-test).
Particle aging (SO4_Coating) has a particularly large regional impact on AE uncertainty (Fig. 5b) as sulfate coatings modify particle hygroscopic growth. Sulfate coatings (SO4_Coating) enhance particle hygroscopicity, accelerating water uptake and growth of fine-mode aerosols, which systematically reduces AE in regions like the Southern Ocean, and thus increases its parametric uncertainty (Fig. 5b). The overlap of SO2Reactions in both AOD and AE uncertainties (Fig. 5) highlights the important role of sulfate in both mass and size regulation. SO2Reactions and EMI_SS influence the mixing state and hygroscopic growth of aerosol processes, which are critical for determining the aerosol optical properties. Tegen et al. (2019) and Salzmann et al. (2022) emphasize that the underrepresentation of coarse-mode particles, especially sea salt, can lead to substantial overestimations of AE, which is present in the comparison with the PARASOL AE (Fig. 7b).
The interplay between model biases (Fig. 7b) and parametric uncertainty (Fig. 7d) is amplified in the Southern Ocean, due to the lack of coarse model sea salt particles, which are strongly present over the Southern Ocean (Venugopal et al., 2025). A pronounced positive AE bias (Fig. 7b) aligns with an underestimation of coarse-mode sea salt aerosols. This corresponds to a lower AOD (Fig. 6c), suggesting that an increase in aerosol size may influence AE and AOD biases. Given the region’s high proportion of sulfate and sea salt, uncertainties in EMI_SS, EMI_DMS, and SO2Reactions (Fig. 5b) likely propagate through both size distribution and mass, amplifying uncertainty (Fig. 6c). This is consistent with global model challenges in representing marine aerosol emissions and aging (Tegen et al., 2019). Reducing these uncertainties will require improved constraints on sea salt flux parameterizations and DMS-to-sulfate conversion pathways.
In contrast, North Africa exhibits a negative AE bias (Figs. 7c and 4b), suggesting the model overestimates dust aerosol size (see Sect. 3.2.4). This conflicts with prior ECHAM6-HAM validations (Tegen et al., 2019), and might be related to a positive AE bias in PARASOL (Hasekamp et al., 2024). Our PPE mean AE (0.67) here aligns with earlier studies, yet the region shows large uncertainty tied to EMI_DUST (Figs. 5b and S5). The similarity in magnitude between the AE bias and the uncertainty associated with dust emissions suggests that perturbations in EMI_DUST could account for the observed bias.
ECHAM6-HAM exhibits a strong positive AE bias over the Intertropical Convergence Zone (ITCZ) and the South Pacific Convergence Zone (SPCZ; Fig. 7c). This aligns with previously identified precipitation biases linked to cloud cover and ice water path uncertainties (Neubauer et al., 2019; Stevens et al., 2013), as structural uncertainties in cloud parameterization and parametric drivers like WETDEP_IC amplify biases by reducing coarse-mode sea salt via excessive wet deposition. Furthermore, EMI_SS and EMI_DMS uncertainties disrupt sulfate-driven aerosol growth (Fig. S5; Croft et al., 2009). The model’s underestimation of sea salt particle size, dominant in these regions, exacerbates the AE overestimation (Fig. 7c), as DMS-derived sulfate condenses onto fewer coarse particles (Salzmann et al., 2022).
3.2.3 Present-day SSA
The global PPE reveals a systematic overestimation of single-scattering albedo (SSA) over oceans relative to PARASOL observations (Figs. 8b and 4c), indicating that modeled marine aerosols are less absorptive than from PARASOL retrievals. The model presents a negative SSA bias around central Africa and parts of South East Asia and India, whereas a strong positive bias is present over Australia and parts of the Arctic region.
SSA uncertainty from the PPE (Fig. 8d) is insufficient to account for the strong positive bias over the oceans and Australia. However, in regions with negative SSA bias (such as central Africa, South East Asia, and India, Fig. 8b), the model uncertainty is larger than the bias itself; therefore, the observed underestimation falls within the ensemble’s range of variability.

Figure 8As in Fig. 7 but showing Single Scattering Albedo. Global annual mean Single Scattering Albedo for (a) POLDER instrument measurement, (c) PPE (co-located in space/time at 3-hourly intervals), and (b) the difference between the co-located PPE and POLDER (panel c minus panel a). The spatial magnitude of parametric uncertainty is shown as (d) PPE absolute uncertainty (2σ across the ensemble members). Stippling indicates where the difference is not statistically significant at the (95 % level of confidence, Student's t-test).
Uncertainty attribution identifies BC_RAD_NI as the largest global contributor to SSA uncertainty (Fig. 5c), reflecting its direct control over BC absorption efficiency. Secondary drivers include EMI_DMS, EMI_SS, and SO2Reactions, particularly over the Southern Ocean, where marine aerosol processes outweigh BC’s influence (Figs. 5c, S6). Across most land regions, BC_RAD_NI and DU_RAD_NI account for approximately 20 % and 15 % of SSA uncertainty, respectively (Fig. 5c). These parameters govern the imaginary refractive indices of black carbon (BC) and dust, directly influencing their absorptive properties.
SSA uncertainty over the ocean stems from marine emissions (e.g., EMI_SS, EMI_DMS), whereas terrestrial uncertainty is dominated by biomass burning (EMI_BB and BC_RAD_NI), dust (EMI_DUST and DU_RAD_NI), and sulfate chemistry (SO2Reactions) (Fig. 5c). The parametric uncertainty in SSA over land is roughly twice as large as over oceans (Figs. 8d and 4b). Much of the BC_RAD_NI contributions over ocean are related to outflow of existing aerosol emissions from the land (Figs. 5c, S6). Over regions like South America and Africa, where biomass burning is a dominant aerosol source, a negative SSA bias (Fig. 8c) may suggest modeled BC is absorbing too strongly (Fig. 9b) relative to observations (Salzmann et al., 2022), or has a bias in the ratio between BC and OC (Organic Carbon). These regions also show elevated uncertainty tied to BC_RAD_NI, EMI_BB, SO2Reactions, and DU_RAD_NI (Figs. 5c, S6), underscoring the need for better constraints on BC and dust optical properties and combustion emission fluxes.
3.2.4 Model development priorities related to Present-Day aerosol biases
Sulfate-related parameters cause 40 % of AOD and SSA uncertainty, and 44 % for AE uncertainty. For the most part, this is from the shared influence of SO2Reactions and EMI_DMS across AOD, AE, and SSA, highlighting sulfate’s key role in present-day aerosol uncertainty. Regional patterns also highlight how key sources of AOD uncertainty cascade to uncertainties in AE and SSA. Over the Southern Ocean, for example, the elevated AOD relative uncertainty stems from sea salt emissions (EMI_SS) and DMS-derived sulfate production (EMI_DMS), which have smaller aerosol than observations (Fig. 7b), amplifying AE biases and uncertainty (Fig. 7b, d). Here, marine emissions (EMI_SS, EMI_DMS) drive both SSA and AE uncertainties, while their underrepresentation also reduces AOD (Fig. 6c). As a result, we suggest improvements in the treatment of sulfate and marine aerosol emissions (e.g., EMI_DMS, EMI_SS) with a focus on particle size distributions to reduce simultaneous AOD, and AE biases. Additionally, future work will focus more on sulfate-related parameters to better capture and constrain sulfates global uncertainty sources.
Parametric uncertainties may be able to compensate for some structural uncertainties in present-day aerosol. For example, relative humidity causes problems to aerosol growth in ECHAM6-HAM, relative to observations (Tsikerdekis et al., 2023). Additionally, the model has an AOD bias over marine regions from structural problems related to the convective scheme (Salzmann et al., 2022). Through perturbing sulfate and sea salt parameters, aerosols may grow over China and marine regions enough to compensate for the AOD bias. Additionally, the negatively biased modeled SSA over central Africa overlaps with the PPE uncertainty from BC_RAD_NI, enabling the possibility of mitigating SSA bias through aerosol refractive index parameters. Structural uncertainties in cloud parameterization may be compensated by depositional parametric drivers, like WETDEP_IC, which affect large aerosol particles. Parameters related to sulfate, BC_RAD_NI, and wet deposition may be important for future tuning, as they could partially offset known structural deficiencies related to humidity and cloud interactions.
AE uncertainties from the PPE have very little overlap with the modeled bias relative to POLDER. Some parameters, such as NUC_BL and EMI_BF have global contributions to AE uncertainty. Many regions with the largest AE biases, such as high latitudes, coincide with high parametric AE uncertainty, but the extent is insufficient to account for the AE bias. The cause of this mismatch is likely from structural uncertainty stemming from issues in coarse mode aerosol emissions for larger aerosol sizes, as shown by Tegen et al. (2019). Perturbing aerosol mass may enhance AE and AOD uncertainties to overlap biases. Therefore, future PPEs will extend this PPE design to include parameters influencing larger aerosol size modes, possibly through direct perturbation of aerosol mass or size parameters.

Figure 9Regional and global correlation coefficients (r) between each perturbed parameter and the emulated diagnostics (a) AOD, (b) SSA, and (c) AE for present-day conditions. Positive correlations (red) indicate that increasing the parameter value enhances the diagnostic, whereas negative correlations (blue) indicate a reduction. Rows show the parameters, and columns are the regions.
Figure 9 illustrates the linear correlations between each perturbed parameter and the simulated AOD, SSA, and AE across each region and globally. Positive correlations indicate that increasing the parameter value increases the diagnostic, while negative correlations imply an opposite effect. Through Fig. 9, future modeling studies can apply tuning exercises based on their region of interest and tuning parameter to enhance or reduce their desired diagnostic.
Globally, AOD (Fig. 9a) exhibits the strongest positive relationships with emission scaling factors, particularly natural emissions (DMS and sea salt), indicating that higher emissions generally increase aerosol loading. SSA (Fig. 9b), in contrast, shows negative correlations with increasing biomass burning emission and black carbon refractive-index scaling, confirming that stronger BC absorption reduces single-scattering albedo. AE (Fig. 9c) is most strongly influenced by dust and sea‐salt emission scaling factors, with negative correlations suggesting that increases in these sources reduce AE through the introduction of coarser particles. These trends imply that, while total aerosol mass may be broadly consistent with observations, the effective size representation of coarse particles (dust and sea salt) likely contributes to the residual bias. In ECHAM6-HAM, the aerosol size for these species is prescribed within mode widths and is independent of the emitted mass (Tegen et al., 2019). Therefore, adjustments to the emission size distribution rather than the total emission flux may reduce the AE and AOD bias. Regionally, the strongest sensitivities occur over source regions such as Africa and Asia for dust and biomass burning, and over the Southern Ocean for sea salt and DMS. These patterns highlight that addressing aerosol size representation, particularly for natural coarse modes, is a crucial step in reducing uncertainty in modeled aerosol-radiation and aerosol-cloud interactions.
Using a perturbed parameter ensemble (PPE) with the ECHAM6-HAM model, we have quantified aerosol-related parametric uncertainties in aerosol effective radiative forcing (ERF) and present-day aerosol properties (AOD, AE, SSA). Our PPE explores 23 parameters that influence aerosol emissions, removal processes, chemistry, and microphysics, building further on the approach of Yoshioka et al. (2019) developed for the HadGEM model. We also include newly identified parameters informed by recent research and model-specific biases, such as sulfate chemistry. This PPE framework enables us to assess uncertainties at both global and regional scales. Ultimately, our goal is to use PPEs to identify and constrain key ERF causes and uncertainties and to build confidence in climate projections by clarifying the role of parameter uncertainty and their potential to identify and/or reduce structural model uncertainties. When comparing a PPE across multiple models, some structural inadequacies may be overcome by re-tuning model parameters. Despite substantial structural differences between ECHAM6-HAM and HadGEM, the magnitude and dominant parametric sources of aerosol ERF uncertainty overlap in agreement across the ensembles. For example, natural aerosol emissions contribute significantly to both aerosol ERF and ERFaci uncertainty. Additionally, parameters that are globally important in aerosol ERF (EMI_ANTH_SO2, EMI_DMS, and EMI_CMR_BB) are consistent across models. However, key differences are also highlighted due to structural deviations, such as ECHAM6-HAM producing a stronger (more negative) aerosol ERF over land, while most other models have a stronger aerosol ERF over marine regions over persistent stratocumulus clouds (Shindell et al., 2013; Regayre et al., 2018).
Aerosol-related parametric uncertainties within our PPE lead to an aerosol ERF with a 5–95 percentile uncertainty range between −1.59 to −0.89 W m−2. Sulfate-related parameters (sulfate chemistry, Anthropogenic SO2 emissions, DMS emissions) cause 57 % of global ERF uncertainty, and biomass burning parameters (EMI_CMR_BB, BC_RAD_NI, EMI_BB) 27.5 %. While sulfate dominates aerosol forcing in many regions, biomass burning plays a significant role in regions with high biomass burning activity, like Africa. The smaller particle size of black carbon determined from the AE bias, combined with biases in its refractive index (black carbon imaginary refractive index), contributes to an uncertainty in absorption properties and radiative effects.
Global AOD uncertainties are primarily caused by natural aerosol emissions (DMS and sea salt) (33 %) and depositional processes (22 %). Sulfate-related parameters contribute over 40 % of the uncertainty in present-day AOD, AE, and SSA, underscoring their central role in shaping both aerosol climatology and ERF. Regions with high AOD uncertainty in ECHAM6-HAM often coincide with areas where model biases relative to observations are largest. Many of these regions have a positive AE bias, suggesting an underrepresentation of coarse-mode particles, as also identified by Tegen et al. (2019). ECHAM6-HAM under-represents coarse-mode aerosols over much of the ocean, particularly the Southern Ocean. Biomass-burning aerosols in ECHAM6-HAM appear smaller and more absorbing than observed by PARASOL, leading to a positive SSA bias, particularly over Africa and South America, although it should be noted that PARASOL has considerable SSA observational uncertainty. Therefore, we suggest that mitigating aerosol size bias in ECHAM6-HAM, particularly for natural coarse modes, is critical in reducing uncertainty in aerosol-radiation and aerosol-cloud interactions.
The main causes of uncertainty in ERF do not show full overlap with those in present-day AOD, AE, and SSA. On the other hand, the different causes of uncertainties between AOD, AE, and SSA in different regions suggest that spatially resolved measurements of these three aerosol properties together can help in constraining parameters that dominate ERF uncertainty, depending on the accuracy of the observations. However, some important causes of ERF uncertainty (most notably the emitted particle sizes of BB and FF) do not show similar causes of uncertainties in AOD, AE, or SSA. Adding observations of CDNC in addition to aerosol properties is expected to help constrain those parameters, which strongly impact ACI (McCoy et al., 2020). Future work will aim to constrain the ECHAM6-HAM ERF based on the recent satellite retrievals from the PACE (Werdell et al., 2019; Hasekamp et al., 2019a; Fu et al., 2025) and EarthCARE (Illingworth et al., 2015) missions launched in 2024, which provide the relevant aerosol and cloud observations with unprecedented accuracy.
Many of the model biases that appear when comparing with observations are caused by a combination of parametric uncertainties and structural model uncertainties. The latter may be partially mitigated through parameter tuning; however, this compensation may mask rather than resolve model deficiencies. To deepen our understanding of the different structural model uncertainties, a multi-model PPE is needed. The tight clustering of ERF uncertainty sources across models suggests that efforts to constrain ERF may benefit from cross-model coordination, especially around sulfate chemistry, DMS emissions, and biomass burning representation. By applying similar perturbations across multiple models (e.g., ECHAM6-HAM, HadGEM, ICON-HAM, EC-Earth, and NorESM), it would be possible to isolate uncertainties stemming from missing processes and those arising from poorly constrained parameter values. A multi-model PPE is important for CMIP7 to address the model structural uncertainties' contribution to ERF uncertainties and provide a more robust calculation for ERF. Furthermore, this would provide actionable information for improving structural representations of key aerosol processes, leading to improved model skill at simulating climate change.
All model simulation data are archived and are available by contacting the corresponding author. Parameter values are found in Zenodo, and annual mean PPE diagnostics are available in https://doi.org/10.5281/zenodo.15640132 (Bhatti et al., 2025). POLDER observations can be found in https://public.spider.surfsara.nl/project/spexone/others/PARASOL/DATA/POLDER_1.0x1.0_basedon0.1_NPge2/2010/ (last access: February 2025). Additionally, the POLDER measurements combined with AOD, AE, and SSA co-located PPE data can be obtained in Zenodo https://doi.org/10.5281/zenodo.15640132 (Bhatti et al., 2025). For higher frequency PPE data (monthly, daily, 3-hourly) or additional PPE diagnostics, contact the corresponding author. The ESEm code used to emulate the simulations is in https://doi.org/10.5281/zenodo.5466563 (Watson-Parris et al., 2021a, b).
The supplement related to this article is available online at https://doi.org/10.5194/acp-26-269-2026-supplement.
Author contributions. YAB implemented the model setup, performed model simulations, and wrote the manuscript, with assistance from all co-authors. DWP, LAR, HJ, DN, NS, and OPH assisted in technical model setup, methods, and provided expertise in analysis. All co-authors provided expertise in parameter ranges and helped with the model setup.
At least one of the (co-)authors is a member of the editorial board of Atmospheric Chemistry and Physics. The peer-review process was guided by an independent editor, and the authors also have no other competing interests to declare.
Publisher’s note: Copernicus Publications remains neutral with regard to jurisdictional claims made in the text, published maps, institutional affiliations, or any other geographical representation in this paper. While Copernicus Publications makes every effort to include appropriate place names, the final responsibility lies with the authors. Views expressed in the text are those of the authors and do not necessarily reflect the views of the publisher.
This research was supported by the European Union, Horizon Europe project CleanCloud (GA 101137639). The simulations and data analysis used the Dutch national e-infrastructure with the support of the SURF Cooperative using grant no. EINF-11775/L1.
This research has been supported by the EU Horizon 2020 (grant no. GA 101137639) and SURF Cooperative (grant no. EINF-11775/L1).
This paper was edited by Jason West and reviewed by Hunter Brown and one anonymous referee.
Abdul-Razzak, H. and Ghan, S. J.: A parameterization of aerosol activation: 2. Multiple aerosol types, Journal of Geophysical Research: Atmospheres, 105, 6837–6844, https://doi.org/10.1029/1999JD901161, 2000. a
Albrecht, B. A.: Aerosols, Cloud Microphysics, and Fractional Cloudiness, Science, 245, 1227–1230, https://doi.org/10.1126/science.245.4923.1227, 1989. a
Albright, A. L., Proistosescu, C., and Huybers, P.: Origins of a Relatively Tight Lower Bound on Anthropogenic Aerosol Radiative Forcing from Bayesian Analysis of Historical Observations, Journal of Climate, 34, 8777–8792, https://doi.org/10.1175/JCLI-D-21-0167.1, 2021. a, b
Bellouin, N., Quaas, J., Gryspeerdt, E., Kinne, S., Stier, P., Watson-Parris, D., Boucher, O., Carslaw, K. S., Christensen, M., Daniau, A.-L., Dufresne, J.-L., Feingold, G., Fiedler, S., Forster, P., Gettelman, A., Haywood, J. M., Lohmann, U., Malavelle, F., Mauritsen, T., McCoy, D. T., Myhre, G., Mülmenstädt, J., Neubauer, D., Possner, A., Rugenstein, M., Sato, Y., Schulz, M., Schwartz, S. E., Sourdeval, O., Storelvmo, T., Toll, V., Winker, D., and Stevens, B.: Bounding Global Aerosol Radiative Forcing of Climate Change, Reviews of Geophysics, 58, e2019RG000660, https://doi.org/10.1029/2019RG000660, 2020. a, b, c, d, e, f
Bhatti, Y., Revell, L., and McDonald, A.: Influences of Antarctic ozone depletion on Southern Ocean aerosols, Journal of Geophysical Research: Atmospheres, 127, e2022JD037199, https://doi.org/10.1029/2022JD037199, 2022. a
Bhatti, Y. A., Revell, L. E., Schuddeboom, A. J., McDonald, A. J., Archibald, A. T., Williams, J., Venugopal, A. U., Hardacre, C., and Behrens, E.: The sensitivity of Southern Ocean atmospheric dimethyl sulfide (DMS) to modeled oceanic DMS concentrations and emissions, Atmos. Chem. Phys., 23, 15181–15196, https://doi.org/10.5194/acp-23-15181-2023, 2023. a
Bhatti, Y. A., Revell, L. E., McDonald, A. J., Archibald, A. T., Schuddeboom, A. J., Williams, J., Hardacre, C., Mulcahy, J., and Lin, D.: Aerosol and Dimethyl Sulfide Sensitivity to Sulfate Chemistry Schemes, Journal of Geophysical Research: Atmospheres, 129, e2023JD040635, https://doi.org/10.1029/2023JD040635, 2024. a
Bhatti, Y., Hasekamp, O., and Jia, H.: PPE 2010 ECHAM6-HAM, Zenodo [data set], https://doi.org/10.5281/zenodo.15640132, 2025. a, b
Bock, J., Michou, M., Nabat, P., Abe, M., Mulcahy, J. P., Olivié, D. J. L., Schwinger, J., Suntharalingam, P., Tjiputra, J., van Hulten, M., Watanabe, M., Yool, A., and Séférian, R.: Evaluation of ocean dimethylsulfide concentration and emission in CMIP6 models, Biogeosciences, 18, 3823–3860, https://doi.org/10.5194/bg-18-3823-2021, 2021. a
Bollasina, M. A., Ming, Y., and Ramaswamy, V.: Anthropogenic Aerosols and the Weakening of the South Asian Summer Monsoon, Science, 334, 502–505, https://doi.org/10.1126/science.1204994, 2011. a
Boucher, O., Randall, D., Artaxo, P., Bretherton, C., Feingold, G., Forster, P., Kerminen, V.-M., Kondo, Y., Liao, H., Lohmann, U., Rasch, P., Satheesh, S. K., Sherwood, S., Stevens, B., and Zhang, X. Y.: Clouds and Aerosols, in: Climate Change 2013: The Physical Science Basis. Contribution of Working Group I to the Fifth Assessment Report of the Intergovernmental Panel on Climate Change, edited by Stocker, T. F., Qin, D., Plattner, G.-K., Tignor, M., Allen, S. K., Boschung, J., Nauels, A., Xia, Y., Bex, V., and Midgley, P. M., Cambridge University Press, Cambridge, 571–658, ISBN 978-1-107-66182-0, https://doi.org/10.1017/CBO9781107415324.016, section: 7, 2013. a, b
Carslaw, K. S., Lee, L. A., Reddington, C. L., Pringle, K. J., Rap, A., Forster, P. M., Mann, G. W., Spracklen, D. V., Woodhouse, M. T., Regayre, L. A., and Pierce, J. R.: Large contribution of natural aerosols to uncertainty in indirect forcing, Nature, 503, 67–71, https://doi.org/10.1038/nature12674, 2013. a, b, c, d, e
Carslaw, K. S., Gordon, H., Hamilton, D. S., Johnson, J. S., Regayre, L. A., Yoshioka, M., and Pringle, K. J.: Aerosols in the Pre-industrial Atmosphere, Current Climate Change Reports, 3, 1–15, https://doi.org/10.1007/s40641-017-0061-2, 2017. a, b
Croft, B., Lohmann, U., Martin, R. V., Stier, P., Wurzler, S., Feichter, J., Posselt, R., and Ferrachat, S.: Aerosol size-dependent below-cloud scavenging by rain and snow in the ECHAM5-HAM, Atmos. Chem. Phys., 9, 4653–4675, https://doi.org/10.5194/acp-9-4653-2009, 2009. a, b, c
Croft, B., Lohmann, U., Martin, R. V., Stier, P., Wurzler, S., Feichter, J., Hoose, C., Heikkilä, U., van Donkelaar, A., and Ferrachat, S.: Influences of in-cloud aerosol scavenging parameterizations on aerosol concentrations and wet deposition in ECHAM5-HAM, Atmos. Chem. Phys., 10, 1511–1543, https://doi.org/10.5194/acp-10-1511-2010, 2010. a, b
Deng, K., Azorin-Molina, C., Minola, L., Zhang, G., and Chen, D.: Global Near-Surface Wind Speed Changes over the Last Decades Revealed by Reanalyses and CMIP6 Model Simulations, Journal of Climate, Volume 34, 2219–2234, https://doi.org/10.1175/JCLI-D-20-0310.1, 2021. a
Deschamps, P.-Y., Bréon, F.-M., Leroy, M., Podaire, A., Bricaud, A., Buriez, J.-C., and Seze, G.: The POLDER mission: Instrument characteristics and scientific objectives, IEEE Transactions on geoscience and remote sensing, 32, 598–615, 1994. a
Dubovik, O., Sinyuk, A., Lapyonok, T., Holben, B. N., Mishchenko, M., Yang, P., Eck, T. F., Volten, H., Muñoz, O., Veihelmann, B., van der Zande, W. J., Leon, J.-F., Sorokin, M., and Slutsker, I.: Application of spheroid models to account for aerosol particle nonsphericity in remote sensing of desert dust, Journal of Geophysical Research: Atmospheres, 111, https://doi.org/10.1029/2005JD006619, 2006. a
Eidhammer, T., Gettelman, A., Thayer-Calder, K., Watson-Parris, D., Elsaesser, G., Morrison, H., van Lier-Walqui, M., Song, C., and McCoy, D.: An extensible perturbed parameter ensemble for the Community Atmosphere Model version 6, Geosci. Model Dev., 17, 7835–7853, https://doi.org/10.5194/gmd-17-7835-2024, 2024. a, b, c, d, e, f
Feichter, J., Kjellström, E., Rodhe, H., Dentener, F., Lelieveldi, J., and Roelofs, G.-J.: Simulation of the tropospheric sulfur cycle in a global climate model, Atmospheric Environment, 30, 1693–1707, https://doi.org/10.1016/1352-2310(95)00394-0, 1996. a
Forster, P., Storelvmo, T., Armour, K., Collins, W., Dufresne, J.-L., Frame, D., Lunt, D. J., Mauritsen, T., Palmer, M. D., Watanabe, M., Wild, M., and Zhang, X.: The Earth's energy budget, climate feedbacks, and climate sensitivity, in: Climate Change 2021: The Physical Science Basis. Contribution of Working Group I to the Sixth Assessment Report of the Intergovernmental Panel on Climate Change, edited by Masson-Delmotte, V., Zhai, P., Pirani, A., Connors, S. L., Péan, C., Berger, S., Caud, N., Chen, Y., Goldfarb, L., Gomis, M. I., Huang, M., Leitzell, K., Lonnoy, E., Matthews, J. B. R., Maycock, T. K., Waterfield, T., Yelekçi, O., Yu, R., and Zhou, B., Cambridge University Press, Cambridge, United Kingdom and New York, NY, USA, 923–1054, https://doi.org/10.1017/9781009157896.001, 2021. a, b, c, d, e, f, g, h
Fougnie, B., Bracco, G., Lafrance, B., Ruffel, C., Hagolle, O., and Tinel, C.: PARASOL in-flight calibration and performance, Applied Optics, 46, 5435–5451, https://doi.org/10.1364/AO.46.005435, 2007. a
Fu, G. and Hasekamp, O.: Retrieval of aerosol microphysical and optical properties over land using a multimode approach, Atmos. Meas. Tech., 11, 6627–6650, https://doi.org/10.5194/amt-11-6627-2018, 2018. a, b
Fu, G., Hasekamp, O., Rietjens, J., Smit, M., Di Noia, A., Cairns, B., Wasilewski, A., Diner, D., Seidel, F., Xu, F., Knobelspiesse, K., Gao, M., da Silva, A., Burton, S., Hostetler, C., Hair, J., and Ferrare, R.: Aerosol retrievals from different polarimeters during the ACEPOL campaign using a common retrieval algorithm, Atmos. Meas. Tech., 13, 553–573, https://doi.org/10.5194/amt-13-553-2020, 2020. a
Fu, G., Rietjens, J., Laasner, R., van der Schaaf, L., van Hees, R., Yuan, Z., van Diedenhoven, B., Hannadige, N., Landgraf, J., Smit, M., Knobelspiesse, K., Cairns, B., Gao, M., Franz, B., Werdell, J., and Hasekamp, O.: Aerosol Retrievals From SPEXone on the NASA PACE Mission: First Results and Validation, Geophysical Research Letters, 52, e2024GL113525, https://doi.org/10.1029/2024GL113525, 2025. a, b, c
Gong, S. L.: A parameterization of sea-salt aerosol source function for sub- and super-micron particles, Global Biogeochemical Cycles, 17, https://doi.org/10.1029/2003GB002079, 2003. a
Gryspeerdt, E., Goren, T., Sourdeval, O., Quaas, J., Mülmenstädt, J., Dipu, S., Unglaub, C., Gettelman, A., and Christensen, M.: Constraining the aerosol influence on cloud liquid water path, Atmos. Chem. Phys., 19, 5331–5347, https://doi.org/10.5194/acp-19-5331-2019, 2019. a
Gryspeerdt, E., Mülmenstädt, J., Gettelman, A., Malavelle, F. F., Morrison, H., Neubauer, D., Partridge, D. G., Stier, P., Takemura, T., Wang, H., Wang, M., and Zhang, K.: Surprising similarities in model and observational aerosol radiative forcing estimates, Atmos. Chem. Phys., 20, 613–623, https://doi.org/10.5194/acp-20-613-2020, 2020. a
Hamilton, D. S., Lee, L. A., Pringle, K. J., Reddington, C. L., Spracklen, D. V., and Carslaw, K. S.: Occurrence of pristine aerosol environments on a polluted planet, Proc. Natl. Acad. Sci. USA, 111, 18466–18471, https://doi.org/10.1073/pnas.1415440111, 2014. a
Hasekamp, O., Litvinov, P., Fu, G., Chen, C., and Dubovik, O.: Algorithm evaluation for polarimetric remote sensing of atmospheric aerosols, Atmos. Meas. Tech., 17, 1497–1525, https://doi.org/10.5194/amt-17-1497-2024, 2024. a, b, c, d, e, f, g, h, i, j
Hasekamp, O. P., Litvinov, P., and Butz, A.: Aerosol properties over the ocean from PARASOL multiangle photopolarimetric measurements, Journal of Geophysical Research: Atmospheres, 116, https://doi.org/10.1029/2010JD015469, 2011. a
Hasekamp, O. P., Fu, G., Rusli, S. P., Wu, L., Di Noia, A., Brugh, J. a. d., Landgraf, J., Martijn Smit, J., Rietjens, J., and van Amerongen, A.: Aerosol measurements by SPEXone on the NASA PACE mission: expected retrieval capabilities, Journal of Quantitative Spectroscopy and Radiative Transfer, 227, 170–184, https://doi.org/10.1016/j.jqsrt.2019.02.006, 2019a. a
Hasekamp, O. P., Gryspeerdt, E., and Quaas, J.: Analysis of polarimetric satellite measurements suggests stronger cooling due to aerosol-cloud interactions, Nature Communications, 10, 5405, https://doi.org/10.1038/s41467-019-13372-2, 2019b. a
Haywood, J. M., Abel, S. J., Barrett, P. A., Bellouin, N., Blyth, A., Bower, K. N., Brooks, M., Carslaw, K., Che, H., Coe, H., Cotterell, M. I., Crawford, I., Cui, Z., Davies, N., Dingley, B., Field, P., Formenti, P., Gordon, H., de Graaf, M., Herbert, R., Johnson, B., Jones, A. C., Langridge, J. M., Malavelle, F., Partridge, D. G., Peers, F., Redemann, J., Stier, P., Szpek, K., Taylor, J. W., Watson-Parris, D., Wood, R., Wu, H., and Zuidema, P.: The CLoud–Aerosol–Radiation Interaction and Forcing: Year 2017 (CLARIFY-2017) measurement campaign, Atmos. Chem. Phys., 21, 1049–1084, https://doi.org/10.5194/acp-21-1049-2021, 2021. a
Hoose, C., Kristjánsson, J. E., Iversen, T., Kirkevåg, A., Seland, O., and Gettelman, A.: Constraining cloud droplet number concentration in GCMs suppresses the aerosol indirect effect, Geophysical Research Letters, 36, https://doi.org/10.1029/2009GL038568, 2009. a, b
Illingworth, A. J., Barker, H. W., Beljaars, A., Ceccaldi, M., Chepfer, H., Clerbaux, N., Cole, J., Delanoë, J., Domenech, C., Donovan, D. P., Fukuda, S., Hirakata, M., Hogan, R. J., Huenerbein, A., Kollias, P., Kubota, T., Nakajima, T., Nakajima, T. Y., Nishizawa, T., Ohno, Y., Okamoto, H., Oki, R., Sato, K., Satoh, M., Shephard, M. W., Velázquez-Blázquez, A., Wandinger, U., Wehr, T., and Zadelhoff, G.-J. v.: The EarthCARE Satellite: The Next Step Forward in Global Measurements of Clouds, Aerosols, Precipitation, and Radiation, Bulletin of the American Meteorological Society, 96, https://doi.org/10.1175/BAMS-D-12-00227.1, 2015. a
Jia, H., Ma, X., Yu, F., and Quaas, J.: Significant underestimation of radiative forcing by aerosol–cloud interactions derived from satellite-based methods, Nature Communications, 12, 3649, https://doi.org/10.1038/s41467-021-23888-1, 2021. a
Karset, I. H. H., Berntsen, T. K., Storelvmo, T., Alterskjær, K., Grini, A., Olivié, D., Kirkevåg, A., Seland, Ø., Iversen, T., and Schulz, M.: Strong impacts on aerosol indirect effects from historical oxidant changes, Atmos. Chem. Phys., 18, 7669–7690, https://doi.org/10.5194/acp-18-7669-2018, 2018. a
Lamarque, J.-F., Shindell, D. T., Josse, B., Young, P. J., Cionni, I., Eyring, V., Bergmann, D., Cameron-Smith, P., Collins, W. J., Doherty, R., Dalsoren, S., Faluvegi, G., Folberth, G., Ghan, S. J., Horowitz, L. W., Lee, Y. H., MacKenzie, I. A., Nagashima, T., Naik, V., Plummer, D., Righi, M., Rumbold, S. T., Schulz, M., Skeie, R. B., Stevenson, D. S., Strode, S., Sudo, K., Szopa, S., Voulgarakis, A., and Zeng, G.: The Atmospheric Chemistry and Climate Model Intercomparison Project (ACCMIP): overview and description of models, simulations and climate diagnostics, Geosci. Model Dev., 6, 179–206, https://doi.org/10.5194/gmd-6-179-2013, 2013. a
Lee, L. A., Carslaw, K. S., Pringle, K. J., Mann, G. W., and Spracklen, D. V.: Emulation of a complex global aerosol model to quantify sensitivity to uncertain parameters, Atmos. Chem. Phys., 11, 12253–12273, https://doi.org/10.5194/acp-11-12253-2011, 2011. a, b, c
Lee, L. A., Pringle, K. J., Reddington, C. L., Mann, G. W., Stier, P., Spracklen, D. V., Pierce, J. R., and Carslaw, K. S.: The magnitude and causes of uncertainty in global model simulations of cloud condensation nuclei, Atmos. Chem. Phys., 13, 8879–8914, https://doi.org/10.5194/acp-13-8879-2013, 2013a. a, b
Lee, L. A., Reddington, C. L., and Carslaw, K. S.: On the relationship between aerosol model uncertainty and radiative forcing uncertainty, Proceedings of the National Academy of Sciences, 113, 5820–5827, https://doi.org/10.1073/pnas.1507050113, 2016. a
Lee, Y. H., Lamarque, J.-F., Flanner, M. G., Jiao, C., Shindell, D. T., Berntsen, T., Bisiaux, M. M., Cao, J., Collins, W. J., Curran, M., Edwards, R., Faluvegi, G., Ghan, S., Horowitz, L. W., McConnell, J. R., Ming, J., Myhre, G., Nagashima, T., Naik, V., Rumbold, S. T., Skeie, R. B., Sudo, K., Takemura, T., Thevenon, F., Xu, B., and Yoon, J.-H.: Evaluation of preindustrial to present-day black carbon and its albedo forcing from Atmospheric Chemistry and Climate Model Intercomparison Project (ACCMIP), Atmos. Chem. Phys., 13, 2607–2634, https://doi.org/10.5194/acp-13-2607-2013, 2013b. a
Li, F., Song, X., Harrison, S. P., Marlon, J. R., Lin, Z., Leung, L. R., Schwinger, J., Marécal, V., Wang, S., Ward, D. S., Dong, X., Lee, H., Nieradzik, L., Rabin, S. S., and Séférian, R.: Evaluation of global fire simulations in CMIP6 Earth system models, Geosci. Model Dev., 17, 8751–8771, https://doi.org/10.5194/gmd-17-8751-2024, 2024. a
Li, J., Carlson, B. E., Yung, Y. L., Lv, D., Hansen, J., Penner, J. E., Liao, H., Ramaswamy, V., Kahn, R. A., Zhang, P., Dubovik, O., Ding, A., Lacis, A. A., Zhang, L., and Dong, Y.: Scattering and absorbing aerosols in the climate system, Nature Reviews Earth & Environment, 3, 363–379, https://doi.org/10.1038/s43017-022-00296-7, 2022. a
Lohmann, U. and Hoose, C.: Sensitivity studies of different aerosol indirect effects in mixed-phase clouds, Atmos. Chem. Phys., 9, 8917–8934, https://doi.org/10.5194/acp-9-8917-2009, 2009. a
Lohmann, U. and Neubauer, D.: The importance of mixed-phase and ice clouds for climate sensitivity in the global aerosol–climate model ECHAM6-HAM2, Atmos. Chem. Phys., 18, 8807–8828, https://doi.org/10.5194/acp-18-8807-2018, 2018. a, b, c
Lohmann, U. and Roeckner, E.: Design and performance of a new cloud microphysics scheme developed for the ECHAM general circulation model, Climate Dynamics, 12, 557–572, https://doi.org/10.1007/BF00207939, 1996. a, b
Lohmann, U., Spichtinger, P., Jess, S., Peter, T., and Smit, H.: Cirrus cloud formation and ice supersaturated regions in a global climate model, Environmental Research Letters, 3, 045022, https://doi.org/10.1088/1748-9326/3/4/045022, 2008. a
Long, M. S., Keene, W. C., Kieber, D. J., Erickson, D. J., and Maring, H.: A sea-state based source function for size- and composition-resolved marine aerosol production, Atmos. Chem. Phys., 11, 1203–1216, https://doi.org/10.5194/acp-11-1203-2011, 2011. a, b
Lu, S., Landgraf, J., Fu, G., van Diedenhoven, B., Wu, L., Rusli, S. P., and Hasekamp, O. P.: Simultaneous Retrieval of Trace Gases, Aerosols, and Cirrus Using RemoTAP–The Global Orbit Ensemble Study for the CO2M Mission, Frontiers in Remote Sensing, 3, https://doi.org/10.3389/frsen.2022.914378, 2022. a, b
McCoy, I. L., McCoy, D. T., Wood, R., Regayre, L., Watson-Parris, D., Grosvenor, D. P., Mulcahy, J. P., Hu, Y., Bender, F. A., Field, P. R., Carslaw, K. S., and Gordon, H.: The hemispheric contrast in cloud microphysical properties constrains aerosol forcing, Proc. Natl. Acad. Sci. USA, 117, 18998–19006, https://doi.org/10.1073/pnas.1922502117, 2020. a, b
McKay, M. D., Beckman, R. J., and Conover, W. J.: A Comparison of Three Methods for Selecting Values of Input Variables in the Analysis of Output from a Computer Code, Technometrics, 21, 239–245, https://doi.org/10.2307/1268522, 1979. a
Morrison, H., van Lier-Walqui, M., Fridlind, A. M., Grabowski, W. W., Harrington, J. Y., Hoose, C., Korolev, A., Kumjian, M. R., Milbrandt, J. A., Pawlowska, H., Posselt, D. J., Prat, O. P., Reimel, K. J., Shima, S.-I., van Diedenhoven, B., and Xue, L.: Confronting the Challenge of Modeling Cloud and Precipitation Microphysics, Journal of Advances in Modeling Earth Systems, 12, e2019MS001689, https://doi.org/10.1029/2019MS001689, 2020. a, b
Mortier, A., Gliß, J., Schulz, M., Aas, W., Andrews, E., Bian, H., Chin, M., Ginoux, P., Hand, J., Holben, B., Zhang, H., Kipling, Z., Kirkevåg, A., Laj, P., Lurton, T., Myhre, G., Neubauer, D., Olivié, D., von Salzen, K., Skeie, R. B., Takemura, T., and Tilmes, S.: Evaluation of climate model aerosol trends with ground-based observations over the last 2 decades – an AeroCom and CMIP6 analysis, Atmos. Chem. Phys., 20, 13355–13378, https://doi.org/10.5194/acp-20-13355-2020, 2020. a
Mulcahy, J. P., Johnson, C., Jones, C. G., Povey, A. C., Scott, C. E., Sellar, A., Turnock, S. T., Woodhouse, M. T., Abraham, N. L., Andrews, M. B., Bellouin, N., Browse, J., Carslaw, K. S., Dalvi, M., Folberth, G. A., Glover, M., Grosvenor, D. P., Hardacre, C., Hill, R., Johnson, B., Jones, A., Kipling, Z., Mann, G., Mollard, J., O'Connor, F. M., Palmiéri, J., Reddington, C., Rumbold, S. T., Richardson, M., Schutgens, N. A. J., Stier, P., Stringer, M., Tang, Y., Walton, J., Woodward, S., and Yool, A.: Description and evaluation of aerosol in UKESM1 and HadGEM3-GC3.1 CMIP6 historical simulations, Geosci. Model Dev., 13, 6383–6423, https://doi.org/10.5194/gmd-13-6383-2020, 2020. a, b
Myhre, G., Shindell, D., Bréon, F.-M., Collins, W., Fuglestvedt, J., Huang, J., Koch, D., Lamarque, J.-F., Lee, D., Mendoza, B., Nakajima, T., Robock, A., Stephens, G., Takemura, T., and Zhang, H.: Anthropogenic and Natural Radiative Forcing, in: Climate Change 2013: The Physical Science Basis. Contribution of Working Group I to the Fifth Assessment Report of the Intergovernmental Panel on Climate Change, edited by Stocker, T. F., Qin, D., Plattner, G.-K., Tignor, M., Allen, S. K., Boschung, J., Nauels, A., Xia, Y., Bex, V., and Midgley, P. M., Cambridge University Press, 659–740, ISBN 978-1-107-66182-0, https://doi.org/10.1017/CBO9781107415324.018, 2013. a, b, c
Neubauer, D., Ferrachat, S., Siegenthaler-Le Drian, C., Stier, P., Partridge, D. G., Tegen, I., Bey, I., Stanelle, T., Kokkola, H., and Lohmann, U.: The global aerosol–climate model ECHAM6.3–HAM2.3 – Part 2: Cloud evaluation, aerosol radiative forcing, and climate sensitivity, Geosci. Model Dev., 12, 3609–3639, https://doi.org/10.5194/gmd-12-3609-2019, 2019. a, b, c, d, e, f, g, h, i, j, k, l, m, n, o
Regayre, L. A., Pringle, K. J., Booth, B. B. B., Lee, L. A., Mann, G. W., Browse, J., Woodhouse, M. T., Rap, A., Reddington, C. L., and Carslaw, K. S.: Uncertainty in the magnitude of aerosol-cloud radiative forcing over recent decades, Geophysical Research Letters, 41, 9040–9049, https://doi.org/10.1002/2014GL062029, 2014. a, b
Regayre, L. A., Pringle, K. J., Lee, L. A., Rap, A., Browse, J., Mann, G. W., Reddington, C. L., Carslaw, K. S., Booth, B. B. B., and Woodhouse, M. T.: The Climatic Importance of Uncertainties in Regional Aerosol-Cloud Radiative Forcings over Recent Decades, Journal of Climate, 28, 6589–6607, https://doi.org/10.1175/JCLI-D-15-0127.1, 2015. a, b, c
Regayre, L. A., Johnson, J. S., Yoshioka, M., Pringle, K. J., Sexton, D. M. H., Booth, B. B. B., Lee, L. A., Bellouin, N., and Carslaw, K. S.: Aerosol and physical atmosphere model parameters are both important sources of uncertainty in aerosol ERF, Atmos. Chem. Phys., 18, 9975–10006, https://doi.org/10.5194/acp-18-9975-2018, 2018. a, b, c, d, e, f, g, h, i, j, k, l, m, n, o, p
Regayre, L. A., Deaconu, L., Grosvenor, D. P., Sexton, D. M. H., Symonds, C., Langton, T., Watson-Paris, D., Mulcahy, J. P., Pringle, K. J., Richardson, M., Johnson, J. S., Rostron, J. W., Gordon, H., Lister, G., Stier, P., and Carslaw, K. S.: Identifying climate model structural inconsistencies allows for tight constraint of aerosol radiative forcing, Atmos. Chem. Phys., 23, 8749–8768, https://doi.org/10.5194/acp-23-8749-2023, 2023. a, b, c, d, e, f, g, h, i, j
Revell, L. E., Wotherspoon, N., Jones, O., Bhatti, Y., Williams, J., Mackie, S., and Mulcahy, J.: Atmosphere‐Ocean Feedback From Wind‐Driven Sea Spray Aerosol Production, Geophysical Research Letters, 48, e2020GL091900, https://doi.org/10.1029/2020GL091900, 2021. a
Saltelli, A., Tarantola, S., and Campolongo, F.: Sensitivity Analysis as an Ingredient of Modeling, Statistical Science, 15, 377–395, https://www.jstor.org/stable/2676831 (last access: February 2025), 2000. a
Salzmann, M., Ferrachat, S., Tully, C., Münch, S., Watson‐Parris, D., Neubauer, D., Siegenthaler‐Le Drian, C., Rast, S., Heinold, B., Crueger, T., and Brokopf, R.: The Global Atmosphere-aerosol Model ICON-A-HAM2. 3 – Initial Model Evaluation and Effects of Radiation Balance Tuning on Aerosol Optical Thickness, Journal of Advances in Modeling Earth Systems, 14, e2021MS002699, https://doi.org/10.1029/2021MS002699, 2022. a, b, c, d, e, f, g
Schutgens, N. A. J. and Stier, P.: A pathway analysis of global aerosol processes, Atmos. Chem. Phys., 14, 11657–11686, https://doi.org/10.5194/acp-14-11657-2014, 2014. a
Schutgens, N. A. J., Gryspeerdt, E., Weigum, N., Tsyro, S., Goto, D., Schulz, M., and Stier, P.: Will a perfect model agree with perfect observations? The impact of spatial sampling, Atmos. Chem. Phys., 16, 6335–6353, https://doi.org/10.5194/acp-16-6335-2016, 2016. a, b
Schutgens, N., Dubovik, O., Hasekamp, O., Torres, O., Jethva, H., Leonard, P. J. T., Litvinov, P., Redemann, J., Shinozuka, Y., de Leeuw, G., Kinne, S., Popp, T., Schulz, M., and Stier, P.: AEROCOM and AEROSAT AAOD and SSA study – Part 1: Evaluation and intercomparison of satellite measurements, Atmos. Chem. Phys., 21, 6895–6917, https://doi.org/10.5194/acp-21-6895-2021, 2021. a
Shindell, D. T., Lamarque, J.-F., Schulz, M., Flanner, M., Jiao, C., Chin, M., Young, P. J., Lee, Y. H., Rotstayn, L., Mahowald, N., Milly, G., Faluvegi, G., Balkanski, Y., Collins, W. J., Conley, A. J., Dalsoren, S., Easter, R., Ghan, S., Horowitz, L., Liu, X., Myhre, G., Nagashima, T., Naik, V., Rumbold, S. T., Skeie, R., Sudo, K., Szopa, S., Takemura, T., Voulgarakis, A., Yoon, J.-H., and Lo, F.: Radiative forcing in the ACCMIP historical and future climate simulations, Atmos. Chem. Phys., 13, 2939–2974, https://doi.org/10.5194/acp-13-2939-2013, 2013. a, b, c, d
Smith, C. J., Kramer, R. J., Myhre, G., Alterskjær, K., Collins, W., Sima, A., Boucher, O., Dufresne, J.-L., Nabat, P., Michou, M., Yukimoto, S., Cole, J., Paynter, D., Shiogama, H., O'Connor, F. M., Robertson, E., Wiltshire, A., Andrews, T., Hannay, C., Miller, R., Nazarenko, L., Kirkevåg, A., Olivié, D., Fiedler, S., Lewinschal, A., Mackallah, C., Dix, M., Pincus, R., and Forster, P. M.: Effective radiative forcing and adjustments in CMIP6 models, Atmos. Chem. Phys., 20, 9591–9618, https://doi.org/10.5194/acp-20-9591-2020, 2020. a, b
Smith, C. J., Harris, G. R., Palmer, M. D., Bellouin, N., Collins, W., Myhre, G., Schulz, M., Golaz, J.-C., Ringer, M., Storelvmo, T., and Forster, P. M.: Energy Budget Constraints on the Time History of Aerosol Forcing and Climate Sensitivity, Journal of Geophysical Research: Atmospheres, 126, e2020JD033622, https://doi.org/10.1029/2020JD033622, 2021. a, b
Sofiev, M., Soares, J., Prank, M., de Leeuw, G., and Kukkonen, J.: A regional-to-global model of emission and transport of sea salt particles in the atmosphere, Journal of Geophysical Research: Atmospheres, 116, https://doi.org/10.1029/2010JD014713, 2011. a, b
Stevens, B., Giorgetta, M., Esch, M., Mauritsen, T., Crueger, T., Rast, S., Salzmann, M., Schmidt, H., Bader, J., Block, K., Brokopf, R., Fast, I., Kinne, S., Kornblueh, L., Lohmann, U., Pincus, R., Reichler, T., and Roeckner, E.: Atmospheric component of the MPI-M Earth System Model: ECHAM6, Journal of Advances in Modeling Earth Systems, 5, 146–172, https://doi.org/10.1002/jame.20015, 2013. a, b, c
Stier, P., Feichter, J., Kinne, S., Kloster, S., Vignati, E., Wilson, J., Ganzeveld, L., Tegen, I., Werner, M., Balkanski, Y., Schulz, M., Boucher, O., Minikin, A., and Petzold, A.: The aerosol-climate model ECHAM5-HAM, Atmos. Chem. Phys., 5, 1125–1156, https://doi.org/10.5194/acp-5-1125-2005, 2005. a, b
Sundqvist, H., Berge, E., and Kristjánsson, J. E.: Condensation and Cloud Parameterization Studies with a Mesoscale Numerical Weather Prediction Model, Monthly Weather Review, 117, https://doi.org/10.1175/1520-0493(1989)117<1641:CACPSW>2.0.CO;2, 1989. a
Taylor, K. E., Crucifix, M., Braconnot, P., Hewitt, C. D., Doutriaux, C., Broccoli, A. J., Mitchell, J. F. B., and Webb, M. J.: Estimating Shortwave Radiative Forcing and Response in Climate Models, Journal of Climate, https://doi.org/10.1175/JCLI4143.1, 2007. a
Tegen, I., Neubauer, D., Ferrachat, S., Siegenthaler-Le Drian, C., Bey, I., Schutgens, N., Stier, P., Watson-Parris, D., Stanelle, T., Schmidt, H., Rast, S., Kokkola, H., Schultz, M., Schroeder, S., Daskalakis, N., Barthel, S., Heinold, B., and Lohmann, U.: The global aerosol–climate model ECHAM6.3–HAM2.3 – Part 1: Aerosol evaluation, Geosci. Model Dev., 12, 1643–1677, https://doi.org/10.5194/gmd-12-1643-2019, 2019. a, b, c, d, e, f, g, h, i, j
Terai, C. R., Bretherton, C. S., Wood, R., and Painter, G.: Aircraft observations of aerosol, cloud, precipitation, and boundary layer properties in pockets of open cells over the southeast Pacific, Atmos. Chem. Phys., 14, 8071–8088, https://doi.org/10.5194/acp-14-8071-2014, 2014. a
Thornhill, G. D., Collins, W. J., Kramer, R. J., Olivié, D., Skeie, R. B., O'Connor, F. M., Abraham, N. L., Checa-Garcia, R., Bauer, S. E., Deushi, M., Emmons, L. K., Forster, P. M., Horowitz, L. W., Johnson, B., Keeble, J., Lamarque, J.-F., Michou, M., Mills, M. J., Mulcahy, J. P., Myhre, G., Nabat, P., Naik, V., Oshima, N., Schulz, M., Smith, C. J., Takemura, T., Tilmes, S., Wu, T., Zeng, G., and Zhang, J.: Effective radiative forcing from emissions of reactive gases and aerosols – a multi-model comparison, Atmos. Chem. Phys., 21, 853–874, https://doi.org/10.5194/acp-21-853-2021, 2021. a, b
Toll, V., Christensen, M., Quaas, J., and Bellouin, N.: Weak average liquid-cloud-water response to anthropogenic aerosols, Nature, 572, 51–55, https://doi.org/10.1038/s41586-019-1423-9, 2019. a
Tsigaridis, K., Daskalakis, N., Kanakidou, M., Adams, P. J., Artaxo, P., Bahadur, R., Balkanski, Y., Bauer, S. E., Bellouin, N., Benedetti, A., Bergman, T., Berntsen, T. K., Beukes, J. P., Bian, H., Carslaw, K. S., Chin, M., Curci, G., Diehl, T., Easter, R. C., Ghan, S. J., Gong, S. L., Hodzic, A., Hoyle, C. R., Iversen, T., Jathar, S., Jimenez, J. L., Kaiser, J. W., Kirkevåg, A., Koch, D., Kokkola, H., Lee, Y. H., Lin, G., Liu, X., Luo, G., Ma, X., Mann, G. W., Mihalopoulos, N., Morcrette, J.-J., Müller, J.-F., Myhre, G., Myriokefalitakis, S., Ng, N. L., O'Donnell, D., Penner, J. E., Pozzoli, L., Pringle, K. J., Russell, L. M., Schulz, M., Sciare, J., Seland, Ø., Shindell, D. T., Sillman, S., Skeie, R. B., Spracklen, D., Stavrakou, T., Steenrod, S. D., Takemura, T., Tiitta, P., Tilmes, S., Tost, H., van Noije, T., van Zyl, P. G., von Salzen, K., Yu, F., Wang, Z., Wang, Z., Zaveri, R. A., Zhang, H., Zhang, K., Zhang, Q., and Zhang, X.: The AeroCom evaluation and intercomparison of organic aerosol in global models, Atmos. Chem. Phys., 14, 10845–10895, https://doi.org/10.5194/acp-14-10845-2014, 2014. a
Tsikerdekis, A., Hasekamp, O. P., Schutgens, N. A. J., and Zhong, Q.: Assimilation of POLDER observations to estimate aerosol emissions, Atmos. Chem. Phys., 23, 9495–9524, https://doi.org/10.5194/acp-23-9495-2023, 2023. a, b, c, d, e
Twomey, S.: Pollution and the planetary albedo, Atmospheric Environment (1967), 8, 1251–1256, https://doi.org/10.1016/0004-6981(74)90004-3, 1974. a
van Marle, M. J. E., Kloster, S., Magi, B. I., Marlon, J. R., Daniau, A.-L., Field, R. D., Arneth, A., Forrest, M., Hantson, S., Kehrwald, N. M., Knorr, W., Lasslop, G., Li, F., Mangeon, S., Yue, C., Kaiser, J. W., and van der Werf, G. R.: Historic global biomass burning emissions for CMIP6 (BB4CMIP) based on merging satellite observations with proxies and fire models (1750–2015), Geosci. Model Dev., 10, 3329–3357, https://doi.org/10.5194/gmd-10-3329-2017, 2017. a
Venugopal, A. U., Bhatti, Y. A., Morgenstern, O., Williams, J., Edkins, N., Hardacre, C., Jones, A., and Revell, L. E.: Constraining the Uncertainty Associated With Sea Salt Aerosol Parameterizations in Global Models Using Nudged UKESM1-AMIP Simulations, Journal of Geophysical Research: Atmospheres, 130, e2024JD041643, https://doi.org/10.1029/2024JD041643, 2025. a, b, c
Vignati, E., Wilson, J., and Stier, P.: M7: An efficient size-resolved aerosol microphysics module for large-scale aerosol transport models, Journal of Geophysical Research: Atmospheres, 109, https://doi.org/10.1029/2003JD004485, 2004. a, b
Watson-Parris, D. and Smith, C. J.: Large uncertainty in future warming due to aerosol forcing, Nature Climate Change, 12, 1111–1113, https://doi.org/10.1038/s41558-022-01516-0, 2022. a
Watson-Parris, D., Williams, A., Deaconu, L., and Stier, P.: Model calibration using ESEm v1.1.0 – an open, scalable Earth system emulator, Geosci. Model Dev., 14, 7659–7672, https://doi.org/10.5194/gmd-14-7659-2021, 2021a. a, b
Watson-Parris, D., Williams, A., and Monticone, P.: duncanwp/ESEm: v1.1.0, Zenodo [data set], https://doi.org/10.5281/zenodo.5466563, 2021b. a
Werdell, P. J., Behrenfeld, M. J., Bontempi, P. S., Boss, E., Cairns, B., Davis, G. T., Franz, B. A., Gliese, U. B., Gorman, E. T., Hasekamp, O., Knobelspiesse, K. D., Mannino, A., Martins, J. V., McClain, C. R., Meister, G., and Remer, L. A.: The Plankton, Aerosol, Cloud, Ocean Ecosystem Mission: Status, Science, Advances, Bulletin of the American Meteorological Society, 96, https://doi.org/10.1175/BAMS-D-18-0056.1, 2019. a
Wood, R., O, K.-T., Bretherton, C. S., Mohrmann, J., Albrecht, B. A., Zuidema, P., Ghate, V., Schwartz, C., Eloranta, E., Glienke, S., Shaw, R. A., Fugal, J., and Minnis, P.: Ultraclean Layers and Optically Thin Clouds in the Stratocumulus-to-Cumulus Transition. Part I: Observations, Journal of the Atmospheric Sciences, https://doi.org/10.1175/JAS-D-17-0213.1, 2018. a
Yang, Y., Mou, S., Wang, H., Wang, P., Li, B., and Liao, H.: Global source apportionment of aerosols into major emission regions and sectors over 1850–2017, Atmos. Chem. Phys., 24, 6509–6523, https://doi.org/10.5194/acp-24-6509-2024, 2024. a
Yoshioka, M., Regayre, L. A., Pringle, K. J., Johnson, J. S., Mann, G. W., Partridge, D. G., Sexton, D. M. H., Lister, G. M. S., Schutgens, N., Stier, P., Kipling, Z., Bellouin, N., Browse, J., Booth, B. B. B., Johnson, C. E., Johnson, B., Mollard, J. D. P., Lee, L., and Carslaw, K. S.: Ensembles of Global Climate Model Variants Designed for the Quantification and Constraint of Uncertainty in Aerosols and Their Radiative Forcing, Journal of Advances in Modeling Earth Systems, 11, 3728–3754, https://doi.org/10.1029/2019MS001628, 2019. a, b, c, d, e, f, g, h, i, j, k, l
Yuan, Z., Fu, G., van Diedenhoven, B., Lin, H. X., Erisman, J. W., and Hasekamp, O. P.: Cloud detection from multi-angular polarimetric satellite measurements using a neural network ensemble approach, Atmos. Meas. Tech., 17, 2595–2610, https://doi.org/10.5194/amt-17-2595-2024, 2024. a
Zelinka, M. D., Andrews, T., Forster, P. M., and Taylor, K. E.: Quantifying components of aerosol-cloud-radiation interactions in climate models, Journal of Geophysical Research: Atmospheres, 119, 7599–7615, https://doi.org/10.1002/2014JD021710, 2014. a
Zhang, K., O'Donnell, D., Kazil, J., Stier, P., Kinne, S., Lohmann, U., Ferrachat, S., Croft, B., Quaas, J., Wan, H., Rast, S., and Feichter, J.: The global aerosol-climate model ECHAM-HAM, version 2: sensitivity to improvements in process representations, Atmos. Chem. Phys., 12, 8911–8949, https://doi.org/10.5194/acp-12-8911-2012, 2012. a, b, c, d