the Creative Commons Attribution 4.0 License.
the Creative Commons Attribution 4.0 License.
 | 13 Feb 2026
Remaining aerosol forcing uncertainty after observational constraint and the processes that cause it
Leighton A. Regayre
Léa M. C. Prévost
Kunal Ghosh
Jill S. Johnson
Jeremy E. Oakley
Jonathan Owen
Iain Webb
Ken S. Carslaw
Aerosol radiative forcing remains a major source of climate model uncertainty, limiting climate model projection skill and slowing global action on addressing climate risks. Observations only modestly constrain the magnitude of aerosol radiative forcing despite advances in model fidelity, resolution and availability of observations. Our goals are to understand where aerosol-cloud forcing uncertainty resists efforts to reduce (or constrain) it and to identify the processes that cause the remaining uncertainty, to guide future observation campaigns and model constraint efforts. We map the aerosol forcing uncertainty in a global climate model perturbed parameter ensemble before and after constraint to satellite observations of several cloud, aerosol and radiative properties. Original uncertainty falls by more than 80 % in Northern Hemisphere marine regions and by 70 % for globally averaged aerosol forcing. However, the uncertainty remains large (more than 70 % of the original uncertainty) in Southern Hemisphere marine environments where stratocumulus clouds transition to cumulus, as well as in some highly populated industrialized areas. Regional clusters of shared causes of model uncertainty highlight common processes as targets for future observational constraint. Our findings highlight the value in re-evaluating the remaining causes of ΔFaci uncertainty during the constraint process and provide actionable information for prioritizing existing observations that should be included as constraints. Additionally, our results highlight targeted observations in persistent uncertainty hotspots where novel and process-specific data could further constrain aerosol forcing. This work provides a framework for model evaluation and development that prioritises aerosol forcing constraint to improve model skill at making climate projections.
- Article
(12035 KB) - Full-text XML
- BibTeX
- EndNote


Aerosol effective radiative forcing (ΔFaer) is one of the largest causes of uncertainty in anthropogenic climate change over the past century (Forster et al., 2021). Whilst the cooling effect of anthropogenic aerosol substantially offsets the warming effect of greenhouse gases, the magnitude of ΔFaer over historical periods is uncertain. Despite decades of improvements to model fidelity, increasing model resolution, and a huge increase in observational data availability, large ΔFaer uncertainty persists (Forster et al., 2021). Model processes that cause uncertainty in historical ΔFaer also cause uncertainty in future climate change (Gettelman et al., 2024), suggesting that narrowing the model process uncertainty in ΔFaer over the historical period could significantly improve confidence in climate projections. Uncertainty in model processes accounts for more than 50 % of the uncertainty caused by highly uncertain future shared socioeconomic pathways (Peace et al., 2020), which translates to around 0.5 °C additional uncertainty in long-term warming projections from anthropogenic CO2 emissions (Watson-Parris and Smith, 2022). Reduction in ΔFaer uncertainty would also help to understand aerosol influence on clouds and atmospheric circulation patterns (Mülmenstädt and Wilcox, 2021; Peace et al., 2022), and to reduce some of the risks associated with mitigating the impacts of future climate change.
Climate models are imperfect partly because they represent physical processes using parametrizations – mathematical approximations to real-world processes that are designed to balance fidelity with computational efficiency. Differences in the magnitude of ΔFaer across climate models stem from choices about how to parameterize physical processes (Bellouin et al., 2020). The approximate nature of these parametrizations introduces inherent discrepancies between models and observations that cannot be overcome through parameter retuning (Sexton et al., 2012). For aerosol-cloud interactions, governing processes are microphysical, so the fundamental mismatch in scale with global climate simulations ensures model-observation discrepancies will likely persist even in simulations where resolution is increased to feasible computational limits (e.g. Hoffmann et al., 2023). As a result, no climate model can be fully constrained by observations and will always be partly limited by observational error, spatial and temporal representation errors (Schutgens et al., 2017), and inherent model biases (e.g. Liu et al., 2024; Price et al., 2025).
Closer collaboration between climate modelers, lab-based experimentalists, in-situ observation teams, and satellite instrument scientists has been viewed as essential for improving our ability to constrain ΔFaer (Kahn et al., 2023). However, despite observational programs sharing common goals with modelers to either reduce ΔFaer uncertainty or improve process understanding, modeling centres have yet to provide clear guidance on how new observations can be effectively integrated to reduce model uncertainty, or how priorities for future observational campaigns might evolve in response to better use of existing data.
Meaningful progress with understanding the causes of model uncertainty can be achieved by evaluating (against observations) a wide range of model “variants” that comprehensively sample important causes of uncertainty in ΔFaer (Johnson et al., 2020; Mikkelsen et al., 2025; Regayre et al., 2020, 2023; Rostron et al., 2020; Zhong et al., 2023). These variants can be generated from perturbed parameter ensembles (PPEs) that systematically vary multiple uncertain model parameters to explore the breadth of model behaviour (e.g., Carslaw et al., 2013; Eidhammer et al., 2024; Elsaesser et al., 2025; Qian et al., 2018; Yoshioka et al., 2019). PPE studies, coupled with statistical analyses, have identified key causes of climate model ΔFaer uncertainty. For instance, natural aerosols contribute more to ΔFaer uncertainty over the industrial period than other aerosol sources because of their disproportionate influence on baseline aerosol concentrations (Carslaw et al., 2013), while atmospheric process parameters account for nearly half of the ΔFaer uncertainty through their effect on cloud properties (Regayre et al., 2018).
Narrowing of the uncertainty in ΔFaer (or “constraint”) remains a challenge, in part because the causes of ΔFaer uncertainty vary spatially and temporally due to differences in atmospheric conditions and variations in aerosol emissions, dominant processes and evolving climate impacts of aerosol as they age (Regayre et al., 2014). For example, Regayre et al. (2018) showed uncertainty in the radiative properties of black carbon aerosol cause less than 5 % of the global mean ΔFaer uncertainty in most months but accounts for around 50 % of the annual mean ΔFaer uncertainty near high-emission sources, where black carbon influences boundary layer stability, cloudiness and the susceptibility of clouds to aerosol changes (Bond et al., 2013). Parameters may be overlooked not only when their effects are regionally isolated but also when causes of regional ΔFaer uncertainty cancel out in global mean calculations due to opposing forcing sensitivities across different regions (Regayre et al., 2015). For example, an increase in uncertain natural aerosol emissions can suppress ΔFaer (make it less negative) in relatively clean regions (Carslaw et al., 2013) whilst enhancing ΔFaer (more negative) in polluted regions, where natural and anthropogenic sources combine to increase cloud lifetime (Albrecht, 1989; Regayre et al., 2015). Overcoming these challenges requires leveraging combinations of observations that target specific processes (e.g. Sprintall et al., 2020), or collectively account for uncertainties in aerosol emissions, deposition, size, and composition, as well as microphysical interactions between aerosol and clouds.
Observational constraints on ΔFaer uncertainty are limited by three interlinked issues. First, only observations that share causes of uncertainty with ΔFaer can provide meaningful constraint. Second, compensating model errors allow multiple equally-plausible model variants (or equifinal variants; Beven and Freer, 2001) to agree with observations without any narrowing of the credible ΔFaer range. Third, structurally imperfect models are susceptible to contrasting constraints, where two or more observations constrain a model towards non-overlapping sets of parameter combinations. When combined, these contrasting constraints force a compromise in model skill at simulating associated variables, leaving us with models that on average only perform tolerably (Regayre et al., 2023).
These three issues must be considered collectively to identify useful ΔFaer constraints. For example, concentrations of cloud condensation nuclei directly affect the magnitude of ΔFaer and so share causes of uncertainty, but associated observations only weakly constrain ΔFaer because of compensating errors in model microphysics (Lee et al., 2016). Similarly, top-of-the-atmosphere radiative flux measurements suffer from equifinality related to aerosol emission, processing and deposition process uncertainties, so only weakly constrain ΔFaer despite being a key quantity used to calculate ΔFaer (Regayre et al., 2018). Multi-season, multi-location observational data constraints may partially overcome the equifinality issue by introducing some orthogonality into the overall constraint. However, large observational datasets typically contain a high degree of complementary information, as many observable variables share causes of uncertainty and are therefore somewhat redundant (Regayre et al., 2023). A broad set of observations can actually limit the constraint effectiveness (e.g. Johnson et al., 2020) because using large data sets increases the likelihood of exposing structural model deficiencies (Regayre et al., 2023).
Observations specifically designed (or collated) to isolate differences between present-day and early-industrial environments – such as hemispheric difference in cloud droplet concentrations – more directly map onto ΔFaer (share causes of uncertainty). These observations can bypass much of the error compensation issue by leveraging the large, well-characterized contrast between polluted and pristine environments, so do partially constrain ΔFaer (McCoy et al., 2020). Similarly, aerosol observations from targeted campaigns in pristine environments (e.g. the Antarctic Circumnavigation Expedition – Study of Preindustrial-like Aerosol Climate Effects; ACE-SPACE; Schmale et al., 2019) largely avoid the effects of compensating errors and can uniquely constrain natural aerosol concentrations and their precursors (Regayre et al., 2020), which are critical for reducing ΔFaer uncertainty (Carslaw et al., 2013). However, constraining a model to match a single observation type or environment risks overfitting – yielding a good match for one variable or set of conditions, but with no guarantee of increasing climate projection skill.
To overcome all three limitations, models need to be constrained against a suite of observations that (1) share ΔFaer's causes of uncertainty, (2) collectively minimize the effect of compensating errors, and (3) expose and avoid the effects of structural model errors. Crucially, the dominant sources of ΔFaer uncertainty will likely shift once any observational constraint is applied. This means the criteria for a “good” constraint may evolve as observational constraints are applied, to better align with changing causes of uncertainty and to address any newly revealed compensating errors or model structural deficiencies.
This paper builds on the work of Regayre et al. (2023; hereafter referred to as “R23”) to address the challenges outlined above. R23 constrained global, annual mean aerosol-cloud interaction forcing (ΔFaci; the larger component of ΔFaer) in version 1 of the UK Earth System Model (UKESM1; Sellar et al., 2019) by nearly 70 % (reduction in 90 % credible interval width). This “optimal” constraint reduced ΔFaci uncertainty to the maximum limit with their chosen observations and structurally imperfect model within the explored parameter space, noting that total uncertainty could be larger in free-running simulations or if additional parameters were included. Yet over 30 % of the ΔFaci uncertainty remains, with observationally plausible ΔFaci values ranging from −0.9 to −0.1 W m−2 (90 % credible interval) and regional uncertainties up to around 20 W m−2.
To further constrain ΔFaci towards the limits imposed by observational uncertainties, several key challenges must be addressed. First, we must distinguish between regions where ΔFaci uncertainty has been constrained and regions where the chosen observations had a weaker effect. Second, we need to identify the model parameters that cause remaining ΔFaci uncertainty and how their contributions vary regionally. Third, we must determine which existing or future observations would best constrain these remaining causes of ΔFaci uncertainty. Tackling these challenges would optimize the use of available observations and guide future campaigns, creating a feedback cycle between model evaluation and refinement, and observational design, as exemplified by Carslaw et al. (2013), Hamilton et al. (2014), Schmale et al. (2019) and Regayre et al. (2020).
Section 3.1 examines how each observation added to the R23 optimal constraint reduces ΔFaci uncertainty by eliminating specific parameter combinations. Section 3.2 maps the remaining uncertainty, revealing significant heterogeneity in constraint efficacy. Section 3.3 identifies the causes of remaining regional and global mean ΔFaci uncertainty, and Sect. 3.4 clusters regions according to shared causes of uncertainty and identifies priorities for model development and future observation campaigns. Finally, Sect. 4 discusses the potential for further ΔFaer constraint across the current generation of climate models, and ways the scientific community might collaborate to achieve this elusive goal.
Regayre et al. (2023) used version 1 of the UK Earth System Model (UKESM1; Sellar et al., 2019) to create a 221-member PPE that spans model responses to changes in 37 uncertain aerosol, cloud, and physical atmosphere model parameters (Appendix A, Table A1). Statistical emulators of multiple variables were used to scale up from 221 ensemble members to 1 million model variants (parameter combinations) which is sufficiently large to allow for robust observational constraint using more than 450 observations (Sect. 2.3), to identify localized model behaviour linked to specific parameters (Sect. 2.4) and variance-based sensitivity analyses (Sect. 2.5).
Regayre et al. (2023) identified the observation type that provided the strongest ΔFaci constraint, then progressively added the next strongest observation, eventually reducing ΔFaci uncertainty by nearly 70 % using a combination of just 13 observation values. In this study, we build on the R23 foundation by analyzing the causes of the remaining 30 % of ΔFaci uncertainty after optimal constraint. We quantify parameter contributions to remaining ΔFaci uncertainty at the model grid box level and within clusters of shared causes of uncertainty (Sect. 2.5).
2.1 Experimental design
Regayre et al. (2023) used the atmosphere-only configuration of UKESM1 to create their PPE. UKESM1 is based on the HADGEM3-GC3.1 physical climate model (Williams et al., 2018) with additional coupling to key Earth system processes, including the United Kingdom Chemistry and Aerosol (UKCA) model (Archibald et al., 2020). The atmosphere-only configuration (UKESM1-A) consists of the GA7.1 atmosphere (Walters et al., 2019), with additional aerosol, cloud, and physical atmosphere structural updates as implemented in Mulcahy et al. (2020). R23 used UKESM1-A at N96 horizontal resolution, which is 1.875°×1.25° (208 km × 139 km at the Equator), with 85 vertical levels unevenly distributed between the surface and 85 km in altitude, matching the model version submitted to the 6th Coupled Model Intercomparison Project (CMIP6; Eyring et al., 2016). They nudged horizontal wind fields above around 2 km (model vertical level 17) towards ERA-Interim values for the period December 2016 to November 2017 and prescribed sea ice and sea surface temperatures for the same period.
The model PPE members were forced using anthropogenic SO2 emissions for the years 2014 and 1850, as prescribed in CMIP6 simulations. Differences in top-of-the-atmosphere radiative fluxes between the two anthropogenic emission periods were used to calculate ΔFaer values. The components of ΔFaer from aerosol-cloud interactions, ΔFaci, and aerosol-radiation interactions (ΔFari) account for above-cloud aerosol radiative effects (Ghan et al., 2016) and multiple cloud adjustments (Forster et al., 2021; Grosvenor and Carslaw, 2020). Carbonaceous aerosol emissions were prescribed using CMIP6 (1850) and Copernicus Atmospheric Monitoring Service (CAMS; 2016-17) data, whilst ocean surface concentrations of dimethylsulfide (DMS) and chlorophyll, as well as atmospheric concentrations of gas species (including oxidants OH and O3, which R23 perturbed between 70 % to 130 % of baseline values) were prescribed using monthly mean output from a fully coupled version of the UKESM model averaged over the 1979 to 2014 period. Additionally, R23 prescribed volcanic SO2 emissions for continuously emitting and sporadically erupting volcanoes (Andres and Kasgnoc, 1998) and for explosive volcanic eruptions (Halmer et al., 2002).
Regayre et al. (2023) made structural changes to UKESM1-A to better sample the breadth of ΔFaci uncertainty. Following Yoshioka et al. (2019), an ice mass fraction threshold was defined, above which no nucleation scavenging occurs, to allow sufficient aerosol to be transported to the Arctic (Browse et al., 2012). They also included an organically mediated aerosol nucleation parameterisation (Metzger et al., 2010) to represent remote marine and early industrial aerosol concentrations more accurately in the model. Additionally, R23 used high-resolution lookup tables for aerosol optical properties (Bellouin et al., 2013) that include properties for mineral dust (Balkanski et al., 2007) and better resolve aerosol absorption.
2.2 Perturbed parameter ensembles and emulation
The Regayre et al. (2023) PPE was created in two stages using a history-matching style approach (Craig et al., 1997; Williamson et al., 2013) to ensure that the 221 ensemble members (parameter combinations) spanned the 37-dimensional parameter space whilst achieving acceptable agreement with large-scale climate metrics including the global mean outgoing shortwave radiative flux. Following Lee et al. (2012), Regayre et al. (2014), Sexton et al. (2021) and Yoshioka et al. (2019), ranges for the 37 uncertain parameters were determined by formal expert elicitation using the Sheffield Elicitation Framework (SHELF) approach described in Gosling (2018).
Statistical Gaussian Process emulators (O'Hagan, 2006) were used to extend the 221 climate model simulations to 1 million model variants. Emulators can very efficiently predict output for new model variants (parameter combinations) compared to the time and computational resource required to create climate model ensemble members. Furthermore, as opposed to other machine-learning approaches, emulator uncertainty can be quantified for any parameter combination, to validate emulator skill and avoid over-constraint when comparing model variant output to observations (e.g. Johnson et al., 2020).
Regayre et al. (2023) created statistical emulators of (a) global mean ΔFaer and its components ΔFaci and ΔFari, (b) regional mean cloud and radiative properties, and (c) values from transects spanning stratocumulus- to cumulus-dominated regions (Sect. 2.3). In total, they created and evaluated around 450 statistical emulators. Here, we create emulators of annual mean ΔFaci at the model grid box level. Thus, we densely sample model ΔFaci uncertainty, at more than 27 000 geographical locations, using the same set of 1 million model variants (parameter combinations).
2.3 Observational constraint
Regayre et al. (2023) constrained ΔFaci using multiple satellite-derived cloud and radiation properties. Observations used for constraint included liquid water path (LWP), liquid cloud fraction (fc), cloud optical depth (τc), and cloud droplet effective radius (re) from the MODIS instruments (King et al., 2003). τc and re values were used to calculate cloud droplet number concentration (Nd) values. Observational constraints also included outgoing top-of-the-atmosphere shortwave radiative flux (FSW) measurements from the Clouds and the Earth's Radiant Energy System experiment (CERES; Loeb et al., 2018). Regional mean observations were derived for regions of persistent stratocumulus cloud in the North and South Atlantic, North, and South Pacific and Southern Ocean. R23 also used hemispheric differences in marine Nd for constraint (Hd). For each observation type, monthly means, annual means and seasonal amplitudes were treated as distinct observations. R23 additionally made use of multiple observed relationships between aerosol, cloud, and radiation properties along transects from stratocumulus- to cumulus-dominated regions during hemispheric summer months.
In total, R23 evaluated the ΔFaci constraint potential of more than 450 observations (more than 66 variables in 5 regions at multiple times). Nearly half of these observations were removed from the R23 constraint method because they were identified as being associated with model structural deficiencies, revealed through pair-wise analysis of constraints using the original 1 million model variants. Structural model deficiencies lead to inconsistencies in pairs of model variables, where they constrain the model towards non-overlapping sets of parameter combinations (referred to as the history-matching “terminal case”; Salter et al., 2019). Thus, constraint to one observable variable greatly decreases model skill at simulating the other, and constraint using both variables forces a compromise towards a set of model variants with low skill at simulating either. R23 removed variables associated with structural deficiencies and used the remaining around 225 observations they considered pairwise consistent with Nd, to search of an optimal constraint on ΔFaci.
The optimal constraint on ΔFaci achieved in R23 made use of just 13 observable variables. The R23 approach started with the observation that most strongly constrained ΔFaci. They then identified the most compatible observation that, in combination with the first, provided the strongest constraint on ΔFaci. This process continued by progressively adding the observation that most tightly constrained ΔFaci uncertainty in combination with the existing set of observations. At each stage of the constraint process, R23 compared emulator mean and observed values, whilst accounting for statistical emulator uncertainty to retain a minimum of 5000 model variants and avoid over-constraint. Including additional observable variables beyond the optimal set weakened the constraint. Hence, R23 described the optimal constraint as the tightest constraint achievable with the chosen set of observations and structurally imperfect model.
2.4 Filtering implausible parameter values
In this article we explore how progressively adding observational constraints in the R23 optimal set affect the plausible ranges of uncertain parameters and the credible range of ΔFaci. We evaluate ΔFaci uncertainty in the “original” set of 1 million model variants and in the “unconstrained” set which excludes implausible parameter values that would otherwise dominate analysis of the effects of observational constraints on other parameters.
For most parameters, the R23 ΔFaci constraint affects the likelihood of some parameter values, as seen in the marginal distributions which are no longer uniform (Figs. S12 and S13 of Regayre et al., 2023). That is, in the set of model variants that agree with observations, a given parameter value is more likely to have a higher or lower value (as per the marginal distribution) than in the release version of the model. However, for the parameters related to cloud droplet activation (cloud updraft speed; sig_w) and the diameter of primary sulfate particles (prim_so4_diam), the constraint is stronger and ruled out part of the parameter range as observationally implausible – i.e., there is no way of combining these ruled out parameter values with the other 36 model parameters to bring them into agreement with observations (See R23 Figs. S12 and S13).
In the original set of 1 million model variants, ΔFaci is only sensitive to prim_so4_diam parameter values in a very narrow part of the parameter range (Appendix A, Fig. A1). For prim_so4_diam values lower than 10 nm, extremely high aerosol number concentrations lead to unrealistically large total surface area and smaller cloud condensation nuclei that results in an implausible suppression of cloud formation in the simulated present-day atmosphere, hence these values were ruled out by the R23 constraint. The dominance of implausibly low primary sulfate diameter effects inflated the relative importance of this parameter in the original sensitivity analysis – a known issue with high-dimensional sensitivity analyses (Saltelli et al., 2019). Thus, our analysis of the remaining ΔFaci uncertainty and the path to achieving the optimal constraint, evaluates ΔFaci uncertainty in the original set of 1 million model variants and in the unconstrained set of around 900 000 model variants associated with primary sulfate diameters larger than 10 nm.
2.5 Causes of remaining variance
To quantify the sensitivity of ΔFaci to each of the 37 uncertain model parameters (and more generally, the dependence of ΔFaci on parameters), we fit non-linear Generalized Additive Models (GAMs) to the emulated climate model output, implemented using the “pygam” python package (Servén et al., 2018). GAMs are particularly well-suited for analyzing high-dimensional parameter spaces with heterogeneously distributed data, which suits our needs since observational constraints can remove parts of parameter space and even reduce the range of some parameter values (R23; Sect. 2.4). We quantify the relative importance of parameters as causes of ΔFaci variance (referred to throughout as “causes of uncertainty”), using variance-based sensitivity analyses (Strong et al., 2014). Following R23, we quantify the sum of parameter effects on ΔFaci variance then calculate the proportion of this total that is caused by each parameter. However, the relative importance values here differ from R23 because the GAM method accounts for non-linearities in ΔFaci dependence on changing parameter values, whereas R23 used partial correlations which primarily capture the strength of linear relationships.
Here, marginal variances are calculated by setting all other parameters to the median of the original or constrained sample, then evaluating output from the GAM function. Although the GAM fit is multi-dimensional, this approach allows us to derive ΔFaci variances that are only affected by changes in the target parameter. Using the GAM approach, we can robustly quantify causes of remaining uncertainty after each observational constraint, or combination of constraints, is applied, by calculating marginal sensitivities over the partially reduced parameter space. Thus, this approach can provide insight into how the relative importance of model parameters as causes of ΔFaci uncertainty evolve as observational constraints are progressively added to achieve the R23 optimal set.
2.6 Regional clusters of model behaviour
We use K-means clustering (Pedregosa et al., 2011) to identify distinct sets of model behaviour. K-means clustering is an unsupervised machine-learning technique, that partitions data into clusters of similar behaviour, based on similarity to cluster means. In our case, K-means clusters are defined using proportional contributions to ΔFaci uncertainty from 37 model parameters, across more than 27 000 geographical locations. Using this approach, we identify regions of shared causes of ΔFaci uncertainty in model variants from (a) the original set of 1 million, (b) the unconstrained set of around 900 000, and (c) in the optimally constrained set of 5000.
We frame our evaluation of the processes that cause remaining ΔFaci uncertainty in three stages:
-
Evaluate how causes of global mean ΔFaci uncertainty change as each observational constraint was added in R23 (Sect. 3.1). This approach will be used to isolate the effect of each observation on processes-level uncertainties and to highlight how observational constraints combine to form an overall optimal constraint.
-
Quantify causes of remaining ΔFaci uncertainty at the model grid box level (Sect. 3.2). By doing so, we aim to identify any parameters with spatially coherent influence on remaining ΔFaci uncertainty (Sect. 3.3).
-
Group the causes of model ΔFaci uncertainty at the grid box level into clusters with similar causes of parametric uncertainty (Sect. 3.4). We evaluate these spatial patterns to understand where the R23 constraint was strong and where it was weak, and to identify existing and novel observations that could further constrain ΔFaci.
3.1 The effect on the causes of ΔFaci uncertainty of progressively adding observations
Regayre et al. (2023) analyzed one-at-a-time perturbation experiments and evaluated shared causes of uncertainty (between ΔFaci and observable variables) to provide hypotheses about which of the 13 observations in the optimal set most likely contributed to constraining model parameters. Here, we use GAM analyses (Sect. 2.5) to examine the changes in parametric causes of ΔFaci uncertainty more closely as each constraint is applied.
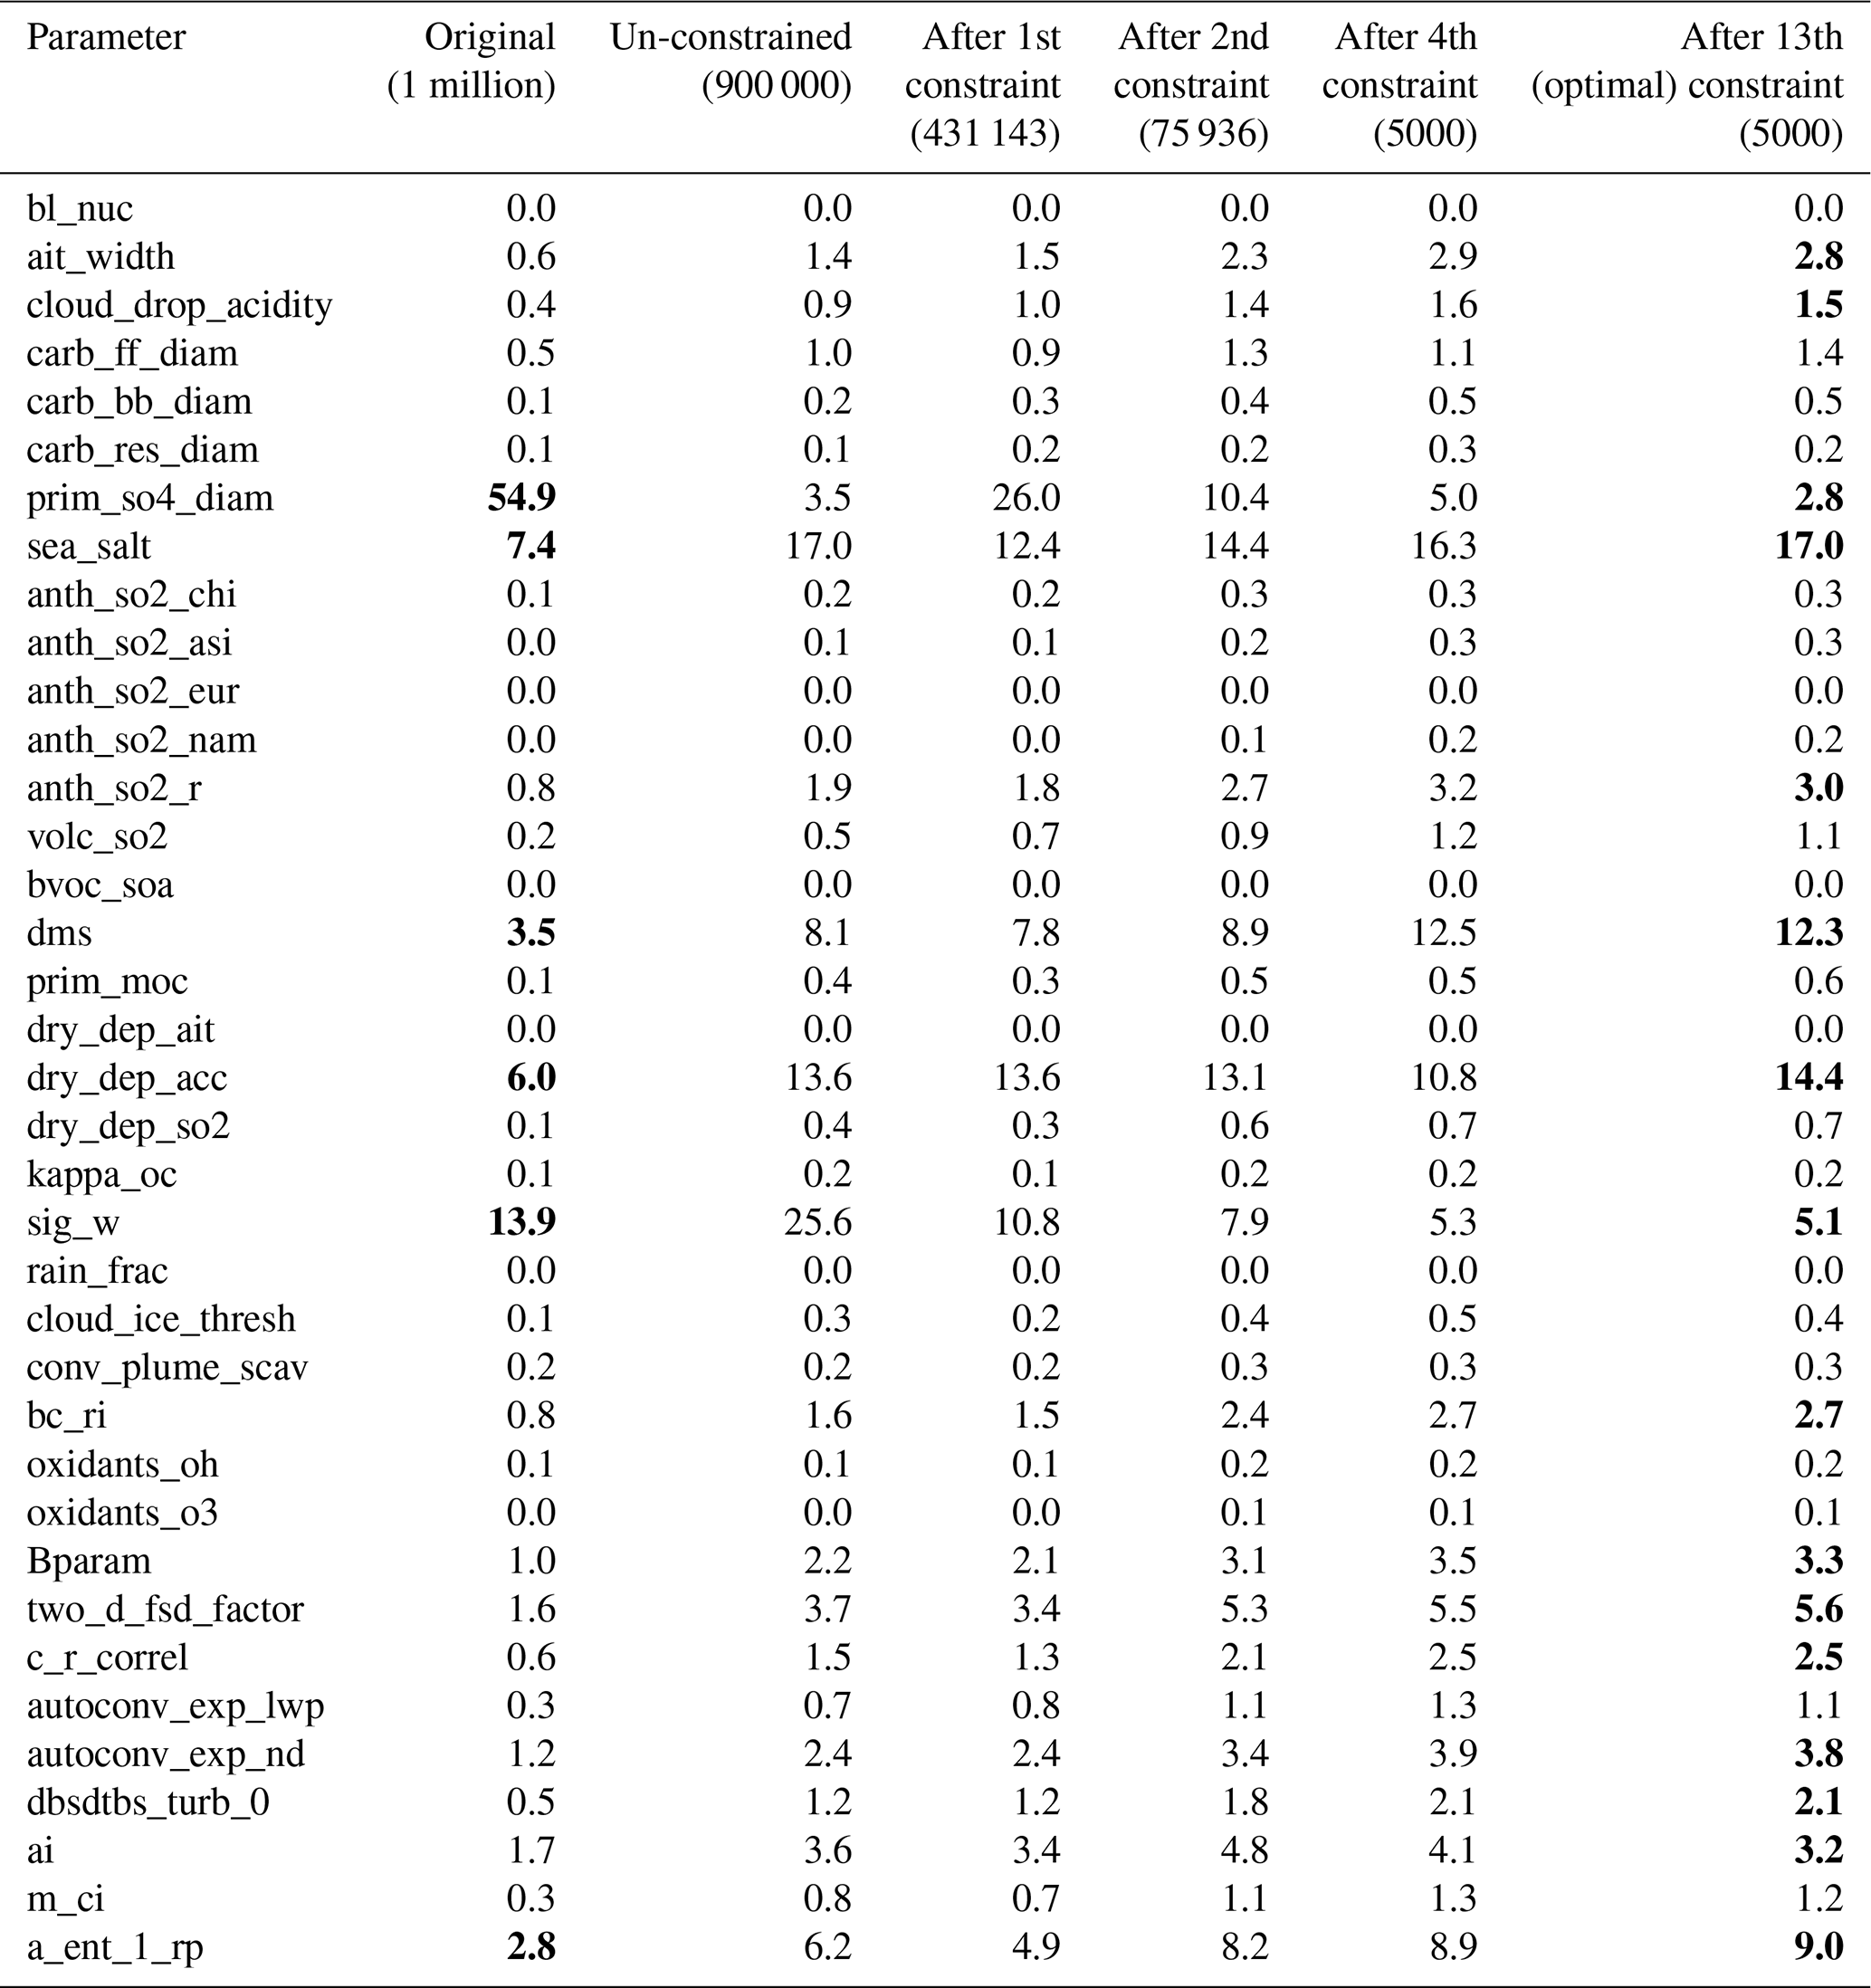
Figure 1 shows the most important parametric causes of global mean ΔFaci uncertainty for the original set of 1 million model variants and for the uncertainty that remains after progressively applying constraints until the R23 optimal constraint is reached. The parameter controlling the emission diameter of primary sulfate aerosol (prim_so4_diam) is the dominant cause of ΔFaci uncertainty (around 55 % of uncertainty) in the original set of model variants (See Sect. 2.4; Table A2). The cloud updraft velocity parameter (sig_w), which affects droplet activation, causes around 14 % of the ΔFaci uncertainty and several other parameters related to natural aerosol emission fluxes and removal processes each cause around 5 % to 10 % of the ΔFaci uncertainty (Table A2). The small number of model parameters affecting the original ΔFaci uncertainty suggests that an informed choice of observations could achieve strong constraint. However, we find that the relative importance of uncertainty sources changes as constraints are progressively applied. Parameters that initially seem unimportant contribute more than a few percent to the remaining uncertainty after constraint, which suggests in-depth analysis of spatial variation in the process-level drivers of remaining uncertainty, before and after optimal constraint, may reveal observations with potential to further constrain ΔFaci.
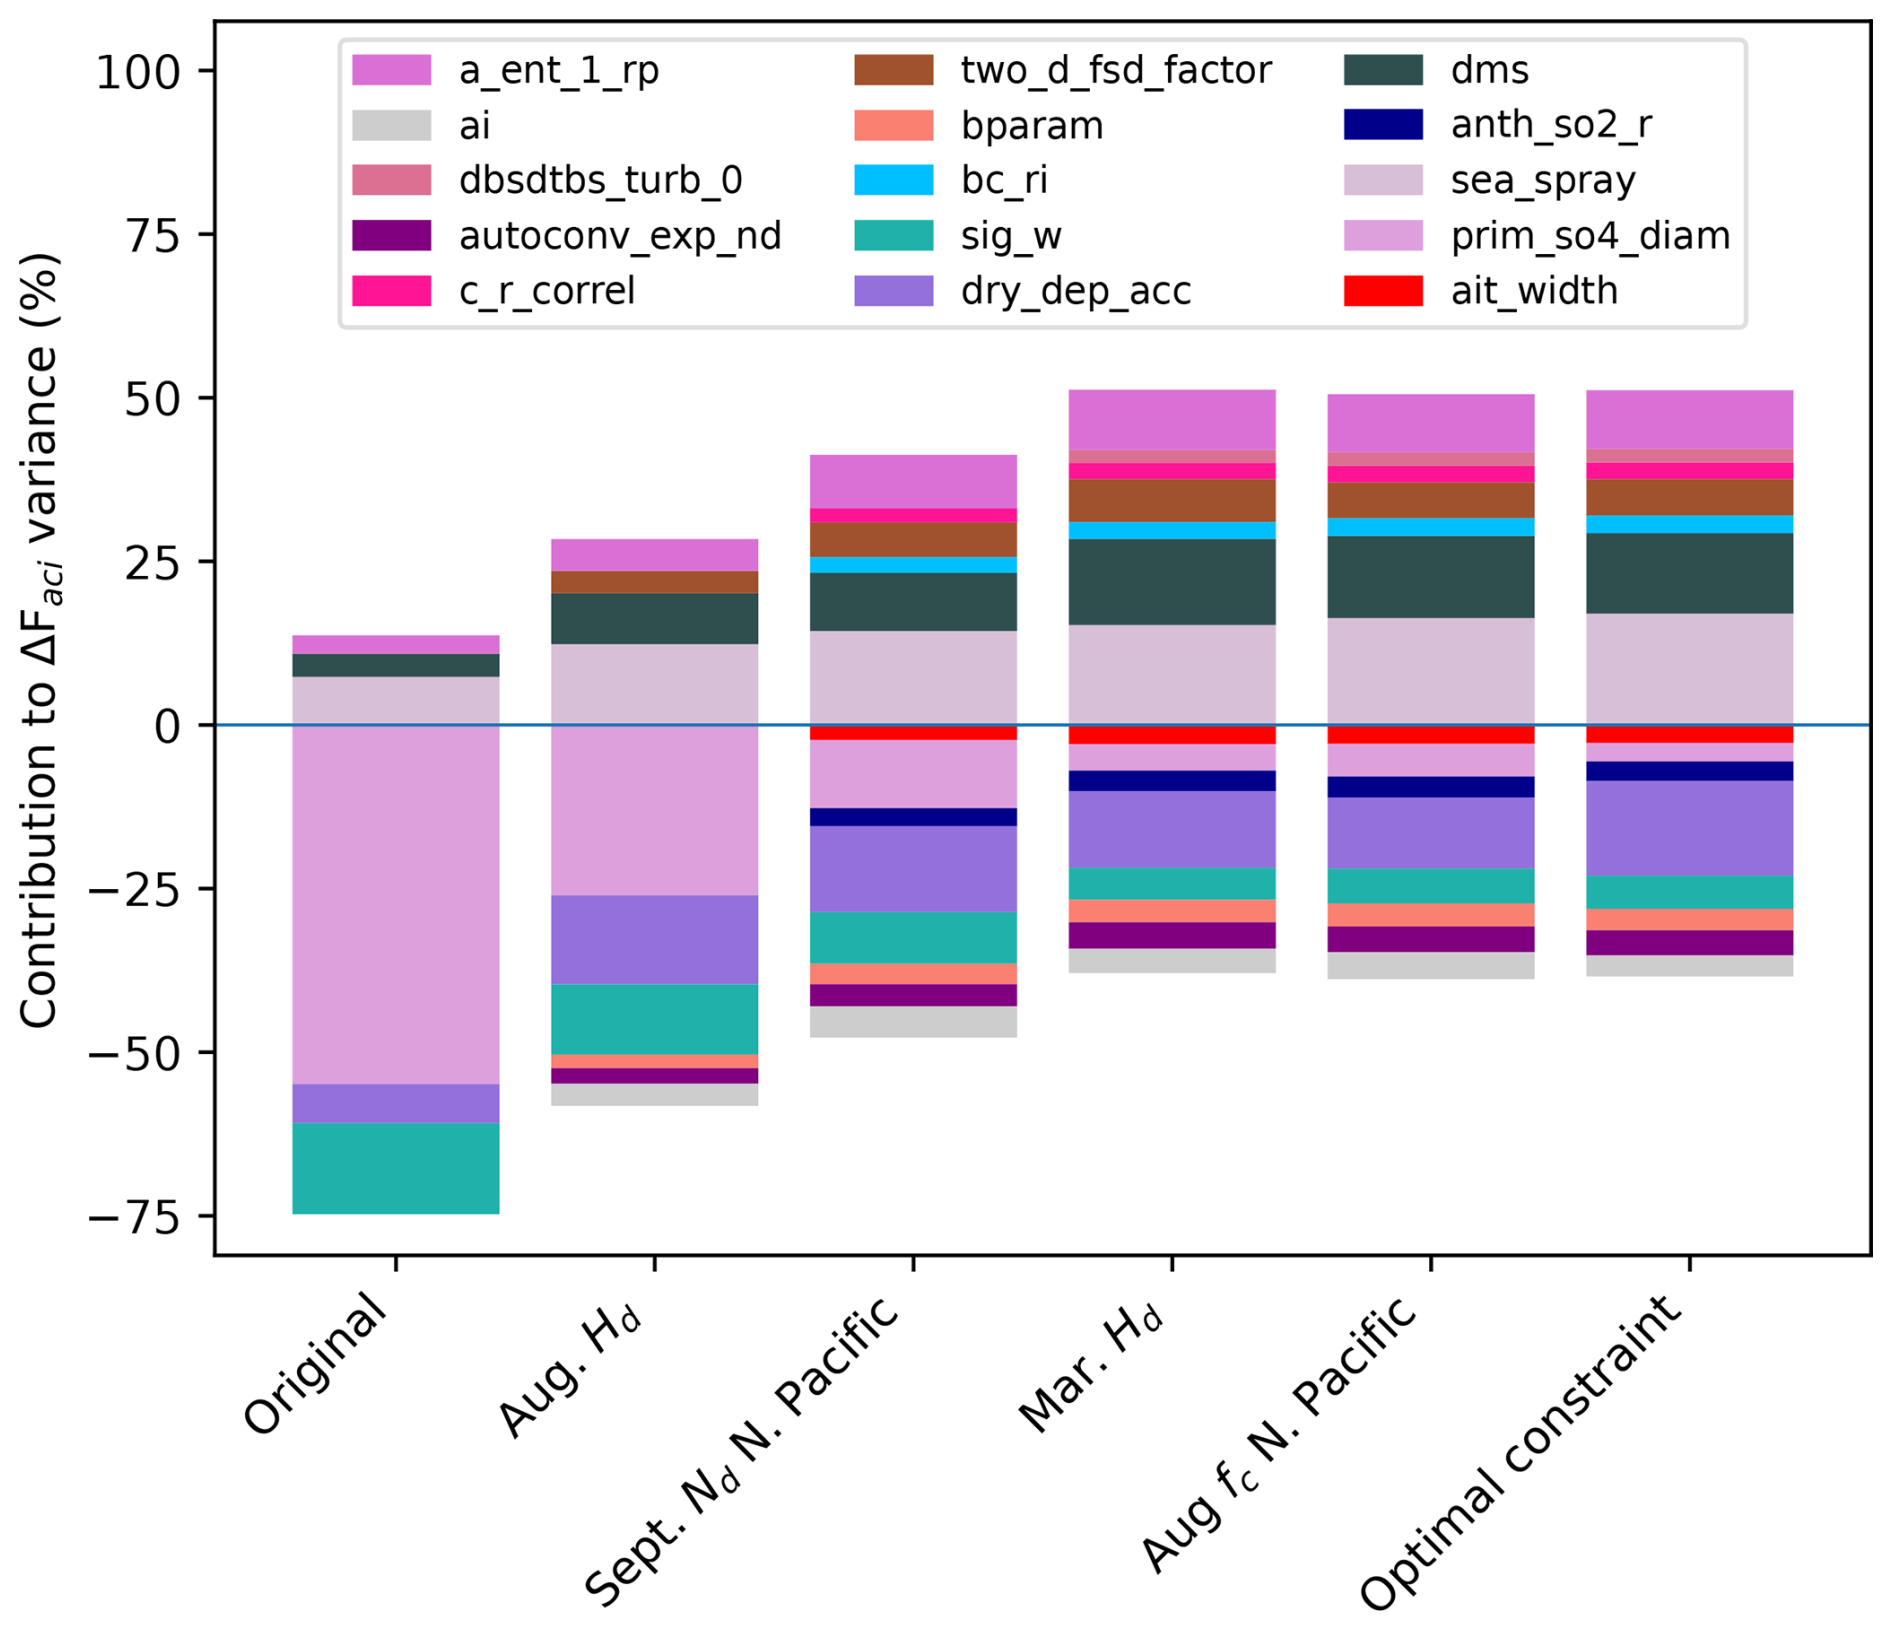
Figure 1Causes of uncertainty in ΔFaci for the original set of 1 million model variants, and after observational constraint to August Hd (Aug. Hd), then progressively adding North Pacific Nd in September (Sept. Nd N. Pacific), March Hd (Mar. Hd), North Pacific fc in August (Aug. fc N. Pacific) and finally, for the R23 optimal constraint. Only parameters that cause at least 2 % of the uncertainty are shown. See Table A2 for contributions from all parameters. Parameter contributions to uncertainty are multiplied by the sign of linear ΔFaci sensitivity to increasing parameter values, thus for parameters below the zero line, increasing the parameter value reduces ΔFaci, making it more negative.
The first of the 13 observational constraints used to achieve the R23 optimal constraint is Hd in August. Observed Hd provides a contrast between marine Nd in the polluted Northern Hemisphere (NH) and the relatively pristine Southern Hemisphere (SH), which can act as a proxy for the difference in Nd between the present-day and early-industrial atmospheres (McCoy et al., 2020). Constraint to match observed Hd in August reduces the proportion of uncertainty caused by primary sulfate (prim_so4_diam) from around 55 % to only around 25 % and the proportion caused by cloud droplet activation (sig_w) from around 14 % to around 11 % (Fig. 1 and Table A2). The sig_w parameter is constrained towards lower values (Supplement Fig. S12 in R23), consistent with lower Nd concentrations in updraft-limited (mostly polluted NH) regions (Reutter et al., 2009), lower Hd (see Supplement Fig. S16 in R23) and thus weaker (less negative) ΔFaci (Fig. 1; below the zero line indicates increasing the sig_w parameter value strengthens ΔFaci). The prim_so4_diam parameter is constrained towards higher values which is also consistent with lower NH Nd and lower Hd values (Supplement Fig. S16 in R23; Cao et al., 2023). However, increasing primary sulfate diameters is associated with stronger (more negative) ΔFaci (Fig. 1) due to the dominant influence of the smallest particle diameter values on the ΔFaci dependence on this parameter (Sect. 2.4 and Fig. A1). Thus, the August Hd observation rules out the strongest and weakest ΔFaci values (tails of the ΔFaci distribution) reducing the 90 % credible range from (−1.6 to 1.0 W m−2) to (−1.2 to 0.2 W m−2). This significant reduction in importance of model parameters that dominate the original uncertainty, using just one observational constraint, highlights the importance of re-evaluating the remaining causes of ΔFaci uncertainty during the constraint process.
Other parameters cause a larger proportion of the remaining ΔFaci uncertainty after August Hd constraint (Fig. 1; Table A2). The most prominent increases in importance are in the turbulent cloud top entrainment parameter (a_ent_1_rp, a physical atmosphere parameter), natural aerosol emission parameters (dms and sea_salt) and the aerosol accumulation mode dry deposition velocity (dry_dep_acc), for which the contributions to uncertainty approximately double to between 5 % and around 14 %. Several physical atmosphere parameters (bparam, two_d_fsd_factor, autoconv_exp_nd and ai), which caused less than a few percent of the original ΔFaci uncertainty, emerge as important causes of remaining uncertainty after the Hd constraint. These results suggest over-reliance on selecting observational constraints based on original causes of ΔFaci uncertainty can be misleading, as these causes of uncertainty are likely to be amongst the easiest to constrain. In our case, implausibly low primary sulfate emission diameters and too-high droplet activation mask the influence of other causes of uncertainty, such as (a) those that affect the early-industrial background aerosol concentration (Carslaw et al., 2013) and (b) physical atmosphere parameters that affect ΔFaci by altering the atmospheric state (Regayre et al., 2018).
The relative importance of model parameters as causes of remaining ΔFaci uncertainty continues to evolve as additional observational constraints are applied, although the first few constraints cause the largest changes (Fig. 1 and Table A2). The prim_so4_diam and sig_w parameters contribute less to the remaining ΔFaci uncertainty with each additional constraint, to the point where after optimal constraint, these parameters together contribute only 8 % of the remaining ΔFaci uncertainty compared with nearly 70 % in the original set of model variants.
A different set of parameters cause the remaining global mean ΔFaci uncertainty, after optimal constraint, than those causing ΔFaci uncertainty in the original set of model variants (Fig. 1 and Table A2). Several parameters, mostly natural emission flux and physical atmosphere parameters, are effectively unconstrained by the optimal set of observations, so their contributions to remaining ΔFaci uncertainty increase with each new observational constraint. Parameters that affect background aerosol concentrations together cause nearly half of the remaining ΔFaci uncertainty after optimal constraint (sea_salt 17 %, dry_dep_acc 14 % and dms 12 %). This suggests there is potential for additional observational constraint of ΔFaci beyond the R23 optimal constraint using, for example, observations in remote marine regions (Regayre et al., 2020; Schmale et al., 2019). Additionally, several physical atmosphere parameters together cause around 32 % of the remaining ΔFaci uncertainty (a_ent_1_rp: 9 %, two_d_fsd_factor: 6 %, autoconv_exp_nd: 4 %, bparam and ai: 3 % each, and 1 % to 2 % from other parameters), which highlights the need to identify and use observations that will constrain physical atmosphere processes that cause ΔFaci uncertainty by altering the cloud properties and thus sensitivity to aerosol (Mülmenstädt et al., 2024).
3.2 Regional constraint and remaining ΔFaci uncertainty
In this section we explore where the R23 optimal constraint has the strongest and weakest effect on ΔFaci uncertainty. Figure 2a shows that in the original set of 1 million model variants, ΔFaci uncertainty (90 % credible interval) is concentrated in regions of persistent stratocumulus cloud as expected, since the radiative properties of clouds in these regions are highly susceptible to aerosol. However, ΔFaci is also highly uncertain (90 % credible interval range greater than 5 W m−2) over continental regions near to anthropogenic emission sources, particularly over central China, and South American coastal regions. Over most ocean regions, even those regions far from persistent stratocumulus cloud, the unconstrained ΔFaci uncertainty exceeds 2 W m−2.
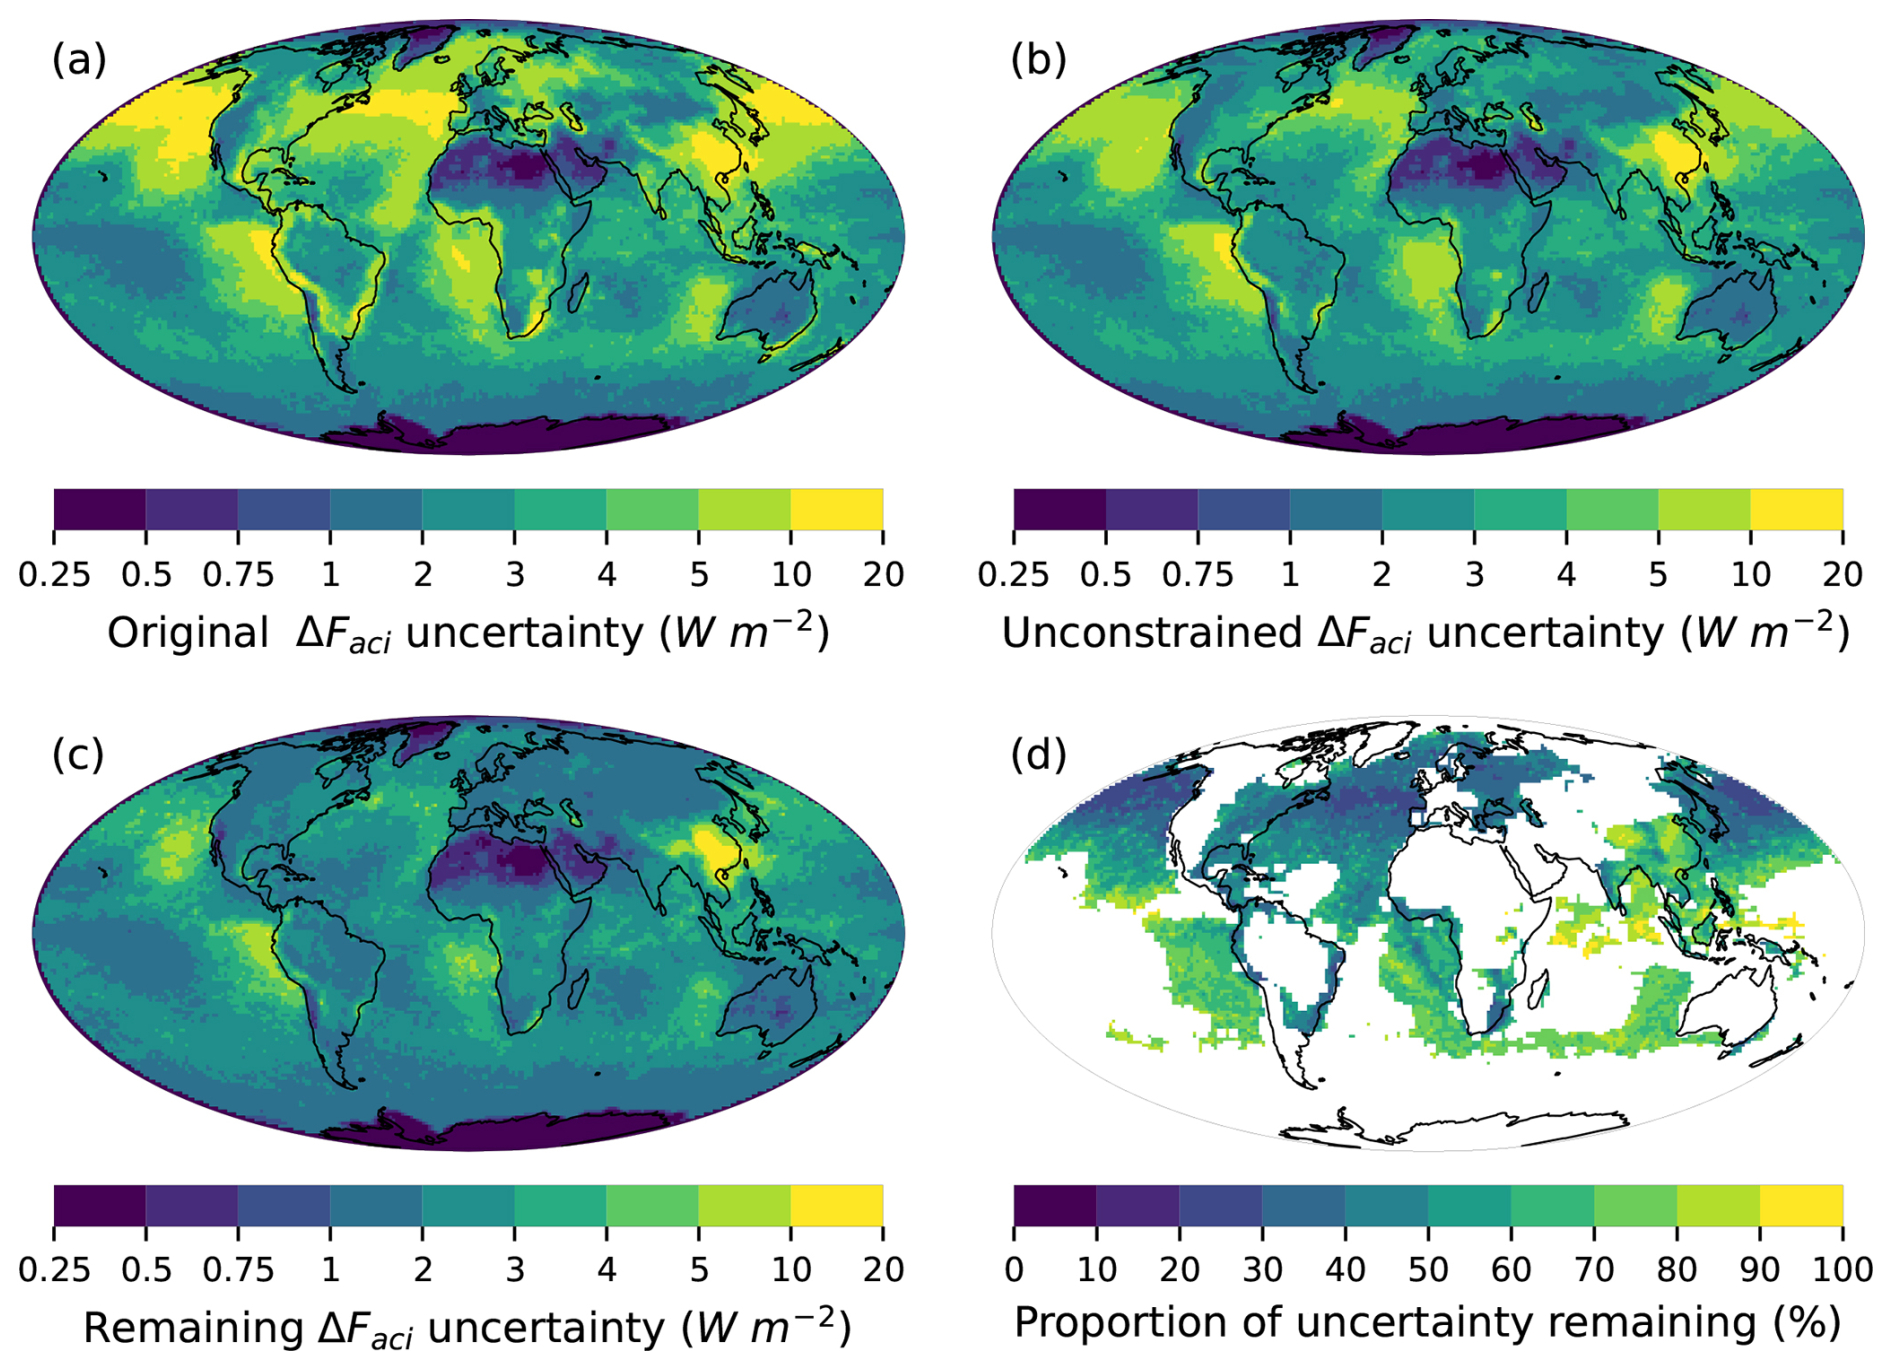
Figure 2Annual mean ΔFaci uncertainty (90 % credible interval ranges) in model grid boxes from (a) the original set of 1 million model variants, (b) the unconstrained subset with the lowest prim_so4_diam values filtered out and (c) the R23 optimally constrained set of model variants, as well as (d) the proportion of original uncertainty remaining after optimal constraint, in locations where original forcing was greater than 3 W m−2.
Figure 2b shows the effect of removing the 10 % of model variants associated with implausibly low primary sulfate diameters (Sect. 2.4 and Fig. A1). Uncertainty in ΔFaci is reduced to less than 10 W m−2 in most regions where it was originally between 10 to 20 W m−2 (Fig. 2a). This suggests a significant proportion of ΔFaci uncertainty near anthropogenic emission sources in the original set of model variants was caused by the over-wide perturbed range of the prim_so4_diam parameter in R23.
After the optimal constraint, uncertainty in ΔFaci is reduced by between 60 % to 80 % across NH marine regions, most continental regions, in the tropical Atlantic and very prominently along the South-East Atlantic shipping corridor to the west of Africa (Fig. 2c, d) – note the clear shipping lane in Fig. 2d where primary sulfate will have dominated the uncertainty in the original set of model variants. However, there are some regions where ΔFaci uncertainty is largely unaffected by the R23 optimal constraint. For example, over parts of the South Pacific, North-East Pacific and outside the South Atlantic shipping corridor, ΔFaci uncertainty is reduced by less than 30 %, so remains between 4 to 10 W m−2. Additionally, over much of inland China the constraint is less than around 10 % and the remaining uncertainty is more than 10 W m−2. These results suggest there is potential to further constrain ΔFaci using observations that target whichever processes cause remaining uncertainty in these regions.
3.3 Causes of remaining ΔFaci uncertainty at the regional level
In this section we quantify parametric contributions to remaining ΔFaci uncertainty after optimal constraint at the model grid box level. It is essential to constrain sub-global ΔFaci because anthropogenic aerosol can produce regional climate responses that contribute to projection uncertainty (e.g. Chemke and Dagan, 2018; Peace et al., 2022; Shindell, 2014; Williams et al., 2022). Regional variations in the relative importance of parameters as causes of ΔFaci uncertainty can be overlooked by global mean analyses (Regayre et al., 2015). Evaluating uncertainty at the model grid box level can reveal (a) cancellation of regional effects in the global mean, where the ΔFaci dependence on model parameters has opposing signs in different regions, (b) large but geographically isolated causes of ΔFaci uncertainty that do not stand out in global mean analyses, and (c) widespread small contributions to uncertainty that compound to elevate parameter importance in the global mean analysis. Each of these cases demands a different strategy for further constraint of ΔFaci uncertainty.
Regional patterns of parameter influences on remaining ΔFaci uncertainty reveal a more complex picture than is apparent from an analysis of the global mean (Sect. 3.1). Figure 3 shows maps of parametric contributions to ΔFaci uncertainty after optimal constraint, weighted by the remaining uncertainty (Fig. 2c) and the sign of ΔFaci dependence on each parameter (as with Fig. 1). These composite maps highlight the parameters that cause remaining uncertainty and the regions where contributions are most pronounced. Although calculations were performed at the model grid box level, Fig. 3 reveals spatially coherent patterns of parameter influences on ΔFaci uncertainty. At the global mean scale, only 6 of the 37 parameters cause 5 % or more of the remaining ΔFaci uncertainty (Fig. 1 and Table A2) but at the regional scale at least 15 parameters significantly affect ΔFaci uncertainty in multiple regions (Fig. 3) and almost all parameters contribute to remaining ΔFaci uncertainty in at least one region (Figs. A2, A3).
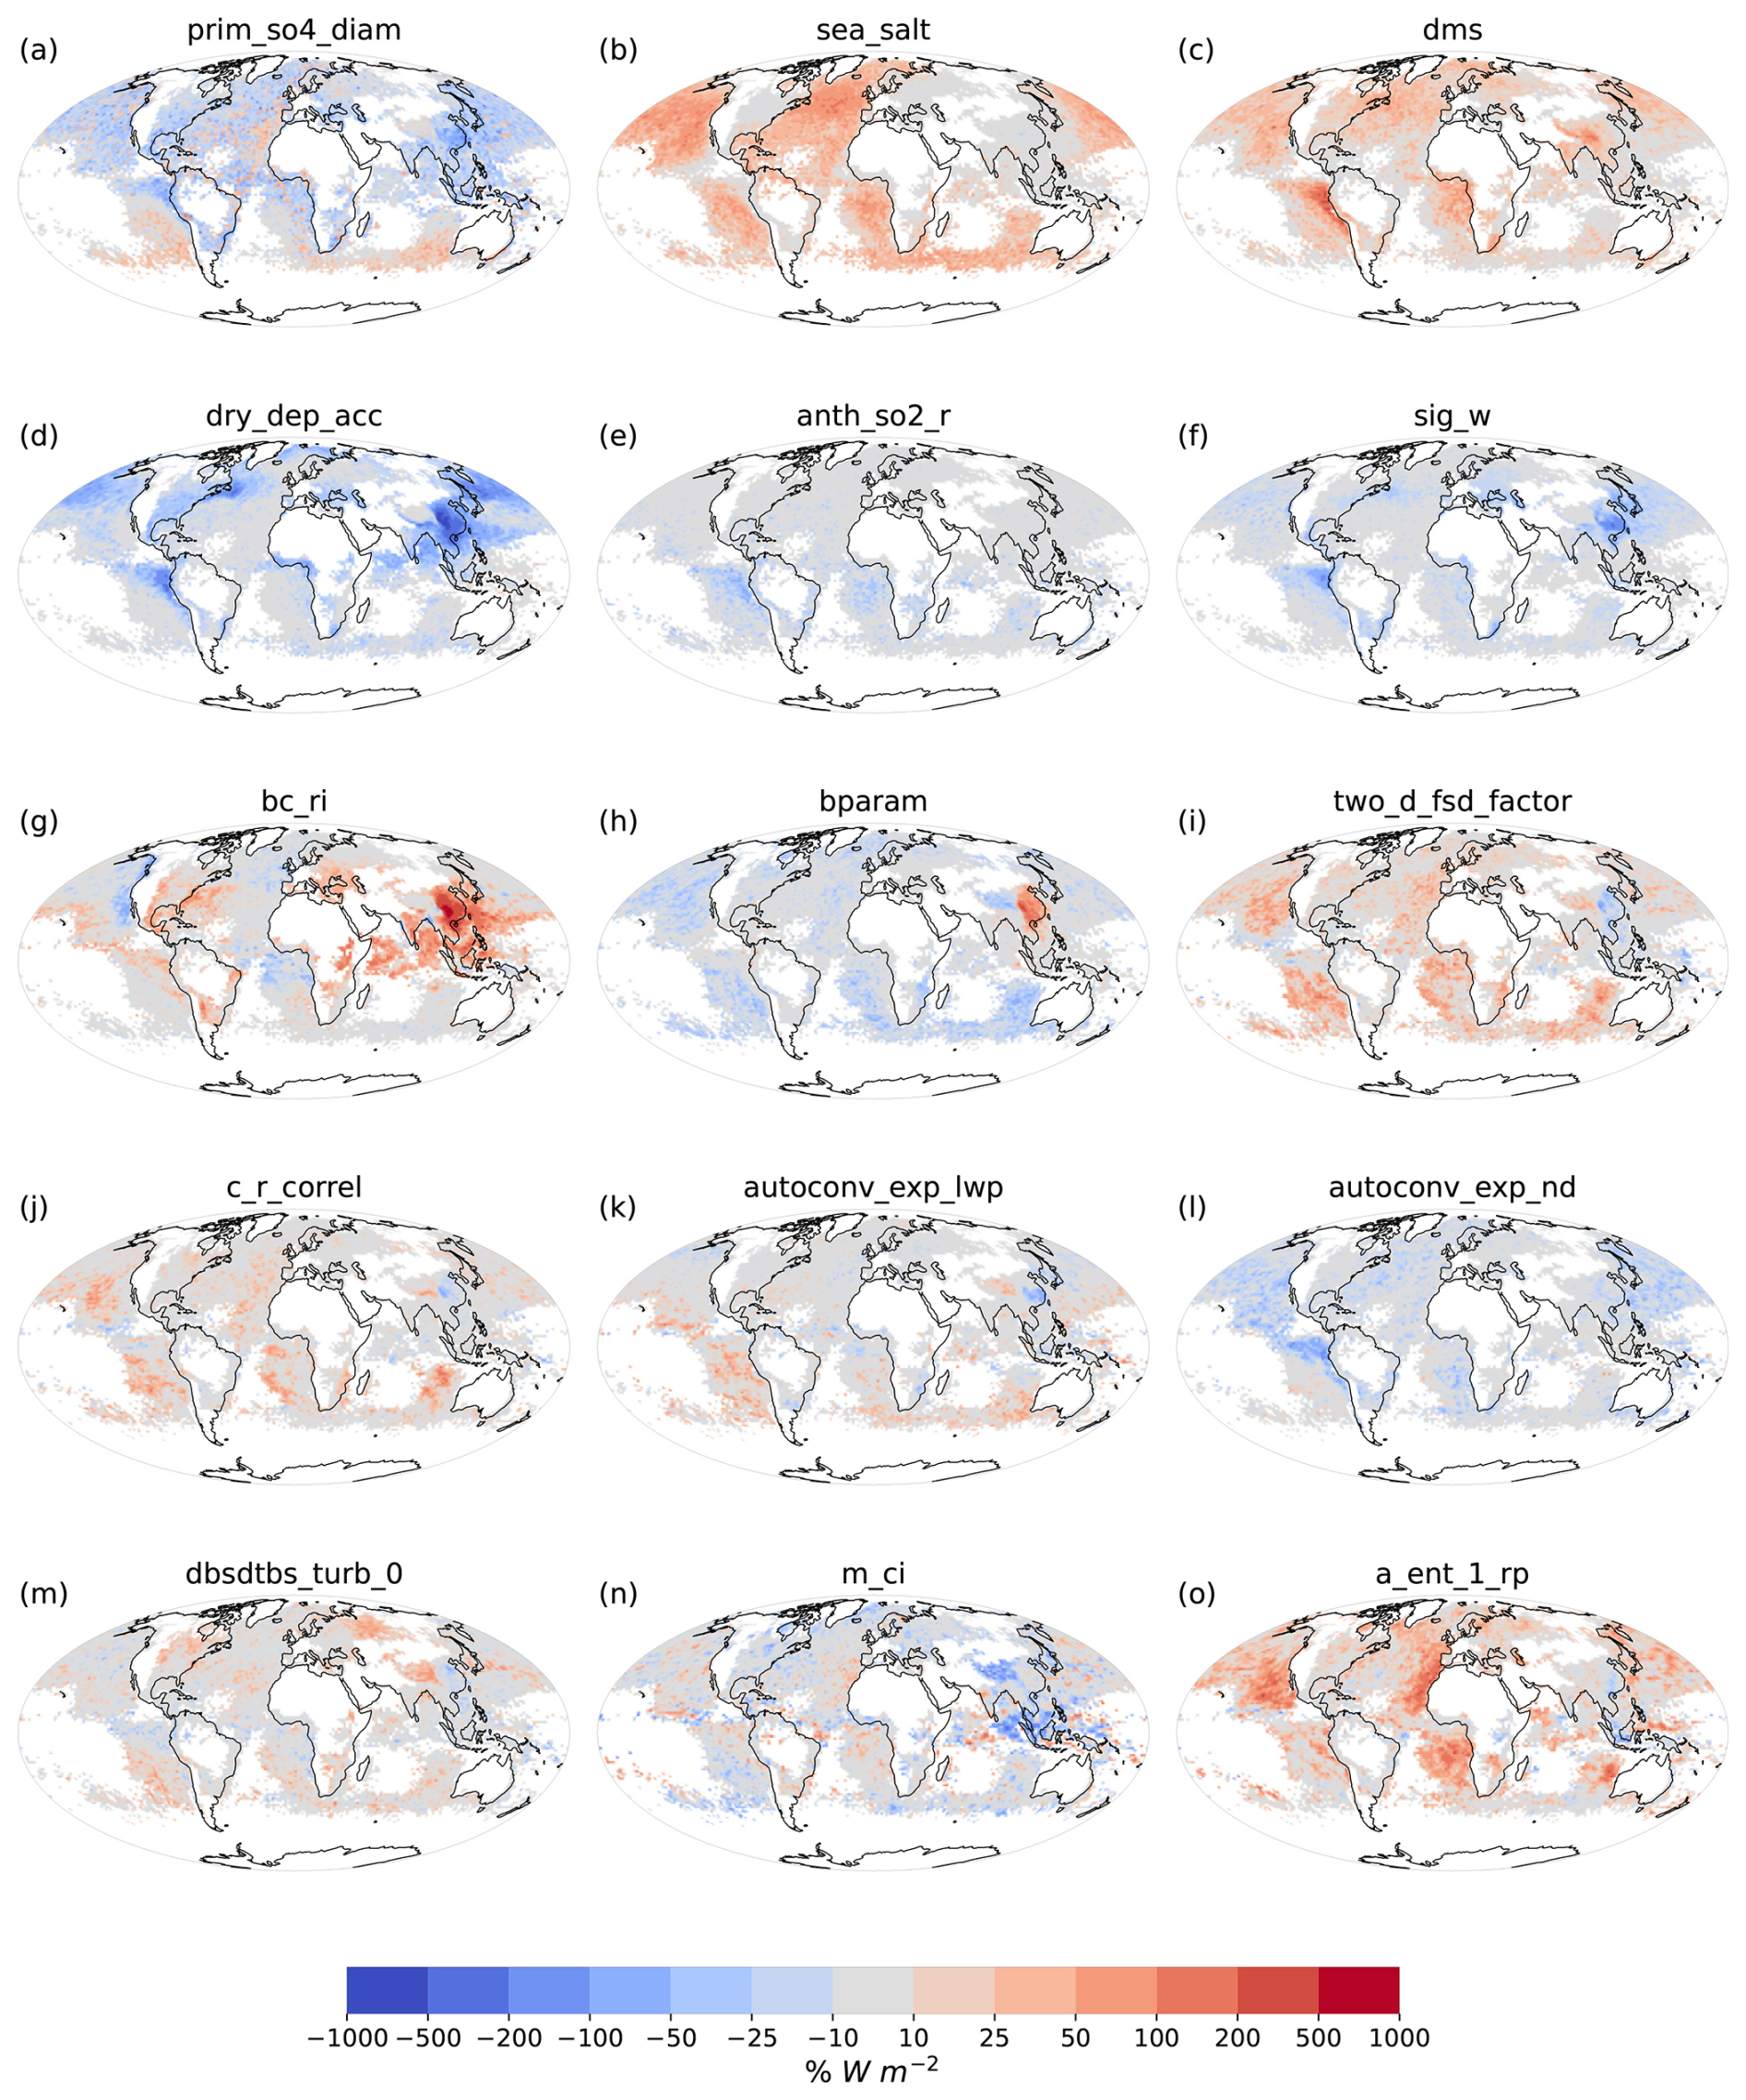
Figure 3Maps of key parametric causes of remaining ΔFaci uncertainty after R23 optimal constraint. Shading indicates the proportion of ΔFaci uncertainty caused by individual parameters, multiplied by the 90 % credible interval range in that grid box and by the sign of the ΔFaci sensitivity to increasing the parameter value. Negative values indicate increasing the parameter value is associated with stronger (more negative) ΔFaci values. Regions where the ΔFaci 90 % CI is less than 3 W m−2 are masked.
The parameters controlling primary sulfate emission diameter (prim_so4_diam) and cloud droplet activation (sig_w) were tightly constrained by R23 (Fig. 1), but together they still contribute more than 50 % of the remaining ΔFaci uncertainty in some regions, notably over China and the South American coast where more than 50 % of the original uncertainty remains (Fig. 2d). If ΔFaci dependence on these parameters were similar across all regions, the ΔFaci uncertainty would be constrained everywhere. However, the uncertainty caused by these parameters is reduced in some regions but not others, which suggests ΔFaci dependence on prim_so4_diam and sig_w (in conjunction with other parameter effects) over China and the South Pacific is not the same as the ΔFaci dependence in regions where ΔFaci was more strongly constrained (Fig. 2d).
Several parameters make large-scale, spatially coherent contributions to remaining ΔFaci uncertainty. For example, the sea_salt and dms parameters are important over most marine environments, contributing 17 % and around 12 % of the remaining global mean ΔFaci uncertainty respectively (Fig. 1). An increase in the magnitude of these natural aerosol emission parameters weakens ΔFaci (less negative) everywhere. However, sea_salt has a strong influence on global mean ΔFaci uncertainty due to its influence in the NH, whilst dms is most important in the south-eastern Pacific coastal region. The dms parameter affects secondary aerosol formation and particle growth, so causes more remaining ΔFaci uncertainty in this relatively polluted region with high present-day aerosol concentrations. The aerosol removal parameter dry_dep_acc also causes around 14 % of the remaining ΔFaci uncertainty. This parameter is most important in regions of outflow from anthropogenic pollution sources. Increasing aerosol removal rates in these regions strengthens annual mean ΔFaci (more negative) by reducing baseline aerosol concentrations which makes clouds more susceptible to aerosol changes (Carslaw et al., 2013), though the sign of this effect varies across seasons (Regayre et al., 2015). Additionally, the parameter controlling turbulent entrainment, a_ent_1_rp, causes around 9 % of the remaining ΔFaci uncertainty, with the largest contributions in marine regions associated with stratocumulus to cumulus transition. Increasing the entrainment rate weakens ΔFaci (less negative) in these regions by reducing cloud amount and thus susceptibility to aerosol changes.
The sign of ΔFaci dependence on parameter perturbations can vary between regions. This indicates that changing a parameter value strengthens ΔFaci in some regions but weakens it in others. For example, there is a clear boundary between Eastern and Western China, where the dependence of ΔFaci on several physical atmosphere parameters changes sign (bparam, two_d_fsd_factor, c_r_correl, autoconv_exp_lwp, dbsdtbs_turb_0, a_ent_1_rp). These sign changes are also evident within some ocean basins (e.g. dbsdtbd_turb_0 and m_ci in the South Pacific; two_d_fsd_factor in the North Atlantic). Furthermore, the change in sign of ΔFaci dependence on physical atmosphere parameters aligns spatially with the influence of the parameter controlling black carbon radiative properties (bc_ri). For example, this parameter is the dominant cause of ΔFaci uncertainty in central China (more than 30 %) yet contributes relatively little to ΔFaci uncertainty in neighbouring Chinese regions (around 10 %). We hypothesise the sign of ΔFaci dependence on physical atmosphere parameters is determined by the effect of the bc_ri parameter, which determines the importance of physical atmosphere parameters by affecting boundary layer stability and cloud properties including cloud depth (Bond et al., 2013; Zhuang et al., 2010).
Non-uniform regional variation in the parameters causing ΔFaci uncertainty means that global mean ΔFaci is resistant to the type of broad regional mean observational constraints applied by R23. That is, comparing regional mean model output to observations sub-optimally combines smaller-scale variations in ΔFaci dependence on uncertain model parameters. Thus, this analysis of remaining ΔFaci uncertainty at the model grid box scale provides new insight into how observational constraints can be calculated and applied. In the following section, we take this analysis further by clustering the data according to shared causes of remaining ΔFaci uncertainty rather than by geographical region. Theoretically, further ΔFaci constraint could be achieved using targeted observations within these clusters of shared causes of uncertainty (Lee et al., 2016).
3.4 Regional clusters of remaining ΔFaci uncertainty and observations to constrain them
In this section, we explore how clustering regions according to their shared causes of remaining ΔFaci uncertainty can inform future strategies for further observational constraint.
In Fig. 4 we cluster the combinations of parameters that cause unconstrained and remaining ΔFaci uncertainty (see also Fig. A4 – a similar map for the original ΔFaci uncertainty). Each cluster is concentrated in regions determined by the importance of locally dominant processes. Neighbouring clusters typically share one or more important parameters, which suggest causes of ΔFaci uncertainty vary systematically across regions defined by these clusters. Spatial coverage of some clusters is reduced by the optimal constraint. Coverage is reduced by at least 75 % for the 2nd (orange) and 8th (grey) clusters and by around 50 % for the 3rd (green) cluster after optimal constraint. Reduced spatial coverage of these clusters (across continental Europe and North America, and high latitude marine regions) suggests combinations of parameters associated with them are constrained by R23 in certain areas. However, the persistence of these clusters in other regions suggests ΔFaci dependence on model parameters is not uniform within clusters. This may be due to interactions with other uncertain parameters or regional differences in how parameters affect ΔFaci.
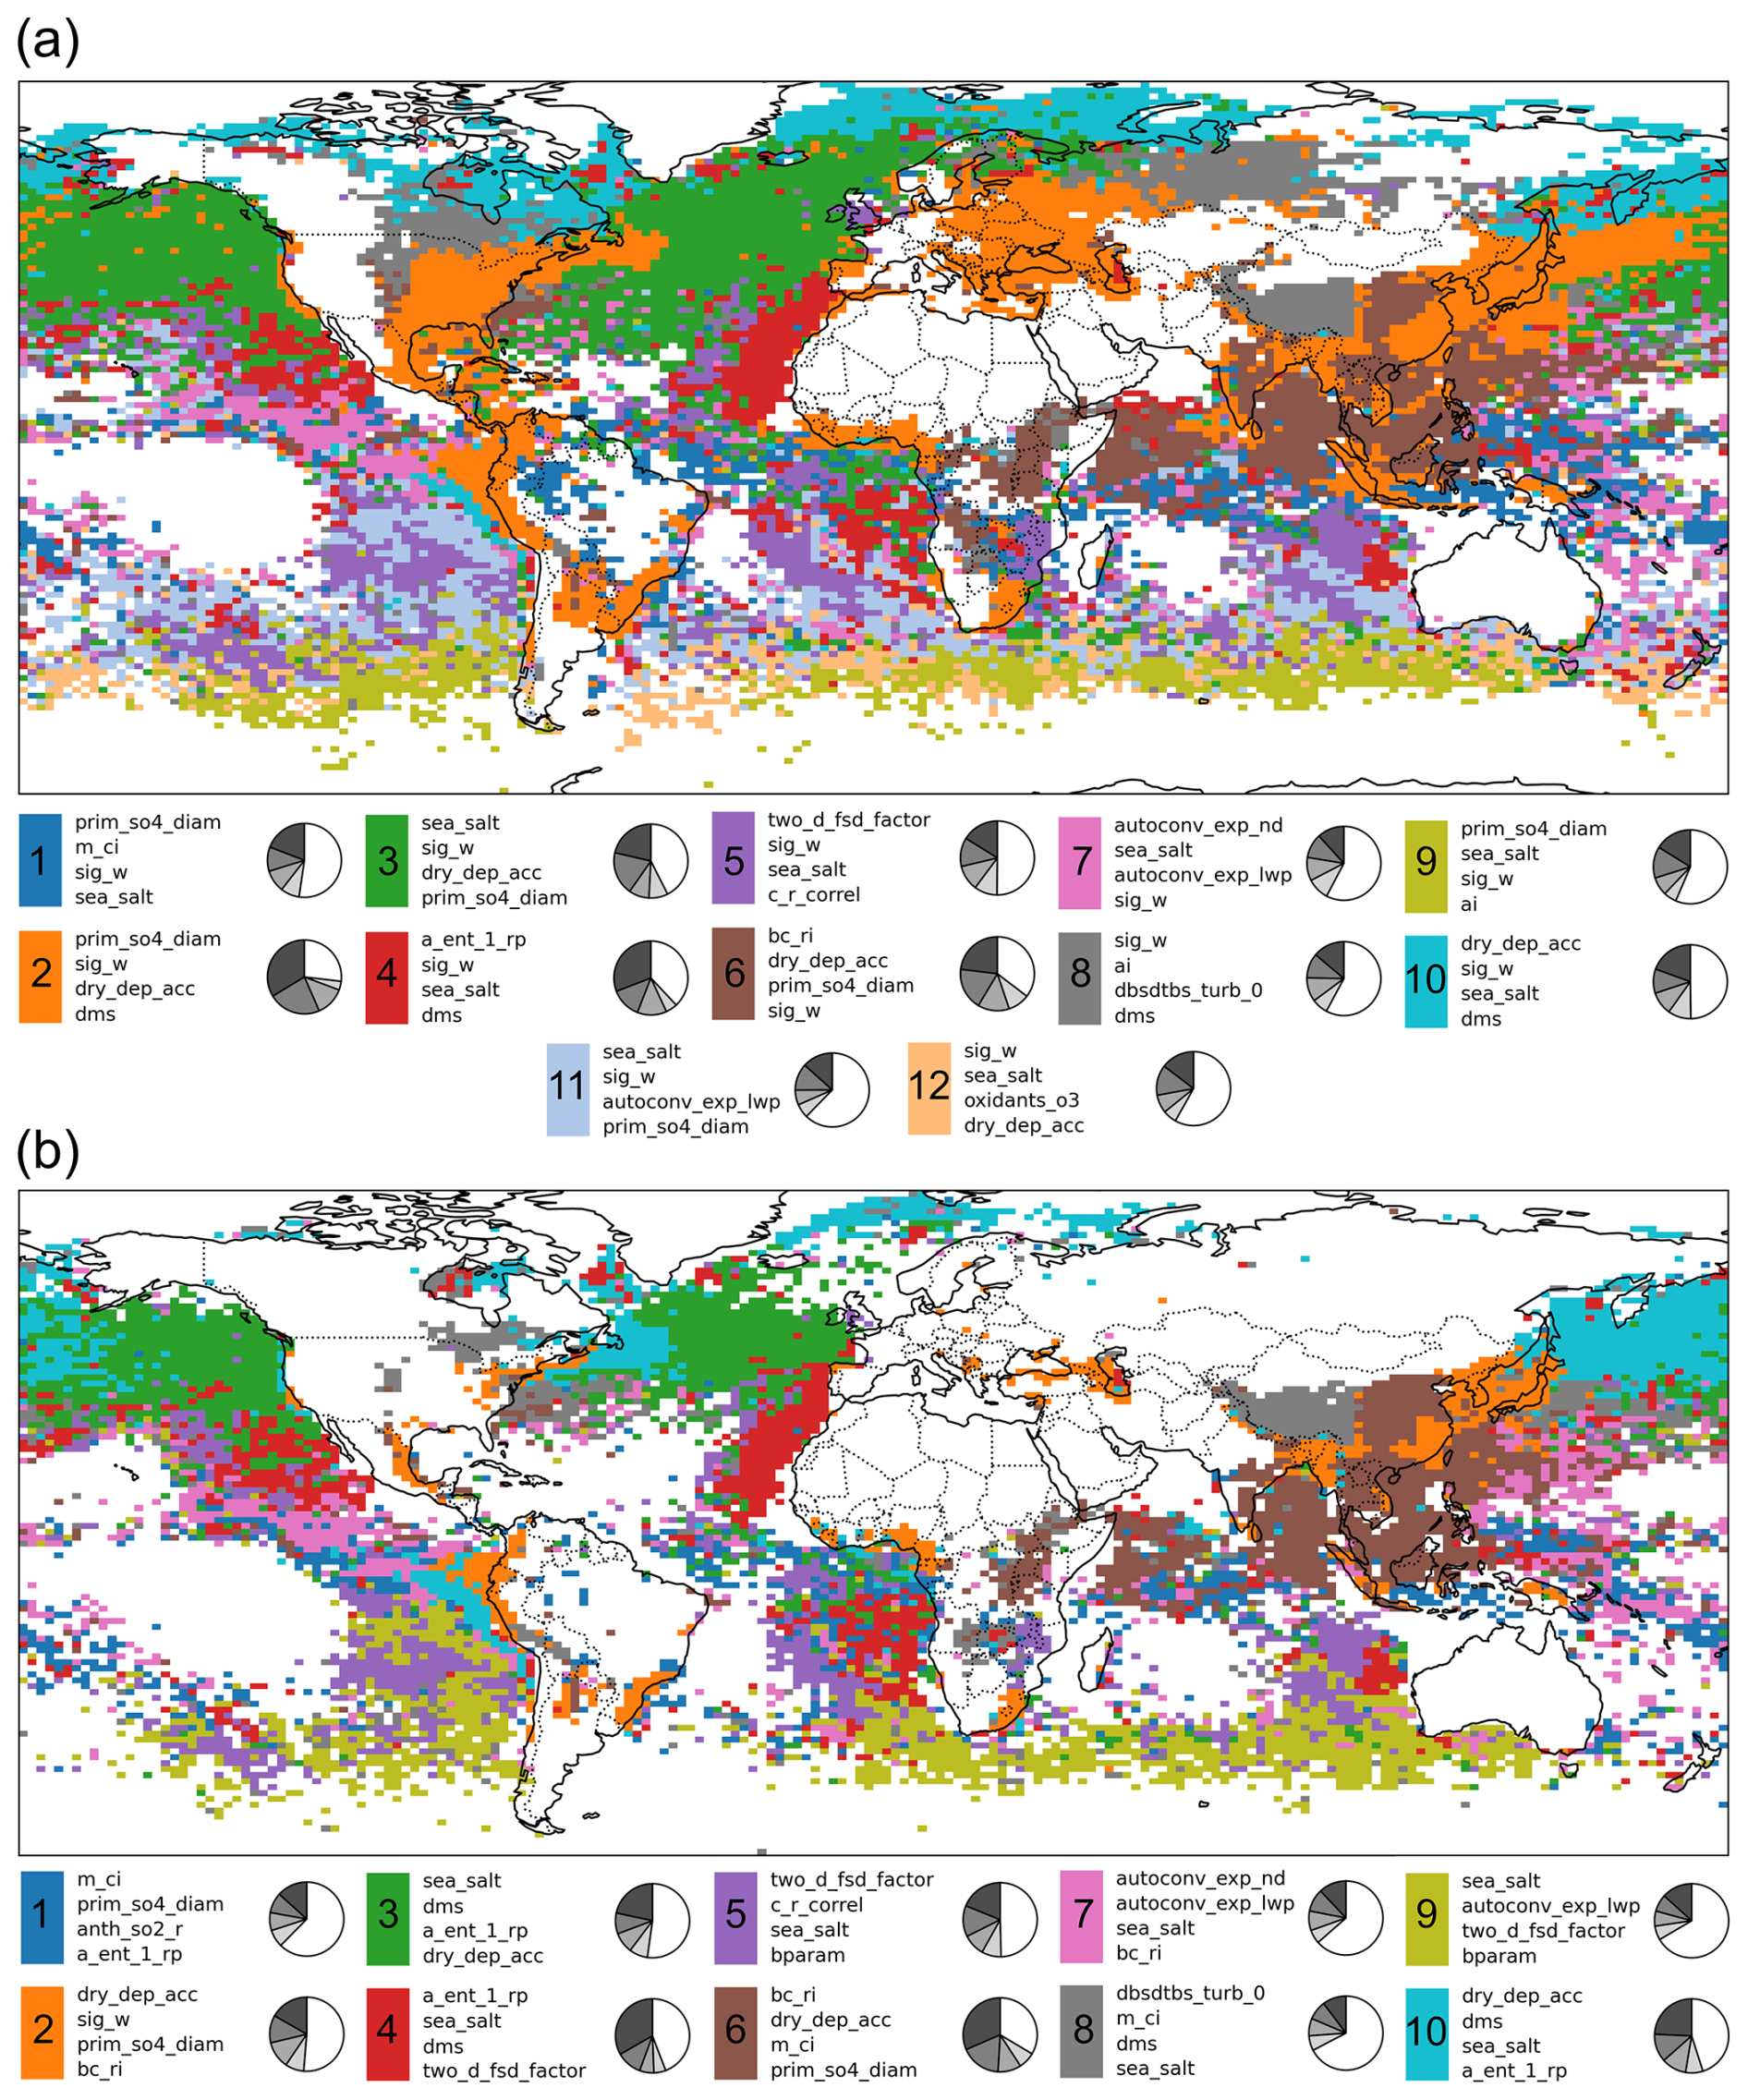
Figure 4Maps of shared causes of remaining ΔFaci uncertainty, (a) in the unconstrained set of model variants (the 90 % of the original 1 million with prim_so4_diam parameter values larger than 10 nm; Sect. 2.4), and (b) after R23 optimal constraint. Model grid boxes where remaining ΔFaci uncertainty is less than 0.5 W m−2 are masked. The legend shows the 4 most important causes of uncertainty in each cluster and counter-clockwise shading in the pie charts shows the corresponding proportions of uncertainty caused by these parameters, out of 100 % total, with the white region representing contributions from the other 33 parameters.
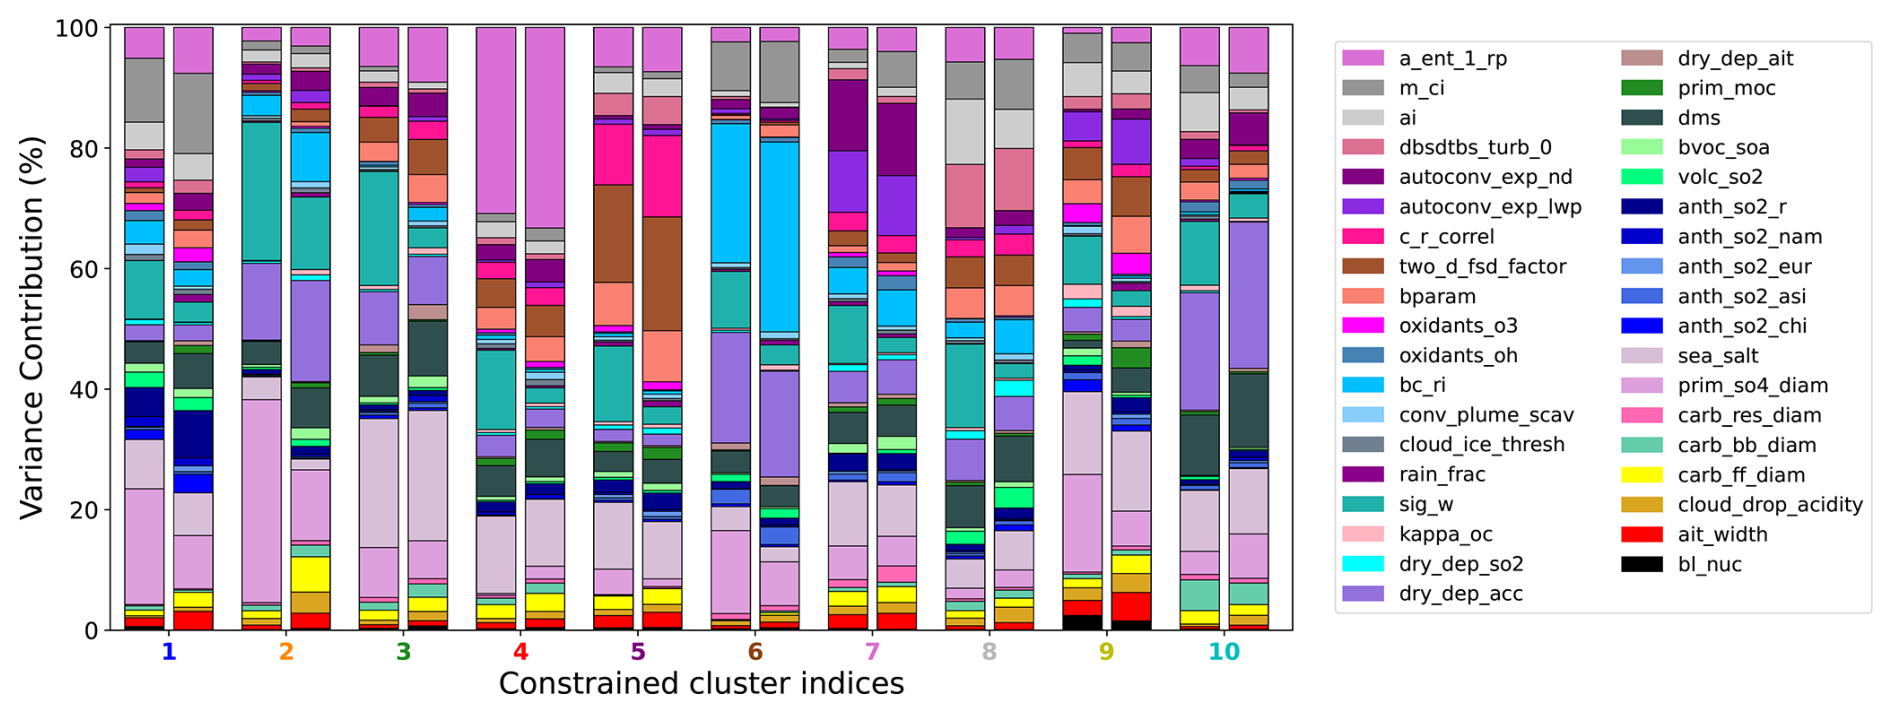
Figure 5Proportion of ΔFaci variance caused by the 37 parameters in the first 10 unconstrained (left) and all 10 optimally constrained (right) clusters. Cluster indices and colors on the x-axis match Fig. 4. Parameter contributions to ΔFaci variance are shown in consistent order for each bar, though near-zero contributions are not always visible.
Figure 5 shows how progressively adding observations to the optimal constraint affects causes of ΔFaci uncertainty in each cluster (Fig. 4). The cloud droplet activation parameter (sig_w) and primary sulfate parameter (prim_so4_diam) are constrained by more than 50 % in most clusters. However, other parameters are not strongly constrained and therefore cause a similar or higher proportion of remaining ΔFaci uncertainty after constraint. The persistence of key causes of ΔFaci uncertainty in each region, even as the overall uncertainty is reduced, suggests that the R23 constraint only partially constrains the governing processes. A deeper understanding of how these parameters interact with other causes of ΔFaci uncertainty at the regional level is needed to inform further constraint efforts.
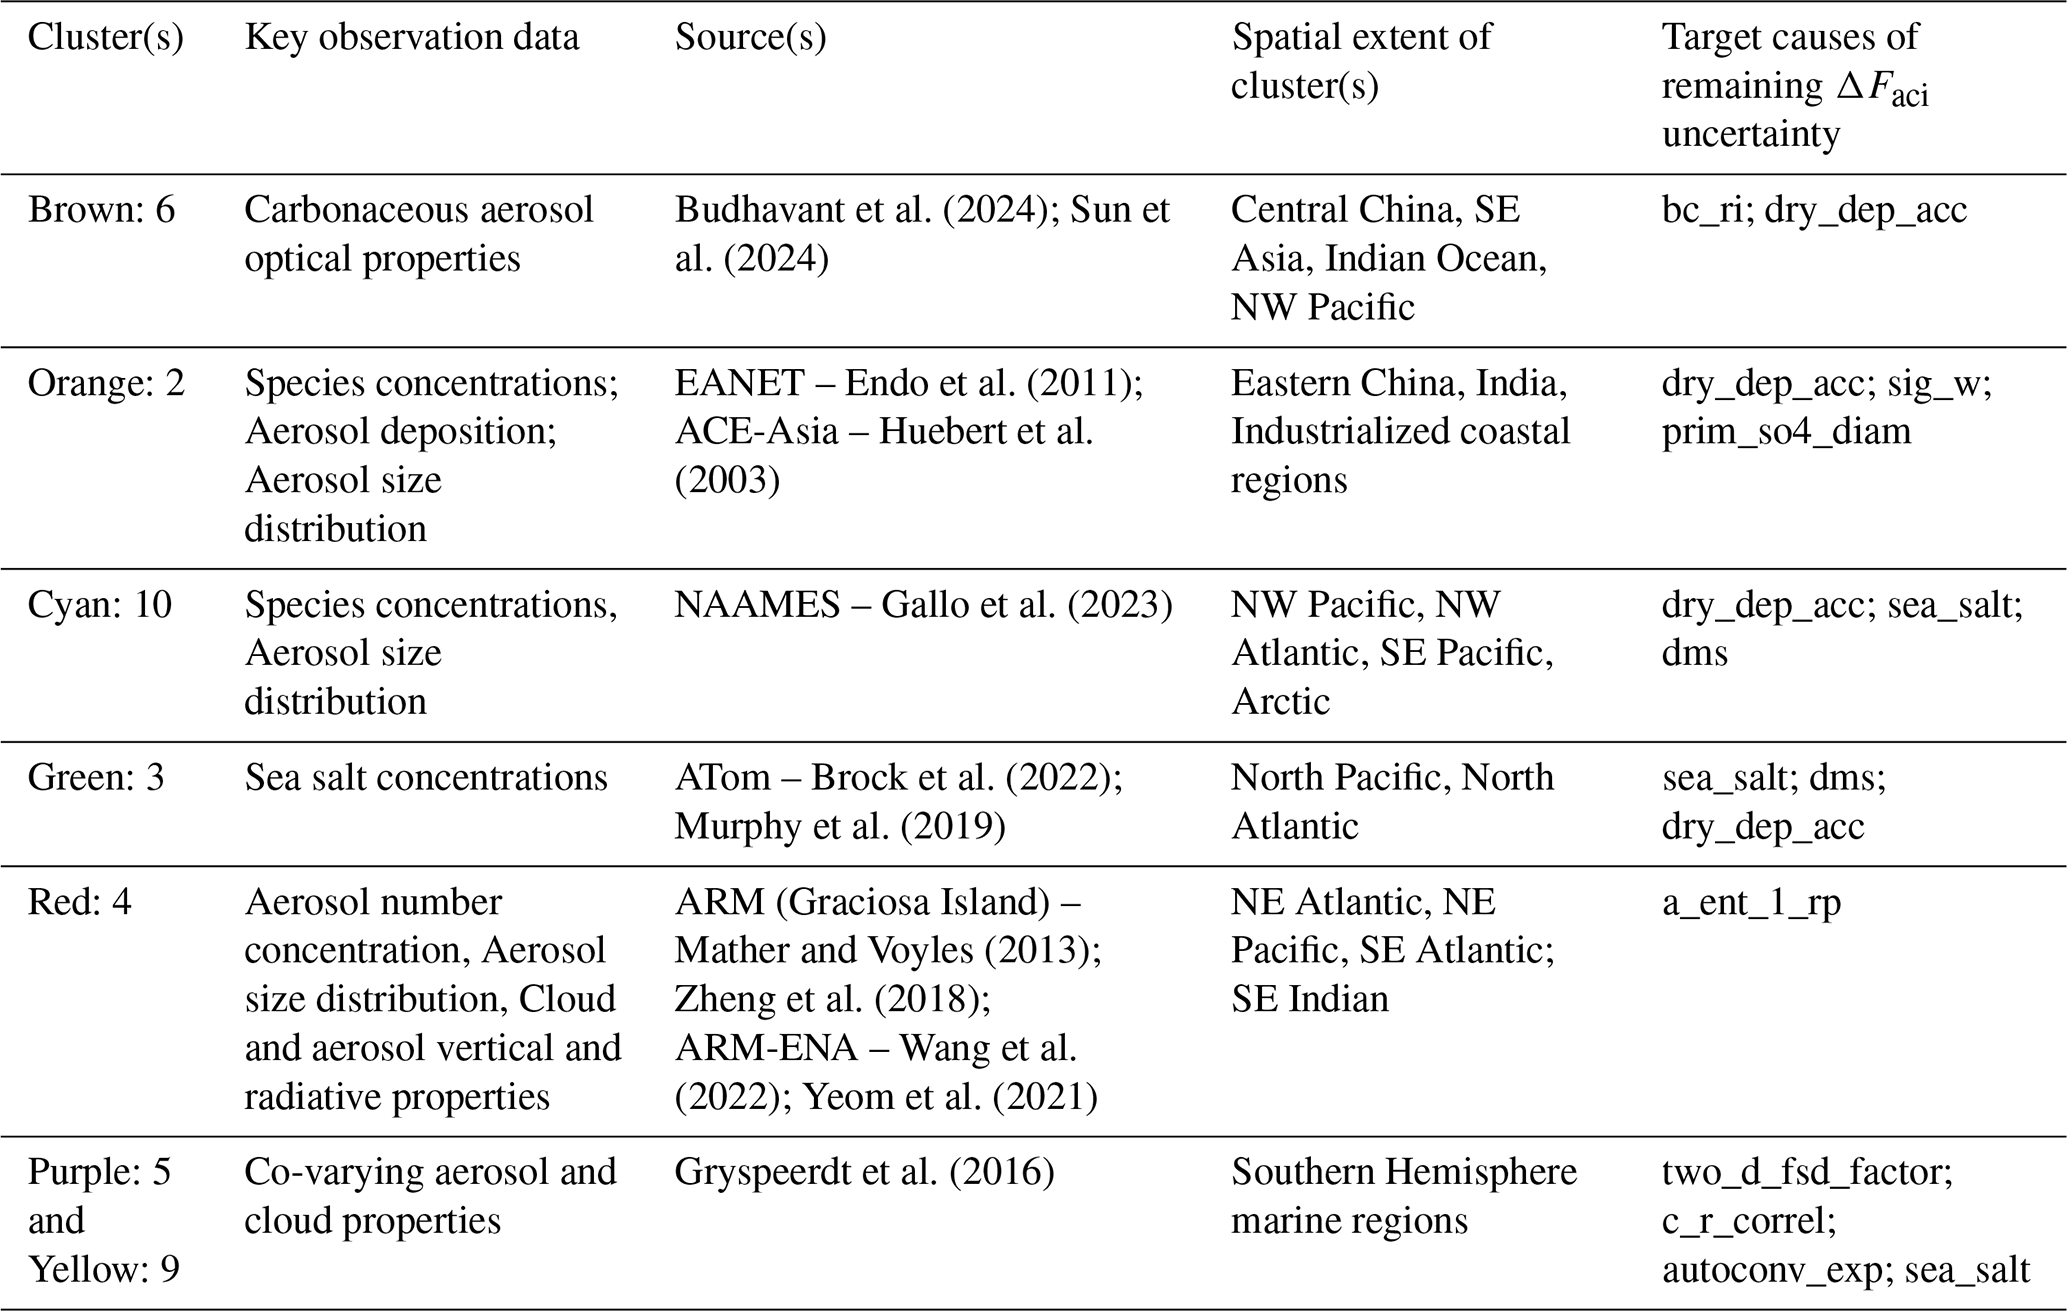
Our analysis of remaining ΔFaci uncertainty focusses on clusters where ΔFaci is resistant to the R23 constraint (Fig. 2), beginning with Asia, where ΔFaci uncertainty is weakly constrained (less than 30 %) so remains greater than 10 W m−2. Asia is partitioned into three clusters of remaining uncertainty (2: orange, 6: brown and 8: grey). In Sect. 3.3, we described how the parameter controlling the refractive index of carbonaceous aerosol (bc_ri) can affect the atmospheric state and thus the sign of ΔFaci dependence on some physical atmosphere parameters (Fig. 3). The bc_ri parameter is particularly important in Cluster 6 (brown) where in combination with the dry deposition parameter (dry_dep_acc) it causes nearly 50 % of the remaining ΔFaci uncertainty. This cluster extends into the Indian Ocean, East China Sea and western Pacific. The two main causes of remaining ΔFaci uncertainty in this cluster (deposition processes and aerosol optical properties) also represent major sources of multi-model diversity in aerosol optical depth over biomass burning regions (Petrenko et al., 2025). In theory, available measurements of carbonaceous aerosol optical properties within this cluster over Asia (e.g. Budhavant et al., 2024; Sun et al., 2024) should further reduce regional ΔFaci uncertainty by up to 35 %. However, observed variability in optical properties, driven by differences in aerosol mixing state (Bond et al., 2013; Fierce et al., 2016; Lack and Cappa, 2010), is not well represented in climate models. It is difficult to attribute radiative effects to individual species using climate models because aerosol species are typically treated as internally mixed (mixing state assumptions; e.g. Sand et al., 2021). As a result, observational constraints based on in-situ data may not be representative of the entire cluster, particularly across multiple regions. In such cases, region-specific observational constraints may be needed to constrain the cluster contribution to global mean ΔFaci uncertainty.
Over densely populated and industrialized regions of Asia (Cluster 2, orange; spanning India, China's coast, Indonesia, Japan and Korea) the remaining uncertainty in ΔFaci is dominated by dry deposition (dry_dep_acc), cloud droplet activation (sig_w) and primary sulfate emission properties (prim_so4_diam). Cloud droplet activation in these regions is strongly controlled by updraft velocity, consistent with an updraft-limited regime at high aerosol concentrations (Reutter et al., 2009). It is essential to constrain ΔFaci uncertainty in updraft-limited regimes because the sensitivity of cloud properties to aerosol under these conditions shapes our understanding of future climate responses (Andersen et al., 2023; Jia and Quaas, 2023).
Cluster 2 (orange), most dominant over Asia, spans several other industrial zones, including the coasts of North and South America, Africa, and the Mediterranean, so constraint of the combined parameter effects on ΔFaci in any of these regions could reduce uncertainty more widely unless these three parameters have regionally specific values (currently not assumed in the model). Opportunities for widespread constraint of uncertainty in Cluster 2 may be found through existing observations. For example, additional ΔFaci constraint beyond R23 might be achieved using in-situ sulfate concentration and aerosol deposition measurements from Japanese EANET (Acid Deposition Monitoring Network in East Asia) stations (Endo et al., 2011) in combination with extensive in-situ concentration and size distribution observations collected as part of the Aerosol Characterization Experiments (ACE) Asia (Huebert et al., 2003). Over Peru and Ecuador, where remaining uncertainty exceeds 5 W m−2 (Fig. 2c), the relevant observations are currently lacking so far as we are aware. While the VOCALS campaign (Wood et al., 2011) measured atmospheric properties within our Cluster 2, aerosol data were only collected further south. Other campaigns in our target region measure deposition fluxes (e.g. Baker et al., 2016) but focus on metal deposition as a source of marine biogenic activity, so are not suitable for broader climate model constraint. The lack of suitable observations in this region highlights a specific opportunity: novel measurements using, for example, condensation particle counters (for aerosol concentration data), mobility particle size spectrometers (for aerosol size distributions) and deposition collectors (removal rates) at specific coastal sites aligned to prevailing wind direction could play a critical role in reducing ΔFaci uncertainty.
Remaining uncertainty over the North Pacific and North Atlantic Oceans share four main clusters: in the west nearest to outflowing anthropogenic pollution it is Cluster 2 (orange), immediately downwind it is Cluster 10 (cyan), which transitions into Cluster 3 (green) and ultimately Cluster 4 (red) on the eastern side of each NH ocean basin. Although R23 constrained ΔFaci uncertainty by more than 70 % in NH marine regions (Fig. 2d), the uncertainty remains greater than 3 W m−2 (Fig. 2c). The aerosol deposition parameter (dry_dep_acc) causes nearly 25 % of the remaining ΔFaci uncertainty in Cluster 10 (cyan), with more than 10 % each from natural aerosol emission parameters (dms and sea_salt) and around 10 % from the parameter controlling turbulent cloud top entrainment (a_ent_1_rp). The importance of aerosol removal (dry_dep_acc) decreases to less than 10 % in Cluster 3 (green) and less than 5 % in Cluster 4 (red). In contrast, the cloud top entrainment parameter (a_ent_1_rp) increases in importance further from anthropogenic emission sources, causing around 10 % of the remaining ΔFaci uncertainty in Cluster 3 (green) and around 35 % in Cluster 4 (red) where remaining uncertainty is greatest (larger than 5 W m−2). In the central Cluster 3 (green) which covers most of the NH mid-Atlantic and mid-Pacific regions, sea salt emissions (sea_salt) and dimethylsulfide emissions (dms) combine to cause more than 25 % of the remaining uncertainty.
These results suggest ΔFaci could be further constrained over NH ocean regions using existing observations that target each cluster. For example, extensive aerosol, cloud and radiation measurements from the Department of Energy Atmospheric Radiation Measurement (ARM) site on Graciosa Island (Mather and Voyles, 2013; Zheng et al., 2018) and associated Eastern North Atlantic flight campaign (ACE-ENA; Wang et al., 2022; Yeom et al., 2021) may help reduce ΔFaci uncertainty associated with cloud top entrainment (parameter a_ent_1_rp) and natural aerosol emissions (dms and sea_salt) in Cluster 4 (red). These measurements could be complemented by sea salt mass concentration measurements from Atmospheric Tomography (ATom) missions (Brock et al., 2022), which span Clusters 3 (green) and 4 (red) across both the North Pacific and North Atlantic (e.g. Murphy et al., 2019), and aerosol concentration and size distribution measurements from the North Atlantic Aerosols and Marine Ecosystems Study (NAAMES) in Cluster 10 (cyan) within the western North Atlantic (Gallo et al., 2023).
There is a contrast between clusters of ΔFaci uncertainty in NH and SH marine regions. Cluster 3 (green) is less prominent in the SH, where Cluster 5 (purple) features in each ocean basin, accompanied by Cluster 9 (yellow) and, except in the South Pacific, Cluster 4 (red). ΔFaci uncertainty is only weakly constrained (by 40 % or less) in these regions (Fig. 2d). In each of these clusters, the dominant parameter is the one controlling how the spatial distribution of clouds affects radiation within model grid boxes (two_d_fsd_factor), causing around 20 % of the remaining ΔFaci uncertainty in Cluster 5 and around 10 % in other clusters. Additional contributors to remaining uncertainty include the cloud-precipitation overlap parameter (c_r_correl; around 15 % in Cluster 5) and an autoconversion sensitivity parameter (autoconv_exp_lwp; more than 5 % in Cluster 9). The importance of these physical atmosphere model parameters suggests a need to constrain the transition from stratocumulus to cumulus clouds, which might be achieved using process-based observations, such as co-varying aerosol and cloud properties (e.g. Gryspeerdt et al., 2016), subject to addressing discrepancies between models and satellite data (Kokkola et al., 2025; Quaas et al., 2020). However, model structural deficiencies have thus far prevented observed cloud properties associated with these physical atmosphere parameters being used as constraints (Regayre et al., 2023). In practice, model developments informed by large eddy simulation analyses (e.g. Sansom et al., 2024) may be needed to improve cloud transitions in global climate models and further constrain ΔFaci uncertainty in SH marine regions.
The Regayre et al. (2023) optimal constraint reduced global annual mean ΔFaci uncertainty by nearly 70 % (90 % credible interval spanning −0.9 to −0.1 W m−2). However, our results here show that the observational constraint did not affect all regions (Fig. 2d) or causes of uncertainty (Fig. 5) equally. Although the uncertainty caused by the two main drivers of original ΔFaci uncertainty, parameters controlling the diameter of primary sulfate particles (prim_so4_diam) and cloud droplet activation (cloud updraft speed; sig_w), is greatly reduced, all other parameters cause a similar or greater proportion of remaining uncertainty (Fig. 5 and Table A2). Remaining ΔFaci uncertainty is greatest in continental Asia (90 % credible interval greater than 10 W m−2) and SH regions of persistent stratocumulus cloud (5 to 10 W m−2; Fig. 2c).
By analyzing clusters of shared causes of remaining ΔFaci uncertainty (Fig. 4), we identify specific existing observational data likely to further constrain ΔFaci in our model (Table 1). However, observations related to key causes of uncertainty are not available across all regions and clusters. For example, novel observations of aerosol species concentrations, size distributions and deposition fluxes at multiple sites along the coasts of Peru and Ecuador would be highly valued for their potential to further constrain ΔFaci in Cluster 2 (orange) which would have a broad impact on remaining uncertainty in other regions of persistent uncertainty. These results show how evaluating models within an uncertainty framework can identify novel observations which, if made, would likely provide far-reaching additional constraint of ΔFaci.
Table 1Summary of existing observations with high potential to further constrain ΔFaci, and the processes they would target.
The conventional approach to model development typically focusses on increasing model fidelity, often inspired by the detection of biases or insights from multi-model intercomparisons (Chen et al., 2021). However, apparent improvements in model skill can largely be attributed to parameter retuning rather than genuine structural advances (Rostron et al., 2025). Increasing model fidelity carries a computational burden which is not always beneficial (Proske et al., 2022). Operationalizing a more targeted model development cycle requires structural modifications, evaluation within an uncertainty framework (Lee et al., 2012; Sexton et al., 2021), and successive waves of observational constraint to reduce model uncertainty and reveal structural deficiencies (Elsaesser et al., 2025; Fierce et al., 2024; Johnson et al., 2020; McNeall et al., 2016; Regayre et al., 2023). Diagnosing the causes of remaining uncertainty, as demonstrated here, is a key step in this cycle.
Here we have described a workflow for constraining (narrowing uncertainty in) aerosol radiative forcing that combines perturbed parameter ensembles (PPEs), extensive observational constraints and statistical analyses to track changes in the causes of uncertainty as observational constraints are progressively applied. Systematically analyzing the causes of remaining ΔFaci uncertainty after observational constraint enables us to: (a) identify regions where model uncertainty resists observational constraint (highlighting where additional observational data are most needed) and (b) partition regions into clusters of shared uncertainty sources (pointing to existing and novel observation types that could further reduce ΔFaci uncertainty). Our analysis also suggests model uncertainty may be more effectively constrained if observational constraints were applied within clusters of common causes of model uncertainty, rather than across geographic regions that are likely to span multiple clusters. This approach to model evaluation and constraint provides actionable information to guide both further observational constraint and efforts to increase model fidelity that directly target ΔFaci uncertainty.
The workflow of progressive observational constraint and clustering of the common causes of uncertainty demonstrated here tackles only part of the overall uncertainty in aerosol radiative forcing – parametric uncertainty. The other part, highlighted by R23, is structural uncertainty caused by structural deficiencies in models. Progressive observational constraint, reclustering, identification of new target observations and further constraint only works if the multiple observations provide consistent constraints on the uncertain parameters, but R23 showed that inconsistency is likely to become a problem even after very few constraints have been applied – that is, different observations constrain the model to different (inconsistent or non-overlapping) parts of parameter space. As we outlined in R23, the approach we have shown here would therefore need to be combined with efforts to address these inconsistencies by making model structural improvements. We suggest that targeting model development at the processes causing such multi-variable inconsistency will be more efficient than addressing causes of bias in single variables.
A key question is how transferable ΔFaci constraint derived from a single model is to other models. While climate models share multiple parameterisations and fundamental assumptions, and are evaluated against similar observational datasets (Knutti et al., 2013; Kuma et al., 2023; Sanderson et al., 2015), differences in tuning strategies (Hourdin et al., 2017) and configurations result in diverse responses to anthropogenic aerosol changes (Bellouin et al., 2020; IPCC, 2023). To ensure our approach supports improvements across a range of climate models, it is essential to extend this development and evaluation cycle across multiple models. Multi-model PPEs (MM-PPEs), which simultaneously sample both structural and parametric uncertainties, offer a more robust basis for identifying structural deficiencies, targeting model development priorities, and guiding future observation strategies. Applying our approach systematically across different models and model versions would build a foundation for strategic, evidence-based climate model development.
Additional Figs. A1 to A4 and Tables A1, A2.
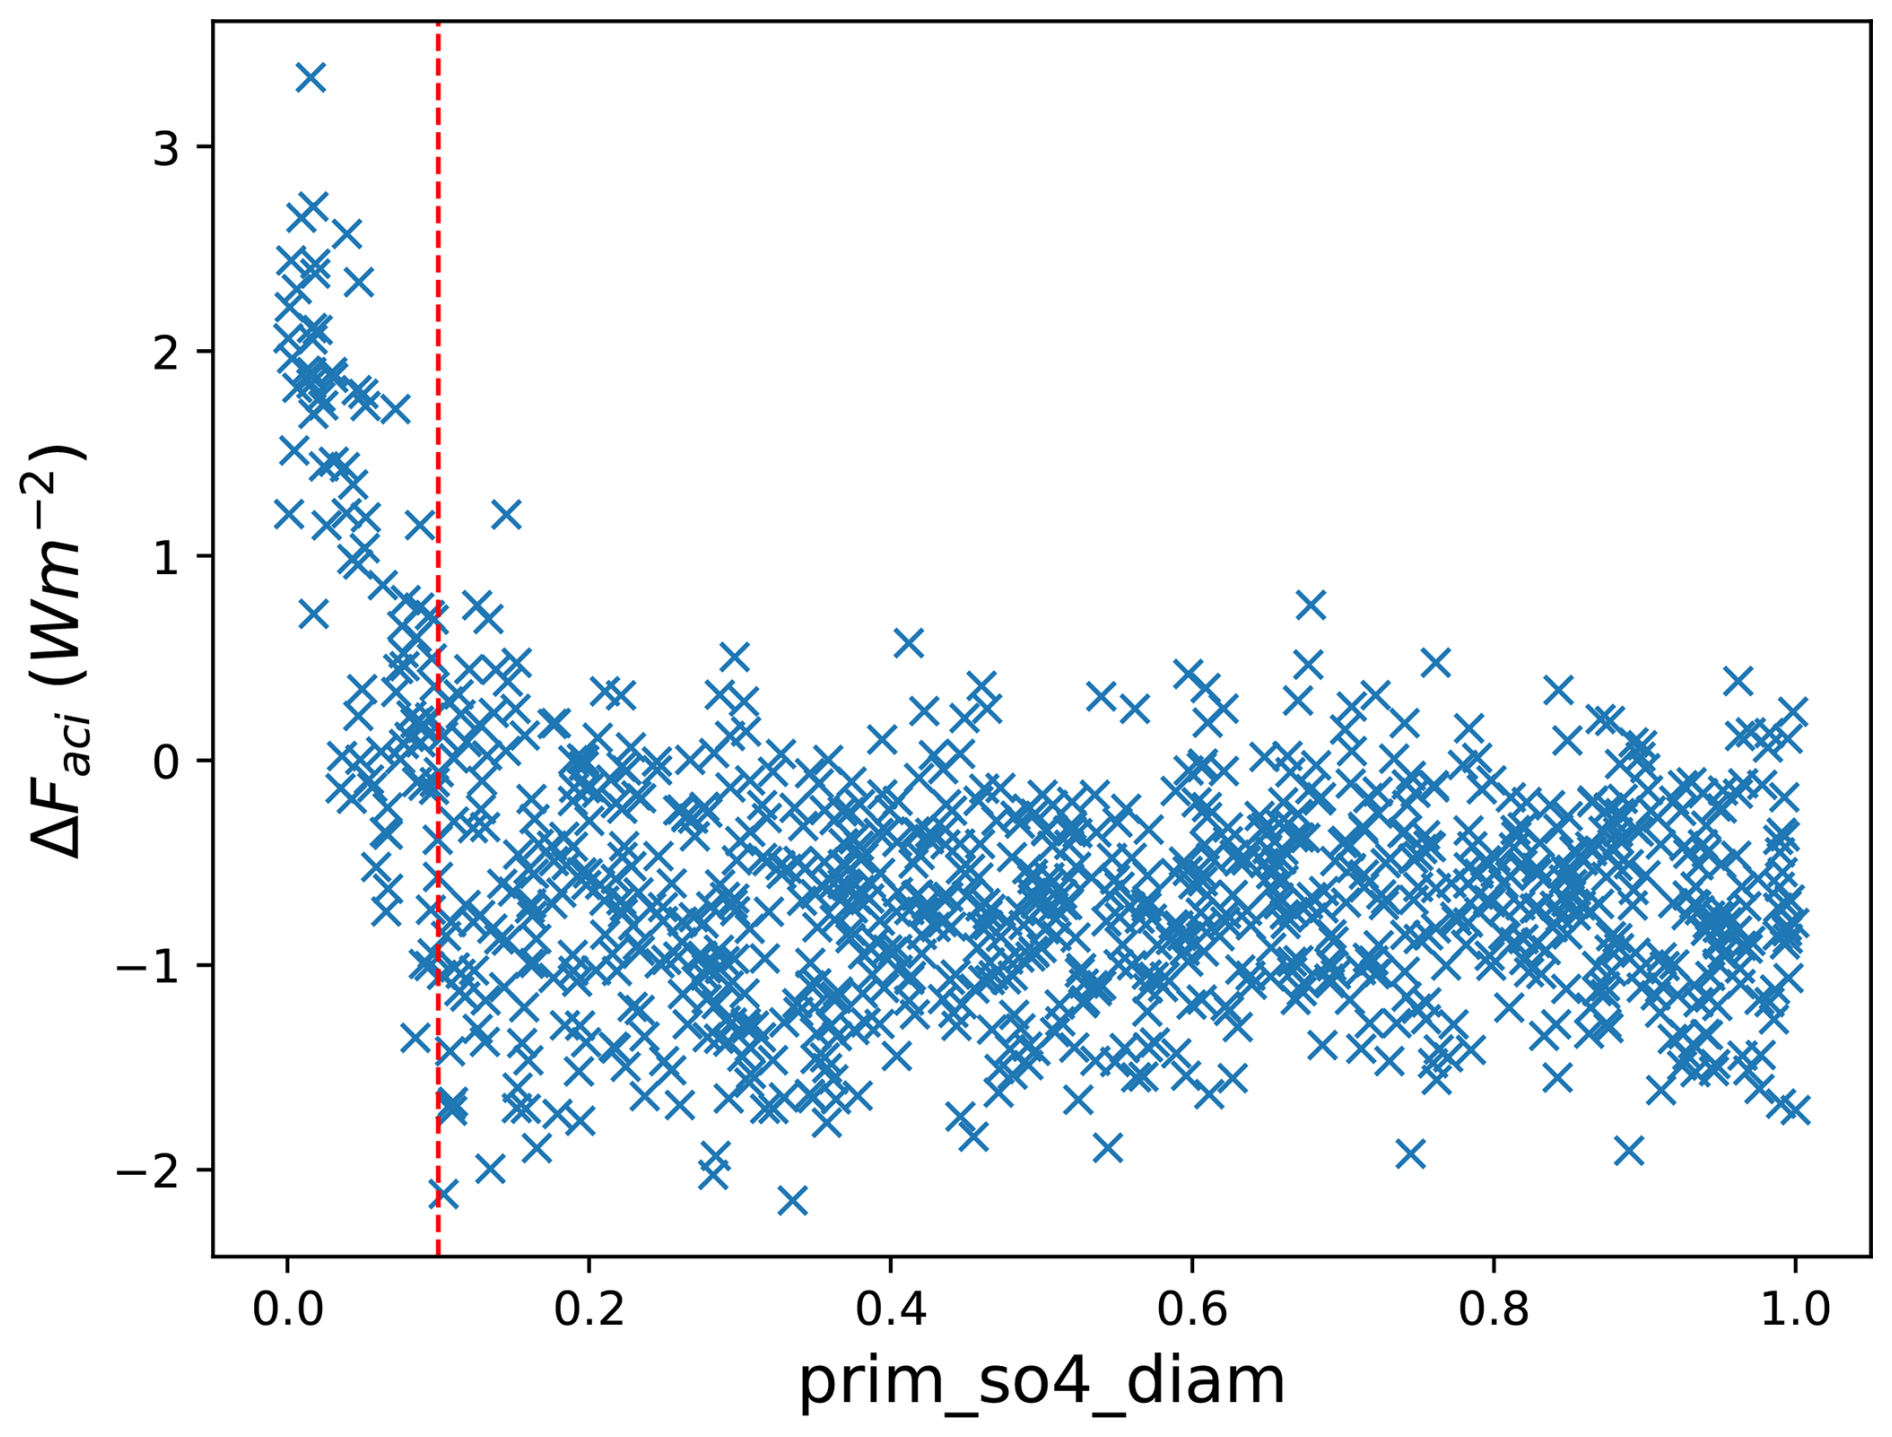
Figure A1The marginal dependence of ΔFaci on normalized prim_so4_diam parameter values. Values for the first 1000 of the original 1 million model variants are shown. Parameter values are normalized to be on the 0–1 scale. The dashed line separates values below around 10 nm, which were removed to create Fig. 2b and the set of model variants referred to as unconstrained.
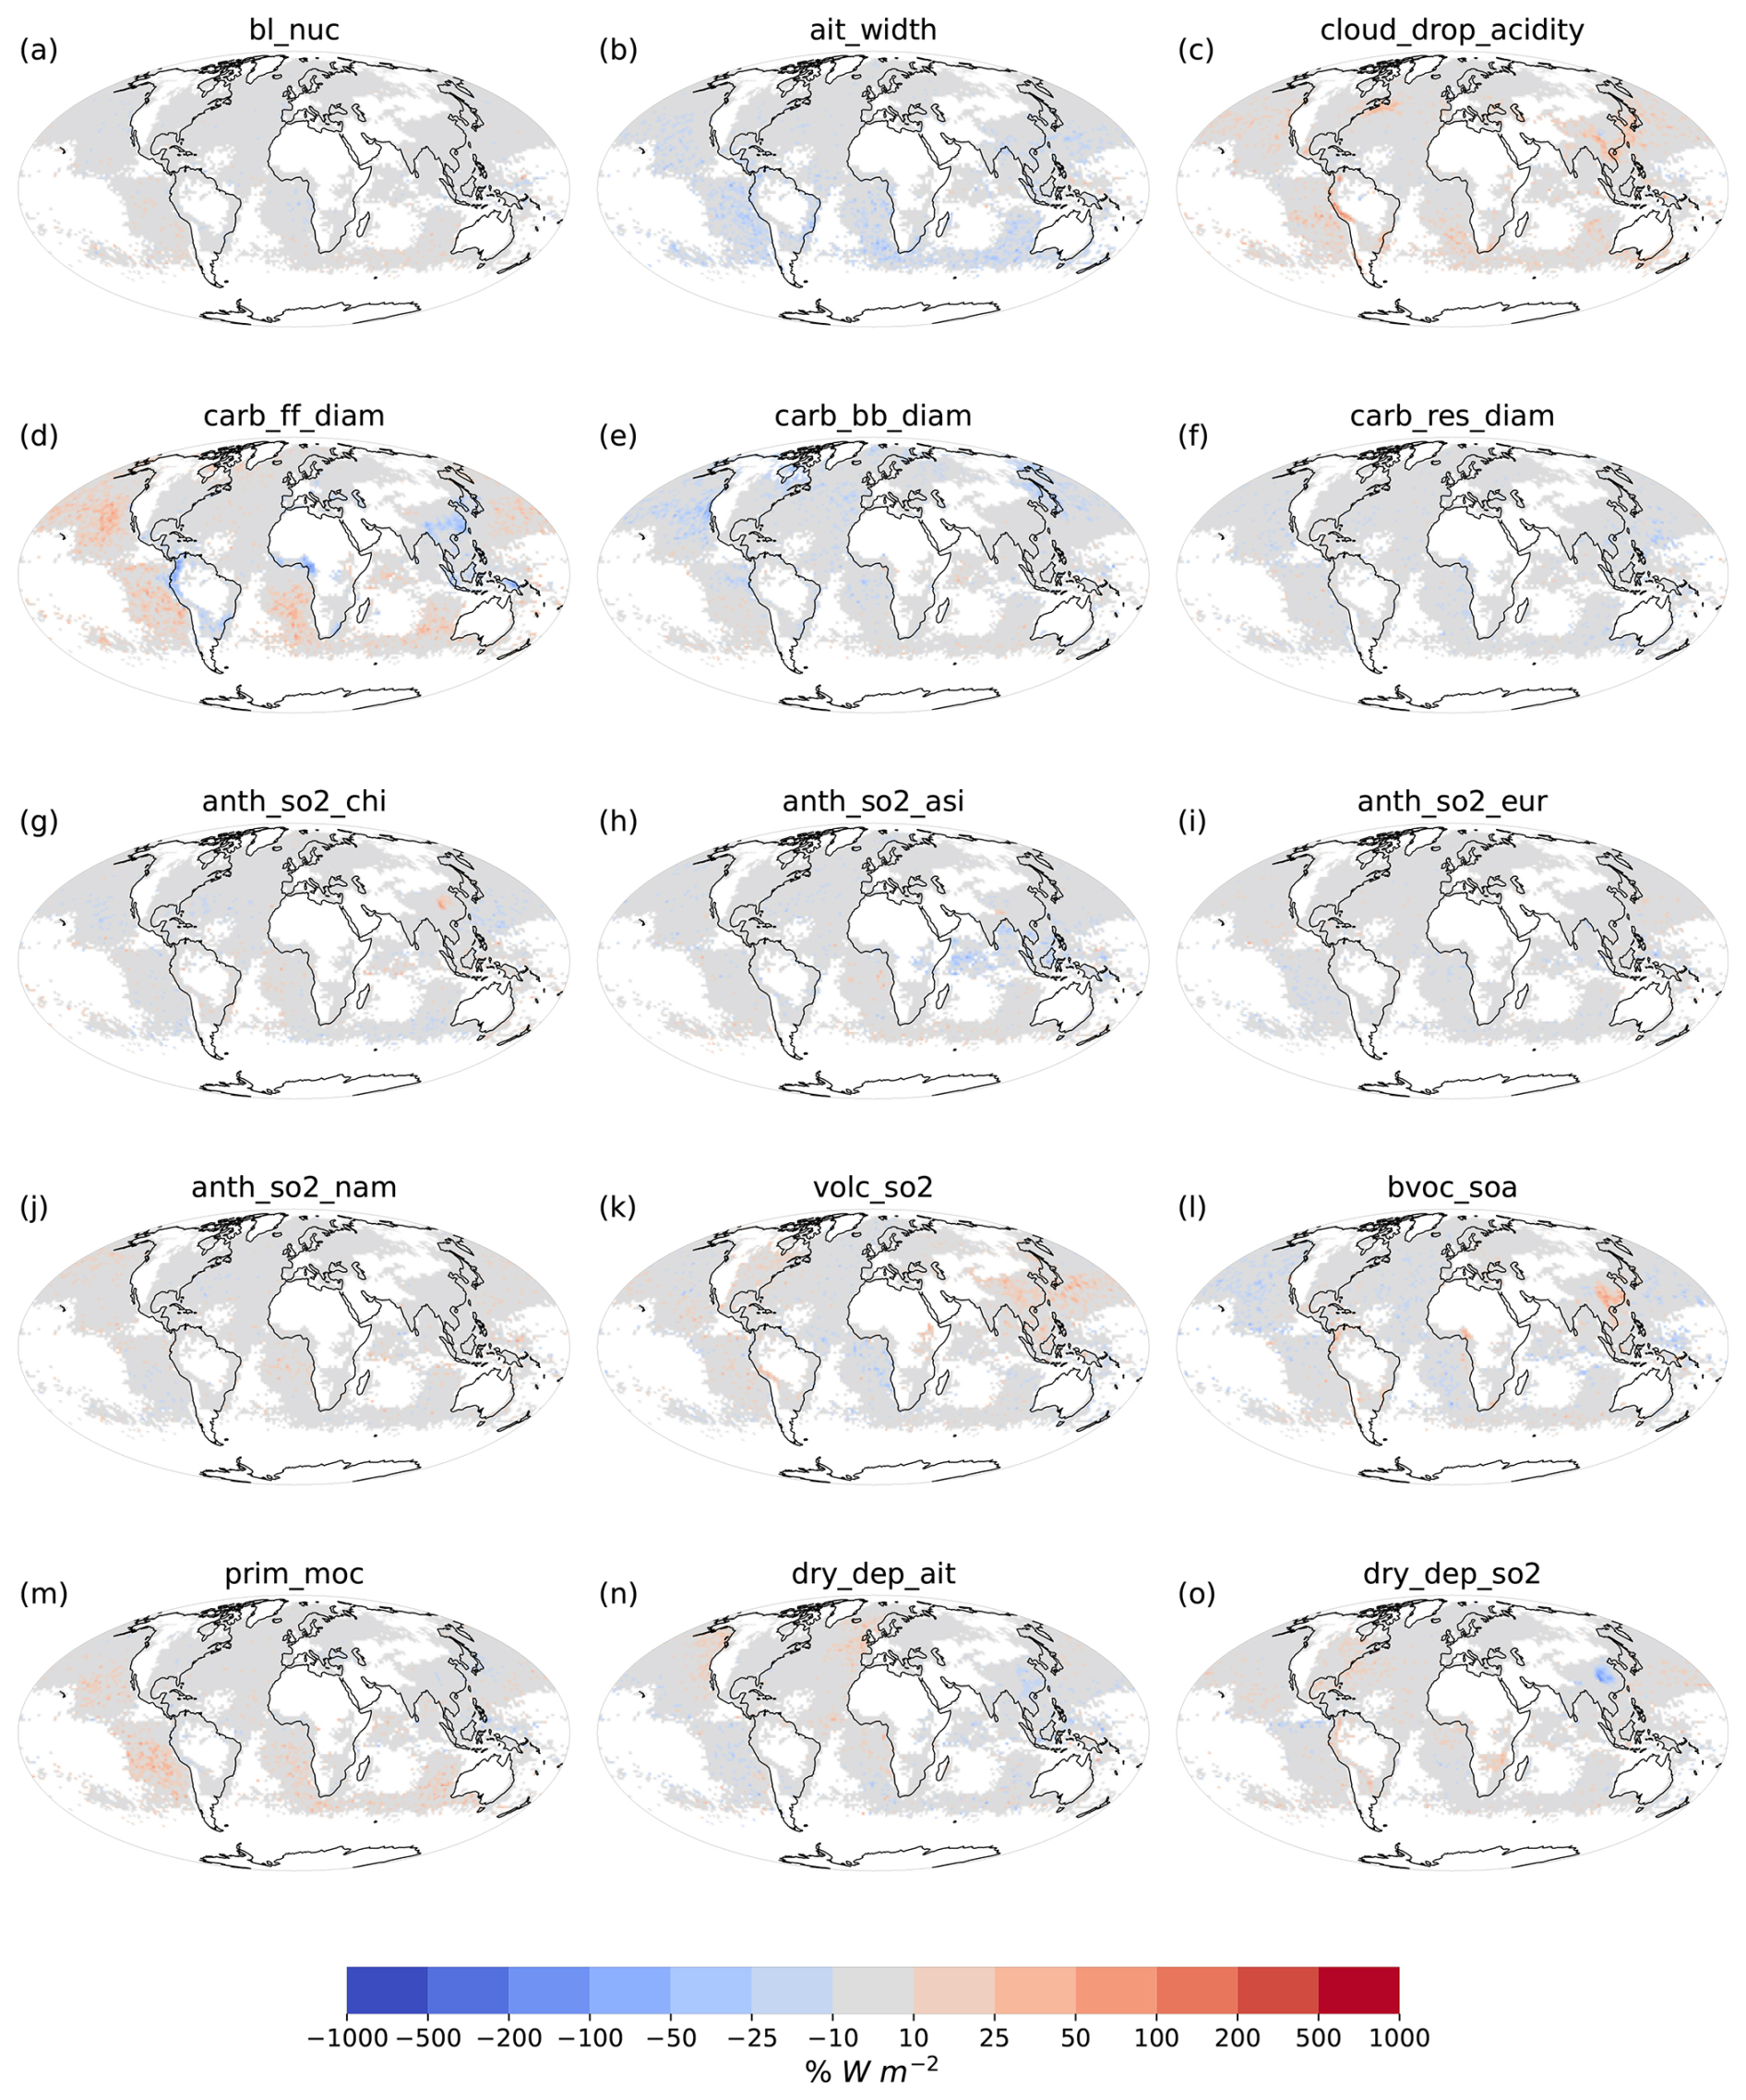
Figure A2Maps of parametric causes of remaining ΔFaci uncertainty after optimal constraint for 15 of the 22 parameters not shown in Fig. 3. Shading indicates the proportion of variance caused by individual parameters, multiplied by the variance in that grid box and by the sign of the ΔFaci dependence on the parameter value. Negative values indicate increasing the parameter value is associated with stronger (more negative) ΔFaci values. Regions where the ΔFaci 90 % CI is less than 3 W m−2 are masked.
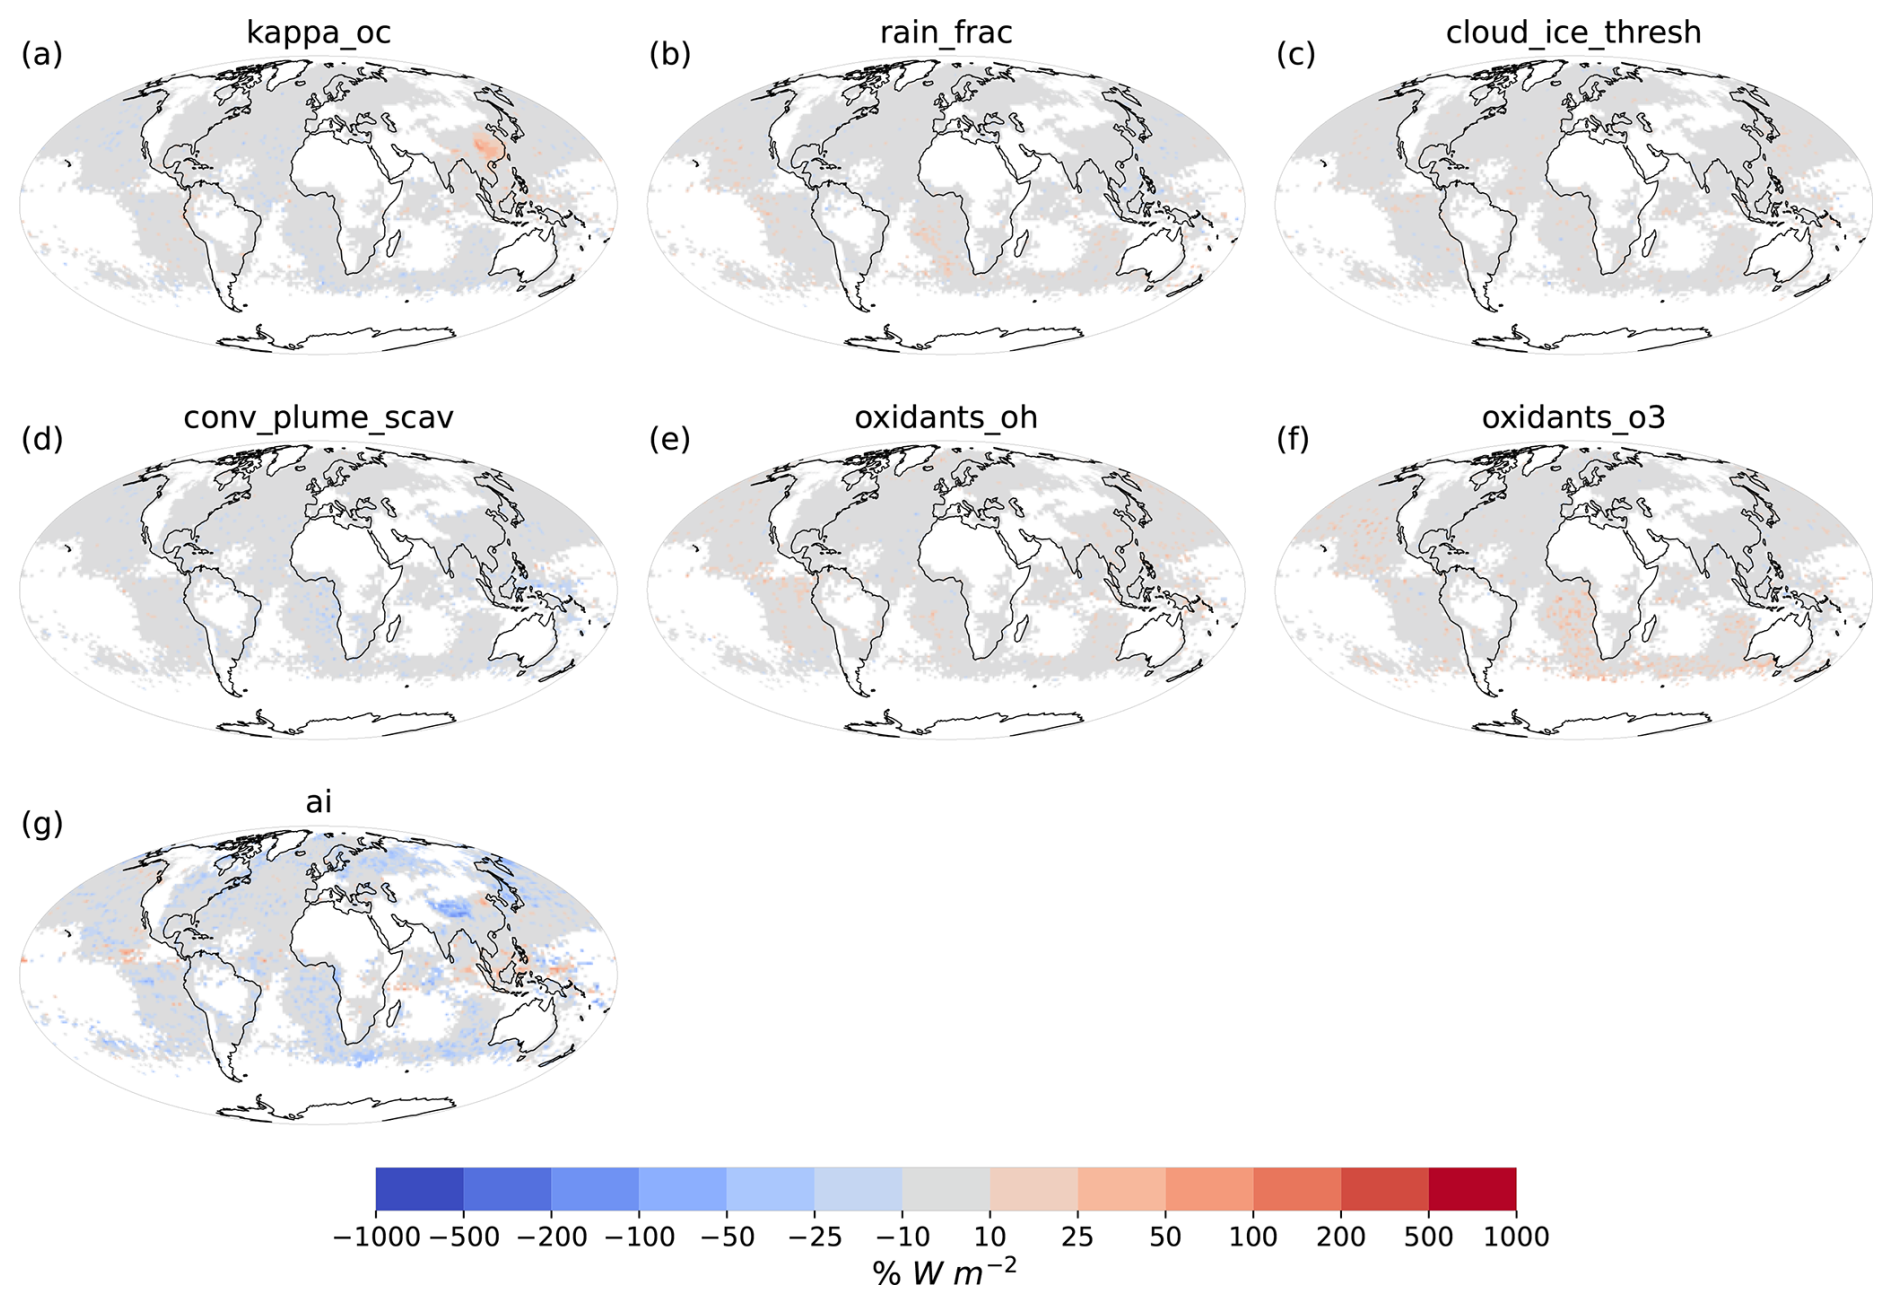
Figure A3Maps of parametric causes of remaining ΔFaci uncertainty after optimal constraint for the 7 parameters not shown in Fig. 3 nor Fig. A2. Shading indicates the proportion of variance caused by individual parameters, multiplied by the variance in that grid box and by the sign of the ΔFaci dependence on the parameter value. Negative values indicate increasing the parameter value is associated with stronger (more negative) ΔFaci values. Regions where the ΔFaci 90 % CI is less than 3 W m−2 are masked.
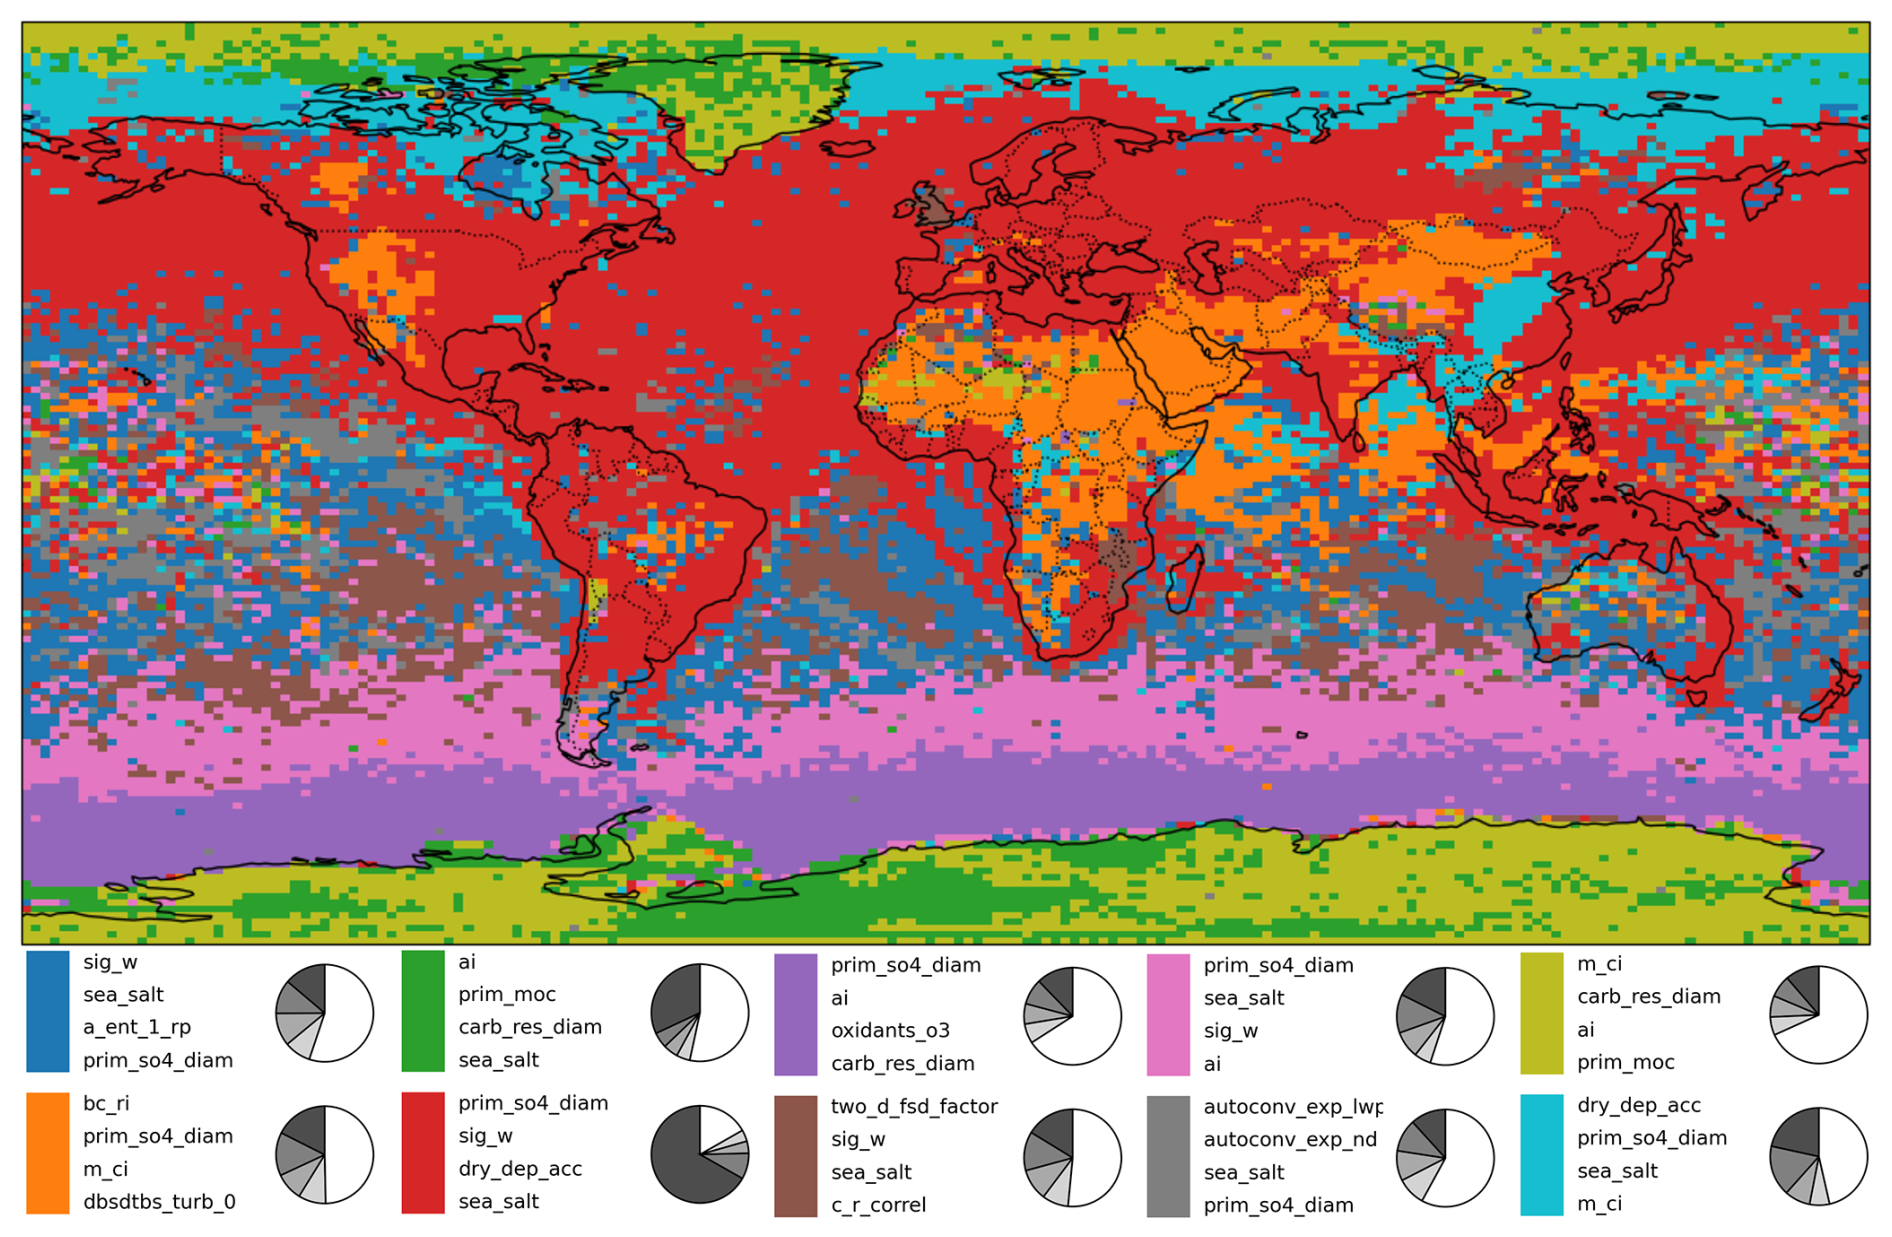
Figure A4Shared causes of ΔFaci uncertainty in the original set of 1 million model variants. As with Fig. 4 in the main article, the legend shows the 4 most important causes of uncertainty in each cluster and anti-clockwise shading in the pie charts shows the corresponding proportions of uncertainty caused by these parameters, out of 100 % total, with the white region representing contributions from the other 33 parameters.
Table A1Parameter names, perturbation type and description, following Regayre et al. (2023).
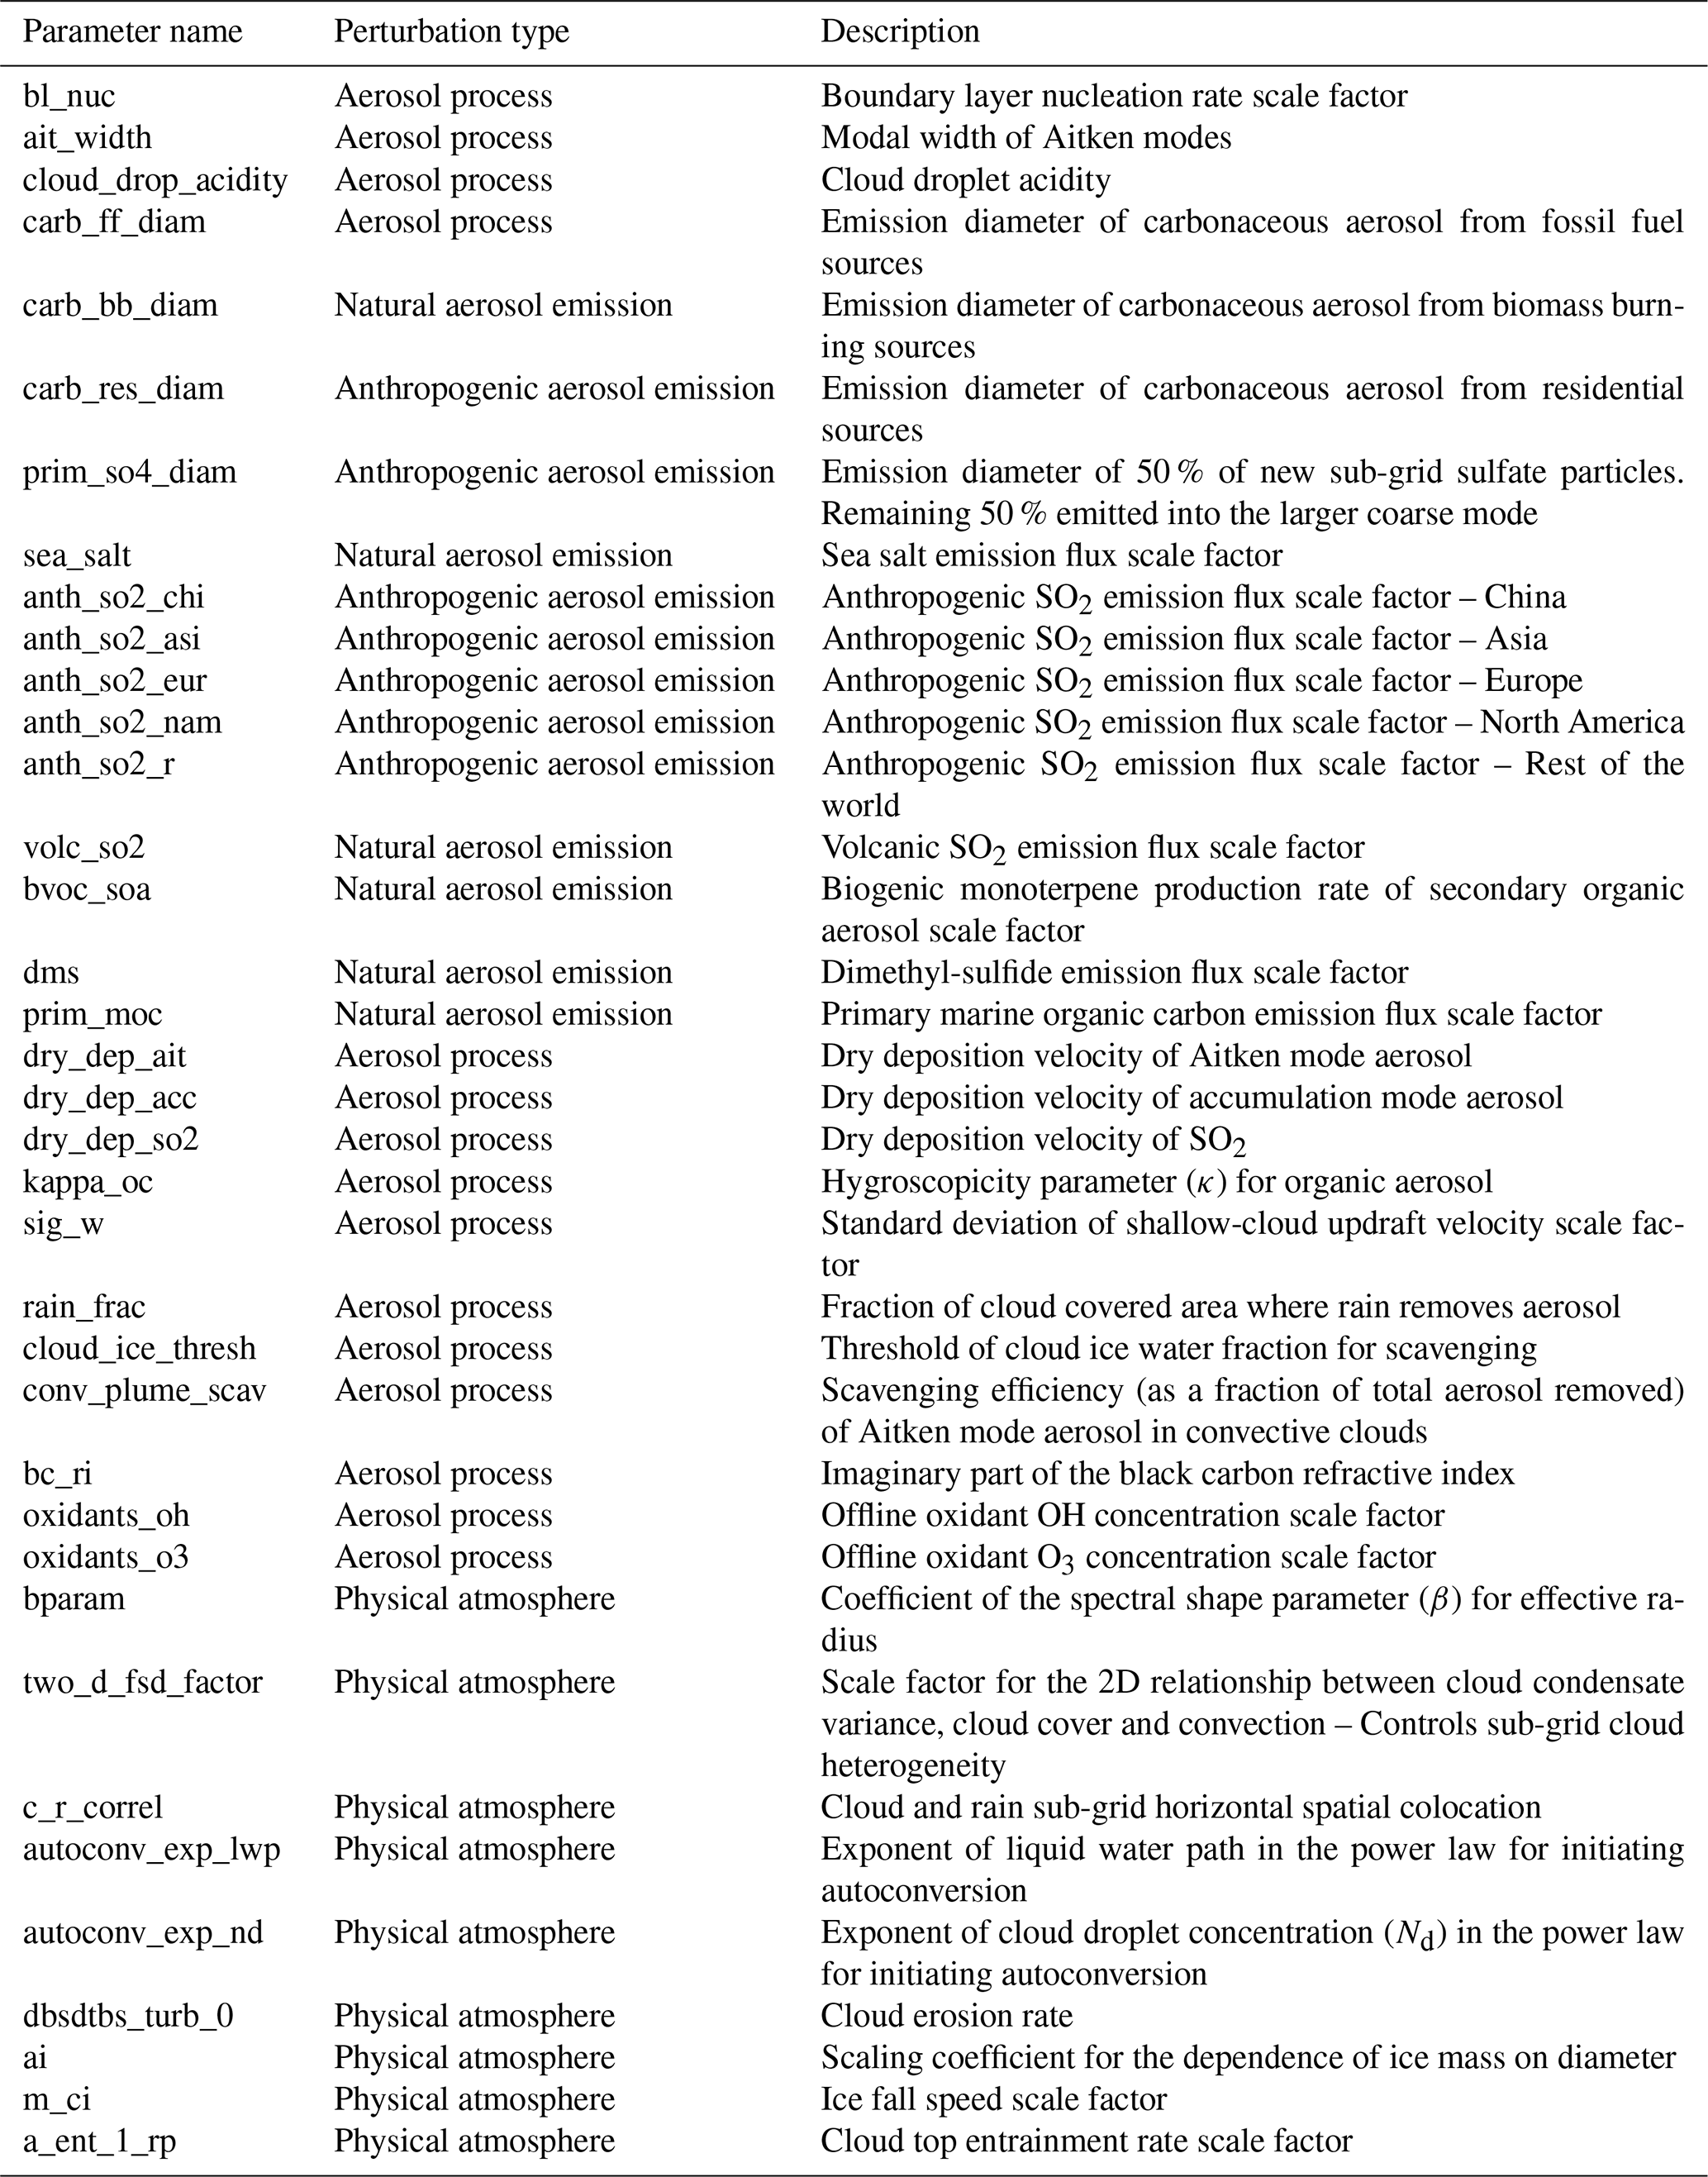
Table A2Percentage of ΔFaci uncertainty (90 % credible interval) caused by each of the 37 perturbed parameters before, during and after optimal constraint. In the original set, causes of variance greater than 2 % of the total are in bold font, indicating these parameters are in the first ΔFaci bar in Fig. 1. Causes of remaining variance after the 13th (optimal) constraint are also bold where they differ from the original causes by more than 1 %.
Code used to create figures in this article are available here: https://doi.org/10.5281/zenodo.16686812 (Regayre, 2025).
Output from the A-CURE PPE is available on the CEDA archive (https://catalogue.ceda.ac.uk/uuid/b735718d66c1403fbf6b93ba3bd3b1a9, Regayre et al., 2021).
LR led the research, processed output from the ensemble, created statistical emulators, and implemented GAM analyses at the model grid box level, building on historical input from JJ. LR and KC wrote the article with contributions from all co-authors. JOa, JJ, JOw, and KG provided valuable recommendations regarding statistical analyses, and all co-authors contributed to the development of the methodology. LP created the K-means clusters with input from LR. The research was motivated by concepts stemming from collaborative discussions among all co-authors, with KC providing overarching vision and guidance.
At least one of the (co-)authors is a member of the editorial board of Atmospheric Chemistry and Physics. The peer-review process was guided by an independent editor, and the authors also have no other competing interests to declare.
Publisher's note: Copernicus Publications remains neutral with regard to jurisdictional claims made in the text, published maps, institutional affiliations, or any other geographical representation in this paper. The authors bear the ultimate responsibility for providing appropriate place names. Views expressed in the text are those of the authors and do not necessarily reflect the views of the publisher.
The PPE that informed this research was created using the ARCHER UK National Supercomputing Service (http://www.archer.ac.uk, last access: 21 January 2021) under project allocation n02-NEP013406. This work benefited from AI-assisted drafting using ChatGPT (OpenAI) and Copilot (Microsoft). This work used JASMIN, the UK's collaborative data analysis environment (https://www.jasmin.ac.uk, last access: 10 February 2026).
LR was supported by the Met Office Hadley Centre Climate Programme funded by DSIT. LR and KS acknowledge funding from the FORCeS project under the European Union's Horizon 2020 research programme with grant agreement 821205. We acknowledge funding from NERC under grants A-CURE and Aerosol-MFR (NE/P013406/1 and NE/X013901/1). LP is funded by a Doctoral Training Grant from the Natural Environment Research Council (NERC) and a CASE studentship with the Met Office Hadley Centre.
This paper was edited by Tom Goren and reviewed by two anonymous referees.
Albrecht, B. A.: Aerosols, Cloud Microphysics, and Fractional Cloudiness, Science, 245, 1227–1230, https://doi.org/10.1126/science.245.4923.1227, 1989.
Andersen, H., Cermak, J., Douglas, A., Myers, T. A., Nowack, P., Stier, P., Wall, C. J., and Wilson Kemsley, S.: Sensitivities of cloud radiative effects to large-scale meteorology and aerosols from global observations, Atmos. Chem. Phys., 23, 10775–10794, https://doi.org/10.5194/acp-23-10775-2023, 2023.
Andres, R. J. and Kasgnoc, A. D.: A time-averaged inventory of subaerial volcanic sulfur emissions, J. Geophys. Res., 103, 25251–25261, https://doi.org/10.1029/98JD02091, 1998.
Archibald, A. T., O'Connor, F. M., Abraham, N. L., Archer-Nicholls, S., Chipperfield, M. P., Dalvi, M., Folberth, G. A., Dennison, F., Dhomse, S. S., Griffiths, P. T., Hardacre, C., Hewitt, A. J., Hill, R. S., Johnson, C. E., Keeble, J., Köhler, M. O., Morgenstern, O., Mulcahy, J. P., Ordóñez, C., Pope, R. J., Rumbold, S. T., Russo, M. R., Savage, N. H., Sellar, A., Stringer, M., Turnock, S. T., Wild, O., and Zeng, G.: Description and evaluation of the UKCA stratosphere–troposphere chemistry scheme (StratTrop vn 1.0) implemented in UKESM1, Geosci. Model Dev., 13, 1223–1266, https://doi.org/10.5194/gmd-13-1223-2020, 2020.
Baker, A. R., Thomas, M., Bange, H. W., and Plasencia Sánchez, E.: Soluble trace metals in aerosols over the tropical south-east Pacific offshore of Peru, Biogeosciences, 13, 817–825, https://doi.org/10.5194/bg-13-817-2016, 2016.
Balkanski, Y., Schulz, M., Claquin, T., and Guibert, S.: Reevaluation of Mineral aerosol radiative forcings suggests a better agreement with satellite and AERONET data, Atmos. Chem. Phys., 7, 81–95, https://doi.org/10.5194/acp-7-81-2007, 2007.
Bellouin, N., Quaas, J., Morcrette, J.-J., and Boucher, O.: Estimates of aerosol radiative forcing from the MACC re-analysis, Atmos. Chem. Phys., 13, 2045–2062, https://doi.org/10.5194/acp-13-2045-2013, 2013.
Bellouin, N., Quaas, J., Gryspeerdt, E., Kinne, S., Stier, P., Watson-Parris, D., Boucher, O., Carslaw, K. S., Christensen, M., Daniau, A.-L., Dufresne, J.-L., Feingold, G., Fiedler, S., Forster, P., Gettelman, A., Haywood, J. M., Lohmann, U., Malavelle, F., Mauritsen, T., McCoy, D. T., Myhre, G., Mülmenstädt, J., Neubauer, D., Possner, A., Rugenstein, M., Sato, Y., Schulz, M., Schwartz, S. E., Sourdeval, O., Storelvmo, T., Toll, V., Winker, D., and Stevens, B.: Bounding Global Aerosol Radiative Forcing of Climate Change, Rev. Geophys., 58, https://doi.org/10.1029/2019RG000660, 2020.
Beven, K. and Freer, J.: Equifinality, data assimilation, and uncertainty estimation in mechanistic modelling of complex environmental systems using the GLUE methodology, J. Hydrol., 249, 11–29, https://doi.org/10.1016/S0022-1694(01)00421-8, 2001.
Bond, T. C., Doherty, S. J., Fahey, D. W., Forster, P. M., Berntsen, T., DeAngelo, B. J., Flanner, M. G., Ghan, S., Kärcher, B., Koch, D., Kinne, S., Kondo, Y., Quinn, P. K., Sarofim, M. C., Schultz, M. G., Schulz, M., Venkataraman, C., Zhang, H., Zhang, S., Bellouin, N., Guttikunda, S. K., Hopke, P. K., Jacobson, M. Z., Kaiser, J. W., Klimont, Z., Lohmann, U., Schwarz, J. P., Shindell, D., Storelvmo, T., Warren, S. G., and Zender, C. S.: Bounding the role of black carbon in the climate system: A scientific assessment, J. Geophys. Res. Atmos., 118, 5380–5552, https://doi.org/10.1002/jgrd.50171, 2013.
Brock, C. A., Froyd, K. D., Dollner, M., Williamson, C. J., Schill, G. P., Murphy, D. M., Wagner, N. L., Kupc, A., Jimenez, J. L., Campuzano-Jost, P., Nault, B. A., Schroder, J. C., Day, D. A., Price, D. J., Weinzierl, B. B., Schwarz, J. P., Katich, J. M., Wang, S., Zeng, L. H., Webb, R., Dibb, J. E., Scheuer, E., Diskin, G. S., DiGangi, J. P., Bui, T. P., Dean-Day, J. M., Thompson, C. R., Peischl, J., Ryerson, T. B., Bourgeois, I., Daube, B. C., Commane, R., and Wofsy, S. C.: Atmospheric Tomography Mission (ATom); ATom: Comprehensive Aerosol Properties, 2016–2018, Version 2, NASA Earthdata [data set], https://doi.org/10.3334/ORNLDAAC/2111, 2022.
Browse, J., Carslaw, K. S., Arnold, S. R., Pringle, K., and Boucher, O.: The scavenging processes controlling the seasonal cycle in Arctic sulphate and black carbon aerosol, Atmos. Chem. Phys., 12, 6775–6798, https://doi.org/10.5194/acp-12-6775-2012, 2012.
Budhavant, K., Manoj, M. R., Nair, H. R. C. R., Gaita, S. M., Holmstrand, H., Salam, A., Muslim, A., Satheesh, S. K., and Gustafsson, Ö.: Changing optical properties of black carbon and brown carbon aerosols during long-range transport from the Indo-Gangetic Plain to the equatorial Indian Ocean, Atmos. Chem. Phys., 24, 11911–11925, https://doi.org/10.5194/acp-24-11911-2024, 2024.
Cao, Y., Zhu, Y., Wang, M., Rosenfeld, D., Liang, Y., Liu, J., Liu, Z., and Bai, H.: Emission Reductions Significantly Reduce the Hemispheric Contrast in Cloud Droplet Number Concentration in Recent Two Decades, J. Geophy. Res. Atmos., 128, e2022JD037417, https://doi.org/10.1029/2022JD037417, 2023.
Carslaw, K. S., Lee, L. A., Reddington, C. L., Pringle, K. J., Rap, A., Forster, P. M., Mann, G. W., Spracklen, D. V., Woodhouse, M. T., Regayre, L. A., and Pierce, J. R.: Large contribution of natural aerosols to uncertainty in indirect forcing, Nature, 503, 67–71, https://doi.org/10.1038/nature12674, 2013.
Chemke, R. and Dagan, G.: The Effects of the Spatial Distribution of Direct Anthropogenic Aerosols Radiative Forcing on Atmospheric Circulation, J. Clim., 31, 7129–7145, https://doi.org/10.1175/JCLI-D-17-0694.1, 2018.
Chen, D., Rojas, M., Samset, B. H., Cobb, K., Diongue Niang, A., Edwards, P., Emori, S., Faria, S. H., Hawkins, E., Hope, P., Huybrechts, P., Meinshausen, M., Mustafa, S. K., Plattner, G.-K., and Treguier, A.-M.: Framing, Context, and Methods, in: Climate Change 2021: The Physical Science Basis. Contribution of Working Group I to the Sixth Assessment Report of the Intergovernmental Panel on Climate Change, Cambridge University Press, Cambridge, United Kingdom and New York, 147–286, https://doi.org/10.1017/9781009157896.003, 2021.
Craig, P. S., Goldstein, M., Seheult, A. H., and Smith, J. A.: Pressure Matching for Hydrocarbon Reservoirs: A Case Study in the Use of Bayes Linear Strategies for Large Computer Experiments, in: Case Studies in Bayesian Statistics, vol. 121, edited by: Gatsonis, C., Hodges, J. S., Kass, R. E., McCulloch, R., Rossi, P., and Singpurwalla, N. D., Springer New York, New York, 37–93, https://doi.org/10.1007/978-1-4612-2290-3_2, 1997.
Eidhammer, T., Gettelman, A., Thayer-Calder, K., Watson-Parris, D., Elsaesser, G., Morrison, H., van Lier-Walqui, M., Song, C., and McCoy, D.: An extensible perturbed parameter ensemble for the Community Atmosphere Model version 6, Geosci. Model Dev., 17, 7835–7853, https://doi.org/10.5194/gmd-17-7835-2024, 2024.
Elsaesser, G. S., Van Lier-Walqui, M., Yang, Q., Kelley, M., Ackerman, A. S., Fridlind, A. M., Cesana, G. V., Schmidt, G. A., Wu, J., Behrangi, A., Camargo, S. J., De, B., Inoue, K., Leitmann-Niimi, N. M., and Strong, J. D. O.: Using Machine Learning to Generate a GISS ModelE Calibrated Physics Ensemble (CPE), J. Adv. Model. Earth Syst., 17, e2024MS004713, https://doi.org/10.1029/2024MS004713, 2025.
Endo, T., Yagoh, H., Sato, K., Matsuda, K., Hayashi, K., Noguchi, I., and Sawada, K.: Regional characteristics of dry deposition of sulfur and nitrogen compounds at EANET sites in Japan from 2003 to 2008, Atmos. Env., 45, 1259–1267, https://doi.org/10.1016/j.atmosenv.2010.12.003, 2011.
Eyring, V., Bony, S., Meehl, G. A., Senior, C. A., Stevens, B., Stouffer, R. J., and Taylor, K. E.: Overview of the Coupled Model Intercomparison Project Phase 6 (CMIP6) experimental design and organization, Geosci. Model Dev., 9, 1937–1958, https://doi.org/10.5194/gmd-9-1937-2016, 2016.
Fierce, L., Bond, T. C., Bauer, S. E., Mena, F., and Riemer, N.: Black carbon absorption at the global scale is affected by particle-scale diversity in composition, Nat. Commun., 7, 12361, https://doi.org/10.1038/ncomms12361, 2016.
Fierce, L., Yao, Y., Easter, R., Ma, P.-L., Sun, J., Wan, H., and Zhang, K.: Quantifying structural errors in cloud condensation nuclei activity from reduced representation of aerosol size distributions, J. Aerosol Sci., 181, 106388, https://doi.org/10.1016/j.jaerosci.2024.106388, 2024.
Forster, P., Storelvmo, T., Armour, K., Collins, W., Dufresne, J., Frame, D., Lunt, D., Mauritsen, T., Palmer, M., Watanabe, M., Wild, M., and Zhang, H.: The Earth's energy budget, climate feedbacks, and climate sensitivity, in: Climate Change 2021: The Physical Science Basis. Contribution of Working Group I to the Sixth Assessment Report of the Intergovernmental Panel on Climate Change, edited by: Masson-Delmotte, V., Zhai, P., Pirani, A., Connors, S. L., Pean, C., Berger, S., Caud, N., Chen, Y., Goldfarb, L., Gomis, M. I., Huang, M., Leitzell, K., Lonnoy, E., Matthews, J. B. R., Maycock, T. K., Aterfield, T., Yelekci, O., Yu, R., and Zhou, B., Cambridge University Press, https://doi.org/10.1017/9781009157896.009, 2021.
Gallo, F., Sanchez, K. J., Anderson, B. E., Bennett, R., Brown, M. D., Crosbie, E. C., Hostetler, C., Jordan, C., Yang Martin, M., Robinson, C. E., Russell, L. M., Shingler, T. J., Shook, M. A., Thornhill, K. L., Wiggins, E. B., Winstead, E. L., Wisthaler, A., Ziemba, L. D., and Moore, R. H.: Measurement report: Aerosol vertical profiles over the western North Atlantic Ocean during the North Atlantic Aerosols and Marine Ecosystems Study (NAAMES), Atmos. Chem. Phys., 23, 1465–1490, https://doi.org/10.5194/acp-23-1465-2023, 2023.
Gettelman, A., Eidhammer, T., Duffy, M. L., McCoy, D. T., Song, C., and Watson-Parris, D.: The Interaction Between Climate Forcing and Feedbacks, J. Geophys. Res. Atmos., 129, e2024JD040857, https://doi.org/10.1029/2024JD040857, 2024.
Ghan, S., Wang, M., Zhang, S., Ferrachat, S., Gettelman, A., Griesfeller, J., Kipling, Z., Lohmann, U., Morrison, H., Neubauer, D., Partridge, D. G., Stier, P., Takemura, T., Wang, H., and Zhang, K.: Challenges in constraining anthropogenic aerosol effects on cloud radiative forcing using present-day spatiotemporal variability, Proc. Natl. Acad. Sci. USA, 113, 5804–5811, https://doi.org/10.1073/pnas.1514036113, 2016.
Gosling, J. P.: SHELF: The Sheffield Elicitation Framework, in: Elicitation, vol. 261, edited by: Dias, L. C., Morton, A., and Quigley, J., Springer International Publishing, Cham, 61–93, https://doi.org/10.1007/978-3-319-65052-4_4, 2018.
Grosvenor, D. P. and Carslaw, K. S.: The decomposition of cloud–aerosol forcing in the UK Earth System Model (UKESM1), Atmos. Chem. Phys., 20, 15681–15724, https://doi.org/10.5194/acp-20-15681-2020, 2020.
Gryspeerdt, E., Quaas, J., and Bellouin, N.: Constraining the aerosol influence on cloud fraction: AEROSOLS AND CLOUD FRACTION, J. Geophys. Res. Atmos., 121, 3566–3583, https://doi.org/10.1002/2015JD023744, 2016.
Halmer, M. M., Schmincke, H.-U., and Graf, H.-F.: The annual volcanic gas input into the atmosphere, in particular into the stratosphere: a global data set for the past 100 years, J. Volcanol. Geotherm. Res., 115, 511–528, https://doi.org/10.1016/S0377-0273(01)00318-3, 2002.
Hamilton, D. S., Lee, L. A., Pringle, K. J., Reddington, C. L., Spracklen, D. V., and Carslaw, K. S.: Occurrence of pristine aerosol environments on a polluted planet, Proc. Natl. Acad. Sci. USA, 111, 18466–18471, https://doi.org/10.1073/pnas.1415440111, 2014.
Hoffmann, J., Bauer, P., Sandu, I., Wedi, N., Geenen, T., and Thiemert, D.: Destination Earth – A digital twin in support of climate services, Clim. Serv., 30, 100394, https://doi.org/10.1016/j.cliser.2023.100394, 2023.
Hourdin, F., Mauritsen, T., Gettelman, A., Golaz, J.-C., Balaji, V., Duan, Q., Folini, D., Ji, D., Klocke, D., Qian, Y., Rauser, F., Rio, C., Tomassini, L., Watanabe, M., and Williamson, D.: The Art and Science of Climate Model Tuning, Bull. Amer. Met. Soc., 98, 589–602, https://doi.org/10.1175/BAMS-D-15-00135.1, 2017.
Huebert, B. J., Bates, T., Russell, P. B., Shi, G., Kim, Y. J., Kawamura, K., Carmichael, G., and Nakajima, T.: An overview of ACE-Asia: Strategies for quantifying the relationships between Asian aerosols and their climatic impacts, J. Geophys. Res., 108, 2003JD003550, https://doi.org/10.1029/2003JD003550, 2003.
Intergovernmental Panel On Climate Change (IPCC): Climate Change 2021 – The Physical Science Basis: Working Group I Contribution to the Sixth Assessment Report of the Intergovernmental Panel on Climate Change, 1st edn., Cambridge University Press, https://doi.org/10.1017/9781009157896, 2023.
Jia, H. and Quaas, J.: Nonlinearity of the cloud response postpones climate penalty of mitigating air pollution in polluted regions, Nat. Clim. Chang., 13, 943–950, https://doi.org/10.1038/s41558-023-01775-5, 2023.
Johnson, J. S., Regayre, L. A., Yoshioka, M., Pringle, K. J., Turnock, S. T., Browse, J., Sexton, D. M. H., Rostron, J. W., Schutgens, N. A. J., Partridge, D. G., Liu, D., Allan, J. D., Coe, H., Ding, A., Cohen, D. D., Atanacio, A., Vakkari, V., Asmi, E., and Carslaw, K. S.: Robust observational constraint of uncertain aerosol processes and emissions in a climate model and the effect on aerosol radiative forcing, Atmos. Chem. Phys., 20, 9491–9524, https://doi.org/10.5194/acp-20-9491-2020, 2020.
Kahn, R. A., Andrews, E., Brock, C. A., Chin, M., Feingold, G., Gettelman, A., Levy, R. C., Murphy, D. M., Nenes, A., Pierce, J. R., Popp, T., Redemann, J., Sayer, A. M., Da Silva, A. M., Sogacheva, L., and Stier, P.: Reducing Aerosol Forcing Uncertainty by Combining Models With Satellite and Within-The-Atmosphere Observations: A Three-Way Street, Rev. Geophys., 61, e2022RG000796, https://doi.org/10.1029/2022RG000796, 2023.
King, M. D., Menzel, W. P., Kaufman, Y. J., Tanre, D., Bo-Cai Gao, Platnick, S., Ackerman, S. A., Remer, L. A., Pincus, R., and Hubanks, P. A.: Cloud and aerosol properties, precipitable water, and profiles of temperature and water vapor from MODIS, IEEE T. Geosci. Remote, 41, 442–458, https://doi.org/10.1109/TGRS.2002.808226, 2003.
Knutti, R., Masson, D., and Gettelman, A.: Climate model genealogy: Generation CMIP5 and how we got there: CLIMATE MODEL GENEALOGY, Geophys. Res. Lett., 40, 1194–1199, https://doi.org/10.1002/grl.50256, 2013.
Kokkola, H., Tonttila, J., Calderón, S. M., Romakkaniemi, S., Lipponen, A., Peräkorpi, A., Mielonen, T., Gryspeerdt, E., Virtanen, T. H., Kolmonen, P., and Arola, A.: Model analysis of biases in the satellite-diagnosed aerosol effect on the cloud liquid water path, Atmos. Chem. Phys., 25, 1533–1543, https://doi.org/10.5194/acp-25-1533-2025, 2025.
Kuma, P., Bender, F. A.-M., and Jönsson, A. R.: Climate Model Code Genealogy and Its Relation to Climate Feedbacks and Sensitivity, J. Adv. Model. Earth Syst., 15, e2022MS003588, https://doi.org/10.1029/2022MS003588, 2023.
Lack, D. A. and Cappa, C. D.: Impact of brown and clear carbon on light absorption enhancement, single scatter albedo and absorption wavelength dependence of black carbon, Atmos. Chem. Phys., 10, 4207–4220, https://doi.org/10.5194/acp-10-4207-2010, 2010.
Lee, L. A., Carslaw, K. S., Pringle, K. J., and Mann, G. W.: Mapping the uncertainty in global CCN using emulation, Atmos. Chem. Phys., 12, 9739–9751, https://doi.org/10.5194/acp-12-9739-2012, 2012.
Lee, L. A., Reddington, C. L., and Carslaw, K. S.: On the relationship between aerosol model uncertainty and radiative forcing uncertainty, Proc. Natl. Acad. Sci. USA, 113, 5820–5827, https://doi.org/10.1073/pnas.1507050113, 2016.
Liu, Z., Bollasina, M. A., and Wilcox, L. J.: Impact of Asian aerosols on the summer monsoon strongly modulated by regional precipitation biases, Atmos. Chem. Phys., 24, 7227–7252, https://doi.org/10.5194/acp-24-7227-2024, 2024.
Loeb, N. G., Doelling, D. R., Wang, H., Su, W., Nguyen, C., Corbett, J. G., Liang, L., Mitrescu, C., Rose, F. G., and Kato, S.: Clouds and the Earth's Radiant Energy System (CERES) Energy Balanced and Filled (EBAF) Top-of-Atmosphere (TOA) Edition-4.0 Data Product, J. Clim., 31, 895–918, https://doi.org/10.1175/JCLI-D-17-0208.1, 2018.
Mather, J. H. and Voyles, J. W.: The Arm Climate Research Facility: A Review of Structure and Capabilities, Bull. Amer. Meteor. Soc., 94, 377–392, https://doi.org/10.1175/BAMS-D-11-00218.1, 2013.
McCoy, I. L., McCoy, D. T., Wood, R., Regayre, L., Watson-Parris, D., Grosvenor, D. P., Mulcahy, J. P., Hu, Y., Bender, F. A.-M., Field, P. R., Carslaw, K. S., and Gordon, H.: The hemispheric contrast in cloud microphysical properties constrains aerosol forcing, Proc. Natl. Acad. Sci. USA, 117, 189980–19006, https://doi.org/10.1073/pnas.1922502117, 2020.
McNeall, D., Williams, J., Booth, B., Betts, R., Challenor, P., Wiltshire, A., and Sexton, D.: The impact of structural error on parameter constraint in a climate model, Earth Syst. Dynam., 7, 917–935, https://doi.org/10.5194/esd-7-917-2016, 2016.
Metzger, A., Verheggen, B., Dommen, J., Duplissy, J., Prevot, A. S. H., Weingartner, E., Riipinen, I., Kulmala, M., Spracklen, D. V., Carslaw, K. S., and Baltensperger, U.: Evidence for the role of organics in aerosol particle formation under atmospheric conditions, Proc. Natl. Acad. Sci. USA, 107, 6646–6651, https://doi.org/10.1073/pnas.0911330107, 2010.
Mikkelsen, A., McCoy, D. T., Eidhammer, T., Gettelman, A., Song, C., Gordon, H., and McCoy, I. L.: Constraining aerosol–cloud adjustments by uniting surface observations with a perturbed parameter ensemble, Atmos. Chem. Phys., 25, 4547–4570, https://doi.org/10.5194/acp-25-4547-2025, 2025.
Mulcahy, J. P., Johnson, C., Jones, C. G., Povey, A. C., Scott, C. E., Sellar, A., Turnock, S. T., Woodhouse, M. T., Abraham, N. L., Andrews, M. B., Bellouin, N., Browse, J., Carslaw, K. S., Dalvi, M., Folberth, G. A., Glover, M., Grosvenor, D. P., Hardacre, C., Hill, R., Johnson, B., Jones, A., Kipling, Z., Mann, G., Mollard, J., O'Connor, F. M., Palmiéri, J., Reddington, C., Rumbold, S. T., Richardson, M., Schutgens, N. A. J., Stier, P., Stringer, M., Tang, Y., Walton, J., Woodward, S., and Yool, A.: Description and evaluation of aerosol in UKESM1 and HadGEM3-GC3.1 CMIP6 historical simulations, Geosci. Model Dev., 13, 6383–6423, https://doi.org/10.5194/gmd-13-6383-2020, 2020.
Mülmenstädt, J. and Wilcox, L. J.: The Fall and Rise of the Global Climate Model, J. Adv. Model. Earth Syst., 13, e2021MS002781, https://doi.org/10.1029/2021MS002781, 2021.
Mülmenstädt, J., Ackerman, A. S., Fridlind, A. M., Huang, M., Ma, P.-L., Mahfouz, N., Bauer, S. E., Burrows, S. M., Christensen, M. W., Dipu, S., Gettelman, A., Leung, L. R., Tornow, F., Quaas, J., Varble, A. C., Wang, H., Zhang, K., and Zheng, Y.: Can general circulation models (GCMs) represent cloud liquid water path adjustments to aerosol–cloud interactions?, Atmos. Chem. Phys., 24, 13633–13652, https://doi.org/10.5194/acp-24-13633-2024, 2024.
Murphy, D. M., Froyd, K. D., Bian, H., Brock, C. A., Dibb, J. E., DiGangi, J. P., Diskin, G., Dollner, M., Kupc, A., Scheuer, E. M., Schill, G. P., Weinzierl, B., Williamson, C. J., and Yu, P.: The distribution of sea-salt aerosol in the global troposphere, Atmos. Chem. Phys., 19, 4093–4104, https://doi.org/10.5194/acp-19-4093-2019, 2019.
O'Hagan, A.: Bayesian analysis of computer code outputs: A tutorial, Reliab. Eng. Syst. Saf., 91, 1290–1300, https://doi.org/10.1016/j.ress.2005.11.025, 2006.
Peace, A. H., Carslaw, K. S., Lee, L. A., Regayre, L. A., Booth, B. B. B., Johnson, J. S., and Bernie, D.: Effect of aerosol radiative forcing uncertainty on projected exceedance year of a 1.5 °C global temperature rise, Environ. Res. Lett., 15, 0940a6, https://doi.org/10.1088/1748-9326/aba20c, 2020.
Peace, A. H., Booth, B. B. B., Regayre, L. A., Carslaw, K. S., Sexton, D. M. H., Bonfils, C. J. W., and Rostron, J. W.: Evaluating uncertainty in aerosol forcing of tropical precipitation shifts, Earth Syst. Dynam., 13, 1215–1232, https://doi.org/10.5194/esd-13-1215-2022, 2022.
Pedregosa, F., Varoquaux, G., Gramfort, A., Michel, V., Thirion, B., Grisel, O., Blondel, M., Prettenhofer, P., Weiss, R., Dubourg, V., Vanderplas, J., Passos, A., and Cournapeau, D.: Scikit-learn: Machine Learning in Python, J. Mach. Learn. Res., 12, 2825–2830, 2011.
Petrenko, M., Kahn, R., Chin, M., Bauer, S. E., Bergman, T., Bian, H., Curci, G., Johnson, B., Kaiser, J. W., Kipling, Z., Kokkola, H., Liu, X., Mezuman, K., Mielonen, T., Myhre, G., Pan, X., Protonotariou, A., Remy, S., Skeie, R. B., Stier, P., Takemura, T., Tsigaridis, K., Wang, H., Watson-Parris, D., and Zhang, K.: Biomass burning emission analysis based on MODIS aerosol optical depth and AeroCom multi-model simulations: implications for model constraints and emission inventories, Atmos. Chem. Phys., 25, 1545–1567, https://doi.org/10.5194/acp-25-1545-2025, 2025.
Price, R., Orr, A., Field, P. F., Mace, G., and Protat, A.: Simulation of Cloud Processes Over Offshore Coastal Antarctica Using the High-Resolution Regional UK Met Office Unified Model With Interactive Aerosols, J. Geophys. Res. Atmos., 130, e2024JD042109, https://doi.org/10.1029/2024JD042109, 2025.
Proske, U., Ferrachat, S., Neubauer, D., Staab, M., and Lohmann, U.: Assessing the potential for simplification in global climate model cloud microphysics, Atmos. Chem. Phys., 22, 4737–4762, https://doi.org/10.5194/acp-22-4737-2022, 2022.
Qian, Y., Wan, H., Yang, B., Golaz, J., Harrop, B., Hou, Z., Larson, V. E., Leung, L. R., Lin, G., Lin, W., Ma, P., Ma, H., Rasch, P., Singh, B., Wang, H., Xie, S., and Zhang, K.: Parametric Sensitivity and Uncertainty Quantification in the Version 1 of E3SM Atmosphere Model Based on Short Perturbed Parameter Ensemble Simulations, J. Geophys. Res. Atmos., 123, https://doi.org/10.1029/2018JD028927, 2018.
Quaas, J., Arola, A., Cairns, B., Christensen, M., Deneke, H., Ekman, A. M. L., Feingold, G., Fridlind, A., Gryspeerdt, E., Hasekamp, O., Li, Z., Lipponen, A., Ma, P.-L., Mülmenstädt, J., Nenes, A., Penner, J. E., Rosenfeld, D., Schrödner, R., Sinclair, K., Sourdeval, O., Stier, P., Tesche, M., van Diedenhoven, B., and Wendisch, M.: Constraining the Twomey effect from satellite observations: issues and perspectives, Atmos. Chem. Phys., 20, 15079–15099, https://doi.org/10.5194/acp-20-15079-2020, 2020.
Regayre, L.: Figure creation code and dependencies for Reamining aerosol forcing uncertainty after observational constraint and the processes that cause it, Zenodo [code], https://doi.org/10.5281/zenodo.16686812, 2025.
Regayre, L. A., Pringle, K. J., Booth, B. B. B., Lee, L. A., Mann, G. W., Browse, J., Woodhouse, M. T., Rap, A., Reddington, C. L., and Carslaw, K. S.: Uncertainty in the magnitude of aerosol-cloud radiative forcing over recent decades, Geophys. Res. Lett., 41, 9040–9049, https://doi.org/10.1002/2014GL062029, 2014.
Regayre, L. A., Pringle, K. J., Lee, L. A., Rap, A., Browse, J., Mann, G. W., Reddington, C. L., Carslaw, K. S., Booth, B. B. B., and Woodhouse, M. T.: The Climatic Importance of Uncertainties in Regional Aerosol–Cloud Radiative Forcings over Recent Decades, J. Clim., 28, 6589–6607, https://doi.org/10.1175/JCLI-D-15-0127.1, 2015.
Regayre, L. A., Johnson, J. S., Yoshioka, M., Pringle, K. J., Sexton, D. M. H., Booth, B. B. B., Lee, L. A., Bellouin, N., and Carslaw, K. S.: Aerosol and physical atmosphere model parameters are both important sources of uncertainty in aerosol ERF, Atmos. Chem. Phys., 18, 9975–10006, https://doi.org/10.5194/acp-18-9975-2018, 2018.
Regayre, L. A., Schmale, J., Johnson, J. S., Tatzelt, C., Baccarini, A., Henning, S., Yoshioka, M., Stratmann, F., Gysel-Beer, M., Grosvenor, D. P., and Carslaw, K. S.: The value of remote marine aerosol measurements for constraining radiative forcing uncertainty, Atmos. Chem. Phys., 20, 10063–10072, https://doi.org/10.5194/acp-20-10063-2020, 2020.
Regayre, L. A., Carslaw, K. S., Deaconu, L., Symonds, C., Richardson, M., Langton, T., Watson-Parris, D., and Stier, P.: A-CURE: Monthly mean perturbed parameter ensemble data, https://catalogue.ceda.ac.uk/uuid/b735718d66c1403fbf6b93ba3bd3b1a9 (last access: 10 February 2026), 2021.
Regayre, L. A., Deaconu, L., Grosvenor, D. P., Sexton, D. M. H., Symonds, C., Langton, T., Watson-Paris, D., Mulcahy, J. P., Pringle, K. J., Richardson, M., Johnson, J. S., Rostron, J. W., Gordon, H., Lister, G., Stier, P., and Carslaw, K. S.: Identifying climate model structural inconsistencies allows for tight constraint of aerosol radiative forcing, Atmos. Chem. Phys., 23, 8749–8768, https://doi.org/10.5194/acp-23-8749-2023, 2023.
Reutter, P., Su, H., Trentmann, J., Simmel, M., Rose, D., Gunthe, S. S., Wernli, H., Andreae, M. O., and Pöschl, U.: Aerosol- and updraft-limited regimes of cloud droplet formation: influence of particle number, size and hygroscopicity on the activation of cloud condensation nuclei (CCN), Atmos. Chem. Phys., 9, 7067–7080, https://doi.org/10.5194/acp-9-7067-2009, 2009.
Rostron, J. W., Sexton, D. M. H., McSweeney, C. F., Yamazaki, K., Andrews, T., Furtado, K., Ringer, M. A., and Tsushima, Y.: The impact of performance filtering on climate feedbacks in a perturbed parameter ensemble, Clim. Dyn., 55, 521–551, https://doi.org/10.1007/s00382-020-05281-8, 2020.
Rostron, J. W., Sexton, D. M. H., Furtado, K., and Tsushima, Y.: A clearer view of systematic errors in model development: two practical approaches using perturbed parameter ensembles, Clim. Dyn., 63, 354, https://doi.org/10.1007/s00382-025-07717-5, 2025.
Saltelli, A., Aleksankina, K., Becker, W., Fennell, P., Ferretti, F., Holst, N., Li, S., and Wu, Q.: Why so many published sensitivity analyses are false: A systematic review of sensitivity analysis practices, Env. Model. Soft., 114, 29–39, https://doi.org/10.1016/j.envsoft.2019.01.012, 2019.
Salter, J. M., Williamson, D. B., Scinocca, J., and Kharin, V.: Uncertainty Quantification for Computer Models With Spatial Output Using Calibration-Optimal Bases, J. Am. Stat. Assoc., 114, 1800–1814, https://doi.org/10.1080/01621459.2018.1514306, 2019.
Sand, M., Samset, B. H., Myhre, G., Gliß, J., Bauer, S. E., Bian, H., Chin, M., Checa-Garcia, R., Ginoux, P., Kipling, Z., Kirkevåg, A., Kokkola, H., Le Sager, P., Lund, M. T., Matsui, H., van Noije, T., Olivié, D. J. L., Remy, S., Schulz, M., Stier, P., Stjern, C. W., Takemura, T., Tsigaridis, K., Tsyro, S. G., and Watson-Parris, D.: Aerosol absorption in global models from AeroCom phase III, Atmos. Chem. Phys., 21, 15929–15947, https://doi.org/10.5194/acp-21-15929-2021, 2021.
Sanderson, B. M., Knutti, R., and Caldwell, P.: A Representative Democracy to Reduce Interdependency in a Multimodel Ensemble, J. Clim., 28, 5171–5194, https://doi.org/10.1175/JCLI-D-14-00362.1, 2015.
Sansom, R. W. N., Carslaw, K. S., Johnson, J. S., and Lee, L.: An Emulator of Stratocumulus Cloud Response to Two Cloud-Controlling Factors Accounting for Internal Variability, J. Adv. Model. Earth Syst., 16, e2023MS004179, https://doi.org/10.1029/2023MS004179, 2024.
Schmale, J., Baccarini, A., Thurnherr, I., Henning, S., Efraim, A., Regayre, L., Bolas, C., Hartmann, M., Welti, A., Lehtipalo, K., Aemisegger, F., Tatzelt, C., Landwehr, S., Modini, R. L., Tummon, F., Johnson, J. S., Harris, N., Schnaiter, M., Toffoli, A., Derkani, M., Bukowiecki, N., Stratmann, F., Dommen, J., Baltensperger, U., Wernli, H., Rosenfeld, D., Gysel-Beer, M., and Carslaw, K. S.: Overview of the Antarctic Circumnavigation Expedition: Study of Preindustrial-like Aerosols and Their Climate Effects (ACE-SPACE), Bull. Am. Met. Soc., 100, 2260–2283, https://doi.org/10.1175/BAMS-D-18-0187.1, 2019.
Schutgens, N., Tsyro, S., Gryspeerdt, E., Goto, D., Weigum, N., Schulz, M., and Stier, P.: On the spatio-temporal representativeness of observations, Atmos. Chem. Phys., 17, 9761–9780, https://doi.org/10.5194/acp-17-9761-2017, 2017.
Sellar, A. A., Jones, C. G., Mulcahy, J. P., Tang, Y., Yool, A., Wiltshire, A., O'Connor, F. M., Stringer, M., Hill, R., Palmieri, J., Woodward, S., Mora, L., Kuhlbrodt, T., Rumbold, S. T., Kelley, D. I., Ellis, R., Johnson, C. E., Walton, J., Abraham, N. L., Andrews, M. B., Andrews, T., Archibald, A. T., Berthou, S., Burke, E., Blockley, E., Carslaw, K., Dalvi, M., Edwards, J., Folberth, G. A., Gedney, N., Griffiths, P. T., Harper, A. B., Hendry, M. A., Hewitt, A. J., Johnson, B., Jones, A., Jones, C. D., Keeble, J., Liddicoat, S., Morgenstern, O., Parker, R. J., Predoi, V., Robertson, E., Siahaan, A., Smith, R. S., Swaminathan, R., Woodhouse, M. T., Zeng, G., and Zerroukat, M.: UKESM1: Description and Evaluation of the U.K. Earth System Model, J. Adv. Model. Earth Syst., 11, 4513–4558, https://doi.org/10.1029/2019MS001739, 2019.
Servén, D., Brummitt, C., Abedi, H., and Hlink: dswah/pyGAM: v0.8.0, Zenodo [code], https://doi.org/10.5281/zenodo.1208723, 2018.
Sexton, D. M. H., Murphy, J. M., Collins, M., and Webb, M. J.: Multivariate probabilistic projections using imperfect climate models part I: outline of methodology, Clim. Dyn., 38, 2513–2542, https://doi.org/10.1007/s00382-011-1208-9, 2012.
Sexton, D. M. H., McSweeney, C. F., Rostron, J. W., Yamazaki, K., Booth, B. B. B., Murphy, J. M., Regayre, L., Johnson, J. S., and Karmalkar, A. V.: A perturbed parameter ensemble of HadGEM3-GC3.05 coupled model projections: part 1: selecting the parameter combinations, Clim. Dyn., 56, 3395–3436, https://doi.org/10.1007/s00382-021-05709-9, 2021.
Shindell, D. T.: Inhomogeneous forcing and transient climate sensitivity, Nat. Clim. Change, 4, 274–277, https://doi.org/10.1038/nclimate2136, 2014.
Sprintall, J., Coles, V. J., Reed, K. A., Butler, A. H., Foltz, G. R., Penny, S. G., and Seo, H.: Best Practice Strategies for Process Studies Designed to Improve Climate Modeling, Bull. Am. Met. Soc., 101, E1842–E1850, https://doi.org/10.1175/BAMS-D-19-0263.1, 2020.
Strong, M., Oakley, J. E., and Brennan, A.: Estimating Multiparameter Partial Expected Value of Perfect Information from a Probabilistic Sensitivity Analysis Sample: A Nonparametric Regression Approach, Med. Decis. Making, 34, 311–326, https://doi.org/10.1177/0272989X13505910, 2014.
Sun, C., Zhang, Y., Liang, B., Gao, M., Sun, X., Li, F., Ni, X., Sun, Q., Ou, H., Chen, D., Zhou, S., and Zhao, J.: Morphological and optical properties of carbonaceous aerosol particles from ship emissions and biomass burning during a summer cruise measurement in the South China Sea, Atmos. Chem. Phys., 24, 3043–3063, https://doi.org/10.5194/acp-24-3043-2024, 2024.
Walters, D., Baran, A. J., Boutle, I., Brooks, M., Earnshaw, P., Edwards, J., Furtado, K., Hill, P., Lock, A., Manners, J., Morcrette, C., Mulcahy, J., Sanchez, C., Smith, C., Stratton, R., Tennant, W., Tomassini, L., Van Weverberg, K., Vosper, S., Willett, M., Browse, J., Bushell, A., Carslaw, K., Dalvi, M., Essery, R., Gedney, N., Hardiman, S., Johnson, B., Johnson, C., Jones, A., Jones, C., Mann, G., Milton, S., Rumbold, H., Sellar, A., Ujiie, M., Whitall, M., Williams, K., and Zerroukat, M.: The Met Office Unified Model Global Atmosphere 7.0/7.1 and JULES Global Land 7.0 configurations, Geosci. Model Dev., 12, 1909–1963, https://doi.org/10.5194/gmd-12-1909-2019, 2019.
Wang, J., Wood, R., Jensen, M. P., Chiu, J. C., Liu, Y., Lamer, K., Desai, N., Giangrande, S. E., Knopf, D. A., Kollias, P., Laskin, A., Liu, X., Lu, C., Mechem, D., Mei, F., Starzec, M., Tomlinson, J., Wang, Y., Yum, S. S., Zheng, G., Aiken, A. C., Azevedo, E. B., Blanchard, Y., China, S., Dong, X., Gallo, F., Gao, S., Ghate, V. P., Glienke, S., Goldberger, L., Hardin, J. C., Kuang, C., Luke, E. P., Matthews, A. A., Miller, M. A., Moffet, R., Pekour, M., Schmid, B., Sedlacek, A. J., Shaw, R. A., Shilling, J. E., Sullivan, A., Suski, K., Veghte, D. P., Weber, R., Wyant, M., Yeom, J., Zawadowicz, M., and Zhang, Z.: Aerosol and Cloud Experiments in the Eastern North Atlantic (ACE-ENA), Bull. Am. Met. Soc., 103, E619–E641, https://doi.org/10.1175/BAMS-D-19-0220.1, 2022.
Watson-Parris, D. and Smith, C. J.: Large uncertainty in future warming due to aerosol forcing, Nat. Clim. Change, 12, 1111–1113, https://doi.org/10.1038/s41558-022-01516-0, 2022.
Williams, A. I. L., Stier, P., Dagan, G., and Watson-Parris, D.: Strong control of effective radiative forcing by the spatial pattern of absorbing aerosol, Nat. Clim. Change, 12, 735–742, https://doi.org/10.1038/s41558-022-01415-4, 2022.
Williams, K. D., Copsey, D., Blockley, E. W., Bodas-Salcedo, A., Calvert, D., Comer, R., Davis, P., Graham, T., Hewitt, H. T., Hill, R., Hyder, P., Ineson, S., Johns, T. C., Keen, A. B., Lee, R. W., Megann, A., Milton, S. F., Rae, J. G. L., Roberts, M. J., Scaife, A. A., Schiemann, R., Storkey, D., Thorpe, L., Watterson, I. G., Walters, D. N., West, A., Wood, R. A., Woollings, T., and Xavier, P. K.: The Met Office Global Coupled Model 3.0 and 3.1 (GC3.0 and GC3.1) Configurations, J. Adv. Model. Earth Syst., 10, 357–380, https://doi.org/10.1002/2017MS001115, 2018.
Williamson, D., Goldstein, M., Allison, L., Blaker, A., Challenor, P., Jackson, L., and Yamazaki, K.: History matching for exploring and reducing climate model parameter space using observations and a large perturbed physics ensemble, Clim. Dyn., 41, 1703–1729, https://doi.org/10.1007/s00382-013-1896-4, 2013.
Wood, R., Mechoso, C. R., Bretherton, C. S., Weller, R. A., Huebert, B., Straneo, F., Albrecht, B. A., Coe, H., Allen, G., Vaughan, G., Daum, P., Fairall, C., Chand, D., Gallardo Klenner, L., Garreaud, R., Grados, C., Covert, D. S., Bates, T. S., Krejci, R., Russell, L. M., de Szoeke, S., Brewer, A., Yuter, S. E., Springston, S. R., Chaigneau, A., Toniazzo, T., Minnis, P., Palikonda, R., Abel, S. J., Brown, W. O. J., Williams, S., Fochesatto, J., Brioude, J., and Bower, K. N.: The VAMOS Ocean-Cloud-Atmosphere-Land Study Regional Experiment (VOCALS-REx): goals, platforms, and field operations, Atmos. Chem. Phys., 11, 627–654, https://doi.org/10.5194/acp-11-627-2011, 2011.
Yeom, J. M., Yum, S. S., Shaw, R. A., La, I., Wang, J., Lu, C., Liu, Y., Mei, F., Schmid, B., and Matthews, A.: Vertical Variations of Cloud Microphysical Relationships in Marine Stratocumulus Clouds Observed During the ACE-ENA Campaign, J. Geophys. Res. Atmos., 126, e2021JD034700, https://doi.org/10.1029/2021JD034700, 2021.
Yoshioka, M., Regayre, L. A., Pringle, K. J., Johnson, J. S., Mann, G. W., Partridge, D. G., Sexton, D. M. H., Lister, G. M. S., Schutgens, N., Stier, P., Kipling, Z., Bellouin, N., Browse, J., Booth, B. B. B., Johnson, C. E., Johnson, B., Mollard, J. D. P., Lee, L., and Carslaw, K. S.: Ensembles of Global Climate Model Variants Designed for the Quantification and Constraint of Uncertainty in Aerosols and Their Radiative Forcing, J. Adv. Model. Earth Syst., 11, 3728–3754, https://doi.org/10.1029/2019MS001628, 2019.
Zheng, G., Wang, Y., Aiken, A. C., Gallo, F., Jensen, M. P., Kollias, P., Kuang, C., Luke, E., Springston, S., Uin, J., Wood, R., and Wang, J.: Marine boundary layer aerosol in the eastern North Atlantic: seasonal variations and key controlling processes, Atmos. Chem. Phys., 18, 17615–17635, https://doi.org/10.5194/acp-18-17615-2018, 2018.
Zhong, Q., Schutgens, N., Van Der Werf, G. R., Takemura, T., Van Noije, T., Mielonen, T., Checa-Garcia, R., Lohmann, U., Kirkevåg, A., Olivié, D. J. L., Kokkola, H., Matsui, H., Kipling, Z., Ginoux, P., Le Sager, P., Rémy, S., Bian, H., Chin, M., Zhang, K., Bauer, S. E., and Tsigaridis, K.: Threefold reduction of modeled uncertainty in direct radiative effects over biomass burning regions by constraining absorbing aerosols, Sci. Adv., 9, eadi3568, https://doi.org/10.1126/sciadv.adi3568, 2023.
Zhuang, B. L., Liu, L., Shen, F. H., Wang, T. J., and Han, Y.: Semidirect radiative forcing of internal mixed black carbon cloud droplet and its regional climatic effect over China, J. Geophys. Res., 115, 2009JD013165, https://doi.org/10.1029/2009JD013165, 2010.