the Creative Commons Attribution 4.0 License.
the Creative Commons Attribution 4.0 License.
Separating the Twomey effect and the semi-direct effect in absorbing aerosol environments through the cloud-aerosol mixing ratio
Po-Hsun Lin
Otto Klemm
Neng-Huei Lin
Air masses carrying absorbing aerosols play a dual role by altering ambient supersaturation and acting as cloud condensation nuclei (CCN), thus contributing to both the semi-direct and indirect aerosol effects. However, in real cloud development processes, aerosol influences can simultaneously act to suppress cloud formation or enhance droplet production, resulting in microphysical characteristics that remain difficult to describe. In the study, an aerosol and cloud microphysics experiment, focusing on warm cloud events strongly coupled with biomass-burning aerosols transported from the Southeast Asia Peninsula, was conducted in the spring of 2024 at the Lulin Atmospheric Background Station (LABS, 2862 m a.s.l.) in Taiwan. One-minute resolution of in-situ data was used in the data analysis, allowing exploration of the microphysical responses under varying mixing states of absorbing aerosol concentration and cloud liquid water content. This study applies the cloud-aerosol mixing ratio (e.g., mass concentration mixing ratio (MCr), in conjunction with the ACI index ( to describe the behavior of aerosol-cloud interactions. Results identify two distinct responses: (1) under high MCr conditions (MCr>4.5), clouds exhibit features of the Twomey effect (); (2) under low MCr conditions (MCr=3–4.5), not only is the less than −0.06, but the high aerosol loading also coincides with elevated temperatures, lower relative humidity, and a reduction in small droplets (<10 µm), consistent with a semi-direct effect. This study provides a comprehensive explanation of how absorbing aerosols influence cloud systems over East Asia and highlights the critical role of the cloud-aerosol mixing ratio in characterizing the microphysical responses associated with the Twomey effect and the semi-direct effect.
- Article
(9271 KB) - Full-text XML
-
Supplement
(1392 KB) - BibTeX
- EndNote
Anthropogenic aerosols continue to impact the cloud amount and distribution, which in turn affects the radiative balance and contributes to climate change (IPCC, 2023). The mechanisms through which aerosols influence cloud properties remain highly complex. Since the release of AR5 (IPCC, 2014), the understanding of aerosol effects has been redefined and broadly categorized into aerosol-radiation interactions (ARI) and aerosol-cloud interactions (ACI). The adjustment processes associated with ARI, as the semi-direct effect (Bond et al., 2013; Boucher et al., 2013; Kacarab et al., 2020; Spracklen et al., 2011), can lead to reductions in cloud amount. This response, driven by aerosol-induced environmental changes, constitutes one of the major pathways through which aerosols alter the radiation budget. On the other hand, scientists have studied the impact of ACI over the past 30 years, showing that low-level warm clouds, which generally exhibit higher horizontal extensions, are more sensitive to variations in anthropogenic aerosol concentrations (Fan et al., 2016; Warren et al., 1988; Wood, 2012). When aerosol loading increases under constant liquid water path (LWP) conditions, a greater number of cloud droplets with smaller droplet sizes will form, leading to an increase in cloud optical thickness and thus cloud albedo, which is called the Twomey effect (Feingold et al., 2001; Twomey, 1974, 1977). Additionally, smaller droplet sizes reduce the collision efficiency, thereby lowering the likelihood of rain formation and extending the cloud's lifetime, which, on average, increases cloud albedo (Albrecht, 1989; Kaufman et al., 2005). Satellite observations (Chen et al., 2021; Christensen et al., 2016; Toll et al., 2017) and ground-based field campaigns (Haywood et al., 2021; Zhao et al., 2018) have confirmed these theories, and there is a considerable consensus on ACI.
However, even though most studies agree that increased aerosol concentrations generally lead to more numerous and smaller cloud droplets, there remains disagreement regarding whether such microphysical changes result in an overall increase in cloud amount, as the reduction in droplet size may instead enhance evaporation (Chen et al., 2012; Fan et al., 2016; Toll et al., 2019). This not only indicates large uncertainties in the estimation of LWP but may also lead to misinterpretations in models regarding aerosol-induced variations in LWP and cloud fraction (CF) (Chen et al., 2022; Toll et al., 2019). It is worth noting that such reductions in cloud cover in ARI adjustment may contrast with the tendencies typically attributed to ACI. Irrespective of whether smaller droplets persist in the ambient environment, the decrease in supersaturation during ARI adjustment processes undoubtedly promotes cloud dissipation. These contrasting effects highlight the substantial uncertainty and complexity inherent in aerosol effects on clouds.
Beyond the contrasting effects of ACI and ARI, a deeper layer of complexity arises from the behavior of aerosol-cloud responses, which are often nonlinear and highly sensitive to aerosol properties such as hygroscopicity and absorptivity. While it is widely acknowledged that increased aerosol concentrations generally lead to more numerous and smaller cloud droplets, this relationship is not necessarily linear. Recent studies suggest that beyond a certain threshold of aerosol loading, further increases in aerosol concentrations may have a diminished or even negligible effect on cloud droplet size and number (Chen et al., 2021; Feingold et al., 2001; Jia and Quaas, 2023; Saponaro et al., 2017). Observational studies have also shown that the water content in the atmosphere plays a critical role in determining whether aerosols ultimately enhance or suppress cloud formation (Zhang and Zuidema, 2019, 2021). Furthermore, some cloud seeding studies have even indicated that large amounts of hygroscopic aerosols are ineffective at increasing cloud amount or droplet size under limited liquid water content (Lin et al., 2023; Silverman and Sukarnjanaset, 2000). This nonlinearity adds a layer of complexity to interpreting aerosol effects on clouds, particularly when attempting to quantify aerosol-induced changes in cloud water content. The situation becomes even more intricate with the presence of absorbing aerosols such as black carbon. These aerosols can modify the thermal structure of the atmosphere through radiative heating, which in turn influences cloud formation and dissipation pathways (Bender et al., 2019; Bond et al., 2013). Although the activation of aerosols into cloud condensation nuclei (CCN) is governed by their size and hygroscopicity (Klemm and Lin, 2016; Pöhlker et al., 2023; Wang et al., 2010), the presence of absorbing aerosols may reduce ambient supersaturation levels and introduce thermodynamic feedbacks that counteract the microphysical pathways traditionally associated with ACI, which is, as indicated before, the main reason responsible for ARI adjustment. These insights emphasize that aerosol concentration thresholds and the presence of absorbing species must be carefully accounted for in any attempt to characterize aerosol effects on clouds, as they fundamentally alter the pathways and magnitude of cloud responses to aerosol perturbations.
To quantify the impact of aerosols on cloud properties, previous studies have utilized aerosol-cloud interaction (ACI) index as a measure (Chen et al., 2021; Feingold et al., 2001; Kaufman and Fraser, 1997; Lihavainen et al., 2010; McComiskey et al., 2009; Zheng et al., 2020). In particular, positive ACI index values (ranging from 0 to 0.33) are generally interpreted as an indication of the strength of the Twomey effect (Lihavainen et al., 2010; McComiskey et al., 2009). However, many traditional applications of the ACI index rely on the assumption of constant liquid water content (LWC), under which retrieved values based on cloud effective radius (re) or cloud optical thickness (COT) become comparable. Unless cloud droplet number concentration (Nd) is used – a metric more directly tied to aerosol activation efficiency – the applicability of ACI indices remains limited to specific liquid water regimes (McComiskey et al., 2009). In addition, studies based primarily on satellite data are often constrained by retrieval limitations, as simultaneous estimation of cloud and aerosol properties within the same spatial domain remains challenging (Jia et al., 2021). Moreover, variations in cloud-base and cloud-top CCN concentrations, uncertainties in Nd, and the low vertical resolution of aerosol optical depth (AOD) introduce substantial uncertainty in estimating in-cloud aerosol concentrations (Jia et al., 2022; Quaas et al., 2020). Furthermore, variations in aerosol composition, number concentration, hygroscopicity, and optical properties (McMeeking et al., 2011; Ohata et al., 2016; Pöhlker et al., 2023; Wang et al., 2010) make the conversion from aerosols to CCN difficult to quantify (Quaas et al., 2020), significantly increasing the complexity of retrieving and interpreting aerosol-cloud interaction signals. These factors contribute to the persistent difficulty in robustly quantifying aerosol effects on clouds. Consequently, observational ACI estimates frequently demonstrate significant spatial and temporal constraints, and may not generalise effectively across varied cloud regimes or environmental conditions (Jia et al., 2022; Lihavainen et al., 2010; McComiskey et al., 2009; Quaas et al., 2020). To present, the accurate quantification of the impact of aerosol on clouds remains one of the most pressing and unresolved challenges in climate change research (Bellouin et al., 2020; Bender et al., 2019).
This study posits that constraining aerosol properties is essential for robust analyses of the relationship between aerosol concentration and cloud water content. In recent years, a series of studies have been conducted over the southeastern Atlantic Ocean to investigate the emission, transport, and cloud-related impacts of biomass-burning aerosols originating from continental sources (Bond et al., 2013; Haywood et al., 2021; Herbert et al., 2020; Kaufman et al., 2005; Taylor et al., 2020). Biomass-burning aerosols, which contain substantial amounts of light-absorbing species such as black carbon (BC), complicate aerosol effects. Taiwan is situated downwind of biomass burning emissions from the Southeast Asia Peninsula during spring (Lee et al., 2011; Lin et al., 2013; Nguyen et al., 2020; Wang et al., 2007; Yen et al., 2013), accompanied by cold frontal systems (Huang et al., 2020). This geographic advantage allows for observing cloud system development and impacts influenced by aerosols. Lulin Atmospheric Background Station, located in Taiwan's mountainous region, provides a valuable opportunity to capture and isolate frontal systems influenced by biomass-burning aerosols (Pani et al., 2022; Tsay et al., 2016).
Therefore, this study used in-situ observational instruments, including the Cloud Droplet Probe and 11-D optical particle counter, to investigate a frontal event occurring from 1 to 12 March 2024. Cloud droplet number concentration (Nd) is mainly employed to calculate the ACI index. Unlike traditional metrics such as effective radius (Re) or cloud optical thickness (COT), which rely on the assumption of constant liquid water content (LWC), Nd offers a more direct representation of aerosol activation efficiency without requiring constraints on cloud water content (McComiskey et al., 2009). Furthermore, this study introduces the use of the cloud-aerosol mixing ratio to represent how much liquid water is present per unit of aerosol concentration, thereby providing a more realistic indication of aerosol loading within cloud systems. This framework allows for a systematic examination of the transition between Twomey effect-dominated ACI responses and ARI adjustments (semi-direct effect) under the influence of absorbing aerosols. This approach moves beyond conventional constraints, offering a unified perspective to disentangle the intertwined microphysical and thermodynamic pathways governing aerosol effects on clouds. The findings offer a crucial advancement in understanding how different cloud water-aerosol mixing states regulate cloud microphysical processes, thereby contributing to a more physically based and comprehensive assessment of aerosol-cloud-climate linkages. Section 2.1 and 2.2 describe the observation site and the instruments used, while Sect. 2.3 to 2.6 present the analytical methods. Section 3 presents the relationship between the cloud water-aerosol mixing ratio and the ACI index, and Sect. 3.5 further integrates changes in meteorological conditions as well as the size distributions of cloud droplets and aerosols. Section 4 provides the conclusions.
2.1 Observation Site
Lulin Atmospheric Background Station (LABS), which is located at central Taiwan (23.47° N, 120.87° E, 2862 m above sea level, m a.s.l.), was selected as the site for the field campaign. LABS is an atmospheric background indicator station in East Asia that benefits from its geographical location and altitude (Cheng et al., 2013; Hsiao et al., 2017; Lee et al., 2011; Pani et al., 2022). Most studies have shown that biomass burning aerosol transported from the Southeast Asia Peninsula can be detected during spring season (Chuang et al., 2014; Hsiao et al., 2017; Huang et al., 2020; Nguyen et al., 2020). LABS not only includes measurements of aerosol mass concentration (i.e., PM2.5, PM10), optical properties, and carbon mass concentration, but also contains basic atmospheric measurements (i.e., temperature, relative humidity, pressure, wind direction, wind speed), which help to understand the weather conditions.
2.2 Data Set
From 1 to 12 March 2024, a field campaign was carried out at LABS to collect extensive data on biomass-burning aerosols and cloud-related meteorological conditions. An Aerosol-Cloud Microphysics Monitoring System, including Cloud Droplet Probe (CDP) and 11-D Optical Particle Counter, was deployed to provide high-resolution measurements of aerosol and cloud size distribution and number concentration (Fig. 1a). Combined with the basic atmospheric measurements and aerosol system at LABS, a comprehensive list of all observed parameters is provided in Table 1.
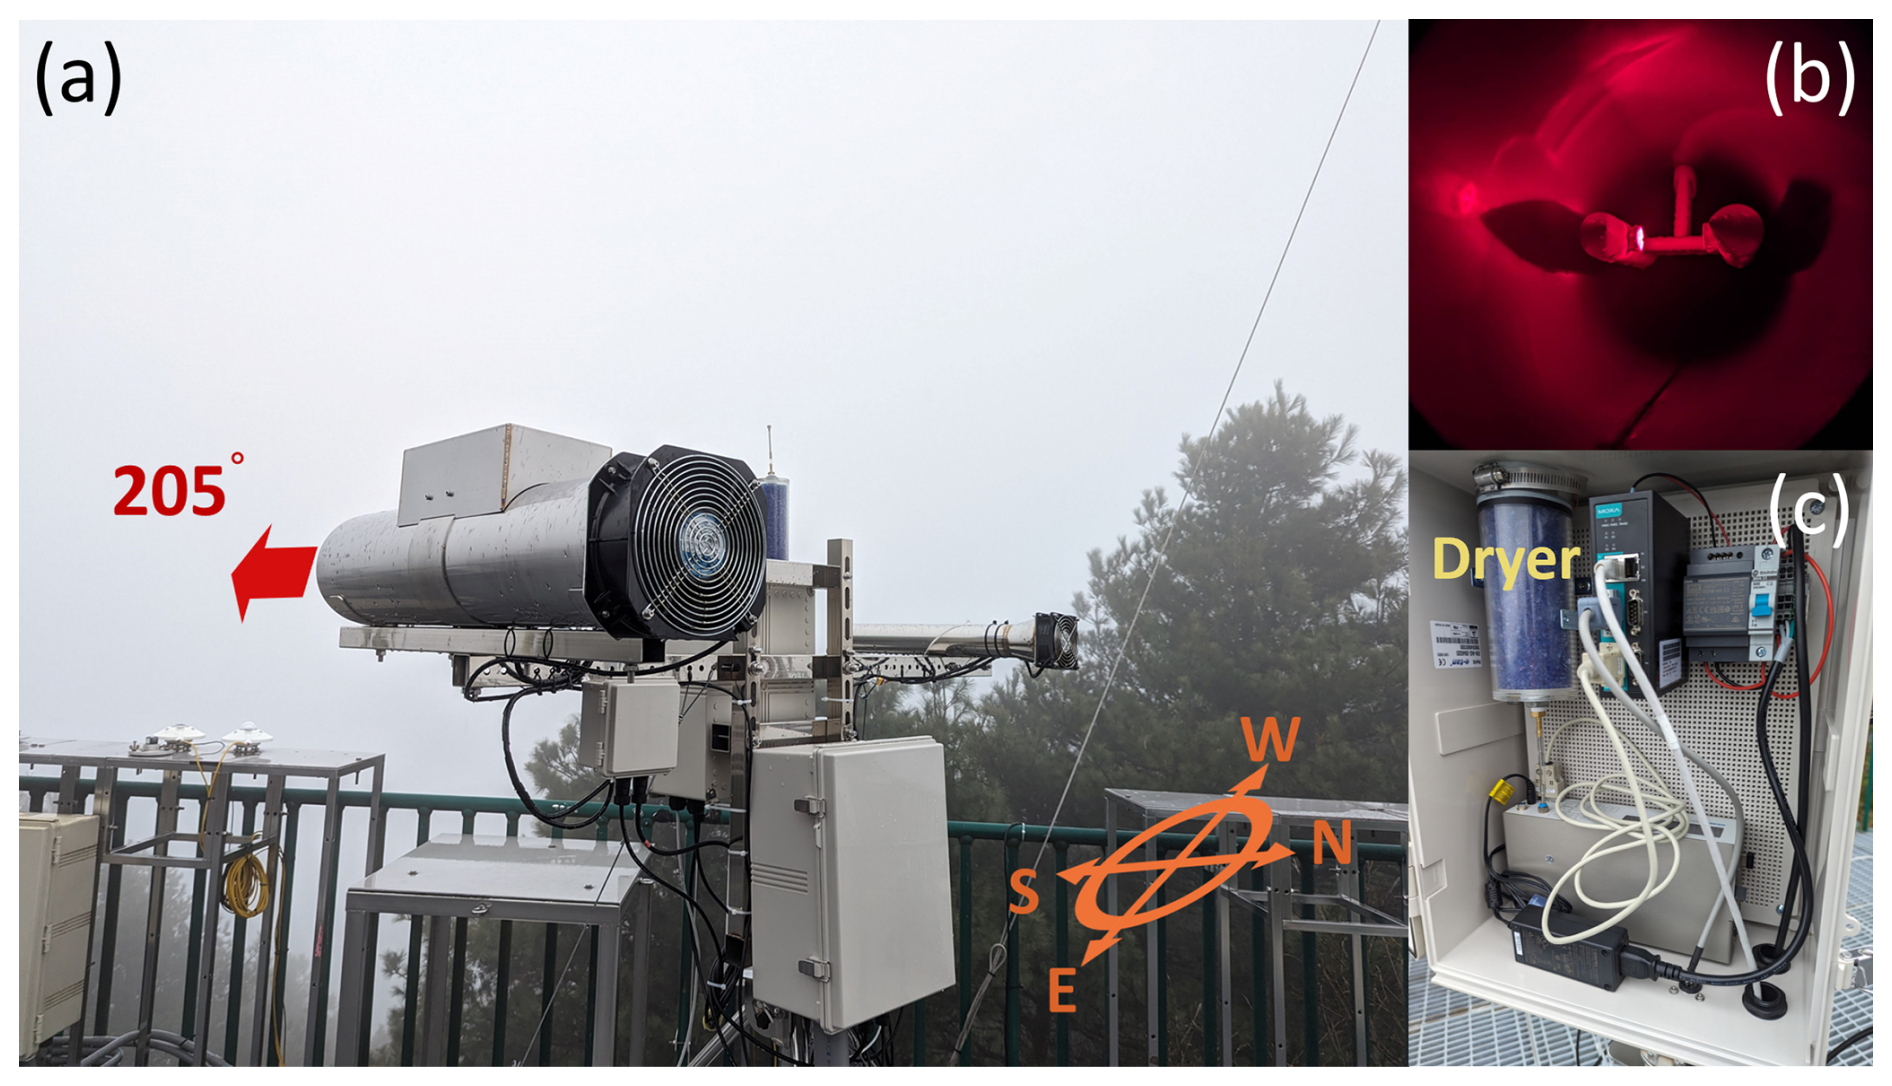
Figure 1(a) The setup and orientation diagram of Aerosol-Cloud Microphysics Monitoring System deployed at LABS during the 2024 observation period. (b) The appearance of CDP. (c) The appearance of 11-D.
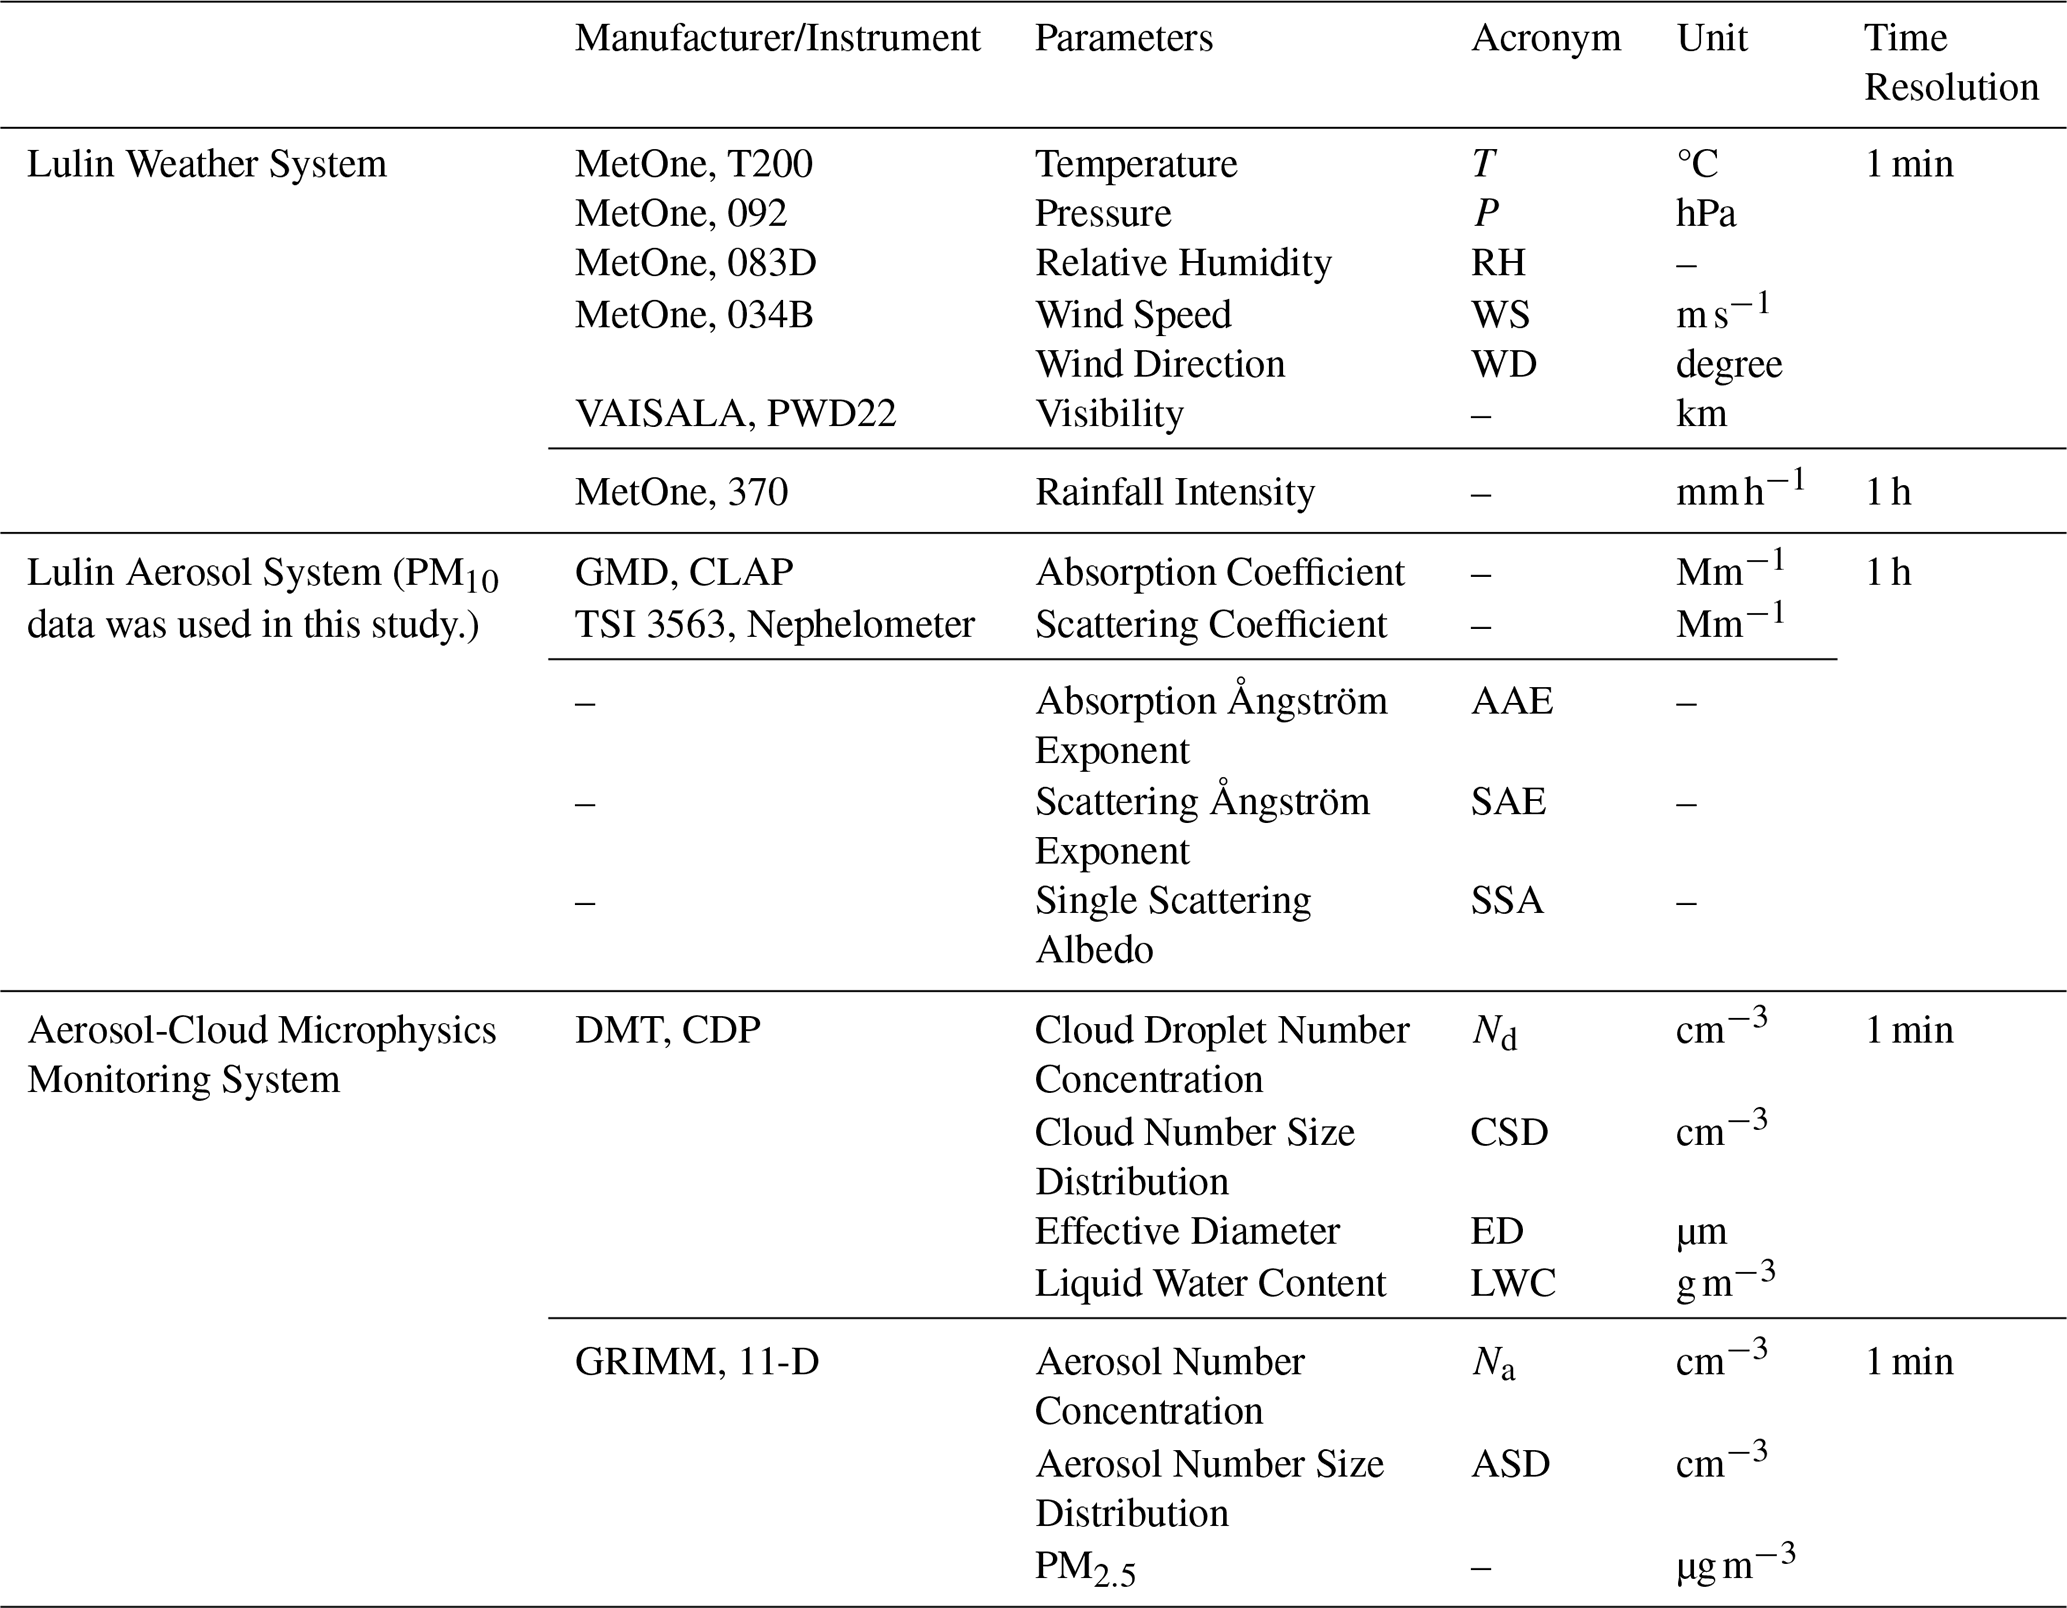
CDP is a forward-scattering spectrometer manufactured by Droplet Measurement Technologies (DMT). It is designed to be lightweight and mounted on airborne platforms, enabling measurements of cloud droplet number concentration and size distribution. Therefore, a ducted facility is necessary to ensure the required airflow velocity when CDP is positioned on the ground (Fig. 1b). CDP uses a 658 nm single-mode diode laser to detect forward-scattered light at angles between 4 and 12° from cloud droplets passing through the laser beam's effective sampling area of 0.267 mm2. Based on Mie scattering theory, the instrument retrieves the size of cloud droplets with diameters ranging from 2–50 µm. According to Lance (2012), CDP exhibits an overall uncertainty of 20 % to 30 % when cloud number concentration reaches 500 cm−3, with a tendency to underestimate the number of cloud droplets and overestimate the size of cloud droplets. During the observation period, CDP instrument required regular cleaning of its optical windows, with more frequent wiping necessary during rainfall. The raw data are recorded at a temporal resolution of 1 Hz and averaged to 1 min intervals for comparison with aerosol size spectrometers and meteorological data from LABS. All measurements were also corrected for variations in airflow velocity within the wind duct, which can be affected by ambient wind.
The 11-D optical particle counter is a portable instrument developed and manufactured by Grimm Aerosol Technik, Germany. Figure 1c shows the instruments' appearance during the field campaign. 11-D utilizes a diode laser with a narrow wavelength band and automatically adjusts the flow rate according to the ambient pressure. The receiver analyses the intensity of light scattered by aerosols within the airflow, subsequently deriving the aerosol number concentration and size distribution across 31 size bins ranging from 0.253 µm to over 35.15 µm diameters, and also provides results of aerosol mass concentrations (i.e., PM10, PM4, PM2.5, and PM1). As part of the Aerosol-Cloud Microphysics Monitoring System, a drying tube is employed to ensure that the relative humidity remains below 40 % during sampling. The detection limit of the 11-D for mass concentration is 100 000 µg m−3, while for number concentration, it is 3000 cm−3. Ardon-Dryer et al. (2022) reported that the 11-D exhibits an uncertainty of ±3 % when the number concentration exceeds 500 cm−3. The PM2.5 and PM10 measurements from the 11-D were compared with hourly data from the 1405-DF TEOM Continuous Dichotomous Ambient Air Monitor at LABS. The root-mean-square error (RMSE) was 3.76 for PM2.5 and 2.97 for PM10, with both variables showing a coefficient of determination (R2) of 0.9, indicating good agreement. Therefore, the PM2.5 data used in this study are based on the 11-D observations, and the raw data have a temporal resolution of 6 s, which were merged into 1 min averaged data.
The aerosol optical properties were analysed using the aerosol system deployed at LABS. The aerosol system includes a TSI 3563 nephelometer and a Continuous Light Absorption Photometer (CLAP) to investigate aerosol optical characteristics. TSI 3563, which is manufactured by TSI, can measure the scattering coefficient and backward scattering coefficient for PM10 and PM1 at wavelengths of 450, 550, and 700 nm. CLAP is a compact instrument that has been designed by NOAA's Global Monitoring Division (GMD). It is well known for its capacity to conduct continuous long-term monitoring and to measure the absorption coefficients of PM10 and PM1 at wavelengths of 467, 528, and 652 nm. By integrating the data from TSI 3563 nephelometer and CLAP, further calculations of aerosol optical properties such as the Absorption Ångström Exponent (AAE), Scattering Ångström Exponent (SAE), and Single Scattering Albedo (SSA) can be derived for a more comprehensive analysis. The aerosol system was equipped with a heated drying unit at the inlet, maintaining the relative humidity of the sampled air below 40 %. Therefore, even during cloud events, the measurements represent the properties of dry aerosols. Similarly, the 11-D system also used a drying tube at the inlet (Fig. 1c) to keep the relative humidity of the sampled air below 40 %. In this study, all aerosol measurements represent dry aerosols and include both interstitial aerosols and in-droplet aerosols.
2.3 Definition of Warm Cloud
Gultepe and Isaac (1999) proposed that extremely low number concentrations observed by cloud droplet spectrometers might be attributed to aerosols or dust in the environment rather than to cloud droplets. However, the minimum effective value should be adjusted according to cloud type and in-cloud number concentration to prevent distortion of the average calculation. Over the past two decades, studies utilizing cloud droplet spectrometers have defined the minimum effective value for low-level clouds as a droplet number concentration of 10 cm−3, with liquid water content constrained to a concentration range between 0.001 and 0.01 g m−3 based on the expected visibility of either thick or thin cloud layers (D'Alessandro et al., 2021; Deng et al., 2009; Koike et al., 2019; Yang et al., 2019). Deng et al. (2009) conducted research on warm clouds in the East Asian region and reported an average cloud droplet number concentration of 193 cm−3 for the observed middle to low cloud families. This study analyses the aerosol-cloud interactions observed at LABS for low-level warm clouds, defining the warm cloud data based on previous studies' thresholds for cloud droplet spectrometer sampling (Deng et al., 2009; Yang et al., 2019) as a droplet number concentration of ≥10 cm−3, liquid water content of ≥0.001 g m−3, and an ambient temperature greater than 0 °C.
During spring, amounts of biomass burning aerosols from the Southeast Asian Peninsula are lifted into the free atmosphere through the convergence of low-level tropospheric air and transported to East Asia and the western Pacific by a low-level jet (LLJ) generated by frontal structures at an altitude of 700 hPa (Huang et al., 2020; Lin et al., 2013; Yen et al., 2013). Satellite imagery and surface chart show (Fig. 2a and b) that the passing of fronts carries abundant moisture from inland China towards East Asia and the western Pacific on 7 March 2024, demonstrating that the location of the cloud system lies north of the biomass burning hotspot, leading to mixing during the transport process. To minimize the variability in aerosol composition and cloud types, satellite imagery and surface charts (Fig. 2a and b) were used to ensure that the observed warm cloud data were associated with frontal systems. In addition, this study employed the NOAA HYSPLIT model (Draxler and Hess, 1998; Stein et al., 2015) to generate 3 d backward trajectories, MODIS fire hotspot data (Giglio et al., 2006; Justice et al., 2002) from Terra and Aqua (Fig. 2c), and lidar observations deployed by the Taiwan Ministry of Environment in central Taiwan (Fig. S1 in the Supplement) as supporting evidence to assess the potential impact of long-range transport of biomass-burning aerosols. The results indicate that, during the cloud events, air masses surrounding LABS may have traversed affected regions, such as the southern coastal areas of China and the Southeast Asian Peninsula, while the fire hotspot data further highlight the Southeast Asian Peninsula as potential major sources of biomass burning during this period.
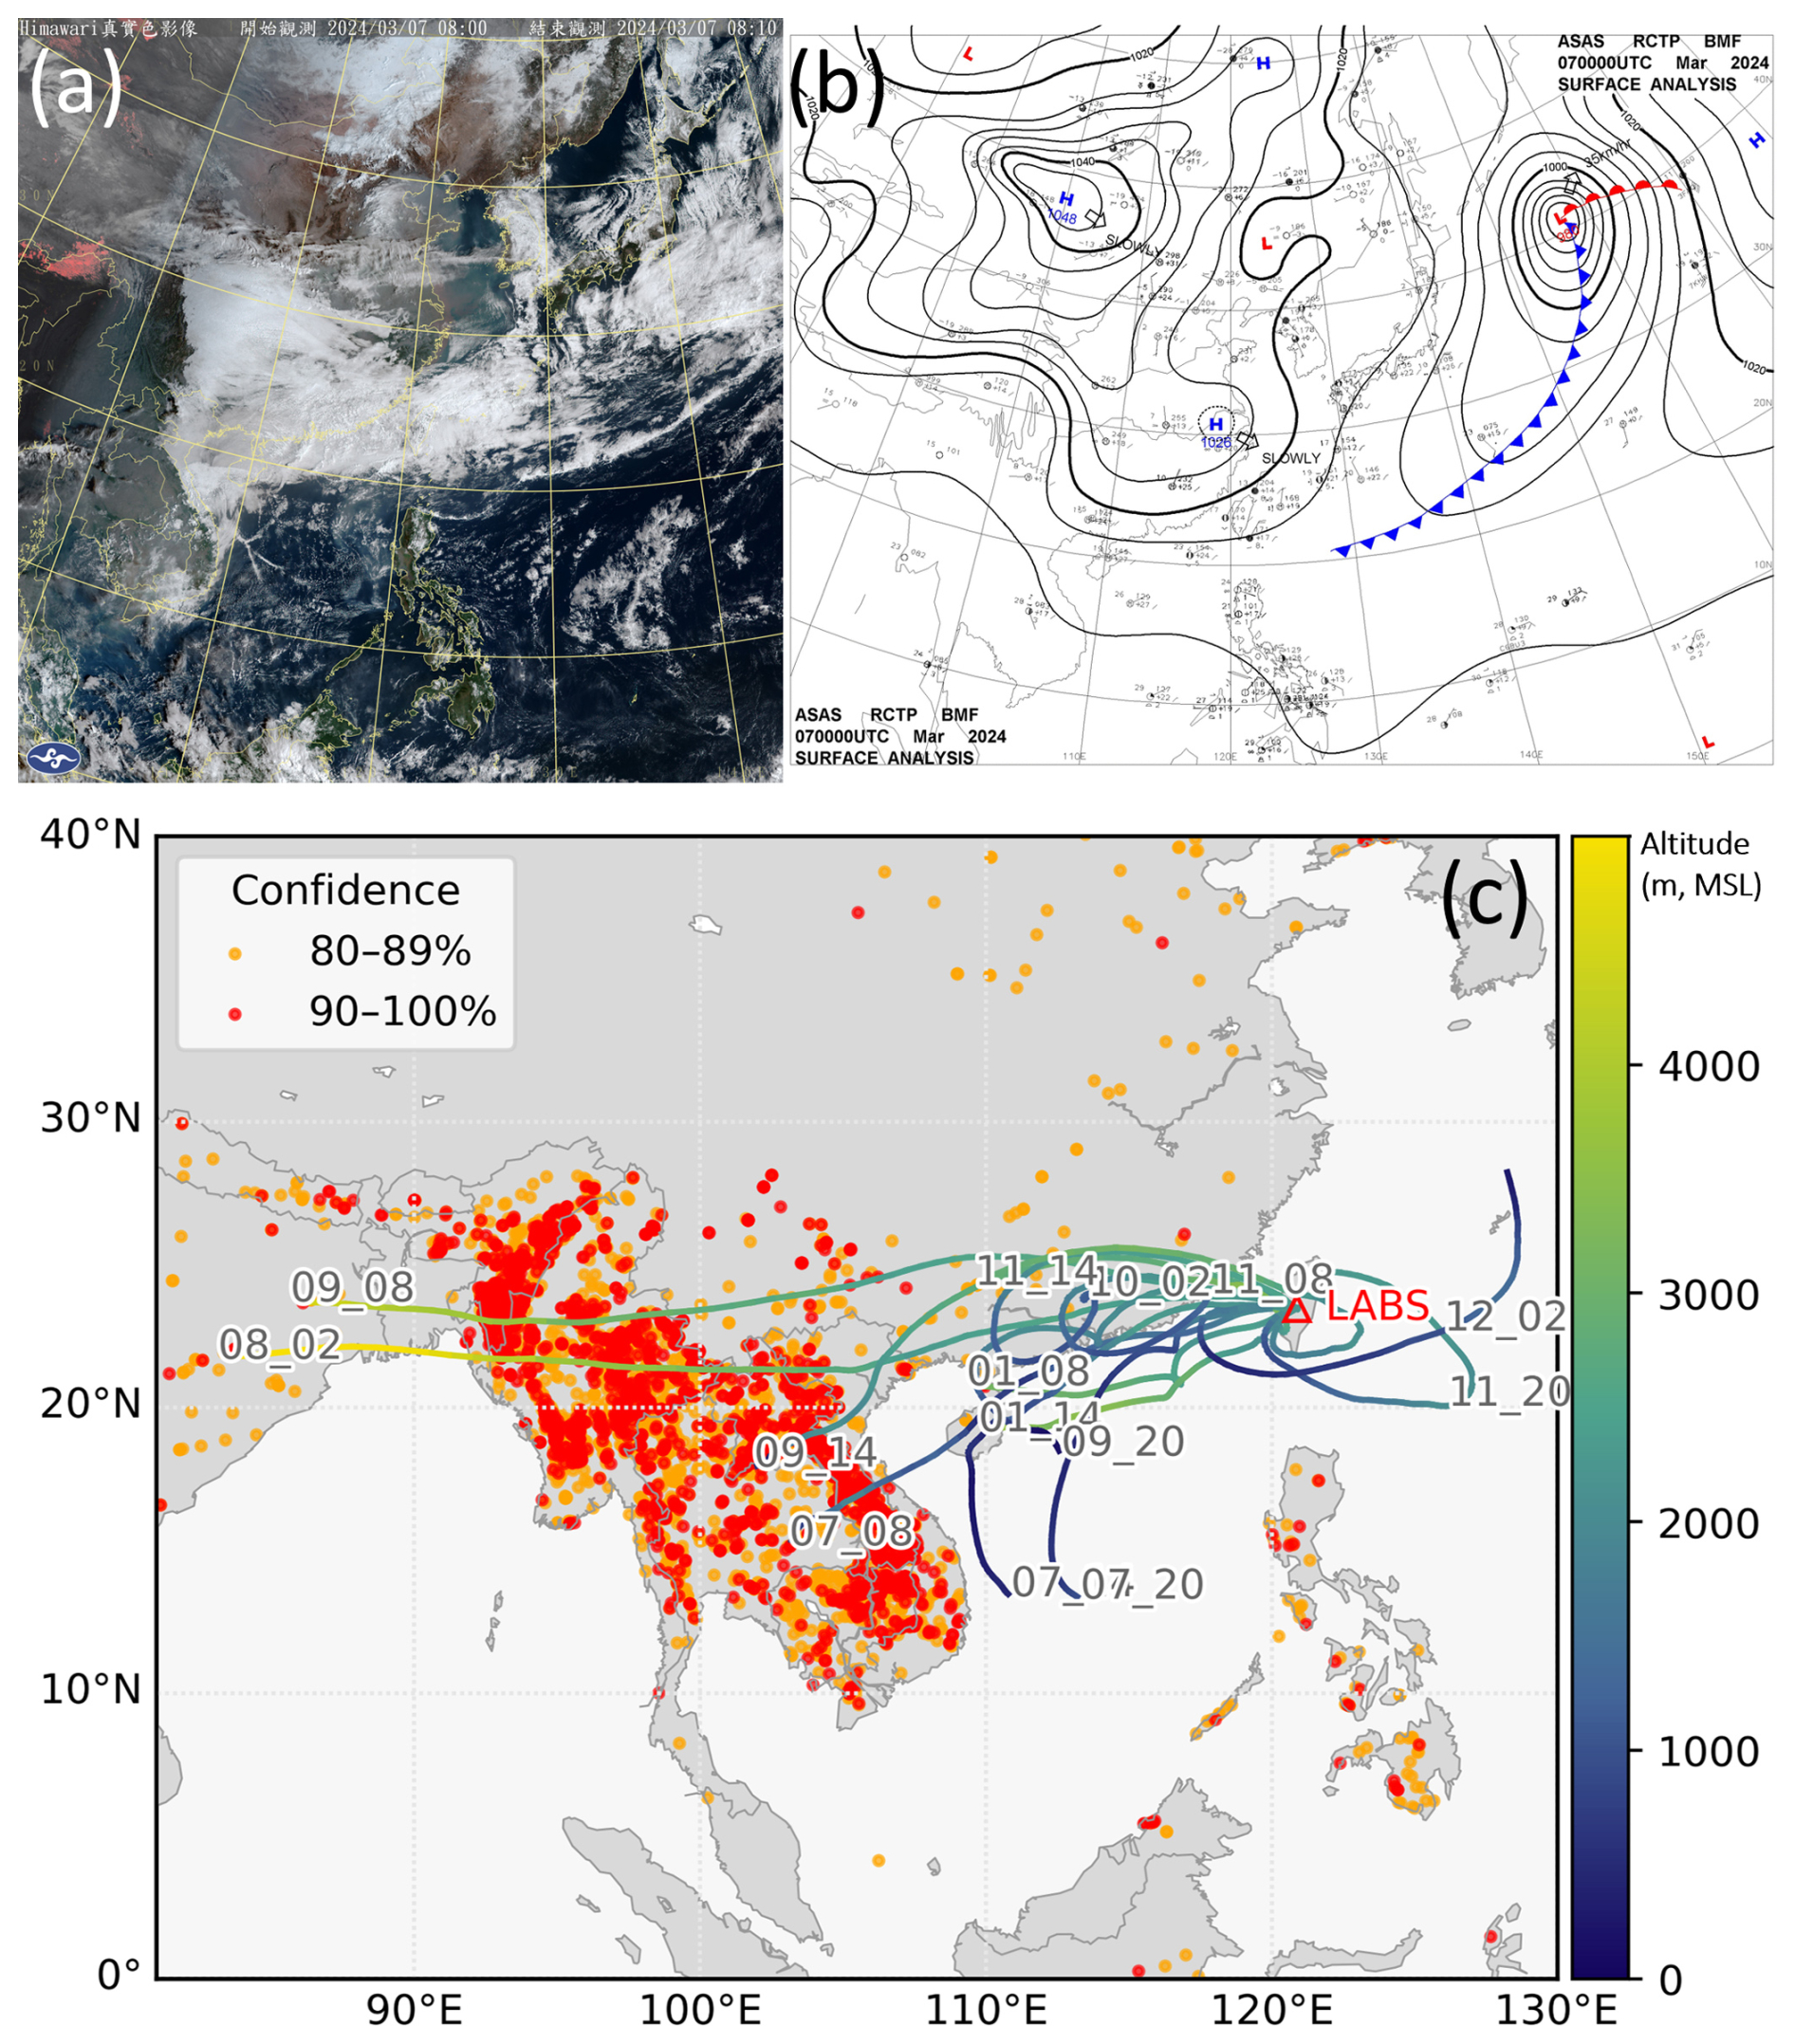
Figure 2(a) Himawari true color satellite image and (b) surface chart from Central Weather Administration (CWA) at 08:00 LT (UTC +8), 7 March 2024. (c) Fire hotspot data from 1 March to 12 March 2024, were plotted together with the timing of major cloud events (DD_HH, LT) using 72 h backward trajectories. Fire hotspot data were obtained from MODIS onboard Terra and Aqua, considering only those with confidence levels above 80 %. The backward trajectories were calculated using the NOAA HYSPLIT model (GFS 0.25°×0.25°) and displayed at 6 h intervals.
2.4 Aerosol-Cloud Interaction Index
In the comparison of the relationship between cloud microphysics and aerosol concentration variations, the Aerosol-Cloud Interaction (ACI) index was first proposed by Kaufman and Fraser (1997) to quantify aerosol effects on cloud microphysics. The ACI index is defined as the ratio of the change in cloud droplet effective radius (re) to the change in aerosol optical depth (AOD), as expressed in Eq. (1). To minimize observational errors caused by different instruments and locations, Feingold et al. (2001) further revised the formulation into Eq. (2), which has been widely adopted in subsequent studies (Chen et al., 2021; Lihavainen et al., 2010; McComiskey et al., 2009; Zheng et al., 2020).
Based on satellite remote sensing assumptions such as and , regarding cloud microphysical variables (Stephens, 1978; Twomey, 1977), the relationship can be extended to Eqs. (3)–(5) (Lihavainen et al., 2010; McComiskey et al., 2009). Therefore, when comparing the ACI index, it is necessary to constrain the analysis to similar LWC conditions to ensure consistency across different parameters. This serves as a constraint when comparing metrics such as cloud effective radius or cloud optical thickness. More intuitively, without fixing LWC, variations in cloud effective radius or optical thickness may reflect intrinsic changes in cloud systems rather than the influence of aerosol concentrations.
Here, Nd is the cloud droplet number concentration, COT is the cloud optical thickness, and LWP is the liquid water path, while α refers to proxies for CCN number concentration, such as AOD, aerosol index (AI), sulphate mass concentration, PM2.5, or aerosol number concentration (Na). In contrast, McComiskey et al. (2009) indicated that the cloud number concentration emphasizes the activation process from aerosol to cloud droplet. This metric, particularly when direct measurements of droplet number are available, does not rely on the fixed-LWC assumption. While Eq. (3) simplifies the cloud microphysical processes to some extent, it adequately captures the relationship between changes in aerosol number and cloud droplet number concentrations. Theoretically, when all added aerosol particles are activated and grow into cloud droplets, the derivative equals 1. Therefore, within the defined range, represents the reasonable interval for the microphysical process of aerosol particles growing into cloud droplets. In recent years, the calculation formula derived from the ACI index has been increasingly regarded as one of the approaches to quantify the sensitivity of cloud systems to aerosol perturbations (Liu et al., 2024; Ma et al., 2018). In particular, the Nd-to-aerosol susceptibility provides a straightforward representation of the relationship between aerosol variations and changes in cloud droplet number (Quaas et al., 2020), thereby giving the index a clear physical meaning.
Nevertheless, the variability in atmospheric conditions and the complexity of aerosol composition may lead to ACI index values that exceed the expected range or even become negative. This paper posits that negative ACI index values are not inherently meaningless, nor are they solely influenced by factors external to aerosols, particularly when considering the physical implications of Eq. (3). In certain cases, absorbing aerosols can significantly alter ambient temperature, thereby reducing relative humidity, which makes the environment less conducive to cloud droplet formation (Boucher et al., 2013; Johnson et al., 2004; Koch and Del Genio, 2010; Schultze and Rockel, 2018). More extreme examples of this phenomenon are frequently observed in cloud seeding studies, where competing effects between hygroscopic seeded aerosols and natural aerosols are noted. Since larger cloud condensation nuclei (CCN) require less supersaturation to form droplets, all available moisture tends to accumulate in the larger CCN, forcing smaller CCN to evaporate or remain inactive (Segal et al., 2007, 2004). Whether through direct effects from changes in aerosol number concentrations or indirectly via increased temperature from aerosol absorption, the interplay between the aerosol load and supersaturation can lead to scenarios where an increase in aerosol concentration coincides with a decrease in cloud droplet numbers. When the observed data being compared are based on similar weather conditions and the light-absorbing properties of aerosols are further established, a negative ACI index value has physical significance.
Nd, re, Na, and PM2.5 were all derived from in-situ instruments in this study. Given the advantages of metrics, this study primarily adopts Eq. (3) as the basis for calculating the ACI index. Additionally, Sect. 3.4 presents supplementary analyses using (Eq. 5) calculations under constrained LWC conditions for comparison. However, due to the size range limitations of the 11-D instrument, aerosols smaller than 0.253 µm are not detected, leading to a noticeable underestimation of Na values. Thus, in calculating ACI index, the variation in PM2.5 is primarily used as a proxy for aerosol concentration changes.
2.5 Cloud-Aerosol Mixing Ratio
In order to better explain the nonlinear relationship of aerosol concentration and the amount of water content in the cloud system without constraining LWC, it is essential to consider both cloud water content (i.e., LWC, Nd) and aerosol concentration (i.e., PM2.5, Na) when analysing aerosol effects.
Therefore, this study introduces a ratio-based index to quantify the relationship between cloud water content and aerosol concentration. Drawing on the meteorological concept of mixing ratio, which is the ratio of water vapor to dry air, this study calculates the ratios of measured aerosol and cloud droplet mass and number concentrations to assess aerosol loading in cloud systems relative to liquid water content. Equations (6) and (7) define the mass concentration mixing ratio (MCr) and number concentration mixing ratio (NCr), representing the amount of cloud liquid water per unit aerosol mass and the number of cloud droplets per unit aerosol number concentration, respectively. It is important to note that due to the underestimation of Na in the 11-D measurements (only aerosols within the instrument's measurement size range (0.253–35.15 µm) were included in the particle number calculation), the study primarily focuses on MCr for quantitative analysis. Furthermore, relative humidity (RH) was not included in the mixing ratio calculations owing to limitations in measurement capabilities. When the ambient RH approaches saturation (∼100 %), the sensitivity of existing instruments to subtle variations diminishes significantly. However, aerosol activation processes under such near-saturated conditions, such as crossing the critical threshold on the Köhler curve, are highly sensitive to these minor differences (Klemm and Lin, 2016). Furthermore, conventional relative humidity instruments cannot capture variations at supersaturated conditions (RH>100 %). While LWC also does not directly quantify supersaturation, it provides a more quantitative representation of the resulting cloud water after a series of processes such as air mass mixing, aerosol activation, and subsequent cloud droplet growth or dissipation.
2.6 Selection of Time Interval Resolution
Within a cloud event, the continuous variation in cloud microphysical properties often exhibits strong temporal correlations, effectively capturing the impact of environmental perturbations and indicating whether the increased aerosol particles have been activated. In addition, to avoid the influence of rapid meteorological changes associated with frontal progression, the Standard Error of Mean (SEM) was used to determine an appropriate temporal scale for analysing ACI index, MCr, and NCr from continuously observed data. SEM illustrates the relationship between the mean calculated from a sample size n and the standard deviation σ of the data within that sample. Wang et al. (2021) used the average SEM (Eq. 8) to identify an appropriate spatial resolution for observational values. The SEM values of PM2.5, LWC, and Nd under different temporal scales were calculated (Fig. 3), ensuring that the differences between different sampling intervals are minimized while also avoiding excessively long-time intervals that could be influenced by significantly different weather conditions.
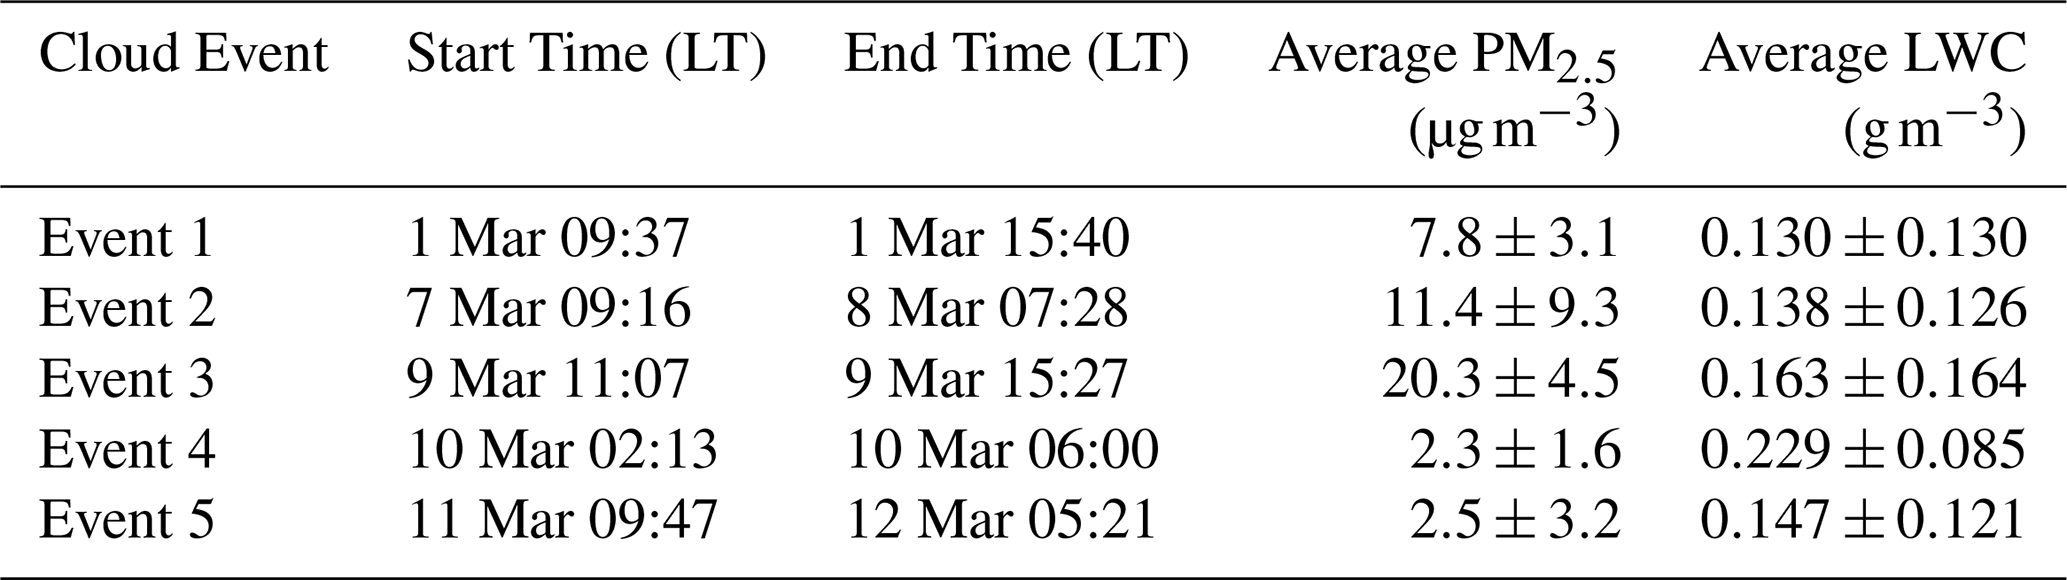
Figure 3a shows that when the time resolution of the observational data is less than 60 min, the average SEM for PM2.5, LWC, and Nd is large and decreases rapidly as the time interval increases. However, beyond 60 min, the decrease approaches a linear trend, and the differential results exhibit significant variation before and after the 60 min mark (Fig. 3b). Consequently, this study adopts a resolution of 60 min, calculating the moving averages of PM2.5, LWC, and Nd for continuous cloud events in 60 min intervals, while excluding the first 30 min and the last 30 min of the cloud event for ACI index calculations. Simultaneously, when calculating the moving averages, it is necessary to have a sufficient duration and continuous occurrence of cloud events. Accordingly, in the subsequent analysis of the temporal variations of aerosols and cloud microphysics, the calculations for MCr, NCr, and ACI will be based on data from continuous cloud events lasting more than three hours. The start and end times and the mean of PM2.5, LWC of each cloud event are presented in Table 2.
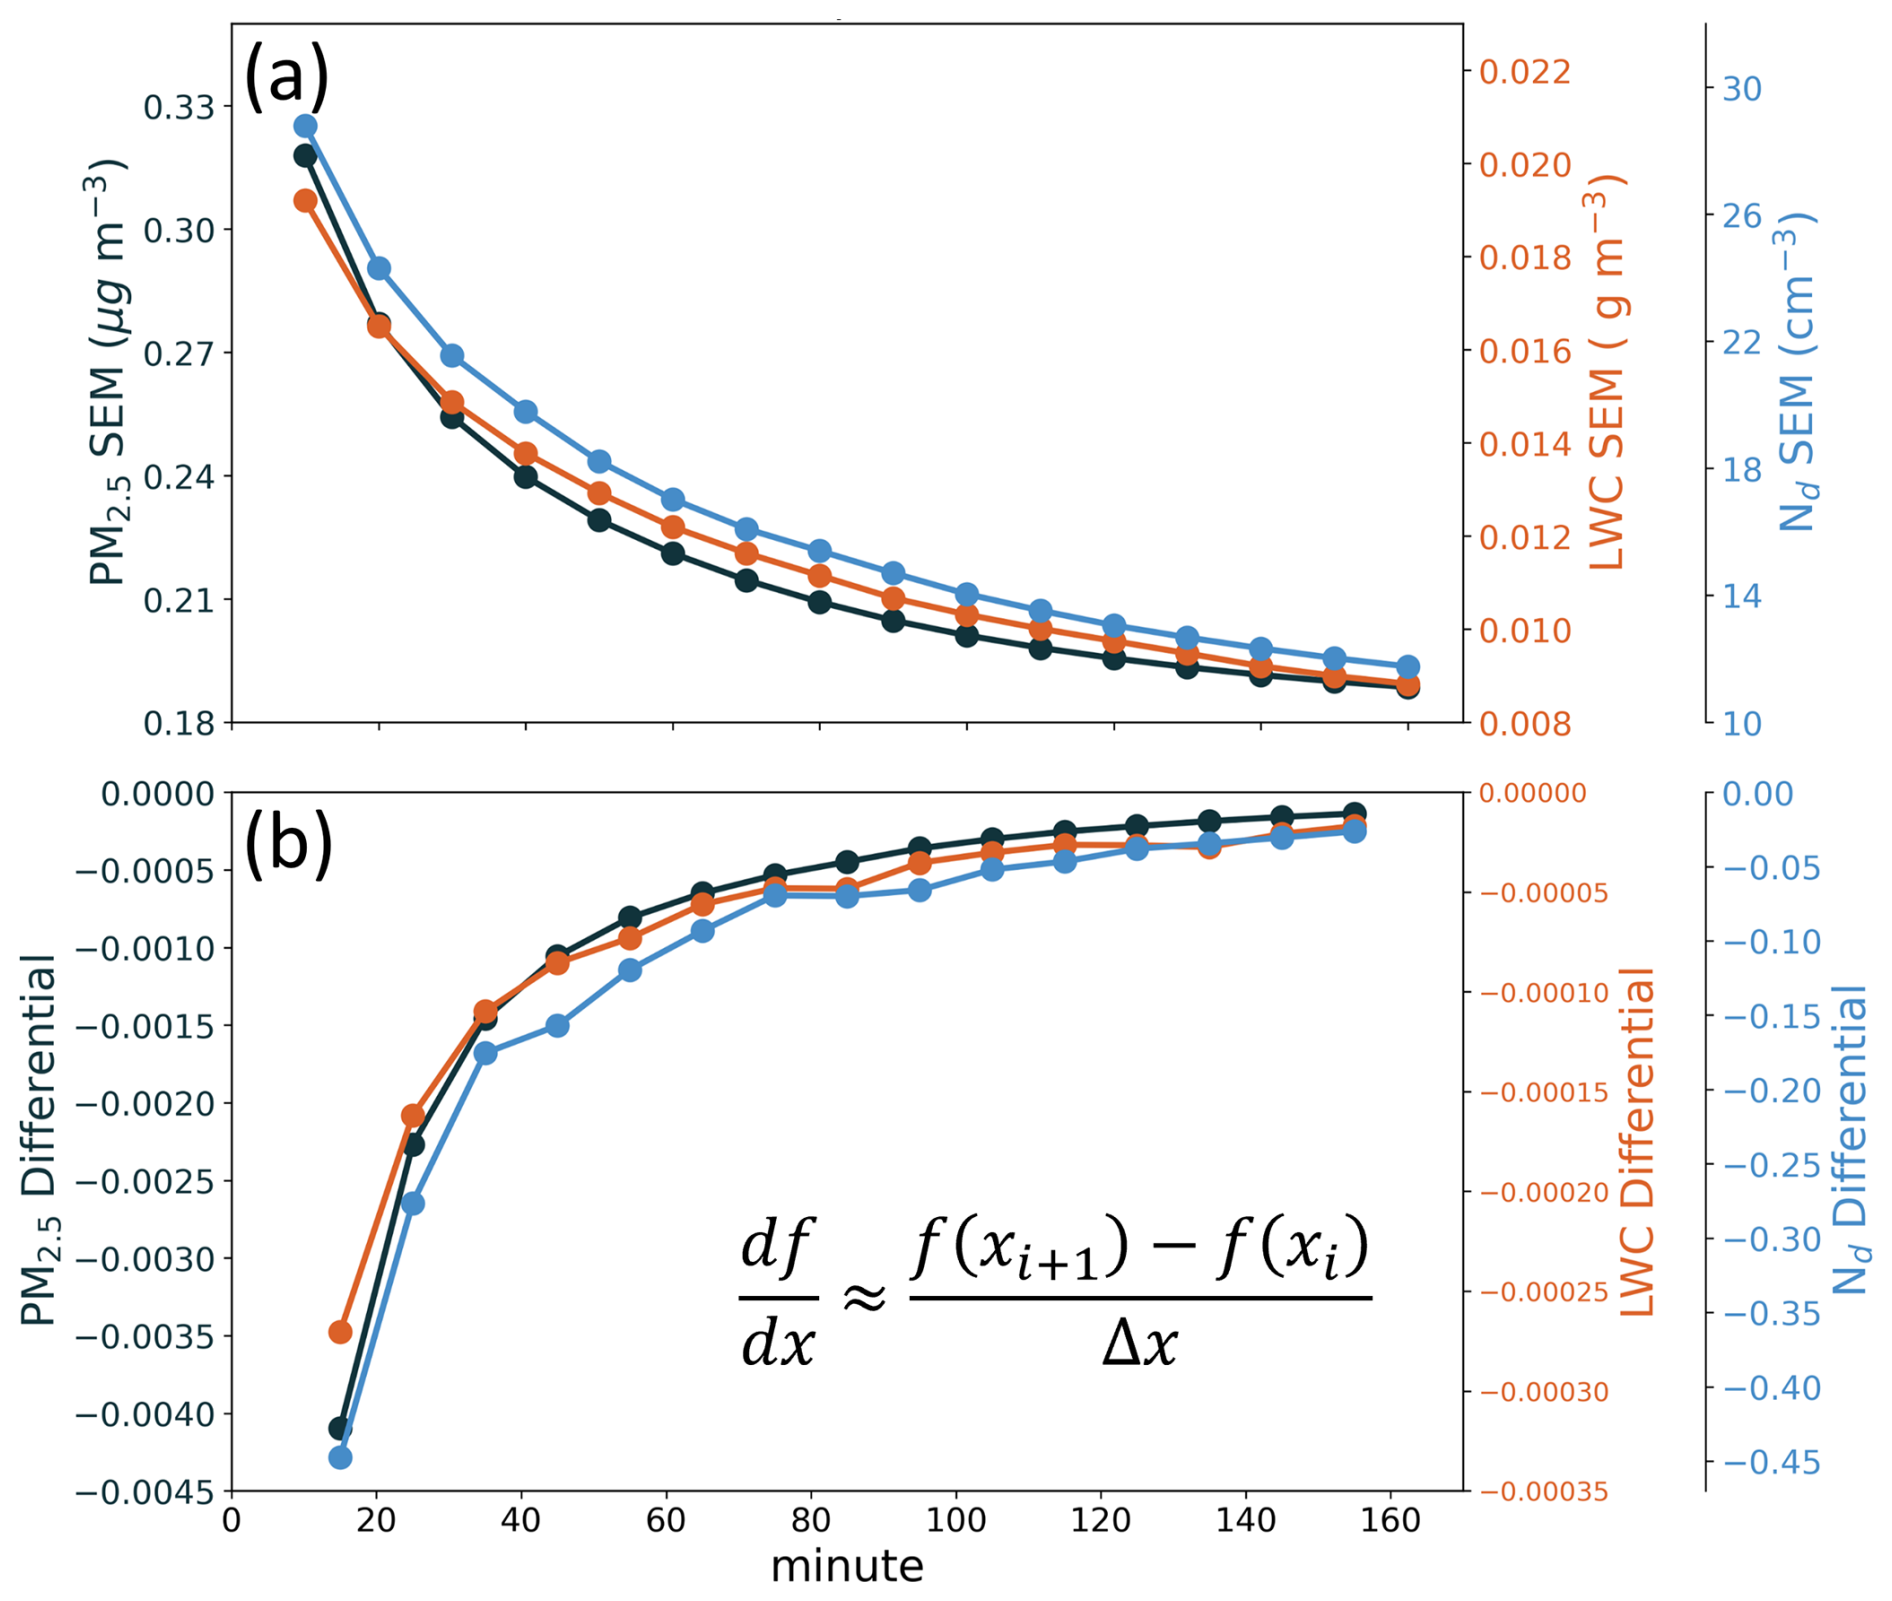
Figure 3(a) The standard error of the mean for PM2.5 (black), LWC (orange), and Nd (blue) at different time resolutions; (b) the differential results of the standard error of the mean.
Table 2The start, end local times and the mean of PM2.5, LWC of continuous cloud events (UTC +8).
3.1 Aerosol Optical Properties
Figure 4 presents the aerosol observations from the LABS aerosol system, with the corresponding meteorological information shown in Fig. S2 in the Supplement. In this section, the aerosol optical properties of aerosols are analysed using PM10 measurements from the aerosol system, whereas PM2.5 observations from the 11-D instrument are primarily used in the other sections. The gray-shaded intervals denote continuous cloud events lasting more than three hours and detected by CDP (Table 2). Based on the absorption and scattering coefficients as well as aerosol mass concentrations (Fig. 4a, b and Fig. S2d), it is evident that during cloud events accompanied by significant precipitation (Fig. S2d), aerosol concentrations decreased due to washout effect. However, in periods without precipitation signals prior to 10 March, aerosol concentrations clearly increased, indicating continuous long-range transport of aerosols to the LABS region. Overall, higher pollutant levels were observed during the early stage of the cloud event on 1 March (Event 1), both the early and late stages of the event on 7 March (Event 2), and throughout the event on 9 March (Event 3). In contrast, lower concentrations occurred during the precipitation periods on 1 March and 7 March, and during the cloud events on 10 and 11 March (Event 4 and Event 5).
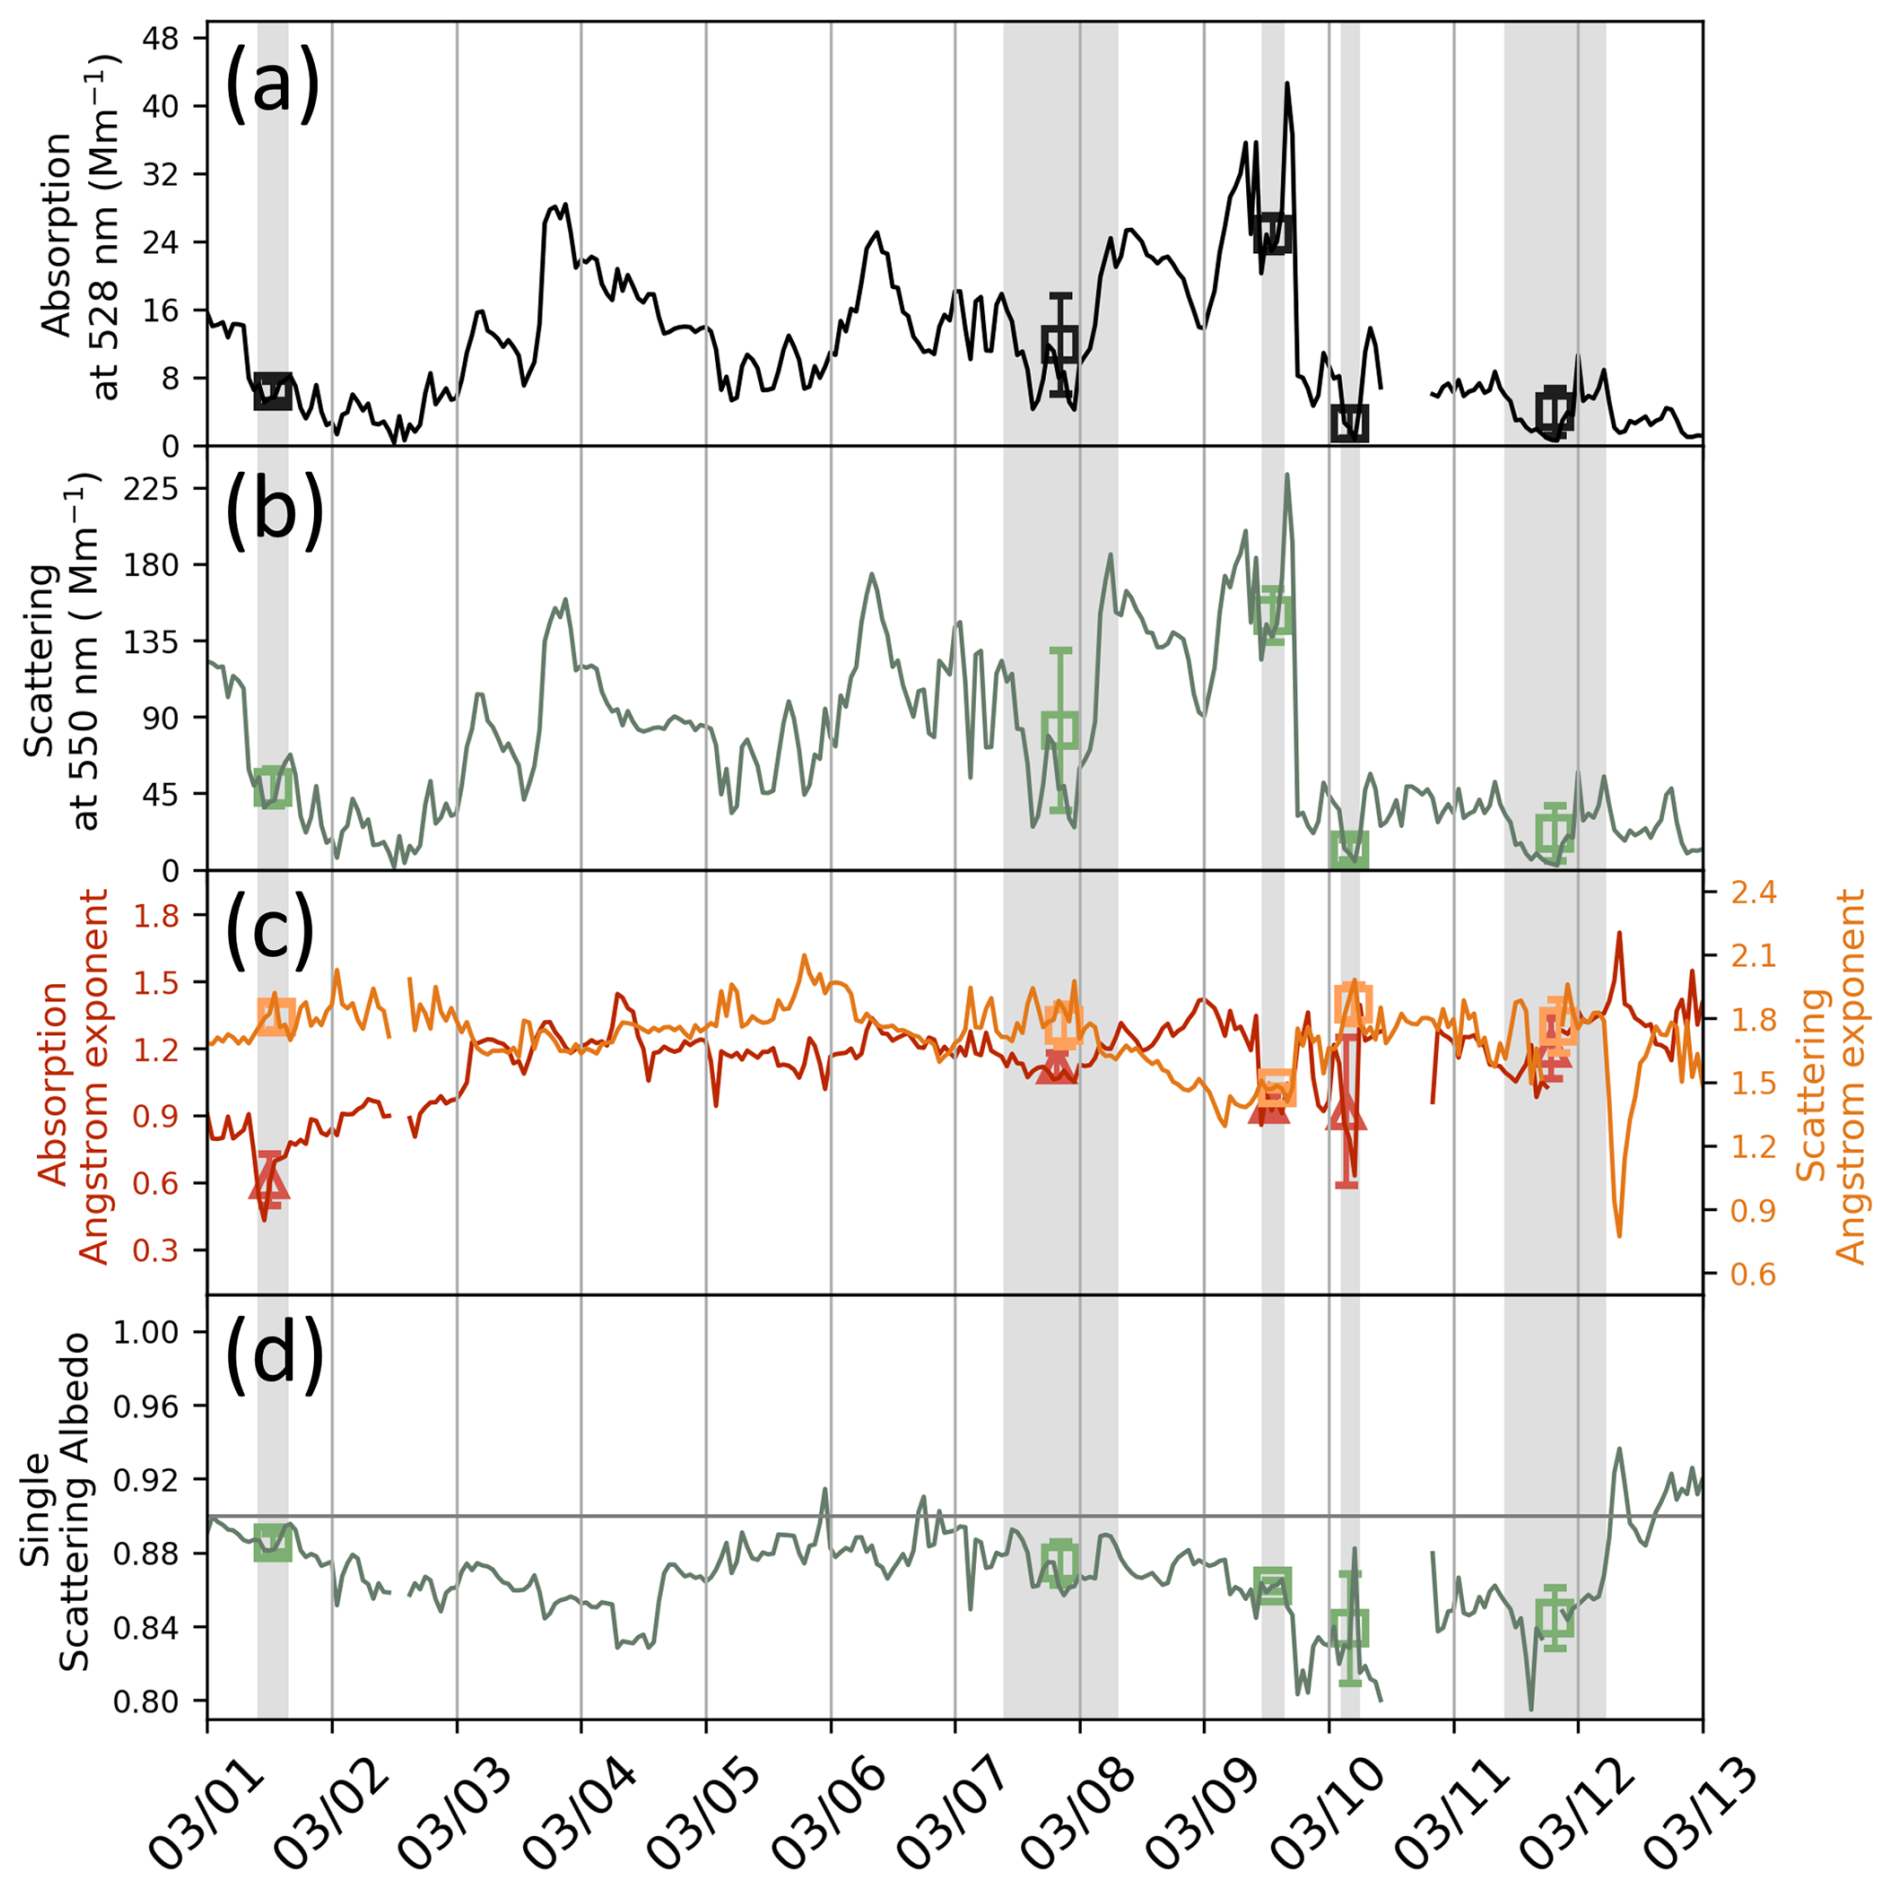
Figure 4PM10 aerosol optical properties observed by the aerosol system at LABS, the gray-shaded intervals represent continuous cloud events. (a) Absorption coefficient; (b) scattering coefficient; (c) Absorption Ångström Exponent (AAE, red) and Scattering Ångström Exponent (SAE, orange); (d) Single Scattering Albedo (SSA), and gray dash line means SSA=0.9.
Further analysis was conducted using AAE and SAE to evaluate the light absorption and scattering abilities of aerosols at blue and red wavelengths (Fig. 4c and d). Except for the Event 1, when the mean AAE value was significantly lower than 1 (0.61 ± 0.12), the average AAE during other cloud events was close to 1, suggesting minimal wavelength dependence of aerosol absorption. The SAE remained relatively stable throughout the observation period but showed a slight decrease on 9 March (1.47 ± 0.01), possibly indicating the presence of coarse-mode aerosols related to local sources. The single-scattering albedo (SSA), used to evaluate the overall aerosol absorption capacity (Fig. 4e), was generally below 0.9 during most of the observation period except on 12 March. Notably, no significant correlation was found between SSA values and aerosol concentrations before and after cloud events, suggesting that despite effects of wet deposition, the proportion of light-absorbing aerosols within the total aerosol population remained relatively consistent. In some cloud events (Events 2 and 5), SSA even decreased during precipitation (Fig. S2d), indicating an increased fraction of absorbing aerosols, likely due to the relatively hydrophobic nature of black carbon (Hilario et al., 2022; McMeeking et al., 2011; Ohata et al., 2016; Pöhlker et al., 2023), which reduces its susceptibility to wet removal compared to more hygroscopic components.
The overall mean of SSA for the entire field campaign was 0.87 ± 0.02, consistent with the values reported in previous studies conducted under the influence of biomass-burning aerosols, which typically ranged from 0.77 to 0.87 depending on transport distance (Davies et al., 2019; Hsiao et al., 2017; Taylor et al., 2020; Wu et al., 2020). Combining AAE, SAE, and SSA data, and applying the aerosol classification method developed by Cappa et al. (2016) and Schmeisser et al. (2017) for NOAA aerosol systems (Fig. 5), the results suggest that the aerosols observed during the entire study period exhibited optical characteristics typically associated with black carbon type.
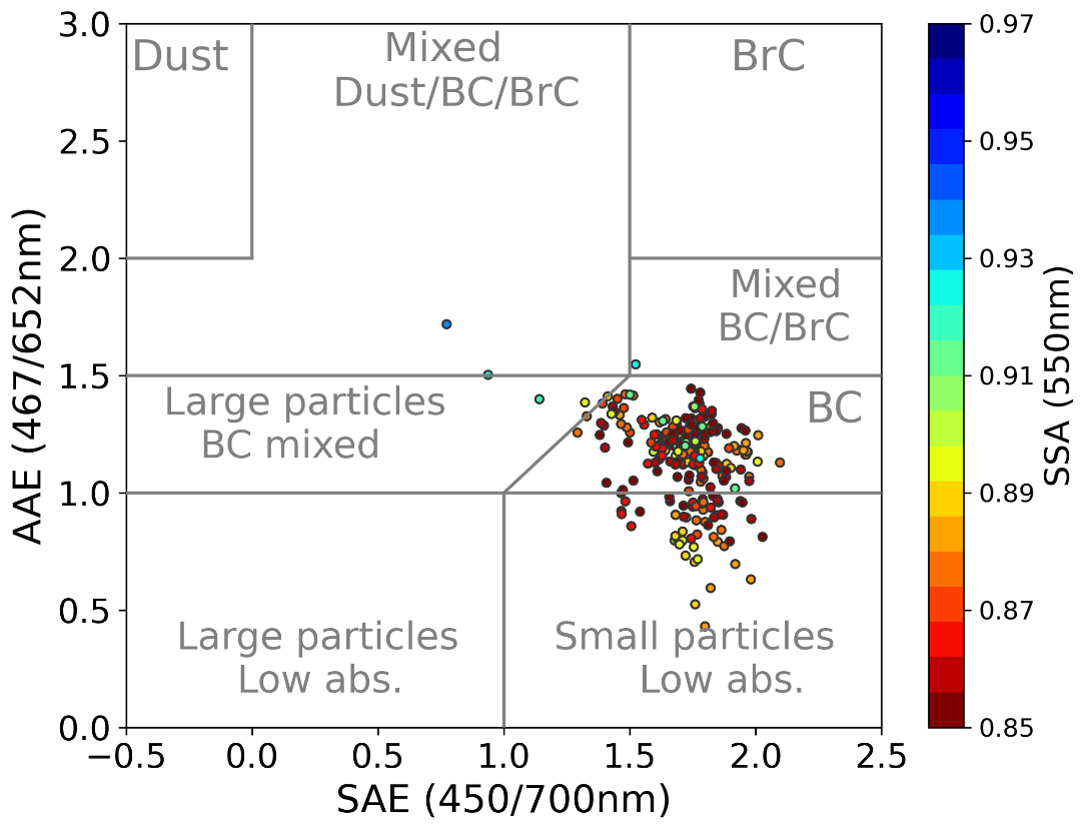
Figure 5Classification of PM10 aerosols at LABS from 1 to 12 March 2024 (Classification method adapted from Schmeisser et al., 2017), BC means black carbon type, BrC means brown carbon type.
3.2 Cloud Microphysical Characteristics Under Different Aerosol Loads within Cloud Systems
To compare the impact of aerosol loading on cloud microphysical characteristics within cloud systems, PM2.5 values measured concurrently with the warm cloud observation data served as the distinguishing criterion. Because LABS is situated at a high altitude within the free atmosphere, the variability in pollutant concentrations is markedly different from that in the boundary layer dominated by anthropogenic emissions. As a result, conventional air quality indices may not adequately capture the magnitude of aerosol loading observed at the site. Therefore, this research categorized the data into ten groups, each containing an equal number of data points, to facilitate comparisons while minimizing statistical errors caused by varying dataset sizes.
Figure 6a shows the aerosol loading in the environment, ranging from low to high. The maximum mean value of Nd (370 cm−3) was observed when the PM2.5 concentration ranged between 1.4 and 2.6 µg m−3 (Fig. 6a), whereas LWC reached the maximum mean value (0.219 g m−3) within the lower PM2.5 concentration range of 0.4–1.4 µg m−3 (Fig. 6c). Notably, when PM2.5≥2.6 µg m−3, both Nd and LWC exhibited a decreasing trend as environmental aerosol concentrations increased. The variation in effective diameter (ED) can be characterized by a threshold at PM2.5=5.7 µg m−3 (Fig. 6b). When PM2.5 concentrations were below this value, ED decreased with increasing aerosol loading. However, when PM2.5≥5.7 µg m−3, ED maintained an average size or slightly increased despite the higher aerosol concentration. A further comparison of weather data across different PM2.5 concentration ranges revealed that when PM2.5≥21.7 µg m−3, the average temperature (4.3 °C, Fig. 6d) and specific humidity (7.0 g kg−1, Fig. 6f) reached the lowest values, possibly constrained by specific time and weather conditions. Additionally, relative humidity (Fig. 6e) displayed a decreasing trend with increasing environmental aerosol loading, and the standard deviation of relative humidity increased, reaching the lowest value (93.4 %) and the highest standard deviation (7.1 %) between PM2.5 concentrations of 16.4 and 21.7 µg m−3.The results from the combined analysis of cloud microphysical data and weather data indicate that the variations in aerosols and cloud microphysics described by the Twomey effect (Twomey, 1974, 1977) are more pronounced when PM2.5 levels are below 4.2 µg m−3. Compared with environments where PM2.5≥5.7 µg m−3, those with extremely low aerosol concentrations (PM2.5<2.6 µg m−3) exhibited noticeably higher LWC, highlighting the substantial differences in cloud liquid water among different aerosol loading conditions. The range of PM2.5 between 2.6 and 5.7 µg m−3 appeared to represent a transitional phase. In environments with relatively low average aerosol concentrations, higher LWC coexisted with higher Nd and lower ED values, indicating that sufficient water availability allowed more aerosol particles to be activated. It is important to note that while LWC does not directly equate to the levels of supersaturation within the cloud system, higher LWC values imply that the initial conditions within the cloud system indeed provided sufficient moisture to support aerosol activation and continued growth. In the high aerosol loading environment (PM2.5≥5.7 µg m−3), increased aerosol concentrations result in a decrease in Nd and a slight increase in ED, indicating that cloud droplets are more likely to dissipate, with liquid water becoming more concentrated in larger droplets. Under the classification scheme adopted in this study, it is evident that cloud microphysical characteristics differ significantly when PM2.5 concentrations are above or below 4.2 µg m−3, demonstrating that the impact of light-absorbing aerosols on cloud systems is not monotonic. Instead, it reveals nonlinear interactions between aerosol loading and cloud microphysical characteristics.
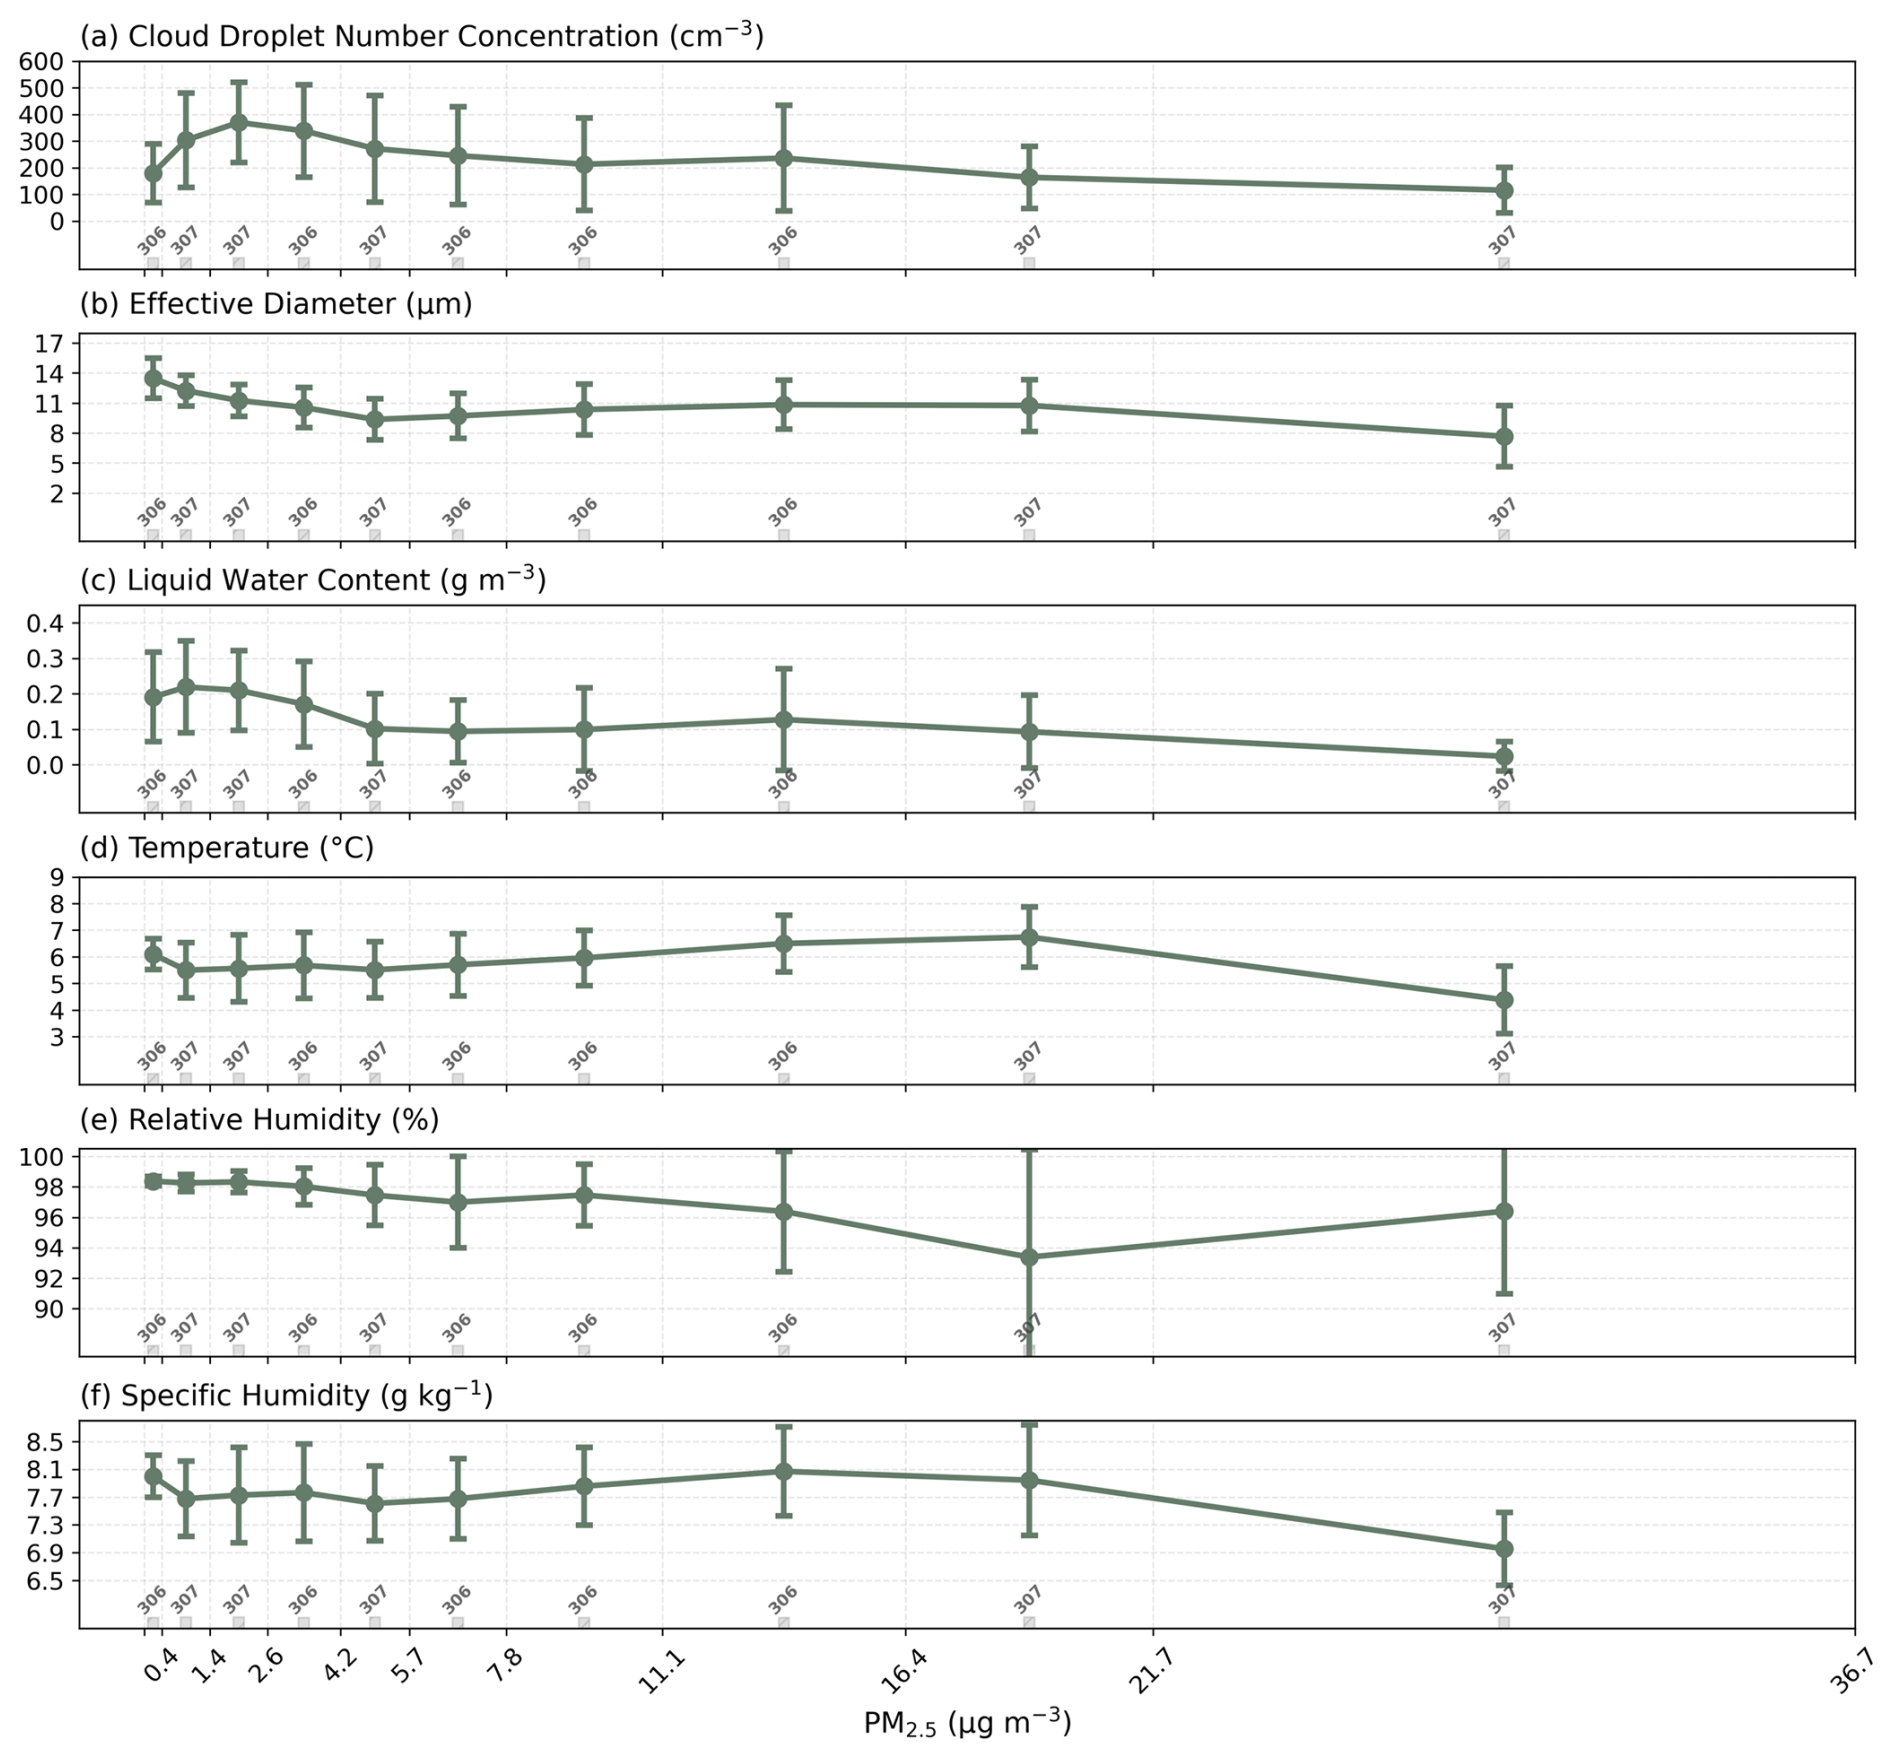
Figure 6Cloud microphysical and weather data categorized into 10 groups of equal sample size based on PM2.5 obtained from 11-D (the data number in each group is shown below as gray bars and values). (a) Nd, (b) ED, (c) LWC from CDP observation results; (d) temperature, (e) relative humidity and (f) specific humidity are weather results measured at LABS.
3.3 Relationship between Cloud-Aerosol Mixing Ratio and ACI Index in Continuous Cloud Events
The start and end times of continuous cloud events are shown in Table 2, which allows for an analysis of the cloud microphysical responses as aerosol concentrations fluctuate over time. Figure 7 presents MCr values calculated using the average LWC and PM2.5 values from each 60 min period, NCr values derived from Nd and Na, and the ACI index calculated from aerosol and cloud microphysical data within each 60 min interval (see Sect. 2.6). The results indicate that only approximately 13 % (351 out of 2608 data points) of the selected continuous cloud events display a positive ACI index value. Of these, over 95 % (334 out of 351) occurred in regions where MCr exceeded 4.5 (with the minimum MCr value within the reasonable range for ACI index >0 being 4.64), especially when positive ACI values within the reasonable range (0–0.33, Fig. 7). This finding suggests that under the influence of high aerosol concentrations, cloud systems tend to adjust by reducing the cloud droplet number concentrations most of the time. As shown in Fig. S3 in the Supplement, the distribution of NCr-ACI reveals a similar tendency to that observed in the MCr-ACI relationship. After constraining aerosol properties and meteorological conditions, negative ACI index can be meaningfully interpreted (as described in Sect. 2.4). However, most of the previous studies have focused only on positive region. It is important to note that negative values do not have a defined “reasonable range”, they simply indicate that an increase in aerosol concentration is accompanied by a decrease in cloud droplets number. The physical mechanism can be understood in the following way. In cloud systems with higher liquid water content, precipitation is often present, leading to enhanced wet deposition of aerosol particles and consequently lower average aerosol concentrations within the clouds. In contrast, when high concentrations of light-absorbing aerosols are present, they tend to warm the environment and reduce relative humidity (see Sect. 3.5 for details), which suppresses supersaturation and ultimately promotes cloud droplet evaporation, resulting in reduced liquid water content.
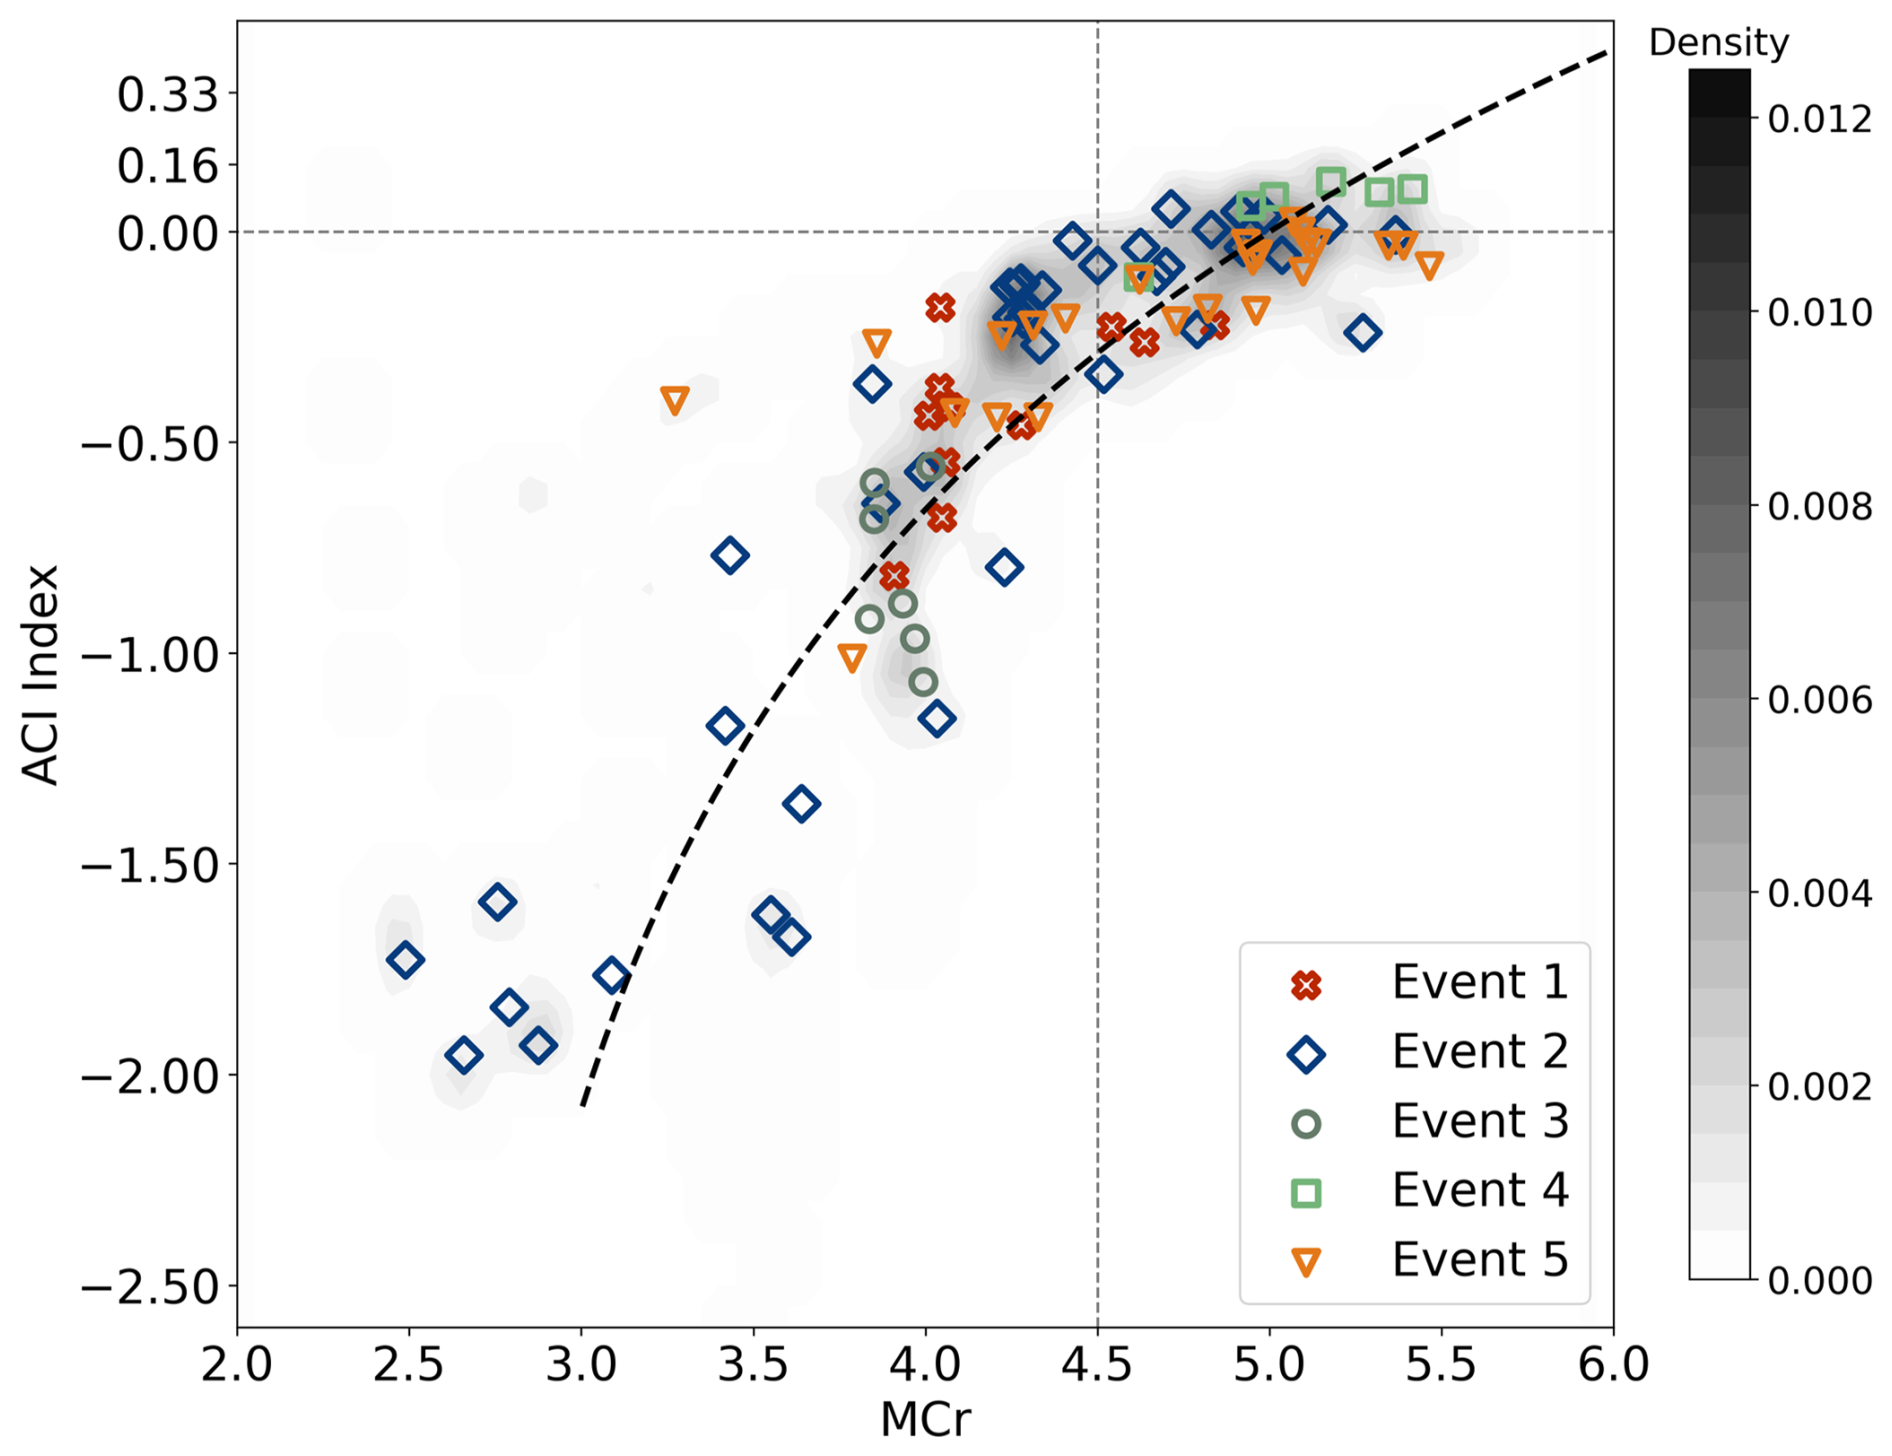
Figure 7Scatter and density plots of the MCr-ACI index for the continuous cloud events. The density plot illustrates the overall distribution of all calculated results, while the scatter plot shows the distribution of individual cloud events using different colors and symbols (one point shown for every 30 calculations).
Comparative analysis among individual cloud events reveals several notable trends (Fig. 7). All events show a consistent relationship between MCr and ACI, where smaller ACI values (more negative) correspond to lower liquid water content per unit aerosol abundance (i.e., smaller MCr). A closer examination of cases with MCr>4.5 shows that 31 % of ACI values (135 data points) are positive in Event 2, and 93 % (148 data points) are positive in Event 4. In contrast, although ACI values in Events 1 and 5 tend to increase with MCr, most of them remain negative. These findings suggest that short-term variations in cloud systems are more sensitive to environmental changes induced by absorbing aerosols, where increased aerosol loading can lead to the dissipation of cloud droplets. It is noteworthy that although Event 3 exhibited relatively high mean LWC (the second highest among the five consecutive cloud events), it occurred under high aerosol loading conditions (Table 2). Consequently, the liquid water content per unit aerosol abundance was relatively low (MCr≈4; Fig. 7), and the calculated ACI values remained negative throughout the event (Fig. 7). This result suggests that aerosol-cloud interactions under the influence of absorbing aerosols cannot be interpreted solely based on aerosol concentration. In particular, since the liquid water content varies substantially among real world cloud events, MCr provides a more representative measure of the actual aerosol loading within clouds.
3.4 MCr and Aerosol Affect Cloud Microphysics
In Sect. 3.3, temporal analysis revealed a positive correlation between the cloud-aerosol mixing ratio and ACI index. To further clarify this relationship, different MCr thresholds were applied as screening criteria (Fig. 8) to identify suitable divisions that distinguish conditions under which aerosols in cloud systems exist in liquid-water-sufficient environments (where the Twomey effect tends to dominate) and those in liquid-water-limited environments (where the semi-direct effect prevails). As shown in Fig. 8, the results remain highly consistent regardless of whether PM2.5 or Na is used as the aerosol variable (α) in the ACI index calculation. The data above the threshold value are considered indicative of sufficient liquid water content. In this subset and the threshold exceeds 4.5, the ACI values range from 0.08 to 0.12 (Fig. 8a), the correlation coefficients (r) are consistently near 0.6 (Fig. 8b), and the RMSE remains low (Fig. 8c), indicating stable performance. Overall, under conditions of relatively abundant liquid water, the tendency for both aerosol concentration and cloud droplet number to increase appears largely insensitive to variations in the threshold. In comparison, Chen et al. (2021) reported ACI values of 0.09 in suburban areas and 0.06 in polluted regions of northern Taiwan regarding the impact of aerosols on cloud water; McComiskey et al. (2009) found ACI values in California ranging from 0.04 to 0.15; and Lihavainen et al. (2010) reported ACI values in high-latitude regions of the Northern Hemisphere between 0.01 and 0.17. The ACI calculated in this study is within a reasonable range. Relatively, data below the threshold exhibit poor separation of aerosol influence when MCr<4.1. It is not until the threshold reaches approximately 4.3 that the lower group shows clearly negative ACI values. These findings, when combined with previous observations of cloud microphysical trends for aerosol concentration and liquid water content, confirm that an MCr threshold of 4.5 not only retains a greater amount of data within the regime of sufficient liquid water content, but also effectively distinguishes between different data clusters. Given the size and distribution of the observational dataset, the subsequent analysis is conducted using two representative MCr intervals: [3,4.5] (1374 data) and [4.5,6] (1069 data), which also helps minimize potential meteorological interference under extreme conditions.
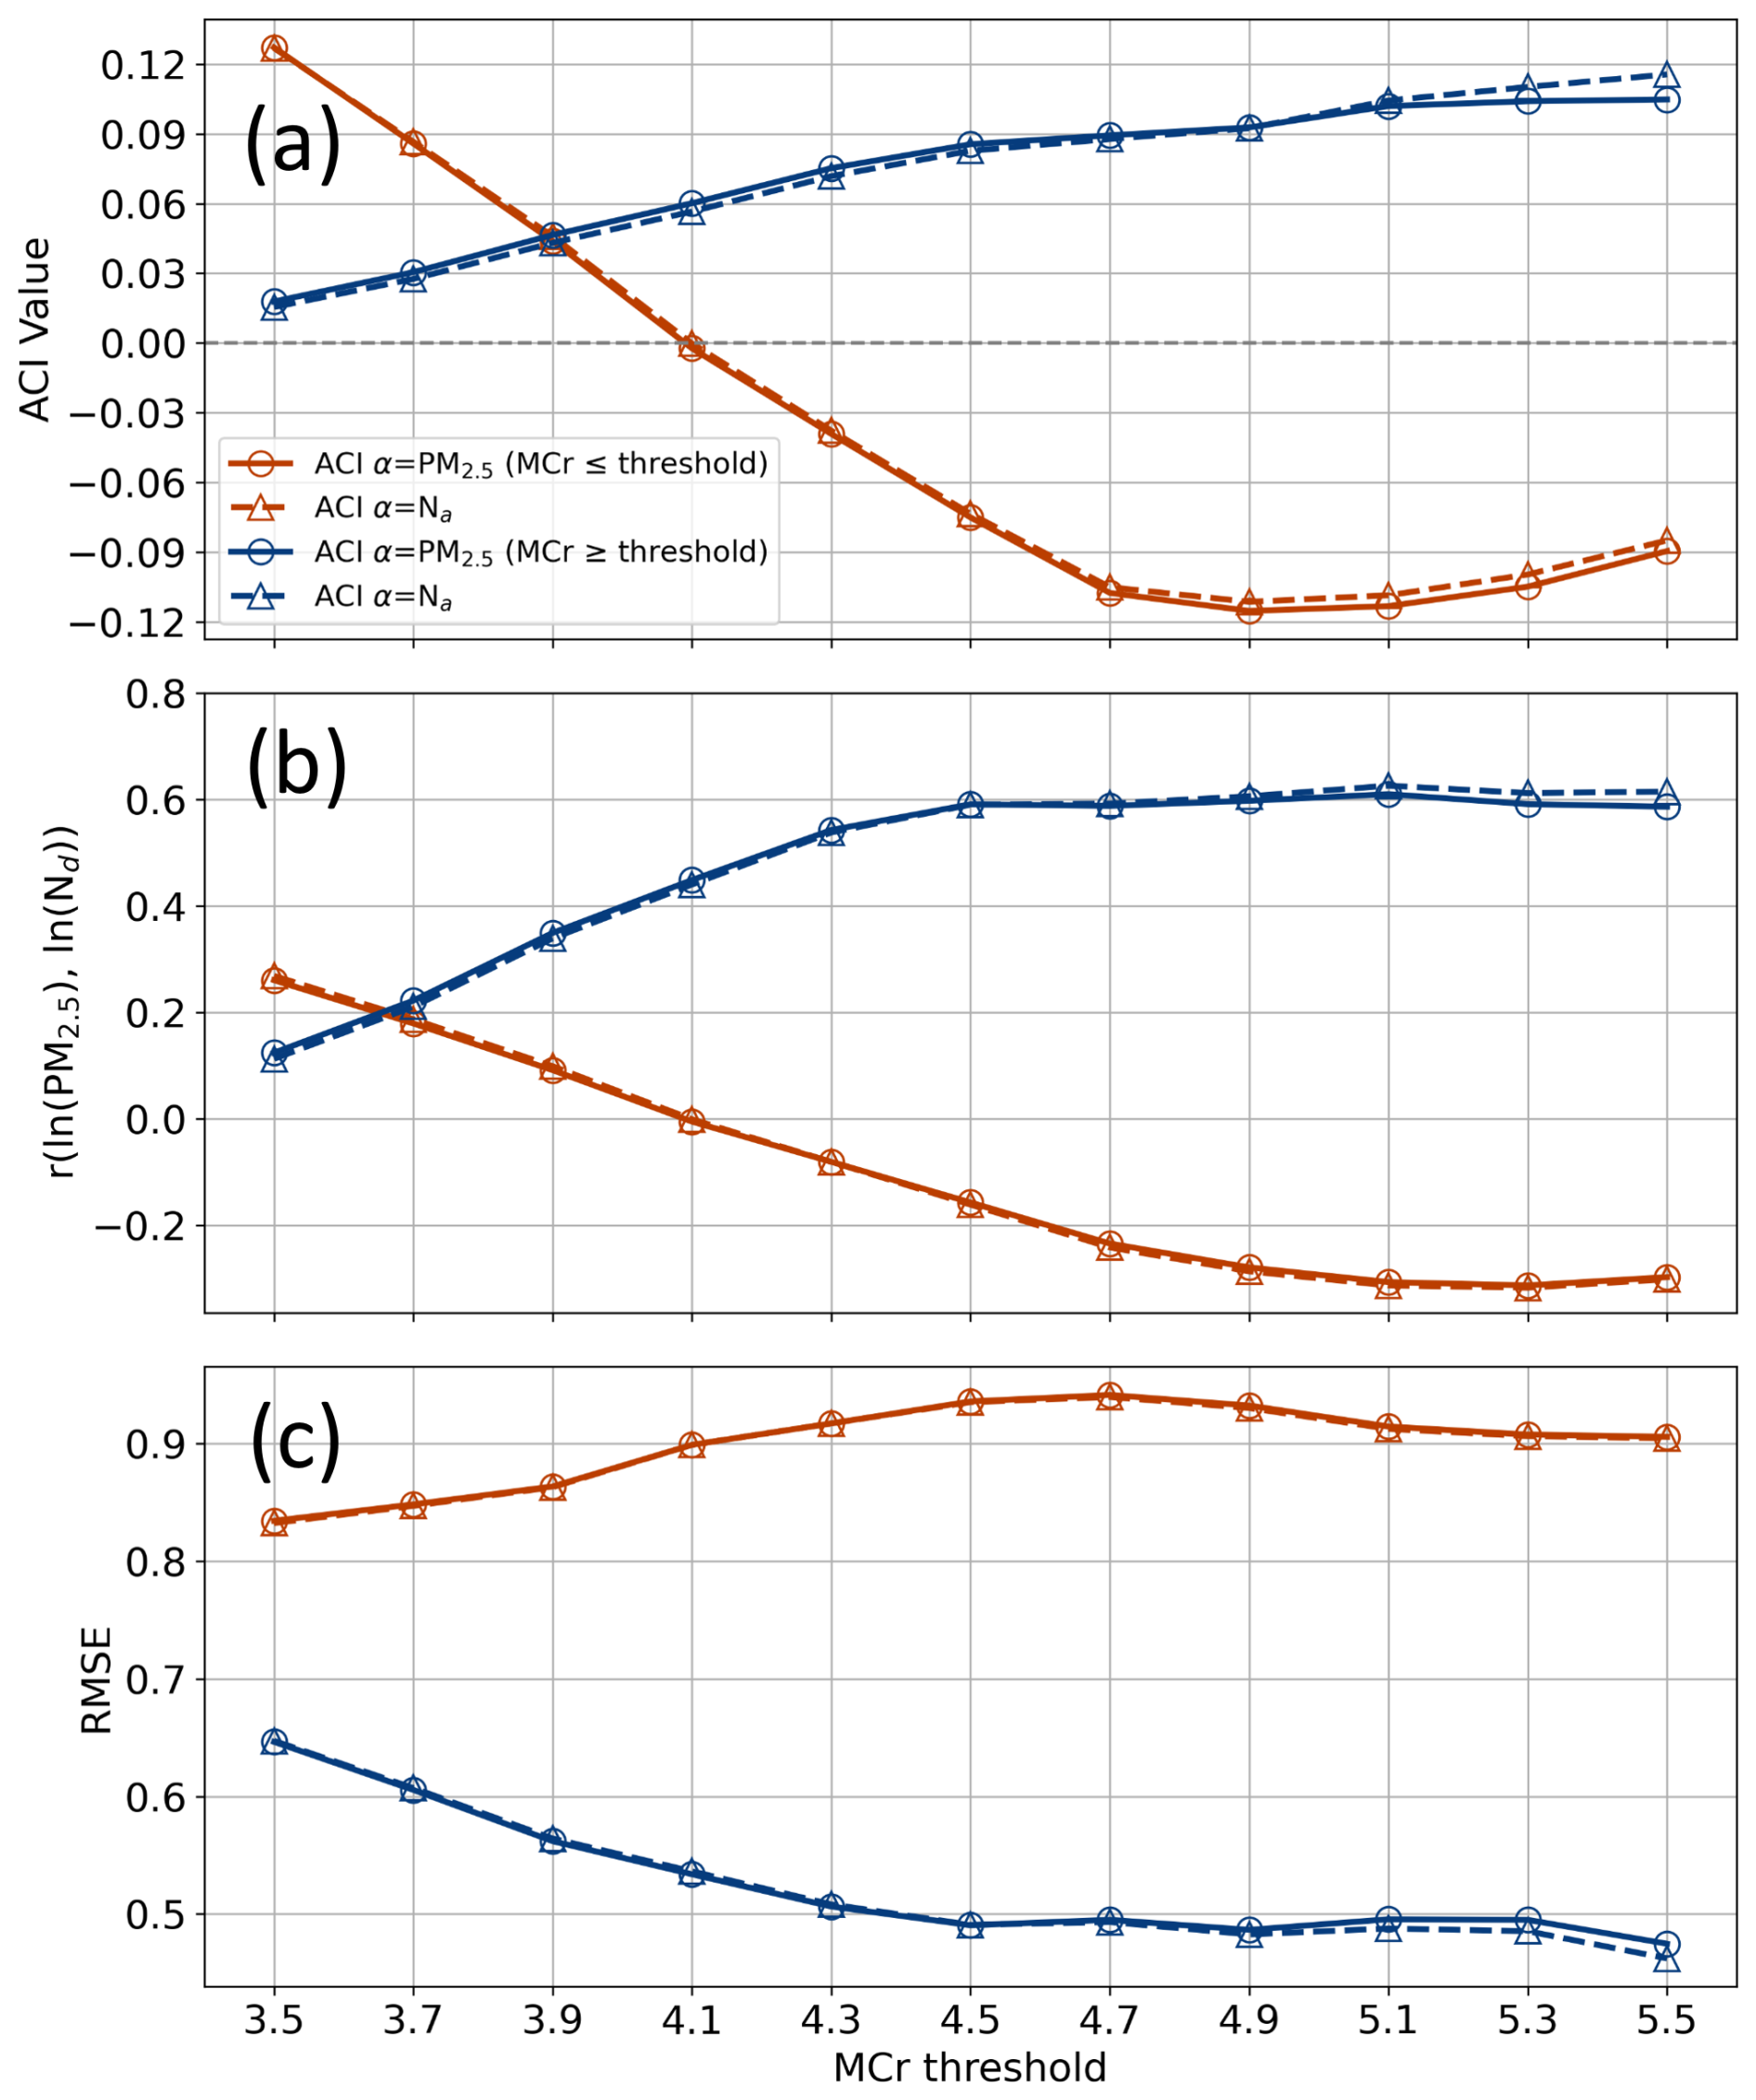
Figure 8(a) ACI values, (b) correlation coefficients, and (c) RMSE are calculated based on different MCr thresholds. Blue markers represent data subsets with MCr values above the given threshold, while red markers indicate those below it. Circles correspond to calculations using PM2.5 as α, and triangles denote those using Na as α.
Figure 9 further presents the distribution results of ln (PM2.5) and ED, along with the calculated for different LWC ranges after distinguishing based on MCr. The analysis of all observational data indicates that under LWC constraints, ranges between 0 and 0.03 (Fig. 9a). Despite the positive ACI index, the weak correlation coefficients make it difficult to demonstrate that aerosol effects consistently produced the same impact on cloud microphysics. Under the condition where MCr is limited to between 4.5 and 6 (Fig. 9b), it is observed that as PM2.5 concentration increases, ED gradually decreases within the same LWC range. The calculation of shows an improved correlation coefficient, particularly when the LWC ranges from 0.1 to 0.2 g m−3, where is 0.08 (r=0.55). This is comparable to the ACI index derived from Nd under the same constrained MCr condition. The consistency between the calculated results of and suggests that Twomey effect (Twomey, 1974, 1977) is the dominant mechanism within this range.
Conversely, when MCr is within the range of 3 to 4.5 (Fig. 9c), the results from indicate that changes in ED actually increase with rising PM2.5 concentrations. This further supports the notion that the impacts of absorbing aerosols on cloud systems vary with different loading conditions. Under high absorbing aerosol loading, the increase in ED indicates a decrease in small cloud droplets in the environment, while the slight decrease in Nd suggests the dissipation of these small droplets. This outcome could be attributed to the role of absorbing aerosols in raising temperatures and reducing relative humidity by absorbing shortwave radiation (Bond et al., 2013; Haywood et al., 2021; Zhang and Zuidema, 2021).
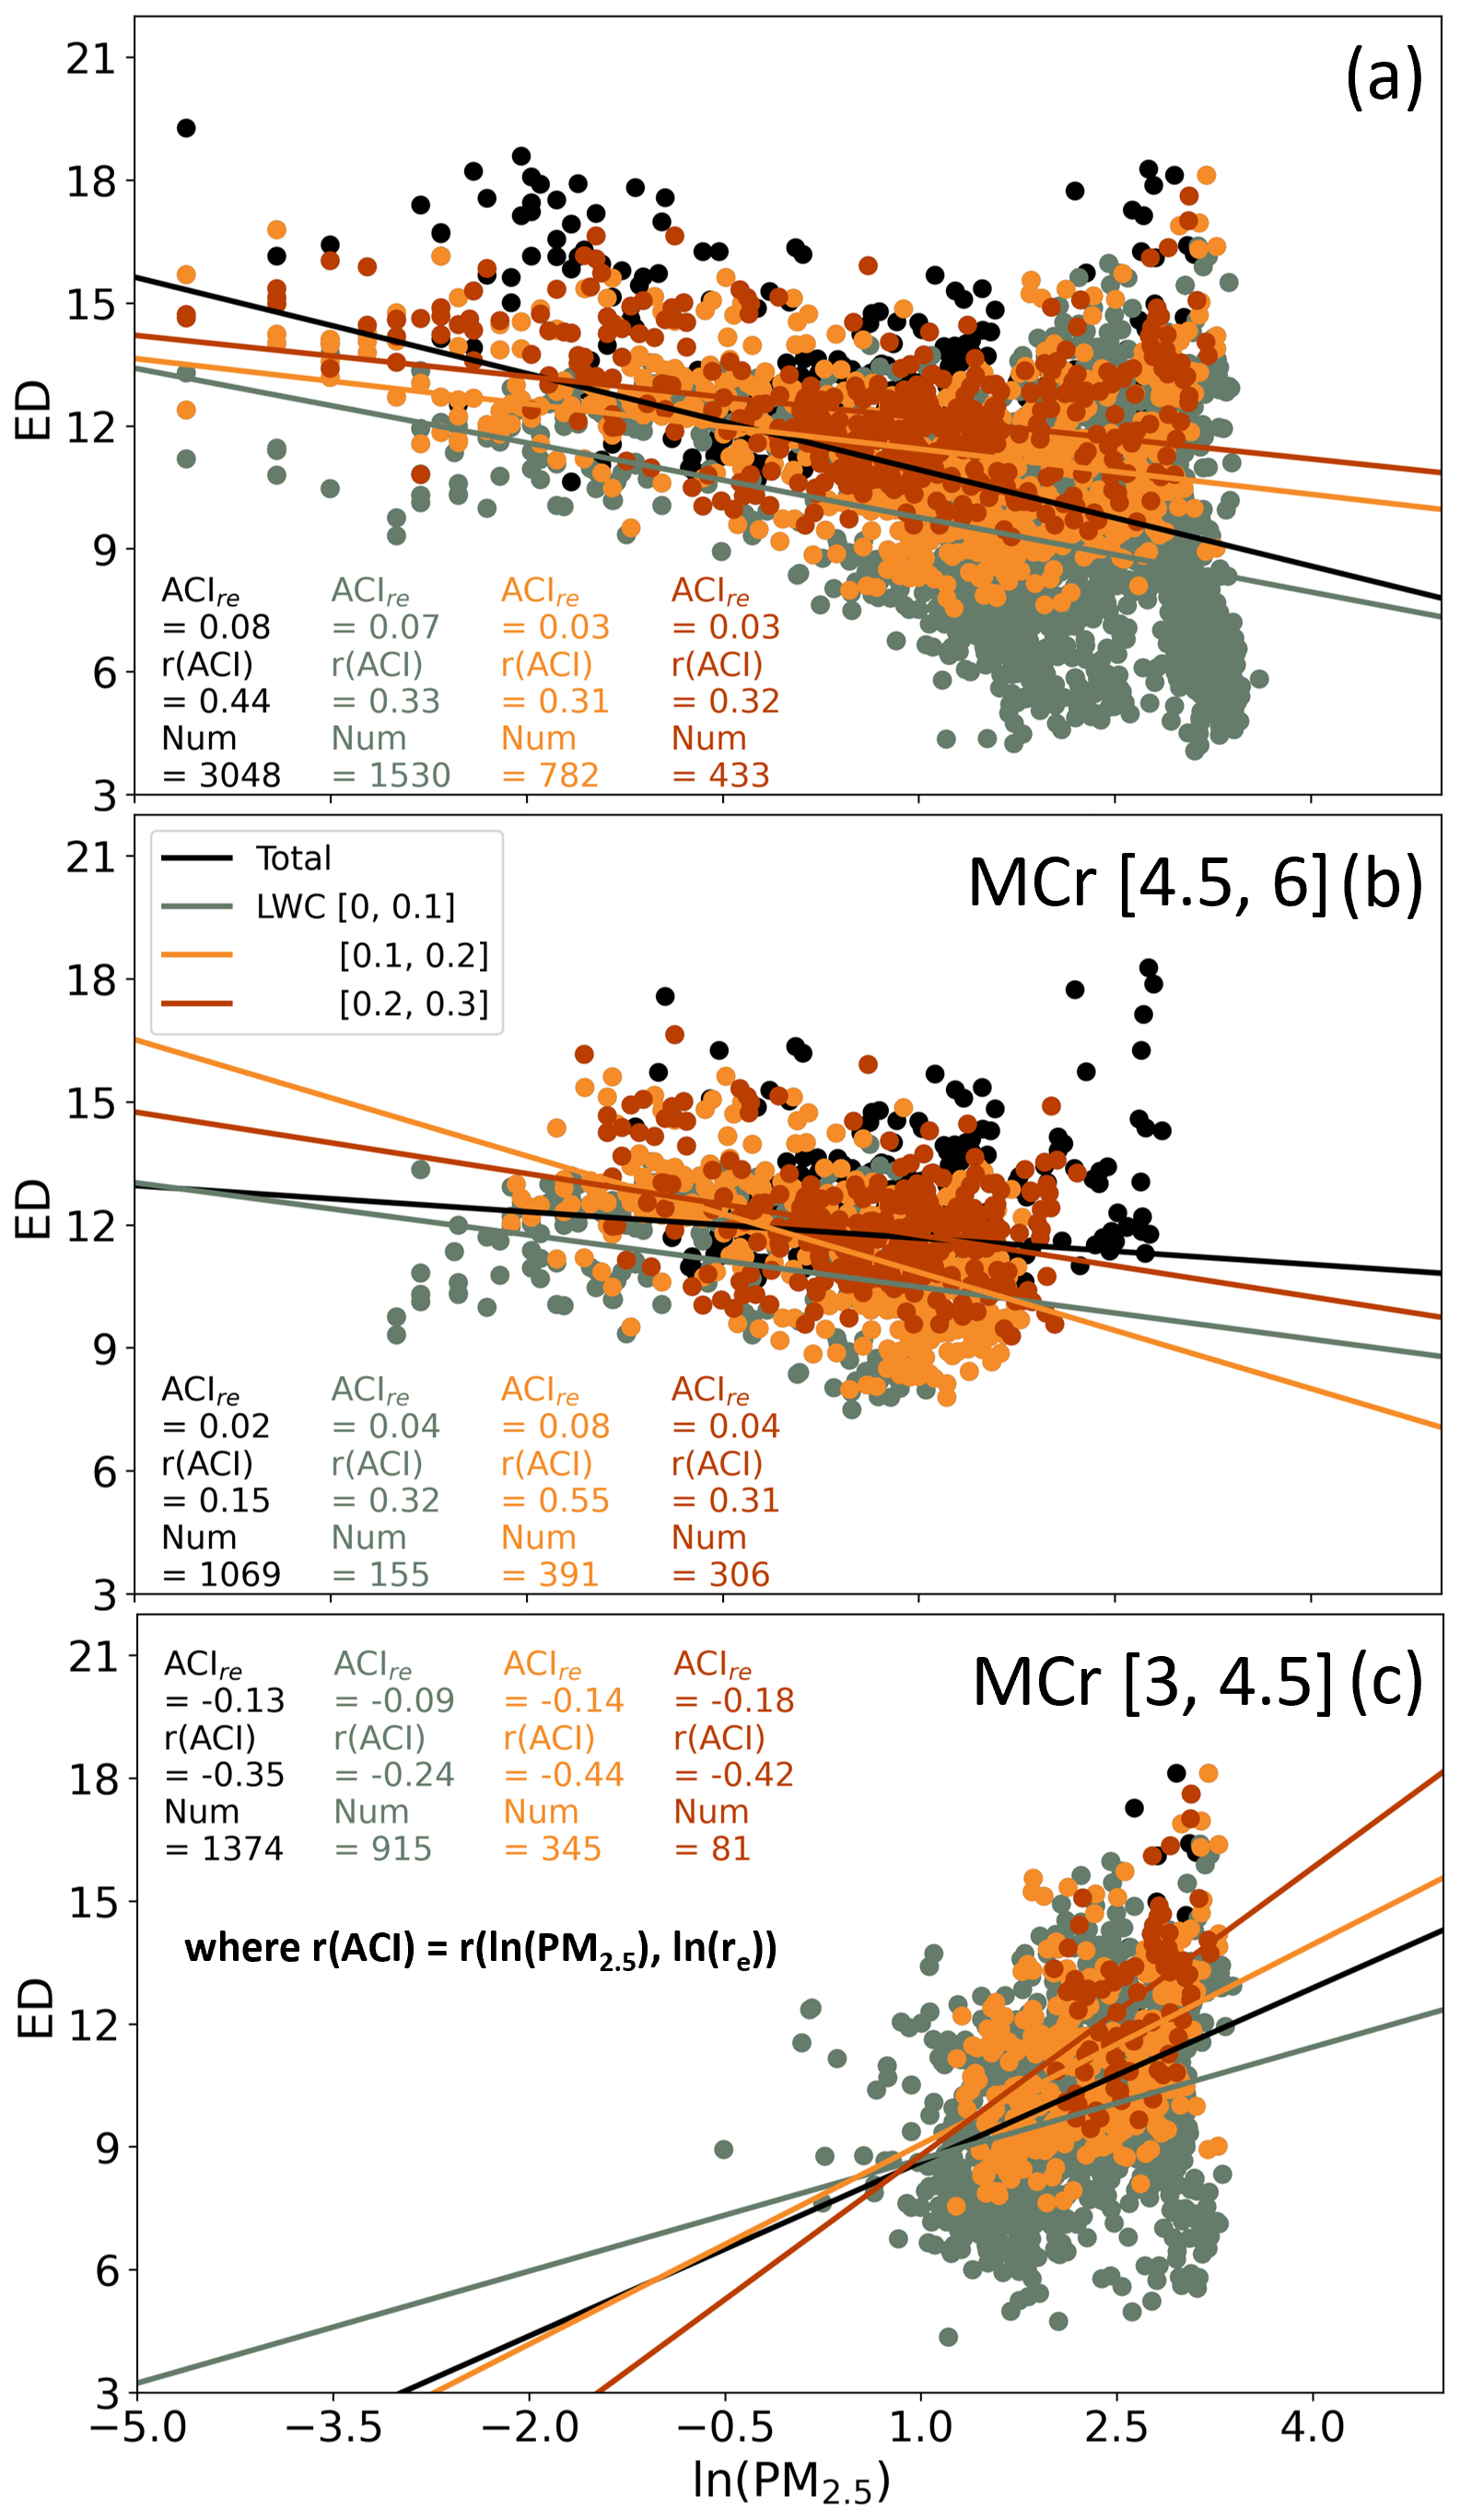
Figure 9Scatter plot of ln (PM2.5) and ED, along with calculation results under specified LWC conditions during the observation period. (a) Results for all observed data; (b) MCr [4.5,6]; (c) MCr [3,4.5].
3.5 Difference in Cloud Droplet Size Distribution
This section explores the differences in cloud droplet characteristics under high and low aerosol concentrations within different MCr ranges, and conducts comprehensive analysis. Figure 10 displays the frequency of cloud microphysical properties based on MCr grouping. For each group, data were further separated into high and low aerosol loading based on the median PM2.5 concentration. In MCr [4.5,6], high aerosol loading yields a markedly higher frequency of Nd between 300–600 cm−3 compared with both the overall observations and the low-aerosol subset (Fig. 10c). In the frequency distribution of ED (Fig. 10b), it was also found that frequencies below 12 µm are significantly higher, which is consistent with the results in Sect. 3.4. In the MCr [3,4.5] range with high aerosol load, the difference in cloud droplet number concentration is not as pronounced (Fig. 10f); however, the ED results indicate that droplets smaller than 10 µm diameters are more frequent under low aerosol load (Fig. 10e), while the high aerosol load resembles the overall observation results.
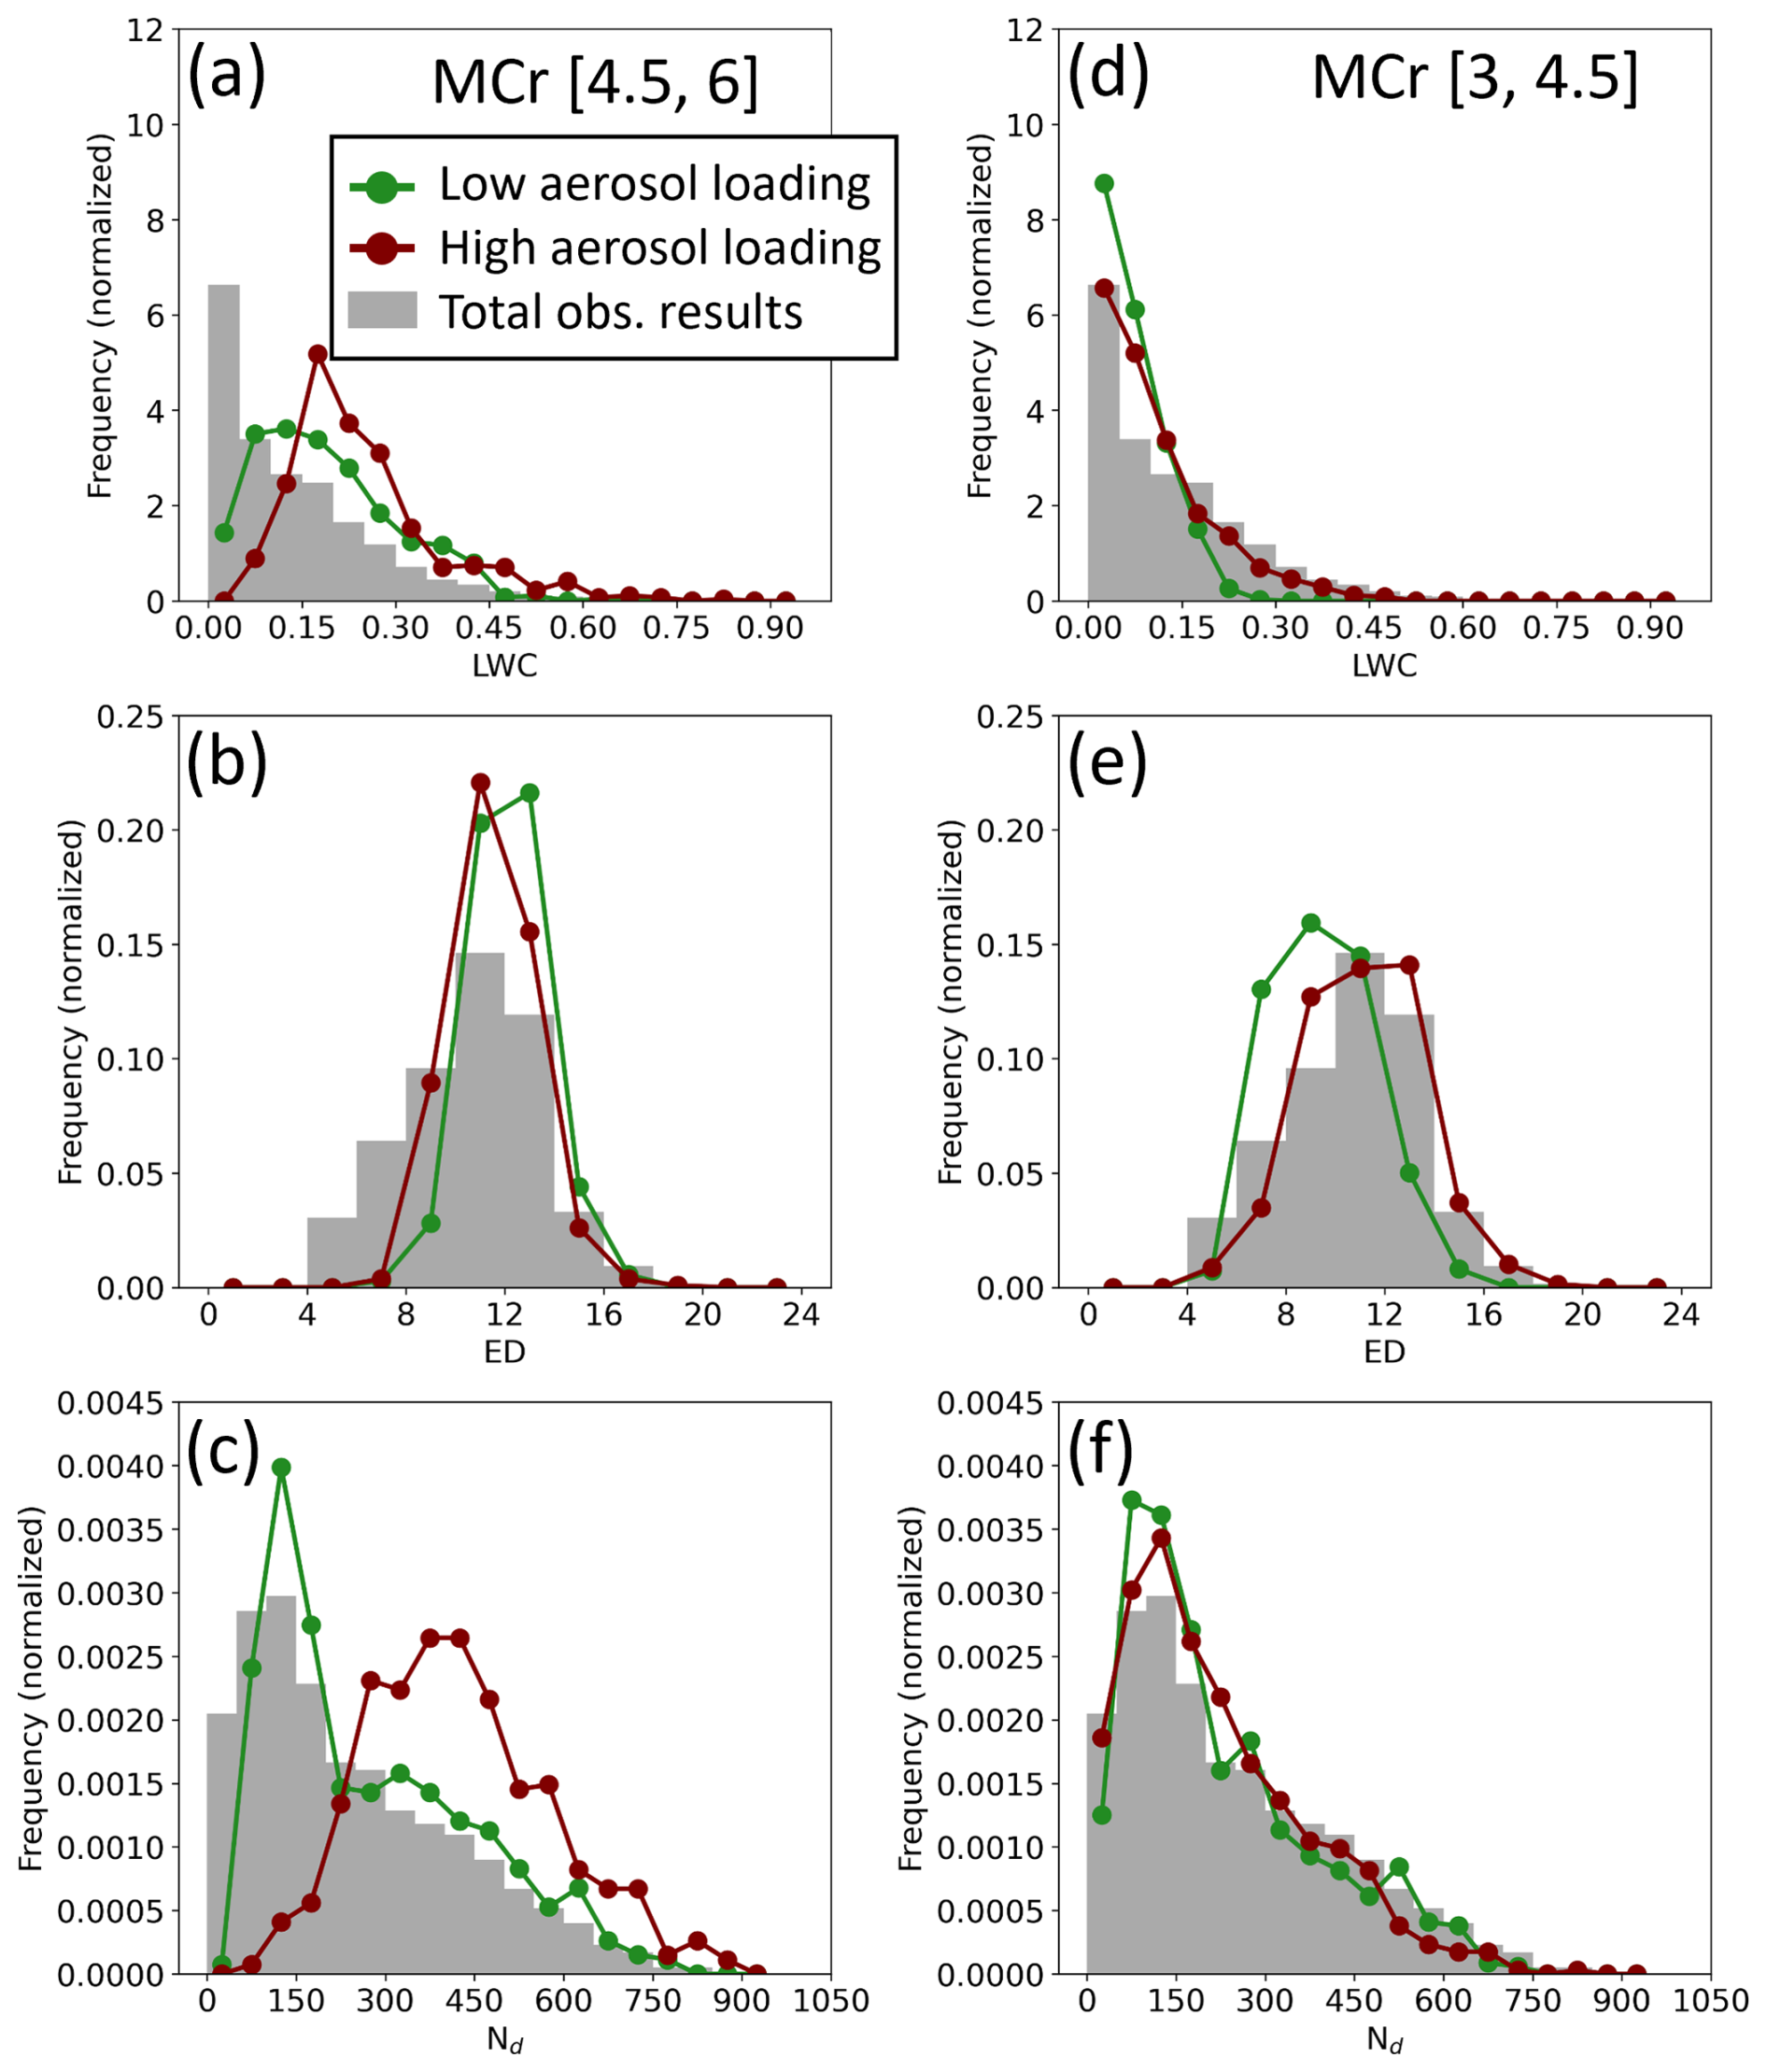
Figure 10Frequency of cloud microphysical data during the observation period and within specific MCr ranges. The red line represents high aerosol load conditions, where PM2.5 values exceed the median after MCr filtering; the green line represents low aerosol load conditions, where PM2.5 values are below the median after MCr filtering. (a)–(c) respectively show the frequency of LWC, ED, and Nd data within the MCr range of [4.5,6]; (d)–(f) show the frequency of LWC, ED, and Nd data within the MCr range of [3,4.5].
The frequency distribution of LWC indicates that within the constrained MCr [4.5,6], the occurrence of LWC values exceeding 0.15 g m−3 is noticeably higher (Fig. 10a). Conversely, in MCr [3,4.5], cloud events with lower LWC appear more frequently, especially under low aerosol loading (Fig. 10d). A comparison of the frequency distributions of ED and Nd reveals that variations in droplet size, rather than droplet number concentration, primarily account for the differences in LWC across these regimes. However, restricting the LWC range is necessary to reduce uncertainties when assessing aerosol effects on droplet size. Considering weather conditions, Table 3 shows the mean value of temperature, relative humidity, specific humidity in different constraint conditions. In the high aerosol loading of MCr [3,4.5], the temperature is higher, the moisture content is greater, but the relative humidity is lower, aligning with the description of the semi-direct effect. On the other hand, the lower specific humidity observed under low aerosol loading suggests a reduced availability of water vapor, which may be one of the contributing factors to the smaller cloud droplet sizes.
Table 3Mean temperature and humidity across different conditions (bold values indicate statistically significant differences between the two groups according to an independent t test (P value<0.05)).
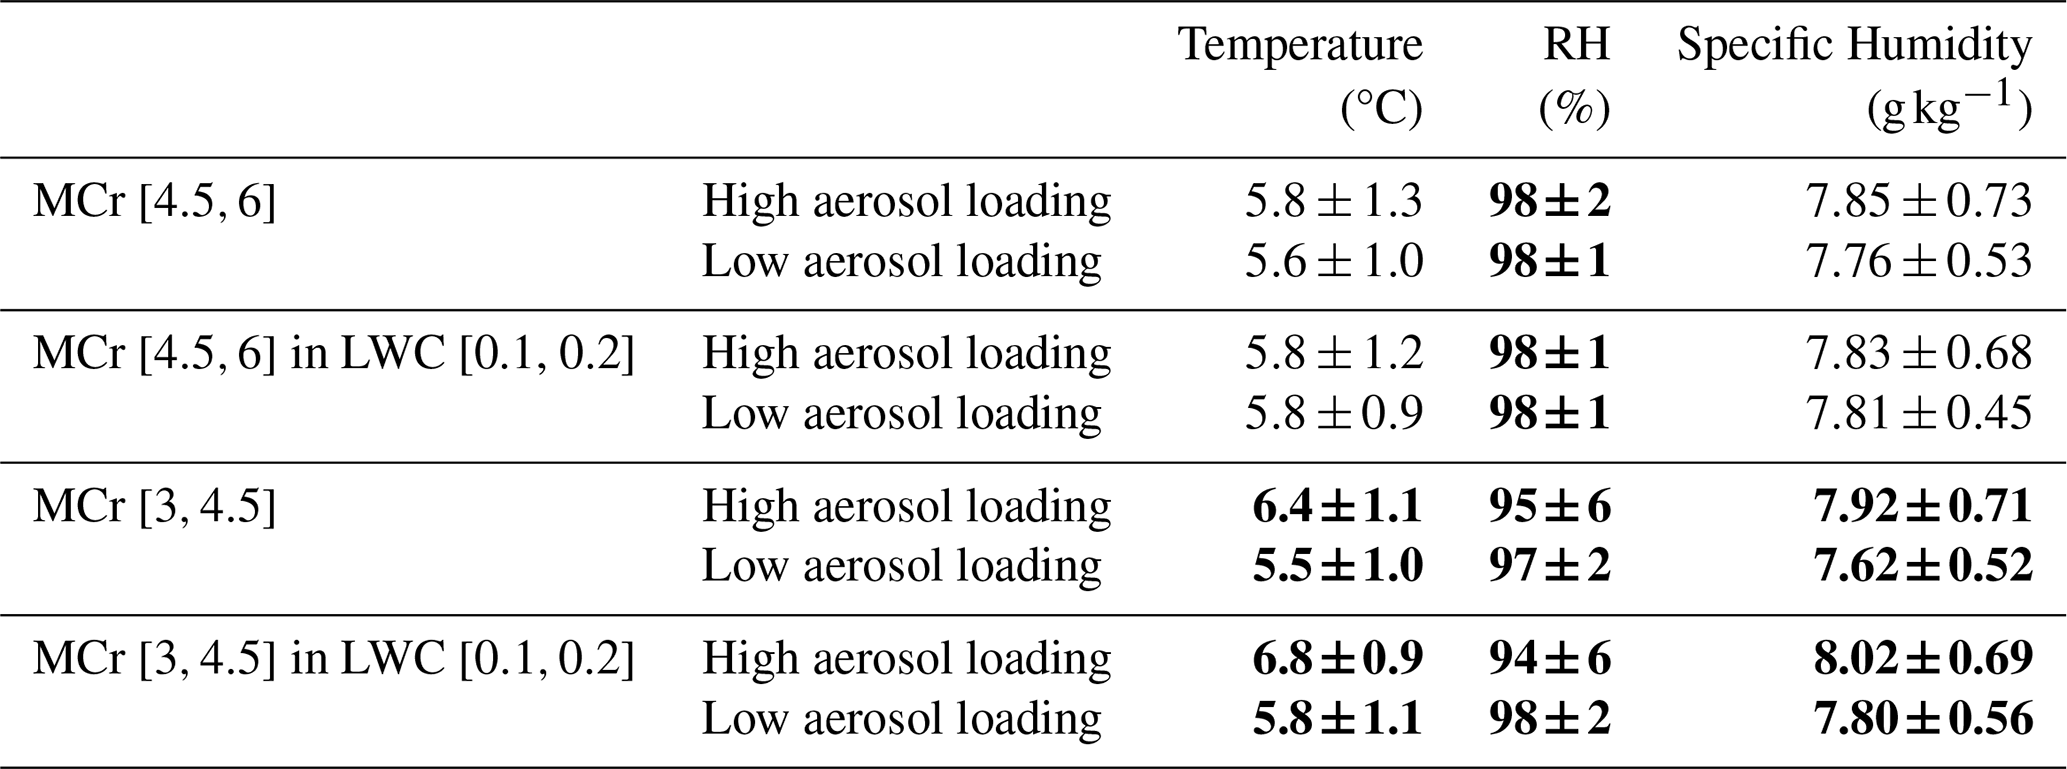
Figure 11 presents the average distributions of aerosol and cloud droplet sizes, while Fig. 12 further illustrates observations within the LWC range of 0.1–0.2 g m−3. From the comparison chart for MCr [4.5,6] (Fig. 11a), it is observed that aerosol particles are primarily maintained below 5 µm, with an overall lower concentration. Under high aerosol load, there is an apparent increase in smaller cloud droplets. However, as shown in Fig. 10a, higher aerosol loading is often associated with greater LWC, with elevated average LWC also observed (0.25 and 0.19 g m−3 are the means in high and low aerosol load). Likewise, more cloud droplets larger than 20 µm are observed under high aerosol load. When LWC is restricted (Fig. 12a), the aerosol size distribution remains similar except for fewer particles larger than 2.5 µm. Under high aerosol loading, an increase in cloud droplets smaller than 12 µm is observed, while the larger droplets (>12 µm) markedly decrease. Constraint LWC (Fig. 12a) more clearly characterizes the Twomey effect, illustrating how aerosol particle concentrations influence the droplet size distribution, in particular, there are minimal differences between high and low aerosol pollution in terms of weather conditions (Table 3).
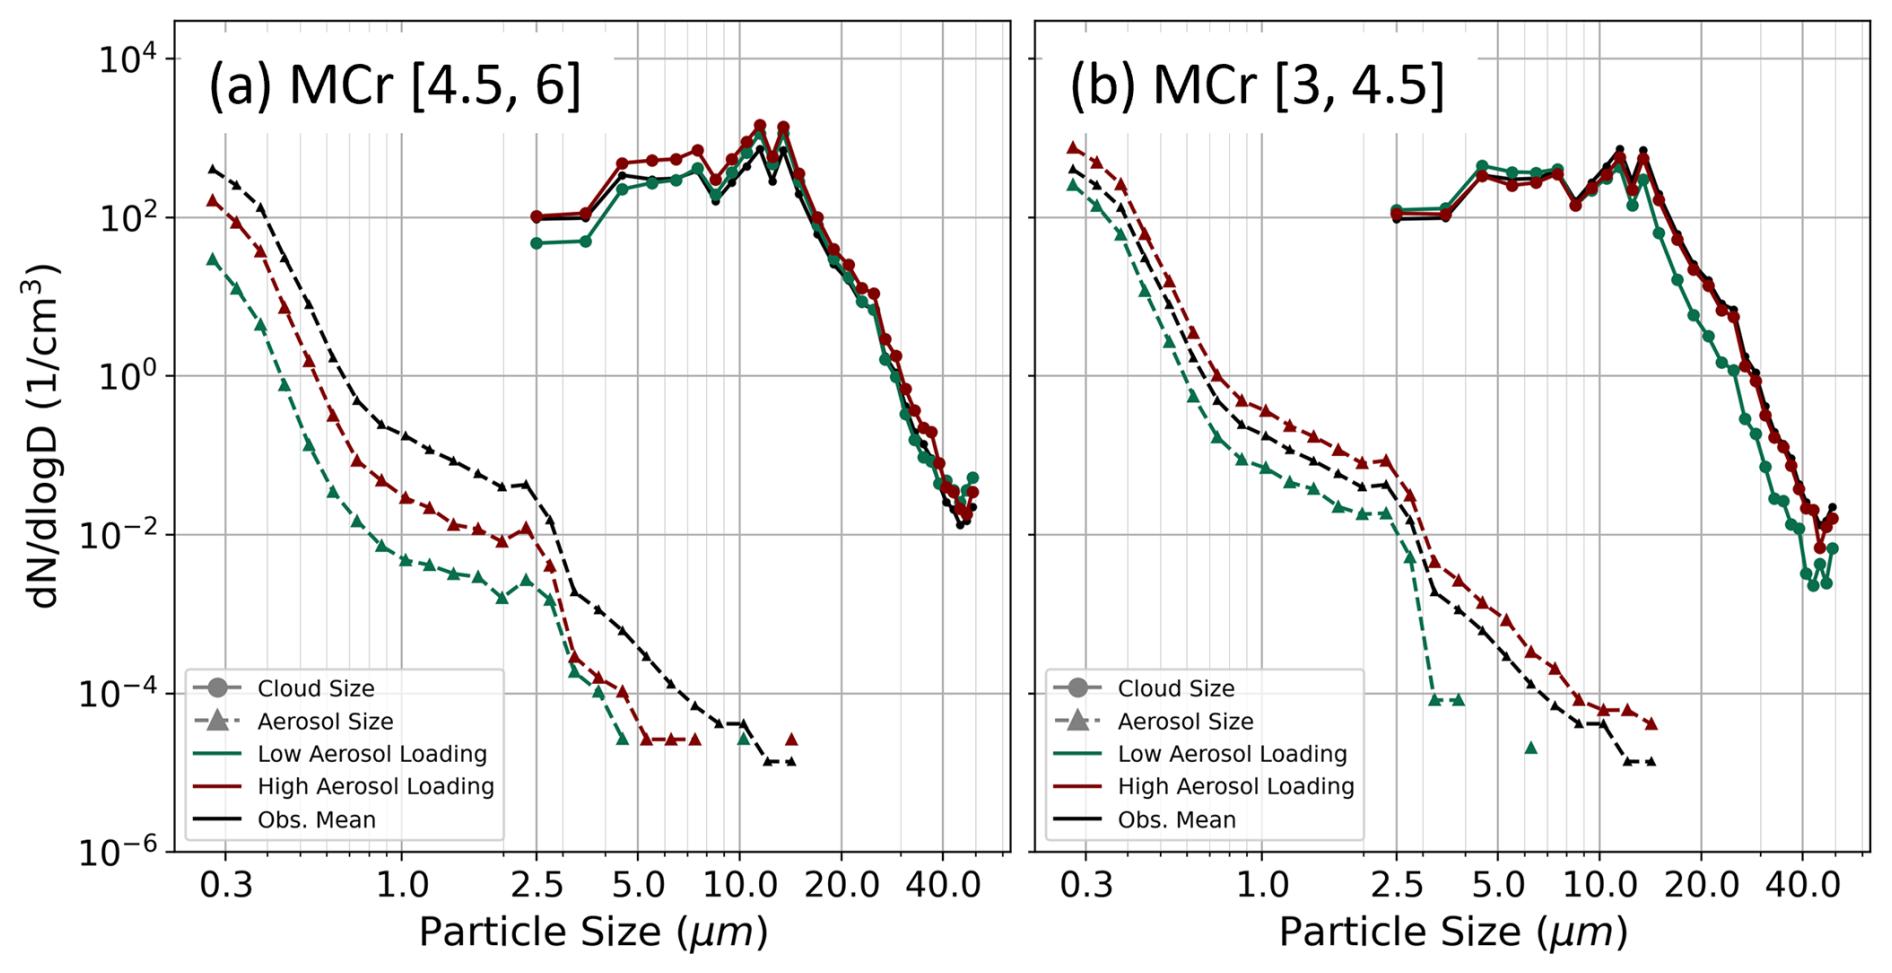
Figure 11Size distribution of aerosols (triangles) and cloud droplets (circles). The black line represents the mean of all observations during the study period (not constrained by MCr intervals). Red and green lines follow the same conditions as in Fig. 10. (a) Red and green lines limited to the MCr range [4.5,6]; (b) Red and green lines limited to the MCr range [3,4.5].
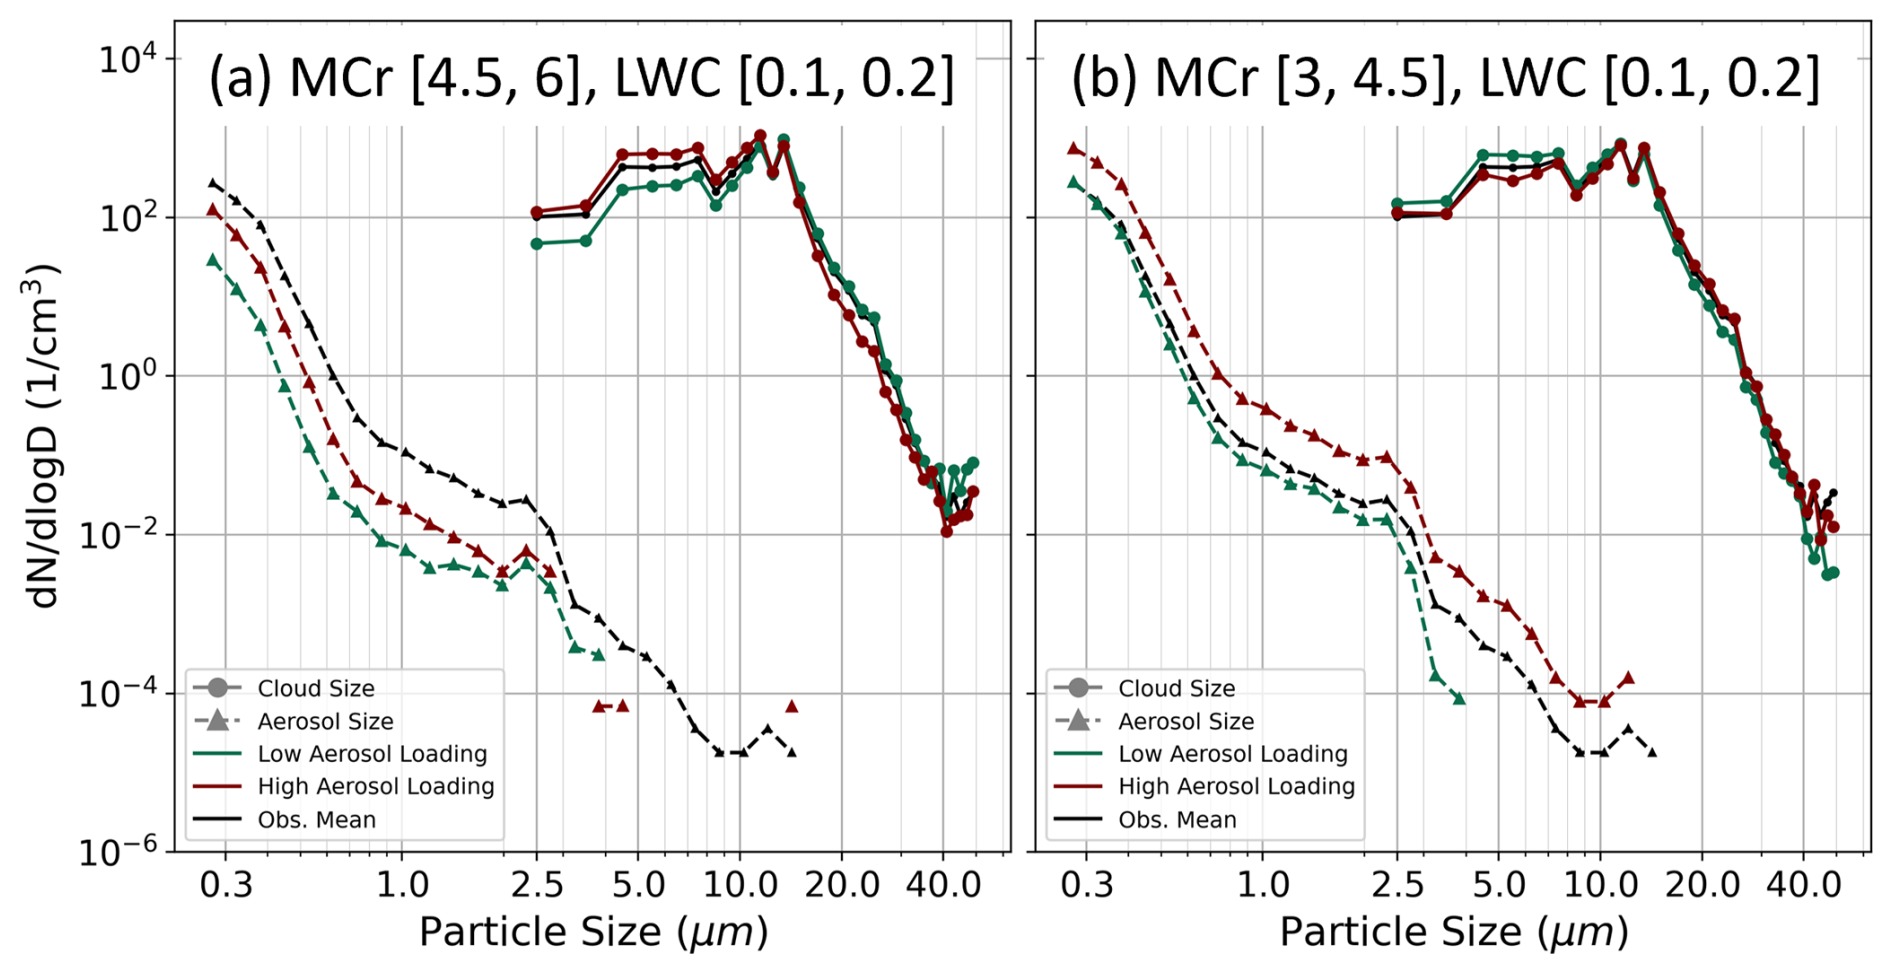
Figure 12Same as Fig. 11, but all data are limited to the LWC range of 0.1–0.2 g m−3, including the black line, which represents the mean of all observation data within this LWC range.
In MCr [3,4.5], Fig. 11b first reveals that under low aerosol loading, only fine-mode aerosol particles are present. Examining the cloud droplet size distribution, more droplets smaller than 10 µm are observed under low aerosol loading, while the number of droplets larger than 10 µm sharply decreases. Notably, the total Nd under low aerosol loading reaches 223 cm−3, slightly higher than the 217 cm−3 observed under high aerosol loading. Compared with the observed mean (Fig. 11b, black solid line), cloud droplets smaller than 10 µm under low aerosol loading exceeds the average. In contrast, for cloud droplets larger than 10 µm, the number remains below the mean regardless of aerosol loading. The differences from the original conditions become less pronounced when LWC is constrained (Fig. 12b). Focusing on high aerosol loading results, the number of small cloud droplets shows lower than in both average (the black line represents the observation average for LWC 0.1–0.2 g m−3) and low aerosol loading cases. On the other hand, under low aerosol loading, the number of large droplets (>12 µm) is less compared to the average and high aerosol loading scenarios. Overall, around the 10 µm threshold remains a clear dividing point.
A comprehensive comparison under different cloud-aerosol mixing ratios, aerosol loadings, and meteorological conditions reveals that in the MCr range of [4.5,6], the Twomey effect can be clearly and consistently described through changes in the cloud droplet size distribution. In contrast, within the MCr range of [3,4.5], the interpretation becomes more complex. Cloud droplet size distributions can be explained by Köhler curve, coarse-mode aerosols under high aerosol loading can more easily activate and grow into larger droplets under lower supersaturation conditions, while smaller droplets are more prone to evaporation (Klemm and Lin, 2016). Although this study does not directly measure supersaturation levels, the observed results – characterized by higher temperatures and lower relative humidity – align with the theoretical framework of the semi-direct effect.
This study applies the cloud-aerosol mixing ratio to systematically evaluate the interplay between cloud liquid water and aerosol content. In particular, these ratios quantify the amount of liquid water per unit mass of aerosol and provide a more integrated perspective for distinguishing microphysical responses under different environmental conditions, highlighting when aerosols are more likely to be activated or when cloud droplets tend to be suppressed. Based on cloud and aerosol microphysical data collected in March 2024 at the Lulin Atmospheric Background Station (LABS) in central Taiwan, we identify a nonlinear relationship between aerosol concentration and cloud microphysical properties. In a comparative analysis involving 10 data groups stratified by both PM2.5 concentration levels and sample size considerations, a distinct trend emerged: in the low-concentration (PM2.5<2.6 µg m−3), an increase in PM2.5 was associated with an increase in Nd and a significant decrease in ED. However, in the high-concentration when PM2.5≥5.7 µg m−3, further increases in PM2.5 corresponded to a decrease in Nd and a slight increase in ED. These results suggest a transition in cloud microphysical responses under elevated aerosol loading conditions.
Building upon the nonlinear response, the subsequent analysis examined the association between the ACI index and the cloud-aerosol mixing ratio over a continuous 60 min period. The results indicate that when the cloud system exhibits a higher mixing ratio, a continuous increase in aerosol concentration tends to result in a higher Nd. This trend is consistently observed in both MCr and NCr analyses. According to the distribution of the ACI index concerning MCr, only 30 % of the data exhibit ACI>0 in the MCr>4.5 regime. This indicates that the environmental changes in temperature and humidity induced by the absorbing aerosol components often outweigh their potential to activate as CCN. Subsequent analyses based on varying MCr thresholds further confirm the appropriateness of selecting MCr=4.5 as a critical value in this study. A further examination of effective diameter showed that under constrained LWC conditions, the trends of effective diameter with aerosol concentration differed significantly between the MCr [4.5,6] and [3,4.5] regimes, as reflected by the index. This further indicates that, at the microscale, the cloud-aerosol mixing ratio influences the key microphysical processes within cloud systems.
In the subsequent analysis, differences between high and low aerosol loads within different cloud-aerosol mixing ratio intervals were examined using MCr. Under MCr [4.5,6], cloud systems more frequently exhibited higher Nd (300–600 cm−3) and smaller ED (8–12 µm). Regardless of whether LWC was constrained, the cloud droplet size distributions were more concentrated below 10 µm. These results support and reinforce the previous argument. In contrast, under the MCr [3,4.5] condition, markedly different cloud microphysical characteristics were observed. At low aerosol loading, ED was often smaller than 10 µm, with a greater number of small droplets. At high aerosol loading, more coarse-mode aerosols were present, and the droplet size distribution showed a significant reduction in the number of droplets smaller than 10 µm. These subtle differences could be explained by Köhler theory.
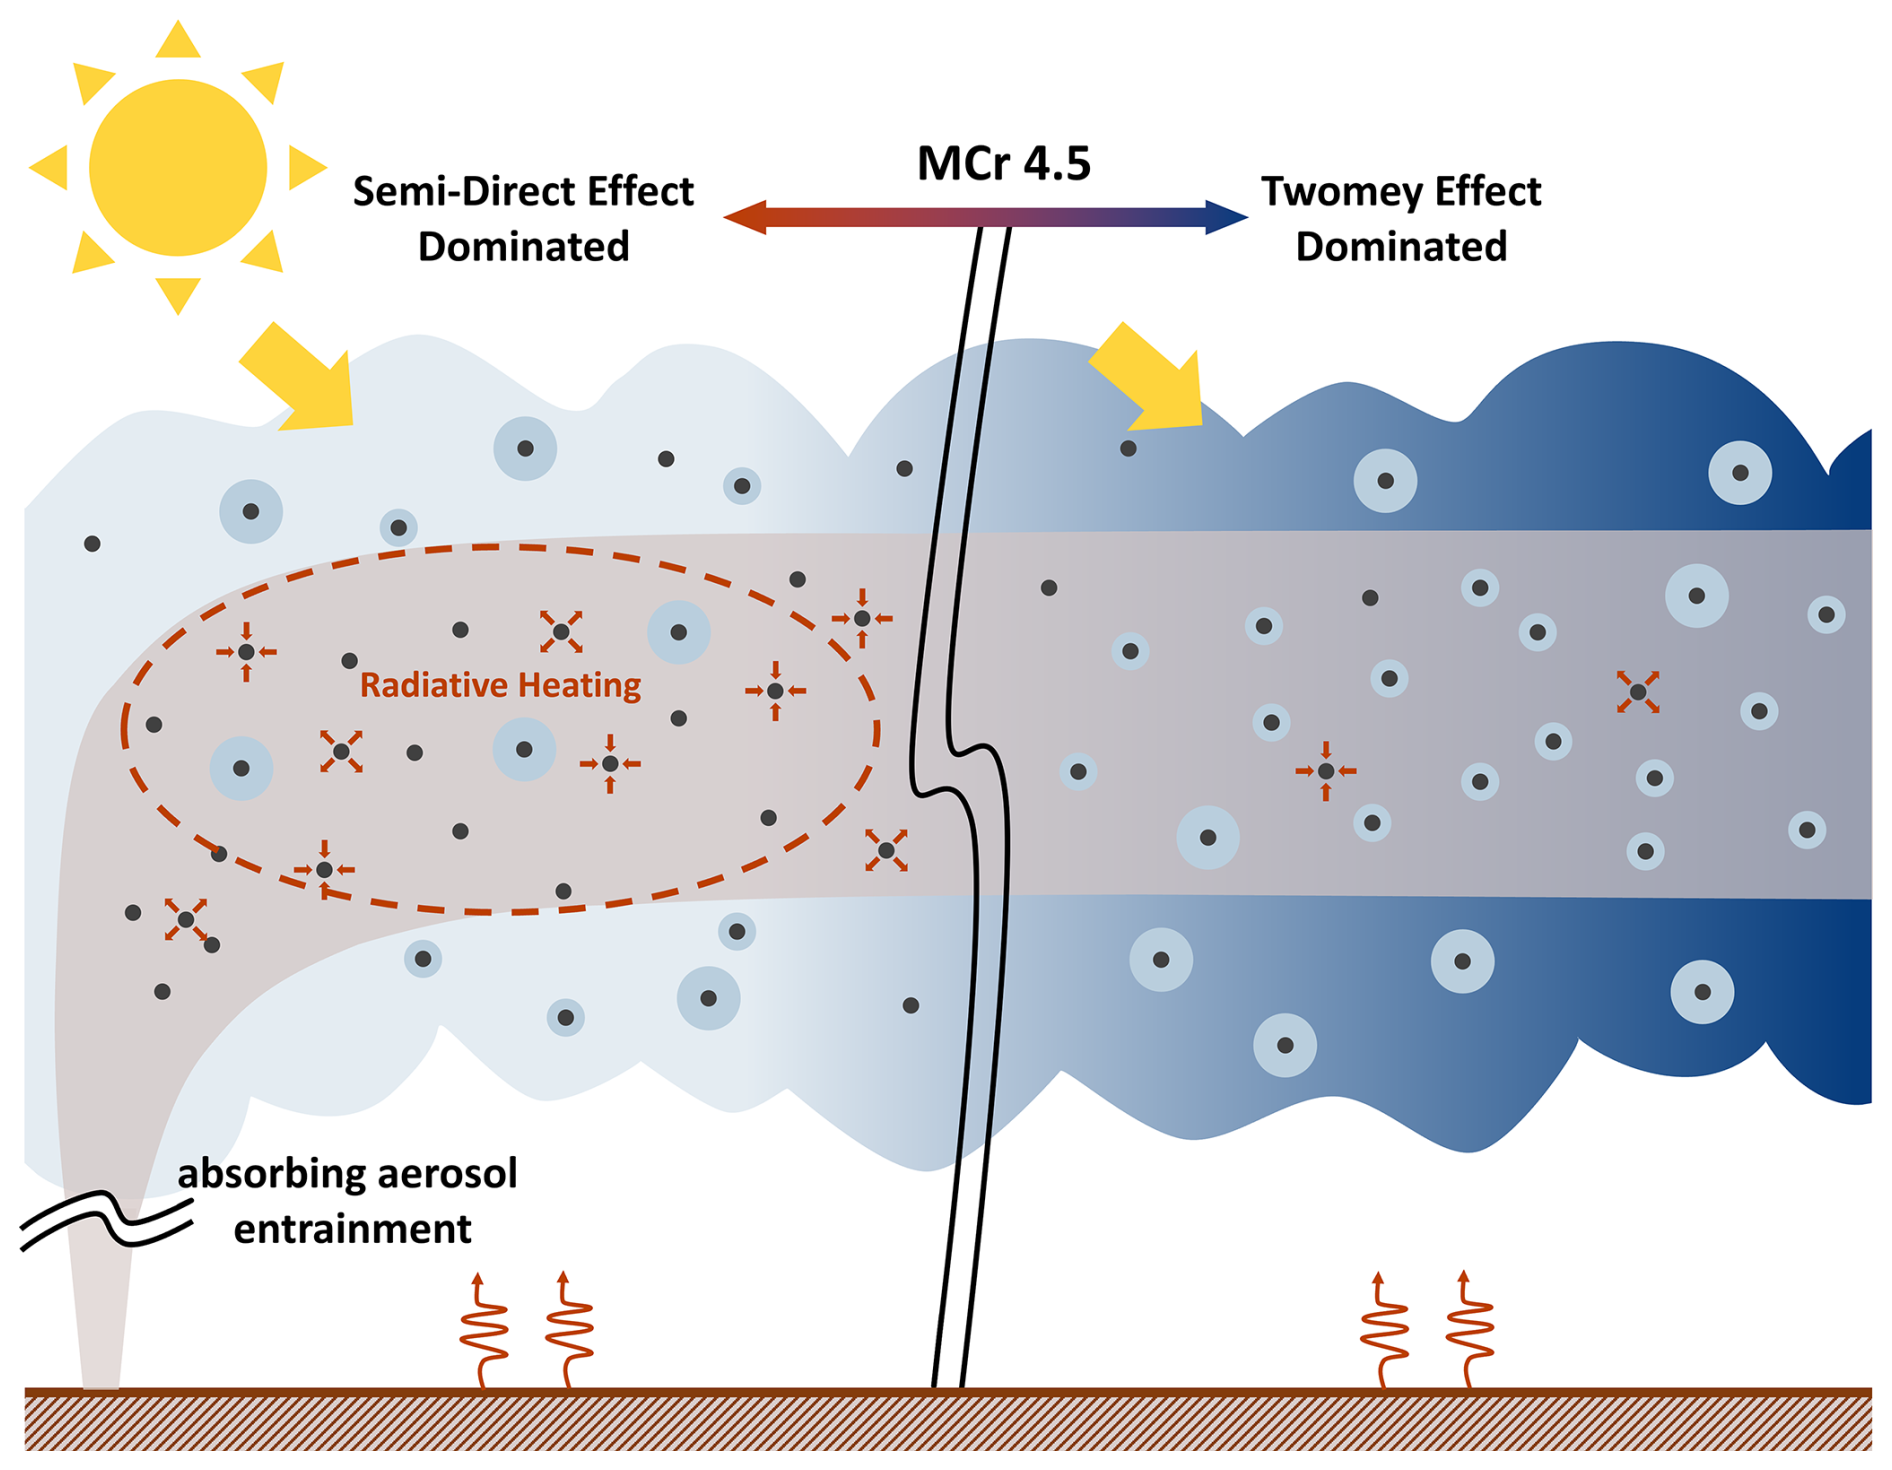
Figure 13A schematic illustration showing how aerosol entrainment leads to different cloud microphysical responses under varying MCr conditions.
The overall microphysical variations in aerosol-cloud interactions can be divided into two dominant regimes, the semi-direct effect and the Twomey effect, whose relationships with MCr are illustrated in Fig. 13. A low MCr value indicates that each unit of aerosol within the cloud system is associated with a relatively limited amount of liquid water. Under this condition, the entrainment of additional absorbing aerosols is mainly governed by the semi-direct effect, resulting in the dissipation of small cloud droplets (Fig. 13). In contrast, a high MCr value represents an environment with abundant liquid water relative to aerosol loading, where the increase in aerosols enhances the formation of numerous small droplets through microphysical processes described by the Twomey effect (Twomey, 1974, 1977). Notably, all of the above analyses are established by simultaneously accounting for both cloud water content and aerosol concentration. Without the additional information provided by MCr or NCr, such variations might be obscured or even misinterpreted due to mutual interference between variables. The conclusions drawn in this study demonstrate the importance of incorporating cloud-aerosol mixing ratios – particularly when attempting to transition from observational phenomena to a more complete framework for understanding the nonlinear responses between aerosol concentrations and clouds. Fundamentally, the cloud-aerosol mixing ratio framework moves beyond considering the influence of aerosol emissions alone and instead incorporates the coupled state between aerosols and the environment or between aerosols and the cloud system. This provides a more comprehensive perspective for understanding the feedback mechanisms involved in aerosol-cloud interactions. Although this study, through prior screening and constraining of meteorological and aerosol conditions, ultimately converges on the role of absorbing aerosols, the impacts of other aerosol types and their actual in-cloud loadings at different locations around the world remain unresolved. Nevertheless, given the widespread availability of global PM2.5 observations, future work will be able to leverage extensive monitoring networks in combination with in-situ cloud-water measurements to further investigate these processes.
The in-situ data collected by the aerosol–cloud microphysics monitoring system at LABS and the lidar data can be requested from the corresponding author. Supporting data from LABS are available at https://data.moenv.gov.tw/dataset/detail/AQX_P_26 (last access: 20 January 2026) or can also be requested by contacting the corresponding author.
The supplement related to this article is available online at https://doi.org/10.5194/acp-26-2083-2026-supplement.
PHL drafted the initial manuscript and was responsible for formal analysis, software implementation, and data visualization. SHW provided the methodology, resources, and supervision, and contributed to manuscript review and editing. PHL, SHW, OK, and NHL jointly interpreted and discussed the results. All authors contributed to the final paper.
The contact author has declared that none of the authors has any competing interests.
Publisher's note: Copernicus Publications remains neutral with regard to jurisdictional claims made in the text, published maps, institutional affiliations, or any other geographical representation in this paper. The authors bear the ultimate responsibility for providing appropriate place names. Views expressed in the text are those of the authors and do not necessarily reflect the views of the publisher.
This research is primarily based on the first author's M.Sc. thesis completed at the Department of Atmospheric Sciences, National Central University, Taiwan, and has been further expanded through additional analyses and discussions. The authors would like to express their sincere gratitude to Prof. Sheng-Hsiang Wang for the valuable guidance during the thesis period and constructive suggestions for this research. The authors also acknowledge the Ministry of Environment (MOE), Taiwan, for providing access to the Lulin Atmospheric Background Station (LABS) and for supplying air quality and meteorological data. The lidar observational data used in this study were also provided by the Ministry of Environment (MOE), Taiwan. The authors further acknowledge the Central Weather Administration of Taiwan for satellite imagery and synoptic weather chart products, which are publicly available at https://opendata.cwa.gov.tw/index (last access: 20 January 2026), https://asrad.pccu.edu.tw/dbar/ (last access: 20 January 2026), and https://obs.pblap.tw/ (last access: 20 January 2026). In addition, MODIS active fire data were obtained from NASA via the FIRMS platform (https://firms.modaps.eosdis.nasa.gov/active_fire; last access: 20 January 2026), and HYSPLIT trajectory outputs were provided by NOAA through the READY system (https://www.ready.noaa.gov/HYSPLIT_traj.php, last access: 20 January 2026).
This research has been supported by the National Science and Technology Council (grant no. MOST 111-2628-M-008-002-MY3).
This paper was edited by Armin Sorooshian and reviewed by three anonymous referees.
Albrecht, B. A.: Aerosols, Cloud Microphysics, and Fractional Cloudiness, Science, 245, 1227–1230, https://doi.org/10.1126/science.245.4923.1227, 1989.
Ardon-Dryer, K., Kelley, M. C., Xueting, X., and Dryer, Y.: The Aerosol Research Observation Station (AEROS), Atmos. Meas. Tech., 15, 2345–2360, https://doi.org/10.5194/amt-15-2345-2022, 2022.
Bellouin, N., Quaas, J., Gryspeerdt, E., Kinne, S., Stier, P., Watson-Parris, D., Boucher, O., Carslaw, K. S., Christensen, M., Daniau, A.-L., Dufresne, J.-L., Feingold, G., Fiedler, S., Forster, P., Gettelman, A., Haywood, J. M., Lohmann, U., Malavelle, F., Mauritsen, T., McCoy, D. T., Myhre, G., Mülmenstädt, J., Neubauer, D., Possner, A., Rugenstein, M., Sato, Y., Schulz, M., Schwartz, S. E., Sourdeval, O., Storelvmo, T., Toll, V., Winker, D., and Stevens, B.: Bounding Global Aerosol Radiative Forcing of Climate Change, Rev. Geophys., 58, e2019RG000660, https://doi.org/10.1029/2019RG000660, 2020.
Bender, F. A. M., Frey, L., McCoy, D. T., Grosvenor, D. P., and Mohrmann, J. K.: Assessment of aerosol–cloud–radiation correlations in satellite observations, climate models and reanalysis, Clim. Dynam., 52, 4371–4392, https://doi.org/10.1007/s00382-018-4384-z, 2019.
Bond, T. C., Doherty, S. J., Fahey, D. W., Forster, P. M., Berntsen, T., DeAngelo, B. J., Flanner, M. G., Ghan, S., Kärcher, B., Koch, D., Kinne, S., Kondo, Y., Quinn, P. K., Sarofim, M. C., Schultz, M. G., Schulz, M., Venkataraman, C., Zhang, H., Zhang, S., Bellouin, N., Guttikunda, S. K., Hopke, P. K., Jacobson, M. Z., Kaiser, J. W., Klimont, Z., Lohmann, U., Schwarz, J. P., Shindell, D., Storelvmo, T., Warren, S. G., and Zender, C. S.: Bounding the role of black carbon in the climate system: A scientific assessment, J. Geophys. Res.-Atmos., 118, 5380–5552, https://doi.org/10.1002/jgrd.50171, 2013.
Boucher, O., Randall, D., Artaxo, P., Bretherton, C., Feingold, G., Forster, P., Kerminen, V.-M., Kondo, Y., Liao, H., Lohmann, U., Rasch, P., Satheesh, S., Sherwood, S., Stevens, B., and Zhang, X.: Clouds and Aerosols, in: Climate Change 2013: The Physical Science Basis. Contribution of Working Group I to the Fifth Assessment Report of the Intergovernmental Panel on Climate Change, edited by: Stocker, T., Qin, D., Plattner, G.-K., Tignor, M., Allen, S., Boschung, J., Nauels, A., Xia, Y., Bex, V., and Midgley, P., Chap. 7, Cambridge University Press, Cambridge, United Kingdom and New York, NY, USA, 571–658, https://doi.org/10.1017/CBO9781107415324.016, 2013.
Cappa, C. D., Kolesar, K. R., Zhang, X., Atkinson, D. B., Pekour, M. S., Zaveri, R. A., Zelenyuk, A., and Zhang, Q.: Understanding the optical properties of ambient sub- and supermicron particulate matter: results from the CARES 2010 field study in northern California, Atmos. Chem. Phys., 16, 6511–6535, https://doi.org/10.5194/acp-16-6511-2016, 2016.
Chen, Y., Haywood, J., Wang, Y., Malavelle, F., Jordan, G., Partridge, D., Fieldsend, J., De Leeuw, J., Schmidt, A., Cho, N., Oreopoulos, L., Platnick, S., Grosvenor, D., Field, P., and Lohmann, U.: Machine learning reveals climate forcing from aerosols is dominated by increased cloud cover, Nature Geoscience, 15, 609–614, https://doi.org/10.1038/s41561-022-00991-6, 2022.
Chen, Y.-C., Christensen, M. W., Xue, L., Sorooshian, A., Stephens, G. L., Rasmussen, R. M., and Seinfeld, J. H.: Occurrence of lower cloud albedo in ship tracks, Atmos. Chem. Phys., 12, 8223–8235, https://doi.org/10.5194/acp-12-8223-2012, 2012.
Chen, Y.-C., Wang, S.-H., Min, Q., Lu, S., Lin, P.-L., Lin, N.-H., Chung, K.-S., and Joseph, E.: Aerosol impacts on warm-cloud microphysics and drizzle in a moderately polluted environment, Atmos. Chem. Phys., 21, 4487–4502, https://doi.org/10.5194/acp-21-4487-2021, 2021.
Cheng, F.-Y., Yang, Z.-M., Ou-Yang, C.-F., and Ngan, F.: A numerical study of the dependence of long-range transport of CO to a mountain station in Taiwan on synoptic weather patterns during the Southeast Asia biomass-burning season, Atmos. Environ., 78, 277–290, https://doi.org/10.1016/j.atmosenv.2013.03.020, 2013.
Christensen, M. W., Chen, Y.-C., and Stephens, G. L.: Aerosol in direct effect dictated by liquid clouds, J. Geophys. Res.-Atmos., 121, 14636–14650, https://doi.org/10.1002/2016JD025245, 2016.
Chuang, M.-T., Lee, C.-T., Chou, C. C. K., Lin, N.-H., Sheu, G.-R., Wang, J.-L., Chang, S.-C., Wang, S.-H., Chi, K. H., Young, C.-Y., Huang, H., Chen, H.-W., Weng, G.-H., Lai, S.-Y., Hsu, S.-P., Chang, Y.-J., Chang, J.-H., and Wu, X.-C.: Carbonaceous aerosols in the air masses transported from Indochina to Taiwan: Long-term observation at Mt. Lulin, Atmos. Environ., 89, 507–516, https://doi.org/10.1016/j.atmosenv.2013.11.066, 2014.
D'Alessandro, J. J., McFarquhar, G. M., Wu, W., Stith, J. L., Jensen, J. B., and Rauber, R. M.: Characterizing the Occurrence and Spatial Heterogeneity of Liquid, Ice, and Mixed Phase Low-Level Clouds Over the Southern Ocean Using in Situ Observations Acquired During SOCRATES, J. Geophys. Res.-Atmos., 126, e2020JD034482, https://doi.org/10.1029/2020JD034482, 2021.
Davies, N. W., Fox, C., Szpek, K., Cotterell, M. I., Taylor, J. W., Allan, J. D., Williams, P. I., Trembath, J., Haywood, J. M., and Langridge, J. M.: Evaluating biases in filter-based aerosol absorption measurements using photoacoustic spectroscopy, Atmos. Meas. Tech., 12, 3417–3434, https://doi.org/10.5194/amt-12-3417-2019, 2019.
Deng, Z., Zhao, C., Zhang, Q., Huang, M., and Ma, X.: Statistical analysis of microphysical properties and the parameterization of effective radius of warm clouds in Beijing area, Atmos. Res., 93, 888–896, https://doi.org/10.1016/j.atmosres.2009.04.011, 2009.
Draxler, R. R. and Hess, G.: An overview of the HYSPLIT_4 modelling system for trajectories, Australian Meteorological Magazine, 47, 295–308, 1998.
Fan, J., Wang, Y., Rosenfeld, D., and Liu, X.: Review of Aerosol–Cloud Interactions: Mechanisms, Significance, and Challenges, Journal of the Atmospheric Sciences, 73, 4221–4252, https://doi.org/10.1175/JAS-D-16-0037.1, 2016.
Feingold, G., Remer, L. A., Ramaprasad, J., and Kaufman, Y. J.: Analysis of smoke impact on clouds in Brazilian biomass burning regions: An extension of Twomey's approach, J. Geophys. Res.-Atmos., 106, 22907–22922, https://doi.org/10.1029/2001JD000732, 2001.
Giglio, L., Csiszar, I., and Justice, C. O.: Global distribution and seasonality of active fires as observed with the Terra and Aqua Moderate Resolution Imaging Spectroradiometer (MODIS) sensors, J. Geophys. Res.-Biogeo., 111, https://doi.org/10.1029/2005JG000142, 2006.
Gultepe, I. and Isaac, G. A.: Scale Effects on Averaging of Cloud Droplet and Aerosol Number Concentrations: Observations and Models, Journal of Climate, 12, 1268–1279, https://doi.org/10.1175/1520-0442(1999)012<1268:SEOAOC>2.0.CO;2, 1999.
Haywood, J. M., Abel, S. J., Barrett, P. A., Bellouin, N., Blyth, A., Bower, K. N., Brooks, M., Carslaw, K., Che, H., Coe, H., Cotterell, M. I., Crawford, I., Cui, Z., Davies, N., Dingley, B., Field, P., Formenti, P., Gordon, H., de Graaf, M., Herbert, R., Johnson, B., Jones, A. C., Langridge, J. M., Malavelle, F., Partridge, D. G., Peers, F., Redemann, J., Stier, P., Szpek, K., Taylor, J. W., Watson-Parris, D., Wood, R., Wu, H., and Zuidema, P.: The CLoud–Aerosol–Radiation Interaction and Forcing: Year 2017 (CLARIFY-2017) measurement campaign, Atmos. Chem. Phys., 21, 1049–1084, https://doi.org/10.5194/acp-21-1049-2021, 2021.
Herbert, R. J., Bellouin, N., Highwood, E. J., and Hill, A. A.: Diurnal cycle of the semi-direct effect from a persistent absorbing aerosol layer over marine stratocumulus in large-eddy simulations, Atmos. Chem. Phys., 20, 1317–1340, https://doi.org/10.5194/acp-20-1317-2020, 2020.
Hilario, M. R. A., Bañaga, P. A., Betito, G., Braun, R. A., Cambaliza, M. O., Cruz, M. T., Lorenzo, G. R., MacDonald, A. B., Pabroa, P. C., Simpas, J. B., Stahl, C., Yee, J. R., and Sorooshian, A.: Stubborn aerosol: why particulate mass concentrations do not drop during the wet season in Metro Manila, Philippines, Environmental Science: Atmospheres, 2, 1428–1437, https://doi.org/10.1039/D2EA00073C, 2022.
Hsiao, T.-C., Chen, W.-N., Ye, W.-C., Lin, N.-H., Tsay, S.-C., Lin, T.-H., Lee, C.-T., Chuang, M.-T., Pantina, P., and Wang, S.-H.: Aerosol optical properties at the Lulin Atmospheric Background Station in Taiwan and the influences of long-range transport of air pollutants, Atmos. Environ., 150, 366–378, https://doi.org/10.1016/j.atmosenv.2016.11.031, 2017.
Huang, H.-Y., Wang, S.-H., Huang, W.-X., Lin, N.-H., Chuang, M.-T., da Silva, A. M., and Peng, C.-M.: Influence of Synoptic-Dynamic Meteorology on the Long-Range Transport of Indochina Biomass Burning Aerosols, J. Geophys. Res.-Atmos., 125, e2019JD031260, https://doi.org/10.1029/2019JD031260, 2020.
IPCC: Climate Change 2013 – The Physical Science Basis: Working Group I Contribution to the Fifth Assessment Report of the Intergovernmental Panel on Climate Change, Cambridge University Press, Cambridge, https://doi.org/10.1017/CBO9781107415324, 2014.
IPCC: Climate Change 2021 – The Physical Science Basis: Working Group I Contribution to the Sixth Assessment Report of the Intergovernmental Panel on Climate Change, Cambridge University Press, Cambridge, https://doi.org/10.1017/9781009157896, 2023.
Jia, H. and Quaas, J.: Nonlinearity of the cloud response postpones climate penalty of mitigating air pollution in polluted regions, Nature Climate Change, 13, 943–950, https://doi.org/10.1038/s41558-023-01775-5, 2023.
Jia, H., Ma, X., Yu, F., and Quaas, J.: Significant underestimation of radiative forcing by aerosol–cloud interactions derived from satellite-based methods, Nat. Commun., 12, 3649, https://doi.org/10.1038/s41467-021-23888-1, 2021.
Jia, H., Quaas, J., Gryspeerdt, E., Böhm, C., and Sourdeval, O.: Addressing the difficulties in quantifying droplet number response to aerosol from satellite observations, Atmos. Chem. Phys., 22, 7353–7372, https://doi.org/10.5194/acp-22-7353-2022, 2022.
Johnson, B. T., Shine, K. P., and Forster, P. M.: The semi-direct aerosol effect: Impact of absorbing aerosols on marine stratocumulus, Q. J. Roy. Meteor. Soc., 130, 1407–1422, https://doi.org/10.1256/qj.03.61, 2004.
Justice, C. O., Giglio, L., Korontzi, S., Owens, J., Morisette, J. T., Roy, D., Descloitres, J., Alleaume, S., Petitcolin, F., and Kaufman, Y.: The MODIS fire products, Remote Sens. Environ., 83, 244–262, https://doi.org/10.1016/S0034-4257(02)00076-7, 2002.
Kacarab, M., Thornhill, K. L., Dobracki, A., Howell, S. G., O'Brien, J. R., Freitag, S., Poellot, M. R., Wood, R., Zuidema, P., Redemann, J., and Nenes, A.: Biomass burning aerosol as a modulator of the droplet number in the southeast Atlantic region, Atmos. Chem. Phys., 20, 3029–3040, https://doi.org/10.5194/acp-20-3029-2020, 2020.
Kaufman, Y. J. and Fraser, R. S.: The Effect of Smoke Particles on Clouds and Climate Forcing, Science, 277, 1636–1639, https://doi.org/10.1126/science.277.5332.1636, 1997.
Kaufman, Y. J., Koren, I., Remer, L. A., Rosenfeld, D., and Rudich, Y.: The effect of smoke, dust, and pollution aerosol on shallow cloud development over the Atlantic Ocean, P. Natl. Acad. Sci. USA, 102, 11207–11212, https://doi.org/10.1073/pnas.0505191102, 2005.
Klemm, O. and Lin, N. H.: What Causes Observed Fog Trends: Air Quality or Climate Change?, Aerosol and Air Quality Research, 16, 1131–1142, https://doi.org/10.4209/aaqr.2015.05.0353, 2016.
Koch, D. and Del Genio, A. D.: Black carbon semi-direct effects on cloud cover: review and synthesis, Atmos. Chem. Phys., 10, 7685–7696, https://doi.org/10.5194/acp-10-7685-2010, 2010.
Koike, M., Ukita, J., Ström, J., Tunved, P., Shiobara, M., Vitale, V., Lupi, A., Baumgardner, D., Ritter, C., Hermansen, O., Yamada, K., and Pedersen, C. A.: Year-Round In Situ Measurements of Arctic Low-Level Clouds: Microphysical Properties and Their Relationships With Aerosols, J. Geophys. Res.-Atmos., 124, 1798–1822, https://doi.org/10.1029/2018JD029802, 2019.
Lance, S.: Coincidence Errors in a Cloud Droplet Probe (CDP) and a Cloud and Aerosol Spectrometer (CAS), and the Improved Performance of a Modified CDP, J. Atmos. Ocean. Tech., 29, 1532–1541, https://doi.org/10.1175/JTECH-D-11-00208.1, 2012.
Lee, C.-T., Chuang, M.-T., Lin, N.-H., Wang, J.-L., Sheu, G.-R., Chang, S.-C., Wang, S.-H., Huang, H., Chen, H.-W., Liu, Y.-L., Weng, G.-H., Lai, H.-Y., and Hsu, S.-P.: The enhancement of PM2.5 mass and water-soluble ions of biosmoke transported from Southeast Asia over the Mountain Lulin site in Taiwan, Atmos. Environ., 45, 5784–5794, https://doi.org/10.1016/j.atmosenv.2011.07.020, 2011.
Lihavainen, H., Kerminen, V.-M., and Remer, L. A.: Aerosol-cloud interaction determined by both in situ and satellite data over a northern high-latitude site, Atmos. Chem. Phys., 10, 10987–10995, https://doi.org/10.5194/acp-10-10987-2010, 2010.
Lin, K.-I., Chung, K.-S., Wang, S.-H., Chen, L.-H., Liou, Y.-C., Lin, P.-L., Chang, W.-Y., Chiu, H.-J., and Chang, Y.-H.: Evaluation of hygroscopic cloud seeding in warm-rain processes by a hybrid microphysics scheme using a Weather Research and Forecasting (WRF) model: a real case study, Atmos. Chem. Phys., 23, 10423–10438, https://doi.org/10.5194/acp-23-10423-2023, 2023.
Lin, N.-H., Tsay, S.-C., Maring, H. B., Yen, M.-C., Sheu, G.-R., Wang, S.-H., Chi, K. H., Chuang, M.-T., Ou-Yang, C.-F., Fu, J. S., Reid, J. S., Lee, C.-T., Wang, L.-C., Wang, J.-L., Hsu, C. N., Sayer, A. M., Holben, B. N., Chu, Y.-C., Nguyen, X. A., Sopajaree, K., Chen, S.-J., Cheng, M.-T., Tsuang, B.-J., Tsai, C.-J., Peng, C.-M., Schnell, R. C., Conway, T., Chang, C.-T., Lin, K.-S., Tsai, Y. I., Lee, W.-J., Chang, S.-C., Liu, J.-J., Chiang, W.-L., Huang, S.-J., Lin, T.-H., and Liu, G.-R.: An overview of regional experiments on biomass burning aerosols and related pollutants in Southeast Asia: From BASE-ASIA and the Dongsha Experiment to 7-SEAS, Atmos. Environ., 78, 1–19, https://doi.org/10.1016/j.atmosenv.2013.04.066, 2013.
Liu, J., Zhu, Y., Wang, M., Rosenfeld, D., Cao, Y., and Yuan, T.: Cloud Susceptibility to Aerosols: Comparing Cloud-Appearance Versus Cloud-Controlling Factors Regimes, J. Geophys. Res.-Atmos., 129, e2024JD041216, https://doi.org/10.1029/2024JD041216, 2024.
Ma, P.-L., Rasch, P. J., Chepfer, H., Winker, D. M., and Ghan, S. J.: Observational constraint on cloud susceptibility weakened by aerosol retrieval limitations, Nat. Commun., 9, 2640, https://doi.org/10.1038/s41467-018-05028-4, 2018.
McComiskey, A., Feingold, G., Frisch, A. S., Turner, D. D., Miller, M. A., Chiu, J. C., Min, Q., and Ogren, J. A.: An assessment of aerosol-cloud interactions in marine stratus clouds based on surface remote sensing, J. Geophys. Res.-Atmos., 114, https://doi.org/10.1029/2008JD011006, 2009.
McMeeking, G. R., Good, N., Petters, M. D., McFiggans, G., and Coe, H.: Influences on the fraction of hydrophobic and hydrophilic black carbon in the atmosphere, Atmos. Chem. Phys., 11, 5099–5112, https://doi.org/10.5194/acp-11-5099-2011, 2011.
Nguyen, L. S. P., Huang, H.-Y., Lei, T. L., Bui, T. T., Wang, S.-H., Chi, K. H., Sheu, G.-R., Lee, C.-T., Ou-Yang, C.-F., and Lin, N.-H.: Characterizing a landmark biomass-burning event and its implication for aging processes during long-range transport, Atmos. Environ., 241, 117766, https://doi.org/10.1016/j.atmosenv.2020.117766, 2020.
Ohata, S., Schwarz, J. P., Moteki, N., Koike, M., Takami, A., and Kondo, Y.: Hygroscopicity of materials internally mixed with black carbon measured in Tokyo, J. Geophys. Res.-Atmos., 121, 362–381, https://doi.org/10.1002/2015JD024153, 2016.
Pani, S. K., Lin, N.-H., Lee, C.-T., Griffith, S. M., Chang, J. H.-W., and Hsu, B.-J.: Insights into aerosol chemical composition and optical properties at Lulin Atmospheric Background Station (2862 m a.s.l.) during two contrasting seasons, Sci. Total Environ., 834, 155291, https://doi.org/10.1016/j.scitotenv.2022.155291, 2022.
Pöhlker, M. L., Pöhlker, C., Quaas, J., Mülmenstädt, J., Pozzer, A., Andreae, M. O., Artaxo, P., Block, K., Coe, H., Ervens, B., Gallimore, P., Gaston, C. J., Gunthe, S. S., Henning, S., Herrmann, H., Krüger, O. O., McFiggans, G., Poulain, L., Raj, S. S., Reyes-Villegas, E., Royer, H. M., Walter, D., Wang, Y., and Pöschl, U.: Global organic and inorganic aerosol hygroscopicity and its effect on radiative forcing, Nat. Commun., 14, 6139, https://doi.org/10.1038/s41467-023-41695-8, 2023.
Quaas, J., Arola, A., Cairns, B., Christensen, M., Deneke, H., Ekman, A. M. L., Feingold, G., Fridlind, A., Gryspeerdt, E., Hasekamp, O., Li, Z., Lipponen, A., Ma, P.-L., Mülmenstädt, J., Nenes, A., Penner, J. E., Rosenfeld, D., Schrödner, R., Sinclair, K., Sourdeval, O., Stier, P., Tesche, M., van Diedenhoven, B., and Wendisch, M.: Constraining the Twomey effect from satellite observations: issues and perspectives, Atmos. Chem. Phys., 20, 15079–15099, https://doi.org/10.5194/acp-20-15079-2020, 2020.
Saponaro, G., Kolmonen, P., Sogacheva, L., Rodriguez, E., Virtanen, T., and de Leeuw, G.: Estimates of the aerosol indirect effect over the Baltic Sea region derived from 12 years of MODIS observations, Atmos. Chem. Phys., 17, 3133–3143, https://doi.org/10.5194/acp-17-3133-2017, 2017.
Schmeisser, L., Andrews, E., Ogren, J. A., Sheridan, P., Jefferson, A., Sharma, S., Kim, J. E., Sherman, J. P., Sorribas, M., Kalapov, I., Arsov, T., Angelov, C., Mayol-Bracero, O. L., Labuschagne, C., Kim, S.-W., Hoffer, A., Lin, N.-H., Chia, H.-P., Bergin, M., Sun, J., Liu, P., and Wu, H.: Classifying aerosol type using in situ surface spectral aerosol optical properties, Atmos. Chem. Phys., 17, 12097–12120, https://doi.org/10.5194/acp-17-12097-2017, 2017.
Schultze, M. and Rockel, B.: Direct and semi-direct effects of aerosol climatologies on long-term climate simulations over Europe, Clim. Dynam., 50, 3331–3354, https://doi.org/10.1007/s00382-017-3808-5, 2018.
Segal, Y., Khain, A., Pinsky, M., and Rosenfeld, D.: Effects of hygroscopic seeding on raindrop formation as seen from simulations using a 2000-bin spectral cloud parcel model, Atmos. Res., 71, 3–34, https://doi.org/10.1016/j.atmosres.2004.03.003, 2004.
Segal, Y., Pinsky, M., and Khain, A.: The role of competition effect in the raindrop formation, Atmos. Res., 83, 106–118, https://doi.org/10.1016/j.atmosres.2006.03.007, 2007.
Silverman, B. A. and Sukarnjanaset, W.: Results of the Thailand Warm-Cloud Hygroscopic Particle Seeding Experiment, J. Appl. Meteorol., 39, 1160–1175, https://doi.org/10.1175/1520-0450(2000)039<1160:ROTTWC>2.0.CO;2, 2000.
Spracklen, D. V., Carslaw, K. S., Pöschl, U., Rap, A., and Forster, P. M.: Global cloud condensation nuclei influenced by carbonaceous combustion aerosol, Atmos. Chem. Phys., 11, 9067–9087, https://doi.org/10.5194/acp-11-9067-2011, 2011.
Stein, A. F., Draxler, R. R., Rolph, G. D., Stunder, B. J. B., Cohen, M. D., and Ngan, F.: NOAA's HYSPLIT Atmospheric Transport and Dispersion Modeling System, B. Am. Meteorol. Soc., 96, 2059–2077, https://doi.org/10.1175/BAMS-D-14-00110.1, 2015.
Stephens, G. L.: Radiation Profiles in Extended Water Clouds. I: Theory, Journal of Atmospheric Sciences, 35, 2111–2122, https://doi.org/10.1175/1520-0469(1978)035<2111:RPIEWC>2.0.CO;2, 1978.
Taylor, J. W., Wu, H., Szpek, K., Bower, K., Crawford, I., Flynn, M. J., Williams, P. I., Dorsey, J., Langridge, J. M., Cotterell, M. I., Fox, C., Davies, N. W., Haywood, J. M., and Coe, H.: Absorption closure in highly aged biomass burning smoke, Atmos. Chem. Phys., 20, 11201–11221, https://doi.org/10.5194/acp-20-11201-2020, 2020.
Toll, V., Christensen, M., Gassó, S., and Bellouin, N.: Volcano and Ship Tracks Indicate Excessive Aerosol-Induced Cloud Water Increases in a Climate Model, Geophys. Res. Lett., 44, 12492–12500, https://doi.org/10.1002/2017GL075280, 2017.
Toll, V., Christensen, M., Quaas, J., and Bellouin, N.: Weak average liquid-cloud-water response to anthropogenic aerosols, Nature, 572, 51–55, https://doi.org/10.1038/s41586-019-1423-9, 2019.
Tsay, S.-C., Maring, H. B., Lin, N.-H., Buntoung, S., Chantara, S., Chuang, H.-C., Gabriel, P. M., Goodloe, C. S., Holben, B. N., Hsiao, T.-C., Hsu, N. C., Janjai, S., Lau, W. K. M., Lee, C.-T., Lee, J., Loftus, A. M., Nguyen, A. X., Nguyen, C. M., Pani, S. K., Pantina, P., Sayer, A. M., Tao, W.-K., Wang, S.-H., Welton, E. J., Wiriya, W., and Yen, M.-C.: Satellite-Surface Perspectives of Air Quality and Aerosol-Cloud Effects on the Environment: An Overview of 7-SEAS/BASELInE, Aerosol and Air Quality Research, 16, 2581–2602, https://doi.org/10.4209/aaqr.2016.08.0350, 2016.
Twomey, S.: Pollution and the planetary albedo, Atmos. Environ. (1967), 8, 1251–1256, https://doi.org/10.1016/0004-6981(74)90004-3, 1974.
Twomey, S.: The Influence of Pollution on the Shortwave Albedo of Clouds, Journal of Atmospheric Sciences, 34, 1149–1152, https://doi.org/10.1175/1520-0469(1977)034<1149:TIOPOT>2.0.CO;2, 1977.
Wang, J., Cubison, M. J., Aiken, A. C., Jimenez, J. L., and Collins, D. R.: The importance of aerosol mixing state and size-resolved composition on CCN concentration and the variation of the importance with atmospheric aging of aerosols, Atmos. Chem. Phys., 10, 7267–7283, https://doi.org/10.5194/acp-10-7267-2010, 2010.
Wang, S., Ma, Y., Wang, Z., Wang, L., Chi, X., Ding, A., Yao, M., Li, Y., Li, Q., Wu, M., Zhang, L., Xiao, Y., and Zhang, Y.: Mobile monitoring of urban air quality at high spatial resolution by low-cost sensors: impacts of COVID-19 pandemic lockdown, Atmos. Chem. Phys., 21, 7199–7215, https://doi.org/10.5194/acp-21-7199-2021, 2021.
Wang, S.-H., Lin, N.-H., Chou, M.-D., and Woo, J.-H.: Estimate of radiative forcing of Asian biomass-burning aerosols during the period of TRACE-P, J. Geophys. Res.-Atmos., 112, https://doi.org/10.1029/2006JD007564, 2007.
Warren, S. G., Hahn, C. H., London, J., Chervin, R. M., and Jenne, R. L.: Global Distribution of Total Cloud Cover and Cloud Type Amounts Over the Ocean, University Corporation for Atmos. Res., https://doi.org/10.5065/D6QC01D1, 1988.
Wood, R.: Stratocumulus Clouds, Monthly Weather Review, 140, 2373–2423, https://doi.org/10.1175/MWR-D-11-00121.1, 2012.
Wu, H., Taylor, J. W., Szpek, K., Langridge, J. M., Williams, P. I., Flynn, M., Allan, J. D., Abel, S. J., Pitt, J., Cotterell, M. I., Fox, C., Davies, N. W., Haywood, J., and Coe, H.: Vertical variability of the properties of highly aged biomass burning aerosol transported over the southeast Atlantic during CLARIFY-2017, Atmos. Chem. Phys., 20, 12697–12719, https://doi.org/10.5194/acp-20-12697-2020, 2020.
Yang, Y., Zhao, C., Dong, X., Fan, G., Zhou, Y., Wang, Y., Zhao, L., Lv, F., and Yan, F.: Toward understanding the process-level impacts of aerosols on microphysical properties of shallow cumulus cloud using aircraft observations, Atmos. Res., 221, 27–33, https://doi.org/10.1016/j.atmosres.2019.01.027, 2019.
Yen, M.-C., Peng, C.-M., Chen, T.-C., Chen, C.-S., Lin, N.-H., Tzeng, R.-Y., Lee, Y.-A., and Lin, C.-C.: Climate and weather characteristics in association with the active fires in northern Southeast Asia and spring air pollution in Taiwan during 2010 7-SEAS/Dongsha Experiment, Atmos. Environ., 78, 35–50, https://doi.org/10.1016/j.atmosenv.2012.11.015, 2013.
Zhang, J. and Zuidema, P.: The diurnal cycle of the smoky marine boundary layer observed during August in the remote southeast Atlantic, Atmos. Chem. Phys., 19, 14493–14516, https://doi.org/10.5194/acp-19-14493-2019, 2019.
Zhang, J. and Zuidema, P.: Sunlight-absorbing aerosol amplifies the seasonal cycle in low-cloud fraction over the southeast Atlantic, Atmos. Chem. Phys., 21, 11179–11199, https://doi.org/10.5194/acp-21-11179-2021, 2021.
Zhao, C., Qiu, Y., Dong, X., Wang, Z., Peng, Y., Li, B., Wu, Z., and Wang, Y.: Negative Aerosol-Cloud re Relationship From Aircraft Observations Over Hebei, China, Earth Space Sci., 5, 19–29, https://doi.org/10.1002/2017EA000346, 2018.
Zheng, X., Xi, B., Dong, X., Logan, T., Wang, Y., and Wu, P.: Investigation of aerosol–cloud interactions under different absorptive aerosol regimes using Atmospheric Radiation Measurement (ARM) southern Great Plains (SGP) ground-based measurements, Atmos. Chem. Phys., 20, 3483–3501, https://doi.org/10.5194/acp-20-3483-2020, 2020.