the Creative Commons Attribution 4.0 License.
the Creative Commons Attribution 4.0 License.
Volume-to-extinction ratio: an important property of dust
Maria Kezoudi
Holger Baars
Athina Floutsi
Eleni Drakaki
Konrad Kandler
Sudharaj Aryasree
Elena Louca
Theodoros Christoudias
Eleni Marinou
Chris Stopford
Troy Thornberry
Vassilis Amiridis
Jean Sciare
Franco Marenco
The volume-to-extinction ratio (ζ) is an important aerosol property, allowing to relate gravimetric and optical quantifications, widely used in remote sensing and in climate models. The ζ ratio is affected by the microphysical properties of aerosol particles, including their size, shape and composition. This study presents a synergistic approach combining airborne in-situ observations and ground-based remote sensing to study this ratio during dust events originating in the Middle East and Saharan regions, and to examine its vertical variability and general estimation uncertainty. The data were collected during the 2021 Cyprus Fall Campaign and the 2022 ASKOS campaign in Cabo Verde. The combination of observations offered vertically-resolved information on the particle size-distribution and volume-to-extinction ratio. The findings of this study reveal pronounced differences in the ζ ratio and effective radius across events and regions, reflecting variations in the degree of mixing with fine particles, as well as some variability with altitude due to varying particle size and shape. During Middle East dust events in Cyprus in fall 2021 the observed average ζ was the lowest with µm, whilst for a Saharan dust case in Cabo Verde in summer 2022 observations showed the highest values with µm, both values obtained at the dust layer altitude in some of the reported cases. The analysis highlights large discrepancies compared to AERONET-derived values and previous literature, especially in the presence of super-coarse and giant particles. Scattering computations allowed to evaluate the experimental results and provide insights into the role of particle asphericity. Atmospheric model simulations also showed discrepancies, mainly due to assumptions that neglect larger particles. These findings suggest that improved dust representation in models is essential for accurate climate assessment.
- Article
(6158 KB) - Full-text XML
- BibTeX
- EndNote
Understanding whether aerosols warm or cool the planet is key to explaining, mitigating, and predicting climate change (IPCC, 2021). Many studies over the past decades have explored this question, which is challenging due to the various ways aerosols interact with radiative forcing. Firstly, aerosols can interact (directly) with solar and terrestrial radiation, either scattering light to produce a cooling effect or absorbing it to contribute to warming. Beyond their direct effect on radiation, aerosols also have an indirect impact by influencing cloud formation by acting as cloud condensation nuclei (CCN) and ice-nucleating particles (INP), altering cloud properties and precipitation patterns (Albrecht, 1989; Karydis et al., 2017). Adding to the complexity, natural aerosol emissions, such as dust, are not fixed; they respond dynamically to climate changes, amplifying or dampening atmospheric feedbacks (Carslaw et al., 2010).
The interaction of aerosols with radiation is dependent on their optical and microphysical properties (e.g. particle size, refractive index), which vary based on composition, source, and atmospheric processing during transit. For example, sulfate and nitrate aerosols, typically smaller than 1 µm, primarily scatter radiation due to the low imaginary part of their refractive index (RI), leading to cooling effects (Robock, 2000; Zaehle et al., 2011). In contrast, black carbon (BC), with particle sizes of 0.1–0.25 µm, are good absorbers of shortwave radiation, contributing to warming and influencing cloud formation as a CCN (Moteki, 2023; Koch and Del Genio, 2010). Mineral dust, however, exhibits more complex optical behaviour due to its broad particle size distribution (PSD), spanning from fine to super-coarse and giant modes, and to a variable RI, which depends on mineralogical composition (Di Biagio et al., 2017; Ryder et al., 2018). Its extinction efficiency is strongly size-dependent, with studies suggesting that larger particles contribute significantly to the extinction of infrared radiation (Mahowald et al., 2014; Ryder et al., 2019; Fountoulakis et al., 2024). In addition, dust can act as both CCN, (Karydis et al., 2011; Levin and Cotton, 2008; Rosenfeld et al., 2001), and ice nuclei (IN) (DeMott et al., 2003, 2015), affecting cloud microphysics and precipitation processes. Specifically, larger dust particles, although at lower concentrations in the atmosphere, due to their enhanced deposition, can still act efficiently as CCN (Andreae et al., 2005) or IN (Chen et al., 2021).
Atmospheric models, including numerical weather prediction, dust transport and climate models, are important for understanding the dust radiative impact (Kok et al., 2023). However, most model predictions typically include dust particles up to 10 µm, missing a substantial quantity of giant particles and leading to poor representation of the dust load and its radiative effect (Adebiyi and Kok, 2020; O'Sullivan et al., 2020; Drakaki et al., 2022). Given that mineral dust is the most abundant aerosol type by mass, accurately quantifying it and realistically describing its PSD correctly becomes even more significant.
The quantity and distribution of dust in the atmosphere are among the parameters considered for various environmental and economic applications, including climate projections (Kok et al., 2023), air quality assessment (Karanasiou et al., 2012; Proestakis et al., 2025), and aviation safety (Nickovic et al., 2021; Ryder et al., 2024). Remote sensing technologies such as spaceborne lidars (e.g., CALIOP, Winker et al., 2009; ATLID, Illingworth et al., 2015) and ground-based lidar (e.g., EARLINET, Bösenberg et al., 2003; LALINET, Antuña-Marrero et al., 2017; MPLNET, Welton et al., 2001) and sun photometer networks (e.g., AERONET, Holben et al., 1998; SKYNET, Nakajima et al., 2007), provide valuable optical measurements of dust, which when converted into physical quantities like mass concentration, can be utilized in a variety of applications. The key variables in this conversion process is the volume-to-extinction ratio and the density, which serves a dual purpose: it facilitates the estimation of extinction coefficient from mass concentration, an approach commonly used in atmospheric models (Ghan and Zaveri, 2007), important for assessing radiative effects – and enables the translation of remotely sensed extinction and aerosol optical depth (AOD) into gravimetric quantities, which are useful for most policy formulations.
For the calculation of the volume-to-extinction ratio, it is necessary to derive the total volume of dust particles and their extinction. The relationship between the two parameters significantly influences retrieval accuracy, and can be challenging particularly for mixed aerosol types such as desert dust mixed with other aerosols (e.g. pollutants), where this relationship becomes more complex. The extinction coefficient can be derived from observations using sun photometers and lidar, or estimated through atmospheric models. Similarly, the total volume concentration, which is directly related to PSD, can be measured in-situ using optical particle spectometers (OPSs, also known as optical particle counters, OPCs), inverted from sky radiance observations, or estimated by models. Ground-based in-situ measurements often provide only ground-level PSDs, which may not be representative of the entire atmospheric column.
Ground-based sun/sky radiometers, such as those of the AERONET or SKYNET networks (Holben et al., 1998; Nakajima et al., 2007), offer spectrally resolved AOD and can retrieve fine and coarse mode aerosol properties, including size-resolved volume concentration. When combined with ground-based lidar observations, these measurements enable the inversion of lidar-derived optical properties (e.g., Ansmann et al., 2011; Mamouri and Ansmann, 2014), allowing for simultaneous retrieval of both columnar and vertically resolved aerosol properties. Sunphotometer-only inversions have inherent limitations, such as the assumption of a single complex RI for both fine and coarse particles. Furthermore, AERONET's and SKYNET's retrievals are constrained to a maximum particle radius (15 µm for AERONET, 10 µm for SKYNET v5), which can lead to underestimation of giant particles, as demonstrated by Estellés et al. (2018) and Garcia-Suñer et al. (2024) for dust events over the Sahara and tropical eastern Atlantic during the Sunphotometer Airborne Validation Experiment in Dust (SAVEX-D) and AERosol Properties – Dust (AER-D) campaigns.
Synergistic algorithms that combine lidar with sunphotometer measurements (e.g. GRASP, Lopatin et al., 2021), overcome some of these limitations, but they are not used operationally as of yet (Tsekeri et al., 2023). Airborne observations acquired from in-situ sensors on board aircraft or Unmanned Aerial Vehicles (UAVs) can provide high vertical-resolution profiles of aerosol properties for fine, coarse and giant particles (Haywood et al., 2003; Turnbull et al., 2012; Johnson et al., 2016; Ryder et al., 2015a, 2018; Kezoudi et al., 2021a). Airborne in-situ measurements can directly capture PSDs at different altitudes, offering a more detailed view of aerosol distribution that may complement ground-based remote sensing data. These observations are particularly valuable for validating and refining retrieval methods using lidar and/or sun photometer observations. In-situ measurements should, whenever possible, cover the full particle size range to provide meaningful improvements to existing methodologies, and this is usually achieved by combining different sensors each covering part of the size spectrum (see e.g. Ryder et al., 2015b).
The Unmanned Research Laboratory (USRL) (Kezoudi et al., 2021a) of the Cyprus Institute provides UAV-related infrastructure and a unique capability for conducting synergistic atmospheric observations using miniaturized and conventional sensors. This mobile facility can perform flights at any chosen location of interest upon authorization, but can also operate from its private runway. The private runway is strategically located near the Cyprus Atmospheric Observatory (CAO) in Agia Marina Xyliatou, which is equipped with ground-based remote sensing observations.
This study explores the volume-to-extinction ratio of mineral dust using the extinction coefficient derived from lidar measurements, and the PSDs measured in-situ with UAVs. During the Fall Campaign 2021 in Cyprus and the ASKOS Campaign 2022 in Cabo Verde, synergistic measurements were conducted using UAV-mounted in-situ sensors, lidar, and sun photometers during dust episodes. These observations provide a unique dataset for deriving volume-to-extinction ratios across different aerosol conditions, including Saharan, Middle Eastern, and mixed dust cases. The retrieved ratios are compared with MOPSMAP scattering calculations (Gasteiger and Wiegner, 2018a) for different refractive indices and shape assumptions (i.e., aspect ratios) to link observations to the theory. Additionally, a comparison between the observed ζ and the predefined ζ used in the WRF-Chem model input is conducted to evaluate how well the model's predefined values represent the aerosol load. The findings of this study contribute to improved aerosol characterization and enhancement of the reliability of remote sensing-based aerosol mass retrievals.
Aerosol “quantity” in the atmosphere is often expressed in terms of mass concentration (for example, in units of µg m−3) or by extensive optical properties, e.g. the extinction coefficient (in units of M m−1). When the column-integrated quantities are given, the equivalent formulations will be the mass loading (e.g. in g m−2) and the AOD (unitless). Mass is the natural way to express the quantity of matter, and it can be directly obtained at the Earth's surface from gravimetric measurements or calculated from observations of the particle size distribution. The extinction and AOD are parameters that affect the aerosol direct radiative impact. Moreover, these quantities can be observed by remote sensing through lidar, sunphotometer networks such as AERONET and SKYNET, or passive satellite imagers. The relationship between the gravimetric and the optical properties of aerosols is essential when using optical observations for the validation, tuning and data assimilation for models that represent the aerosols in terms of concentration, and vice versa when using remote sensing observations to estimate gravimetric concentrations.
The conversion factor for extinction-to-mass is called the “specific extinction” (Haywood et al., 2003; Marenco et al., 2011; Johnson et al., 2012). This section outlines the theoretical concept that relates aerosol concentration and the aerosol extinction to the particle microphysical properties, in order to better understand how these influence specific extinction. The specific extinction depends on two terms: the volume-to-extinction ratio (the focus of this article) and the density ρ (not investigated here).
For spherical particles, the total aerosol concentration (mass per unit volume) can be expressed as shown in Eq. (1):
where ρ is the density of the particles, V is the total particle volume per unit volume of air, r is the radius of the particles assumed to be spherical, and n(r) is the particle number size distribution function, and to assume the number of particles per volume and unit radius interval. The aerosol extinction coefficient α, representing the scattering and absorption per unit volume, is expressed as shown in Eq. (2):
Here, is the mean extinction efficiency for spherical particles (subscript s) weighted by surface area. It can be expressed as follows:
where qext(r) is the extinction efficiency for spherical particles of radius r, as computed with Mie theory (Lorenz, 1890; Mie, 1908; Van de Hulst, 1957). It is important to note that the extinction efficiency is dependent upon the refractive index and the ratio between the particle circumference and the wavelength of light (i.e., the size parameter). For spheres, it is typically between 0 and 5, and it has a typical oscillatory behavior with particle size, tending to 2 in the geometrical optics limit (large particles compared to the wavelength). By combining Eqs. (1) and (2), the specific extinction is expressed as the ratio between α and M:
where ζ is the volume-to-extinction ratio, the focus of this article, has units of length, and can be expressed as follows:
In Eq. (5) reff,s is the effective radius, i.e. the ratio between the third and the second moments of the PSD:
For non-spherical particles, the definitions of reff and can be in general reformulated to:
and
following Schumann et al. (2011), where Vp(r) and Ap(r) are the particle volume and particle projected area, respectively, averaged over different particle orientations, qext(r) is the ratio between the cross-section and the projected area of the particle, and r is a measure of the particle size. The factor ensures consistency with Eq. (6) for spherical particles. Several definitions are possible for r as outlined in Schumann et al. (2011) (e.g., the maximum dimension): amongst those, Gasteiger et al. (2011) retains the projected-area equivalent radius rc (also called the geometric cross-section-equivalent radius) and the volume-equivalent radius rv. Following the latter paper's Eq. (11), the expression for ζ can be formulated using an additional parameter Ψ, the sphericity:
with Ψ defined as
For particles that are not spherical, Ψ<1, whereas Ψ=1 is in the case of spheres (consistent with the general concept introduced by Wadell, 1935).
The volume-to-extinction ratio is a measure of how the volume of particles relates to their extinction properties, and it is important for understanding how particle size affects the overall optical properties of aerosol populations. From Eq. (9), it becomes evident that an increase in reff in the Mie and geometric optics regime leads to an increase in the volume-to-extinction ratio, assuming other factors (such as the extinction efficiency) remain constant. Figure 1 illustrates the relation described in Eq. (9) for the refractive indices of water, mineral dust and black carbon in the case of different sphericities, at 532 nm. The particle number distribution n(r) used here is based on Eq. (18) (Sect. 4.3.3) for n0=100, σ=1.5 and r0 ranging between 0.01 and 100 µm.
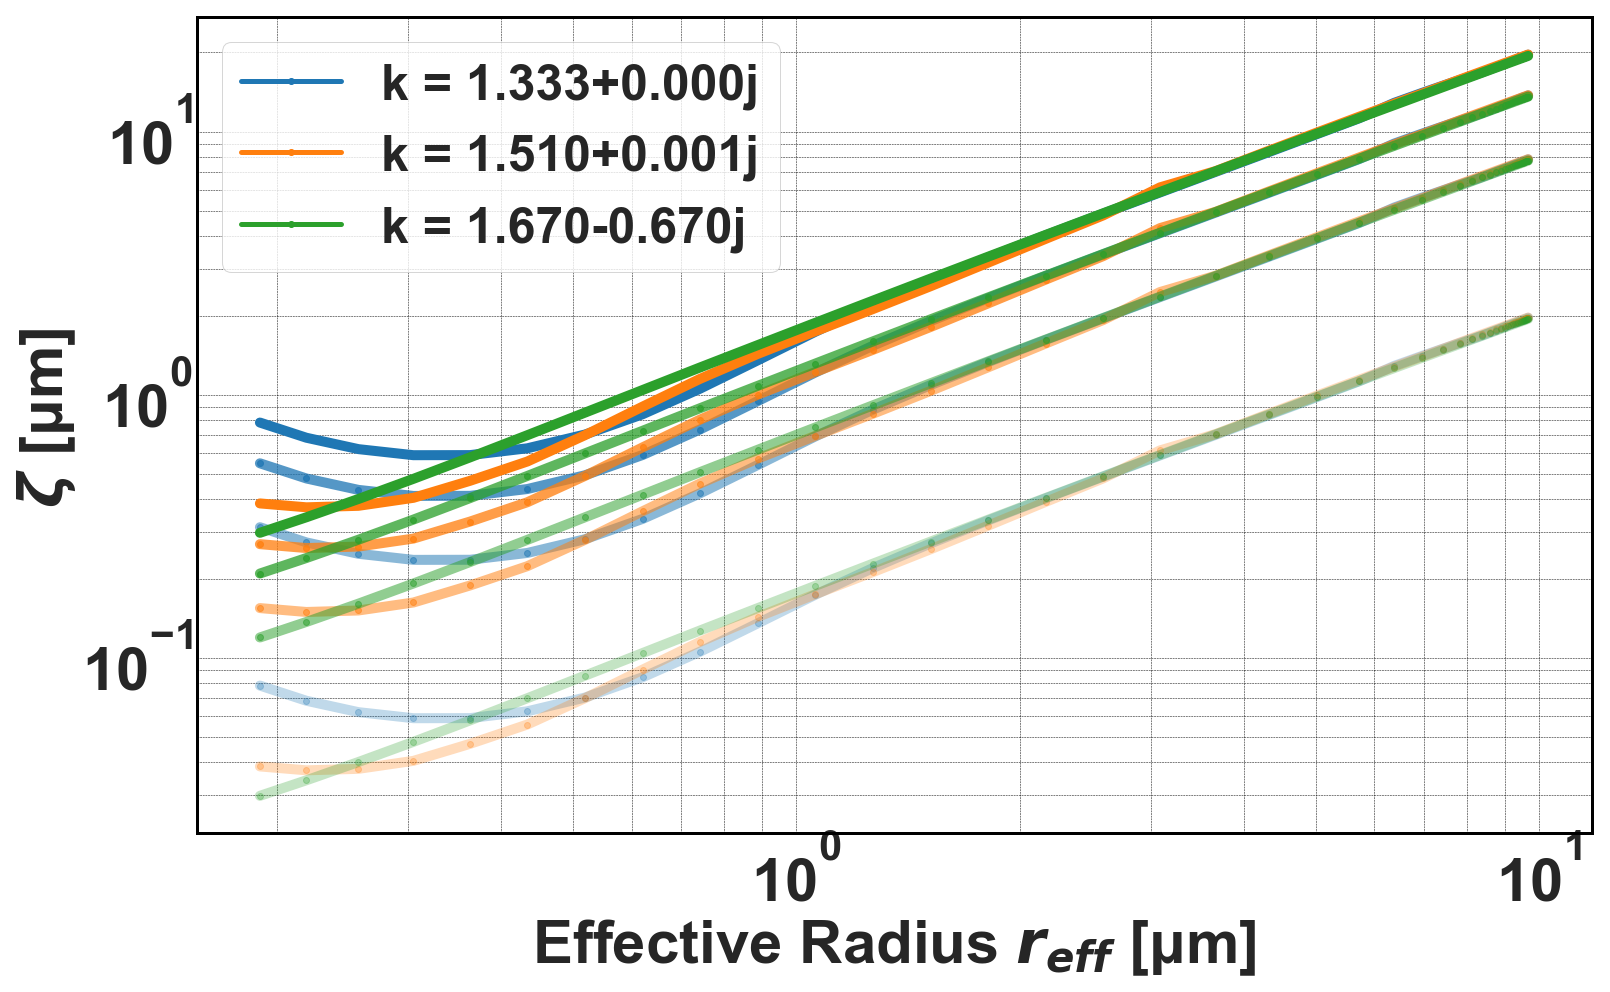
Figure 1Theoretical relation between volume-to-extinction ratio (ζ) and effective radius (reff) at 532 nm, for a selected range of refractive indices (k): water (blue), dust (orange) and black carbon (green) (as in Seinfeld and Pandis, 2006; Di Biagio et al., 2019; Zhao et al., 2020). Transparency is changing for changing sphericity Ψ = (0.1,0.4,0.7,1) with more intense colour being Ψ=1.
From the plot, it is evident that the relation is not linear but there is an increase in ζ with increasing effective radius, except for small effective radii.
When considering larger particles where , Eq. (9) is simplified as in geometric optics and ζ becomes:
For larger particles, their volume increases more than their ability to scatter and absorb light, and thus the volume-extinction ratio also increases. In the geometric optics regime the relation between ζ and reff is linear. In this study, the instruments observed particles with radii ranging from 0.06 to 30 µm, covering a range that includes both the Mie scattering and geometric optics regimes, considering a wavelength at 532 nm.
3.1 Campaigns
3.1.1 Fall Campaign
The Cyprus Fall Campaign 2021, conducted from 18 October to 18 November 2021, in Orounda, Cyprus, aimed to investigate the microphysical properties of mineral dust transported over Cyprus through airborne in-situ and ground-based remote sensing observations. Using UAVs equipped with OPS instruments, in-situ particle measurements were conducted, capturing a wide range of particle sizes. The UAVs also carried the Compact Optical Backscatter Aerosol Detectors (COBALDs, data not utilized in this paper) and the Giant Particle Collector (GPaC), a miniaturized body impactor designed for UAVs to collect super-micron particles. Data acquired during these flights allowed to calculate total number concentration and volume size distributions. The results of the UAV observations during the Cyprus 2021 Fall Campaign are reported in Kezoudi et al. (2025). The microphysical characteristics of dust were captured from two major global sources (North Africa and the Middle East). In particular, Middle Eastern dust was found to have a more pronounced fine particle mode than dust from North Africa. This finding, in agreement with the results of Teri et al. (2025), can be interpreted as evidence of a dusty mixture with anthropogenic particles when referring to dust originating from this source region.
In addition to these airborne in-situ observations, ground-based remote sensing measurements were conducted at the Cyprus Atmospheric Observatory (CAO, https://cao.cyi.ac.cy/, last access: 23 December 2025) of the Cyprus Institute (CYI) in Nicosia (CAO-NIC) and Agia Marina Xyliatou (CAO-AMX). These included a dual-wavelength polarization lidar (CE376) capable of detecting altitudes up to 18 km, and sun-photometers (CE318, CE318T) for measuring columnar aerosol properties like AOD and Ångström exponent. Together, the airborne and remote sensing measurements provided valuable insights into the vertical distribution and optical properties of dust transported to Cyprus.
3.1.2 ASKOS Campaign
ASKOS (Marinou et al., 2023), the ground-based component of the Joint Aeolus Tropical Atlantic Campaign (JATAC), a campaign organized by the European Space Agency (ESA) and the National Aeronautics and Space Administration (NASA), was implemented by the National Observatory of Athens (NOA) in 2021–2022 in São Vicente, Cabo Verde, to provide reference measurements for calibrating and validating the aerosol products of the Aeolus satellite mission (Fehr et al., 2023). Additional scientific objectives were to study possible dust orientation in the atmosphere, quantify the dust interactions with water vapour, investigate the mixing and transport of giant particles in the Saharan air layer and boundary layer, characterize cloud microphysics in the Eastern Atlantic, and analyze the impact of dust particles on cloud formation and radiation. ASKOS utilized advanced instruments such as the multi-wavelength Raman polarization-water vapour lidar PollyXT (Engelmann et al., 2016; Baars et al., 2016), the AERONET sun-photometer, the scanning Doppler wind lidar (HALO), the microwave radiometer, and the 94 GHz cloud radar (FRM4Radar). Aeolus aerosol product Cal/Val was performed with the ESA reference lidar eVe (Paschou et al., 2022). Reference atmospheric electricity sensors, radiosondes and radiation measurements were also deployed. Part of the ASKOS/JATAC campaign was the CYI airborne campaign between 8–30 June 2022, with the deployment of airborne in-situ measurements from OPSs on board UAVs, enriching the dataset for aerosol characterization. Similar to the Fall Campaign 2021, the COBALD and the impactors were also carried by the UAVs.
3.2 Remote sensing observations
3.2.1 CIMEL CE376 Lidar
The CIMEL CE376 is a compact elastic backscatter lidar developed by CIMEL in France. It is a dual-wavelength polarization lidar (Papetta et al., 2024) equipped with a laser diode and a frequency-doubled Nd:YAG laser, operating in the near-infrared (808 nm) and green (532 nm) with pulse energy of approximately 4 and 6 µJ respectively and a repetition rate of 4.7 kHz. It measures backscatter signals in three detection channels, one for the infrared and two for green, co-polar and cross-polar channels. For all the reception channels, the lidar uses photon-counting acquisition through avalanche photodiode detectors (SPCM-AQRH modules from Excelitas). The system has continuous day and night operations with a typical maximum detection altitude of around 10 km for the day and 18 km for the night. The signal is recorded in 2048 successive bins spaced by 15 m in the vertical, corresponding to a recording range up to 30 km (technical specifications: https://www.cimel.fr/solutions/ce376/, last access: 23 December 2025).
The CIMEL lidar was installed in September 2021 at CAO-Nicosia, Cyprus and has been running continuously since.
This lidar is part of the ICARE network: Cloud-Aerosol-Water-Radiation Interactions network (ICARE, https://dataviz.icare.univ-lille.fr/lidar_panel/, last access: 23 December 2025).
3.2.2 PollyXT Lidar
PollyXT is a transportable aerosol multiwavelength Raman and polarization lidar type designed for continuous profiling of the atmosphere. The instrument setup has steadily improved from single-wavelength systems (Althausen et al., 2009) to multi-wavelength lidars with near-range and water vapor profiling capabilities (Engelmann et al., 2016). The PollyXT deployed at Mindelo Cabo Verde has the capability to measure particle backscatter and extinction coefficients (with Raman method), and particle depolarization ratio at all three emitted wavelengths of 355, 532, 1064 nm (Gebauer et al., 2024). Furthermore, it has a near-range receiver in the UV and the visible wavelengths (elastic and Raman) and water vapor profiling capabilities (407 nm). Additionally, the dual–field-of-view methodology has been implemented (Jimenez et al., 2020). The depolarization channels enable the differentiation between spherical and non-spherical aerosol particles through particle depolarization ratio (PDR) measurements. Various studies demonstrated PollyXTs potential for aerosol monitoring in Central Asia (Hofer et al., 2017, 2020a, b) and southernmost South America (Jimenez et al., 2020).
In July 2021, the PollyXT lidar system was deployed in Mindelo, Cabo Verde, as part of the ASKOS campaign (Marinou et al., 2023), and it has been operating continuously since its installation, becoming a permanent installation. Also, this PollyXT is part of PollyNET, a network comprising both permanent and campaign-based Polly lidar stations (Baars et al., 2016). The PollyXT measurements are analysed automatically by the PollyNET Processing Chain (PPC; Klamt et al., 2024) and, among others, vertically-resolved aerosol optical properties are derived in near-real-time (NRT). Quicklooks of the products can be found at https://polly.tropos.de/ (last access: 23 December 2025). A short description of the instrument and its performance can be found in Gebauer et al. (2025) and Floutsi et al. (2025), which provide comprehensive overviews of the PollyXT system and its operational capabilities.
3.2.3 Sunphotometer
Sun- and sky-scanning spectral radiometers from the AErosol RObotic NETwork (AERONET; Holben et al., 1998) were co-located with the lidars during both campaigns to collect observations of aerosol properties. AOD, which represents the column-integrated aerosol extinction coefficient and the Ångström exponent are calculated from direct sun measurements. In addition, the sunphotometers collect sky radiance measurements in the almucantar geometry, allowing for the retrieval of a large suite of microphysical and optical properties of aerosol particles, such as volume size distributions and single scattering albedo (Dubovik and King, 2000). The instruments measure across eight spectral bands, ranging from 340 to 1020 nm.
In the Fall Campaign of 2021 in Cyprus, a lunar/sun-sky photometer (CE318T) was colocated with the lidar at CAO-Nicosia, while another photometer (CE318) was deployed at CAO-AMX, a remote site unaffected by urban pollution near the airfield of UAV operations. The sunphotometer in Nicosia was used to constrain the lidar ratio for the retrievals of the extinction and backscatter coefficients (Klett, 1985; Fernald, 1984). The size distributions reported in this paper are derived from the CAO-AMX sunphotometer. During the ASKOS campaign in Cabo Verde, a lunar/sun-sky photometer (CE318T), was employed for observations in Mindelo.
3.3 UAV based observations
The Unmanned Systems Research Laboratory (USRL, https://usrl.cyi.ac.cy/, last access: 23 December 2025) is part of CARE-C of the Cyprus Institute and offers on-site facilities and related infrastructure for research, development, and testing of technologies related to UAVs (Unmanned Aerial Vehicles). USRL owns a private airfield at Orounda [35°5′42.18′′ N, 33°4′54.19′′ E], 327 m above sea level (a.s.l.), with a clear view of the northwestern side of the island (19 km distance from the sea). The airfield's location is strategically selected to be near the CAO-AMX station. UAV-based sensors provided by third parties are employed on board the UAVs. The sensors used in this study are described in the following subsections. Uncertainty estimates for the two Optical Particle Sizers used in this study are provided in Sect. 4.3.2.
3.3.1 Portable Optical Particle Spectrometer (POPS)
The Portable Optical Particle Spectrometer (POPS), is an optical particle counter developed at the NOAA Chemical Sciences Laboratory. It is a lightweight OPS (0.8 kg without battery) designed to be deployed as a balloon-borne instrument or on board UAVs. POPS has a 405 nm diode laser and can measure aerosol number concentration in the diameter range from 0.14 to 3.0 µm. The instrument determines particle size based on the intensity of light scattered by individual particles as they pass through a focused laser beam. The PSD is derived from the number of particles detected in each size bin during a specified period of time (1 s).
Air is drawn into the optical chamber through an inlet, which alters its temperature and, consequently, its relative humidity. Therefore, drying the sampled air is necessary to maintain particles in a known hydration state and to prevent flooding of the chamber when the UAV-POPS system is flown in humid environments. A dryer is installed at the inlet of the instrument for this purpose (Gao et al., 2016). Comparisons with reference ground and UAV-based observations showed that POPS can provide reliable vertical profiles of particle size distribution (Mei et al., 2020). The sampling volume of POPS is based on the sampling flow, which is approximately 3 cm3 s−1.
3.3.2 Universal Cloud and Aerosol Sounding System (UCASS)
The Universal Cloud and Aerosol Sounding System (UCASS) developed by the University of Hertfordshire, is a lightweight OPS (∼ 230 g) designed for use as a balloon-borne instrument, as a dropsonde, or on board UAVs (Smith et al., 2019). The UCASS operates a 658 nm laser diode and determines particle size from the intensity of light scattered by individual particles as they pass through a focused laser beam, assigning them to a number of pre-defined size bins.
Unlike POPS, UCASS is an open-path instrument, meaning that the scattering experiment takes place directly in the atmosphere in ambient conditions. This configuration is essential for observing large particles, as inlet systems typically result in significant losses in the coarse mode before the particles reach the detection volume.
Depending on the configuration mode and the laboratory calibration, UCASS can measure dust in the radius (optical) range between 0.2 and 39.0 µm. Previous studies showed that UCASS airborne particle size distributions and number concentrations were in close agreement with other reference airborne OPSs, e.g. the Cloud, Aerosol, and Precipitation Spectrometer (CAPS, Kezoudi et al., 2021a). During the ASKOS campaign, two UCASS units were mounted on a fixed-wing UAV, one under each wing. The first UCASS covered a size range of 0.3–15 µm for dust particles, while the second spanned 2–39 µm. In the Fall Campaign, two UCASS units were mounted on the wings, with a size range of 0.3–20 µm for both. In this paper, data from both UCASS units are combined. The sampled air volume in UCASS is specified as v=Ax with a sample area of m2 and x=ut the distance covered by the UAV with a known airspeed u (m s−1) during a time t.
3.3.3 Impactors
A modified Giant Particle Collector (GPaC; Lieke et al., 2011) adapted for UAV applications was mounted under the wings of the UAVs. The collection size range of the modified impactor, depends on environmental conditions (air speed, pressure, and temperature). An adhesive carbon substrate is affixed to the impactor head, housed in a casing that allows exposure only during specific flight segments (e.g., when sampling within a dust layer) (Kezoudi et al., 2021a). The impactor substrates are analyzed without further treatment with a Scanning Electron Microscope (SEM; FEI Quanta 400F, FEI, the Netherlands) with energy-dispersive X-ray fluorescence (EDX; Oxford XMax 120, Oxford Instruments, United Kingdom). The SEM is operated in a semi-automated way. First, particles are segmented from the background by image analysis using their backscatter electron intensity, yielding size and shape parameters. Second, at the identified positions, the particles are analyzed under electron bombardment with EDX, yielding the single-particle composition. For more details on the quantification and data analysis scheme, refer to Kandler et al. (2018).
Kezoudi et al. (2025) discusses the collection efficiency of the impactors in comparison with UCASS, and finds that it is near 1 in the size range 4–14 µm in diameter, falling down to much less than that (∼ 10 %) for smaller particles, and decreasing progressively to a similar low efficiency for particles larger than 20 µm. Given that the impactors are not used here to determine the PSD, but rather to determine intensive properties such as the refractive index and the particle shape, this uneven collection efficiency is deemed as acceptable. From the composition, refractive indices are estimated using the approach described in Aryasree et al. (2024). During the Fall and ASKOS campaigns, two GPaC samplers were employed on board the UAV, one on each wing, and were set to open at specific altitude ranges. This paper utilizes the aspect ratios and refractive indices obtained from the samples.
3.3.4 Meteorological parameters
Relative humidity (RH) and air temperature (T) data are recorded during UAV flights. These measurements are obtained with the HC2-ROPCB sensor (from the Rotronic Company) mounted below the aircraft’s wing. A customized 3-D printed probe houses the sensor to protect it from possible shocks and direct solar irradiance while ensuring proper air flow during flight (Kezoudi et al., 2021a).
3.4 Simulation algorithms
3.4.1 MOPSMAP model
The MOPSMAP algorithm by Gasteiger and Wiegner (2018b) (Modeled Optical Properties of Ensembles of Aerosol Particles), based on Fortran, offers a computationally efficient approach for optical modeling with complex aerosol shapes. MOPSMAP considers optical properties of spheres as well as spheroids (prolate or oblate with aspect ratios 1 ≤ AR ≤ 5) and irregular particle shapes in random orientation over a range of sizes and refractive indices. This paper utilizes the MOPSMAP web interface to calculate the optical properties of dust by using as input the wavelength (532 nm in this case), refractive indices (based on impactors and AERONET), shapes (spheroids and spheres), and sizes based on the OPS observations of the PSDs.
3.4.2 WRF-Chem model
The Weather Research and Forecasting regional atmospheric model coupled with chemistry (WRF-Chem) is a fully integrated meteorology-chemistry-aerosol model developed through a collaborative effort led by NOAA/ESRL. WRF-Chem simulates the emission, transport, deposition, mixing, and chemical transformation of trace gases and aerosols, as well as aerosol interactions, photolysis, and their interactions with meteorology (Grell et al., 2005). Additionally, cloud chemistry, aerosol-cloud interactions, and their feedback processes are incorporated into the model (Fast et al., 2006; Chapman et al., 2009).
This study makes use of the Georgia Tech/Goddard Global Ozone Chemistry Aerosol Radiation and Transport (GOCART) dust emission scheme to get the simulated emission, transport and deposition of the dust over the sites of interest. GOCART uses five particle sizes with radius between 0.1 and 10 µm. Aerosol optical properties are calculated using a parameterized Mie theory (Ghan and Zaveri, 2007), adapted for a size-resolved size distribution (Fast et al., 2006; Barnard et al., 2010). Two different setups are used in this study to cover the Cyprus and Cabo Verde cases. The first setup, operated by the CYI, has a model domain extending from 7 to 57° N and from 28° W to 78° E, with a horizontal resolution of 20 km. It also includes the main sources of dust in the Middle East and North Africa. The second setup, operated by NOA, covers a domain bounded between 1.42 and 39.99° N and stretches from 30.87° W to 46.87° E, with a horizontal resolution of 20 km. Both models use 32 vertical pressure levels.
The CYI set-up was tested for 13 different GOCART schemes, testing various combinations of options (Deb et al., 2026). These included nudging (applied to constrain meteorological fields), aerosol-radiation feedback (aer_ra_feedback=0 or 1 to toggle feedback), and prognostic dust treatment (progn=0 or 1 to enable or disable dynamic dust evolution). Only one run was used in this manuscript and had the following settings: aer_ra_feedback=1, progn=1 with nudging of a scale parameter C=0.4 µg s2 m−5. This configuration was selected so that dust emissions are treated as active tracers in the model, undergoing advection, convection, boundary-layer mixing, and deposition, while allowing dust–radiation interactions to influence meteorology through direct aerosol effects. The empirical constant C=0.4 µg s2 m−5 follows (Zhao et al., 2010), who found this value provided realistic AODs over the Sahel, and is consistent with the configuration used for the Eastern Mediterranean and Middle East region in Georgiou et al. (2022).
Here, the focus is on the relationship between the extinction coefficient and the mass concentration of coarse soil-derived aerosols. These parameters are used to calculate the modeled volume-to-extinction ratio and compare it with observations. More specifically, the modeled ζ (Eq. 12) is derived from the simulated total dust mass concentration (“TOT_DUST”, µg m−3), divided by the simulated extinction coefficients for 550 nm (“EXTCOF55”, km−1) and the density ρ. The WRF-GOCART module models the dust PSD using five size bins, with ρ=2500 kg m−3 for the first bin and ρ=2650 kg m−3 for bins 2–5 (Ukhov et al., 2021).
4.1 Case selection
From the two campaigns, some cases are selected where observations were available from OPSs on board UAVs, lidar, and sunphotometers. The first criterion for selection was the availability of these multi-instrument datasets, as they are the basis for applying the described methodology. Additionally, the focus is on cloud-free days to ensure reliable extinction retrievals from the lidar and accurate size distribution retrievals from AERONET. A final criterion was to select cases with a significant amount of particles (AOD > 0.2) and large particles (e.g., dust-dominated cases), to ensure that the observations were made during a well-developed dust event. The cases that meet these criteria are presented in Table 1. Back trajectory analysis using the HYSPLIT model (Stein et al., 2015) revealed the origin of the air masses at the dust layer altitude ranges. Only one case from the ASKOS campaign was included, as the combined requirements for cloudless conditions, AERONET observations availability and UAV observations using both POPS and UCASS significantly limited the number of available cases for applying the methodology. Furthermore, in some cases that met these criteria, changes in the aerosol layer formation between the UCASS and POPS flights prevented the observations from being meaningfully combined.
Table 1Overview of the selected cases during Fall and ASKOS campaigns. The table summarizes the date, campaign name, the dust origin, the take-off and landing times of both POPS and UCASS instruments, maximum reached altitude for both UCASS and POPS, the effective radius reff at the dust layer, the volume linear depolarization ratio (VLDR), the aerosol optical depth (AOD) at stations Agia Marina Xyliatou (AMX), Nicosia (NIC) and Ocean Science Centre Mindelo (OSCM), and the Ångström exponent. Cases marked with (*) are used as demonstration cases in the methodology section. The presented reff is calculated according to Eq. (6).
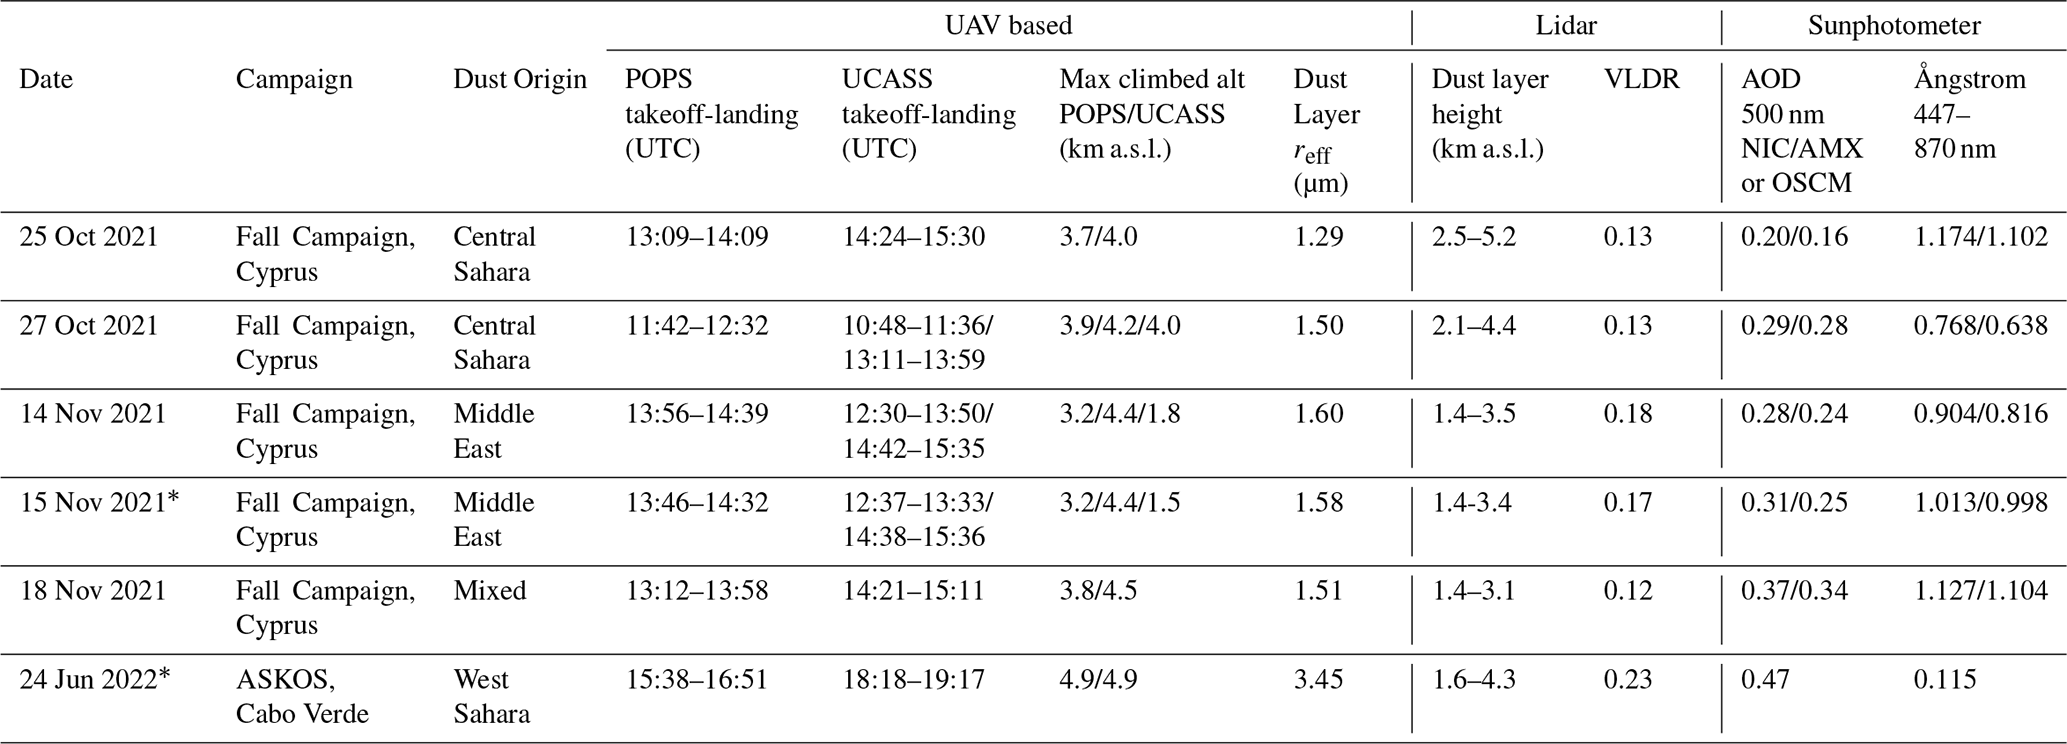
Two selected case studies are used to demonstrate the methodology: (i) 15 November 2021 from the Fall Campaign in Cyprus and (ii) 24 June 2022 from the ASKOS campaign in Cabo Verde (cases with (*) on Table 1) to examine the application of the method for different dust load and origin. As seen in Table 1, the depolarization, AOD, Ångström exponent, reff and vertical depth of the two cases differ significantly, with the second case showing higher AOD and VLDR values and extending over a larger vertical depth. The larger reff observed on 24 June 2024 is not unexpected, as this case from Cabo Verde is located directly along the path of long-range transported dust over the Atlantic carried by the Saharan Air Layer (SAL). Previous studies have shown that large mineral dust particles, with diameters exceeding 30 µm, can remain within the SAL for several days during trans-Atlantic transport before being removed by sedimentation processes (Ryder et al., 2018; Weinzierl et al., 2017). The SAL is typically associated with high aerosol optical depth (AOD) and can extend vertically up to approximately 5 km (Karyampudi et al., 1999; Prospero et al., 2014; Tsamalis et al., 2013). On the other hand, on 15 November 2021, a higher Ångström exponent in combination with the lower effective radius and VLDR values could mean dust mixed with other finer aerosols, which is consistent with a Middle Eastern origin (Teri et al., 2025).
According to HYSPLIT backward trajectory analyses, for the 24 June 2022 event the sampled air masses originated from Mali and Mauritania and traveled for approximately 2–3 d before arriving at Cabo Verde. In contrast, for the 15 November 2021 event, the air masses originated from the Middle East, passing over Iraq, Saudi Arabia, Jordan, and Israel, before reaching Cyprus after about 3–4 d of transport. The backtrajectories for these two cases can be seen in the Appendix A.
4.2 Remote sensing
4.2.1 Lidar observations
Figure 2 shows the 532 nm volume linear depolarization ratio (VLDR) profiles time series for the two demonstration cases. The times of the UAV flights (indicated by the white dashed boxes), of the available size distributions from AERONET (black lines), and of the selected lidar profiles (red box) are also shown in the same figure. It should be noted that the lidar profiles selected for analysis correspond to the times closer to the OPS observations and have no clouds in the profile. Comparing the time series of the two cases, the dust layer on 15 November 2021 appears more vertically homogeneous, extending from the ground up to approximately 3 km. In contrast, the case on 24 June 2022 exhibits a more complex vertical structure, with multiple aerosol layers at different altitudes, and the most VLDR-intense layer located between approximately 3–4 km. The cloud-free lidar profiles within the red box were averaged over time to produce one profile seen in Fig. 3.
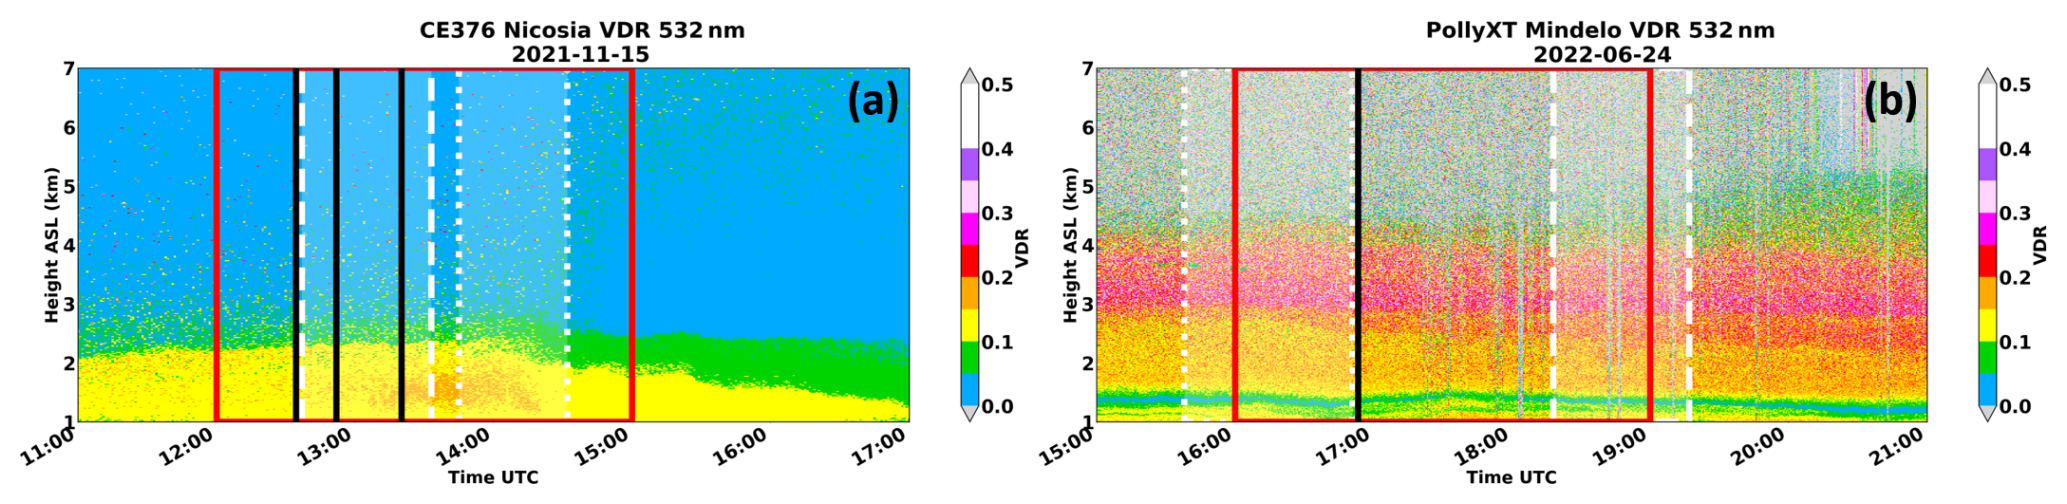
Figure 2VLDR profiles for 15 November 2021 (a) and 24 June 2022 (b). Vertical lines indicate the timestamps of available PSDs from AERONET (black solid lines), UCASS flight time (box with dashed white line), POPS flight time (box with dotted white line), and the chosen lidar interval (red box).
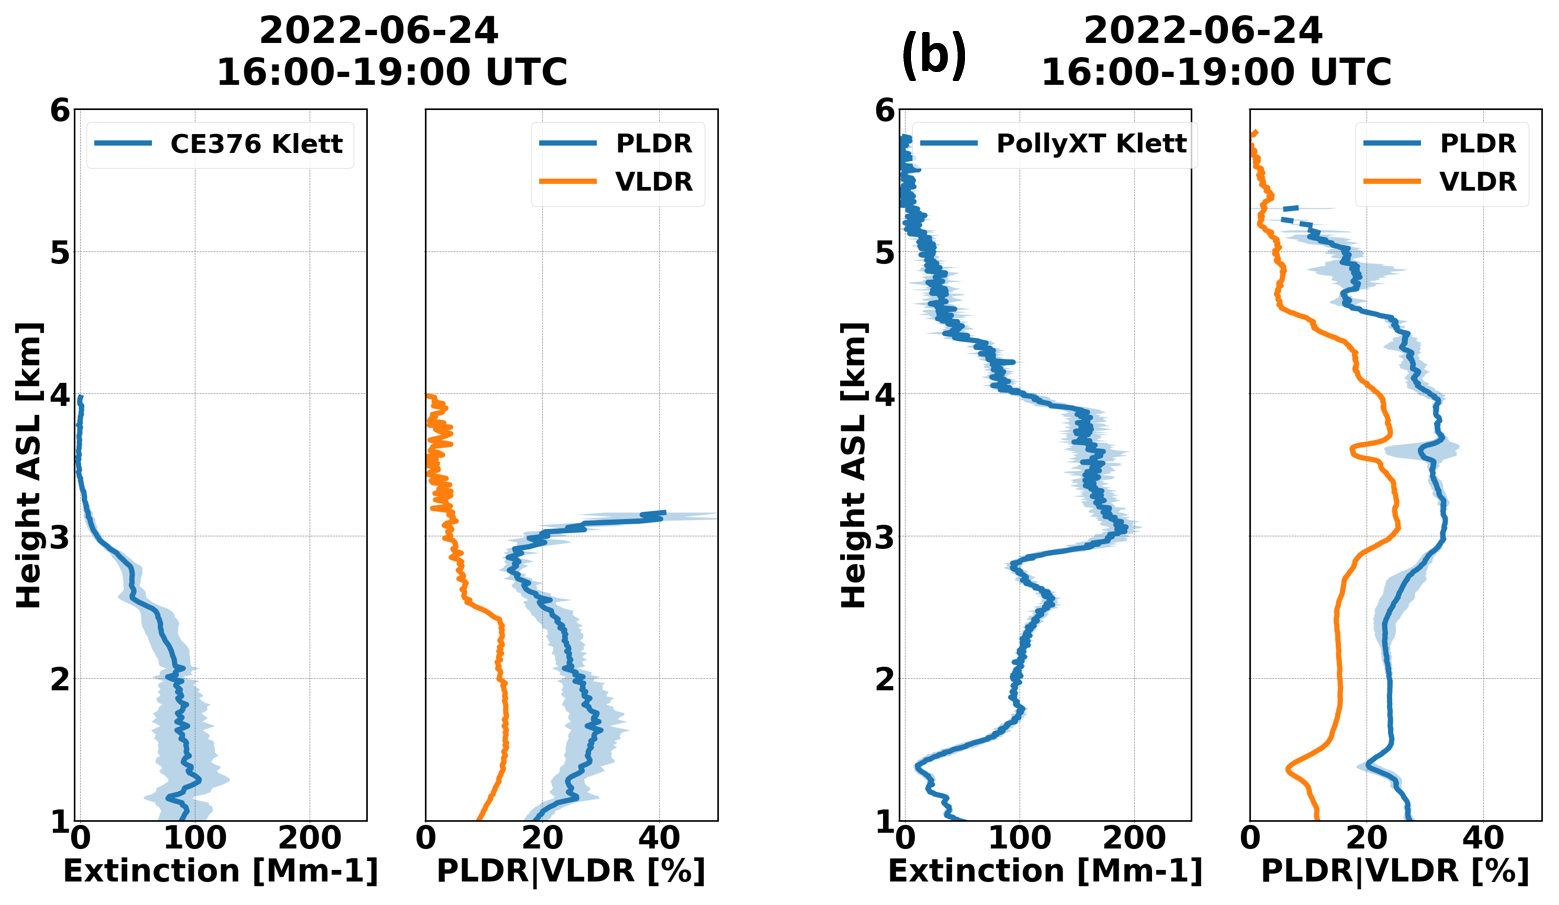
Figure 3Three-hour averaged extinction coefficient, VLDR and PLDR profiles for 15 November 2021 (a) and 24 June 2022 (b). The following reference altitudes (zref) were used for the Klett inversions: (a) zref = 4 km a.s.l. and LR = 35 ± 9 sr; for (b) zref = 5.8 km a.s.l. and LR = 50 ± 7 sr. Shaded areas represent the extinction coefficient uncertainty within the chosen time interval. The PLDR is not shown at low extinction (≤10 M m−1) values due to increased noise levels.
The Fernald–Klett method (Fernald, 1984; Klett, 1985) was used to derive the aerosol extinction coefficient profiles from the lidar measurements (note that Raman data from PollyXT were not available during the daytime). The retrieval was constrained, as in Marenco et al. (1997), using the nearest in time sunphotometer AOD measurements (seen in Table 1), and this constraint was satisfied with a lidar ratio (LR) of 35 ± 9 sr for 15 November 2021 and 50 ± 7 sr for 24 June 2022. The lidar ratio of 50 ± 7 sr found for the ASKOS case agrees well with values typically reported for Saharan dust, which are generally in the range of 50–60 sr (Groß et al., 2015; Haarig et al., 2022). The lower value of 35 sr observed on 15 November 2021 has also been reported in previous studies in the region, and it is considered typical of Middle Eastern dust (Mamouri et al., 2013, 2016; Teri et al., 2025). This low value may indicate that Middle East dust could be a mixture of dust with other aerosol types, such as e.g., anthropogenic pollution, as is expected for this dust source (see Teri et al., 2025). To calculate the LR uncertainty, the simultaneous observations of AOD and lidar signal were repeated at different times during the same day, and the standard deviation was computed. This LR uncertainty was then combined with the statistical uncertainty of the extinction coefficient within the sampling period to obtain the extinction-coefficient uncertainty shown in Fig. 3.
The extinction coefficient and VLDR profiles as well as the particle depolarization ratio (PLDR) for the two cases are shown in Fig. 3, which help confirm the altitudes of the dust layers listed in Table 1. As mentioned before, the 24 June 2022 presents higher extinction coefficients, PLDR and VLDR for the particles than the 15 November. These extinction profiles are used further in the analysis for the calculations of the ζ ratio. The VLDR and PLDR is shown here for qualitative purposes (i.e. aerosol typing), but they are not further used in the data analysis.
4.2.2 AERONET
The columnar volume size distribution, (in µm3 µm−2), where “log” refers to the natural logarithm (as throughout the remainder of this paper), is retrieved from AERONET at 22 logarithmically equidistant discrete points, denoted as ri for radius, within the size range 0.05 µm ≤ ri ≤ 15 µm. For this analysis, level 1.5 data were used (cloud-screened and instrument-controlled). To ensure higher retrieval accuracy, only PSDs with sky-radiance fitting error (sky error, i.e., the normalized root-mean-square discrepancy between measured sky radiances and those simulated by the inversion for the same geometry and wavelengths, Dubovik et al., 2002) of less than 5 % are included. The estimated accuracy of AERONET AOD product is estimated to be ± 0.02 (Holben et al., 1998) whilst for the retrieval products the uncertainty depends on the aerosol load (Sinyuk et al., 2020), being up to 35 % for radii between 0.1 to 7.0 µm while uncertainties rise up to 100 % for particles beyond these sizes (≤ 0.1 and ≥ 7 µm) (Dubovik and King, 2000; Dubovik et al., 2002). Figure 4 provides the column-averaged PSDs from the two demonstration cases used. The figure shows the PSDs retrieved by AERONET and their limited temporal variability during the day for the Cyprus case (temporal variability is not illustrated for the Cabo Verde case due to insufficient observations). Most importantly, it highlights that the size distributions for these two cases differ substantially. The PSD from 15 November 2021 shows a similar magnitude of the peak volume size-distribution for the fine and coarse modes. The significant contribution of the fine mode could indicate the presence of fine dust or a mixture of dust with other aerosols, which also aligns with the higher Ångström exponent for that case. The PSD from 24 June 2022, is dominated by coarse-mode particles, which, considering also the lidar observations, are non-spherical dominated.
When multiple size distributions are available within the time interval considered, an average distribution is computed and used in the analysis to reduce variability and enhance data reliability.
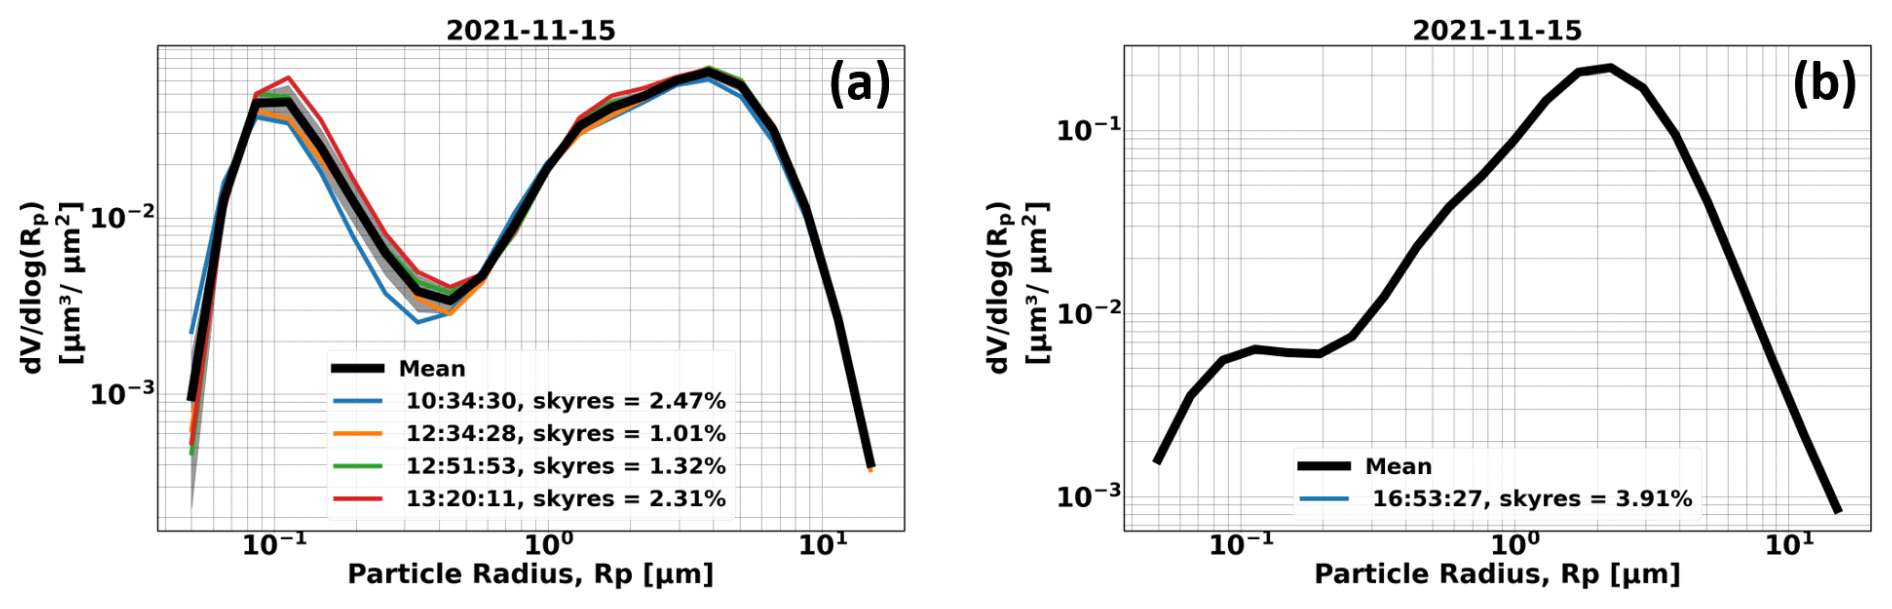
Figure 4AERONET column-averaged volume size distributions (colored lines) for 15 November 2021 (a) and 24 June 2022 (b). The average size distribution (black line) and its standard deviation (grey shaded area) are shown for the case with more than one size distribution in the considered time interval.
4.3 OPS observations
The first step when using the OPS observations is the data filtering. First, cloud screening is applied by discarding all observations for which the relative humidity exceeds 90 % and the particle counts per second at each bin are above a threshold given by the manufacturer (UCASS: 1000 counts s−1 and POPS: 5000 counts s−1). Additionally, to ensure optimal particle sampling for UCASS, only observations when the aircraft flew at an airspeed between 4 and 16 m s−1 are accepted. The values not passing these criteria are omitted. For both POPS and UCASS the UAV ascent rate is ∼ 1 m s−1 and the sampling frequency is 1 Hz. In order to use the same vertical grid for both observations, the data from both instruments are resampled to produce a 10 m vertical resolution. This process results to approximately 10 raw observations for each resampled altitude: these measurements are averaged to produce a single datum.
Figure 5 shows temperature and relative humidity profiles during the UAV flights on 15 November 2021 and 24 June 2022. This figure highlights the atmospheric conditions encountered during the flights and illustrates how the atmospheric quality criteria are applied. Red and yellow points represent data filtered based on the humidity and airspeed criteria, respectively, as outlined above. In one case, the main reason for excluding data was the airspeed being outside the acceptable range (15 November 2021), while in the other, it was due to high humidity (24 June 2022). In both cases, the filtered data points were less than 20 % of the total data.
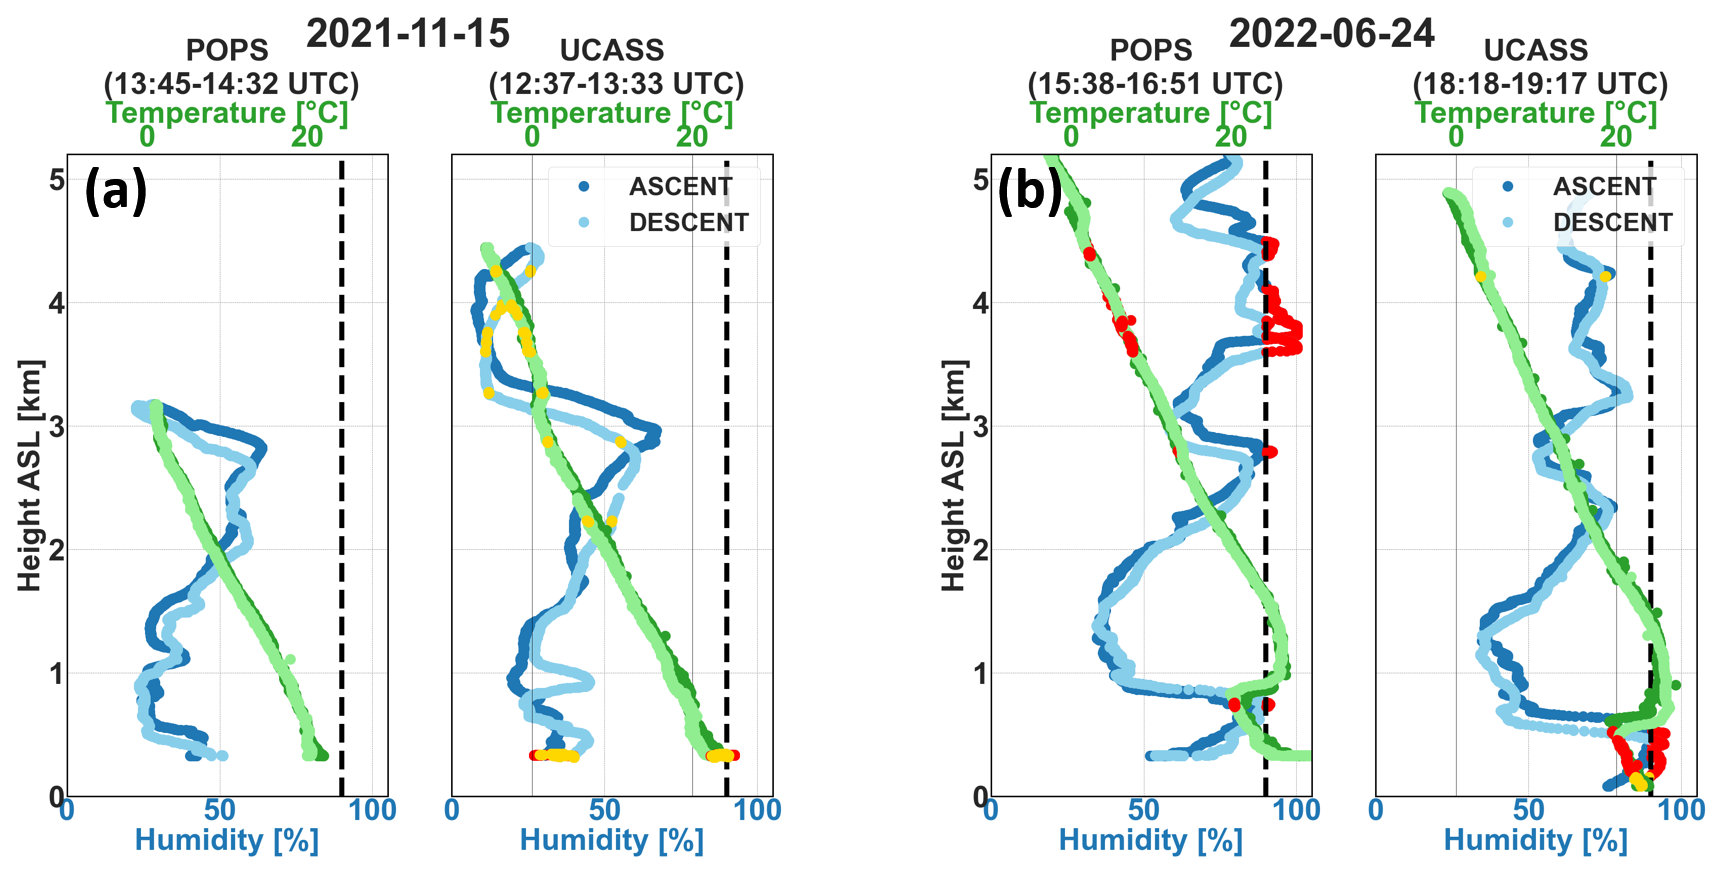
Figure 5Temperature (green) and humidity (blue) profiles measured during the UAV flights on 15 November 2021 (a) and 24 June 2022 (b) during ascent (dark blue and green) and descent (light blue and green). Red marked points indicate the discarded observations due to the RH criterion (<90 %) and the yellow points the discarded observations due to the airspeed threshold (>4, <16 m s−1). The dashed line marks the 90 % humidity threshold.
This figure also allows the identification of atmospheric layers. For example, on 24 June 2022, a strong thermal inversion and a sharp reduction in relative humidity mark the top of the marine boundary layer at approximately 600 m a.s.l. Just above the MBL top, a warm layer with temperatures exceeding 25 °C is observed. The relative humidity within the Saharan Air Layer also exhibits a layered structure, with layers between 1.5–2.5 and 2.8–3.5 km, which correspond well with the extinction layers observed for the same date in Fig. 3. Furthermore, between 15:38 and 19:17 UTC, the vertical structure remained more or less unchanged, although a downward subsidence of all layers by approximately 400 m is evident, as also seen in Fig. 2.
For the case of 15 November 2021, similar to the Cabo Verde case, the atmospheric conditions remained relatively stable between 13:33 and 14:32 UTC. In the Cyprus humidity profile, a layer is observed in the RH profile between 1 and 3.2 km a.s.l., which is consistent with the layers seen on the extinction profile Fig. 3 for the same date. In this case, a smaller downward displacement of the layers, of approximately 200 m, is observed.
4.3.1 Concentration calculations and PSD
The next step is to calculate the number concentration profiles from the count measurements of the two OPSs. To ensure consistency between the sensors, the observations are resampled into 10 m deep layers, providing uniform profile resolution. The ascent and descent profiles for each OPS (POPS, UCASS-1 and UCASS-2) are combined by calculating the average of the two profiles for each 10 m segment. The particle concentration () at a given altitude z and each size bin of radius ri (which is the geometric mean of the bin edges) is then calculated using the following equation:
where countsz,i represents the count of particles within the ith bin and vol is the sampling volume of the instrument at altitude z. The sampling volume varies for each instrument, with distinct values for POPS and UCASS as described in Sect. 3.3.1 and 3.3.2. The total concentration at each altitude can then be calculated by summing up all the bins as:
Figure 6 illustrates the total concentration profiles averaged between ascent and descent for the two case studies (15 November 2021 and 24 June 2022), with the standard deviation shown with the shaded regions. The concentration profiles follow the same trend as the extinction coefficient profiles shown in Fig. 3, and the layers discussed in Sect. 4.3 are also evident here.
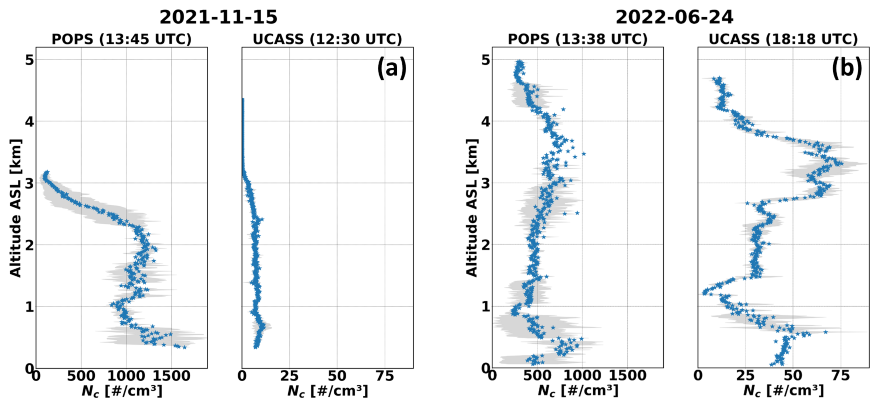
Figure 6Number concentration profiles for 15 November 2021 (a) and 24 June 2022 (b). The grey shaded area indicates the standard deviation in concentration between ascent and descent profiles.
Using the number concentration , the particle volume size distribution (PSD) can be expressed as follows:
The volume-weighted distribution can be calculated by scaling by dlog (ri) that represents the logarithmic bin width. Figure 7 shows the volume and number particle size distributions for the two case studies, for different altitude ranges, to assist the description of the methodology, which uses height-resolved particle size distributions to calculate the volume-to-extinction ratio. This figure highlights the vertical variability of the size distributions in both cases. To assist the reader in understanding how the two OPS are combined to retrieve the full size distribution, data from POPS and UCASS are plotted as circles and triangles, respectively.
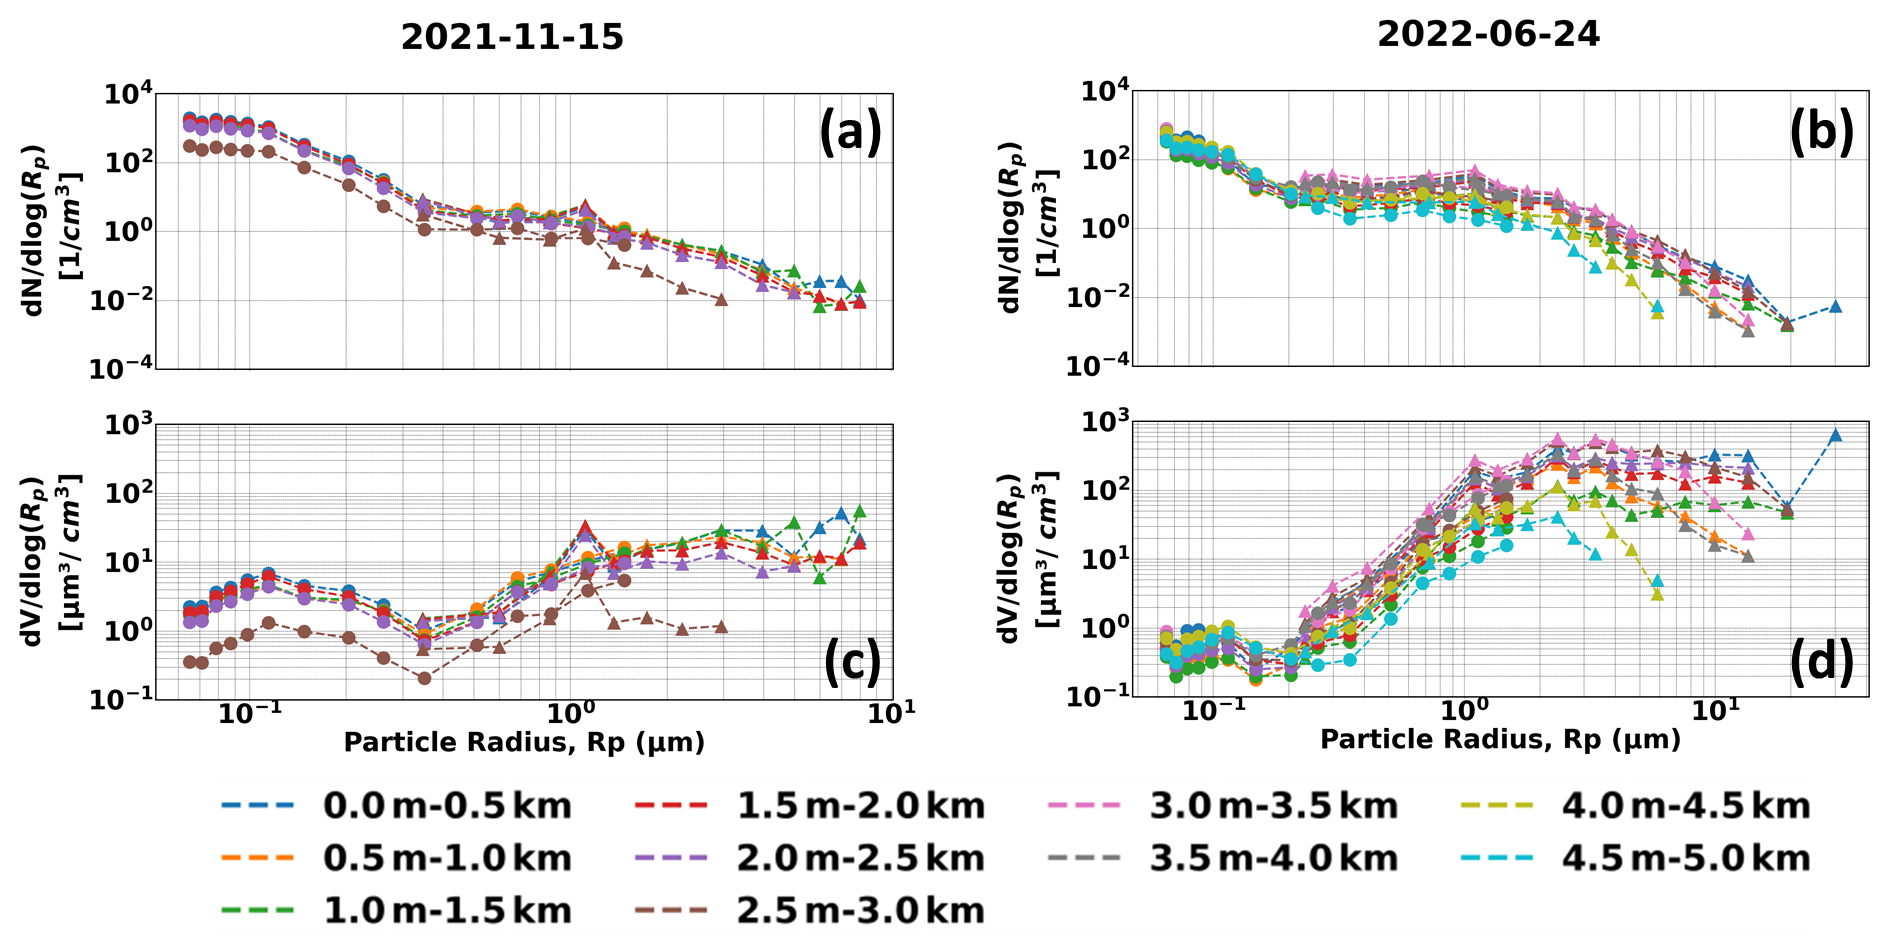
Figure 7Volume and number particle size distributions for 15 November 2021 (a, c) and 24 June 2022 (b, d) at different altitudes from ground level. Circle points indicate the measurements by POPS, whilst triangles are the measurements from UCASS. The maximum altitude reached by the UAV was 3 km and 4.5 km a.g.l. on 15 November 2021 and 24 June 2022, respectively.
The PSDs differ significantly between the two cases. On 15 November 2021, both fine and coarse modes are pronounced as was seen also in Fig. 4, with concentrations having fewer coarse particles above 2.5 km. In contrast, the volume PSDs on 24 June 2022 are dominated by the coarse mode fraction, with minimal contribution from finer particles. Interestingly, for this case, particles with radii larger than 10 µm are observed by the OPSs up to 4 km above ground level. This giant mode contribution had also been observed during previous airborne campaigns, including the SAMUM-1 over Morocco, Fennec campaign over the Saharan desert, AER-D campaign off the west coast of Africa, and SAMUM-2 and SALTRACE at Cabo Verde (Ryder et al., 2013, 2018; Kudo et al., 2021; Weinzierl et al., 2009, 2011, 2017).
To create a comprehensive PSD, measurements from the three sensors (POPS and 2 UCASS) are combined by merging all size bins and fitting a lognormal distribution.
4.3.2 Uncertainties associated with OPS observations
The uncertainty of OPS observations includes two components: statistical (counting) uncertainty and uncertainty in the estimation of the sample volume.
Statistical uncertainty arises from the number of particles counted during a given sampling period. It depends on both the sampling duration and the particle number concentration in each size bin and can be described using Poisson statistics: .
For open-path instruments such as UCASS, the sample volume is estimated as vol=Avt, where A is the sampling area ( m2), v is the aircraft speed (typically 10–12 m s−1, measured via pitot tube), and t is the sampling time. The relative uncertainty in particle number concentration is then given by:
where and represent relative uncertainties in area and speed, which are approximately ∼2 % and ∼5 % respectively.
For POPS, the sample volume is determined by the flow rate of the internal pump: vol=Qt, where the flow rate Q is approximately 2.9 cm3 s−1, as recorded by the instrument. This flow is monitored using a laminar flow element (LFE) and a differential pressure (DP) sensor. The LFE-DP system has an associated uncertainty of approximately 5 % (Gao et al., 2016). Considering these, the relative uncertainty of particle number concentration for POPS is:
Considering Eqs. (16) and (17) for counts = 10, the relative uncertainties are dominated by the statistical components and are in both cases ∼32 %. From the equations, it is obvious that the relative uncertainties will approach a minimum value (∼5 %) as the number of counts approaches infinity. These uncertainties can be propagated to the volume concentration used for the volume-to-extinction calculation, resulting in the uncertainties seen in Fig. 10.
An additional source of uncertainty for both UCASS and POPS is related to the particle diameter corresponding to each bin, which depends on the optical properties of the particles. This study relies on manufacturer-provided sizing calibrations for the two instruments (Smith et al., 2019; Gao et al., 2016). In addition, the UCASS units used in this study were part of the instrumentation at the ACTRIS pilot calibration week held at Institute of Chemical Process Fundamentals, Czech Academy of Sciences, in Prague, 2025, during which the accuracy of the UCASS size-bin settings was confirmed. Particle sizing also depends on the refractive index (RI) of the aerosols: UCASS calibration for dust RI () is provided by the manufacturer, while POPS is calibrated using polystyrene latex (PSL) spheres and dioctyl sebacate (DOS), with refractive indices of for PSLs and for DOS (Gao et al., 2016). In order to correct for the RI in the case of POPS, Mie scattering calculations are performed, and the correction is ∼4 % on the diameter for dust RI (). For POPS size bins below 1.22 µm, this results in a diameter correction of less than 0.05 µm, and up to 0.1 µm for bins above 1.22 µm. Given the small magnitude of this correction and its impact on the volume concentration, it is not applied to the POPS data and can be considered negligible. In addition to these calibration-related uncertainties, a previous study by Kezoudi et al. (2021b) found that in one case UCASS-derived extinction coefficients were about a factor of two larger than those retrieved from Raman lidar observations in layers with high particle number concentrations. This difference was attributed to spatial inhomogeneities, as the two instruments sampled slightly different air masses and not to a calibration issue. For the 24 June 2022 case in Cabo Verde, where larger particles were observed, UCASS and PollyXT lidar–derived extinction coefficients were consistent. This agreement provides additional confidence in the UAV-based particle size distributions used in this study.
4.3.3 Lognormal fits
Lognormal fits are widely used as they tend to provide the best representation for most airborne particle size distributions and they smooth out sensor noise. Their simplicity and ability to combine various modes to describe PSDs shapes make them a standard choice in aerosol research and related fields (Pöhlker et al., 2023; Boucher, 2015; Kulmala et al., 2012). The lognormal distribution is characterized by the geometric mean radius Rg and the geometric standard deviation σ, which allow for the representation of both single-modal and multi-modal size distributions (Heintzenberg, 1994).
In this study, a bi-modal lognormal fit is applied to describe the PSDs. Using two lognormal modes, the observations of the chosen flight dates (Table 1) were fitted at 500 m averaged vertical layers.
For a multi-modal distribution, with coarse and fine modes, the following lognormal model is used:
where Ni is the total number concentration of particles, of mode i, Rg,i is the geometric mean radius of the mode, and σi is the geometric standard deviation of the mode.
The fitting process accounted for all the data from the two UCASS and the POPS instruments to provide a combined smoothed range PSD as the examples shown in Fig. 8a, c and b, d, representing measurements taken on 15 November 2021, and 24 June 2022, respectively, for 1.5–2 and 2–2.5 km range. This includes, therefore, using the data from two instruments within intervals where measurements overlap. In these two examples, a bimodal (n=2) lognormal was fitted to the data using a non-linear least-squares approach on the particle number distribution values as a function of radius. The fitting routine minimizes the squared residuals between the observations and the modelled function (Eq. 18). The corresponding Rg,i and σi are provided in the legends of the plots. The quality of the fit is assessed using the standard errors of the fitted parameters (i.e., the square root of the diagonal elements of the covariance matrix returned by the fit), together with a visual inspection to identify and exclude potential outliers that could bias the results. For the two cases shown in Fig. 8, the fitted distributions and their uncertainty envelopes lie within the measurement variability of the OPS instruments, providing a reliable representation of the measurements.
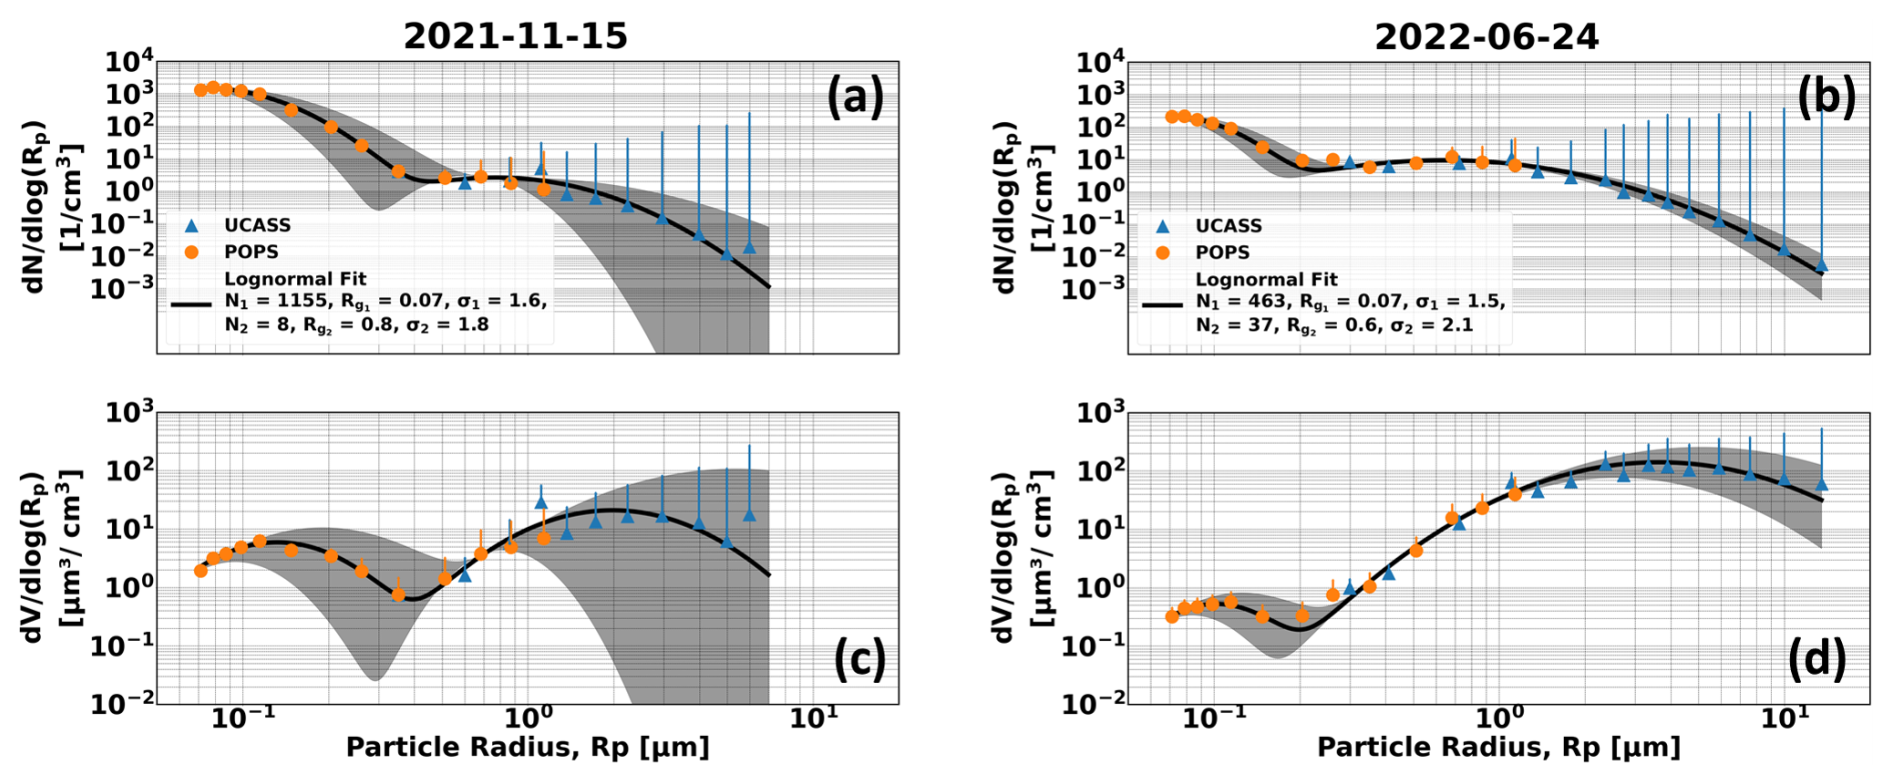
Figure 8Number and volume size distributions for 15 November 2021 (a, c) and 24 June 2022 (b, d) at layers 1.5–2 and 2–2.5 km a.g.l. respectively. Bi-modal lognormal fit on the data is seen with the black line. Shaded area shows the lognormal fit error. Line error bars represent the standard deviation of the number and volume size distributions in the selected altitude range (only positive error bars are shown for visual purposes). The fitting parameters for each mode of the lognormal are seen in the legend.
The fitted distributions are subsequently used to derive the column-averaged OPS PSDs and to provide input for the scattering simulations in MOPSMAP.
4.4 Comparison of PSDs
Given the differences in how the PSDs from AERONET and UAV-based measurements are expressed, it is essential to convert them to comparable units for a meaningful comparison. The AERONET PSD is column-integrated, expressed in units of µm3 µm−2. In contrast, the PSDs acquired from OPSs on board UAVs are vertically resolved and expressed in units of µm3 µm−3, reflecting the volume concentrations at specific altitudes.
One way to compare these different PSDs is to create column-integrated PSDs from the UAV observations. The column-integrated PSDs are calculated as:
for each size bin (r), where dz represents the height difference (10 m) between consecutive UAV-based observations. zmin and zmax represent the minimum and maximum observed dust layer altitude.
Figure 9 compares the AERONET and column-integrated OPS PSDs for the two cases 15 November 2021 and 24 June 2022. In the first case, on 15 November 2021, the observed size distributions from the UAV-based measurements closely follow the AERONET PSD over the 0.1–5 µm size range. Across most radii, the two curves fall within each other's uncertainty envelopes, indicating that the observed differences are not statistically significant. A small deviation is observed at the fine mode particles <0.2 µm where AERONET exhibits more fine particles than the UAV-based observations.
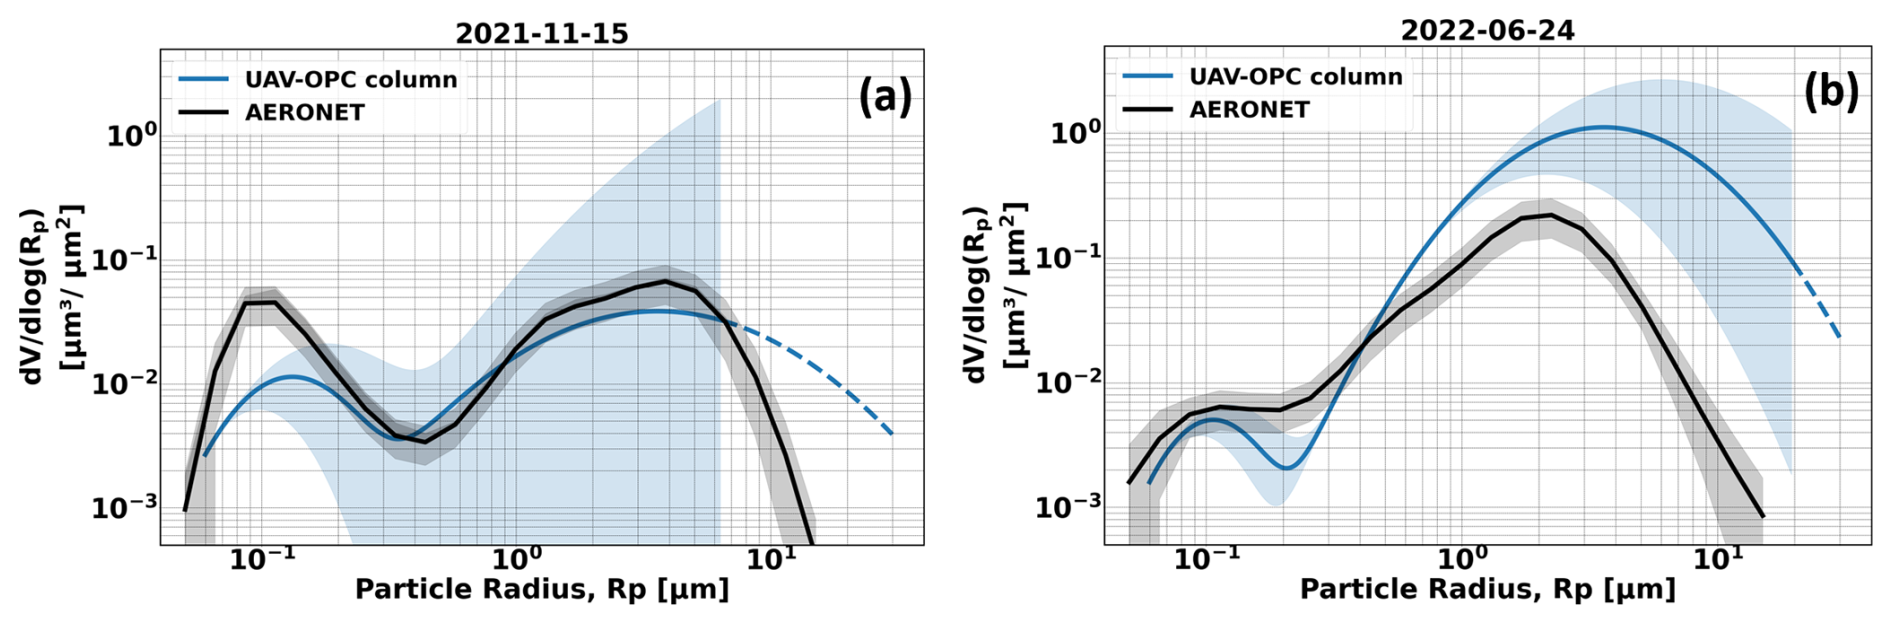
Figure 9Column-integrated volume size distributions acquired with OPSs on board UAVs, compared to AERONET for 15 November 2021 (a) and 24 June 2022 (b). The blue shaded area indicates the uncertainty of the fitted lognormal, and the gray shaded area shows the AERONET inversion uncertainties (35 % for 0.1 ≤ r ≤ 7.0 µm and 100 % for r ≤ 0.1 and r ≥ 7.0 µm). The dashed line corresponds to the extrapolated lognormal curve beyond the maximum observed size bin.
The 24 June 2022 case is dominated by the coarse mode, with the UAV-based PSD showing the presence of larger particles that AERONET does not capture. Specifically, UAV-OPS based observations show a coarse-mode peak near 3–4 µm that is roughly a factor of two larger than the AERONET peak. Overall, there is an imbalance between the fine and coarse modes of the two methods, which, considering the uncertainties of both methods is minimal in the fine mode but significant in the coarse mode, as there is no overlap of the two method uncertainty bands in the coarse mode region. This discrepancy could be attributed to different factors. Part of this difference could be attributed to AERONET retrieval algorithm uncertainties and the cut-off at 15 µm, which can not always be realistic for dust aerosols, as seen especially for the second demonstration case. However, uncertainties also exist in the UAV-OPS measurements, both instrumental and statistical, as discussed in Sect. 4.3.2.
In addition to these uncertainties, sampling-related differences between column and in-situ profiling can also lead to mismatches. Even when measurements are closely matched in time and space, remote-sensing products such as AERONET represent a column-integrated average, while UAV-OPS instruments sample discrete layers over a larger area. Such spatial and vertical inhomogeneities can produce discrepancies between in-situ and column-based retrievals of optical properties, as was also shown by Andrews et al. (2017).
5.1 Observed volume-to-extinction ratio
Using the formulation presented in Sect. 2, Eq. (9), the profile of the ζ ratio (volume-to-extinction ratio) is derived by combining the extinction coefficient profile acquired from the lidar measurements, with volume concentration at different heights obtained by integrating the OPS-derived PSDs. Ansmann et al. (2012) provides an overview of the volume-to-extinction conversion factor (ζ), based on observations (airborne, AERONET and lidar) (Johnson and Osborne, 2011; Osborne et al., 2008; Weinzierl et al., 2009; Müller et al., 2013) and models during Saharan dust events (Hess et al., 1998; Barnaba and Gobbi, 2004). In that study ζ typically ranges from ∼ 0.6 to 1.3 µm. A subsequent study by Ansmann et al. (2019b) shows ζ values based on long-term AERONET climatologies collected at desert stations around the globe. Notably, the Limassol (Cyprus) and Sal (Cabo Verde) stations reported ζ of 0.64±0.08 and 0.64±0.07 µm, respectively.
The observed ζ values for the two demonstration cases alongside the range of ζ values reported in the literature are presented in Fig. 10 with a blue line, whereas the shaded area represents the uncertainty. For the 15 November 2021 case, the observed average µm (blue line) between 1.1–3.1 km a.s.l. (dust layers) is approximately ∼12 % lower than the smallest value for dust in the literature. Considering also the uncertainty band of the observations, this deviation is minimal and can be explained by the fact that this case likely does not represent a pure dust event. Conversely, for the 24 June 2022 case, the observed average between 1.6–4.3 km a.s.l., and therefore considering the total dust layer depth, µm, which is similar to the values recorded before in the literature for Western Saharan cases. However, in the 1.6–3.5 km a.s.l. sublayer, where larger particles were more prevalent (see Fig. 7), the observed µm is associated with the observation of giant particles, and it exceeds the literature maximum by more than 70 %. Even though at this height ζ uncertainties approach the upper edge of literature range, the measurements still indicate a significant coarse-mode contribution.
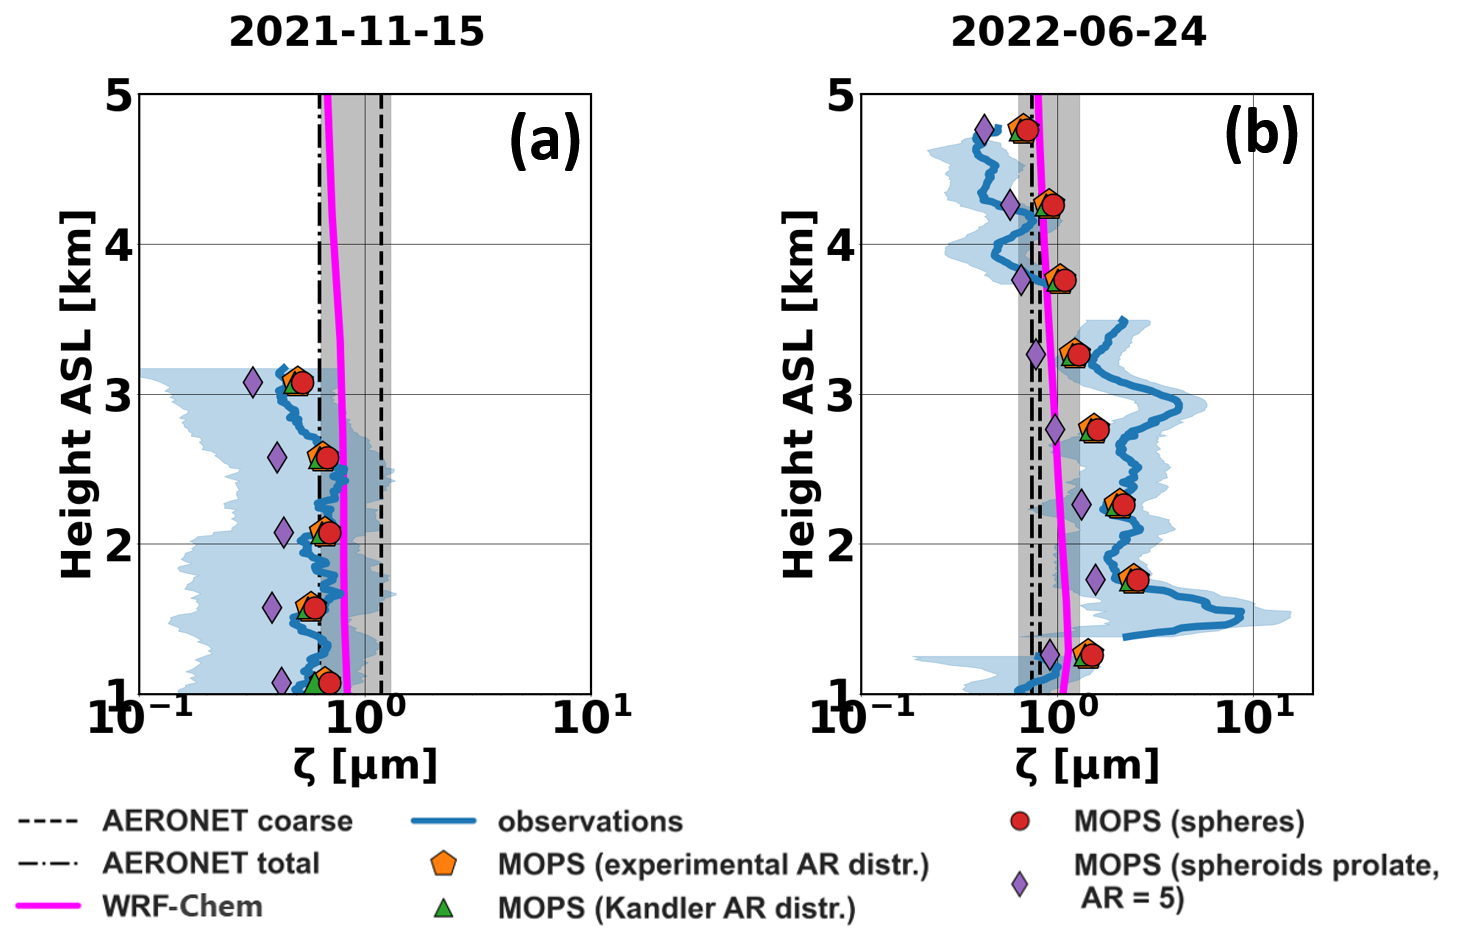
Figure 10Observed ζ ratio (blue line) compared to MOPSMAP derived calculations for different spheroidal aspect ratios (markers) for 15 November 2021 (a) and 24 June 2022 (b). The blue shaded area corresponds to the combined ζ uncertainties, obtained from the propagation of both the extinction and volume concentration uncertainties, as discussed in Sect. 4.2.1 and 4.3.2. The gray shaded area indicates the range of ζ values provided in the literature. The dashed line and dash-dotted lines denote the ζ values derived using the AERONET PSDs for total and coarse aerosols, respectively. The experimental aspect ratio distributions (lognormal) have ϵ=1.45, σ=0.6 and ϵ=1.44, σ=0.6 for 15 November 2021 (a) and 24 June 2022 (b) respectively. The Kandler AR distribution has ϵ=1.45, σ=0.7.
The dash-dotted and dashed lines in Fig. 10 present the AERONET-derived ζ values for total and coarse aerosol fractions on the respective days (calculated with the method given in Ansmann et al., 2012). For 15 November 2021, the observed ζ values agree more closely with the AERONET-derived ζ for total aerosols, which is consistent with the agreement of the PSDs provided by AERONET and OPSS in Fig. 9. In contrast, for the 24 June 2022 case, both AERONET-derived ζ values underestimate the observed values by approximately ∼ 41 % within the 1.6–4.3 km a.s.l. range, with the discrepancy increasing to as much as ∼ 150 % between 1.5–3.5 km a.s.l., where larger particles were more dominant. This discrepancy aligns with the PSD comparison in Fig. 9, indicating that AERONET may underestimate coarse particles (due to the 15 µm limitation) and overestimate fine ones, which in turn affects the volume-to-extinction ratio (see Eq. 9). This highlights the potential inaccuracies of using column-averaged ζ values from AERONET without correcting for these size-dependent discrepancies. The coarse/fine mode imbalance observed on 24 June 2022, characterized by a significantly higher proportion of coarse particles, is the reason for the elevated ζ values.
The MOPSMAP-based calculations of ζ, also shown in Fig. 10, are derived using the fitted lognormal PSDs described in Sect. 4.3.3, and refractive indices obtained from AERONET (for the real part) and SEM analysis of impactor samples collected during the flights (Kandler et al., 2009, 2018) (for the imaginary part) and a number of arbitrary values for the sphericity. The refractive indices used in the calculations were and for the cases 15 November 2021 and 24 June 2022, respectively (which are in both cases close to the climatological RI values for dust from Ryder et al., 2019). The MOPSMAP calculations were also performed for different RIs (real part: 1.52–1.53 and imaginary part: 0.0017–0.0056) with almost no dependency, which was expected due to the existence of coarser particles (geometric optics). Fine particles were modeled as spheres, while coarse particles were modeled as prolate spheroids with different aspect ratios: (i) aspect ratio distribution derived from the impactor samples (using SEM analysis), with ϵ and σ the center and width of the aspect ratio distribution, (ii) aspect ratio distribution from Kandler et al. (2007) (“Kandler AR distr” herein), (iii) spherical particles, and (iv) spheroids with an aspect ratio of 5. AR = 5, is an extreme value only used for comparison purposes. It must be noted that the experimental AR distributions for the two cases were very close to the distribution from Kandler et al. (2007); ϵ=1.45, σ=0.6 and ϵ=1.44, σ=0.6 for 15 November 2021 and 24 June 2022, and ϵ=1.45, σ=0.7 for the Kandler distribution. At low aspect ratios the choice between oblate and prolate had negligible influence on the results.
The MOPSMAP-derived ζ values generally follow the observed profiles, though some differences remain. On 15 November 2021, using the aspect ratio distribution derived from SEM analysis of impactor samples (orange hexagons), the calculations follow well most of the observed profile, except in the 1–1.5 km a.s.l. layer, which is close to the overlap region of the lidar. The results using the Kandler AR distribution (green triangles) and spherical particles (red circles) provide similar values. For 24 June 2022, the observations up to ∼3 km, and above the marine boundary layer, align better with more spherical spheroids, even though differences are large at some altitudes e.g. ∼ 2.3 and ∼ 3.3 km a.s.l. In the upper layers (above 3.5 km a.s.l.), spheroids with an aspect ratio of 5 show a better agreement with observations.
The observed and the simulated ζ are compared to the observations in Fig. 10 for the two demonstration cases on 15 November 2021, during Fall Campaign, and on 24 June 2022 during ASKOS. The WRF-Chem simulation for 15 November 2021, shows good agreement considering the uncertainty of the observations, with simulated ζ values being at the lower part of those reported in the literature. In contrast, for 24 June 2022, the WRF-Chem simulations align well with the ζ values reported in the literature but underestimate the observed ζ. This discrepancy is expected, as the model accounts for particles with radii up to 10 µm, whereas observations indicate the presence of particles exceeding 20 µm during this case as seen in Fig. 9 and as discussed in the previous section.
In Fig. 11 the observed relationship between ζ values and reff for the dates seen in Table 1 is plotted over the theoretical values (blue lines), calculated using Eq. (9), where qext is calculated using Mie theory algorithm with refractive of (derived from SEM analysis of impactor samples). The theoretical lines are shown for different values of sphericity Ψ. The color of the points corresponds to the altitude of the observation, whereas observations within dust layers are marked as stars.
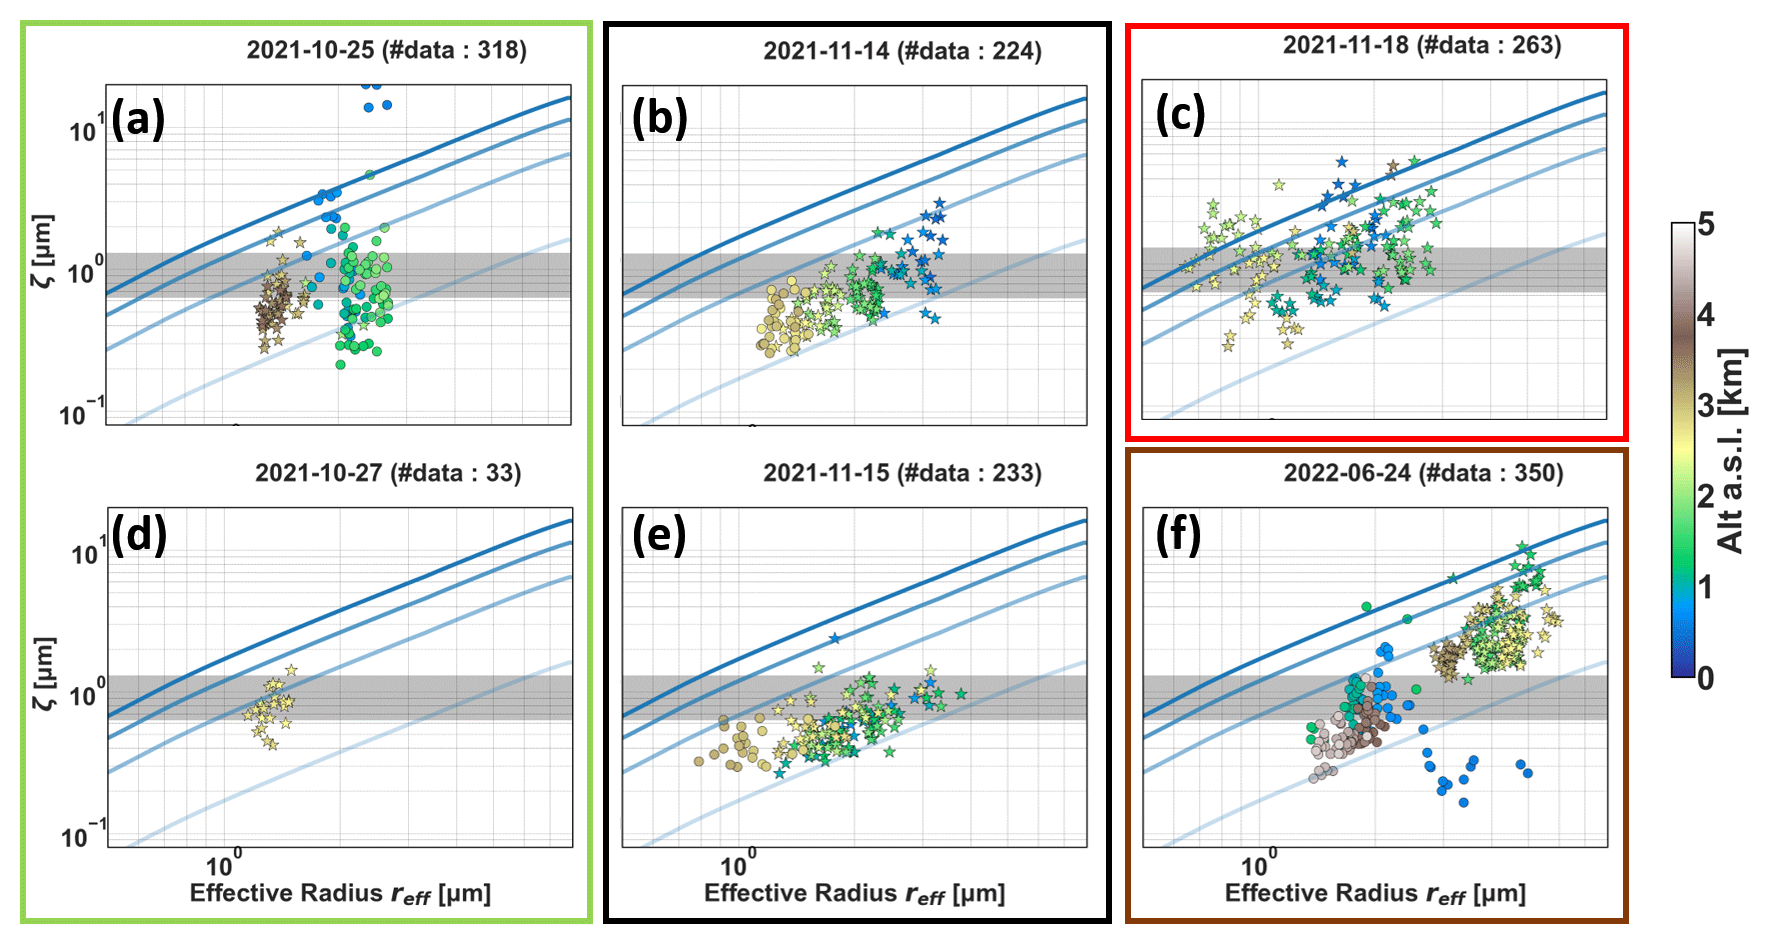
Figure 11Scatter plots of observed ζ vs effective radius for the case studies shown in Table 1. The theoretical blue lines (see Eq. 9) have changing transparency for changing sphericity Ψ = (0.1, 0.4, 0.7, 1) with the more intense being Ψ=1. Point color indicates sampling altitude, and star-shaped markers denote observations within dust layers, as identified in Table 1. Cases are grouped by source region: green box – Central Sahara, black box – Middle East, red box – mixed origin, and brown box – Western Sahara.
For the Central Saharan dust case of 25 October, 2021 (Fig. 11, green box; panel a) the observations lie between the theoretical lines of sphericity with Ψ between 0.1 and 1 with some outliers with high ζ values at lower altitudes (≤ 0.65 km a.s.l.). The observations at the dust layer (∼ 1–3 km a.s.l.) are close to the ζ values provided in the literature for dust particles, which is expected since the latter were mainly derived from Saharan dust cases. Similarly, for the second central Saharan case on the 27 October 2021 (Fig. 11, green box; panel d), the few data in the dust layer (∼ 2.5 km a.s.l.) are within the values provided in the literature and closer to the Ψ∼0.4 sphericity line.
The observations from Middle East dust on 14 and 15 November 2021 (Fig. 11, black box; panels b, e), exhibit comparable characteristics and lie between the theoretical curves with sphericity between 0.1 and 0.4. The same pattern is observed for both cases with ζ and reff values decreasing for increasing altitude.
18 November 2021 covers a wider range of reff and ζ values compared to the other cases. The measurements also span a wide range of potential sphericity, from 0.1 to 1. The color of the data points indicates that the airmasses were well mixed (vertically), as there is no clear dependence of ζ and reff with altitude. It was seen from Table 1 that the Ångström exponent presented the highest values during this day compared to the other cases, suggesting the presence of finer particles in size (something that is also confirmed by the PSDs derived from OPS measurements for this date). This is likely due to the mixing of anthropogenic pollution with dust. Bimenyimana et al. (2025) has shown that the Middle East region is the main hotspot for most PM chemical pollutants measured in Cyprus. According to HYSPLIT back-trajectory analysis for this specific case, the air masses originated from various regions in North Africa, the Middle East, and Turkey.
On 24 June 2022, (Fig. 11f) the highest reff and ζ values are observed among all the days examined, due to the presence of larger particles compared to other data shown here. Notably, two distinct groups of data are apparent: (1) corresponding to data inside the main dust layer (∼ 1.5–4 km a.s.l.) and (2) outside the dust layer. Some outliers in the lower part correspond to measurements inside the marine boundary layer. The observations in the dust layer mainly have a range of sphericity with Ψ∼ between 0.2 and 0.7 and lie outside the range of values provided in the literature for ζ, a result that was observed in Fig. 9 as well. The observations on top and below the dust layer exhibit significantly lower reff and ζ, and are closer to the values provided in the literature.
It is seen from this figure that cases dominated by Middle Eastern sources (e.g., 14 and 15 November 2021) exhibit lower ζ values and a wide reff range. On the other hand, Central Saharan cases have a narrower reff range. Cases from mixed origin and Western Sahara exhibit a wide range of ζ and reff. This is shown for the 18 November 2021 case, possibly due to a combination of aerosols (pollution, residual dust). For the case on 24 June 2022, the highest reff values are found, due to the presence of giant particles.
Overall, the observed values for ζ and reff for dust particles, vary significantly depending on the source regions, which can be different for the airmasses at different altitudes. In addition, a big fraction of observations at the dust layers lie outside the range of values provided for ζ in the literature, which in some cases (i.e., Cabo Verde) can be related to the limitation of AERONET and models to account for coarser and giant particles. For Middle Eastern cases, the discrepancies may also be due to the limited number of studies on dust originating from this region.
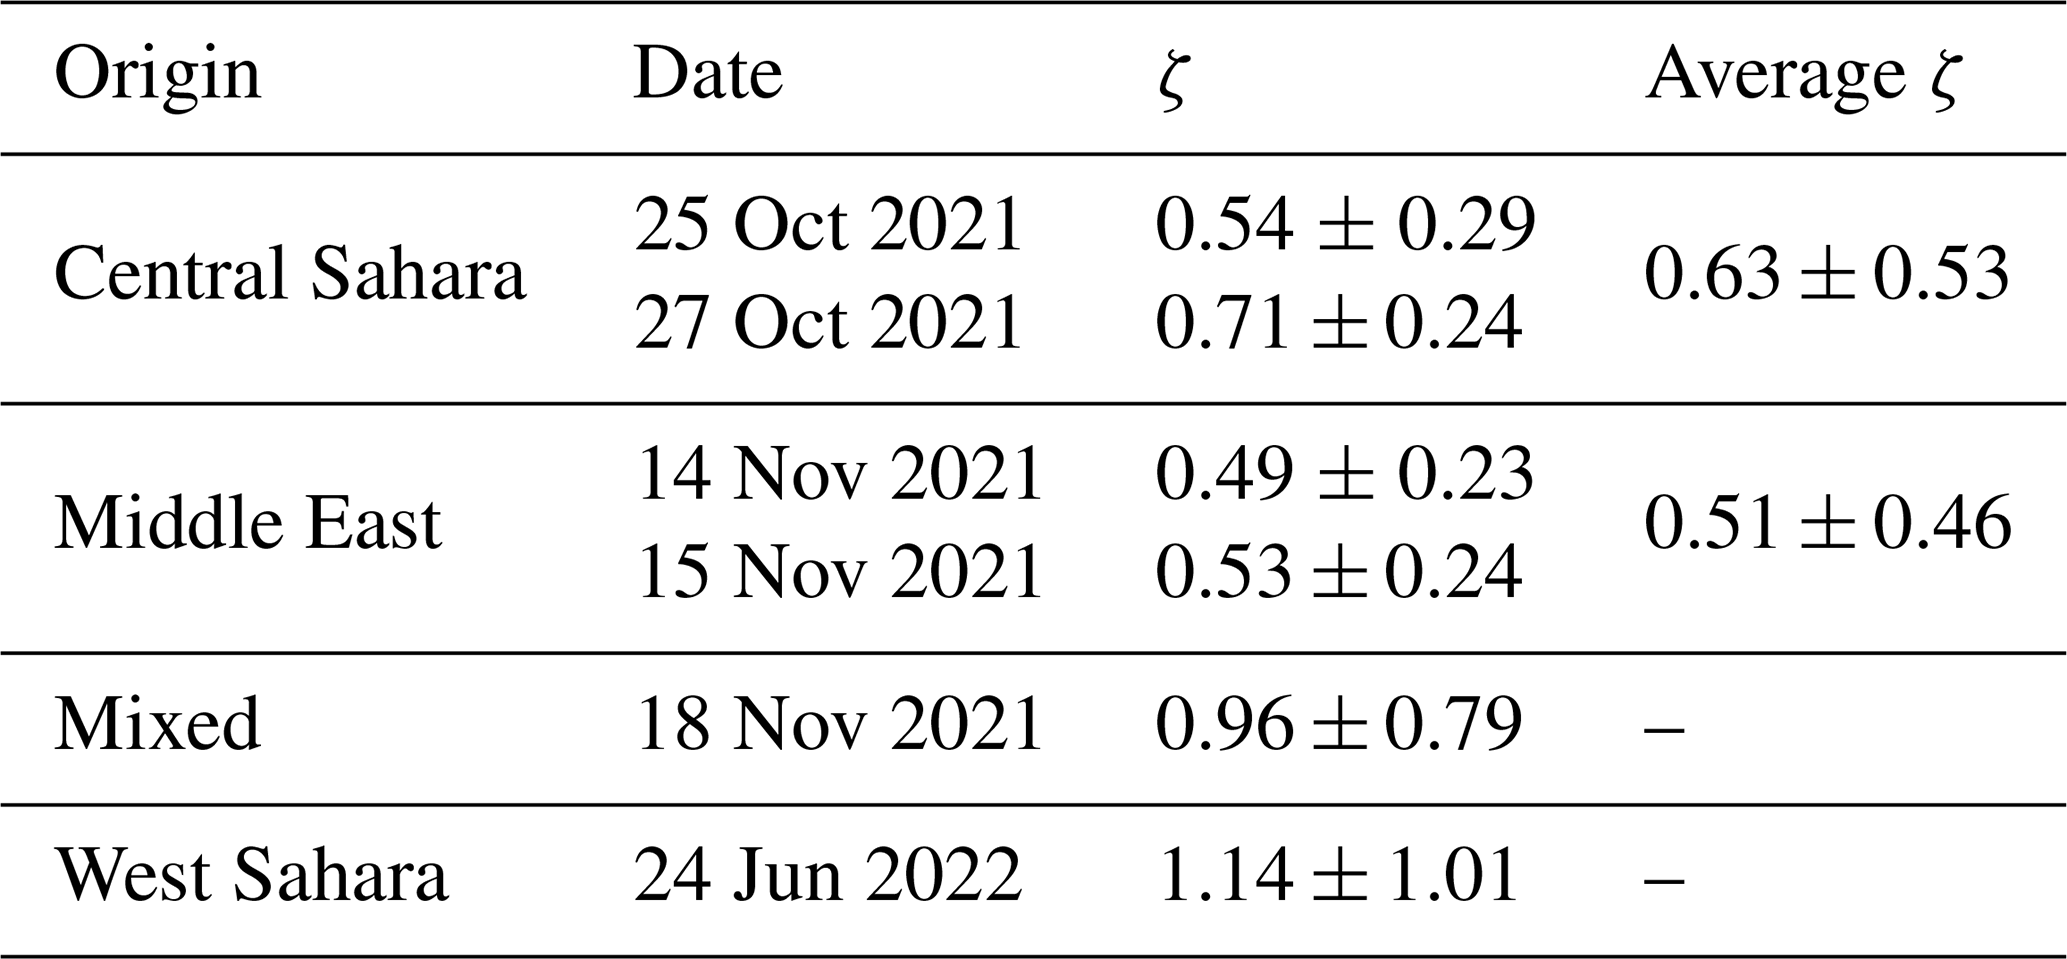
Table 2 summarizes the ζ values with their respective statistical uncertainties across the different source regions seen in Table 1. The West Saharan case exhibits the largest ζ, which is related to the higher effective radii driven by the important fraction of the coarse-mode dust. In contrast, the Middle Eastern cases show the smallest ζ values, likely due to the significant fraction of fine-mode dust.
Table 2Average dust ζ values for the different cases of Table 1.
Understanding the properties of atmospheric dust and other aerosols is important for quantifying climate forcing and has broad implications across several applied domains, including air quality, human health, and solar energy production (Middleton, 2017). Atmospheric aerosol load is typically described either by mass/volume concentration or by its ability to extinguish light, depending on the observational method and application. The link between gravimetric and optical properties plays a key role in remote sensing, model evaluation, data assimilation, and regulatory air quality assessments. To correlate between the gravimetric and optical expressions of the dust load, a key factor is the volume-to-extinction ratio (another relevant parameter is the particle density, which is not examined in this study). This study demonstrates (in Eq. 9 and Fig. 11), that the volume-to-extinction ratio depends on the effective radius and shape of the particles, and, for finer particles, also on the scattering efficiency, which itself is a function of geometry and RI.
The volume-to-extinction ratio (denoted here as ζ) is often estimated from the column-averaged particle size distribution (PSD) and aerosol optical depth derived from AERONET (Ansmann et al., 2011). In this way, the global coverage and consistent methodology used across the network are fully exploited. However, a known limitation of the current AERONET algorithm is that it restricts the PSD to radii below 15 µm, which can lead to underestimation of both the effective radius and ζ. In modeling studies, the ζ is instead derived from the modeled aerosol PSD where a clear limitation is the representation of larger particles, often neglected in models, which typically include aerosol particles with radii up to 10 µm, missing thus the super-coarse and giant mode particles which are relevant for mineral dust. This leads to inaccurate simulations of the dust load and its radiative effects (Adebiyi and Kok, 2020; O'Sullivan et al., 2020; Drakaki et al., 2022). Adebiyi and Kok (2020) has quantified this limitation of models, showing that it results in a significant underestimation of giant particle abundance by up to a factor of four. A consequence of this limitation is that in models ζ can be significantly underestimated.
Recent observations from ocean buoy-mounted atmospheric samplers (van der Does et al., 2018), submarine sediment traps (van der Does et al., 2016), and airborne campaigns (Weinzierl et al., 2009; Ryder et al., 2015a, 2018; Marenco et al., 2018; Estellés et al., 2018) have highlighted the presence of dust super-coarse and giant particles and suggest that the previously underestimated giant mode may occur relatively frequently, particularly in source regions and within the Saharan Air Layer that traverses the Atlantic; however, these datasets remain sparse. In this study, a combined use of ground-based lidar and airborne in-situ (UAV-based) observations of the PSD is presented, to derive vertically resolved values of the volume-to-extinction ratio of dust during various dust events, which in alignment with the previous work mentioned above, confirms the observation of giant particles over the Eastern Atlantic (Cabo Verde), and this is reflected in the derived ζ. As the reports of super-coarse particles are sporadic, and given that using a sunphotometer network can be difficult to reveal them due to the assumptions and limitations of the current AERONET retrieval algorithms, the question remains open as to how frequently are the large particles to be found. This general question cannot be answered due to the limited dataset that has been obtained in this study, but the observations here can be added to the previous ones, and contribute incrementally to this growing body of evidence.
When compared to the ζ values derived from AERONET, following the well-established method of Ansmann et al. (2011), good agreement is found for the Middle East case, where no giant particles were observed. In contrast, significant differences, up to 150 %, are observed over the Eastern Atlantic. Similar discrepancies are evident when comparing with values reported in the literature (Ansmann et al., 2012, 2019a). Note that the findings of the present study confirm the findings by Müller et al. (2010), who reported that the effective particle radii from AERONET retrievals tend to be underestimated compared to those calculated from in-situ observations of the PSD. In contrast, the observations in Cyprus show better agreement with both AERONET-derived and literature-based values of effective radius and ζ (Figs. 10 and 11). The dust that was observed over Cyprus is characterised by a smaller concentration of super-coarse and giant particles than the dust that was observed over the Eastern Atlantic, and moreover a larger concentration of fine particles was encountered over Cyprus. This suggests a mixed aerosol type, which could be influenced by regional pollution. While Cyprus is frequently affected by Saharan dust, it is also exposed to dust outbreaks originating from the Middle East (Kezoudi et al., 2025), which often carry not only dust, but also a significant amount of anthropogenic pollutants (Teri et al., 2025). Bimenyimana et al. (2025) identified the Middle East as a major source of fine particles transported to Cyprus, largely from fossil fuel combustion. Similarly, Christodoulou et al. (2023) demonstrated that emissions from this Middle East industry contribute significantly to organic aerosols and black carbon levels in Cyprus.
The evaluation of the WRF-Chem modeled ζ against observations highlighted a similar underestimation of the modeled particle size for the Eastern Atlantic case, and therefore of the ζ. This underestimation reflects the model’s limited representation of giant particles, as discussed earlier.
The influence of particle shape on the volume-to-extinction ratio has also been examined. For this, the MOPSMAP optical model has been used, with input of different aspect ratios and refractive indices, both derived from literature as well as by SEM analysis on the UAV-based filter samples. Near-spherical particles, with AR close to 1 (aligning well with Kandler et al., 2009), largely reproduced the observed ζ values over Cyprus. Over the Eastern Atlantic, larger discrepancies were observed. Although near-spherical shapes showed a better agreement with observations at some altitudes, simulations with higher aspect ratios provided a closer match to the observed ζ values near the top of the dust layer. These differences between events and across altitudes suggest variability in dust particle morphology, possibly due to differences in source region, ageing processes or differential stratification of such particles in the atmosphere. Additionally, aerosol mixing likely plays a role in these differences; pollution over Cyprus and sea salt over Cabo Verde may both influence the optical properties, particularly those related to particle shape assumptions. It would be desirable in the future to model the dust optical properties with sophisticated optical models that are able to properly consider the dust size and shape characteristics.
This study highlights a unique strength of airborne measurements, notably their ability to provide in-situ insights into the dust PSDs and their variability in time and space, including coarse particles larger than 20 µm, which remain underestimated by current remote sensing and models. The effect of this underestimation is mostly relevant for cases influenced by recently emitted dust near source regions, where super-coarse and giant particles are likely to be abundant. In contrast, for aged or mixed dust plumes (e.g., the ones that were over Cyprus), this limitation is less significant, and the AERONET-derived ζ values agree well with UAV in-situ observations. Although the UAV in-situ measurements are subject to their own uncertainties and methodological limitations (e.g. detection efficiency, aerosol drying), which should be considered when interpreting the results, they provide valuable information that helps confirm these conclusions. The observations presented here are limited to a handful of vertical profiles, not general enough to establish the volume-to-extinction ratio of dust as a unique general result, but they are meaningful for illustrating the methodological challenges and limitations associated with retrieving the dust volume-to-extinction ratio in the presence of giant particles, particularly in methods such as AERONET and in most atmospheric models that typically assume an upper size cut-off or simplified size distribution. In addition, these cases allow us to highlight situations in which in-situ UAV measurements provide information that may not be fully captured by remote-sensing approaches. The identified characteristics are not isolated, as mixtures of Middle Eastern dust with finer aerosols have been reported previously, while the East Atlantic case is consistent with earlier observations of giant dust particles in that region. These results further demonstrate the need to refine the remote sensing, airborne in-situ and modelling approaches to capture the full dust size spectrum (including super-coarse and giant modes). As noted by Adebiyi et al. (2023), greater emphasis should be placed on synergistic airborne and ground-based measurements across a range of dust-dominated environments influenced by different source regions. The approach presented here could in the future be repeated for a number of regions near the sources (e.g. Sahara and the Middle East) and at different locations where dust is transported long-range. Ansmann et al. (2012) previously raised concerns about applying Saharan dust-derived conversion factors to other dust sources, emphasising the need for region-specific adjustments. Systematic validation and implementation of updated, regionally appropriate volume-to-extinction ratios in operational remote sensing retrievals should be aimed at. O'Sullivan et al. (2020) already discussed the need to complement the global set of observations that are currently used to constrain models (typically the AOD from AERONET and/or satellite imagers) with additional observations such as vertical distribution and the PSDs. Whereas spaceborne lidar can provide information on the vertical distribution globally, PSDs are better observed in-situ, e.g. from balloon-borne sensors, as also suggested in their study. The current study, based on UAV in-situ observations, represents a small but significant step in that direction.
Our study emphasises the significance of the volume-to-extinction ratio in quantifying dust using models and remote sensing and in particular when bridging between optical and gravimetric quantitative estimates. It demonstrates that the spatial and vertical variability of this ratio can lead to uncertainties when using predefined, column-averaged, or literature-based values that may not be representative of specific dust conditions.
Airmass backtrajectories were performed using HYSPLIT (Stein et al., 2015). The resulted backtrajectories over a 120 h period for the two demonstration cases are shown here. It is confirmed by the backtrajectories that for the 15 November 2021, airmasses arrived to Cyprus, travelled from Middle East. For 24 June 2022, the airmass reaching Cabo Verde likely passed over Mali and Mauritania, travelling across the Sahara Desert.
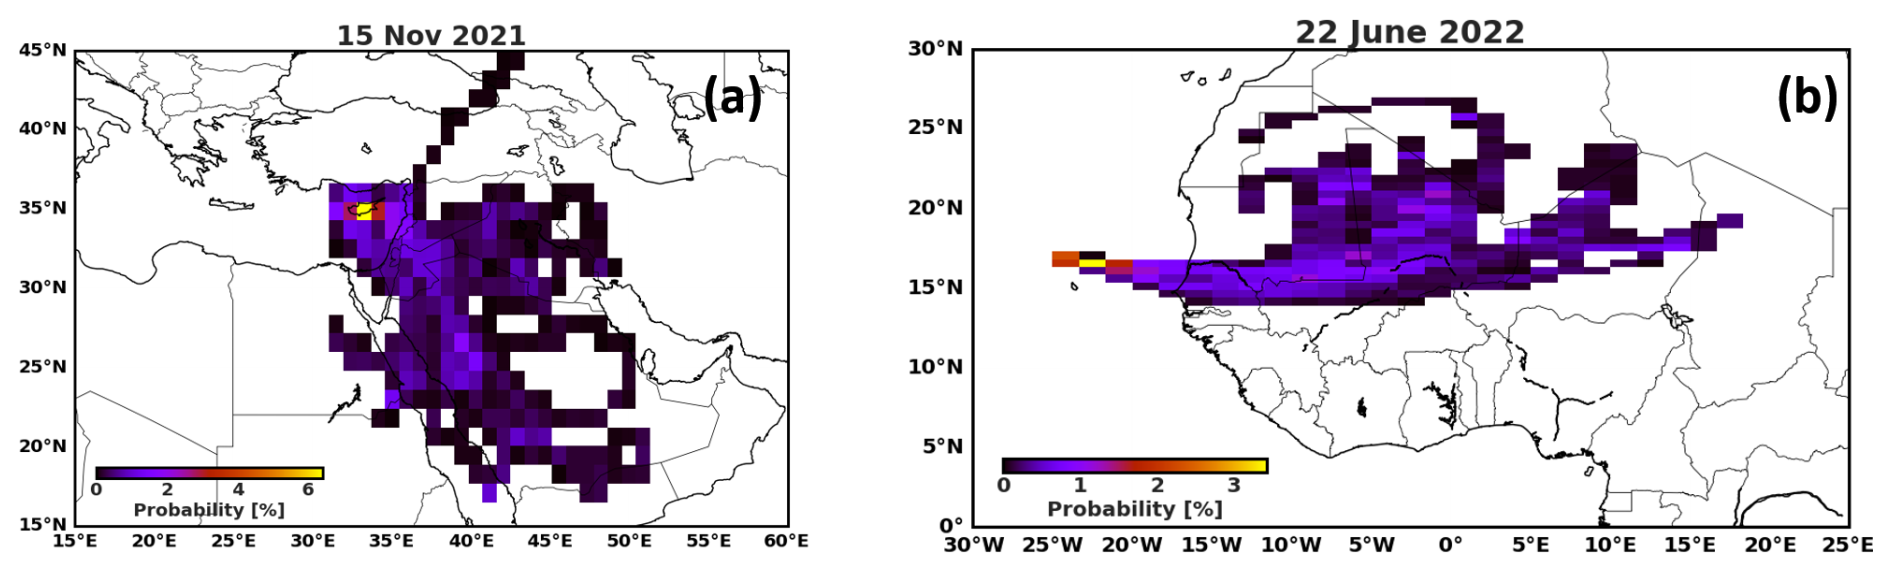
Figure A1Hysplit 120 h backtrajectories during 15 November 2021, in Cyprus (a) and 24 June 2022, in Cabo Verde at endpoint altitudes of 2 and 3.5 km a.s.l. respectively. The color shows the probability of the backtrajectory passing each grid point.
The data from the UAV based OPSs and lidars are available here: https://doi.org/10.5281/zenodo.15910856 (Papetta, 2025). AERONET data are available at https://aeronet.gsfc.nasa.gov/ (last access: 23 December 2025).
The ASKOS dataset can be found here in https://evdc.esa.int/publications/askos-campaign-dataset/ (last access: 23 December 2025).
AP: Conceptualization, participation in field campaigns and data acquisition, data analysis and interpretation, writing–original draft; FM: Conceptualization, supervision, participation in field campaigns and data acquisition, theoretical background, placing the subject matter in the wider context; MK: UAV–OPS observations coordination, participation in field campaigns and data acquisition; HB, AF: Lidar observations at Mindelo; KK: SEM analysis on samples; SA: Refractive index calculations; ED, EL: WRF-Chem model; All authors have contributed by writing, reviewing and editing.
The contact author has declared that none of the authors has any competing interests.
Publisher's note: Copernicus Publications remains neutral with regard to jurisdictional claims made in the text, published maps, institutional affiliations, or any other geographical representation in this paper. The authors bear the ultimate responsibility for providing appropriate place names. Views expressed in the text are those of the authors and do not necessarily reflect the views of the publisher.
The authors acknowledge the EMME-CARE project for supporting this work under the European Union's Horizon 2020 Research and Innovation Programme (Grant Agreement No. 856612). Additionally, we acknowledge the ESA project (Contract No. 4000131861/20/NL/IA) for funding the ASKOS campaign. Part of this work was supported through a virtual mobility by the COST Action Harmonia (CA21119) supported by COST (European Cooperation in Science and Technology). We extend our gratitude to the AERONET network and to Holger Baars, Ronny Engelmannm and Philip Goloub, principal investigators of the Mindelo and Agia Marina Xyliatou stations, for maintaining the instrument operation and providing valuable data. Parts of this research has been supported by the German Federal Ministry for Economic Affairs and Energy (BMWi, grant no. 50EE1721C), the German Federal Ministry of Education and Research (BMBF) under the FONA Strategy “Research for Sustainability” (grant no. 01LK2001A), and the European Union's Horizon 2020 research and innovation program (grant nos. 739530 and 871115). The authors wish to warmly thank Alexandra Tsekeri for providing useful discussions and guidance with the scattering calculations involving non-spherical particles, and for constructive advice on the paper content. Also we thank the co-authors for their contribution to this study. We sincerely thank the USRL team for their support in advancing the scientific vision through the provision and operation of their UAV fleet. In addition, we would like to thank the CAO team for ensuring the continuous operation of the remote sensing observations at Nicosia and Agia Marina Xyliatou. Finally, many thanks are given to Cesaria Evora International Airport and the Ocean Science Centre Mindelo for their support, which has been decisive in the success of the campaign.
This research has been supported by the EU Horizon 2020 (grant nos. 856612, 739530, and 871115), the European Space Agency (grant no. 4000131861/20/NL/IA), the European Cooperation in Science and Technology (grant no. CA21119), the Bundesministerium für Wirtschaft und Energie (grant no. 50EE1721C), and the German Federal Ministry of Education and Research (BMBF) under the FONA Strategy “Research for Sustainability” (grant no. 01LK2001A).
This paper was edited by Zhibo Zhang and reviewed by three anonymous referees.
Adebiyi, A., Kok, J. F., Murray, B. J., Ryder, C. L., Stuut, J. B. W., Kahn, R. A., Knippertz, P., Formenti, P., Mahowald, N. M., Pérez García-Pando, C., Klose, M., Ansmann, A., Samset, B. H., Ito, A., Balkanski, Y., Di Biagio, C., Romanias, M. N., Huang, Y., and Meng, J.: A review of coarse mineral dust in the Earth system, Aeolian Research, 60, https://doi.org/10.1016/j.aeolia.2022.100849, 2023. a
Adebiyi, A. A. and Kok, J. F.: Climate models miss most of the coarse dust in the atmosphere, Science Advances, 6, eaaz9507, https://doi.org/10.1126/sciadv.aaz9507, 2020. a, b, c
Albrecht, B.: Aerosols, Cloud Microphysics, and Fractional Cloudiness, Science, https://doi.org/10.1126/science.245.4923.1227, 1989. a
Althausen, D., Engelmann, R., Baars, H., Heese, B., Ansmann, A., Müller, D., and Komppula, M.: Portable Raman Lidar PollyXT for automated profiling of aerosol backscatter, extinction, and depolarization, J. Atmos. Ocean. Tech., 26, 2366–2378, https://doi.org/10.1175/2009JTECHA1304.1, 2009. a
Andreae, M. O., Jones, C. D., and Cox, P. M.: Strong present-day aerosol cooling implies a hot future, Nature, 435, 1187–1190, https://doi.org/10.1038/nature03671, 2005. a
Andrews, E., Ogren, J. A., Kinne, S., and Samset, B.: Comparison of AOD, AAOD and column single scattering albedo from AERONET retrievals and in situ profiling measurements, Atmos. Chem. Phys., 17, 6041–6072, https://doi.org/10.5194/acp-17-6041-2017, 2017. a
Ansmann, A., Tesche, M., Seifert, P., Groß, S., Freudenthaler, V., Apituley, A., Wilson, K. M., Serikov, I., Linné, H., Heinold, B., Hiebsch, A., Schnell, F., Schmidt, J., Mattis, I., Wandinger, U., and Wiegner, M.: Ash and fine-mode particle mass profiles from EARLINET-AERONET observations over central Europe after the eruptions of the Eyjafjallajökull volcano in 2010, J. Geophys. Res., 116, D00U02, https://doi.org/10.1029/2010JD015567, 2011. a, b, c
Ansmann, A., Seifert, P., Tesche, M., and Wandinger, U.: Profiling of fine and coarse particle mass: case studies of Saharan dust and Eyjafjallajökull/Grimsvötn volcanic plumes, Atmos. Chem. Phys., 12, 9399–9415, https://doi.org/10.5194/acp-12-9399-2012, 2012. a, b, c, d
Ansmann, A., Mamouri, R.-E., Bühl, J., Seifert, P., Engelmann, R., Hofer, J., Nisantzi, A., Atkinson, J. D., Kanji, Z. A., Sierau, B., Vrekoussis, M., and Sciare, J.: Ice-nucleating particle versus ice crystal number concentrationin altocumulus and cirrus layers embedded in Saharan dust:a closure study, Atmos. Chem. Phys., 19, 15087–15115, https://doi.org/10.5194/acp-19-15087-2019, 2019a. a
Ansmann, A., Mamouri, R.-E., Hofer, J., Baars, H., Althausen, D., and Abdullaev, S. F.: Dust mass, cloud condensation nuclei, and ice-nucleating particle profiling with polarization lidar: updated POLIPHON conversion factors from global AERONET analysis, Atmos. Meas. Tech., 12, 4849–4865, https://doi.org/10.5194/amt-12-4849-2019, 2019b. a
Antuña-Marrero, J. C., Landulfo, E., Estevan, R., Barja, B., Robock, A., Wolfram, E., Ristori, P., Clemesha, B., Zaratti, F., Forno, R., Armandillo, E., Bastidas, Ã. E., de Frutos Baraja, Ã. M., Whiteman, D. N., Quel, E., Barbosa, H. M. J., Lopes, F., Montilla-Rosero, E., and Guerrero-Rascado, J. L.: LALINET: The First Latin American-born Regional Atmospheric Observational Network, Bulletin of the American Meteorological Society, 98, 1255–1275, https://doi.org/10.1175/BAMS-D-15-00228.1, 2017. a
Aryasree, S., Kandler, K., Benker, N., Walser, A., Tipka, A., Dollner, M., Seibert, P., and Weinzierl, B.: Vertical Variability in morphology, chemistry and optical properties of the transported Saharan air layer measured from Cape Verde and the Caribbean, Royal Society Open Science, 11, 231433, https://doi.org/10.1098/rsos.231433, 2024. a
Baars, H., Kanitz, T., Engelmann, R., Althausen, D., Heese, B., Komppula, M., Preißler, J., Tesche, M., Ansmann, A., Wandinger, U., Lim, J.-H., Ahn, J. Y., Stachlewska, I. S., Amiridis, V., Marinou, E., Seifert, P., Hofer, J., Skupin, A., Schneider, F., Bohlmann, S., Foth, A., Bley, S., Pfüller, A., Giannakaki, E., Lihavainen, H., Viisanen, Y., Hooda, R. K., Pereira, S. N., Bortoli, D., Wagner, F., Mattis, I., Janicka, L., Markowicz, K. M., Achtert, P., Artaxo, P., Pauliquevis, T., Souza, R. A. F., Sharma, V. P., van Zyl, P. G., Beukes, J. P., Sun, J., Rohwer, E. G., Deng, R., Mamouri, R.-E., and Zamorano, F.: An overview of the first decade of PollyNET: an emerging network of automated Raman-polarization lidars for continuous aerosol profiling, Atmos. Chem. Phys., 16, 5111–5137, https://doi.org/10.5194/acp-16-5111-2016, 2016. a, b
Barnaba, F. and Gobbi, G. P.: Aerosol seasonal variability over the Mediterranean region and relative impact of maritime, continental and Saharan dust particles over the basin from MODIS data in the year 2001, Atmos. Chem. Phys., 4, 2367–2391, https://doi.org/10.5194/acp-4-2367-2004, 2004. a
Barnard, J. C., Fast, J. D., Paredes-Miranda, G., Arnott, W. P., and Laskin, A.: Evaluation of the WRF-Chem “Aerosol Chemical to Aerosol Optical Properties” Module Using Data from the MILAGRO Campaign, Journal of Geophysical Research: Atmospheres, 115, D07206, https://doi.org/10.1029/2009JD013694, 2010. a
Bimenyimana, E., Sciare, J., Oikonomou, K., Iakovides, M., Pikridas, M., Vasiliadou, E., Savvides, C., and Mihalopoulos, N.: Cross-validation of methods for quantifying the contribution of local (urban) and regional sources to PM2.5 pollution: Application in the Eastern Mediterranean (Cyprus), Atmospheric Environment, 343, 120975, https://doi.org/10.1016/j.atmosenv.2024.120975, 2025. a, b
Bösenberg, J., Matthias, V., Linné, H., Comeron, A., Rocadenbosch, F., Perez, C., and Baldasano, J.: EARLINET: A European Aerosol Research Lidar Network to Establish an Aerosol Climatology, Report 348, Max-Planck-Institut für Meteorologie, Hamburg, Germany, eARLINET Project Report, https://hdl.handle.net/2117/87211 (last access: 6 February 2026), 2003. a
Carslaw, K. S., Boucher, O., Spracklen, D. V., Mann, G. W., Rae, J. G. L., Woodward, S., and Kulmala, M.: A review of natural aerosol interactions and feedbacks within the Earth system, Atmos. Chem. Phys., 10, 1701–1737, https://doi.org/10.5194/acp-10-1701-2010, 2010. a
Chapman, E. G., Gustafson Jr., W. I., Easter, R. C., Barnard, J. C., Ghan, S. J., Pekour, M. S., and Fast, J. D.: Coupling aerosol-cloud-radiative processes in the WRF-Chem model: Investigating the radiative impact of elevated point sources, Atmos. Chem. Phys., 9, 945–964, https://doi.org/10.5194/acp-9-945-2009, 2009. a
Chen, J., Wu, Z., Chen, J., Reicher, N., Fang, X., Rudich, Y., and Hu, M.: Size-resolved atmospheric ice-nucleating particles during East Asian dust events, Atmos. Chem. Phys., 21, 3491–3506, https://doi.org/10.5194/acp-21-3491-2021, 2021. a
Christodoulou, A., Stavroulas, I., Vrekoussis, M., Desservettaz, M., Pikridas, M., Bimenyimana, E., Kushta, J., Ivančič, M., Rigler, M., Goloub, P., Oikonomou, K., Sarda-Estève, R., Savvides, C., Afif, C., Mihalopoulos, N., Sauvage, S., and Sciare, J.: Ambient carbonaceous aerosol levels in Cyprus and the role of pollution transport from the Middle East, Atmos. Chem. Phys., 23, 6431–6456, https://doi.org/10.5194/acp-23-6431-2023, 2023. a
Deb, S., et al.: Evaluation of WRF-Chem (version 4.7.1) aeolian dust emission and land surface models over the dust belt, Geoscientific Model Development, in preparation, 2026. a
DeMott, P. J., Sassen, K., Poellot, M. R., Baumgardner, D., Rogers, D. C., Brooks, S. D., Prenni, A. J., and Kreidenweis, S. M.: African dust aerosols as atmospheric ice nuclei, Geophysical Research Letters, 30, 2003GL017410, https://doi.org/10.1029/2003GL017410, 2003. a
DeMott, P. J., Prenni, A. J., McMeeking, G. R., Sullivan, R. C., Petters, M. D., Tobo, Y., Niemand, M., Möhler, O., Snider, J. R., Wang, Z., and Kreidenweis, S. M.: Integrating laboratory and field data to quantify the immersion freezing ice nucleation activity of mineral dust particles, Atmos. Chem. Phys., 15, 393–409, https://doi.org/10.5194/acp-15-393-2015, 2015. a
Di Biagio, C., Formenti, P., Balkanski, Y., Caponi, L., Cazaunau, M., Pangui, E., Journet, E., Nowak, S., Caquineau, S., Andreae, M. O., Kandler, K., Saeed, T., Piketh, S., Seibert, D., Williams, E., and Doussin, J.-F.: Global scale variability of the mineral dust long-wave refractive index: a new dataset of in situ measurements for climate modeling and remote sensing, Atmos. Chem. Phys., 17, 1901–1929, https://doi.org/10.5194/acp-17-1901-2017, 2017. a
Di Biagio, C., Formenti, P., Balkanski, Y., Caponi, L., Cazaunau, M., Pangui, E., Journet, E., Nowak, S., Andreae, M. O., Kandler, K., Saeed, T., Piketh, S., Seibert, D., Williams, E., and Doussin, J.-F.: Complex refractive indices and single-scattering albedo of global dust aerosols in the shortwave spectrum and relationship to size and iron content, Atmos. Chem. Phys., 19, 15503–15531, https://doi.org/10.5194/acp-19-15503-2019, 2019. a
Drakaki, E., Amiridis, V., Tsekeri, A., Gkikas, A., Proestakis, E., Mallios, S., Solomos, S., Spyrou, C., Marinou, E., Ryder, C. L., Bouris, D., and Katsafados, P.: Modeling coarse and giant desert dust particles, Atmos. Chem. Phys., 22, 12727–12748, https://doi.org/10.5194/acp-22-12727-2022, 2022. a, b
Dubovik, O. and King, M. D.: A flexible inversion algorithm for retrieval of aerosol optical properties from Sun and sky radiance measurements, Journal of Geophysical Research: Atmospheres, 105, 20673–20696, https://doi.org/10.1029/2000JD900282, 2000. a, b
Dubovik, O., Holben, B. N., Eck, T. F., Smirnov, A., Kaufman, Y. J., King, M. D., Tanré, D., and Slutsker, I.: Variability of Absorption and Optical Properties of Key Aerosol Types Observed in Worldwide Locations, Journal of the Atmospheric Sciences, 59, 590–608, https://doi.org/10.1175/1520-0469(2002)059<0590:VOAAOP>2.0.CO;2, 2002. a, b
Engelmann, R., Kanitz, T., Baars, H., Heese, B., Althausen, D., Skupin, A., Wandinger, U., Komppula, M., Stachlewska, I. S., Amiridis, V., Marinou, E., Mattis, I., Linné, H., and Ansmann, A.: The automated multiwavelength Raman polarization and water-vapor lidar PollyXT: the neXT generation, Atmos. Meas. Tech., 9, 1767–1784, https://doi.org/10.5194/amt-9-1767-2016, 2016. a, b
Estellés, V., Marenco, F., Ryder, C., Segura, S., O'Sullivan, D., Brooke, J., Campanelli, M., Buxmann, J., and Martínez-Lozano, J. A.: Validation of AERONET and ESR/SKYNET size distributions with airborne in situ measurements in dust conditions, in: 9th International Workshop on Sand/Duststorms and Associated Dustfall, 22–24 May 2018, Tenerife, Spain, http://dustworkshop9.net/wp-content/uploads/2018/05/abstracts-dw9.pdf (last access: 6 February 2026), 2018. a, b
Fast, J. D., Gustafson Jr., W. I., Easter, R. C., Zaveri, R. A., Barnard, J. C., Chapman, E. G., Grell, G. A., and Peckham, S. E.: Evolution of ozone, particulates, and aerosol direct radiative forcing in the vicinity of Houston using a fully coupled meteorology-chemistry-aerosol model, Journal of Geophysical Research: Atmospheres, 111, https://doi.org/10.1029/2005JD006721, 2006. a, b
Fehr, T., McCarthy, W., Amiridis, V., Baars, H., von Bismarck, J., Borne, M., Chen, S., Flamant, C., Marenco, F., Knipperz, P., Koopman, R., Lemmerz, C. L., Marinou, E., Močnik, G., Parrinello, T., Piña, A., Reitebuch, O., Skofronick-Jackson, G., Zawislak, J., and Zenk, C.: The Joint Aeolus Tropical Atlantic Campaign 2021/2022 Overview – Atmospheric Science and Satellite Validation in the Tropics, EGU General Assembly 2023, Vienna, Austria, 23–28 Apr 2023, EGU23-7249, https://doi.org/10.5194/egusphere-egu23-7249, 2023. a
Fernald, G. F.: Analysis of atmospheric lidar observations: some comments, Appl. Opt., 23, 652–653, https://doi.org/10.1364/AO.23.000652, 1984. a, b
Floutsi, A. A., Rizos, K., Trapon, D., Engelmann, R., Althausen, D., Marinou, E., Paschou, P., Hofer, J., Proestakis, E., Gebauer, H., Skupin, A., Ansmann, A., Fehr, T., Hummel, T., Koopman, R., Amiridis, V., Wandinger, U., and Baars, H.: On the representativeness of the ground-based lidar observations for satellite calibration/validation – the example of the archipelago of Cabo Verde, EGUsphere [preprint], https://doi.org/10.5194/egusphere-2025-4742, 2025. a
Fountoulakis, I., Tsekeri, A., Kazadzis, S., Amiridis, V., Nersesian, A., Tsichla, M., Proestakis, E., Gkikas, A., Papachristopoulou, K., Barlakas, V., Emde, C., and Mayer, B.: A sensitivity study on radiative effects due to the parameterization of dust optical properties in models, Atmos. Chem. Phys., 24, 4915–4948, https://doi.org/10.5194/acp-24-4915-2024, 2024. a
Gao, R. S., Telg, H., McLaughlin, R. J., Ciciora, S. J., Watts, L. A., Richardson, M. S., Schwarz, J. P., Perring, A. E., Thornberry, T. D., Rollins, A. W., Markovic, M. Z., Bates, T. S., Johnson, J. E., and Fahey, D. W.: A light-weight, high-sensitivity particle spectrometer for PM2.5 aerosol measurements, Aerosol Science and Technology, 50, 88–99, https://doi.org/10.1080/02786826.2015.1131809, 2016. a, b, c, d
Garcia-Suñer, M., Estellés, V., Marenco, F., Ryder, C., Kumar, G., Momoi, M., Campanelli, M., O'Sullivan, D., Brooke, J., and Buxmann, J.: Validation of AERONET and SKYNET columnar aerosol size distributions by comparison with aircraft in situ measurements at Cape Verde, EMS Annual Meeting 2024, Barcelona, Spain, 1–6 Sep 2024, EMS2024-717, https://doi.org/10.5194/ems2024-717, 2024. a
Gasteiger, J. and Wiegner, M.: Modeling of aerosol optical properties with MOPSMAP: Fortran program with data set, Zenodo, https://doi.org/10.5281/zenodo.1284217, 2018a. a
Gasteiger, J. and Wiegner, M.: MOPSMAP v1.0: a versatile tool for the modeling of aerosol optical properties, Geosci. Model Dev., 11, 2739–2762, https://doi.org/10.5194/gmd-11-2739-2018, 2018b. a
Gasteiger, J., Groß, S., Freudenthaler, V., and Wiegner, M.: Volcanic ash from Iceland over Munich: mass concentration retrieved from ground-based remote sensing measurements, Atmos. Chem. Phys., 11, 2209–2223, https://doi.org/10.5194/acp-11-2209-2011, 2011. a
Gebauer, H., Floutsi, A. A., Haarig, M., Radenz, M., Engelmann, R., Althausen, D., Skupin, A., Ansmann, A., Zenk, C., and Baars, H.: Tropospheric sulfate from Cumbre Vieja (La Palma) observed over Cabo Verde contrasted with background conditions: a lidar case study of aerosol extinction, backscatter, depolarization and lidar ratio profiles at 355, 532 and 1064 nm, Atmos. Chem. Phys., 24, 5047–5067, https://doi.org/10.5194/acp-24-5047-2024, 2024. a
Gebauer, H., Floutsi, A. A., Hofer, J., Haarig, M., Skupin, A., Engelmann, R., Jimenez, C., and Baars, H.: Characterization of the annual cycle of atmospheric aerosol over Mindelo, Cabo Verde, by means of continuous multiwavelength lidar observations, EGUsphere [preprint], https://doi.org/10.5194/egusphere-2025-3344, 2025. a
Georgiou, G. K., Christoudias, T., Proestos, Y., Kushta, J., Pikridas, M., Sciare, J., Savvides, C., and Lelieveld, J.: Evaluation of WRF-Chem model (v3.9.1.1) real-time air quality forecasts over the Eastern Mediterranean, Geosci. Model Dev., 15, 4129–4146, https://doi.org/10.5194/gmd-15-4129-2022, 2022. a
Ghan, S. J. and Zaveri, R. A.: Parameterization of Optical Properties for Hydrated Internally Mixed Aerosols, Journal of Geophysical Research: Atmospheres, 112, D10201, https://doi.org/10.1029/2006JD007927, 2007. a, b
Grell, G. A., Peckham, S. E., Schmitz, R., McKeen, S. A., Frost, G., Skamarock, W. C., and Eder, B.: Fully coupled online chemistry within the WRF model, Atmospheric Environment, 39, 6957–6975, https://doi.org/10.1016/j.atmosenv.2005.04.027, 2005. a
Groß, S., Freudenthaler, V., Schepanski, K., Toledano, C., Schäfler, A., Ansmann, A., and Weinzierl, B.: Optical properties of long-range transported Saharan dust over Barbados as measured by dual-wavelength depolarization Raman lidar measurements, Atmos. Chem. Phys., 15, 11067–11080, https://doi.org/10.5194/acp-15-11067-2015, 2015. a
Haarig, M., Ansmann, A., Engelmann, R., Baars, H., Toledano, C., Torres, B., Althausen, D., Radenz, M., and Wandinger, U.: First triple-wavelength lidar observations of depolarization and extinction-to-backscatter ratios of Saharan dust, Atmos. Chem. Phys., 22, 355–369, https://doi.org/10.5194/acp-22-355-2022, 2022. a
Haywood, J., Francis, P., Osborne, S., Glew, M., Loeb, N., Highwood, E., Tanré, D., Myhre, G., Formenti, P., and Hirst, E.: Radiative properties and direct radiative effect of Saharan dust measured by the C-130 aircraft during SHADE: 1. Solar spectrum, Journal of Geophysical Research: Atmospheres, 108, https://doi.org/10.1029/2002jd002687, 2003. a, b
Hess, M., Koepke, P., and Schult, I.: Optical properties of aerosols and clouds: The software package OPAC, B. Am. Meteorol. Soc., 79, 831–844, 1998. a
Hofer, J., Althausen, D., Abdullaev, S. F., Makhmudov, A. N., Nazarov, B. I., Schettler, G., Engelmann, R., Baars, H., Fomba, K. W., Müller, K., Heinold, B., Kandler, K., and Ansmann, A.: Long-term profiling of mineral dust and pollution aerosol with multiwavelength polarization Raman lidar at the Central Asian site of Dushanbe, Tajikistan: case studies, Atmos. Chem. Phys., 17, 14559–14577, https://doi.org/10.5194/acp-17-14559-2017, 2017. a
Hofer, J., Ansmann, A., Althausen, D., Engelmann, R., Baars, H., Abdullaev, S. F., and Makhmudov, A. N.: Long-term profiling of aerosol light extinction, particle mass, cloud condensation nuclei, and ice-nucleating particle concentration over Dushanbe, Tajikistan, in Central Asia, Atmos. Chem. Phys., 20, 4695–4711, https://doi.org/10.5194/acp-20-4695-2020, 2020a. a
Hofer, J., Ansmann, A., Althausen, D., Engelmann, R., Baars, H., Fomba, K. W., Wandinger, U., Abdullaev, S. F., and Makhmudov, A. N.: Optical properties of Central Asian aerosol relevant for spaceborne lidar applications and aerosol typing at 355 and 532 nm, Atmos. Chem. Phys., 20, 9265–9280, https://doi.org/10.5194/acp-20-9265-2020, 2020b. a
Holben, B., Eck, T., Slutsker, I., Tanré, D., Buis, J., Setzer, A., Vermote, E., Reagan, J., Kaufman, Y., Nakajima, T., Lavenu, F., Jankowiak, I., and Smirnov, A.: AERONET: A Federated Instrument Network and Data Archive for Aerosol Characterization, Remote Sensing of Environment, 66, 1–16, https://doi.org/10.1016/S0034-4257(98)00031-5, 1998. a, b, c, d
Illingworth, A. J., Barker, H. W., Beljaars, A., Ceccaldi, M., Chepfer, H., Clerbaux, N., Cole, J., Delanoë, J., Domenech, C., Donovan, D. P., Fukuda, S., Hirakata, M., Hogan, R. J., Huenerbein, A., Kollias, P., Kubota, T., Nakajima, T., Nakajima, T. Y., Nishizawa, T., Ohno, Y., Okamoto, H., Oki, R., Sato, K., Satoh, M., Shephard, M. W., Velázquez-Blázquez, A., Wandinger, U., Wehr, T., and van Zadelhoff, G.-J.: The EarthCARE Satellite: The Next Step Forward in Global Measurements of Clouds, Aerosols, Precipitation, and Radiation, Bulletin of the American Meteorological Society, 96, 1311–1332, https://doi.org/10.1175/BAMS-D-12-00227.1, 2015. a
IPCC: Climate Change 2021: The Physical Science Basis. Contribution of Working Group I to the Sixth Assessment Report of the Intergovernmental Panel on Climate Change, Cambridge University Press, https://doi.org/10.1017/9781009157896, 2021. a
Jimenez, C., Ansmann, A., Engelmann, R., Donovan, D., Malinka, A., Schmidt, J., Seifert, P., and Wandinger, U.: The dual-field-of-view polarization lidar technique: a new concept in monitoring aerosol effects in liquid-water clouds – theoretical framework, Atmos. Chem. Phys., 20, 15247–15263, https://doi.org/10.5194/acp-20-15247-2020, 2020. a, b
Johnson, B. and Osborne, S. R.: Physical and optical properties of mineral dust aerosol measured by aircraft during the GERBILS campaign, Q. J. Roy. Meteor. Soc., 137, 1117–1130, 2011. a
Johnson, B., Turnbull, K., Brown, P., Burgess, R., Dorsey, J., Baran, A. J., Webster, H., Haywood, J., Cotton, R., Ulanowski, Z., Hesse, E., Woolley, A., and Rosenberg, P.: In situ observations of volcanic ash clouds from the FAAM aircraft during the eruption of Eyjafjallajökull in 2010, Journal of Geophysical Research: Atmospheres, 117, https://doi.org/10.1029/2011JD016760, 2012. a
Johnson, B. T., Haywood, J. M., Langridge, J. M., Darbyshire, E., Morgan, W. T., Szpek, K., Brooke, J. K., Marenco, F., Coe, H., Artaxo, P., Longo, K. M., Mulcahy, J. P., Mann, G. W., Dalvi, M., and Bellouin, N.: Evaluation of biomass burning aerosols in the HadGEM3 climate model with observations from the SAMBBA field campaign, Atmos. Chem. Phys., 16, 14657–14685, https://doi.org/10.5194/acp-16-14657-2016, 2016. a
Kandler, K., Benker, N., Bundke, U., Cuevas, E., Ebert, M., Knippertz, P., Rodríguez, S., Schütz, L., and Weinbruch, S.: Chemical composition and complex refractive index of Saharan Mineral Dust at Izaña, Tenerife (Spain) derived by electron microscopy, Atmospheric Environment, 41, 8058–8074, https://doi.org/10.1016/j.atmosenv.2007.06.047, 2007. a, b
Kandler, K., Schütz, L., Deutscher, C., Ebert, M., Hofmann, H., Jäckel, S., Jaenicke, R., Knippertz, P., Lieke, K., Massling, A., Petzold, A., Schladitz, A., Weinzierl, B., Wiedensohler, A., Zorn, S., and Weinbruch, S.: Size distribution, mass concentration, chemical and mineralogical composition and derived optical parameters of the boundary layer aerosol at Tinfou, Morocco, during SAMUM 2006, Tellus, Series B: Chemical and Physical Meteorology, 61, 32–50, https://doi.org/10.1111/j.1600-0889.2008.00385.x, 2009. a, b
Kandler, K., Schneiders, K., Ebert, M., Hartmann, M., Weinbruch, S., Prass, M., and Pöhlker, C.: Composition and mixing state of atmospheric aerosols determined by electron microscopy: method development and application to aged Saharan dust deposition in the Caribbean boundary layer, Atmos. Chem. Phys., 18, 13429–13455, https://doi.org/10.5194/acp-18-13429-2018, 2018. a, b
Karanasiou, A., Moreno, N., Moreno, T., Viana, M., Leeuw, F. D., and Querol, X.: Health effects from Sahara dust episodes in Europe: literature review and research gaps, Environment International, https://doi.org/10.1016/j.envint.2012.06.012, 2012. a
Karyampudi, V. M., Palm, S. P., Reagen, J. A., Fang, H., Grant, W. B., Hoff, R. M., Moulin, C., Pierce, H. F., Torres, O., Browell, E. V., and Melfi, S. H.: Validation of the Saharan Dust Plume Conceptual Model Using Lidar, Meteosat, and ECMWF Data, Bulletin of the American Meteorological Society, 80, 1045–1076, https://doi.org/10.1175/1520-0477(1999)080<1045:VOTSDP>2.0.CO;2, 1999. a
Karydis, V. A., Kumar, P., Barahona, D., Sokolik, I. N., and Nenes, A.: On the effect of dust particles on global cloud condensation nuclei and cloud droplet number: DUST IMPACTS ON CLOUD CONDENSATION NUCLEI, Journal of Geophysical Research, 116, https://doi.org/10.1029/2011JD016283, 2011. a
Karydis, V. A., Tsimpidi, A. P., Bacer, S., Pozzer, A., Nenes, A., and Lelieveld, J.: Global impact of mineral dust on cloud droplet number concentration, Atmos. Chem. Phys., 17, 5601–5621, https://doi.org/10.5194/acp-17-5601-2017, 2017. a
Kezoudi, M., Keleshis, C., Antoniou, P., Biskos, G., Bronz, M., Constantinides, C., Desservettaz, M., Gao, R.-S., Girdwood, J., Harnetiaux, J., Kandler, K., Leonidou, A., Liu, Y., Lelieveld, J., Marenco, F., Mihalopoulos, N., Močnik, G., Neitola, K., Paris, J.-D., Pikridas, M., Sarda-Esteve, R., Stopford, C., Unga, F., Vrekoussis, M., and Sciare, J.: The Unmanned Systems Research Laboratory (USRL): A New Facility for UAV-Based Atmospheric Observations, Atmosphere, 12, https://doi.org/10.3390/atmos12081042, 2021a. a, b, c, d, e
Kezoudi, M., Tesche, M., Smith, H., Tsekeri, A., Baars, H., Dollner, M., Estellés, V., Bühl, J., Weinzierl, B., Ulanowski, Z., Müller, D., and Amiridis, V.: Measurement report: Balloon-borne in situ profiling of Saharan dust over Cyprus with the UCASS optical particle counter, Atmos. Chem. Phys., 21, 6781–6797, https://doi.org/10.5194/acp-21-6781-2021, 2021b. a
Kezoudi, M., Papetta, A., Kandler, K., Ryder, C. L., Leonidou, A., Keleshis, C., Stopford, C., Thornberry, T., Mamouri, R.-E., Sciare, J., and Marenco, F.: Microphysical and Compositional Differences Between Saharan and Middle Eastern Dust Revealed by UAS Observations, EGUsphere [preprint], https://doi.org/10.5194/egusphere-2025-5234, 2025. a, b, c
Klett, J. D.: Lidar inversion with variable backscatter/extinction ratios, Appl. Opt., 24, 1638–1643, https://doi.org/10.1364/AO.25.000833, 1985. a, b
Koch, D. and Del Genio, A. D.: Black carbon semi-direct effects on cloud cover: review and synthesis, Atmos. Chem. Phys., 10, 7685–7696, https://doi.org/10.5194/acp-10-7685-2010, 2010. a
Kok, J. F., Storelvmo, T., Karydis, V. A., Adebiyi, A. A., Mahowald, N. M., Evan, A. T., He, C., and Leung, D. M.: Mineral dust aerosol impacts on global climate and climate change, Nature Reviews Earth & Environment, 4, 71–86, https://doi.org/10.1038/s43017-022-00379-5, 2023. a, b
Kudo, R., Diémoz, H., Estellés, V., Campanelli, M., Momoi, M., Marenco, F., Ryder, C. L., Ijima, O., Uchiyama, A., Nakashima, K., Yamazaki, A., Nagasawa, R., Ohkawara, N., and Ishida, H.: Optimal use of the Prede POM sky radiometer for aerosol, water vapor, and ozone retrievals, Atmos. Meas. Tech., 14, 3395–3426, https://doi.org/10.5194/amt-14-3395-2021, 2021. a
Levin, Z. and Cotton, W. R.: Aerosol pollution impact on precipitation: a scientific review, Springer Nature, https://doi.org/10.1007/978-1-4020-8690-8, 2008. a
Lieke, K., Kandler, K., Scheuvens, D., Emmel, C., Von Glahn, C., Petzold, A., Weinzierl, B., Veira, A., Ebert, M., Weinbruch, S., and Schütz, L.: Particle chemical properties in the vertical column based on aircraft observations in the vicinity of Cape Verde Islands, Tellus B: Chemical and Physical Meteorology, https://doi.org/10.1111/j.1600-0889.2011.00553.x, 2011. a
Lopatin, A., Dubovik, O., Fuertes, D., Stenchikov, G., Lapyonok, T., Veselovskii, I., Wienhold, F. G., Shevchenko, I., Hu, Q., and Parajuli, S.: Synergy processing of diverse ground-based remote sensing and in situ data using the GRASP algorithm: applications to radiometer, lidar and radiosonde observations, Atmos. Meas. Tech., 14, 2575–2614, https://doi.org/10.5194/amt-14-2575-2021, 2021. a
Lorenz, L.: Lysbevægelsen i og uden for en af plane Lysbølger belyst Kugle, Kongelige Danske Videnskabernes Selskabs Skrifter: Naturvidenskabelig og Mathematisk Afdeling, https://books.google.com.cy/books?id=hnE7QwAACAAJ (last access: 23 December 2025), 1890. a
Mahowald, N., Albani, S., Kok, J. F., Engelstaeder, S., Scanza, R., Ward, D. S., and Flanner, M. G.: The size distribution of desert dust aerosols and its impact on the Earth system, Aeolian Research, 15, 53–71, https://doi.org/10.1016/j.aeolia.2013.09.002, 2014. a
Mamouri, R. E. and Ansmann, A.: Fine and coarse dust separation with polarization lidar, Atmos. Meas. Tech., 7, 3717–3735, https://doi.org/10.5194/amt-7-3717-2014, 2014. a
Mamouri, R. E., Ansmann, A., Nisantzi, A., Kokkalis, P., Schwarz, A., and Hadjimitsis, D.: Low Arabian dust extinction-to-backscatter ratio, Geophysical Research Letters, 40, 4762–4766, https://doi.org/10.1002/grl.50898, 2013. a
Mamouri, R.-E., Ansmann, A., Nisantzi, A., Solomos, S., Kallos, G., and Hadjimitsis, D. G.: Extreme dust storm over the eastern Mediterranean in September 2015: satellite, lidar, and surface observations in the Cyprus region, Atmos. Chem. Phys., 16, 13711–13724, https://doi.org/10.5194/acp-16-13711-2016, 2016. a
Marenco, F., Santacesaria, V., Bais, A. F., Balis, D., di Sarra, A., Papayannis, A., and Zerefos, C.: Optical properties of tropospheric aerosols determined by lidar andspectrophotometric measurements (Photochemical Activity and Solar UltravioletRadiation campaign), Appl. Opt., 36, 6875–6886, https://doi.org/10.1364/AO.36.006875, 1997. a
Marenco, F., Johnson, B., Turnbull, K., Newman, S., Haywood, J., Webster, H., and Ricketts, H.: Airborne lidar observations of the 2010 Eyjafjallajökull volcanic ash plume, Journal of Geophysical Research: Atmospheres, 116, https://doi.org/10.1029/2011JD016396, 2011. a
Marenco, F., Ryder, C., Estellés, V., O'Sullivan, D., Brooke, J., Orgill, L., Lloyd, G., and Gallagher, M.: Unexpected vertical structure of the Saharan Air Layer and giant dust particles during AER-D, Atmos. Chem. Phys., 18, 17655–17668, https://doi.org/10.5194/acp-18-17655-2018, 2018. a
Marinou, E., Paschou, P., Tsikoudi, I., Tsekeri, A., Daskalopoulou, V., Kouklaki, D., Siomos, N., Spanakis-Misirlis, V., Voudouri, K. A., Georgiou, T., Drakaki, E., Kampouri, A., Papachristopoulou, K., Mavropoulou, I., Mallios, S., Proestakis, E., Gkikas, A., Koutsoupi, I., Raptis, I. P., Kazadzis, S., Baars, H., Floutsi, A., Pirloaga, R., Nemuc, A., Marenco, F., Kezoudi, M., Papetta, A., Močnik, G., Díez, J. Y., Ryder, C. L., Ratcliffe, N., Kandler, K., Sudharaj, A., and Amiridis, V.: An Overview of the ASKOS Campaign in Cabo Verde, Environmental Sciences Proceedings, p. 200, https://doi.org/10.3390/environsciproc2023026200, 2023. a, b
Mei, F., McMeeking, G., Pekour, M., Gao, R.-S., Kulkarni, G., China, S., Telg, H., Dexheimer, D., Tomlinson, J., and Schmid, B.: Performance Assessment of Portable Optical Particle Spectrometer (POPS), Sensors, 20, https://doi.org/10.3390/s20216294, 2020. a
Middleton, N.: Desert dust hazards: A global review, Aeolian Research, 24, 53–63, https://doi.org/10.1016/j.aeolia.2016.12.001, 2017. a
Mie, G.: Beiträge zur Optik trüber Medien, speziell kolloidaler Metallösungen, Annalen der Physik, 330, 377–445, https://doi.org/10.1002/andp.19083300302, 1908. a
Moteki, N.: Climate-relevant properties of black carbon aerosols revealed by in situ measurements: a review, Progress in Earth and Planetary Science, https://doi.org/10.1186/s40645-023-00544-4, 2023. a
Müller, T., Weinzierl, B., Petzold, A., Kandler, K., Ansmann, A., Mller, D., Tesche, M., Freudenthaler, V., Esselborn, M., Heese, B., Althausen, D., Schladitz, A., Otto, S., and Knippertz, P.: Mineral dust observed with AERONET Sun photometer, Raman lidar, and in situ instruments during SAMUM 2006: Shape-independent particle properties, Journal of Geophysical Research Atmospheres, 115, 1–18, https://doi.org/10.1029/2009JD012520, 2010. a
Müller, D., Veselovskii, I., Kolgotin, A., Tesche, M., Ansmann, A., and Dubovik, O.: Vertical profiles of pure dust and mixed smoke–dust plumes inferred from inversion of multiwavelength Raman/polarization lidar data and comparison to AERONET retrievals and in situ observations, Appl. Opt., 52, 3178–3202, 2013. a
Nakajima, T., Yoon, S.-C., Ramanathan, V., Shi, G.-Y., Takemura, T., Higurashi, A., Takamura, T., Aoki, K., Sohn, B.-J., Kim, S.-W., Tsuruta, H., Sugimoto, N., Shimizu, A., Tanimoto, H., Sawa, Y., Lin, N.-H., Lee, C.-T., Goto, D., and Schutgens, N.: Overview of the Atmospheric Brown Cloud East Asian Regional Experiment 2005 and a study of the aerosol direct radiative forcing in east Asia, Journal of Geophysical Research: Atmospheres, 112, https://doi.org/10.1029/2007JD009009, 2007. a, b
Nickovic, S., Cvetkovic, B., Petkovic, S., Amiridis, V., Pejanovic, G., Solomos, S., Marinou, E., and Nikolic, J.: Cloud icing by mineral dust and impacts to aviation safety, Scientific Reports, 11, 6411, https://doi.org/10.1038/s41598-021-85566-y, 2021. a
Osborne, S. R., Johnson, B. T., Haywood, J. M., Baran, A. J., Harrison, M. A. J., and McConnell, C. L.: Physical and optical properties of mineral dust aerosol during the Dust and Biomass-burning Experiment, J. Geophys. Res., 113, D00C03, https://doi.org/10.1029/2007JD009551, 2008. a
O'Sullivan, D., Marenco, F., Ryder, C. L., Pradhan, Y., Kipling, Z., Johnson, B., Benedetti, A., Brooks, M., McGill, M., Yorks, J., and Selmer, P.: Models transport Saharan dust too low in the atmosphere: a comparison of the MetUM and CAMS forecasts with observations, Atmos. Chem. Phys., 20, 12955–12982, https://doi.org/10.5194/acp-20-12955-2020, 2020. a, b, c
Papetta, A.: Dataset for 'Volume-to-extinction ratio: An important property of dust' by Papetta A et al., Zenodo [data set], https://doi.org/10.5281/zenodo.15910856, 2025. a
Papetta, A., Marenco, F., Kezoudi, M., Mamouri, R.-E., Nisantzi, A., Baars, H., Popovici, I. E., Goloub, P., Victori, S., and Sciare, J.: Lidar depolarization characterization using a reference system, Atmos. Meas. Tech., 17, 1721–1738, https://doi.org/10.5194/amt-17-1721-2024, 2024. a
Paschou, P., Siomos, N., Tsekeri, A., Louridas, A., Georgoussis, G., Freudenthaler, V., Binietoglou, I., Tsaknakis, G., Tavernarakis, A., Evangelatos, C., von Bismarck, J., Kanitz, T., Meleti, C., Marinou, E., and Amiridis, V.: The eVe reference polarisation lidar system for the calibration and validation of the Aeolus L2A product, Atmos. Meas. Tech., 15, 2299–2323, https://doi.org/10.5194/amt-15-2299-2022, 2022. a
Proestakis, E., Papachristopoulou, K., Georgiou, T., Chatoutsidou, S. E., Lazaridis, M., Gkikas, A., Fountoulakis, I., Tsikoudi, I., Petrakis, M. P., and Amiridis, V.: Atmospheric dust and air quality over large-cities and megacities of the world, Atmos. Chem. Phys., 25, 14777–14823, https://doi.org/10.5194/acp-25-14777-2025, 2025. a
Prospero, J. M., Collard, F.-X., Molinié, J., and Jeannot, A.: Characterizing the annual cycle of African dust transport to the Caribbean Basin and South America and its impact on the environment and air quality, Global Biogeochemical Cycles, 28, 757–773, https://doi.org/10.1002/2013GB004802, 2014. a
Robock, A.: Volcanic eruptions and climate, Rev. Geophys., https://doi.org/10.1029/1998rg000054, 2000. a
Rosenfeld, D., Rudich, Y., and Lahav, R.: Desert dust suppressing precipitation: A possible desertification feedback loop, Proceedings of the National Academy of Sciences of the United States of America, 98, 5975–5980, https://doi.org/10.1073/pnas.101122798, 2001. a
Ryder, C. L., Highwood, E. J., Rosenberg, P. D., Trembath, J., Brooke, J. K., Bart, M., Dean, A., Crosier, J., Dorsey, J., Brindley, H., Banks, J., Marsham, J. H., McQuaid, J. B., Sodemann, H., and Washington, R.: Optical properties of Saharan dust aerosol and contribution from the coarse mode as measured during the Fennec 2011 aircraft campaign, Atmos. Chem. Phys., 13, 303–325, https://doi.org/10.5194/acp-13-303-2013, 2013. a
Ryder, C. L., McQuaid, J. B., Flamant, C., Rosenberg, P. D., Washington, R., Brindley, H. E., Highwood, E. J., Marsham, J. H., Parker, D. J., Todd, M. C., Banks, J. R., Brooke, J. K., Engelstaedter, S., Estelles, V., Formenti, P., Garcia-Carreras, L., Kocha, C., Marenco, F., Sodemann, H., Allen, C. J. T., Bourdon, A., Bart, M., Cavazos-Guerra, C., Chevaillier, S., Crosier, J., Darbyshire, E., Dean, A. R., Dorsey, J. R., Kent, J., O'Sullivan, D., Schepanski, K., Szpek, K., Trembath, J., and Woolley, A.: Advances in understanding mineral dust and boundary layer processes over the Sahara from Fennec aircraft observations, Atmos. Chem. Phys., 15, 8479–8520, https://doi.org/10.5194/acp-15-8479-2015, 2015a. a, b
Ryder, C. L., McQuaid, J. B., Flamant, C., Rosenberg, P. D., Washington, R., Brindley, H. E., Highwood, E. J., Marsham, J. H., Parker, D. J., Todd, M. C., Banks, J. R., Brooke, J. K., Engelstaedter, S., Estelles, V., Formenti, P., Garcia-Carreras, L., Kocha, C., Marenco, F., Sodemann, H., Allen, C. J. T., Bourdon, A., Bart, M., Cavazos-Guerra, C., Chevaillier, S., Crosier, J., Darbyshire, E., Dean, A. R., Dorsey, J. R., Kent, J., O'Sullivan, D., Schepanski, K., Szpek, K., Trembath, J., and Woolley, A.: Advances in understanding mineral dust and boundary layer processes over the Sahara from Fennec aircraft observations, Atmos. Chem. Phys., 15, 8479–8520, https://doi.org/10.5194/acp-15-8479-2015, 2015b. a
Ryder, C. L., Marenco, F., Brooke, J. K., Estelles, V., Cotton, R., Formenti, P., McQuaid, J. B., Price, H. C., Liu, D., Ausset, P., Rosenberg, P. D., Taylor, J. W., Choularton, T., Bower, K., Coe, H., Gallagher, M., Crosier, J., Lloyd, G., Highwood, E. J., and Murray, B. J.: Coarse-mode mineral dust size distributions, composition and optical properties from AER-D aircraft measurements over the tropical eastern Atlantic, Atmos. Chem. Phys., 18, 17225–17257, https://doi.org/10.5194/acp-18-17225-2018, 2018. a, b, c, d, e
Ryder, C. L., Highwood, E. J., Walser, A., Seibert, P., Philipp, A., and Weinzierl, B.: Coarse and giant particles are ubiquitous in Saharan dust export regions and are radiatively significant over the Sahara, Atmos. Chem. Phys., 19, 15353–15376, https://doi.org/10.5194/acp-19-15353-2019, 2019. a, b
Ryder, C. L., Bézier, C., Dacre, H. F., Clarkson, R., Amiridis, V., Marinou, E., Proestakis, E., Kipling, Z., Benedetti, A., Parrington, M., Rémy, S., and Vaughan, M.: Aircraft engine dust ingestion at global airports, Nat. Hazards Earth Syst. Sci., 24, 2263–2284, https://doi.org/10.5194/nhess-24-2263-2024, 2024. a
Schumann, U., Mayer, B., Gierens, K., Unterstrasser, S., Jessberger, P., Petzold, A., Voigt, C., and Gayet, J. F.: Effective radius of ice particles in cirrus and contrails, Journal of the Atmospheric Sciences, 68, 300–321, https://doi.org/10.1175/2010JAS3562.1, 2011. a, b
Seinfeld, J. H. and Pandis, N. S.: Atmospheric chemistry and physics: from air pollution to climate change, J. Wiley, ISBN 0471720178, 2006. a
Sinyuk, A., Holben, B. N., Eck, T. F., Giles, D. M., Slutsker, I., Korkin, S., Schafer, J. S., Smirnov, A., Sorokin, M., and Lyapustin, A.: The AERONET Version 3 aerosol retrieval algorithm, associated uncertainties and comparisons to Version 2, Atmos. Meas. Tech., 13, 3375–3411, https://doi.org/10.5194/amt-13-3375-2020, 2020. a
Smith, H. R., Ulanowski, Z., Kaye, P. H., Hirst, E., Stanley, W., Kaye, R., Wieser, A., Stopford, C., Kezoudi, M., Girdwood, J., Greenaway, R., and Mackenzie, R.: The Universal Cloud and Aerosol Sounding System (UCASS): a low-cost miniature optical particle counter for use in dropsonde or balloon-borne sounding systems, Atmos. Meas. Tech., 12, 6579–6599, https://doi.org/10.5194/amt-12-6579-2019, 2019. a, b
Stein, A. F., Draxler, R. R., Rolph, G. D., Stunder, B. J. B., Cohen, M. D., and Ngan, F.: NOAA's HYSPLIT Atmospheric Transport and Dispersion Modeling System, Bulletin of the American Meteorological Society, 96, 2059–2077, https://doi.org/10.1175/BAMS-D-14-00110.1, 2015. a, b
Teri, M., Gasteiger, J., Heimerl, K., Dollner, M., Schöberl, M., Seibert, P., Tipka, A., Müller, T., Aryasree, S., Kandler, K., and Weinzierl, B.: Pollution affects Arabian and Saharan dust optical properties in the eastern Mediterranean, Atmos. Chem. Phys., 25, 6633–6662, https://doi.org/10.5194/acp-25-6633-2025, 2025. a, b, c, d, e
Tsamalis, C., Chédin, A., Pelon, J., and Capelle, V.: The seasonal vertical distribution of the Saharan Air Layer and its modulation by the wind, Atmos. Chem. Phys., 13, 11235–11257, https://doi.org/10.5194/acp-13-11235-2013, 2013. a
Tsekeri, A., Gialitaki, A., Di Paolantonio, M., Dionisi, D., Liberti, G. L., Fernandes, A., Szkop, A., Pietruczuk, A., Pérez-Ramírez, D., Granados Muñoz, M. J., Guerrero-Rascado, J. L., Alados-Arboledas, L., Bermejo Pantaleón, D., Bravo-Aranda, J. A., Kampouri, A., Marinou, E., Amiridis, V., Sicard, M., Comerón, A., Muñoz-Porcar, C., Rodríguez-Gómez, A., Romano, S., Perrone, M. R., Shang, X., Komppula, M., Mamouri, R.-E., Nisantzi, A., Hadjimitsis, D., Navas-Guzmán, F., Haefele, A., Szczepanik, D., Tomczak, A., Stachlewska, I. S., Belegante, L., Nicolae, D., Voudouri, K. A., Balis, D., Floutsi, A. A., Baars, H., Miladi, L., Pascal, N., Dubovik, O., and Lopatin, A.: Combined sun-photometer–lidar inversion: lessons learned during the EARLINET/ACTRIS COVID-19 campaign, Atmos. Meas. Tech., 16, 6025–6050, https://doi.org/10.5194/amt-16-6025-2023, 2023. a
Turnbull, K., Johnson, B., Marenco, F., Haywood, J., Minikin, A., Weinzierl, B., Schlager, H., Schumann, U., Leadbetter, S., and Woolley, A.: A case study of observations of volcanic ash from the Eyjafjallajökull eruption: 1. In situ airborne observations, Journal of Geophysical Research: Atmospheres, 117, https://doi.org/10.1029/2011JD016688, 2012. a
Ukhov, A., Ahmadov, R., Grell, G., and Stenchikov, G.: Improving dust simulations in WRF-Chem v4.1.3 coupled with the GOCART aerosol module, Geosci. Model Dev., 14, 473–493, https://doi.org/10.5194/gmd-14-473-2021, 2021. a
Van de Hulst, H. C.: Light Scattering by Small Particles, John Wiley and Sons, https://doi.org/10.1063/1.3060205, 1957. a
van der Does, M., Korte, L. F., Munday, C. I., Brummer, G.-J. A., and Stuut, J.-B. W.: Particle size traces modern Saharan dust transport and deposition across the equatorial North Atlantic, Atmos. Chem. Phys., 16, 13697–13710, https://doi.org/10.5194/acp-16-13697-2016, 2016. a
van der Does, M., Knippertz, P., Zschenderlein, P., Harrison, R. G., and Stuut, J.-B. W.: The mysterious long-range transport of giant mineral dust particles, Science Advances, 4, eaau2768, https://doi.org/10.1126/sciadv.aau2768, 2018. a
Wadell, H.: Volume, Shape, and Roundness of Quartz Particles, The Journal of Geology, https://doi.org/10.1086/624298, 1935. a
Weinzierl, B., Petzold, A., Esselborn, M., Wirth, M., Rasp, K., Kandler, K., Schütz, L., Koepke, P., and Fiebig, M.: Airborne measurements of dust layer properties, particle size distribution and mixing state of Saharan dust during SAMUM 2006, Tellus B, 61, 96–117, https://doi.org/10.1111/j.1600-0889.2008.00392.x, 2009. a, b, c
Weinzierl, B., Sauer, D., Esselborn, M., Petzold, A., Veira, A., Rose, M., Mund, S., Wirth, M., Ansmann, A., Tesche, M., Gross, S., and Freudenthaler, V.: Microphysical and optical properties of dust and tropical biomass burning aerosol layers in the Cape Verde region – an overview of the airborne in situ and lidar measurements during SAMUM-2, Tellus B, 63, 589–618, https://doi.org/10.1111/j.1600-0889.2011.00566.x, 2011. a
Weinzierl, B., Ansmann, A., Prospero, J. M., Althausen, D., Benker, N., Chouza, F., Dollner, M., Farrell, D., Fomba, W. K., Freudenthaler, V., Gasteiger, J., Groß, S., Haarig, M., Heinold, B., Kandler, K., Kristensen, T. B., Mayol-Bracero, O. L., Müller, T., Reitebuch, O., Sauer, D., Schäfler, A., Schepanski, K., Spanu, A., Tegen, I., Toledano, C., and Walser, A.: The Saharan Aerosol Long-Range Transport and Aerosol–Cloud-Interaction Experiment: Overview and Selected Highlights, Bulletin of the American Meteorological Society, 98, 1427–1451, https://doi.org/10.1175/BAMS-D-15-00142.1, 2017. a, b
Welton, E. J., Campbell, J. R., Spinhirne, J. D., and Scott III, V. S.: Global monitoring of clouds and aerosols using a network of micropulse lidar systems, in: Lidar Remote Sensing for Industry and Environment Monitoring, edited by: Singh, U. N., Asai, K., Ogawa, T., Singh, U. N., Itabe, T., and Sugimoto, N., Vol. 4153, 151–158, International Society for Optics and Photonics, SPIE, https://doi.org/10.1117/12.417040, 2001. a
Winker, D. M., Vaughan, M. A., Omar, A., Hu, Y., Powell, K. A., Liu, Z., Hunt, W. H., and Young, S. A.: Overview of the CALIPSO Mission and CALIOP Data Processing Algorithms, Journal of Atmospheric and Oceanic Technology, 26, 2310–2323, https://doi.org/10.1175/2009JTECHA1281.1, 2009. a
Zaehle, S., Ciais, P., Friend, A. D., and Prieur, V.: Carbon benefits of anthropogenic reactive nitrogen offset by nitrous oxide emissions, Nature Geoscience, https://doi.org/10.1038/ngeo1207, 2011. a
Zhao, C., Liu, X., Leung, L. R., Johnson, B., McFarlane, S. A., Gustafson Jr., W. I., Fast, J. D., and Easter, R.: The spatial distribution of mineral dust and its shortwave radiative forcing over North Africa: modeling sensitivities to dust emissions and aerosol size treatments, Atmos. Chem. Phys., 10, 8821–8838, https://doi.org/10.5194/acp-10-8821-2010, 2010. a
Zhao, G., Li, F., and Zhao, C.: Determination of the refractive index of ambient aerosols, Atmospheric Environment, 240, 117800, https://doi.org/10.1016/j.atmosenv.2020.117800, 2020. a
- Abstract
- Introduction
- Particle microphysical and optical properties, and the volume-to-extinction ratio
- Observational datasets and models
- Methodology
- Results
- Conclusions
- Appendix A: HYSPLIT
- Data availability
- Author contributions
- Competing interests
- Disclaimer
- Acknowledgements
- Financial support
- Review statement
- References