the Creative Commons Attribution 4.0 License.
the Creative Commons Attribution 4.0 License.
 | 06 Feb 2026
Modelling the impact of anthropogenic aerosols on CCN concentrations over a rural boreal forest environment
Metin Baykara
Carlton Xavier
Putian Zhou
Juniper Tyree
Benjamin Foreback
Mikko Äijälä
Frans Graeffe
Tuukka Petäjä
Markku Kulmala
Pauli Paasonen
Paul I. Palmer
Michael Boy
The radiative properties of clouds depend partially on the cloud droplet number concentration, which is determined by the concentration of cloud condensation nuclei (CCN) when the clouds are formed. In turn, CCN concentrations are determined by the atmospheric particle size distribution and their chemical composition. We use a novel Lagrangian modelling framework to examine the origins and history of gas and aerosol components observed at the boreal forest measurement site SMEAR II, and their potential to act as CCN. This framework combines: (a) global emission datasets, (b) backward trajectories from the FLEXible PARTicle dispersion model (FLEXPART) airmass dispersion model, (c) a detailed description of atmospheric chemistry and aerosol dynamics from the Model to Simulate the Concentration of Organic Vapours, Sulphuric Acid and Aerosol Particles (SOSAA). We apply this SOSAA-FP (FP standing for FLEXPART) framework to simulate a period from March to October 2018 with 1 h time resolution, focusing on the concentrations of CCN between 0.1 % and 1.2 % maximum supersaturation as calculated by the κ-Köhler theory (with respective dry particle diameter of activation ca. 175–35 nm). We find that the model PM1 fraction of primary particles, sulfates and secondary organic aerosol correlate well with the observed organic aerosol and sulfate trends and explain most of the observed organic aerosol and sulfate PM1 mass. Our results show that primary particle emissions play a considerable role in CCN concentrations even at a rural site such as SMEAR II. Changes in atmospheric cluster formation rates had a relatively weak impact on the CCN concentrations in the sensitivity runs. Enhanced cluster formation increased (decreased) the CCN concentrations for the highest (lowest) maximum supersaturation. Without any cluster formation our modelled median CCN concentrations changed by −48 % and +23 % for supersaturations of 1.2 % and 0.1 %, respectively, whereas omitting primary particle emissions had a decreasing effect in all calculated CCN supersaturation classes (−82 % and −33 % decrease in median CCN of 1.2 % and 0.1 % supersaturation, respectively). While the enhancing effect of cluster formation to high supersaturation (i.e., small diameter) CCN concentrations is unsurprising, the weak sensitivity to cluster formation rates and the decreasing effect to lowest supersaturation CCN was unexpected, as was the strong influence of anthropogenic primary emissions. The Lagrangian model framework showed its power, as it was possible to trace down the causes behind the unexpected outcomes by comparing how the particle population evolved along the trajectories in different sensitivity tests.
- Article
(9348 KB) - Full-text XML
-
Supplement
(6506 KB) - BibTeX
- EndNote


The atmospheric energy budget is heavily influenced by water in all its phases. Undoubtedly the liquid and solid phases – found prominently in clouds – are far more complex when it comes to quantifying their influence on radiative forcing (RF). Clouds affect the path and intensity of downward and upward radiation in visible and thermal wavelengths by absorption and scattering. Broadly, the process of forming cloud droplets requires two ingredients: first, excess moisture – above 100 % relative humidity, i.e. supersaturation state – and second, the presence of cloud condensation nuclei (CCN), which act as condensation seeds for heterogeneous nucleation of water. The first condition is usually met where moist air is being lifted by convection, and the adiabatic cooling of the air brings the vapour below the dew point. Depending on the updraft velocity, which roughly determines the maximum achievable supersaturation, the critical diameter of the CCN (i.e. diameter above which over 50 % of particles activate), is commonly found between 40 and 100 nm (Dusek et al., 2006), or even below (Svensmark et al., 2024).
CCN can originate from primary particles that are directly emitted to the atmosphere (and possibly processed further in the atmosphere), or from new particle formation (NPF), where the particles are formed through clustering and condensational growth of atmospheric vapours. These two sources are separate only in the most ideal sense; in the atmosphere, particles are mixed due to coagulation, and secondary aerosol mass forms via gas-to-particle partitioning on both primary and NPF-particles. Consequently, our definition that demarcates the two processes is not clearly defined and remains difficult to determine with measurements alone (Kerminen et al., 2012). The origins of CCN are relevant to future climate predictions as it is likely that the anthropogenic emissions of primarily emitted particles and the precursor gases involved in NPF will change with emission mitigation policies and will likely change further in the coming years due to the transition of fossil fuel based energy production and transport to renewables and nuclear energy.
NPF is estimated to contribute to a significant fraction of the global CCN. Paasonen et al. (2013) estimated that approximately half of the PN100 nm particles (corresponding approximately 0.2 %–0.3 % supersaturation) in continental Europe originate from direct primary emissions, that is, emissions of particles larger than 100 nm in diameter, while the rest is resulting from the growth of both NPF and emitted particles. Several model studies have shown that globally, about half of all CCN are secondary organic aerosol particles originating from NPF (Merikanto et al., 2009; Yu and Luo, 2009; Gordon et al., 2017), while other model studies suggest more modest effect. Pierce and Adams (2009) saw 12 % change in the average global boundary layer CCN0.2 % concentrations when nucleation rates were changed within 6 orders of magnitude, while Reddington et al. (2011) were able to reproduce boundary layer CCN50 nm to a good degree (R2 0.8, NMB −18 %) without any nucleation on 15 European observation sites during the EUCAARI campaign in May 2008 using a global aerosol microphysics model. Gordon et al. (2017) estimated that NPF accounted for 54 % of the global CCN at 0.2 % supersaturation in the present-day environment. Pierce et al. (2014) reached a similar conclusion for particles between 50–100 nm diameter in a 1-year size distribution measurements at Egbert, Canada. Estimates vary still markedly depending on the location, anthropogenic influence and size class, and in general modelling the effect of NPF to CCN remains difficult (Ren et al., 2021).
Considerable work has been done to understand cluster formation in different conditions and geographical locations (e.g. Hirsikko et al., 2011; Kirkby et al., 2011; Almeida et al., 2013; Riccobono et al., 2014; Dunne et al., 2016; Chamba et al., 2023; Zhao et al., 2024). The starting point of NPF, formation of stable clusters, is known to occur through clustering of sulfuric acid and basic compounds such as ammonia or amines (Sipilä et al., 2010), but other pathways, involving for example large organic molecules or iodic acids are being observed in different environments and laboratory experiments (Elm et al., 2020; Zhao et al., 2024). Besides the rate of cluster formation, it is also important to consider their growth rates, as the clusters are quickly scavenged by larger particles. The growth of the sub-10 nm clusters is believed to come largely through condensation of (usually highly oxygenated) extremely low volatility organic vapours and sulfuric acid (Ehn et al., 2014). Consequently, it is important to understand the emission of VOCs and their subsequent oxidation and partitioning within the aerosol size distribution. Oxidation of the most abundant emitted biogenic volatile organic compounds (BVOC), isoprene, monoterpenes and sesquiterpenes, are known to produce a vast spectrum of low volatility vapours, many of which can condense on the smallest particle sizes, or even participate in cluster formation (Dada et al., 2023). Modelling particle growth via condensation of organic vapours is usually based on the saturation vapour pressure of the oxidation products, or parametrised in terms of mass yield, as is often done in global models. Regarding anthropogenic VOC emissions (AVOC), most models lack a mechanistic understanding of their autoxidation and the resulting components, contributing to the uncertainty in estimating human influence on secondary organic aerosol (SOA) formation and thereby CCN concentrations in urban areas. Steps towards closing this knowledge gap have been taken in the recent years (Garmash et al., 2020; Wang et al., 2021; Pichelstorfer et al., 2024). There is also evidence of heterogeneous chemistry between VOC oxidation products and aerosols, affecting SOA yields, but the global implications of these processes are still unclear.
Studies have linked BVOC emissions to CCN concentrations (e.g. Riipinen et al., 2011; Paasonen et al., 2013; Petäjä et al., 2021; Yli-Juuti et al., 2021), but due to the intertwined nature of primary and secondary aerosols, it is not clear how much of this link translates to the contribution of cluster formation specifically and NPF in general. Atmospheric chemical composition and aerosol processes in a particular location is generally affected by the airmass history, especially for components with long atmospheric lifetimes and processes with long timescales. While CCN concentrations are linked to high SOA mass and increased temperatures along trajectories, from local observations it is not clear what are the underlying independent processes during the upstream history of the airmasses. Assuming that local observations of aerosol processes are also taking place at a regional scale can lead to erroneous conclusions about the aerosol dynamics. For example, Hakala et al. (2023) showed that the apparent shrinkage of nucleation mode particles at Hada al Sham, Saudi-Arabia, was simply due to development of air mass transport in a manner that the particles arriving to the observation site during the afternoon/evening had grown less than those arriving before them, due to spatial and temporal heterogeneities in concentrations of vapours causing the growth. Studies at SMEAR II (Station for Measuring Ecosystem-Atmosphere Relations) station at Hyytiälä, Finland, have linked local NPF events to airmass trajectories arriving from the north-westerly or north-easterly direction over the North Atlantic or Arctic Ocean, consistent with conditions such as low condensation sink, ample short wave radiation and availability of sulfuric acid (Riuttanen et al., 2013; Vana et al., 2016; Dada et al., 2017). These conditions are somewhat different from those when high SOA loadings and increased temperatures along trajectory are observed. This implies that cluster formation and CCN formation are in general decoupled, and a favourable sequence of events is necessary for cluster formation to lead to CCN. Such would be the case of marine air arriving and advecting over forested area, eventually leading to increased CCN concentrations. However, the difficulty of separating primary particle emissions from secondary aerosol formation remains, as observation-based models aiming to describe measured aerosol types often struggle to classify aerosols as secondary or primary, and need very detailed chemical information to succeed (Zhang et al., 2009).
In this article, we utilize a one-dimensional aerosol and chemistry Lagrangian transport model to quantify the contributions of biogenic and anthropogenic secondary aerosol formation and primary anthropogenic emissions on the observed number concentrations and composition of CCN, and demonstrate how the seasonal variation of BVOC emissions and variability of the origins of the airmasses influences these contributions. We describe our recently developed modelling framework which can utilize detailed aerosol process models on the necessary spatial scale to describe the airmass history at least one week backwards. We have used it to address the following questions: (1) how much of the given CCN number concentration or composition at the SMEAR II station in rural Southern Finland can be attributed to primary or secondary sources? (2) how sensitive is the CCN number concentration to changes in emissions of some key ingredients and cluster formation rates? and (3) given possible future changes in the tested parameters, what can we expect to happen to CCN number concentrations? We concentrate here on three components that affect CCN concentration: cluster formation rates (NUC), anthropogenic primary number emissions (PNE) and BVOC emissions (BIO). For the benefit of the reader, Table 1 describes the abbreviations frequently used in this paper.
The following sections describe the SOSAA-FLEXPART (later, SOSAA-FP) modelling framework, consisting of SOSAA (model to Simulate the concentrations of Organic vapours, Sulphuric Acid and Aerosols, e.g. Zhou et al., 2017; Chen et al., 2021; Boy et al., 2022) and FLEXPART (FLEXible PARTicle dispersion model, Stohl et al., 1998, 2005; Stohl and Thomson, 1999; Pisso et al., 2019; FLEXPART Contributors, 2020) models, and its input data. In addition to a general overview, the individual steps necessary to use the SOSAA column model are described. We also include a description of the measurement data used to evaluate the model. For brevity, some details are left to the Supplement.
2.1 SOSAA-FLEXPART model framework (SOSAA-FP)
The SOSAA-FP framework simulates the effects of emissions, atmospheric chemistry, physics and meteorology on particle number size distribution, composition and gaseous compound concentrations during the long-distance transport to a chosen point location. SOSAA-FP uses global, gridded emission, concentration and meteorological data and is therefore not dependent on the availability of measurements at the location. However, as comparing a model to observations is beneficial in evaluating its performance, we chose SMEAR II as the end point of the trajectories.
SOSAA-FP consists of a one-dimensional column model SOSAA, that simulates atmospheric chemistry and aerosol physics along a FLEXPART trajectory. Nominally, the model follows a mean airmass trajectory, which is calculated in advance using FLEXPART in backward mode. During the SOSAA simulation, the model is constrained by meteorological conditions (we used ERA5: fifth generation of ECMWF atmospheric reanalyses of the global climate dataset, Hersbach et al., 2020, 2023) at the mean location of the transported air parcels. The concentrations of all gas phase compounds are calculated by the SOSAA chemistry module based on the emissions (and meteorology) along the trajectory, except for [O3] that was read in throughout the simulation from the CAMS global atmospheric composition dataset. In addition, [CO] and [SO2] were initialized using CAMS data. Similarly, the aerosol size distribution, concentrations and composition are calculated by the aerosol module. The chemistry and aerosol modules are updated with the mean emissions at any given location. These means were calculated using FLEXPART's Source Receptor Relationship output as weighting factors, and are discussed in more detail in Sect. 2.1.2. The losses of the gases and particles are modelled with a simplified dry deposition to the ground and vegetation, further discussed in Sect. 2.1.3. The SOSAA-FP framework is schematically presented in Fig. 1. Each simulated trajectory contains the history of the airmass arriving at the station at a given time, shown in Fig. 1 with the red frames. When the procedure is repeated for a set of trajectories, a time series at the station is obtained, represented in the schematics by the bottom surface plot showing the time series of the vertical profile of HOM monomer concentrations.
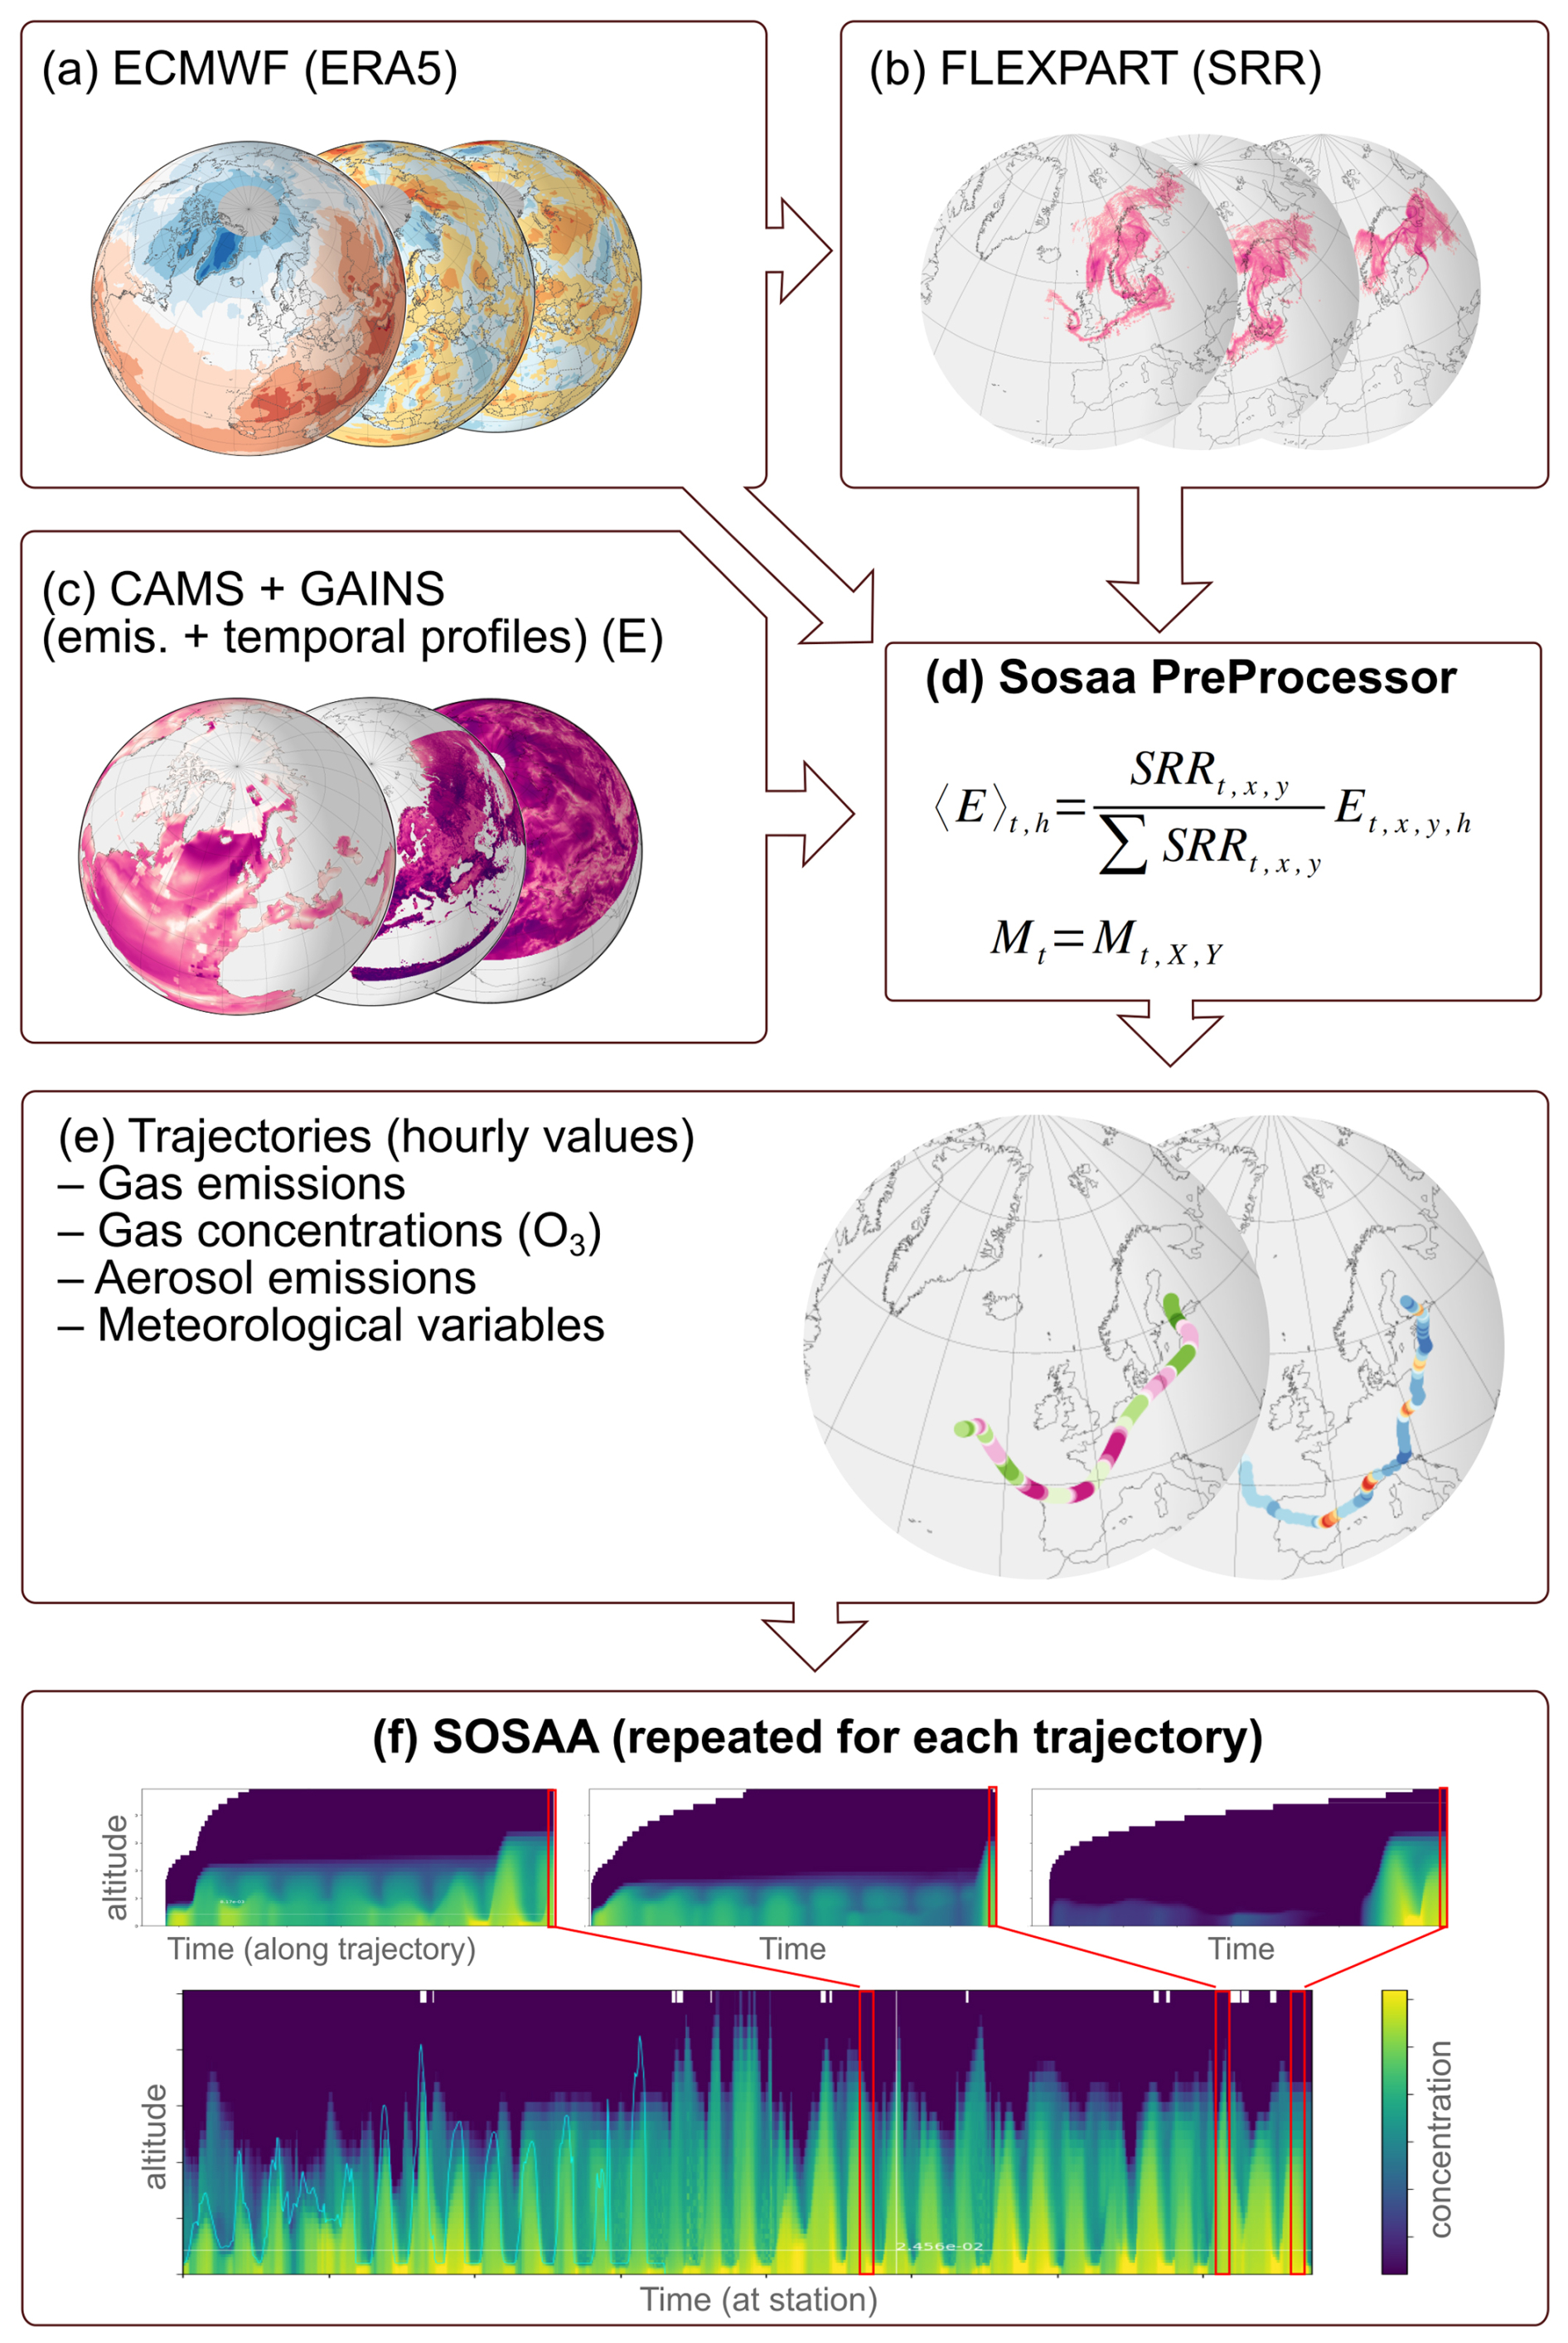
Figure 1Schematic workflow of the SOSAA-FP framework. The boxes show the main steps taken to arrive at the results presented in this work, including (a) collection of reanalysis datasets from ERA5, (b) calculation of SRR (source-receptor relationship) with the airmass dispersion model FLEXPART, (c) collection of emission data from CAMS and GAINS, (d) processing data in (a)–(c) in to SOSAA input data, (e) collection of SOSAA input data, (f) chemical and aerosol transport simulation along trajectories with SOSAA. Bolded headlines show tools which are developed for this work. The arrows show the direction of the input data flow.
The SOSAA-FP framework involves many pre- and post-processing steps before the SOSAA model can be run. We have made these processes easier with a suite of processing scripts, which streamlines the data processing on an HPC computer. Similarly to the ARCA-box (Atmospherically Relevant Chemistry and Aerosol model, Clusius et al., 2022), the SOSAA trajectory model has a graphical user interface, which can be used in setting up the model and data analysis. With this software suite the SOSAA-FP framework can be straightforwardly applied from scratch to model any location on the globe, without the need to acquire site-specific input data for the models.
2.1.1 Flexpart trajectories
FLEXPART (FLEXible PARTicle dispersion model, Stohl et al., 1998, 2005; Stohl and Thomson, 1999; Pisso et al., 2019) is a dispersion model used to trace airmasses both in the forward-time and backward-time mode (Seibert and Frank, 2004). In this study FLEXPART was used in the backward mode. FLEXPART needs gridded meteorological reanalysis data, and in this study, we used ERA5 dataset (Copernicus Climate Change Service, Hersbach et al., 2023), extracted in 0.5° × 0.5° horizontal resolution and 137 (hybrid) vertical layers. FLEXPART starts with a predetermined number of particles (in this study inert and massless tracers), and disperses them forward or backward in time. This leads to a plume of tracers, generally spreading more the further away the air masses are from the release location. One of FLEXPART's outputs is the Source Receptor Relationship (SRR, in unit of seconds), which describes the time the air parcels are affected by emissions at different locations. When multiplied with the gridded emission fluxes, one gets the concentration at the receptor (the tracer release locations). Each output time (1 h interval) FLEXPART uses k-means clustering to group the dispersed particles into a few (in our case five) clusters, whose centre of mass locations are saved separately. From these clusters a single mean trajectory line is also calculated. In this study, some of the meteorological data (temperature, pressure, humidity, friction velocity and land-sea mask) was extracted from the single trajectory points from the ERA5 data, whereas the SRR-weighted means were used for all emissions, short wave radiation, leaf area index and albedo. The hourly mean mixing heights are calculated by FLEXPART using the lowest altitude where the Richardson number exceeds 0.25, and by taking a weighted mean of the tracer plume.
2.1.2 Emission Inputs
Since the SOSAA model is a one-dimensional column model which is only run once per trajectory, the three-dimensional emission and airmass dispersion fields need to be averaged to represent a mean trajectory. In order to calculate the mean emissions at any given time, normalized SRR were used as weighting factors in a pre-processing step (SOSAA PreProcessor, SPP, discussed in detail in the Supplement). In this study, the anthropogenic gas emissions come from Copernicus Atmosphere Monitoring Service (CAMS, Granier et al., 2019), specifically CAMS-GLOB-ANT dataset which is a globally gridded anthropogenic emissions inventory based on emissions provided by Emissions Database for Global Atmospheric Research (EDGAR) developed at Joint Research Center (JRC) (https://edgar.jrc.ec.europa.eu/, last access: 24 January 2025, Crippa et al., 2018), and Community Emissions Data System (CEDS) (Hoesly et al., 2018). CAMS-GLOB-ANT dataset has a spatial resolution of 0.1° × 0.1° in latitude and longitude and provides monthly averages of the global emissions of 36 compounds, 25 of which are speciated volatile organic compounds (Huang et al., 2017), including the main air pollutants such as NOx, NH3, SO2, CO and CH4 for 16 emission sectors. These emission sectors are based on GFNR (Gridded Nomenclature For Reporting) sector classification. The methodology of how these emissions were generated for the 2000–2023 period is explained in detail by Soulie et al. (2024). To convert these emissions to hourly data CAMS-GLOB-TEMPO (Guevara et al., 2021) global emission temporal profiles are used. This temporal profile dataset has a spatial resolution of 0.1° × 0.1° in latitude and longitude and includes monthly, weekly (day-of-the-week), daily (day-of-the-year) and diurnal temporal profiles for the main air pollutants (NOx, SO2, NMVOC, NH3, CO and PM2.5, here used for number emissions of PN1 µm) and the greenhouse gases (CO2 and CH4). Temporal profiles are mainly for the following sectors; energy industry, refineries, residential combustion, manufacturing industry, road transport, aviation and agriculture.
For the biogenic gaseous emissions, CAMS-GLOB-BIO and CAMS-GLOB-OCE datasets were used. The emissions of BVOCs from vegetation were calculated with ERA5 meteorology and static land cover using the Model of Emissions of Gases and Aerosols from Nature (MEGAN v2.10, Guenther et al., 2012) on a 0.25° × 0.25° grid as monthly mean values as well as monthly mean daily profiles (Sindelarova et al., 2022). These emissions include 25 BVOC species and chemical groups. Along with BVOCs from vegetation, SPP also process oceanic biogenic emissions using CAMS-GLOB-OCE dataset, and in this study emissions of dimethyl sulphide (DMS) with a grid resolution of 0.5° × 0.5° and hourly temporal resolution were used.
Particle number emissions (PNE) and the respective particle size distributions (PSD) are obtained from Paasonen et al. (2016). This emission data set utilises the activity, technology, fuel and spatial gridding data from the GAINS model (Amann et al., 2011), more exactly for year 2020 within the ECLIPSE v5 CLE baseline scenario (Klimont et al., 2017). These data are combined with particle number emission factors developed by Paasonen et al. (2016), based on the European PNE inventory generated by Netherlands Organisation for Applied Scientific Research (van der Gon et al., 2009) during the EUCAARI project (Kulmala et al., 2011), but updated in terms of emission factors and size distributions for several source sectors, including road transport (based on TRANSPHORM database, Vouitsis et al., 2013) and residential combustion (based on wide literature review, Paasonen et al., 2016, and references therein), thus covering the dominant source sectors in European context. The diameter ranges of the size classes applied in the GAINS emissions are 3–10, 10–20, 20–30, 30–50, 50–70, 70–100, 100–200, 200–400, and 400–1000 nm. Since the GAINS size distribution is much coarser than that in SOSAA, using the emissions directly in SOSAA would have led to strong artefacts in the final modelled particle size distribution, and to overcome this, a smoothing function was applied to the calculated emissions that preserved the total PM1, PN1 and the bin number concentration as well as possible (PN1 and PM1 error in the smoothed emissions was typically less than 0.5 %). The number emissions of the coarse mode (starting from around 230 nm) were gradually reduced in the attempt to have a better closure between the emitted masses calculated from PN1 and PM1 from ECLIPSE V6b Baseline scenario (Klimont et al., 2017). The scaling is further discussed in the Supplement.
Even though CAMS and GAINS datasets were used in this study, SPP can be easily configured to use any type of emissions inventories. For our purposes, the chosen datasets were most suitable as they are readily available and consistent with our modelling domain and general spatio-temporal resolution. The methods used in SPP to calculate the mean emissions along the trajectory is discussed in more detail the Supplement.
2.1.3 SOSAA trajectory model
The chemistry and aerosol model is based on the SOSAA (model to Simulate the concentrations of Organic vapours, Sulphuric Acid and Aerosols, e.g. Boy et al., 2022; Chen et al., 2021; Zhou et al., 2017) and ARCA-box (Atmospherically Relevant Chemistry and Aerosol model, Clusius et al., 2022) models. The model simulates the chemistry and aerosol processes in a column from the surface up to 2.5 km altitude, divided into 45 layers with increasing depth. SOSAA models the vertical turbulent diffusion with the simple Grisogono K(z) scheme, originally developed for the EMEP air pollution model (Jeričević et al., 2010). The necessary input for it, friction velocity (against which K is scaling linearly) and boundary layer height (BLH) are taken from ERA5 and FLEXPART output, respectively: friction velocity is calculated from northward and eastward surface stresses, whereas BLH is the average mixing height at the dispersed FLEXPART tracer plume. With BLH=1500 m and friction velocity=1 the scheme gives a maximum Kh of 74 , occurring at around 315 m, or 0.21 × BLH, whereas a minimum was set with k≥0.01 m2 s−1, in practice applied above the boundary layer.
Trajectory SOSAA uses a simplified dry deposition scheme where the losses of the aerosols in the first 20 m were calculated using the low and high vegetation leaf area index from ERA5 as scaling factor. Particles were deposited with gravitational settling, impaction, interception and Brownian deposition by treating the canopy as needle-leaf tree everywhere. The evaluation with SOSAA dry deposition velocities against literature are in the Supplement.
Modelling dry deposition of gaseous compounds requires detailed information on the land use types and surfaces. To simplify the modelling setup the dry deposition was approximated with a single loss rate of in the first 20 m (nominal canopy height) for all gaseous compounds. This is an oversimplification especially with regards to VOCs, which are depositing with very varying rates, depending on their solubility and vapour pressures, leading to biases that could be substantial in most of the current air quality models (Liggio et al., 2025).
Wet deposition, or cloud scavenging was not modelled in this study. As SO2 has a large sink in the cloud droplets, and is subsequently removed with rain-out, omitting wet deposition would lead to overestimation of SO2. At its current state SOSAA-FP does not model aqueous phase particle chemistry and the uptake of inorganic compounds, and to counterbalance this omission in SOSAA-FP, we applied a constant factor of 0.5 for all SO2 emissions.
The chemistry scheme used in SOSAA for this study is based on a subset of the Master Chemical Mechanism (MCM 3.3.1, Jenkin et al., 1997, 2015; Saunders et al., 2003), augmented with the Peroxy Radical Autoxidation Mechanism (PRAM, Roldin et al., 2019), which simulates the autoxidation reactions of monoterpenes. The MCM subset was selected so that a reasonable mapping of the CAMS emissions to the chemistry system could be achieved. The selected precursors and their mappings are shown in Table S1 in the Supplement.
SOSAA chemistry module solves the time-evolution of the 3542 chemical species and 11 334 reactions in a 60 s time step, and is based on the Kinetic PreProcessor (https://kpp.readthedocs.io/en/latest, last access: 24 January 2025, Lin et al., 2023). As the chemistry module is identical to that of the ARCA box, the interested reader is referred to Clusius et al. (2022), which describes the kinetic chemical system, solvers and calculation of photochemical reaction rates in detail.
The aerosol module follows that of ARCA box, which uses a sectional particle size distribution and simulates formation of stable atmospheric clusters via the ACDC module (Atmospheric Cluster Dynamics Code, Olenius et al., 2013), condensational growth and Brownian coagulation as described in Clusius et al. (2022). In this study we used 60 logarithmically spaced particle size bins ranging from 1.07 nm–2 µm in diameter and using the fully stationary method of distributing particles after growth and coagulation. The condensation of 600 lowest volatility organic compounds from the chemistry was simulated using the Analytical Prediction of Condensation scheme (APC, Jacobson, 1997, 2002). There are different parametrisations for estimating the volatilities and their temperature dependencies, and in this study, we used the volatility basis set (VBS) method as suggested in Stolzenburg et al. (2022) (Eqs. 10–12). The necessary parameters for the reference saturation concentration at 300 K were those in Stolzenburg et al. (2018) for products originating from monoterpene peroxy radical autoxidation chemistry, and those in Donahue et al. (2011) for all other compounds. Condensation of sulfuric acid is calculated assuming a zero saturation vapour pressure. The SOSAA aerosol module does not calculate the ion balance and the uptake of water and soluble inorganics, but a rough estimation of the uptake of ammonia and nitric acid to particles was made in order to not underestimate the growth of nucleation and Aitken modes. The uptake of nitric acid was estimated by using the collision rate scaled with relative humidity so that the effective collision rate was
The uptake of ammonia was estimated by adding two NH3 molecules for each condensed H2SO4 molecule and one for each HNO3 molecule when the gaseous NH3 concentrations allowed this. The size-resolved sea salt particle fluxes were calculated following Ovadnevaite et al. (2014), which is a parametrisation that takes into account the sea state with means of the Reynolds number. For this study the parametrisation was simplified so that the Reynolds number (Re) was replaced with wind at 10 m height (U10) by equating the reported mean fluxes as a function of Re and U10 and solving for Re. This simplification does not take into account that the salt particle fluxes are different when the wind is increasing and the sea state is still developing, and when the sea state is matured – whereas the Reynolds number captures this behaviour (Ovadnevaite et al., 2014). The sea salt emissions were multiplied by the sea fraction of the land-sea mask. Over the Baltic Sea, which is brackish water and has smaller fetch than the oceans, the sea salt emissions were reduced to 5 % of the calculated fluxes.
New particles from the nucleation module, primary particle or sea salt emissions were added to their respective size bins and assigned a composition. As the exact composition of primary particles is unknown, they are assigned a tracer composition, which enabled us to track them and their emission day in the model through all the processes.
The formation of stable clusters through neutral and ion-mediated pathways was calculated by the ACDC module using the H2SO4−NH3 chemistry (Besel et al., 2020), where the cluster stabilities are based on energies calculated with DLPNO-CCSD(T)/aug-cc-pVTZ//ωB97X-D/6-31++ level of theory. This dataset can be considered as the best estimate of pure H2SO4−NH3 clustering efficiency, but it could underestimate the clustering in atmospheric conditions where other components could be taking part in the cluster formation. Other datasets, notably those calculated with the B3LYP/CBSB7//RICC2/aug-cc-pV(T+d)Z have shown better agreement with laboratory experiments (Almeida et al., 2013; Kürten et al., 2016), but as the modelled [H2SO4] showed some overestimation, the more conservative DLPNO chemistry was used.
2.2 Model setup and analysis
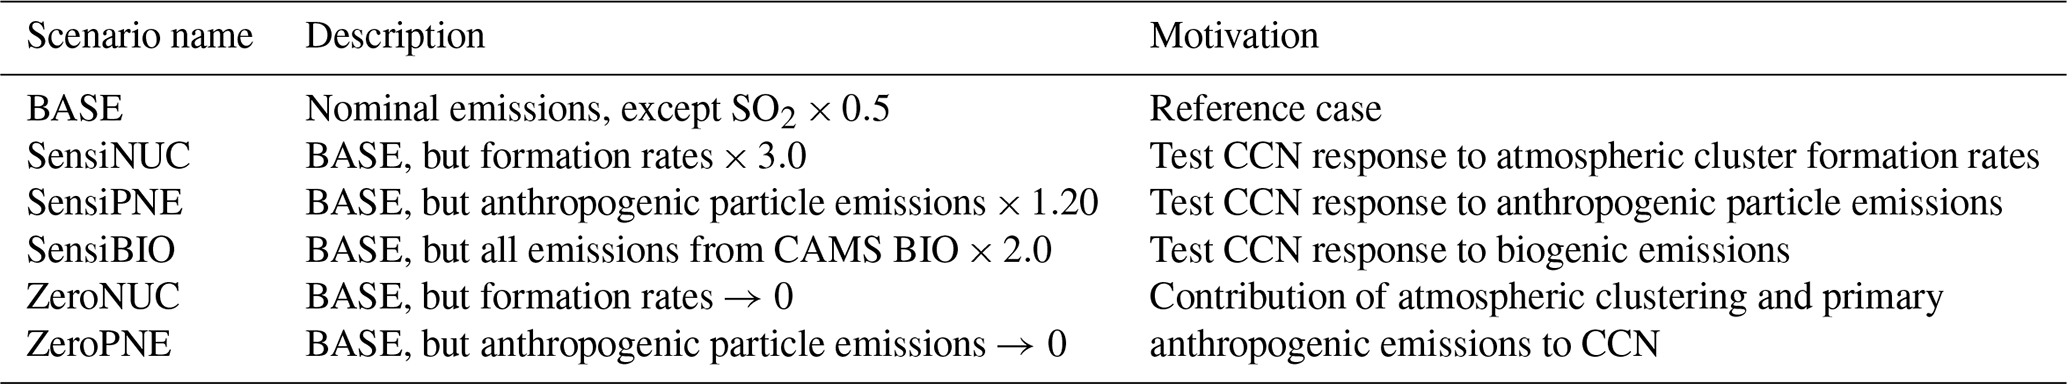
In this work, the FLEXPART trajectories were calculated (and the SOSAA model was run) 7 d backward. The gas concentrations started from zero except for SO2, CO and O3, which were initialized using CAMS reanalysis data. The particle size distribution is initialized with two modes (with count median diameters at 14 and 52 nm) PN2 µm 1250 cm−3, and therefore we considered the first 3 d to be spin-up time, and the results shown here are generally focused on the last 96 h before the station. We simulated the base scenario, where the model input data was used in their nominal values (with the exceptions discussed earlier). We also tested, how sensitive the modelled CCN concentrations are to a relatively small perturbation in key input emissions and processes. The parameters that were perturbed with a constant factor were (a) all biogenic emissions (CAMS-BIO), (b) anthropogenic particle number emissions (PNE) and (c) the nucleation rates calculated by ACDC. Additionally, we simulated two extreme cases where (d) nucleation and (e) primary particle emissions were turned off. Where the first three simulations can be thought of testing the model base state, the latter two shift the model substantially from the base state. These simulations did not represent realistic future scenarios but estimate the effects of anthropogenic particle emissions and atmospheric clustering on CCN concentrations separately, and, when compared with BASE, their effect to each other. The scenarios are summarized in Table 2.
Table 1Description and names of the SOSAA simulations used in this study.
2.2.1 Calculation of modelled CCN concentration
The modelled CCN concentrations presented here are calculated for maximum supersaturations between 0.1 % and 1.2 %, using the κ-Köhler theory (Petters and Kreidenweis, 2007), which relates the water vapour saturation to particle dry and wet diameters taking into account their hygroscopicity, expressed with the κ-coefficient. For a given dry particle diameter and κ, the critical wet diameter and the corresponding saturation ratio S can be determined from the (local) maximum of κ-Köhler equation:
where Dp,d and Dp,w are the dry and wet diameter of the particle, σ is the solute surface tension (here value of pure water was used), Rg is the ideal gas constant and T is the droplet temperature (we used the model temperature at ground level to compare with measured CCN).
The particle hygroscopicity κ depends on the composition, and here we used bulk values for the main aerosol components. This simplification can be justified by the unknown activity coefficients of 600 condensing organic compounds, the resulting composition mixture and the generally unknown composition of the anthropogenic particle emissions. To get an idea of the range of uncertainty in the CCN concentration related to the hygroscopicity, a combination of lower and upper κ ranges were used (the chosen κ and the ranges are shown in Table S2).
The κ values for any given particle size in bin i was calculated using , where vj,i are the volume fractions of the components in bin i. Using these κ in Eq. (2), the critical maximum supersaturation as a function of particle size and κ for the model particle size distribution can be calculated. Finally, the CCNS number concentration for a given supersaturation S (expressed in %) is the sum of particles whose Scrit≤S.
2.2.2 Calculation of model response
This study focuses on creating a model which is able to simulate the CCN concentrations, and investigating how the CCN may be formed. As the framework consists of many steps and input data which include averaging over large areas and times, it is expected that the model will miss any variability that is smaller than the resolution of the input data. Any particular year and location has special conditions, which are not perfectly captured by the often very generic emission profiles in the datasets. Even with these shortcomings, given the model is in a reasonable proximity with observations, we can test how the modelled CCN responds to different processes and input parameters. A perturbation test provides an estimate of the significance of a single input in a multivariate model. Furthermore, as it turns out, the extrapolations made with the responses are passable estimates of the effects of larger perturbations. For example, everything else being equal, if biogenic emissions increase by a factor of 2, with what factor does the CCN change?
We define the response R as a linear sensitivity to the input. We can write the response R in terms of two model run output QBASE and QPERT, and their respective inputs IBASE and IPERT, obtained from perturbed (PERT) and unperturbed (BASE) model runs, respectively
which simplifies to
where fQ and fI are the fractions and , respectively. In some sense the response describes the model's current state with respect to I, including its history, all other input, concentrations, weather conditions, geographic location and the emissions that follow from it. Like the model state, R varies in time and place, and due to the non-linear nature of the model, we assume that it is reasonable to use the linear sensitivity when fI and fQ are in proximity of 1 (however, if fI=1, R is not defined); in other words, we assume this state holds if the model is not perturbed too much. Note that the response is not necessarily bound between −1 and 1. In the results sensitivity is expressed in percent ( %). In addition to the linear response, we also tested a power function, where . This function was better suited to predict the effect of the cluster formation rates in the ZeroNUC case (Table 2), and is further discussed in the Supplement.
2.2.3 Statistical descriptors used for model evaluation
To quantify model skill, we use normalized mean bias factor (BNMBF, Eq. S3 in the Supplement, Yu et al., 2006) and squared Pearson correlation coefficient (r2) to evaluate model performance. BNMBF is statistically robust, symmetric around zero (BNMBF=0: no bias) and readily interpretable: the factor of under- or over-estimation is e.g. means the model has a negative bias by a factor of , whereas BNMBF=0.5 means bias (by overestimating) by a factor of 1.5.
2.3 Measurement data for model evaluation
We used data from the SMEAR II (Station for Measuring Ecosystem–Atmosphere Relations, Haataja and Vesala, 1997; Hari and Kulmala, 2005) measurement station, (https://smear.avaa.csc.fi/, last access: 24 January 2025, Junninen et al., 2009) to evaluate the model results at the end of the trajectories. The SMEAR II station features continuous atmospheric measurements for a boreal forest stand since 1995 (Ilvesniemi et al., 2009; Keronen, 2017; Kolari et al., 2022), and houses a broad range of basic aerosol, trace gas, meteorological, ecological and soil measurement instruments on permanent basis and intensive measurement campaigns (e.g. Kulmala et al., 2009, 2011; Williams et al., 2011; Petäjä et al., 2016). The station represents boreal zone atmospheric “background” observations, with pronounced local and regional influence from forested areas (Williams et al., 2011), with very few local anthropogenic emission sources but some regional ones (Keronen, 2017). However, long-range transported air masses from continental Europe, British Isles, Eastern Europe, Southwest Russia (including St. Petersburg area), Kola Peninsula and Baltic regions regularly affect the aerosol, VOC and trace gas observations on site (Kulmala et al., 2000; Riuttanen et al., 2013; Patokoski et al., 2015; Keronen, 2017).
The modelling period was selected to be March to October 2018. The choice of the time was largely based on good data availability both for model input and model evaluation, but at the same time there were interesting meteorological features especially with regards to temperature. Compared to 30 year mean, March 2018 was colder and April slightly warmer, while during summer Finland experienced heat waves with lower than average precipitation in May and July, June temperatures being comparable to 30 year mean. Autumn was warmer than on average.
For this study a subset of comparable observation data was selected as follows. Atmospheric inorganic trace gas measurements from gas analysers (CO, O3, NOx, SO2, Keronen, 2017), the volatile organic compounds (VOC) concentrations continuously measured with a proton transfer reaction mass spectrometer (PTR-MS, Lindinger and Jordan, 1998; Taipale et al., 2008; Blake et al., 2009). Aerosol particle number size distributions between 3 and 1000 nm in diameter, observed with a differential mobility particle sizer (DMPS, Aalto et al., 2001) and CCN concentrations with cloud condensation nuclei counter (CCNC, Roberts and Nenes, 2005; Paramonov et al., 2015). Aerosol particle chemical composition was obtained from using the Aerosol Chemical Speciation Monitor (ACSM, Ng et al., 2011; Heikkinen et al., 2020), which offers a standard speciation into organics, sulfates, nitrates, ammonia and chlorides. When the measurement resolution allowed it, the data was averaged to hourly means before comparison, otherwise daily medians were used. Gas concentration data was averaged from samples between 4.2 and 125 m, particle measurements are from ca. 4 m height. We emphasize that these data were not used as input in the model, instead the model relies completely on gridded, global emission, concentration and meteorological reanalysis data.
3.1 Comparison of modelled and measured gas concentrations
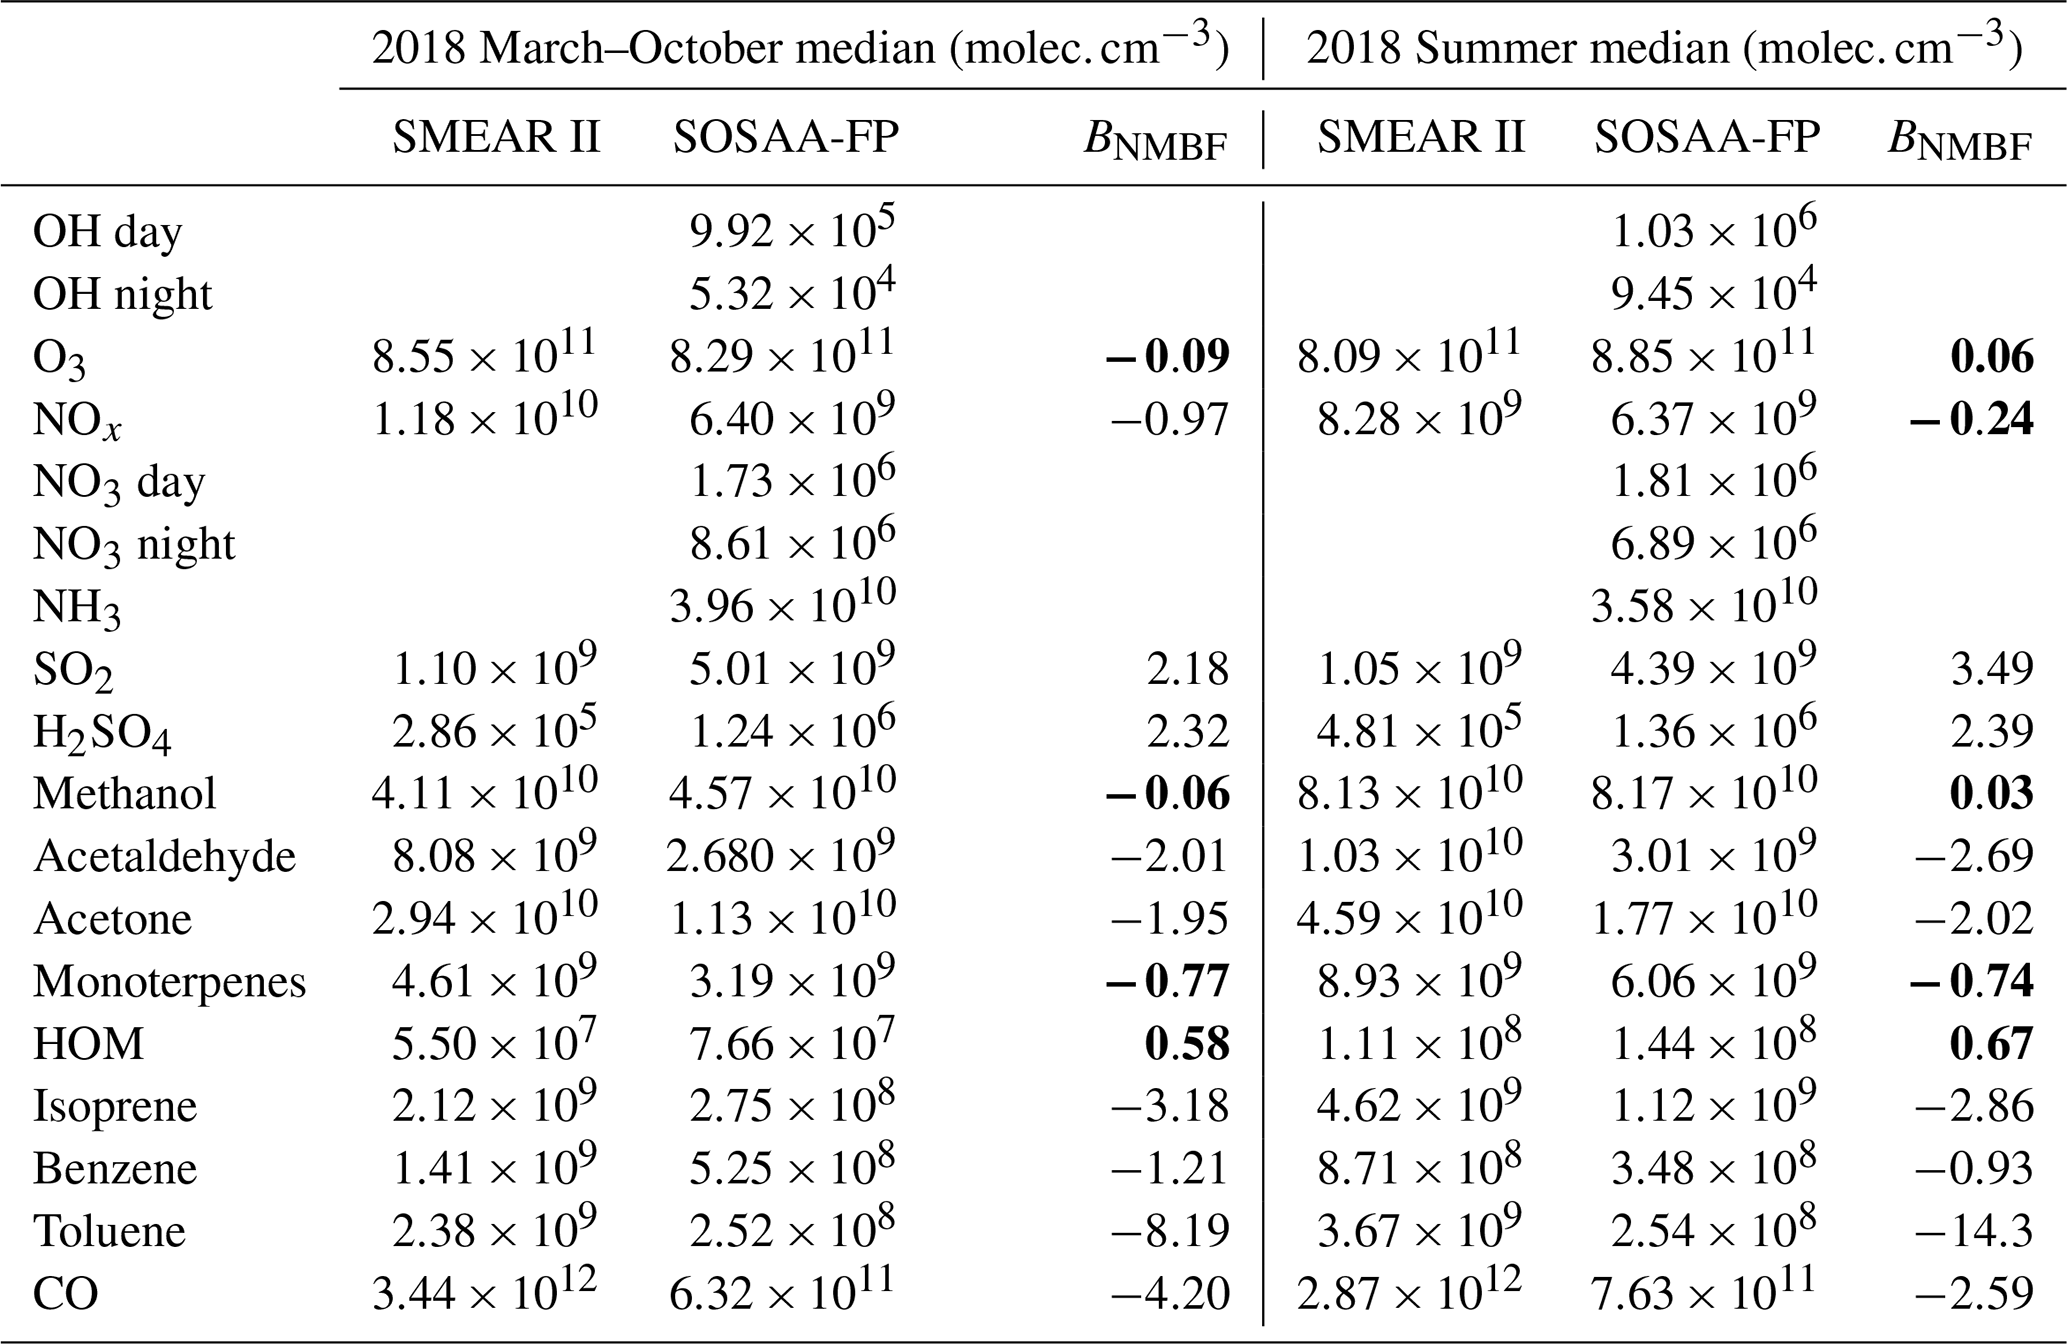
The modelled and measured gas concentrations were aggregated to daily median gas concentrations at SMEAR II and are shown in Fig. 2, while the 8 months and summer medians are shown in Table 3. To obtain data that represents boundary layer at and just above the canopy, the hourly modelled values were obtained my taking the average between 8 and 50 m. The best model performance in terms of correlation during the 8 month period is seen in (r2 and BNMBF given in brackets) [acetone] (0.73, −1.95), [methanol] (0.67, −0.06), [monoterpenes] (0.59, −0.76) and [HOM] (0.53, 0.59), whereas smallest BNMBF is seen in [methanol] and [O3], with [HOM] and [monoterpenes] as distant 3rd and 4th. Worst performers in terms of correlation of daily medians were [H2SO4] (0.01, 2.33), [CO] (0.12, −4.21), [O3] (0.10, −0.09, even though ozone is directly read in from CAMS) and [SO2] (0.08, 2.10). Isoprene (0.52, −3.18) concentrations are underestimated quite substantially outside the growth season, whereas the discrepancy is smaller during summertime. The model overshoots [SO2] and consequently [H2SO4], even when the SO2 emissions were halved. This discrepancy is partly resulting from missing aqueous phase chemistry and the consequent sink term in the cloud droplets. The simple approach of halving the SO2 emissions to account for this leaves the actual variation in the SO2 sink unresolved. This is supported by the moderate positive correlations between the total precipitation along the trajectory and the model biases of SO2 and H2SO4 (r=0.33 and 0.30, respectively). Ammonia is not routinely measured at SMEAR II, and the modelled [NH3] is shown against weekly filter measurements available at EBAS database (https://ebas-data.nilu.no, last access: 31 January 2025, Tørseth et al., 2012), which the model overshoots by an order of magnitude. As dry and wet deposition are the most significant sink for NH3 and oxidation being negligible (Renard et al., 2004; Behera et al., 2013), the simplistic deposition scheme used here could result in accumulation along the trajectory. This means that the cluster formation in the ACDC could be enhanced towards the end of the trajectory by approximately a factor of 3 when compared to measured NH3 concentrations (in STP, 107 cm−3 H2SO4 and 0.1–10 ppb NH3 the formation rates vary between 1 and 4 ). Otherwise this overshooting has little effect in the model since the gas phase chemistry scheme does not have reactions involving NH3, and the particle phase uptake of it in the model is limited by H2SO4 and HNO3. Furthermore, the increased cluster formation (which is also due to likely overestimation of H2SO4) counterbalances the very conservative estimation of the DLPNO-based cluster chemistry.
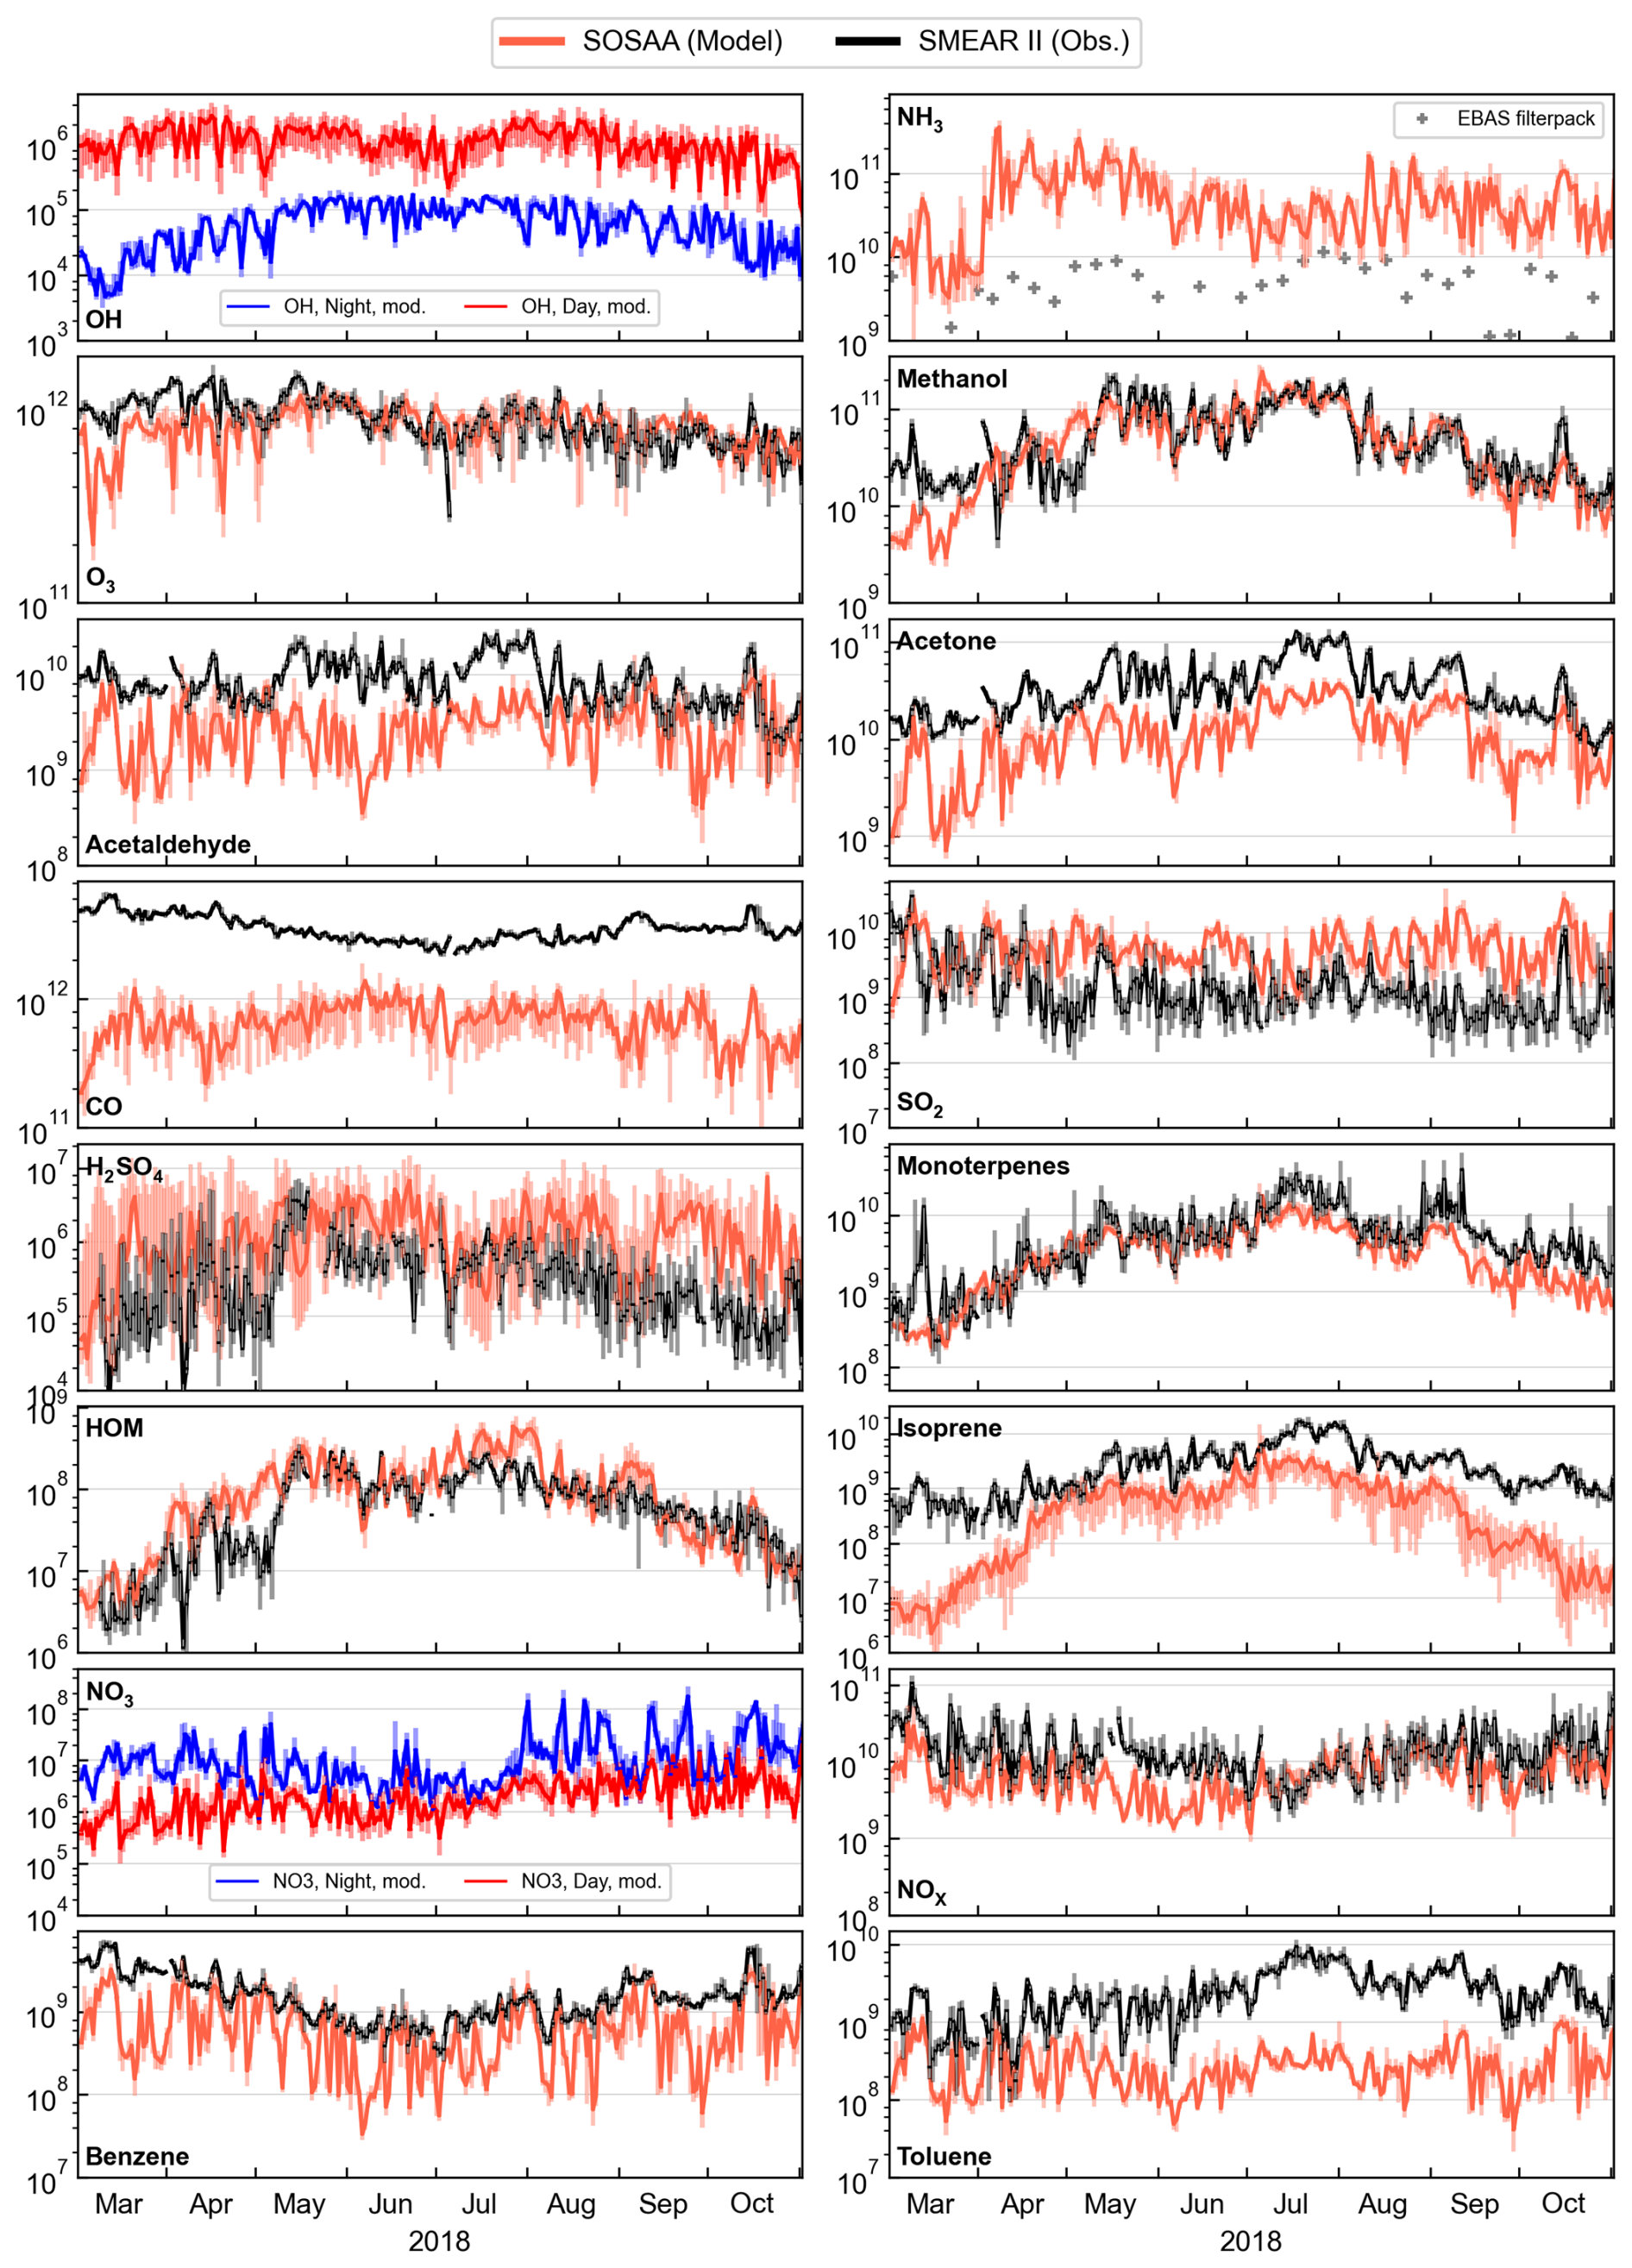
Figure 2Daily median gas concentrations (cm−3) at the SMEAR II station in the SOSAA model (red) and measurements (black) in the study period March–October 2018, with shaded ranges showing the interquartiles (25th to 75th percentiles of the data). The names of the compounds are shown in the corresponding panels. There are no measurements of OH and NO3 from this time period, and for these compounds the modelled daytime (red) and nighttime (blue) values are shown separately. Note that O3 concentrations are not modelled by SOSAA, but instead are read directly from CAMS. NH3 measurements (shown with grey markers) come from EBAS filter measurements with 1 week time resolution.
Table 2Median concentrations () of key components during summer (JJA) and total time period (March–October 2018), and bias (BNMBF) between model and measured daily medians. Bias values in bold if FAC2>0.5.
Modelled daytime median OH concentrations were on average 106 (the 95th percentile of daily concentrations were typically at 2–3 ×10⁶ ). Long-term OH measurements are not available for the time period, but the result can be compared with earlier SOSAA-modelled concentrations at SMEAR II (Chen et al., 2021), where the modelled daily median concentrations during the time period ranged between 1×10⁶ and 6×10⁶ . However, in that study the modelled OH concentrations were compared with measured concentrations during two earlier campaigns (EUCAARI, from late April–May 2007, Kulmala et al., 2011; Williams et al., 2011), and the model overestimated the measured daily median concentrations, which were consistently below 106 . The authors discuss that the measurement height could affect the biases (the measurements were sampled close to the ground, typically at 4 m height, inside forest canopy). In our work the mixing inside and outside the canopy was not modelled in the same detail, and the difference between the first 10 m and the mean value between 10 and 80 m is negligible.
Similarly to OH, NO3 measurements were unavailable, but our results with median night time [NO3] of 8.6×10⁶ are somewhat higher than a previous modelling study from SMEAR II, which showed median nightime concentrations of 4×10⁶ for the year 2018 (Chen et al., 2021).
At SMEAR II the HOM are primarily products of monoterpenes (Ehn et al., 2014; Bianchi et al., 2019) and sesquiterpenes (Li et al., 2021; Dada et al., 2023). The lifetime of both terpenes and their oxidation products are short compared to the timescales of long-distance transport. Therefore, the good agreement with the modelled and measured [HOM] suggests that the emissions close to the station and the relevant chemistry are consistent with each other. These processes are vital steps in modelling SOA formation, and the results suggest that the model has the potential to describe SOA formation properly also upstream along the trajectories, given that the emissions are realistic. The biogenic emissions in CAMS are provided as monthly mean values, together with their mean daily profiles, and therefore are missing much of the day-to-day variation, and so will SOSAA. The modelling community would benefit from an open-access dataset with the gridded global modelled biogenic emissions from MEGAN (or any BVOC emission model) at high temporal resolution.
3.2 Aerosol size distributions and composition
Figure 3 shows the modelled and observed particle size distributions at SMEAR II (panel a) and the size-resolved ratios between the two (panel b), so that the ratio E for bin i was defined as . Figure 3b also shows on the right axis the time-averaged (12 d running mean) ratios for the comparable total size distribution 3–1000 nm and three subclasses; 3–30, 30–100 and 100–1000 nm, approximately corresponding to nucleation, accumulation and coarse modes. The BNMBF of the modelled number concentrations in total, nucleation, accumulation and coarse modes are −0.163, 0.793, −1.346 and −0.710, respectively, meaning the model on average produced more particles in nucleation mode and less in other modes, with clear exceptions in July and early September when the observations showed low concentrations in the nucleation mode while the mode was practically absent in the model. This period has been discussed in earlier studies where the July heat wave resulted in decreased gross primary production in large parts of central and north-western Europe, when compared with earlier years. Heikkinen et al. (2020) report a high SOA loading in July, but also an increased anthropogenic organic component in PM1. We attribute the weak new particle formation in the model to elevated temperatures and condensation sink due to primary emissions upstream of the trajectories (Fig. S20 in the Supplement), which effectively reduces cluster formation in the ACDC module (Figs. S4–S6). The increased particle number emissions along the trajectory in mid-July to early August coincide with the decreased nucleation rates in the model. While the number emissions especially 3 d prior to arriving at station were among the highest in the period, similar emissions were observed in March, but with much less nucleation inhibition, which could partly be explained by the lower temperatures. Other factors such as NH3 and SO2 emissions along the trajectories did not markedly differ in July from adjacent months (Fig. S8).
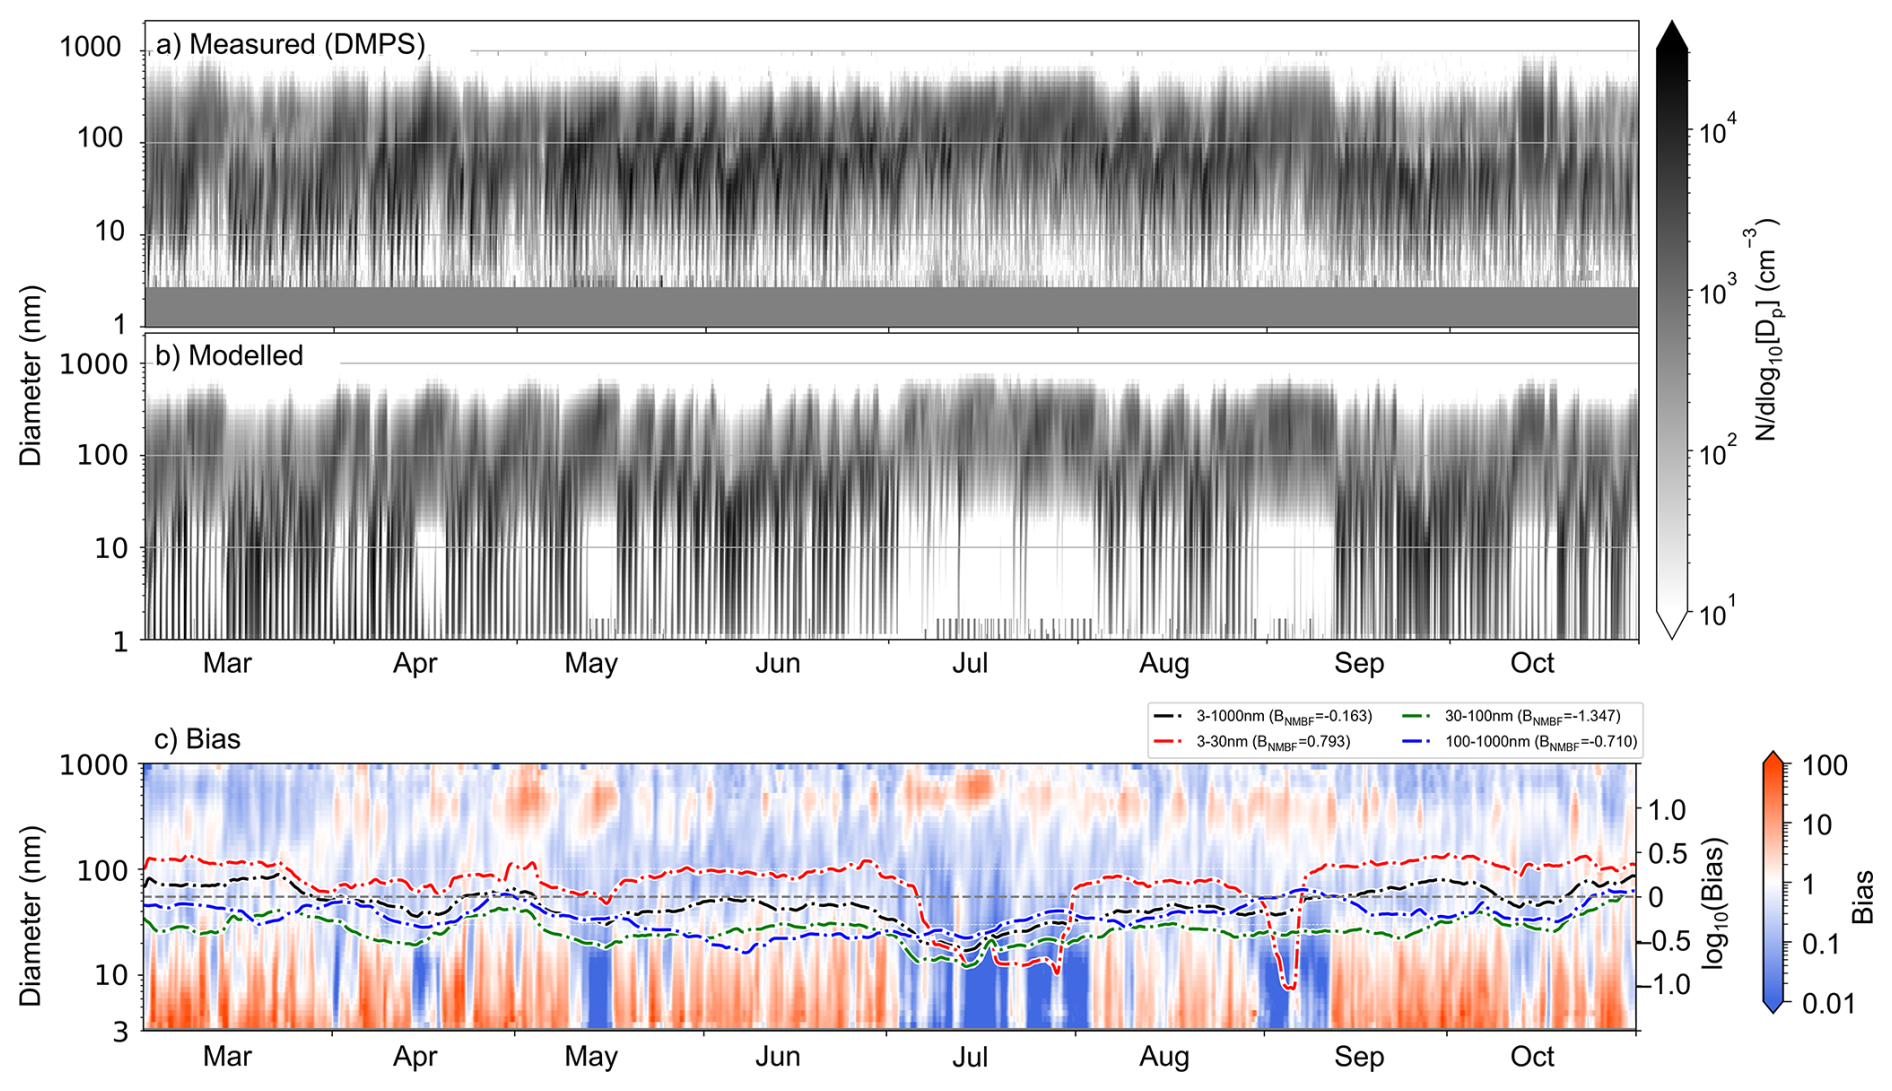
Figure 3(a) Measured (with DMPS) and (b) modelled particle size distributions from the study period. (c) Model bias as ratio of model and measurement (Model/Measurement). Heatmap shows the size distribution of the bias; black, red, green and blue dashed lines show a 12 d running bias for 3–1000, 3–30 nm (nucleation mode), 30–100 nm (Aitken mode) and 100–1000 nm (accumulation mode), respectively. The legend shows the normalized mean bias factor (BNMBF) for the total time period for the selected size classes.
The lower sensitivity of the DMPS instrument (well below 10 nm) can explain only a small fraction of the overshooting in the smallest sizes, and therefore it is possible that the model bias is due to insufficient growth of the nucleation mode, leading to underestimation of the larger particles. Possible reasons for this could be a significant underestimation of the concentrations of extremely low-volatility organic compounds (ELVOC), overestimation of the saturation vapour pressures of the current vapours, missing particle phase reactions which could decrease volatility of organic compounds and thus reduce their later evaporation, missing cloud processing or insufficient partitioning of inorganic compounds. The perturbation run SensiBIO (Table 2) saw the size distribution shifting towards larger sizes (especially noticeable in June, see Fig. S9). However, the gas phase [HOMs] were relatively well captured in the BASE, and the particulate ammonium and nitric acid were already overestimated when compared with ACSM measurement. This leaves the cloud processes or particle phase reactions as possible additions to the model which could reduce the difference in the modelled and measured size distributions. Whether including these processes would markedly shift the nucleation mode, which is well beyond activation size, and where SVOCs accumulate weakly, is unclear. Cloud droplets are a sink for the particles below activation size (Pierce et al., 2015), and this missing sink could partially explain the overestimation of the nucleation mode, although they might not be deposited in rainout in case of cloud droplet evaporation. Finally, the “particle phase” in the model is masking rather complex microphysics where the actual phase state can vary from liquid to glassy (Reid et al., 2018) depending on the environmental conditions, affecting their mixing state, water solubility, volatility and SOA uptake (Shiraiwa et al., 2017; Rasool et al., 2021; Zhang et al., 2024).
Modelled aerosol mass composition was compared with ACSM measurements from SMEAR II. SOSAA stores detailed information of the secondary organic aerosol, but a substantial fraction of the aerosol loadings in the model comes from anthropogenic particle emissions, whose composition varies, and is not known in sufficient detail. Here we assumed that the PNE are primarily composed of organic compounds, black and brown carbon and sulfates. The ACSM shows organic aerosol, sulfates, nitrates, ammonium and chlorides, but cannot measure (refractive) black carbon. For Fig. 4 we attributed the modelled SOA and 85 % of the primary particle mass to organic aerosol, all sulfuric acid and the remaining 15 % of primary particle mass to sulfates, nitric acid to nitrates, particle phase ammonia to ammonium and 60 % of sea salt mass to chlorides. The majority of the measured and modelled particles are organics and sulfates. The model is able to capture the time series of the total mass to a good degree; for the 24 h running mean BNMBF: 0.17 (r2: 0.53), and by component OA: 0.01 (r2: 0.70), SO4: −0.40 (r2: 0.40), NO3: 2.05 (r2: 0.31), NH4: −0.22 (r2: 0.45), Cl: −0.17 (r2: 0.02). For the sum OA+SO4 the BNMBF was 0.04 (r2: 0.62). Consistent with the southerly origins of BVOC, modelled OA mass correlates with mean temperature along the trajectory (Fig. 4b), aligning with prior studies based on local observations and trajectory analysis (e.g. Paasonen et al., 2013; Yli-Juuti et al., 2021).
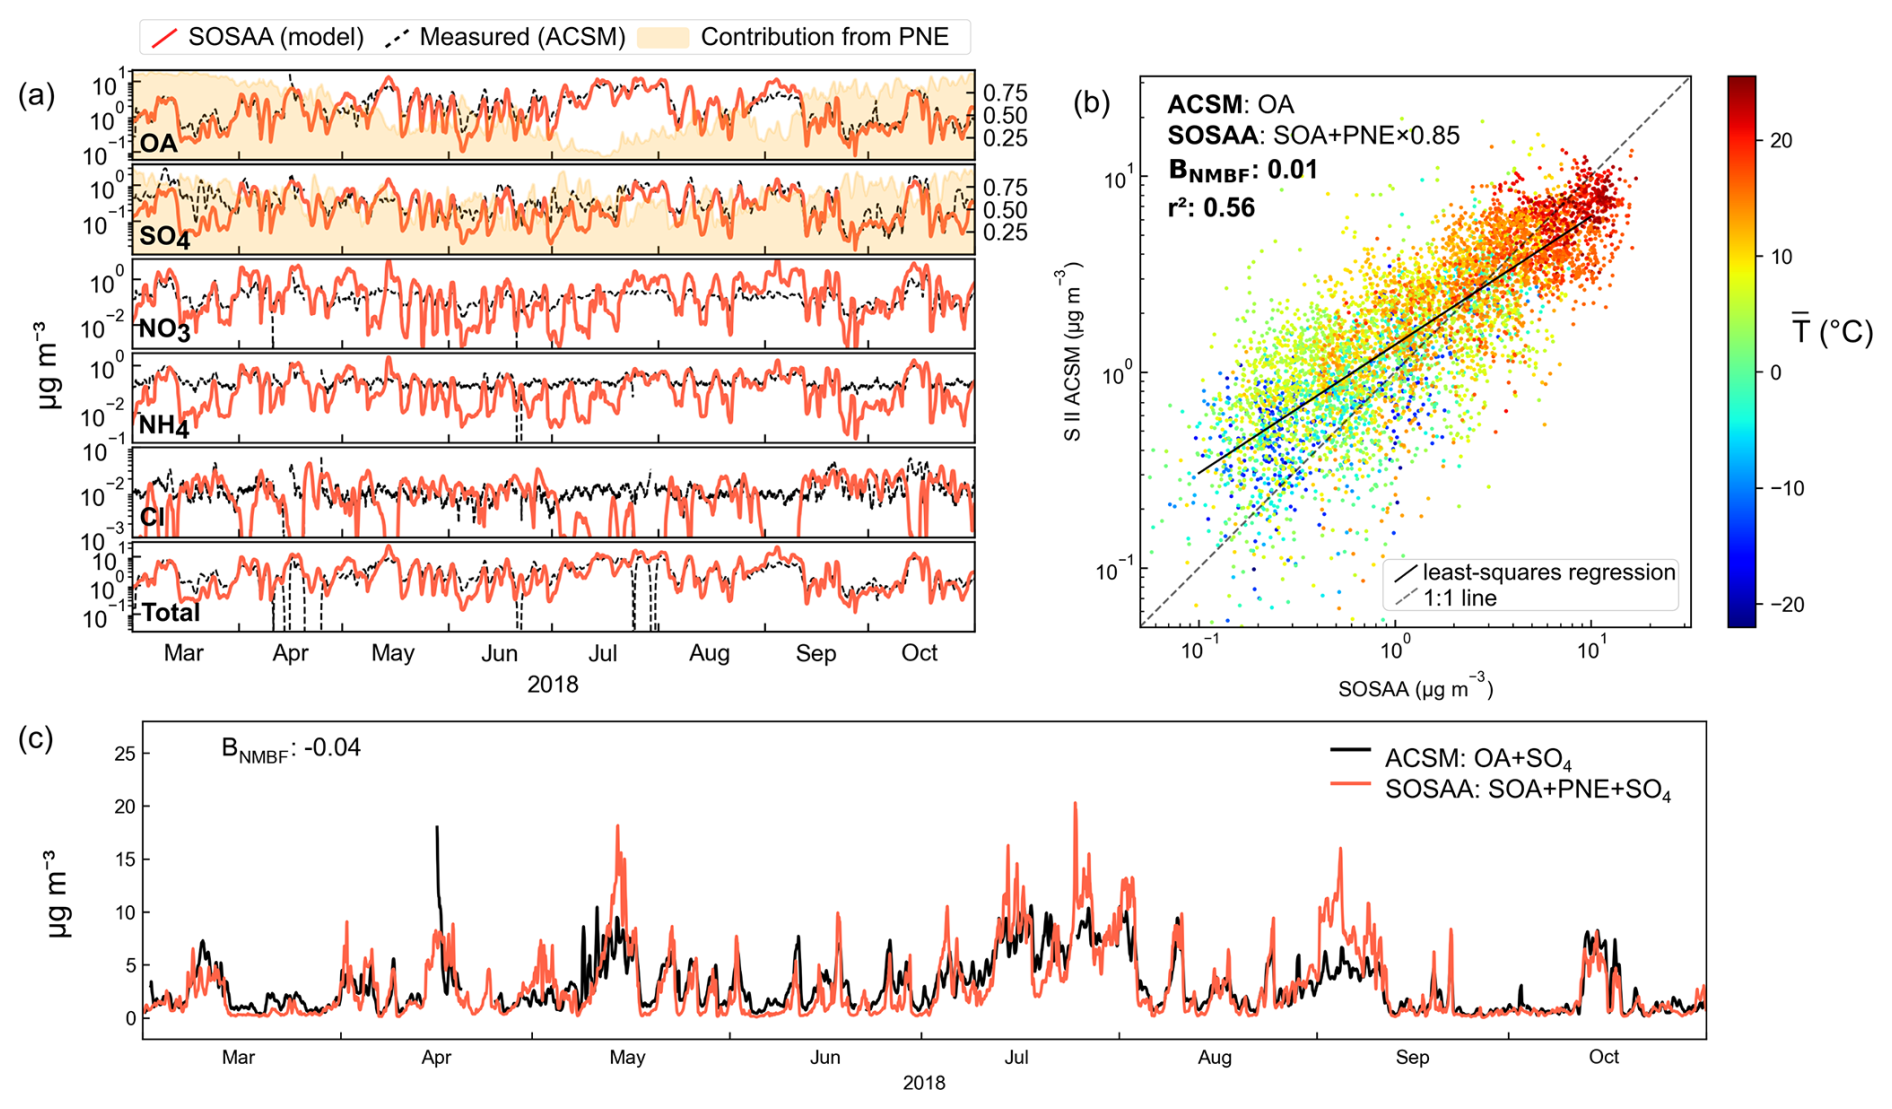
Figure 4(a) 24 h running mean of mass composition from ACSM measurements with component labels in the lower left corners of the subplots. For this figure 85 % of the primarily emitted particle (PNE) mass in the model was attributed to organic aerosol (OA), and 15 % to sulfates (SO4). The yellow shading with the axis on the right shows the modelled mass fraction coming from the primary particles. (b) The scatter plot of 3 h values organic aerosol of PM1 from ACSM and SOSAA (obtained similarly as in panel a), coloured with mean temperature during the last 4 d along the mean trajectory. (c) The unfiltered 3 h ACSM OA + SO4 and SOSAA PNE + SOA + SO4.
Our work shows a much stronger effect of primary aerosol emissions than previous studies at SMEAR II. The average primary particle fraction of total OA (POA : OA) during the 8 month period was 58 %, ranging from 17 % in July to 95 % in March. For example, Heikkinen et al. (2021) reported only 1 % and 9 % POA : OA mass fraction in the months of July and March, respectively, in their 8 years study between 2012 and 2020. Their result is significantly lower than that of Äijälä et al. (2019) who reported an average POA : OA fraction of 26 % in campaigns conducted between 2008 and 2011, mostly in the same months as those used in this work. The discrepancy between our result and these studies can partly be explained by our treatment of primary particles as completely non-volatile, whereas they would likely evaporate some of their SVOC, which are then oxidized in the gas phase and eventually partitioning back to particles, showing as SOA. Ciarelli et al. (2016) used this approach in the CAMx model, which improved their model POA : OA fraction when compared to measurement, while increasing the underestimation of OA. This means that some SOA actually has sources in the primary particles, possibly masking the anthropogenic sources. It is also possible that in the measured composition, some POA actually has undergone reactions in the particle phase and has become chemically indistinguishable from SOA (Yazdani et al., 2023).
On the other hand, the chemistry scheme used in this work does not include the autoxidation mechanism of aromatic compounds. During the study period the terpene emissions for the last 96 h along the trajectory are substantially higher than aromatic emissions (on average 6 times higher and more than 8 times higher during summer). Assuming similar yields to monoterpenes, this would mean that including the aromatic autoxidation would increase the SOA mass (of mostly anthropogenic sources) on average by 10 %–15 %, while in March, when the emissions are comparable to those of terpenes, the increase could be substantially higher.
Figure 5 shows the size-resolved relative fractions of the particle composition in the SOSAA model. The secondary aerosol mass is the dominant fraction in the 1–10 nm range (around 80 % of mass) and comprises more than 60 % of the mass in the 10–100 nm diameter range, especially in the summer months when the secondary mass is on average between 65 % to 85 % of the total mass in the size range. For sizes over 200 nm in diameter, primary emissions start to dominate the mass, with a tail of sea salt from approximately 500 nm diameter upwards. Figure 6 shows that episodes with elevated PM1 concentration can occur with very different contributions of primary, secondary organic and secondary inorganic aerosols. This is evident, e.g., in the episodes when PM1 exceeds 8 µg m−3 for several days: during those in March–April and in September–October, the composition is mostly primary and inorganic secondary aerosol; during those in April–May and August, SOA slightly exceeds primary and secondary inorganic contributions; and during the June–July episode, SOA clearly dominates PM1 mass. Measurements of size resolved aerosol composition from SMEAR II station exist from March–April 2003, where days with cleaner northern air (associated with higher likelihood of new particle formation events) showed high fraction of organic mass from terpene oxidation products in nucleation and Aitken modes, and organics, nitrates and sulfates in the accumulation modes (Allan et al., 2006). Another related study used Nano Aerosol Mass Spectrometer (NAMS) to measure the composition of particles between 15 and 22 nm in diameter at SMEAR II in March–April 2011, and reported molar fractions of sulfur (7 %), nitrogen (14 %), carbon (38 %) and oxygen (45 %) during 8 NPF event days (Pennington et al., 2013). Similar analysis from our data during daytime (06:00–18:00 LT) MAM showed 2 %, 13 %, 35 % and 50 % molar fractions of sulfur, nitrogen, carbon and oxygen, respectively (calculated with 1:1 C : O mass fraction in OA). While our results agree with these studies, their short time period and long time difference makes more detailed quantitative comparison impractical.
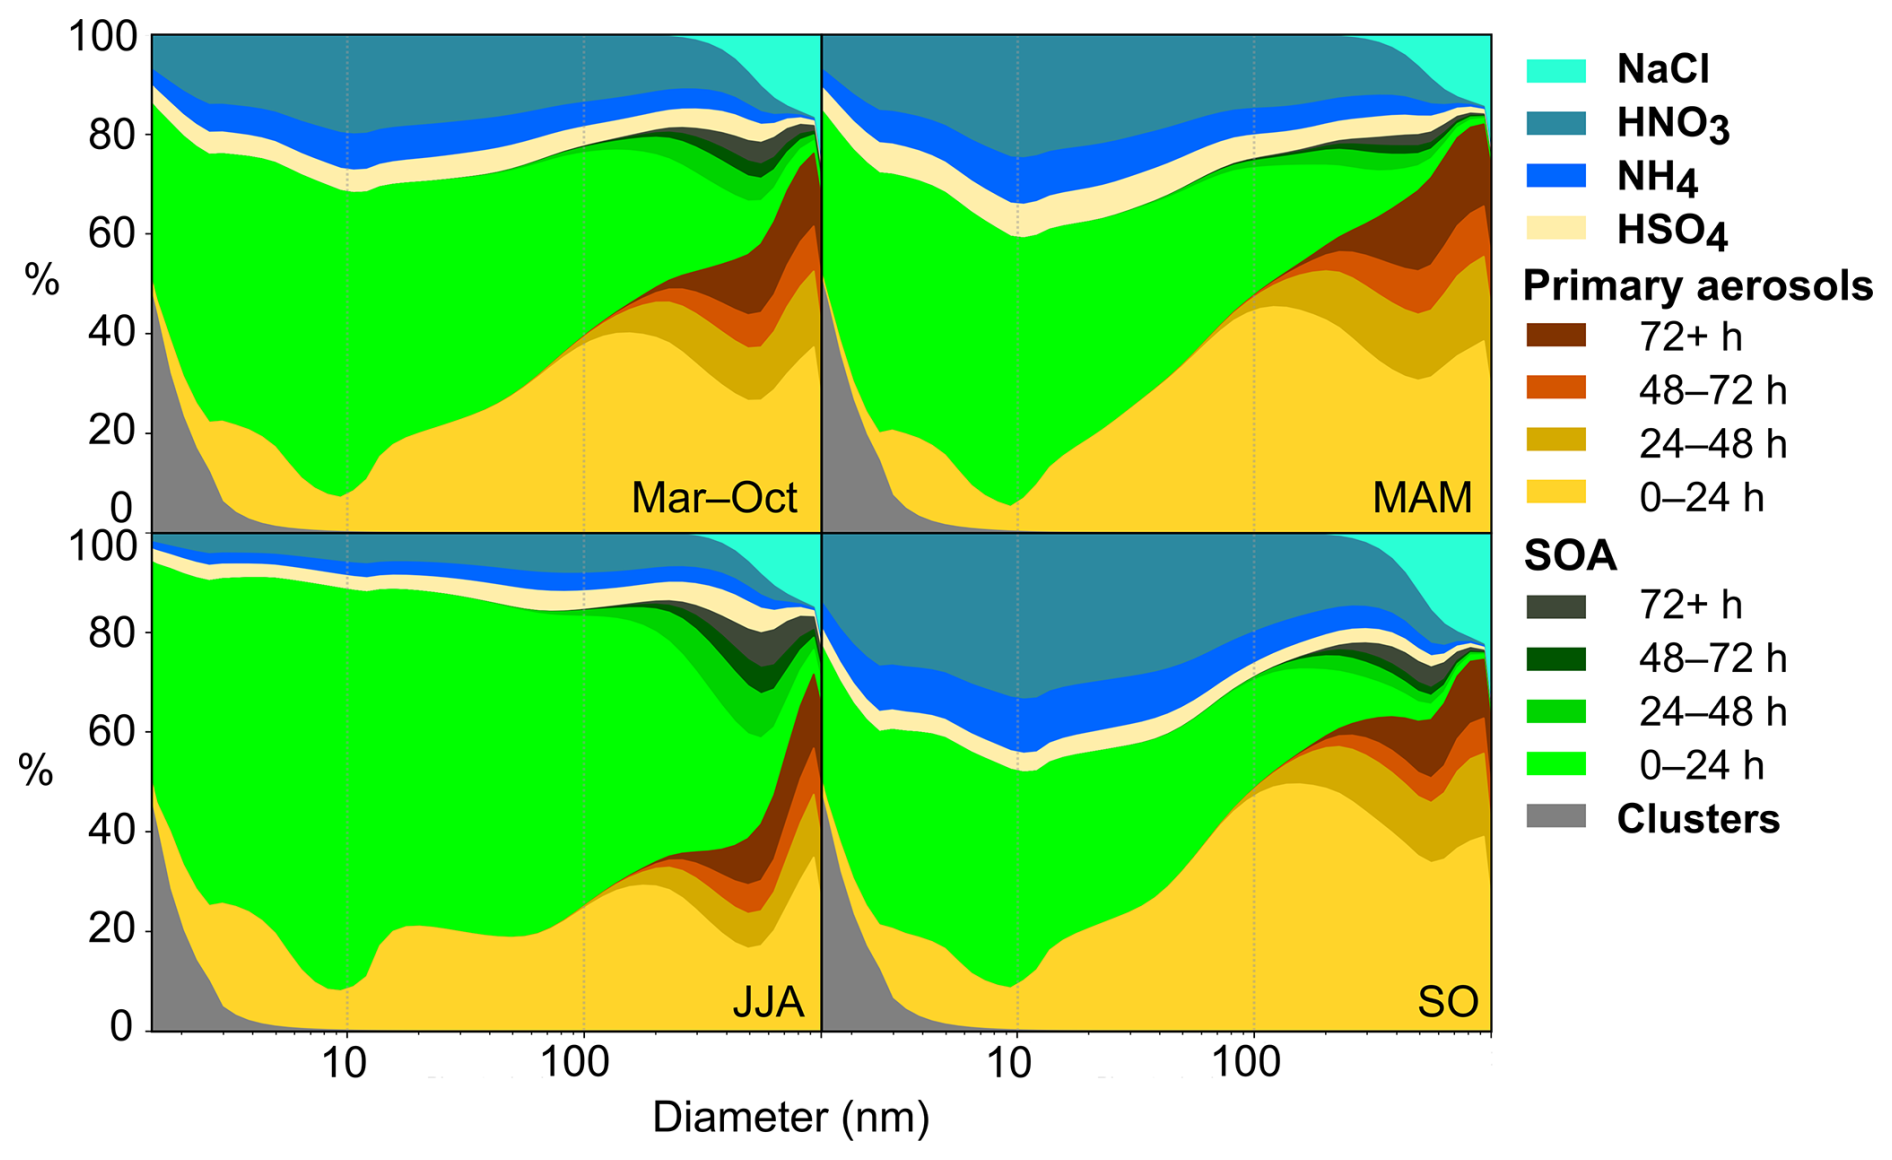
Figure 5Modelled, size dependent aerosol mass fractions of aerosol components for the whole period (March–October), spring (MAM), summer (JJA), and autumn months (SO). “Primary aerosols” refers to particles that originate from anthropogenic particle emissions (PNE), SOA refers to organic aerosol that has formed through condensation of vapours. Primary particles and SOA are classified by their age in the final PSD; age refers to the time since they were emitted or formed in the model.
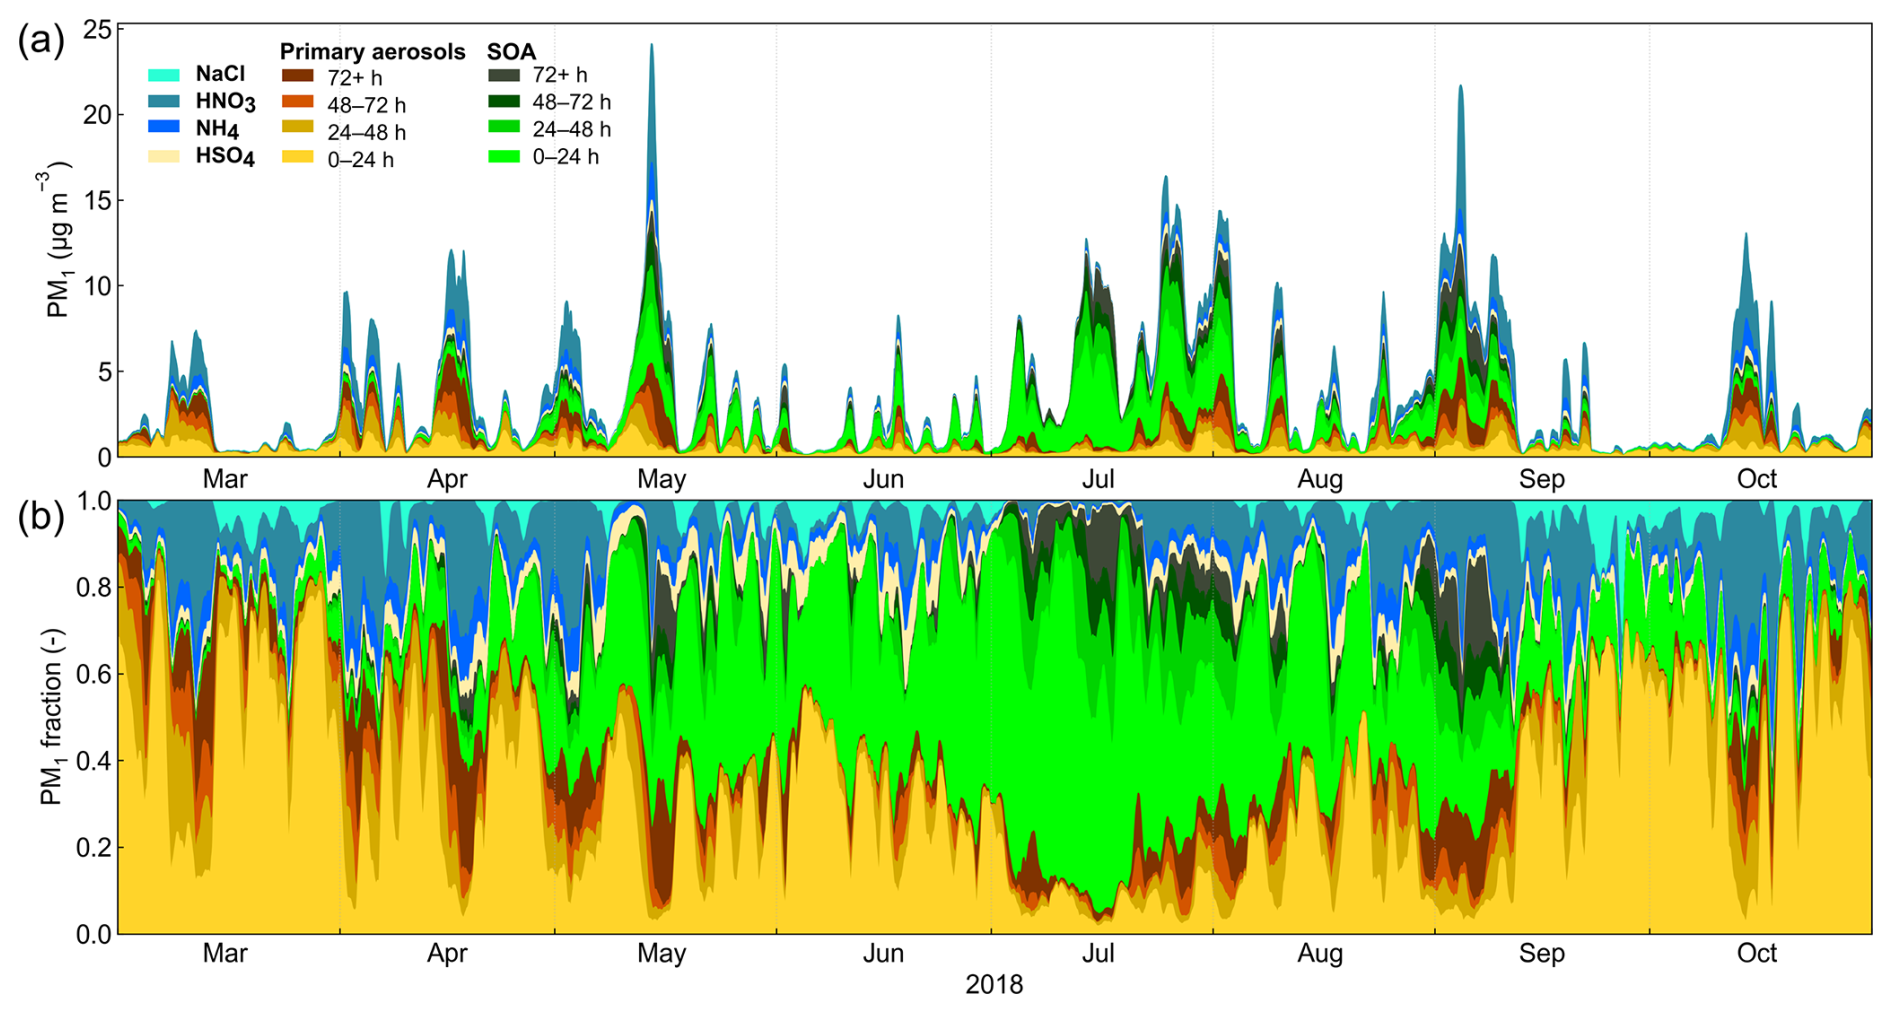
Figure 6(a) Time series of modelled PM1 aerosol components. (b) Modelled PM1 aerosol component mass fractions. Data is shown as moving average (24 h boxcar) of hourly values. “Primary aerosols” refers to particles that originate from anthropogenic emissions, SOA refers to organic aerosol that has formed through condensation of vapours.
3.3 CCN concentrations
Figure 7 shows model and SMEAR II measurements of CCN, for three maximum supersaturations. The measured 8 month time series shows large variation, generally higher median concentrations in the summer months and lower in the two autumn months. Summertime (JJA) median of measured [CCN0.5 %] was approximately +28 % of the 8 month median, autumn (SO) approximately −60 % of total median concentration, spring (MAM) being close to total median. In the 0.1 % supersaturation class only autumn concentrations differed significantly (−40 %, p<0.01, Mood's median test) from the total median. The model underestimates the concentrations of the 0.2 % and 0.5 % supersaturation classes, and overestimates the 0.1 % class, and does not capture the statistically significant increase in the summertime in the larger supersaturation class but does so with the autumn decrease. The modelled median [CCN] in the supersaturations above 0.5 % showed practically no change in the summertime and only a weak, statistically insignificant decrease in the autumn. As the measurements for the time period were available only for up to 0.5 % supersaturation, this cannot be verified against observations, but it seems reasonable to assume that the same trends that were observed in the 0.5 % supersaturation class would continue even in smaller particles. Figure 8 shows that although the model is able to capture the variation in [CCN] in short time scales, as evident from the satisfactory correlation of the daily median in all compared supersaturation classes (r2 was 0.49, 0.61 and 0.58 for 0.5 %, 0.2 % and 0.1 % supersaturation [CCN], respectively), the seasonal dynamics of [CCN] remained elusive and the increase in the summertime smaller diameter [CCN] is missed. In [CCN0.1 %] the model has least bias in the summer months, which could be an indication that the coarse mode particles (from primary emissions) are overshooting, and, as they are sinks to smallest particles, this would lead to underestimation of the higher supersaturation classes. However, the time series shows that during the same periods when the model overestimates [CCN0.1 %], the other classes have very little bias (spring) or increase their overestimation (August–September). In general both modelled and measured [CCN] correlate with primary emissions – r2 between mean PNE 0–4 d before the station and [CCN0.1 %] at the station was 0.57 for modelled and 0.38 for measured CCN; same comparison for [CCN0.5 %] showed r2 of 0.34 and 0.21 for modelled and measured CCN, respectively.
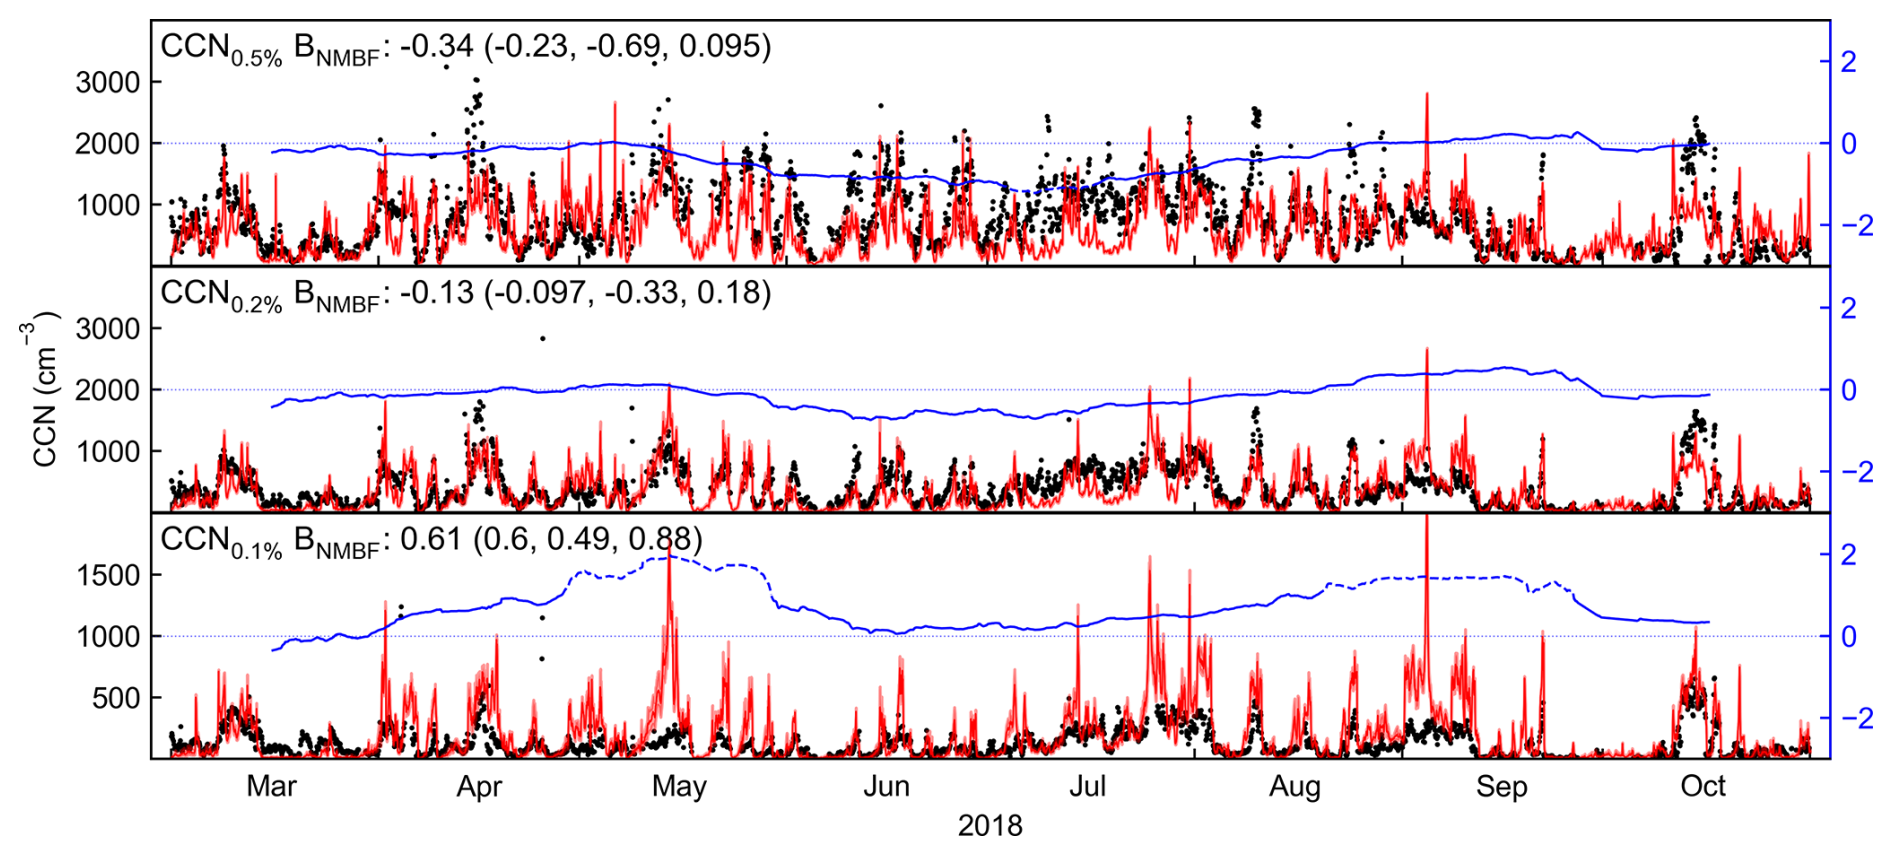
Figure 7Measured (black markers) and modelled (red line) CCN number concentration for 0.5 %, 0.2 % and 0.1 % supersaturation. A red shading is shown along the modelled [CCN] where the concentrations are calculated using the upper and lower limits of the κ-values of the components (see Table S2), giving an estimate of the uncertainty that is related to the component activities. For the most part the uncertainty due to κ is too small to stand out from the figure. The axis on the right shows the running BNMBF, with 30 d window, solid line marks periods where model is within a factor of two of measurements ().
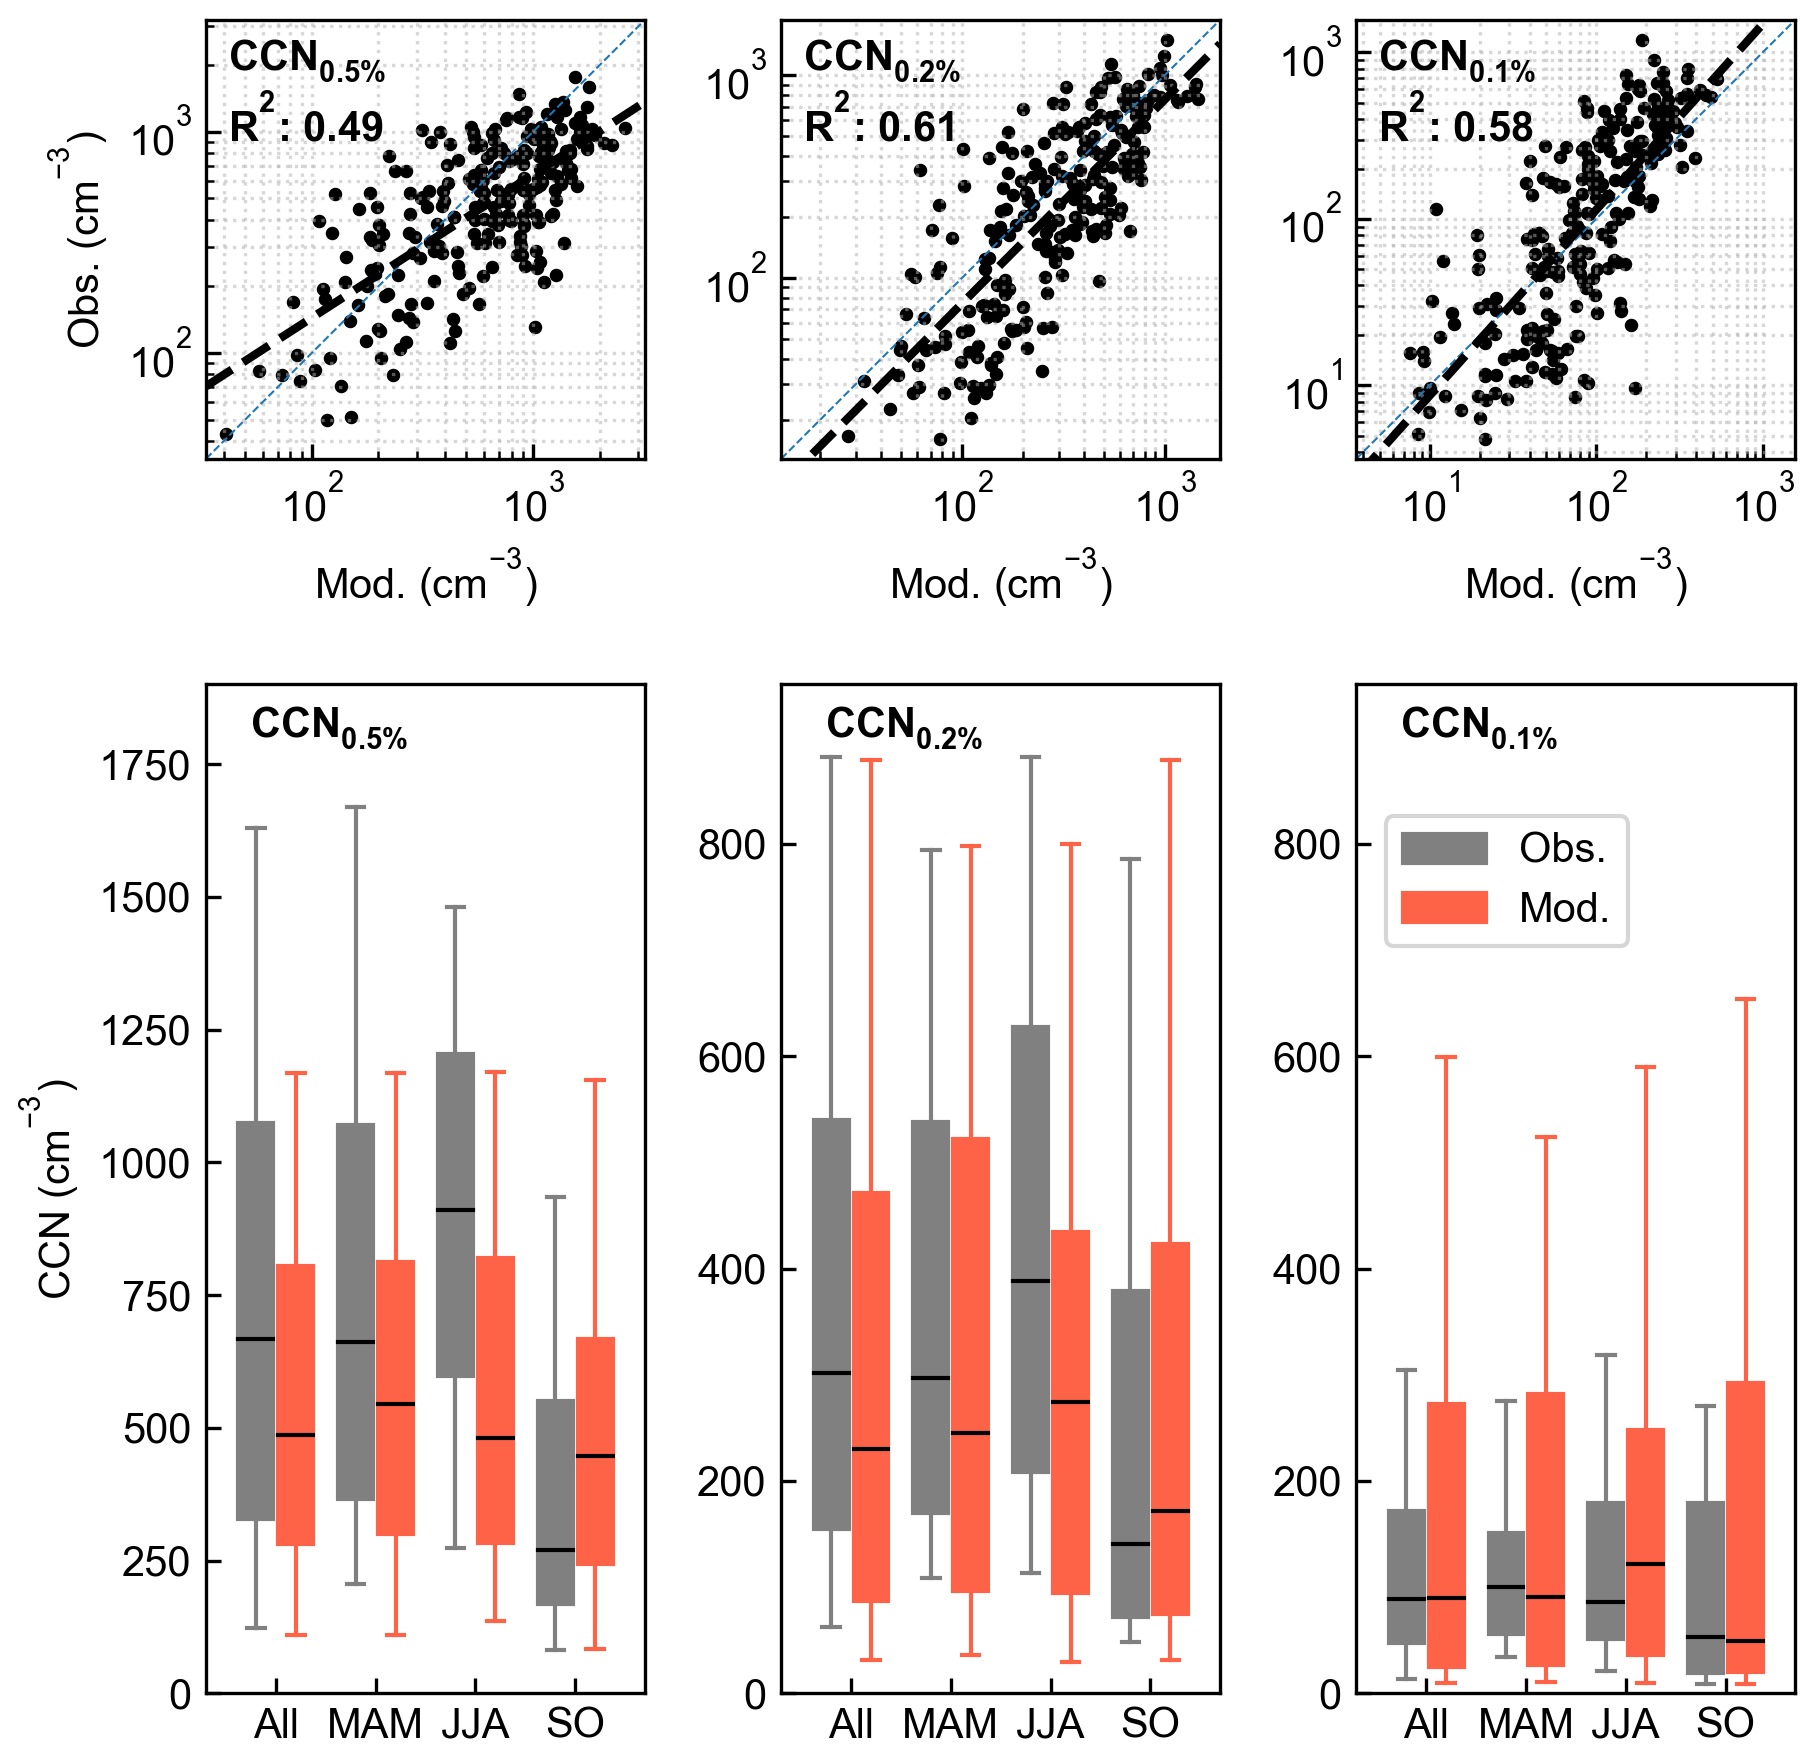
Figure 8Scatter (top row) and box plots (bottom row) of modelled and measured daily median CCN number concentrations of three supersaturation classes (left column: CCN0.5 %; middle column: CCN0.2 %; right column: CCN0.1 %). Box plots show data for full period (All), spring (MAM), summer (JJA) and the early autumn (SO), boxes include 25th–75th percentiles, while whiskers show 5 %–95 % range. Note the different scales in each supersaturation class.
3.4 Model sensitivity: CCN response to selected parameters
The model has shown good potential in capturing the variability of local gas concentrations as well as particle concentrations and composition, including CCN concentrations. The following sensitivity tests investigate the model response (R) to changes in some key parameters. Figure 9 shows the responses of three CCN supersaturation classes (1.0 %, 0.6 % and 0.2 % maximum supersaturation) to the perturbations in the three “Sensi” runs (see Table 2). In all classes, the model CCN are generally most responsive to the primary particle emissions, followed by BVOC emissions, whereas changes in cluster formation rates show the least response. However, the responses show large variation in seasonal and synoptic time scales, which could relate to the seasonal variation of BVOC emissions, as well as the history of the trajectories, namely which geographical areas and conditions (meteorological, emissions) they originate from (discussed in Sect. 3.5). The distributions of the responses, shown on the right panels in Fig. 9, show that all parameters have, on average, mostly a positive impact – that is – increasing the variable increases CCN concentrations. However, all parameters occasionally show negative responses, meaning that an increase will decrease CCN concentrations. This is most evident in the case of cluster formation rates, where for the lowest maximum supersaturation (largest diameter particles), increased nucleation rates show a negative response in CCN concentration, although the effect is much smaller in either direction than those of PNE or BVOC emissions. This is in line with some modelling studies where high concentrations in the nucleation mode caused a decrease in low volatility vapour concentrations and hindered the growth of larger particle sizes, resulting in less CCN in the lower supersaturation range (Roldin et al., 2019; Patoulias et al., 2024). During the time of largest negative effect [CCN0.1 %] were very low, indicating that the PNE size distribution at the time was low on the accumulation mode particles which would otherwise dominate the condensation sink, and therefore the particles from NPF would be comparable sinks of vapours, hindering the growth of accumulation mode. Cluster formation rates have a positive but surprisingly small effect to higher maximum supersaturation (smaller diameter) CCN. The RNUC stays in general below 10 % (8 % for the exponential effect RNUC,POW), meaning that to approximately double the CCN concentrations, more than ten-fold increase in the formation rates is needed, whereas a ten-fold decrease would decrease CCN by less than 10 %. The diurnal profiles of the responses reveal a more detailed picture where daytime CCN concentrations show considerably higher sensitivity to cluster formation rates – even exceeding those of PNE emissions – and lower to particle number emissions, when compared with the seasonal medians (Fig. S19). The weak impact of cluster formation to CCN concentration can be ultimately attributed to the low survival probability of 1–2 nm clusters and the resulting small contribution to the total CCN. Changes in BVOC emissions affect CCN in a similar, if more benign, diurnal pattern as changes in PNE, implying that effect of BVOC emission particularly affect the particles that are in the upper range of the Aitken mode and are able to accumulate mass via compounds that are low- or semi-volatile and not only via extremely low volatility vapours. This would favour the primary particles, which are already close to, or in this size range when emitted.
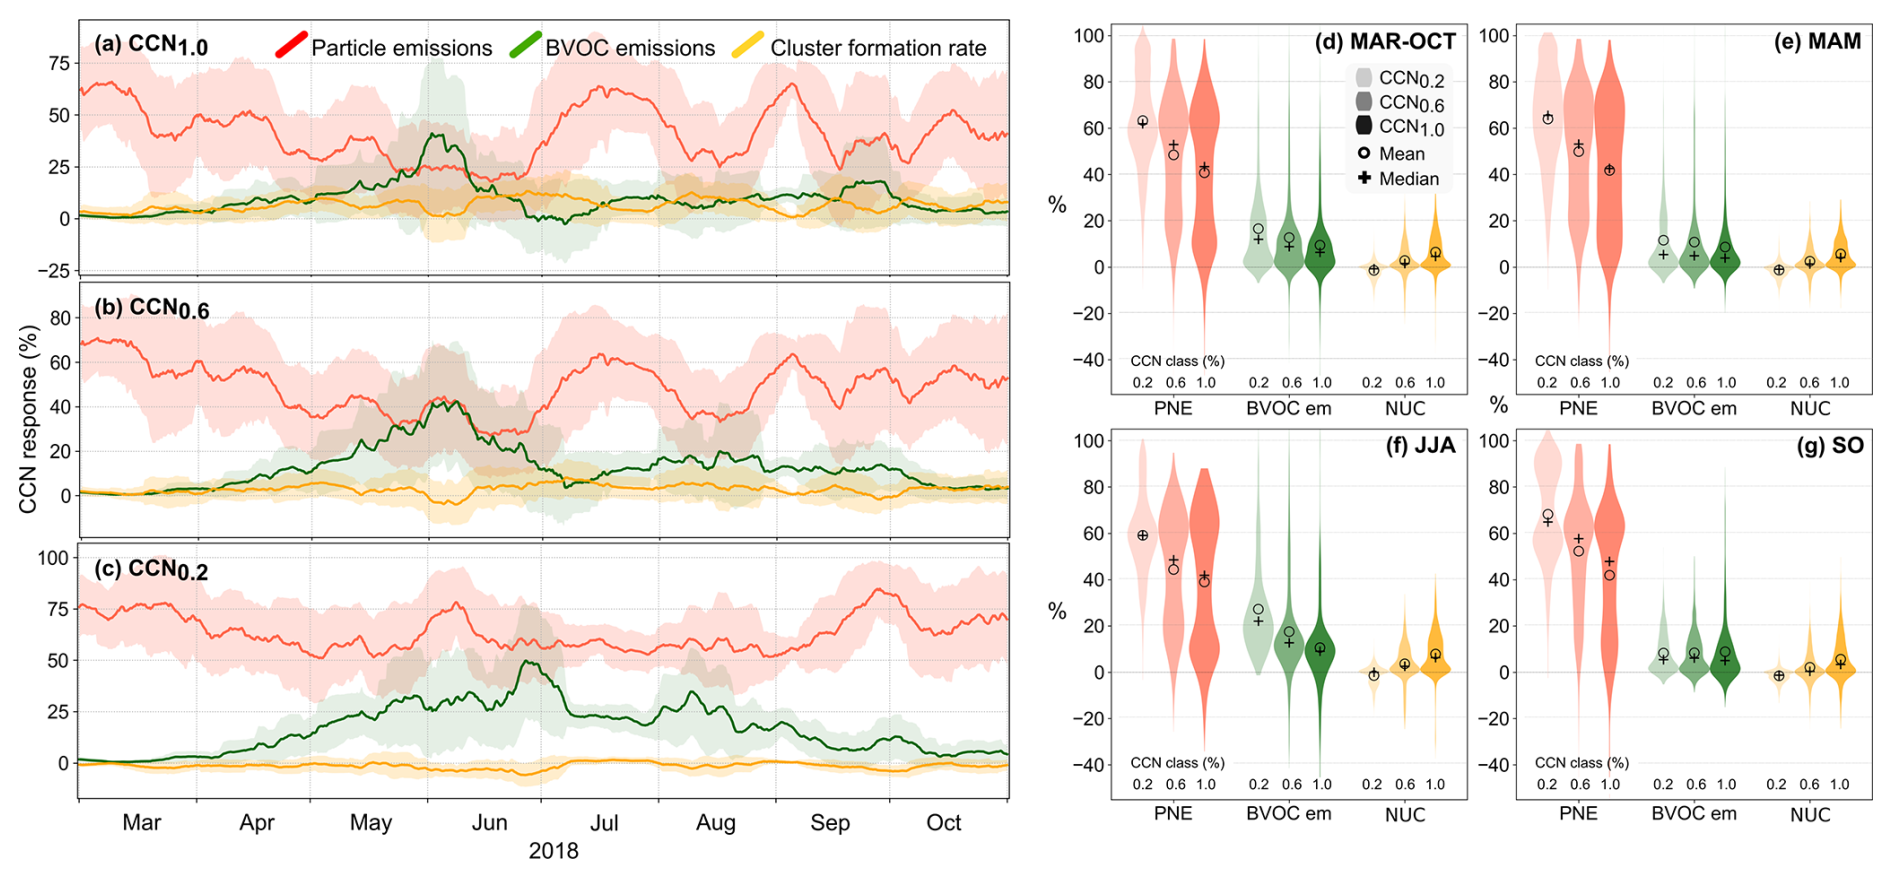
Figure 9The calculated responses RPNE, RBIO and RNUC of CCN number concentration to changes in anthropogenic particle emissions (red), BVOC emissions (green) and cluster formation rate (yellow), shown as 12 d running mean for three supersaturation classes: (a) 1.0 %, (b) 0.6 %, (c) 0.2 %. The input parameters were varied separately in the three “Sensi”-simulations (Table 2). The shaded areas show the ± standard deviation for the 12 d window used in the running mean. Panels (d)–(g) show the grouped distribution of the responses in panels (a)–(c) as violin plots for the full study period (d), spring (e), summer (f) and autumn (g), with mean marked with circle and median marked with cross.
Figure 10 shows the differences in median CCN concentrations between Zero-simulations (Table 2) and BASE for the total dataset, separated to daily, daytime and nighttime medians (the monthly distributions of the changes, along with 12 d running mean are shown in Fig. S18). Setting the formation rates to zero changed the median [CCN1.2 %] by −48 % (−50 %, −45 %) and median [CCN0.1 %] by +23 % (+12 %, +35 %), where range in brackets is the 95 % confidence interval of the change obtained by random sampling of the Zero-simulation distributions (“bootstrapping”). Monthly analysis shows that this increase was mostly due to increase in June and October, while in other months the median CCN0.1 % concentrations were not significantly different (p>0.05 in Mood's test) from the BASE. However, due to the low [CCN0.1 %] in June the strong increase was not in general reflected in the summertime median concentrations, which increased by only 14 % (Table S4). Removing PNE from the model decreases the coagulation sink, thereby increasing the cluster formation rates (on average by approximately threefold), and these changes in ZeroPNE simulation are shown in Fig. S7 and further discussed in the Supplement.
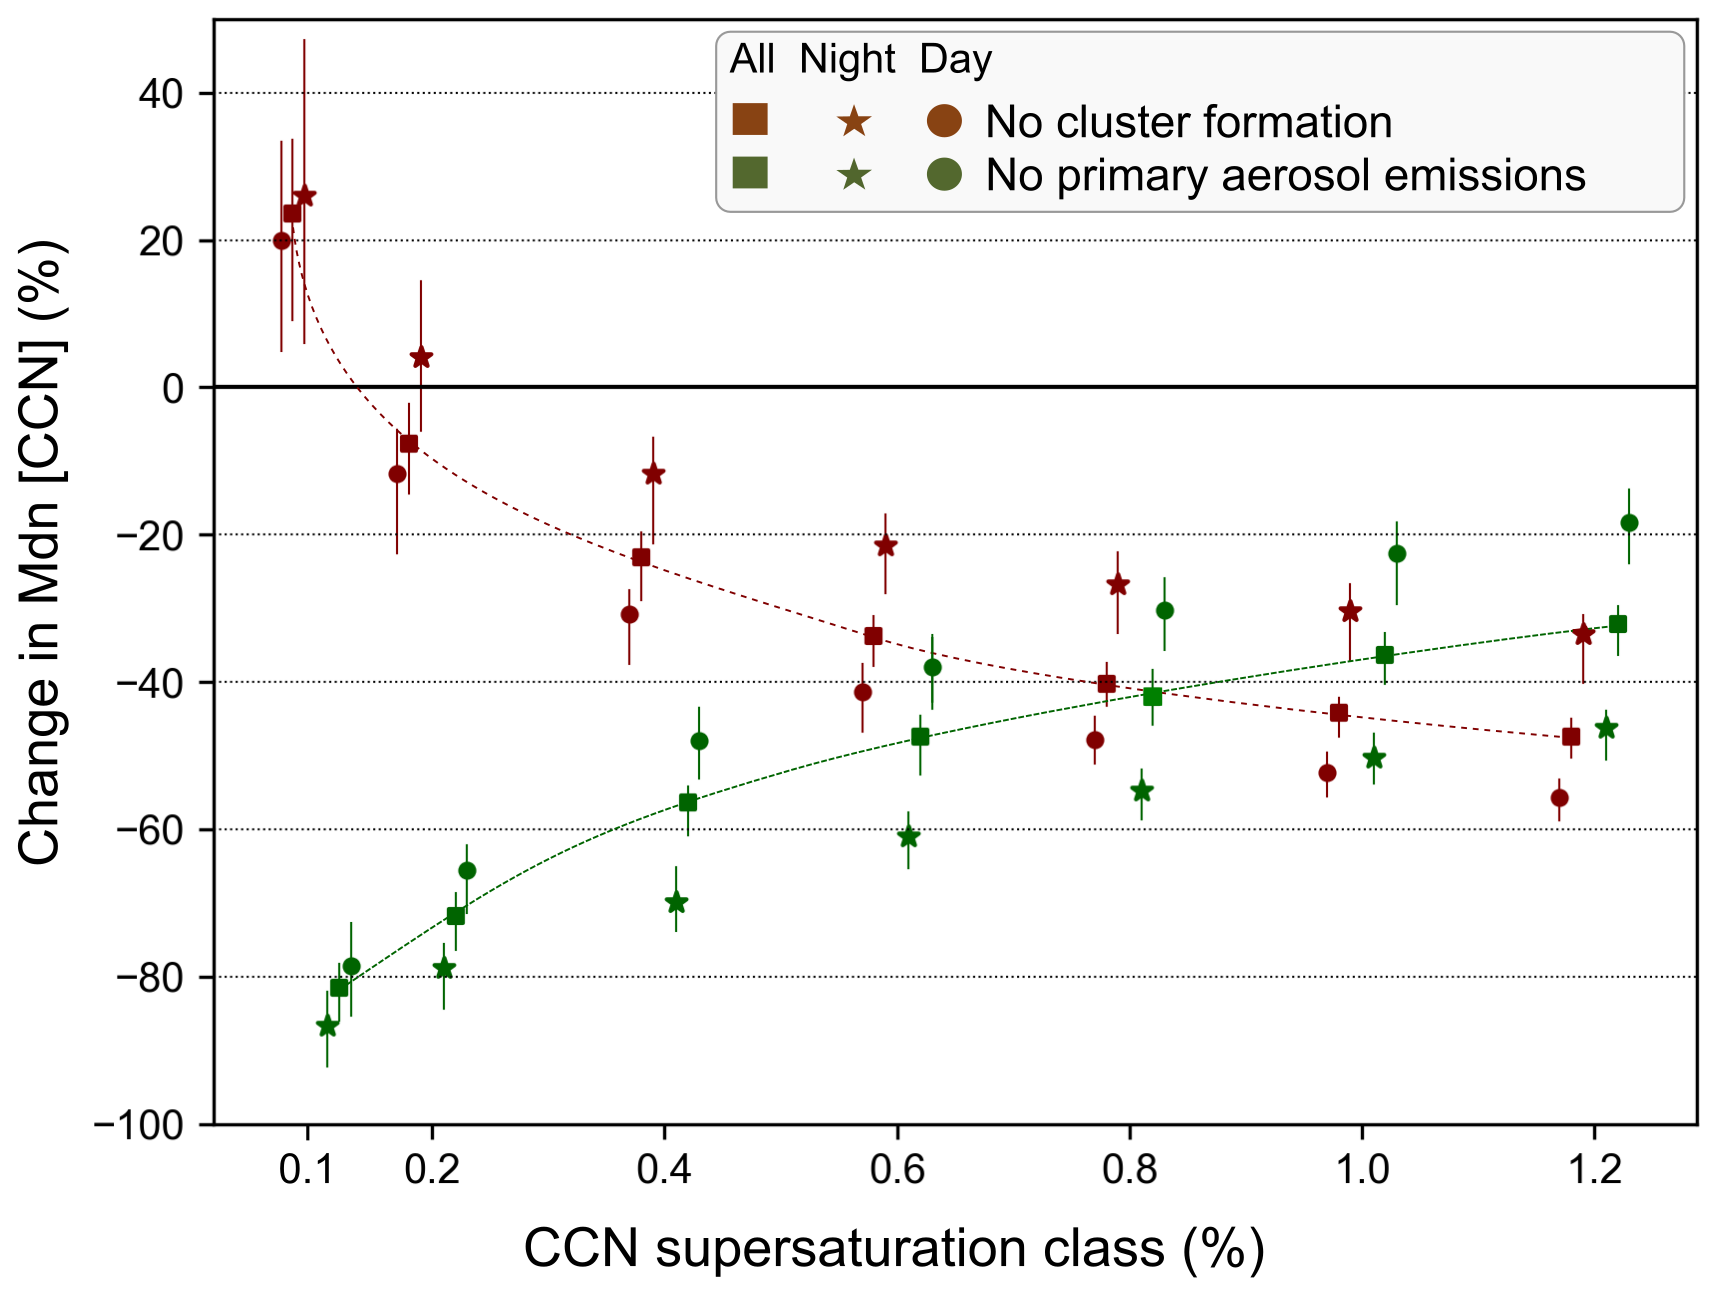
Figure 10Relative change in median CCN number concentrations between Zero-simulations and BASE (Table 2), during the study period March–October, for nighttime (21:00–07:00 LT, marked with star symbol), daytime (08:00–20:00 LT, marked with round symbol) and daily concentrations (marked with squares). The vertical range represents 95 % confidence intervals of the median, obtained from bootstrapping. The spline fits for daily change of medians are provided for visual aid only.
Removing all particle emissions from the model had generally a decreasing effect in all CCN classes, strongest in the CCN0.1 %, where the change in median concentrations was −82 % (−86 %, −78 %) and smallest in the CCN1.2 % class with a change of −33 % (−36 %,−29 %). As expected from the diurnal profiles of the responses, removing cluster formation had a stronger effect in daytime CCN concentrations, while the opposite was true for removing PNE (Fig. 10). The diurnal effect increased towards the smallest CCN sizes and was particularly evident in the ZeroPNE simulation, where the daytime decrease of median [CCN1.2 %] (−19 %) was less than half of what was seen in nighttime concentrations (−46 %).
The results from the Zero-simulations, supported by the sensitivity studies, can be used to estimate the overall impact of new particle formation and primary number emissions to the CCN concentrations. The effects differ markedly in the extreme ends of the chosen supersaturation classes: the CCN0.1 % seems to be dominated by the primary emissions; we estimate 85 % of daytime and 90 % of nighttime concentrations of the study period and location can be attributed to PNE, while NPF contributes approximately 65 % of the daytime and 45 % of the nighttime CCN1.2 % concentrations. The seasonal and synoptic variability is considerable, and these fractions would differ markedly for specific time periods or seasons (Fig. S18). As the responses RNUC are very low, significant changes in cluster formation rates are required to substantially affect CCN concentrations. Therefore, in the presence of primary particle emissions, cluster formation is suppressed to levels where its impact on CCN formation is not showing its full potential, which would be seen in cleaner air with low background concentration and coagulation sink. While nucleation still is a significant contributor to CCN, particularly during daytime and higher supersaturation size classes, primary emissions strongly affect the CCN concentrations under current conditions. However, cloud processes and related aqueous-phase inorganic chemistry could impact this outcome (e.g. Xavier et al., 2022). Furthermore, we point out that the ZeroPNE simulation was not a true pre-industrial scenario, as other anthropogenic emissions, including SO2, were as in BASE.
3.5 Origins and history of modelled CCN
Trajectory modelling enables the identification of the processes and conditions that lead to CCN. To this end, the geographical origins and environmental conditions of the trajectories were plotted in one diagram (Fig. S20). In March, cluster formation rates were average throughout the period, with low BVOC emissions. Early March peak in CCN is accompanied with some BVOC and notable PNE and cluster formation, origins from south-east, whereas second half of March saw below average CCN, PNE and BVOC, with average cluster formation, and origins from north-westerly direction. With increasing temperatures in April the BVOC emissions pick up, cluster formation is strong, but the peaks in CCN coincide more with elevated PNE (and BVOC). The end of April shows airmasses originating from west of SMEAR II, elevated cluster formation rates 3–4 d prior to station, followed by increasing BVOC emissions and decreasing particle emissions during the last 2 d. The resulting increase in [CCN1.0 %] at the end of April could be described as a typical new particle formation event leading to CCN, whereas the peak in mid-May, while still showing strong BVOC emissions, seems to mostly originate from PNE. Otherwise, much of the April–June period includes trajectories with westerly to north-westerly component, formation of clusters and average [CCN1.0 %]. Especially in June primary emissions were low, cluster formation along trajectories generally lasted for days with BVOC emissions overlapping, indicating that much of the CCN was likely formed from NPF (also supported by the Zero-simulations). In contrast, July and early September mostly saw periods with weak cluster formation, elevated BVOC and primary particle emissions, related to south-easterly origins of the airmasses, coinciding with some of the highest CCN concentrations in the studied time period (see also Fig. S21). The different pathways of CCN origins are also supported by the fractions of [CCN0.2 %][CCN1.2 %] (Fig. S16), where low fractions are seen in end of March, end of April, June, mid-August and late September and early October, coinciding with low PNE (and lower than average fraction of 3–30 nm emissions) and suggesting formation of CCN via NPF.
Although the model evaluation demonstrated promising results, challenges remain. The model SOSAA overestimated the particle concentrations within the 1–30 nm diameter range while underestimating the Aitken mode. Paasonen et al. (2016) estimated that the applied PNE in nucleation mode is clearly underestimated, a conclusion subsequently corroborated by observations in Beijing (Kontkanen et al., 2020). Overestimating the concentrations while very likely underestimating the emissions in this size range would suggest that the growth of the newly formed particles is not sufficiently efficient in the model. The overestimated nucleation mode concentrations may be partly attributable to more frequent new particle formation events in SOSAA compared to observations at the SMEAR II station, but the deficit in Aitken mode particles likely stems from low particle survivability due to coagulation sink, and/or insufficient particle growth.
Our simulations showed that just increasing the current BVOC emissions did not sufficiently favour this growth as the majority of low volatility vapours were accumulating on the larger particles, leading to overestimation in both aerosol mass and [HOM] measurements at SMEAR II, without significant shift of the nucleation mode towards Aitken and CCN sizes. When comparing the modelled and measured sulfuric acid and HOM concentrations, the model does not suffer from a considerable lack of low volatility vapours. SOSAA-FP chemistry module in this work did not have an autoxidation scheme for aromatics, meaning that some low volatility vapours are still missing from the model.
The capacity of AVOC emissions to enhance SOA production is well-established (Riva et al., 2019). Specifically, aromatic compounds such as benzenes, polyaromatics, and cycloalkanes, which are prevalent in anthropogenic emissions, significantly increase the yield of highly oxidized molecules in the atmosphere via autoxidation reactions, thereby increase SOA mass (Rissanen, 2021). Furthermore, it is possible that condensational growth alone is insufficient to replicate the observed size distributions, at least within the constraints of the current estimations of saturation vapour pressures. Other processes, such as surface reactions and inorganic particle phase chemistry, and mechanisms not yet represented in the SOSAA model may contribute significantly to enhancement of SOA yields. This suggests that the model's vapour pressure-based approach to gas-particle partitioning, which for extremely low volatility compounds and H2SO4 effectively leads to condensation at the kinetic limit, is inadequate for accurately simulating the pathway from cluster formation to CCN. Including processes that enhance the growth of the nucleation mode particles, such as cloud processing or heterogeneous chemistry, or increase their survivability, such as primary particle evaporation (discussed in Sect. 3.2) could improve the model results and warrants further in-depth investigation. An additional mechanism to consider is the impact of stochastic growth, which Olenius et al. (2018) demonstrated provides a more accurate representation of growth for particles below approximately 5 nm in diameter. Box models utilizing similar aerosol physics mechanisms as was used in this study have been evaluated in chamber experiments to the extent that doubting the modelling of coagulation seems unnecessary. Concurrently, recent advances in understanding the heterogeneous chemistry of atmospheric particles provide a solid foundation for integrating these processes into future models. Lastly, given the characteristically slow growth of nucleation mode particles to CCN sizes, the discrepancy in the 30–300 nm modelled and observed number concentrations may also originate from an underestimation within the particle emission dataset. This possibility underscores the critical importance of accurate primary particle number emission estimates for modelling CCN processes.
In this work we have used a novel Lagrangian modelling framework to examine the origins and history of gas and aerosol components observed at the boreal forest measurements site SMEAR II. The SOSAA-FP framework integrates global emission datasets, FLEXPART backward trajectories, and the detailed atmospheric chemistry and aerosol dynamics of the SOSAA model. The period from March to October 2018 was simulated by using this framework with 1 h temporal resolution. The SOSAA-FP framework simplifies three-dimensional transport of atmospheric components while providing a more comprehensive description of gas-phase chemistry, aerosol dynamics and composition than large-scale 3-D models. Model evaluation against observations confirmed the framework's ability in assessing the impacts of airmass origins, emissions, meteorology, and seasonal variations. The model performed particularly well for larger aerosol particles, agreeing with measured bulk particulate mass, composition, and CCN concentrations. However, challenges persist in reproducing the size distributions of smaller particles and certain gas-phase species, and these issues are partly attributable to uncertainties in the input data. Despite these limitations, the SOSAA-FP framework demonstrates significant potential for future applications in air quality, cloud formation, and aerosol optical properties. Our results from the study period showed large temporal variation in the impacts of primary aerosol emissions to CCN concentrations at SMEAR II station. On average between March and October 2018, the modelled [CCN0.4 %] and [CCN1.2 %] without primary particle emissions decreased by 56 % and 33 % and without cluster formation by 22 % and 48 %, respectively. These results illustrate a non-linear, compensatory relationship between the two sources: the deficit in CCN in the ZeroPNE from missing primary emissions is partially offset by enhanced new particle formation. This effect arises primarily from reduced coagulation sink for molecular clusters, thereby improving their survivability, and the shift in the condensation sink towards smaller sizes, increasing growth rates of smaller particles.
Sensitivity simulations show that CCN concentrations strongly respond to primary particle emissions, especially outside the growth season, underlining the importance of size-dependent primary particle emission data for models. These modelling results highlight the highly dynamic and complex relation between atmospheric aerosol formation and primary emissions. Although the direct pathway from NPF to CCN may dominate in remote regions, the geographic domain of this study (Northern Europe) is subject to considerable anthropogenic influence, despite the rural setting of the SMEAR II station. These findings suggest that, despite decades of improved air quality and emission control strategies, anthropogenic activities continue to exert a substantial influence on atmospheric fine particle concentrations.
| BIO | BVOC emissions in the model |
| NUC | Cluster formation rates in the model |
| PNE | Anthropogenic PN1 µm particle number emissions in the model |
| fI | factor of change in BIO, NUC or PNE |
| fQ | factor of change in some model output |
| ) | Model response to change in BIO, NUC or PNE, calculated from fI and fO |
| (A/B)VOC | (Anthropogenic/Biogenic) volatile organic compound |
| NPF | New particle formation, including formation of clusters and their growth |
| HOM | Highly oxygenated molecules, C : O ratio y < 0.7 (Bianchi et al., 2019) |
| CCNX | Cloud condensation nuclei at supersaturation x % |
| [C] | brackets refer to concentration of C (cm−3 if not stated otherwise) |
| PSD | particle size distribution |
The processed model data used for figures is available at https://doi.org/10.5281/zenodo.14602389 (Clusius, 2025). SOSAA-FP code, and full model input and output is available at request from the corresponding author.
The supplement related to this article is available online at https://doi.org/10.5194/acp-26-1967-2026-supplement.
MiB and PIP outlined the study. PC, MeB, CX, PZ, JT, PP performed the model development and data preprocessing, PC conducted the simulations and evaluations, analyzed the simulation results, wrote the original paper and plotted all figures, under supervision of PP, MiB and PIP. MÄ, FG processed and provided ACSM data. All authors contributed to the paper preparation, discussion, and writing.
The contact author has declared that none of the authors has any competing interests.
Publisher's note: Copernicus Publications remains neutral with regard to jurisdictional claims made in the text, published maps, institutional affiliations, or any other geographical representation in this paper. The authors bear the ultimate responsibility for providing appropriate place names. Views expressed in the text are those of the authors and do not necessarily reflect the views of the publisher.
The authors wish to thank the Finnish CSC – IT Center for Science Ltd. for providing invaluable HPC resources for this study. PC gratefully acknowledges the University of Edinburgh and University of Helsinki Partnership Programme on Forests. We acknowledge the FLEXPART development team (FlexTeam, University of Vienna; flex team.univie.ac.at). PZ would also like to acknowledge the Horizon Europe project FOCI (101056783) and the DORA (Determination of Observations to Reduce Aerosol Radiative Forcing Uncertainty) project founded by the Väisälä project grant (Suomalaisen Tiedeakatemian Väisälä-hankeapuraha).
Financial support was provided through the Research Council of Finland (project nos. 360114, ACCC 337549) and Horizon Europe project FOCI (101056783). Additionally, this project was funded by internal resources at the University of Helsinki's Lahti University Campus.
Open-access funding was provided by the Helsinki University Library.
This paper was edited by Dantong Liu and reviewed by two anonymous referees.
Aalto, P., Hämeri, K., Becker, E., Weber, R., Salm, J., Mäkelä, J. M., Hoell, C., O'Dowd, C. D., Karlsson, H., Hansson, H.-C., Väkevä, M., Koponen, I. K., Buzorius, G., and Kulmala, M.: Physical characterization of aerosol particles during nucleation events, Tellus B, 53, 344–358, https://doi.org/10.1034/j.1600-0889.2001.530403.x, 2001.
Äijälä, M., Daellenbach, K. R., Canonaco, F., Heikkinen, L., Junninen, H., Petäjä, T., Kulmala, M., Prévôt, A. S. H., and Ehn, M.: Constructing a data-driven receptor model for organic and inorganic aerosol – a synthesis analysis of eight mass spectrometric data sets from a boreal forest site, Atmos. Chem. Phys., 19, 3645–3672, https://doi.org/10.5194/acp-19-3645-2019, 2019.
Allan, J. D., Alfarra, M. R., Bower, K. N., Coe, H., Jayne, J. T., Worsnop, D. R., Aalto, P. P., Kulmala, M., Hyötyläinen, T., Cavalli, F., and Laaksonen, A.: Size and composition measurements of background aerosol and new particle growth in a Finnish forest during QUEST 2 using an Aerodyne Aerosol Mass Spectrometer, Atmos. Chem. Phys., 6, 315–327, https://doi.org/10.5194/acp-6-315-2006, 2006.
Almeida, J., Schobesberger, S., Kürten, A., Ortega, I. K., Kupiainen-Määttä, O., Praplan, A. P., Adamov, A., Amorim, A., Bianchi, F., Breitenlechner, M., David, A., Dommen, J., Donahue, N. M., Downard, A., Dunne, E., Duplissy, J., Ehrhart, S., Flagan, R. C., Franchin, A., Guida, R., Hakala, J., Hansel, A., Heinritzi, M., Henschel, H., Jokinen, T., Junninen, H., Kajos, M., Kangasluoma, J., Keskinen, H., Kupc, A., Kurtén, T., Kvashin, A. N., Laaksonen, A., Lehtipalo, K., Leiminger, M., Leppä, J., Loukonen, V., Makhmutov, V., Mathot, S., McGrath, M. J., Nieminen, T., Olenius, T., Onnela, A., Petäjä, T., Riccobono, F., Riipinen, I., Rissanen, M., Rondo, L., Ruuskanen, T., Santos, F. D., Sarnela, N., Schallhart, S., Schnitzhofer, R., Seinfeld, J. H., Simon, M., Sipilä, M., Stozhkov, Y., Stratmann, F., Tomé, A., Tröstl, J., Tsagkogeorgas, G., Vaattovaara, P., Viisanen, Y., Virtanen, A., Vrtala, A., Wagner, P. E., Weingartner, E., Wex, H., Williamson, C., Wimmer, D., Ye, P., Yli-Juuti, T., Carslaw, K. S., Kulmala, M., Curtius, J., Baltensperger, U., Worsnop, D. R., Vehkamäki, H., and Kirkby, J.: Molecular understanding of sulphuric acid-amine particle nucleation in the atmosphere, Nature, 502, 359–363, https://doi.org/10.1038/nature12663, 2013.
Amann, M., Bertok, I., Borken-Kleefeld, J., Cofala, J., Heyes, C., Höglund-Isaksson, L., Klimont, Z., Nguyen, B., Posch, M., Rafaj, P., Sandler, R., Schöpp, W., Wagner, F., and Winiwarter, W.: Cost-effective control of air quality and greenhouse gases in Europe: Modeling and policy applications, Environ. Model. Softw., 26, 1489–1501, https://doi.org/10.1016/j.envsoft.2011.07.012, 2011.
Behera, S. N., Sharma, M., Aneja, V. P., and Balasubramanian, R.: Ammonia in the atmosphere: a review on emission sources, atmospheric chemistry and deposition on terrestrial bodies, Environ. Sci. Pollut. Res., 20, 8092–8131, https://doi.org/10.1007/s11356-013-2051-9, 2013.
Besel, V., Kubečka, J., Kurtén, T., and Vehkamäki, H.: Impact of Quantum Chemistry Parameter Choices and Cluster Distribution Model Settings on Modeled Atmospheric Particle Formation Rates, J. Phys. Chem. A, 124, 5931–5943, https://doi.org/10.1021/acs.jpca.0c03984, 2020.
Bianchi, F., Kurtén, T., Riva, M., Mohr, C., Rissanen, M. P., Roldin, P., Berndt, T., Crounse, J. D., Wennberg, P. O., Mentel, T. F., Wildt, J., Junninen, H., Jokinen, T., Kulmala, M., Worsnop, D. R., Thornton, J. A., Donahue, N., Kjaergaard, H. G., and Ehn, M.: Highly Oxygenated Organic Molecules (HOM) from Gas-Phase Autoxidation Involving Peroxy Radicals: A Key Contributor to Atmospheric Aerosol, Chem. Rev., 119, 3472–3509, https://doi.org/10.1021/acs.chemrev.8b00395, 2019.
Blake, R. S., Monks, P. S., and Ellis, A. M.: Proton-Transfer Reaction Mass Spectrometry, Chem. Rev., 109, 861–896, https://doi.org/10.1021/cr800364q, 2009.
Boy, M., Zhou, P., Kurtén, T., Chen, D., Xavier, C., Clusius, P., Roldin, P., Baykara, M., Pichelstorfer, L., Foreback, B., Bäck, J., Petäjä, T., Makkonen, R., Kerminen, V.-M., Pihlatie, M., Aalto, J., and Kulmala, M.: Positive feedback mechanism between biogenic volatile organic compounds and the methane lifetime in future climates, npj Clim. Atmos. Sci., 5, https://doi.org/10.1038/s41612-022-00292-0, 2022.
Chamba, G., Rissanen, M., Barthelmeß, T., Saiz-Lopez, A., Rose, C., Iyer, S., Saint-Macary, A., Rocco, M., Safi, K., Deppeler, S., Barr, N., Harvey, M., Engel, A., Dunne, E., Law, C. S., and Sellegri, K.: Evidence of nitrate-based nighttime atmospheric nucleation driven by marine microorganisms in the South Pacific, P. Natl. Acad. Sci. USA, 120, https://doi.org/10.1073/pnas.2308696120, 2023.
Chen, D., Xavier, C., Clusius, P., Nieminen, T., Roldin, P., Qi, X., Pichelstorfer, L., Kulmala, M., Rantala, P., Aalto, J., Sarnela, N., Kolari, P., Keronen, P., Rissanen, M. P., Taipale, D., Foreback, B., Baykara, M., Zhou, P., and Boy, M.: A modelling study of OH, NO3 and H2SO4 in 2007–2018 at SMEAR II, Finland: analysis of long-term trends, Environ. Sci. Atmos., 1, 449–472, https://doi.org/10.1039/d1ea00020a, 2021.
Ciarelli, G., Aksoyoglu, S., Crippa, M., Jimenez, J.-L., Nemitz, E., Sellegri, K., Äijälä, M., Carbone, S., Mohr, C., O'Dowd, C., Poulain, L., Baltensperger, U., and Prévôt, A. S. H.: Evaluation of European air quality modelled by CAMx including the volatility basis set scheme, Atmos. Chem. Phys., 16, 10313–10332, https://doi.org/10.5194/acp-16-10313-2016, 2016.
Clusius, P.: SOSAA-FP postprocessed aerosol data from base and sensitivity simulations, https://doi.org/10.5281/zenodo.14602389, 2025.
Clusius, P., Xavier, C., Pichelstorfer, L., Zhou, P., Olenius, T., Roldin, P., and Boy, M.: Atmospherically Relevant Chemistry and Aerosol box model – ARCA box (version 1.2), Geosci. Model Dev., 15, 7257–7286, https://doi.org/10.5194/gmd-15-7257-2022, 2022.
Crippa, M., Guizzardi, D., Muntean, M., Schaaf, E., Dentener, F., van Aardenne, J. A., Monni, S., Doering, U., Olivier, J. G. J., Pagliari, V., and Janssens-Maenhout, G.: Gridded emissions of air pollutants for the period 1970–2012 within EDGAR v4.3.2, Earth Syst. Sci. Data, 10, 1987–2013, https://doi.org/10.5194/essd-10-1987-2018, 2018.
Dada, L., Paasonen, P., Nieminen, T., Buenrostro Mazon, S., Kontkanen, J., Peräkylä, O., Lehtipalo, K., Hussein, T., Petäjä, T., Kerminen, V.-M., Bäck, J., and Kulmala, M.: Long-term analysis of clear-sky new particle formation events and nonevents in Hyytiälä, Atmos. Chem. Phys., 17, 6227–6241, https://doi.org/10.5194/acp-17-6227-2017, 2017.
Dada, L., Stolzenburg, D., Simon, M., Fischer, L., Heinritzi, M., Wang, M., Xiao, M., Vogel, A. L., Ahonen, L., Amorim, A., Baalbaki, R., Baccarini, A., Baltensperger, U., Bianchi, F., Daellenbach, K. R., DeVivo, J., Dias, A., Dommen, J., Duplissy, J., Finkenzeller, H., Hansel, A., He, X.-C., Hofbauer, V., Hoyle, C. R., Kangasluoma, J., Kim, C., Kürten, A., Kvashnin, A., Mauldin, R., Makhmutov, V., Marten, R., Mentler, B., Nie, W., Petäjä, T., Quéléver, L. L. J., Saathoff, H., Tauber, C., Tome, A., Molteni, U., Volkamer, R., Wagner, R., Wagner, A. C., Wimmer, D., Winkler, P. M., Yan, C., Zha, Q., Rissanen, M., Gordon, H., Curtius, J., Worsnop, D. R., Lehtipalo, K., Donahue, N. M., Kirkby, J., El Haddad, I., and Kulmala, M.: Role of sesquiterpenes in biogenic new particle formation, Sci. Adv., 9, https://doi.org/10.1126/sciadv.adi5297, 2023.
Denier van der Gon, H., Visschedijk, A., Johansson, C., Larsson, E. H., Harrison, R. M., and Beddows, D.: Size-resolved Pan European Anthropogenic Particle Number Inventory, EU-CAARI Deliverable D141, 2009.
Donahue, N. M., Epstein, S. A., Pandis, S. N., and Robinson, A. L.: A two-dimensional volatility basis set: 1. organic-aerosol mixing thermodynamics, Atmos. Chem. Phys., 11, 3303–3318, https://doi.org/10.5194/acp-11-3303-2011, 2011.
Dunne, E. M., Gordon, H., Kürten, A., Almeida, J., Duplissy, J., Williamson, C., Ortega, I. K., Pringle, K. J., Adamov, A., Baltensperger, U., Barmet, P., Benduhn, F., Bianchi, F., Breitenlechner, M., Clarke, A., Curtius, J., Dommen, J., Donahue, N. M., Ehrhart, S., Flagan, R. C., Franchin, A., Guida, R., Hakala, J., Hansel, A., Heinritzi, M., Jokinen, T., Kangasluoma, J., Kirkby, J., Kulmala, M., Kupc, A., Lawler, M. J., Lehtipalo, K., Makhmutov, V., Mann, G., Mathot, S., Merikanto, J., Miettinen, P., Nenes, A., Onnela, A., Rap, A., Reddington, C. L. S., Riccobono, F., Richards, N. A. D., Rissanen, M. P., Rondo, L., Sarnela, N., Schobesberger, S., Sengupta, K., Simon, M., Sipilä, M., Smith, J. N., Stozkhov, Y., Tomé, A., Tröstl, J., Wagner, P. E., Wimmer, D., Winkler, P. M., Worsnop, D. R., and Carslaw, K. S.: Global atmospheric particle formation from CERN CLOUD measurements, Science, 354, 1119–1124, https://doi.org/10.1126/science.aaf2649, 2016.
Dusek, U., Frank, G. P., Hildebrandt, L., Curtius, J., Schneider, J., Walter, S., Chand, D., Drewnick, F., Hings, S., Jung, D., Borrmann, S., and Andreae, M. O.: Size Matters More Than Chemistry for Cloud-Nucleating Ability of Aerosol Particles, Science, 312, 1375–1378, https://doi.org/10.1126/science.1125261, 2006.
Ehn, M., Thornton, J. A., Kleist, E., Sipilä, M., Junninen, H., Pullinen, I., Springer, M., Rubach, F., Tillmann, R., Lee, B., Lopez-Hilfiker, F., Andres, S., Acir, I.-H., Rissanen, M., Jokinen, T., Schobesberger, S., Kangasluoma, J., Kontkanen, J., Nieminen, T., Kurtén, T., Nielsen, L. B., Jørgensen, S., Kjaergaard, H. G., Canagaratna, M., Maso, M. D., Berndt, T., Petäjä, T., Wahner, A., Kerminen, V.-M., Kulmala, M., Worsnop, D. R., Wildt, J., and Mentel, T. F.: A large source of low-volatility secondary organic aerosol, Nature, 506, 476–479, https://doi.org/10.1038/nature13032, 2014.
Elm, J., Kubečka, J., Besel, V., Jääskeläinen, M. J., Halonen, R., Kurtén, T., and Vehkamäki, H.: Modeling the formation and growth of atmospheric molecular clusters: A review, J. Aerosol Sci., 149, 105621, https://doi.org/10.1016/j.jaerosci.2020.105621, 2020.
EPA: Guidance on the Use of Models and Other Analyses for Demonstrating Attainment of Air Quality Goals for Ozone, PM2.5, and Regional Haze, Vol EPA-454/B-07e002, 2007.
FLEXPART Contributors: FLEXPART (FLEXible PARTicle dispersion model): The Lagrangian particle dispersion model, GitLab [code], https://gitlab.phaidra.org/flexpart/flexpart (last access: 27 January 2026), 2020.
Garmash, O., Rissanen, M. P., Pullinen, I., Schmitt, S., Kausiala, O., Tillmann, R., Zhao, D., Percival, C., Bannan, T. J., Priestley, M., Hallquist, Å. M., Kleist, E., Kiendler-Scharr, A., Hallquist, M., Berndt, T., McFiggans, G., Wildt, J., Mentel, T. F., and Ehn, M.: Multi-generation OH oxidation as a source for highly oxygenated organic molecules from aromatics, Atmos. Chem. Phys., 20, 515–537, https://doi.org/10.5194/acp-20-515-2020, 2020.
Gordon, H., Kirkby, J., Baltensperger, U., Bianchi, F., Breitenlechner, M., Curtius, J., Dias, A., Dommen, J., Donahue, N. M., Dunne, E. M., Duplissy, J., Ehrhart, S., Flagan, R. C., Frege, C., Fuchs, C., Hansel, A., Hoyle, C. R., Kulmala, M., Kürten, A., Lehtipalo, K., Makhmutov, V., Molteni, U., Rissanen, M. P., Stozkhov, Y., Tröstl, J., Tsagkogeorgas, G., Wagner, R., Williamson, C., Wimmer, D., Winkler, P. M., Yan, C., and Carslaw, K. S.: Causes and importance of new particle formation in the present-day and preindustrial atmospheres, J. Geophys. Res.-Atmos., 122, 8739–8760, https://doi.org/10.1002/2017jd026844, 2017.
Granier, C., Darras, S., Denier van der Gon, H., Doubalova, J., Elguindi, N., Galle, B., Gauss, M., Guevara, M., Jalkanen, J.-P., Kuenen, J., Liousse, C., Quack, B., Simpson, D., and Sindelarova, K.: The Copernicus Atmosphere Monitoring Service global and regional emissions (April 2019 version), https://doi.org/10.24380/d0bn-kx16, 2019.
Guenther, A. B., Jiang, X., Heald, C. L., Sakulyanontvittaya, T., Duhl, T., Emmons, L. K., and Wang, X.: The Model of Emissions of Gases and Aerosols from Nature version 2.1 (MEGAN2.1): an extended and updated framework for modeling biogenic emissions, Geosci. Model Dev., 5, 1471–1492, https://doi.org/10.5194/gmd-5-1471-2012, 2012.
Guevara, M., Jorba, O., Tena, C., Denier van der Gon, H., Kuenen, J., Elguindi, N., Darras, S., Granier, C., and Pérez García-Pando, C.: Copernicus Atmosphere Monitoring Service TEMPOral profiles (CAMS-TEMPO): global and European emission temporal profile maps for atmospheric chemistry modelling, Earth Syst. Sci. Data, 13, 367–404, https://doi.org/10.5194/essd-13-367-2021, 2021.
Haataja, J. and Vesala, T. (Eds.): Smear – II: station for measuring forest ecosystem – atmosphere relations, Helsingin yliopiston metsäekologian laitos, Helsinki, ISBN: 951-45-7911-9, 1997.
Hakala, S., Vakkari, V., Lihavainen, H., Hyvärinen, A.-P., Neitola, K., Kontkanen, J., Kerminen, V.-M., Kulmala, M., Petäjä, T., Hussein, T., Khoder, M. I., Alghamdi, M. A., and Paasonen, P.: Explaining apparent particle shrinkage related to new particle formation events in western Saudi Arabia does not require evaporation, Atmos. Chem. Phys., 23, 9287–9321, https://doi.org/10.5194/acp-23-9287-2023, 2023.
Hari, P. and Kulmala, M.: Station for Measuring Ecosystem-Atmosphere Relations (SMEAR II), Boreal Environ. Res., 10, 315–322, 2005.
Heikkinen, L., Äijälä, M., Riva, M., Luoma, K., Dällenbach, K., Aalto, J., Aalto, P., Aliaga, D., Aurela, M., Keskinen, H., Makkonen, U., Rantala, P., Kulmala, M., Petäjä, T., Worsnop, D., and Ehn, M.: Long-term sub-micrometer aerosol chemical composition in the boreal forest: inter- and intra-annual variability, Atmos. Chem. Phys., 20, 3151–3180, https://doi.org/10.5194/acp-20-3151-2020, 2020.
Heikkinen, L., Äijälä, M., Daellenbach, K. R., Chen, G., Garmash, O., Aliaga, D., Graeffe, F., Räty, M., Luoma, K., Aalto, P., Kulmala, M., Petäjä, T., Worsnop, D., and Ehn, M.: Eight years of sub-micrometre organic aerosol composition data from the boreal forest characterized using a machine-learning approach, Atmos. Chem. Phys., 21, 10081–10109, https://doi.org/10.5194/acp-21-10081-2021, 2021.
Hersbach, H., Bell, B., Berrisford, P., Hirahara, S., Horányi, A., Muñoz-Sabater, J., Nicolas, J., Peubey, C., Radu, R., Schepers, D., Simmons, A., Soci, C., Abdalla, S., Abellan, X., Balsamo, G., Bechtold, P., Biavati, G., Bidlot, J., Bonavita, M., De Chiara, G., Dahlgren, P., Dee, D., Diamantakis, M., Dragani, R., Flemming, J., Forbes, R., Fuentes, M., Geer, A., Haimberger, L., Healy, S., Hogan, R. J., Hólm, E., Janisková, M., Keeley, S., Laloyaux, P., Lopez, P., Lupu, C., Radnoti, G., de Rosnay, P., Rozum, I., Vamborg, F., Villaume, S., and Thépaut, J.: The ERA5 global reanalysis, Q. J. Roy. Meteor. Soc., 146, 1999–2049, https://doi.org/10.1002/qj.3803, 2020.
Hersbach, H., Bell, B., Berrisford, P., Biavati, G., Horányi, A., Muñoz Sabater, J., Nicolas, J., Peubey, C., Radu, R., Rozum, I., Schepers, D., Simmons, A., Soci, C., Dee, D., and Thépaut, J.-N.: ERA5 hourly data on single levels from 1940 to present, Copernicus Climate Change Service (C3S) Climate Data Store (CDS) [data set], https://doi.org/10.24381/cds.adbb2d47, 2023.
Hirsikko, A., Nieminen, T., Gagné, S., Lehtipalo, K., Manninen, H. E., Ehn, M., Hõrrak, U., Kerminen, V.-M., Laakso, L., McMurry, P. H., Mirme, A., Mirme, S., Petäjä, T., Tammet, H., Vakkari, V., Vana, M., and Kulmala, M.: Atmospheric ions and nucleation: a review of observations, Atmos. Chem. Phys., 11, 767–798, https://doi.org/10.5194/acp-11-767-2011, 2011.
Hoesly, R. M., Smith, S. J., Feng, L., Klimont, Z., Janssens-Maenhout, G., Pitkanen, T., Seibert, J. J., Vu, L., Andres, R. J., Bolt, R. M., Bond, T. C., Dawidowski, L., Kholod, N., Kurokawa, J.-I., Li, M., Liu, L., Lu, Z., Moura, M. C. P., O'Rourke, P. R., and Zhang, Q.: Historical (1750–2014) anthropogenic emissions of reactive gases and aerosols from the Community Emissions Data System (CEDS), Geosci. Model Dev., 11, 369–408, https://doi.org/10.5194/gmd-11-369-2018, 2018.
Huang, G., Brook, R., Crippa, M., Janssens-Maenhout, G., Schieberle, C., Dore, C., Guizzardi, D., Muntean, M., Schaaf, E., and Friedrich, R.: Speciation of anthropogenic emissions of non-methane volatile organic compounds: a global gridded data set for 1970–2012, Atmos. Chem. Phys., 17, 7683–7701, https://doi.org/10.5194/acp-17-7683-2017, 2017.
Ilvesniemi, H., Levula, J., Ojansuu, R., Kolari, P., Kulmala, L., Pumpanen, J., Launiainen, S., Vesala, T., and Nikinmaa, E.: Long-term measurements of the carbon balance of a boreal Scots pine dominated forest ecosystem, Boreal Environ. Res., 14, 731–753, 2009.
Jacobson, M. Z.: Development and application of a new air pollution modeling system – II. Aerosol module structure and design, Atmos. Environ., 31, 131–144, https://doi.org/10.1016/1352-2310(96)00202-6, 1997.
Jacobson, M. Z.: Analysis of aerosol interactions with numerical techniques for solving coagulation, nucleation, condensation, dissolution, and reversible chemistry among multiple size distributions, J. Geophys. Res., 107, AAC 2-1–AAC 2-23, https://doi.org/10.1029/2001jd002044, 2002.
Jenkin, M. E., Saunders, S. M., and Pilling, M. J.: The tropospheric degradation of volatile organic compounds: a protocol for mechanism development, Atmos. Environ., 31, 81–104, https://doi.org/10.1016/s1352-2310(96)00105-7, 1997.
Jenkin, M. E., Young, J. C., and Rickard, A. R.: The MCM v3.3.1 degradation scheme for isoprene, Atmos. Chem. Phys., 15, 11433–11459, https://doi.org/10.5194/acp-15-11433-2015, 2015.
Jeričević, A., Kraljević, L., Grisogono, B., Fagerli, H., and Večenaj, Ž.: Parameterization of vertical diffusion and the atmospheric boundary layer height determination in the EMEP model, Atmos. Chem. Phys., 10, 341–364, https://doi.org/10.5194/acp-10-341-2010, 2010.
Junninen, H., Lauri, A., Keronen, P., Aalto, P., Hiltunen, V., Hari, P., and Kulmala, M.: Smart-SMEAR: on-line data exploration and visualization tool for SMEAR stations, Boreal Environ. Res., 14, 447–457, 2009.
Kerminen, V.-M., Paramonov, M., Anttila, T., Riipinen, I., Fountoukis, C., Korhonen, H., Asmi, E., Laakso, L., Lihavainen, H., Swietlicki, E., Svenningsson, B., Asmi, A., Pandis, S. N., Kulmala, M., and Petäjä, T.: Cloud condensation nuclei production associated with atmospheric nucleation: a synthesis based on existing literature and new results, Atmos. Chem. Phys., 12, 12037–12059, https://doi.org/10.5194/acp-12-12037-2012, 2012.
Keronen, P.: Flux and concentration measurements of carbon dioxide and ozone in a forested environment, doctor dissertation, University of Helsinki, Finland, ISSN: 0784-3496, 2017
Kirkby, J., Curtius, J., Almeida, J., Dunne, E., Duplissy, J., Ehrhart, S., Franchin, A., Gagné, S., Ickes, L., Kürten, A., Kupc, A., Metzger, A., Riccobono, F., Rondo, L., Schobesberger, S., Tsagkogeorgas, G., Wimmer, D., Amorim, A., Bianchi, F., Breitenlechner, M., David, A., Dommen, J., Downard, A., Ehn, M., Flagan, R. C., Haider, S., Hansel, A., Hauser, D., Jud, W., Junninen, H., Kreissl, F., Kvashin, A., Laaksonen, A., Lehtipalo, K., Lima, J., Lovejoy, E. R., Makhmutov, V., Mathot, S., Mikkilä, J., Minginette, P., Mogo, S., Nieminen, T., Onnela, A., Pereira, P., Petäjä, T., Schnitzhofer, R., Seinfeld, J. H., Sipilä, M., Stozhkov, Y., Stratmann, F., Tomé, A., Vanhanen, J., Viisanen, Y., Vrtala, A., Wagner, P. E., Walther, H., Weingartner, E., Wex, H., Winkler, P. M., Carslaw, K. S., Worsnop, D. R., Baltensperger, U., and Kulmala, M.: Role of sulphuric acid, ammonia and galactic cosmic rays in atmospheric aerosol nucleation, Nature, 476, 429–433, https://doi.org/10.1038/nature10343, 2011.
Klimont, Z., Kupiainen, K., Heyes, C., Purohit, P., Cofala, J., Rafaj, P., Borken-Kleefeld, J., and Schöpp, W.: Global anthropogenic emissions of particulate matter including black carbon, Atmos. Chem. Phys., 17, 8681–8723, https://doi.org/10.5194/acp-17-8681-2017, 2017.
Kolari, P., Aalto, J., Levula, J., Kulmala, L., Ilvesniemi, H., and Pumpanen, J.: Hyytiälä SMEAR II site characteristics, Version v1, Zenodo [data set], https://doi.org/10.5281/zenodo.5909681, 2022.
Kontkanen, J., Deng, C., Fu, Y., Dada, L., Zhou, Y., Cai, J., Daellenbach, K. R., Hakala, S., Kokkonen, T. V., Lin, Z., Liu, Y., Wang, Y., Yan, C., Petäjä, T., Jiang, J., Kulmala, M., and Paasonen, P.: Size-resolved particle number emissions in Beijing determined from measured particle size distributions, Atmos. Chem. Phys., 20, 11329–11348, https://doi.org/10.5194/acp-20-11329-2020, 2020.
Kulmala, M., Rannik, U., Pirjola, L., Dal Maso, M., Karimäki, J., Asmi, A., Jäppinen, A., Karhu, V., Korhonen, H., Malvikko, S.-P., Raittila, J., Suni, T., Yli-Koivisto, S., and Vesala, T.: Characterization of atmospheric trace gas and aerosol concentrations at forest sites in southern and northern Finland using back trajectories, Boreal Environ. Res., 5, 315–336, 2000.
Kulmala, M., Asmi, A., Lappalainen, H. K., Carslaw, K. S., Pöschl, U., Baltensperger, U., Hov, Ø., Brenquier, J.-L., Pandis, S. N., Facchini, M. C., Hansson, H.-C., Wiedensohler, A., and O'Dowd, C. D.: Introduction: European Integrated Project on Aerosol Cloud Climate and Air Quality interactions (EUCAARI) – integrating aerosol research from nano to global scales, Atmos. Chem. Phys., 9, 2825–2841, https://doi.org/10.5194/acp-9-2825-2009, 2009.
Kulmala, M., Asmi, A., Lappalainen, H. K., Baltensperger, U., Brenguier, J.-L., Facchini, M. C., Hansson, H.-C., Hov, Ø., O'Dowd, C. D., Pöschl, U., Wiedensohler, A., Boers, R., Boucher, O., de Leeuw, G., Denier van der Gon, H. A. C., Feichter, J., Krejci, R., Laj, P., Lihavainen, H., Lohmann, U., McFiggans, G., Mentel, T., Pilinis, C., Riipinen, I., Schulz, M., Stohl, A., Swietlicki, E., Vignati, E., Alves, C., Amann, M., Ammann, M., Arabas, S., Artaxo, P., Baars, H., Beddows, D. C. S., Bergström, R., Beukes, J. P., Bilde, M., Burkhart, J. F., Canonaco, F., Clegg, S. L., Coe, H., Crumeyrolle, S., D'Anna, B., Decesari, S., Gilardoni, S., Fischer, M., Fjaeraa, A. M., Fountoukis, C., George, C., Gomes, L., Halloran, P., Hamburger, T., Harrison, R. M., Herrmann, H., Hoffmann, T., Hoose, C., Hu, M., Hyvärinen, A., Hõrrak, U., Iinuma, Y., Iversen, T., Josipovic, M., Kanakidou, M., Kiendler-Scharr, A., Kirkevåg, A., Kiss, G., Klimont, Z., Kolmonen, P., Komppula, M., Kristjánsson, J.-E., Laakso, L., Laaksonen, A., Labonnote, L., Lanz, V. A., Lehtinen, K. E. J., Rizzo, L. V., Makkonen, R., Manninen, H. E., McMeeking, G., Merikanto, J., Minikin, A., Mirme, S., Morgan, W. T., Nemitz, E., O'Donnell, D., Panwar, T. S., Pawlowska, H., Petzold, A., Pienaar, J. J., Pio, C., Plass-Duelmer, C., Prévôt, A. S. H., Pryor, S., Reddington, C. L., Roberts, G., Rosenfeld, D., Schwarz, J., Seland, Ø., Sellegri, K., Shen, X. J., Shiraiwa, M., Siebert, H., Sierau, B., Simpson, D., Sun, J. Y., Topping, D., Tunved, P., Vaattovaara, P., Vakkari, V., Veefkind, J. P., Visschedijk, A., Vuollekoski, H., Vuolo, R., Wehner, B., Wildt, J., Woodward, S., Worsnop, D. R., van Zadelhoff, G.-J., Zardini, A. A., Zhang, K., van Zyl, P. G., Kerminen, V.-M., S Carslaw, K., and Pandis, S. N.: General overview: European Integrated project on Aerosol Cloud Climate and Air Quality interactions (EUCAARI) – integrating aerosol research from nano to global scales, Atmos. Chem. Phys., 11, 13061–13143, https://doi.org/10.5194/acp-11-13061-2011, 2011.
Kürten, A., Bianchi, F., Almeida, J., Kupiainen-Määttä, O., Dunne, E. M., Duplissy, J., Williamson, C., Barmet, P., Breitenlechner, M., Dommen, J., Donahue, N. M., Flagan, R. C., Franchin, A., Gordon, H., Hakala, J., Hansel, A., Heinritzi, M., Ickes, L., Jokinen, T., Kangasluoma, J., Kim, J., Kirkby, J., Kupc, A., Lehtipalo, K., Leiminger, M., Makhmutov, V., Onnela, A., Ortega, I. K., Petäjä, T., Praplan, A. P., Riccobono, F., Rissanen, M. P., Rondo, L., Schnitzhofer, R., Schobesberger, S., Smith, J. N., Steiner, G., Stozhkov, Y., Tomé, A., Tröstl, J., Tsagkogeorgas, G., Wagner, P. E., Wimmer, D., Ye, P., Baltensperger, U., Carslaw, K., Kulmala, M., and Curtius, J.: Experimental particle formation rates spanning tropospheric sulfuric acid and ammonia abundances, ion production rates, and temperatures, J. Geophys. Res.-Atmos., 121, https://doi.org/10.1002/2015jd023908, 2016.
Li, H., Canagaratna, M. R., Riva, M., Rantala, P., Zhang, Y., Thomas, S., Heikkinen, L., Flaud, P.-M., Villenave, E., Perraudin, E., Worsnop, D., Kulmala, M., Ehn, M., and Bianchi, F.: Atmospheric organic vapors in two European pine forests measured by a Vocus PTR-TOF: insights into monoterpene and sesquiterpene oxidation processes, Atmos. Chem. Phys., 21, 4123–4147, https://doi.org/10.5194/acp-21-4123-2021, 2021.
Liggio, J., Makar, P., Li, S.-M., Hayden, K., Darlington, A., Moussa, S., Wren, S., Staebler, R., Wentzell, J., Wheeler, M., Leithead, A., Mittermeier, R., Narayan, J., Wolde, M., Blanchard, D., Aherne, J., Kirk, J., Lee, C., Stroud, C., Zhang, J., Akingunola, A., Katal, A., Cheung, P., Ghahreman, R., Majdzadeh, M., He, M., Ditto, J., and Gentner, D. R.: Organic carbon dry deposition outpaces atmospheric processing with unaccounted implications for air quality and freshwater ecosystems, Sci. Adv., 11, https://doi.org/10.1126/sciadv.adr0259, 2025.
Lin, H., Long, M. S., Sander, R., Sandu, A., Yantosca, R. M., Estrada, L. A., Shen, L., and Jacob, D. J.: An Adaptive Auto-Reduction Solver for Speeding Up Integration of Chemical Kinetics in Atmospheric Chemistry Models: Implementation and Evaluation in the Kinetic Pre-Processor (KPP) Version 3.0.0, J. Adv. Model. Earth Sy., 15, https://doi.org/10.1029/2022ms003293, 2023.
Lindinger, W. and Jordan, A.: Proton-transfer-reaction mass spectrometry (PTR-MS): on-line monitoring of volatile organic compounds at pptv levels, Chem. Soc. Rev., 27, 347, https://doi.org/10.1039/a827347z, 1998.
Merikanto, J., Spracklen, D. V., Mann, G. W., Pickering, S. J., and Carslaw, K. S.: Impact of nucleation on global CCN, Atmos. Chem. Phys., 9, 8601–8616, https://doi.org/10.5194/acp-9-8601-2009, 2009.
Ng, N. L., Herndon, S. C., Trimborn, A., Canagaratna, M. R., Croteau, P. L., Onasch, T. B., Sueper, D., Worsnop, D. R., Zhang, Q., Sun, Y. L., and Jayne, J. T.: An Aerosol Chemical Speciation Monitor (ACSM) for Routine Monitoring of the Composition and Mass Concentrations of Ambient Aerosol, Aerosol Sci. Technol., 45, 780–794, https://doi.org/10.1080/02786826.2011.560211, 2011.
Olenius, T., Kupiainen-Määttä, O., Ortega, I. K., Kurtén, T., and Vehkamäki, H.: Free energy barrier in the growth of sulfuric acid-ammonia and sulfuric acid-dimethylamine clusters, J. Chem. Phys., 139, 084312, https://doi.org/10.1063/1.4819024, 2013.
Olenius, T., Pichelstorfer, L., Stolzenburg, D., Winkler, P. M., Lehtinen, K. E. J., and Riipinen, I.: Robust metric for quantifying the importance of stochastic effects on nanoparticle growth, Sci. Rep., 8, https://doi.org/10.1038/s41598-018-32610-z, 2018.
Ovadnevaite, J., Manders, A., de Leeuw, G., Ceburnis, D., Monahan, C., Partanen, A.-I., Korhonen, H., and O'Dowd, C. D.: A sea spray aerosol flux parameterization encapsulating wave state, Atmos. Chem. Phys., 14, 1837–1852, https://doi.org/10.5194/acp-14-1837-2014, 2014.
Paasonen, P., Asmi, A., Petäjä, T., Kajos, M. K., Äijälä, M., Junninen, H., Holst, T., Abbatt, J. P. D., Arneth, A., Birmili, W., van der Gon, H. D., Hamed, A., Hoffer, A., Laakso, L., Laaksonen, A., Richard Leaitch, W., Plass-Dülmer, C., Pryor, S. C., Räisänen, P., Swietlicki, E., Wiedensohler, A., Worsnop, D. R., Kerminen, V.-M., and Kulmala, M.: Warming-induced increase in aerosol number concentration likely to moderate climate change, Nat. Geosci., 6, 438–442, https://doi.org/10.1038/ngeo1800, 2013.
Paasonen, P., Kupiainen, K., Klimont, Z., Visschedijk, A., Denier van der Gon, H. A. C., and Amann, M.: Continental anthropogenic primary particle number emissions, Atmos. Chem. Phys., 16, 6823–6840, https://doi.org/10.5194/acp-16-6823-2016, 2016.
Paramonov, M., Kerminen, V.-M., Gysel, M., Aalto, P. P., Andreae, M. O., Asmi, E., Baltensperger, U., Bougiatioti, A., Brus, D., Frank, G. P., Good, N., Gunthe, S. S., Hao, L., Irwin, M., Jaatinen, A., Jurányi, Z., King, S. M., Kortelainen, A., Kristensson, A., Lihavainen, H., Kulmala, M., Lohmann, U., Martin, S. T., McFiggans, G., Mihalopoulos, N., Nenes, A., O'Dowd, C. D., Ovadnevaite, J., Petäjä, T., Pöschl, U., Roberts, G. C., Rose, D., Svenningsson, B., Swietlicki, E., Weingartner, E., Whitehead, J., Wiedensohler, A., Wittbom, C., and Sierau, B.: A synthesis of cloud condensation nuclei counter (CCNC) measurements within the EUCAARI network, Atmos. Chem. Phys., 15, 12211–12229, https://doi.org/10.5194/acp-15-12211-2015, 2015.
Patokoski, J., Ruuskanen, T. M., Kajos, M. K., Taipale, R., Rantala, P., Aalto, J., Ryyppö, T., Nieminen, T., Hakola, H., and Rinne, J.: Sources of long-lived atmospheric VOCs at the rural boreal forest site, SMEAR II, Atmos. Chem. Phys., 15, 13413–13432, https://doi.org/10.5194/acp-15-13413-2015, 2015.
Patoulias, D., Florou, K., Pandis, S. N., and Nenes, A.: New Particle Formation Events Can Reduce Cloud Droplets in Boundary Layer Clouds at the Continental Scale, Geophys. Res. Lett., 51, https://doi.org/10.1029/2023gl106182, 2024.
Pennington, M. R., Bzdek, B. R., DePalma, J. W., Smith, J. N., Kortelainen, A.-M., Hildebrandt Ruiz, L., Petäjä, T., Kulmala, M., Worsnop, D. R., and Johnston, M. V.: Identification and quantification of particle growth channels during new particle formation, Atmos. Chem. Phys., 13, 10215–10225, https://doi.org/10.5194/acp-13-10215-2013, 2013.
Petäjä, T., O'Connor, E. J., Moisseev, D., Sinclair, V. A., Manninen, A. J., Väänänen, R., von Lerber, A., Thornton, J. A., Nicoll, K., Petersen, W., Chandrasekar, V., Smith, J. N., Winkler, P. M., Krüger, O., Hakola, H., Timonen, H., Brus, D., Laurila, T., Asmi, E., Riekkola, M.-L., Mona, L., Massoli, P., Engelmann, R., Komppula, M., Wang, J., Kuang, C., Bäck, J., Virtanen, A., Levula, J., Ritsche, M., and Hickmon, N.: BAECC: A Field Campaign to Elucidate the Impact of Biogenic Aerosols on Clouds and Climate, B. Am. Meteorol. Soc., 97, 1909–1928, https://doi.org/10.1175/bams-d-14-00199.1, 2016.
Petäjä, T., Tabakova, K., Manninen, A., Ezhova, E., O'Connor, E., Moisseev, D., Sinclair, V. A., Backman, J., Levula, J., Luoma, K., Virkkula, A., Paramonov, M., Räty, M., Äijälä, M., Heikkinen, L., Ehn, M., Sipilä, M., Yli-Juuti, T., Virtanen, A., Ritsche, M., Hickmon, N., Pulik, G., Rosenfeld, D., Worsnop, D. R., Bäck, J., Kulmala, M., and Kerminen, V.-M.: Influence of biogenic emissions from boreal forests on aerosol-cloud interactions, Nat. Geosci., 15, 42–47, https://doi.org/10.1038/s41561-021-00876-0, 2021.
Petters, M. D. and Kreidenweis, S. M.: A single parameter representation of hygroscopic growth and cloud condensation nucleus activity, Atmos. Chem. Phys., 7, 1961–1971, https://doi.org/10.5194/acp-7-1961-2007, 2007.
Pichelstorfer, L., Roldin, P., Rissanen, M., Hyttinen, N., Garmash, O., Xavier, C., Zhou, P., Clusius, P., Foreback, B., Golin Almeida, T., Deng, C., Baykara, M., Kurten, T., and Boy, M.: Towards automated inclusion of autoxidation chemistry in models: from precursors to atmospheric implications, Environ. Sci. Atmos., 4, 879–896, https://doi.org/10.1039/d4ea00054d, 2024.
Pierce, J. R. and Adams, P. J.: Uncertainty in global CCN concentrations from uncertain aerosol nucleation and primary emission rates, Atmos. Chem. Phys., 9, 1339–1356, https://doi.org/10.5194/acp-9-1339-2009, 2009.
Pierce, J. R., Westervelt, D. M., Atwood, S. A., Barnes, E. A., and Leaitch, W. R.: New-particle formation, growth and climate-relevant particle production in Egbert, Canada: analysis from 1 year of size-distribution observations, Atmos. Chem. Phys., 14, 8647–8663, https://doi.org/10.5194/acp-14-8647-2014, 2014.
Pierce, J. R., Croft, B., Kodros, J. K., D'Andrea, S. D., and Martin, R. V.: The importance of interstitial particle scavenging by cloud droplets in shaping the remote aerosol size distribution and global aerosol-climate effects, Atmos. Chem. Phys., 15, 6147–6158, https://doi.org/10.5194/acp-15-6147-2015, 2015.
Pisso, I., Sollum, E., Grythe, H., Kristiansen, N. I., Cassiani, M., Eckhardt, S., Arnold, D., Morton, D., Thompson, R. L., Groot Zwaaftink, C. D., Evangeliou, N., Sodemann, H., Haimberger, L., Henne, S., Brunner, D., Burkhart, J. F., Fouilloux, A., Brioude, J., Philipp, A., Seibert, P., and Stohl, A.: The Lagrangian particle dispersion model FLEXPART version 10.4, Geosci. Model Dev., 12, 4955–4997, https://doi.org/10.5194/gmd-12-4955-2019, 2019.
Rasool, Q. Z., Shrivastava, M., Octaviani, M., Zhao, B., Gaudet, B., and Liu, Y.: Modeling Volatility-Based Aerosol Phase State Predictions in the Amazon Rainforest, ACS Earth and Space Chemistry, 5, 2910–2924, https://doi.org/10.1021/acsearthspacechem.1c00255, 2021.
Reddington, C. L., Carslaw, K. S., Spracklen, D. V., Frontoso, M. G., Collins, L., Merikanto, J., Minikin, A., Hamburger, T., Coe, H., Kulmala, M., Aalto, P., Flentje, H., Plass-Dülmer, C., Birmili, W., Wiedensohler, A., Wehner, B., Tuch, T., Sonntag, A., O'Dowd, C. D., Jennings, S. G., Dupuy, R., Baltensperger, U., Weingartner, E., Hansson, H.-C., Tunved, P., Laj, P., Sellegri, K., Boulon, J., Putaud, J.-P., Gruening, C., Swietlicki, E., Roldin, P., Henzing, J. S., Moerman, M., Mihalopoulos, N., Kouvarakis, G., Ždímal, V., Zíková, N., Marinoni, A., Bonasoni, P., and Duchi, R.: Primary versus secondary contributions to particle number concentrations in the European boundary layer, Atmos. Chem. Phys., 11, 12007–12036, https://doi.org/10.5194/acp-11-12007-2011, 2011.
Ren, J., Chen, L., Fan, T., Liu, J., Jiang, S., and Zhang, F.: The NPF Effect on CCN Number Concentrations: A Review and Re-Evaluation of Observations From 35 Sites Worldwide, Geophys. Res. Lett., 48, https://doi.org/10.1029/2021gl095190, 2021.
Renard, J. J., Calidonna, S. E., and Henley, M. V.: Fate of ammonia in the atmosphere – a review for applicability to hazardous releases, J. Hazard. Mater., 108, 29–60, https://doi.org/10.1016/j.jhazmat.2004.01.015, 2004.
Riccobono, F., Schobesberger, S., Scott, C. E., Dommen, J., Ortega, I. K., Rondo, L., Almeida, J., Amorim, A., Bianchi, F., Breitenlechner, M., David, A., Downard, A., Dunne, E. M., Duplissy, J., Ehrhart, S., Flagan, R. C., Franchin, A., Hansel, A., Junninen, H., Kajos, M., Keskinen, H., Kupc, A., Kürten, A., Kvashin, A. N., Laaksonen, A., Lehtipalo, K., Makhmutov, V., Mathot, S., Nieminen, T., Onnela, A., Petäjä, T., Praplan, A. P., Santos, F. D., Schallhart, S., Seinfeld, J. H., Sipilä, M., Spracklen, D. V., Stozhkov, Y., Stratmann, F., Tomé, A., Tsagkogeorgas, G., Vaattovaara, P., Viisanen, Y., Vrtala, A., Wagner, P. E., Weingartner, E., Wex, H., Wimmer, D., Carslaw, K. S., Curtius, J., Donahue, N. M., Kirkby, J., Kulmala, M., Worsnop, D. R., and Baltensperger, U.: Oxidation Products of Biogenic Emissions Contribute to Nucleation of Atmospheric Particles, Science, 344, 717–721, https://doi.org/10.1126/science.1243527, 2014.
Riipinen, I., Pierce, J. R., Yli-Juuti, T., Nieminen, T., Häkkinen, S., Ehn, M., Junninen, H., Lehtipalo, K., Petäjä, T., Slowik, J., Chang, R., Shantz, N. C., Abbatt, J., Leaitch, W. R., Kerminen, V.-M., Worsnop, D. R., Pandis, S. N., Donahue, N. M., and Kulmala, M.: Organic condensation: a vital link connecting aerosol formation to cloud condensation nuclei (CCN) concentrations, Atmos. Chem. Phys., 11, 3865–3878, https://doi.org/10.5194/acp-11-3865-2011, 2011.
Rissanen, M.: Anthropogenic Volatile Organic Compound (AVOC) Autoxidation as a Source of Highly Oxygenated Organic Molecules (HOM), J. Phys. Chem. A, 125, 9027–9039, https://doi.org/10.1021/acs.jpca.1c06465, 2021.
Riuttanen, L., Hulkkonen, M., Dal Maso, M., Junninen, H., and Kulmala, M.: Trajectory analysis of atmospheric transport of fine particles, SO2, NOx and O3 to the SMEAR II station in Finland in 1996–2008, Atmos. Chem. Phys., 13, 2153–2164, https://doi.org/10.5194/acp-13-2153-2013, 2013.
Riva, M., Heikkinen, L., Bell, D. M., Peräkylä, O., Zha, Q., Schallhart, S., Rissanen, M. P., Imre, D., Petäjä, T., Thornton, J. A., Zelenyuk, A., and Ehn, M.: Chemical transformations in monoterpene-derived organic aerosol enhanced by inorganic composition, npj Clim. Atmos. Sci., 2, https://doi.org/10.1038/s41612-018-0058-0, 2019.
Roberts, G. C. and Nenes, A.: A Continuous-Flow Streamwise Thermal-Gradient CCN Chamber for Atmospheric Measurements, Aerosol Sci. Technol., 39, 206–221, https://doi.org/10.1080/027868290913988, 2005.
Roldin, P., Ehn, M., Kurtén, T., Olenius, T., Rissanen, M. P., Sarnela, N., Elm, J., Rantala, P., Hao, L., Hyttinen, N., Heikkinen, L., Worsnop, D. R., Pichelstorfer, L., Xavier, C., Clusius, P., Öström, E., Petäjä, T., Kulmala, M., Vehkamäki, H., Virtanen, A., Riipinen, I., and Boy, M.: The role of highly oxygenated organic molecules in the Boreal aerosol-cloud-climate system, Nat. Commun., 10, https://doi.org/10.1038/s41467-019-12338-8, 2019.
Saunders, S. M., Jenkin, M. E., Derwent, R. G., and Pilling, M. J.: Protocol for the development of the Master Chemical Mechanism, MCM v3 (Part A): tropospheric degradation of non-aromatic volatile organic compounds, Atmos. Chem. Phys., 3, 161–180, https://doi.org/10.5194/acp-3-161-2003, 2003.
Seibert, P. and Frank, A.: Source-receptor matrix calculation with a Lagrangian particle dispersion model in backward mode, Atmos. Chem. Phys., 4, 51–63, https://doi.org/10.5194/acp-4-51-2004, 2004.
Sindelarova, K., Markova, J., Simpson, D., Huszar, P., Karlicky, J., Darras, S., and Granier, C.: High-resolution biogenic global emission inventory for the time period 2000–2019 for air quality modelling, Earth Syst. Sci. Data, 14, 251–270, https://doi.org/10.5194/essd-14-251-2022, 2022.
Sipilä, M., Berndt, T., Petäjä, T., Brus, D., Vanhanen, J., Stratmann, F., Patokoski, J., Mauldin, R. L., Hyvärinen, A.-P., Lihavainen, H., and Kulmala, M.: The Role of Sulfuric Acid in Atmospheric Nucleation, Science, 327, 1243–1246, https://doi.org/10.1126/science.1180315, 2010.
Soulie, A., Granier, C., Darras, S., Zilbermann, N., Doumbia, T., Guevara, M., Jalkanen, J.-P., Keita, S., Liousse, C., Crippa, M., Guizzardi, D., Hoesly, R., and Smith, S. J.: Global anthropogenic emissions (CAMS-GLOB-ANT) for the Copernicus Atmosphere Monitoring Service simulations of air quality forecasts and reanalyses, Earth Syst. Sci. Data, 16, 2261–2279, https://doi.org/10.5194/essd-16-2261-2024, 2024.
Stohl, A. and Thomson, D. J.: A density correction for Lagrangian particle dispersion models, Bound.-Lay. Meteorol., 90, 155–167, 1999.
Stohl, A., Hittenberger, M., and Wotawa, G.: Validation of the lagrangian particle dispersion model FLEXPART against large-scale tracer experiment data, Atmos. Environ., 32, 4245–4264, https://doi.org/10.1016/s1352-2310(98)00184-8, 1998.
Stohl, A., Forster, C., Frank, A., Seibert, P., and Wotawa, G.: Technical note: The Lagrangian particle dispersion model FLEXPART version 6.2, Atmos. Chem. Phys., 5, 2461–2474, https://doi.org/10.5194/acp-5-2461-2005, 2005.
Stolzenburg, D., Fischer, L., Vogel, A. L., Heinritzi, M., Schervish, M., Simon, M., Wagner, A. C., Dada, L., Ahonen, L. R., Amorim, A., Baccarini, A., Bauer, P. S., Baumgartner, B., Bergen, A., Bianchi, F., Breitenlechner, M., Brilke, S., Buenrostro Mazon, S., Chen, D., Dias, A., Draper, D. C., Duplissy, J., El Haddad, I., Finkenzeller, H., Frege, C., Fuchs, C., Garmash, O., Gordon, H., He, X., Helm, J., Hofbauer, V., Hoyle, C. R., Kim, C., Kirkby, J., Kontkanen, J., Kürten, A., Lampilahti, J., Lawler, M., Lehtipalo, K., Leiminger, M., Mai, H., Mathot, S., Mentler, B., Molteni, U., Nie, W., Nieminen, T., Nowak, J. B., Ojdanic, A., Onnela, A., Passananti, M., Petäjä, T., Quéléver, L. L. J., Rissanen, M. P., Sarnela, N., Schallhart, S., Tauber, C., Tomé, A., Wagner, R., Wang, M., Weitz, L., Wimmer, D., Xiao, M., Yan, C., Ye, P., Zha, Q., Baltensperger, U., Curtius, J., Dommen, J., Flagan, R. C., Kulmala, M., Smith, J. N., Worsnop, D. R., Hansel, A., Donahue, N. M., and Winkler, P. M.: Rapid growth of organic aerosol nanoparticles over a wide tropospheric temperature range, P. Natl. Acad. Sci. USA, 115, 9122–9127, https://doi.org/10.1073/pnas.1807604115, 2018.
Stolzenburg, D., Wang, M., Schervish, M., and Donahue, N. M.: Tutorial: Dynamic organic growth modeling with a volatility basis set, J. Aerosol Sci., 166, 106063, https://doi.org/10.1016/j.jaerosci.2022.106063, 2022.
Svensmark, H., Enghoff, M. B., Svensmark, J., Thaler, I., and Shaviv, N. J.: Supersaturation and Critical Size of Cloud Condensation Nuclei in Marine Stratus Clouds, Geophys. Res. Lett., 51, https://doi.org/10.1029/2024gl108140, 2024.
Taipale, R., Ruuskanen, T. M., Rinne, J., Kajos, M. K., Hakola, H., Pohja, T., and Kulmala, M.: Technical Note: Quantitative long-term measurements of VOC concentrations by PTR-MS – measurement, calibration, and volume mixing ratio calculation methods, Atmos. Chem. Phys., 8, 6681–6698, https://doi.org/10.5194/acp-8-6681-2008, 2008.
Tørseth, K., Aas, W., Breivik, K., Fjæraa, A. M., Fiebig, M., Hjellbrekke, A. G., Lund Myhre, C., Solberg, S., and Yttri, K. E.: Introduction to the European Monitoring and Evaluation Programme (EMEP) and observed atmospheric composition change during 1972–2009, Atmos. Chem. Phys., 12, 5447–5481, https://doi.org/10.5194/acp-12-5447-2012, 2012.
Vana, M., Komsaare, K., Hõrrak, U., Mirme, S., Nieminen, T., Kontkanen, J., Manninen, H., Petäjä, T., Noe, S., and Kulmala, M.: Characteristics of new-particle formation at three SMEAR stations, Boreal Environ. Res., 21, 345–362, 2016.
Vouitsis, I., Ntziachristos, L., and Han, Z.: Methodology for the quantification of road transport PM emissions, using emission factors or profiles, TRANSPHORM Deliverable D, 1, 1–2, 2013.
Wang, Z., Ehn, M., Rissanen, M. P., Garmash, O., Quéléver, L., Xing, L., Monge-Palacios, M., Rantala, P., Donahue, N. M., Berndt, T., and Sarathy, S. M.: Efficient alkane oxidation under combustion engine and atmospheric conditions, Commun. Chem., 4, https://doi.org/10.1038/s42004-020-00445-3, 2021.
Williams, J., Crowley, J., Fischer, H., Harder, H., Martinez, M., Petäjä, T., Rinne, J., Bäck, J., Boy, M., Dal Maso, M., Hakala, J., Kajos, M., Keronen, P., Rantala, P., Aalto, J., Aaltonen, H., Paatero, J., Vesala, T., Hakola, H., Levula, J., Pohja, T., Herrmann, F., Auld, J., Mesarchaki, E., Song, W., Yassaa, N., Nölscher, A., Johnson, A. M., Custer, T., Sinha, V., Thieser, J., Pouvesle, N., Taraborrelli, D., Tang, M. J., Bozem, H., Hosaynali-Beygi, Z., Axinte, R., Oswald, R., Novelli, A., Kubistin, D., Hens, K., Javed, U., Trawny, K., Breitenberger, C., Hidalgo, P. J., Ebben, C. J., Geiger, F. M., Corrigan, A. L., Russell, L. M., Ouwersloot, H. G., Vilà-Guerau de Arellano, J., Ganzeveld, L., Vogel, A., Beck, M., Bayerle, A., Kampf, C. J., Bertelmann, M., Köllner, F., Hoffmann, T., Valverde, J., González, D., Riekkola, M.-L., Kulmala, M., and Lelieveld, J.: The summertime Boreal forest field measurement intensive (HUMPPA-COPEC-2010): an overview of meteorological and chemical influences, Atmos. Chem. Phys., 11, 10599–10618, https://doi.org/10.5194/acp-11-10599-2011, 2011.
Xavier, C., Baykara, M., Wollesen de Jonge, R., Altstädter, B., Clusius, P., Vakkari, V., Thakur, R., Beck, L., Becagli, S., Severi, M., Traversi, R., Krejci, R., Tunved, P., Mazzola, M., Wehner, B., Sipilä, M., Kulmala, M., Boy, M., and Roldin, P.: Secondary aerosol formation in marine Arctic environments: a model measurement comparison at Ny-Ålesund, Atmos. Chem. Phys., 22, 10023–10043, https://doi.org/10.5194/acp-22-10023-2022, 2022.
Yazdani, A., Takahama, S., Kodros, J. K., Paglione, M., Masiol, M., Squizzato, S., Florou, K., Kaltsonoudis, C., Jorga, S. D., Pandis, S. N., and Nenes, A.: Chemical evolution of primary and secondary biomass burning aerosols during daytime and nighttime, Atmos. Chem. Phys., 23, 7461–7477, https://doi.org/10.5194/acp-23-7461-2023, 2023.
Yli-Juuti, T., Mielonen, T., Heikkinen, L., Arola, A., Ehn, M., Isokääntä, S., Keskinen, H.-M., Kulmala, M., Laakso, A., Lipponen, A., Luoma, K., Mikkonen, S., Nieminen, T., Paasonen, P., Petäjä, T., Romakkaniemi, S., Tonttila, J., Kokkola, H., and Virtanen, A.: Significance of the organic aerosol driven climate feedback in the boreal area, Nat. Commun., 12, https://doi.org/10.1038/s41467-021-25850-7, 2021.
Yu, F. and Luo, G.: Simulation of particle size distribution with a global aerosol model: contribution of nucleation to aerosol and CCN number concentrations, Atmos. Chem. Phys., 9, 7691–7710, https://doi.org/10.5194/acp-9-7691-2009, 2009.
Yu, S., Eder, B., Dennis, R., Chu, S., and Schwartz, S. E.: New unbiased symmetric metrics for evaluation of air quality models, Atmos. Sci. Lett., 7, 26–34, https://doi.org/10.1002/asl.125, 2006.
Zhang, Y., Sheesley, R. J., Schauer, J. J., Lewandowski, M., Jaoui, M., Offenberg, J. H., Kleindienst, T. E., and Edney, E. O.: Source apportionment of primary and secondary organic aerosols using positive matrix factorization (PMF) of molecular markers, Atmos. Environ., 43, 5567–5574, https://doi.org/10.1016/j.atmosenv.2009.02.047, 2009.
Zhang, Z., Li, Y., Ran, H., An, J., Qu, Y., Zhou, W., Xu, W., Hu, W., Xie, H., Wang, Z., Sun, Y., and Shiraiwa, M.: Simulated phase state and viscosity of secondary organic aerosols over China, Atmos. Chem. Phys., 24, 4809–4826, https://doi.org/10.5194/acp-24-4809-2024, 2024.
Zhao, B., Donahue, N. M., Zhang, K., Mao, L., Shrivastava, M., Ma, P.-L., Shen, J., Wang, S., Sun, J., Gordon, H., Tang, S., Fast, J., Wang, M., Gao, Y., Yan, C., Singh, B., Li, Z., Huang, L., Lou, S., Lin, G., Wang, H., Jiang, J., Ding, A., Nie, W., Qi, X., Chi, X., and Wang, L.: Global variability in atmospheric new particle formation mechanisms, Nature, 631, 98–105, https://doi.org/10.1038/s41586-024-07547-1, 2024.
Zhou, P., Ganzeveld, L., Rannik, Ü., Zhou, L., Gierens, R., Taipale, D., Mammarella, I., and Boy, M.: Simulating ozone dry deposition at a boreal forest with a multi-layer canopy deposition model, Atmos. Chem. Phys., 17, 1361–1379, https://doi.org/10.5194/acp-17-1361-2017, 2017.