
the Creative Commons Attribution 4.0 License.
the Creative Commons Attribution 4.0 License.
 | 20 Nov 2026
Sea salt aerosols from blowing snow: contributions to radiative forcing

Joonas Merikanto
Petri Räisänen
Arundathi Chandrasekharan
Risto Makkonen
The Arctic and Antarctic regions experience significant climate impacts from aerosol–cloud–radiation interactions, yet the role of sea salt aerosols (SSA) emitted through blowing snow remains poorly quantified. We implement a parameterization of blowing-snow SSA production in the TM5 global chemical transport model and the EC-Earth3 global climate model, using atmosphere-only and fully coupled transient (SSP3-7.0, 2015–2051) experiments to assess the contribution of blowing snow to aerosol mass, number, cloud condensation nuclei (CCN), and radiative fluxes in both polar regions. TM5 results are evaluated against MOSAiC campaign data and observations from the coastal stations Villum, Zeppelin, and Alert. Blowing snow substantially increases SSA mass, particle number, and CCN during polar winter and spring, with the largest enhancements over Antarctic sea ice. Including blowing snow allows TM5 to capture more of the observed SSA and CCN peaks during the blowing-snow season, although the overall correlation with MOSAiC observations improves only modestly and the full-year change is not statistically significant. The associated surface radiative response is small and differs between hemispheres. Over the Arctic, blowing-snow SSA enhances the wintertime longwave cloud radiative effect (+0.45 W m−2), partially offsetting a negative clear-sky radiative response, while the area-weighted annual-mean all-sky net surface radiative flux response remains slightly negative (−0.06 W m−2 poleward of 60° N). Over the Antarctic, the positive longwave cloud radiative effect is outweighed by a stronger negative shortwave cloud radiative effect, resulting in an area-weighted annual-mean all-sky net surface radiative flux response of −0.25 W m−2 poleward of 60° S. Overall, our results indicate that blowing-snow SSA emissions are an important and currently underrepresented contributor to polar aerosol burdens, seasonal cycles, and high-latitude aerosol–cloud feedbacks, although their influence on the annual-mean surface energy budget is modest, with pronounced seasonal and regional variability.
- Article
(4999 KB) - Full-text XML
-
Supplement
(2002 KB) - BibTeX
- EndNote


The Arctic region is experiencing rapid climate change, warming nearly four times faster than the global average (Rantanen et al., 2022). This phenomenon, known as Arctic amplification, is driven by multiple feedback mechanisms, including changes in surface albedo, sea ice loss, and atmospheric heat transport (Serreze and Barry, 2011; Pithan and Mauritsen, 2014). Recently, the role of atmospheric aerosols has received increasing attention (Schmale et al., 2021). This is due to their complex interactions with atmospheric radiation, clouds, and surface albedo in the polar environments (Sand et al., 2017), and due to the effect of global aerosol emissions on the heat transport to the Arctic (Acosta Navarro et al., 2016; Lewinschal et al., 2019; Merikanto et al., 2021). With regards to aerosol-cloud interactions in the polar regions, the longwave radiative effect of low-level mixed-phase clouds, comprising both liquid droplets and ice crystals, plays a critical role (Mauritsen et al., 2011; Schmale et al., 2021). However, the overall impact of aerosols on Arctic clouds and climate is still not well understood. This is to a large extent because aerosol sources and their properties in the central Arctic are poorly known (Wendisch et al., 2019).
Sea salt aerosols (SSA) are an important source of cloud condensation nuclei (CCN) in both Arctic and Antarctic regions. Model estimates show that SSA account for more than a quarter of the Arctic aerosol number concentration, and even up to 45 % locally (Gong et al., 2023). As Arctic sea ice declines, increased open-ocean area and more frequent sea-ice leads are expected to enhance SSA emissions, thereby increasing Arctic CCN concentrations (Emme and Horowitz, 2025). SSA represents the largest mass fraction among all aerosol species in the Arctic (May et al., 2016). The primary sources of SSA in the region are bubble bursting over open ocean, emissions from leads in sea ice (Lapere et al., 2024) and wave breaking (de Leeuw et al., 2011). However, recent studies have highlighted that blowing snow is also an important and previously underappreciated source of SSA, especially during winter and spring (Huang et al., 2018; Yang et al., 2008; Frey et al., 2020). Unlike open-ocean sea spray, which is generated by bubble bursting and wave breaking and therefore requires open water, blowing-snow SSA originates from saline snow that is lofted from the sea-ice surface by wind. This mechanism is active precisely when open-water sources are suppressed, during winter (DJF in the Arctic and JJA in the Antarctic regions), when sea-ice cover is extensive and open water is scarce. Blowing snow can therefore dominate the SSA budget over consolidated sea ice in the wintertime on both poles.
The first observations of SSA production from snow-covered sea ice were made in 2013 in the Weddell Sea, Antarctica. Frey et al. (2020) demonstrated that snow over sea ice can release sea salt into the atmosphere. Similar observations were made in the Arctic during the 2019–2020 MOSAiC expedition. Ranjithkumar et al. (2025) showed that both particle mass and number concentrations of SSA increased during periods of storm-induced blowing snow. Blowing snow was responsible for enhanced SSA concentrations for up to 40 % of the time during the Arctic winter and spring.
CMIP6 models have been shown to inadequately represent SSA emissions in polar regions. In addition, there are significant discrepancies between models, largely due to differences in source functions and emission parameterizations (Lapere et al., 2023). These inconsistencies lead to biases in cloud microphysics, aerosol–radiation interactions, and the surface energy budget. Thornhill et al. (2021) demonstrated that doubling SSA emissions in CMIP6 models results in an effective radiative forcing (ERF) ranging from −0.3 to −2.2 W m−2. Furthermore, Venugopal et al. (2025) showed that this model spread is mainly due to differences in the parameterization of ambient aerosol size distribution, CCN, and cloud droplet number concentrations (CDNC).
The climate effects of SSA production from blowing snow remain uncertain. Gong et al. (2023) investigated this process using the GEOS-Chem chemical transport model, driven by meteorological fields from the MERRA-2 reanalysis, while Yang et al. (2019) and Ranjithkumar et al. (2025) implemented blowing-snow SSA production in the p-TOMCAT chemical transport model. However, simulations using fully coupled global climate models are still lacking, limiting our understanding of the broader climate implications of SSA production from blowing snow.
Here, we implement SSA production from blowing snow into the chemical transport model TM5 and to the global climate model EC-Earth3 using TM5, based on the parameterization from Yang et al. (2019), to investigate the climate impacts of SSA from blowing snow and their effects on CCN. We also investigate how much SSA is generated from blowing snow in the years 2019–2020 in both the Arctic and Antarctic using the TM5 chemical transport model. For the Arctic, model results are evaluated against in situ MOSAiC campaign data and monitoring stations at Zeppelin, Alert and Villum. For the Antarctic, no equivalent in-situ observations are available for this period, and the model results are therefore assessed in the context of the simulated emission patterns and seasonal cycles alone. Furthermore, we quantify the effect of blowing snow SSA on surface radiative fluxes using atmosphere-only simulations with the EC-Earth3 global climate model, and carry out transient fully-coupled climate simulations following the SSP3-7.0 scenario for the years 2015–2051 to investigate future responses to polar SSA changes.
2.1 Observational datasets
Measurements of Arctic aerosols and cloud properties were carried out as part of the MOSAiC expedition. This year-long campaign, from September 2019 to October 2020, aimed to investigate Arctic climate change from multiple perspectives, including the atmosphere, sea ice, snow, ocean, ecosystems, and biogeochemistry (Shupe et al., 2020). Particle number concentration data from Beck et al. (2022) and cloud condensation nuclei (CCN) data from Bergner et al. (2023) were obtained for the MOSAiC expedition (October 2019–September 2020). Both datasets were collected using instruments housed in the Swiss aerosol container on the D-deck of the research vessel Polarstern. Blowing snow events in the observational record were defined based on concurrent 10 m wind speed surpassing a temperature-dependent critical threshold, calculated empirically from the observed air temperature (Li and Pomeroy, 1997), and snowdrift density at 0.1 m above the snow surface, which was required to exceed 10−5 kg m−3. These criteria allow separation of snow-driven aerosol production from sea-spray contributions.
We also used observations of sea salt mass from ground stations at three Arctic locations: Villum, Zeppelin, and Alert (Norwegian Institute for Air Research, 2024). Both Alert and Villum are situated above 80° N, where sea ice persists even during summer, making them ideal coastal sites for studying blowing snow events. In contrast, Zeppelin is a mountainous site that is often influenced by sea spray.
2.2 Blowing snow
We implement the same sea-salt aerosol (SSA) production from blowing snow parameterization as used in the p-TOMCAT chemical transport model in Yang et al. (2019). The parameterization depends on meteorological variables, including air temperature, 10 m wind speed, and relative humidity. The parameterization produces a size-resolved SSA particle flux. The size distribution of emitted SSA follows the original p-TOMCAT implementation and is determined by the prescribed blowing-snow particle size distribution, snow salinity (which is fixed per size bin), and the assumed number of SSA particles produced per sublimating snow particle. The SSA mass flux is proportional to the bulk sublimation flux of blowing snow multiplied by the bulk snow salinity (Yang et al., 2019). Converting bulk sublimation flux into a size-resolved particle flux requires four inputs: (1) sublimation function for snow particles, (2) blowing-snow size distribution, (3) snow salinity and (4) ratio of SSA formed per snow particle. The blowing snow parameterization is most sensitive to how the size distribution is described. Among the meteorological variables, once the size-distribution parameters are constrained by observations, the SSA number flux is most sensitive to relative humidity (with respect to ice), 10 m wind speed, snow age, and temperature (Ranjithkumar et al., 2025). Relative humidity acts through its control on the snow-particle sublimation flux, while wind speed additionally governs the SSA mass flux through the saltation mixing ratio. For the sublimation function, the parametrization follows the SI_Base control run of Yang et al. (2019), in which a constant water mass loss rate is assumed across all blowing-snow particle size bins. Under this scheme, one SSA particle is formed per sublimating snow particle, which Yang et al. (2019) identify as a lower bound on SSA number production. The paper by Yang et al. (2019) also includes sensitivity experiments with larger values of N (the number of SSA particles produced per sublimating snow particle), but in this study we adopt the SI_Base configuration (N = 1). Snow salinity is prescribed using the full observed salinity frequency distribution from Weddell Sea field measurements (Frey et al., 2020), spanning 24 bins from 0.002 to 80 psu, with the distribution peak around 0.01–0.1 psu. The parameterization computes SSA production only under subsaturated conditions (RH < 100 %).
2.3 Models
2.3.1 TM5
We employed the Tracer Model version 5 (TM5), a global three-dimensional chemistry transport model designed to simulate atmospheric composition with a focus on tropospheric chemistry (Huijnen et al., 2010). TM5 utilizes a flexible two-way nested zooming capability, allowing for variable horizontal resolutions in different regions of interest. The model incorporates a comprehensive photochemical mechanism, interactions with aerosols, stratospheric chemistry treatments, and both wet and dry deposition processes. Emissions from various sources, including anthropogenic, biogenic, and biomass burning, are integrated with spatial and temporal distributions. Meteorological input fields are typically provided by the ECMWF Integrated Forecasting System (IFS), ensuring realistic transport and mixing processes (Huijnen et al., 2010; Krol et al., 2005; Williams et al., 2017).
For aerosol microphysics, TM5 is coupled with the M7 module, a size-resolved aerosol microphysics scheme that represents the aerosol size distribution using seven log-normal modes (Vignati et al., 2004). These modes comprise a soluble nucleation mode together with soluble and insoluble Aitken, accumulation, and coarse modes. M7 simulates key aerosol processes such as nucleation, condensation, coagulation, and deposition. The module tracks both number and mass concentrations for each mode, allowing a detailed representation of the aerosol dynamics and their interactions with trace gases. CCN concentrations at 0.3 % supersaturation are calculated using the CCN diagnostic implemented in TM5. The diagnostic applies κ-Köhler theory to the M7 lognormal aerosol modes to determine the fraction of particles activated at the prescribed supersaturation. The activated particle numbers are integrated over the soluble Aitken, accumulation, and coarse modes and summed to obtain the total CCN concentration. This diagnostic is used only for output and does not provide feedback to the model cloud microphysics.
2.3.2 EC-Earth3
For assessing the climate impacts of blowing snow SSA production, we use the EC-Earth3 global climate model (Döscher et al., 2022). In the EC-Earth3 model, aerosols and chemical processes are represented by the TM5 atmospheric chemistry model. The atmospheric model employed a spatial discretization TL255 in the horizontal with 91 vertical levels, whereas TM5 was run at a coarser resolution of 3° × 2° (longitude × latitude) with 34 vertical levels and a model top at 0.1 hPa (van Noije et al., 2014, 2021).
2.4 Experiments
We conducted six experiments in total, two with the TM5 model and four with EC-Earth3. The TM5 experiments were driven with boundary conditions from ERA5 for the years 2019–2020, corresponding to the MOSAiC campaign period. Figure S1 in the Supplement shows a comparison of ERA5 10 m wind speed against in situ MOSAiC observations along the drift track, with the critical threshold wind speed overlaid. ERA5 reproduces the observed wind speed and captures the timing of threshold exceedance, confirming that the forcing adequately resolves the wind-driven onset of blowing snow. The relative humidity that controls sublimation is likewise well constrained over the Arctic: Graham et al. (2019) found that ERA5 reproduces observed temperature, wind, and humidity profiles with correlation coefficients exceeding 0.88.
The EC-Earth3 experiments either followed the Atmospheric Model Intercomparison Project (AMIP) (Gates, 1992) setup described in Naakka et al. (2025), with prescribed sea-ice concentrations and sea surface temperatures taken from the CMIP6 ACCESS-ESM1-5 model for the years 1950–1969, were carried out in a transient fully coupled mode following the SSP3-7.0 scenario for years 2015–2051. In all cases, we performed a baseline simulation without the blowing snow parameterization and a sensitivity simulation including sea-salt aerosol (SSA) production from blowing snow. The experiments are listed in Table 1.
Table 1List of experiments used in this study. Each row corresponds to one experiment, with the model name and a brief description.

2.5 Statistical methods
To assess the statistical significance of changes in different variables (aerosol particle number concentrations, temperature, aerosol optical depth) between simulations with and without blowing snow emissions, we applied a non-parametric block bootstrap method combined with False Discovery Rate (FDR) correction to control for multiple testing. At each grid point, we constructed a time series of monthly mean differences between the two simulations. To account for temporal autocorrelation, we applied the moving block bootstrap technique. For transient runs, we apply a modified t-test to capture lag-1 autocorrelation.
Figure 1 shows the time-mean sea salt particle flux from the TM5 blowing snow experiment. The highest fluxes in the Arctic are found along the eastern coast of Greenland and at the boundary between the open ocean and sea ice. In comparison, the Antarctic exhibits even more pronounced sea salt fluxes from blowing snow. In the Antarctic, emissions are more zonally uniform around the ice edge, whereas in the Arctic they are more localized, particularly near the Greenland coast. Maximum flux values in the Arctic region reach approximately 3.6 particles m−2 s−1, while values in the Antarctic can reach up to 7.0 particles m−2 s−1. This corresponds to an increase in particle number fluxes of over 100 % in the Arctic (near the North Pole) and up to 89 % in the Antarctic. The high relative increase in the Arctic is due to the lack of other emission sources over sea ice regions. There is a clear seasonal cycle. In the Arctic, most of the sea salt emissions due to blowing snow occur during Boreal wintertime (DJF) and springtime (MAM), whereas in the Antarctic the peak emissions occur during the Austral winter (JJA) and spring (SON) seasons.
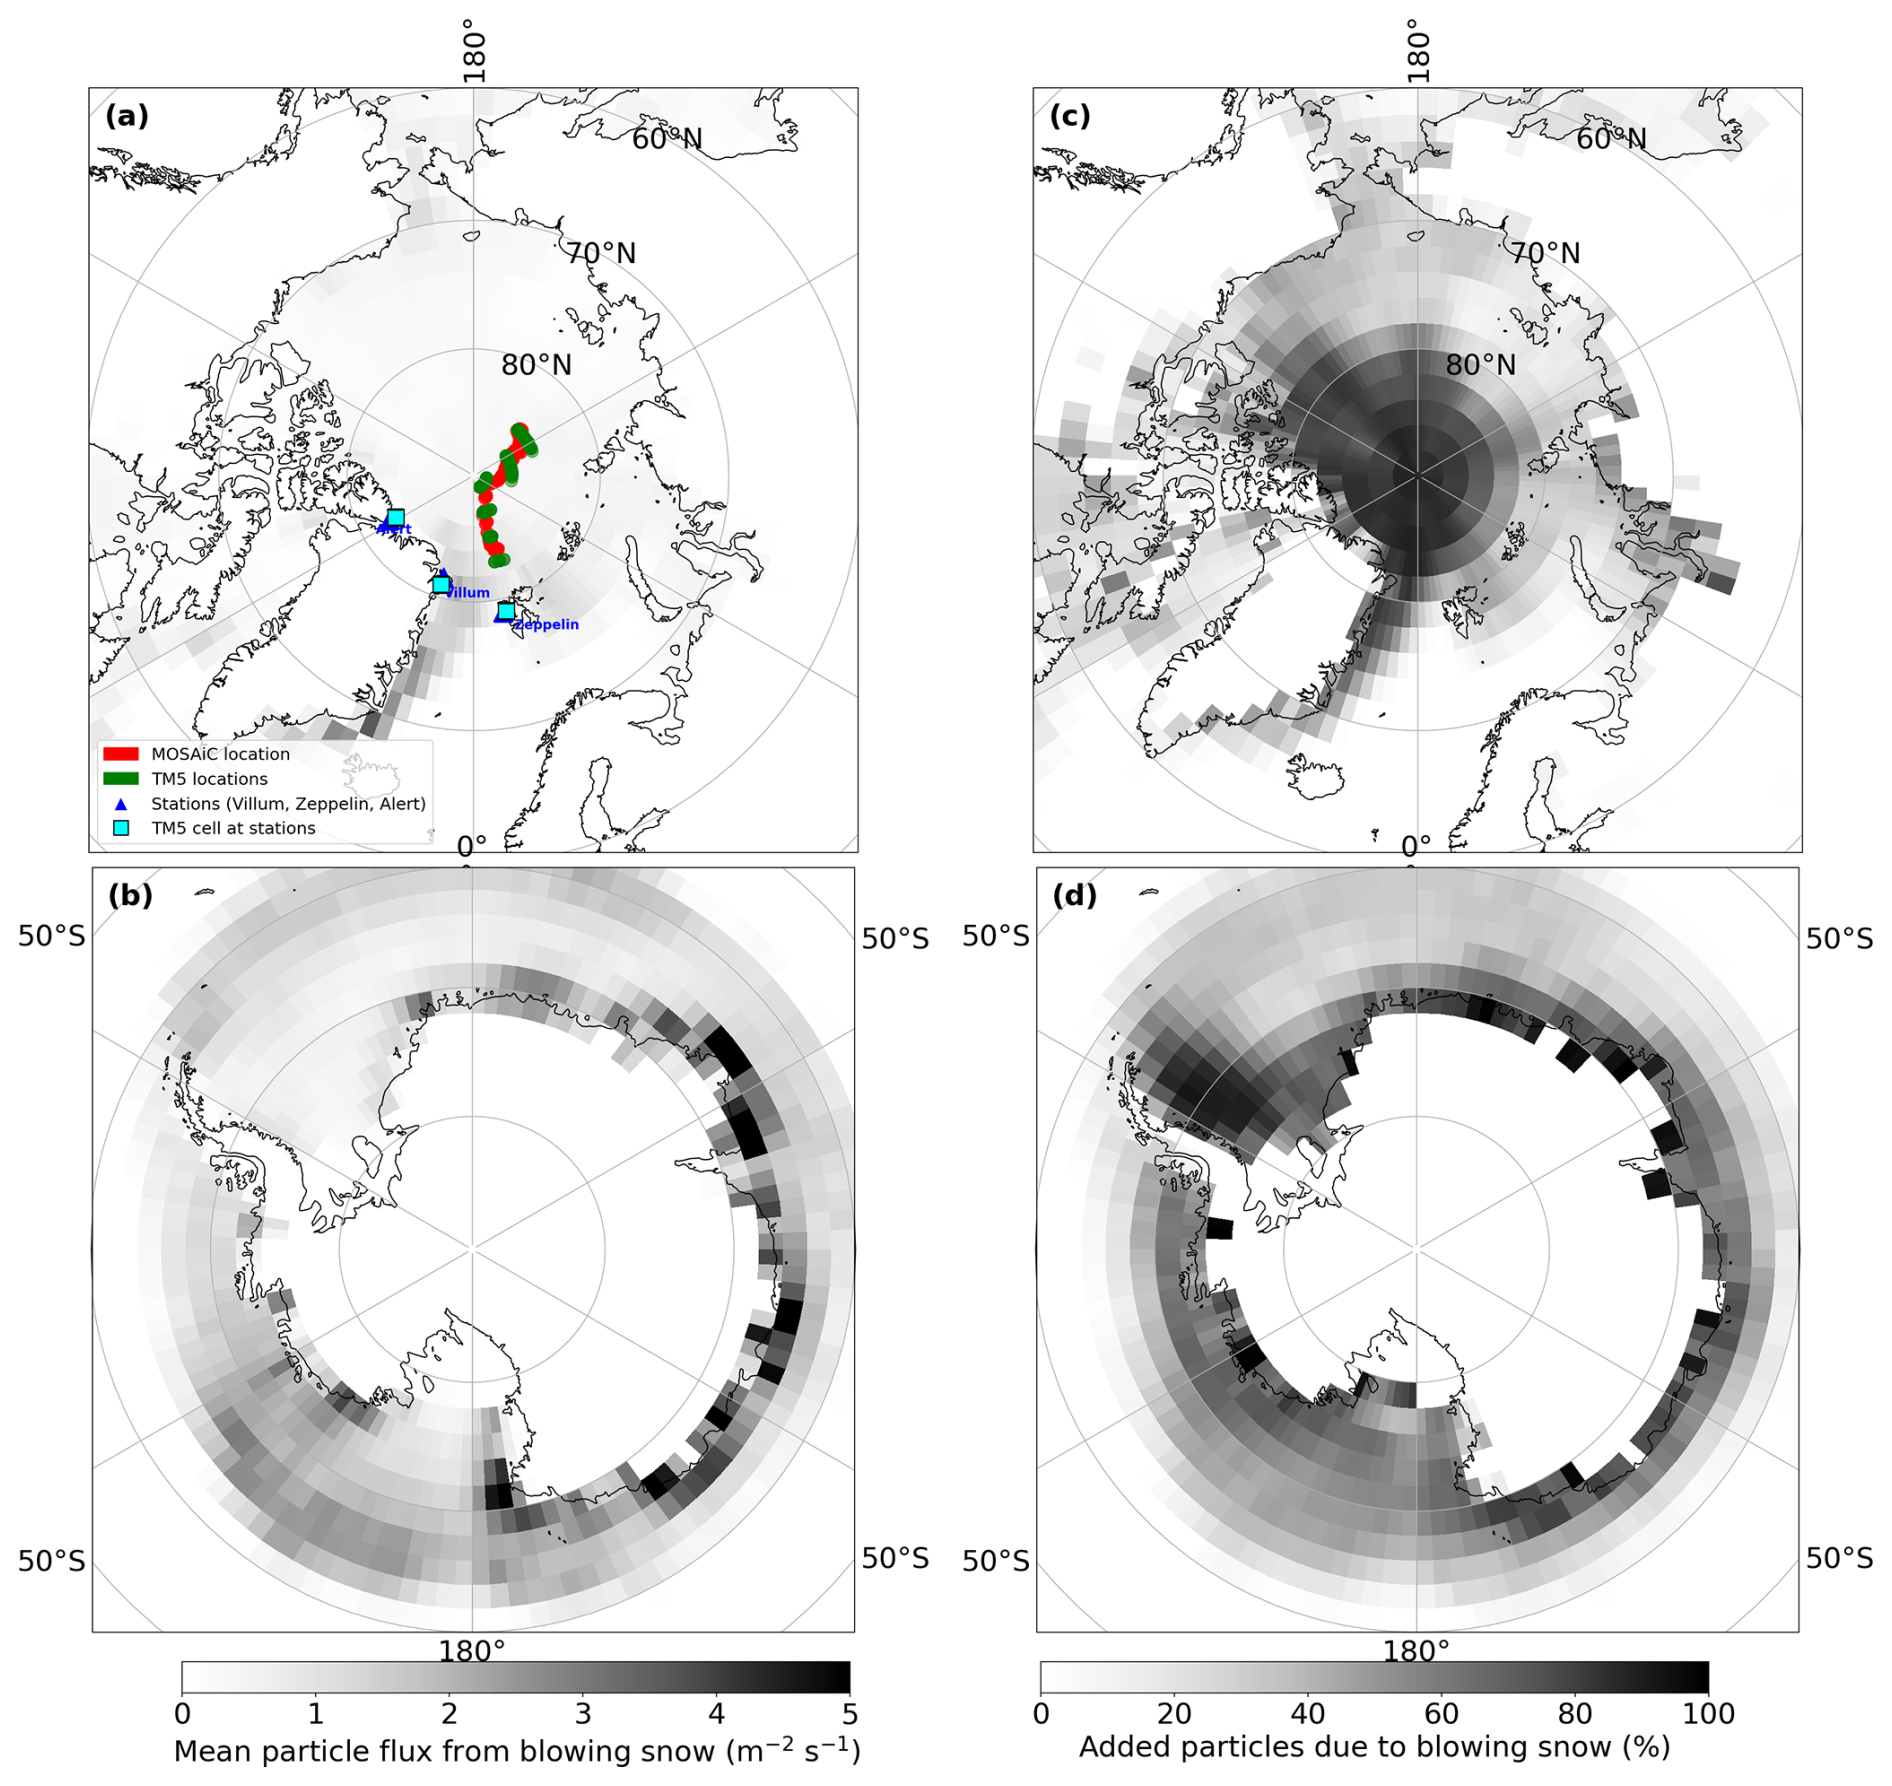
Figure 1Time-mean sea salt aerosol particle number flux from blowing snow simulated by TM5 in the Blowing snow experiment (2019–2020, driven by ERA5 meteorology). (a) Arctic and (b) Antarctic mean flux (particles m−2 s−1), shown by the white-to-black shading. In panel (a), red dots mark the MOSAiC track and the green dot the closest corresponding TM5 grid point. Panels (c) and (d) show the increase in total sea salt particle number due to blowing snow, expressed as a percentage relative to the Baseline simulation (without blowing snow), for the Arctic and Antarctic respectively.
3.1 Comparison to MOSAiC observations
Figure 2 presents a time series of sea salt aerosol number concentrations (particles cm−3) from MOSAiC campaign observations, alongside TM5 model simulations with and without the blowing snow parametrization. The figure demonstrates that inclusion of the blowing snow parametrization in TM5 slightly improves the model's ability to reproduce observed events. Over the full campaign period (October 2019–September 2020), the correlation between observations and the TM5 baseline simulation is R = 0.37, increasing to R = 0.39 with blowing snow; however, this difference is not statistically significant according to Williams' test. Restricting the comparison to the blowing-snow season (November 2019–April 2020), when blowing snow events are active and the parametrization is relevant, the correlation improves more substantially from R = 0.59 (baseline) to R = 0.63 (with blowing snow). These correlation values are comparable to those reported by Ranjithkumar et al. (2025), who found R = 0.23 using the (Yang et al., 2019) scheme and R = 0.28 using an updated wind-dependent scheme for coarse aerosol (0.5–20 µm) along the same MOSAiC track with p-TOMCAT. Gong et al. (2023) reported a larger improvement in correlation, from R = 0.43 to R = 0.53, using GEOS-Chem with NP = 5 for total particle number (10 nm–10 µm). The more modest full-year improvement in TM5 likely reflects that the inclusion of summer months when no blowing-snow events occur and both simulations are identical, thereby diluting the signal. Nevertheless, the simulation including blowing snow captures a greater number of the observed sea salt aerosol peaks, although some events remain underestimated or are missed entirely. In contrast, the standard model simulation without blowing snow fails to reproduce most of these episodes, highlighting the importance of the blowing snow mechanism for Arctic wintertime aerosol concentrations. Comparison of CCN values for the MOSAiC period is shown in Fig. 3, where the blowing snow parametrization more accurately reproduces the observed CCN increases during blowing snow events, although not all events are captured.
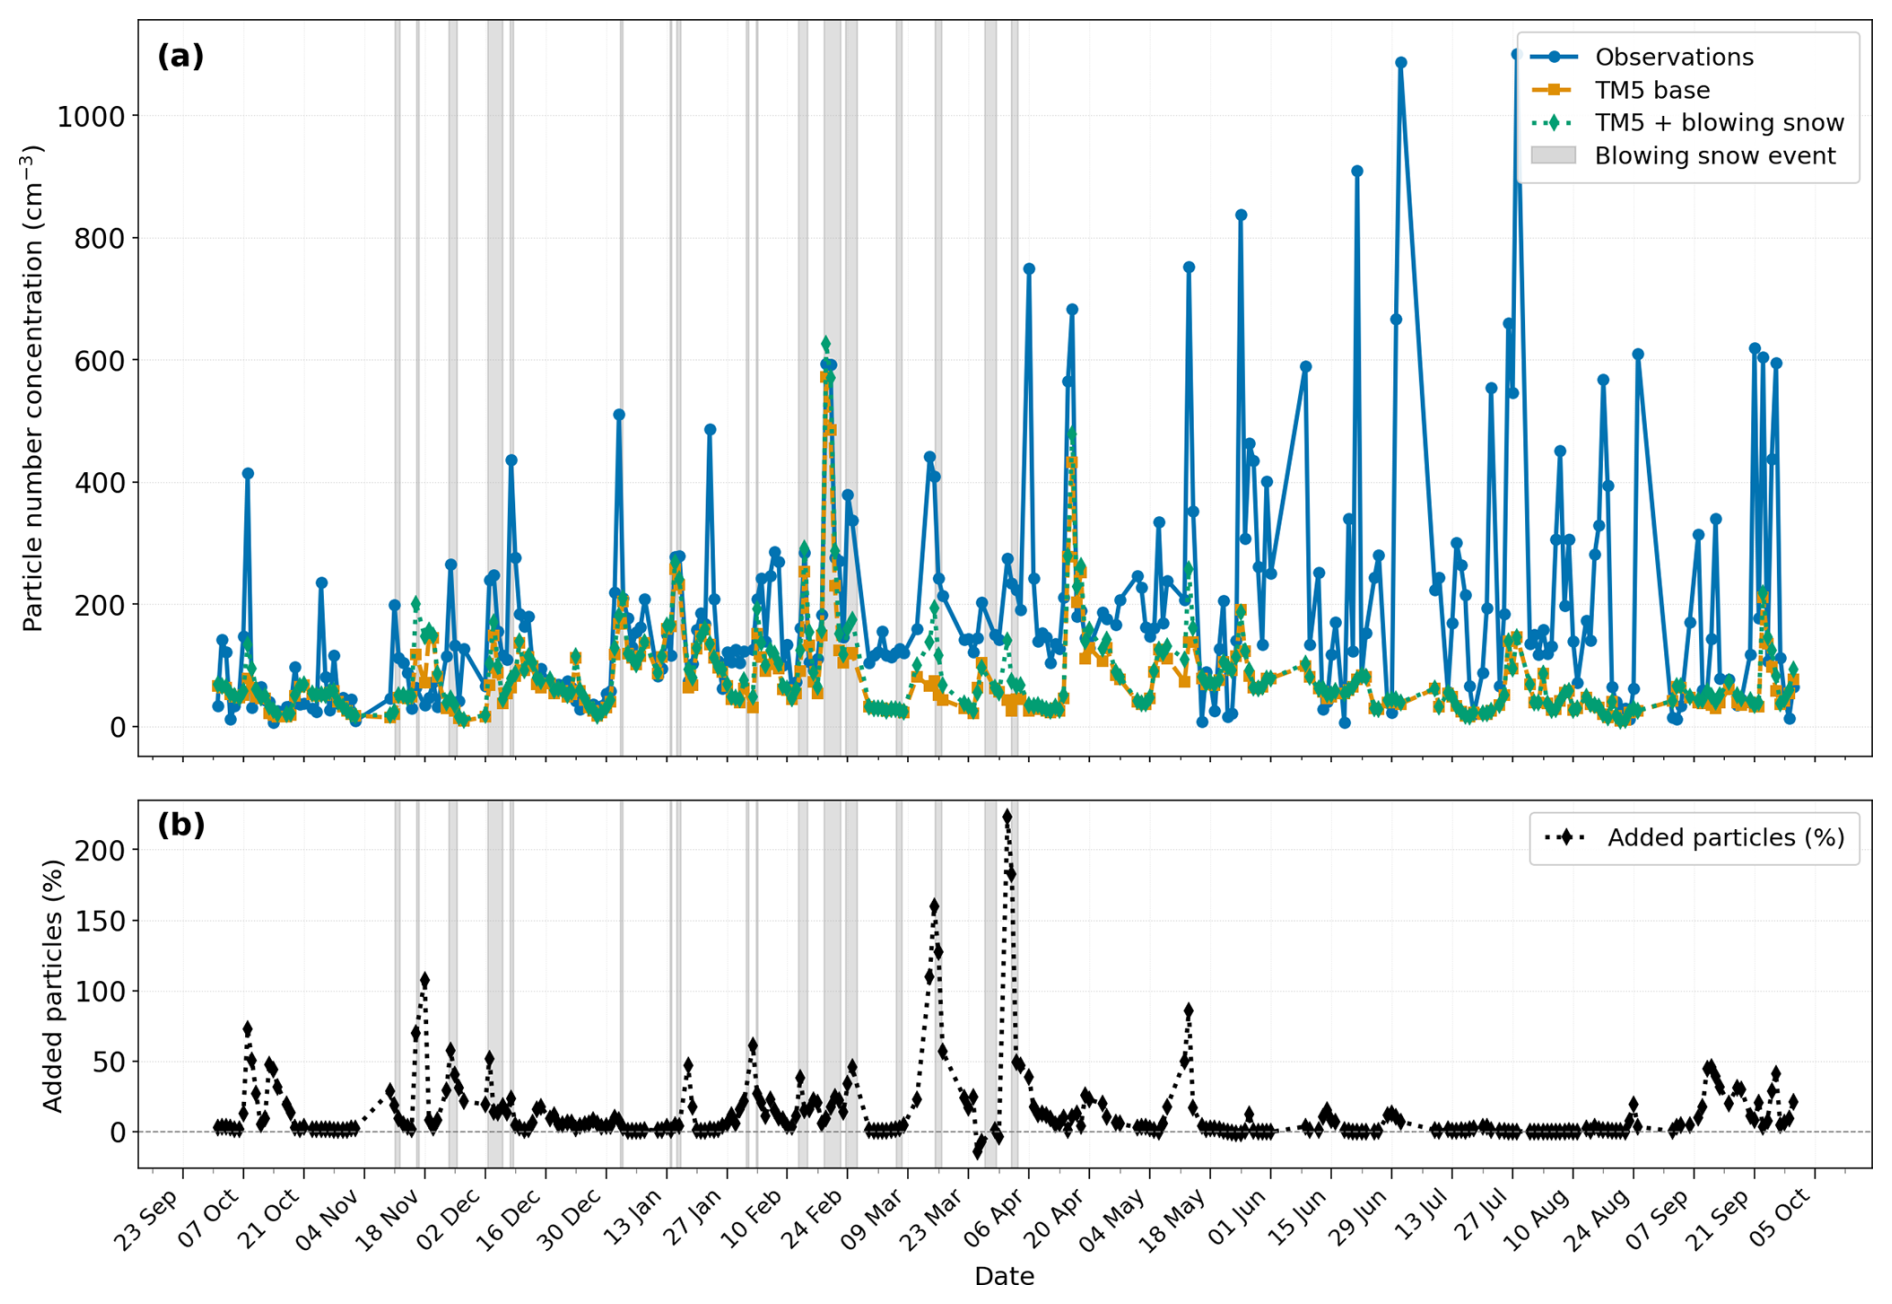
Figure 2Time series of sea salt aerosol number concentration along the MOSAiC track. Grey shaded areas indicate periods identified as blowing snow events. (a) Observed particle number concentration (blue, MOSAiC campaign) compared to TM5 results without blowing snow emissions (orange) and with blowing snow emissions (green). (b) Relative increase in particle number concentration due to blowing snow in the TM5 simulation, expressed as the percentage change relative to the Baseline simulation.
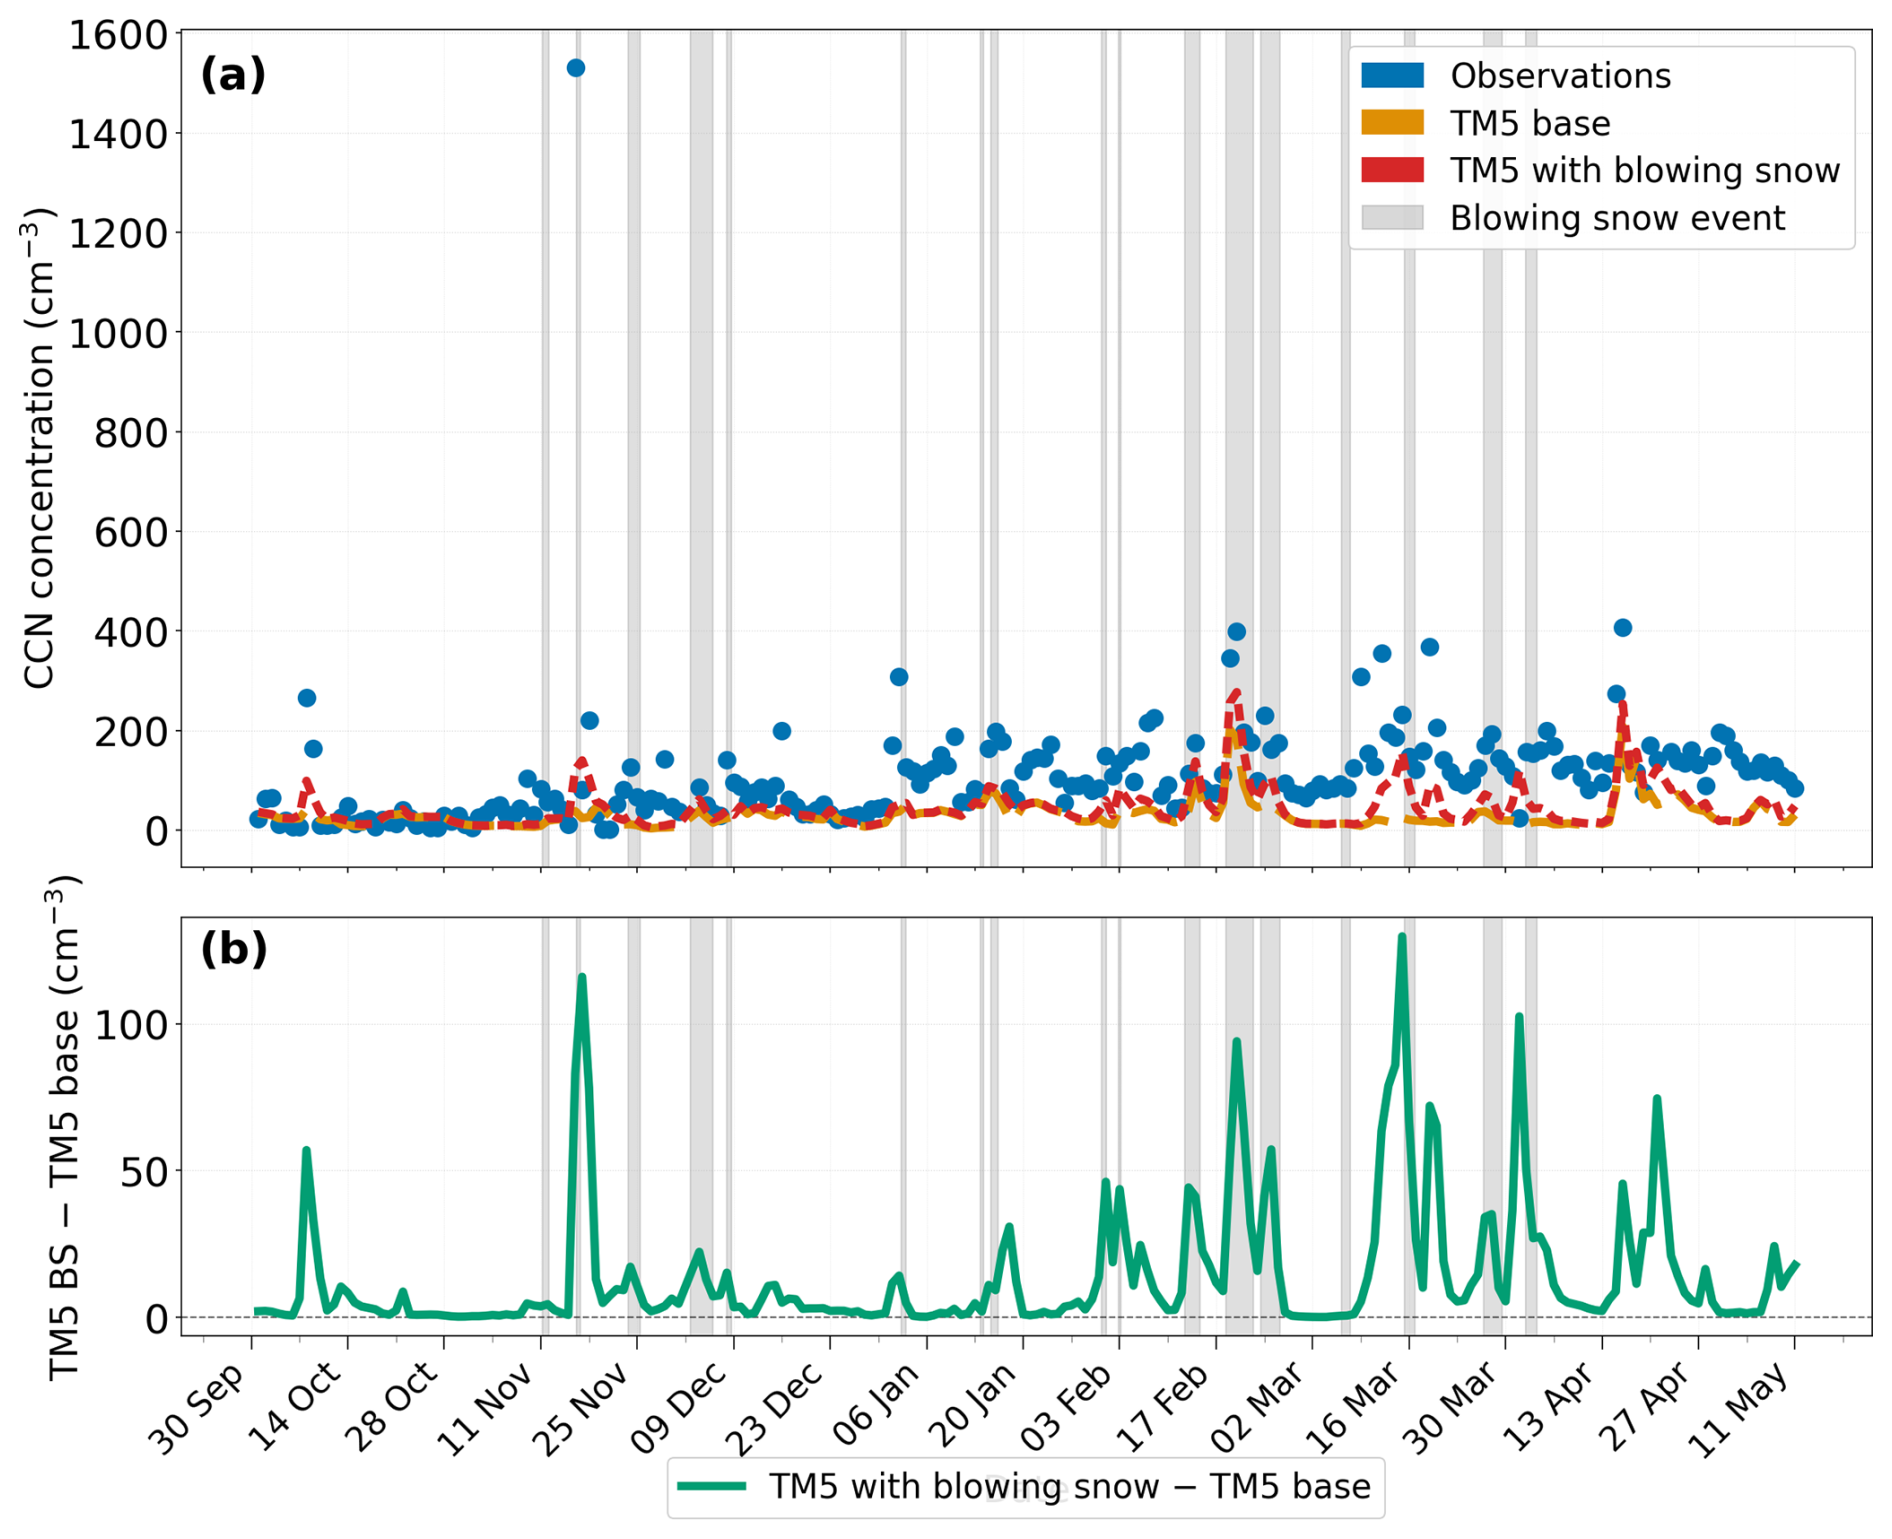
Figure 3Time series of sea salt CCN concentration at 0.3 % supersaturation from the MOSAiC campaign. Grey shaded areas indicate periods identified as blowing snow events. (a) Observed CCN concentration (blue dots, MOSAiC campaign) compared to TM5 model results without blowing snow emissions (orange dashed line) and with blowing snow emissions (red dotted line). (b) Difference in CCN concentration between the TM5 simulation with blowing snow emissions and the base simulation, showing the contribution of blowing snow to CCN concentrations.
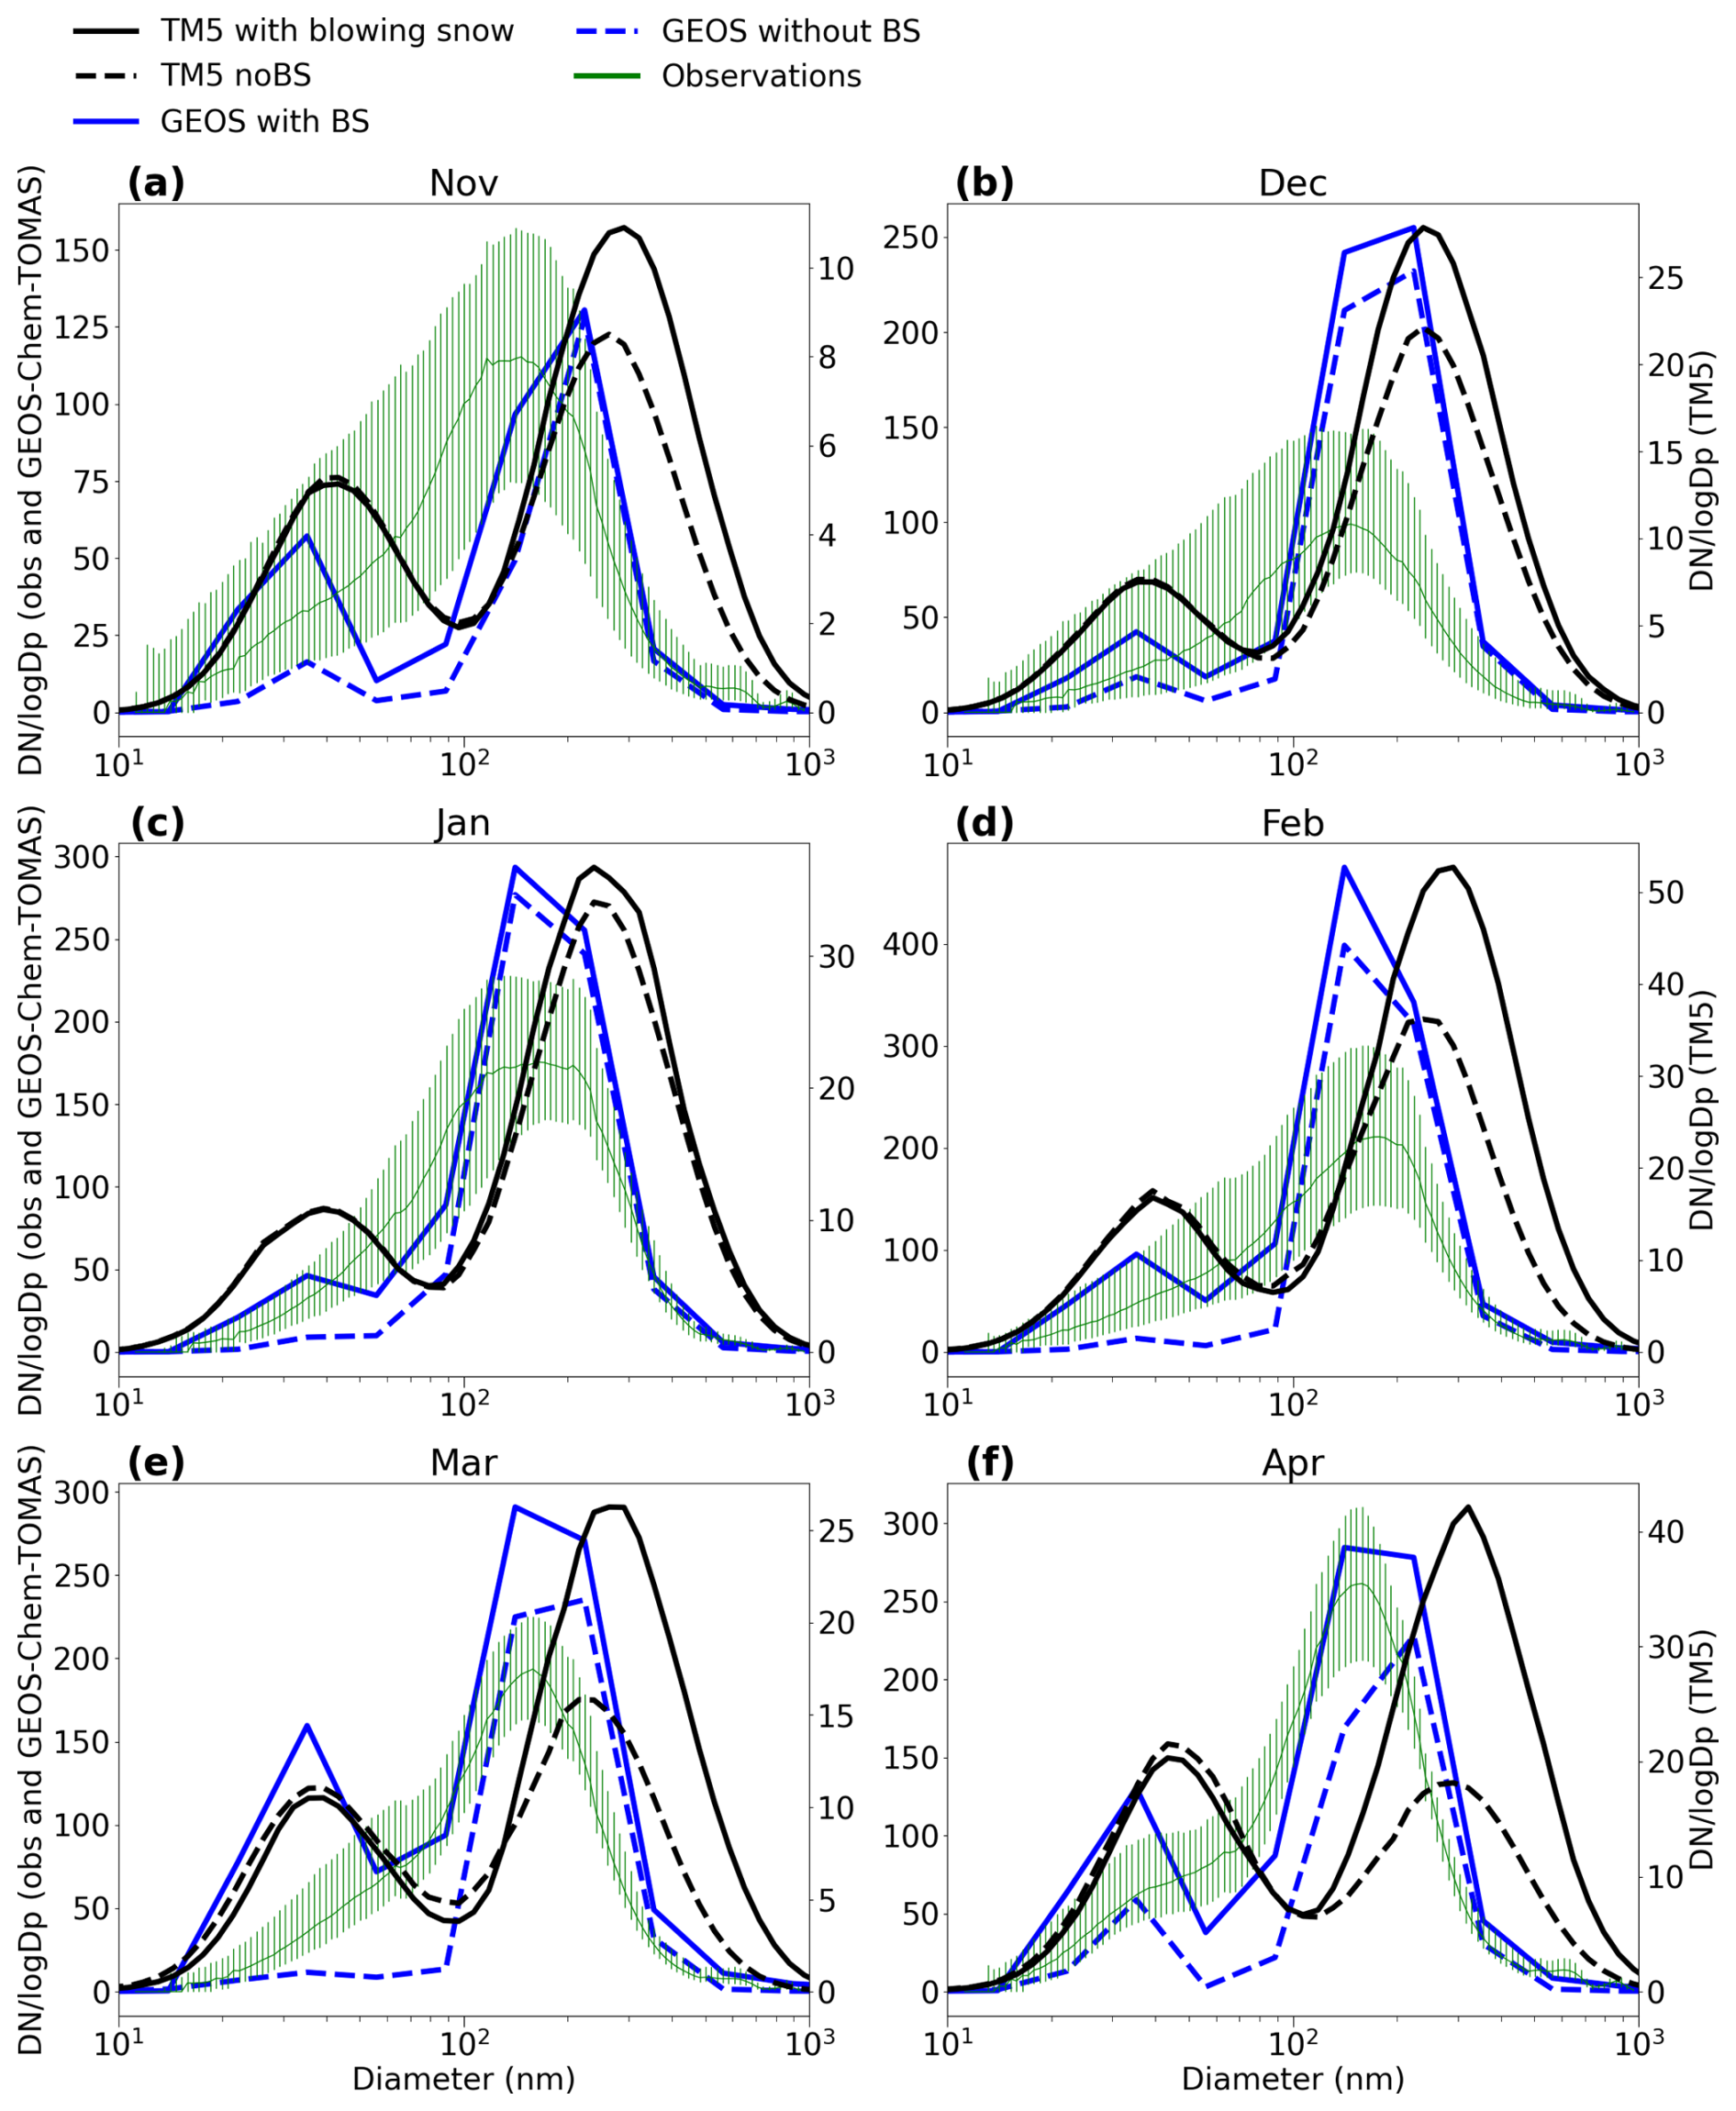
Figure 4Monthly median aerosol size distributions along the MOSAiC track. Observations are shown in green. TM5 model results without blowing snow (baseline) are shown as a dashed black line, while TM5 results including blowing snow are shown as a solid black line. GEOS-Chem model results without blowing snow are shown as a dashed blue line, and GEOS-Chem results with blowing snow are shown as a solid blue line
Figure 4 shows monthly median particle size distributions from TM5 simulations compared to MOSAiC observations and GEOS-Chem model results from Gong et al. (2023). The distributions are plotted as number concentrations () as a function of particle diameter, with each subplot representing a different month. Both TM5 and GEOS-Chem are shown with and without the blowing snow parametrization, allowing for a direct comparison of its impact. The inclusion of the blowing snow parameterization leads to an increase in accumulation-mode particle concentrations across all months in both models, consistent with the direct emission of SSA into the accumulation size range. However, TM5 and GEOS-Chem respond differently in the Aitken mode. In TM5, blowing snow causes a slight decrease in Aitken-mode particle concentrations, particularly in March and April, whereas in GEOS-Chem, Aitken-mode particles increase substantially in all months. This contrasting response likely reflects differences in aerosol microphysics between the two models. In TM5, the M7 modal scheme efficiently transfers mass from smaller to larger modes through coagulation, so newly emitted accumulation-mode SSA acts as a sink for Aitken particles. In GEOS-Chem, the sectional size representation allows blowing-snow SSA to populate finer size bins directly, leading to enhanced Aitken-mode concentrations. It should be noted that TM5's M7 sea salt production scheme does not produce a net increase in Aitken-mode SSA from blowing snow – in contrast to GEOS-Chem and the observations of Gong et al. (2023), who identified abundant fine-mode sea salt (diameter below 300 nm) as the primary driver of CCN enhancement during blowing-snow events. This represents an important model limitation, as the additional fine-particle contribution identified in observations and GEOS-Chem is not represented in the present TM5 simulations. Consequently, the simulated CCN enhancement may be underestimated if the missing fine-mode particles contribute substantially to the CCN. In addition, the prescribed Weddell Sea salinity distribution may underestimate SSA mass production in the Arctic if Arctic snow has higher salinity than assumed, while the choice of N = 1 introduces uncertainty in the emitted particle number and size distribution. The extent to which these uncertainties affect the CCN and cloud responses is not quantified here.
3.2 Station comparisons
Figure 5 presents monthly sea salt aerosol mass concentrations from TM5 simulations with and without the blowing snow parametrization, alongside observations from three Arctic ground-based monitoring stations: Zeppelin, Alert, and Villum. Across all sites, the inclusion of the blowing snow parametrization leads to a pronounced increase in sea salt concentrations during the winter and spring months (January–May), resulting in a more realistic seasonal cycle. Without blowing snow, TM5 underestimates observed sea salt aerosol levels during the cold season, particularly from January through March. However, the addition of blowing snow leads to an overestimation of the sea salt mass in Villum and Zeppelin, while Alert remains underestimated. A similar pattern is reported by Ranjithkumar et al. (2025), who found that p-TOMCAT underpredicts sodium mass concentration by a factor of 3 at Alert in February despite including blowing snow. The overestimation at Villum and Zeppelin likely reflects the combined effects of uncertainties in the blowing-snow parameterization, including our conservative N = 1 assumption (Yang et al., 2019; Gong et al., 2023) and the prescribed Weddell Sea salinity distribution. In our implementation, the same Weddell Sea snow salinity distribution, with a frequency-weighted mean of 0.92 psu (Yang et al., 2019), is applied at both poles and may not fully represent the spatial and vertical variability of Arctic snow salinity. This could lead to either over- or underestimation of SSA production and its associated mass flux. For example, the MOSAiC-observed Arctic snow salinities are 0.09–0.48 psu Ranjithkumar et al. (2025), which is substantially lower than what is prescribed. Zeppelin station is additionally influenced by sea spray from nearby open ocean, which may not be fully separated from the blowing-snow signal in the observational record.
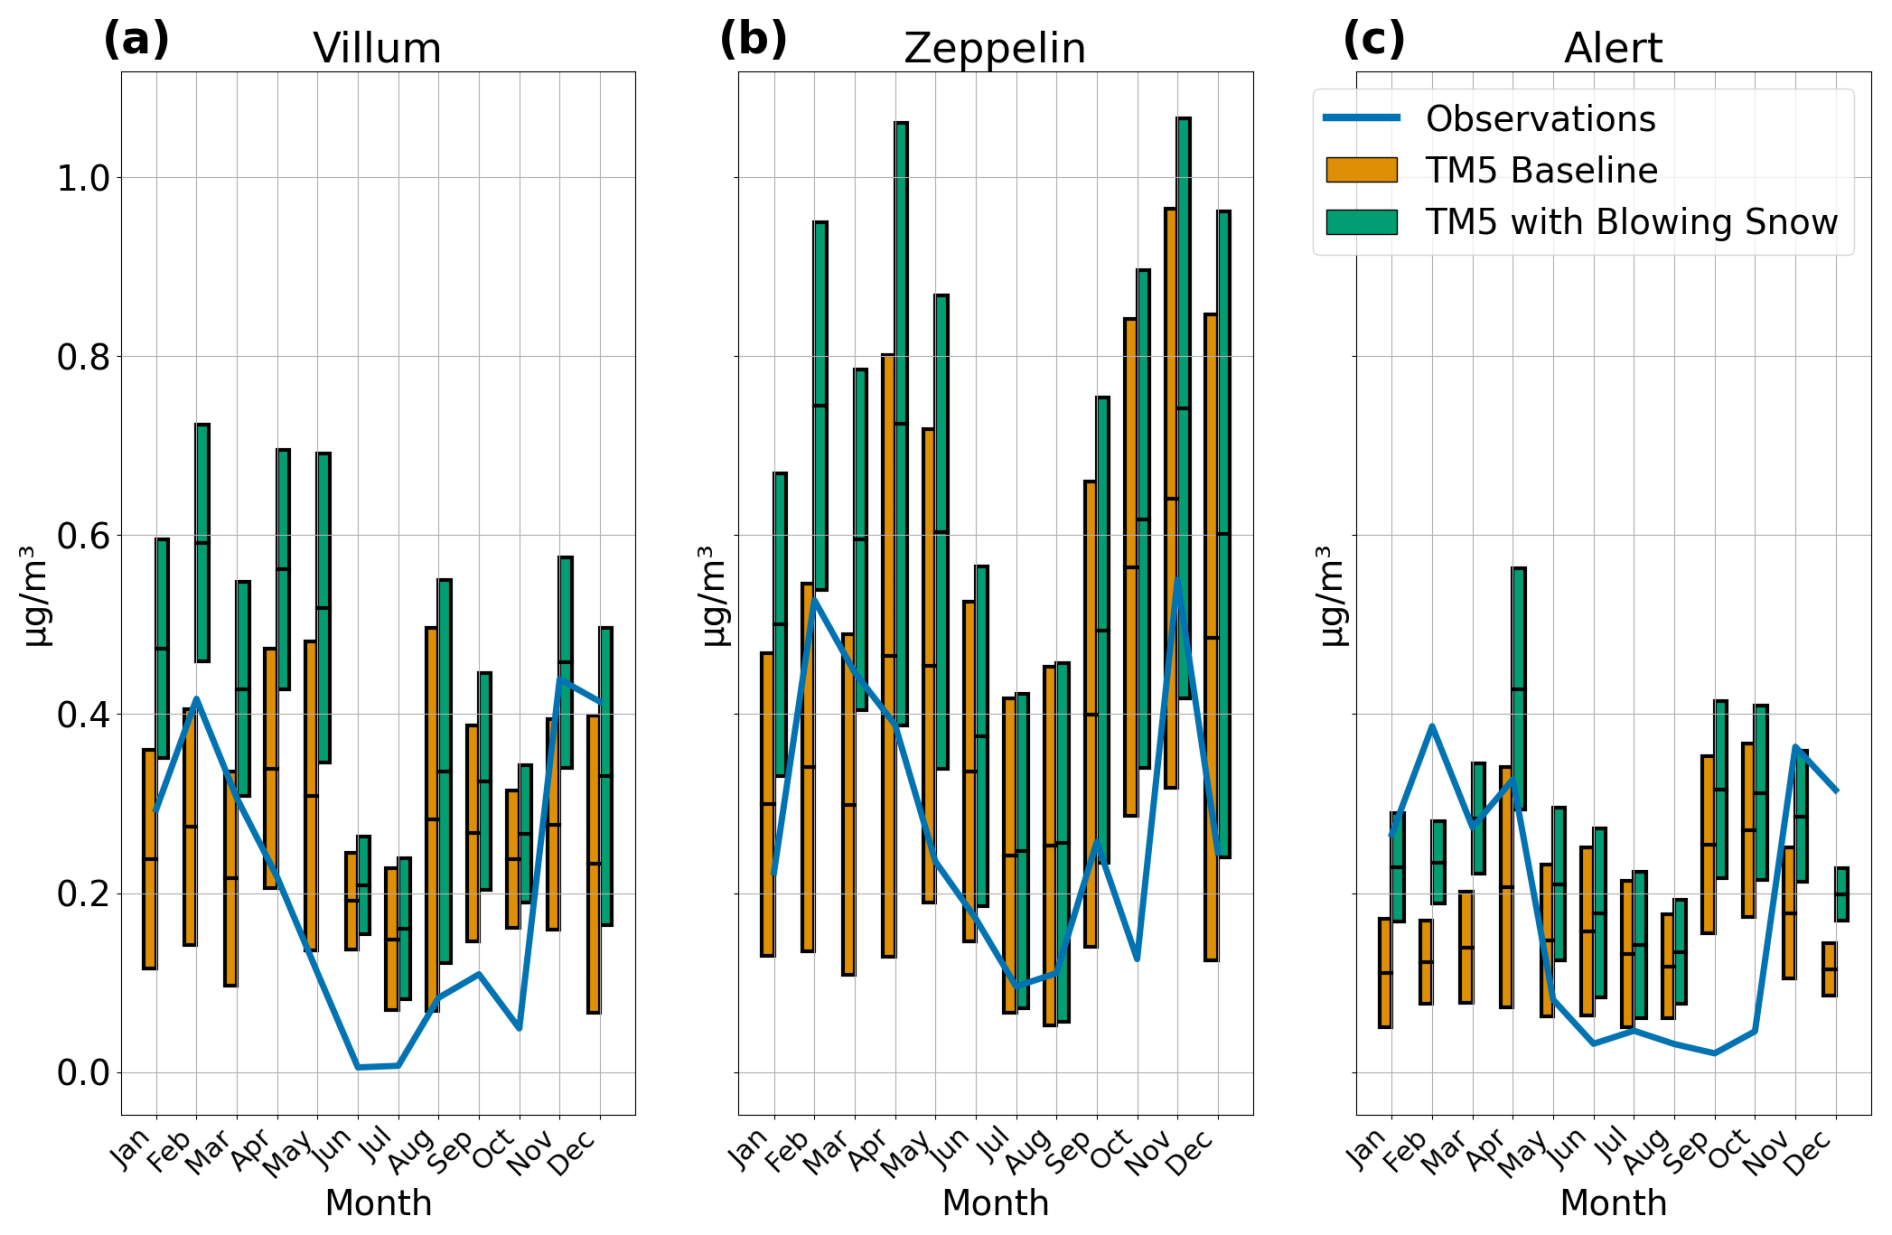
Figure 5Monthly mean total sea salt aerosol mass concentrations at three Arctic land-based stations: (a) Villum, (b) Zeppelin, and (c) Alert. Blue lines represent observations, orange bars show TM5 model results without blowing snow emissions, and green bars show TM5 results including blowing snow emissions. Monthly mean value is indicated by black line, and the height of the bar indicates the standard deviation within the month of modeled sea salt mass. Observations cover 2020 and are sampled from daily data of total sea salt aerosol mass.
4.1 Present-day forcing
The previous section demonstrated how the inclusion of the blowing snow parametrization increases sea salt aerosol mass, particle number concentrations, and CCN locally, particularly in Arctic surface observations. In this section, we assess the global implications of this additional source. Specifically, we examine the effect of blowing snow on global CCN distributions and quantify the associated radiative forcing. As shown in Fig. 1, the strongest impacts are found in the Antarctic region, where extensive sea ice and persistent strong winds create favorable conditions for blowing snow generation.
Figure 6 presents the zonal mean response of aerosol number concentrations to the blowing snow parametrization, with separate panels for the Aitken mode (left) and the accumulation mode (right) particles. The results illustrate that blowing snow significantly increases the number of accumulation mode particles in both the Arctic and Antarctic regions, particularly between 60 and 80° latitude. This enhancement is most pronounced in the Southern Hemisphere, consistent with the stronger sea salt fluxes over Antarctic sea ice.
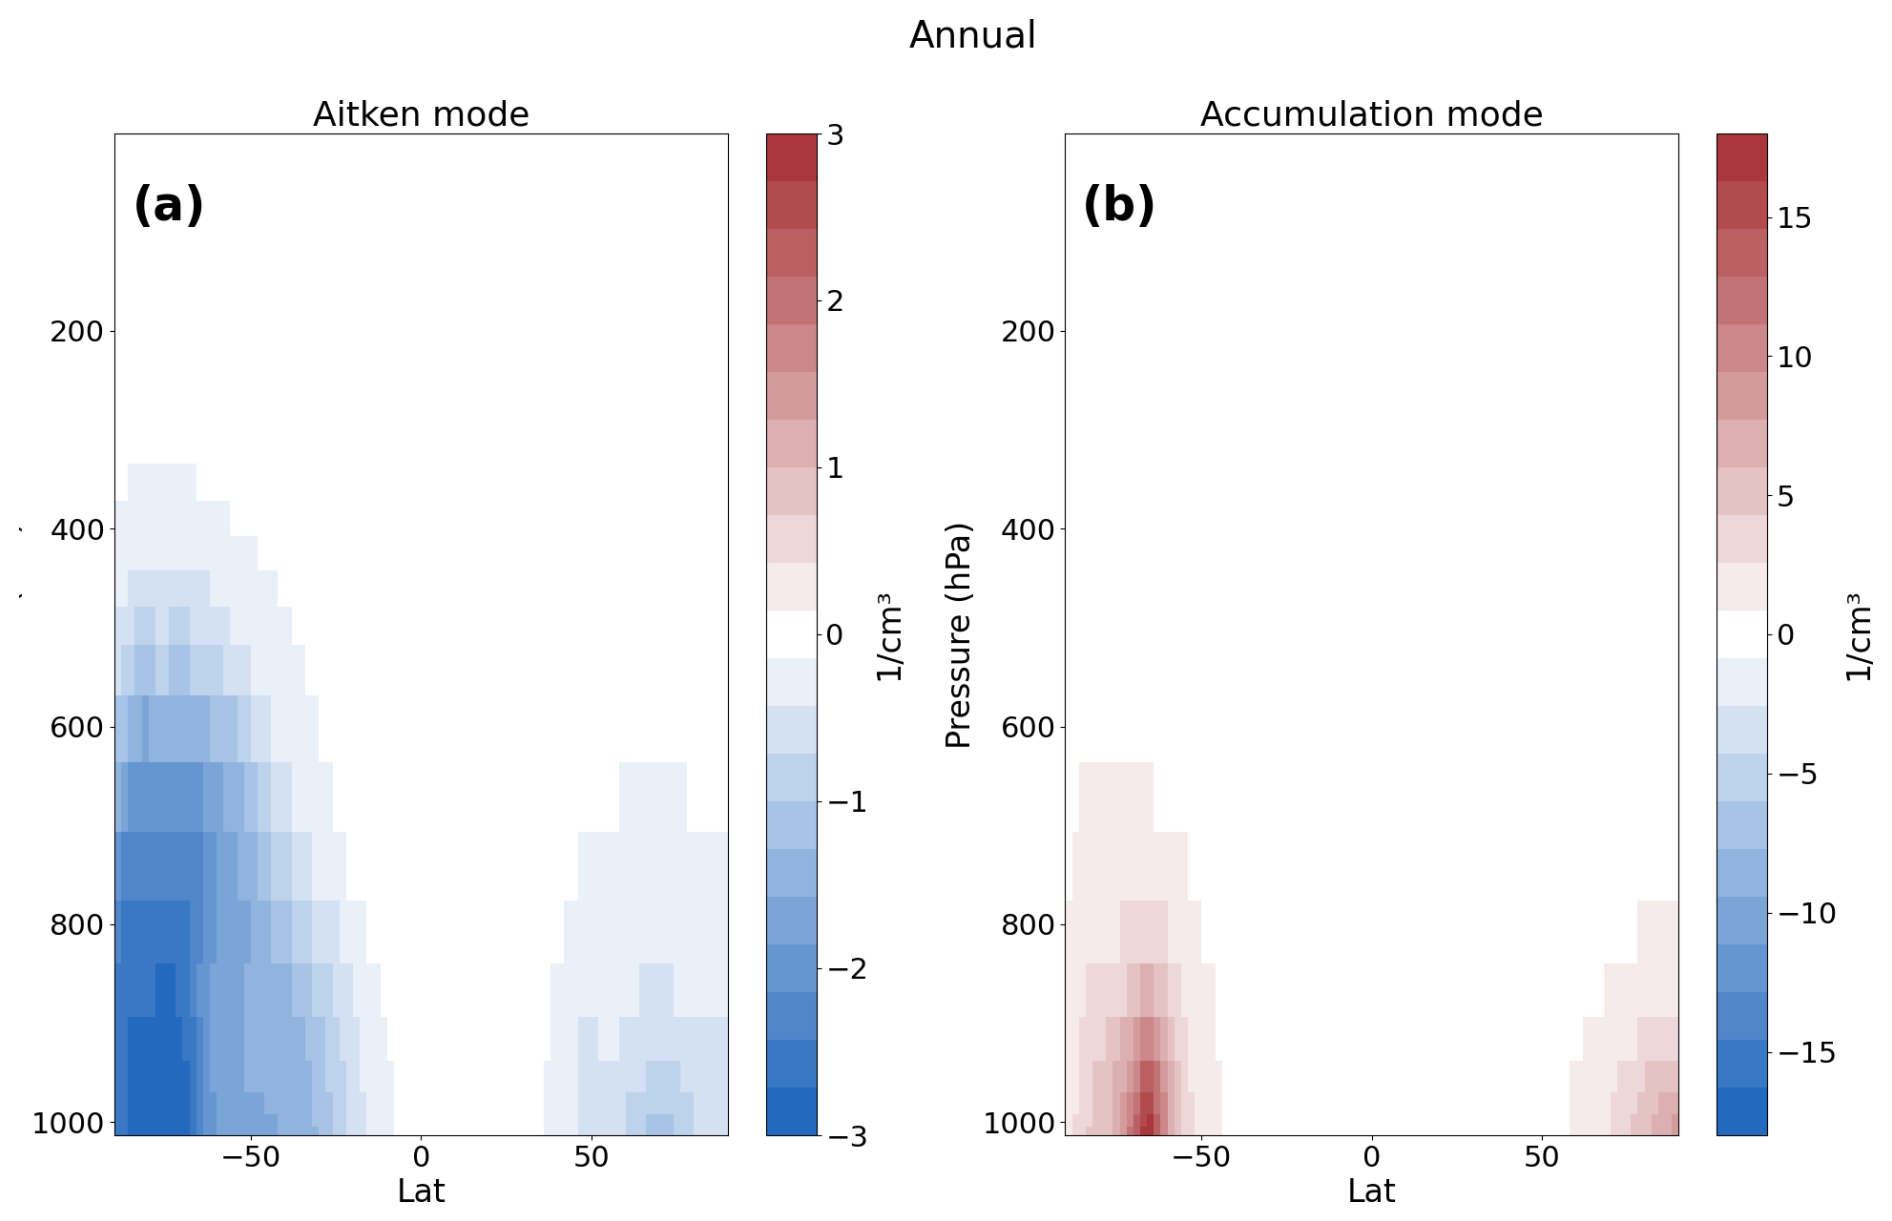
Figure 6Annual zonal mean difference (blowing snow − baseline) in particle number concentration due to blowing snow for the Aitken mode (a) and accumulation mode (b) in the TM5 simulations. Shading shows the change in number concentration (particles cm−3), calculated as the difference between simulations with and without blowing snow emissions. Positive values indicate an increase in concentration attributed to blowing snow events. All colored regions are statistically significant at level p < 0.05 using block bootstrapping, after FDR is applied.
In contrast, the inclusion of blowing snow leads to a widespread reduction in Aitken mode particle concentrations across the same regions. This suggests that the added coarse and accumulation mode sea salt particles enhance coagulation and act as a sink for ultrafine particles, reducing their atmospheric lifetime. However, in Fig. 4 the GEOS-Chem model also shows an increase of Aitken mode particles, in contrast to TM5 which shows a slight decrease of Aitken mode particles. The opposing responses in the two size modes highlight the complex role of blowing snow in modulating the aerosol size distribution and its potential implications for cloud condensation nuclei (CCN) availability and cloud microphysical properties in polar environments.
Figure 7 shows the zonal mean change in CCN concentrations at 0.3 % supersaturation due to the inclusion of the blowing snow parametrization. The results highlight a clear polar enhancement, with the strongest increases observed in the Antarctic. Specifically, CCN concentrations increase by up to 16.85 cm−3 in the Antarctic and 8.31 cm−3 in the Arctic. These increases are consistent with the elevated sea salt aerosol concentrations resulting from blowing snow emissions in both hemispheres. The enhancement in CCN is primarily confined to latitudes poleward of 60°. The CCN enhancements discussed above come from the accumulation mode, because TM5's M7 scheme suppresses rather than enhances Aitken-mode particles in response to blowing-snow emissions (Sect. 3.1). Since Aitken-mode particles are efficient CCN under Arctic conditions, the CCN increases reported here may underestimate the total CCN impact of blowing-snow SSA. An increase in CCN can modify cloud droplet number concentrations and droplet sizes by providing additional particles for cloud activation. In CCN-limited polar clouds, such changes in cloud microphysics can alter cloud optical properties and consequently the shortwave and longwave radiative effects of clouds.
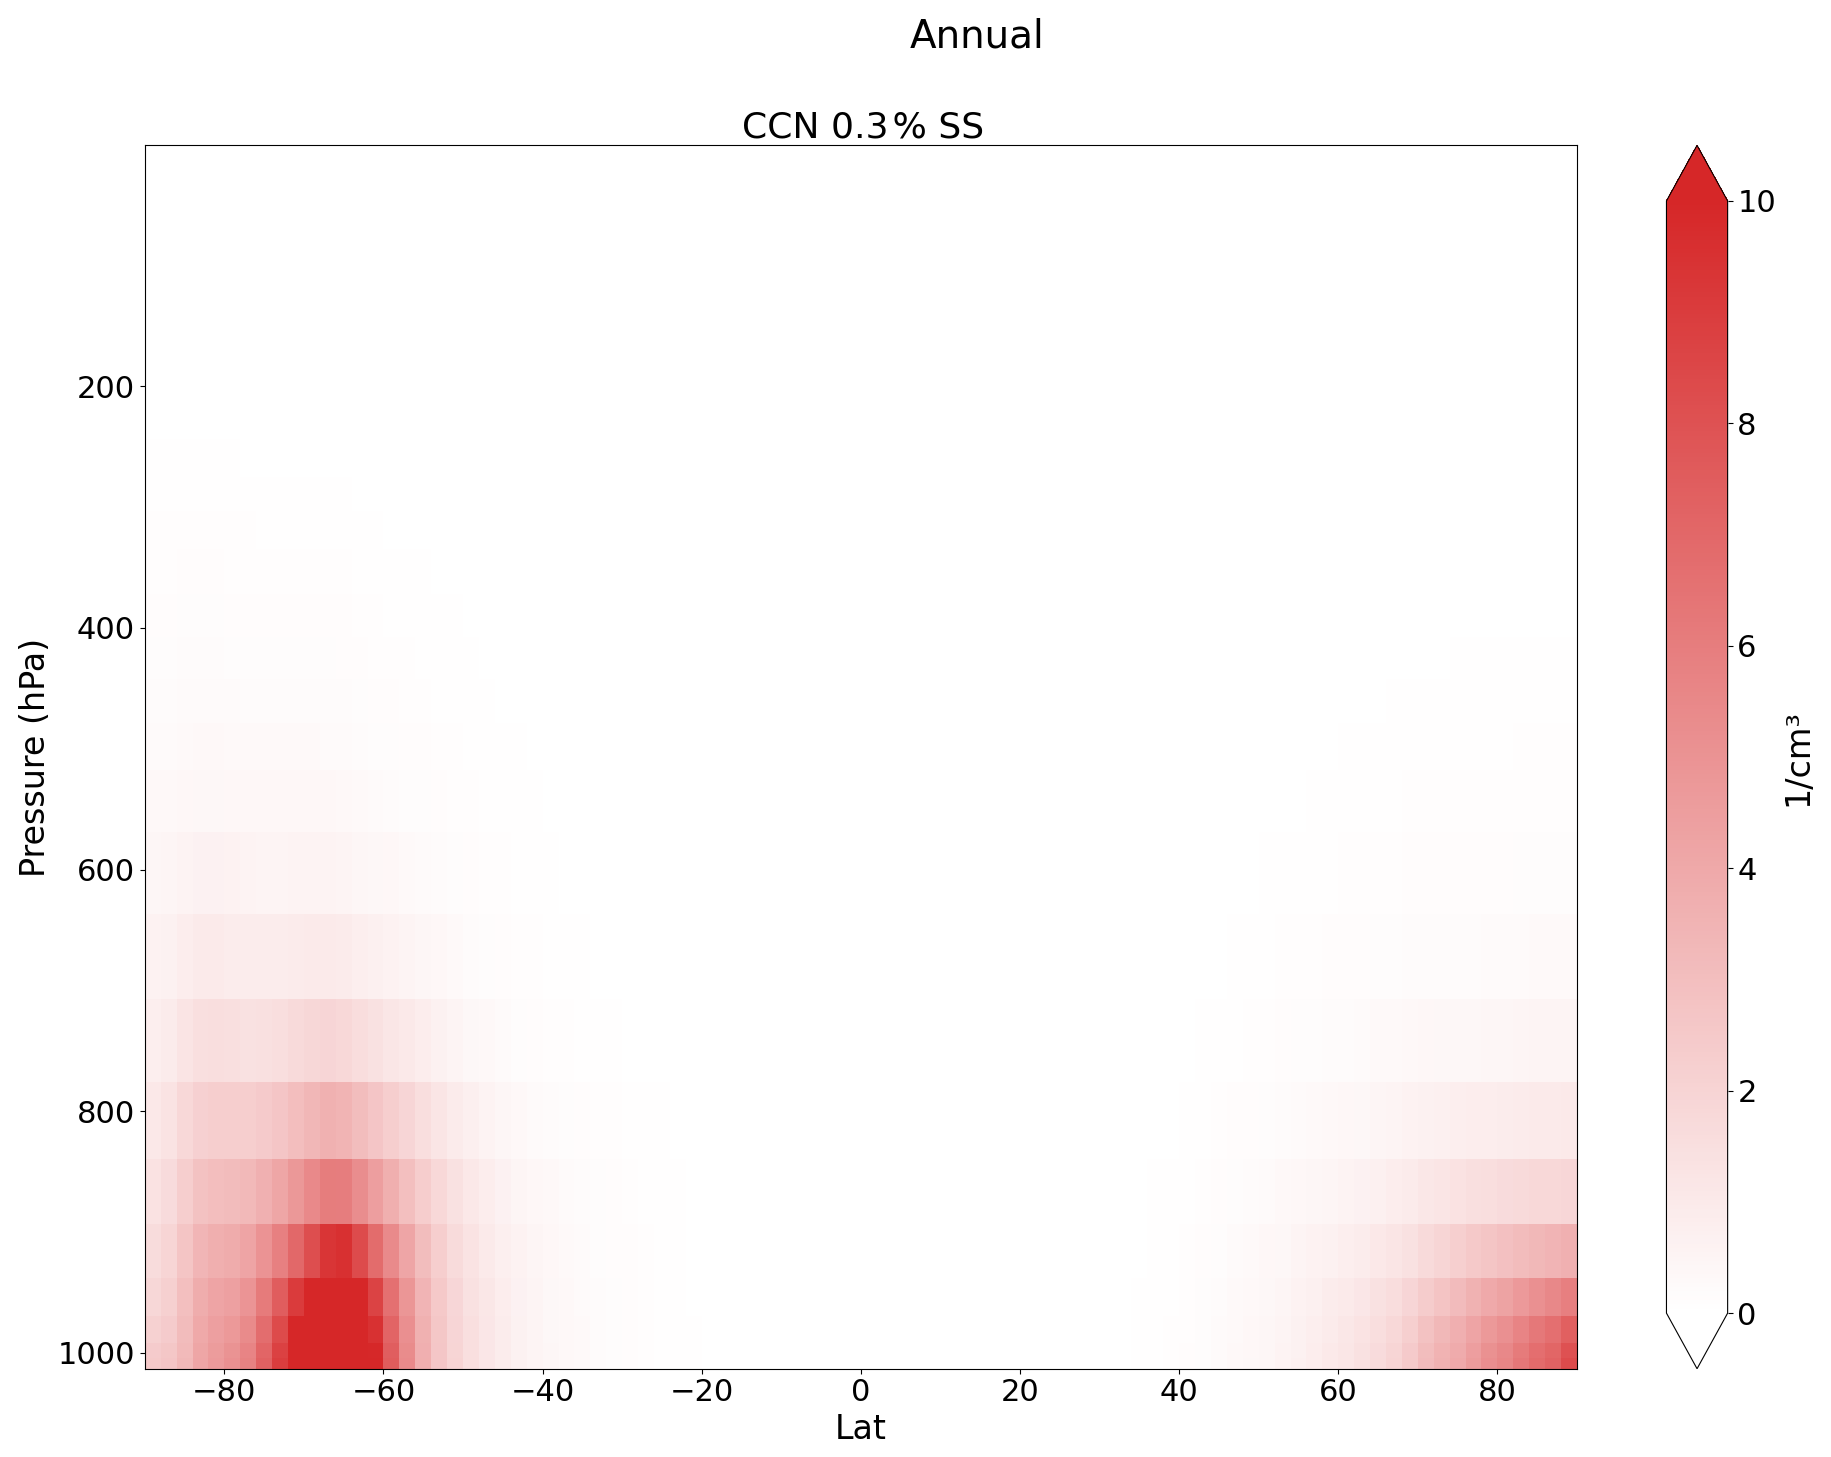
Figure 7Annual zonal mean difference (blowing snow − baseline) in CCN at 0.3 % concentration (cm−3) in the TM5 simulations. All colored regions are statistically significant at level p < 0.05 after applying FDR.
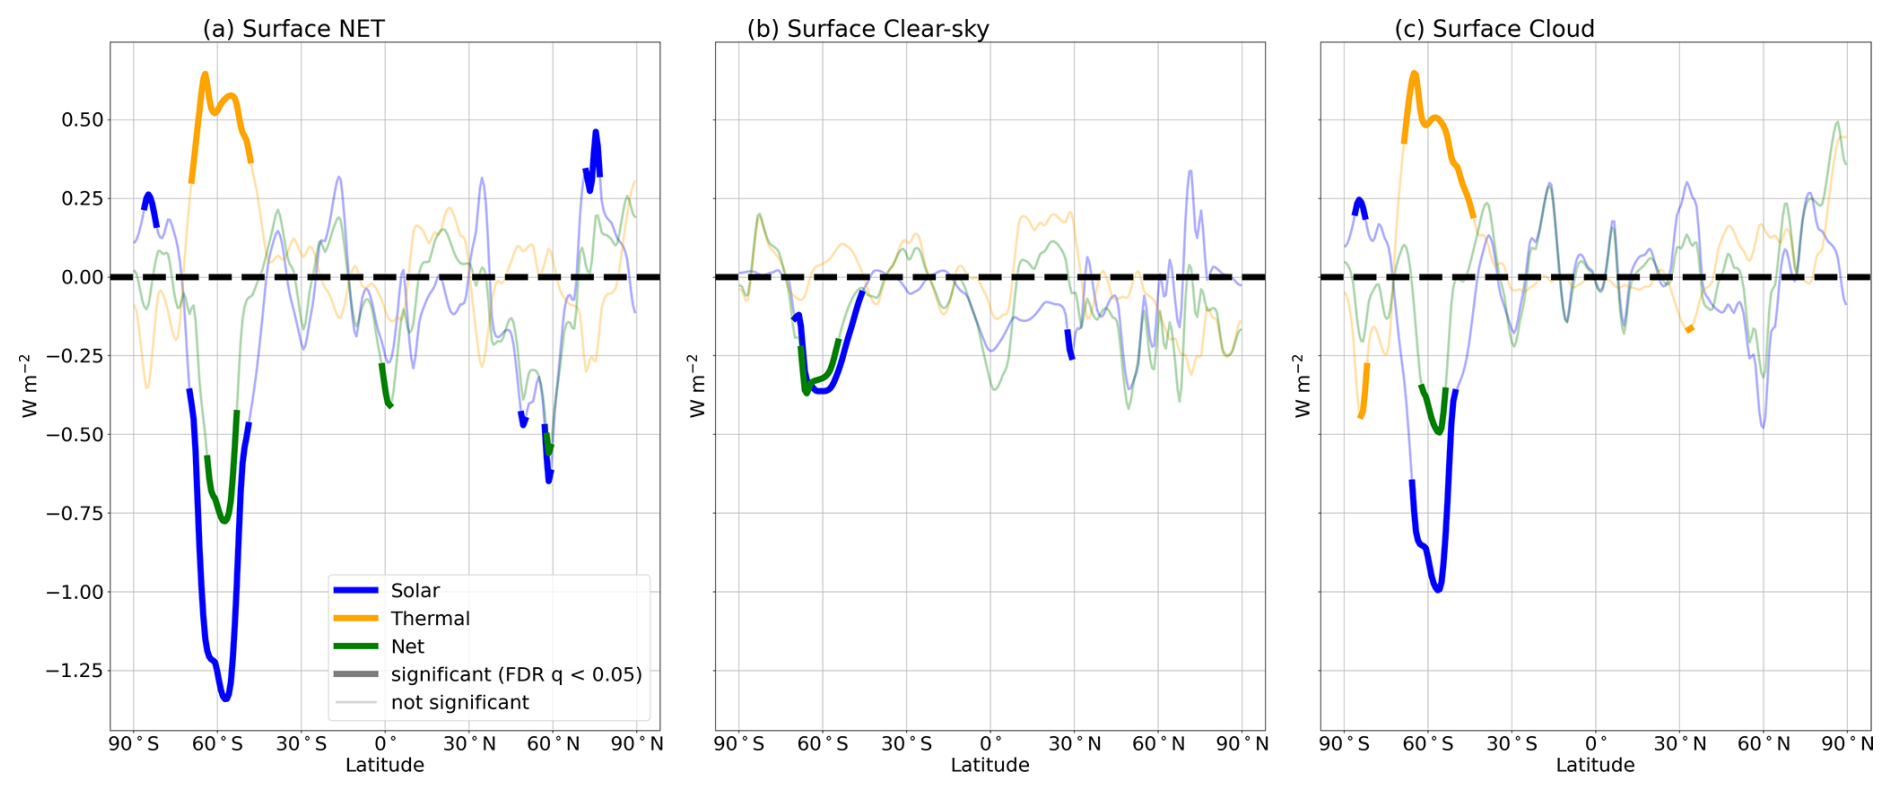
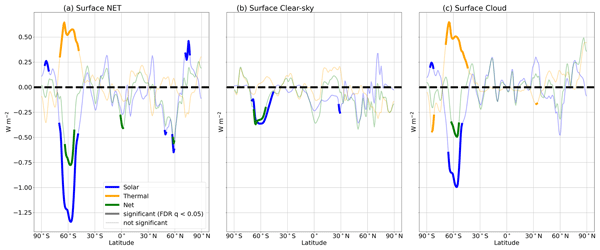
Figure 8Zonal mean annual-mean changes (blowing snow − baseline) in surface radiative fluxes (W m−2) simulated with EC-Earth3, comparing AMIP-type experiments with and without the blowing snow sea-salt aerosol parameterization. (a) All-sky surface radiative fluxes, (b) clear-sky contributions, (c) the curve shows changes in cloud radiative effects. Shows changes in net downward solar (blue), thermal (orange), and net (green) components. Positive values show an increase in radiation reaching the surface due to blowing snow. Statistical significance was assessed using the block-bootstrap.
The inclusion of the blowing-snow parameterization in EC-Earth3 leads to statistically significant changes in the surface radiative fluxes (Fig. 8). Figure 8a shows the annual zonal mean all-sky surface radiative flux response (positive downwards). Over the Arctic (poleward of 60° N), the area-weighted annual zonal mean all-sky net surface radiative flux response is −0.06 W m−2 (−0.27 to +0.17 W m−2, using block bootstrap). During boreal winter (DJF; Fig. S2a), the corresponding area-weighted zonal mean is −0.12 W m−2 (−0.40 to +0.20 W m−2), whereas the boreal summer (JJA; Fig. S3a) response is −0.22 W m−2 (−0.76 to +0.37 W m−2). None of these values are statistically distinguishable from zero and reflects internal variability rather than a forced response, since blowing-snow emissions are absent in that season. Over the Antarctic (poleward of 60° S), the area-weighted zonal mean all-sky net surface radiative flux is −0.25 W m−2 (−0.35 to −0.14 W m−2) in the annual mean, with a stronger austral summer (DJF; Fig. S2a) cooling of −0.65 W m−2 (−0.96 to −0.38 W m−2). Thus, the area-weighted all-sky surface response is negative in both hemispheres, with a considerably stronger cooling over the Antarctic.
Figure 8b shows the clear-sky surface radiative flux response. Relative to the control simulation without blowing-snow SSA, the area-weighted annual zonal mean clear-sky net surface radiative flux over the Arctic (poleward of 60° N) decreases by 0.16 W m−2, with a substantially stronger reduction during boreal winter (DJF; Fig. S2b) of 0.57 W m−2.
Figure 8c shows the cloud radiative effect (CRE), calculated as the difference between the all-sky and clear-sky surface radiative fluxes. Relative to the control simulation, the area-weighted annual zonal mean net CRE over the Arctic (poleward of 60° N) increases by +0.10 W m−2, with a stronger enhancement during boreal winter (DJF; Fig. S2c) of +0.45 W m−2. Over the Antarctic (poleward of 60° S), the annual-mean net CRE decreases by −0.10 W m−2, while the austral summer (DJF; Fig. S2c) response reaches −0.50 W m−2. Thus, cloud changes partly offset the clear-sky cooling over the Arctic but reinforce the cooling over the Antarctic.
The enhanced Arctic cloud longwave radiative effect is consistent with the findings of Gong et al. (2023), who reported a cloudy-sky surface longwave warming of +2.30 W m−2 during November–April north of 70° N due to blowing-snow SSA. The corresponding area-weighted winter (DJF) longwave cloud radiative effect in our simulations is +0.45 W m−2 poleward of 60° N. The smaller magnitude in our simulations likely reflects differences in the assumed SSA production efficiency (NP = 1 in the SI_Base configuration compared with NP = 5 in Gong et al., 2023), as well as differences in the model configuration, meteorological forcing, and the spatial and seasonal averaging. Nevertheless, both Gong et al. (2023) and our AMIP style runs consistently show that blowing-snow SSA enhances wintertime Arctic cloud longwave warming.
4.2 Future response under SSP370 with interactive SST
Figure 9a presents the evolution of AOD due to sea salt added by blowing snow events. The largest increases occur over the Southern Ocean, with substantial enhancements also evident in the Arctic (blue and red lines in Fig. 9a), consistent with elevated sea-salt emissions from blowing snow. In the Southern Ocean, the AOD difference tends to decrease slightly towards the end of the simulation period, consistent with the fact that with a warming climate, sea ice cover is reduced, which acts to reduce the blowing snow emissions. Figure 9b shows the corresponding evolution of surface air temperature. The most notable feature is that the inclusion of SSA from blowing snow induces some regional cooling in the Arctic at the begining of the simulations, by up to 1.5 °C in some years. However, there is a slight warming trend. Figure 9c and d show the time-mean zonal means of AOD and temperature, respectively. There is a statistically significant increase in AOD in both the Arctic and Antarctic. The Arctic cooling is approximately −0.75 °C; however, this is not statistically significant when FDR correction is applied.
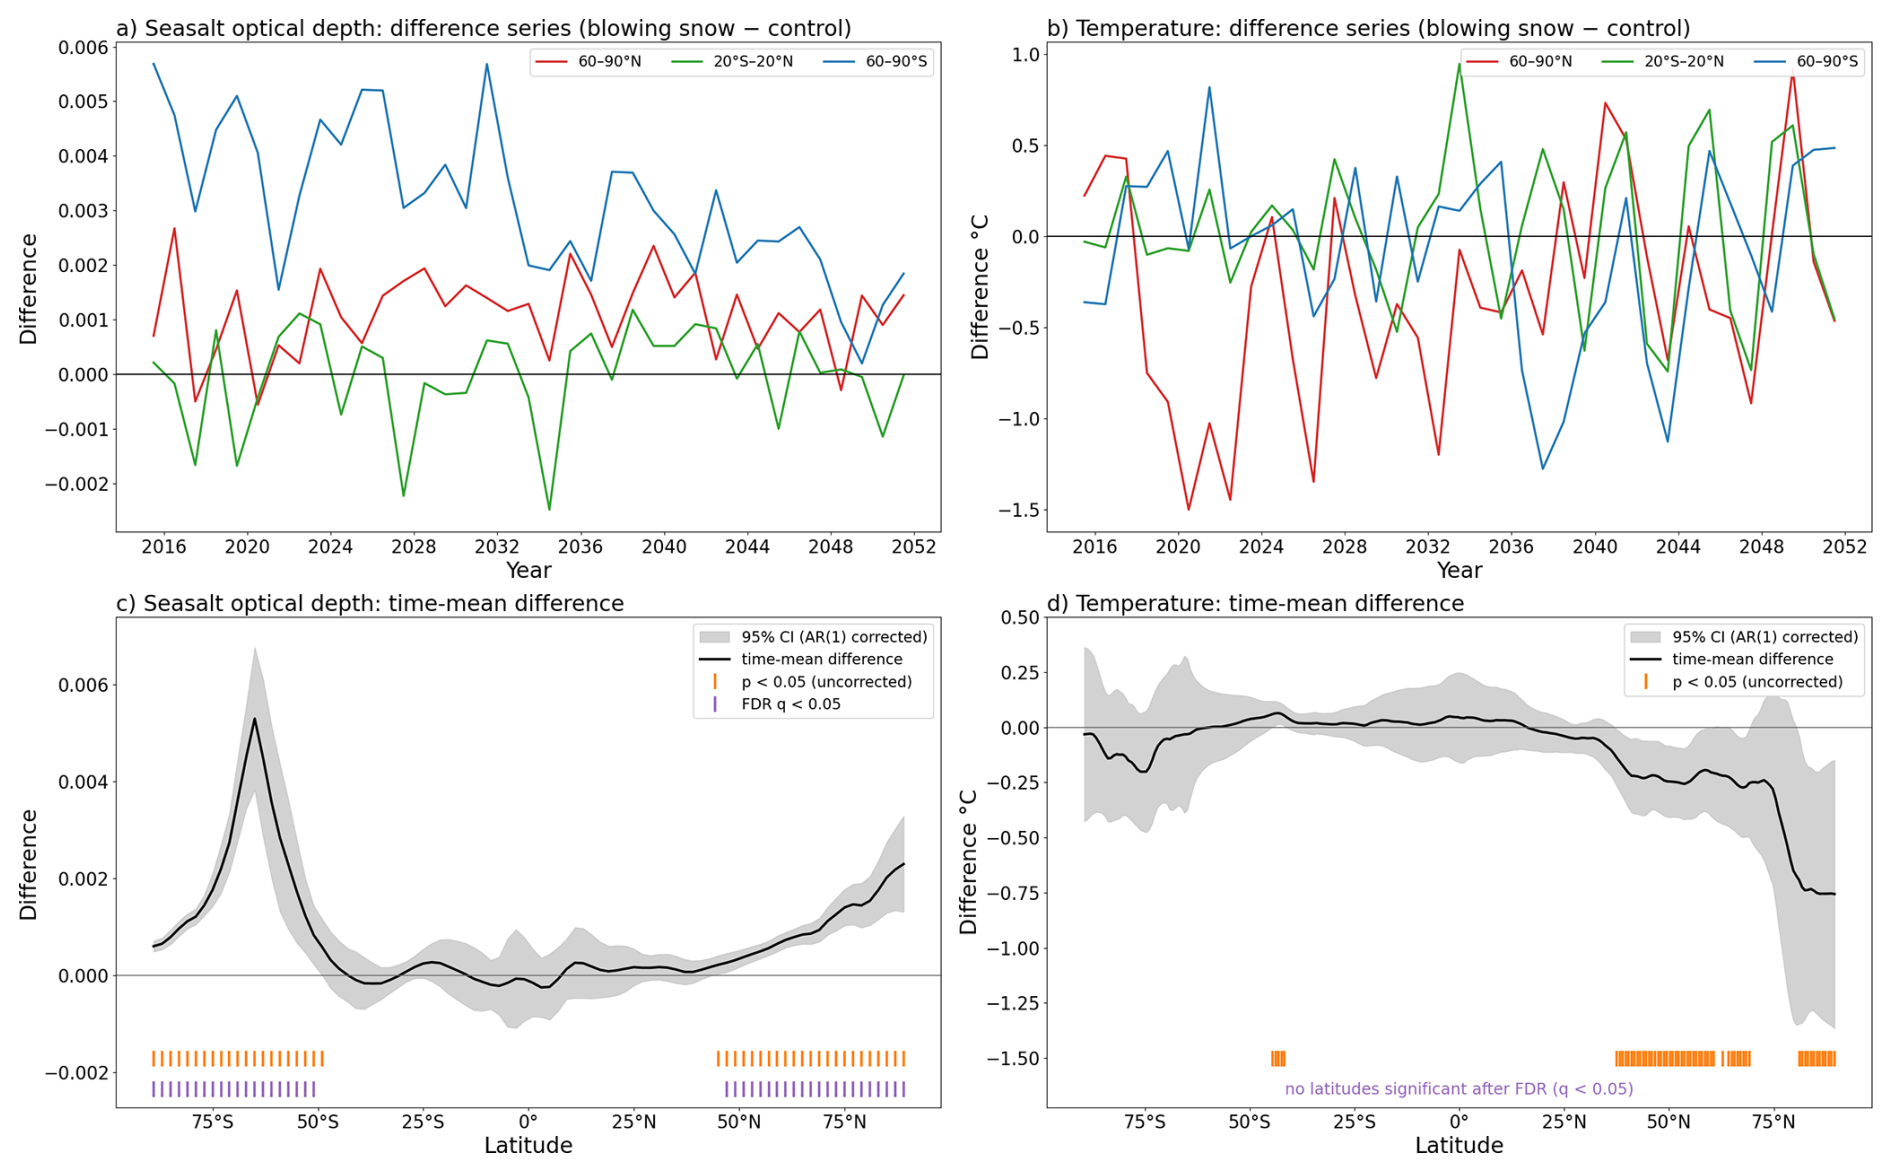
Figure 9Response of aerosol optical depth and near-surface temperature to blowing-snow sea-salt emissions in EC-Earth3 fully coupled transient simulations, 2015–2051. (a, b) Difference series (blowing snow minus control) of the zonal-mean fields, area-weighted over three latitude bands: 60–90° N (red), 20° S–20° N (green), and 60–90° S (blue), for (a) aerosol optical depth at 550 nm and (b) 2 m temperature. (c, d) Time-mean zonal-mean difference as a function of latitude (black), with the 95 % confidence interval of the mean (grey shading) from a two-sided one-sample t test corrected for interannual autocorrelation and applied false discovery rate.
Modeling SSA production from blowing snow is subject to significant uncertainties stemming from observational gaps and intrinsic variability in snow properties and meteorological conditions. The blowing-snow particle size distribution, described here by a two-parameter gamma function with shape parameter α = 2 and mean diameter of 140 µm following Yang et al. (2019), is the parameter to which the SSA number flux is most sensitive (Ranjithkumar et al., 2025). The α value varies between sites and with altitude, and the small-particle end of the distribution (< 46 µm) remains poorly constrained by observations. The choice of the sublimation function also introduces substantial uncertainty: Yang et al. (2019) show that an alternative moisture-diffusion mechanism with N = 10–20 SSA formed per snow particle produces equally good agreement with Weddell Sea observations as our SI_Base implementation (N = 1), while generating substantially different SSA size spectra in the ultrafine and coarse modes.
It is not only the parameterization of blowing snow that introduces uncertainties in estimating sea-salt aerosol (SSA) production and its climate impacts. Different models show both similarities and differences in how their aerosol schemes respond to additional SSA production from blowing snow. In particular, the number concentration of accumulation-mode particles is increased in both the TM5 and GEOS-Chem models; however, a notable discrepancy is that in TM5, adding blowing-snow SSA decreases Aitken-mode particles, whereas in the GEOS-Chem model it increases them. This likely relates to differences in how aerosol modes are represented in the two models (Swanson et al., 2022; Huang et al., 2020). In TM5, blowing-snow SSA enhances accumulation-mode particles but decreases Aitken-mode particles. This may reflect transfer of particles into larger modes through coagulation and condensation, effectively shifting the particle population toward larger sizes. In GEOS-Chem, by contrast, blowing-snow SSA increases Aitken-mode particles, consistent with differences in the representation of aerosol size distributions and microphysical processes (Huang and Jaeglé, 2017).
This study investigates how sea salt aerosols (SSA) generated from blowing snow influence on CCN, cloud radiative effects and the surface radiation budget. We implemented a parameterization of SSA production from blowing snow in the TM5 global chemical transport model and the EC-Earth3 global climate model. Our analysis focuses on the resulting changes in aerosol particle mass, cloud condensation nuclei (CCN) concentrations, and the surface radiation budget.
First, we find that SSA production from blowing snow events is stronger in Antarctic than in Arctic regions. In TM5, blowing snow increases particle number concentrations in the 100–1000 nm size range, while the GEOS-Chem model shows an increase in smaller particle numbers as well. With blowing snow included, TM5 better captures observed peaks in SSA particle number concentrations. In coastal regions, blowing snow enhances the seasonal cycle, with higher particle concentrations during winter and spring.
The inclusion of SSA from blowing snow leads to increased CCN concentrations. Globally, blowing snow generates a negative radiative forcing at the surface due to reduced incoming solar radiation, while modifications to cloud properties contribute to a positive change in the longwave (LW) radiation balance.
The simulated Arctic temperature differences should be interpreted cautiously. Although the EC-Earth3 simulations show a cooling tendency in the Arctic associated with the inclusion of blowing-snow SSA, the present analysis does not establish this difference as a robust forced temperature response. A single realization cannot adequately distinguish the response to the imposed aerosol perturbation from internal climate variability, particularly in the Arctic. We therefore do not interpret the simulated temperature difference as evidence for a robust cooling effect of blowing-snow SSA. Instead, the temperature results provide an indication of the potential climate response within the present model configuration, which should be tested using multi-member transient ensembles.
The inclusion of blowing-snow SSA in global climate models should therefore be considered in the context of uncertainties in the blowing-snow SSA parameterization and the inherent natural variability of the polar climate system. Several priorities emerge for future research. First, multi-member transient simulations are needed to distinguish the forced radiative and temperature responses from internal climate variability, particularly for assessing whether the simulated Arctic temperature differences persist across ensemble members. Second, systematic sensitivity experiments varying the number of SSA particles per sublimating snow particle, the size-distribution shape parameter, and the snow salinity distribution are required to quantify the range of plausible aerosol and radiative responses. Third, evaluation against Antarctic observations remains limited by the scarcity of in-situ aerosol measurements over Southern Ocean sea ice during winter, and expanding such observational datasets would substantially improve model constraint.
By acting as a wintertime source of cloud condensation nuclei, blowing-snow SSA enhances the longwave cloud radiative effect during the polar night. This partially offsets the longwave cooling that occurs under clear-sky conditions over the Arctic. Observations and the sectional GEOS-Chem representation indicate that fine-mode sea salt, including particles below 300 nm in diameter, can make an important contribution to CCN enhancement during blowing-snow events. In contrast, the TM5 M7 scheme does not produce a net increase in Aitken-mode SSA in the present simulations. This represents an important model limitation, as the additional fine-particle contribution identified in observations and GEOS-Chem is not explicitly represented in the simulated TM5 aerosol response. The simulated CCN enhancement may therefore underestimate the contribution from this fine-particle source. However, the overall bias in the simulated CCN and radiative responses cannot be established from the present simulations alone, because uncertainties in the emitted particle number and size distribution, CCN activation, and subsequent cloud response all contribute to the result.
The effects of blowing snow SSA may also be sensitive to future changes in Arctic sea ice. As sea ice retreats, the area and conditions favourable for blowing-snow aerosol production may change, potentially altering the magnitude and spatial distribution of this source. How the contribution of blowing-snow SSA to the polar aerosol and radiative system will evolve under future sea-ice conditions therefore remains an important open question for polar climate projections.
Code used to generate plots are available https://doi.org/10.5281/zenodo.23878577 (Nordling, 2026a).
All simulation data is available at https://doi.org/10.5281/zenodo.19327654 (Nordling, 2026b), Station observations can be downloaded from https://ebas-data.nilu.no/ (last access: 20 March 2026) and Mosaic is from https://www.pangaea.de/?q=project:label:MOSAiC (last access: 20 March 2026).
The supplement related to this article is available online at https://doi.org/10.5194/acp-26-16583-2026-supplement.
KN and PR did the simulation, JM and RM came up with original idea. KN wrote initial draft where all authors commented.
The contact author has declared that none of the authors has any competing interests.
Publisher's note: Copernicus Publications remains neutral with regard to jurisdictional claims made in the text, published maps, institutional affiliations, or any other geographical representation in this paper. The authors bear the ultimate responsibility for providing appropriate place names. Views expressed in the text are those of the authors and do not necessarily reflect the views of the publisher.
We acknowledge CSC – IT Centre for Science, Finland, for providing highperformance computing resources. MOSAiC data used for model evaluation in this manuscript was produced as part of the international Multidisciplinary drifting Observatory for the Study of the arctic Climate.
This research has been supported by the European Union's Horizon 2020 research and innovation programme under grant agreement no. 101003826 through the CRiceS project, European Union's Horizon Europe project CleanCloud (grant no. 101137639), and the Research Council Finland (grant nos. 337552 and 374289).
This paper was edited by Hailong Wang and reviewed by Christos Xenofontos and three anonymous referees.
Acosta Navarro, J. C., Varma, V., Riipinen, I., Seland, Ø., Kirkevåg, A., Struthers, H., Iversen, T., Hansson, H.-C., and Ekman, A. M. L.: Amplification of Arctic warming by past air pollution reductions in Europe, Nat. Geosci., 9, 277–281, https://doi.org/10.1038/ngeo2673, 2016. a
Beck, I., Quéléver, L., Laurila, T., Jokinen, T., and Schmale, J.: Continuous corrected particle number concentration data in 10 sec resolution, measured in the Swiss aerosol container during MOSAiC 2019/2020, PANGAEA [data set], https://doi.org/10.1594/PANGAEA.941886, 2022. a
Bergner, N., Heutte, B., Angot, H., Dada, L., Beck, I., Quéléver, L., Jokinen, T., Laurila, T., and Schmale, J.: Cloud Condensation Nuclei (CCN) concentrations measured in the Swiss container during MOSAiC 2019/2020, PANGAEA [data set], https://doi.org/10.1594/PANGAEA.961131, 2023. a
de Leeuw, G., Andreas, E. L., Anguelova, M. D., Fairall, C. W., Lewis, E. R., O'Dowd, C., Schulz, M., and Schwartz, S. E.: Production flux of sea spray aerosol, Rev. Geophysics, 49, https://doi.org/10.1029/2010RG000349, 2011. a
Döscher, R., Acosta, M., Alessandri, A., Anthoni, P., Arsouze, T., Bergman, T., Bernardello, R., Boussetta, S., Caron, L.-P., Carver, G., Castrillo, M., Catalano, F., Cvijanovic, I., Davini, P., Dekker, E., Doblas-Reyes, F. J., Docquier, D., Echevarria, P., Fladrich, U., Fuentes-Franco, R., Gröger, M., v. Hardenberg, J., Hieronymus, J., Karami, M. P., Keskinen, J.-P., Koenigk, T., Makkonen, R., Massonnet, F., Ménégoz, M., Miller, P. A., Moreno-Chamarro, E., Nieradzik, L., van Noije, T., Nolan, P., O'Donnell, D., Ollinaho, P., van den Oord, G., Ortega, P., Prims, O. T., Ramos, A., Reerink, T., Rousset, C., Ruprich-Robert, Y., Le Sager, P., Schmith, T., Schrödner, R., Serva, F., Sicardi, V., Sloth Madsen, M., Smith, B., Tian, T., Tourigny, E., Uotila, P., Vancoppenolle, M., Wang, S., Wårlind, D., Willén, U., Wyser, K., Yang, S., Yepes-Arbós, X., and Zhang, Q.: The EC-Earth3 Earth system model for the Coupled Model Intercomparison Project 6, Geosci. Model Dev., 15, 2973–3020, https://doi.org/10.5194/gmd-15-2973-2022, 2022. a
Emme, E. J. and Horowitz, H. M.: Impacts of sea ice leads on sea salt aerosols and atmospheric chemistry in the Arctic, Atmos. Chem. Phys., 25, 4531–4545, https://doi.org/10.5194/acp-25-4531-2025, 2025. a
Frey, M. M., Norris, S. J., Brooks, I. M., Anderson, P. S., Nishimura, K., Yang, X., Jones, A. E., Nerentorp Mastromonaco, M. G., Jones, D. H., and Wolff, E. W.: First direct observation of sea salt aerosol production from blowing snow above sea ice, Atmos. Chem. Phys., 20, 2549–2578, https://doi.org/10.5194/acp-20-2549-2020, 2020. a, b, c
Gates, W. L.: AN AMS CONTINUING SERIES: GLOBAL CHANGE–AMIP: The Atmospheric Model Intercomparison Project, B. Am. Meteorol. Soc., 73, 1962–1970, https://doi.org/10.1175/1520-0477(1992)073<1962:ATAMIP>2.0.CO;2, 1992. a
Gong, X., Zhang, J., Croft, B., Yang, X., Frey, M. M., Bergner, N., Chang, R. Y.-W., Creamean, J. M., Kuang, C., Martin, R. V., Ranjithkumar, A., Sedlacek, A. J., Uin, J., Willmes, S., Zawadowicz, M. A., Pierce, J. R., Shupe, M. D., Schmale, J., and Wang, J.: Arctic warming by abundant fine sea salt aerosols from blowing snow, Nat. Geosci., 16, 768–774, https://doi.org/10.1038/s41561-023-01254-8, 2023. a, b, c, d, e, f, g, h, i
Graham, R. M., Hudson, S. R., and Maturilli, M.: Improved Performance of ERA5 in Arctic Gateway Relative to Four Global Atmospheric Reanalyses, Geophys. Res. Lett., 46, 6138–6147, https://doi.org/10.1029/2019GL082781, 2019. a
Huang, J. and Jaeglé, L.: Wintertime enhancements of sea salt aerosol in polar regions consistent with a sea ice source from blowing snow, Atmos. Chem. Phys., 17, 3699–3712, https://doi.org/10.5194/acp-17-3699-2017, 2017. a
Huang, J., Jaeglé, L., and Shah, V.: Using CALIOP to constrain blowing snow emissions of sea salt aerosols over Arctic and Antarctic sea ice, Atmos. Chem. Phys., 18, 16253–16269, https://doi.org/10.5194/acp-18-16253-2018, 2018. a
Huang, J., Jaeglé, L., Chen, Q., Alexander, B., Sherwen, T., Evans, M. J., Theys, N., and Choi, S.: Evaluating the impact of blowing-snow sea salt aerosol on springtime BrO and O3 in the Arctic, Atmos. Chem. Phys., 20, 7335–7358, https://doi.org/10.5194/acp-20-7335-2020, 2020. a
Huijnen, V., Williams, J., van Weele, M., van Noije, T., Krol, M., Dentener, F., Segers, A., Houweling, S., Peters, W., de Laat, J., Boersma, F., Bergamaschi, P., van Velthoven, P., Le Sager, P., Eskes, H., Alkemade, F., Scheele, R., Nédélec, P., and Pätz, H.-W.: The global chemistry transport model TM5: description and evaluation of the tropospheric chemistry version 3.0, Geosci. Model Dev., 3, 445–473, https://doi.org/10.5194/gmd-3-445-2010, 2010. a, b
Krol, M., Houweling, S., Bregman, B., van den Broek, M., Segers, A., van Velthoven, P., Peters, W., Dentener, F., and Bergamaschi, P.: The two-way nested global chemistry-transport zoom model TM5: algorithm and applications, Atmos. Chem. Phys., 5, 417–432, https://doi.org/10.5194/acp-5-417-2005, 2005. a
Lapere, R., Thomas, J. L., Marelle, L., Ekman, A. M. L., Frey, M. M., Lund, M. T., Makkonen, R., Ranjithkumar, A., Salter, M. E., Samset, B. H., Schulz, M., Sogacheva, L., Yang, X., and Zieger, P.: The Representation of Sea Salt Aerosols and Their Role in Polar Climate Within CMIP6, J. Geophys. Res.-Atmos., 128, e2022JD038235, https://doi.org/10.1029/2022JD038235, 2023. a
Lapere, R., Marelle, L., Rampal, P., Brodeau, L., Melsheimer, C., Spreen, G., and Thomas, J. L.: Modeling the contribution of leads to sea spray aerosol in the high Arctic, Atmos. Chem. Phys., 24, 12107–12132, https://doi.org/10.5194/acp-24-12107-2024, 2024. a
Lewinschal, A., Ekman, A. M. L., Hansson, H.-C., Sand, M., Berntsen, T. K., and Langner, J.: Local and remote temperature response of regional SO2 emissions, Atmos. Chem. Phys., 19, 2385–2403, https://doi.org/10.5194/acp-19-2385-2019, 2019. a
Li, L. and Pomeroy, J. W.: Probability of occurrence of blowing snow, J. Geophys. Res.-Atmos., 102, 21955–21964, https://doi.org/10.1029/97JD01522, 1997. a
Mauritsen, T., Sedlar, J., Tjernström, M., Leck, C., Martin, M., Shupe, M., Sjogren, S., Sierau, B., Persson, P. O. G., Brooks, I. M., and Swietlicki, E.: An Arctic CCN-limited cloud-aerosol regime, Atmos. Chem. Phys., 11, 165–173, https://doi.org/10.5194/acp-11-165-2011, 2011. a
May, N. W., Quinn, P. K., McNamara, S. M., and Pratt, K. A.: Multiyear study of the dependence of sea salt aerosol on wind speed and sea ice conditions in the coastal Arctic, J. Geophys. Res.-Atmos., 121, 9208–9219, https://doi.org/10.1002/2016JD025273, 2016. a
Merikanto, J., Nordling, K., Räisänen, P., Räisänen, J., O'Donnell, D., Partanen, A.-I., and Korhonen, H.: How Asian aerosols impact regional surface temperatures across the globe, Atmos. Chem. Phys., 21, 5865–5881, https://doi.org/10.5194/acp-21-5865-2021, 2021. a
Naakka, T., Köhler, D., Nordling, K., Räisänen, P., Lund, M. T., Makkonen, R., Merikanto, J., Samset, B. H., Sinclair, V. A., Thomas, J. L., and Ekman, A. M. L.: Polar winter climate change: strong local effects from sea ice loss, widespread consequences from warming seas, Atmos. Chem. Phys., 25, 8127–8145, https://doi.org/10.5194/acp-25-8127-2025, 2025. a
Nordling, K.: kallenordling/blowing_from_snow: Codes for making figurse for blowinsnow paper, Version release, Zenodo [computer software], https://doi.org/10.5281/zenodo.23878577, 2026a.access: 20 March 2026 a
Nordling, K.: Sea Salt Aerosols from Blowing Snow: Contributions to Radiative Forcing, Zenodo [data set], https://doi.org/10.5281/zenodo.19327654, 2026b. a
Norwegian Institute for Air Research: EBAS Database, https://ebas.nilu.no/ (last access: 21 February 2025), 2024. a
Pithan, F. and Mauritsen, T.: Arctic amplification dominated by temperature feedbacks in contemporary climate models, Nat. Geosci., 7, 181–184, https://doi.org/10.1038/ngeo2071, 2014. a
Ranjithkumar, A., Duncan, E., Yang, X., Partridge, D. G., Lachlan-Cope, T., Gong, X., Nishimura, K., and Frey, M. M.: Direct observation of Arctic Sea salt aerosol production from blowing snow and modeling over a changing sea ice environment, Elementa: Science of the Anthropocene, 13, 00006, https://doi.org/10.1525/elementa.2024.00006, 2025. a, b, c, d, e, f, g
Rantanen, M., Karpechko, A. Y., Lipponen, A., Nordling, K., Hyvärinen, O., Ruosteenoja, K., Vihma, T., and Laaksonen, A.: The Arctic has warmed nearly four times faster than the globe since 1979, Communications Earth & Environment, 3, 168, https://doi.org/10.1038/s43247-022-00498-3, 2022. a
Sand, M., Samset, B. H., Balkanski, Y., Bauer, S., Bellouin, N., Berntsen, T. K., Bian, H., Chin, M., Diehl, T., Easter, R., Ghan, S. J., Iversen, T., Kirkevåg, A., Lamarque, J.-F., Lin, G., Liu, X., Luo, G., Myhre, G., Noije, T. V., Penner, J. E., Schulz, M., Seland, Ø., Skeie, R. B., Stier, P., Takemura, T., Tsigaridis, K., Yu, F., Zhang, K., and Zhang, H.: Aerosols at the poles: an AeroCom Phase II multi-model evaluation, Atmos. Chem. Phys., 17, 12197–12218, https://doi.org/10.5194/acp-17-12197-2017, 2017. a
Schmale, J., Zieger, P., and Ekman, A. M. L.: Aerosols in current and future Arctic climate, Nat. Clim. Change, 11, 95–105, https://doi.org/10.1038/s41558-020-00969-5, 2021. a, b
Serreze, M. C. and Barry, R. G.: Processes and impacts of Arctic amplification: A research synthesis, Global Planet. Change, 77, 85–96, https://doi.org/10.1016/j.gloplacha.2011.03.004, 2011. a
Shupe, M. D., Rex, M., Dethloff, K., Damm, E., Fong, A. A., Gradinger, R., Heuzé, C., Loose, B., Makarov, A., Maslowski, W., Nicolaus, M., Perovich, D., Rabe, B., Rinke, A., Sokolov, V., and Sommerfeld, A.: Arctic Report Card 2020: The MOSAiC Expedition: A Year Drifting with the Arctic Sea Ice, NOAA Arctic Report Card 2020, NOAA IR, https://doi.org/10.25923/9g3v-xh92, 2020. a
Swanson, W. F., Holmes, C. D., Simpson, W. R., Confer, K., Marelle, L., Thomas, J. L., Jaeglé, L., Alexander, B., Zhai, S., Chen, Q., Wang, X., and Sherwen, T.: Comparison of model and ground observations finds snowpack and blowing snow aerosols both contribute to Arctic tropospheric reactive bromine, Atmos. Chem. Phys., 22, 14467–14488, https://doi.org/10.5194/acp-22-14467-2022, 2022. a
Thornhill, G., Collins, W., Olivié, D., Skeie, R. B., Archibald, A., Bauer, S., Checa-Garcia, R., Fiedler, S., Folberth, G., Gjermundsen, A., Horowitz, L., Lamarque, J.-F., Michou, M., Mulcahy, J., Nabat, P., Naik, V., O'Connor, F. M., Paulot, F., Schulz, M., Scott, C. E., Séférian, R., Smith, C., Takemura, T., Tilmes, S., Tsigaridis, K., and Weber, J.: Climate-driven chemistry and aerosol feedbacks in CMIP6 Earth system models, Atmos. Chem. Phys., 21, 1105–1126, https://doi.org/10.5194/acp-21-1105-2021, 2021. a
van Noije, T., Bergman, T., Le Sager, P., O'Donnell, D., Makkonen, R., Gonçalves-Ageitos, M., Döscher, R., Fladrich, U., von Hardenberg, J., Keskinen, J.-P., Korhonen, H., Laakso, A., Myriokefalitakis, S., Ollinaho, P., Pérez García-Pando, C., Reerink, T., Schrödner, R., Wyser, K., and Yang, S.: EC-Earth3-AerChem: a global climate model with interactive aerosols and atmospheric chemistry participating in CMIP6 , Geosci. Model Dev., 14, 5637–5668, https://doi.org/10.5194/gmd-14-5637-2021, 2021. a
van Noije, T. P. C., Le Sager, P., Segers, A. J., van Velthoven, P. F. J., Krol, M. C., Hazeleger, W., Williams, A. G., and Chambers, S. D.: Simulation of tropospheric chemistry and aerosols with the climate model EC-Earth, Geosci. Model Dev., 7, 2435–2475, https://doi.org/10.5194/gmd-7-2435-2014, 2014. a
Venugopal, A. U., Bhatti, Y. A., Morgenstern, O., Williams, J., Edkins, N., Hardacre, C., Jones, A., and Revell, L. E.: Constraining the Uncertainty Associated With Sea Salt Aerosol Parameterizations in Global Models Using Nudged UKESM1-AMIP Simulations, J. Geophys. Res.-Atmos., 130, e2024JD041643, https://doi.org/10.1029/2024JD041643, 2025. a
Vignati, E., Wilson, J., and Stier, P.: M7: An efficient size-resolved aerosol microphysics module for large-scale aerosol transport models, J. Geophys. Res.-Atmos., 109, https://doi.org/10.1029/2003JD004485, 2004. a
Wendisch, M., Macke, A., Ehrlich, A., Lüpkes, C., Mech, M., Chechin, D., Dethloff, K., Velasco, C. B., Bozem, H., Brückner, M., Clemen, H.-C., Crewell, S., Donth, T., Dupuy, R., Ebell, K., Egerer, U., Engelmann, R., Engler, C., Eppers, O., Gehrmann, M., Gong, X., Gottschalk, M., Gourbeyre, C., Griesche, H., Hartmann, J., Hartmann, M., Heinold, B., Herber, A., Herrmann, H., Heygster, G., Hoor, P., Jafariserajehlou, S., Jäkel, E., Järvinen, E., Jourdan, O., Kästner, U., Kecorius, S., Knudsen, E. M., Köllner, F., Kretzschmar, J., Lelli, L., Leroy, D., Maturilli, M., Mei, L., Mertes, S., Mioche, G., Neuber, R., Nicolaus, M., Nomokonova, T., Notholt, J., Palm, M., van Pinxteren, M., Quaas, J., Richter, P., Ruiz-Donoso, E., Schäfer, M., Schmieder, K., Schnaiter, M., Schneider, J., Schwarzenböck, A., Seifert, P., Shupe, M. D., Siebert, H., Spreen, G., Stapf, J., Stratmann, F., Vogl, T., Welti, A., Wex, H., Wiedensohler, A., Zanatta, M., and Zeppenfeld, S.: The Arctic Cloud Puzzle: Using ACLOUD/PASCAL Multiplatform Observations to Unravel the Role of Clouds and Aerosol Particles in Arctic Amplification, B. Am. Meteorol. Soc., 100, 841–871, https://doi.org/10.1175/BAMS-D-18-0072.1, 2019. a
Williams, J. E., Boersma, K. F., Le Sager, P., and Verstraeten, W. W.: The high-resolution version of TM5-MP for optimized satellite retrievals: description and validation, Geosci. Model Dev., 10, 721–750, https://doi.org/10.5194/gmd-10-721-2017, 2017. a
Yang, X., Pyle, J. A., and Cox, R. A.: Sea salt aerosol production and bromine release: Role of snow on sea ice, Geophys. Res. Lett., 35, https://doi.org/10.1029/2008GL034536, 2008. a
Yang, X., Frey, M. M., Rhodes, R. H., Norris, S. J., Brooks, I. M., Anderson, P. S., Nishimura, K., Jones, A. E., and Wolff, E. W.: Sea salt aerosol production via sublimating wind-blown saline snow particles over sea ice: parameterizations and relevant microphysical mechanisms, Atmos. Chem. Phys., 19, 8407–8424, https://doi.org/10.5194/acp-19-8407-2019, 2019. a, b, c, d, e, f, g, h, i, j, k, l