
the Creative Commons Attribution 4.0 License.
the Creative Commons Attribution 4.0 License.
 | 17 Nov 2026
Addressing systematic underestimation in a global ship emission inventory through improved fleet representation and fuel compliance characterization
Weiwei Zhang
Zhaofeng Lv
Wen Yi
Tingkun He
Bensheng Xiao
Feng Sun
Qiang Zhang

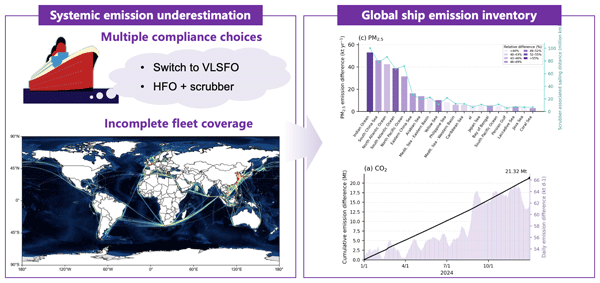
As a sector with high energy demand, long-lived assets, and limited near-term low-carbon alternatives, global shipping is considered difficult to decarbonize and is subject to stringent emission controls. To evaluate emission control effects and conduct rapid response air quality simulations, accurate and timely ship emission inventories are indispensable. However, existing inventories face challenges from incomplete fleet representation and large uncertainties in PM2.5 emissions after the global sulfur regulation. Here, we updated the Ship Emission Inventory Model to SEIMv2.3 by introducing an improved representation of post-2020 fuel sulfur compliance pathways and enabling near-real-time emission calculation within 3 d of AIS data acquisition. Ship activity and technical database are updated daily instead of yearly to obtain a more complete and rapid description of the global ship fleet. Fleet's multiple choices to comply with fuel sulfur regulation were considered, including switching to very low sulfur fuel and utilizing scrubbers to keep consuming heavy fuel oil. The daily expansion of ship technical database uncovered 8 % and 6.2 % of the total gross tonnage of active bulk carrier and container fleets, unveiling up to 5.4 % of global ship CO2 emissions. The resulting emission discrepancies gradually accumulated over 2024, indicating that delayed fleet information updates remain an important source of uncertainty in ship emission estimates. Meanwhile, assuming that all ships switch to low-sulfur fuels after 2020 would lead to underestimation of PM2.5 and BC emissions by approximately 43 % and 15 %. Although South China Ocean had the most absolute underestimation, the Indian Ocean had the highest underestimated portion, reaching 56 % and 15 % of its total PM2.5 and BC emissions.
- Article
(6818 KB) - Full-text XML
-
Supplement
(2730 KB) - BibTeX
- EndNote


As a sector characterized by high energy demand, long-lived assets, and limited near-term low-carbon alternatives, global shipping is considered hard to abate (Sharmina et al., 2021). From 1970 to 2021, global shipping experienced a threefold increase in cargo turnover and a 1.7-fold increase in carbon dioxide (CO2) emissions (Wang et al., 2025). Growing ship emissions have brought adverse impacts on the air quality and public health of coastal regions (Liu et al., 2016, 2019; Anenberg et al., 2019; Zhang et al., 2021). In 2018, global shipping was responsible for 2.9 % of anthropogenic CO2 emissions, 11 % of sulfur oxides (SOx), and 15 % of nitrogen oxides (NOx) (IMO, 2020). Under a business-as-usual scenario without additional mitigation measures, international shipping was projected to account for approximately 17 % of global CO2 emissions by 2050 (Cames et al., 2015), which reflects both the future development of international shipping emissions and the emission trajectories of other sectors. To restrain ship emissions, international and regional regulations have been implemented. Previous research showed that after the International Maritime Organization (IMO) low sulfur regulation came into force in 2020, ship SO2 emissions dropped by 81.3 % globally (Yi et al., 2025) and by 71 % in Southern China (Feng et al., 2023). The regulation has a comparatively small effect on CO2 emissions. For ships equipped with scrubbers to comply with the regulation, additional energy is required, commonly resulting in an approximately 2 % fuel-consumption penalty (Lunde Hermansson et al., 2024). Studies evaluating regional sulfur regulations have demonstrated their effectiveness in reducing ship-related SO2 emissions. The sulfur emission control measures implemented in the Marmara Sea and Turkish Straits since 2006 reduced SO2 concentrations by 90 % in Istanbul (Viana et al., 2015) while China's Domestic Emission Control Area (DECA) policy, implemented progressively during 2016–2019, achieved an emission reduction by 33 % within 200 nautical miles away from the Chinese mainland's territorial sea baseline (Wang et al., 2021).
Accurate and timely emission inventories are key to evaluating air quality and climate impacts (Im et al., 2018; Luo et al., 2024; Liu et al., 2024; Goldsworthy et al., 2019; Huang et al., 2020; Li et al., 2024). While long-term policy assessments often rely on annual inventories, high-temporal-resolution inventories are particularly important for pollution-episode analysis, source attribution, and air-quality modelling, where short-term variations in source activity need to be represented explicitly (Gu et al., 2026; Jia et al., 2022; Sokhi et al., 2022). Bottom-up models using Automatic Identification System (AIS) have substantially improved the spatial and temporal representation of shipping emissions by combining ship activity with ship-specific technical characteristics, engine-load calculations, and emission factors. However, converting ship activity into emissions requires information beyond vessel movements, including fuel consumption, technical specifications, and voyage-specific compliance pathways, which are not directly provided by AIS records. Therefore, existing models such as STEAM, MariTEAM, and MoSES generally rely on vessel characteristics, fleet statistics, regulatory assumptions, or predefined scenarios to estimate fuel use and emission-control practices (Schwarzkopf et al., 2021; Jalkanen et al., 2009; Kramel et al., 2021). These assumptions introduce two major uncertainties in global ship emission inventories: incomplete representation of the evolving fleet and insufficient characterization of fuel compliance pathways. In particular, distinguishing Heavy Fuel Oil (HFO) use with scrubbers from low-sulfur fuel switching remains challenging at the global ship level, despite their substantially different implications for PM2.5, and BC emissions. For CO2 and pollutants such as NOx, incomplete fleet information can also lead to biased emission estimates through missing ship activity and fuel consumption penalty.
Among these uncertainties, the representation of sulfur compliance pathways became particularly important after the implementation of the IMO 2020 sulfur regulation. From 1 January 2020, the global sulfur limit for ship fuel oil was reduced from 3.50 % to 0.50 %, while a stricter limit of 0.10 % applies within emission control areas (ECAs). Ships can comply with this regulation either by switching to low-sulfur fuels such as Very Low Sulfur Fuel oil (VLSFO) and Marine Gas Oil (MGO) or by continuing to use HFO with scrubber systems. However, globally complete ship-level information on scrubber installation is rarely available, limiting the ability of emission inventories to explicitly represent HFO-with-scrubber pathways. Some previous shipping emission inventories assumed that ships previously using HFO switched to VLSFO or MGO after 2020 without explicitly considering scrubber-based compliance (Yi et al., 2024, 2025).
Nevertheless, multi-source evidence indicates that HFO-based compliance pathways remained important after 2020 (IMO, 2024; Lunde Hermansson et al., 2024). IMO fuel statistics showed that the broad HFO category still accounted for approximately 65 % of ship fuel consumption after 2020 (IMO, 2024), while regional bunker data indicated that HFO remained an important fuel category in major maritime hubs, with reported shares ranging from 21.4 % to 37.2 % in Singapore and Rotterdam. Moreover, a STEAM-based assessment (Lunde Hermansson et al., 2024; Jalkanen et al., 2021) identified more than 800 scrubber-equipped ships operating in the Baltic Sea after 2020, demonstrating the continued use of scrubbers in regional fleets. However, these statistics provide indirect evidence of HFO consumption or regional scrubber presence rather than globally representative ship-level compliance information. This limitation highlights the potential uncertainty introduced by neglecting HFO-with-scrubber pathways in post-2020 estimates of PM2.5 and BC emissions.
Another challenge facing ship emission inventories is the timely incorporation of newly identified ships into ship technical databases. In this study, newly identified ships include both newly delivered ships and existing ships absent from the ship technical database used for bottom-up emission estimation. Such databases are typically updated less frequently than AIS-based activity data (Yi et al., 2025), creating a temporal mismatch between fleet information and observed ship activity. Newly identified ships often lack key technical specifications and are represented by proxy values, which may affect engine power estimation, load-factor correction, and emission factor assignment. Previous studies have extracted ship parameters from AIS data (Wang et al., 2021; Huang et al., 2020; Schwarzkopf et al., 2021) and supplement missing parameters with machine learning methods (Yang et al., 2022, 2024; Huang et al., 2024; Raman et al., 2025). However, an integrated framework that simultaneously updates ship activity and technical information with quality control remains limited.
Here, we developed SEIMv2.3, a dynamically updated ship emission inventory model based on Shipping Emission Inventory Model (SEIM) (Liu et al., 2016; Wang et al., 2021; Yi et al., 2025). SEIMv2.3 improves the representation of ship activity, fleet composition, and sulfur compliance pathways through three methodological developments. First, AIS activity records are processed at a daily temporal resolution with an enhanced preprocessing framework to support near-real-time emission updates. Second, newly identified ships are dynamically detected from AIS records using ship identifiers such as MMSI and IMO number, and incorporated into the ship technical database. Missing technical specifications are then reconstructed using available static AIS attributes, including ship type, length, width, and draft, together with machine-learning models. Third, the fleet low sulfur compliance choice module (FLSCCM) is introduced to reconstruct post-2020 sulfur compliance pathways by integrating ship-level scrubber installation records with constrained gap filling. Using SEIMv2.3, we calculated global ship emissions from 2022 to 2024 at daily resolution and quantified the effects of improved fleet representation and sulfur compliance pathway characterization on emission estimates.
SEIM was first established by Liu et al. (2016) based on AIS data and ship-specific technical information to simulate ship emissions at the individual AIS-signal level. This signal-level approach enables ship-by-ship reconstruction of ship activity and emissions, suitable for the establishment of multi-scale shipping emission inventories with applications in regions (Liu et al., 2016; Wang et al., 2021; Zhang et al., 2025b) and ports (Fu et al., 2017). The specific formula used in this study to calculate ship emissions are identical to those reported by Yi et al. (2025) and provided in the Supplement. Emission factors for different ship types and fuels are listed in Tables S2–S4, primarily based on the IMO Fourth Greenhouse Gas Study (IMO, 2020) and U.S. Environmental Protection Agency reports (Starcrest Consulting Group, 2022). Engine-load effects were explicitly considered by estimating the main-engine load for each AIS record and applying pollutant-specific low-load adjustment factors shown in Fig. S4 when the load was below 20 %.
Similar to other AIS-based bottom-up models introduced above (e.g., STEAM, MariTEAM, and MoSES), SEIM reconstructs ship activity at high spatial and temporal resolution but cannot directly observe fuel consumption or compliance technologies used during each voyage. Therefore, emission estimation depends on both accurate fleet representation and appropriate characterization of fuel compliance pathways. To improve the timeliness and completeness of these key inputs, SEIMv2.3 introduces three methodological improvements: (1) Daily AIS-based activity processing. AIS records are processed at a daily temporal resolution rather than annual aggregation, enabling ship activity reconstruction and emission estimation with a short delay and providing the technical basis for near-real-time emission updates. Detailed methods are provided in Sect. 2.1. (2) Daily identification of previously missing ships. In SEIMv2.2, ship activity records were matched with our Ship Technical Specifications Database (STSD), which may become incomplete as new ships enter operation or previously unrecorded ships become active. SEIMv2.3 uses daily AIS activity records to identify previously missing ships and update the STSD, with detailed procedures described in Sect. 2.2. (3) Fleet low sulfur compliance choice module (FLSCCM). SEIMv2.3 incorporates multiple sulfur compliance pathways, including low-sulfur fuel switching and HFO use with scrubbers, to better represent post-2020 sulfur compliance choices. Detailed methods are provided in Sect. 2.3.
2.1 From daily AIS to near-real-time emissions
This study established a daily AIS pre-processing framework specifically designed to handle anomalies in daily signals. AIS data consist of both dynamic data and static data. Dynamic AIS offers ship activity information encompassing timestamps and latitude-longitude coordinates, and are subject to multi-stage cleaning to establish a well-cleaned daily ship activity database. Static AIS contains ship identifiers, including MMSI and, where available, IMO numbers, together with technical information such as ship type, length, width, and draft, and is used for the daily identification and characterization of newly observed ships. In this study, we collected global daily AIS data from 2022 to 2024, comprising approximately 113 million dynamic signals and 14 million static signals per day. The daily AIS processing resulted in approximately 45 billion processed signals annually. AIS data contain anomalies and inaccuracies due to various reasons. Therefore, rigorous pre-processing was necessary especially for daily near-real-time emission calculation.

Figure 1Anomalies and transmission delays of daily AIS signals. Timestamp of dynamic and static AIS signals received on Day n (a) and their spatial distribution in coastal areas along China (e) and western Europe (f). Example of daily signal count anomaly during 21–29 February 2024, Day 52 to Day 60 of 2024 (b). Spatial distribution of AIS signals received on Day 53 of 2024 in coastal areas along China (c) and western Europe (d). Spatial distribution of AIS signals of Day 53 after pre-processing in coastal areas along China (g) and western Europe (h).
For the daily AIS dataset, firstly, to ensure the stability of daily input data, the model reads AIS signals from the 3 d preceding and following the target date when calculating daily emissions. Unlike annual AIS preprocessing, the daily framework explicitly accounts for transmission delays because daily AIS data received on a given day may contain signals with timestamps from both the current and previous days. As demonstrated in Fig. 1a, the total AIS signals received in 1 d generally comprised of about 90 % of signals with timestamp of the current day and 10 % of signals with timestamp of the previous day. Secondly, three-stage cleaning was performed to remove low-quality signals, temporal anomaly, and spatial anomaly. Figure 1c and d present the spatial anomaly which leads to the abnormal AIS signal surge during 21 and 29 February 2024 in Fig. 1b, when the signal count exceeded 200×106 d−1. If unprocessed, the abnormal surge would result in up to 2 times of emission overestimation. The cleaning criteria in this study is the same as the work by Yi et al. (2025). Signals with invalid geographic coordinates, excessively long-time intervals, or ground speed exceeding 50 kn were discarded in this process. Thirdly, linear interpolation and route restoration was employed to reconstruct the actual sailing trajectory of ships. In the previous step, we removed signals located on land. Additionally, although some signals are not located over land themselves, the connecting lines with adjacent signals may cross over land. In this step, we reconstructed the sailing trajectory between the starting and ending points of those signals based on a global shipping route network using the Dijkstra shortest path algorithm (Wang et al., 2021; Aulinger et al., 2016; Johansson et al., 2017; Cherkassky et al., 1996). Interpolation was performed segment by segment at fixed time intervals, and emissions are calculated accordingly. Besides, as shown in Fig. 1e and f, the delayed signals contributed to a considerable part of the entire shipping routes, indicating the necessity of 3 d AIS processing to the reconstruction of actual sailing trajectories. This preprocessing window is required for trajectory reconstruction from delayed AIS transmissions, while SEIMv2.3 enables near-real-time emission updates approximately 3 d after AIS data acquisition. The overall effect of pre-processing framework on global AIS signals from 2022 to 2024 is illustrated in Fig. S1. Figure 1g and h display the improvement in coastal regions along China and western Europe on 22 February 2024. The framework managed to reduce inland signals by 46 % and 51 % in the two regions, where spatial anomalies were removed while signals on inland rivers were kept.
2.2 Daily identification and characterization of previously missing ships
The STSD in SEIM contains ship-specific attributes, including ship type, deadweight tonnage (DWT), and main engine power. In previous versions of SEIM, the STSD was updated approximately every 2 years, potentially missing vessels newly appearing in the daily AIS activity database (Yi et al., 2025). SEIM v2.3 therefore introduces a daily update framework that identifies AIS-observed ships absent from the STSD, supplements their technical characteristics, and incorporates them into daily emission calculations.

Figure 2The composition of ship types (a), deadweight tonnage (b), and main engine power (c) for daily newly detected ships. The ship categories shown here represent the dominant categories identified from processed AIS static information for newly identified ships and do not correspond directly to the 14 emission categories used in SEIMv2.3.
First, we identified newly detected ships by filtering IMO number that were not yet included in STSD from daily static AIS signals. Before utilizing static AIS to update the STSD, two major challenges need to be solved: (1) the classification of cargo ships in static AIS is overly broad, which does not align with the 14-type ship classification required by SEIMv2.3. While static AIS assign values 70–79 uniformly to cargo ships, SEIMv2.3 further subdivides cargo ships into auto carriers, bulk carriers, container ships, and general cargo ships, each with distinct emission factors. (2) Static AIS lacks main engine power and DWT information, which is also critical for matching emission factors. Without additional parameter completion, these missing specifications would have to be represented by proxy values, which may introduce considerable uncertainties in engine power estimation and subsequent emission factor assignment. Through extensive literature review, we selected machine learning algorithms and feature sets that have demonstrated strong fitting performance to supplement and refine these missing or coarse parameters (Baek et al., 2024; Huang et al., 2024; Raman et al., 2025; Yang et al., 2024). The final models, features, and hyperparameters used are listed in Table S1. Cargo ships were further subdivided into auto carriers, bulk carriers, container ships, and general cargo ships based on geometric features such as ship length and width using the XGBoost, achieving an accuracy of 0.82 shown in Fig. S2. XGBoost and Random Forest were applied to predict DWT (r2=0.92, RMSE = 4.9 kt, MAE = 1.9 kt) and main engine power (r2=0.80, RMSE = 1.7 kW, MAE = 0.9 kW), significantly improving data completeness. Ultimately, the reconstructed technical information of newly identified ships was merged with the original STSD, forming a dynamically updated STSD as shown in Fig. 2.
2.3 Fleet low sulfur compliance choice module (FLSCCM)
In response to the IMO low sulfur regulation, ships primarily have three compliance options (Chu Van et al., 2019; Deng et al., 2021; Ji and El-Halwagi, 2020), with different implications for fuel consumption, SO2 emissions, PM2.5, BC and, to a lesser extent, CO2 emissions: (1) Switching to low-sulfur fuels (e.g., MGO, VLSFO). This straightforward option directly lowers fuel sulfur content, resulting in sharp reduction in SO2, PM2.5 and BC emissions. As shown in Tables S2 and S4, the emission factors for HFO (2.43 % sulfur) are 0.051 gSO2 g−1 fuel and 1.39 gPM2.5 kWh−1 for the main engine, whereas for VLSFO (0.5 % sulfur) they are 0.0098 gSO2 g−1 fuel and 0.31 gPM2.5 kWh−1. Assuming other operational factors remain constant, this switch reduces SO2 by 81 % and reduces PM2.5 and BC emissions by approximately 77 %. (2) Continuing to use cheap HFO with a scrubber. Scrubbers remove SO2from exhaust but are less effective against PM2.5. Studies reported the PM2.5 removal efficiency ranging only from about 16 % to 37 % and no significant BC removal efficiency for ship scrubbers (Yang et al., 2021; Kuittinen et al., 2024). Therefore, compared to option (1), this option yields similar SO2 emissions but results in relatively higher PM2.5 and BC emissions. (3) Using alternative fuels such as LNG, which can substantially reduce emissions but currently represent a limited share of global marine fuel consumption. Therefore, FLSCCM focuses on the allocation of the two dominant sulfur compliance pathways: low-sulfur fuel switching and HFO with scrubbers.
Because globally complete ship-level compliance information is unavailable, FLSCCM reconstructs fleet sulfur compliance pathways by combining ship-level scrubber installation records with constrained statistical gap filling. All ships were assumed to comply with the IMO 2020 sulfur limit. For ships with Clarksons installation records, scrubber availability was determined from the reported installation year; retrofits were therefore included from the year of installation onward. These records indicate scrubber installation availability rather than voyage-level operation. In this study, ships with effective installations were assumed to follow the HFO-with-scrubber pathway during the corresponding period. For ships without available scrubber installation records, FLSCCM applied structurally constrained gap filling based on characteristics of the observed scrubber fleet. Because scrubber installations were concentrated among larger ships and major cargo ship categories, gap filling was restricted to bulk carriers, container ships, oil tankers, and chemical tankers. Unmatched ships were eligible only if their DWT was at least 50 000 t and, where reliable information was available, they were built after 2006. These size and age thresholds were empirical screening criteria, not assumptions that older ships could not have been retrofitted. Accordingly, ships not identified by FLSCCM as following the HFO-with-scrubber pathway were assumed to achieve compliance through the use of low-sulfur fuel. For ships identified or assigned as following the HFO-with-scrubber pathway, SEIMv2.3 applied a baseline PM2.5 removal efficiency of 37 % and a BC removal efficiency of 30 % in the emission calculation. Uncertainties associated with scrubber assignment criteria and removal efficiencies are further evaluated through sensitivity analyses in the Supplement and the Discussion section.
To isolate the contributions of daily STSD updates and FLSCCM, we conducted three numerical experiments for the 2024 inventory: (i) SEIMv2.2, without either update; (ii) SEIM with the updated STSD but without FLSCCM; and (iii) the complete SEIMv2.3 framework. The difference between (ii) and (i) was used to estimate the contribution of daily STSD updates, while the difference between (iii) and (ii) was used to estimate the contribution of FLSCCM.
The reconstructed fleet-level fuel structure was evaluated against IMO fuel consumption statistics for the post-2020 period (Fig. 3). SEIMv2.3 reproduced the major transition from HFO-dominated fuel use before IMO 2020 to increased adoption of low-sulfur fuels and HFO-with-scrubber pathways afterward. The remaining differences between modelled and IMO-reported fuel shares are likely attributable to differences in fuel classification, fleet coverage, and the explicit separation of HFO-with-scrubber pathways in SEIMv2.3. The close agreement in HFO consumption, particularly in 2019, suggests that the higher total fuel consumption in SEIM is not a uniform scaling effect but is more likely associated with its broader fleet coverage and differences in fuel composition relative to the IMO DCS reporting fleet. Therefore, IMO statistics were used as an independent fleet-level reference to assess the plausibility of reconstructed compliance pathways rather than as a direct constraint for model calibration.


Figure 4The composition of ship number and total weight of the active global fleet by SEIMv2.3 and SEIMv2.2. Panels (a–c) show fleet number by ship type, build period, and weight bin; panels (d–f) show the corresponding distributions of total fleet weight. The inner ring distinguishes ships contained in the original STSD (light grey) from ships newly identified through the dynamic STSD updating procedure (dark grey). The outer coloured ring shows the category composition of the original STSD fleet, and the linked stacked bar shows the composition of newly identified vessels using the same colour scheme.
3.1 Enhanced description of global shipping fleet
The daily identification and characterization mechanism enables the model to effectively capture newly-detected ship activity. Daily AIS processing identified approximately 20 previously unrepresented ships on an average processing day, which were subsequently incorporated into the STSD. As shown in Fig. 2. Bulk carriers constitute the primary category among these newly added ships, accounting for approximately 57 % of the total. Regarding DWT range, newly identified vessels were predominantly distributed within the 10 000–100 000 DWT range, accounting for about 59 % of newly identified vessels by number. Meanwhile, main engine power was largely concentrated in the 1000–10 000 kW range, which included approximately 58 % of newly identified vessels by number. The daily identification and characterization mechanism also led to a continuous expansion of our STSD, as illustrated in Fig. S5. Over the study period, the number of vessels in STSD increased from 418 000 to 440 000 when counted by unique MMSI, corresponding to a 5.3 % increase. When counted by unique IMO number, which provides a more stable identifier for oceangoing vessels, the number increased from 105 000 to 126 000, corresponding to a 20.0 % increase. The difference between the two counts reflects their different coverage and identifier characteristics: MMSI provides broader coverage of AIS-observed vessels, whereas IMO numbers are permanent identifiers but are not available for all vessels.
The expansion of the STSD have enabled SEIMv2.3 to provide a more comprehensive characterization of the global active fleet. In 2024, SEIMv2.3 captured activities from 132 000 ships, including 68 000 IMO-identified ships. Compared with SEIMv2.2, the number of active bulk carriers, container ships, general cargo ships, and fishing ships increased by 22.9 %, 6.8 %, 8.0 %, and 14.6 %, respectively. Bulk carriers and container ships showed the largest increases in fleet tonnage, with gross tonnage increases of 8.0 % and 6.2 %, respectively. Newly identified ships were primarily constructed between 2000 and 2010, indicating that the update mainly supplemented missing information for existing vessels (Fig. 4). DWT distribution reveals that while the ship number increase in SEIMv2.3 was dominated by ship whose DWT was less than 10 kn, the growth in total fleet tonnage was driven predominantly by ship DWT between 60 to 80 kn. The newly identified ships accounted for approximately 10.3 % of all active ships annually and contributed about 11.3 % of the total annual sailing distance in 2024. Their activities exhibited the highest signal density in major maritime hubs, notably in East Asia and Europe, with their activity widely distributed across global shipping routes, as shown in Fig. 5. This geographical pattern reflects the higher rate of new ship deployment in these key shipbuilding and operational regions, such as China, South Korea, and the major ports of Northern Europe.

Figure 5Annual spatial distribution of newly detected ship signals.
3.2 Annual ship emissions and comparison with other studies
Following our previous global ship emission estimates for 2016–2021 (Yi et al., 2025), SEIMv2.3 extends the inventory to 2022–2024. To improve the representation of emission changes before and after the IMO 2020 sulfur regulation, historical emissions from 2019 to 2021 were recalculated using the revised SEIMv2.3 framework. Figure 6 shows the global ship emissions of nine atmospheric pollutants and greenhouse gases (GHG), including CO2, CH4, and N2O, calculated using different models from 2019 to 2024. For comparison, available international shipping emission estimates from the Emissions Database for Global Atmospheric Research (EDGAR) and the Community Emissions Data System (CEDS) were used as independent global references to evaluate the temporal consistency of SEIMv2.3. For EDGAR, international shipping emissions were derived using the Ship Traffic Emission Assessment Model (STEAM3) framework (Crippa et al., 2024). Comparisons were limited to pollutants available across inventories. PM2.5 was excluded from the CEDS comparison because corresponding estimates were unavailable.
From 2019 to 2020, ship SO2 emissions dropped sharply from 12 215 to 2212 kn, consistent with the results from EDGAR and CEDS. PM2.5 emissions showed a substantial but less pronounced reduction than SO2 because the implementation of sulfur regulations affected not only fuel sulfur content but also the selection of compliance pathways. In SEIMv2.3, global ship PM2.5 emissions decreased by 60.2 %, from 1725 kn in 2019 to 686 kn in 2020, and remained relatively stable at 703–768 kn during 2021–2024. In comparison, SEIMv2.2, which did not represent HFO-with-scrubber pathways after 2020, estimated only 393 kn PM2.5 emissions in 2020, corresponding to a 42.7 % underestimation relative to SEIMv2.3. BC emissions exhibited a comparable but weaker response. SEIMv2.3 estimated that global ship BC emissions decreased by 30.3 %, from 98 kn in 2019 to 68.3 kn in 2020, followed by relatively stable emissions between 67.2 and 70.6 kn during 2021–2024. In contrast, SEIMv2.2 estimated 58 kn BC emissions in 2020, corresponding to a 15.1 % underestimation relative to SEIMv2.3 and indicating the importance of representing HFO-with-scrubber pathways for BC emission estimation. For other atmospheric pollutants and GHGs, the improvement mainly results from daily identification and characterization of newly observed ships. Comparison between SEIMv2.3 and SEIMv2.2 shows that the absence of daily ship technical database updates would underestimate CO2 emissions by 5.4 % in 2023 and 2.6 % in 2024. The 2024 attribution experiments further showed that daily STSD updates accounted for most changes in CO2 and gaseous-pollutant estimates, whereas FLSCCM had the larger effect on PM2.5 and BC (Fig. 6). Although the proportion of underestimated emissions relative to total shipping emissions was relatively low, the inclusion of newly identified ships enabled us to capture emission changes caused by fluctuations in maritime trade and provided a more complete basis for monitoring shipping decarbonization and evaluating mitigation policies.
Comparison with external inventories also revealed pollutant-specific differences. EDGAR (STEAM-based) generally reported higher PM2.5 and BC emissions than SEIMv2.3, while differences in CO2, CH4, and N2O were smaller or followed different patterns. Because STEAM3 also accounts for exhaust-gas cleaning systems, the higher PM2.5 and BC estimates cannot be attributed simply to omission of scrubbers (Johansson et al., 2017). Instead, differences in fleet representation, fuel-compliance pathways, emission factors, and scrubber removal efficiencies may contribute to the observed discrepancies. For GHGs, CO2 is mainly affected by vessel activity and fuel consumption, whereas CH4 and N2O are more sensitive to LNG representation, methane slip, and fuel- or engine-specific emission factors (Heikkilä et al., 2024; Yi et al., 2025).
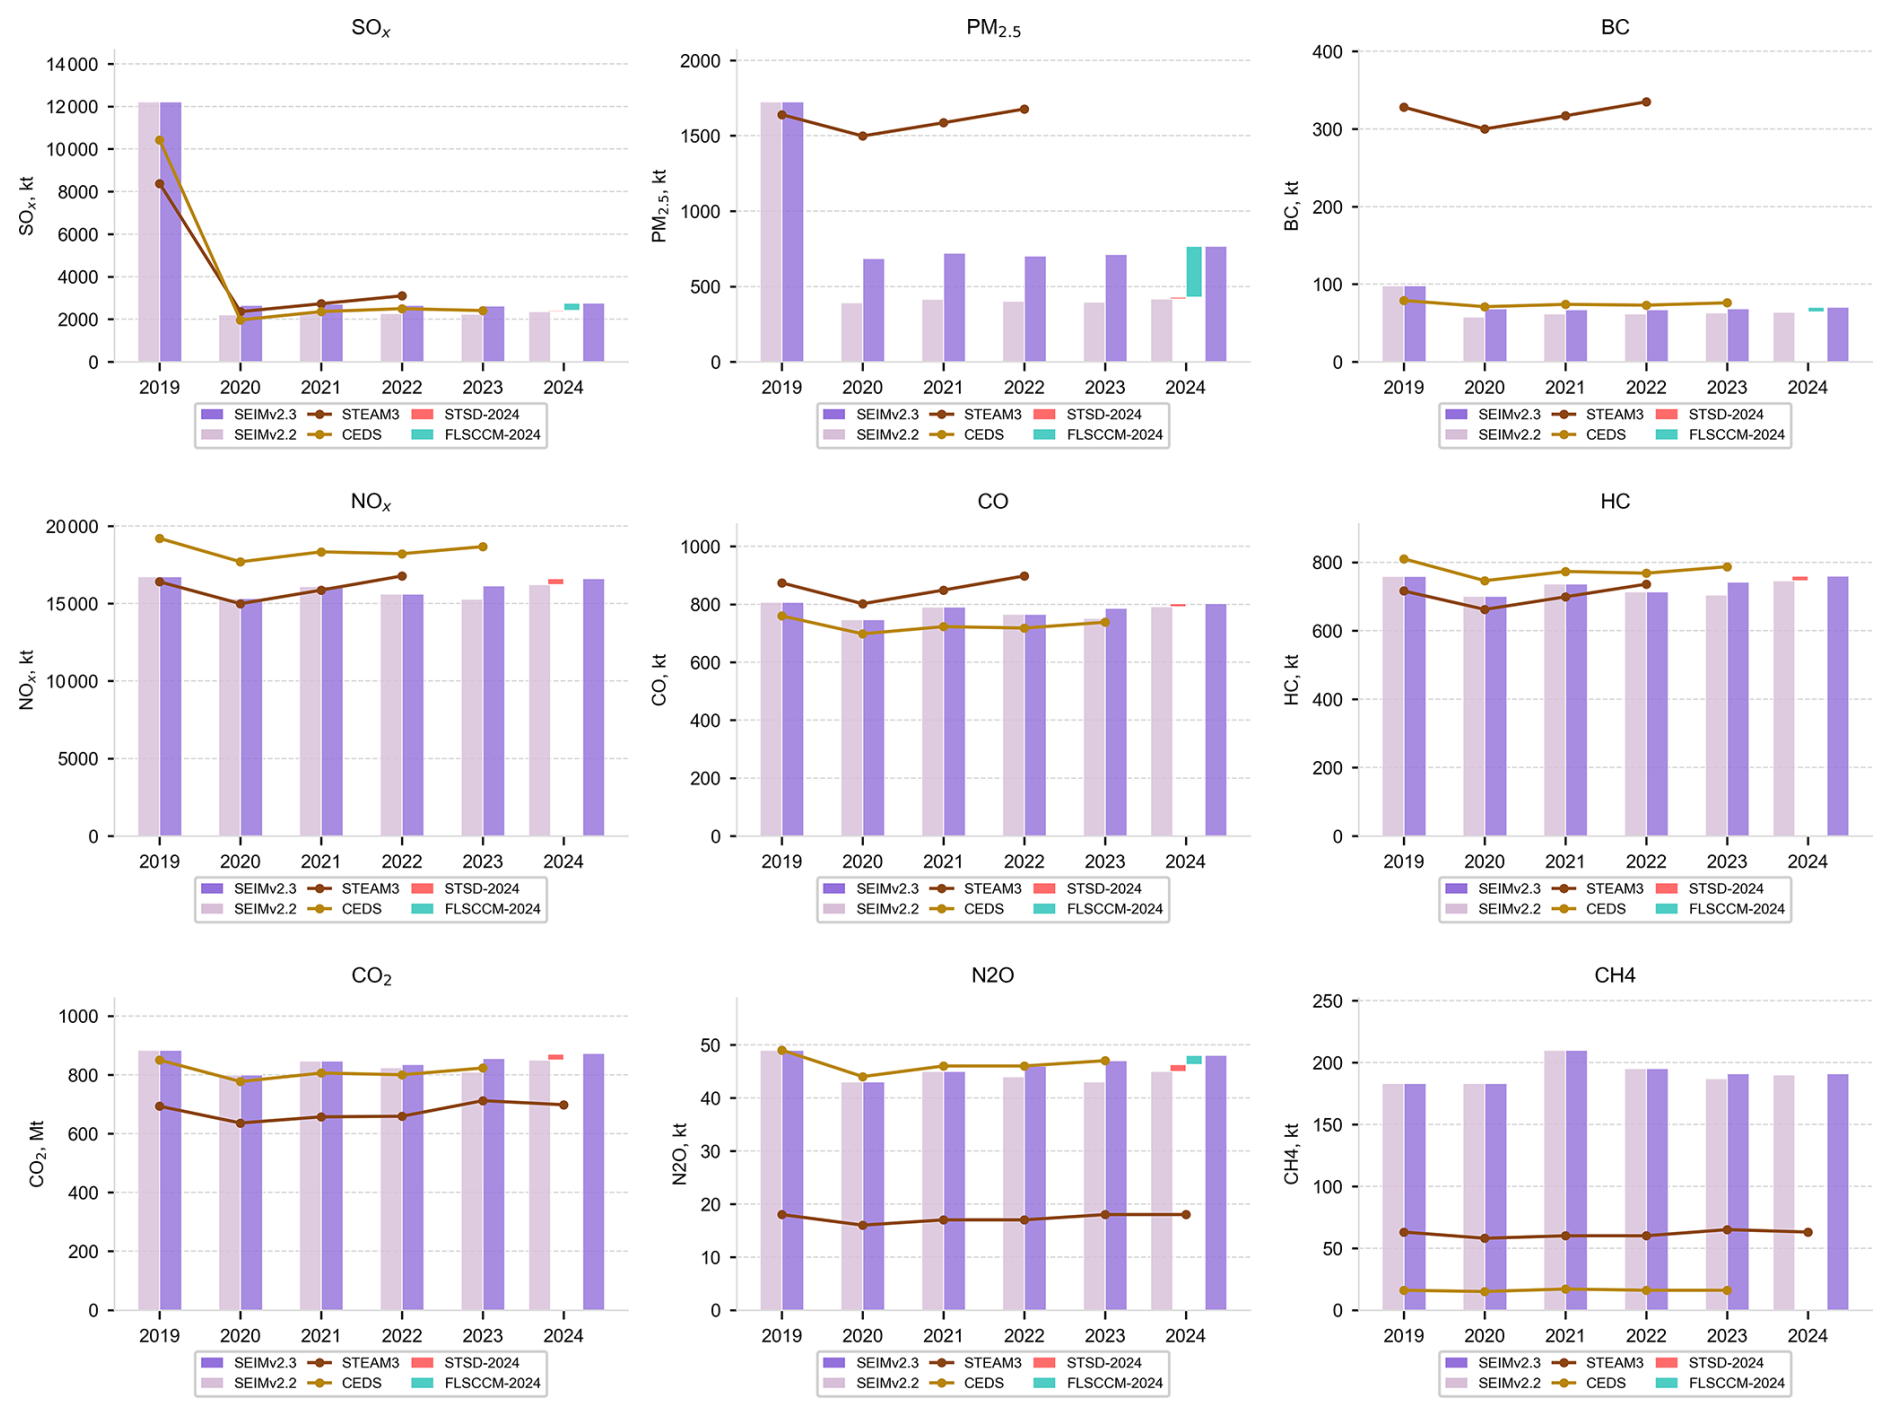
Figure 6Comparison of annual global ship emissions results from SEIMv2.3, SEIMv2.2, and other emission inventories from 2019 to 2024. SEIMv2.2 results were sourced from Yi et al. (2025). SEIMv2.3 represents the method presented in this paper. EDGAR (STEAM-based) represents international-shipping emission estimates from EDGAR (Crippa, 2025), whose spatial and temporal allocation of shipping emissions draws on STEAM-based activity information. CEDS represents the emission results from Community Earth atmospheric Data Systems, sourced from Hoesly et al. (2025). STSD-2024 and FLSCCM-2024 denote configurations incorporating updated fleet information and reconstructed sulfur compliance pathways, respectively.
3.3 Spatiotemporal heterogeneity in ship emission underestimation
Emission underestimation showed distinct spatial patterns among pollutants (Fig. 7). The major discrepancies were concentrated in the South China Sea, North Atlantic Ocean, Indian Ocean, and North Pacific Ocean. Figure 7 compares regional emission discrepancies with sailing distances of newly identified ships and scrubber-equipped ships to identify potential sources of underestimation. For CO2 and NOx, the largest discrepancies were primarily associated with incomplete fleet representation. The South China Sea contributed the largest shares of global CO2 and NOx underestimation, accounting for 14.2 % and 14.4 %, respectively, followed by the Indian Ocean and North Atlantic Ocean. These regions also exhibited relatively high STSD-added vessel sailing distances, indicating the important contribution of incomplete fleet representation to CO2 and NOx discrepancies. In contrast, PM2.5 and BC underestimations were more strongly associated with incomplete representation of sulfur compliance pathways. The Indian Ocean showed the largest contributions to global PM2.5 and BC underestimation, accounting for 15.1 % and 14.7 %, respectively. These regions also showed substantial scrubber-associated sailing distances, indicating that incomplete representation of HFO-with-scrubber pathways was a major contributor to particulate emission discrepancies.
The relative impact of underestimation on individual regions was further evaluated by normalizing emission differences against regional total emissions. For CO2, the relative differences were relatively small across major shipping regions, reaching 3.0 % in the South China Sea, 2.9 % in the Indian Ocean, and 2.8 % in the South Atlantic Ocean. Similarly, NOx underestimation ratios ranged from 2.7 % to 4.6 %, with the highest value observed in the South China Sea. In contrast, particulate emissions exhibited substantially larger relative differences. The relative underestimation of PM2.5 reached 56.1 % in the Indian Ocean, 53.7 % in the South Atlantic Ocean, and 48.5 % in the South China Sea. For BC, the corresponding values were 14.5 %, 12.8 %, and 10.8 %, respectively. These results highlight the stronger influence of compliance pathway assumptions than fleet completeness on regional PM2.5 and BC estimates.
The differences between SEIMv2.3 and SEIMv2.2 accumulated throughout 2024 due to differences in fleet representation and sulfur compliance pathway characterization. The daily emission discrepancies remained consistently positive throughout 2024. As shown in Fig. 8, the daily emission discrepancies between SEIMv2.3 and SEIMv2.2 increased from 52.8 kn CO2 d−1, 1.52 kn NOx d−1, 0.93 kn PM2.5 d−1, and 0.017 kn BC d−1 at the beginning of 2024 to 62.1 kn CO2 d−1, 1.79 kn NOx d−1, 0.95 kn PM2.5 d−1, and 0.018 kn BC d−1 at the end of 2024. The corresponding cumulative emission discrepancies reached 21.3 Mt CO2, 615.8 kn NOx, 350.3 kn PM2.5, and 6.5 kn BC by the end of 2024.

Figure 7Regional differences in ship PM2.5, BC, CO2, and NOx emissions between SEIMv2.3 and SEIMv2.2 in 2024.

Figure 8Temporal accumulation of emission discrepancies between SEIMv2.3 and SEIMv2.2 during 2024.
Overall, our study establishes a dynamically updated framework for global ship emission estimation and reveals substantial emission underestimation associated with incomplete fleet representation and simplified sulfur compliance assumptions in previous SEIM configurations. Near-real-time emission inventories enable tracking of short-term emission changes and provide important inputs for air-quality modelling, forecasting, and emission-control assessment (Xu et al., 2023). The underestimation addressed in this study may affect assessments of the environmental and health impacts of global shipping. Underestimated PM2.5 and SO2 emissions may bias estimates of shipping-induced aerosol–cloud interactions and radiative forcing (Chen et al., 2017; Goldsworthy et al., 2019; Yuan et al., 2024; Zhang et al., 2025a). Such underestimation may also affect assessments of atmospheric deposition impacts in coastal and marine environments (Shi et al., 2023). The additional contribution to population exposure and health burdens may be limited, because the additional emissions identified in this study were mainly in open-ocean regions, distant from populated coastal areas.
The continued importance of HFO-with-scrubber pathways after IMO 2020 is also supported by independent evidence from IMO fuel consumption statistics, scrubber installation records, and ambient particle observations. IMO fuel statistics indicate that HFO-based pathways remained important after 2020 (IMO, 2024), while Lunde Hermansson et al. (2024) identified continued operation of scrubber-equipped ships after the sulfur regulation, supporting the necessity of explicitly representing HFO-with-scrubber pathways. Song et al. (2022) reported a pronounced reduction in SO2 at Busan Port following the IMO 2020 sulfur regulation, while no statistically significant change was observed in bulk PM2.5. Similar patterns have been reported in Shanghai, and studies in Canadian port cities also found that PM2.5 reductions were smaller than those of SO2 (Anastasopolos et al., 2021; Zhang et al., 2019). These contrasting responses reflect the stronger direct link between sulfur regulation and SO2, whereas ambient PM2.5 is influenced by multiple emission sources and atmospheric processes.
In addition to PM2.5 mass emissions, particle number (PN) emissions deserve further attention because ship exhaust contains large numbers of ultrafine particles that are not fully represented by particle mass. Shipping remains an important source of anthropogenic PN emissions after 2020 (Kuittinen et al., 2021). Measurements in the Baltic Sea sulfur emission control area showed that reducing fuel sulfur content from 1.5 % to 0.1 % decreased plume PN concentrations by 27 % and ambient PN concentrations by 32 % (Seppälä et al., 2021). However, the influence of scrubbers on PN is highly variable. Some measurements have reported substantial reductions in total PN downstream of scrubbers (Winnes et al., 2020; Kuittinen et al., 2024), while others have observed increased PN associated with the formation or growth of ultrafine sulfur-containing particles (Grigoriadis et al., 2024). Santos et al. (2024) further showed that reductions in total PN can coincide with shifts toward larger sulfate particles and increases in particle mass or cloud-condensation-nuclei emissions. These contrasting responses indicate that future ship emission inventories should consider PN size distributions and scrubber-specific particle characteristics in addition to PM2.5 mass emissions.
Despite the improvements introduced in SEIMv2.3, several uncertainties remain. First, missing vessel specifications supplemented through machine learning may introduce errors at the individual-ship level, although these uncertainties are expected to decrease after aggregation at regional and global scales. Commercial databases such as Sea-web provide extensive ship-level information (S&P Global, 2026), but the fields available to this study did not include main engine power, a key input to SEIM. Our machine-learning framework therefore supplements accessible data to complete model-relevant ship characteristics, not intended to replace proprietary databases. Second, FLSCCM reconstructs sulfur compliance pathways using ship-level scrubber records combined with constrained statistical allocation because global ship-specific fuel-use observations are unavailable. The exact number of ships assigned to the HFO-with-scrubber pathway therefore remains uncertain and should be interpreted as a fleet-level proxy rather than a census of confirmed scrubber installations. However, sensitivity tests show that substantial changes in the reconstructed fleet size produce only limited changes in global PM2.5 and BC emissions. Third, FLSCCM does not distinguish ULSFO and MGO, and fuels of 0.1 % sulfur are represented using MGO emission factors. This simplification is expected to have limited influence on SO2, but it may lead to some underestimation of PM2.5 and BC emissions where residual-type ULSFO is used. Therefore, uncertainties may arise from incomplete scrubber records, assumed scrubber operation, and simplified representation of ULSFO using MGO emission factors. These uncertainties mainly affect PM2.5 and BC estimates, while their influence on SO2 remains limited.
To quantify the influence of scrubber-related uncertainty on particulate emission estimates, we conducted sensitivity analyses using different scrubber removal efficiency assumptions. Under the low-, baseline-, and high-removal scenarios, corresponding to PM2.5 removal efficiencies of 10 %, 37 %, and 70 % and BC removal efficiencies of 10 %, 30 %, and 60 %, global PM2.5 emissions varied by +26.6 % and −32.6 % relative to the baseline case, while BC emissions varied by +11.5 % and −17.3 %. Despite this uncertainty, all scenarios consistently show higher particulate emissions than inventories that neglect or incompletely represent HFO-with-scrubber pathways, indicating that the identified underestimation is robust to plausible variations in scrubber removal performance.
Future reductions in uncertainty require improved ship-specific technical databases, broader sharing of scrubber installation and fuel-use data, and additional validation data. IMO GISIS provides an important official source of scrubber information, although its coverage is incomplete, while commercial databases and onboard or operational records can provide complementary evidence. Direct single-ship validation remains challenging because comprehensive fuel-use and compliance information is rarely public. Nevertheless, comparisons with independent inventories and sensitivity analyses suggest that these uncertainties are unlikely to alter the main conclusions.
Python codes used during the current study are available from the corresponding author on reasonable request. The code is not publicly available due to intellectual property restrictions associated with patent protection.
The supplement related to this article is available online at https://doi.org/10.5194/acp-26-16373-2026-supplement.
Weiwei Zhang developed the model, performed the simulations, and prepared the manuscript. Zhaofeng Lv managed the project and edited the manuscript. Bensheng Xiao collected the data. Wen Yi, Tingkun He, and Feng Sun validated the results and reviewed the manuscript. Huan Liu and Qiang Zhang conceptualized the research aim, supervised the project and acquired the financial support.
At least one of the (co-)authors is a member of the editorial board of Atmospheric Chemistry and Physics. The peer-review process was guided by an independent editor, and the authors also have no other competing interests to declare.
Publisher's note: Copernicus Publications remains neutral with regard to jurisdictional claims made in the text, published maps, institutional affiliations, or any other geographical representation in this paper. The authors bear the ultimate responsibility for providing appropriate place names. Views expressed in the text are those of the authors and do not necessarily reflect the views of the publisher.
This research has been supported by the National Key Research and Development Program of China (grant no. 2023YFC3705604) and COSCO SHIPPING Co., Ltd. (grant nos. 2025-4-Z001-03 and 2025-4-Z002-04).
This paper was edited by Tim Butler and reviewed by three anonymous referees.
Anastasopolos, A. T., Sofowote, U. M., Hopke, P. K., Rouleau, M., Shin, T., Dheri, A., Peng, H., Kulka, R., Gibson, M. D., Farah, P.-M., and Sundar, N.: Air quality in Canadian port cities after regulation of low-sulphur marine fuel in the North American Emissions Control Area, Sci. Total Environ., 791, 147949, https://doi.org/10.1016/j.scitotenv.2021.147949, 2021.
Anenberg, S. C., Miller, J., Henze, D. K., Minjares, R., and Achakulwisut, P.: The global burden of transportation tailpipe emissions on air pollution-related mortality in 2010 and 2015, Environ. Res. Lett., 14, 094012, https://doi.org/10.1088/1748-9326/ab35fc, 2019.
Aulinger, A., Matthias, V., Zeretzke, M., Bieser, J., Quante, M., and Backes, A.: The impact of shipping emissions on air pollution in the greater North Sea region – Part 1: Current emissions and concentrations, Atmos. Chem. Phys., 16, 739–758, https://doi.org/10.5194/acp-16-739-2016, 2016.
Baek, W.-K., Kim, E., Jeon, H.-K., Lee, K.-J., Kim, S.-W., Lee, Y.-K., and Ryu, J.-H.: Monitoring Maritime Ship Characteristics Using Satellite Remote Sensing Data from Different Sensors, Ocean Sci. J., 59, https://doi.org/10.1007/s12601-023-00131-0, 2024.
Cames, M., Graichen, J., Siemons, A., and Cook, V.: Emission Reduction Targets for International Aviation and Shipping European Parliament, https://www.europarl.europa.eu/RegData/etudes/STUD/2015/569964/IPOL_STU(2015)569964_EN.pdf (last access: 14 November 2026), 2015.
Chen, D., Wang, X., Nelson, P., Li, Y., Zhao, N., Zhao, Y., Lang, J., Zhou, Y., and Guo, X.: Ship emission inventory and its impact on the PM2.5 air pollution in Qingdao Port, North China, Atmos. Environ., 166, 351–361, https://doi.org/10.1016/j.atmosenv.2017.07.021, 2017.
Cherkassky, B. V., Goldberg, A. V., and Radzik, T.: Shortest paths algorithms: Theory and experimental evaluation, Math. Program., 73, 129–174, https://doi.org/10.1007/BF02592101, 1996.
Chu Van, T., Ramirez, J., Rainey, T., Ristovski, Z., and Brown, R. J.: Global impacts of recent IMO regulations on marine fuel oil refining processes and ship emissions, Transport. Res. D–Tr. E., 70, 123–134, https://doi.org/10.1016/j.trd.2019.04.001, 2019.
Crippa, M., Guizzardi, D., Pagani, F., Schiavina, M., Melchiorri, M., Pisoni, E., Graziosi, F., Muntean, M., Maes, J., Dijkstra, L., Van Damme, M., Clarisse, L., and Coheur, P.: Insights into the spatial distribution of global, national, and subnational greenhouse gas emissions in the Emissions Database for Global Atmospheric Research (EDGAR v8.0), Earth Syst. Sci. Data, 16, 2811–2830, https://doi.org/10.5194/essd-16-2811-2024, 2024.
Crippa, M., Guizzardi, D., Pagani F., Banja M., Muntean M., Schaaf, E., Quadrelli, R., Risquez Martin, A., Taghavi-Moharamli, P., Grassi, G., Rossi, S., Melo, J., Oom, D., Branco, A., Suarez Moreno, M., Sedano, F. San-Miguel, J., Manca, G., Pisoni, E., and Pekar, F.: GHG emissions of all world countries – JRC/IEA 2025 Report, LuxembourgJRC143227, https://doi.org/10.2760/9816914, 2025.
Deng, J., Wang, X., Wei, Z., Wang, L., Wang, C., and Chen, Z.: A review of NOx and SOx emission reduction technologies for marine diesel engines and the potential evaluation of liquefied natural gas fuelled vessels, Sci. Total Environ., 766, 144319, https://doi.org/10.1016/j.scitotenv.2020.144319, 2021.
Feng, X., Ma, Y., Lin, H., Fu, T.-M., Zhang, Y., Wang, X., Zhang, A., Yuan, Y., Han, Z., Mao, J., Wang, D., Zhu, L., Wu, Y., Li, Y., and Yang, X.: Impacts of Ship Emissions on Air Quality in Southern China: Opportunistic Insights from the Abrupt Emission Changes in Early 2020, Environ. Sci. Technol., 57, 16999–17010, https://doi.org/10.1021/acs.est.3c04155, 2023.
Fu, M., Liu, H., Jin, X., and He, K.: National- to port-level inventories of shipping emissions in China, Environ. Res. Lett., 12, 114024, https://doi.org/10.1088/1748-9326/aa897a, 2017.
Goldsworthy, B., Enshaei, H., and Jayasinghe, S.: Comparison of large-scale ship exhaust emissions across multiple resolutions: From annual to hourly data, Atmos. Environ., 214, 116829, https://doi.org/10.1016/j.atmosenv.2019.116829, 2019.
Grigoriadis, A., Kousias, N., Raptopoulos-Chatzistefanou, A., Salberg, H., Moldanová, J., Hermansson, A.-L., Cha, Y., Kontses, A., Toumasatos, Z., Mamarikas, S., and Ntziachristos, L.: Particulate and Gaseous Emissions from a Large Two-Stroke Slow-Speed Marine Engine Equipped with Open-Loop Scrubber under Real Sailing Conditions, Atmosphere, 15, 845, https://doi.org/10.3390/atmos15070845, 2024.
Gu, C., Wang, Y., Ji, Y., Zhang, L., Sun, S., Bian, Y., Zhang, Z., Zhu, J., Zhao, W., Zhong, S., and Zhao, Y.: Technical note: Rapid assessment of drivers and air quality effects of regional daily changes in air pollutant emissions based on near-real-time techniques, Atmos. Chem. Phys., 26, 8913–8935, https://doi.org/10.5194/acp-26-8913-2026, 2026.
Heikkilä, M., Kuittinen, N., and Grönholm, T.: Comparing modelled and measured exhaust gas components from two LNG-powered ships, Atmos. Environ. X, 23, 100275, https://doi.org/10.1016/j.aeaoa.2024.100275, 2024.
Hoesly, R., Smith, S. J., Ahsan, H., Prime, N., O'Rourke, P., Crippa, M., Klimont, Z., Guizzardi, D., Feng, L., Harkins, C., Mcdonald, B., and Wang, S.: CEDS v_2025_03_18 Aggregate Data (v_2025_03_18), Zenodo, https://doi.org/10.5281/zenodo.15059443, 2025.
Huang, I.-L., Lee, M.-C., Nieh, C.-Y., and Huang, J.-C.: Ship Classification Based on AIS Data and Machine Learning Methods, Electronics, 13, 98, https://doi.org/10.3390/electronics13010098, 2024.
Huang, L., Wen, Y., Zhang, Y., Zhou, C., Zhang, F., and Yang, T.: Dynamic calculation of ship exhaust emissions based on real-time AIS data, Transport. Res. D–Tr. E., 80, 102277, https://doi.org/10.1016/j.trd.2020.102277, 2020.
Im, U., Christensen, J. H., Geels, C., Hansen, K. M., Brandt, J., Solazzo, E., Alyuz, U., Balzarini, A., Baro, R., Bellasio, R., Bianconi, R., Bieser, J., Colette, A., Curci, G., Farrow, A., Flemming, J., Fraser, A., Jimenez-Guerrero, P., Kitwiroon, N., Liu, P., Nopmongcol, U., Palacios-Peña, L., Pirovano, G., Pozzoli, L., Prank, M., Rose, R., Sokhi, R., Tuccella, P., Unal, A., Vivanco, M. G., Yarwood, G., Hogrefe, C., and Galmarini, S.: Influence of anthropogenic emissions and boundary conditions on multi-model simulations of major air pollutants over Europe and North America in the framework of AQMEII3, Atmos. Chem. Phys., 18, 8929–8952, https://doi.org/10.5194/acp-18-8929-2018, 2018.
IMO: Fourth IMO GHG Study – Final Report, International Maritime Organization, https://www.imo.org/en/ourwork/environment/pages/fourth-imo-greenhouse-gas-study-2020.aspx (last access: 14 November 2026), 2020.
IMO: Report of fuel oil consumption data submitted to the IMO Ship Fuel Oil Consumption Database in GISIS (Reporting year: 2023), MEPC 82/6/38, International Maritime Organization, https://wwwcdn.imo.org/localresources/en/OurWork/Environment/Documents/Reporting year 2023.pdf (last access: 14 November 2026), 2024.
Jalkanen, J.-P., Brink, A., Kalli, J., Pettersson, H., Kukkonen, J., and Stipa, T.: A modelling system for the exhaust emissions of marine traffic and its application in the Baltic Sea area, Atmos. Chem. Phys., 9, 9209–9223, https://doi.org/10.5194/acp-9-9209-2009, 2009.
Jalkanen, J.-P., Johansson, L., Wilewska-Bien, M., Granhag, L., Ytreberg, E., Eriksson, K. M., Yngsell, D., Hassellöv, I.-M., Magnusson, K., Raudsepp, U., Maljutenko, I., Winnes, H., and Moldanova, J.: Modelling of discharges from Baltic Sea shipping, Ocean Sci., 17, 699–728, https://doi.org/10.5194/os-17-699-2021, 2021.
Ji, C. and El-Halwagi, M. M.: A data-driven study of IMO compliant fuel emissions with consideration of black carbon aerosols, Ocean Eng., 218, 108241, https://doi.org/10.1016/j.oceaneng.2020.108241, 2020.
Jia, G., Huang, Z., Tang, X., Ou, J., Lu, M., Xu, Y., Zhong, Z., Sha, Q. e., Wu, H., Zheng, C., Deng, T., Chen, D., He, M., and Zheng, J.: A meteorologically adjusted ensemble Kalman filter approach for inversing daily emissions: A case study in the Pearl River Delta, China, J. Environ. Sci., 114, 233–248, https://doi.org/10.1016/j.jes.2021.08.048, 2022.
Johansson, L., Jalkanen, J.-P., and Kukkonen, J.: Global assessment of shipping emissions in 2015 on a high spatial and temporal resolution, Atmos. Environ., 167, 403–415, https://doi.org/10.1016/j.atmosenv.2017.08.042, 2017.
Kramel, D., Muri, H., Kim, Y., Lonka, R., Nielsen, J. B., Ringvold, A. L., Bouman, E. A., Steen, S., and Strømman, A. H.: Global Shipping Emissions from a Well-to-Wake Perspective: The MariTEAM Model, Environ. Sci. Technol., 55, 15040–15050, https://doi.org/10.1021/acs.est.1c03937, 2021.
Kuittinen, N., Jalkanen, J.-P., Alanen, J., Ntziachristos, L., Hannuniemi, H., Johansson, L., Karjalainen, P., Saukko, E., Isotalo, M., Aakko-Saksa, P., Lehtoranta, K., Keskinen, J., Simonen, P., Saarikoski, S., Asmi, E., Laurila, T., Hillamo, R., Mylläri, F., Lihavainen, H., Timonen, H., and Rönkkö, T.: Shipping Remains a Globally Significant Source of Anthropogenic PN Emissions Even after 2020 Sulfur Regulation, Environ. Sci. Technol., 55, 129–138, https://doi.org/10.1021/acs.est.0c03627, 2021.
Kuittinen, N., Timonen, H., Karjalainen, P., Murtonen, T., Vesala, H., Bloss, M., Honkanen, M., Lehtoranta, K., Aakko-Saksa, P., and Rönkkö, T.: In-depth characterization of exhaust particles performed on-board a modern cruise ship applying a scrubber, Sci. Total Environ., 946, 174052, https://doi.org/10.1016/j.scitotenv.2024.174052, 2024.
Li, Z., Fei, J., Du, Y., Ong, K.-L., and Arisian, S.: A near real-time carbon accounting framework for the decarbonization of maritime transport, Transport. Res. E–Log., 191, 103724, https://doi.org/10.1016/j.tre.2024.103724, 2024.
Liu, H., Fu, M., Jin, X., Shang, Y., Shindell, D., Faluvegi, G., Shindell, C., and He, K.: Health and climate impacts of ocean-going vessels in East Asia, Nat. Clim. Chang., 6, 1037–1041, https://doi.org/10.1038/nclimate3083, 2016.
Liu, H., Meng, Z.-H., Lv, Z.-F., Wang, X.-T., Deng, F.-Y., Liu, Y., Zhang, Y.-N., Shi, M.-S., Zhang, Q., and He, K.-B.: Emissions and health impacts from global shipping embodied in US–China bilateral trade, Nat. Sustain., 2, 1027–1033, https://doi.org/10.1038/s41893-019-0414-z, 2019.
Liu, H., Yi, W., Jalkanen, J.-P., Luo, Z., Majamäki, E., Matthias, V., Moldanová, J., Shi, Z., and He, K.: Atmospheric impacts and regulation framework of shipping emissions: achievements, challenges and frontiers, Fundamental Res., https://doi.org/10.1016/j.fmre.2024.02.013, 2024.
Lunde Hermansson, A., Hassellöv, I.-M., Grönholm, T., Jalkanen, J.-P., Fridell, E., Parsmo, R., Hassellöv, J., and Ytreberg, E.: Strong economic incentives of ship scrubbers promoting pollution, Nat. Sustain., 7, 812–822, https://doi.org/10.1038/s41893-024-01347-1, 2024.
Luo, Z., Lv, Z., Zhao, J., Sun, H., He, T., Yi, W., Zhang, Z., He, K., and Liu, H.: Shipping-related pollution decreased but mortality increased in Chinese port cities, Nat. Cities, 1, 295–304, https://doi.org/10.1038/s44284-024-00050-8, 2024.
Raman, R., Jethava, G., Chandrasekaran, H., and Tiwari, V.: Utilizing AIS Data and Machine Learning Techniques for Ship Type Classification, 2025 International Conference on Knowledge Engineering and Communication Systems (ICKECS), 28–29 April 2025, 1–6, https://doi.org/10.1109/ICKECS65700.2025.11034805, 2025.
S&P Global: Sea-web™: The Ultimate Marine Online Database, S&P Global, https://www.spglobal.com/market-intelligence/en/solutions/sea-web-maritime-reference (last access: 14 November 2026), 2026.
Santos, L. F. E. D., Salo, K., Kong, X., Hartmann, M., Sjöblom, J., and Thomson, E. S.: Marine Fuel Regulations and Engine Emissions: Impacts on Physicochemical Properties, Cloud Activity and Emission Factors, J. Geophys. Res.-Atmos., 129, e2023JD040389, https://doi.org/10.1029/2023JD040389, 2024.
Schwarzkopf, D. A., Petrik, R., Matthias, V., Quante, M., Majamäki, E., and Jalkanen, J.-P.: A ship emission modeling system with scenario capabilities, Atmos. Environ. X, 12, 100132, https://doi.org/10.1016/j.aeaoa.2021.100132, 2021.
Seppälä, S. D., Kuula, J., Hyvärinen, A.-P., Saarikoski, S., Rönkkö, T., Keskinen, J., Jalkanen, J.-P., and Timonen, H.: Effects of marine fuel sulfur restrictions on particle number concentrations and size distributions in ship plumes in the Baltic Sea, Atmos. Chem. Phys., 21, 3215–3234, https://doi.org/10.5194/acp-21-3215-2021, 2021.
Sharmina, M., Edelenbosch, O. Y., Wilson, C., Freeman, R., Gernaat, D. E. H. J., Gilbert, P., Larkin, A., Littleton, E. W., Traut, M., van Vuuren, D. P., Vaughan, N. E., Wood, F. R., and Le Quéré, C.: Decarbonising the critical sectors of aviation, shipping, road freight and industry to limit warming to 1.5–2 °C, Clim. Policy, 21, 455–474, https://doi.org/10.1080/14693062.2020.1831430, 2021.
Shi, Z., Endres, S., Rutgersson, A., Al-Hajjaji, S., Brynolf, S., Booge, D., Hassellöv, I.-M., Kontovas, C., Kumar, R., Liu, H., Marandino, C., Matthias, V., Moldanová, J., Salo, K., Sebe, M., Yi, W., Yang, M., and Zhang, C.: Perspectives on shipping emissions and their impacts on the surface ocean and lower atmosphere: An environmental-social-economic dimension, Elementa-Sci. Anthrop., 11, https://doi.org/10.1525/elementa.2023.00052, 2023.
Sokhi, R. S., Moussiopoulos, N., Baklanov, A., Bartzis, J., Coll, I., Finardi, S., Friedrich, R., Geels, C., Grönholm, T., Halenka, T., Ketzel, M., Maragkidou, A., Matthias, V., Moldanova, J., Ntziachristos, L., Schäfer, K., Suppan, P., Tsegas, G., Carmichael, G., Franco, V., Hanna, S., Jalkanen, J.-P., Velders, G. J. M., and Kukkonen, J.: Advances in air quality research – current and emerging challenges, Atmos. Chem. Phys., 22, 4615–4703, https://doi.org/10.5194/acp-22-4615-2022, 2022.
Song, S.-K., Shon, Z.-H., Moon, S.-H., Lee, T.-H., Kim, H.-S., Kang, S.-H., Park, G.-H., and Yoo, E.-C.: Impact of international Maritime Organization 2020 sulfur content regulations on port air quality at international hub port, J. Clean. Prod., 347, 131298, https://doi.org/10.1016/j.jclepro.2022.131298, 2022.
Starcrest Consulting Group, L.: PORT OF LOS ANGELES Inventory of Air Emission 2021, https://kentico.portoflosangeles.org/getmedia/f26839cd-54cd-4da9-92b7-a34094ee75a8/2021_air_emissions_inventory (last access: 14 November 2026), 2022.
Viana, M., Fann, N., Tobías, A., Querol, X., Rojas-Rueda, D., Plaza, A., Aynos, G., Conde, J. A., Fernández, L., and Fernández, C.: Environmental and Health Benefits from Designating the Marmara Sea and the Turkish Straits as an Emission Control Area (ECA), Environ. Sci. Technol., 49, 3304–3313, https://doi.org/10.1021/es5049946, 2015.
Wang, X., Yi, W., Lv, Z., Deng, F., Zheng, S., Xu, H., Zhao, J., Liu, H., and He, K.: Ship emissions around China under gradually promoted control policies from 2016 to 2019, Atmos. Chem. Phys., 21, 13835–13853, https://doi.org/10.5194/acp-21-13835-2021, 2021.
Wang, X., Liu, H., Zhang, J., Fu, X., Chen, D., Zhang, W., Yi, W., Lv, Z., Zhang, Q., and He, K.: Global shipping emissions from 1970 to 2021: Structural and spatial change driven by trade dynamics, One Earth, https://doi.org/10.1016/j.oneear.2025.101243, 2025.
Winnes, H., Fridell, E., and Moldanová, J.: Effects of Marine Exhaust Gas Scrubbers on Gas and Particle Emissions, https://doi.org/10.3390/jmse8040299, 2020.
Xu, Y., Huang, Z., Ye, J., and Zheng, J.: Hourly emissions of air pollutants and greenhouse gases from open biomass burning in China during 2016–2020, Sci. Data, 10, 629, https://doi.org/10.1038/s41597-023-02541-0, 2023.
Yang, J., Tang, T., Jiang, Y., Karavalakis, G., Durbin, T. D., Wayne Miller, J., Cocker, D. R., and Johnson, K. C.: Controlling emissions from an ocean-going container vessel with a wet scrubber system, Fuel, 304, 121323, https://doi.org/10.1016/j.fuel.2021.121323, 2021.
Yang, T., Wang, X., and Liu, Z.: Ship Type Recognition Based on Ship Navigating Trajectory and Convolutional Neural Network, J. Mar. Sci. Eng., 10, 84, https://doi.org/10.3390/jmse10010084, 2022.
Yang, Y., Liu, Y., Li, G., Zhang, Z., and Liu, Y.: Harnessing the power of Machine learning for AIS Data-Driven maritime Research: A comprehensive review, Transportation Res. E-Log., 183, 103426, https://doi.org/10.1016/j.tre.2024.103426, 2024.
Yi, W., He, T., Wang, X., Soo, Y. H., Luo, Z., Xie, Y., Peng, X., Zhang, W., Wang, Y., Lv, Z., He, K., and Liu, H.: Ship emission variations during the COVID-19 from global and continental perspectives, Total Environ., 176633, https://doi.org/10.1016/j.scitotenv.2024.176633, 2024.
Yi, W., Wang, X., He, T., Liu, H., Luo, Z., Lv, Z., and He, K.: The high-resolution global shipping emission inventory by the Shipping Emission Inventory Model (SEIM), Earth Syst. Sci. Data, 17, 277–292, https://doi.org/10.5194/essd-17-277-2025, 2025.
Yuan, T., Song, H., Oreopoulos, L., Wood, R., Bian, H., Breen, K., Chin, M., Yu, H., Barahona, D., Meyer, K., and Platnick, S.: Abrupt reduction in shipping emission as an inadvertent geoengineering termination shock produces substantial radiative warming, Commun. Earth Environ., 5, 281, https://doi.org/10.1038/s43247-024-01442-3, 2024.
Zhang, J., Chen, Y.-S., Gryspeerdt, E., Yamaguchi, T., and Feingold, G.: Radiative forcing from the 2020 shipping fuel regulation is large but hard to detect, Commun. Earth Environ., 6, 18, https://doi.org/10.1038/s43247-024-01911-9, 2025a.
Zhang, W., Yi, W., He, T., Peng, X., Xing, Q., Wu, X., Yang, Z., Xie, R., Xian, A., Liu, H., and Hao, J.: Ship emissions and reduction potential under domestic policies and international cooperation: A case study in Hainan, China, J. Environ. Sci., 156, 253–266, https://doi.org/10.1016/j.jes.2025.02.006, 2025b.
Zhang, X., Zhang, Y., Liu, Y., Zhao, J., Zhou, Y., Wang, X., Yang, X., Zou, Z., Zhang, C., Fu, Q., Xu, J., Gao, W., Li, N., and Chen, J.: Changes in the SO2 Level and PM2.5 Components in Shanghai Driven by Implementing the Ship Emission Control Policy, Environ. Sci. Technol., 53, 11580–11587, https://doi.org/10.1021/acs.est.9b03315, 2019.
Zhang, Y., Eastham, S. D., Lau, A. K. H., Fung, J. C. H., and Selin, N. E.: Global air quality and health impacts of domestic and international shipping, Environ. Res. Lett., 16, 084055, https://doi.org/10.1088/1748-9326/ac146b, 2021.