
the Creative Commons Attribution 4.0 License.
the Creative Commons Attribution 4.0 License.
 | 17 Nov 2026
Isolating the influence of aerosols on Arctic cloud radiative effects during a polluted warm air mass intrusion
Ruth Price

Louis Marelle
Lucas Bastien
Rémy Lapere
Hélène Angot
Benjamin Heutte
Julia Schmale
Jean-Christophe Raut
Jennie L. Thomas
Arctic warm air mass intrusions are key to the region's energy balance because they transport large amounts of heat and moisture from lower latitudes. The resulting changes in heat and moisture content influences cloud properties, the thermodynamic structure of the boundary layer, and surface radiation. Warm air mass intrusions can also carry significant amounts of aerosols into the Arctic, including aerosols from anthropogenic sources at lower latitudes, which could influence the radiative impacts of such events. In this study, we examine the role of aerosol transport during a warm air mass intrusion that occurred in the central Arctic in April 2020. We use a version of the regional chemistry-climate model WRF-Chem adapted for Arctic conditions (WRF-Chem-Polar), to investigate the radiative impact of aerosol-cloud interactions associated with the event. We isolate the effects of the high aerosol burden by running the model with and without anthropogenic emissions. Anthropogenic emissions increase cloud droplet number concentration by 117 % and liquid water content by 52 %. However, the net surface radiative impact of these aerosol-cloud interactions is limited over sea ice. The high albedo of the underlying sea ice limits shortwave cloud cooling, while the longwave effects of cloud perturbations are small. Over open ocean regions, the surface radiative impacts of the aerosols are stronger. Overall, these results suggest that the net effect of an extreme aerosol transport event is sensitive to the season in which the event takes place, due to strong dependence on the surface state and the background Arctic haze conditions.
- Article
(6749 KB) - Full-text XML
- BibTeX
- EndNote


The Arctic is warming four times faster than the global average rate (Rantanen et al., 2022), driven by greenhouse gas emissions and amplified by local climate feedbacks and warm air transported from the lower latitudes (Stuecker et al., 2018). Heat and moisture are transported to the Arctic from lower latitudes year-round. Much of this transport occurs in the form of transient eddies, often referred to as warm air intrusions (WAIs). WAIs are characterised as extreme events during which plumes of warm and moist air travel into the Arctic and cause heat and moisture anomalies over temporal scales from hours to days. Studies suggest that on average hundreds of Arctic WAIs occur each year with events taking place during every season, although precise climatologies are limited by the large sensitivity to the data and methods used to define WAI events (Zhang et al., 2023; Woods et al., 2026). WAI events have a disproportionate effect on the Arctic climate: despite occurring only 10 % of the time, they are responsible for more than 60 % of all moisture transport to the Arctic (Pithan et al., 2018). The extreme temperature anomalies associated with WAIs are particularly impactful when they lead to melt conditions over ice sheets or sea ice (Mortin et al., 2016; Solomon et al., 2017), and some studies have indicated a connection between springtime Arctic WAI events and autumn sea ice extent during years in which the Arctic sea ice minimum is below average (e.g. Kapsch et al., 2013), a connection that is driven by the high downwelling longwave flux from cloud and water vapour anomalies caused by WAI events. Surface warming during WAIs is controlled via inter-related, coupled processes between the polar boundary layer, clouds, and surface fluxes. In models, such processes are typically at the sub-grid scale and are therefore highly parameterised. This poses a challenge for the use of global climate models to understand WAIs (Pithan et al., 2018), particularly when these parameterisations for low-atmosphere and cloud processes are designed for mid-latitudes and therefore are not well-suited for use in the Arctic region.
Another important but less well-studied aspect of WAIs is the role of aerosols during such transport events. WAIs from lower latitudes can carry a high aerosol burden relative to background aerosol conditions, containing both anthropogenic emissions from mid-latitude source regions or natural aerosol species such as sea spray and dust (Dada et al., 2022; Lapere et al., 2024b; Angot et al., 2026). Such pollution events can have additional or non-linear impacts to the WAI itself. For example, the deposition of light-absorbing aerosol on snow and ice surfaces is known to be an important radiative forcing in Arctic regional climate (Skiles et al., 2018), and strong aerosol transport associated with WAIs can lead to considerable deposition events of light-absorbing impurities onto ice and snow (Thomas et al., 2017; Angot et al., 2026). Moreover, aerosol transport during WAIs can alter the radiative budget of clouds via aerosol-cloud interactions.
The WAI event that we investigate here was observed during the Multidisciplinary drifting Observatory for the Study of Arctic Climate (MOSAiC) expedition. The surface impacts of the event were particularly intense; Kirbus et al. (2023) showed that the potential temperature and specific humidity anomalies recorded during the event were equal to the 90th percentile of a dataset of the 50 most extreme WAIs between 1979 and 2016. Dada et al. (2022) presented in-situ aerosol measurements that show the event carried an extremely high aerosol burden and caused a strong perturbation to CCN concentrations. This suggests that the high aerosol burden impacted the microphysical properties of the clouds and affected the radiative budget at the location of Research Vessel (R/V) Polarstern during MOSAiC. Kirbus et al. (2023) investigated this further alongside their characterisation of the synoptic and thermodynamic drivers of the event. Using a high-resolution large eddy simulation (LES) model to test the sensitivity of the cloud and boundary layer structure to different prescribed CCN values, they characterise the impact that a CCN concentration representative of the polluted conditions has on the clouds via processes such as cloud-top longwave cooling and entrainment. However, since their model setup is necessarily limited to a few hours of the event over a spatial domain of a few kilometres around the ship, they could not provide further details about the large-scale surface radiative impacts of the event.
Here, we aim to address this gap by simulating the MOSAiC Arctic WAI case study on 15 and 16 April 2020, including the effects of the WAI on simulated aerosol properties, associated cloud impacts, and surface radiative effects and aim to answer the following questions in this study:
-
Can this warm air mass intrusion be reproduced in a regional chemistry-climate model?
-
Do transported anthropogenic aerosols influence clouds and surface radiation during the warm air mass intrusion?
-
What is the relative importance of aerosol anomalies vs. heat and moisture anomalies for the surface radiative budget?
-
What are the implications of this analysis for global-scale models, both in the present day and in future Arctic climate?
In order to do this, we use WRF-Chem-Polar, a regional climate model that has been extensively developed and tested for use in Arctic simulations (e.g. Marelle et al., 2017, 2021, 2025; Ahmed et al., 2023; Ioannidis et al., 2023; Lapere et al., 2024a, 2025), and therefore provides the best available framework for state-of-the-art simulations of the impacts of Arctic aerosol and cloud processes over large regional scales.
We test the sensitivity of cloud radiative effects to long-range transported anthropogenic pollution within the WAI, with the objective of quantifying the importance of anthropogenic aerosol anomalies during strong pollution events for the Arctic radiative budget. While in-situ observations provide invaluable insight into local processes during such extreme events, they are inherently limited in their ability to capture the full spatial extent and temporal evolution of WAIs and their downstream impacts. Numerical modelling is therefore essential for placing these observations in a broader context. To this end, we adopt a pan-Arctic modelling approach with a horizontal spatial resolution of approximately 100 km, allowing us to investigate WAI-driven aerosol-cloud-radiation interactions over regional scales while remaining relevant to those typically represented in global climate and Earth system models.
2.1 Model
We use WRF-Chem-Polar, which is adapted from the Weather Research and Forecasting model including Chemistry (WRF-Chem) version 4.6.1, and has been developed for Arctic aerosol and cloud research. Improvements include polar-specific aerosol sources (e.g. blowing snow), improvements to other aerosol and precursor sources relevant for polar regions (sea spray including organics, dimethylsulfide and its multiphase chemistry), and improvements to the modelling of clouds and aerosol-cloud interactions in the model. In this work, we represent aerosol-cloud interactions by combining MOSAIC-4bin aerosols with the parameterisation of Thompson and Eidhammer (2014) hosted in the Thompson 2-moment cloud model, a setup called TE14 in Marelle et al. (2025). Specific details on the model configuration can be found in Table A1. To investigate the WAI event observed during MOSAiC on 15 and 16 April, we ran simulations from 15 March to 30 April 2020. We exclude the first two weeks of model output to allow for model spin-up. We ran the model with and without emissions from fires and anthropogenic sources, producing two simulations that we refer to as “polluted” and “clean” throughout.
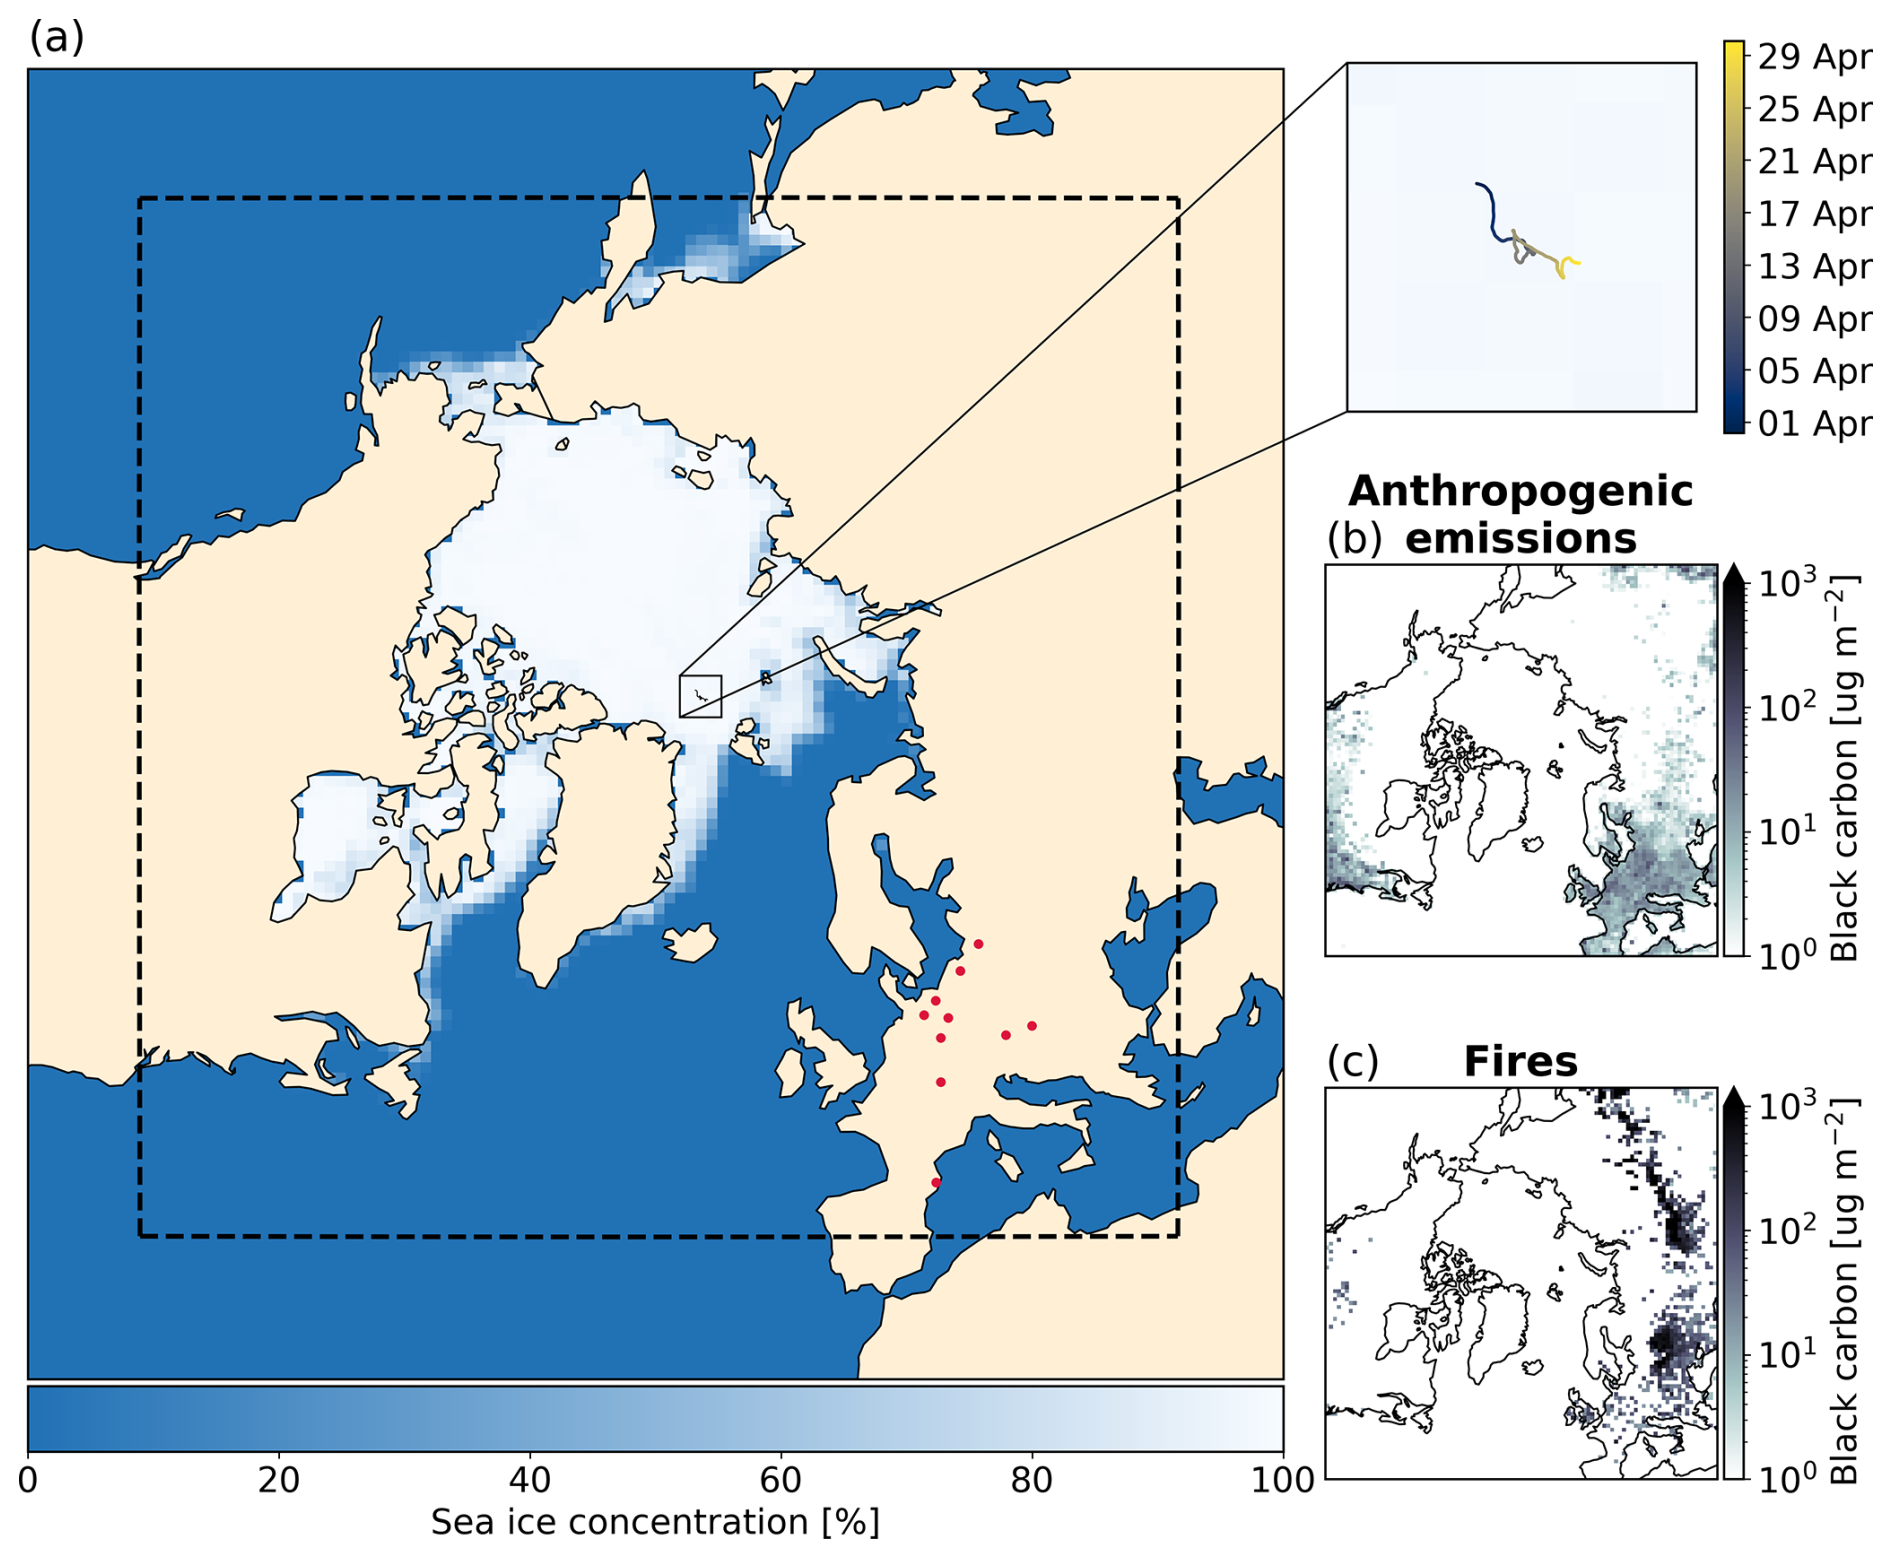
Figure 1(a) Map with WRF-Chem-Polar domain boundaries (black dashed lines), EMEP station locations (red circles), sea ice concentration from WRF-Chem-Polar output, and position of R/V Polarstern during April 2020 of MOSAiC expedition. CAMS black carbon emissions accumulated over 13–16 April from (b) anthropogenic emissions and (c) fires.
The black box in Fig. 1 displays the extent of the WRF-Chem-Polar domain used in this study. The domain consists of 100 × 100 grid boxes at a horizontal resolution of 100 km and has 50 vertical levels between the surface and 50 hPa. The size and location of the model of domain was selected to include both the location of the R/V Polarstern (map and inset in Fig. 1), and the location of Eurasian anthropogenic aerosol emission regions (red circles on Fig. 1 show location of EMEP sites where we perform model evaluation against measurements of PM2.5). Although the horizontal grid resolution of our model configuration somewhat limits our ability to perform detailed comparisons to point measurements at high time resolution, we use MOSAiC measurements to increase our confidence in the fidelity of the simulated anthropogenic aerosols in this case.
2.2 Observations
2.2.1 MOSAiC
MOSAiC was a year-long expedition involving the R/V Polarstern and taking place between September 2019 and October 2020. The ship drifted with the sea ice and measurements were taken onboard the ship, on the ice surrounding the ship, and from a distributed network of observing systems. In this study we use measurements from the atmospheric science theme as described in Shupe et al. (2022). We use measurements of aerosol mass and number concentration taken from the deck of the R/V Polarstern. Mass concentration of the sulphate and organic aerosol components were taken with a High-resolution time-of-flight aerosol mass spectrometer (HR-ToF-AMS, referred to as AMS, Heutte et al., 2023). Equivalent black carbon was calculated from aerosol attenuation measured with an aethalometer (Heutte et al., 2023). Note that measured equivalent black carbon will be compared to modelled black carbon in Sect. 3 without making a distinction between the two terms. The instrumental setup used to obtain these aerosol composition measurements used an upper size cut-off of 1 µm, thus the simulated, binned aerosol mass concentrations are interpolated up to 1 µm diameter. We also evaluate the simulated meteorology using observed temperature and humidity taken from a combination of radiosonde, 10 m meteorological tower, ceilometer, and radiation station MOSAiC measurements (Jozef et al., 2023). To collocate the model output with the ship's position, we extract the nine nearest grid points to the ship and compare using the mean, minimum and maximum values over these grid points.
This section evaluates the baseline representation of aerosols in the polluted simulation, facilitating the investigation in later sections of cloud responses to pollution during the WAI and the associated surface radiative effects. We use PM2.5 mass concentration measurements from Europe to evaluate the modelled anthropogenic aerosol emissions close to sources, and MOSAiC aerosol mass concentration measurements to evaluate the subsequent transport to the central Arctic.
3.1 Emissions and aerosols over Europe
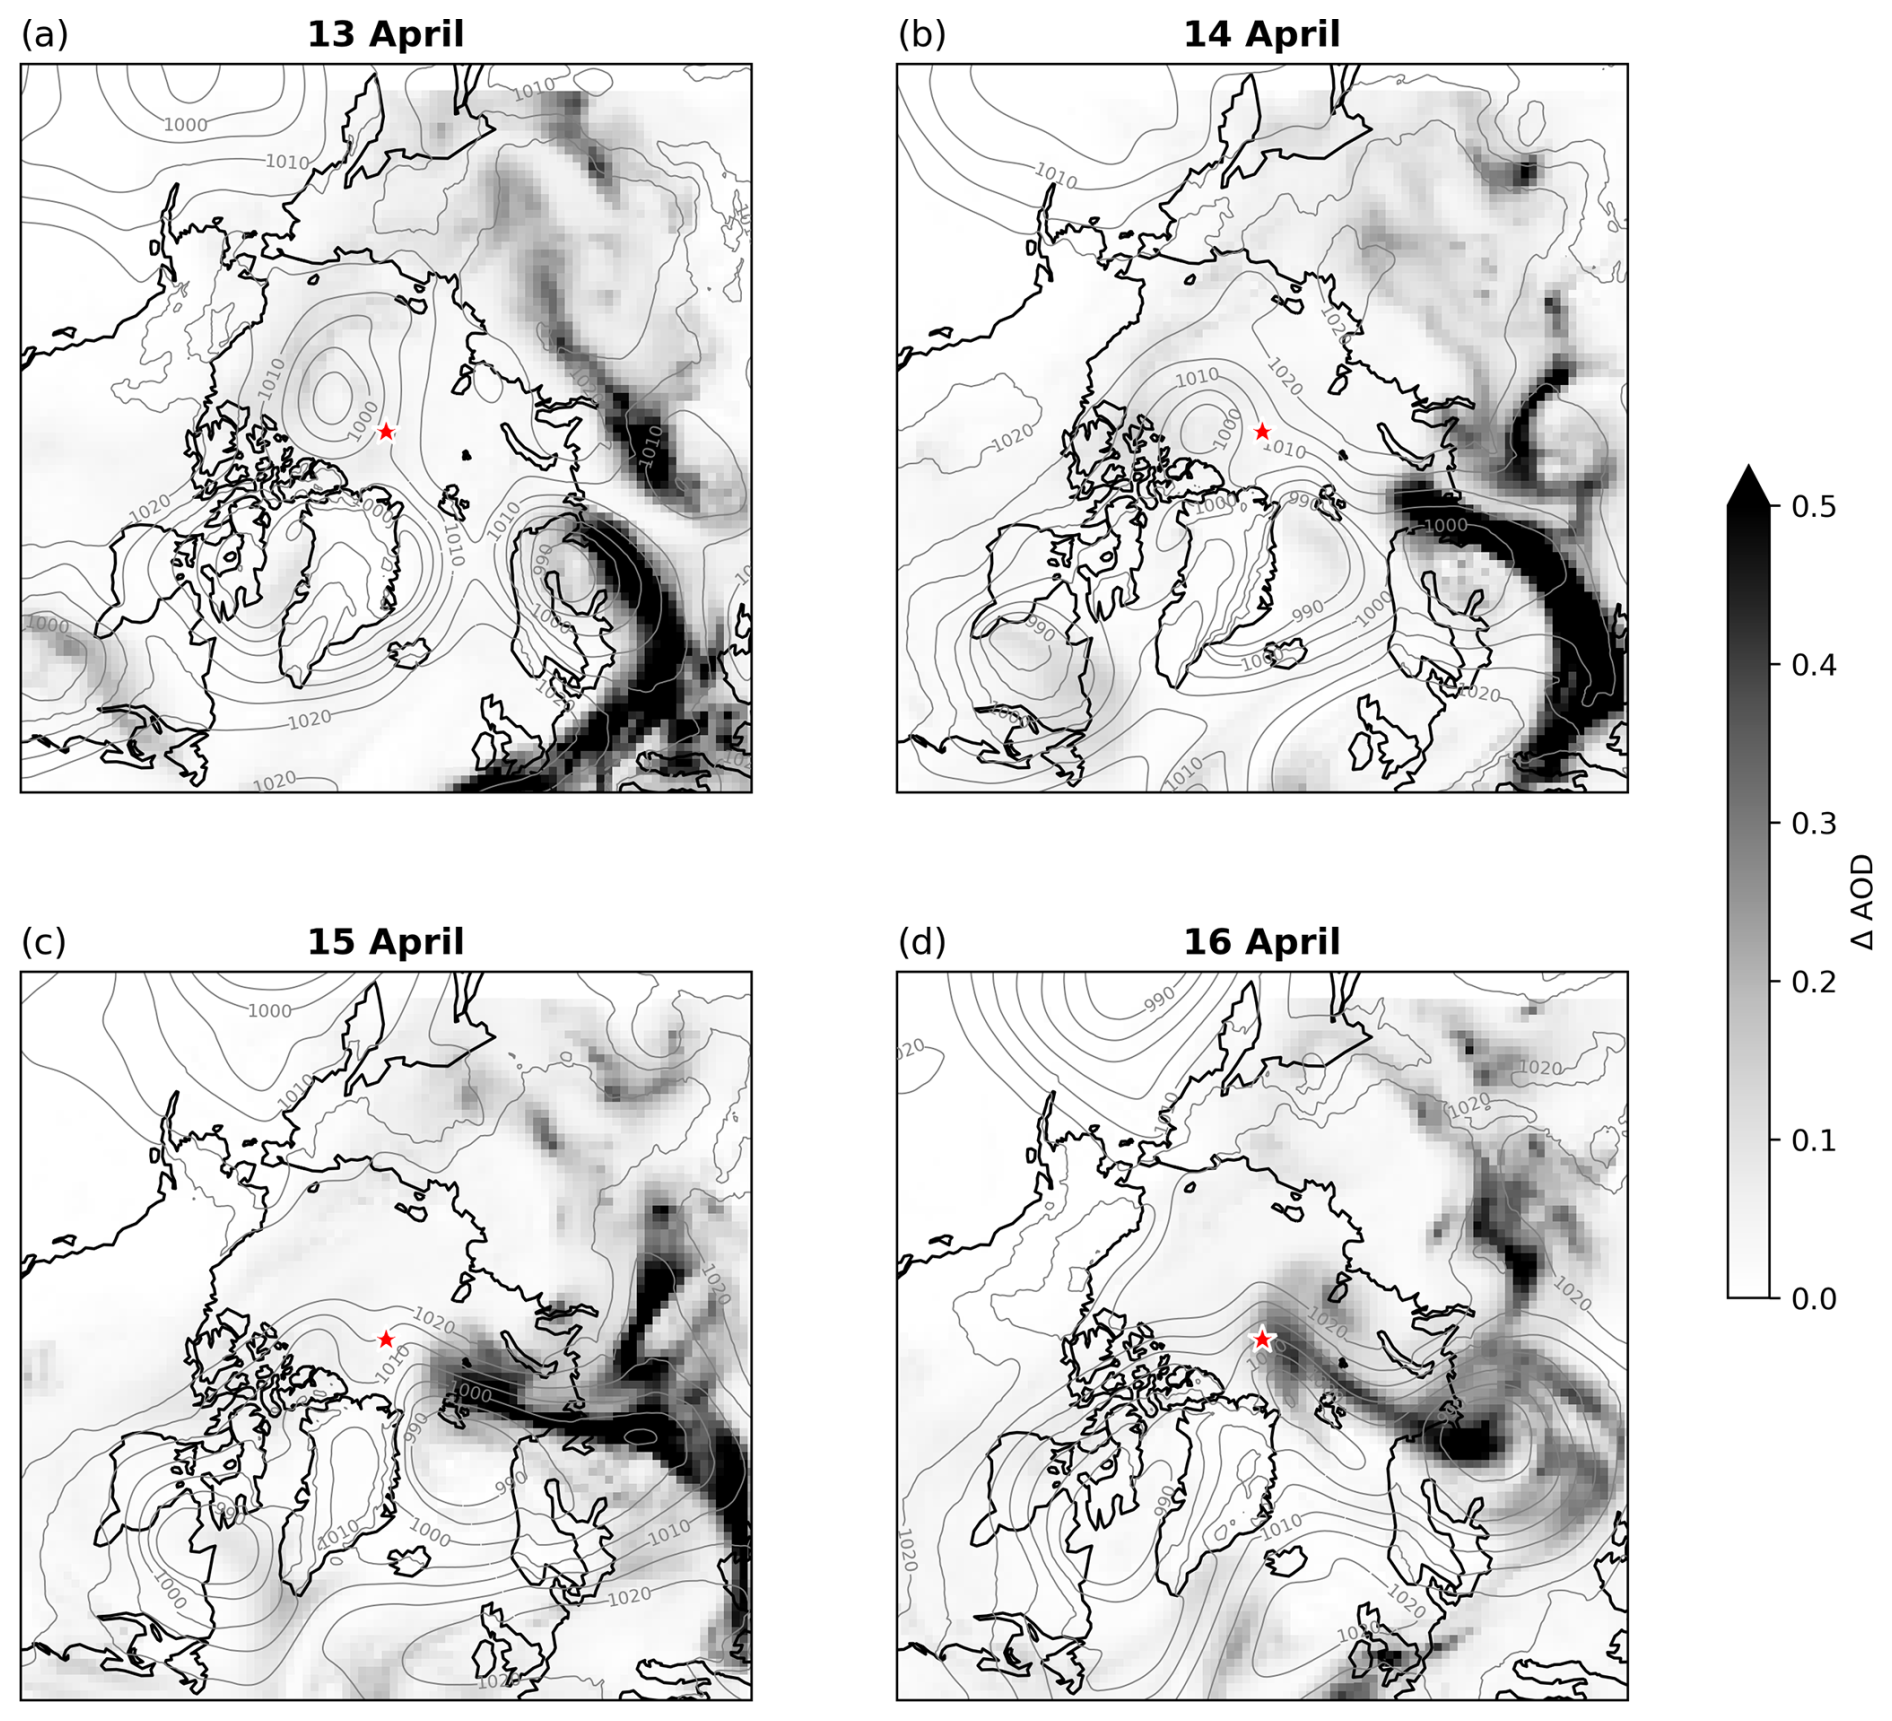
Figure 2Daily maps of the anomaly in simulated AOD between the polluted and clean simulations. Red star indicates position of R/V Polarstern on each day. Daily average mean sea level pressure from ERA5 shown in grey isobars.
Figure 1b–c shows accumulated black carbon emissions from fires and anthropogenic sources in the model domain. The emissions are calculated from the CAMS global emissions inventory v5.3 (anthropogenic sources) and FINNv1.5 (fires), and are used online during the WRF-Chem-Polar simulations. Including these emission regions as an aerosol source in the model domain is crucial for an accurate representation of the strong pollution event and its transport into the central Arctic. Dada et al. (2022) showed that the high aerosol burdens observed at the ship on 15 and 16 April were associated with aerosol transport from western Russian and northern Finland, regions which are associated with emissions from gas flaring and the metallurgical industry. It can be seen from the simulated AOD anomalies between the polluted and clean simulations (Fig. 2) that a high AOD from anthropogenic aerosol is reproduced in the polluted simulation, including over western Russia/northern Finland during the WAI event and the days leading up to it.
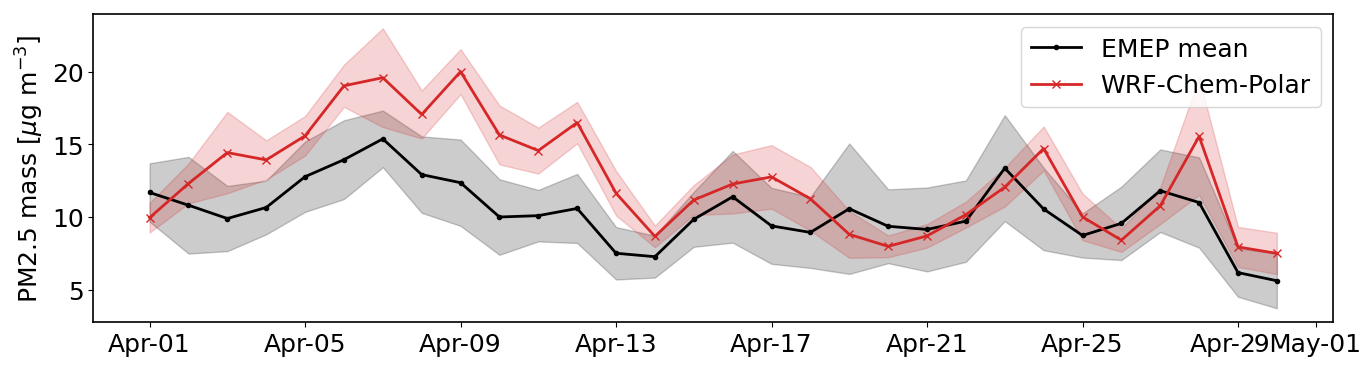
Figure 3Times series of daily mean PM2.5 mass concentration from EMEP measurements (black) and WRF-Chem-Polar output (red) for April 2020. Solid lines show mean over 10 EMEP stations, shading shows 1 standard deviation. WRF-Chem-Polar values are calculated from the mean of the 9 nearest grid cells to each station.
To validate the treatment of aerosols in the mid-latitude emissions regions, we compared model output of PM2.5 to measurements from European sites taken from the European Monitoring and Evaluation Programme (EMEP) dataset (e.g. Tørseth et al., 2012). We selected PM2.5 for this evaluation because it is widely available in the EMEP dataset. The comparison of daily mean PM2.5 mass concentration is shown in Fig. 3 as a mean across 10 EMEP sites, the location of individual sites included in the comparison are indicated on Fig. 1 as red circles. The model captures both the magnitude and the variability of PM2.5 with the exception of a small overestimation of mass concentration between 8 and 12 April. This strong model-observation agreement in PM2.5 in the European source regions shows that the model is capable of producing a well-characterised polluted warm air mass that can be used to study the cloud and radiative effects.
3.2 Central Arctic aerosols
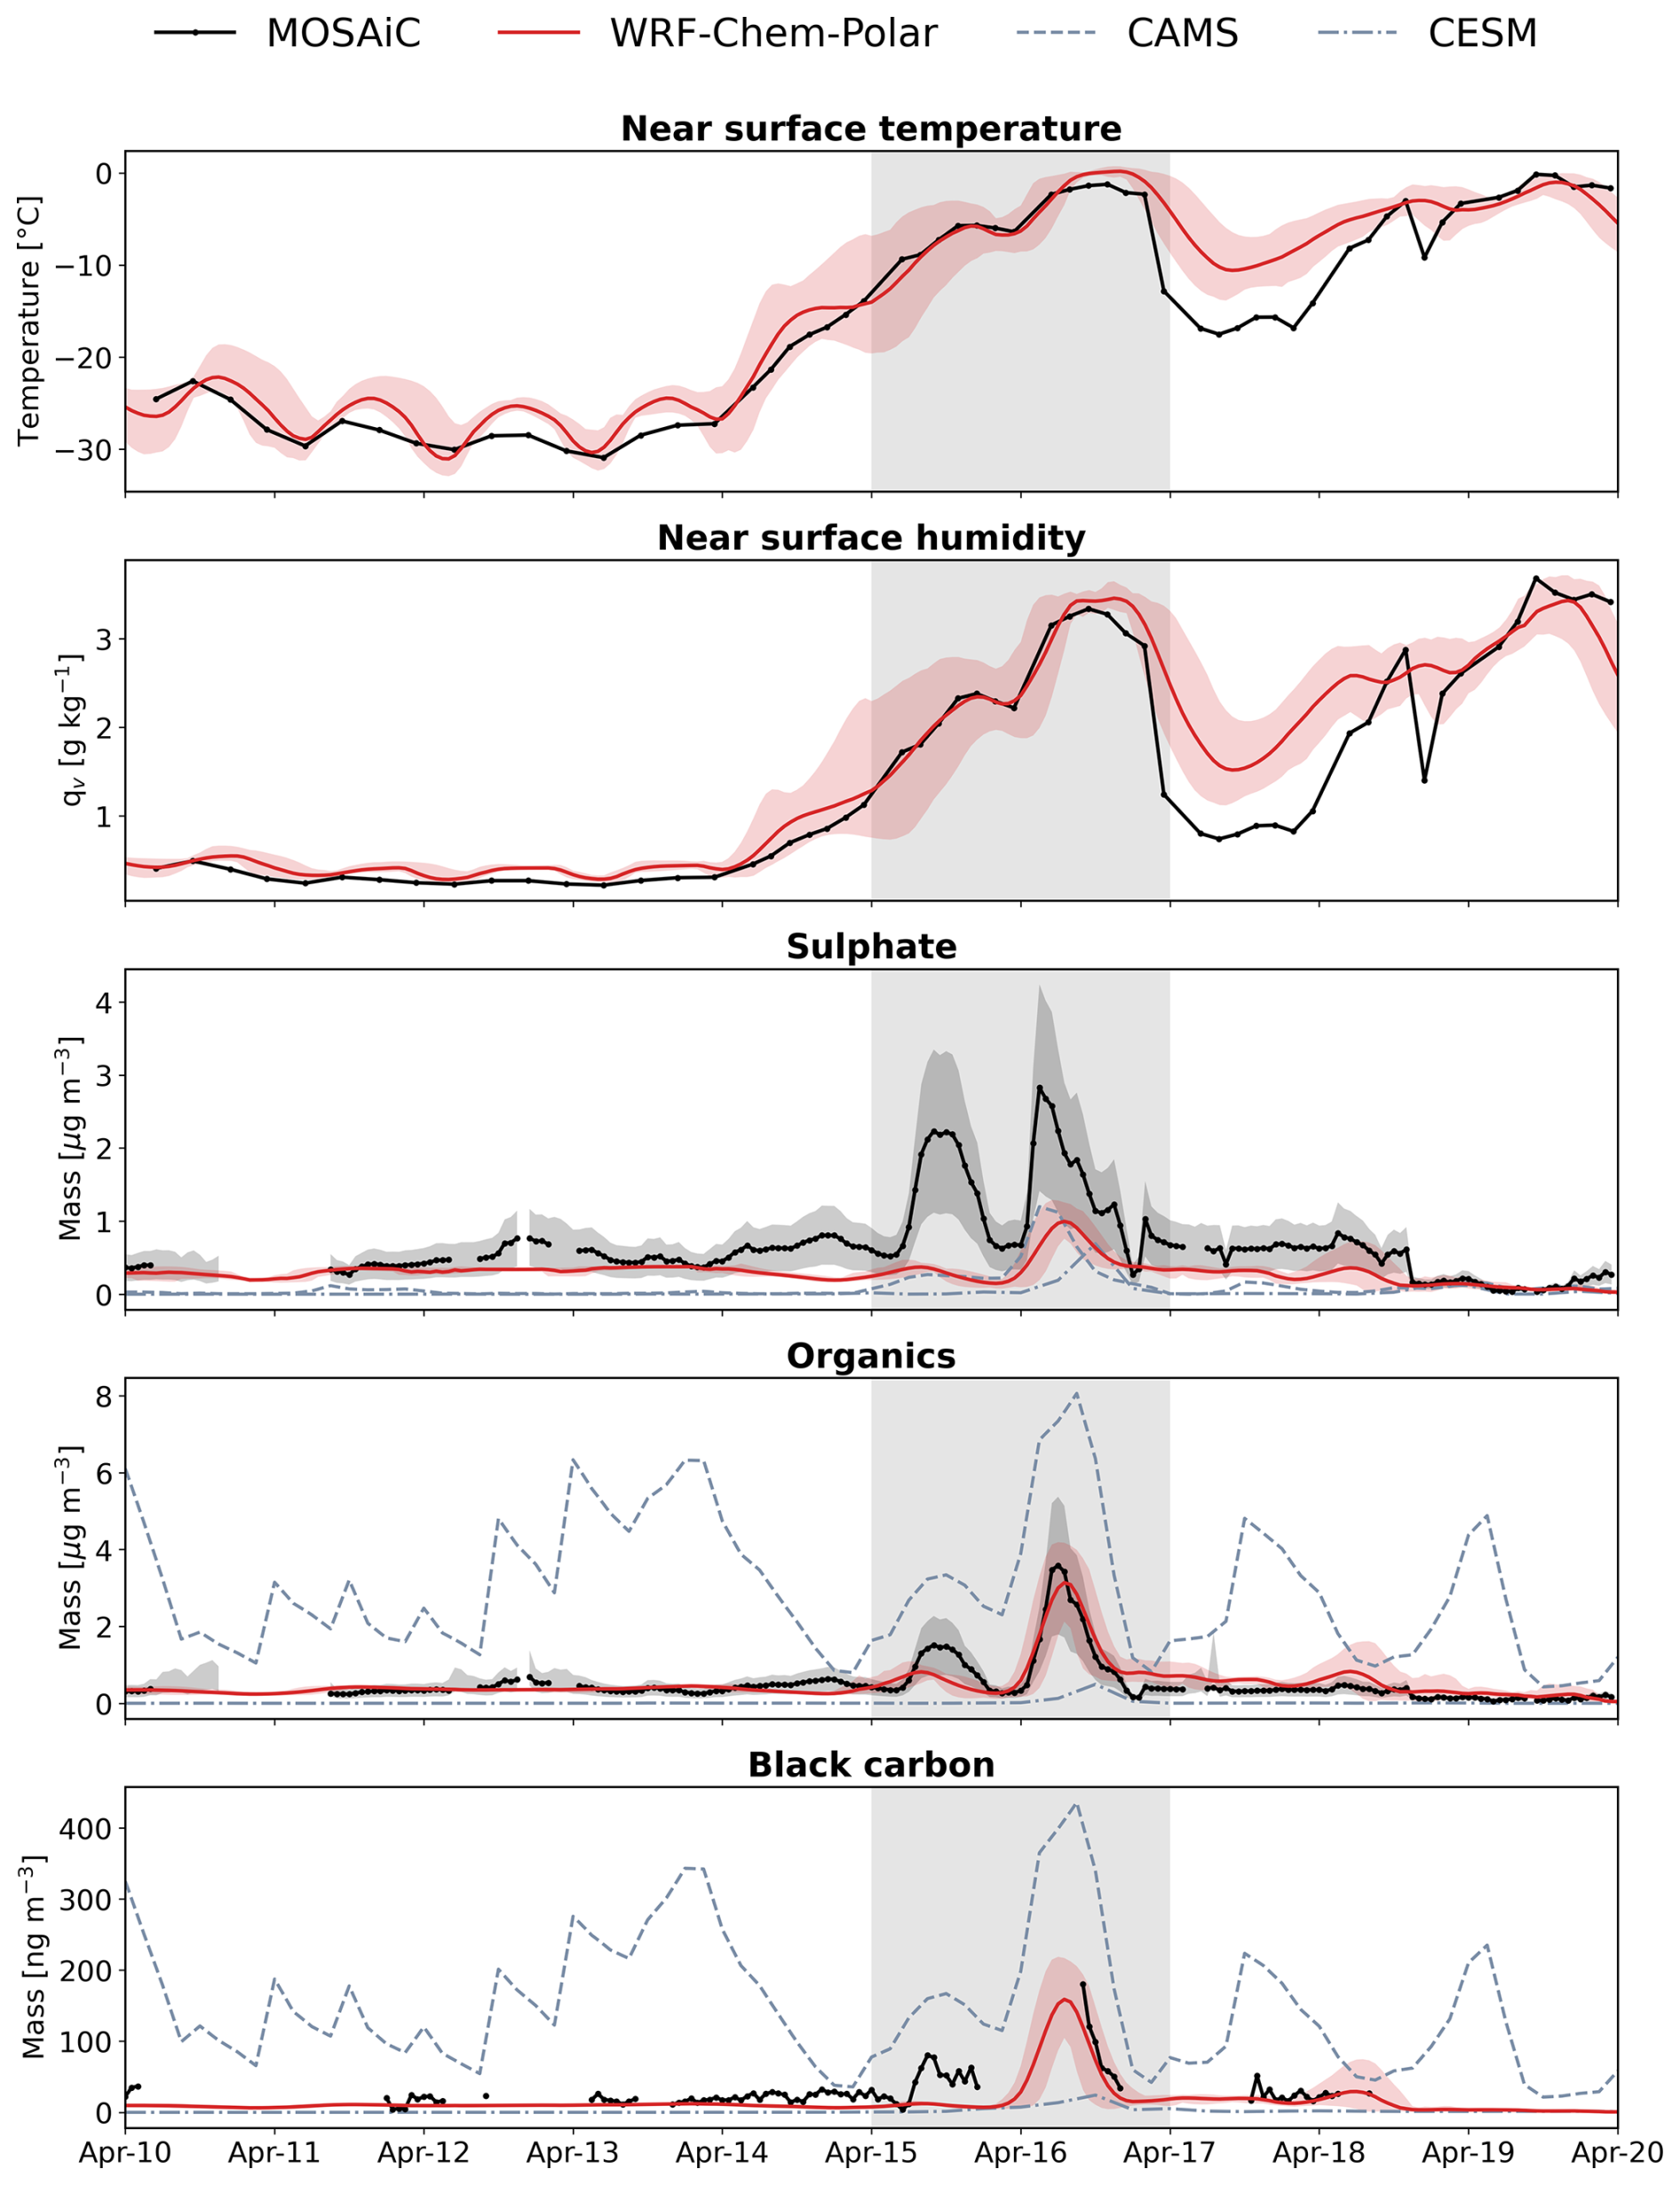
Figure 4Times series of hourly mean (a) near-surface temperature, (b) near-surface humidity, and (c–e) PM1 aerosol mass concentration from MOSAiC measurements (black with markers) and WRF-Chem-Polar output (red) for April 2020. Temperature and humidity measurements are from 10 m met mast, sulphate and organic carbon measurements are from AMS, black carbon measurements are from aethalometer. WRF-Chem-Polar values are calculated from the mean of the 9 nearest grid cells to R/V Polarstern, shading shows range. Output is from lowest model level. Collocated aerosol mass concentration from CAMS reanalysis (thin dash, Inness et al., 2019) and CESM output (thin dash-dot, Buchholz et al., 2019) are also shown on panels (c)–(e).
Next, we evaluate the transport of aerosols into the central Arctic by comparing aerosol mass concentration from MOSAiC measurements and model output. The results are shown in Fig. 4. We evaluated sulphate and organics (the largest two components of aerosol mass in the observations) against measurements from AMS, and black carbon (which typically indicates direct emissions from combustion processes) against aethalometer measurements. Missing time periods in the measurements in Fig. 4 indicate where data has been removed due to the presence of local ship pollution (Beck et al., 2022). AMS measurements (Fig. 4 top and middle) are shown with a 50 % uncertainty that is typical of the AMS instrument.
In the period before the event (up to 14 April inclusive), the aerosol mass measurements show background values typical of the Arctic haze season (Heutte et al., 2025). WRF-Chem-Polar captures the sulphate and organics background well. Black carbon is slightly underestimated by WRF-Chem-Polar in the background, though due to the relatively small amount of black carbon relative to total aerosol mass, this underestimation does not equate to a large underestimation in aerosol mass.
The measurements show two peaks in aerosol mass during the WAI event, on 15 and 16 April. The first peak on 15 April is not captured well by WRF-Chem-Polar. This underestimation in aerosol mass is likely due to missing anthropogenic emissions in the source regions, accumulation of small errors in atmospheric circulation, or biases in wet removal during transport to the central Arctic. Note that we also tested the sensitivity of the simulated aerosol to the use of another emissions inventory, ECLIPSE, for anthropogenic emissions in the model (not shown). ECLIPSE was also used by Dada et al. (2022) in their analysis of the sources of the pollution in this event. We found that the simulated aerosol mass concentration in the central Arctic was not very sensitive to the emissions used, which indicates that the underestimation of the first peak on 15 April is likely due to a combination of factors. The second peak on 16 April is represented well. Organic and black carbon mass concentration agrees well with the MOSAiC measurements, particularly when accounting for the range of simulated concentrations arising from spatial variability in the model (red shading), which can introduce bias if small errors in modelled transport pathways physically displace the aerosol plume relative to the ship position. Sulphate mass is underestimated but remains within reasonable agreement when measurement uncertainty is considered (black shading).
We note that it is well known that models often fail to capture aerosol abundance over the central Arctic Ocean which is far from anthropogenic source regions, where model bias can typically exceed one order of magnitude (Whaley et al., 2022). To provide a broader context for the comparison of MOSAiC measurements and WRF-Chem-Polar, Fig. 4 also shows aerosol mass concentrations from CESM. CESM output also provides the initial and boundary conditions for aerosols in WRF-Chem-Polar, and is included here as a benchmark of the representation of high Arctic aerosol from a state-of-the-art global climate model with a sophisticated aerosol scheme. CESM consistently underestimates sulphate, organic, and black carbon mass and captures little of the event-driven increase in aerosol mass. The fact that WRF-Chem-Polar provides a more realistic representation of aerosols than CESM gives us more confidence in the regional, Arctic-focused configuration of WRF-Chem-Polar for our research aim of understanding aerosol-cloud-radiation interactions over the Arctic Ocean, specifically during this aerosol transport event.
For reference, we also show that the CAMS aerosol reanalysis product EAC4 overestimates organic and black carbon aerosol and underestimates sulphate aerosol in the central Arctic Ocean (Fig. 4). This is likely because CAMS EAC4 assimilates aerosol optical depth, without adjusting aerosol composition or vertical distributions (Inness et al., 2019), which results in these biases in aerosol composition and mass at the surface during the background conditions of Arctic springtime. While the model used to produce CAMS EAC4 does not include the same level of detail in aerosol-cloud radiation interactions as WRF-Chem-Polar, it is widely used as a reference for global aerosol abundance (e.g. Jia et al., 2026), and should be validated further for use in the central Arctic Ocean. It is included here to compare the performance of WRF-Chem-Polar to a widely-used reference for atmospheric composition. CAMS performs similarly to WRF-Chem-Polar for sulphate but overestimates organic and black carbon mass.
Overall, the evaluation of aerosol mass both within Europe and in the central Arctic shows that both the anthropogenic emissions that drive the pollution event, and the transport of those emissions to the central Arctic (our region of interest) are captured in WRF-Chem-Polar to a standard that is reasonable for the investigation of aerosol-cloud interactions that will be presented in subsequent sections.
3.3 Sensitivity to microphysics scheme
Model-observation comparisons shown in the previous sections were performed for simulations using the Thompson cloud microphysics scheme (Figs. 3 and 4). Although the cloud microphysics scheme does not directly calculate any aerosol process rates, aerosol properties can still be indirectly affected due to coupling between aerosol and clouds, for example via changes to aerosol wet deposition rates or the vertical structure of the boundary layer. Therefore, for completeness, we have tested the model-observation agreement for aerosol mass concentration with the Morrison et al. (2009) microphysics scheme, shown in Fig. A1. The model-observation agreement is less good than for the Thompson microphysics scheme, therefore in the remainder of the paper we only use the results from Thompson (Sects. 4 and 5). However, it is worth noting that despite the relatively poor agreement between observed and modelled aerosols using a different scheme, the conclusions of this study are robust with respect to the role of aerosols in modifying cloud properties and radiation. Specifically, the resulting surface radiative effects of the aerosol on clouds and radiation during the warm air mass intrusion are similar in both the Thompson and Morrison microphysics schemes (see Appendix).
In Sect. 3 we showed that the polluted simulation is capable of reproducing the observed pollution event that arrived at R/V Polarstern on 16 April. In this section we will use differences between the polluted and clean simulations to investigate the effect of the pollution transport on Arctic cloud properties and surface radiation.
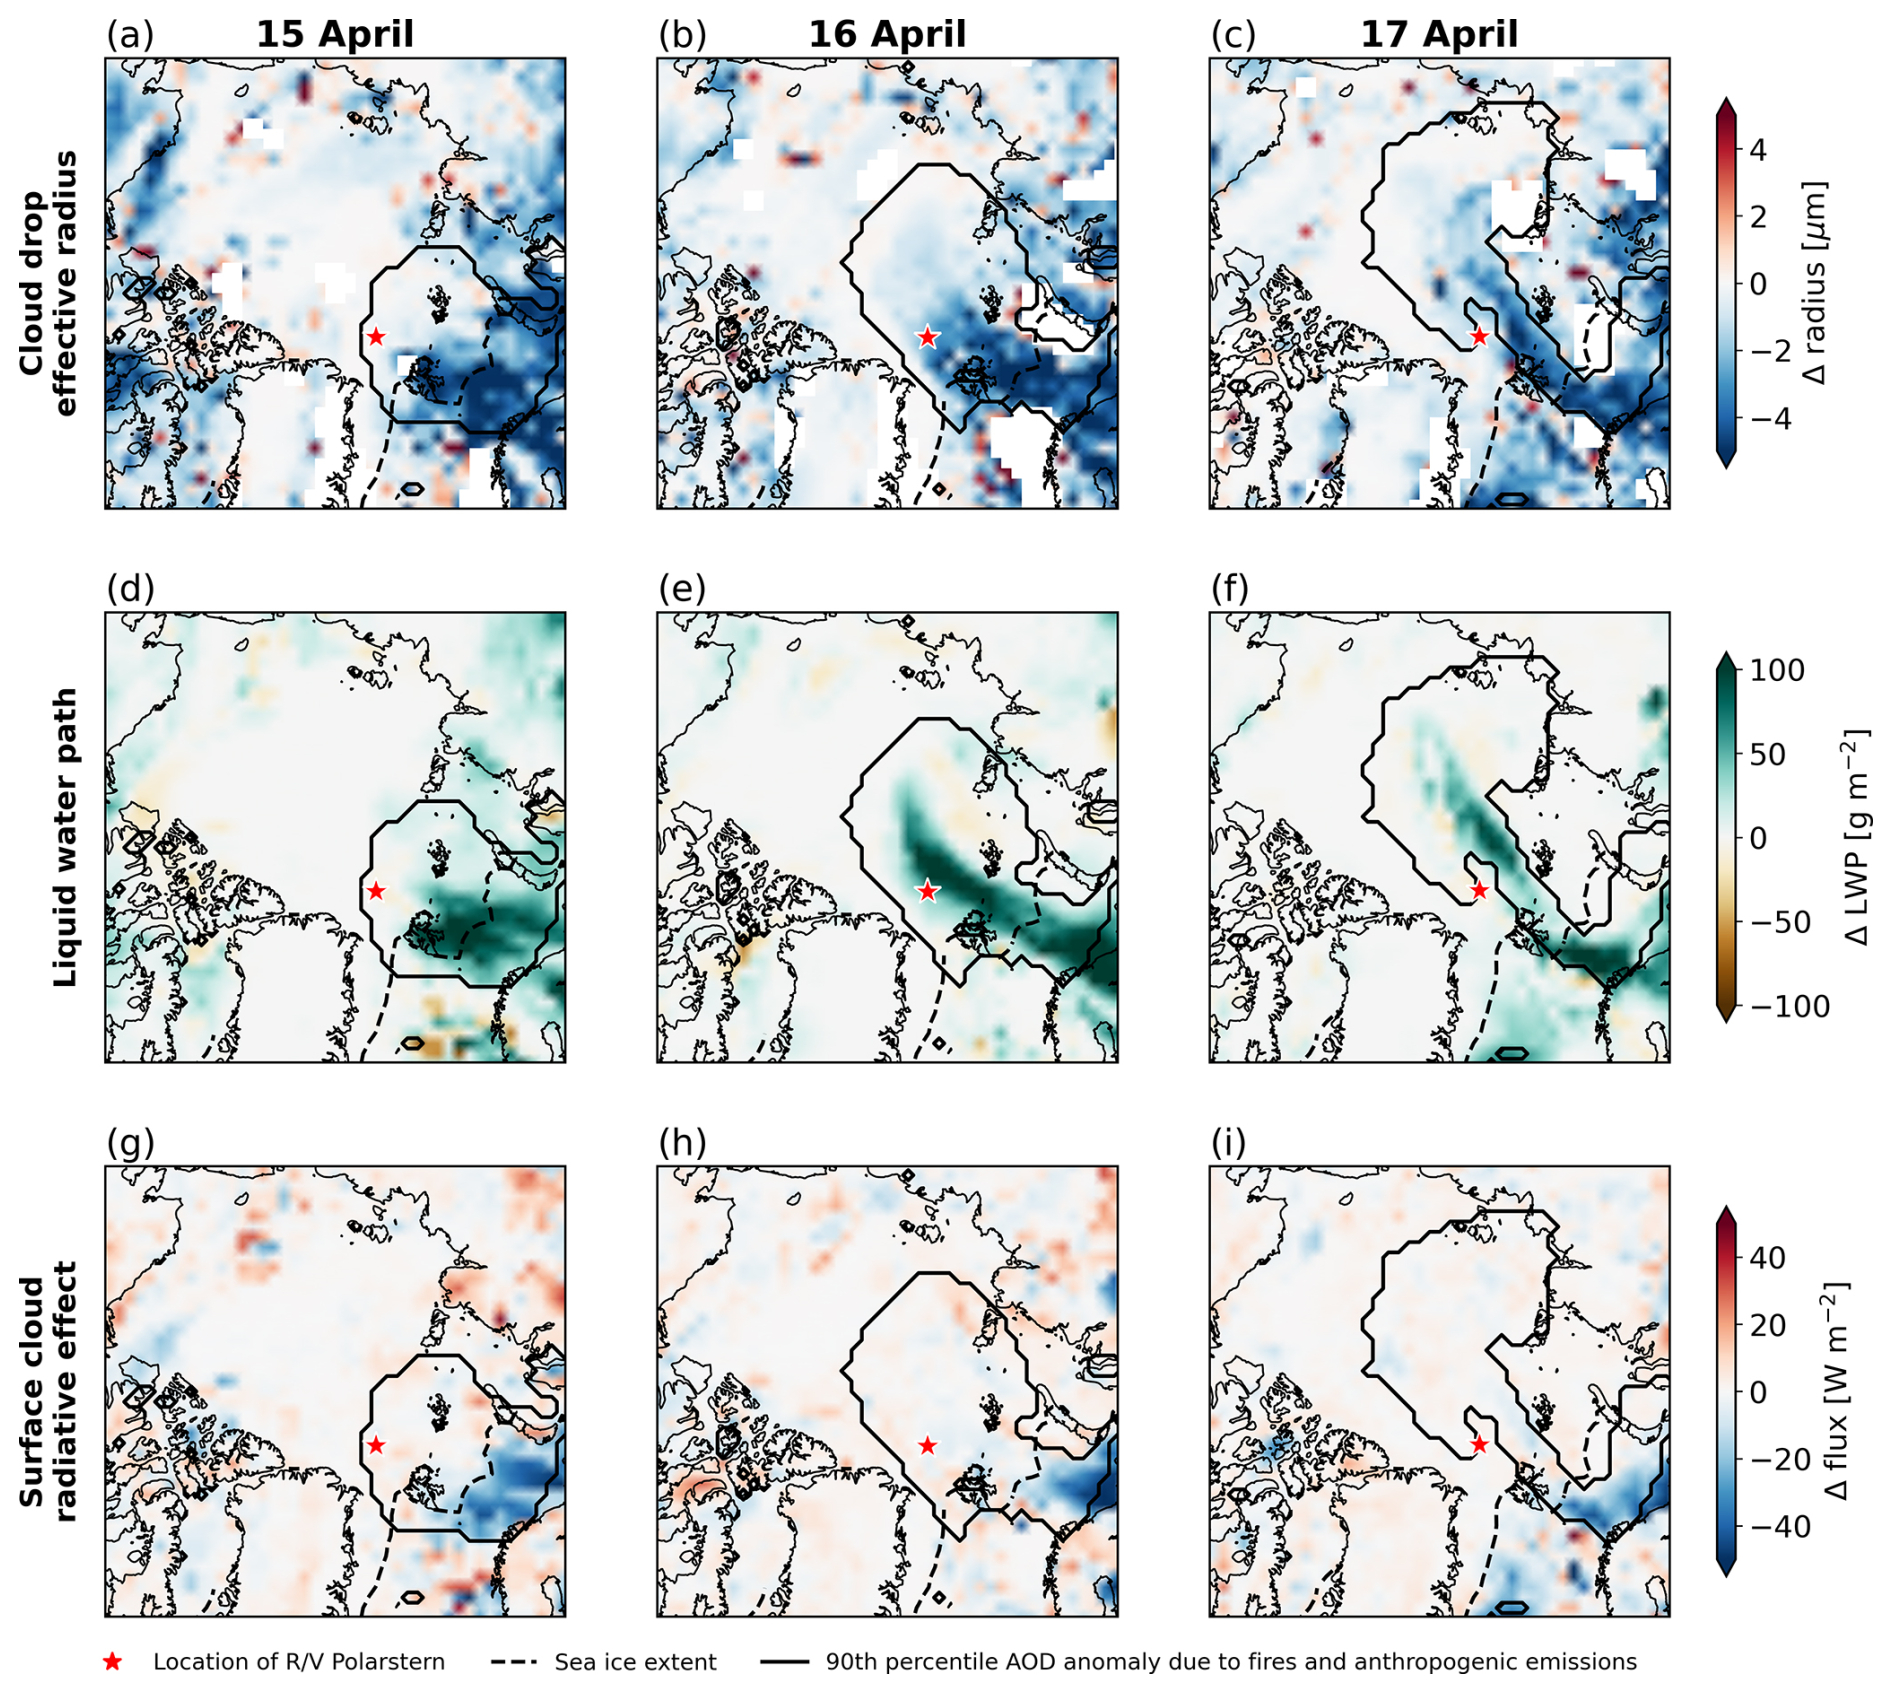
Figure 5Maps of daily mean anomaly of (a–c) cloud droplet effective radius (0–2 km altitude mean of grid boxes with non-zero cloud fraction), (d–f) cloud liquid water path and (g–i) total (LW+SW) surface cloud radiative effect between polluted and clean simulations. Red star indicates position of R/V Polarstern on each day. Solid black line indicates extent of 90th percentile of AOD anomaly each day. Black dashed line indicates WRF-Chem-Polar sea ice extent. Flux of cloud radiative effect is defined as positive towards surface.
The strong increase in aerosol number concentration in the model due to the polluted air leads to more and smaller cloud droplets. Figure 5a–c show the daily mean anomaly of cloud droplet effective radius between the two simulations. The anomalies are calculated as the mean between 0–2 km altitude of cloud-containing grid boxes, i.e. grid boxes where cloud fraction is non-zero. The altitude 0–2 km is selected as the altitude at which the model simulates clouds during the event (not shown). The spatial extent of the polluted air mass can be defined by selecting grid points where the AOD anomaly between the two simulations exceeds a given threshold, here we use the 90 % percentile of all AOD anomaly values between 13 and 17 April (solid black outline in all panels of Fig. 5). Cloud droplet effective radius decreases in the presence of the pollution (negative anomalies), suggesting that high aerosol loading causes a higher number of smaller cloud droplets compared to cleaner air. This aerosol-cloud interaction suppresses the formation of rain from cloud water, since smaller droplets are less efficient at forming rain. Positive anomalies in the simulated cloud liquid water path (Fig. 5d–f) are consistent with this precipitation suppression mechanism.
The influence of changing cloud properties on total surface radiative flux can be seen in Fig. 5g–i, which show anomalies in surface cloud radiative effect. Over open ocean, regions of smaller droplets and higher liquid water path are associated with a strong surface cooling effect of up to 50 W m−2. This cooling is driven by higher cloud optical depth and albedo, causing more incoming radiation to be reflected back to space. In contrast, these strong radiative effects do not occur over high-albedo, ice-covered surfaces. This is evident by the spatial relationship between the strength of the surface cloud radiative effect anomalies and the extent of the sea ice in the model (black dashed line in all panels of Fig. 5).
In the Arctic, higher cloud optical depth can also be associated with a surface warming effect by trapping more outgoing longwave radiation, especially over bright surfaces where shortwave cloud cooling is limited. However, in this case we find that the model does not predict a strong effect from such longwave warming at the surface. The simulated clouds appear to be sufficiently thick that their emissivity is already saturated and thus there is limited effect from increased aerosol burden (Garrett and Zhao, 2006). Regions of increased cloud fraction do lead to surface longwave warming (not shown), however, these regions that experience longwave warming are not widespread and are typically offset by shortwave cooling.
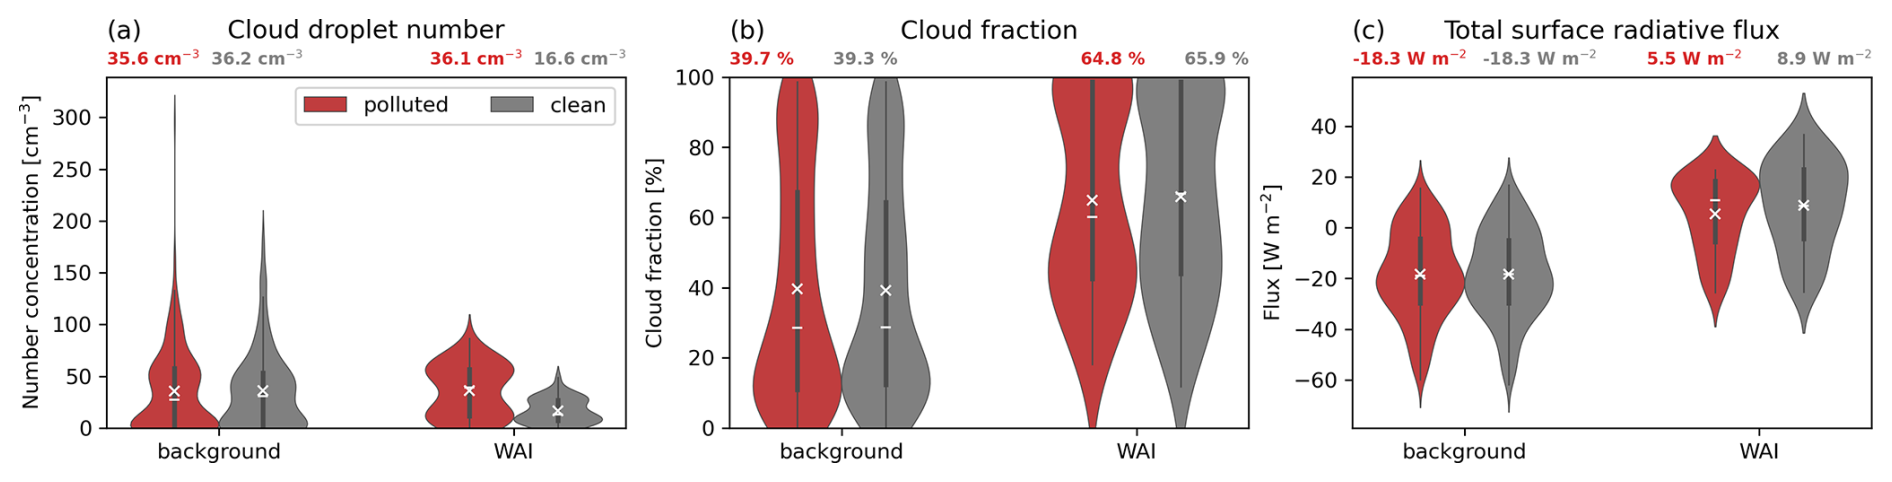
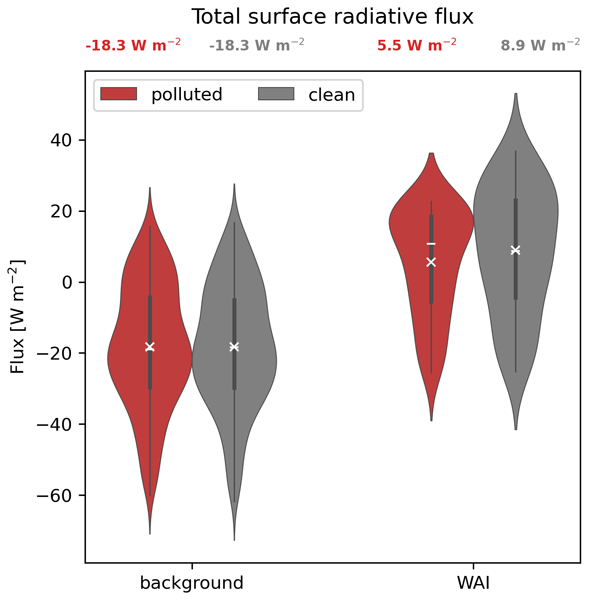
Figure 6Simulated distributions at ship position of (a) mean cloud droplet number concentration between 0 and 2 km altitude (in-cloud values only), (b) mean cloud fraction between 0 and 2 km altitude, and (c) total surface radiative flux. Distributions are calculated for the background (1–13 April) and the WAI (15–16 April), and from polluted (red) and clean (grey) simulations. Mean (white cross) and median (white line) values are shown for each distribution, mean value is shown above each distribution in text.
Figure 6 shows simulated distributions of cloud fraction, cloud droplet number concentration, and surface radiative flux during the background and the WAI. Distributions of cloud droplet number concentration and cloud fraction are calculated for altitudes between 0 and 2 km, corresponding to the altitudes where clouds are simulated in the model (not shown). The distributions are taken from model output that was collocated with the position of R/V Polarstern. Before the WAI, cloud fraction below 2 km altitude is not sensitive to the anthropogenic emissions, with mean values of 39.7 % and 39.3 % from the polluted and clean simulations, respectively. During the WAI, the cloud fraction below 2 km is substantially higher on average, with mean values of 64.8 % in the polluted simulation and 65.9 % in the clean simulation. Although the polluted and clean simulations differ more during the WAI than during the background, the difference between the two simulations during the WAI is much less than the difference between background and WAI conditions.
The impact of pollution during the WAI is clearest in the distributions of cloud droplet number concentration. The polluted simulation predicts a small increase in mean cloud droplet number from 35.5 cm−3 in the background to 36.1 cm−3 in the WAI, whereas the clean simulation actually predicts a decrease from 36.2 to 16.6 cm−3. However, Fig. 6c shows only limited surface radiative effects of the droplet number perturbation. The WAI consistently increases total radiative flux at the surface. In the polluted simulation, surface flux increases from −18.3 to 5.5 W m−2 during the WAI whereas the difference between the two simulations during the WAI is about 3.4 W m−2. This small difference is driven by stronger shortwave cooling in the polluted simulation as result of the higher droplet number. Overall, the increase in surface radiative flux from the background to the WAI is driven by longwave warming due to increased cloud occurrence and optical depth.
Using WRF-Chem-Polar, we simulated a warm air mass intrusion observed in the central Arctic during the MOSAiC expedition. By running simulations with and without anthropogenic aerosol emissions, we isolated and quantified the effect of the observed extreme anomalies in aerosol burden on cloud properties and surface radiation during the warm air intrusion event. Cloud droplet number concentration and liquid water content are 117 % and 52 % higher, respectively, in the polluted simulation than the clean simulations. This leads to strong surface cooling over open ocean regions, whereas the surface cooling effect is strongly limited over the sea ice region, where albedo is already high. This study builds on previous observational (Dada et al., 2022) and modelling (Kirbus et al., 2023) studies of the same event by using a coupled aerosol-cloud microphysics model configuration, confirming the link between high aerosol loading and cloud water content that was seen in idealised LES simulations presented in Kirbus et al. (2023) and quantifying the resulting surface radiative effect, with sea ice playing an important role in controlling the local response. We caution that the coarse horizontal resolution (100 km) may introduce limitations due to uncertainties in sub-grid cloud parameterisations, including those related to mixed and ice-phase cloud processes and their interactions with aerosols, which we have not considered in this study. However, sensitivity tests with two microphysics schemes suggest that the surface radiative impact of the anthropogenic aerosol is no more sensitive to this choice than the baseline surface warming of the event itself. Moreover, although we performed model evaluation at the surface for the central Arctic, there is a lack of detailed aerosol microphysical measurements available at cloud level. It is therefore a limitation of the current study that we cannot further constrain the model representation of aerosol at the cloud level, where it is most relevant for the impacts we investigate. The results address the following questions:
-
Can this warm air mass intrusion be reproduced in a regional chemistry-climate model? We have shown that this configuration of WRF-Chem-Polar can accurately simulate the event as it was observed during MOSAiC, including the rapid increase in near-surface temperature, the transition from (radiatively transparent) cloud-free or nearly cloud-free conditions to (radiatively opaque) cloudy conditions, and the strong increase in anthropogenic aerosol. This is despite some limitations in the model regarding the fidelity of aerosol mass concentration during the event (model underestimation of aerosols in the central Arctic). Furthermore, we used two different model cloud microphysics schemes to test the sensitivity of our results to the treatment of cloud processes. We found that the results are fairly insensitive to these different treatments of clouds, with both microphysics schemes producing similar cloud radiative effects despite the fact that the results of one of the schemes agree much better with the in-situ aerosol mass measurements from MOSAiC than the other. A limitation of this study is the lack of an evaluation of aerosol properties at cloud level, due to a lack of aerosol microphysical measurements aloft. However, we note that the WAI promoted strong vertical mixing in the lower atmosphere during the event (Dada et al., 2022; Angot et al., 2026), increasing our confidence that the evaluation of aerosols at the surface can provide some constraint on the aerosols aloft. Overall, we have demonstrated the value of using a regional chemistry-climate model with sophisticated aerosol and cloud schemes to study aerosol-cloud interactions in an event such as this.
-
Do transported anthropogenic aerosols influence clouds and surface radiation during the warm air mass intrusion? Our results show that despite a clear impact on cloud properties due to the transport of anthropogenic aerosols during the event, surface radiative impacts of these aerosol-cloud interactions are limited to open ocean regions, with only very weak responses over sea ice. Changes to cloud droplet number and liquid water content reduce the incoming shortwave radiation, but the magnitude of this effect is limited over the sea ice surface where the albedo is already high. Note that this dependence of radiative effect on surface type is specific to this season, whereas in polar night this shortwave effect would not take place and the total cloud radiative effect would therefore be controlled by the longwave response (in this case a weaker effect). While it has been hypothesised that the increase in cloud liquid water due to the pollution could cause surface warming from an increase in downwelling longwave radiation, we find that this does not take place. This is because the cloud emissivity is already saturated even without the pollution, likely due to the warm, moist conditions of the WAI combined with the moderately polluted Arctic haze background. The surface radiative impacts of the aerosols transported into the central Arctic during this event are therefore likely to be strongly dictated by the seasonal conditions of the incoming shortwave radiation, sea ice and background aerosols.
-
What were the relative importance of aerosol anomalies vs. heat and moisture anomalies for the surface radiative budget? The extreme aerosol anomalies during the event produced only a limited surface radiative impact compared with the strong surface radiative perturbation associated with the warm air mass intrusion itself. The radiative impact of the WAI without pollution (calculated from the increase in total surface radiative flux in our clean simulation) is a surface warming of 27.2 W m−2. When we include the effects of the pollution transport, the radiative impact is 23.8 W m−2. This implies that the additional radiative impact of the pollution transport is a cooling effect of 3.4 W m−2 relative to the strong overall warming from the WAI. The surface radiative impact of this event is therefore dominated by the longwave warming resulting from the perturbations to clouds and lower atmosphere caused by the strong heat and moisture transport. Note that because this was a particularly intense WAI event in terms of the impacts on temperature, moisture, and surface energy budget, it is possible that equivalent aerosol transport during an event with a weaker thermodynamical forcing could produce a relatively stronger effect.
-
What are the implications of this analysis for global-scale models, both in the present day and in future Arctic climate? Our analysis has shown that we need to be able to understand how extreme events such as these will evolve in a changing Arctic climate. For this extreme event that occurred during present-day Arctic spring, when background aerosol levels are already raised due to haze and underlying surface albedo is high, even an exceptionally strong extreme in aerosol loading does not cause a strong cloud radiative effect. However, in a future Arctic, two counteracting changes will alter this balance: sea ice loss will lower surface albedo, while declining anthropogenic emissions at lower latitudes will reduce the background aerosol burden. Together, these changes could amplify the surface radiative impact of extreme aerosol events, with the result that anthropogenic aerosol may exert a stronger cooling effect over an ice-free Arctic than it does today. However, predicting such a future cooling effect is made more difficult due to uncertainties in the role of natural polar aerosol sources (which will also be affected by sea ice loss) and future transport of anthropogenic aerosol and extreme events. Moreover, the relative importance of aerosol forcing could be greater for events that are less intense than this one was in terms of the thermodynamical forcing on the surface energy budget. Thus, the radiative effects of aerosol transport also depend on trends in moisture and energy transport driven by WAI events, which are subject to large uncertainties (Zhang et al., 2023). Comprehensive modelling and observational approaches are needed to understand this evolving system, capable of capturing the interacting effects of sea ice loss, shifts in large-scale dynamics, and changing aerosol processes.
Table A1WRF-Chem-Polar model configuration as used in this study.
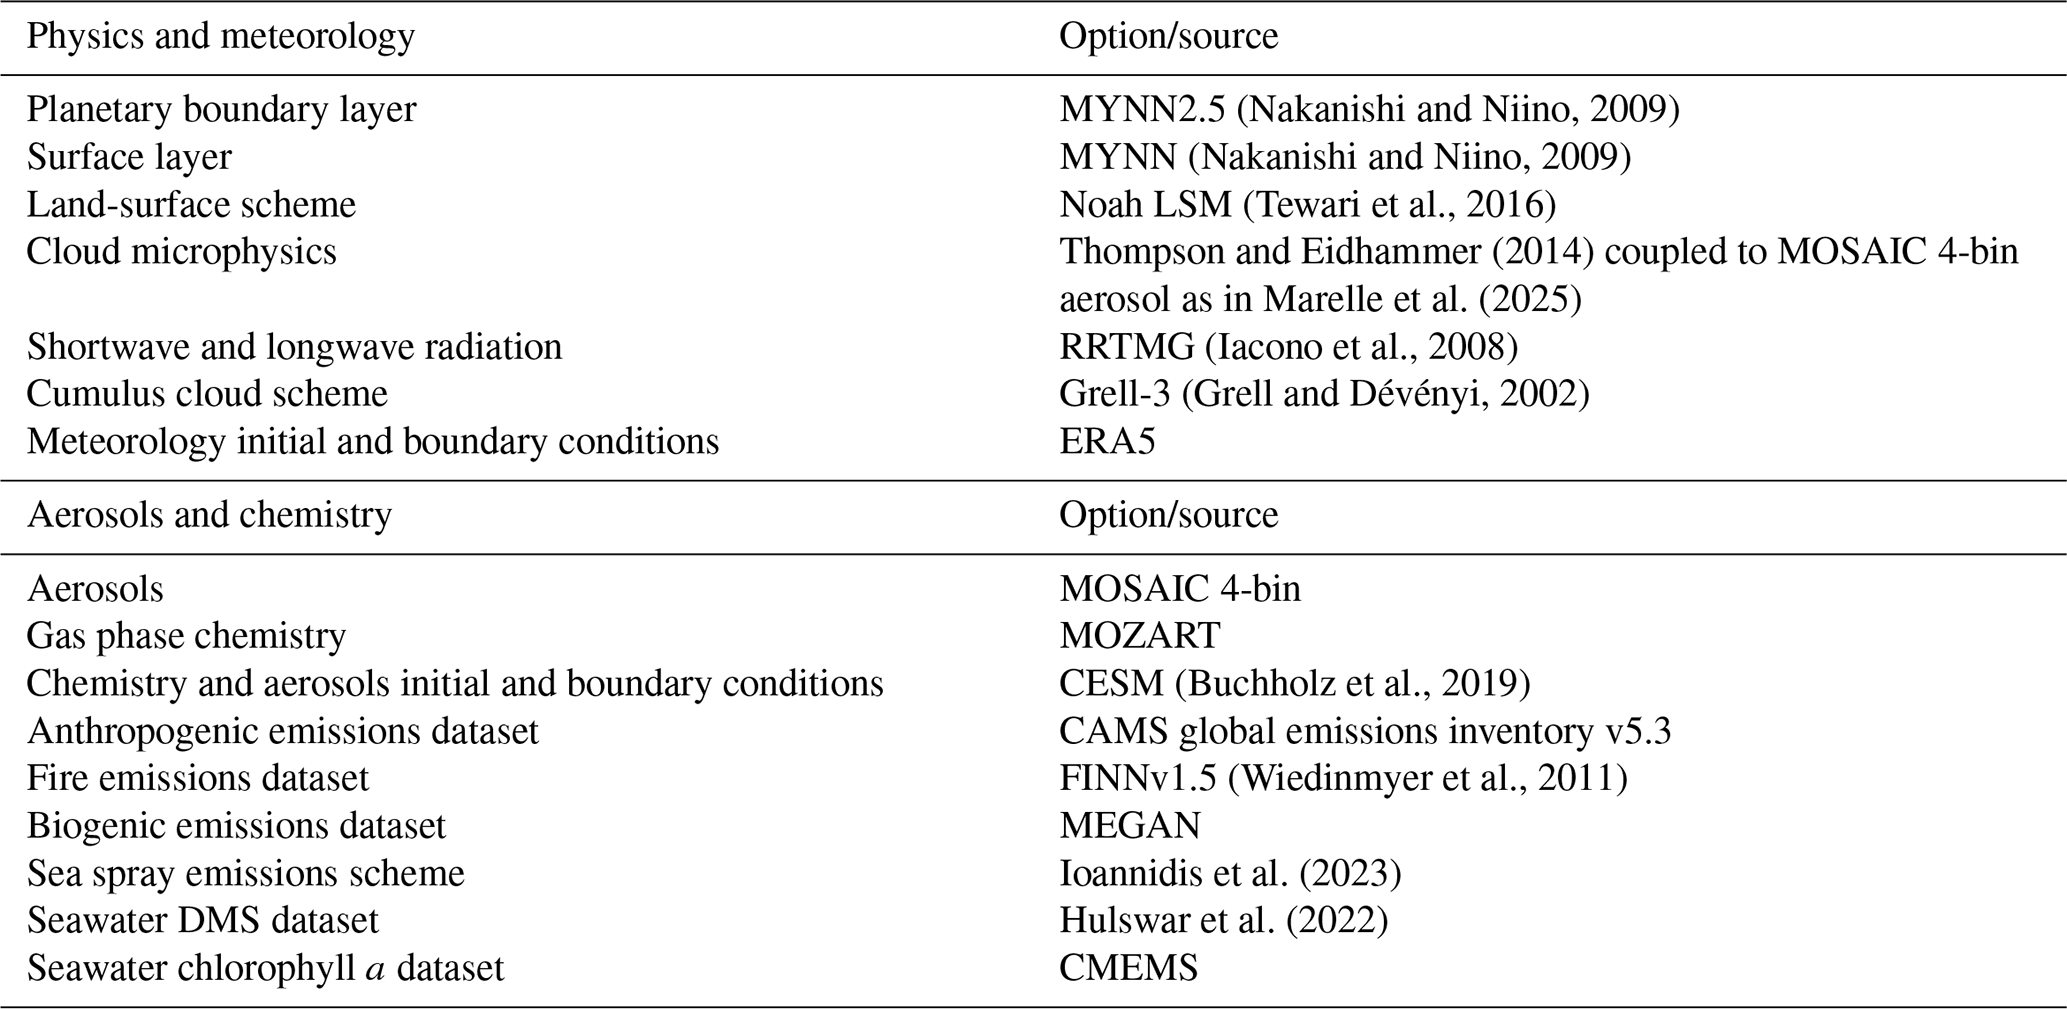
Figure A1 shows the comparison of simulated and measured aerosol mass concentration at the R/V Polarstern for the simulations using Morrison cloud microphysics. The model-observation agreement for these simulations is substantially worse than for the simulations using Thompson microphysics (Fig. 4). The difference is likely to be caused by differences in the strength of aerosol removal during transport, since both simulations use the same CAMS emissions and ERA5 meteorology for boundary and initial conditions. The two simulations also agree much better for PM2.5 mass concentration over Europe (not shown), further pointing to processes during transport to the central Arctic. Despite the poor model performance from Morrison shown in Fig. A1, the two schemes are consistent in that cloud properties and total surface radiative flux remain more sensitive to the WAI thermodynamical forcing than to the pollution (Fig. A2).
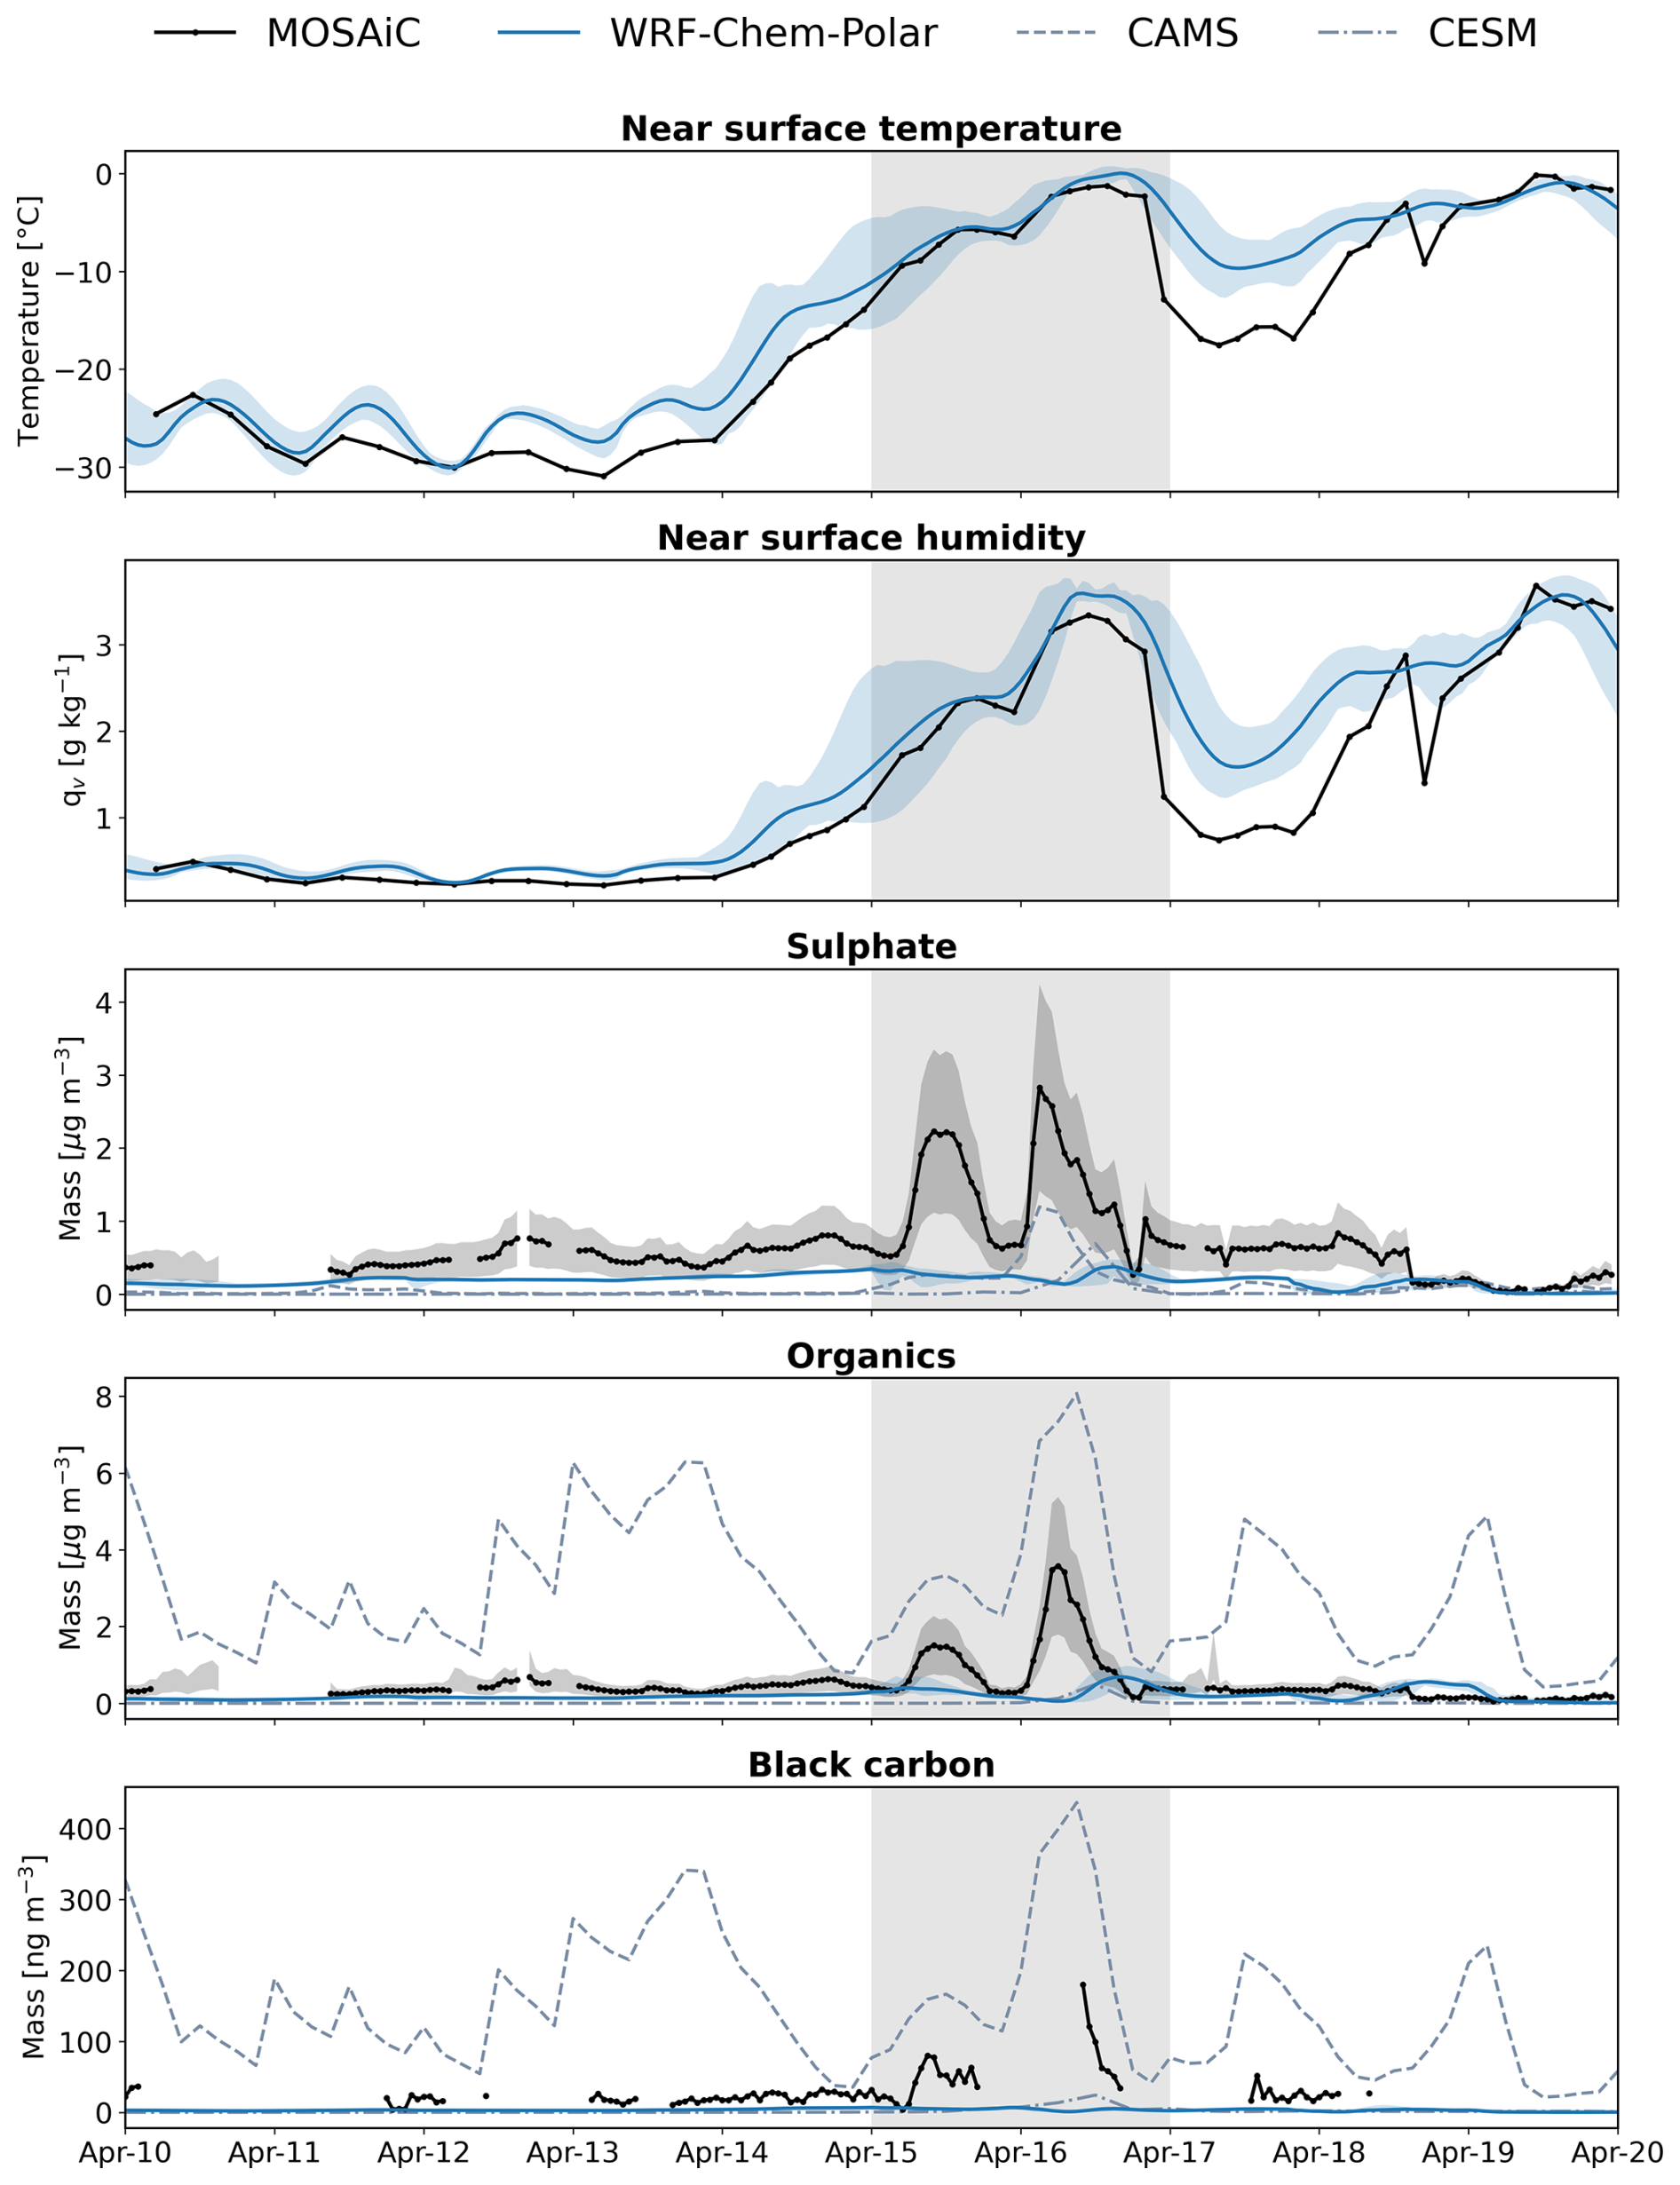
Figure A1As Fig. 4 but showing WRF-Chem-Polar model output using the Morrison cloud microphysics scheme (solid blue lines).
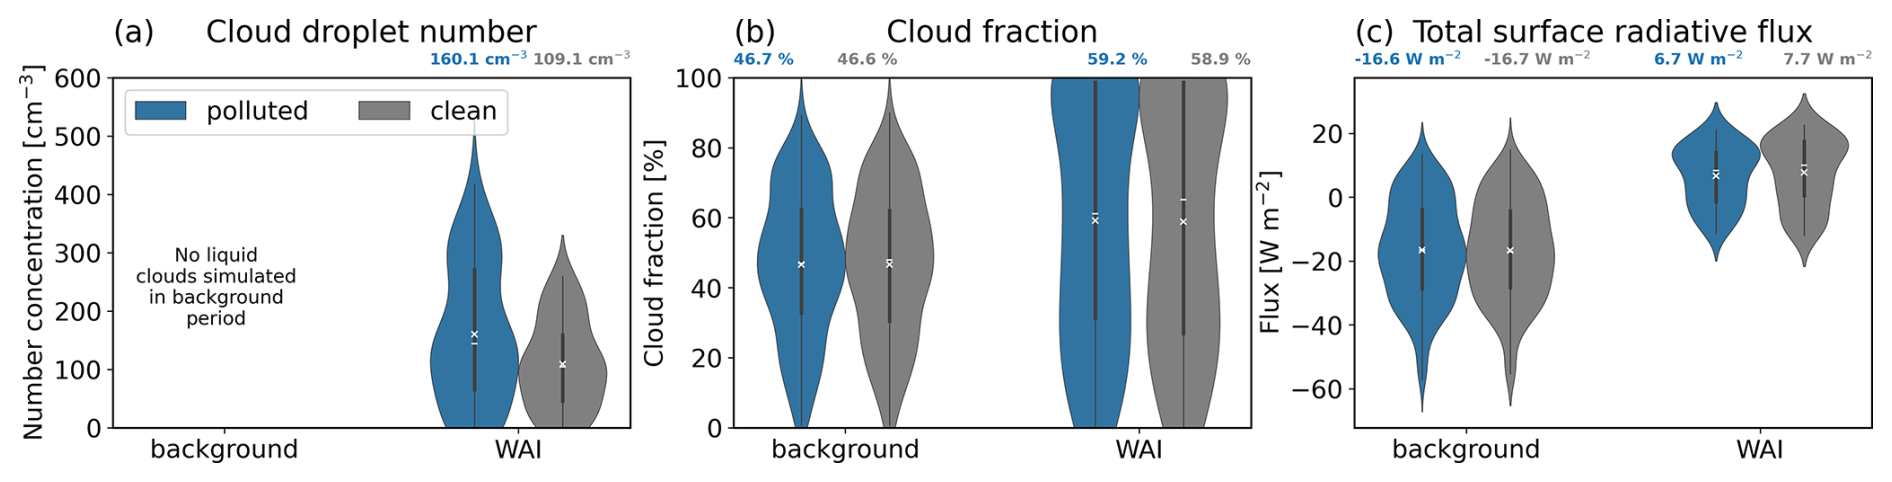
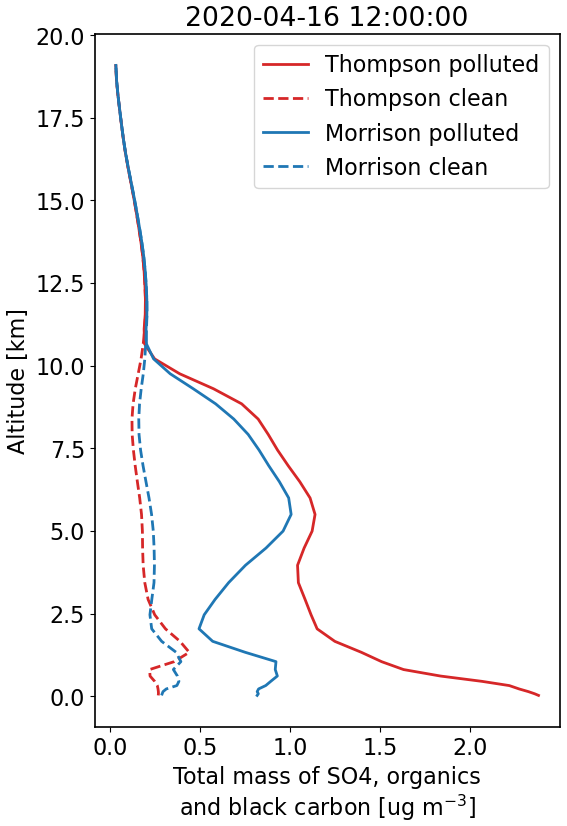
Figure A3Vertical profiles of aerosol mass concentration from Thompson (red) and Morrison (blue) simulations under polluted (solid lines) and clean (dashed lines) conditions. Aerosol mass is calculated as the total of sulphate, organics, and black carbon.
The WRF-Chem-Polar model version used in this study is available at https://doi.org/10.5281/zenodo.19736986 (Marelle et al., 2026). Model namelists, run scripts, and code to reproduce the figures are available at https://doi.org/10.5281/zenodo.19568552 (Price, 2026a). ERA5 meteorological data used to drive the model is available from ECMWF at https://doi.org/10.24381/cds.bd0915c6 (Hersbach et al., 2023a) for pressure levels and https://doi.org/10.24381/cds.adbb2d47 (Hersbach et al., 2023b) for single levels. Ocean chlorophyll a data used to drive marine aerosol emissions in the model is taken from the daily product of the Global Ocean Biogeochemistry Hindcast available from Copernicus Marine Service, distributed via https://data.marine.copernicus.eu/ (last access: 10 November 2026). Seawater DMS used to drive ocean emissions of DMS in the model is taken from Hulswar et al. (2022). CAM-Chem data for initial and boundary conditions of model aerosols are available from Buchholz et al. (2019). Anthropogenic aerosol emissions are taken from CAMS global emission dataset inventory version 5.3, available at https://doi.org/10.24381/1d158bec (Granier et al., 2019). Fire emissions are taken from version 1.5 of the FINN dataset distributed by NCAR at https://www.acom.ucar.edu/Data/fire/ (last access: 10 November 2026) and described in Wiedinmyer et al. (2011). The processed WRF-Chem-Polar model output required to reproduce the figures is available at https://doi.org/10.5281/zenodo.19564870 (Price, 2026b). EMEP measurements of PM2.5 for April 2020 were taken from the EBAS database at https://ebas-data.nilu.no/ (last access: 10 November 2026) (EBAS database filters used to find the data are included in the code for figures). Temperature and humidity measurements from MOSAiC are available from https://doi.org/10.1594/PANGAEA.957760 (Jozef et al., 2023). Aerosol mass spectrometer and black carbon aethalometer measurements taken during MOSAiC are available at https://doi.org/10.1594/PANGAEA.961009 (Heutte et al., 2023) and https://doi.org/10.1594/PANGAEA.952251 (Heutte et al., 2022) respectively. EAC4 aerosol mass mixing ratios are available from CAMS at https://doi.org/10.24381/d58bbf47 (Inness et al., 2019) (EAC4 download script included in code for figures).
RP ran the model simulations, in collaboration with LM, RL, LB and JLT. RP analysed output and made figures with input from JLT, LM, RL, LB, and JCR. JS, BH, and HA collaborated with interpretation and analysis of observational data. RP, JLT, and LM contributed towards the design of the study. All authors were involved in discussion of results and writing of the paper.
The contact author has declared that none of the authors has any competing interests.
Publisher's note: Copernicus Publications remains neutral with regard to jurisdictional claims made in the text, published maps, institutional affiliations, or any other geographical representation in this paper. The authors bear the ultimate responsibility for providing appropriate place names. Views expressed in the text are those of the authors and do not necessarily reflect the views of the publisher.
This study benefited from access to IDRIS HPC resources (GENCI allocation A019017141), and from the IPSL Data and Computing Center ESPRI which is supported by CNRS, SU, CNES and Ecole Polytechnique and funded by the CERTAINTY project. Computations presented in this paper were also performed using the GRICAD infrastructure (https://gricad.univ-grenoble-alpes.fr, last access: 10 November 2026), which is supported by Grenoble research communities. We acknowledge use of the WRF-Chem preprocessor tools adapted from those that are provided by the Atmospheric Chemistry Observations and Modeling Lab (ACOM) of NCAR. Data reported in this manuscript were produced as part of the international Multidisciplinary drifting Observatory for the Study of Arctic Climate (MOSAiC) expedition with the tag MOSAiC20192020, with activities supported by Polarstern expedition AWI_PS122_00. The authors would like to thank the teams at the Paul Scherrer Institute and INAR for their land-based support during the MOSAiC expedition. We also thank all those who contributed to MOSAiC and made this endeavour possible (https://doi.org/10.5281/zenodo.5541624, Nixdorf et al., 2021).
This project has received funding from Horizon Europe programme under Grant Agreement No. 101137680 via project CERTAINTY (Cloud-aERosol inTeractions and their impActs IN The earth sYstem). This research also received funding from the French National Research Agency (ANR) project MPC2 (no. ANR‐22‐CEA01‐0009‐02). HA received funding by the ANR ATOX (ANR-24-CE01-7616) project. RP received funding from the Make Our Planet Great Again Visiting Fellowship Program 2025 funded by the French Ministry of Europe and Foreign Affairs. This research was funded by the Swiss National Science Foundation (grant no. 200021_188478) and the Swiss Polar Institute (grant no. DIRCR-2018-004). JS holds the Ingvar Kamprad chair for extreme environments research, sponsored by Ferring Pharmaceuticals. This project has received funding from the European Union's Horizon 2020 research and innovation program under grant agreement no. 101003826 via project CRiceS (Climate Relevant interactions and feedbacks: the key role of sea ice and Snow in the polar and global climate system). We acknowledge funding from the US Department of Energy under grant no. DESC0022046.
This paper was edited by Tom Goren and reviewed by two anonymous referees.
Ahmed, S., Thomas, J. L., Angot, H., Dommergue, A., Archer, S. D., Bariteau, L., Beck, I., Benavent, N., Blechschmidt, A.-M., Blomquist, B., Boyer, M., Christensen, J. H., Dahlke, S., Dastoor, A., Helmig, D., Howard, D., Jacobi, H.-W., Jokinen, T., Lapere, R., Laurila, T., Quéléver, L. L. J., Richter, A., Ryjkov, A., Mahajan, A. S., Marelle, L., Pfaffhuber, K. A., Posman, K., Rinke, A., Saiz-Lopez, A., Schmale, J., Skov, H., Steffen, A., Stupple, G., Stutz, J., Travnikov, O., and Zilker, B.: Modelling the coupled mercury-halogen-ozone cycle in the central Arctic during spring, Elementa: Science of the Anthropocene, 11, 00129, https://doi.org/10.1525/elementa.2022.00129, 2023. a
Angot, H., Réveillet, M., Dada, L., Jacobi, H.-W., Archer, S. D., Bariteau, L., Barten, J. G. M., Beck, I., Bergner, N., Blomquist, B., Bourgeois, I., Boyer, M., Bucci, S., Creamean, J., Barry, K., Cox, C. J., Dahlke, S., Duetsch, M., Dumont, M., Ganzeveld, L. N., Helmig, D., Heutte, B., Howard, D., Jokinen, T., Laurila, T., Macfarlane, A. R., Pernov, J. B., Persson, P. O. G., Posman, K. M., Quéléver, L., Shupe, M. D., Stohl, A., and Schmale, J.: Influence of warm and moist air intrusions on black carbon deposition and snowmelt in the central Arctic, Elementa: Science of the Anthropocene, 14, 00124, https://doi.org/10.1525/elementa.2025.00124, 2026. a, b, c
Beck, I., Angot, H., Baccarini, A., Dada, L., Quéléver, L., Jokinen, T., Laurila, T., Lampimäki, M., Bukowiecki, N., Boyer, M., Gong, X., Gysel-Beer, M., Petäjä, T., Wang, J., and Schmale, J.: Automated identification of local contamination in remote atmospheric composition time series, Atmos. Meas. Tech., 15, 4195–4224, https://doi.org/10.5194/amt-15-4195-2022, 2022. a
Buchholz, R. R., Emmons, L. K., Tilmes, S., and The CESM2 Development Team: CESM2.1/CAM-chem Instantaneous Output for Boundary Conditions, UCAR, https://doi.org/10.5065/NMP7-EP60, 2019. a, b, c
Dada, L., Angot, H., Beck, I., Baccarini, A., Quéléver, L. L. J., Boyer, M., Laurila, T., Brasseur, Z., Jozef, G., de Boer, G., Shupe, M. D., Henning, S., Bucci, S., Dütsch, M., Stohl, A., Petäjä, T., Daellenbach, K. R., Jokinen, T., and Schmale, J.: A central arctic extreme aerosol event triggered by a warm air-mass intrusion, Nat. Commun., 13, 5290, https://doi.org/10.1038/s41467-022-32872-2, 2022. a, b, c, d, e, f
Garrett, T. J. and Zhao, C.: Increased Arctic cloud longwave emissivity associated with pollution from mid-latitudes, Nature, 440, 787–789, https://doi.org/10.1038/nature04636, 2006. a
Granier, C., Darras, S., Denier van der Gon, H., Doubalova, J., Elguindi, N., Galle, B., Gauss, M., Guevara, M., Jalkanen, J.-P., Kuenen, J., Liousse, C., Quack, B., Simpson, D., and Sindelarova, K.: The Copernicus Atmosphere Monitoring Service global and regional emissions (April 2019 version), Copernicus Atmosphere Monitoring Service (CAMS) report [data set], https://doi.org/10.24380/d0bn-kx16, 2019. a
Grell, G. A. and Dévényi, D.: A generalized approach to parameterizing convection combining ensemble and data assimilation techniques, Geophys. Res. Lett., 29, 38–1–38–4, https://doi.org/10.1029/2002GL015311, 2002. a
Heutte, B., Beck, I., Quéléver, L., Jokinen, T., Laurila, T., Dada, L., and Schmale, J.: Equivalent black carbon concentration in 10 minutes time resolution, measured in the Swiss container during MOSAiC 2019/2020, PANGAEA [data set], https://doi.org/10.1594/PANGAEA.952251, 2022. a
Heutte, B., Dada, L., Angot, H., Daellenbach, K. R., El Haddad, I., Beck, I., Quéléver, L., Jokinen, T., Laurila, T., and Schmale, J.: Bulk size-resolved chemical composition and mass concentration of non-refractory submicron aerosols measured in the Swiss container during MOSAiC 2019/2020, PANGAEA [data set], https://doi.org/10.1594/PANGAEA.961009, 2023. a, b, c
Heutte, B., Bergner, N., Angot, H., Pernov, J. B., Dada, L., Mirrielees, J. A., Beck, I., Baccarini, A., Boyer, M., Creamean, J. M., Daellenbach, K. R., El Haddad, I., Frey, M. M., Henning, S., Laurila, T., Moschos, V., Petäjä, T., Pratt, K. A., Quéléver, L. L. J., Shupe, M. D., Zieger, P., Jokinen, T., and Schmale, J.: Observations of high-time-resolution and size-resolved aerosol chemical composition and microphysics in the central Arctic: implications for climate-relevant particle properties, Atmos. Chem. Phys., 25, 2207–2241, https://doi.org/10.5194/acp-25-2207-2025, 2025. a
Hersbach, H., Bell, B., Berrisford, P., Biavati, G., Horányi, A., Muñoz Sabater, J., Nicolas, J., Peubey, C., Radu, R., Rozum, I., Schepers, D., Simmons, A., Soci, C., Dee, D., and Thépaut, J.-N.: ERA5 hourly data on pressure levels from 1940 to present, Copernicus Climate Change Service (C3S) Climate Data Store (CDS) [data set], https://doi.org/10.24381/cds.bd0915c6, 2023a. a
Hersbach, H., Bell, B., Berrisford, P., Biavati, G., Horányi, A., Muñoz Sabater, J., Nicolas, J., Peubey, C., Radu, R., Rozum, I., Schepers, D., Simmons, A., Soci, C., Dee, D., and Thépaut, J.-N.: ERA5 hourly data on single levels from 1940 to present, Copernicus Climate Change Service (C3S) Climate Data Store (CDS) [data set], https://doi.org/10.24381/cds.adbb2d47, 2023b. a
Hulswar, S., Simó, R., Galí, M., Bell, T. G., Lana, A., Inamdar, S., Halloran, P. R., Manville, G., and Mahajan, A. S.: Third revision of the global surface seawater dimethyl sulfide climatology (DMS-Rev3), Earth Syst. Sci. Data, 14, 2963–2987, https://doi.org/10.5194/essd-14-2963-2022, 2022. a, b
Iacono, M. J., Delamere, J. S., Mlawer, E. J., Shephard, M. W., Clough, S. A., and Collins, W. D.: Radiative forcing by long-lived greenhouse gases: Calculations with the AER radiative transfer models, J. Geophys. Res.-Atmos., 113, https://doi.org/10.1029/2008JD009944, 2008. a
Inness, A., Ades, M., Agustí-Panareda, A., Barré, J., Benedictow, A., Blechschmidt, A.-M., Dominguez, J. J., Engelen, R., Eskes, H., Flemming, J., Huijnen, V., Jones, L., Kipling, Z., Massart, S., Parrington, M., Peuch, V.-H., Razinger, M., Remy, S., Schulz, M., and Suttie, M.: The CAMS reanalysis of atmospheric composition, Atmos. Chem. Phys., 19, 3515–3556, https://doi.org/10.5194/acp-19-3515-2019, 2019. a, b, c
Ioannidis, E., Law, K. S., Raut, J.-C., Marelle, L., Onishi, T., Kirpes, R. M., Upchurch, L. M., Tuch, T., Wiedensohler, A., Massling, A., Skov, H., Quinn, P. K., and Pratt, K. A.: Modelling wintertime sea-spray aerosols under Arctic haze conditions, Atmos. Chem. Phys., 23, 5641–5678, https://doi.org/10.5194/acp-23-5641-2023, 2023. a, b
Jia, H., Quaas, J., Kroese, W., van Diedenhoven, B., Gryspeerdt, E., Böhm, C., Block, K., and Hasekamp, O.: Optimal choice of proxy for cloud condensation nuclei reduces uncertainty in aerosol-cloud-climate forcing, Sci. Adv., 12, https://doi.org/10.1126/sciadv.aea4828, 2026. a
Jozef, G., Klingel, R., Cassano, J. J., Maronga, B., Boer, G. d., Dahlke, S., and Cox, C. J.: Lower atmospheric properties relating to temperature, wind, stability, moisture, and surface radiation budget over the central Arctic sea ice during MOSAiC, PANGAEA [data set], https://doi.org/10.1594/PANGAEA.957760, 2023. a, b
Kapsch, M.-L., Graversen, R. G., and Tjernström, M.: Springtime atmospheric energy transport and the control of Arctic summer sea-ice extent, Nat. Clim. Change, 3, 744–748, https://doi.org/10.1038/nclimate1884, 2013. a
Kirbus, B., Tiedeck, S., Camplani, A., Chylik, J., Crewell, S., Dahlke, S., Ebell, K., Gorodetskaya, I., Griesche, H., Handorf, D., Höschel, I., Lauer, M., Neggers, R., Rückert, J., Shupe, M. D., Spreen, G., Walbröl, A., Wendisch, M., and Rinke, A.: Surface impacts and associated mechanisms of a moisture intrusion into the Arctic observed in mid-April 2020 during MOSAiC, Front. Earth Sci., 11, https://doi.org/10.3389/feart.2023.1147848, 2023. a, b, c, d
Lapere, R., Marelle, L., Rampal, P., Brodeau, L., Melsheimer, C., Spreen, G., and Thomas, J. L.: Modeling the contribution of leads to sea spray aerosol in the high Arctic, Atmos. Chem. Phys., 24, 12107–12132, https://doi.org/10.5194/acp-24-12107-2024, 2024a. a
Lapere, R., Thomas, J. L., Favier, V., Angot, H., Asplund, J., Ekman, A. M. L., Marelle, L., Raut, J.-C., Da Silva, A., Wille, J. D., and Zieger, P.: Polar Aerosol Atmospheric Rivers: Detection, Characteristics, and Potential Applications, J. Geophys. Res.-Atmos., 129, https://doi.org/10.1029/2023JD039606, 2024b. a
Lapere, R., Haddon, A., Price, R., Marelle, L., Monahan, A. H., Steiner, N. S., Raut, J.-C., Bastien, L., and Thomas, J. L.: Oceanic DMS strongly affects aerosols and clouds in the Arctic, Geophys. Res. Lett., 53, e2026GL121724, https://doi.org/10.1029/2026GL121724, 2025. a
Marelle, L., Raut, J.-C., Law, K. S., Berg, L. K., Fast, J. D., Easter, R. C., Shrivastava, M., and Thomas, J. L.: Improvements to the WRF-Chem 3.5.1 model for quasi-hemispheric simulations of aerosols and ozone in the Arctic, Geosci. Model Dev., 10, 3661–3677, https://doi.org/10.5194/gmd-10-3661-2017, 2017. a
Marelle, L., Thomas, J. L., Ahmed, S., Tuite, K., Stutz, J., Dommergue, A., Simpson, W. R., Frey, M. M., and Baladima, F.: Implementation and Impacts of Surface and Blowing Snow Sources of Arctic Bromine Activation Within WRF-Chem 4.1.1, J. Adv. Model. Earth Sy., 13, https://doi.org/10.1029/2020MS002391, 2021. a
Marelle, L., Myhre, G., Thomas, J. L., and Raut, J.-C.: Aerosol Background Concentrations Influence Aerosol-Cloud Interactions as Much as the Choice of Aerosol-Cloud Parameterization, Geophys. Res. Lett., 52, https://doi.org/10.1029/2024GL111780, 2025. a, b, c
Marelle, L., Lapere, R., Price, R., Bastien, L., and Jennie, T.: WRF-Chem-Polar/WRF-Chem-Polar, (Version price_warm_air_arctic), Zenodo [code], https://doi.org/10.5281/zenodo.19736986, 2026. a
Morrison, H., Thompson, G., and Tatarskii, V.: Impact of Cloud Microphysics on the Development of Trailing Stratiform Precipitation in a Simulated Squall Line: Comparison of One- and Two-Moment Schemes, Mon. Weather Rev., 137, 991–1007, https://doi.org/10.1175/2008MWR2556.1, 2009. a
Mortin, J., Svensson, G., Graversen, R. G., Kapsch, M.-L., Stroeve, J. C., and Boisvert, L. N.: Melt onset over Arctic sea ice controlled by atmospheric moisture transport, Geophys. Res. Lett., 43, 6636–6642, https://doi.org/10.1002/2016GL069330, 2016. a
Nakanishi, M. and Niino, H.: Development of an Improved Turbulence Closure Model for the Atmospheric Boundary Layer, J. Meteorol. Soc. Jpn., 87, 895–912, https://doi.org/10.2151/jmsj.87.895, 2009. a, b
Nixdorf, U., Dethloff, K., Rex, M., Shupe, M., Sommerfeld, A., Perovich, D. K., Nicolaus, M., Heuzé, C., Rabe, B., Loose, B., Damm, E., Gradinger, R., Fong, A., Maslowski, W., Rinke, A., Kwok, R., Spreen, G., Wendisch, M., Herber, A., …, and Boetius, A.: MOSAiC Extended Acknowledgement, Zenodo, https://doi.org/10.5281/zenodo.5541624, 2021. a
Pithan, F., Svensson, G., Caballero, R., Chechin, D., Cronin, T. W., Ekman, A. M. L., Neggers, R., Shupe, M. D., Solomon, A., Tjernström, M., and Wendisch, M.: Role of air-mass transformations in exchange between the Arctic and mid-latitudes, Nat. Geosci., 11, 805–812, https://doi.org/10.1038/s41561-018-0234-1, 2018. a, b
Price, R.: Code to reproduce figures for “Isolating the effect of aerosols on Arctic cloud radiative effects during a polluted warm air mass intrusion” (Version v1.0), Zenodo [code], https://doi.org/10.5281/zenodo.19568552, 2026a. a
Price, R.: Data to reproduce figures for “Isolating the effect of aerosols on Arctic cloud radiative effects during a polluted warm air mass intrusion”, Zenodo [data set], https://doi.org/10.5281/zenodo.19564870, 2026b. a
Rantanen, M., Karpechko, A. Y., Lipponen, A., Nordling, K., Hyvärinen, O., Ruosteenoja, K., Vihma, T., and Laaksonen, A.: The Arctic has warmed nearly four times faster than the globe since 1979, Commun. Earth Environ., 3, 168, https://doi.org/10.1038/s43247-022-00498-3, 2022. a
Shupe, M. D., Rex, M., Blomquist, B., Persson, P. O. G., Schmale, J., Uttal, T., Althausen, D., Angot, H., Archer, S., Bariteau, L., Beck, I., Bilberry, J., Bucci, S., Buck, C., Boyer, M., Brasseur, Z., Brooks, I. M., Calmer, R., Cassano, J., Castro, V., Chu, D., Costa, D., Cox, C. J., Creamean, J., Crewell, S., Dahlke, S., Damm, E., de Boer, G., Deckelmann, H., Dethloff, K., Dütsch, M., Ebell, K., Ehrlich, A., Ellis, J., Engelmann, R., Fong, A. A., Frey, M. M., Gallagher, M. R., Ganzeveld, L., Gradinger, R., Graeser, J., Greenamyer, V., Griesche, H., Griffiths, S., Hamilton, J., Heinemann, G., Helmig, D., Herber, A., Heuzé, C., Hofer, J., Houchens, T., Howard, D., Inoue, J., Jacobi, H.-W., Jaiser, R., Jokinen, T., Jourdan, O., Jozef, G., King, W., Kirchgaessner, A., Klingebiel, M., Krassovski, M., Krumpen, T., Lampert, A., Landing, W., Laurila, T., Lawrence, D., Lonardi, M., Loose, B., Lüpkes, C., Maahn, M., Macke, A., Maslowski, W., Marsay, C., Maturilli, M., Mech, M., Morris, S., Moser, M., Nicolaus, M., Ortega, P., Osborn, J., Pätzold, F., Perovich, D. K., Petäjä, T., Pilz, C., Pirazzini, R., Posman, K., Powers, H., Pratt, K. A., Preußer, A., Quéléver, L., Radenz, M., Rabe, B., Rinke, A., Sachs, T., Schulz, A., Siebert, H., Silva, T., Solomon, A., Sommerfeld, A., Spreen, G., Stephens, M., Stohl, A., Svensson, G., Uin, J., Viegas, J., Voigt, C., von der Gathen, P., Wehner, B., Welker, J. M., Wendisch, M., Werner, M., Xie, Z., and Yue, F.: Overview of the MOSAiC expedition: Atmosphere, Elementa: Science of the Anthropocene, 10, 00060, https://doi.org/10.1525/elementa.2021.00060, 2022. a
Skiles, S. M., Flanner, M., Cook, J. M., Dumont, M., and Painter, T. H.: Radiative forcing by light-absorbing particles in snow, Nat. Clim. Change, 8, 964–971, https://doi.org/10.1038/s41558-018-0296-5, 2018. a
Solomon, A., Shupe, M. D., and Miller, N. B.: Cloud–Atmospheric Boundary Layer–Surface Interactions on the Greenland Ice Sheet during the July 2012 Extreme Melt Event, J. Climate, 30, https://doi.org/10.1175/JCLI-D-16-0071.1, 2017. a
Stuecker, M. F., Bitz, C. M., Armour, K. C., Proistosescu, C., Kang, S. M., Xie, S.-P., Kim, D., McGregor, S., Zhang, W., Zhao, S., Cai, W., Dong, Y., and Jin, F.-F.: Polar amplification dominated by local forcing and feedbacks, Nat. Clim. Change, 8, 1076–1081, https://doi.org/10.1038/s41558-018-0339-y, 2018. a
Tewari, M., Wang, W., Dudhia, J., LeMone, M., Mitchell, K., Ek, M., Gayno, G., Wegiel, J., and Cuenca, R.: Implementation and verification of the united NOAH land surface model in the WRF model, 11–15, https://ams.confex.com/ams/84Annual/techprogram/paper_69061.htm (last access: 10 November 2026), 2016. a
Thomas, J. L., Polashenski, C. M., Soja, A. J., Marelle, L., Casey, K. A., Choi, H. D., Raut, J.-C., Wiedinmyer, C., Emmons, L. K., Fast, J. D., Pelon, J., Law, K. S., Flanner, M. G., and Dibb, J. E.: Quantifying black carbon deposition over the Greenland ice sheet from forest fires in Canada, Geophys. Res. Lett., 44, 7965–7974, https://doi.org/10.1002/2017GL073701, 2017. a
Thompson, G. and Eidhammer, T.: A Study of Aerosol Impacts on Clouds and Precipitation Development in a Large Winter Cyclone, J. Atmos. Sci., 71, 3636–3658, https://doi.org/10.1175/JAS-D-13-0305.1, 2014. a, b
Tørseth, K., Aas, W., Breivik, K., Fjæraa, A. M., Fiebig, M., Hjellbrekke, A. G., Lund Myhre, C., Solberg, S., and Yttri, K. E.: Introduction to the European Monitoring and Evaluation Programme (EMEP) and observed atmospheric composition change during 1972–2009, Atmos. Chem. Phys., 12, 5447–5481, https://doi.org/10.5194/acp-12-5447-2012, 2012. a
Whaley, C. H., Mahmood, R., von Salzen, K., Winter, B., Eckhardt, S., Arnold, S., Beagley, S., Becagli, S., Chien, R.-Y., Christensen, J., Damani, S. M., Dong, X., Eleftheriadis, K., Evangeliou, N., Faluvegi, G., Flanner, M., Fu, J. S., Gauss, M., Giardi, F., Gong, W., Hjorth, J. L., Huang, L., Im, U., Kanaya, Y., Krishnan, S., Klimont, Z., Kühn, T., Langner, J., Law, K. S., Marelle, L., Massling, A., Olivié, D., Onishi, T., Oshima, N., Peng, Y., Plummer, D. A., Popovicheva, O., Pozzoli, L., Raut, J.-C., Sand, M., Saunders, L. N., Schmale, J., Sharma, S., Skeie, R. B., Skov, H., Taketani, F., Thomas, M. A., Traversi, R., Tsigaridis, K., Tsyro, S., Turnock, S., Vitale, V., Walker, K. A., Wang, M., Watson-Parris, D., and Weiss-Gibbons, T.: Model evaluation of short-lived climate forcers for the Arctic Monitoring and Assessment Programme: a multi-species, multi-model study, Atmos. Chem. Phys., 22, 5775–5828, https://doi.org/10.5194/acp-22-5775-2022, 2022. a
Wiedinmyer, C., Akagi, S. K., Yokelson, R. J., Emmons, L. K., Al-Saadi, J. A., Orlando, J. J., and Soja, A. J.: The Fire INventory from NCAR (FINN): a high resolution global model to estimate the emissions from open burning, Geosci. Model Dev., 4, 625–641, https://doi.org/10.5194/gmd-4-625-2011, 2011. a, b
Woods, B., Boisvert, L., Parker, C., Valkonen, E., Taylor, P., Webster, M., and Linscott, G.: Understanding the Climatology and Characteristics of Arctic Moisture Intrusions, J. Geophys. Res.-Atmos., 131, https://doi.org/10.1029/2025JD044159, 2026. a
Zhang, C., Tung, W.-W., and Cleveland, W. S.: Climatology and decadal changes of Arctic atmospheric rivers based on ERA5 and MERRA-2, Environ. Res.-Climate, 2, 035005, https://doi.org/10.1088/2752-5295/acdf0f, 2023. a, b