
the Creative Commons Attribution 4.0 License.
the Creative Commons Attribution 4.0 License.
 | 16 Nov 2026
Meteorological conditions and aerosol-meteorology feedback drive divergent responses of co-occurring PM2.5 and O3 pollution to NOx–VOC perturbations in Beijing–Tianjin–Hebei–Shandong
Yi Gao
Yu Zhao

Zining Yang
Co-occurring PM2.5 and O3 pollution (Double High Pollution, DHP) is a growing concern, yet its response to emission controls under different meteorological conditions is poorly quantified. Previous studies focused on synoptic-scale classifications or single meteorological variables, largely neglecting aerosol-meteorology feedback. This study investigated the PM2.5 O3 response to NOx–VOC precursor perturbations, which jointly control O3 and nitrate, and the impact of aerosol-meteorology feedback on PM2.5 O3 response in Beijing–Tianjin–Hebei–Shandong in July 2020 using WRF-Chem. DHP occurred under warm (23–31 °C), moderately humid (45 %–80 %), and shallow boundary layer (0.5–1.1 km) conditions that were classified into five types: Convective, Stable, WarmHumid, DryHot, and Moderate based on boundary layer height, temperature and humidity. PM2.5 was highest under Stable and WarmHumid (∼ 46 µg m−3) and lowest under DryHot (∼ 40 µg m−3); O3 was highest under DryHot and Moderate (∼ 163 µg m−3) and lowest under WarmHumid (∼ 149 µg m−3). O3 responded most strongly under WarmHumid and weakest under DryHot at all joint reduction levels (−25.2 % and −23.3 % at NOx VOC) with stronger NOx sensitivity under WarmHumid and Convective; PM2.5 reductions were largest under Stable and WarmHumid (−20.6 % and −20.9 %) and smallest under DryHot (−15.2 %). Aerosol-meteorology feedback enhanced PM2.5 reduction most under Stable and WarmHumid but weakened O3 reduction under Stable for large NOx-only cuts, driven by the most lasting PBLH increase and strong OH amplification. These results demonstrate that meteorological condition-specific strategies, particularly coordinated NOx–VOC control under stagnant and humid summer conditions, are essential for effective DHP mitigation.
- Article
(7927 KB) - Full-text XML
-
Supplement
(5138 KB) - BibTeX
- EndNote


Fine particulate matter (PM2.5) concentration has decreased significantly across China over the past decades, particularly after the Air Pollution Prevention and Control Action Plan took effect in 2013. Nevertheless, surface ozone (O3) concentration has increased in several regions, adding complexity to the co-control of PM2.5 and O3 (Zhang et al., 2019; Liu et al., 2023; Wang et al., 2023). Recent nationwide evidence based on observations from 1092 sites (2015–2023) showed a clear trend evolution of co-occurring PM2.5 and O3 pollution (double-high pollution, DHP) in China: the frequency of DHP first declined from 2015 to 2021 and then rebounded during 2021–2023 and North China remained the most affected area (Wang et al., 2025a). It implies that control strategies focused primarily on particulate matter are no longer sufficient to achieve coordinated PM2.5 and O3 reductions or to avoid rebound risks in one pollutant while reducing the other (Lu et al., 2020; Zhao et al., 2021).
Both PM2.5 and O3 concentration are strongly affected by thermodynamic conditions, boundary-layer development, humidity, and regional transport (Zong et al., 2021; Qian and Liao, 2025). Previous studies have shown that DHP was typically associated with two kinds of meteorological backgrounds. One was characterized by stagnant high-pressure systems, weak near-surface winds, and limited ventilation, together with strong solar radiation and high temperature that enhanced daytime photochemistry (Ma et al., 2023; Wang et al., 2025b; Zhan et al., 2024). The other involved the coupling of regional transport with humid and shallow boundary layer conditions which promoted secondary aerosol formation while maintaining a sufficiently oxidizing environment for elevated O3 (Luo et al., 2022; Dai et al., 2024; Liu et al., 2026). However, some studies have shown that, even under the same large-scale circulation patterns, differences in local boundary layer, temperature, and humidity still led to two- to three-fold differences in pollutant concentrations (Zong et al., 2021). Therefore, detailed meteorological condition classification is necessary for understanding the meteorological dependence of DHP and its response to emission control.
The difficulty of synergistic control arises largely from the nonlinear response of O3 to its precursors, nitrogen oxides (NOx) and volatile organic compounds (VOCs). Depending on local chemical sensitivity, O3 formation may be NOx-limited, VOC-limited, or transitional, so the same emission reduction strategy can produce very different outcomes across regions and meteorological conditions (Lu et al., 2018; Ivatt et al., 2022; Wang et al., 2023). Previous studies have examined how precursor emission reductions affect DHP. Using a deep-learning based emission-concentration response surface model, Ding et al. (2022) showed that coordinated NOx VOC control was generally more effective than single-precursor control for PM2.5 O3 co-mitigation, and that delayed VOC abatement substantially weakened the overall clean-air benefits. Based on GEOS-Chem sensitivity simulations for urban and non-urban areas of Beijing-Tianjin-Hebei and Yangtze River Delta, Dai et al. (2024) demonstrated that synergistic NOx VOC reductions markedly decreased DHP days, with VOC reductions contributing more in urban areas and NOx reductions playing a stronger role in non-urban areas. Some studies showed that under VOC-limited conditions, isolated NOx reductions may even increase O3 and the benefit of coordinated precursor control may be partly offset by the O3 enhancing effect induced by declining PM2.5 and weakened aerosol suppression (Ren et al., 2022; Liu et al., 2023; Yang et al., 2024). The reduction efficiency was also affected by meteorological conditions: based on observations, reanalysis data, and GEOS-Chem model over Beijing–Tianjin–Hebei, Qian and Liao (2025) demonstrated that O3 reduction efficiency was more sensitive to temperature whereas PM2.5 reduction efficiency was more sensitive to humidity.
Aerosol-meteorology feedback which includes aerosol-radiation interaction (ARI) and aerosol-cloud interaction (ACI) (Satheesh and Krishna Moorthy, 2005; Lohmann and Feichter, 2005) also affects DHP. Emission controls change aerosol loading, perturbing radiation (ARI) and cloud microphysics (ACI). The resulting adjustments in T2, RH2, and PBLH modulate the PM2.5 and O3 responses, ultimately affecting DHP occurrence. Offline atmospheric chemistry models cannot separate the concentration change caused directly by emission perturbations from induced indirectly through aerosol-meteorology feedback. Moreover, many online coupled studies still considered ARI only. Over the North China Plain during the COVID-19 lockdown, ARI enhanced the emission-induced PM2.5 decrease by 2.7 µg m−3 and the O3 increase by 0.8 ppbv beyond the baseline changes (Zhu et al., 2021). Yang et al. (2024) showed that weakened ARI under sustained clean air measures enhanced photolysis and thereby exacerbated O3 pollution over eastern China. Li et al. (2026) revealed pronounced seasonality in the O3 response to ARI and heterogeneous chemistry. Zhao et al. (2026b) demonstrated that ARI and ACI together depressed O3 while increased PM2.5 under moist and cloudy conditions implying future PM2.5 reductions may heighten rebound risk.
However, how NOx–VOC precursor perturbations affect DHP under refined local meteorological conditions remains unclear. Most previous studies focused on large-scale synoptic classifications or individual meteorological variables, which do not directly link to the chemical environment governing precursor reactions. In addition, the role of aerosol-meteorology feedback in affecting control effectiveness under different meteorological conditions is poorly understood, as most previous coupled studies considered ARI only and did not evaluate how this feedback affects PM2.5 O3 with the variations of boundary layer, thermal and moisture conditions. To fill these gaps, this study investigates DHP responses to NOx–VOC precursor perturbations in Beijing–Tianjin–Hebei–Shandong (BTHS), a hotspot of summertime DHP, in July 2020. The typical meteorological conditions of DHP were identified and classified into different types based on combined boundary layer, temperature and humidity conditions rather than large scale synoptic categories or a single meteorological element. Then, two-dimensional response matrices were constructed using the online-coupled WRF-Chem model to evaluate O3 and PM2.5 responses to NOx–VOC precursor perturbations and aerosol-meteorology feedback contribution under each meteorological condition type. The response was also linked to key meteorological and chemical indicators to elucidate the underlying mechanisms.
Section 2 describes the model configuration, experimental design, and observation datasets. Results and discussion including identification of DHP, meteorological condition classification, model validation, pollutant response to precursor perturbations and the impact of aerosol-meteorology feedback are presented in Sect. 3. The key findings and conclusions are summarized in Sect. 4.
2.1 Model configurations and emissions
The Weather Research and Forecasting model coupled with Chemistry (WRF-Chem) (Grell et al., 2005) was used to simulate interaction between atmospheric chemical processes and meteorological fields. The USTC (University of Science and Technology of China) version of WRF-Chem adopted in this study incorporates several enhancements over the standard release including biogenic volatile organic compound emissions coupled to the land surface module, diagnosis of aerosol radiative forcing components, aerosol-snow interactions, and refined treatment of aerosol mixing within the planetary boundary layer (PBL) (Zhao et al., 2013, 2014, 2016; Zhang et al., 2021; Yang et al., 2025). The modeling domain covered 140 (west-east) × 120 (south–north) grid points at 27 km horizontal resolution and was centered at 32° N, 115° E with BTHS marked by the red outlines (Fig. S1 in the Supplement). Vertically, 29 sigma layers stretched from the surface to 50 hPa, 14 of which are below 2 km altitude to resolve PBL structure.
Gas-phase photochemistry followed the Carbon Bond Mechanism Z (CBM-Z; Zaveri and Peters, 1999) and aerosol processes were treated with the four-bin Model for Simulating Aerosol Interactions and Chemistry (MOSAIC), including nucleation, condensation, gas-particle partitioning, and aqueous-phase chemistry (Zaveri et al., 2008). The physics parameterizations comprised the Morrison double-moment microphysics scheme (Morrison and Gettelman, 2008), Noah land surface model (Chen and Dudhia, 2001), RRTMG longwave and shortwave radiation scheme (Iacono et al., 2008), revised MM5 Monin-Obukhov surface layer scheme (Foken, 2006), Mellor-Yamada-Janjić PBL scheme (Janjić, 1994), Grell-Freitas ensemble cumulus scheme (Freitas et al., 2018), fast-J photolysis scheme (Wild et al., 2000), and a single-layer urban canopy model (Kusaka et al., 2001; Kusaka and Kimura, 2004).
Meteorological initial and boundary conditions were derived from the ERA5 reanalysis of 0.25° × 0.25° (https://doi.org/10.24381/cds.adbb2d47, Copernicus Climate Change Service, 2023). Chemical lateral and initial conditions came from the Community Atmosphere Model with Chemistry (CAM-Chem; https://www2.acom.ucar.edu/gcm/cam-chem-output, last access: 11 June 2026). Anthropogenic emissions over China were from the MEIC inventory (http://meicmodel.org.cn, last access: 11 June 2026; Li et al., 2017a, b; Geng et al., 2024) for 2020 at 0.25° × 0.25° supplemented by the Regional Emission Inventory in Asia (REAS; https://www.nies.go.jp/REAS/, last access: 11 June 2026) outside mainland China at the same resolution. The species included SO2, CO, NOx, NH3, NMVOCs, BC, OC, PM10 and PM2.5. Biomass burning emissions were from the Fire INventory from NCAR (FINN) at 1 km and 1 h resolution (Wiedinmyer et al., 2011). Biogenic emissions were calculated online using the Model of Emissions of Gases and Aerosols from Nature version 2.1 (MEGAN v2.1; Guenther et al., 2006). Dust and sea-salt emissions were calculated online by WRF-Chem, driven by predicted meteorological fields (Gong et al., 1997; Zhao et al., 2013).
2.2 Observation data
Model performance was assessed against surface observations for July 2020. Hourly temperature, relative humidity, and wind speed data from 147 meteorological stations in Beijing–Tianjin–Hebei (77 sites) and Shandong province (70 sites) were obtained from the National Meteorological Information Center of the China Meteorological Administration (CMA, http://www.nmic.cn/, last access: 11 June 2026) to evaluate simulated 2 m temperature (T2), 2 m relative humidity (RH2), 10 m wind speed (WS10) and 10 m wind direction (WD10). Hourly near-surface PM2.5 and O3 concentrations from 479 air quality monitoring sites nationwide (of which 23 sites in Beijing–Tianjin–Hebei and 46 sites in Shandong province) were obtained from the China National Environmental Monitoring Centre (CNEMC, https://www.cnemc.cn/, last access: 11 June 2026) to evaluate the simulated PM2.5 and O3 concentrations. Maximum Daily 8 h Average O3 (MDA8 O3) was computed from hourly data using an 8 h running mean and taking the daily maximum. Following the Chinese air quality standard GB 3095-2012, an 8 h block was retained only if at least 6 of the 8 hourly records were valid. The daily MDA8 value was then calculated only when more than 14 valid 8 h moving averages were available during the daytime window (08:00–24:00 LST). The locations of all the stations are presented in Fig. S1. The 1 km gridded population density dataset of China (Xu, 2017) was used to classify the BTHS into urban (population density > 1500 persons km−2), suburban (500–1500 persons km−2), and rural (< 500 persons km−2) areas.
2.3 Numerical experiments
Two parallel sets of numerical experiments were conducted for July 2020 with a 5 d spin-up time (Table 1). The first experiment set (EXP_W) accounted for the full interaction between aerosols and meteorology including both ARI and ACI. The second experiment set (EXP_WO) replaced this full interaction with an idealized configuration: ARI was disabled by removing aerosol effects on radiation in the RRTMG scheme, and aerosol-dependent cloud activation was replaced by prescribing a fixed cloud droplet number concentration (CDNC) of 10 cm−3 in the Morrison double-moment cloud microphysics scheme (Zhao et al., 2017; Zhang et al., 2018; Xiong et al., 2025; Zhao et al., 2026b), a value consistent with satellite observations of clean marine liquid clouds (Bennartz, 2007; Zeng et al., 2014). Note that a fixed CDNC is not equivalent to switching off ACI: it replaces aerosol-dependent activation with an idealized clean-cloud microphysical state. Applying clean-maritime CDNC to the polluted continental BTHS region is therefore a methodological limitation of this design. Because EXP_WO differs from EXP_W simultaneously in ARI, cloud microphysical state, and subsequent meteorological evolution, the diagnosed feedback is hereafter referred to as the combined response to this idealized perturbation.
Table 1Summary of WRF-Chem numerical experimental design.
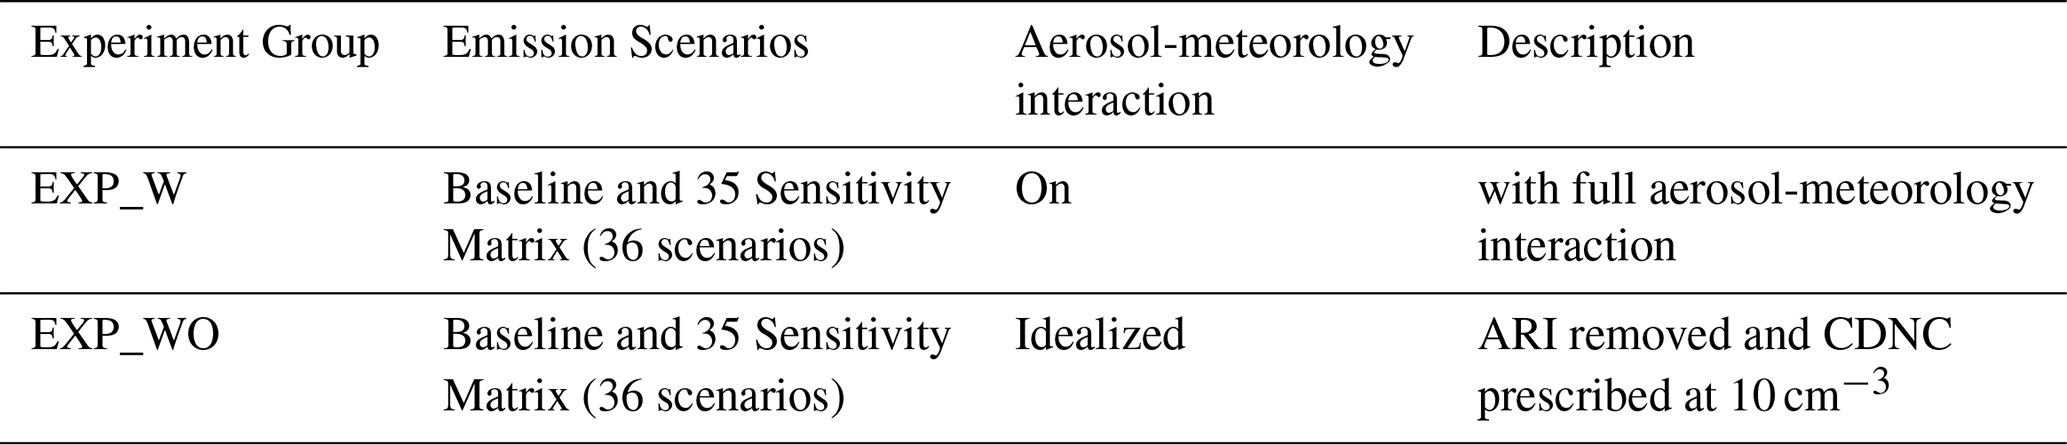
Note: The Sensitivity Matrix includes 35 scenarios with varying NOx and VOCs reduction rates (0 % to 50 % with 10 % interval), plus the Baseline (0 % reduction).
Each set contained 36 simulation scenarios: one baseline scenario (EXP_W_BASE/EXP_WO_BASE) without emission reduction and 35 sensitivity scenarios which represented combinations of NOx and VOCs emission reductions ranging from 0 % to 50 % with a 10 % interval. These scenarios are designed to isolate the response of PM2.5 O3 to NOx–VOC precursor perturbations. NOx and VOC are the common precursors linking O3 photochemistry and nitrate aerosol formation. Under the typical ammonia-rich conditions of summer BTHS, nitrate formation is HNO3-limited (Li et al., 2018; Liu et al., 2021a; Li et al., 2025), so NOx reductions directly target the most responsive PM2.5 component. Other emitted species (SO2, BC, OC, primary particulate matter, NH3) are held at baseline levels. Although these species and aerosols can still influence O3 through photolysis, heterogeneous, and radical chemistry, they are not the dominant precursors considered here, and keeping their emissions unchanged holds these pathways approximately constant across scenarios, thereby isolating the targeted NOx–VOC sensitivity signal. Scenarios were named as EXP_W_NO(x)_VOC(y)/EXP_WO_NO(x)_VOC(y), where x and y denote the percentage reductions of NOx and VOC, respectively.
The response of PM2.5 O3 concentrations to the emission reductions with and without aerosol-meteorology feedback was obtained by subtracting EXP_W_BASE from EXP_W_NO(x)_VOC(y) and EXP_WO_BASE from EXP_WO_NO(x)_VOC(y), denoted ΔPM2.5 O3 and ΔwoPM2.5 O3, respectively. Subtracting ΔwoPM2.5 O3 from ΔPM2.5 O3 yielded the impact of aerosol-meteorology feedback on the response of PM2.5 O3 concentrations to precursor perturbations, denoted ΔaerPM2.5 O3.
3.1 Model evaluation
The simulated meteorology and air quality in BTHS are evaluated against surface observations for 1–30 July 2020 in this section. Figure 1 presents the time series comparison of T2, RH2, WS10, WD10, and planetary boundary layer height (PBLH) while Fig. 2 shows the spatial distributions and time series comparison of PM2.5 and MDA8 O3. Statistics are provided in Table 2, including the mean observed and modeled values (AVGO and AVGM), correlation coefficient (R), mean bias (MB), normalized mean bias (NMB) and root mean square error (RMSE).
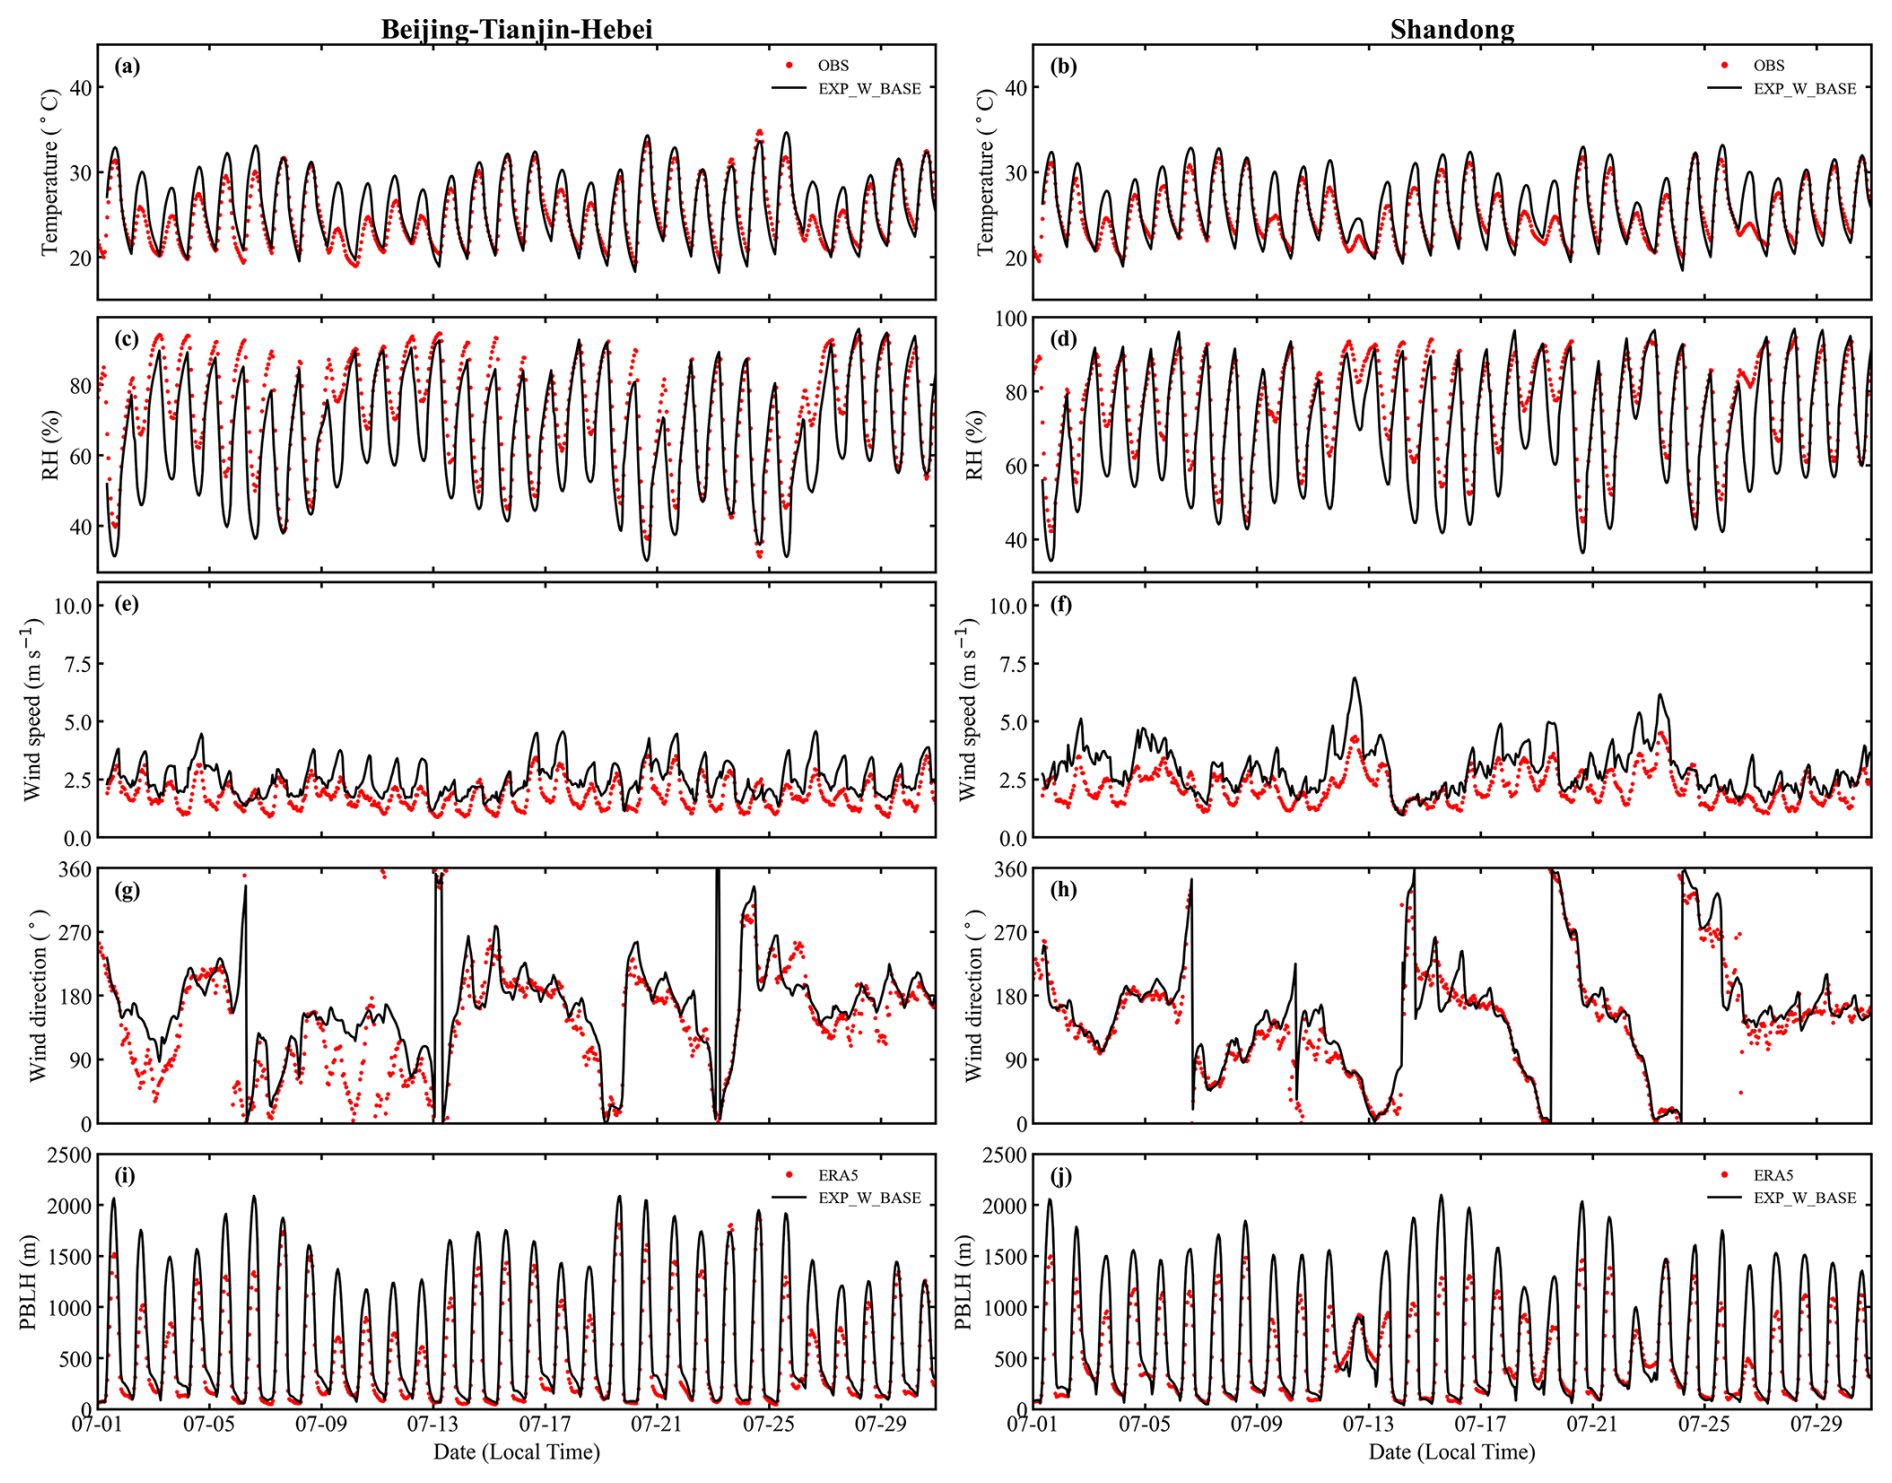
Figure 1The comparisons between observed and simulated hourly (a, b) T2 (°C), (c, d) RH2 (%), (e, f) WS10 (m s−1), (g, h) WD10 (°) and (i, j) PBLH (m) averaged at the sites in Beijing-Tianjin-Hebei and Shandong Province from 1 to 30 July 2020.
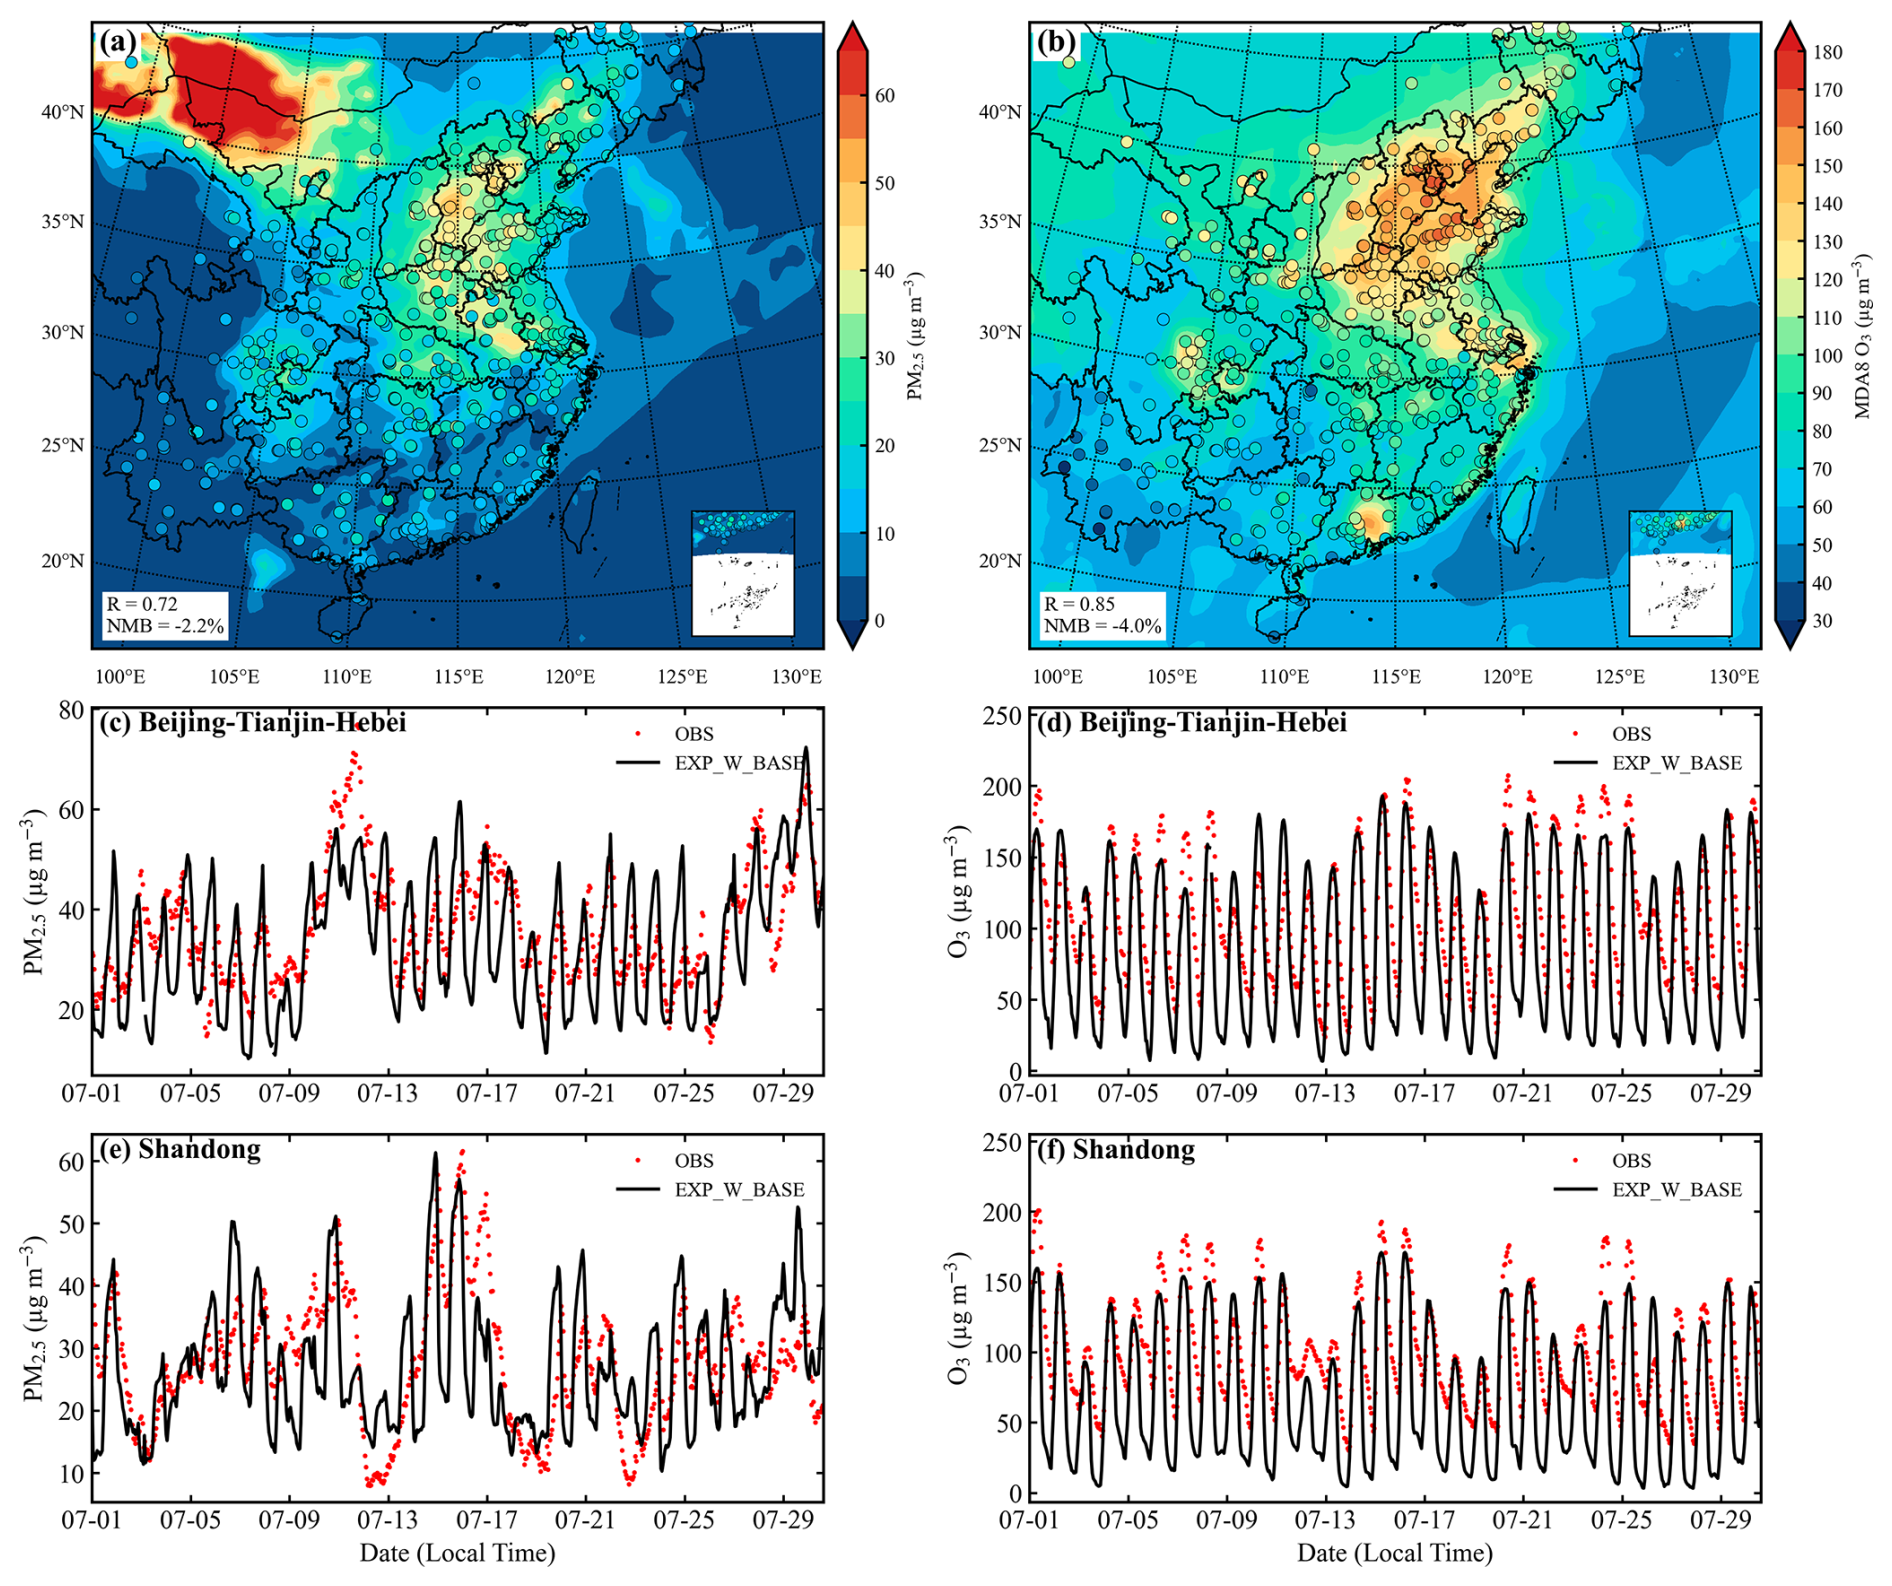
Figure 2Spatial distribution of simulated mean (a) PM2.5 (µg m−3) and (b) Maximum Daily 8 h Average O3 (MDA8 O3) surface concentration (µg m−3) with the corresponding observed mean concentration overlaid as colored markers for the period from 1–30 July 2020. The comparisons between observed and simulated hourly (c, e) PM2.5 (µg m−3) and (d, f) O3 (µg m−3) surface concentration averaged at the sites in Beijing-Tianjin-Hebei and Shandong Province from 1 to 30 July 2020.
Table 2Statistics of comparisons between observed and simulated (EXP_W_BASE) hourly 2 m temperature (T2, °C), 2 m relative humidity (RH2, %), 10 m wind speed (WS10, m s−1), 10 m wind direction (WD10, °), planetary boundary layer height (PBLH, m), PM2.5 (µg m−3), and O3 (µg m−3) averaged at the observational sites of Beijing-Tianjin-Hebei and Shandong Province from 1–30 July 2020 (local time).
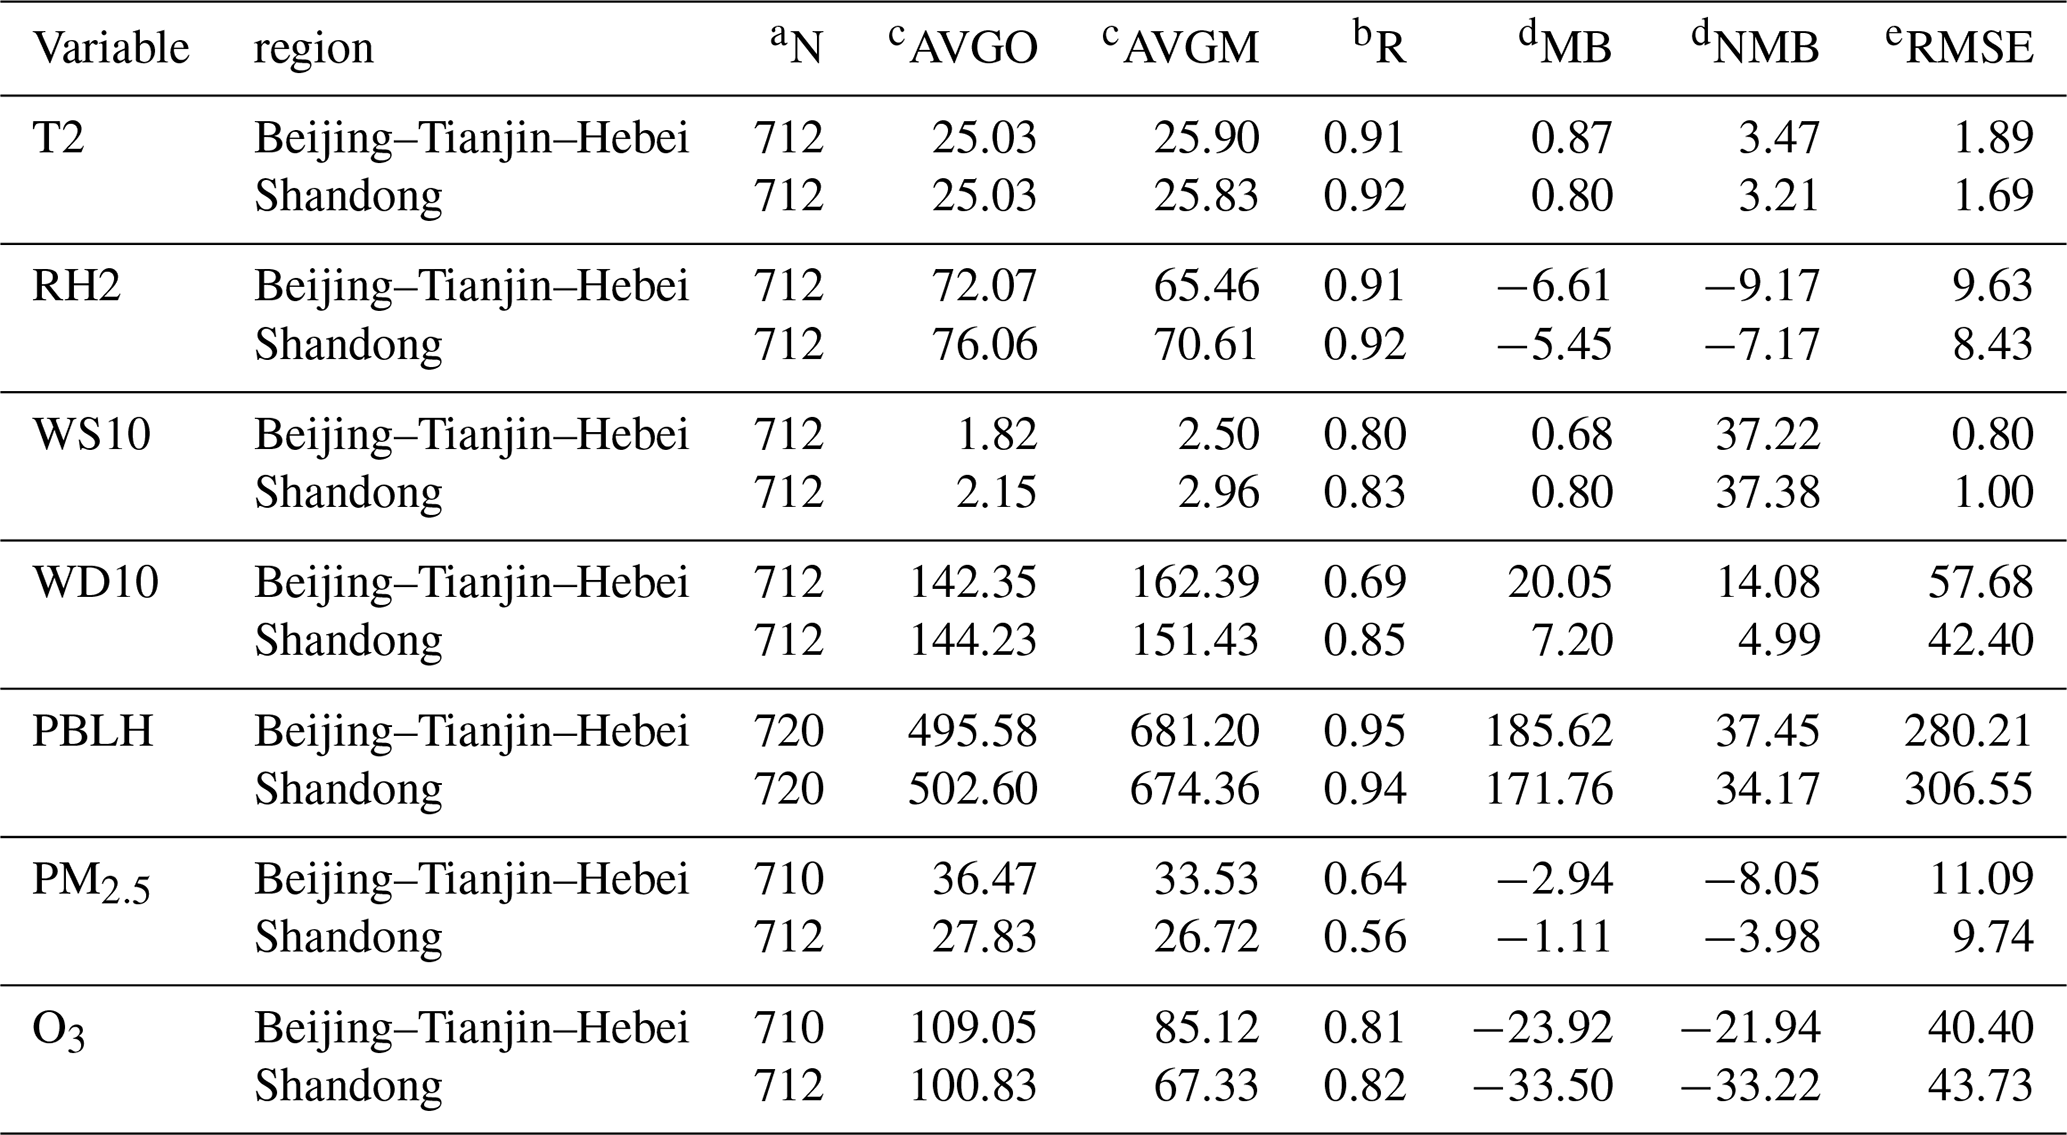
a N is the number of paired samples. b R is the correlation coefficient between the observation and model results. c AVGO and AVGMare the average values of observation and model results, sampled at the observation site and time, respectively. d MB and NMB are the mean biases between the observation and model results, and the normalized mean bias between the observation and model results, respectively. e RMSE is the root-mean-square error between observation and model results.
Overall, the model captures the temporal variability of near surface meteorology. In Fig. 1a and b, the simulated T2 in Beijing–Tianjin–Hebei and Shandong province reproduces the observed day-to-day evolution and diurnal cycle with R of 0.91 and 0.92, respectively, and exhibits only a small overestimation (NMB around 3 %). Similarly, RH2 is well correlated with observations in Beijing–Tianjin–Hebei and Shandong province (R=0.91 and 0.92) in Fig. 1c and d, indicating that the model reasonably represents the timing of moist and dry periods. A slight underestimation is present (NMB = −9.17 % and −7.17 %), which may influence aerosol hygroscopic growth and heterogeneous chemistry. In contrast, near-surface winds show larger discrepancies. Figure 1e and f show that WS10 is overestimated throughout the period with R of 0.80 and 0.83 and MB of 0.68 and 0.80 m s−1 in Beijing–Tianjin–Hebei and Shandong province. The high correlation suggests that the simulation captures much of the variability in wind strength, but the systematic positive bias indicates overly strong mechanical mixing and excessive boundary-layer ventilation in the model. In Fig. 1g and h, WD10 is also well simulated with R of 0.69 and 0.85 with a positive bias (NMB = 14.08 % and 4.99 %) implying that transport pathways are reasonably represented. For PBLH, the model accurately captures its temporal evolution, with R of 0.95 and 0.94 against ERA5 reanalysis (Fig. 1i and j) demonstrating the model's ability to reproduce the dynamic variation of the planetary boundary layer. The NMB values are 37.45 % and 34.17 % for Beijing–Tianjin–Hebei and Shandong province, respectively, indicating a systematic overestimation by the model during the simulation period. Nevertheless, absolute biases in PBLH, wind speed, and O3 can still affect which grid-days meet the DHP thresholds and how samples are assigned to the meteorological condition types. These effects on sample membership and regime classification were not fully quantified and are acknowledged as a limitation of this study.
For PM2.5, the model simulation demonstrates good performance at the regional scale. In Fig. 2a, the modeled PM2.5 field is consistent with the observed distribution (R=0.72) indicating that the model captures the overall burden of fine particles during this month, with higher concentrations over the North China Plain and lower concentration toward surrounding cleaner regions. The time series in Fig. 2c and e suggests that the model generally follows observed day-to-day variability and several pollution episodes with R of 0.64 and 0.56 and NMB of −8.05 % and −3.98 %, though differences remain in peak intensity and short-term fluctuations. For O3, in Fig. 2b, d and f, the model captures both spatial gradients (R=0.85) and the temporal evolution (R=0.81 and 0.82) of MDA8 O3, reflecting a good representation of the timing of photochemical production and synoptic modulation. However, the model simulation shows an underestimation in MDA8 O3 for Beijing–Tianjin–Hebei and Shandong province (NMB = −21.94 % and −33.22 %). The time series reveals that the model underestimates nighttime O3 concentrations, which is a widely documented bias in chemical transport models (Li and Rappenglueck, 2018; Travis and Jacob, 2019; Liu et al., 2021b). This nighttime O3 low bias is primarily attributed to excessive O3 titration by NO within the shallow nocturnal boundary layer, where the model typically underestimates the nocturnal PBL height, leading to overestimated NOx concentrations and consequently excessive chemical destruction of O3 (Zhao et al., 2019; Liu et al., 2021b). Generally, the model simulation provides a solid foundation for regional analyses, with strong performance in temperature and humidity and spatial-temporal patterns of PM2.5 and O3. We note that the central analysis of this study is based on relative responses and internally consistent classification, so the model biases documented above have limited influence on the type-to-type contrasts.
3.2 Identification of DHP samples and their typical meteorological conditions
DHP samples of BTHS were identified using WRF-Chem model simulations during July 2020. Earlier investigations typically adopted Class II thresholds of the Chinese National Ambient Air Quality Standard (GB 3095-2012) namely 75 µg m−3 for 24 h PM2.5 and 160 µg m−3 for MDA8 O3 as the criteria for compound pollution. Given that atmospheric concentrations in China have fallen markedly in recent years, those thresholds no longer reflect current pollution levels or the stricter goals of contemporary air quality management (Ma et al., 2023; He et al., 2024; Liu et al., 2025). We therefore applied the more stringent Class I limits (35 µg m−3 for daily PM2.5 and 100 µg m−3 for MDA8 O3) to screen model grids. The screening procedure comprised four steps. First, daily mean PM2.5 and MDA8 O3 were calculated from hourly WRF-Chem outputs for all model grids over China's land area. Grid-day samples meeting the Class I criteria were retained as candidate DHP samples. The simulated spatial distribution of DHP days agrees well with observations in BTHS (Fig. S2), supporting the use of simulated samples. All subsequent filtering was conducted within the BTHS area.
Second, to minimize the influence of wet removal and precipitation-related processes, grid-day samples with daily rain-hours ≥3 h (hourly precipitation increment > 0.1 mm) were excluded. Third, grids with no more than 9 DHP days (< 30 % of the study period) were excluded for statistical robustness. Fourth, only days with more than 20 DHP samples within BTHS were retained, roughly matching the number of stations exceeding the > 50 % criterion of prior observational studies (Zong et al., 2021) and avoiding the excessive restrictiveness of a percentage threshold over several hundred grid cells. After the four-step screening, a total of 1510 DHP samples were retained, covering 113 unique model grids in BTHS.
To test the robustness of DHP identification, Class I thresholds (PM2.5 > 35 µg m−3 and MDA8 O3 > 100 µg m−3) were perturbed by ±2.5 % and ±5 % (PM2.5: 33.25–36.75 µg m−3; MDA8 O3: 95–105 µg m−3; a 5 × 5 matrix, 25 combinations) and the entire filtering and classification process was repeated for each of the 25 threshold combinations. Figure S3 and Table S1 in the Supplement show the sensitivity of DHP identification and meteorological condition classification to the threshold. The DHP count is governed almost entirely by the PM2.5 threshold (−27.5 % to +40.0 %), whereas varying the O3 threshold between 95 and 105 µg m−3 changes the count by less than 0.3 %. Within each meteorological condition type, concentration statistics change only marginally across all threshold combinations: O3 means, medians, and quartiles shift by ≤ 3.2, ≤ 4.2, and ≤ 5.9 µg m−3, respectively, while those of PM2.5 change by ≤ 2.3, ≤ 2.9, and ≤ 2.7 µg m−3. The contrasts between types persist at every threshold, with DryHot and Moderate showing the highest O3, WarmHumid the lowest O3, Stable the highest PM2.5, and DryHot the lowest PM2.5, and the condition ranking (WarmHumid > Moderate > DryHot > Stable > Convective) is preserved at each threshold. In addition, two-sample Kolmogorov–Smirnov tests detected no significant O3 distribution change (all p > 0.07; Cohen's d < 0.18), and PM2.5 distributions were stable under ±2.5 % and changed only marginally under ±5 % (d < 0.41). Although threshold perturbation mainly rescales the sample count through the PM2.5 criterion, the quantities on which our conclusions rest (within-type concentration distributions, between-type contrasts, and the condition ranking) are invariant. The meteorological-condition-specific pollution characteristics underlying our conclusions are therefore robust to the choice of Class I threshold.
Then, the variations in PM2.5 and O3 under temperature, humidity and PBLH bins and the typical meteorological condition of DHP are examined, focusing on the contrast between all samples and DHP samples (Fig. 3). Figure 3a and b show that DHP occurs mainly within 23–31 °C rather than across all temperatures. For DHP samples, PM2.5 is systematically higher than for all samples, with medians rising from ∼ 38 µg m−3 at 23–25 °C to ∼ 43 µg m−3 at 27–29 °C before declining to ∼ 40 µg m−3 near 31 °C, while MDA8 O3 increases with T2 and peaks near 29 °C. In Fig. S4, Ox (O3 + NO2) and OH likewise increase with T2, and Ox is higher for DHP samples, especially at mid-to-high T2. Warm conditions therefore favor elevated O3, PM2.5, and oxidant capacity simultaneously, although O3 is slightly lower than for all samples at the highest temperatures because the DHP criteria require both pollutants to exceed their thresholds.
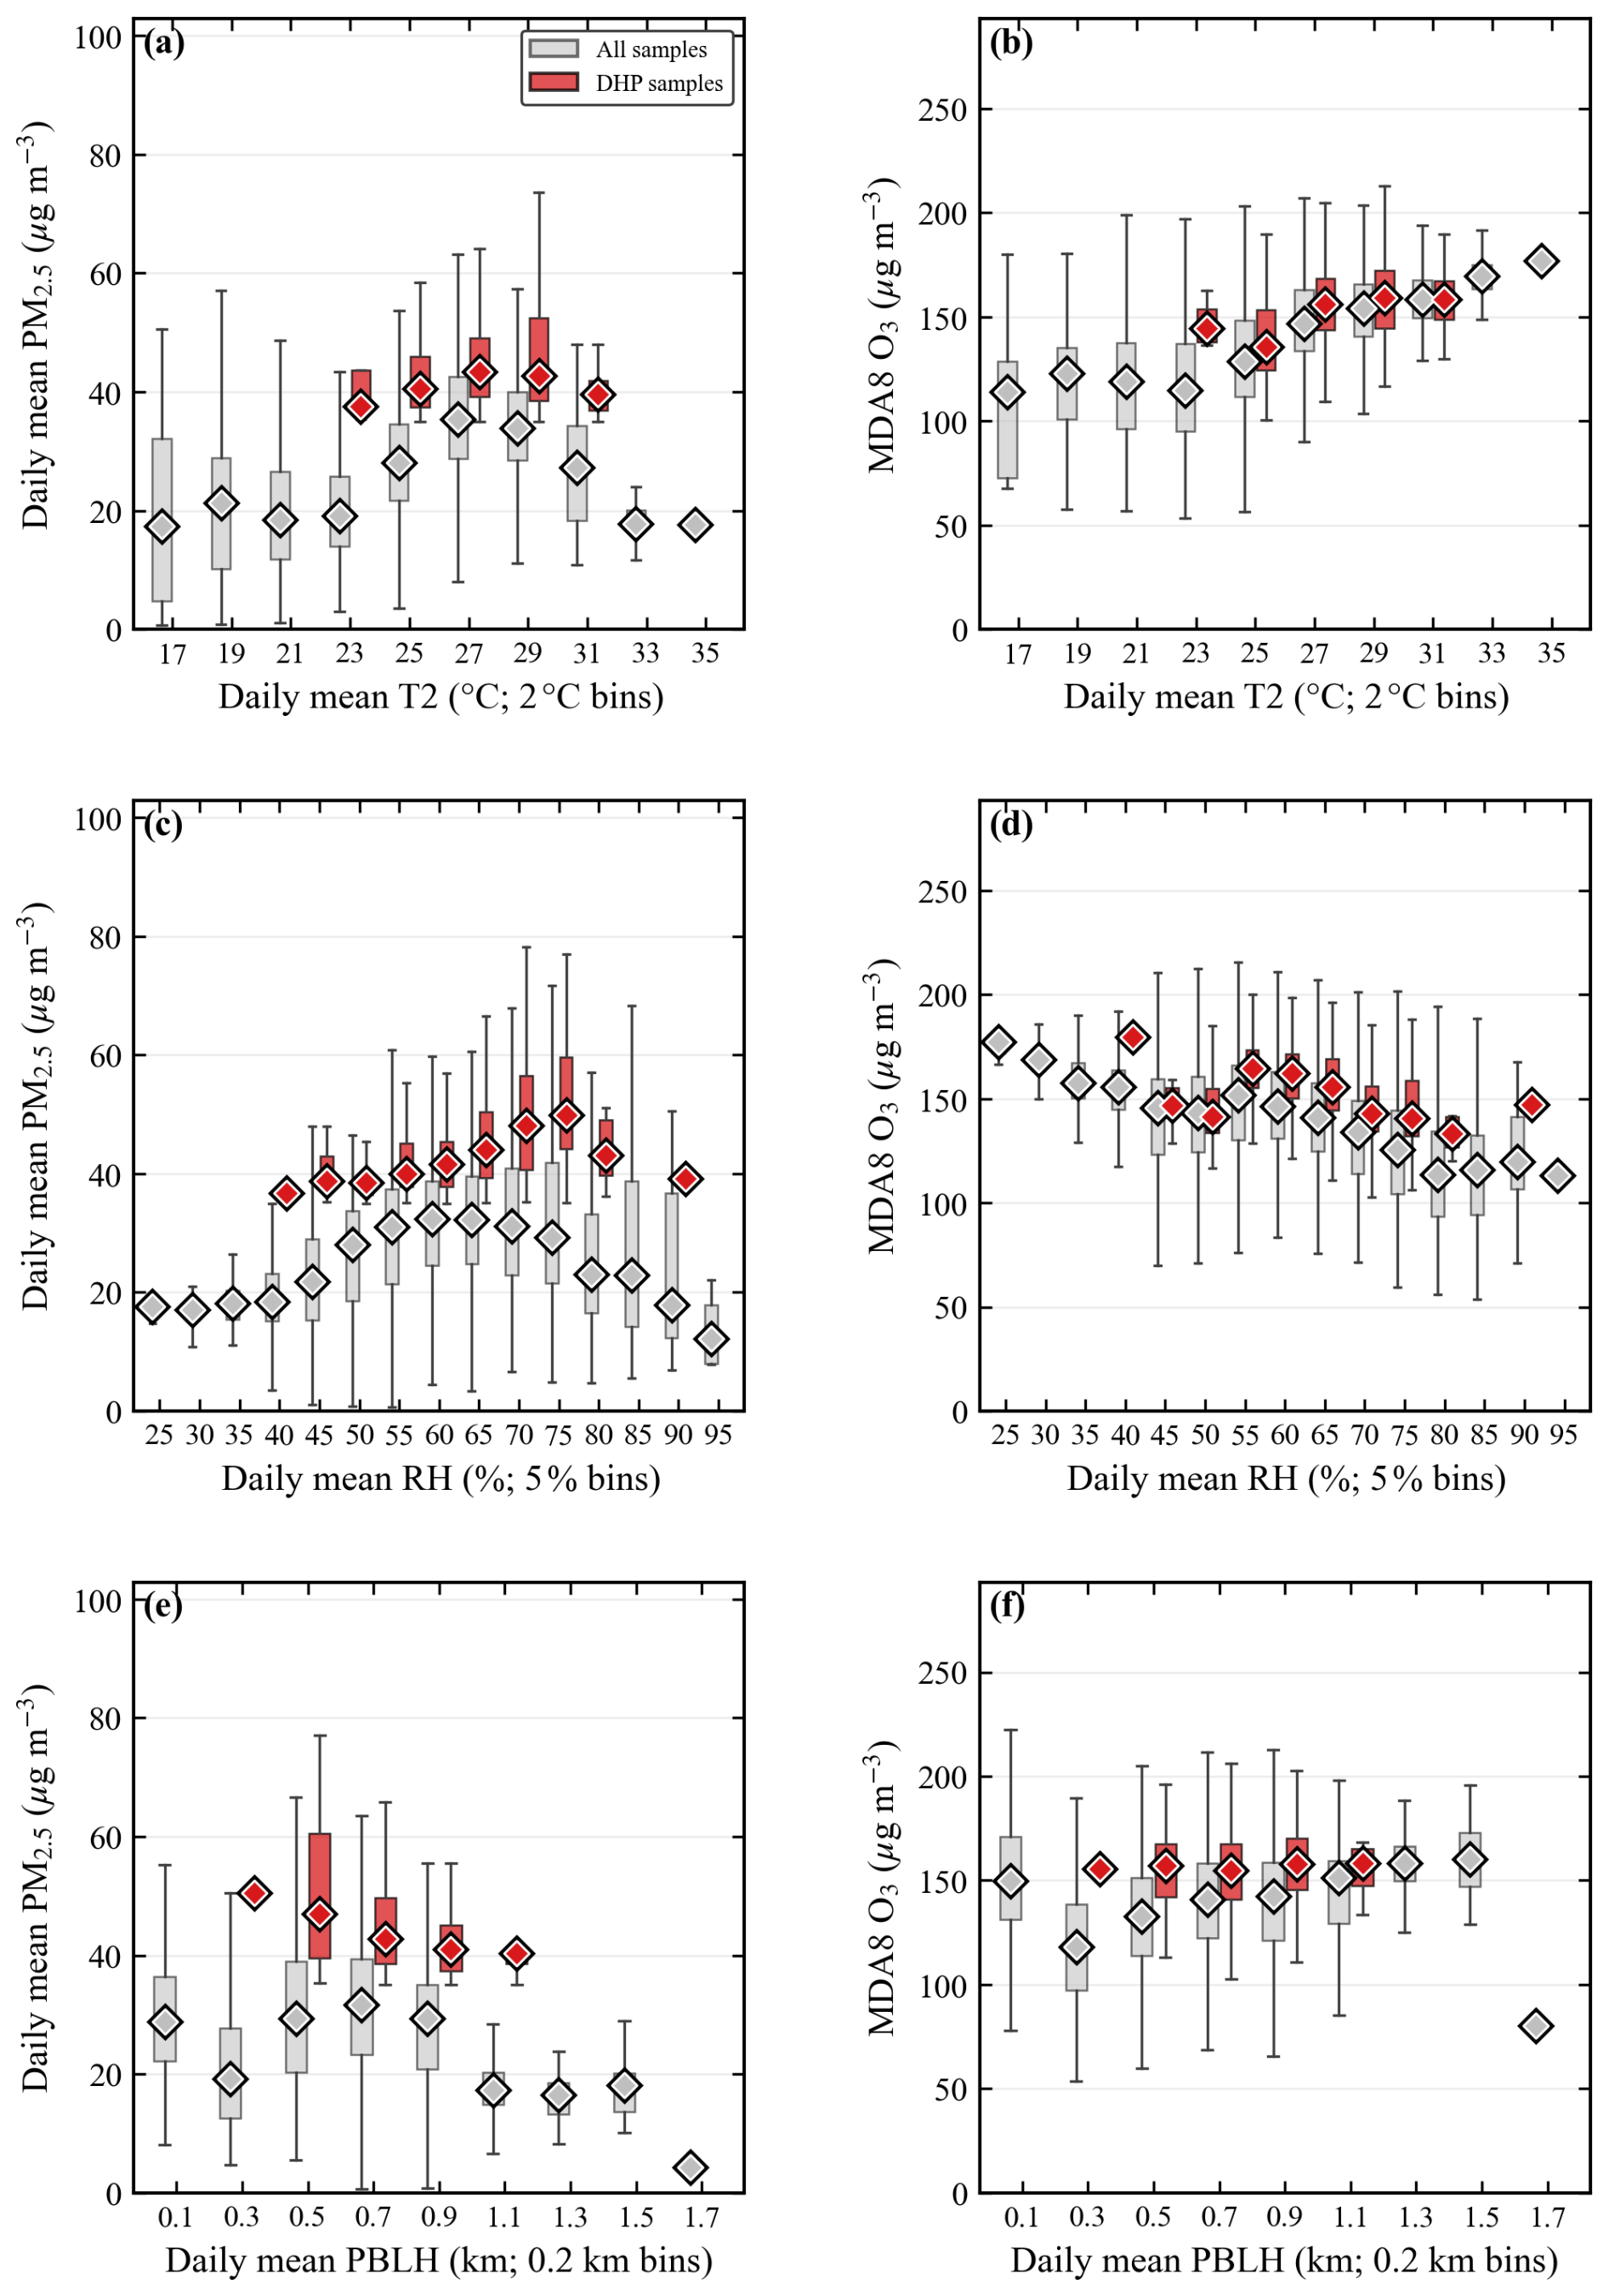
Figure 3Boxplots of (a), (c), (e) daily mean PM2.5 (µg m−3) and (b), (d), (f) MDA8 O3 (µg m−3) in each T2, RH2 and PBLH bin of all samples and DHP samples from the EXP_W_BASE experiment. T2 is binned to 2 °C intervals, RH2 to 5 % intervals and PBLH to 0.2 km intervals. In each boxplot, the horizontal line inside the box represents the median, the box spans the interquartile range (25th–75th percentile), and the whiskers extend to the most extreme data points within 1.5 times the interquartile range from the box edges.
Figure 3c and d show that DHP occurs mainly within 45 %–80 % RH. For all samples, PM2.5 exhibits a broad peak at moderate-to-high humidity rather than a monotonic response, and for DHP samples it peaks at ∼ 48–50 µg m−3 around 70 %–75 % RH. MDA8 O3 decreases with increasing RH for both sample sets, reflecting suppressed photochemistry under humid conditions and for DHP samples it peaks near 55 % RH and declines beyond ∼ 70 %. Ox and OH also decrease with RH (Fig. S4), while DHP samples exhibit higher Ox and comparable or slightly higher OH at moderate RH (55 %–75 %). DHP thus preferentially occurs in a moderate humidity window where aerosol formation is enhanced but photochemical O3 is not yet strongly suppressed.
DHP also occurs within a specific PBLH range of 0.5–1.1 km (Fig. 3e and f). PM2.5 generally decreases with PBLH, and DHP samples show higher PM2.5 with a steeper decrease. MDA8 O3 instead increases with PBLH for all samples, reflecting enhanced entrainment of O3-rich air and stronger photochemical production in deeper boundary layers, whereas for DHP samples it remains relatively uniform across 0.3–1.1 km, as do Ox and OH (Fig. S4). This pattern reflects competing effects of boundary-layer mixing. Low PBLH concentrates PM2.5 but also traps NOx near the surface, enhancing NO titration and reducing entrainment, whereas higher PBLH allows sufficient mixing for photochemical production (Zong et al., 2021).
3.3 Meteorological condition classification and characteristics of DHP under the classification
The meteorological condition of each DHP sample was classified from simulated boundary layer, temperature, and humidity conditions rather than large-scale synoptic categories or a single element. Samples with PBLH above the monthly 90th percentile were classified as Convective (unstable, well-mixed) and those below the 10th percentile as Stable (stable, weakly mixed). The remaining samples were classified by daily mean T2 and RH2 into WarmHumid (T2 ≥ 25 °C and RH2 ≥ 65 %), DryHot (T2 ≥ 25 °C and RH2 < 60 %), and Moderate (all others). The thresholds follow the binned relationships in Sect. 3.2. The 25 °C T2 threshold marks the sharp rise of both PM2.5 and MDA8 O3. The RH thresholds reflect the inflection near 60 % RH, below which gas-phase photochemistry dominates, and the measurable PM2.5 rise and consistent O3 and OH decline near 65 % RH, beyond which aqueous-phase chemistry becomes influential (Zang et al., 2019, similarly used RH ≥ 60 % to define wet days). Samples within the transitional 60 %–65 % RH under warm conditions are classified as Moderate. The resulting distribution is balanced. WarmHumid (∼ 40 %) and Moderate (∼ 25.5 %) are most prevalent, followed by DryHot (∼ 16 %), Stable (∼ 12.7 %), and Convective (∼ 5.8 %), and all five types retain sufficient samples (87–604).
To validate and interpret the classification, Fig. S5 shows the boxplots of daily meteorological variables by the five types. WarmHumid, DryHot, and Moderate, defined by temperature and humidity thresholds, exhibit narrow T2 and RH ranges, whereas Convective and Stable are sharply distinguished by PBLH and further differ in T2 and RH2 (higher T2 and lower RH2 in Convective). WS10 differences are weaker, with the largest values in WarmHumid and DryHot. Overall, the five types effectively separate distinct ventilation and thermodynamic environments. Figure 4 presents the boxplots of daily mean PM2.5 and MDA8 O3 by meteorological condition type. PM2.5 shows strong condition dependence with the highest medians under Stable and WarmHumid (median ∼ 46 µg m−3) and the largest spread under Stable. PM2.5 is intermediate under Convective and Moderate (medians ∼ 42 µg m−3), and is the lowest under DryHot (median ∼ 40 µg m−3) with the tightest distribution. MDA8 O3 remains elevated in all types (medians ∼ 149–164 µg m−3), consistently above the median of all samples (∼ 140 µg m−3), and is the highest under DryHot and Moderate (medians ∼ 163 µg m−3) and lowest under WarmHumid (∼ 149 µg m−3).
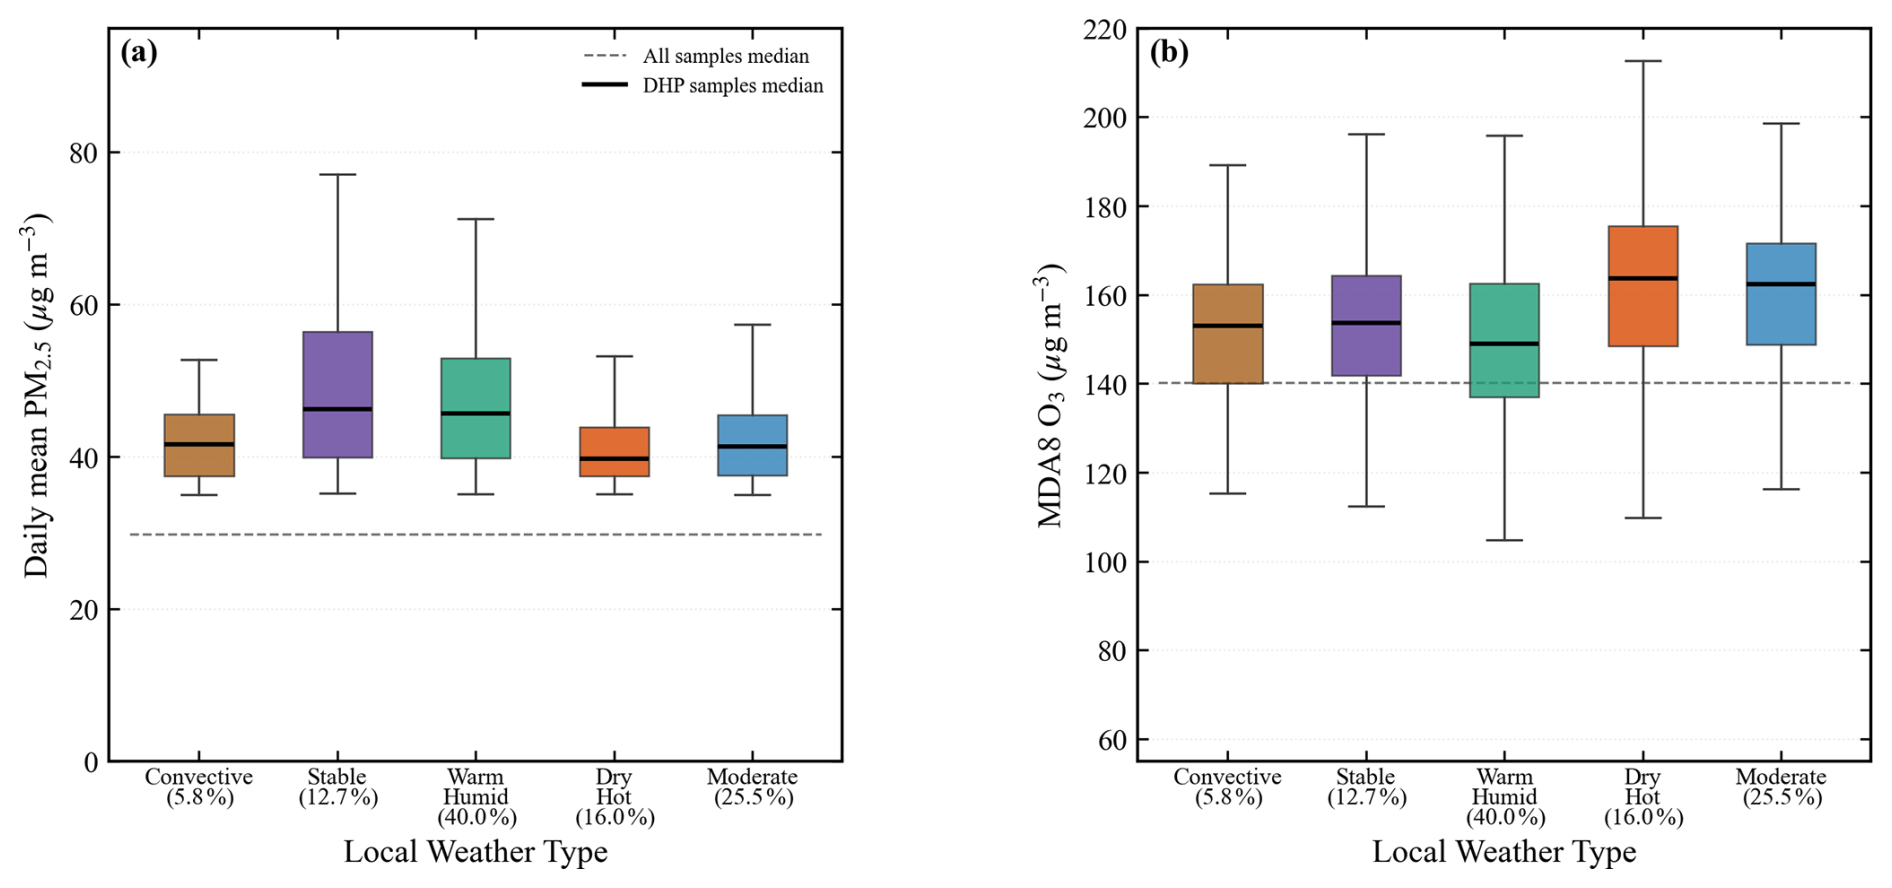
Figure 4Boxplots of (a) daily mean PM2.5 (µg m−3) and (b) MDA8 O3 (µg m−3) for different meteorological condition types. The numbers in parentheses beneath each type indicate the proportion in the DHP samples and the gray dashed lines denote the median values for all samples.
These patterns are supported by the oxidants, precursors, and PM2.5 composition variations for different meteorological condition types (Figs. S6 and S7). The high PM2.5 under Stable reflects pollutant accumulation within a shallow boundary layer, as evidenced by elevated NO2 and CO, while the lowest OH and relatively low Ox indicate suppressed photochemistry. The elevated PM2.5 under WarmHumid is consistent with enhanced aqueous-phase secondary aerosol formation with the lowest HNO3, suggesting efficient gas-to-particle conversion of HNO3 into NH4NO3. This is further confirmed by the PM2.5 composition (Fig. S7). For DHP samples, NO accounts for 34.0 % of PM2.5, exceeding SO (9.7 %), NH (13.6 %), BC (4.4 %), and OC (8.8 %), confirming that NOx-driven NO is the dominant PM2.5 component and the primary pathway through which NOx reductions affect PM2.5. NO is highest under WarmHumid and lowest under DryHot; NH follows the same pattern, while SO, BC, and OC show relatively small variations across types. In contrast, DryHot favors the strongest photochemical O3 production, with the highest Ox, NO2, and HNO3 indicating active daytime photochemistry and abundant precursors, yet the lowest PM2.5 due to the absence of aqueous-phase enhancement, high temperature volatilization of NH4NO3, and deeper boundary layer dilution. The afternoon (12:00–16:00 LST) formaldehyde-to-NO2 ratio (FNR) ranges from 0.76 to 0.93 (median) (Fig. S6c), placing the DHP samples in the transitional regime between VOC-limited and NOx-limited conditions (FNR ≈ 0.6–1.8; Tonnesen and Dennis, 2000; Folorunsho et al., 2025), with Convective and WarmHumid showing the highest FNR and Stable and DryHot the lowest. Together, PM2.5 is more sensitive to different meteorological conditions with the highest value under Stable and WarmHumid conditions that favor accumulation and aqueous chemistry. In contrast, O3 stays persistently elevated under all types, with DryHot favoring the strongest photochemical production. DHP is not controlled by a single meteorological element but arises from the combined influences of boundary-layer mixing, temperature, humidity, and aqueous-phase versus gas-phase chemical pathways.
3.4 Responses of DHP to precursor perturbations under different meteorological conditions
Figure 5 shows the percentage response of MDA8 O3 and PM2.5 to NOx and VOC reductions under five meteorological condition types. For O3, all types exhibit asymmetric isopleths where NOx reductions produce larger decreases than equivalent VOC reductions, but the degree of asymmetry varies substantially. Convective and WarmHumid show strong NOx dominance (a 6–7 percentage-point advantage at 50 % single-precursor reduction), consistent with their higher afternoon FNR (Fig. S6). In contrast, Stable, DryHot, and Moderate show nearly symmetric responses at moderate reduction levels with a slight VOC advantage under weak controls (≤ 20 %) and the NOx advantage narrowing to only 2–3 percentage points under strong control. Under joint control, the O3 response converges across types (−23.3 % to −25.2 %), as the nonlinear amplification of NOx sensitivity compensates for the weaker baseline NOx response in the more VOC-sensitive types. WarmHumid consistently shows the strongest O3 response for all NOx-dominated reduction levels (e.g., −25.2 % at joint ), while DryHot shows the weakest (e.g., −23.3 % at joint ). When VOC reductions exceed NOx reductions, Convective shows the weakest O3 response, reflecting its weak VOC sensitivity. For PM2.5, the response is overwhelmingly dominated by NOx reductions under all types, which is attributed to the known underestimation of secondary organic aerosol (SOA) in WRF-Chem with the MOSAIC aerosol scheme (Zhao et al., 2026a), with WarmHumid and Stable strongest (−21.4 % and −21.2 % at 50 % NOx reduction), and DryHot weakest (−15.2 %). The absolute response (Fig. S8) shows the same pattern.
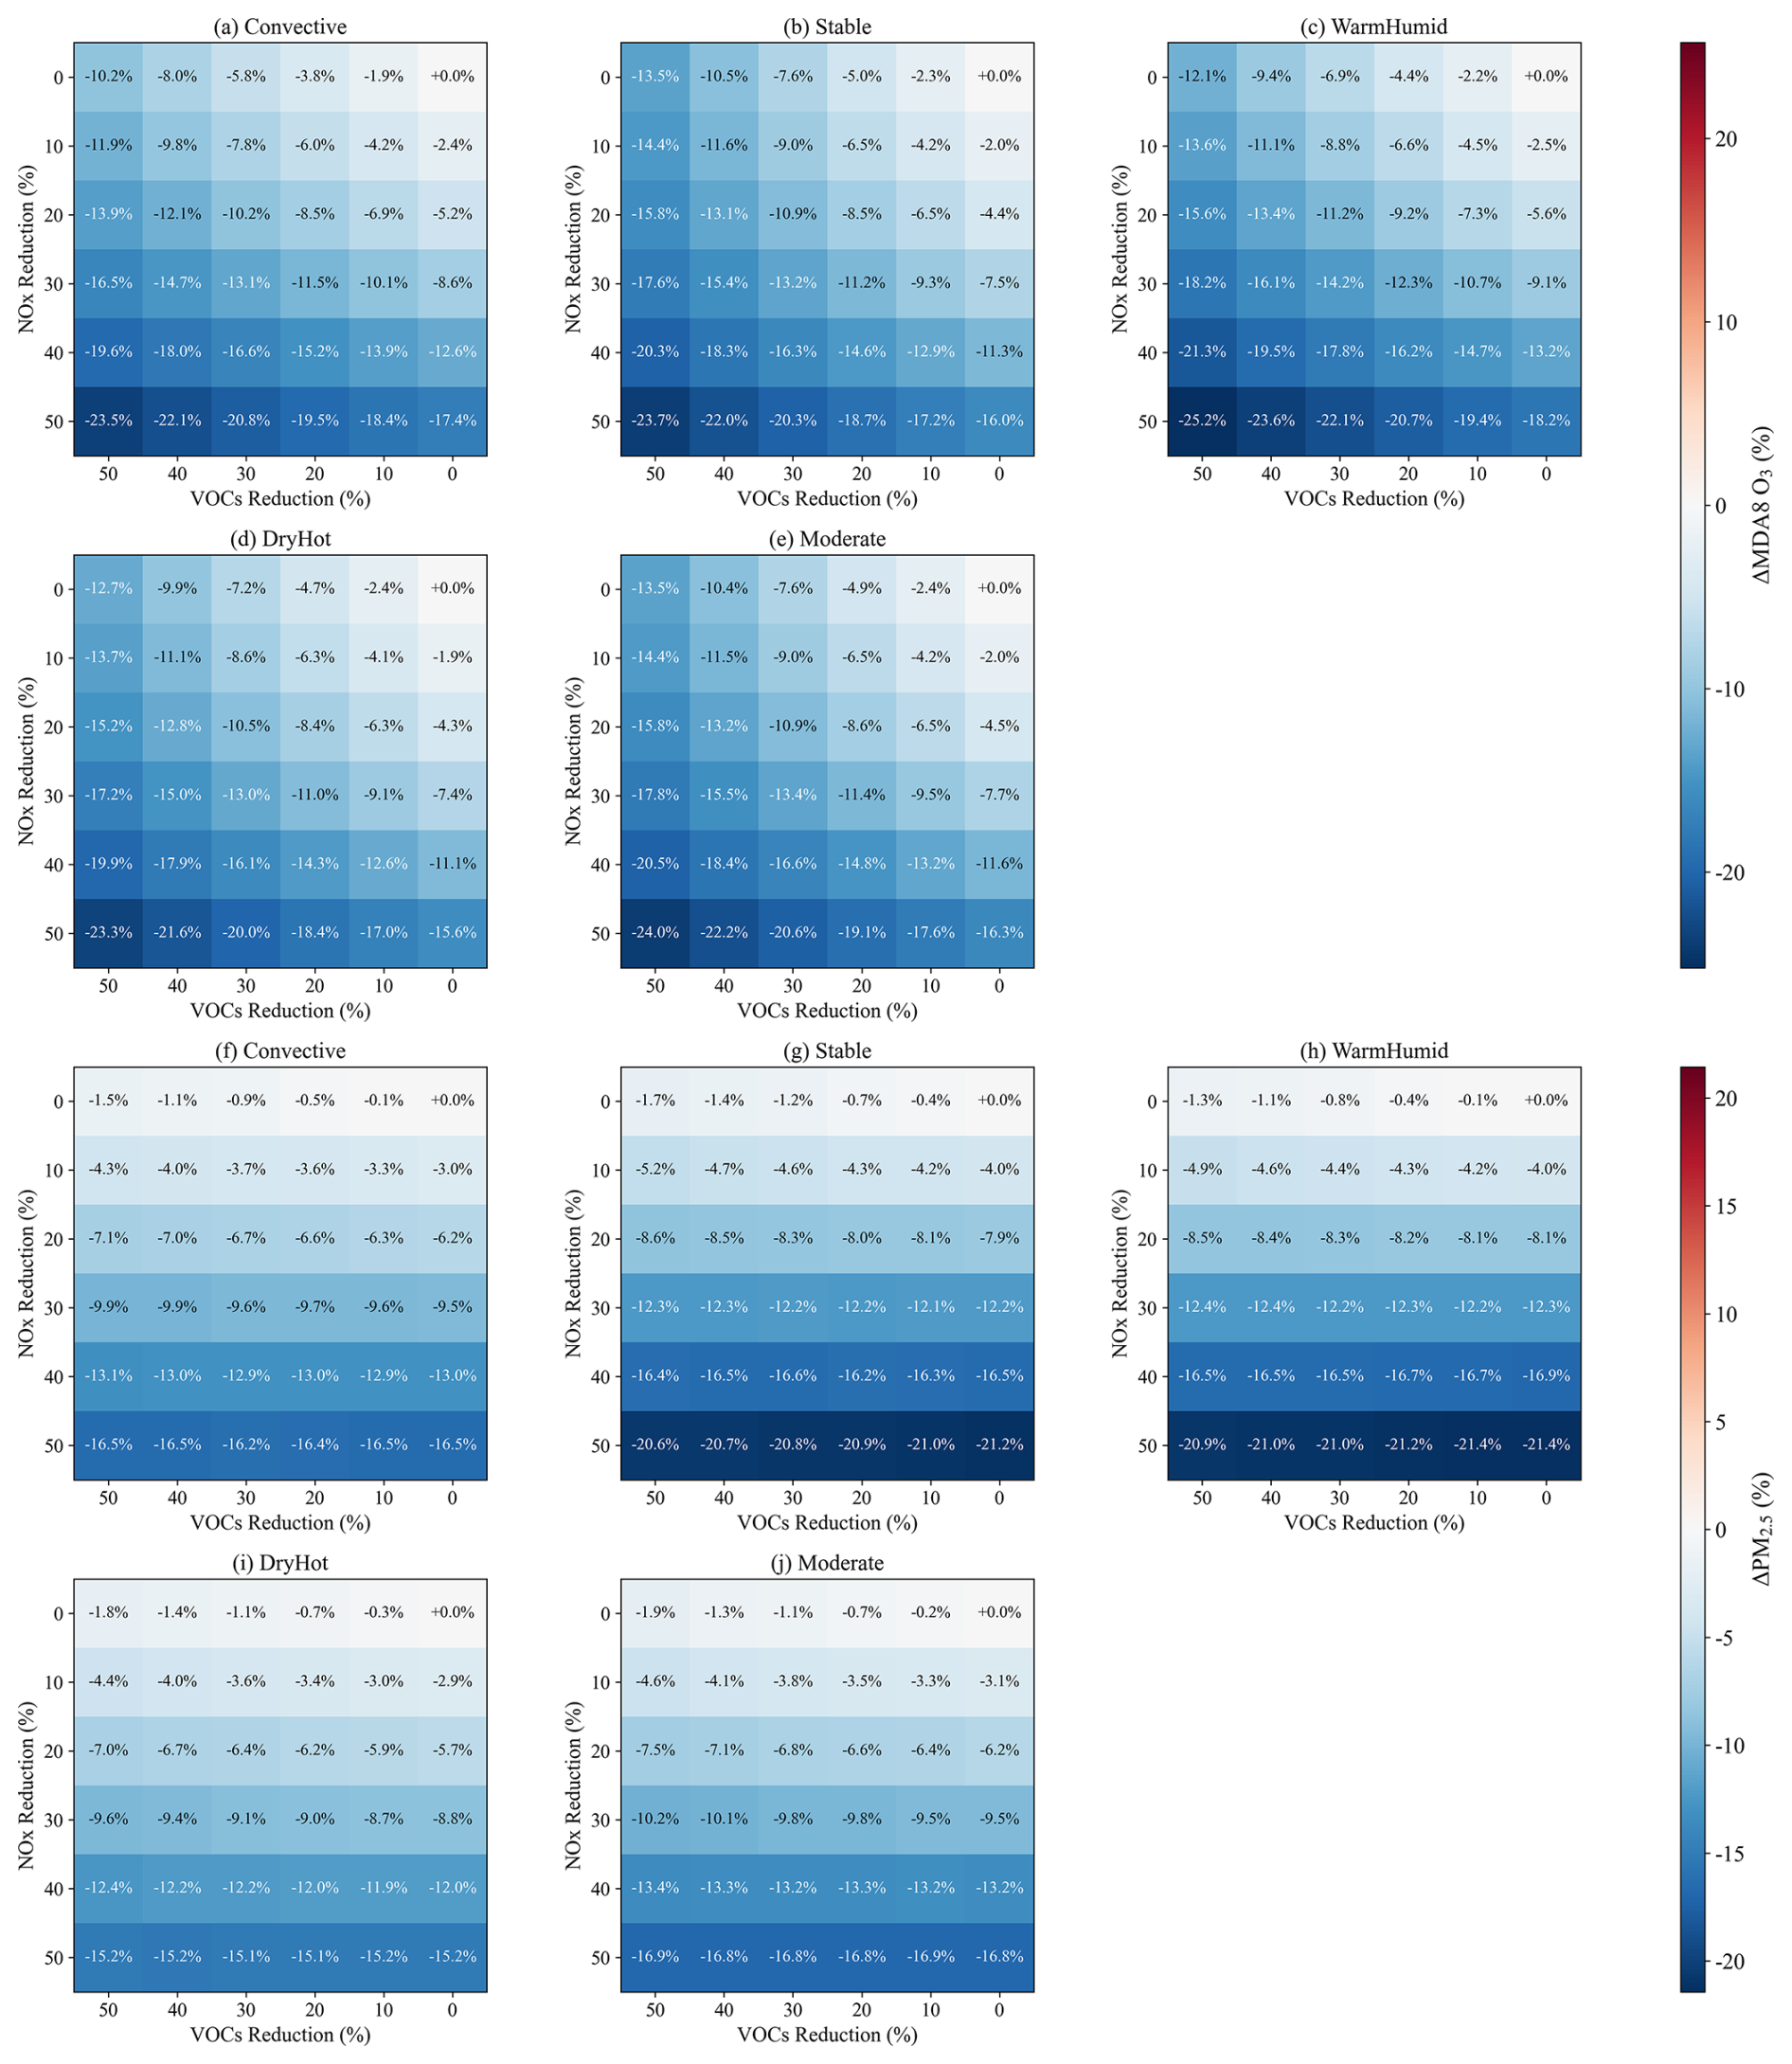
Figure 5MDA8 O3 and PM2.5 response to NOx and VOC emission reductions for DHP samples classified into different meteorological condition types. The percentage differences in MDA8 O3 between each reduction scenario and the baseline scenario (ΔMDA8 O3, %) for (a) Convective, (b) Stable, (c) WarmHumid, (d) DryHot, and (e) Moderate, and the percentage differences in PM2.5 between each reduction scenario and the baseline (ΔPM2.5, %) for (f) Convective, (g) Stable, (h) WarmHumid, (i) DryHot, and (j) Moderate. Rows and columns denote NOx and VOC reduction levels (%).
The overall NOx-sensitivity of O3 for different meteorological conditions is largely attributable to the spatial distribution of DHP samples. 64.4 % of the DHP samples are located in suburban areas and 28.6 % in rural areas, with only 7.0 % in urban areas. This dominance holds for all types (suburban plus rural: 89.7 %–95.4 %). As shown in Figs. S9 and S10, rural and suburban samples exhibit stronger O3 sensitivity to NOx reductions, whereas urban samples display greater VOC sensitivity. Therefore, the apparent NOx-dominance masks the VOC-limited regime that prevails in urban areas. This urban VOC-limited characteristic is not specific to DHP episodes. The response matrices for all samples (Figs. S11 and S12) show the same regional pattern.
The O3 gradient diagnostics further clarify these differences (Fig. 6). The gradients measure the concentration change per additional percentage point of emission reduction (∂ΔO3 ∂NOx or ∂ΔO3 ∂VOC), computed by differentiating the absolute-response matrices with respect to the reduction level at 10-percentage-point intervals (0 %, 10 %, 20 %, 30 %, 40 %, 50 %). All panels display negative values, indicating that emission reductions effectively lower O3. At weak control (≤ 10 % reduction), Convective and WarmHumid show stronger O3 benefit from NOx reduction than from VOC reduction (ONOOVOC 1.15–1.28) while Stable, DryHot, and Moderate show the opposite (ONOOVOC 0.81–0.85), consistent with Fig. 5. As NOx reduction deepens, ∂ΔONOx intensifies by a factor of ∼ 2.0–2.4 (roughly doubling by 50 % NOx reduction) whereas along the VOC-only path, ∂ΔOVOC intensifies by a factor of ∼ 1.2–1.3. Therefore, the effectiveness of NOx reduction accelerates far more strongly than that of VOC. Even under Stable, DryHot, and Moderate where VOC reductions are initially more effective, NOx reductions overtake them once the control level exceeds ∼ 20 %. For PM2.5 (Fig. S13), ∂ΔPMNOx dominates ∂ΔPMVOC by an order of magnitude under all types and for all reduction levels, confirming that PM2.5 responds almost exclusively to NOx control.
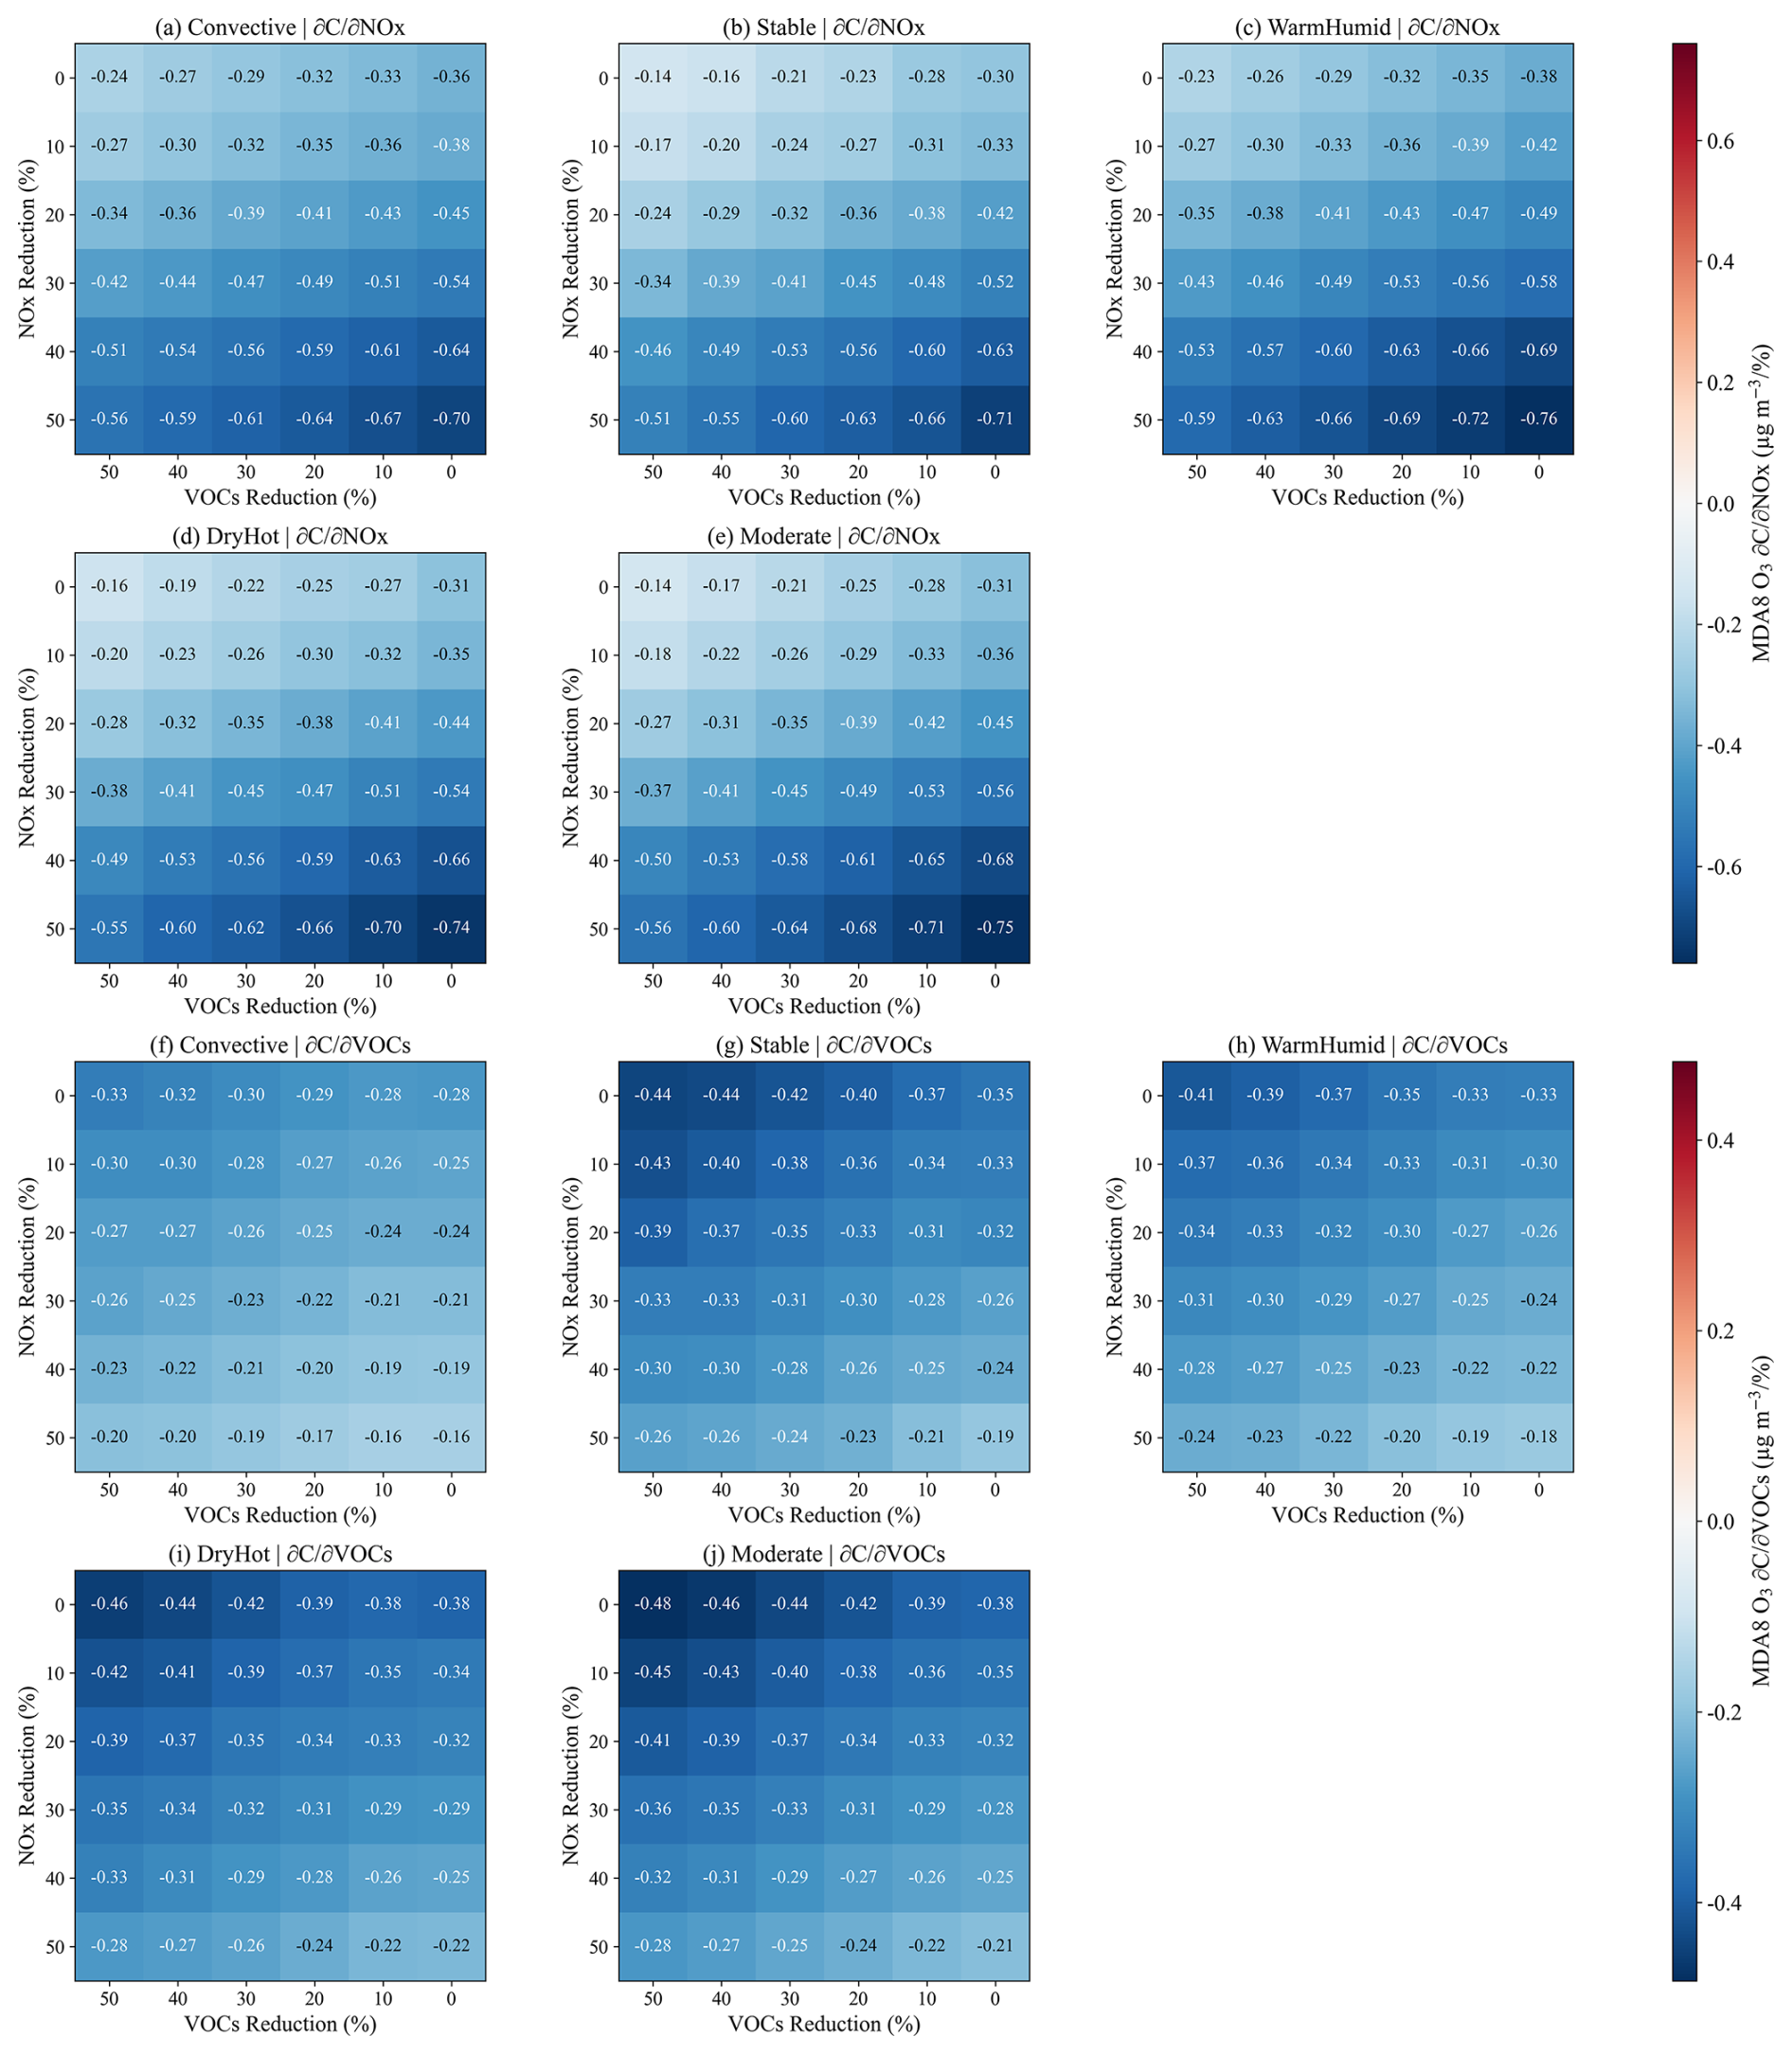
Figure 6MDA8 O3 response gradient to NOx and VOC emission reductions for DHP samples classified into different meteorological condition types. ∂(MDA8 O3) ∂NOx (µg m−3/%) for (a) Convective, (b) Stable, (c) WarmHumid, (d) DryHot, and (e) Moderate, and ∂(MDA8 O3) ∂VOCs (µg m−3/%) for (f) Convective, (g) Stable, (h) WarmHumid, (i) DryHot, and (j) Moderate. The gradients are computed by differentiating the absolute response matrices with respect to the reduction level at 10 percentage point intervals (0 %, 10 %, 20 %, 30 %, 40 %, 50 %). Rows and columns denote NOx and VOC reduction levels (%).
Figure 7 further links the responses shown in Figs. 5 and 6 to the underlying chemical states with each panel including 35 emission reduction scenarios and the zero-reduction baseline highlighted by yellow-filled markers. The axes represent the absolute value of chemical state diagnosed for each scenario, while the point color denotes the change in O3 or PM2.5 relative to the baseline. In the log10(OH) and FNR space (Fig. 7a), all types primarily lie in the transitional regime but with different shifts in chemical sensitivity. WarmHumid and Convective occupy higher FNR, implying a stronger tendency toward NOx-limited O3 production, supporting their greater NOx sensitivity in Fig. 5. In contrast, Stable, DryHot, and Moderate concentrate at lower FNR, closer to the VOC-influenced edge, consistent with near-symmetric NOx–VOC effectiveness and a slight VOC advantage under weak controls in Fig. 5. OH mainly modulates the overall photochemical intensity, whereas the separation among types is better explained by FNR. In the log10(HNO3) and NO2 space (Fig. 7b), WarmHumid and Convective exhibit trajectories that emphasize O3 reductions along decreasing NO2 and HNO3, whereas the other types occupy relatively NOx-rich portions of this space, matching the more symmetric behavior in Fig. 5.
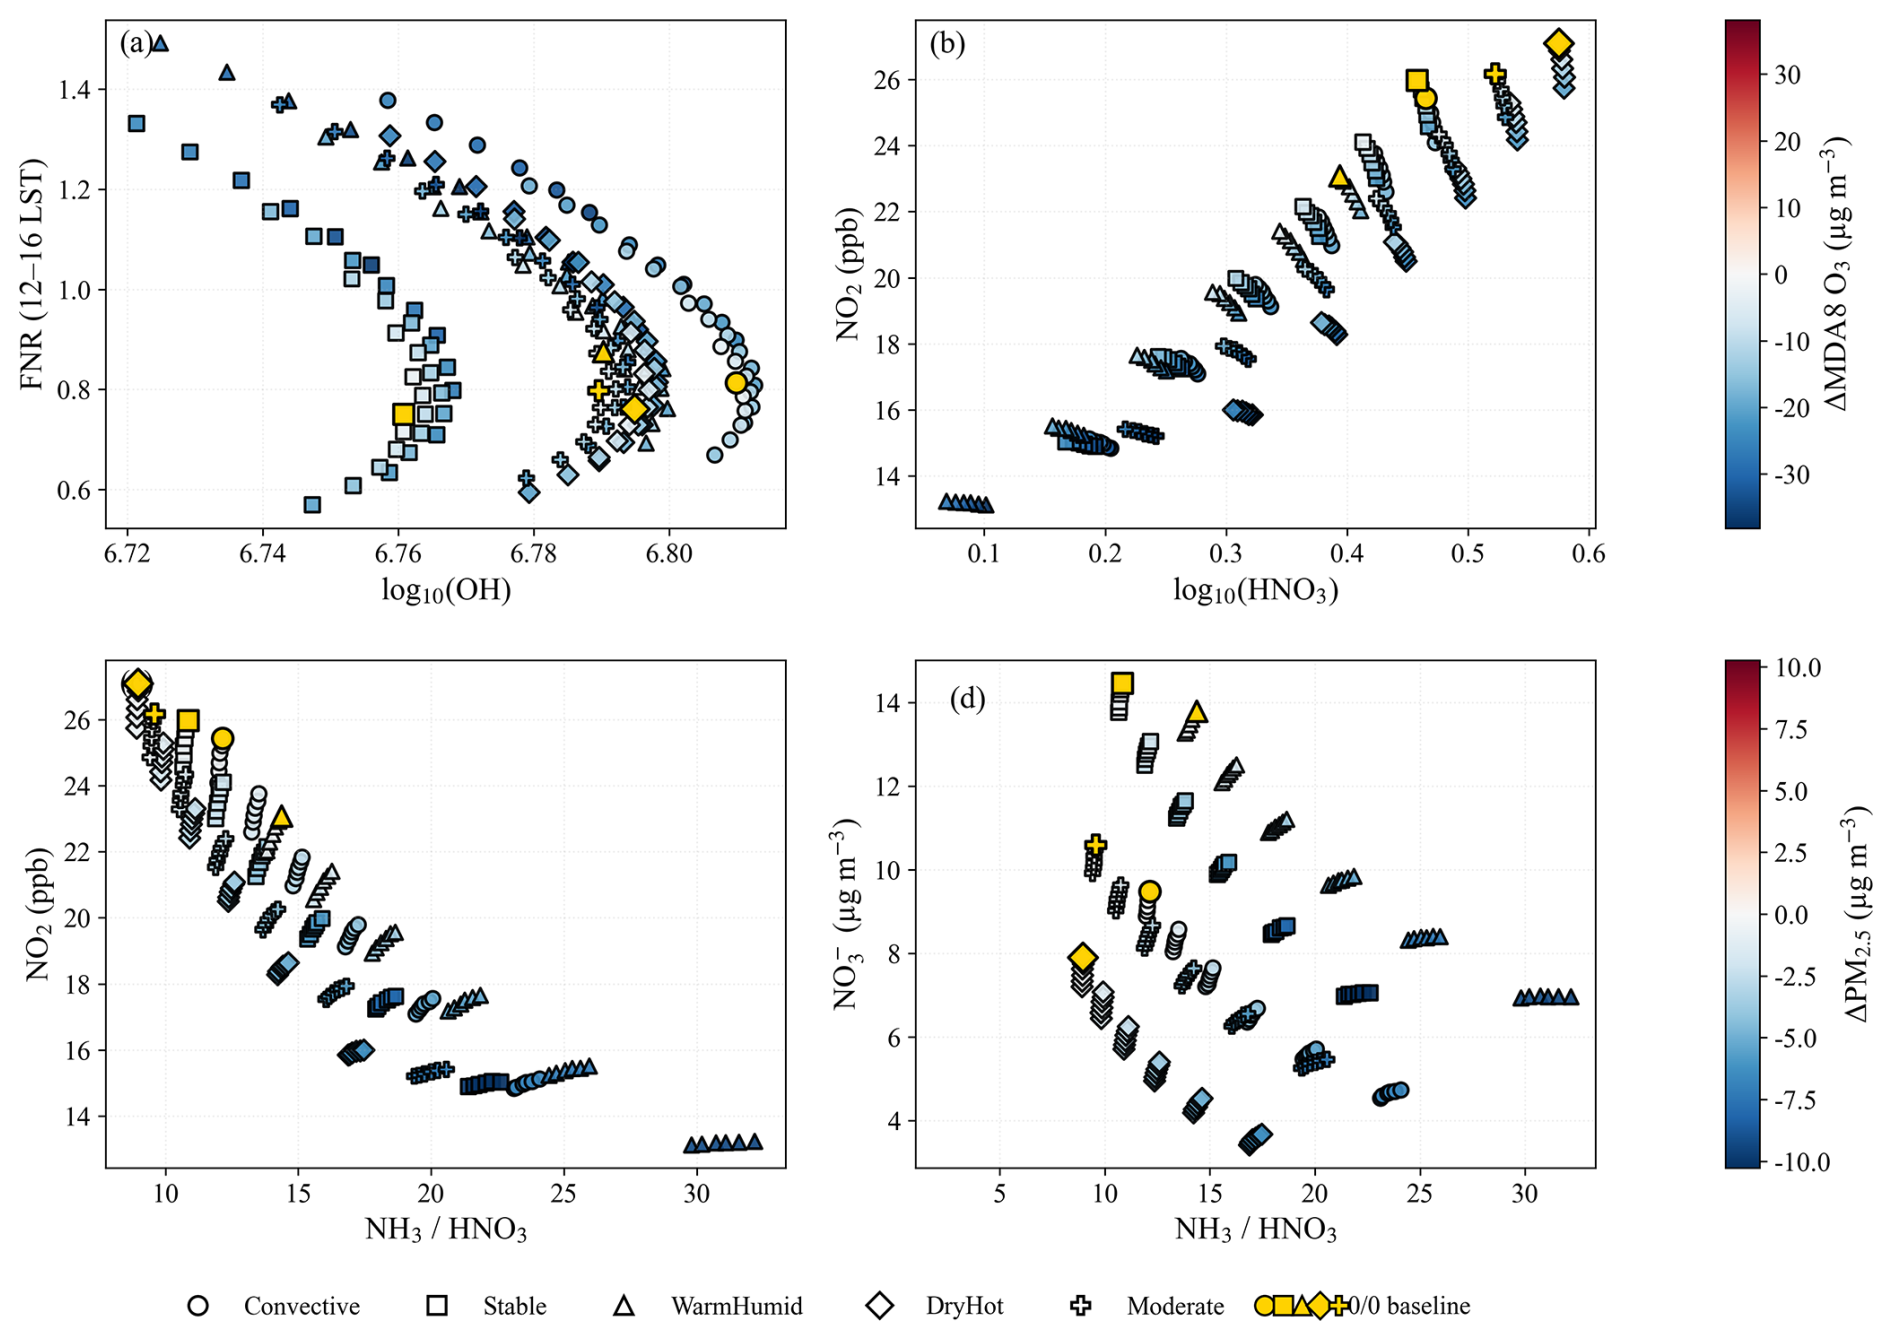
Figure 7Chemical state of MDA8 O3 and PM2.5 responses to NOx and VOC emission reductions for DHP samples. Each point represents O3 and PM2.5 responses to one of the 35 emission reduction scenarios for a given meteorological condition type; the baseline response is highlighted by yellow filled markers. The axes show the absolute value of chemical state diagnosed for each scenario, while point color denotes the concentration change relative to the baseline. The O3 response (µg m−3) in relation to (a) log10(OH) and FNR, and to (b) log10(HNO3) and NO2, respectively. The PM2.5 response (µg m−3) in relation to (c) NH3 HNO3 and NO2, and to (d) NH3 HNO3 and NO, respectively. OH and HNO3 are shown on a log10 scale.
Figure 7c and d show that PM2.5 changes are controlled primarily through the nitrate formation pathway. PM2.5 responds strongly as the NH3–HNO3 balance shifts under NOx reduction under WarmHumid and Stable indicating higher nitrate formation efficiency, consistent with their largest PM2.5 decreases under NOx reductions in Fig. 5. DryHot shows weaker PM2.5 sensitivity within the same chemical coordinate system, indicating that hot conditions reduce the effectiveness of translating HNO3 changes into particulate mass via unfavorable ammonium nitrate partitioning. Convective and Moderate generally fall between these extremes, consistent with their intermediate PM2.5 response ranking in Fig. 5. Figure 7d confirms that NO is the dominant driver of PM2.5 reductions. Under all types, stronger PM2.5 decreases co-occur with lower NO, with WarmHumid and Stable showing a clearer alignment between declining NO and more negative PM2.5 response, consistent with their stronger NOx-driven PM2.5 sensitivity in Fig. 5.
Figure 8 illustrates the diurnal variation of the chemical responses. For O3 (Fig. 8a), all types show weak nighttime changes, rapidly increasing reductions after sunrise, and maximum decreases during late morning and afternoon when photochemical production is most active. The strongest daytime O3 reductions occur under WarmHumid, consistent with the largest positive FNR response under WarmHumid (Fig. 8b), indicating that emission reductions push the chemical regime further toward the NOx-sensitive side. This is also consistent with the strongest O3 response and the largest asymmetry between NOx and VOC controls under WarmHumid in Fig. 5.
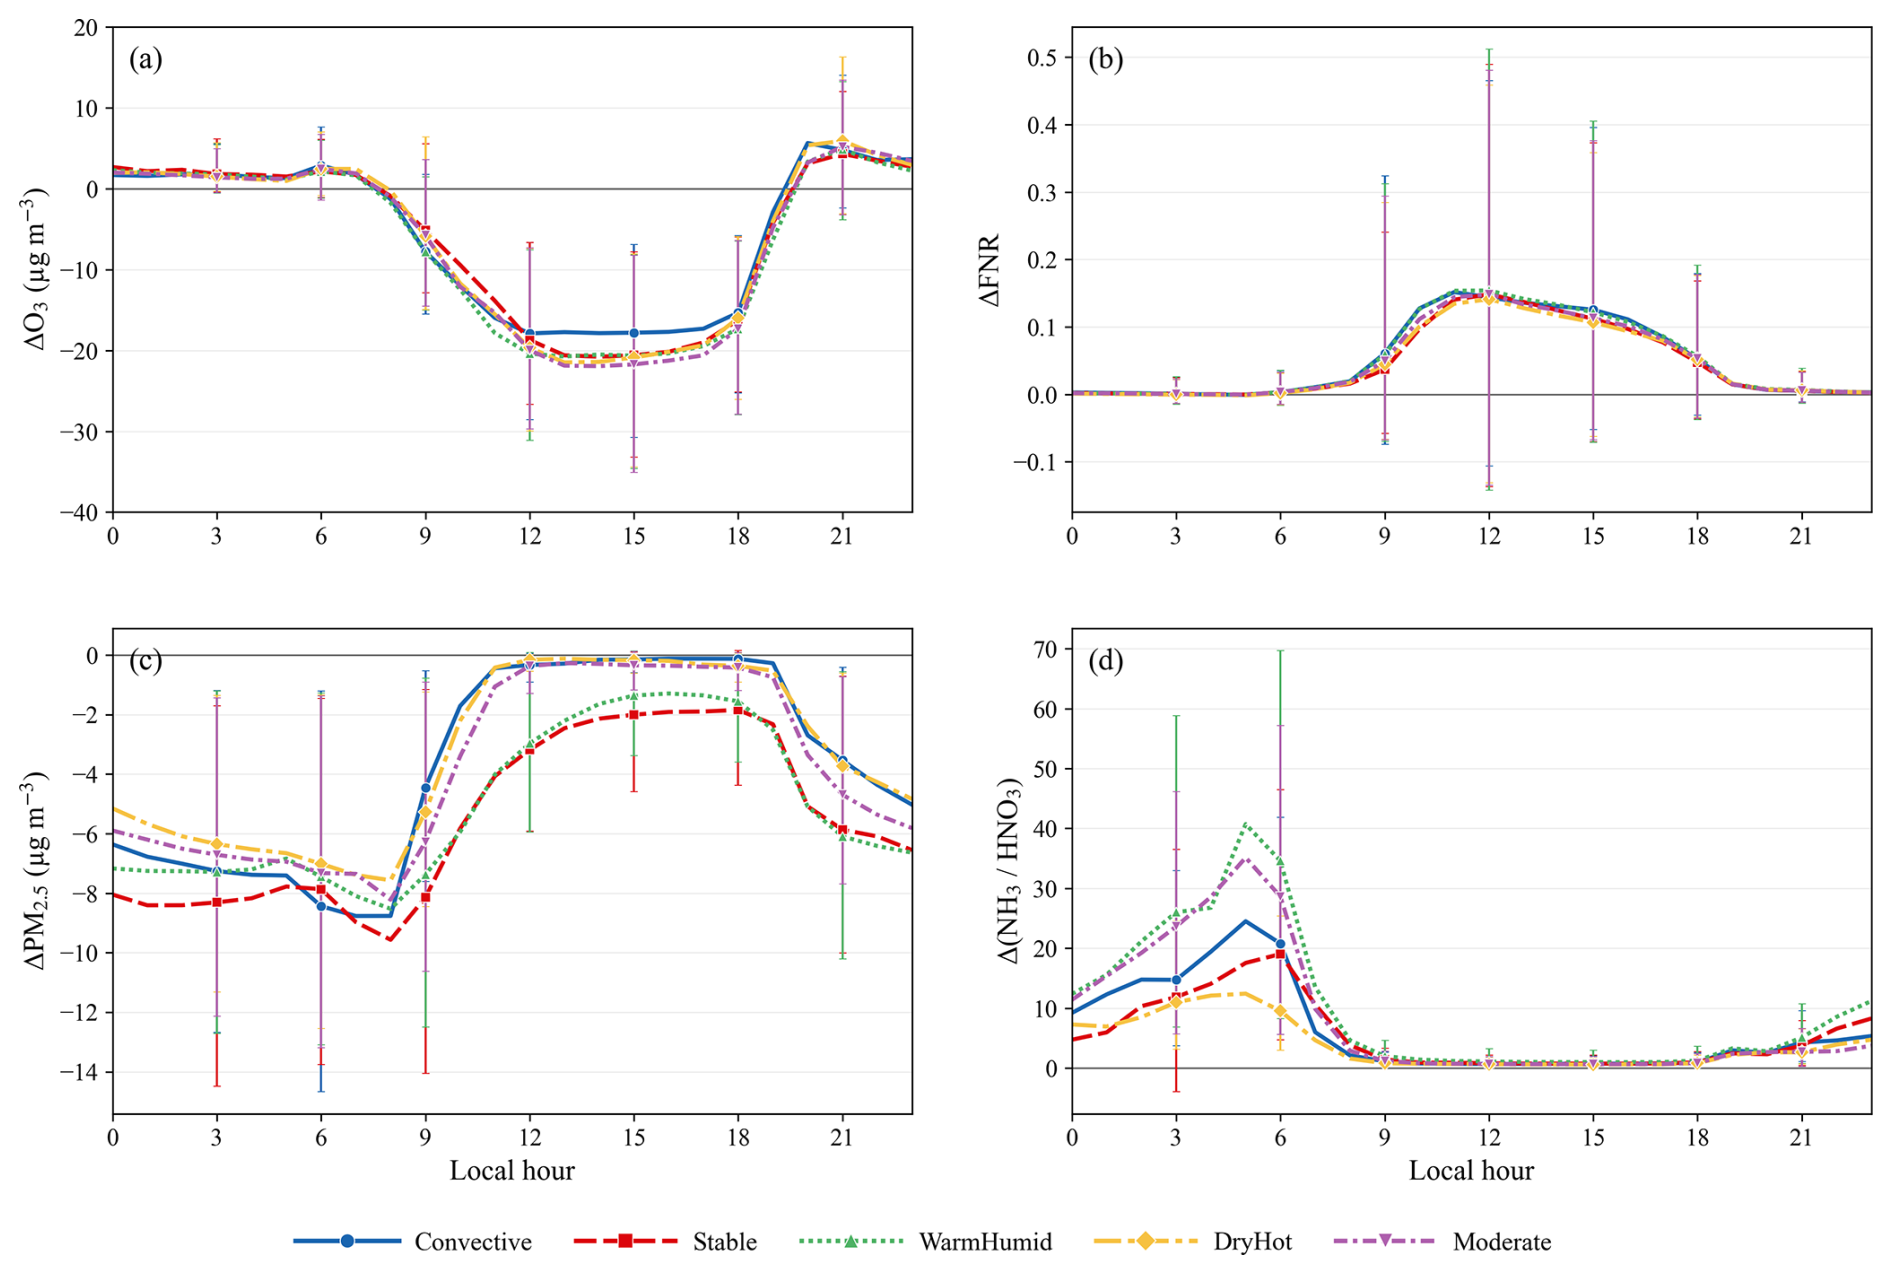
Figure 8Diurnal variations of the median value of the response of (a) O3 (µg m−3), (b) FNR, (c) PM2.5 (µg m−3), and (d) NH3 HNO3 to NOx and VOC emission reductions under different meteorological condition types. The vertical bars plotted every 3 h indicate the p10–p90 (10th and 90th percentiles) range across emission reduction scenarios.
PM2.5 responses (Fig. 8c) are strongest during nighttime and early morning and weaken substantially during daytime with WarmHumid and Stable largest and DryHot weakest. This is closely linked to the NH3 HNO3 response (Fig. 8d), which shows that emission reductions substantially increase the NH3 HNO3 ratio under WarmHumid and Stable during nighttime and early morning, enhancing the sensitivity of nitrate formation to HNO3 removal. Conversely, the smaller NH3 HNO3 response under DryHot reflects less favorable conditions for particulate nitrate formation.
The p10–p90 ranges reveal that the influence of emission reduction level varies throughout the day. The O3 spread increases markedly during the daytime reduction period whereas the largest spread in PM2.5 and NH3 HNO3 response occurs during nighttime and early morning, when partitioning and accumulation processes dominate. Notably, for O3 the inter-scenario variability clearly exceeds the inter-type differences, whereas for PM2.5 the inter-type differences are comparable, highlighting that O3 responses are controlled primarily by reduction intensity, while PM2.5 responses are additionally modulated by meteorological condition.
3.5 The impact of aerosol-meteorology feedback on pollutant response to precursor perturbations
The impact of aerosol-meteorology feedback on PM2.5 O3 concentration response to precursor perturbations (ΔaerX), as described in Sect. 2.3, is calculated as the difference between the ΔX and ΔwoX. A negative value indicates that aerosol-meteorology feedback enhances the emission reduction effect, while a positive value indicates that aerosol-meteorology feedback weakens it. The absolute changes of response are shown in Fig. S14 and the percentage changes of response, expressed relative to the baseline concentration in EXP_W_BASE, are shown in Fig. 9.
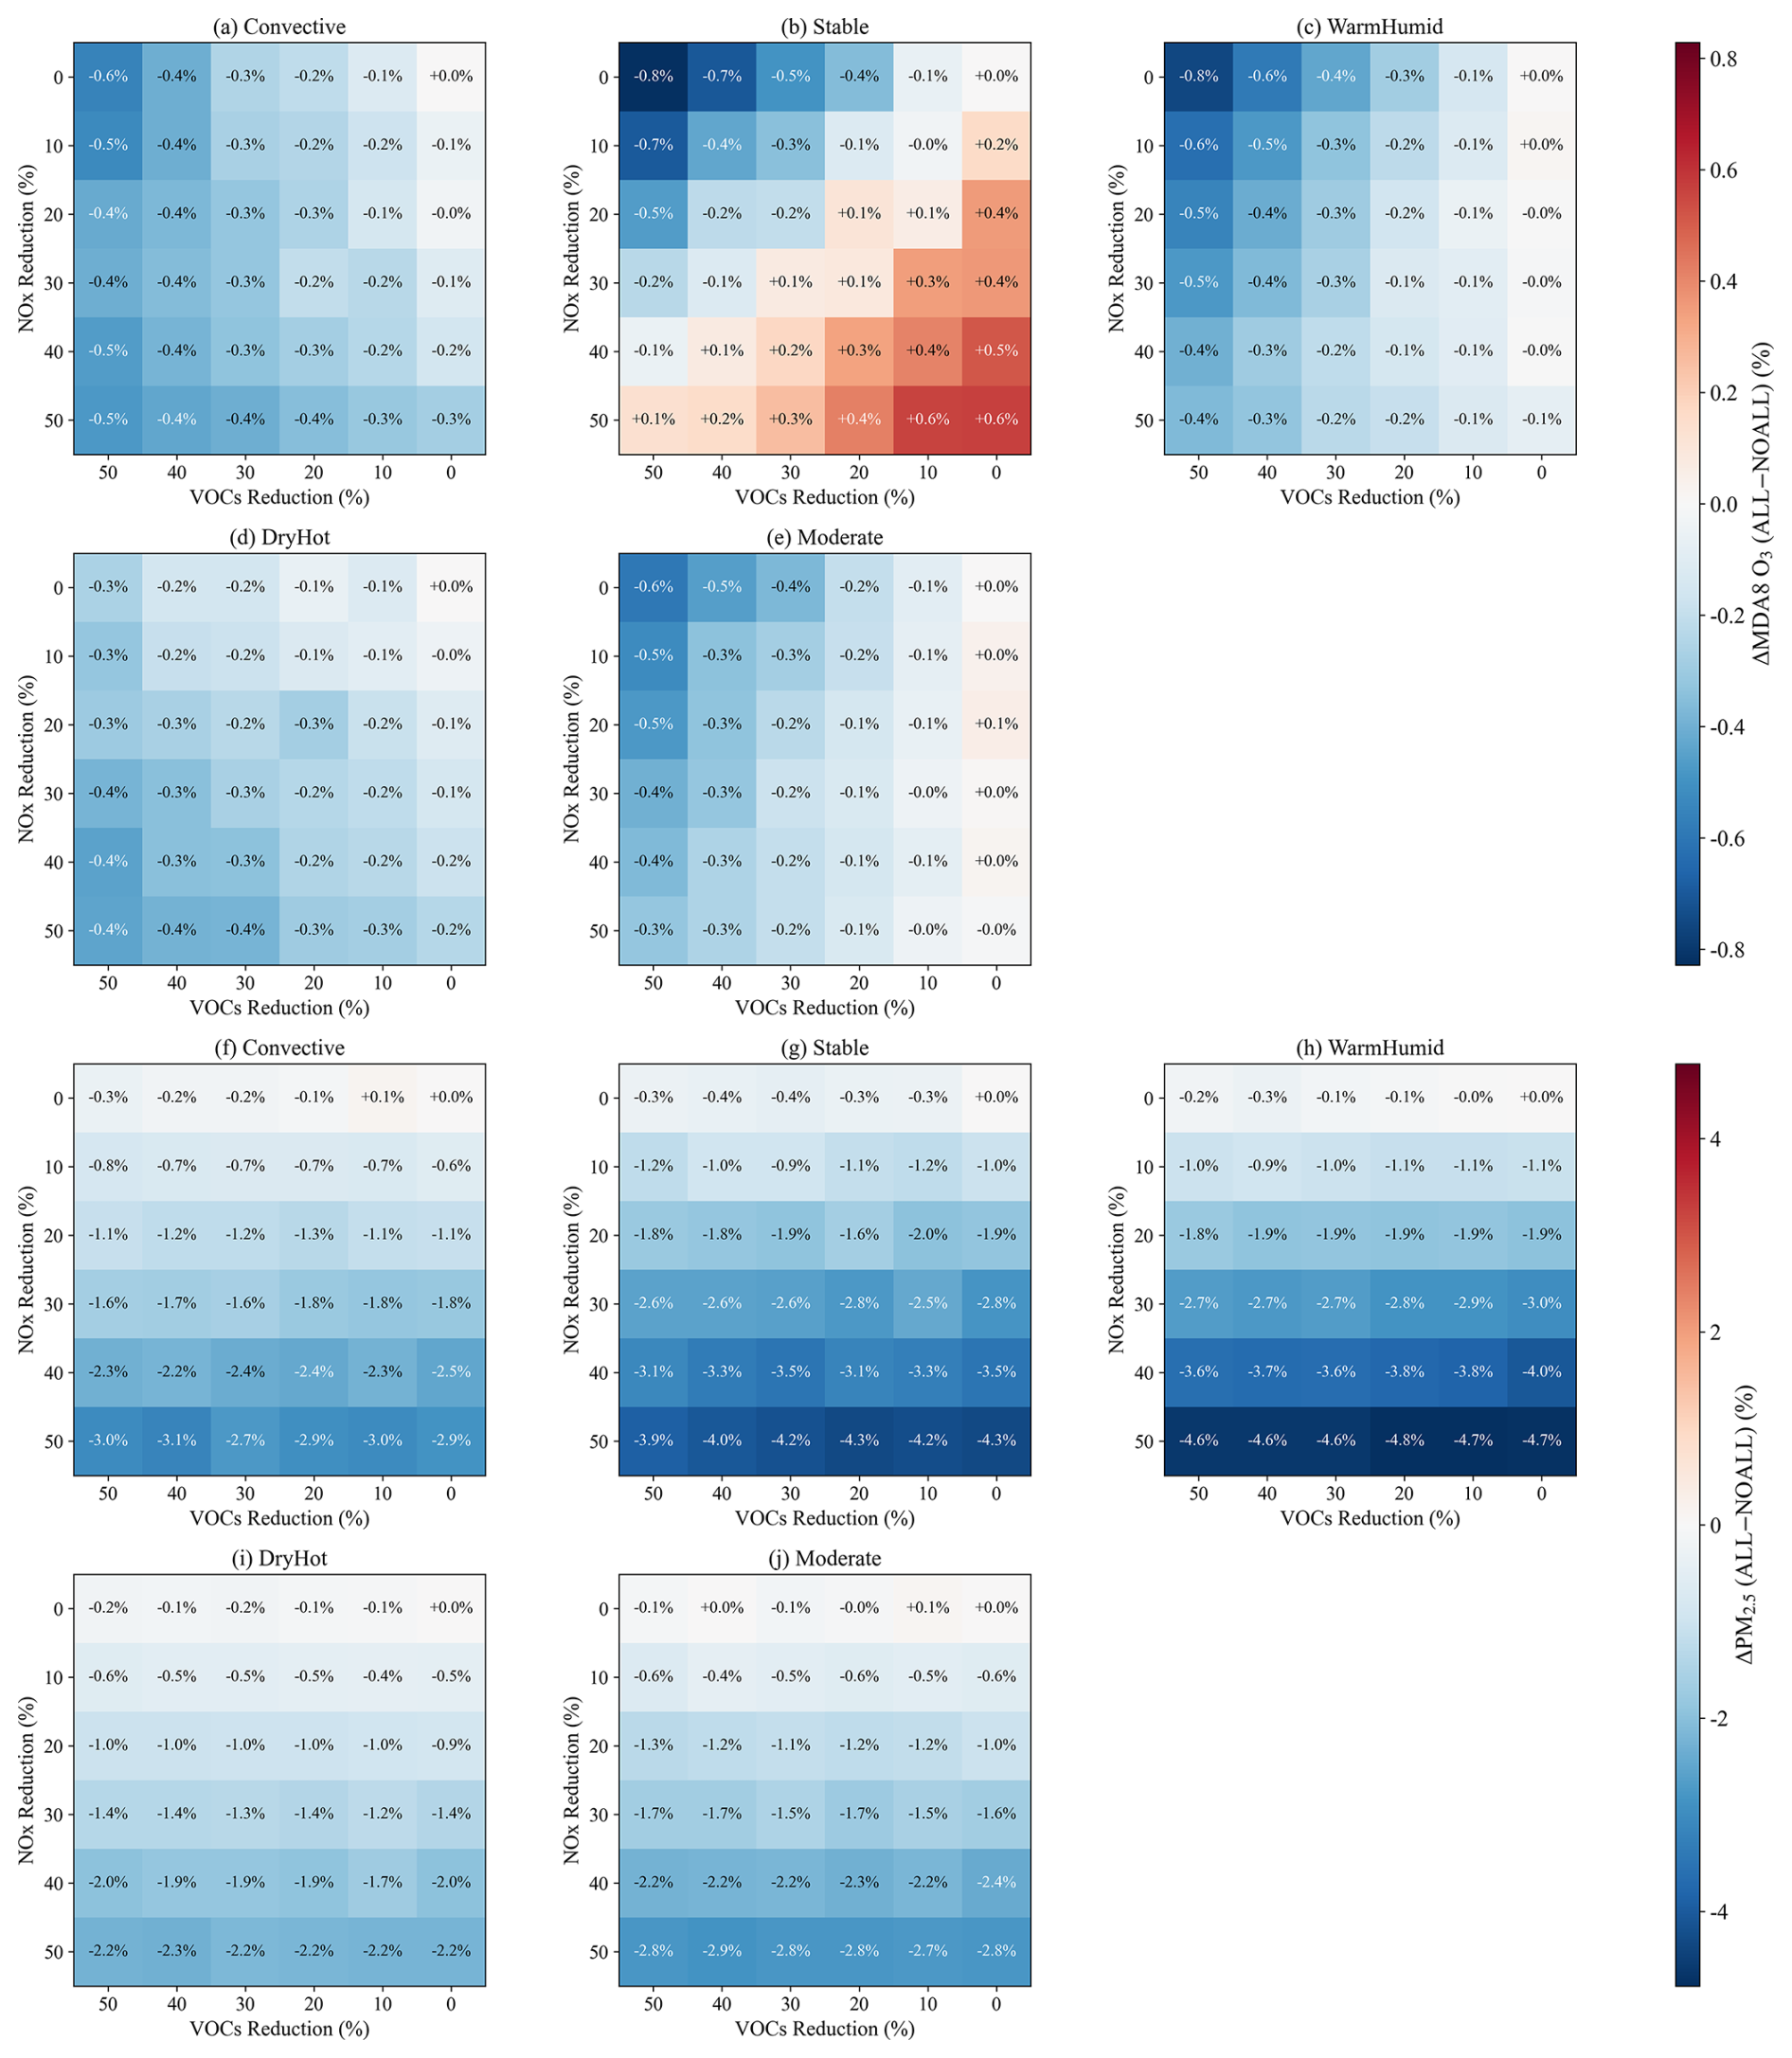
Figure 9The impact of aerosol-meteorology feedback on MDA8 O3 (ΔaerMDA8 O3, %) and PM2.5 (ΔaerPM2.5, %) responses to NOx and VOC emission reductions for (a, f) Convective, (b, g) Stable, (c, h) WarmHumid, (d, i) DryHot, and (e, j) Moderate. Rows and columns denote NOx and VOC reduction levels (%), respectively. Percentages are expressed relative to the baseline concentration in EXP_W_BASE.
For MDA8 O3 (Fig. 9a–e), ΔaerMDA8 O3 is generally negative under Convective, WarmHumid, DryHot, and Moderate, indicating that aerosol-meteorology feedback slightly enhances the effectiveness of emission reductions. The magnitude of this enhancement is relatively small, typically less than 1 % in relative terms and reaching −0.72 to −1.14 µg m−3 in absolute terms (Fig. S14). In contrast, under Stable, ΔaerMDA8 O3 becomes positive when NOx reductions are large and VOC reductions are small (up to 0.6 %), suggesting that aerosol-meteorology feedback weakens the O3 reduction under stagnant atmospheric conditions, reflecting reduced photolysis and elevated NO titration offsetting the emission-driven O3 decline. However, as the VOC emission reduction ratio increases, the positive ΔaerMDA8 O3 diminishes and eventually turns negative, indicating it can be overcome by sufficient VOC reduction. For PM2.5 (Fig. 9f–j), ΔaerPM2.5 remains consistently negative under all types and scenarios, with the enhancement strengthening as NOx reductions deepen. The enhancement is particularly pronounced under Stable and WarmHumid (−4.3 % and −4.8 % at 50 % NOx reduction in Fig. 9), and weaker under Convective (−3.1 %, −1.30 µg m−3), DryHot (−2.3 %, −0.94 µg m−3), and Moderate (−2.9 %, −1.23 µg m−3). Overall, aerosol-meteorology feedback amplifies the response of PM2.5 under all conditions, whereas their effect on O3 is small and condition dependent, weakening O3 reduction under Stable when NOx-only controls are applied.
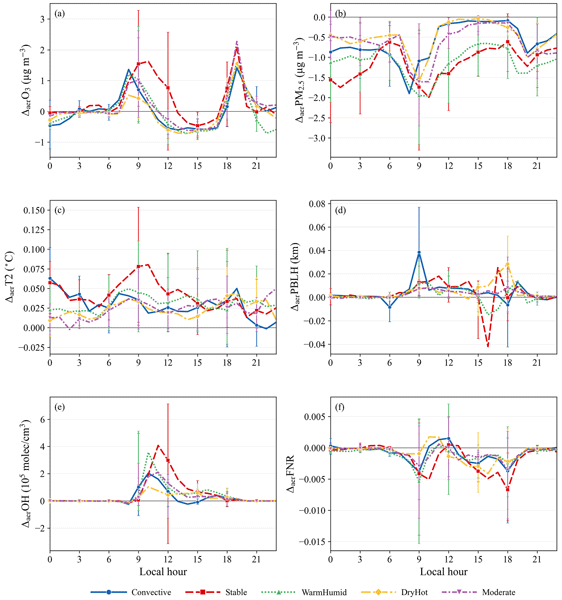
Figure 10 decomposes the impact of aerosol-meteorology feedback on pollutants and the related meteorological and chemical elements (T2, PBLH, OH, and FNR) response into diurnal profiles. The hourly values are larger than the daily averages. Aerosol-meteorology feedback weakens O3 reduction effectiveness (ΔaerO3 > 0, Fig. 10a) while enhancing PM2.5 reduction (ΔaerPM2.5 < 0, Fig. 10b) under all types, but both the magnitude and sign exhibit strong diurnal variation. For O3, the weakening is concentrated in the morning (8:00–10:00) and evening (18:00–20:00), with a sign reversal during the afternoon (12:00–16:00). The morning weakening is weakest under DryHot and strongest under Stable. The scenario spread is large. For example, under Stable, the p10–p90 range spans 0.16 (0.2 %) to 3.28 µg m−3 (4.1 %) at 09:00 and −0.15 (−0.2 %) to 3.82 µg m−3 (4.8 %) at 19:00, indicating that while the direction of weakening is robust, its magnitude depends strongly on the emission reduction pathway. For PM2.5, the enhancement is concentrated in the morning (07:00–10:00), with a median of −1.46 µg m−3 (−2.8 %), −1.74 µg m−3 (−3.8 %), −1.34 µg m−3 (−3.3 %), −1.22 µg m−3 (−2.7 %), −1.02 µg m−3 (−2.4 %) under Stable, WarmHumid, Convective, Moderate, and DryHot. The strongest scenarios reach −2.66 to −2.89 µg m−3 (−5.1 % to −6.4 %) under Stable and WarmHumid. During the afternoon (12:00–16:00), the PM2.5 enhancement weakens substantially but persists under Stable and WarmHumid. This persistent afternoon PM2.5 enhancement under Stable and WarmHumid is a key distinction from the other types.
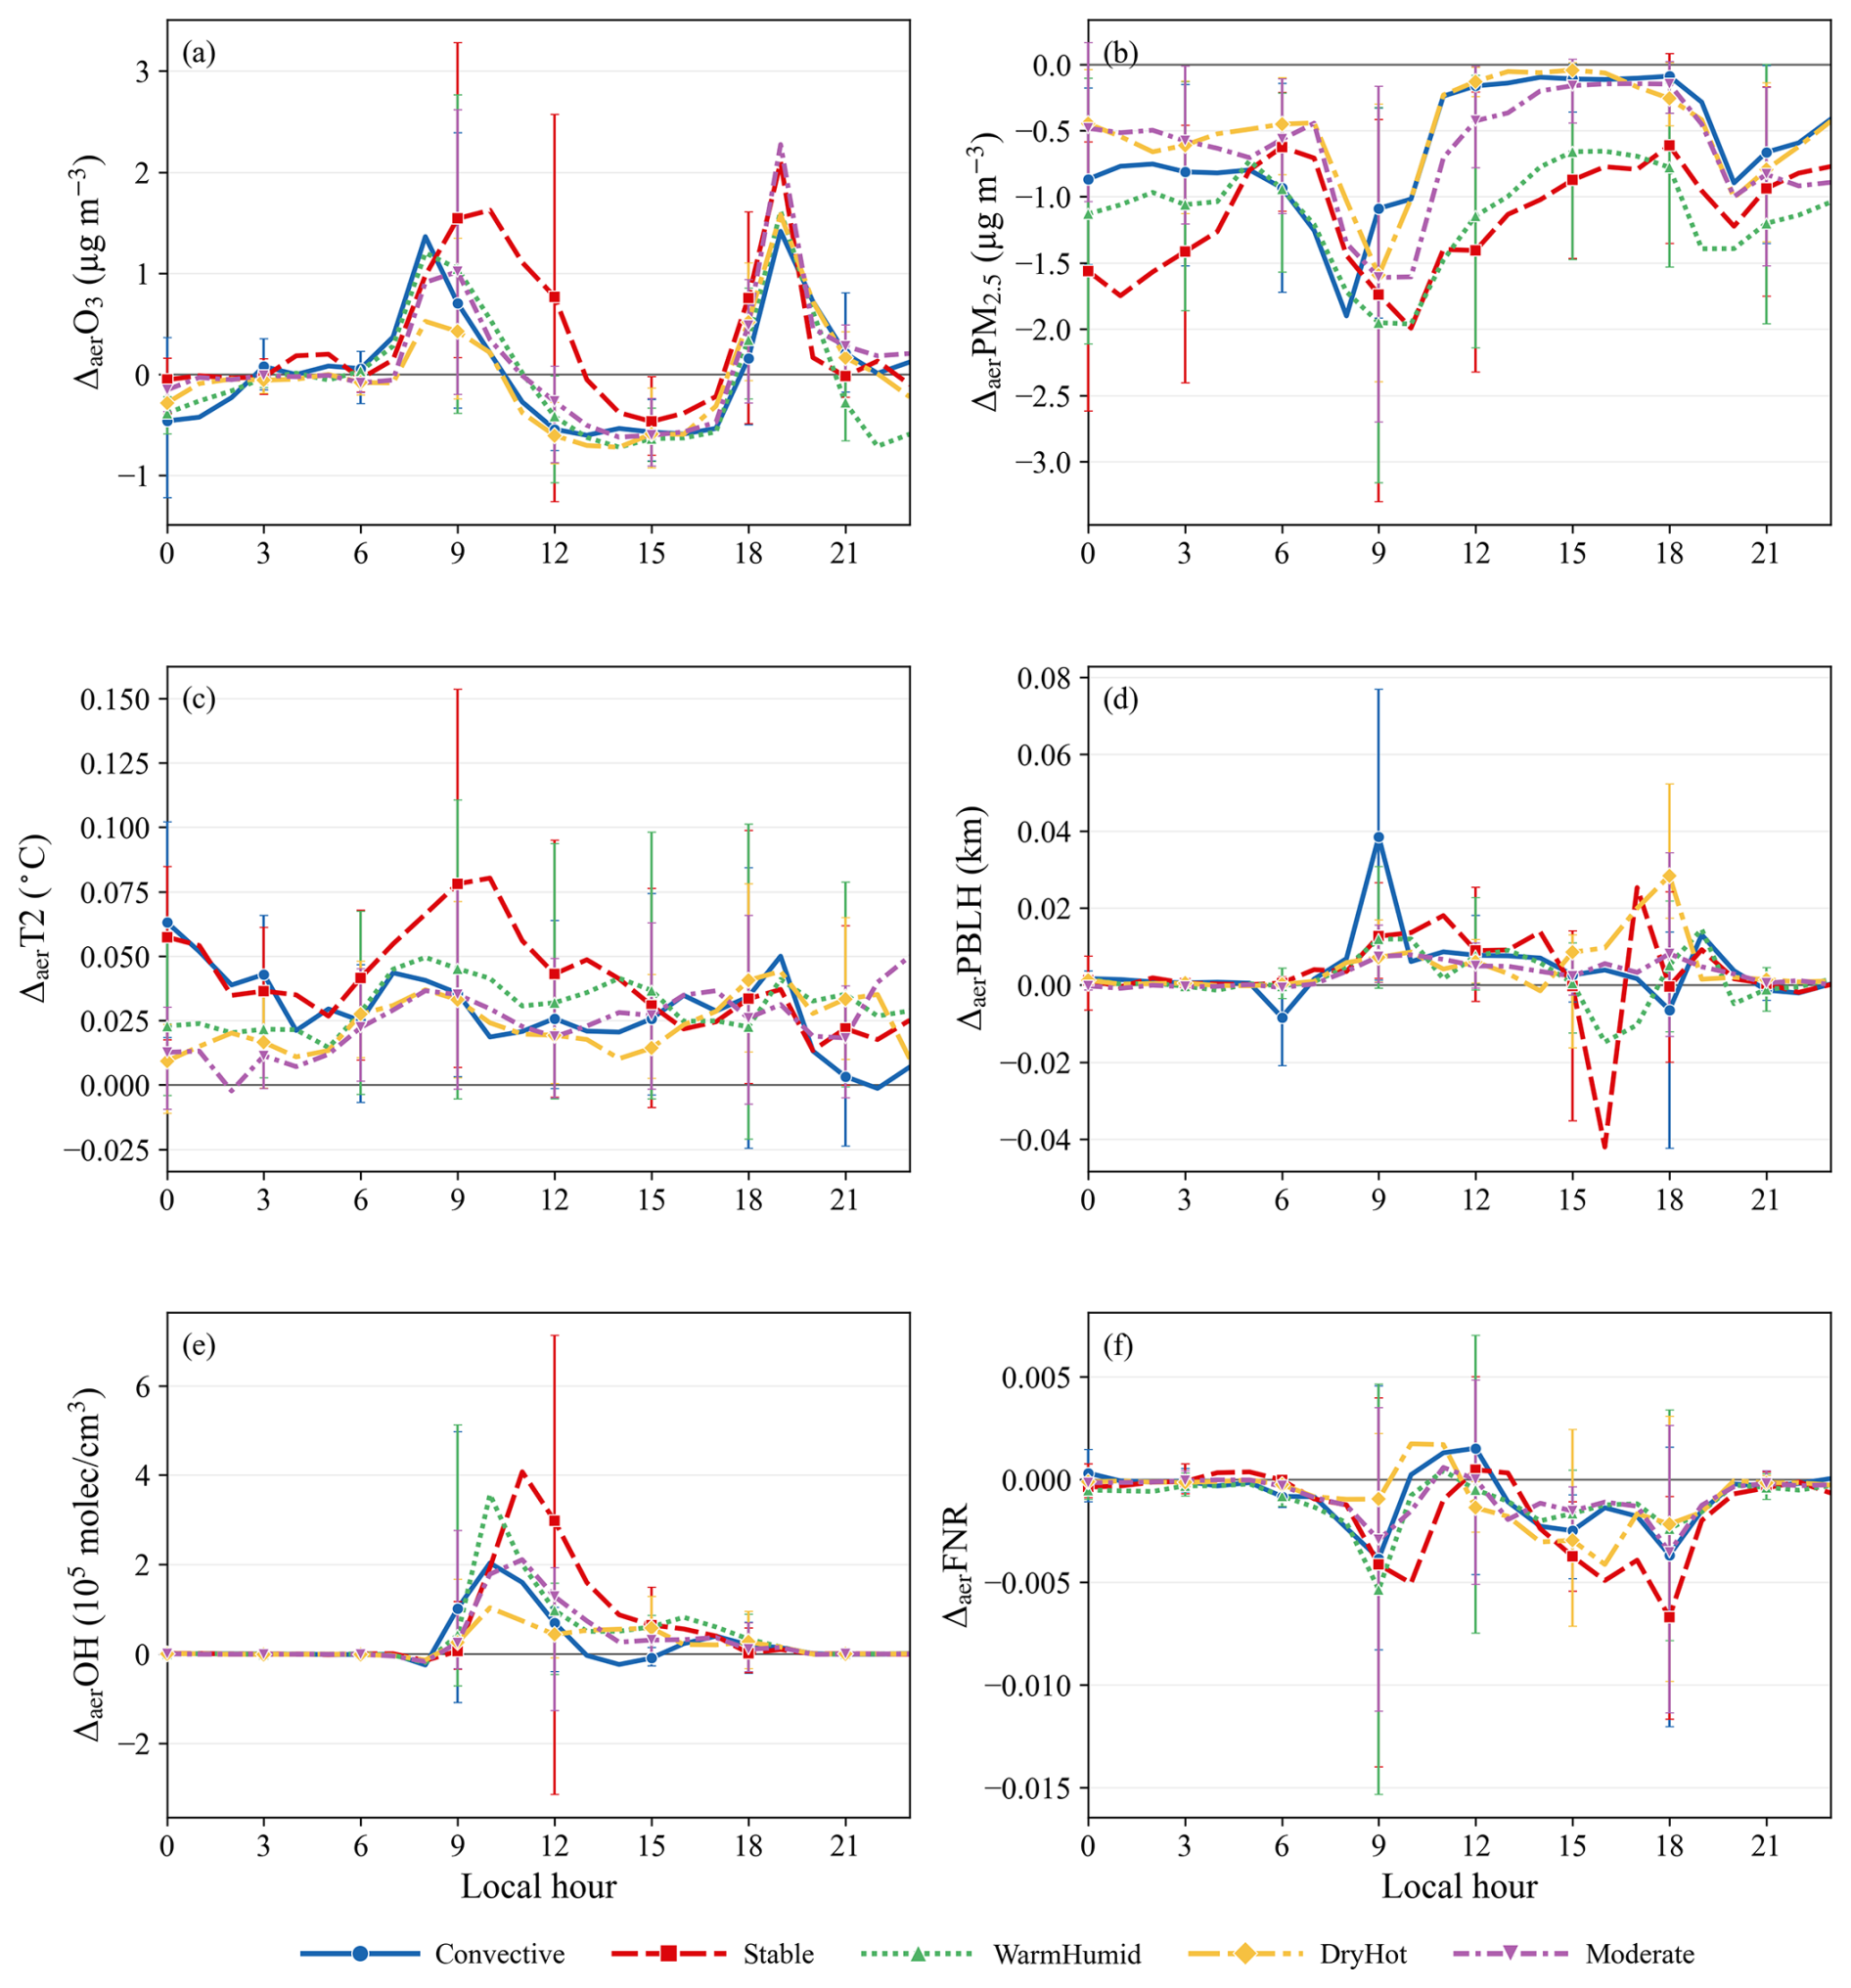
Figure 10Diurnal profiles of the impact of aerosol-meteorology feedback (ΔaerX) on the response of (a) O3 (µg m−3), (b) PM2.5 (µg m−3), (c) T2 (°C), (d) PBLH (km), (e) OH (105 molec. cm−3), and (f) FNR to NOx and VOC emission reductions under different meteorological condition types. The vertical bars plotted every 3 h indicate the p10–p90 range across emission reduction scenarios.
The aerosol-meteorology feedback-induced increase of temperature (Δaer T2 > 0, Fig. 10c) is sustained for all 24 hours under Stable and WarmHumid but weaker under DryHot. This indicates that when aerosol-meteorology feedback is weakened under emission control, the enhanced shortwave downward radiation (SWDOWN) and decreased liquid water path (LWP) (Fig. S15) raise surface temperature. Accordingly, ΔaerPBLH is predominantly positive (Fig. 10d), reflecting that the removal of aerosol suppression leads to a higher PBLH and thus stronger dispersion. Under Stable, positive ΔaerPBLH spans 19 out of 24 h with a broad daytime value of 12–18 m (09:00–14:00), and remains robust across scenarios. Under Convective, the positive ΔaerPBLH is concentrated around morning boundary layer development (peak 39 m at 09:00) with a wider spread. The extended duration of PBLH increase under Stable directly sustains the persistent afternoon PM2.5 enhancement.
Figure 10e shows that when aerosol-meteorology feedback is weakened, increased solar radiation enhances OH production with the largest increase of ΔaerOH under Stable. The OH spread is the largest among all variables indicating that the OH amplification is highly scenario-dependent, with some emission pathways even producing negative ΔaerOH. The FNR response (Fig. 10f) is predominantly negative, with the strongest change under Stable, but the spread frequently crosses zero across scenarios, indicating that the direction of FNR response is scenario-dependent while the median remains negative. The magnitude of FNR changes is very small, suggesting that aerosol affects O3 reduction effectiveness primarily through the OH changes rather than through substantial shifts in the NOx-versus VOC-limited regime.
The results of Fig. 10 are also supported by Fig. S16, which quantifies the differences in cloud properties and key meteorological fields between EXP_W_BASE and EXP_WO_BASE. The feedback reduces SWDOWN, increases cloud droplet number path (CDNP) and LWP, lowers T2 and PBLH, and raises RH2, with the largest responses under Stable. Since the DHP identification excludes days with more than 3 h of precipitation, the precipitation differences between the two experiments are very small, indicating that the fixed-CDNC-induced changes in wet removal and cloud lifetime have limited influence on the diagnosed responses. The aerosol-meteorology feedback also modifies DHP elimination under emission reductions (Fig. S17). Tracking the 1510 baseline DHP samples across the reduction matrix, the feedback enhances DHP elimination by up to 5.9 percentage points, strengthening with deeper NOx reductions but insensitive to VOC reductions, consistent with the enhanced PM2.5 response (ΔaerPM2.5 < 0).
Generally, under Stable, the combination of the longest PBLH sensitivity duration and strongest OH amplification maximizes both the weakening of O3 reduction and the enhancement of PM2.5 reduction. Under WarmHumid, the PM2.5 enhancement is comparable to Stable due to humidity driven heterogeneous chemistry, but the O3 weakening is much weaker. Under DryHot, efficient turbulent mixing and low humidity minimize all feedback responses.
This study investigated the response of co-occurring PM2.5 and O3 pollution to NOx–VOC precursor perturbations under typical meteorological conditions and the impact of aerosol-meteorology feedback on this response using WRF-Chem with 36 NOx–VOC precursor perturbation scenarios (0 %–50 % each) and paired simulations with and without aerosol-meteorology feedback for July 2020 over BTHS.
DHP samples were characterized by warm temperature (T2 ∼ 23–31 °C), moderate-to-high humidity (RH ∼ 45 %–80 %), and low PBLH (0.5–1.1 km), with concurrent increases of ∼ 13 µg m−3 in PM2.5 and ∼ 15 µg m−3 in MDA8 O3 relative to all samples. These characteristics are consistent with previous findings linking co-pollution to stagnant and humid conditions (Ma et al., 2023; Luo et al., 2022; Dai et al., 2024; Liu et al., 2026). Based on boundary layer, temperature and humidity conditions, the meteorological conditions of DHP samples were classified into five types: Convective, Stable, WarmHumid, DryHot, and Moderate. Unlike previous synoptic-scale classifications (Zong et al., 2021; Wang et al., 2025b; Zhan et al., 2024) or single meteorological element (Qian and Liao, 2025), this approach directly captured local boundary layer and thermodynamic conditions.
The pollutant characteristics were different under different meteorological conditions. Stable and WarmHumid showed the highest PM2.5 (median ∼ 46 µg m−3), driven by shallow boundary layer accumulation and humid gas-to-particle conversion, respectively, while DryHot showed the lowest (∼ 40 µg m−3) due to unfavorable NH4NO3 partitioning. For O3, DryHot and Moderate showed the highest concentrations (∼ 163 µg m−3) through active photochemistry, while WarmHumid was lowest (∼ 149 µg m−3).
O3 and PM2.5 responses to precursor perturbations were also distinctly different under different meteorological conditions. For O3, WarmHumid consistently showed the strongest O3 response at all NOx-dominated reduction levels, while DryHot showed the weakest. WarmHumid and Convective also showed stronger NOx sensitivity (NOx-only exceeds VOC-only by 6–7 percentage points at 50 % reduction) due to higher FNR, while Stable, DryHot, and Moderate showed near-symmetric responses with a slight VOC advantage at ≤ 20 %. Beyond ∼ 20 % NOx reduction, nonlinear amplification caused NOx control to overtake VOC control under all types, extending Ding et al. (2022) by showing the crossover point depends on meteorological condition. For PM2.5, NOx reductions dominated through the nitrate pathway, with WarmHumid and Stable showing the strongest response (−21.4 % and −21.2 % at 50 % NOx) and DryHot the weakest (−15.2 %).
Aerosol-meteorology feedback generally enhanced PM2.5 reduction but weakened O3 reduction, with both effects different by types. For PM2.5, the enhancement was strongest under Stable and WarmHumid (−4.3 % to −4.8 % at 50 % NOx) and weakest under DryHot (−2.3 %), consistent with Zhu et al. (2021) but extending to meteorological condition difference. For O3, aerosol-meteorology feedback slightly enhanced reduction under Convective, WarmHumid, DryHot, and Moderate (< 1 %), but weakened it under Stable when NOx reductions were large without VOC co-reduction (up to +0.6 %), consistent with Yang et al. (2024) and further revealing that this effect concentrates under stagnant conditions and can be overcome by sufficient VOC co-reduction. Diurnally, the O3 weakening peaked in the morning and evening and the PM2.5 enhancement peaked in the morning and persisted into the afternoon under Stable and WarmHumid through persistent PBLH increase and strong OH amplification while DryHot minimized all feedback through efficient mixing and low humidity. These results extended Li et al. (2026) and Zhao et al. (2026b) by demonstrating that aerosol-meteorology feedback varied substantially for different meteorological condition even within the same season.
Several limitations should be noted. First, as the analysis covers a single month (July 2020), the five meteorological condition types, though physically distinct and consistent with multi-year studies, may not represent the frequency distribution and NOx–VOC sensitivity of such conditions in other seasons or years. The DHP samples are also not fully independent owing to spatial and temporal autocorrelation, so the effective sample size may be smaller than the nominal count; the main conclusions, however, rest on large between-type contrasts and the persistent elevation of O3 under all types, which are robust to this dependence. Second, the MOSAIC aerosol scheme is known to underestimate SOA, which weakens the simulated PM2.5 response to VOC reductions; the PM2.5 response should therefore be interpreted as conservative estimates. Third, the DHP thresholds reflect the air quality changes after the Action Plan took effect and may require adjustment as concentrations continue to decline. Furthermore, the perturbation matrix isolates NOx–VOC sensitivity and does not represent a comprehensive emission control strategy. Reductions of SO2, NH3, primary particulate matter, and other species would provide additional PM2.5 co-benefits that are not quantified here.
These findings indicate important implications for atmospheric chemistry understanding and air quality management. The effectiveness of emission controls and aerosol-meteorology feedback on pollutant reductions is not fixed but varies systematically with local boundary layer, thermal, and moisture conditions, helping explain why identical emission control policies can yield different outcomes across episodes and locations. For management, the results suggest meteorological condition specific control strategies. Coordinated NOx–VOC reduction is most beneficial under Stable and WarmHumid, sufficient VOC co-reduction can overcome aerosol-meteorology feedback-induced O3 weakening under Stable, deeper combined precursor reductions are needed under DryHot and Moderate, and additional VOC control remains necessary in urban areas to avoid possible O3 increases under VOC-limited chemistry. Incorporating meteorological classification into emission control strategies can enhance the effectiveness and efficiency of DHP mitigation. It is noted that these implications are drawn from a single-month case study and should be re-examined for other seasons and years before operational application.
The updated USTC version of WRF-Chem can be downloaded from https://doi.org/10.5281/zenodo.15702248 (Xia et al., 2024) or can be obtained from the corresponding author upon request. The Multi-resolution Emission Inventory for China (MEIC) at 0.25°×0.25° resolution for 2020 is available at http://meicmodel.org.cn (last access: 11 June 2026). ERA5 reanalysis data is available from the Copernicus Climate Data Store (https://doi.org/10.24381/cds.adbb2d47, Copernicus Climate Change Service, 2023). Other raw data can be provided by the corresponding author upon request.
The supplement related to this article is available online at https://doi.org/10.5194/acp-26-16225-2026-supplement.
YG, YZ, and MZ designed the study. YG and YZ conducted model simulations. YG and MZ carried out the analysis and visualized the results, with YZ and ZY contributing to the investigation. The manuscript draft was written by YG. All authors discussed the results and edited the paper.
The contact author has declared that none of the authors has any competing interests.
Publisher's note: Copernicus Publications remains neutral with regard to jurisdictional claims made in the text, published maps, institutional affiliations, or any other geographical representation in this paper. The authors bear the ultimate responsibility for providing appropriate place names. Views expressed in the text are those of the authors and do not necessarily reflect the views of the publisher.
We thank for the technical support of the National Large Scientific and Technological Infrastructure “Earth System Numerical Simulation Facility” (https://cstr.cn/31134.02.EL, last access: 11 June 2026).
This work was supported by Jing-Jin-Ji Regional Integrated Environmental Improvement-National Science and Technology Major Project (grant nos. 2026ZD1213300 and 2026ZD1213301), the National Key Research and Development Program of China (grant nos. 2022YFC3701203 and 2022YFC3701200).
This paper was edited by Xiaohong Liu and reviewed by Yang Yang and one anonymous referee.
Bennartz, R.: Global assessment of marine boundary layer cloud droplet number concentration from satellite, J. Geophys. Res., 112, D02208, https://doi.org/10.1029/2006JD007547, 2007.
Chen, F. and Dudhia, J.: Coupling an Advanced Land Surface–Hydrology Model with the Penn State–NCAR MM5 Modeling System, Part I: Model Implementation and Sensitivity, Mon. Weather Rev., 129, 569–585, https://doi.org/10.1175/1520-0493(2001)129<0569:CAALSH>2.0.CO;2, 2001.
Copernicus Climate Change Service: ERA5 hourly data on single levels from 1940 to present, Copernicus Climate Change Service (C3S) Climate Data Store (CDS) [data set], https://doi.org/10.24381/cds.adbb2d47, 2023.
Dai, H., Liao, H., Wang, Y., and Qian, J.: Co-occurrence of ozone and PM2.5 pollution in urban/non-urban areas in eastern China from 2013 to 2020: Roles of meteorology and anthropogenic emissions, Sci. Total Environ., 924, 171687, https://doi.org/10.1016/j.scitotenv.2024.171687, 2024.
Ding, D., Xing, J., Wang, S., Dong, Z., Zhang, F., Liu, S., and Hao, J.: Optimization of a NOx and VOC Cooperative Control Strategy Based on Clean Air Benefits, Environ. Sci. Technol., 56, 739–749, https://doi.org/10.1021/acs.est.1c04201, 2022.
Foken, T.: 50 Years of the Monin–Obukhov Similarity Theory, Bound.-Lay. Meteorol., 119, 431–447, https://doi.org/10.1007/s10546-006-9048-6, 2006.
Folorunsho, A., Dudhia, J., Sullivan, J., Walter, P., Flynn, J., Griggs, T., Sheesley, R., Usenko, S., Gronoff, G., Estes, M., and Li, Y.: High-Resolution WRF-LES-Chem Simulations to Investigate Ozone Formation Regimes in Houston, ACS ES&T Air 2, 1668–1683, https://doi.org/10.1021/acsestair.5c00109, 2025.
Freitas, S. R., Grell, G. A., Molod, A., Thompson, M. A., Putman, W. M., Santos e Silva, C. M., and Souza, E. P.: Assessing the Grell-Freitas Convection Parameterization in the NASA GEOS Modeling System, J. Adv. Model. Earth Sy., 10, 1266–1289, https://doi.org/10.1029/2017MS001251, 2018.
Geng, G., Liu, Y., Liu, Y., Liu, S., Cheng, J., Yan, L., Wu, N., Hu, H., Tong, D., Zheng, B., Yin, Z., He, K., and Zhang, Q.: Efficacy of China's clean air actions to tackle PM2.5 pollution between 2013 and 2020, Nat. Geosci., 17, 987–994, https://doi.org/10.1038/s41561-024-01540-z, 2024.
Gong, S. L., Barrie, L. A., and Blanchet, J.-P.: Modeling sea-salt aerosols in the atmosphere: 1. Model development, J. Geophys. Res., 102, 3805–3818, https://doi.org/10.1029/96JD02953, 1997.
Grell, G. A., Peckham, S. E., Schmitz, R., McKeen, S. A., Frost, G., Skamarock, W. C., and Eder, B.: Fully coupled ”online” chemistry within the WRF model, Atmos. Environ., 39, 6957–6975, https://doi.org/10.1016/j.atmosenv.2005.04.027, 2005.
Guenther, A., Karl, T., Harley, P., Wiedinmyer, C., Palmer, P. I., and Geron, C.: Estimates of global terrestrial isoprene emissions using MEGAN (Model of Emissions of Gases and Aerosols from Nature), Atmos. Chem. Phys., 6, 3181–3210, https://doi.org/10.5194/acp-6-3181-2006, 2006.
He, C., Liu, J., Zhou, Y., Zhou, J., Zhang, L., Wang, Y., Liu, L., and Peng, S.: Synergistic PM2.5 and O3 control to address the emerging global PM2.5-O3 compound pollution challenges, Eco-Environ. Health, 3, 325–337, https://doi.org/10.1016/j.eehl.2024.04.004, 2024.
Iacono, M. J., Delamere, J. S., Mlawer, E. J., Shephard, M. W., Clough, S. A., and Collins, W. D.: Radiative forcing by long-lived greenhouse gases: Calculations with the AER radiative transfer models, J. Geophys. Res., 113, D13103, https://doi.org/10.1029/2008JD009944, 2008.
Ivatt, P. D., Evans, M. J., and Lewis, A. C.: Suppression of surface ozone by an aerosol-inhibited photochemical ozone regime, Nat. Geosci., 15, 536–540, https://doi.org/10.1038/s41561-022-00972-9, 2022.
Janjić, Z. I.: The Step-Mountain Eta Coordinate Model: Further Developments of the Convection, Viscous Sublayer, and Turbulence Closure Schemes, Mon. Weathr Rev., 122, 927–945, https://doi.org/10.1175/1520-0493(1994)122<0927:TSMECM>2.0.CO;2, 1994.
Kusaka, H. and Kimura, F.: Coupling a Single-Layer Urban Canopy Model with a Simple Atmospheric Model: Impact on Urban Heat Island Simulation for an Idealized Case, J. Meteorol. Soc. Jpn, 82, 67–80, https://doi.org/10.2151/jmsj.82.67, 2004.
Kusaka, H., Kondo, H., Kikegawa, Y., and Kimura, F.: A Simple Single-Layer Urban Canopy Model For Atmospheric Models: Comparison With Multi-Layer And Slab Models, Bound.-Lay. Meteorol., 101, 329–358, https://doi.org/10.1023/A:1019207923078, 2001.
Li, H., Zhang, Q., Zheng, B., Chen, C., Wu, N., Guo, H., Zhang, Y., Zheng, Y., Li, X., and He, K.: Nitrate-driven urban haze pollution during summertime over the North China Plain, Atmos. Chem. Phys., 18, 5293–5306, https://doi.org/10.5194/acp-18-5293-2018, 2018.
Li, L., Guo, Y., Xu, J., Ye, X., Li, D., Liu, Z., Ti, C., Liu, X., and Zhang, L.: Opportunities to mitigate PM2.5 and nitrogen deposition through agricultural NH3 control strategies in China's Beijing–Tianjin–Hebei region, Environ. Sci. Technol., 59, 14572–14584, https://doi.org/10.1021/acs.est.5c02485, 2025.
Li, M., Liu, H., Geng, G., Hong, C., Liu, F., Song, Y., Tong, D., Zheng, B., Cui, H., Man, H., Zhang, Q., and He, K.: Anthropogenic emission inventories in China: a review, Nat. Sci. Rev., 4, 834–866, https://doi.org/10.1093/nsr/nwx150, 2017a.
Li, M., Zhang, Q., Kurokawa, J.-I., Woo, J.-H., He, K., Lu, Z., Ohara, T., Song, Y., Streets, D. G., Carmichael, G. R., Cheng, Y., Hong, C., Huo, H., Jiang, X., Kang, S., Liu, F., Su, H., and Zheng, B.: MIX: a mosaic Asian anthropogenic emission inventory under the international collaboration framework of the MICS-Asia and HTAP, Atmos. Chem. Phys., 17, 935–963, https://doi.org/10.5194/acp-17-935-2017, 2017b.
Li, X. and Rappenglueck, B.: A study of model nighttime ozone bias in air quality modeling, Atmos. Environ., 195, 210–228, https://doi.org/10.1016/j.atmosenv.2018.09.046, 2018.
Li, Y., Li, C., Li, Y., Wang, T., Li, M., Qu, Y., Wu, H., Xie, M., and Wang, Y.: Decadal evolution of aerosol-mediated ozone responses in Eastern China under clean air actions and carbon neutrality policies, Atmos. Chem. Phys., 26, 1301–1319, https://doi.org/10.5194/acp-26-1301-2026, 2026.
Liu, Z., Zhou, M., Chen, Y., Chen, D., Pan, Y., Song, T., Ji, D., Chen, Q., and Zhang, L.: The nonlinear response of fine particulate matter pollution to ammonia emission reductions in North China, Environ. Res. Lett., 16, 034014, https://doi.org/10.1088/1748-9326/abdf86, 2021a.
Liu, H., Gao, Y., Zhang, M., Han, X., Zhu, L., and Yang, J.: Episode analysis of the characteristics and causes of PM2.5 and ozone co-pollution in Tianjin, a coastal city in northern China, Atmos. Environ., 372, 121898, https://doi.org/10.1016/j.atmosenv.2026.121898, 2026.
Liu, Y., Geng, G., Cheng, J., Liu, Y., Xiao, Q., Liu, L., Shi, Q., Tong, D., He, K., and Zhang, Q.: Drivers of Increasing Ozone during the Two Phases of Clean Air Actions in China 2013–2020, Environ. Sci. Technol., 57, 8954–8964, https://doi.org/10.1021/acs.est.3c00054, 2023.
Liu, Z., An, X., Wang, C., Li, J., and Cui, M.: Sensitivity analysis of PM2.5 and O3 co-pollution in Beijing based on GRAPES-CUACE adjoint model, J. Environ. Sci., 158, 461–475, https://doi.org/10.1016/j.jes.2024.11.020, 2025.
Liu, Z., Doherty, R. M., Wild, O., Hollaway, M., and O’Connor, F. M.: Contrasting chemical environments in summertime for atmospheric ozone across major Chinese industrial regions: the effectiveness of emission control strategies, Atmos. Chem. Phys., 21, 10689–10706, https://doi.org/10.5194/acp-21-10689-2021, 2021b.
Lohmann, U. and Feichter, J.: Global indirect aerosol effects: a review, Atmos. Chem. Phys., 5, 715–737, https://doi.org/10.5194/acp-5-715-2005, 2005.
Lu, X., Hong, J., Zhang, L., Cooper, O.R., Schultz, M.G., Xu, X., Wang, T., Gao, M., Zhao, Y., and Zhang, Y.: Severe surface ozone pollution in China: A global perspective, Environ. Sci. Tech. Lett., 5, 487–494, https://doi.org/10.1021/acs.estlett.8b00366, 2018.
Lu, X., Zhang, S., Xing, J., Wang, Y., Chen, W., Ding, D., Wu, Y., Wang, S., Duan, L., and Hao, J.: Progress of air pollution control in China and its challenges and opportunities in the ecological civilization era, Engineering, 6, 1423–1431, https://doi.org/10.1016/j.eng.2020.03.014, 2020.
Luo, Y., Zhao, T., Yang, Y., Zong, L., Kumar, K.R., Wang, H., Meng, K., Zhang, L., Lu, S., and Xin, Y.: Seasonal changes in the recent decline of combined high PM2.5 and O3 pollution and associated chemical and meteorological drivers in the Beijing–Tianjin–Hebei region, China Sci. Tot. Env., 838, 156312, https://doi.org/10.1016/j.scitotenv.2022.156312, 2022.
Ma, X., Yin, Z., Cao, B., and Wang, H.: Meteorological influences on co-occurrence of O3 and PM2.5 pollution and implication for emission reductions in Beijing-Tianjin-Hebei, Sci. China Earth Sci., 66, 1258–1267, https://doi.org/10.1007/s11430-022-1070-y, 2023.
Morrison, H. and Gettelman, A.: A New Two-Moment Bulk Stratiform Cloud Microphysics Scheme in the Community Atmosphere Model, Version 3 (CAM3). Part I: Description and Numerical Tests, J. Climate, 21, 3642–3659, https://doi.org/10.1175/2008JCLI2105.1, 2008.
Qian, J. and Liao, H.: Effectiveness of precursor emission reductions for the control of summertime ozone and PM2.5 in the Beijing-Tianjin-Hebei region under different meteorological conditions, Adv. Atmos. Sci., 42, 653–669, https://doi.org/10.1007/s00376-024-4071-4, 2025.
Ren, J., Guo, F., and Xie, S.: Diagnosing ozone–NOx–VOC sensitivity and revealing causes of ozone increases in China based on 2013–2021 satellite retrievals, Atmos. Chem. Phys., 22, 15035–15047, https://doi.org/10.5194/acp-22-15035-2022, 2022.
Satheesh, S. K. and Krishna Moorthy, K.: Radiative effects of natural aerosols: A review, Atmos. Environ., 39, 2089–2110, https://doi.org/10.1016/j.atmosenv.2004.12.029, 2005.
Tonnesen, G. S. and Dennis, R. L.: Analysis of radical propagation efficiency to assess ozone sensitivity to hydrocarbons and NOx: 2. Long-lived species as indicators of ozone concentration sensitivity, J. Geophys. Res., 105, 9227–9241, https://doi.org/10.1029/1999JD900372, 2000.
Travis, K. R. and Jacob, D. J.: Systematic bias in evaluating chemical transport models with maximum daily 8 h average (MDA8) surface ozone for air quality applications: a case study with GEOS-Chem v9.02, Geosci. Model Dev., 12, 3641–3648, https://doi.org/10.5194/gmd-12-3641-2019, 2019.
Wang, F., Han, X., Xie, H., Gao, Y., Guan, X., and Zhang, M.: Investigating trends and causes of simultaneous high pollution from PM2.5 and ozone in China, 2015–2023, Atmos. Pollut. Res., 16, 102351, https://doi.org/10.1016/j.apr.2024.102351, 2025a.
Wang, W., Zhou, Y., Li, M., Lu, Y., Jiang, X., Wang, T., Zhuang, B., Li, S., Zhan, C., Sun, X., and Huang, X.: Large-scale synoptic and weather drivers for the co-occurrence of fine particulate matter and ozone extremes over China, Sci. China Earth Sci., 68, 1448–1457, https://doi.org/10.1007/s11430-024-1534-1, 2025b.
Wang, Y., Zhao, Y., Liu, Y., Jiang, Y., Zheng, B., Xing, J., Liu, Y., Wang, S., and Nielsen, C. P.: Sustained emission reductions have restrained the ozone pollution over China, Nat. Geosci., 16, 967–974, https://doi.org/10.1038/s41561-023-01284-2, 2023.
Wiedinmyer, C., Akagi, S. K., Yokelson, R. J., Emmons, L. K., Al-Saadi, J. A., Orlando, J. J., and Soja, A. J.: The Fire INventory from NCAR (FINN): a high resolution global model to estimate the emissions from open burning, Geosci. Model Dev., 4, 625–641, https://doi.org/10.5194/gmd-4-625-2011, 2011.
Wild, O., Zhu, X., and Prather, M. J.: Fast-J: Accurate Simulation of In- and Below-Cloud Photolysis in Tropospheric Chemical Models, J. Atmos. Chem., 37, 245–282, https://doi.org/10.1023/A:1006415919030, 2000.
Xia, Z., Zhao, C., Yang, Z., Du, Q., Jia, W., Jin, C., Shi, J., and An, H.: Source code for Hybrid WRFCHEM with Physics and AI Schemes (Aerosol Chemistry and Interactions) (Version v1.0), Zenodo [code], https://doi.org/10.5281/zenodo.15702248, 2024.
Xiong, Y., Yang, Q., Gao, Y., Li, K., Yang, Y., Lin, G., Lu, X., Wang, Z., Zhang, H., and Gao, M.: Modeling the formation of aerosols and their interactions with weather and climate: critical review and future perspectives, Front. Environ. Sci. Eng., 19, 143, https://doi.org/10.1007/s11783-025-2063-y, 2025.
Xu, X.: China Population Spatial Distribution Kilometer Grid Dataset, Resource and Environment Science Data Publishing and Registration System [data set], https://doi.org/10.12078/2017121101, 2017.
Yang, H., Chen, L., Liao, H., Zhu, J., Wang, W., and Li, X.: Weakened aerosol–radiation interaction exacerbating ozone pollution in eastern China since China's clean air actions, Atmos. Chem. Phys., 24, 4001–4015, https://doi.org/10.5194/acp-24-4001-2024, 2024.
Yang, Z., Du, Q., Yang, Q., Zhao, C., Li, G., Xia, Z., Xu, M., Yuan, R., Li, Y., Xia, K., Gu, J., and Feng, J.: Modeling urban pollutant transport at multiple resolutions: impacts of turbulent mixing, Atmos. Chem. Phys., 25, 8831–8857, https://doi.org/10.5194/acp-25-8831-2025, 2025.
Zang, L., Wang, Z., Zhu, B., and Zhang, Y.: Roles of relative humidity in aerosol pollution aggravation over central China during wintertime, Int. J. Environ. Res. Pub. He., 16, 4422, https://doi.org/10.3390/ijerph16224422, 2019.
Zaveri, R. A. and Peters, L. K.: A new lumped structure photochemical mechanism for large-scale applications, J. Geophys. Res., 104, 30387–30415, https://doi.org/10.1029/1999JD900876, 1999.
Zaveri, R. A., Easter, R. C., Fast, J. D., and Peters, L. K.: Model for simulating aerosol interactions and chemistry (MOSAIC), J. Geophys. Res.-Atmos., 113, D13204, https://doi.org/10.1029/2007JD008782, 2008.
Zeng, S., Riedi, J., Trepte, C. R., Winker, D. M., and Hu, Y.-X.: Study of global cloud droplet number concentration with A-Train satellites, Atmos. Chem. Phys., 14, 7125–7134, https://doi.org/10.5194/acp-14-7125-2014, 2014.
Zhan, Y., Xie, M., Zhuang, B., Gao, D., Zhu, K., Lu, H., Wang, T., Li, S., Li, M., Luo, Y., and Zhao, R.: Particle-ozone complex pollution under diverse synoptic weather patterns in the Yangtze River Delta region: synergistic relationships and the effects of meteorology and chemical compositions, Sci. Total Environ., 946, 174365, https://doi.org/10.1016/j.scitotenv.2024.174365, 2024.
Zhang, M., Zhao, C., Yang, Y., Du, Q., Shen, Y., Lin, S., Gu, D., Su, W., and Liu, C.: Modeling sensitivities of BVOCs to different versions of MEGAN emission schemes in WRF-Chem (v3.6) and its impacts over eastern China, Geosci. Model Dev., 14, 6155–6175, https://doi.org/10.5194/gmd-14-6155-2021, 2021.
Zhang, Q., Zheng, Y., Tong, D., Shao, M., Wang, S., Zhang, Y., Xu, X., Wang, J., He, H., Liu, W., Ding, Y., Lei, Y., Li, J., Wang, Z., Zhang, X., Wang, Y., Cheng, J., Liu, Y., Shi, Q., Yan, L., Geng, G., Hong, C., Li, M., Liu, F., Zheng, B., Cao, J., Ding, A., Gao, J., Fu, Q., Huo, J., Liu, B., Liu, Z., Yang, F., He, K., and Hao, J.: Drivers of improved PM2.5 air quality in China from 2013 to 2017, P. Natl. Acad. Sci. USA, 116, 24463–24469, https://doi.org/10.1073/pnas.1907956116, 2019.
Zhang, X., Zhang, Q., Hong, C., Zheng, Y., Geng, G., Tong, D., Zhang, Y., and Zhang, X. Y.: Enhancement of PM2.5 concentrations by aerosol-meteorology interactions over China, J. Geophys. Res.-Atmos., 123, 1179–1194, https://doi.org/10.1002/2017JD027524, 2018.
Zhao, B., Liou, K.-N., Gu, Y., Li, Q., Jiang, J. H., Su, H., He, C., Tseng, H.-L. R., Wang, S., Liu, R., Qi, L., Lee, W.-L., and Hao, J.: Enhanced PM2.5 pollution in China due to aerosol-cloud interactions, Sci. Rep., 7, 4453, https://doi.org/10.1038/s41598-017-04096-8, 2017.
Zhao, C., Chen, S., Leung, L. R., Qian, Y., Kok, J. F., Zaveri, R. A., and Huang, J.: Uncertainty in modeling dust mass balance and radiative forcing from size parameterization, Atmos. Chem. Phys., 13, 10733–10753, https://doi.org/10.5194/acp-13-10733-2013, 2013.
Zhao, C., Hu, Z., Qian, Y., Ruby Leung, L., Huang, J., Huang, M., Jin, J., Flanner, M. G., Zhang, R., Wang, H., Yan, H., Lu, Z., and Streets, D. G.: Simulating black carbon and dust and their radiative forcing in seasonal snow: a case study over North China with field campaign measurements, Atmos. Chem. Phys., 14, 11475–11491, https://doi.org/10.5194/acp-14-11475-2014, 2014.
Zhao, C., Huang, M., Fast, J. D., Berg, L. K., Qian, Y., Guenther, A., Gu, D., Shrivastava, M., Liu, Y., Walters, S., Pfister, G., Jin, J., Shilling, J. E., and Warneke, C.: Sensitivity of biogenic volatile organic compounds to land surface parameterizations and vegetation distributions in California, Geosci. Model Dev., 9, 1959–1976, https://doi.org/10.5194/gmd-9-1959-2016, 2016.
Zhao, H., Chen, K., Liu, Z., Zhang, Y., Shao, T., and Zhang, H.: Coordinated control of PM2.5 and O3 is urgently needed in China after implementation of the “air pollution prevention and control action plan”, Chemosphere, 270, 129441, https://doi.org/10.1016/j.chemosphere.2020.129441, 2021.
Zhao, X., Zhao, X., Liu, Z., Jia, L., and Hu, B.: Non-Ideal Treatment of Organic Aerosol Reveals Its Missing Sources and Improves PM2.5 Prediction, J. Geophys. Res.-Atmos., 131, e2025JD044333, https://doi.org/10.1029/2025JD044333, 2026a.
Zhao, Y., Gao, Y., Xu, L., and Zhang, M.: Numerical analysis of aerosol-radiation-cloud interactions impacts on surface ozone during PM2.5-O3 compound pollution episodes in the Beijing-Tianjin-Hebei and Yangtze River Delta, China, Atmos. Res., 336, 108859, https://doi.org/10.1016/j.atmosres.2026.108859, 2026b.
Zhao, Y., Zhang, L., Zhou, M., Chen, D., Lu, X., Tao, W., Liu, J., Tian, H., Ma, Y., and Fu, T.-M.: Influences of planetary boundary layer mixing parameterization on summertime surface ozone concentration and dry deposition over North China, Atmos. Environ., 218, 116950, https://doi.org/10.1016/j.atmosenv.2019.116950, 2019.
Zhu, J., Chen, L., Liao, H., Yang, H., Yang, Y., and Yue, X.: Enhanced PM2.5 Decreases and O3 Increases in China During COVID-19 Lockdown by Aerosol-Radiation Feedback, Geophys. Res. Lett., 48, e2020GL090260, https://doi.org/10.1029/2020GL090260, 2021.
Zong, L., Yang, Y., Gao, M., Wang, H., Wang, P., Zhang, H., Wang, L., Ning, G., Liu, C., Li, Y., and Gao, Z.: Large-scale synoptic drivers of co-occurring summertime ozone and PM2.5 pollution in eastern China, Atmos. Chem. Phys., 21, 9105–9124, https://doi.org/10.5194/acp-21-9105-2021, 2021.